UNITED STATES
SECURITIES AND EXCHANGE COMMISSION
Washington, D.C. 20549
FORM N-CSR
CERTIFIED SHAREHOLDER REPORT OF REGISTERED
MANAGEMENT INVESTMENT COMPANIES
Investment Company Act file number 811-6440
Fidelity Aberdeen Street Trust
(Exact name of registrant as specified in charter)
245 Summer St., Boston, Massachusetts 02210
(Address of principal executive offices) (Zip code)
William C. Coffey, Secretary
245 Summer St.
Boston, Massachusetts 02210
(Name and address of agent for service)
Registrant's telephone number, including area code:
617-563-7000
| |
Date of fiscal year end: | March 31 |
| |
Date of reporting period: | March 31, 2019 |
Item 1.
Reports to Stockholders
Fidelity Freedom® Funds - Income, 2005, 2010, 2015, 2020, 2025, 2030, 2035, 2040, 2045, 2050, 2055, 2060
Annual Report March 31, 2019 |
 |
Beginning on January 1, 2021, as permitted by regulations adopted by the Securities and Exchange Commission, paper copies of a fund’s shareholder reports will no longer be sent by mail, unless you specifically request paper copies of the reports from the fund or from your financial intermediary, such as a financial advisor, broker-dealer or bank. Instead, the reports will be made available on a website, and you will be notified by mail each time a report is posted and provided with a website link to access the report.
If you already elected to receive shareholder reports electronically, you will not be affected by this change and you need not take any action. You may elect to receive shareholder reports and other communications from a fund electronically, by contacting your financial intermediary. For Fidelity customers, visit Fidelity's web site or call Fidelity using the contact information listed below.
You may elect to receive all future reports in paper free of charge. If you wish to continue receiving paper copies of your shareholder reports, you may contact your financial intermediary or, if you are a Fidelity customer, visit Fidelity’s website, or call Fidelity at the applicable toll-free number listed below. Your election to receive reports in paper will apply to all funds held with the fund complex/your financial intermediary.
| Account Type | Website | Phone Number |
| Brokerage, Mutual Fund, or Annuity Contracts: | fidelity.com/mailpreferences | 1-800-343-3548 |
| Employer Provided Retirement Accounts: | netbenefits.fidelity.com/preferences (choose 'no' under Required Disclosures to continue to print) | 1-800-343-0860 |
| Advisor Sold Accounts Serviced Through Your Financial Intermediary: | Contact Your Financial Intermediary | Your Financial Intermediary's phone number |
| Advisor Sold Accounts Serviced by Fidelity: | institutional.fidelity.com | 1-877-208-0098 |
Contents
To view a fund's proxy voting guidelines and proxy voting record for the 12-month period ended June 30, visit http://www.fidelity.com/proxyvotingresults or visit the Securities and Exchange Commission's (SEC) web site at http://www.sec.gov.
You may also call 1-800-544-8544 if you’re an individual investing directly with Fidelity, call 1-800-835-5092 if you’re a plan sponsor or participant with Fidelity as your recordkeeper or call 1-877-208-0098 on institutional accounts or if you’re an advisor or invest through one to request a free copy of the proxy voting guidelines.
Standard & Poor's, S&P and S&P 500 are registered service marks of The McGraw-Hill Companies, Inc. and have been licensed for use by Fidelity Distributors Corporation.
Other third-party marks appearing herein are the property of their respective owners.
All other marks appearing herein are registered or unregistered trademarks or service marks of FMR LLC or an affiliated company. © 2019 FMR LLC. All rights reserved.
This report and the financial statements contained herein are submitted for the general information of the shareholders of the Funds. This report is not authorized for distribution to prospective investors in the Funds unless preceded or accompanied by an effective prospectus.
A fund files its complete schedule of portfolio holdings with the SEC for the first and third quarters of each fiscal year on Form N-PORT. Forms N-PORT are available on the SEC’s web site at http://www.sec.gov. A fund's Forms N-PORT may be reviewed and copied at the SEC’s Public Reference Room in Washington, DC. Information regarding the operation of the SEC's Public Reference Room may be obtained by calling 1-800-SEC-0330.
For a complete list of a fund's portfolio holdings, view the most recent holdings listing, semiannual report, or annual report on Fidelity's web site at http://www.fidelity.com, http://www.institutional.fidelity.com, or http://www.401k.com, as applicable.
NOT FDIC INSURED •MAY LOSE VALUE •NO BANK GUARANTEE
Neither the Funds nor Fidelity Distributors Corporation is a bank.
Fidelity Freedom® Income Fund
Performance: The Bottom Line
Average annual total return reflects the change in the value of an investment, assuming reinvestment of distributions from dividend income and capital gains (the profits earned upon the sale of securities that have grown in value, if any) and assuming a constant rate of performance each year. The hypothetical investment and the average annual total returns do not reflect the deduction of taxes that a shareholder would pay on fund distributions or the redemption of fund shares. During periods of reimbursement by Fidelity, a fund’s total return will be greater than it would be had the reimbursement not occurred. How a fund did yesterday is no guarantee of how it will do tomorrow.
Average Annual Total Returns
| Periods ended March 31, 2019 | Past 1 year | Past 5 years | Past 10 years |
| Fidelity Freedom® Income Fund | 3.08% | 3.57% | 5.68% |
| Class K | 3.04% | 3.57% | 5.68% |
| Class K6 | 3.16% | 3.59% | 5.70% |
Prior to June 1, 2017, the fund operated under a different pricing structure. The fund’s historical performance prior to June 1, 2017 does not reflect the fund’s current pricing structure.
The initial offering of Class K shares took place on July 20, 2017. Returns prior to July 20, 2017 are those of Fidelity Freedom® Income Fund, the original class of the fund.
The initial offering of Class K6 shares took place on June 7, 2017. Returns prior to June 7, 2017 are those of Fidelity Freedom® Income Fund, the original class of the fund.
$10,000 Over 10 Years
Let's say hypothetically that $10,000 was invested in Fidelity Freedom® Income Fund, a class of the fund, on March 31, 2009.
The chart shows how the value of your investment would have changed, and also shows how the Bloomberg Barclays U.S. Aggregate Bond Index performed over the same period.
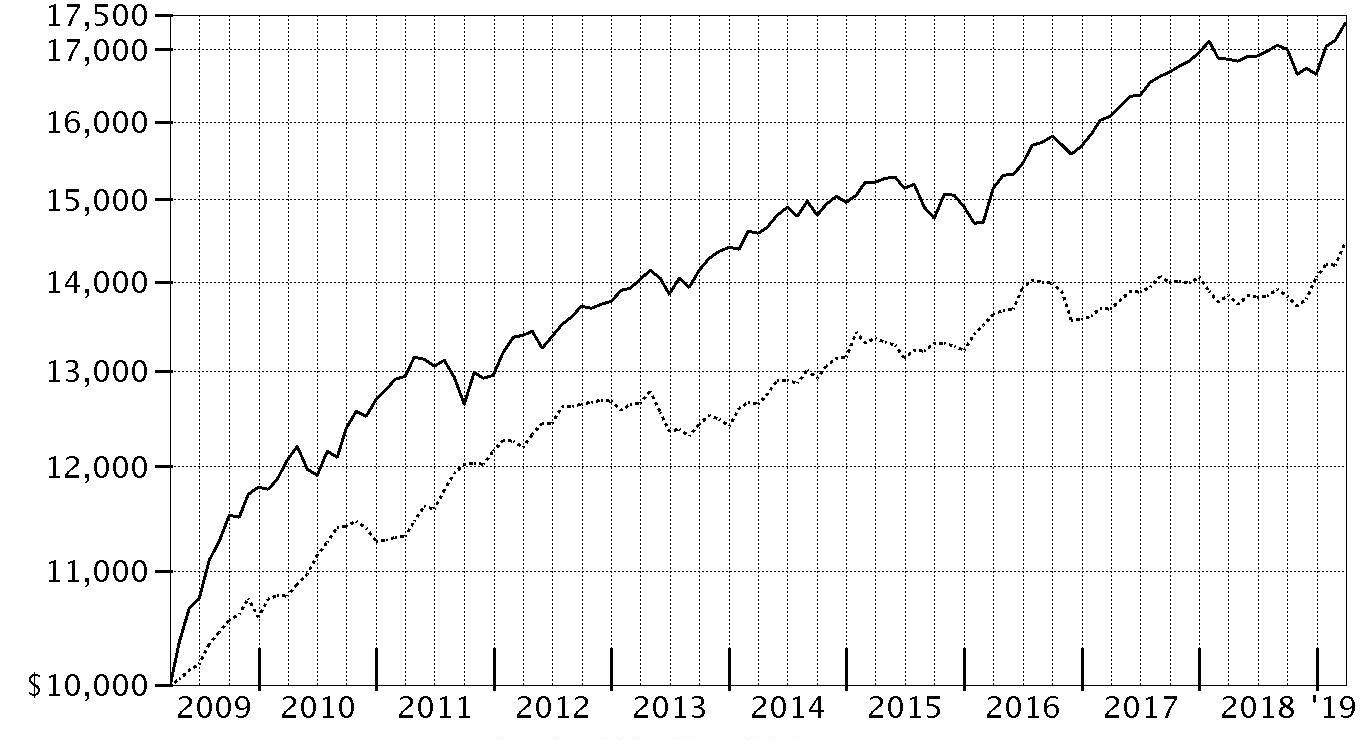
| Period Ending Values |
| $17,383 | Fidelity Freedom® Income Fund |
| $14,472 | Bloomberg Barclays U.S. Aggregate Bond Index |
Fidelity Freedom® 2005 Fund
Performance: The Bottom Line
Average annual total return reflects the change in the value of an investment, assuming reinvestment of distributions from dividend income and capital gains (the profits earned upon the sale of securities that have grown in value, if any) and assuming a constant rate of performance each year. The hypothetical investment and the average annual total returns do not reflect the deduction of taxes that a shareholder would pay on fund distributions or the redemption of fund shares. During periods of reimbursement by Fidelity, a fund’s total return will be greater than it would be had the reimbursement not occurred. How a fund did yesterday is no guarantee of how it will do tomorrow.
Average Annual Total Returns
| Periods ended March 31, 2019 | Past 1 year | Past 5 years | Past 10 years |
| Fidelity Freedom® 2005 Fund | 3.03% | 4.27% | 7.70% |
| Class K | 3.00% | 4.28% | 7.71% |
| Class K6 | 3.15% | 4.32% | 7.72% |
Prior to June 1, 2017, the fund operated under a different pricing structure. The fund’s historical performance prior to June 1, 2017 does not reflect the fund’s current pricing structure.
The initial offering of Class K shares took place on July 20, 2017. Returns prior to July 20, 2017 are those of Fidelity Freedom® 2005 Fund, the original class of the fund.
The initial offering of Class K6 shares took place on June 7, 2017. Returns prior to June 7, 2017 are those of Fidelity Freedom® 2005 Fund, the original class of the fund.
$10,000 Over 10 Years
Let's say hypothetically that $10,000 was invested in Fidelity Freedom® 2005 Fund, a class of the fund, on March 31, 2009.
The chart shows how the value of your investment would have changed, and also shows how the Bloomberg Barclays U.S. Aggregate Bond Index performed over the same period.
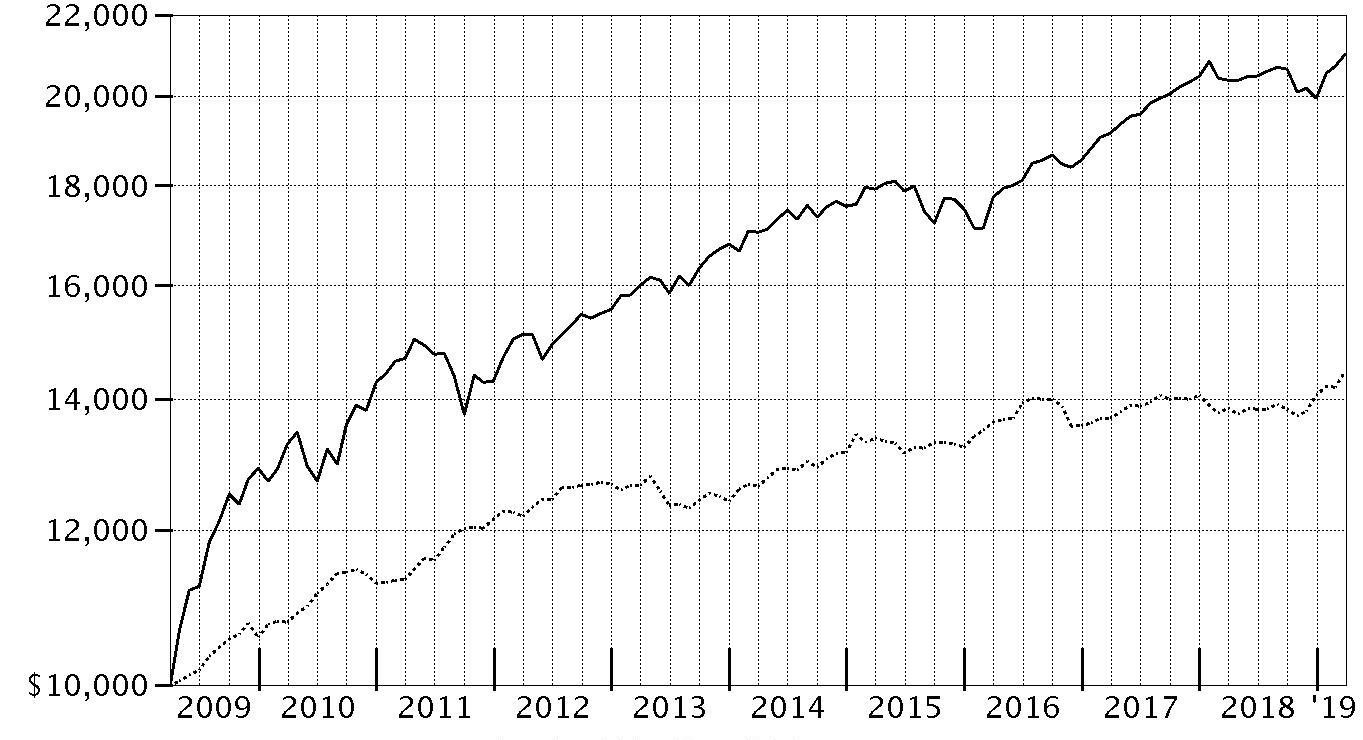
| Period Ending Values |
| $21,000 | Fidelity Freedom® 2005 Fund |
| $14,472 | Bloomberg Barclays U.S. Aggregate Bond Index |
Fidelity Freedom® 2010 Fund
Performance: The Bottom Line
Average annual total return reflects the change in the value of an investment, assuming reinvestment of distributions from dividend income and capital gains (the profits earned upon the sale of securities that have grown in value, if any) and assuming a constant rate of performance each year. The hypothetical investment and the average annual total returns do not reflect the deduction of taxes that a shareholder would pay on fund distributions or the redemption of fund shares. During periods of reimbursement by Fidelity, a fund’s total return will be greater than it would be had the reimbursement not occurred. How a fund did yesterday is no guarantee of how it will do tomorrow.
Average Annual Total Returns
| Periods ended March 31, 2019 | Past 1 year | Past 5 years | Past 10 years |
| Fidelity Freedom® 2010 Fund | 2.89% | 4.81% | 8.65% |
| Class K | 2.95% | 4.84% | 8.67% |
| Class K6 | 2.96% | 4.85% | 8.67% |
Prior to June 1, 2017, the fund operated under a different pricing structure. The fund’s historical performance prior to June 1, 2017 does not reflect the fund’s current pricing structure.
The initial offering of Class K shares took place on July 20, 2017. Returns prior to July 20, 2017 are those of Fidelity Freedom® 2010 Fund, the original class of the fund.
The initial offering of Class K6 shares took place on June 7, 2017. Returns prior to June 7, 2017 are those of Fidelity Freedom® 2010 Fund, the original class of the fund.
$10,000 Over 10 Years
Let's say hypothetically that $10,000 was invested in Fidelity Freedom® 2010 Fund, a class of the fund, on March 31, 2009.
The chart shows how the value of your investment would have changed, and also shows how the Bloomberg Barclays U.S. Aggregate Bond Index performed over the same period.

| Period Ending Values |
| $22,924 | Fidelity Freedom® 2010 Fund |
| $14,472 | Bloomberg Barclays U.S. Aggregate Bond Index |
Fidelity Freedom® 2015 Fund
Performance: The Bottom Line
Average annual total return reflects the change in the value of an investment, assuming reinvestment of distributions from dividend income and capital gains (the profits earned upon the sale of securities that have grown in value, if any) and assuming a constant rate of performance each year. The hypothetical investment and the average annual total returns do not reflect the deduction of taxes that a shareholder would pay on fund distributions or the redemption of fund shares. During periods of reimbursement by Fidelity, a fund’s total return will be greater than it would be had the reimbursement not occurred. How a fund did yesterday is no guarantee of how it will do tomorrow.
Average Annual Total Returns
| Periods ended March 31, 2019 | Past 1 year | Past 5 years | Past 10 years |
| Fidelity Freedom® 2015 Fund | 2.74% | 5.32% | 9.12% |
| Class K | 2.80% | 5.34% | 9.13% |
| Class K6 | 2.87% | 5.37% | 9.15% |
Prior to June 1, 2017, the fund operated under a different pricing structure. The fund’s historical performance prior to June 1, 2017 does not reflect the fund’s current pricing structure.
The initial offering of Class K shares took place on July 20, 2017. Returns prior to July 20, 2017 are those of Fidelity Freedom® 2015 Fund, the original class of the fund.
The initial offering of Class K6 shares took place on June 7, 2017. Returns prior to June 7, 2017 are those of Fidelity Freedom® 2015 Fund, the original class of the fund.
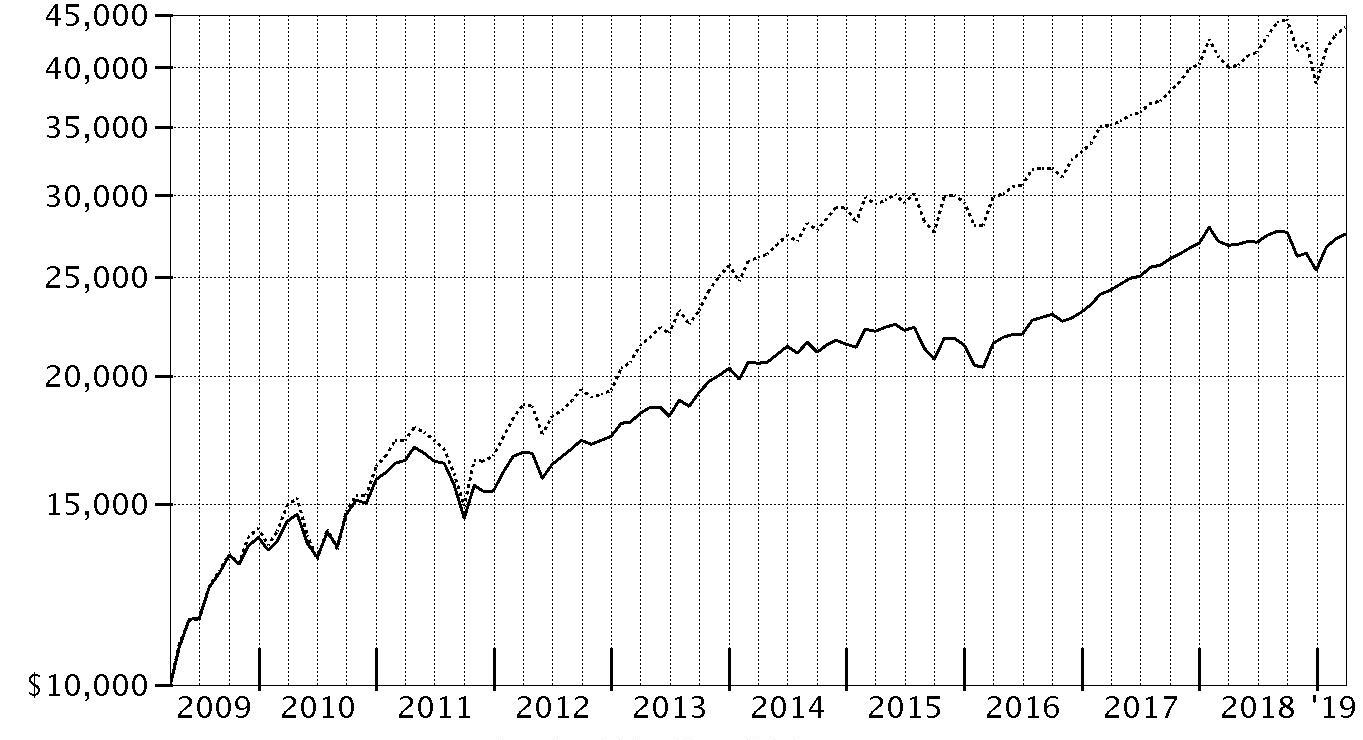
$10,000 Over 10 Years
Let's say hypothetically that $10,000 was invested in Fidelity Freedom® 2015 Fund, a class of the fund, on March 31, 2009.
The chart shows how the value of your investment would have changed, and also shows how the Bloomberg Barclays U.S. Aggregate Bond Index and S&P 500 Index performed over the same period.
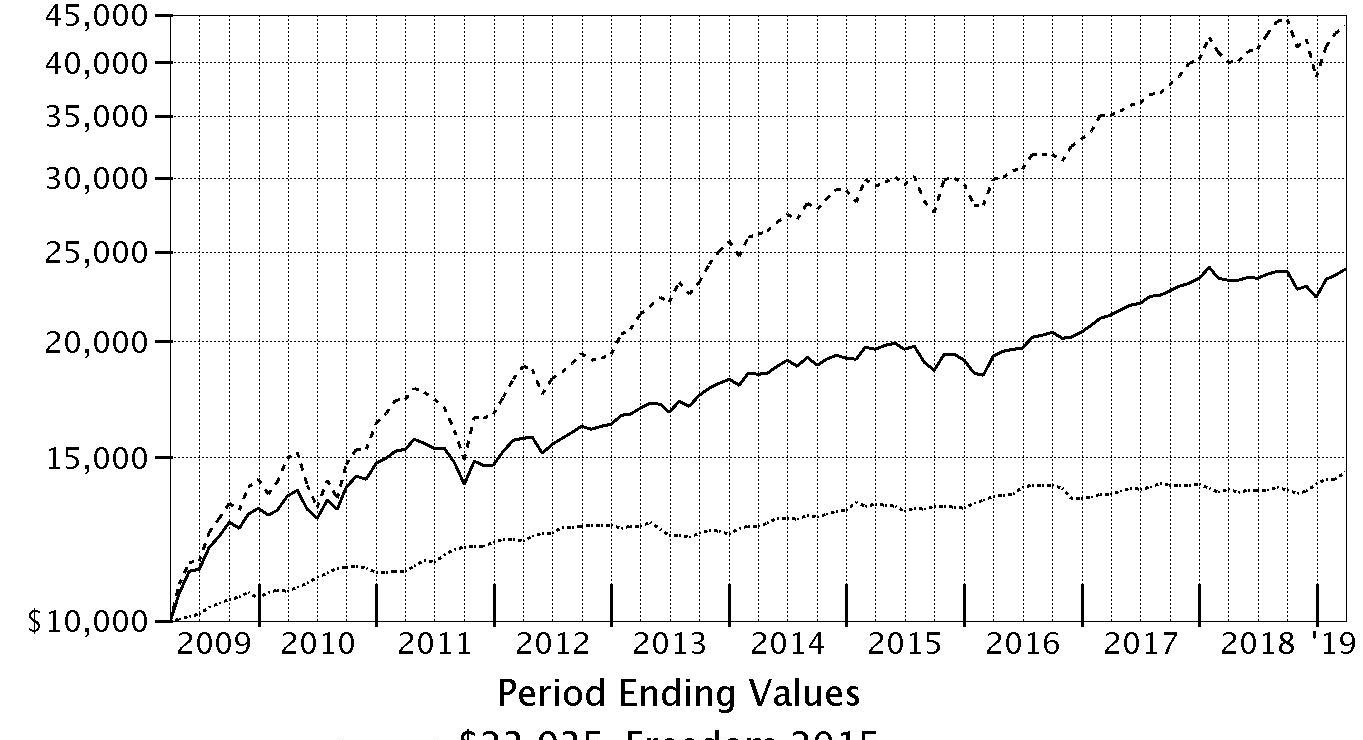
| Period Ending Values |
| $23,935 | Fidelity Freedom® 2015 Fund |
| $14,472 | Bloomberg Barclays U.S. Aggregate Bond Index |
| $43,809 | S&P 500® Index |
Going forward, the fund’s performance will be compared to the Bloomberg Barclays U.S. Aggregate Bond Index, rather than the S&P 500® Index. The Bloomberg Barclays U.S. Aggregate Bond Index more closely represents the fund’s investment strategy, as fixed-income and short-term funds currently represent the majority of the fund’s assets.
Fidelity Freedom® 2020 Fund
Performance: The Bottom Line
Average annual total return reflects the change in the value of an investment, assuming reinvestment of distributions from dividend income and capital gains (the profits earned upon the sale of securities that have grown in value, if any) and assuming a constant rate of performance each year. The hypothetical investment and the average annual total returns do not reflect the deduction of taxes that a shareholder would pay on fund distributions or the redemption of fund shares. During periods of reimbursement by Fidelity, a fund’s total return will be greater than it would be had the reimbursement not occurred. How a fund did yesterday is no guarantee of how it will do tomorrow.
Average Annual Total Returns
| Periods ended March 31, 2019 | Past 1 year | Past 5 years | Past 10 years |
| Fidelity Freedom® 2020 Fund | 2.66% | 5.65% | 9.96% |
| Class K | 2.73% | 5.68% | 9.97% |
| Class K6 | 2.80% | 5.71% | 9.99% |
Prior to June 1, 2017, the fund operated under a different pricing structure. The fund’s historical performance prior to June 1, 2017 does not reflect the fund’s current pricing structure.
The initial offering of Class K shares took place on July 20, 2017. Returns prior to July 20, 2017 are those of Fidelity Freedom® 2020 Fund, the original class of the fund.
The initial offering of Class K6 shares took place on June 7, 2017. Returns prior to June 7, 2017 are those of Fidelity Freedom® 2020 Fund, the original class of the fund.
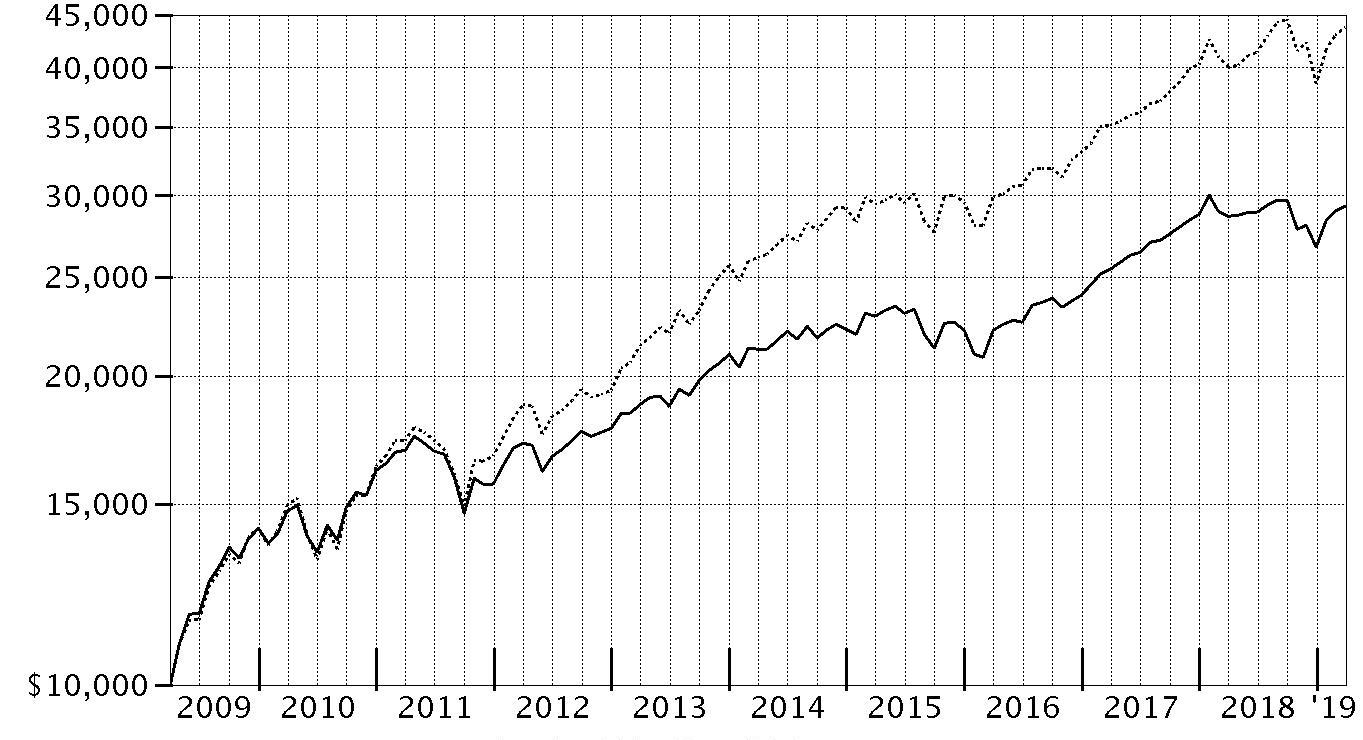
$10,000 Over 10 Years
Let's say hypothetically that $10,000 was invested in Fidelity Freedom® 2020 Fund, a class of the fund, on March 31, 2009.
The chart shows how the value of your investment would have changed, and also shows how the S&P 500® Index performed over the same period.
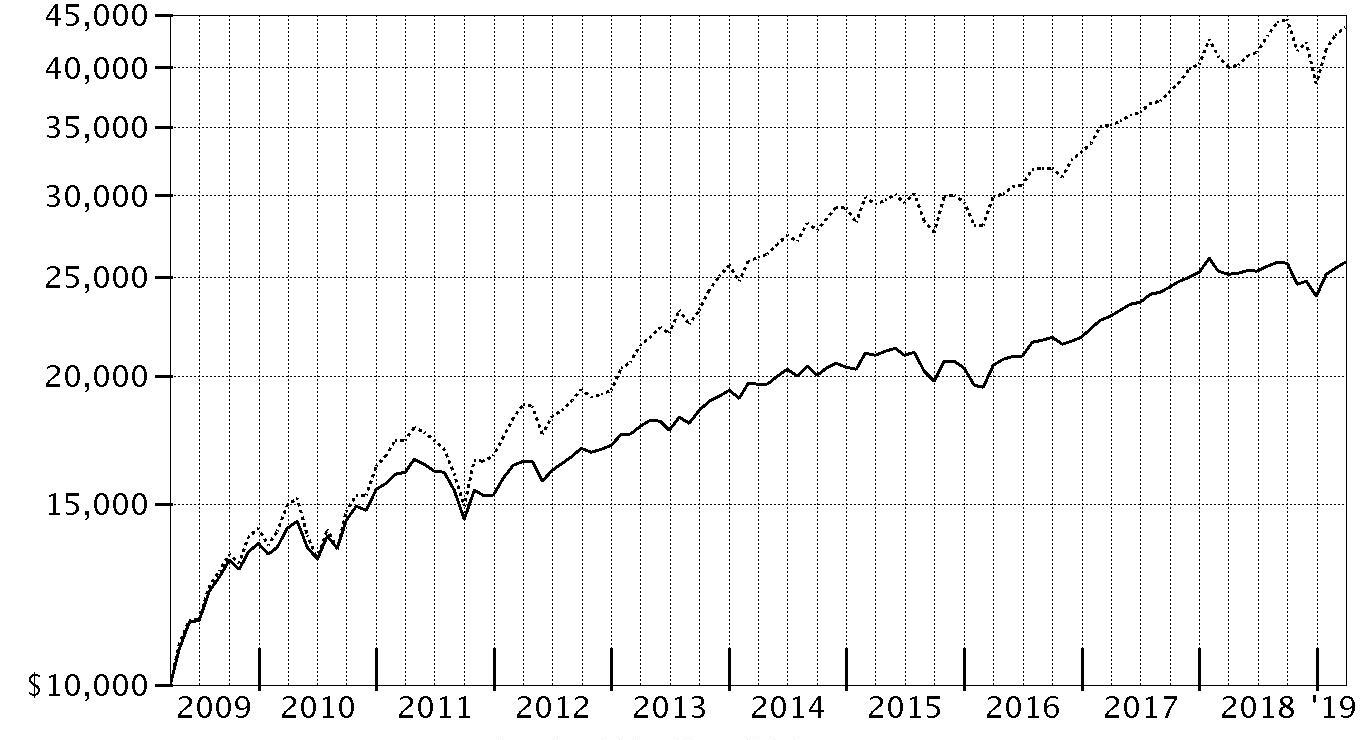
| Period Ending Values |
| $25,838 | Fidelity Freedom® 2020 Fund |
| $43,809 | S&P 500® Index |
Fidelity Freedom® 2025 Fund
Performance: The Bottom Line
Average annual total return reflects the change in the value of an investment, assuming reinvestment of distributions from dividend income and capital gains (the profits earned upon the sale of securities that have grown in value, if any) and assuming a constant rate of performance each year. The hypothetical investment and the average annual total returns do not reflect the deduction of taxes that a shareholder would pay on fund distributions or the redemption of fund shares. During periods of reimbursement by Fidelity, a fund’s total return will be greater than it would be had the reimbursement not occurred. How a fund did yesterday is no guarantee of how it will do tomorrow.
Average Annual Total Returns
| Periods ended March 31, 2019 | Past 1 year | Past 5 years | Past 10 years |
| Fidelity Freedom® 2025 Fund | 2.53% | 5.96% | 10.66% |
| Class K | 2.61% | 5.99% | 10.67% |
| Class K6 | 2.73% | 6.05% | 10.70% |
Prior to June 1, 2017, the fund operated under a different pricing structure. The fund’s historical performance prior to June 1, 2017 does not reflect the fund’s current pricing structure.
The initial offering of Class K shares took place on July 20, 2017. Returns prior to July 20, 2017 are those of Fidelity Freedom® 2025 Fund, the original class of the fund.
The initial offering of Class K6 shares took place on June 7, 2017. Returns prior to June 7, 2017 are those of Fidelity Freedom® 2025 Fund, the original class of the fund.
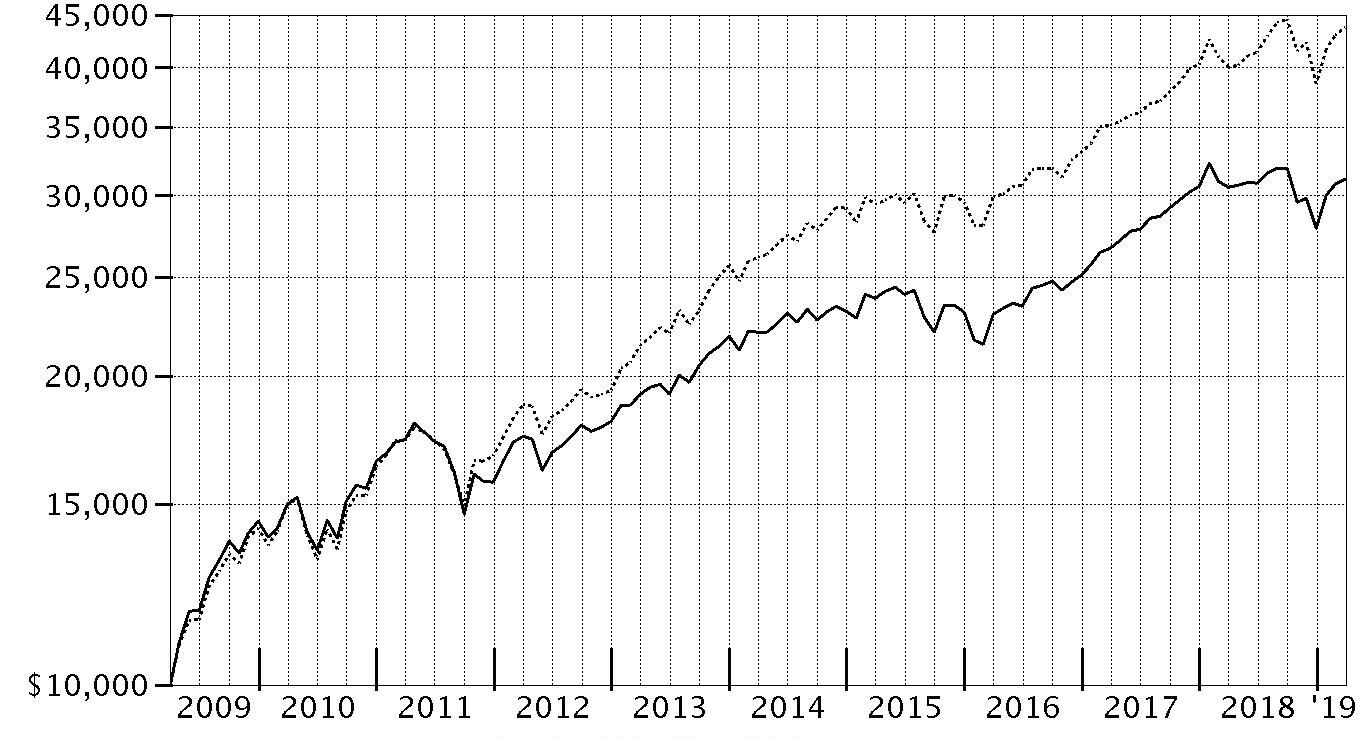
$10,000 Over 10 Years
Let's say hypothetically that $10,000 was invested in Fidelity Freedom® 2025 Fund, a class of the fund, on March 31, 2009.
The chart shows how the value of your investment would have changed, and also shows how the S&P 500® Index performed over the same period.
| Period Ending Values |
| $27,533 | Fidelity Freedom® 2025 Fund |
| $43,809 | S&P 500® Index |
Fidelity Freedom® 2030 Fund
Performance: The Bottom Line
Average annual total return reflects the change in the value of an investment, assuming reinvestment of distributions from dividend income and capital gains (the profits earned upon the sale of securities that have grown in value, if any) and assuming a constant rate of performance each year. The hypothetical investment and the average annual total returns do not reflect the deduction of taxes that a shareholder would pay on fund distributions or the redemption of fund shares. During periods of reimbursement by Fidelity, a fund’s total return will be greater than it would be had the reimbursement not occurred. How a fund did yesterday is no guarantee of how it will do tomorrow.
Average Annual Total Returns
| Periods ended March 31, 2019 | Past 1 year | Past 5 years | Past 10 years |
| Fidelity Freedom® 2030 Fund | 2.32% | 6.65% | 11.36% |
| Class K | 2.40% | 6.68% | 11.37% |
| Class K6 | 2.57% | 6.74% | 11.41% |
Prior to June 1, 2017, the fund operated under a different pricing structure. The fund’s historical performance prior to June 1, 2017 does not reflect the fund’s current pricing structure.
The initial offering of Class K shares took place on July 20, 2017. Returns prior to July 20, 2017 are those of Fidelity Freedom® 2030 Fund, the original class of the fund.
The initial offering of Class K6 shares took place on June 7, 2017. Returns prior to June 7, 2017 are those of Fidelity Freedom® 2030 Fund, the original class of the fund.
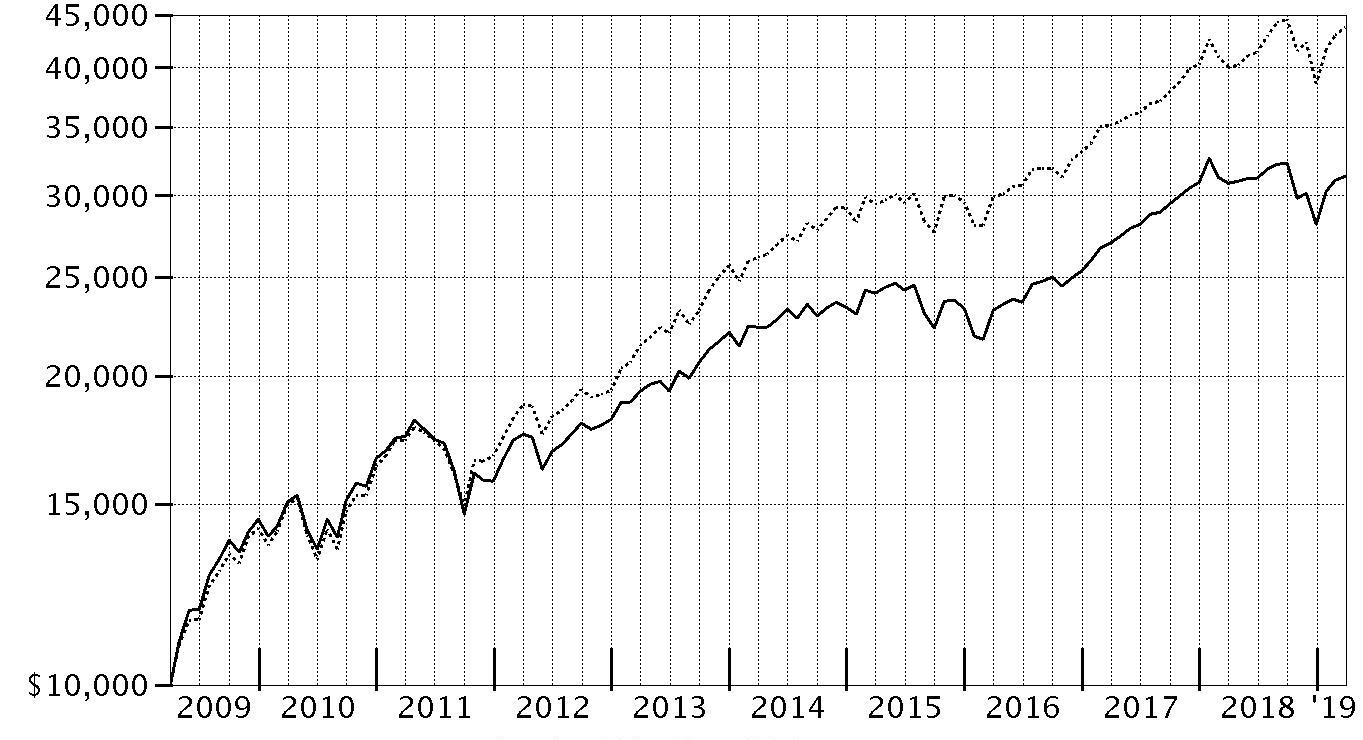
$10,000 Over 10 Years
Let's say hypothetically that $10,000 was invested in Fidelity Freedom® 2030 Fund, a class of the fund, on March 31, 2009.
The chart shows how the value of your investment would have changed, and also shows how the S&P 500® Index performed over the same period.
| Period Ending Values |
| $29,318 | Fidelity Freedom® 2030 Fund |
| $43,809 | S&P 500® Index |
Fidelity Freedom® 2035 Fund
Performance: The Bottom Line
Average annual total return reflects the change in the value of an investment, assuming reinvestment of distributions from dividend income and capital gains (the profits earned upon the sale of securities that have grown in value, if any) and assuming a constant rate of performance each year. The hypothetical investment and the average annual total returns do not reflect the deduction of taxes that a shareholder would pay on fund distributions or the redemption of fund shares. During periods of reimbursement by Fidelity, a fund’s total return will be greater than it would be had the reimbursement not occurred. How a fund did yesterday is no guarantee of how it will do tomorrow.
Average Annual Total Returns
| Periods ended March 31, 2019 | Past 1 year | Past 5 years | Past 10 years |
| Fidelity Freedom® 2035 Fund | 1.85% | 7.05% | 11.87% |
| Class K | 1.95% | 7.09% | 11.88% |
| Class K6 | 2.10% | 7.15% | 11.92% |
Prior to June 1, 2017, the fund operated under a different pricing structure. The fund’s historical performance prior to June 1, 2017 does not reflect the fund’s current pricing structure.
The initial offering of Class K shares took place on July 20, 2017. Returns prior to July 20, 2017 are those of Fidelity Freedom® 2035 Fund, the original class of the fund.
The initial offering of Class K6 shares took place on June 7, 2017. Returns prior to June 7, 2017 are those of Fidelity Freedom® 2035 Fund, the original class of the fund.
$10,000 Over 10 Years
Let's say hypothetically that $10,000 was invested in Fidelity Freedom® 2035 Fund, a class of the fund, on March 31, 2009.
The chart shows how the value of your investment would have changed, and also shows how the S&P 500® Index performed over the same period.

| Period Ending Values |
| $30,688 | Fidelity Freedom® 2035 Fund |
| $43,809 | S&P 500® Index |
Fidelity Freedom® 2040 Fund
Performance: The Bottom Line
Average annual total return reflects the change in the value of an investment, assuming reinvestment of distributions from dividend income and capital gains (the profits earned upon the sale of securities that have grown in value, if any) and assuming a constant rate of performance each year. The hypothetical investment and the average annual total returns do not reflect the deduction of taxes that a shareholder would pay on fund distributions or the redemption of fund shares. During periods of reimbursement by Fidelity, a fund’s total return will be greater than it would be had the reimbursement not occurred. How a fund did yesterday is no guarantee of how it will do tomorrow.
Average Annual Total Returns
| Periods ended March 31, 2019 | Past 1 year | Past 5 years | Past 10 years |
| Fidelity Freedom® 2040 Fund | 1.79% | 7.07% | 12.01% |
| Class K | 1.87% | 7.11% | 12.04% |
| Class K6 | 2.06% | 7.16% | 12.06% |
Prior to June 1, 2017, the fund operated under a different pricing structure. The fund’s historical performance prior to June 1, 2017 does not reflect the fund’s current pricing structure.
The initial offering of Class K shares took place on July 20, 2017. Returns prior to July 20, 2017 are those of Fidelity Freedom® 2040 Fund, the original class of the fund.
The initial offering of Class K6 shares took place on June 7, 2017. Returns prior to June 7, 2017 are those of Fidelity Freedom® 2040 Fund, the original class of the fund.
$10,000 Over 10 Years
Let's say hypothetically that $10,000 was invested in Fidelity Freedom® 2040 Fund, a class of the fund, on March 31, 2009.
The chart shows how the value of your investment would have changed, and also shows how the S&P 500® Index performed over the same period.
| Period Ending Values |
| $31,097 | Fidelity Freedom® 2040 Fund |
| $43,809 | S&P 500® Index |
Fidelity Freedom® 2045 Fund
Performance: The Bottom Line
Average annual total return reflects the change in the value of an investment, assuming reinvestment of distributions from dividend income and capital gains (the profits earned upon the sale of securities that have grown in value, if any) and assuming a constant rate of performance each year. The hypothetical investment and the average annual total returns do not reflect the deduction of taxes that a shareholder would pay on fund distributions or the redemption of fund shares. During periods of reimbursement by Fidelity, a fund’s total return will be greater than it would be had the reimbursement not occurred. How a fund did yesterday is no guarantee of how it will do tomorrow.
Average Annual Total Returns
| Periods ended March 31, 2019 | Past 1 year | Past 5 years | Past 10 years |
| Fidelity Freedom® 2045 Fund | 1.72% | 7.06% | 12.11% |
| Class K | 1.83% | 7.11% | 12.14% |
| Class K6 | 1.95% | 7.16% | 12.16% |
Prior to June 1, 2017, the fund operated under a different pricing structure. The fund’s historical performance prior to June 1, 2017 does not reflect the fund’s current pricing structure.
The initial offering of Class K shares took place on July 20, 2017. Returns prior to July 20, 2017 are those of Fidelity Freedom® 2045 Fund, the original class of the fund.
The initial offering of Class K6 shares took place on June 7, 2017. Returns prior to June 7, 2017 are those of Fidelity Freedom® 2045 Fund, the original class of the fund.
$10,000 Over 10 Years
Let's say hypothetically that $10,000 was invested in Fidelity Freedom® 2045 Fund, a class of the fund, on March 31, 2009.
The chart shows how the value of your investment would have changed, and also shows how the S&P 500® Index performed over the same period.
| Period Ending Values |
| $31,367 | Fidelity Freedom® 2045 Fund |
| $43,809 | S&P 500® Index |
Fidelity Freedom® 2050 Fund
Performance: The Bottom Line
Average annual total return reflects the change in the value of an investment, assuming reinvestment of distributions from dividend income and capital gains (the profits earned upon the sale of securities that have grown in value, if any) and assuming a constant rate of performance each year. The hypothetical investment and the average annual total returns do not reflect the deduction of taxes that a shareholder would pay on fund distributions or the redemption of fund shares. During periods of reimbursement by Fidelity, a fund’s total return will be greater than it would be had the reimbursement not occurred. How a fund did yesterday is no guarantee of how it will do tomorrow.
Average Annual Total Returns
| Periods ended March 31, 2019 | Past 1 year | Past 5 years | Past 10 years |
| Fidelity Freedom® 2050 Fund | 1.73% | 7.07% | 12.23% |
| Class K | 1.82% | 7.10% | 12.25% |
| Class K6 | 1.96% | 7.15% | 12.27% |
Prior to June 1, 2017, the fund operated under a different pricing structure. The fund’s historical performance prior to June 1, 2017 does not reflect the fund’s current pricing structure.
The initial offering of Class K shares took place on July 20, 2017. Returns prior to July 20, 2017 are those of Fidelity Freedom® 2050 Fund, the original class of the fund.
The initial offering of Class K6 shares took place on June 7, 2017. Returns prior to June 7, 2017 are those of Fidelity Freedom® 2050 Fund, the original class of the fund.
$10,000 Over 10 Years
Let's say hypothetically that $10,000 was invested in Fidelity Freedom® 2050 Fund, a class of the fund, on March 31, 2009.
The chart shows how the value of your investment would have changed, and also shows how the S&P 500® Index performed over the same period.

| Period Ending Values |
| $31,710 | Fidelity Freedom® 2050 Fund |
| $43,809 | S&P 500® Index |
Fidelity Freedom® 2055 Fund
Performance: The Bottom Line
Average annual total return reflects the change in the value of an investment, assuming reinvestment of distributions from dividend income and capital gains (the profits earned upon the sale of securities that have grown in value, if any) and assuming a constant rate of performance each year. The hypothetical investment and the average annual total returns do not reflect the deduction of taxes that a shareholder would pay on fund distributions or the redemption of fund shares. During periods of reimbursement by Fidelity, a fund’s total return will be greater than it would be had the reimbursement not occurred. How a fund did yesterday is no guarantee of how it will do tomorrow.
Average Annual Total Returns
| Periods ended March 31, 2019 | Past 1 year | Past 5 years | Life of FundA |
| Fidelity Freedom® 2055 Fund | 1.73% | 7.07% | 7.85% |
| Class K | 1.84% | 7.12% | 7.88% |
| Class K6 | 1.97% | 7.17% | 7.91% |
A From June 1, 2011
Prior to June 1, 2017, the fund operated under a different pricing structure. The fund’s historical performance prior to June 1, 2017 does not reflect the fund’s current pricing structure.
The initial offering of Class K shares took place on July 20, 2017. Returns prior to July 20, 2017 are those of Fidelity Freedom® 2055 Fund, the original class of the fund.
The initial offering of Class K6 shares took place on June 7, 2017. Returns prior to June 7, 2017 are those of Fidelity Freedom® 2055 Fund, the original class of the fund.
$10,000 Over Life of Fund
Let's say hypothetically that $10,000 was invested in Fidelity Freedom® 2055 Fund, a class of the fund, on June 1, 2011, when the fund started.
The chart shows how the value of your investment would have changed, and also shows how the S&P 500® Index performed over the same period.

| Period Ending Values |
| $18,076 | Fidelity Freedom® 2055 Fund |
| $25,424 | S&P 500® Index |
Fidelity Freedom® 2060 Fund
Performance: The Bottom Line
Average annual total return reflects the change in the value of an investment, assuming reinvestment of distributions from dividend income and capital gains (the profits earned upon the sale of securities that have grown in value, if any) and assuming a constant rate of performance each year. The hypothetical investment and the average annual total returns do not reflect the deduction of taxes that a shareholder would pay on fund distributions or the redemption of fund shares. During periods of reimbursement by Fidelity, a fund’s total return will be greater than it would be had the reimbursement not occurred. How a fund did yesterday is no guarantee of how it will do tomorrow.
Average Annual Total Returns
| Periods ended March 31, 2019 | Past 1 year | Life of FundA |
| Fidelity Freedom® 2060 Fund | 1.78% | 7.22% |
| Class K | 1.80% | 7.25% |
| Class K6 | 2.05% | 7.33% |
A From August 5, 2014
Prior to June 1, 2017, the fund operated under a different pricing structure. The fund’s historical performance prior to June 1, 2017 does not reflect the fund’s current pricing structure.
The initial offering of Class K shares took place on July 20, 2017. Returns prior to July 20, 2017 are those of Fidelity Freedom® 2060 Fund, the original class of the fund.
The initial offering of Class K6 shares took place on June 7, 2017. Returns prior to June 7, 2017 are those of Fidelity Freedom® 2060 Fund, the original class of the fund.
$10,000 Over Life of Fund
Let's say hypothetically that $10,000 was invested in Fidelity Freedom® 2060 Fund, a class of the fund, on August 5, 2014, when the fund started.
The chart shows how the value of your investment would have changed, and also shows how the S&P 500® Index performed over the same period.
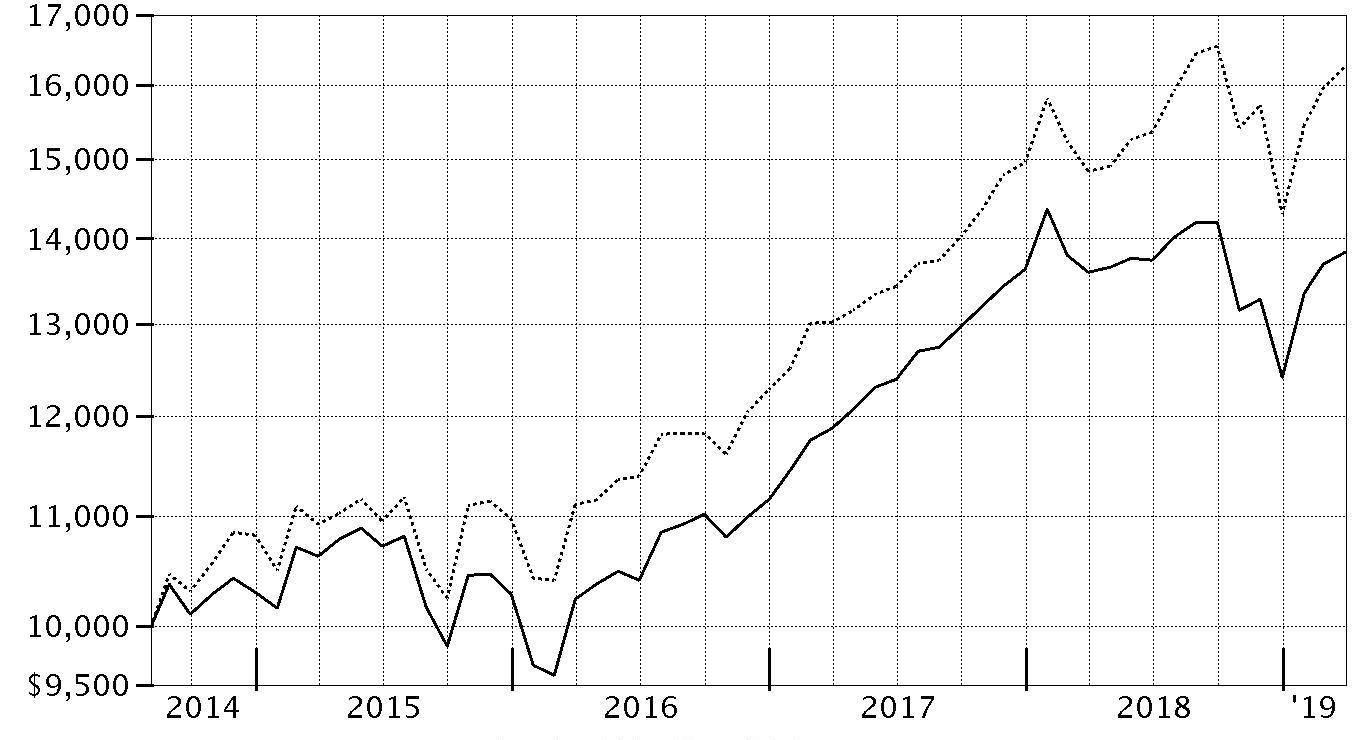
| Period Ending Values |
| $13,835 | Fidelity Freedom® 2060 Fund |
| $16,256 | S&P 500® Index |
Management's Discussion of Fund Performance
Market Recap: The global economy remained in expansion for the 12 months ending March 31, 2019, but growth was less synchronous and uneven. Many major economies progressed toward more-advanced stages of the business cycle. Financial markets responded favorably to the U.S. Federal Reserve’s shift away from its monetary tightening bias in the first quarter of 2019. Most economic indicators remained tepid, although China displayed some initial signs of stabilizing activity, and stepped up the pace of fiscal and monetary stimulus in the first quarter.Against this backdrop, the MSCI World ex USA Index of non-U.S. equity markets returned -2.91% for the year. Much of the negative impact came in the volatile fourth quarter of 2018, when the index returned -13%, followed by a sharp rebound to begin 2019. Among regions in the index, stocks in resource-rich Canada gained 4%, benefiting from rising crude-oil prices early and late in the period, while Asia Pacific ex Japan (+4%) was aided by stabilizing returns in Hong Kong, which rose 8%. Conversely, stocks in Japan (-8%), emerging markets (0%) and Europe ex U.K. (-4%) lagged. Results at home were markedly better. The U.S. equity bellwether S&P 500
® index rose 9.50%. Nine of 11 sectors in the S&P 500
® had a positive return. Three defensive sectors stood out: real estate (+21%), utilities (+19%) and health care (+15%). Conversely, some economically sensitive sectors struggled, with financials (-5%) faring worst. The small-cap-oriented Russell 2000
® Index gained 2.05% for the 12 months. Commodities also lagged, as evidenced by the -5.25% result of the Bloomberg Barclays Commodity Index Total Return.U.S. investment-grade bonds gained 4.48%, according to the Bloomberg Barclays U.S. Aggregate Bond Index, largely driven by surging returns for credit-sensitive sectors. U.S. corporate bonds increased 4.89%, according to the Bloomberg Barclays Credit Bond Index. Elsewhere, securitized sectors fared well, led by commercial mortgage-backed securities (+5.43%). Agency bonds and Treasury Inflation-Protected Securities (TIPS) lagged, as measured by the 3.73% return of the Bloomberg Barclays U.S. Agency Bond Index and the 2.70% advance of the Bloomberg Barclays U.S. Treasury Inflation-Protected Securities Index (Series-L), respectively.
Comments from Co-Portfolio Managers Andrew Dierdorf and Brett Sumsion: For the fiscal year ending March 31, 2019, shares of each Fidelity Freedom
® Fund posted a gain, ranging from 3.08% for Fidelity Freedom Income Fund to 1.72% for Fidelity Freedom 2045 Fund. Each Fund lagged its respective Composite index by roughly 1 to 3 percentage points. Both underlying investment performance and top-down active asset allocation were responsible for the Funds' underperformance of Composites. In terms of investment performance, returns among underlying U.S. equity funds detracted, especially an investment in Fidelity Series Intrinsic Opportunities Fund, which trailed its benchmark, the Russell 3000 Index, by nearly 10 percentage points the past year because the manager's value-oriented investment style was out of favor. To a lesser extent, the Funds' overall investments in non-U.S. equities also hurt relative performance, as returns here lagged the -4.04% return of the MSCI All Country World ex U.S.A. Index, the Composites' benchmark for the asset class. Conversely, the performance of the Funds' underlying investment-grade bond investments added value versus Composites. From an active asset allocation perspective, non-Composite exposure to commodities held back the Funds' relative results the most. Overweighting emerging-markets funds also detracted, as did underweighting U.S. equities – one of the better-performing asset classes this period. Intra-asset allocation decisions – investments made within the major asset classes (equities and fixed-income) – also had a negative influence on the Funds’ relative performance. In particular, allocations within U.S. equities and non U.S.-equities proved disappointing the past year.
The views expressed above reflect those of the portfolio manager(s) only through the end of the period as stated on the cover of this report and do not necessarily represent the views of Fidelity or any other person in the Fidelity organization. Any such views are subject to change at any time based upon market or other conditions and Fidelity disclaims any responsibility to update such views. These views may not be relied on as investment advice and, because investment decisions for a Fidelity fund are based on numerous factors, may not be relied on as an indication of trading intent on behalf of any Fidelity fund.
Notes to Shareholders: At its May 2018 meeting, the Board of Trustees approved incremental updates to the glide path and strategic asset allocation of Fidelity Freedom Funds, adding U.S. Treasury Inflation-Protected Securities and long-term U.S. Treasury bonds and slightly reducing the equity and short-term debt allocations for shorter-dated Funds. These updates have been fully implemented. At its May 2019 meeting, the Board of Trustees approved adjusting the equity composition of the strategic asset allocation of Fidelity Freedom Funds from 70%/30% to 60%/40% for U.S./non-U.S. equities.
Fidelity Freedom® Income Fund
Investment Summary (Unaudited)
The information in the following tables is based on the direct investments of the Fund.
Top Holdings as of March 31, 2019
| | % of fund's net assets |
| Fidelity Series Investment Grade Bond Fund | 37.4 |
| Fidelity Series Government Money Market Fund 2.50% | 17.8 |
| Fidelity Series Inflation-Protected Bond Index Fund | 13.1 |
| Fidelity Series Long-Term Treasury Bond Index Fund | 4.5 |
| Fidelity Series Short-Term Credit Fund | 4.5 |
| Fidelity Series Emerging Markets Opportunities Fund | 3.4 |
| Fidelity Series International Growth Fund | 2.3 |
| Fidelity Series Commodity Strategy Fund | 2.3 |
| Fidelity Series International Value Fund | 2.2 |
| Fidelity Series Intrinsic Opportunities Fund | 1.6 |
| | 89.1 |
Asset Allocation (% of fund's net assets)
| Period end |
| | Domestic Equity Funds | 11.1% |
| | International Equity Funds | 9.1% |
| | Bond Funds | 57.4% |
| | Short-Term Funds | 22.4% |

Domestic Equity Funds category includes Fidelity Series Commodity Strategy Fund which invests in commodity-related investments.
Fidelity Freedom® Income Fund
Schedule of Investments March 31, 2019
Showing Percentage of Net Assets
| U.S. Treasury Obligations - 0.0% | | | |
| | | Principal Amount | Value |
| U.S. Treasury Bills, yield at date of purchase 2.37% to 2.43% 4/4/19 to 6/20/19 (a) | | | |
| (Cost $1,296,310) | | 1,300,000 | 1,296,366 |
| | | Shares | Value |
|
| Domestic Equity Funds - 11.1% | | | |
| Fidelity Series All-Sector Equity Fund (b) | | 1,071,528 | $10,318,814 |
| Fidelity Series Blue Chip Growth Fund (b) | | 1,503,881 | 22,182,241 |
| Fidelity Series Commodity Strategy Fund (b) | | 16,361,213 | 78,042,984 |
| Fidelity Series Growth Company Fund (b) | | 2,584,963 | 43,711,719 |
| Fidelity Series Intrinsic Opportunities Fund (b) | | 3,230,193 | 53,136,678 |
| Fidelity Series Large Cap Stock Fund (b) | | 3,143,894 | 46,058,050 |
| Fidelity Series Large Cap Value Index Fund (b) | | 1,061,774 | 13,176,613 |
| Fidelity Series Opportunistic Insights Fund (b) | | 1,335,495 | 23,344,444 |
| Fidelity Series Small Cap Discovery Fund (b) | | 556,860 | 6,192,282 |
| Fidelity Series Small Cap Opportunities Fund (b) | | 1,370,605 | 18,448,340 |
| Fidelity Series Stock Selector Large Cap Value Fund (b) | | 3,025,285 | 35,698,360 |
| Fidelity Series Value Discovery Fund (b) | | 2,003,370 | 25,022,092 |
| TOTAL DOMESTIC EQUITY FUNDS | | | |
| (Cost $294,443,798) | | | 375,332,617 |
|
| International Equity Funds - 9.1% | | | |
| Fidelity Series Canada Fund (b) | | 657,903 | 6,782,976 |
| Fidelity Series Emerging Markets Fund (b) | | 1,252,169 | 12,258,731 |
| Fidelity Series Emerging Markets Opportunities Fund (b) | | 6,181,258 | 114,538,710 |
| Fidelity Series International Growth Fund (b) | | 5,236,098 | 79,536,330 |
| Fidelity Series International Small Cap Fund (b) | | 1,243,867 | 19,317,262 |
| Fidelity Series International Value Fund (b) | | 8,184,359 | 76,114,541 |
| TOTAL INTERNATIONAL EQUITY FUNDS | | | |
| (Cost $250,120,934) | | | 308,548,550 |
|
| Bond Funds - 57.4% | | | |
| Fidelity Series Emerging Markets Debt Fund (b) | | 2,672,492 | 25,629,199 |
| Fidelity Series Floating Rate High Income Fund (b) | | 481,201 | 4,460,729 |
| Fidelity Series High Income Fund (b) | | 3,147,644 | 29,587,852 |
| Fidelity Series Inflation-Protected Bond Index Fund (b) | | 45,386,929 | 443,884,166 |
| Fidelity Series International Credit Fund (b) | | 196,778 | 1,946,138 |
| Fidelity Series Investment Grade Bond Fund (b) | | 113,213,736 | 1,265,729,572 |
| Fidelity Series Long-Term Treasury Bond Index Fund (b) | | 17,358,248 | 153,967,657 |
| Fidelity Series Real Estate Income Fund (b) | | 1,534,911 | 16,745,875 |
| TOTAL BOND FUNDS | | | |
| (Cost $1,904,302,857) | | | 1,941,951,188 |
|
| Short-Term Funds - 22.4% | | | |
| Fidelity Cash Central Fund, 2.48% (c) | | 5,086,434 | 5,087,452 |
| Fidelity Series Government Money Market Fund 2.50% (b)(d) | | 600,538,386 | 600,538,386 |
| Fidelity Series Short-Term Credit Fund (b) | | 15,135,942 | 150,905,338 |
| TOTAL SHORT-TERM FUNDS | | | |
| (Cost $756,432,811) | | | 756,531,176 |
| TOTAL INVESTMENT IN SECURITIES - 100.0% | | | |
| (Cost $3,206,596,710) | | | 3,383,659,897 |
| NET OTHER ASSETS (LIABILITIES) - 0.0% | | | (1,439,854) |
| NET ASSETS - 100% | | | $3,382,220,043 |
| Futures Contracts | | | | | |
| | Number of contracts | Expiration Date | Notional Amount | Value | Unrealized Appreciation/(Depreciation) |
| Purchased | | | | | |
| Equity Index Contracts | | | | | |
| ICE E-mini MSCI EAFE Index Contracts (United States) | 7 | June 2019 | $653,240 | $11,909 | $11,909 |
| Treasury Contracts | | | | | |
| CBOT 2-Year U.S. Treasury Note Contracts (United States) | 9 | June 2019 | 1,917,844 | 8,355 | 8,355 |
| CBOT 5-Year U.S. Treasury Note Contracts (United States) | 17 | June 2019 | 1,969,078 | 22,411 | 22,411 |
| CBOT Long Term U.S. Treasury Bond Contracts (United States) | 2 | June 2019 | 299,313 | 10,496 | 10,496 |
| CBOT Long Term U.S. Treasury Bond Contracts (United States) | 12 | June 2019 | 1,490,625 | 27,725 | 27,725 |
| CBOT Ultra Long Term U.S. Treasury Bond Contracts (United States) | 3 | June 2019 | 504,000 | 25,083 | 25,083 |
| TOTAL TREASURY CONTRACTS | | | | | 94,070 |
|
| TOTAL PURCHASED | | | | | 105,979 |
|
| Sold | | | | | |
| Equity Index Contracts | | | | | |
| CME E-mini S&P 500 Index Contracts (United States) | 83 | June 2019 | 11,776,870 | (356,462) | (356,462) |
| ICE E-mini MSCI Emerging Markets Index Contracts (United States) | 131 | June 2019 | 6,925,970 | (129,145) | (129,145) |
|
| TOTAL SOLD | | | | | (485,607) |
|
| TOTAL FUTURES CONTRACTS | | | | | $(379,628) |
The notional amount of futures purchased as a percentage of Net Assets is 0.2%
The notional amount of futures sold as a percentage of Net Assets is 0.6%
Legend
(a) Security or a portion of the security was pledged to cover margin requirements for futures contracts. At period end, the value of securities pledged amounted to $1,296,366.
(b) Affiliated Fund
(c) Affiliated fund that is generally available only to investment companies and other accounts managed by Fidelity Investments. The rate quoted is the annualized seven-day yield of the fund at period end. A complete unaudited listing of the fund's holdings as of its most recent quarter end is available upon request. In addition, each Fidelity Central Fund's financial statements, which are not covered by the Fund's Report of Independent Registered Public Accounting Firm, are available on the SEC's website or upon request.
(d) The rate quoted is the annualized seven-day yield of the fund at period end.
Affiliated Central Funds
Information regarding fiscal year to date income earned by the Fund from investments in Fidelity Central Funds is as follows:
| Fund | Income earned |
| Fidelity Cash Central Fund | $75,203 |
| Total | $75,203 |
Amounts in the income column in the above table include any capital gain distributions from underlying funds, which are presented in the corresponding line-item in the Statement of Operations, if applicable.
Affiliated Underlying Funds
Fiscal year to date information regarding the Fund's investments in affiliated Underlying Funds, excluding any Money Market Central Funds, is presented below. Exchanges between classes of the same affiliated Underlying Funds may occur.
| Affiliate | Value, beginning of period | Purchases | Sales Proceeds | Dividend Income | Realized Gain (loss) | Change in Unrealized appreciation (depreciation) | Value, end of period |
| Fidelity Series 100 Index Fund | $15,916,073 | $-- | $16,684,277 | $-- | $6,617,339 | $(5,849,135) | $-- |
| Fidelity Series All-Sector Equity Fund | 30,551,376 | 2,779,732 | 22,863,157 | 2,579,362 | 5,014,166 | (5,163,303) | 10,318,814 |
| Fidelity Series Blue Chip Growth Fund | 31,582,362 | 3,174,616 | 14,690,995 | 2,899,573 | 4,769,782 | (2,653,524) | 22,182,241 |
| Fidelity Series Canada Fund | 9,334,390 | 247,735 | 3,001,964 | 151,592 | 1,796 | 201,019 | 6,782,976 |
| Fidelity Series Commodity Strategy Fund | 79,034,933 | 29,189,668 | 21,418,957 | 4,522,415 | (8,817,227) | 54,567 | 78,042,984 |
| Fidelity Series Emerging Markets Debt Fund | 28,508,764 | 1,836,249 | 3,310,939 | 1,601,930 | (137,899) | (1,266,976) | 25,629,199 |
| Fidelity Series Emerging Markets Fund | -- | 12,925,791 | 765,955 | 48,772 | (18,277) | 117,172 | 12,258,731 |
| Fidelity Series Emerging Markets Opportunities Fund | 114,600,734 | 29,529,778 | 13,927,848 | 8,990,865 | 1,474,501 | (17,138,455) | 114,538,710 |
| Fidelity Series Floating Rate High Income Fund | 9,147,819 | 527,245 | 5,050,482 | 450,247 | (297,331) | 133,478 | 4,460,729 |
| Fidelity Series Government Money Market Fund 2.50% | 859,951,401 | 90,063,089 | 349,476,104 | 14,613,275 | -- | -- | 600,538,386 |
| Fidelity Series Growth Company Fund | 67,193,973 | 6,088,065 | 31,545,784 | 4,389,042 | 12,952,741 | (10,977,276) | 43,711,719 |
| Fidelity Series High Income Fund | 56,045,887 | 3,483,697 | 29,344,722 | 2,979,299 | (1,394,519) | 797,509 | 29,587,852 |
| Fidelity Series Inflation-Protected Bond Index Fund | 140,449,749 | 343,806,398 | 42,050,139 | 8,068,370 | (1,324,527) | 3,002,685 | 443,884,166 |
| Fidelity Series International Credit Fund | 1,872,196 | 94,306 | 15,354 | 94,306 | (207) | (4,803) | 1,946,138 |
| Fidelity Series International Growth Fund | 97,009,280 | 18,168,777 | 31,482,839 | 5,129,287 | 5,224,374 | (9,383,262) | 79,536,330 |
| Fidelity Series International Small Cap Fund | 24,130,987 | 5,924,575 | 7,673,721 | 1,640,557 | 1,147,935 | (4,212,514) | 19,317,262 |
| Fidelity Series International Value Fund | 95,143,387 | 15,233,348 | 24,341,335 | 2,823,633 | 1,712,087 | (11,632,946) | 76,114,541 |
| Fidelity Series Intrinsic Opportunities Fund | 78,260,126 | 5,130,440 | 26,047,160 | 4,463,058 | 6,203,025 | (10,409,753) | 53,136,678 |
| Fidelity Series Investment Grade Bond Fund | 1,414,325,467 | 68,950,138 | 233,728,274 | 42,711,835 | (8,927,545) | 25,109,786 | 1,265,729,572 |
| Fidelity Series Large Cap Stock Fund | 69,040,943 | 6,283,809 | 28,405,830 | 5,687,649 | 4,615,463 | (5,476,335) | 46,058,050 |
| Fidelity Series Large Cap Value Index Fund | 19,791,623 | 787,790 | 7,779,222 | 622,461 | 897,617 | (521,195) | 13,176,613 |
| Fidelity Series Long-Term Treasury Bond Index Fund | 78,600,027 | 112,379,748 | 42,949,463 | 3,617,599 | (1,419,510) | 7,356,855 | 153,967,657 |
| Fidelity Series Opportunistic Insights Fund | 34,616,831 | 2,230,923 | 14,761,326 | 1,931,491 | 6,120,140 | (4,862,124) | 23,344,444 |
| Fidelity Series Real Estate Equity Fund | 6,171,500 | 89,767 | 6,510,092 | 82,424 | 1,186,459 | (937,634) | -- |
| Fidelity Series Real Estate Income Fund | 17,355,440 | 1,424,441 | 2,338,989 | 1,240,665 | (3,762) | 308,745 | 16,745,875 |
| Fidelity Series Short-Term Credit Fund | 211,429,964 | 6,465,257 | 68,630,252 | 4,524,719 | (940,626) | 2,580,995 | 150,905,338 |
| Fidelity Series Small Cap Discovery Fund | 9,419,231 | 1,035,559 | 3,630,681 | 955,039 | 506,894 | (1,138,721) | 6,192,282 |
| Fidelity Series Small Cap Opportunities Fund | 28,758,372 | 2,501,163 | 12,550,150 | 2,253,851 | 3,474,978 | (3,736,023) | 18,448,340 |
| Fidelity Series Stock Selector Large Cap Value Fund | 53,907,465 | 3,668,280 | 21,276,790 | 3,080,122 | 4,270,091 | (4,870,686) | 35,698,360 |
| Fidelity Series Value Discovery Fund | 38,314,030 | 1,868,763 | 14,871,860 | 1,547,278 | 3,531,325 | (3,820,166) | 25,022,092 |
| Total | $3,720,464,330 | $775,889,147 | $1,101,124,661 | $133,700,716 | $46,439,283 | $(64,392,020) | $3,377,276,079 |
Amounts in the income column in the above table include any capital gain distributions from underlying funds, which are presented in the corresponding line-item in the Statement of Operations, if applicable.
Investment Valuation
The following is a summary of the inputs used, as of March 31, 2019, involving the Fund's assets and liabilities carried at fair value. The inputs or methodology used for valuing securities may not be an indication of the risk associated with investing in those securities. For more information on valuation inputs, and their aggregation into the levels used below, please refer to the Investment Valuation section in the accompanying Notes to Financial Statements.
| | Valuation Inputs at Reporting Date: |
| Description | Total | Level 1 | Level 2 | Level 3 |
| Investments in Securities: | | | | |
| Other Short-Term Investments | $1,296,366 | $-- | $1,296,366 | $-- |
| Domestic Equity Funds | 375,332,617 | 375,332,617 | -- | -- |
| International Equity Funds | 308,548,550 | 308,548,550 | -- | -- |
| Bond Funds | 1,941,951,188 | 1,941,951,188 | -- | -- |
| Short-Term Funds | 756,531,176 | 756,531,176 | -- | -- |
| Total Investments in Securities: | $3,383,659,897 | $3,382,363,531 | $1,296,366 | $-- |
| Derivative Instruments: | | | | |
| Assets | | | | |
| Futures Contracts | $105,979 | $105,979 | $-- | $-- |
| Total Assets | $105,979 | $105,979 | $-- | $-- |
| Liabilities | | | | |
| Futures Contracts | $(485,607) | $(485,607) | $-- | $-- |
| Total Liabilities | $(485,607) | $(485,607) | $-- | $-- |
| Total Derivative Instruments: | $(379,628) | $(379,628) | $-- | $-- |
Value of Derivative Instruments
The following table is a summary of the Fund's value of derivative instruments by primary risk exposure as of March 31, 2019. For additional information on derivative instruments, please refer to the Derivative Instruments section in the accompanying Notes to Financial Statements.
| Primary Risk Exposure / Derivative Type | Value |
| | Asset | Liability |
| Equity Risk | | |
| Futures Contracts(a) | $11,909 | $(485,607) |
| Total Equity Risk | 11,909 | (485,607) |
| Interest Rate Risk | | |
| Futures Contracts | 94,070 | -- |
| Total Interest Rate Risk | 94,070 | -- |
| Total Value of Derivatives | $105,979 | $(485,607) |
(a) Reflects gross cumulative appreciation (depreciation) on futures contracts as presented in the Schedule of Investments. In the Statement of Assets and Liabilities, the period end daily variation margin is included in receivable or payable for daily variation margin on futures contracts, and the net cumulative appreciation (depreciation) is included in distributable earnings.
See accompanying notes which are an integral part of the financial statements.
Fidelity Freedom® Income Fund
Financial Statements
Statement of Assets and Liabilities
| | | March 31, 2019 |
| Assets | | |
Investment in securities, at value — See accompanying schedule:
Unaffiliated issuers (cost $1,296,310) | $1,296,366 | |
| Fidelity Central Funds (cost $5,087,446) | 5,087,452 | |
| Other affiliated issuers (cost $3,200,212,954) | 3,377,276,079 | |
| Total Investment in Securities (cost $3,206,596,710) | | $3,383,659,897 |
| Receivable for investments sold | | 8,543,458 |
| Receivable for fund shares sold | | 26,129,219 |
| Distributions receivable from Fidelity Central Funds | | 10,371 |
| Total assets | | 3,418,342,945 |
| Liabilities | | |
| Payable for investments purchased | $7,757,076 | |
| Payable for fund shares redeemed | 26,925,537 | |
| Accrued management fee | 1,238,152 | |
| Payable for daily variation margin on futures contracts | 202,137 | |
| Total liabilities | | 36,122,902 |
| Net Assets | | $3,382,220,043 |
| Net Assets consist of: | | |
| Paid in capital | | $3,183,798,477 |
| Total distributable earnings (loss) | | 198,421,566 |
| Net Assets | | $3,382,220,043 |
| Net Asset Value and Maximum Offering Price | | |
| Fidelity Freedom Income Fund: | | |
| Net Asset Value, offering price and redemption price per share ($1,978,263,120 ÷ 172,955,926 shares) | | $11.44 |
| Class K: | | |
| Net Asset Value, offering price and redemption price per share ($1,236,534,843 ÷ 108,258,089 shares) | | $11.42 |
| Class K6: | | |
| Net Asset Value, offering price and redemption price per share ($167,422,080 ÷ 14,662,342 shares) | | $11.42 |
See accompanying notes which are an integral part of the financial statements.
Statement of Operations
| | | Year ended March 31, 2019 |
| Investment Income | | |
| Dividends: | | |
| Affiliated issuers | | $86,763,239 |
| Interest | | 20,728 |
| Income from Fidelity Central Funds | | 75,203 |
| Total income | | 86,859,170 |
| Expenses | | |
| Management fee | $15,445,776 | |
| Independent trustees' fees and expenses | 16,698 | |
| Total expenses before reductions | 15,462,474 | |
| Expense reductions | (229) | |
| Total expenses after reductions | | 15,462,245 |
| Net investment income (loss) | | 71,396,925 |
| Realized and Unrealized Gain (Loss) | | |
| Net realized gain (loss) on: | | |
| Investment securities: | | |
| Unaffiliated issuers | 440 | |
| Fidelity Central Funds | (168) | |
| Other affiliated issuers | 46,439,283 | |
| Futures contracts | 862,816 | |
| Capital gain distributions from underlying funds: | | |
| Affiliated issuers | 46,937,477 | |
| Total net realized gain (loss) | | 94,239,848 |
| Change in net unrealized appreciation (depreciation) on: | | |
| Investment securities: | | |
| Unaffiliated issuers | 73 | |
| Fidelity Central Funds | 6 | |
| Other affiliated issuers | (64,392,020) | |
| Futures contracts | (379,628) | |
| Total change in net unrealized appreciation (depreciation) | | (64,771,569) |
| Net gain (loss) | | 29,468,279 |
| Net increase (decrease) in net assets resulting from operations | | $100,865,204 |
See accompanying notes which are an integral part of the financial statements.
Statement of Changes in Net Assets
| | Year ended March 31, 2019 | Year ended March 31, 2018 |
| Increase (Decrease) in Net Assets | | |
| Operations | | |
| Net investment income (loss) | $71,396,925 | $54,568,700 |
| Net realized gain (loss) | 94,239,848 | 90,451,426 |
| Change in net unrealized appreciation (depreciation) | (64,771,569) | (21,703,503) |
| Net increase (decrease) in net assets resulting from operations | 100,865,204 | 123,316,623 |
| Distributions to shareholders | (178,193,341) | – |
| Distributions to shareholders from net investment income | – | (51,949,454) |
| Distributions to shareholders from net realized gain | – | (67,440,706) |
| Total distributions | (178,193,341) | (119,390,160) |
| Share transactions - net increase (decrease) | (260,021,875) | 1,577,891,442 |
| Total increase (decrease) in net assets | (337,350,012) | 1,581,817,905 |
| Net Assets | | |
| Beginning of period | 3,719,570,055 | 2,137,752,150 |
| End of period | $3,382,220,043 | $3,719,570,055 |
| Other Information | | |
| Undistributed net investment income end of period | | $5,475,633 |
See accompanying notes which are an integral part of the financial statements.
Financial Highlights
Fidelity Freedom Income Fund
| Years ended March 31, | 2019 | 2018 | 2017 | 2016 | 2015 |
| Selected Per–Share Data | | | | | |
| Net asset value, beginning of period | $11.69 | $11.57 | $11.26 | $11.75 | $11.86 |
| Income from Investment Operations | | | | | |
| Net investment income (loss)A | .23 | .18 | .19 | .21 | .21 |
| Net realized and unrealized gain (loss) | .11 | .38 | .49 | (.27) | .28 |
| Total from investment operations | .34 | .56 | .68 | (.06) | .49 |
| Distributions from net investment income | (.23) | (.19) | (.20)B | (.21) | (.20) |
| Distributions from net realized gain | (.36) | (.25) | (.17)B | (.22) | (.40) |
| Total distributions | (.59) | (.44) | (.37) | (.43) | (.60) |
| Net asset value, end of period | $11.44 | $11.69 | $11.57 | $11.26 | $11.75 |
| Total ReturnC | 3.08% | 4.86% | 6.16% | (.45)% | 4.31% |
| Ratios to Average Net AssetsD,E | | | | | |
| Expenses before reductions | .46%F | .39% | - %G | - %G | - %G |
| Expenses net of fee waivers, if any | .46%F | .39% | -% | -% | -% |
| Expenses net of all reductions | .46%F | .39% | -% | -% | -% |
| Net investment income (loss) | 2.02% | 1.57% | 1.70% | 1.86% | 1.77% |
| Supplemental Data | | | | | |
| Net assets, end of period (000 omitted) | $1,978,263 | $2,111,741 | $2,137,752 | $2,184,994 | $2,483,848 |
| Portfolio turnover rateD | 22% | 17%H | 31% | 20% | 26%H |
A Calculated based on average shares outstanding during the period.
B The amounts shown reflect certain reclassifications related to book to tax differences that were made in the year shown.
C Total returns would have been lower if certain expenses had not been reduced during the applicable periods shown.
D Amounts do not include the activity of the Underlying Funds.
E Expense ratios reflect operating expenses of the class. Expenses before reductions do not reflect amounts reimbursed by the investment adviser or reductions from expense offset arrangements and do not represent the amount paid by the class during periods when reimbursements or reductions occur. Expenses net of fee waivers reflect expenses after reimbursement by the investment adviser but prior to reductions from expense offset arrangements. Expenses net of all reductions represent the net expenses paid by the class but do not include expenses of the underlying funds in which the Fund invests.
F On certain classes, the size and fluctuation of net assets and expense amounts may cause ratios to differ from contractual rates.
G Amount represents less than .005%.
H The portfolio turnover rate does not include the assets acquired in the merger.
See accompanying notes which are an integral part of the financial statements.
Fidelity Freedom Income Fund Class K
| Years ended March 31, | 2019 | 2018 A |
| Selected Per–Share Data | | |
| Net asset value, beginning of period | $11.68 | $11.76 |
| Income from Investment Operations | | |
| Net investment income (loss)B | .24 | .19 |
| Net realized and unrealized gain (loss) | .09 | .05 |
| Total from investment operations | .33 | .24 |
| Distributions from net investment income | (.24) | (.16) |
| Distributions from net realized gain | (.36) | (.17) |
| Total distributions | (.59)C | (.32)D |
| Net asset value, end of period | $11.42 | $11.68 |
| Total ReturnE,F | 3.04% | 2.06% |
| Ratios to Average Net AssetsG,H | | |
| Expenses before reductions | .41%I | .42%J |
| Expenses net of fee waivers, if any | .41%I | .42%J |
| Expenses net of all reductions | .41%I | .42%J |
| Net investment income (loss) | 2.07% | 2.32%J |
| Supplemental Data | | |
| Net assets, end of period (000 omitted) | $1,236,535 | $1,568,576 |
| Portfolio turnover rateG | 22% | 17%K |
A For the period July 20, 2017 (commencement of sale of shares) to March 31, 2018.
B Calculated based on average shares outstanding during the period.
C Total distributions of $.59 per share is comprised of distributions from net investment income of $.236 and distributions from net realized gain of $.357 per share.
D Total distributions of $.32 per share is comprised of distributions from net investment income of $.157 and distributions from net realized gain of $.166 per share.
E Total returns for periods of less than one year are not annualized.
F Total returns would have been lower if certain expenses had not been reduced during the applicable periods shown.
G Amounts do not include the activity of the Underlying Funds.
H Expense ratios reflect operating expenses of the class. Expenses before reductions do not reflect amounts reimbursed by the investment adviser or reductions from expense offset arrangements and do not represent the amount paid by the class during periods when reimbursements or reductions occur. Expense ratios before reductions for start-up periods may not be representative of longer-term operating periods. Expenses net of fee waivers reflect expenses after reimbursement by the investment adviser but prior to reductions from expense offset arrangements. Expenses net of all reductions represent the net expenses paid by the class but do not include expenses of the underlying funds in which the Fund invests.
I On certain classes, the size and fluctuation of net assets and expense amounts may cause ratios to differ from contractual rates.
J Annualized
K The portfolio turnover rate does not include the assets acquired in the merger.
See accompanying notes which are an integral part of the financial statements.
Fidelity Freedom Income Fund Class K6
| Years ended March 31, | 2019 | 2018 A |
| Selected Per–Share Data | | |
| Net asset value, beginning of period | $11.68 | $11.68 |
| Income from Investment Operations | | |
| Net investment income (loss)B | .24 | .18 |
| Net realized and unrealized gain (loss) | .11 | .15 |
| Total from investment operations | .35 | .33 |
| Distributions from net investment income | (.25) | (.17) |
| Distributions from net realized gain | (.36) | (.17) |
| Total distributions | (.61) | (.33)C |
| Net asset value, end of period | $11.42 | $11.68 |
| Total ReturnD,E | 3.16% | 2.86% |
| Ratios to Average Net AssetsF,G | | |
| Expenses before reductions | .37% | .37%H |
| Expenses net of fee waivers, if any | .37% | .37%H |
| Expenses net of all reductions | .37% | .37%H |
| Net investment income (loss) | 2.12% | 1.91%H |
| Supplemental Data | | |
| Net assets, end of period (000 omitted) | $167,422 | $39,253 |
| Portfolio turnover rateF | 22% | 17%I |
A For the period June 7, 2017 (commencement of sale of shares) to March 31, 2018.
B Calculated based on average shares outstanding during the period.
C Total distributions of $.33 per share is comprised of distributions from net investment income of $.168 and distributions from net realized gain of $.166 per share.
D Total returns for periods of less than one year are not annualized.
E Total returns would have been lower if certain expenses had not been reduced during the applicable periods shown.
F Amounts do not include the activity of the Underlying Funds.
G Expense ratios reflect operating expenses of the class. Expenses before reductions do not reflect amounts reimbursed by the investment adviser or reductions from expense offset arrangements and do not represent the amount paid by the class during periods when reimbursements or reductions occur. Expense ratios before reductions for start-up periods may not be representative of longer-term operating periods. Expenses net of fee waivers reflect expenses after reimbursement by the investment adviser but prior to reductions from expense offset arrangements. Expenses net of all reductions represent the net expenses paid by the class but do not include expenses of the underlying funds in which the Fund invests.
H Annualized
I The portfolio turnover rate does not include the assets acquired in the merger.
See accompanying notes which are an integral part of the financial statements.
Fidelity Freedom® 2005 Fund
Investment Summary (Unaudited)
The information in the following tables is based on the direct investments of the Fund.
Top Holdings as of March 31, 2019
| | % of fund's net assets |
| Fidelity Series Investment Grade Bond Fund | 34.2 |
| Fidelity Series Government Money Market Fund 2.50% | 14.9 |
| Fidelity Series Inflation-Protected Bond Index Fund | 11.3 |
| Fidelity Series Long-Term Treasury Bond Index Fund | 4.7 |
| Fidelity Series Emerging Markets Opportunities Fund | 4.3 |
| Fidelity Series Short-Term Credit Fund | 3.7 |
| Fidelity Series International Value Fund | 3.0 |
| Fidelity Series International Growth Fund | 3.0 |
| Fidelity Series Intrinsic Opportunities Fund | 2.5 |
| Fidelity Series Commodity Strategy Fund | 2.3 |
| | 83.9 |
Asset Allocation (% of fund's net assets)
| Period end |
| | Domestic Equity Funds | 16.6% |
| | International Equity Funds | 11.8% |
| | Bond Funds | 52.5% |
| | Short-Term Funds | 19.0% |
| | Short-Term Investments | 0.1% |

Domestic Equity Funds category includes Fidelity Series Commodity Strategy Fund which invests in commodity-related investments.
Fidelity Freedom® 2005 Fund
Schedule of Investments March 31, 2019
Showing Percentage of Net Assets
| U.S. Treasury Obligations - 0.1% | | | |
| | | Principal Amount | Value |
| U.S. Treasury Bills, yield at date of purchase 2.35% to 2.4% 4/4/19 to 6/27/19 (a) | | | |
| (Cost $667,955) | | 670,000 | 667,980 |
| | | Shares | Value |
|
| Domestic Equity Funds - 16.6% | | | |
| Fidelity Series All-Sector Equity Fund (b) | | 536,555 | $5,167,025 |
| Fidelity Series Blue Chip Growth Fund (b) | | 726,424 | 10,714,747 |
| Fidelity Series Commodity Strategy Fund (b) | | 4,656,311 | 22,210,604 |
| Fidelity Series Growth Company Fund (b) | | 1,174,630 | 19,862,990 |
| Fidelity Series Intrinsic Opportunities Fund (b) | | 1,478,861 | 24,327,265 |
| Fidelity Series Large Cap Stock Fund (b) | | 1,442,567 | 21,133,601 |
| Fidelity Series Large Cap Value Index Fund (b) | | 496,915 | 6,166,714 |
| Fidelity Series Opportunistic Insights Fund (b) | | 621,116 | 10,857,111 |
| Fidelity Series Small Cap Discovery Fund (b) | | 275,511 | 3,063,684 |
| Fidelity Series Small Cap Opportunities Fund (b) | | 663,221 | 8,926,958 |
| Fidelity Series Stock Selector Large Cap Value Fund (b) | | 1,371,888 | 16,188,284 |
| Fidelity Series Value Discovery Fund (b) | | 926,560 | 11,572,732 |
| TOTAL DOMESTIC EQUITY FUNDS | | | |
| (Cost $128,144,088) | | | 160,191,715 |
|
| International Equity Funds - 11.8% | | | |
| Fidelity Series Canada Fund (b) | | 285,371 | 2,942,173 |
| Fidelity Series Emerging Markets Fund (b) | | 446,445 | 4,370,696 |
| Fidelity Series Emerging Markets Opportunities Fund (b) | | 2,203,509 | 40,831,027 |
| Fidelity Series International Growth Fund (b) | | 1,924,964 | 29,240,204 |
| Fidelity Series International Small Cap Fund (b) | | 443,263 | 6,883,875 |
| Fidelity Series International Value Fund (b) | | 3,146,486 | 29,262,318 |
| TOTAL INTERNATIONAL EQUITY FUNDS | | | |
| (Cost $94,831,997) | | | 113,530,293 |
|
| Bond Funds - 52.5% | | | |
| Fidelity Series Emerging Markets Debt Fund (b) | | 737,868 | 7,076,150 |
| Fidelity Series Floating Rate High Income Fund (b) | | 180,971 | 1,677,604 |
| Fidelity Series High Income Fund (b) | | 897,287 | 8,434,501 |
| Fidelity Series Inflation-Protected Bond Index Fund (b) | | 11,102,299 | 108,580,484 |
| Fidelity Series International Credit Fund (b) | | 53,601 | 530,111 |
| Fidelity Series Investment Grade Bond Fund (b) | | 29,427,797 | 329,002,771 |
| Fidelity Series Long-Term Treasury Bond Index Fund (b) | | 5,118,727 | 45,403,111 |
| Fidelity Series Real Estate Income Fund (b) | | 434,920 | 4,744,981 |
| TOTAL BOND FUNDS | | | |
| (Cost $509,808,841) | | | 505,449,713 |
|
| Short-Term Funds - 19.0% | | | |
| Fidelity Cash Central Fund, 2.48% (c) | | 4,205,856 | 4,206,697 |
| Fidelity Series Government Money Market Fund 2.50% (b)(d) | | 142,976,866 | 142,976,866 |
| Fidelity Series Short-Term Credit Fund (b) | | 3,542,133 | 35,315,067 |
| TOTAL SHORT-TERM FUNDS | | | |
| (Cost $182,509,308) | | | 182,498,630 |
| TOTAL INVESTMENT IN SECURITIES - 100.0% | | | |
| (Cost $915,962,189) | | | 962,338,331 |
| NET OTHER ASSETS (LIABILITIES) - 0.0% | | | (457,879) |
| NET ASSETS - 100% | | | $961,880,452 |
| Futures Contracts | | | | | |
| | Number of contracts | Expiration Date | Notional Amount | Value | Unrealized Appreciation/(Depreciation) |
| Purchased | | | | | |
| Treasury Contracts | | | | | |
| CBOT 2-Year U.S. Treasury Note Contracts (United States) | 6 | June 2019 | $1,278,563 | $5,437 | $5,437 |
| CBOT 5-Year U.S. Treasury Note Contracts (United States) | 12 | June 2019 | 1,389,938 | 15,820 | 15,820 |
| CBOT Long Term U.S. Treasury Bond Contracts (United States) | 2 | June 2019 | 299,313 | 10,496 | 10,496 |
| CBOT Long Term U.S. Treasury Bond Contracts (United States) | 9 | June 2019 | 1,117,969 | 20,238 | 20,238 |
| CBOT Ultra Long Term U.S. Treasury Bond Contracts (United States) | 2 | June 2019 | 336,000 | 16,722 | 16,722 |
|
| TOTAL PURCHASED | | | | | 68,713 |
|
| Sold | | | | | |
| Equity Index Contracts | | | | | |
| CME E-mini S&P 500 Index Contracts (United States) | 24 | June 2019 | 3,405,360 | (103,073) | (103,073) |
| ICE E-mini MSCI Emerging Markets Index Contracts (United States) | 51 | June 2019 | 2,696,370 | (50,279) | (50,279) |
|
| TOTAL SOLD | | | | | (153,352) |
|
| TOTAL FUTURES CONTRACTS | | | | | $(84,639) |
The notional amount of futures purchased as a percentage of Net Assets is 0.5%
The notional amount of futures sold as a percentage of Net Assets is 0.6%
Legend
(a) Security or a portion of the security was pledged to cover margin requirements for futures contracts. At period end, the value of securities pledged amounted to $667,980.
(b) Affiliated Fund
(c) Affiliated fund that is generally available only to investment companies and other accounts managed by Fidelity Investments. The rate quoted is the annualized seven-day yield of the fund at period end. A complete unaudited listing of the fund's holdings as of its most recent quarter end is available upon request. In addition, each Fidelity Central Fund's financial statements, which are not covered by the Fund's Report of Independent Registered Public Accounting Firm, are available on the SEC's website or upon request.
(d) The rate quoted is the annualized seven-day yield of the fund at period end.
Affiliated Central Funds
Information regarding fiscal year to date income earned by the Fund from investments in Fidelity Central Funds is as follows:
| Fund | Income earned |
| Fidelity Cash Central Fund | $25,790 |
| Total | $25,790 |
Amounts in the income column in the above table include any capital gain distributions from underlying funds, which are presented in the corresponding line-item in the Statement of Operations, if applicable.
Affiliated Underlying Funds
Fiscal year to date information regarding the Fund's investments in affiliated Underlying Funds, excluding any Money Market Central Funds, is presented below. Exchanges between classes of the same affiliated Underlying Funds may occur.
| Affiliate | Value, beginning of period | Purchases | Sales Proceeds | Dividend Income | Realized Gain (loss) | Change in Unrealized appreciation (depreciation) | Value, end of period |
| Fidelity Series 100 Index Fund | $6,515,325 | $-- | $6,766,231 | $-- | $3,060,458 | $(2,809,552) | $-- |
| Fidelity Series All-Sector Equity Fund | 12,530,153 | 1,754,728 | 8,858,577 | 1,272,784 | 645,659 | (904,938) | 5,167,025 |
| Fidelity Series Blue Chip Growth Fund | 12,953,358 | 2,006,105 | 5,004,846 | 1,366,857 | 1,412,512 | (652,382) | 10,714,747 |
| Fidelity Series Canada Fund | 3,443,587 | 410,276 | 990,253 | 64,679 | 6,805 | 71,758 | 2,942,173 |
| Fidelity Series Commodity Strategy Fund | 21,665,200 | 8,431,878 | 5,376,189 | 1,306,153 | (3,398,830) | 888,545 | 22,210,604 |
| Fidelity Series Emerging Markets Debt Fund | 7,599,846 | 763,032 | 916,984 | 435,097 | (22,637) | (347,107) | 7,076,150 |
| Fidelity Series Emerging Markets Fund | -- | 4,629,704 | 299,476 | 17,187 | (6,771) | 47,239 | 4,370,696 |
| Fidelity Series Emerging Markets Opportunities Fund | 40,950,004 | 11,111,667 | 5,703,911 | 3,168,179 | 352,958 | (5,879,691) | 40,831,027 |
| Fidelity Series Floating Rate High Income Fund | 2,476,054 | 251,876 | 997,004 | 137,982 | (53,120) | (202) | 1,677,604 |
| Fidelity Series Government Money Market Fund 2.50% | 188,891,827 | 35,928,967 | 81,843,928 | 3,348,065 | -- | -- | 142,976,866 |
| Fidelity Series Growth Company Fund | 27,067,672 | 3,327,727 | 10,997,761 | 2,045,391 | 4,057,727 | (3,592,375) | 19,862,990 |
| Fidelity Series High Income Fund | 15,273,504 | 1,533,309 | 8,209,962 | 839,623 | (420,728) | 258,378 | 8,434,501 |
| Fidelity Series Inflation-Protected Bond Index Fund | 34,330,025 | 85,228,930 | 11,399,292 | 1,948,741 | (292,062) | 712,883 | 108,580,484 |
| Fidelity Series International Credit Fund | 511,877 | 25,711 | 6,093 | 25,712 | (80) | (1,304) | 530,111 |
| Fidelity Series International Growth Fund | 35,653,275 | 7,176,442 | 12,046,172 | 1,964,426 | 1,824,750 | (3,368,091) | 29,240,204 |
| Fidelity Series International Small Cap Fund | 8,838,106 | 1,996,733 | 2,779,587 | 623,273 | 399,174 | (1,570,551) | 6,883,875 |
| Fidelity Series International Value Fund | 35,085,401 | 5,698,507 | 7,806,375 | 1,071,940 | (37,797) | (3,677,418) | 29,262,318 |
| Fidelity Series Intrinsic Opportunities Fund | 32,312,650 | 3,659,909 | 9,490,498 | 2,105,560 | 617,322 | (2,772,118) | 24,327,265 |
| Fidelity Series Investment Grade Bond Fund | 357,195,577 | 32,801,056 | 65,344,858 | 10,964,784 | (2,292,650) | 6,643,646 | 329,002,771 |
| Fidelity Series Large Cap Stock Fund | 28,318,570 | 3,943,691 | 10,575,980 | 2,545,146 | 1,163,919 | (1,716,599) | 21,133,601 |
| Fidelity Series Large Cap Value Index Fund | 8,118,267 | 690,971 | 2,782,216 | 299,129 | 210,493 | (70,801) | 6,166,714 |
| Fidelity Series Long-Term Treasury Bond Index Fund | 21,896,394 | 32,642,883 | 10,907,672 | 1,069,176 | (277,157) | 2,048,663 | 45,403,111 |
| Fidelity Series Opportunistic Insights Fund | 14,197,365 | 1,617,123 | 5,350,976 | 921,203 | 1,751,714 | (1,358,115) | 10,857,111 |
| Fidelity Series Real Estate Equity Fund | 2,522,653 | 22,552 | 2,634,464 | 19,427 | 352,087 | (262,828) | -- |
| Fidelity Series Real Estate Income Fund | 4,756,952 | 601,948 | 703,138 | 344,918 | (5,314) | 94,533 | 4,744,981 |
| Fidelity Series Short-Term Credit Fund | 46,349,875 | 3,306,778 | 14,728,581 | 1,033,498 | (173,378) | 560,373 | 35,315,067 |
| Fidelity Series Small Cap Discovery Fund | 3,862,917 | 610,273 | 1,110,363 | 423,670 | 112,285 | (411,428) | 3,063,684 |
| Fidelity Series Small Cap Opportunities Fund | 11,795,128 | 1,635,528 | 4,220,481 | 1,064,395 | 644,721 | (927,938) | 8,926,958 |
| Fidelity Series Stock Selector Large Cap Value Fund | 22,112,603 | 2,528,771 | 8,038,158 | 1,457,171 | 971,005 | (1,385,937) | 16,188,284 |
| Fidelity Series Value Discovery Fund | 15,714,129 | 1,497,258 | 5,421,599 | 737,132 | 539,834 | (756,890) | 11,572,732 |
| | $1,022,938,294 | $255,834,333 | $311,311,625 | $42,621,298 | $11,142,899 | $(21,140,247) | $957,463,654 |
Amounts in the income column in the above table include any capital gain distributions from underlying funds, which are presented in the corresponding line-item in the Statement of Operations, if applicable.
Investment Valuation
The following is a summary of the inputs used, as of March 31, 2019, involving the Fund's assets and liabilities carried at fair value. The inputs or methodology used for valuing securities may not be an indication of the risk associated with investing in those securities. For more information on valuation inputs, and their aggregation into the levels used below, please refer to the Investment Valuation section in the accompanying Notes to Financial Statements.
| | Valuation Inputs at Reporting Date: |
| Description | Total | Level 1 | Level 2 | Level 3 |
| Investments in Securities: | | | | |
| Other Short-Term Investments | $667,980 | $-- | $667,980 | $-- |
| Domestic Equity Funds | 160,191,715 | 160,191,715 | -- | -- |
| International Equity Funds | 113,530,293 | 113,530,293 | -- | -- |
| Bond Funds | 505,449,713 | 505,449,713 | -- | -- |
| Short-Term Funds | 182,498,630 | 182,498,630 | -- | -- |
| Total Investments in Securities: | $962,338,331 | $961,670,351 | $667,980 | $-- |
| Derivative Instruments: | | | | |
| Assets | | | | |
| Futures Contracts | $68,713 | $68,713 | $-- | $-- |
| Total Assets | $68,713 | $68,713 | $-- | $-- |
| Liabilities | | | | |
| Futures Contracts | $(153,352) | $(153,352) | $-- | $-- |
| Total Liabilities | $(153,352) | $(153,352) | $-- | $-- |
| Total Derivative Instruments: | $(84,639) | $(84,639) | $-- | $-- |
Value of Derivative Instruments
The following table is a summary of the Fund's value of derivative instruments by primary risk exposure as of March 31, 2019. For additional information on derivative instruments, please refer to the Derivative Instruments section in the accompanying Notes to Financial Statements.
| Primary Risk Exposure / Derivative Type | Value |
| | Asset | Liability |
| Equity Risk | | |
| Futures Contracts(a) | $0 | $(153,352) |
| Total Equity Risk | 0 | (153,352) |
| Interest Rate Risk | | |
| Futures Contracts | 68,713 | 0 |
| Total Interest Rate Risk | 68,713 | 0 |
| Total Value of Derivatives | $68,713 | $(153,352) |
(a) Reflects gross cumulative appreciation (depreciation) on futures contracts as presented in the Schedule of Investments. In the Statement of Assets and Liabilities, the period end daily variation margin is included in receivable or payable for daily variation margin on futures contracts, and the net cumulative appreciation (depreciation) is included in distributable earnings.
See accompanying notes which are an integral part of the financial statements.
Fidelity Freedom® 2005 Fund
Financial Statements
Statement of Assets and Liabilities
| | | March 31, 2019 |
| Assets | | |
Investment in securities, at value — See accompanying schedule:
Unaffiliated issuers (cost $667,955) | $667,980 | |
| Fidelity Central Funds (cost $4,206,697) | 4,206,697 | |
| Other affiliated issuers (cost $911,087,537) | 957,463,654 | |
| Total Investment in Securities (cost $915,962,189) | | $962,338,331 |
| Receivable for investments sold | | 7,086,994 |
| Receivable for fund shares sold | | 1,838,995 |
| Distributions receivable from Fidelity Central Funds | | 8,316 |
| Total assets | | 971,272,636 |
| Liabilities | | |
| Payable for investments purchased | $7,111,218 | |
| Payable for fund shares redeemed | 1,813,355 | |
| Accrued management fee | 364,768 | |
| Payable for daily variation margin on futures contracts | 102,843 | |
| Total liabilities | | 9,392,184 |
| Net Assets | | $961,880,452 |
| Net Assets consist of: | | |
| Paid in capital | | $903,072,554 |
| Total distributable earnings (loss) | | 58,807,898 |
| Net Assets | | $961,880,452 |
| Net Asset Value and Maximum Offering Price | | |
| Fidelity Freedom 2005 Fund: | | |
| Net Asset Value, offering price and redemption price per share ($563,036,295 ÷ 46,160,440 shares) | | $12.20 |
| Class K: | | |
| Net Asset Value, offering price and redemption price per share ($357,174,023 ÷ 29,324,699 shares) | | $12.18 |
| Class K6: | | |
| Net Asset Value, offering price and redemption price per share ($41,670,134 ÷ 3,425,343 shares) | | $12.17 |
See accompanying notes which are an integral part of the financial statements.
Statement of Operations
| | | Year ended March 31, 2019 |
| Investment Income | | |
| Dividends: | | |
| Affiliated issuers | | $24,059,333 |
| Interest | | 7,573 |
| Income from Fidelity Central Funds | | 25,790 |
| Total income | | 24,092,696 |
| Expenses | | |
| Management fee | $4,477,992 | |
| Independent trustees' fees and expenses | 4,657 | |
| Total expenses before reductions | 4,482,649 | |
| Expense reductions | (206) | |
| Total expenses after reductions | | 4,482,443 |
| Net investment income (loss) | | 19,610,253 |
| Realized and Unrealized Gain (Loss) | | |
| Net realized gain (loss) on: | | |
| Investment securities: | | |
| Unaffiliated issuers | 138 | |
| Fidelity Central Funds | (32) | |
| Other affiliated issuers | 11,142,899 | |
| Futures contracts | 320,290 | |
| Capital gain distributions from underlying funds: | | |
| Affiliated issuers | 18,561,965 | |
| Total net realized gain (loss) | | 30,025,260 |
| Change in net unrealized appreciation (depreciation) on: | | |
| Investment securities: | | |
| Unaffiliated issuers | 30 | |
| Affiliated issuers | (21,140,247) | |
| Futures contracts | (84,639) | |
| Total change in net unrealized appreciation (depreciation) | | (21,224,856) |
| Net gain (loss) | | 8,800,404 |
| Net increase (decrease) in net assets resulting from operations | | $28,410,657 |
See accompanying notes which are an integral part of the financial statements.
Statement of Changes in Net Assets
| | Year ended March 31, 2019 | Year ended March 31, 2018 |
| Increase (Decrease) in Net Assets | | |
| Operations | | |
| Net investment income (loss) | $19,610,253 | $14,738,670 |
| Net realized gain (loss) | 30,025,260 | 30,625,628 |
| Change in net unrealized appreciation (depreciation) | (21,224,856) | 1,018,991 |
| Net increase (decrease) in net assets resulting from operations | 28,410,657 | 46,383,289 |
| Distributions to shareholders | (51,673,028) | – |
| Distributions to shareholders from net investment income | – | (13,671,334) |
| Distributions to shareholders from net realized gain | – | (20,759,680) |
| Total distributions | (51,673,028) | (34,431,014) |
| Share transactions - net increase (decrease) | (37,517,008) | 426,953,870 |
| Total increase (decrease) in net assets | (60,779,379) | 438,906,145 |
| Net Assets | | |
| Beginning of period | 1,022,659,831 | 583,753,686 |
| End of period | $961,880,452 | $1,022,659,831 |
| Other Information | | |
| Undistributed net investment income end of period | | $2,657,371 |
See accompanying notes which are an integral part of the financial statements.
Financial Highlights
Fidelity Freedom 2005 Fund
| Years ended March 31, | 2019 | 2018 | 2017 | 2016 | 2015 |
| Selected Per–Share Data | | | | | |
| Net asset value, beginning of period | $12.50 | $12.20 | $11.66 | $12.24 | $12.01 |
| Income from Investment Operations | | | | | |
| Net investment income (loss)A | .24 | .19 | .20 | .22 | .22 |
| Net realized and unrealized gain (loss) | .11 | .59 | .71 | (.34) | .40 |
| Total from investment operations | .35 | .78 | .91 | (.12) | .62 |
| Distributions from net investment income | (.24) | (.18) | (.22)B | (.22) | (.23) |
| Distributions from net realized gain | (.41) | (.30) | (.15)B | (.23) | (.17) |
| Total distributions | (.65) | (.48) | (.37) | (.46)C | (.39)D |
| Net asset value, end of period | $12.20 | $12.50 | $12.20 | $11.66 | $12.24 |
| Total ReturnE | 3.03% | 6.43% | 7.91% | (1.01)% | 5.26% |
| Ratios to Average Net AssetsF,G | | | | | |
| Expenses before reductions | .48% | .41% | - %H | - %H | - %H |
| Expenses net of fee waivers, if any | .48% | .41% | -% | -% | -% |
| Expenses net of all reductions | .48% | .41% | -% | -% | -% |
| Net investment income (loss) | 1.98% | 1.52% | 1.70% | 1.87% | 1.79% |
| Supplemental Data | | | | | |
| Net assets, end of period (000 omitted) | $563,036 | $590,056 | $583,754 | $580,726 | $639,723 |
| Portfolio turnover rateF | 26% | 23%I | 31% | 22% | 23% |
A Calculated based on average shares outstanding during the period.
B The amounts shown reflect certain reclassifications related to book to tax differences that were made in the year shown.
C Total distributions of $.46 per share is comprised of distributions from net investment income of $.223 and distributions from net realized gain of $.234 per share.
D Total distributions of $.39 per share is comprised of distributions from net investment income of $.225 and distributions from net realized gain of $.168 per share.
E Total returns would have been lower if certain expenses had not been reduced during the applicable periods shown.
F Amounts do not include the activity of the Underlying Funds.
G Expense ratios reflect operating expenses of the class. Expenses before reductions do not reflect amounts reimbursed by the investment adviser or reductions from expense offset arrangements and do not represent the amount paid by the class during periods when reimbursements or reductions occur. Expenses net of fee waivers reflect expenses after reimbursement by the investment adviser but prior to reductions from expense offset arrangements. Expenses net of all reductions represent the net expenses paid by the class but do not include expenses of the underlying funds in which the Fund invests.
H Amount represents less than .005%.
I The portfolio turnover rate does not include the assets acquired in the merger.
See accompanying notes which are an integral part of the financial statements.
Fidelity Freedom 2005 Fund Class K
| Years ended March 31, | 2019 | 2018 A |
| Selected Per–Share Data | | |
| Net asset value, beginning of period | $12.49 | $12.48 |
| Income from Investment Operations | | |
| Net investment income (loss)B | .25 | .21 |
| Net realized and unrealized gain (loss) | .10 | .15 |
| Total from investment operations | .35 | .36 |
| Distributions from net investment income | (.24) | (.16) |
| Distributions from net realized gain | (.41) | (.19) |
| Total distributions | (.66)C | (.35) |
| Net asset value, end of period | $12.18 | $12.49 |
| Total ReturnD,E | 3.00% | 2.89% |
| Ratios to Average Net AssetsF,G | | |
| Expenses before reductions | .43% | .44%H |
| Expenses net of fee waivers, if any | .43% | .44%H |
| Expenses net of all reductions | .43% | .44%H |
| Net investment income (loss) | 2.03% | 2.37%H |
| Supplemental Data | | |
| Net assets, end of period (000 omitted) | $357,174 | $422,622 |
| Portfolio turnover rateF | 26% | 23%I |
A For the period July 20, 2017 (commencement of sale of shares) to March 31, 2018.
B Calculated based on average shares outstanding during the period.
C Total distributions of $.66 per share is comprised of distributions from net investment income of $.243 and distributions from net realized gain of $.413 per share.
D Total returns for periods of less than one year are not annualized.
E Total returns would have been lower if certain expenses had not been reduced during the applicable periods shown.
F Amounts do not include the activity of the Underlying Funds.
G Expense ratios reflect operating expenses of the class. Expenses before reductions do not reflect amounts reimbursed by the investment adviser or reductions from expense offset arrangements and do not represent the amount paid by the class during periods when reimbursements or reductions occur. Expense ratios before reductions for start-up periods may not be representative of longer-term operating periods. Expenses net of fee waivers reflect expenses after reimbursement by the investment adviser but prior to reductions from expense offset arrangements. Expenses net of all reductions represent the net expenses paid by the class but do not include expenses of the underlying funds in which the Fund invests.
H Annualized
I The portfolio turnover rate does not include the assets acquired in the merger.
See accompanying notes which are an integral part of the financial statements.
Fidelity Freedom 2005 Fund Class K6
| Years ended March 31, | 2019 | 2018 A |
| Selected Per–Share Data | | |
| Net asset value, beginning of period | $12.49 | $12.36 |
| Income from Investment Operations | | |
| Net investment income (loss)B | .25 | .20 |
| Net realized and unrealized gain (loss) | .11 | .29 |
| Total from investment operations | .36 | .49 |
| Distributions from net investment income | (.27) | (.16) |
| Distributions from net realized gain | (.41) | (.19) |
| Total distributions | (.68) | (.36)C |
| Net asset value, end of period | $12.17 | $12.49 |
| Total ReturnD,E | 3.15% | 3.92% |
| Ratios to Average Net AssetsF,G | | |
| Expenses before reductions | .38%H | .38%I |
| Expenses net of fee waivers, if any | .38%H | .38%I |
| Expenses net of all reductions | .38%H | .38%I |
| Net investment income (loss) | 2.08% | 1.93%I |
| Supplemental Data | | |
| Net assets, end of period (000 omitted) | $41,670 | $9,983 |
| Portfolio turnover rateF | 26% | 23%J |
A For the period June 7, 2017 (commencement of sale of shares) to March 31, 2018.
B Calculated based on average shares outstanding during the period.
C Total distributions of $.36 per share is comprised of distributions from net investment income of $.164 and distributions from net realized gain of $.192 per share.
D Total returns for periods of less than one year are not annualized.
E Total returns would have been lower if certain expenses had not been reduced during the applicable periods shown.
F Amounts do not include the activity of the Underlying Funds.
G Expense ratios reflect operating expenses of the class. Expenses before reductions do not reflect amounts reimbursed by the investment adviser or reductions from expense offset arrangements and do not represent the amount paid by the class during periods when reimbursements or reductions occur. Expense ratios before reductions for start-up periods may not be representative of longer-term operating periods. Expenses net of fee waivers reflect expenses after reimbursement by the investment adviser but prior to reductions from expense offset arrangements. Expenses net of all reductions represent the net expenses paid by the class but do not include expenses of the underlying funds in which the Fund invests.
H On certain classes, the size and fluctuation of net assets and expense amounts may cause ratios to differ from contractual rates.
I Annualized
J The portfolio turnover rate does not include the assets acquired in the merger.
See accompanying notes which are an integral part of the financial statements.
Fidelity Freedom® 2010 Fund
Investment Summary (Unaudited)
The information in the following tables is based on the direct investments of the Fund.
Top Holdings as of March 31, 2019
| | % of fund's net assets |
| Fidelity Series Investment Grade Bond Fund | 30.5 |
| Fidelity Series Government Money Market Fund 2.50% | 11.7 |
| Fidelity Series Inflation-Protected Bond Index Fund | 9.2 |
| Fidelity Series Emerging Markets Opportunities Fund | 5.1 |
| Fidelity Series Long-Term Treasury Bond Index Fund | 4.9 |
| Fidelity Series International Growth Fund | 4.0 |
| Fidelity Series International Value Fund | 3.9 |
| Fidelity Series Intrinsic Opportunities Fund | 3.7 |
| Fidelity Series Large Cap Stock Fund | 3.2 |
| Fidelity Series Growth Company Fund | 3.0 |
| | 79.2 |
Asset Allocation (% of fund's net assets)
| Period end |
| | Domestic Equity Funds | 23.1% |
| | International Equity Funds | 14.9% |
| | Bond Funds | 47.0% |
| | Short-Term Funds | 15.0% |
| | Short-Term Investments | 0.1% |
| | Net Other Assets (Liabilities)* | (0.1)% |

* Net Other Assets (Liabilities) are not included in the pie chart
Domestic Equity Funds category includes Fidelity Series Commodity Strategy Fund which invests in commodity-related investments.
Fidelity Freedom® 2010 Fund
Schedule of Investments March 31, 2019
Showing Percentage of Net Assets
| U.S. Treasury Obligations - 0.1% | | | |
| | | Principal Amount | Value |
| U.S. Treasury Bills, yield at date of purchase 2.37% to 2.43% 4/4/19 to 6/27/19 (a) | | | |
| (Cost $4,090,553) | | 4,100,000 | 4,090,676 |
| | | Shares | Value |
|
| Domestic Equity Funds - 23.1% | | | |
| Fidelity Series All-Sector Equity Fund (b) | | 4,736,928 | $45,616,618 |
| Fidelity Series Blue Chip Growth Fund (b) | | 6,282,159 | 92,661,846 |
| Fidelity Series Commodity Strategy Fund (b) | | 28,453,680 | 135,724,053 |
| Fidelity Series Growth Company Fund (b) | | 10,398,845 | 175,844,462 |
| Fidelity Series Intrinsic Opportunities Fund (b) | | 13,104,338 | 215,566,356 |
| Fidelity Series Large Cap Stock Fund (b) | | 12,774,900 | 187,152,281 |
| Fidelity Series Large Cap Value Index Fund (b) | | 4,358,193 | 54,085,176 |
| Fidelity Series Opportunistic Insights Fund (b) | | 5,479,715 | 95,785,417 |
| Fidelity Series Small Cap Discovery Fund (b) | | 2,410,666 | 26,806,607 |
| Fidelity Series Small Cap Opportunities Fund (b) | | 5,734,762 | 77,189,894 |
| Fidelity Series Stock Selector Large Cap Value Fund (b) | | 12,134,605 | 143,188,341 |
| Fidelity Series Value Discovery Fund (b) | | 8,178,844 | 102,153,762 |
| TOTAL DOMESTIC EQUITY FUNDS | | | |
| (Cost $1,028,819,044) | | | 1,351,774,813 |
|
| International Equity Funds - 14.9% | | | |
| Fidelity Series Canada Fund (b) | | 2,301,466 | 23,728,118 |
| Fidelity Series Emerging Markets Fund (b) | | 3,289,232 | 32,201,584 |
| Fidelity Series Emerging Markets Opportunities Fund (b) | | 16,245,259 | 301,024,642 |
| Fidelity Series International Growth Fund (b) | | 15,339,910 | 233,013,226 |
| Fidelity Series International Small Cap Fund (b) | | 3,522,902 | 54,710,672 |
| Fidelity Series International Value Fund (b) | | 24,347,686 | 226,433,481 |
| TOTAL INTERNATIONAL EQUITY FUNDS | | | |
| (Cost $714,702,340) | | | 871,111,723 |
|
| Bond Funds - 47.0% | | | |
| Fidelity Series Emerging Markets Debt Fund (b) | | 4,529,786 | 43,440,644 |
| Fidelity Series Floating Rate High Income Fund (b) | | 934,712 | 8,664,785 |
| Fidelity Series High Income Fund (b) | | 5,540,454 | 52,080,265 |
| Fidelity Series Inflation-Protected Bond Index Fund (b) | | 55,063,045 | 538,516,576 |
| Fidelity Series International Credit Fund (b) | | 360,695 | 3,567,269 |
| Fidelity Series Investment Grade Bond Fund (b) | | 159,662,920 | 1,785,031,439 |
| Fidelity Series Long-Term Treasury Bond Index Fund (b) | | 32,419,880 | 287,564,333 |
| Fidelity Series Real Estate Income Fund (b) | | 2,607,592 | 28,448,829 |
| TOTAL BOND FUNDS | | | |
| (Cost $2,762,459,926) | | | 2,747,314,140 |
|
| Short-Term Funds - 15.0% | | | |
| Fidelity Cash Central Fund, 2.48% (c) | | 22,517,627 | 22,522,131 |
| Fidelity Series Government Money Market Fund 2.50% (b)(d) | | 684,837,287 | 684,837,287 |
| Fidelity Series Short-Term Credit Fund (b) | | 16,934,996 | 168,841,907 |
| TOTAL SHORT-TERM FUNDS | | | |
| (Cost $876,295,961) | | | 876,201,325 |
| TOTAL INVESTMENT IN SECURITIES - 100.1% | | | |
| (Cost $5,386,367,824) | | | 5,850,492,677 |
| NET OTHER ASSETS (LIABILITIES) - (0.1)% | | | (3,015,999) |
| NET ASSETS - 100% | | | $5,847,476,678 |
| Futures Contracts | | | | | |
| | Number of contracts | Expiration Date | Notional Amount | Value | Unrealized Appreciation/(Depreciation) |
| Purchased | | | | | |
| Treasury Contracts | | | | | |
| CBOT 2-Year U.S. Treasury Note Contracts (United States) | 35 | June 2019 | $7,458,281 | $32,493 | $32,493 |
| CBOT 5-Year U.S. Treasury Note Contracts (United States) | 75 | June 2019 | 8,687,109 | 98,873 | 98,873 |
| CBOT Long Term U.S. Treasury Bond Contracts (United States) | 17 | June 2019 | 2,544,156 | 89,213 | 89,213 |
| CBOT Long Term U.S. Treasury Bond Contracts (United States) | 53 | June 2019 | 6,583,594 | 122,451 | 122,451 |
| CBOT Ultra Long Term U.S. Treasury Bond Contracts (United States) | 17 | June 2019 | 2,856,000 | 142,138 | 142,138 |
|
| TOTAL PURCHASED | | | | | 485,168 |
|
| Sold | | | | | |
| Equity Index Contracts | | | | | |
| CME E-mini S&P 500 Index Contracts (United States) | 150 | June 2019 | 21,283,500 | (644,208) | (644,208) |
| ICE E-mini MSCI Emerging Markets Index Contracts (United States) | 340 | June 2019 | 17,975,800 | (335,182) | (335,182) |
|
| TOTAL SOLD | | | | | (979,390) |
|
| TOTAL FUTURES CONTRACTS | | | | | $(494,222) |
The notional amount of futures purchased as a percentage of Net Assets is 0.5%
The notional amount of futures sold as a percentage of Net Assets is 0.7%
Legend
(a) Security or a portion of the security was pledged to cover margin requirements for futures contracts. At period end, the value of securities pledged amounted to $4,090,676.
(b) Affiliated Fund
(c) Affiliated fund that is generally available only to investment companies and other accounts managed by Fidelity Investments. The rate quoted is the annualized seven-day yield of the fund at period end. A complete unaudited listing of the fund's holdings as of its most recent quarter end is available upon request. In addition, each Fidelity Central Fund's financial statements, which are not covered by the Fund's Report of Independent Registered Public Accounting Firm, are available on the SEC's website or upon request.
(d) The rate quoted is the annualized seven-day yield of the fund at period end.
Affiliated Central Funds
Information regarding fiscal year to date income earned by the Fund from investments in Fidelity Central Funds is as follows:
| Fund | Income earned |
| Fidelity Cash Central Fund | $164,406 |
| Total | $164,406 |
Amounts in the income column in the above table include any capital gain distributions from underlying funds, which are presented in the corresponding line-item in the Statement of Operations, if applicable.
Affiliated Underlying Funds
Fiscal year to date information regarding the Fund's investments in affiliated Underlying Funds, excluding any Money Market Central Funds, is presented below. Exchanges between classes of the same affiliated Underlying Funds may occur.
| Affiliate | Value, beginning of period | Purchases | Sales Proceeds | Dividend Income | Realized Gain (loss) | Change in Unrealized appreciation (depreciation) | Value, end of period |
| Fidelity Series 100 Index Fund | $54,376,498 | $2 | $56,567,080 | $-- | $23,146,601 | $(20,956,021) | $-- |
| Fidelity Series All-Sector Equity Fund | 104,338,689 | 11,734,680 | 67,272,732 | 11,473,079 | 6,650,450 | (9,834,469) | 45,616,618 |
| Fidelity Series Blue Chip Growth Fund | 107,885,174 | 12,532,064 | 32,943,462 | 12,241,663 | 8,651,326 | (3,463,256) | 92,661,846 |
| Fidelity Series Canada Fund | 27,093,349 | 2,360,054 | 6,281,084 | 532,452 | 24,113 | 531,686 | 23,728,118 |
| Fidelity Series Commodity Strategy Fund | 137,197,589 | 44,711,702 | 30,230,894 | 8,348,290 | (17,202,569) | 1,248,225 | 135,724,053 |
| Fidelity Series Emerging Markets Debt Fund | 48,296,926 | 2,829,494 | 5,306,300 | 2,724,704 | (263,115) | (2,116,361) | 43,440,644 |
| Fidelity Series Emerging Markets Fund | -- | 33,760,574 | 2,251,603 | 129,113 | (49,962) | 742,575 | 32,201,584 |
| Fidelity Series Emerging Markets Opportunities Fund | 317,936,755 | 68,175,294 | 40,960,334 | 23,807,740 | 2,964,315 | (47,091,388) | 301,024,642 |
| Fidelity Series Floating Rate High Income Fund | 15,446,698 | 839,595 | 7,322,258 | 800,496 | (443,385) | 144,135 | 8,664,785 |
| Fidelity Series Government Money Market Fund 2.50% | 939,655,611 | 144,809,551 | 399,627,875 | 16,436,178 | -- | -- | 684,837,287 |
| Fidelity Series Growth Company Fund | 223,906,115 | 18,426,708 | 68,415,605 | 17,855,183 | 29,742,210 | (27,814,966) | 175,844,462 |
| Fidelity Series High Income Fund | 96,454,868 | 5,466,182 | 48,773,694 | 5,258,101 | (2,728,323) | 1,661,232 | 52,080,265 |
| Fidelity Series Inflation-Protected Bond Index Fund | 178,194,874 | 415,609,200 | 57,085,722 | 9,802,629 | (6,410,824) | 8,209,048 | 538,516,576 |
| Fidelity Series International Credit Fund | 3,431,541 | 172,863 | 27,952 | 172,861 | (375) | (8,808) | 3,567,269 |
| Fidelity Series International Growth Fund | 280,934,996 | 39,540,033 | 74,768,435 | 15,499,178 | 15,150,044 | (27,843,412) | 233,013,226 |
| Fidelity Series International Small Cap Fund | 69,606,079 | 11,915,157 | 17,243,476 | 4,976,676 | 3,596,110 | (13,163,198) | 54,710,672 |
| Fidelity Series International Value Fund | 276,230,918 | 27,299,333 | 47,193,118 | 8,466,281 | 858,433 | (30,762,085) | 226,433,481 |
| Fidelity Series Intrinsic Opportunities Fund | 270,386,197 | 19,486,019 | 54,208,452 | 18,798,640 | 2,790,276 | (22,887,684) | 215,566,356 |
| Fidelity Series Investment Grade Bond Fund | 2,054,586,502 | 82,471,728 | 374,226,456 | 61,114,494 | (15,786,256) | 37,985,921 | 1,785,031,439 |
| Fidelity Series Large Cap Stock Fund | 237,596,786 | 22,636,753 | 67,193,708 | 22,016,221 | 7,694,264 | (13,581,814) | 187,152,281 |
| Fidelity Series Large Cap Value Index Fund | 67,588,086 | 2,821,246 | 17,252,774 | 2,648,915 | 1,365,796 | (437,178) | 54,085,176 |
| Fidelity Series Long-Term Treasury Bond Index Fund | 140,751,002 | 193,316,803 | 57,224,584 | 7,021,719 | (2,022,156) | 12,743,268 | 287,564,333 |
| Fidelity Series Opportunistic Insights Fund | 118,254,820 | 8,434,748 | 33,332,125 | 8,125,634 | 12,585,973 | (10,157,999) | 95,785,417 |
| Fidelity Series Real Estate Equity Fund | 20,792,626 | 142,266 | 21,515,609 | 117,176 | 3,933,001 | (3,352,284) | -- |
| Fidelity Series Real Estate Income Fund | 29,805,115 | 2,211,486 | 4,089,214 | 2,128,617 | 142,738 | 378,704 | 28,448,829 |
| Fidelity Series Short-Term Credit Fund | 230,191,316 | 5,641,491 | 68,837,570 | 5,059,945 | (947,101) | 2,793,771 | 168,841,907 |
| Fidelity Series Small Cap Discovery Fund | 32,169,764 | 3,724,682 | 6,359,349 | 3,640,489 | 581,020 | (3,309,510) | 26,806,607 |
| Fidelity Series Small Cap Opportunities Fund | 98,250,232 | 9,791,337 | 27,336,232 | 9,532,238 | 4,183,491 | (7,698,934) | 77,189,894 |
| Fidelity Series Stock Selector Large Cap Value Fund | 184,075,787 | 13,306,782 | 49,778,775 | 12,834,544 | 9,012,568 | (13,428,021) | 143,188,341 |
| Fidelity Series Value Discovery Fund | 130,831,369 | 6,845,647 | 33,105,181 | 6,511,226 | 6,949,044 | (9,367,117) | 102,153,762 |
| | $6,496,266,282 | $1,211,013,474 | $1,776,731,653 | $298,074,482 | $94,167,707 | $(200,835,940) | $5,823,879,870 |
Amounts in the income column in the above table include any capital gain distributions from underlying funds, which are presented in the corresponding line-item in the Statement of Operations, if applicable.
Investment Valuation
The following is a summary of the inputs used, as of March 31, 2019, involving the Fund's assets and liabilities carried at fair value. The inputs or methodology used for valuing securities may not be an indication of the risk associated with investing in those securities. For more information on valuation inputs, and their aggregation into the levels used below, please refer to the Investment Valuation section in the accompanying Notes to Financial Statements.
| | Valuation Inputs at Reporting Date: |
| Description | Total | Level 1 | Level 2 | Level 3 |
| Investments in Securities: | | | | |
| Other Short-Term Investments | $4,090,676 | $-- | $4,090,676 | $-- |
| Domestic Equity Funds | 1,351,774,813 | 1,351,774,813 | -- | -- |
| International Equity Funds | 871,111,723 | 871,111,723 | -- | -- |
| Bond Funds | 2,747,314,140 | 2,747,314,140 | -- | -- |
| Short-Term Funds | 876,201,325 | 876,201,325 | -- | -- |
| Total Investments in Securities: | $5,850,492,677 | $5,846,402,001 | $4,090,676 | $-- |
| Derivative Instruments: | | | | |
| Assets | | | | |
| Futures Contracts | $485,168 | $485,168 | $-- | $-- |
| Total Assets | $485,168 | $485,168 | $-- | $-- |
| Liabilities | | | | |
| Futures Contracts | $(979,390) | $(979,390) | $-- | $-- |
| Total Liabilities | $(979,390) | $(979,390) | $-- | $-- |
| Total Derivative Instruments: | $(494,222) | $(494,222) | $-- | $-- |
Value of Derivative Instruments
The following table is a summary of the Fund's value of derivative instruments by primary risk exposure as of March 31, 2019. For additional information on derivative instruments, please refer to the Derivative Instruments section in the accompanying Notes to Financial Statements.
| Primary Risk Exposure / Derivative Type | Value |
| | Asset | Liability |
| Equity Risk | | |
| Futures Contracts(a) | $0 | $(979,390) |
| Total Equity Risk | 0 | (979,390) |
| Interest Rate Risk | | |
| Futures Contracts | 485,168 | 0 |
| Total Interest Rate Risk | 485,168 | 0 |
| Total Value of Derivatives | $485,168 | $(979,390) |
(a) Reflects gross cumulative appreciation (depreciation) on futures contracts as presented in the Schedule of Investments. In the Statement of Assets and Liabilities, the period end daily variation margin is included in receivable or payable for daily variation margin on futures contracts, and the net cumulative appreciation (depreciation) is included in distributable earnings.
See accompanying notes which are an integral part of the financial statements.
Fidelity Freedom® 2010 Fund
Financial Statements
Statement of Assets and Liabilities
| | | March 31, 2019 |
| Assets | | |
Investment in securities, at value — See accompanying schedule:
Unaffiliated issuers (cost $4,090,553) | $4,090,676 | |
| Fidelity Central Funds (cost $22,521,836) | 22,522,131 | |
| Other affiliated issuers (cost $5,359,755,435) | 5,823,879,870 | |
| Total Investment in Securities (cost $5,386,367,824) | | $5,850,492,677 |
| Receivable for investments sold | | 41,207,927 |
| Receivable for fund shares sold | | 8,684,191 |
| Distributions receivable from Fidelity Central Funds | | 44,833 |
| Other receivables | | 74,861 |
| Total assets | | 5,900,504,489 |
| Liabilities | | |
| Payable for investments purchased | $33,897,023 | |
| Payable for fund shares redeemed | 16,000,054 | |
| Accrued management fee | 2,424,269 | |
| Payable for daily variation margin on futures contracts | 631,602 | |
| Other payables and accrued expenses | 74,863 | |
| Total liabilities | | 53,027,811 |
| Net Assets | | $5,847,476,678 |
| Net Assets consist of: | | |
| Paid in capital | | $5,284,106,865 |
| Total distributable earnings (loss) | | 563,369,813 |
| Net Assets | | $5,847,476,678 |
| Net Asset Value and Maximum Offering Price | | |
| Fidelity Freedom 2010 Fund: | | |
| Net Asset Value, offering price and redemption price per share ($3,724,077,218 ÷ 242,618,919 shares) | | $15.35 |
| Class K: | | |
| Net Asset Value, offering price and redemption price per share ($1,909,779,137 ÷ 124,527,522 shares) | | $15.34 |
| Class K6: | | |
| Net Asset Value, offering price and redemption price per share ($213,620,323 ÷ 13,959,920 shares) | | $15.30 |
See accompanying notes which are an integral part of the financial statements.
Statement of Operations
| | | Year ended March 31, 2019 |
| Investment Income | | |
| Dividends: | | |
| Affiliated issuers | | $147,762,727 |
| Interest | | 55,614 |
| Income from Fidelity Central Funds | | 164,406 |
| Total income | | 147,982,747 |
| Expenses | | |
| Management fee | $30,474,744 | |
| Independent trustees' fees and expenses | 29,245 | |
| Total expenses before reductions | 30,503,989 | |
| Expense reductions | (121) | |
| Total expenses after reductions | | 30,503,868 |
| Net investment income (loss) | | 117,478,879 |
| Realized and Unrealized Gain (Loss) | | |
| Net realized gain (loss) on: | | |
| Investment securities: | | |
| Unaffiliated issuers | 3,254 | |
| Fidelity Central Funds | (455) | |
| Other affiliated issuers | 94,167,707 | |
| Futures contracts | 3,524,653 | |
| Capital gain distributions from underlying funds: | | |
| Affiliated issuers | 150,311,755 | |
| Total net realized gain (loss) | | 248,006,914 |
| Change in net unrealized appreciation (depreciation) on: | | |
| Investment securities: | | |
| Unaffiliated issuers | 152 | |
| Fidelity Central Funds | 295 | |
| Other affiliated issuers | (200,835,940) | |
| Futures contracts | (494,222) | |
| Total change in net unrealized appreciation (depreciation) | | (201,329,715) |
| Net gain (loss) | | 46,677,199 |
| Net increase (decrease) in net assets resulting from operations | | $164,156,078 |
See accompanying notes which are an integral part of the financial statements.
Statement of Changes in Net Assets
| | Year ended March 31, 2019 | Year ended March 31, 2018 |
| Increase (Decrease) in Net Assets | | |
| Operations | | |
| Net investment income (loss) | $117,478,879 | $95,597,195 |
| Net realized gain (loss) | 248,006,914 | 280,325,462 |
| Change in net unrealized appreciation (depreciation) | (201,329,715) | 13,024,260 |
| Net increase (decrease) in net assets resulting from operations | 164,156,078 | 388,946,917 |
| Distributions to shareholders | (403,378,051) | – |
| Distributions to shareholders from net investment income | – | (93,275,651) |
| Distributions to shareholders from net realized gain | – | (192,908,815) |
| Total distributions | (403,378,051) | (286,184,466) |
| Share transactions - net increase (decrease) | (407,651,367) | 2,254,227,956 |
| Total increase (decrease) in net assets | (646,873,340) | 2,356,990,407 |
| Net Assets | | |
| Beginning of period | 6,494,350,018 | 4,137,359,611 |
| End of period | $5,847,476,678 | $6,494,350,018 |
| Other Information | | |
| Undistributed net investment income end of period | | $13,674,100 |
See accompanying notes which are an integral part of the financial statements.
Financial Highlights
Fidelity Freedom 2010 Fund
| Years ended March 31, | 2019 | 2018 | 2017 | 2016 | 2015 |
| Selected Per–Share Data | | | | | |
| Net asset value, beginning of period | $15.98 | $15.56 | $14.75 | $15.75 | $15.51 |
| Income from Investment Operations | | | | | |
| Net investment income (loss)A | .29 | .24 | .26 | .28 | .28 |
| Net realized and unrealized gain (loss) | .12 | .95 | 1.08 | (.50) | .62 |
| Total from investment operations | .41 | 1.19 | 1.34 | (.22) | .90 |
| Distributions from net investment income | (.30) | (.23) | (.26) | (.29) | (.29) |
| Distributions from net realized gain | (.74) | (.54) | (.26) | (.49) | (.36) |
| Total distributions | (1.04) | (.77) | (.53)B | (.78) | (.66)C |
| Net asset value, end of period | $15.35 | $15.98 | $15.56 | $14.75 | $15.75 |
| Total ReturnD | 2.89% | 7.74% | 9.27% | (1.42)% | 5.91% |
| Ratios to Average Net AssetsE,F | | | | | |
| Expenses before reductions | .52%G | .44% | - %H | - %H | - %H |
| Expenses net of fee waivers, if any | .52%G | .44% | -% | -% | -% |
| Expenses net of all reductions | .52%G | .44% | -% | -% | -% |
| Net investment income (loss) | 1.90% | 1.47% | 1.69% | 1.86% | 1.81% |
| Supplemental Data | | | | | |
| Net assets, end of period (000 omitted) | $3,724,077 | $4,038,370 | $4,137,360 | $4,271,151 | $4,940,590 |
| Portfolio turnover rateE | 20% | 19%I | 23% | 17% | 18% |
A Calculated based on average shares outstanding during the period.
B Total distributions of $.53 per share is comprised of distributions from net investment income of $.262 and distributions from net realized gain of $.264 per share.
C Total distributions of $.66 per share is comprised of distributions from net investment income of $.294 and distributions from net realized gain of $.361 per share.
D Total returns would have been lower if certain expenses had not been reduced during the applicable periods shown.
E Amounts do not include the activity of the Underlying Funds.
F Expense ratios reflect operating expenses of the class. Expenses before reductions do not reflect amounts reimbursed by the investment adviser or reductions from expense offset arrangements and do not represent the amount paid by the class during periods when reimbursements or reductions occur. Expenses net of fee waivers reflect expenses after reimbursement by the investment adviser but prior to reductions from expense offset arrangements. Expenses net of all reductions represent the net expenses paid by the class but do not include expenses of the underlying funds in which the Fund invests.
G On certain classes, the size and fluctuation of net assets and expense amounts may cause ratios to differ from contractual rates.
H Amount represents less than .005%.
I The portfolio turnover rate does not include the assets acquired in the merger.
See accompanying notes which are an integral part of the financial statements.
Fidelity Freedom 2010 Fund Class K
| Years ended March 31, | 2019 | 2018 A |
| Selected Per–Share Data | | |
| Net asset value, beginning of period | $15.97 | $15.96 |
| Income from Investment Operations | | |
| Net investment income (loss)B | .30 | .27 |
| Net realized and unrealized gain (loss) | .12 | .31 |
| Total from investment operations | .42 | .58 |
| Distributions from net investment income | (.31) | (.22) |
| Distributions from net realized gain | (.74) | (.35) |
| Total distributions | (1.05) | (.57) |
| Net asset value, end of period | $15.34 | $15.97 |
| Total ReturnC,D | 2.95% | 3.59% |
| Ratios to Average Net AssetsE,F | | |
| Expenses before reductions | .46% | .47%G |
| Expenses net of fee waivers, if any | .46% | .47%G |
| Expenses net of all reductions | .46% | .47%G |
| Net investment income (loss) | 1.96% | 2.42%G |
| Supplemental Data | | |
| Net assets, end of period (000 omitted) | $1,909,779 | $2,396,182 |
| Portfolio turnover rateE | 20% | 19%H |
A For the period July 20, 2017 (commencement of sale of shares) to March 31, 2018.
B Calculated based on average shares outstanding during the period.
C Total returns for periods of less than one year are not annualized.
D Total returns would have been lower if certain expenses had not been reduced during the applicable periods shown.
E Amounts do not include the activity of the Underlying Funds.
F Expense ratios reflect operating expenses of the class. Expenses before reductions do not reflect amounts reimbursed by the investment adviser or reductions from expense offset arrangements and do not represent the amount paid by the class during periods when reimbursements or reductions occur. Expense ratios before reductions for start-up periods may not be representative of longer-term operating periods. Expenses net of fee waivers reflect expenses after reimbursement by the investment adviser but prior to reductions from expense offset arrangements. Expenses net of all reductions represent the net expenses paid by the class but do not include expenses of the underlying funds in which the Fund invests.
G Annualized
H The portfolio turnover rate does not include the assets acquired in the merger.
See accompanying notes which are an integral part of the financial statements.
Fidelity Freedom 2010 Fund Class K6
| Years ended March 31, | 2019 | 2018 A |
| Selected Per–Share Data | | |
| Net asset value, beginning of period | $15.97 | $15.77 |
| Income from Investment Operations | | |
| Net investment income (loss)B | .31 | .27 |
| Net realized and unrealized gain (loss) | .11 | .50 |
| Total from investment operations | .42 | .77 |
| Distributions from net investment income | (.35) | (.22) |
| Distributions from net realized gain | (.74) | (.35) |
| Total distributions | (1.09) | (.57) |
| Net asset value, end of period | $15.30 | $15.97 |
| Total ReturnC,D | 2.96% | 4.89% |
| Ratios to Average Net AssetsE,F | | |
| Expenses before reductions | .39% | .40%G |
| Expenses net of fee waivers, if any | .39% | .40%G |
| Expenses net of all reductions | .39% | .40%G |
| Net investment income (loss) | 2.03% | 2.07%G |
| Supplemental Data | | |
| Net assets, end of period (000 omitted) | $213,620 | $59,797 |
| Portfolio turnover rateE | 20% | 19%H |
A For the period June 7, 2017 (commencement of sale of shares) to March 31, 2018.
B Calculated based on average shares outstanding during the period.
C Total returns for periods of less than one year are not annualized.
D Total returns would have been lower if certain expenses had not been reduced during the applicable periods shown.
E Amounts do not include the activity of the Underlying Funds.
F Expense ratios reflect operating expenses of the class. Expenses before reductions do not reflect amounts reimbursed by the investment adviser or reductions from expense offset arrangements and do not represent the amount paid by the class during periods when reimbursements or reductions occur. Expense ratios before reductions for start-up periods may not be representative of longer-term operating periods. Expenses net of fee waivers reflect expenses after reimbursement by the investment adviser but prior to reductions from expense offset arrangements. Expenses net of all reductions represent the net expenses paid by the class but do not include expenses of the underlying funds in which the Fund invests.
G Annualized
H The portfolio turnover rate does not include the assets acquired in the merger.
See accompanying notes which are an integral part of the financial statements.
Fidelity Freedom® 2015 Fund
Investment Summary (Unaudited)
The information in the following tables is based on the direct investments of the Fund.
Top Holdings as of March 31, 2019
| | % of fund's net assets |
| Fidelity Series Investment Grade Bond Fund | 26.7 |
| Fidelity Series Government Money Market Fund 2.50% | 8.9 |
| Fidelity Series Inflation-Protected Bond Index Fund | 7.2 |
| Fidelity Series Emerging Markets Opportunities Fund | 5.8 |
| Fidelity Series Long-Term Treasury Bond Index Fund | 5.0 |
| Fidelity Series International Growth Fund | 4.9 |
| Fidelity Series Intrinsic Opportunities Fund | 4.8 |
| Fidelity Series International Value Fund | 4.7 |
| Fidelity Series Large Cap Stock Fund | 4.2 |
| Fidelity Series Growth Company Fund | 4.0 |
| | 76.2 |
Asset Allocation (% of fund's net assets)
| Period end |
| | Domestic Equity Funds | 29.6% |
| | International Equity Funds | 17.7% |
| | Bond Funds | 41.2% |
| | Short-Term Funds | 11.5% |
| | Short-Term Investments | 0.1% |
| | Net Other Assets (Liabilities)* | (0.1)% |

* Net Other Assets (Liabilities) are not included in the pie chart
Domestic Equity Funds category includes Fidelity Series Commodity Strategy Fund which invests in commodity-related investments.
Fidelity Freedom® 2015 Fund
Schedule of Investments March 31, 2019
Showing Percentage of Net Assets
| U.S. Treasury Obligations - 0.1% | | | |
| | | Principal Amount | Value |
| U.S. Treasury Bills, yield at date of purchase 2.39% to 2.4% 4/4/19 to 6/27/19 (a) | | | |
| (Cost $6,460,062) | | 6,470,000 | 6,460,187 |
| | | Shares | Value |
|
| Domestic Equity Funds - 29.6% | | | |
| Fidelity Series All-Sector Equity Fund (b) | | 9,767,028 | $94,056,484 |
| Fidelity Series Blue Chip Growth Fund (b) | | 12,442,584 | 183,528,111 |
| Fidelity Series Commodity Strategy Fund (b) | | 43,516,011 | 207,571,372 |
| Fidelity Series Growth Company Fund (b) | | 20,782,877 | 351,438,450 |
| Fidelity Series Intrinsic Opportunities Fund (b) | | 26,215,979 | 431,252,852 |
| Fidelity Series Large Cap Stock Fund (b) | | 25,545,972 | 374,248,483 |
| Fidelity Series Large Cap Value Index Fund (b) | | 8,648,882 | 107,332,626 |
| Fidelity Series Opportunistic Insights Fund (b) | | 10,925,544 | 190,978,515 |
| Fidelity Series Small Cap Discovery Fund (b) | | 4,696,870 | 52,229,192 |
| Fidelity Series Small Cap Opportunities Fund (b) | | 11,353,382 | 152,816,524 |
| Fidelity Series Stock Selector Large Cap Value Fund (b) | | 24,242,907 | 286,066,304 |
| Fidelity Series Value Discovery Fund (b) | | 16,313,619 | 203,757,103 |
| TOTAL DOMESTIC EQUITY FUNDS | | | |
| (Cost $2,004,257,936) | | | 2,635,276,016 |
|
| International Equity Funds - 17.7% | | | |
| Fidelity Series Canada Fund (b) | | 4,378,854 | 45,145,985 |
| Fidelity Series Emerging Markets Fund (b) | | 5,485,831 | 53,706,289 |
| Fidelity Series Emerging Markets Opportunities Fund (b) | | 28,036,116 | 519,509,226 |
| Fidelity Series International Growth Fund (b) | | 28,708,822 | 436,087,002 |
| Fidelity Series International Small Cap Fund (b) | | 6,593,339 | 102,394,552 |
| Fidelity Series International Value Fund (b) | | 45,108,854 | 419,512,342 |
| TOTAL INTERNATIONAL EQUITY FUNDS | | | |
| (Cost $1,282,906,990) | | | 1,576,355,396 |
|
| Bond Funds - 41.2% | | | |
| Fidelity Series Emerging Markets Debt Fund (b) | | 6,622,928 | 63,513,876 |
| Fidelity Series Floating Rate High Income Fund (b) | | 1,362,240 | 12,627,967 |
| Fidelity Series High Income Fund (b) | | 8,534,225 | 80,221,715 |
| Fidelity Series Inflation-Protected Bond Index Fund (b) | | 65,290,359 | 638,539,715 |
| Fidelity Series International Credit Fund (b) | | 548,455 | 5,424,223 |
| Fidelity Series Investment Grade Bond Fund (b) | | 212,877,671 | 2,379,972,366 |
| Fidelity Series Long-Term Treasury Bond Index Fund (b) | | 50,358,853 | 446,683,024 |
| Fidelity Series Real Estate Income Fund (b) | | 3,863,998 | 42,156,219 |
| TOTAL BOND FUNDS | | | |
| (Cost $3,659,590,136) | | | 3,669,139,105 |
|
| Short-Term Funds - 11.5% | | | |
| Fidelity Cash Central Fund, 2.48% (c) | | 34,338,987 | 34,345,855 |
| Fidelity Series Government Money Market Fund 2.50%(b)(d) | | 793,686,618 | 793,686,618 |
| Fidelity Series Short-Term Credit Fund (b) | | 19,667,776 | 196,087,723 |
| TOTAL SHORT-TERM FUNDS | | | |
| (Cost $1,024,362,855) | | | 1,024,120,196 |
| TOTAL INVESTMENT IN SECURITIES - 100.1% | | | |
| (Cost $7,977,577,979) | | | 8,911,350,900 |
| NET OTHER ASSETS (LIABILITIES) - (0.1)% | | | (4,825,000) |
| NET ASSETS - 100% | | | $8,906,525,900 |
| Futures Contracts | | | | | |
| | Number of contracts | Expiration Date | Notional Amount | Value | Unrealized Appreciation/(Depreciation) |
| Purchased | | | | | |
| Treasury Contracts | | | | | |
| CBOT 2-Year U.S. Treasury Note Contracts (United States) | 56 | June 2019 | $11,933,250 | $51,988 | $51,988 |
| CBOT 5-Year U.S. Treasury Note Contracts (United States) | 125 | June 2019 | 14,478,516 | 164,788 | 164,788 |
| CBOT Long Term U.S. Treasury Bond Contracts (United States) | 33 | June 2019 | 4,938,656 | 173,179 | 173,179 |
| CBOT Long Term U.S. Treasury Bond Contracts (United States) | 86 | June 2019 | 10,682,813 | 198,694 | 198,694 |
| CBOT Ultra Long Term U.S. Treasury Bond Contracts (United States) | 32 | June 2019 | 5,376,000 | 267,554 | 267,554 |
|
| TOTAL PURCHASED | | | | | 856,203 |
|
| Sold | | | | | |
| Equity Index Contracts | | | | | |
| CME E-mini S&P 500 Index Contracts (United States) | 248 | June 2019 | 35,188,720 | (1,065,090) | (1,065,090) |
| ICE E-mini MSCI Emerging Markets Index Contracts (United States) | 489 | June 2019 | 25,853,430 | (482,069) | (482,069) |
|
| TOTAL SOLD | | | | | (1,547,159) |
|
| TOTAL FUTURES CONTRACTS | | | | | $(690,956) |
The notional amount of futures purchased as a percentage of Net Assets is 0.5%
The notional amount of futures sold as a percentage of Net Assets is 0.7%
Legend
(a) Security or a portion of the security was pledged to cover margin requirements for futures contracts. At period end, the value of securities pledged amounted to $6,460,187.
(b) Affiliated Fund
(c) Affiliated fund that is generally available only to investment companies and other accounts managed by Fidelity Investments. The rate quoted is the annualized seven-day yield of the fund at period end. A complete unaudited listing of the fund's holdings as of its most recent quarter end is available upon request. In addition, each Fidelity Central Fund's financial statements , which are not covered by the Fund's Report of Independent Registered Public Accounting Firm, are available on the SEC's website or upon request.
(d) The rate quoted is the annualized seven-day yield of the fund at period end.
Affiliated Central Funds
Information regarding fiscal year to date income earned by the Fund from investments in Fidelity Central Funds is as follows:
| Fund | Income earned |
| Fidelity Cash Central Fund | $233,964 |
| Total | $233,964 |
Amounts in the income column in the above table include any capital gain distributions from underlying funds, which are presented in the corresponding line-item in the Statement of Operations, if applicable.
Affiliated Underlying Funds
Fiscal year to date information regarding the Fund's investments in affiliated Underlying Funds, excluding any Money Market Central Funds, is presented below. Exchanges between classes of the same affiliated Underlying Funds may occur.
| Affiliate | Value, beginning of period | Purchases | Sales Proceeds | Dividend Income | Realized Gain (loss) | Change in Unrealized appreciation (depreciation) | Value, end of period |
| Fidelity Series 100 Index Fund | $105,566,561 | $1 | $109,407,302 | $-- | $40,106,846 | $(36,266,106) | $-- |
| Fidelity Series All-Sector Equity Fund | 202,550,169 | 26,651,919 | 127,489,931 | 23,789,028 | 17,650,412 | (25,306,085) | 94,056,484 |
| Fidelity Series Blue Chip Growth Fund | 209,424,941 | 24,637,586 | 60,008,820 | 24,305,940 | 15,090,000 | (5,615,596) | 183,528,111 |
| Fidelity Series Canada Fund | 50,695,921 | 5,037,458 | 11,639,341 | 1,016,692 | 38,885 | 1,013,062 | 45,145,985 |
| Fidelity Series Commodity Strategy Fund | 214,500,126 | 67,178,900 | 49,413,987 | 12,912,484 | (24,055,650) | (638,017) | 207,571,372 |
| Fidelity Series Emerging Markets Debt Fund | 72,411,618 | 4,122,432 | 9,468,567 | 4,023,599 | (430,955) | (3,120,652) | 63,513,876 |
| Fidelity Series Emerging Markets Fund | -- | 54,220,224 | 3,541,628 | 216,797 | (91,979) | 3,119,672 | 53,706,289 |
| Fidelity Series Emerging Markets Opportunities Fund | 567,323,168 | 114,933,822 | 83,154,497 | 41,315,086 | 5,376,093 | (84,969,360) | 519,509,226 |
| Fidelity Series Floating Rate High Income Fund | 23,739,962 | 1,235,120 | 11,901,936 | 1,200,357 | (712,701) | 267,522 | 12,627,967 |
| Fidelity Series Government Money Market Fund 2.50% | 1,087,835,535 | 187,515,933 | 481,664,850 | 19,216,620 | -- | -- | 793,686,618 |
| Fidelity Series Growth Company Fund | 432,334,504 | 38,403,968 | 121,332,858 | 35,795,250 | 49,656,407 | (47,623,571) | 351,438,450 |
| Fidelity Series High Income Fund | 148,415,499 | 8,345,048 | 74,903,663 | 8,138,118 | (3,886,452) | 2,251,283 | 80,221,715 |
| Fidelity Series Inflation-Protected Bond Index Fund | 199,093,014 | 514,987,970 | 77,469,212 | 11,685,370 | (4,028,878) | 5,956,821 | 638,539,715 |
| Fidelity Series International Credit Fund | 5,270,239 | 263,493 | 95,017 | 263,490 | (1,322) | (13,170) | 5,424,223 |
| Fidelity Series International Growth Fund | 522,861,176 | 67,450,854 | 130,278,602 | 28,857,538 | 26,455,037 | (50,401,463) | 436,087,002 |
| Fidelity Series International Small Cap Fund | 130,259,302 | 20,577,404 | 30,330,105 | 9,444,193 | 6,474,363 | (24,586,412) | 102,394,552 |
| Fidelity Series International Value Fund | 517,007,350 | 44,698,422 | 86,455,747 | 15,777,434 | 3,198,039 | (58,935,722) | 419,512,342 |
| Fidelity Series Intrinsic Opportunities Fund | 526,008,710 | 37,951,666 | 92,548,220 | 37,184,551 | 4,496,554 | (44,655,858) | 431,252,852 |
| Fidelity Series Investment Grade Bond Fund | 2,839,330,215 | 115,909,792 | 603,766,365 | 82,360,350 | (27,423,945) | 55,922,669 | 2,379,972,366 |
| Fidelity Series Large Cap Stock Fund | 468,089,078 | 43,859,386 | 125,883,619 | 43,159,641 | 9,690,989 | (21,507,351) | 374,248,483 |
| Fidelity Series Large Cap Value Index Fund | 131,206,403 | 5,472,657 | 31,022,446 | 5,281,060 | 3,000,374 | (1,324,362) | 107,332,626 |
| Fidelity Series Long-Term Treasury Bond Index Fund | 222,582,675 | 296,528,410 | 88,828,772 | 11,054,415 | (3,159,117) | 19,559,828 | 446,683,024 |
| Fidelity Series Opportunistic Insights Fund | 229,538,880 | 16,538,837 | 59,209,665 | 16,197,555 | 20,552,242 | (16,441,779) | 190,978,515 |
| Fidelity Series Real Estate Equity Fund | 40,229,865 | 286,682 | 41,604,622 | 251,884 | 6,843,030 | (5,754,955) | -- |
| Fidelity Series Real Estate Income Fund | 45,268,860 | 3,283,614 | 7,184,343 | 3,181,807 | 295,137 | 492,951 | 42,156,219 |
| Fidelity Series Short-Term Credit Fund | 266,092,890 | 6,257,895 | 78,409,301 | 5,851,645 | (1,068,328) | 3,214,567 | 196,087,723 |
| Fidelity Series Small Cap Discovery Fund | 62,450,884 | 7,199,949 | 12,073,827 | 7,096,891 | 1,062,706 | (6,410,520) | 52,229,192 |
| Fidelity Series Small Cap Opportunities Fund | 190,744,879 | 19,226,374 | 49,636,908 | 18,931,880 | 6,951,618 | (14,469,439) | 152,816,524 |
| Fidelity Series Stock Selector Large Cap Value Fund | 357,360,316 | 26,095,146 | 88,068,554 | 25,570,593 | 15,046,305 | (24,366,909) | 286,066,304 |
| Fidelity Series Value Discovery Fund | 253,985,129 | 13,350,587 | 58,463,458 | 12,979,582 | 12,007,963 | (17,123,118) | 203,757,103 |
| | $10,122,177,869 | $1,772,221,549 | $2,805,256,163 | $507,059,850 | $179,133,673 | $(397,732,070) | $8,870,544,858 |
Amounts in the income column in the above table include any capital gain distributions from underlying funds, which are presented in the corresponding line-item in the Statement of Operations, if applicable.
Investment Valuation
The following is a summary of the inputs used, as of March 31, 2019, involving the Fund's assets and liabilities carried at fair value. The inputs or methodology used for valuing securities may not be an indication of the risk associated with investing in those securities. For more information on valuation inputs, and their aggregation into the levels used below, please refer to the Investment Valuation section in the accompanying Notes to Financial Statements.
| | Valuation Inputs at Reporting Date: |
| Description | Total | Level 1 | Level 2 | Level 3 |
| Investments in Securities: | | | | |
| Other Short-Term Investments | $6,460,187 | $-- | $6,460,187 | $-- |
| Domestic Equity Funds | 2,635,276,016 | 2,635,276,016 | -- | -- |
| International Equity Funds | 1,576,355,396 | 1,576,355,396 | -- | -- |
| Bond Funds | 3,669,139,105 | 3,669,139,105 | -- | -- |
| Short-Term Funds | 1,024,120,196 | 1,024,120,196 | -- | -- |
| Total Investments in Securities: | $8,911,350,900 | $8,904,890,713 | $6,460,187 | $-- |
| Derivative Instruments: | | | | |
| Assets | | | | |
| Futures Contracts | $856,203 | $856,203 | $-- | $-- |
| Total Assets | $856,203 | $856,203 | $-- | $-- |
| Liabilities | | | | |
| Futures Contracts | $(1,547,159) | $(1,547,159) | $-- | $-- |
| Total Liabilities | $(1,547,159) | $(1,547,159) | $-- | $-- |
| Total Derivative Instruments: | $(690,956) | $(690,956) | $-- | $-- |
Value of Derivative Instruments
The following table is a summary of the Fund's value of derivative instruments by primary risk exposure as of March 31, 2019. For additional information on derivative instruments, please refer to the Derivative Instruments section in the accompanying Notes to Financial Statements.
| Primary Risk Exposure / Derivative Type | Value |
| | Asset | Liability |
| Equity Risk | | |
| Futures Contracts(a) | $0 | $(1,547,159) |
| Total Equity Risk | 0 | (1,547,159) |
| Interest Rate Risk | | |
| Futures Contracts | 856,203 | 0 |
| Total Interest Rate Risk | 856,203 | 0 |
| Total Value of Derivatives | $856,203 | $(1,547,159) |
(a) Reflects gross cumulative appreciation (depreciation) on futures contracts as presented in the Schedule of Investments. In the Statement of Assets and Liabilities, the period end daily variation margin is included in receivable or payable for daily variation margin on futures contracts, and the net cumulative appreciation (depreciation) is included in distributable earnings.
See accompanying notes which are an integral part of the financial statements.
Fidelity Freedom® 2015 Fund
Financial Statements
Statement of Assets and Liabilities
| | | March 31, 2019 |
| Assets | | |
Investment in securities, at value — See accompanying schedule:
Unaffiliated issuers (cost $6,460,062) | $6,460,187 | |
| Fidelity Central Funds (cost $34,345,461) | 34,345,855 | |
| Other affiliated issuers (cost $7,936,772,456) | 8,870,544,858 | |
| Total Investment in Securities (cost $7,977,577,979) | | $8,911,350,900 |
| Receivable for investments sold | | 54,063,516 |
| Receivable for fund shares sold | | 19,893,839 |
| Distributions receivable from Fidelity Central Funds | | 68,273 |
| Total assets | | 8,985,376,528 |
| Liabilities | | |
| Payable for investments purchased | $44,736,392 | |
| Payable for fund shares redeemed | 29,211,451 | |
| Accrued management fee | 3,932,721 | |
| Payable for daily variation margin on futures contracts | 970,064 | |
| Total liabilities | | 78,850,628 |
| Net Assets | | $8,906,525,900 |
| Net Assets consist of: | | |
| Paid in capital | | $7,779,770,842 |
| Total distributable earnings (loss) | | 1,126,755,058 |
| Net Assets | | $8,906,525,900 |
| Net Asset Value and Maximum Offering Price | | |
| Fidelity Freedom 2015 Fund: | | |
| Net Asset Value, offering price and redemption price per share ($4,946,449,107 ÷ 390,162,816 shares) | | $12.68 |
| Class K: | | |
| Net Asset Value, offering price and redemption price per share ($3,471,921,286 ÷ 274,238,764 shares) | | $12.66 |
| Class K6: | | |
| Net Asset Value, offering price and redemption price per share ($488,155,507 ÷ 38,619,541 shares) | | $12.64 |
See accompanying notes which are an integral part of the financial statements.
Statement of Operations
| | | Year ended March 31, 2019 |
| Investment Income | | |
| Dividends: | | |
| Affiliated issuers | | $223,491,095 |
| Interest | | 92,189 |
| Income from Fidelity Central Funds | | 233,964 |
| Total income | | 223,817,248 |
| Expenses | | |
| Management fee | $49,876,924 | |
| Independent trustees' fees and expenses | 45,055 | |
| Total expenses before reductions | 49,921,979 | |
| Expense reductions | (118) | |
| Total expenses after reductions | | 49,921,861 |
| Net investment income (loss) | | 173,895,387 |
| Realized and Unrealized Gain (Loss) | | |
| Net realized gain (loss) on: | | |
| Investment securities: | | |
| Unaffiliated issuers | 4,428 | |
| Fidelity Central Funds | (586) | |
| Other affiliated issuers | 179,133,673 | |
| Futures contracts | 4,720,170 | |
| Capital gain distributions from underlying funds: | | |
| Affiliated issuers | 283,568,755 | |
| Total net realized gain (loss) | | 467,426,440 |
| Change in net unrealized appreciation (depreciation) on: | | |
| Investment securities: | | |
| Unaffiliated issuers | 169 | |
| Fidelity Central Funds | 394 | |
| Other affiliated issuers | (397,732,070) | |
| Futures contracts | (690,956) | |
| Total change in net unrealized appreciation (depreciation) | | (398,422,463) |
| Net gain (loss) | | 69,003,977 |
| Net increase (decrease) in net assets resulting from operations | | $242,899,364 |
See accompanying notes which are an integral part of the financial statements.
Statement of Changes in Net Assets
| | Year ended March 31, 2019 | Year ended March 31, 2018 |
| Increase (Decrease) in Net Assets | | |
| Operations | | |
| Net investment income (loss) | $173,895,387 | $141,540,775 |
| Net realized gain (loss) | 467,426,440 | 463,661,846 |
| Change in net unrealized appreciation (depreciation) | (398,422,463) | 46,350,154 |
| Net increase (decrease) in net assets resulting from operations | 242,899,364 | 651,552,775 |
| Distributions to shareholders | (689,733,866) | – |
| Distributions to shareholders from net investment income | – | (138,935,375) |
| Distributions to shareholders from net realized gain | – | (291,414,799) |
| Total distributions | (689,733,866) | (430,350,174) |
| Share transactions - net increase (decrease) | (765,552,717) | 4,570,397,075 |
| Total increase (decrease) in net assets | (1,212,387,219) | 4,791,599,676 |
| Net Assets | | |
| Beginning of period | 10,118,913,119 | 5,327,313,443 |
| End of period | $8,906,525,900 | $10,118,913,119 |
| Other Information | | |
| Undistributed net investment income end of period | | $16,059,411 |
See accompanying notes which are an integral part of the financial statements.
Financial Highlights
Fidelity Freedom 2015 Fund
| Years ended March 31, | 2019 | 2018 | 2017 | 2016 | 2015 |
| Selected Per–Share Data | | | | | |
| Net asset value, beginning of period | $13.33 | $12.82 | $12.03 | $12.92 | $12.91 |
| Income from Investment Operations | | | | | |
| Net investment income (loss)A | .23 | .19 | .21 | .23 | .23 |
| Net realized and unrealized gain (loss) | .08 | .97 | 1.04 | (.46) | .57 |
| Total from investment operations | .31 | 1.16 | 1.25 | (.23) | .80 |
| Distributions from net investment income | (.24) | (.19) | (.21) | (.23) | (.25) |
| Distributions from net realized gain | (.73) | (.46) | (.24) | (.43) | (.54) |
| Total distributions | (.96)B | (.65) | (.46)C | (.66) | (.79) |
| Net asset value, end of period | $12.68 | $13.33 | $12.82 | $12.03 | $12.92 |
| Total ReturnD | 2.74% | 9.15% | 10.63% | (1.83)% | 6.42% |
| Ratios to Average Net AssetsE,F | | | | | |
| Expenses before reductions | .57% | .48% | - %G | - %G | - %G |
| Expenses net of fee waivers, if any | .57% | .48% | -% | -% | -% |
| Expenses net of all reductions | .57% | .48% | -% | -% | -% |
| Net investment income (loss) | 1.82% | 1.40% | 1.69% | 1.87% | 1.83% |
| Supplemental Data | | | | | |
| Net assets, end of period (000 omitted) | $4,946,449 | $5,380,580 | $5,327,313 | $5,354,142 | $6,056,161 |
| Portfolio turnover rateF | 19% | 23%H | 21% | 17% | 18% |
A Calculated based on average shares outstanding during the period.
B Total distributions of $.96 per share is comprised of distributions from net investment income of $.239 and distributions from net realized gain of $.725 per share.
C Total distributions of $.46 per share is comprised of distributions from net investment income of $.214 and distributions from net realized gain of $.243 per share.
D Total returns would have been lower if certain expenses had not been reduced during the applicable periods shown.
E Expense ratios reflect operating expenses of the class. Expenses before reductions do not reflect amounts reimbursed by the investment adviser or reductions from expense offset arrangements and do not represent the amount paid by the class during periods when reimbursements or reductions occur. Expenses net of fee waivers reflect expenses after reimbursement by the investment adviser but prior to reductions from expense offset arrangements. Expenses net of all reductions represent the net expenses paid by the class but do not include expenses of the underlying funds in which the Fund invests.
F Amounts do not include the activity of the Underlying Funds.
G Amount represents less than .005%.
H The portfolio turnover rate does not include the assets acquired in the merger.
See accompanying notes which are an integral part of the financial statements.
Fidelity Freedom 2015 Fund Class K
| Years ended March 31, | 2019 | 2018 A |
| Selected Per–Share Data | | |
| Net asset value, beginning of period | $13.31 | $13.21 |
| Income from Investment Operations | | |
| Net investment income (loss)B | .24 | .22 |
| Net realized and unrealized gain (loss) | .08 | .34 |
| Total from investment operations | .32 | .56 |
| Distributions from net investment income | (.25) | (.18) |
| Distributions from net realized gain | (.73) | (.29) |
| Total distributions | (.97)C | (.46)D |
| Net asset value, end of period | $12.66 | $13.31 |
| Total ReturnE,F | 2.80% | 4.25% |
| Ratios to Average Net AssetsG,H | | |
| Expenses before reductions | .50% | .51%I,J |
| Expenses net of fee waivers, if any | .50% | .51%I,J |
| Expenses net of all reductions | .50% | .51%I,J |
| Net investment income (loss) | 1.89% | 2.39%I |
| Supplemental Data | | |
| Net assets, end of period (000 omitted) | $3,471,921 | $4,624,065 |
| Portfolio turnover rateH | 19% | 23%K |
A For the period July 20, 2017 (commencement of sale of shares) to March 31, 2018.
B Calculated based on average shares outstanding during the period.
C Total distributions of $.97 per share is comprised of distributions from net investment income of $.246 and distributions from net realized gain of $.725 per share.
D Total distributions of $.46 per share is comprised of distributions from net investment income of $.176 and distributions from net realized gain of $.288 per share.
E Total returns for periods of less than one year are not annualized.
F Total returns would have been lower if certain expenses had not been reduced during the applicable periods shown.
G Expense ratios reflect operating expenses of the class. Expenses before reductions do not reflect amounts reimbursed by the investment adviser or reductions from expense offset arrangements and do not represent the amount paid by the class during periods when reimbursements or reductions occur. Expense ratios before reductions for start-up periods may not be representative of longer-term operating periods. Expenses net of fee waivers reflect expenses after reimbursement by the investment adviser but prior to reductions from expense offset arrangements. Expenses net of all reductions represent the net expenses paid by the class but do not include expenses of the underlying funds in which the Fund invests.
H Amounts do not include the activity of the Underlying Funds.
I Annualized
J On certain classes, the size and fluctuation of net assets and expense amounts may cause ratios to differ from contractual rates.
K The portfolio turnover rate does not include the assets acquired in the merger.
See accompanying notes which are an integral part of the financial statements.
Fidelity Freedom 2015 Fund Class K6
| Years ended March 31, | 2019 | 2018 A |
| Selected Per–Share Data | | |
| Net asset value, beginning of period | $13.32 | $13.03 |
| Income from Investment Operations | | |
| Net investment income (loss)B | .25 | .21 |
| Net realized and unrealized gain (loss) | .08 | .55 |
| Total from investment operations | .33 | .76 |
| Distributions from net investment income | (.28) | (.18) |
| Distributions from net realized gain | (.73) | (.29) |
| Total distributions | (1.01) | (.47) |
| Net asset value, end of period | $12.64 | $13.32 |
| Total ReturnC,D | 2.87% | 5.80% |
| Ratios to Average Net AssetsE,F | | |
| Expenses before reductions | .41% | .42%G |
| Expenses net of fee waivers, if any | .41% | .42%G |
| Expenses net of all reductions | .41% | .42%G |
| Net investment income (loss) | 1.97% | 1.88%G |
| Supplemental Data | | |
| Net assets, end of period (000 omitted) | $488,156 | $114,268 |
| Portfolio turnover rateF | 19% | 23%H |
A For the period June 7, 2017 (commencement of sale of shares) to March 31, 2018.
B Calculated based on average shares outstanding during the period.
C Total returns for periods of less than one year are not annualized.
D Total returns would have been lower if certain expenses had not been reduced during the applicable periods shown.
E Expense ratios reflect operating expenses of the class. Expenses before reductions do not reflect amounts reimbursed by the investment adviser or reductions from expense offset arrangements and do not represent the amount paid by the class during periods when reimbursements or reductions occur. Expense ratios before reductions for start-up periods may not be representative of longer-term operating periods. Expenses net of fee waivers reflect expenses after reimbursement by the investment adviser but prior to reductions from expense offset arrangements. Expenses net of all reductions represent the net expenses paid by the class but do not include expenses of the underlying funds in which the Fund invests.
F Amounts do not include the activity of the Underlying Funds.
G Annualized
H The portfolio turnover rate does not include the assets acquired in the merger.
See accompanying notes which are an integral part of the financial statements.
Fidelity Freedom® 2020 Fund
Investment Summary (Unaudited)
The information in the following tables is based on the direct investments of the Fund.
Top Holdings as of March 31, 2019
| | % of fund's net assets |
| Fidelity Series Investment Grade Bond Fund | 23.5 |
| Fidelity Series Government Money Market Fund 2.50% | 6.6 |
| Fidelity Series Emerging Markets Opportunities Fund | 6.4 |
| Fidelity Series Intrinsic Opportunities Fund | 5.8 |
| Fidelity Series International Growth Fund | 5.7 |
| Fidelity Series International Value Fund | 5.4 |
| Fidelity Series Inflation-Protected Bond Index Fund | 5.3 |
| Fidelity Series Long-Term Treasury Bond Index Fund | 5.1 |
| Fidelity Series Large Cap Stock Fund | 5.0 |
| Fidelity Series Growth Company Fund | 4.8 |
| | 73.6 |
Asset Allocation (% of fund's net assets)
| Period end |
| | Domestic Equity Funds | 35.1% |
| | International Equity Funds | 20.1% |
| | Bond Funds | 36.2% |
| | Short-Term Funds | 8.6% |
| | Short-Term Investments | 0.1% |
| | Net Other Assets (Liabilities)* | (0.1)% |

* Net Other Assets (Liabilities) are not included in the pie chart
Domestic Equity Funds category includes Fidelity Series Commodity Strategy Fund which invests in commodity-related investments.
Fidelity Freedom® 2020 Fund
Schedule of Investments March 31, 2019
Showing Percentage of Net Assets
| U.S. Treasury Obligations - 0.1% | | | |
| | | Principal Amount | Value |
| U.S. Treasury Bills, yield at date of purchase 2.39% to 2.43% 4/4/19 to 6/27/19 (a) | | | |
| (Cost $18,601,728) | | 18,630,000 | 18,602,097 |
| | | Shares | Value |
|
| Domestic Equity Funds - 35.1% | | | |
| Fidelity Series All-Sector Equity Fund (b) | | 36,239,449 | $348,985,894 |
| Fidelity Series Blue Chip Growth Fund (b) | | 45,995,976 | 678,440,644 |
| Fidelity Series Commodity Strategy Fund (b) | | 135,863,059 | 648,066,793 |
| Fidelity Series Growth Company Fund (b) | | 78,025,693 | 1,319,414,474 |
| Fidelity Series Intrinsic Opportunities Fund (b) | | 98,331,101 | 1,617,546,617 |
| Fidelity Series Large Cap Stock Fund (b) | | 95,473,587 | 1,398,688,050 |
| Fidelity Series Large Cap Value Index Fund (b) | | 32,531,113 | 403,711,107 |
| Fidelity Series Opportunistic Insights Fund (b) | | 40,827,709 | 713,668,349 |
| Fidelity Series Small Cap Discovery Fund (b) | | 17,146,118 | 190,664,833 |
| Fidelity Series Small Cap Opportunities Fund (b) | | 41,997,675 | 565,288,705 |
| Fidelity Series Stock Selector Large Cap Value Fund (b) | | 90,979,463 | 1,073,557,659 |
| Fidelity Series Value Discovery Fund (b) | | 61,229,171 | 764,752,346 |
| TOTAL DOMESTIC EQUITY FUNDS | | | |
| (Cost $7,659,592,314) | | | 9,722,785,471 |
|
| International Equity Funds - 20.1% | | | |
| Fidelity Series Canada Fund (b) | | 15,764,870 | 162,535,812 |
| Fidelity Series Emerging Markets Fund (b) | | 19,457,940 | 190,493,230 |
| Fidelity Series Emerging Markets Opportunities Fund (b) | | 96,063,381 | 1,780,054,457 |
| Fidelity Series International Growth Fund (b) | | 103,670,697 | 1,574,757,886 |
| Fidelity Series International Small Cap Fund (b) | | 23,916,801 | 371,427,916 |
| Fidelity Series International Value Fund (b) | | 161,250,885 | 1,499,633,233 |
| TOTAL INTERNATIONAL EQUITY FUNDS | | | |
| (Cost $4,652,407,500) | | | 5,578,902,534 |
|
| Bond Funds - 36.2% | | | |
| Fidelity Series Emerging Markets Debt Fund (b) | | 19,917,953 | 191,013,165 |
| Fidelity Series Floating Rate High Income Fund (b) | | 4,005,283 | 37,128,969 |
| Fidelity Series High Income Fund (b) | | 26,773,350 | 251,669,491 |
| Fidelity Series Inflation-Protected Bond Index Fund (b) | | 149,557,688 | 1,462,674,190 |
| Fidelity Series International Credit Fund (b) | | 1,862,569 | 18,420,811 |
| Fidelity Series Investment Grade Bond Fund (b) | | 582,922,267 | 6,517,070,943 |
| Fidelity Series Long-Term Treasury Bond Index Fund (b) | | 160,190,238 | 1,420,887,415 |
| Fidelity Series Real Estate Income Fund (b) | | 12,182,734 | 132,913,632 |
| TOTAL BOND FUNDS | | | |
| (Cost $10,066,536,515) | | | 10,031,778,616 |
|
| Short-Term Funds - 8.6% | | | |
| Fidelity Cash Central Fund, 2.48% (c) | | 92,498,946 | 92,517,446 |
| Fidelity Series Government Money Market Fund 2.50% (b)(d) | | 1,841,889,984 | 1,841,889,984 |
| Fidelity Series Short-Term Credit Fund (b) | | 46,632,077 | 464,921,807 |
| TOTAL SHORT-TERM FUNDS | | | |
| (Cost $2,400,030,441) | | | 2,399,329,237 |
| TOTAL INVESTMENT IN SECURITIES - 100.1% | | | |
| (Cost $24,797,168,498) | | | 27,751,397,955 |
| NET OTHER ASSETS (LIABILITIES) - (0.1)% | | | (15,504,635) |
| NET ASSETS - 100% | | | $27,735,893,320 |
| Futures Contracts | | | | | |
| | Number of contracts | Expiration Date | Notional Amount | Value | Unrealized Appreciation/(Depreciation) |
| Purchased | | | | | |
| Treasury Contracts | | | | | |
| CBOT 2-Year U.S. Treasury Note Contracts (United States) | 160 | June 2019 | $34,095,000 | $141,198 | $141,198 |
| CBOT 5-Year U.S. Treasury Note Contracts (United States) | 371 | June 2019 | 42,972,234 | 474,911 | 474,911 |
| CBOT Long Term U.S. Treasury Bond Contracts (United States) | 110 | June 2019 | 16,462,188 | 577,262 | 577,262 |
| CBOT Long Term U.S. Treasury Bond Contracts (United States) | 252 | June 2019 | 31,303,125 | 582,218 | 582,218 |
| CBOT Ultra Long Term U.S. Treasury Bond Contracts (United States) | 112 | June 2019 | 18,816,000 | 936,442 | 936,442 |
|
| TOTAL PURCHASED | | | | | 2,712,031 |
|
| Sold | | | | | |
| Equity Index Contracts | | | | | |
| CME E-mini S&P 500 Index Contracts (United States) | 808 | June 2019 | 114,647,120 | (3,470,131) | (3,470,131) |
| ICE E-mini MSCI EAFE Index Contracts (United States) | 195 | June 2019 | 18,197,400 | (384,604) | (384,604) |
| ICE E-mini MSCI Emerging Markets Index Contracts (United States) | 1,592 | June 2019 | 84,169,040 | (1,569,439) | (1,569,439) |
|
| TOTAL SOLD | | | | | (5,424,174) |
|
| TOTAL FUTURES CONTRACTS | | | | | $(2,712,143) |
The notional amount of futures purchased as a percentage of Net Assets is 0.5%
The notional amount of futures sold as a percentage of Net Assets is 0.8%
Legend
(a) Security or a portion of the security was pledged to cover margin requirements for futures contracts. At period end, the value of securities pledged amounted to $18,602,097.
(b) Affiliated Fund
(c) Affiliated fund that is generally available only to investment companies and other accounts managed by Fidelity Investments. The rate quoted is the annualized seven-day yield of the fund at period end. A complete unaudited listing of the fund's holdings as of its most recent quarter end is available upon request. In addition, each Fidelity Central Fund's financial statements, which are not covered by the Fund's Report of Independent Registered Public Accounting Firm, are available on the SEC's website or upon request.
(d) The rate quoted is the annualized seven-day yield of the fund at period end.
Affiliated Central Funds
Information regarding fiscal year to date income earned by the Fund from investments in Fidelity Central Funds is as follows:
| Fund | Income earned |
| Fidelity Cash Central Fund | $694,408 |
| Total | $694,408 |
Amounts in the income column in the above table include any capital gain distributions from underlying funds, which are presented in the corresponding line-item in the Statement of Operations, if applicable.
Affiliated Underlying Funds
Fiscal year to date information regarding the Fund's investments in affiliated Underlying Funds, excluding any Money Market Central Funds, is presented below. Exchanges between classes of the same affiliated Underlying Funds may occur.
| Affiliate | Value, beginning of period | Purchases | Sales Proceeds | Dividend Income | Realized Gain (loss) | Change in Unrealized appreciation (depreciation) | Value, end of period |
| Fidelity Series 100 Index Fund | $360,400,417 | $18 | $373,452,465 | $-- | $134,660,262 | $(121,608,232) | $-- |
| Fidelity Series All-Sector Equity Fund | 691,515,664 | 99,995,093 | 411,564,891 | 86,832,370 | 47,838,025 | (78,797,997) | 348,985,894 |
| Fidelity Series Blue Chip Growth Fund | 714,854,503 | 95,691,561 | 163,225,429 | 87,649,245 | 40,156,156 | (9,036,147) | 678,440,644 |
| Fidelity Series Canada Fund | 169,349,670 | 9,375,489 | 18,764,952 | 3,599,456 | (165,078) | 2,740,683 | 162,535,812 |
| Fidelity Series Commodity Strategy Fund | 638,248,050 | 207,658,146 | 123,038,477 | 39,047,541 | (63,187,741) | (11,613,185) | 648,066,793 |
| Fidelity Series Emerging Markets Debt Fund | 209,218,641 | 13,010,598 | 20,958,323 | 11,863,475 | (869,704) | (9,388,047) | 191,013,165 |
| Fidelity Series Emerging Markets Fund | -- | 186,524,728 | 8,649,355 | 756,125 | (260,388) | 12,878,245 | 190,493,230 |
| Fidelity Series Emerging Markets Opportunities Fund | 1,848,959,268 | 398,993,545 | 200,202,458 | 139,442,282 | (2,284,536) | (265,411,362) | 1,780,054,457 |
| Fidelity Series Floating Rate High Income Fund | 69,635,549 | 3,927,043 | 35,270,528 | 3,516,729 | (1,926,745) | 763,650 | 37,128,969 |
| Fidelity Series Government Money Market Fund 2.50% | 2,454,122,385 | 434,813,321 | 1,047,045,722 | 44,629,411 | -- | -- | 1,841,889,984 |
| Fidelity Series Growth Company Fund | 1,469,022,731 | 188,587,101 | 336,939,568 | 135,169,335 | 102,721,449 | (103,977,239) | 1,319,414,474 |
| Fidelity Series High Income Fund | 434,030,687 | 27,140,499 | 204,508,057 | 24,835,932 | (10,228,602) | 5,234,964 | 251,669,491 |
| Fidelity Series Inflation-Protected Bond Index Fund | 347,776,727 | 1,224,105,510 | 113,385,412 | 26,456,248 | (6,341,512) | 10,518,877 | 1,462,674,190 |
| Fidelity Series International Credit Fund | 17,926,241 | 895,169 | 351,103 | 895,168 | (4,832) | (44,664) | 18,420,811 |
| Fidelity Series International Growth Fund | 1,737,696,795 | 231,943,082 | 312,435,691 | 101,383,363 | 46,359,315 | (128,805,615) | 1,574,757,886 |
| Fidelity Series International Small Cap Fund | 434,859,065 | 73,641,041 | 74,034,470 | 33,432,982 | 9,719,602 | (72,757,322) | 371,427,916 |
| Fidelity Series International Value Fund | 1,726,630,081 | 145,807,899 | 178,703,896 | 55,500,144 | 1,605,800 | (195,706,651) | 1,499,633,233 |
| Fidelity Series Intrinsic Opportunities Fund | 1,772,722,653 | 144,836,703 | 151,715,957 | 133,845,774 | 10,176,835 | (158,473,617) | 1,617,546,617 |
| Fidelity Series Investment Grade Bond Fund | 7,589,645,384 | 351,434,962 | 1,502,416,778 | 222,545,740 | (80,238,395) | 158,645,770 | 6,517,070,943 |
| Fidelity Series Large Cap Stock Fund | 1,614,989,603 | 164,005,621 | 334,627,488 | 154,107,735 | 8,925,317 | (54,605,003) | 1,398,688,050 |
| Fidelity Series Large Cap Value Index Fund | 448,080,326 | 21,951,516 | 71,535,332 | 19,187,870 | 5,963,805 | (749,208) | 403,711,107 |
| Fidelity Series Long-Term Treasury Bond Index Fund | 665,667,185 | 913,649,561 | 210,993,349 | 34,602,326 | (7,217,028) | 59,781,046 | 1,420,887,415 |
| Fidelity Series Opportunistic Insights Fund | 783,485,090 | 63,895,495 | 145,050,883 | 58,991,448 | 37,738,680 | (26,400,033) | 713,668,349 |
| Fidelity Series Real Estate Equity Fund | 138,627,411 | 1,050,429 | 143,649,574 | 919,961 | 17,526,868 | (13,555,134) | -- |
| Fidelity Series Real Estate Income Fund | 135,680,911 | 10,686,106 | 15,900,437 | 9,785,951 | (86,986) | 2,534,038 | 132,913,632 |
| Fidelity Series Short-Term Credit Fund | 587,623,481 | 17,174,868 | 144,926,021 | 13,447,127 | (1,993,493) | 7,042,972 | 464,921,807 |
| Fidelity Series Small Cap Discovery Fund | 213,189,712 | 26,365,356 | 29,916,605 | 24,986,561 | 1,642,311 | (20,615,941) | 190,664,833 |
| Fidelity Series Small Cap Opportunities Fund | 651,074,180 | 72,314,368 | 128,650,686 | 68,276,002 | 11,896,781 | (41,345,938) | 565,288,705 |
| Fidelity Series Stock Selector Large Cap Value Fund | 1,220,429,926 | 100,816,028 | 210,853,518 | 93,259,213 | 7,740,224 | (44,575,001) | 1,073,557,659 |
| Fidelity Series Value Discovery Fund | 867,290,850 | 54,401,037 | 136,673,032 | 47,236,805 | 22,148,511 | (42,415,020) | 764,752,346 |
| | $30,012,753,186 | $5,284,691,893 | $6,849,440,457 | $1,676,202,319 | $332,014,901 | $(1,139,741,111) | $27,640,278,412 |
Amounts in the income column in the above table include any capital gain distributions from underlying funds, which are presented in the corresponding line-item in the Statement of Operations, if applicable.
Investment Valuation
The following is a summary of the inputs used, as of March 31, 2019, involving the Fund's assets and liabilities carried at fair value. The inputs or methodology used for valuing securities may not be an indication of the risk associated with investing in those securities. For more information on valuation inputs, and their aggregation into the levels used below, please refer to the Investment Valuation section in the accompanying Notes to Financial Statements.
| | Valuation Inputs at Reporting Date: |
| Description | Total | Level 1 | Level 2 | Level 3 |
| Investments in Securities: | | | | |
| Other Short-Term Investments | $18,602,097 | $-- | $18,602,097 | $-- |
| Domestic Equity Funds | 9,722,785,471 | 9,722,785,471 | -- | -- |
| International Equity Funds | 5,578,902,534 | 5,578,902,534 | -- | -- |
| Bond Funds | 10,031,778,616 | 10,031,778,616 | -- | -- |
| Short-Term Funds | 2,399,329,237 | 2,399,329,237 | -- | -- |
| Total Investments in Securities: | $27,751,397,955 | $27,732,795,858 | $18,602,097 | $-- |
| Derivative Instruments: | | | | |
| Assets | | | | |
| Futures Contracts | $2,712,031 | $2,712,031 | $-- | $-- |
| Total Assets | $2,712,031 | $2,712,031 | $-- | $-- |
| Liabilities | | | | |
| Futures Contracts | $(5,424,174) | $(5,424,174) | $-- | $-- |
| Total Liabilities | $(5,424,174) | $(5,424,174) | $-- | $-- |
| Total Derivative Instruments: | $(2,712,143) | $(2,712,143) | $-- | $-- |
Value of Derivative Instruments
The following table is a summary of the Fund's value of derivative instruments by primary risk exposure as of March 31, 2019. For additional information on derivative instruments, please refer to the Derivative Instruments section in the accompanying Notes to Financial Statements.
| Primary Risk Exposure / Derivative Type | Value |
| | Asset | Liability |
| Equity Risk | | |
| Futures Contracts(a) | $0 | $(5,424,174) |
| Total Equity Risk | 0 | (5,424,174) |
| Interest Rate Risk | | |
| Futures Contracts | 2,712,031 | 0 |
| Total Interest Rate Risk | 2,712,031 | 0 |
| Total Value of Derivatives | $2,712,031 | $(5,424,174) |
(a) Reflects gross cumulative appreciation (depreciation) on futures contracts as presented in the Schedule of Investments. In the Statement of Assets and Liabilities, the period end daily variation margin is included in receivable or payable for daily variation margin on futures contracts, and the net cumulative appreciation (depreciation) is included in distributable earnings.
See accompanying notes which are an integral part of the financial statements.
Fidelity Freedom® 2020 Fund
Financial Statements
Statement of Assets and Liabilities
| | | March 31, 2019 |
| Assets | | |
Investment in securities, at value — See accompanying schedule:
Unaffiliated issuers (cost $18,601,728) | $18,602,097 | |
| Fidelity Central Funds (cost $92,515,806) | 92,517,446 | |
| Other affiliated issuers (cost $24,686,050,964) | 27,640,278,412 | |
| Total Investment in Securities (cost $24,797,168,498) | | $27,751,397,955 |
| Receivable for investments sold | | 105,169,981 |
| Receivable for fund shares sold | | 68,779,169 |
| Distributions receivable from Fidelity Central Funds | | 184,554 |
| Other receivables | | 180,432 |
| Total assets | | 27,925,712,091 |
| Liabilities | | |
| Payable for investments purchased | $74,153,934 | |
| Payable for fund shares redeemed | 99,777,270 | |
| Accrued management fee | 12,891,414 | |
| Payable for daily variation margin on futures contracts | 2,815,729 | |
| Other payables and accrued expenses | 180,424 | |
| Total liabilities | | 189,818,771 |
| Net Assets | | $27,735,893,320 |
| Net Assets consist of: | | |
| Paid in capital | | $24,093,244,677 |
| Total distributable earnings (loss) | | 3,642,648,643 |
| Net Assets | | $27,735,893,320 |
| Net Asset Value and Maximum Offering Price | | |
| Fidelity Freedom 2020 Fund: | | |
| Net Asset Value, offering price and redemption price per share ($12,395,049,374 ÷ 783,236,449 shares) | | $15.83 |
| Class K: | | |
| Net Asset Value, offering price and redemption price per share ($13,509,100,615 ÷ 854,550,627 shares) | | $15.81 |
| Class K6: | | |
| Net Asset Value, offering price and redemption price per share ($1,831,743,331 ÷ 116,047,631 shares) | | $15.78 |
See accompanying notes which are an integral part of the financial statements.
Statement of Operations
| | | Year ended March 31, 2019 |
| Investment Income | | |
| Dividends: | | |
| Affiliated issuers | | $675,017,867 |
| Interest | | 284,887 |
| Income from Fidelity Central Funds | | 694,408 |
| Total income | | 675,997,162 |
| Expenses | | |
| Management fee | $160,029,124 | |
| Independent trustees' fees and expenses | 136,042 | |
| Total expenses before reductions | 160,165,166 | |
| Expense reductions | (193) | |
| Total expenses after reductions | | 160,164,973 |
| Net investment income (loss) | | 515,832,189 |
| Realized and Unrealized Gain (Loss) | | |
| Net realized gain (loss) on: | | |
| Investment securities: | | |
| Unaffiliated issuers | 22,673 | |
| Fidelity Central Funds | (1,821) | |
| Other affiliated issuers | 332,014,901 | |
| Futures contracts | 20,680,909 | |
| Capital gain distributions from underlying funds: | | |
| Affiliated issuers | 1,001,184,452 | |
| Total net realized gain (loss) | | 1,353,901,114 |
| Change in net unrealized appreciation (depreciation) on: | | |
| Investment securities: | | |
| Unaffiliated issuers | 498 | |
| Fidelity Central Funds | 1,640 | |
| Other affiliated issuers | (1,139,741,111) | |
| Futures contracts | (2,712,143) | |
| Total change in net unrealized appreciation (depreciation) | | (1,142,451,116) |
| Net gain (loss) | | 211,449,998 |
| Net increase (decrease) in net assets resulting from operations | | $727,282,187 |
See accompanying notes which are an integral part of the financial statements.
Statement of Changes in Net Assets
| | Year ended March 31, 2019 | Year ended March 31, 2018 |
| Increase (Decrease) in Net Assets | | |
| Operations | | |
| Net investment income (loss) | $515,832,189 | $395,829,727 |
| Net realized gain (loss) | 1,353,901,114 | 1,249,079,495 |
| Change in net unrealized appreciation (depreciation) | (1,142,451,116) | 265,229,829 |
| Net increase (decrease) in net assets resulting from operations | 727,282,187 | 1,910,139,051 |
| Distributions to shareholders | (1,867,405,063) | – |
| Distributions to shareholders from net investment income | – | (388,661,235) |
| Distributions to shareholders from net realized gain | – | (719,753,000) |
| Total distributions | (1,867,405,063) | (1,108,414,235) |
| Share transactions - net increase (decrease) | (1,126,115,350) | 16,921,166,403 |
| Total increase (decrease) in net assets | (2,266,238,226) | 17,722,891,219 |
| Net Assets | | |
| Beginning of period | 30,002,131,546 | 12,279,240,327 |
| End of period | $27,735,893,320 | $30,002,131,546 |
| Other Information | | |
| Undistributed net investment income end of period | | $35,178,913 |
See accompanying notes which are an integral part of the financial statements.
Financial Highlights
Fidelity Freedom 2020 Fund
| Years ended March 31, | 2019 | 2018 | 2017 | 2016 | 2015 |
| Selected Per–Share Data | | | | | |
| Net asset value, beginning of period | $16.51 | $15.70 | $14.63 | $15.76 | $15.81 |
| Income from Investment Operations | | | | | |
| Net investment income (loss)A | .28 | .22 | .25 | .28 | .28 |
| Net realized and unrealized gain (loss) | .10 | 1.34 | 1.40 | (.60) | .73 |
| Total from investment operations | .38 | 1.56 | 1.65 | (.32) | 1.01 |
| Distributions from net investment income | (.28) | (.22) | (.26) | (.28) | (.29) |
| Distributions from net realized gain | (.78) | (.52) | (.32) | (.53) | (.77) |
| Total distributions | (1.06) | (.75)B | (.58) | (.81) | (1.06) |
| Net asset value, end of period | $15.83 | $16.51 | $15.70 | $14.63 | $15.76 |
| Total ReturnC | 2.66% | 10.01% | 11.57% | (2.10)% | 6.71% |
| Ratios to Average Net AssetsD,E | | | | | |
| Expenses before reductions | .61% | .52% | - %F | - %F | - %F |
| Expenses net of fee waivers, if any | .61% | .52% | -% | -% | -% |
| Expenses net of all reductions | .61% | .52% | -% | -% | -% |
| Net investment income (loss) | 1.76% | 1.34% | 1.69% | 1.83% | 1.83% |
| Supplemental Data | | | | | |
| Net assets, end of period (000 omitted) | $12,395,049 | $12,916,078 | $12,279,240 | $11,732,980 | $12,868,898 |
| Portfolio turnover rateD | 19% | 21%G | 19% | 17% | 17% |
A Calculated based on average shares outstanding during the period.
B Total distributions of $.75 per share is comprised of distributions from net investment income of $.221 and distributions from net realized gain of $.524 per share.
C Total returns would have been lower if certain expenses had not been reduced during the applicable periods shown.
D Amounts do not include the activity of the Underlying Funds.
E Expense ratios reflect operating expenses of the class. Expenses before reductions do not reflect amounts reimbursed by the investment adviser or reductions from expense offset arrangements and do not represent the amount paid by the class during periods when reimbursements or reductions occur. Expenses net of fee waivers reflect expenses after reimbursement by the investment adviser but prior to reductions from expense offset arrangements. Expenses net of all reductions represent the net expenses paid by the class but do not include expenses of the underlying funds in which the Fund invests.
F Amount represents less than .005%.
G The portfolio turnover rate does not include the assets acquired in the merger.
See accompanying notes which are an integral part of the financial statements.
Fidelity Freedom 2020 Fund Class K
| Years ended March 31, | 2019 | 2018 A |
| Selected Per–Share Data | | |
| Net asset value, beginning of period | $16.49 | $16.24 |
| Income from Investment Operations | | |
| Net investment income (loss)B | .29 | .27 |
| Net realized and unrealized gain (loss) | .10 | .50 |
| Total from investment operations | .39 | .77 |
| Distributions from net investment income | (.29) | (.21) |
| Distributions from net realized gain | (.78) | (.31) |
| Total distributions | (1.07) | (.52) |
| Net asset value, end of period | $15.81 | $16.49 |
| Total ReturnC,D | 2.73% | 4.73% |
| Ratios to Average Net AssetsE,F | | |
| Expenses before reductions | .53% | .54%G |
| Expenses net of fee waivers, if any | .53% | .54%G |
| Expenses net of all reductions | .53% | .54%G |
| Net investment income (loss) | 1.84% | 2.34%G |
| Supplemental Data | | |
| Net assets, end of period (000 omitted) | $13,509,101 | $16,611,072 |
| Portfolio turnover rateE | 19% | 21%H |
A For the period July 20, 2017 (commencement of sale of shares) to March 31, 2018.
B Calculated based on average shares outstanding during the period.
C Total returns for periods of less than one year are not annualized.
D Total returns would have been lower if certain expenses had not been reduced during the applicable periods shown.
E Amounts do not include the activity of the Underlying Funds.
F Expense ratios reflect operating expenses of the class. Expenses before reductions do not reflect amounts reimbursed by the investment adviser or reductions from expense offset arrangements and do not represent the amount paid by the class during periods when reimbursements or reductions occur. Expense ratios before reductions for start-up periods may not be representative of longer-term operating periods. Expenses net of fee waivers reflect expenses after reimbursement by the investment adviser but prior to reductions from expense offset arrangements. Expenses net of all reductions represent the net expenses paid by the class but do not include expenses of the underlying funds in which the Fund invests.
G Annualized
H The portfolio turnover rate does not include the assets acquired in the merger.
See accompanying notes which are an integral part of the financial statements.
Fidelity Freedom 2020 Fund Class K6
| Years ended March 31, | 2019 | 2018 A |
| Selected Per–Share Data | | |
| Net asset value, beginning of period | $16.50 | $16.00 |
| Income from Investment Operations | | |
| Net investment income (loss)B | .30 | .24 |
| Net realized and unrealized gain (loss) | .10 | .79 |
| Total from investment operations | .40 | 1.03 |
| Distributions from net investment income | (.34) | (.22) |
| Distributions from net realized gain | (.78) | (.31) |
| Total distributions | (1.12) | (.53) |
| Net asset value, end of period | $15.78 | $16.50 |
| Total ReturnC,D | 2.80% | 6.40% |
| Ratios to Average Net AssetsE,F | | |
| Expenses before reductions | .43% | .44%G |
| Expenses net of fee waivers, if any | .43% | .44%G |
| Expenses net of all reductions | .43% | .44%G |
| Net investment income (loss) | 1.94% | 1.79%G |
| Supplemental Data | | |
| Net assets, end of period (000 omitted) | $1,831,743 | $474,981 |
| Portfolio turnover rateE | 19% | 21%H |
A For the period June 7, 2017 (commencement of sale of shares) to March 31, 2018.
B Calculated based on average shares outstanding during the period.
C Total returns for periods of less than one year are not annualized.
D Total returns would have been lower if certain expenses had not been reduced during the applicable periods shown.
E Amounts do not include the activity of the Underlying Funds.
F Expense ratios reflect operating expenses of the class. Expenses before reductions do not reflect amounts reimbursed by the investment adviser or reductions from expense offset arrangements and do not represent the amount paid by the class during periods when reimbursements or reductions occur. Expense ratios before reductions for start-up periods may not be representative of longer-term operating periods. Expenses net of fee waivers reflect expenses after reimbursement by the investment adviser but prior to reductions from expense offset arrangements. Expenses net of all reductions represent the net expenses paid by the class but do not include expenses of the underlying funds in which the Fund invests.
G Annualized
H The portfolio turnover rate does not include the assets acquired in the merger.
See accompanying notes which are an integral part of the financial statements.
Fidelity Freedom® 2025 Fund
Investment Summary (Unaudited)
The information in the following tables is based on the direct investments of the Fund.
Top Holdings as of March 31, 2019
| | % of fund's net assets |
| Fidelity Series Investment Grade Bond Fund | 19.9 |
| Fidelity Series Emerging Markets Opportunities Fund | 6.9 |
| Fidelity Series Intrinsic Opportunities Fund | 6.6 |
| Fidelity Series International Growth Fund | 6.3 |
| Fidelity Series International Value Fund | 6.0 |
| Fidelity Series Large Cap Stock Fund | 5.8 |
| Fidelity Series Long-Term Treasury Bond Index Fund | 5.6 |
| Fidelity Series Growth Company Fund | 5.5 |
| Fidelity Series Government Money Market Fund 2.50% | 4.6 |
| Fidelity Series Stock Selector Large Cap Value Fund | 4.4 |
| | 71.6 |
Asset Allocation (% of fund's net assets)
| Period end |
| | Domestic Equity Funds | 39.8% |
| | International Equity Funds | 22.1% |
| | Bond Funds | 32.0% |
| | Short-Term Funds | 6.1% |
| | Short-Term Investments | 0.1% |
| | Net Other Assets (Liabilities)* | (0.1)% |

* Net Other Assets (Liabilities) are not included in the pie chart
Domestic Equity Funds category includes Fidelity Series Commodity Strategy Fund which invests in commodity-related investments.
Fidelity Freedom® 2025 Fund
Schedule of Investments March 31, 2019
Showing Percentage of Net Assets
| U.S. Treasury Obligations - 0.1% | | | |
| | | Principal Amount | Value |
| U.S. Treasury Bills, yield at date of purchase 2.39% to 2.43% 4/4/19 to 6/27/19 (a) | | | |
| (Cost $17,542,813) | | 17,570,000 | 17,543,171 |
| | | Shares | Value |
|
| Domestic Equity Funds - 39.8% | | | |
| Fidelity Series All-Sector Equity Fund (b) | | 40,677,183 | $391,721,273 |
| Fidelity Series Blue Chip Growth Fund (b) | | 51,728,611 | 762,997,010 |
| Fidelity Series Commodity Strategy Fund (b) | | 132,650,763 | 632,744,139 |
| Fidelity Series Growth Company Fund (b) | | 87,897,684 | 1,486,349,840 |
| Fidelity Series Intrinsic Opportunities Fund (b) | | 108,452,937 | 1,784,050,814 |
| Fidelity Series Large Cap Stock Fund (b) | | 107,468,546 | 1,574,414,204 |
| Fidelity Series Large Cap Value Index Fund (b) | | 36,745,007 | 456,005,541 |
| Fidelity Series Opportunistic Insights Fund (b) | | 45,947,519 | 803,162,629 |
| Fidelity Series Small Cap Discovery Fund (b) | | 19,269,221 | 214,273,735 |
| Fidelity Series Small Cap Opportunities Fund (b) | | 47,306,950 | 636,751,550 |
| Fidelity Series Stock Selector Large Cap Value Fund (b) | | 102,549,736 | 1,210,086,884 |
| Fidelity Series Value Discovery Fund (b) | | 68,818,310 | 859,540,695 |
| TOTAL DOMESTIC EQUITY FUNDS | | | |
| (Cost $8,836,375,555) | | | 10,812,098,314 |
|
| International Equity Funds - 22.1% | | | |
| Fidelity Series Canada Fund (b) | | 17,301,826 | 178,381,825 |
| Fidelity Series Emerging Markets Fund (b) | | 20,487,661 | 200,574,206 |
| Fidelity Series Emerging Markets Opportunities Fund (b) | | 101,095,314 | 1,873,296,174 |
| Fidelity Series International Growth Fund (b) | | 112,902,226 | 1,714,984,815 |
| Fidelity Series International Small Cap Fund (b) | | 25,981,228 | 403,488,467 |
| Fidelity Series International Value Fund (b) | | 175,564,697 | 1,632,751,682 |
| TOTAL INTERNATIONAL EQUITY FUNDS | | | |
| (Cost $5,172,528,499) | | | 6,003,477,169 |
|
| Bond Funds - 32.0% | | | |
| Fidelity Series Emerging Markets Debt Fund (b) | | 18,781,305 | 180,112,714 |
| Fidelity Series Floating Rate High Income Fund (b) | | 3,717,104 | 34,457,552 |
| Fidelity Series High Income Fund (b) | | 26,080,294 | 245,154,766 |
| Fidelity Series Inflation-Protected Bond Index Fund (b) | | 115,868,772 | 1,133,196,586 |
| Fidelity Series International Credit Fund (b) | | 1,600,854 | 15,832,442 |
| Fidelity Series Investment Grade Bond Fund (b) | | 483,711,910 | 5,407,899,151 |
| Fidelity Series Long-Term Treasury Bond Index Fund (b) | | 172,276,216 | 1,528,090,035 |
| Fidelity Series Real Estate Income Fund (b) | | 11,792,227 | 128,653,194 |
| TOTAL BOND FUNDS | | | |
| (Cost $8,685,679,476) | | | 8,673,396,440 |
|
| Short-Term Funds - 6.1% | | | |
| Fidelity Cash Central Fund, 2.48% (c) | | 85,455,464 | 85,472,556 |
| Fidelity Series Government Money Market Fund 2.50%(b)(d) | | 1,250,842,921 | 1,250,842,921 |
| Fidelity Series Short-Term Credit Fund (b) | | 31,501,543 | 314,070,382 |
| TOTAL SHORT-TERM FUNDS | | | |
| (Cost $1,650,885,037) | | | 1,650,385,859 |
| TOTAL INVESTMENT IN SECURITIES - 100.1% | | | |
| (Cost $24,363,011,380) | | | 27,156,900,953 |
| NET OTHER ASSETS (LIABILITIES) - (0.1)% | | | (15,742,384) |
| NET ASSETS - 100% | | | $27,141,158,569 |
| Futures Contracts | | | | | |
| | Number of contracts | Expiration Date | Notional Amount | Value | Unrealized Appreciation/(Depreciation) |
| Purchased | | | | | |
| Treasury Contracts | | | | | |
| CBOT 2-Year U.S. Treasury Note Contracts (United States) | 146 | June 2019 | $31,111,688 | $131,804 | $131,804 |
| CBOT 5-Year U.S. Treasury Note Contracts (United States) | 356 | June 2019 | 41,234,813 | 461,324 | 461,324 |
| CBOT Long Term U.S. Treasury Bond Contracts (United States) | 113 | June 2019 | 16,911,156 | 593,006 | 593,006 |
| CBOT Long Term U.S. Treasury Bond Contracts (United States) | 247 | June 2019 | 30,682,031 | 570,666 | 570,666 |
| CBOT Ultra Long Term U.S. Treasury Bond Contracts (United States) | 121 | June 2019 | 20,328,000 | 1,011,691 | 1,011,691 |
|
| TOTAL PURCHASED | | | | | 2,768,491 |
|
| Sold | | | | | |
| Equity Index Contracts | | | | | |
| CME E-mini S&P 500 Index Contracts (United States) | 815 | June 2019 | 115,640,350 | (3,500,194) | (3,500,194) |
| ICE E-mini MSCI EAFE Index Contracts (United States) | 251 | June 2019 | 23,423,320 | (495,055) | (495,055) |
| ICE E-mini MSCI Emerging Markets Index Contracts (United States) | 1,467 | June 2019 | 77,560,290 | (1,446,213) | (1,446,213) |
|
| TOTAL SOLD | | | | | (5,441,462) |
|
| TOTAL FUTURES CONTRACTS | | | | | $(2,672,971) |
The notional amount of futures purchased as a percentage of Net Assets is 0.5%
The notional amount of futures sold as a percentage of Net Assets is 0.8%
Legend
(a) Security or a portion of the security was pledged to cover margin requirements for futures contracts. At period end, the value of securities pledged amounted to $17,543,171.
(b) Affiliated Fund
(c) Affiliated fund that is generally available only to investment companies and other accounts managed by Fidelity Investments. The rate quoted is the annualized seven-day yield of the fund at period end. A complete unaudited listing of the fund's holdings as of its most recent quarter end is available upon request. In addition, each Fidelity Central Fund's financial statements , which are not covered by the Fund's Report of Independent Registered Public Accounting Firm, are available on the SEC's website or upon request.
(d) The rate quoted is the annualized seven-day yield of the fund at period end.
Affiliated Central Funds
Information regarding fiscal year to date income earned by the Fund from investments in Fidelity Central Funds is as follows:
| Fund | Income earned |
| Fidelity Cash Central Fund | $674,913 |
| Total | $674,913 |
Amounts in the income column in the above table include any capital gain distributions from underlying funds, which are presented in the corresponding line-item in the Statement of Operations, if applicable.
Affiliated Underlying Funds
Fiscal year to date information regarding the Fund's investments in affiliated Underlying Funds, excluding any Money Market Central Funds, is presented below. Exchanges between classes of the same affiliated Underlying Funds may occur.
| Affiliate | Value, beginning of period | Purchases | Sales Proceeds | Dividend Income | Realized Gain (loss) | Change in Unrealized appreciation (depreciation) | Value, end of period |
| Fidelity Series 100 Index Fund | $366,746,530 | $384 | $382,199,252 | $-- | $139,134,622 | $(123,682,284) | $-- |
| Fidelity Series All-Sector Equity Fund | 705,221,492 | 122,779,714 | 398,890,501 | 95,341,574 | 35,355,124 | (72,744,556) | 391,721,273 |
| Fidelity Series Blue Chip Growth Fund | 728,890,637 | 125,997,516 | 122,296,698 | 94,798,195 | 20,345,549 | 10,060,006 | 762,997,010 |
| Fidelity Series Canada Fund | 169,257,716 | 20,430,960 | 14,054,285 | 3,860,048 | (169,944) | 2,917,378 | 178,381,825 |
| Fidelity Series Commodity Strategy Fund | 582,964,326 | 215,329,466 | 94,508,427 | 37,192,268 | (39,030,764) | (32,010,462) | 632,744,139 |
| Fidelity Series Emerging Markets Debt Fund | 184,835,032 | 17,578,896 | 13,297,136 | 10,826,830 | (591,671) | (8,412,407) | 180,112,714 |
| Fidelity Series Emerging Markets Fund | -- | 193,619,994 | 6,002,485 | 779,593 | (218,816) | 13,175,513 | 200,574,206 |
| Fidelity Series Emerging Markets Opportunities Fund | 1,817,196,161 | 455,025,209 | 129,711,571 | 143,761,838 | (6,715,559) | (262,498,066) | 1,873,296,174 |
| Fidelity Series Floating Rate High Income Fund | 62,801,027 | 5,585,130 | 32,799,807 | 3,248,936 | (1,811,250) | 682,452 | 34,457,552 |
| Fidelity Series Government Money Market Fund 2.50% | 1,735,916,271 | 283,384,543 | 768,457,893 | 29,899,656 | -- | -- | 1,250,842,921 |
| Fidelity Series Growth Company Fund | 1,493,068,097 | 249,824,634 | 247,798,878 | 147,962,802 | 36,755,121 | (45,499,134) | 1,486,349,840 |
| Fidelity Series High Income Fund | 387,878,745 | 37,381,612 | 175,453,212 | 23,296,476 | (7,885,457) | 3,233,078 | 245,154,766 |
| Fidelity Series Inflation-Protected Bond Index Fund | 222,364,297 | 955,848,173 | 48,411,846 | 20,036,104 | (884,655) | 4,280,617 | 1,133,196,586 |
| Fidelity Series International Credit Fund | 15,496,785 | 771,197 | 392,105 | 770,487 | (5,113) | (38,322) | 15,832,442 |
| Fidelity Series International Growth Fund | 1,728,455,734 | 297,536,277 | 225,635,327 | 107,728,474 | 14,673,268 | (100,045,137) | 1,714,984,815 |
| Fidelity Series International Small Cap Fund | 431,342,797 | 78,492,822 | 39,791,734 | 35,810,431 | 603,807 | (67,159,225) | 403,488,467 |
| Fidelity Series International Value Fund | 1,725,207,204 | 233,459,967 | 122,846,009 | 59,122,156 | (4,592,613) | (198,476,867) | 1,632,751,682 |
| Fidelity Series Intrinsic Opportunities Fund | 1,796,627,752 | 218,226,823 | 66,845,937 | 144,219,050 | 888,023 | (164,845,847) | 1,784,050,814 |
| Fidelity Series Investment Grade Bond Fund | 5,978,177,564 | 487,080,822 | 1,125,400,984 | 179,120,748 | (50,112,036) | 118,153,785 | 5,407,899,151 |
| Fidelity Series Large Cap Stock Fund | 1,631,361,660 | 231,147,247 | 235,469,519 | 164,865,727 | 2,967,122 | (55,592,306) | 1,574,414,204 |
| Fidelity Series Large Cap Value Index Fund | 457,041,989 | 39,685,324 | 45,600,410 | 21,112,709 | 975,449 | 3,903,189 | 456,005,541 |
| Fidelity Series Long-Term Treasury Bond Index Fund | 610,405,640 | 1,034,436,610 | 176,134,806 | 36,829,879 | (5,549,247) | 64,931,838 | 1,528,090,035 |
| Fidelity Series Opportunistic Insights Fund | 798,825,062 | 98,131,007 | 102,367,573 | 64,978,014 | 5,100,762 | 3,473,371 | 803,162,629 |
| Fidelity Series Real Estate Equity Fund | 142,057,130 | 1,088,209 | 147,363,842 | 964,911 | 10,969,915 | (6,751,412) | -- |
| Fidelity Series Real Estate Income Fund | 121,846,965 | 14,432,501 | 9,949,956 | 9,137,953 | (237,983) | 2,561,667 | 128,653,194 |
| Fidelity Series Short-Term Credit Fund | 397,592,784 | 24,417,777 | 111,346,492 | 9,092,728 | (1,377,139) | 4,783,452 | 314,070,382 |
| Fidelity Series Small Cap Discovery Fund | 217,412,216 | 35,744,956 | 18,481,343 | 26,699,619 | (931,097) | (19,470,997) | 214,273,735 |
| Fidelity Series Small Cap Opportunities Fund | 663,854,507 | 101,083,585 | 94,380,400 | 73,908,873 | 5,170,382 | (38,976,524) | 636,751,550 |
| Fidelity Series Stock Selector Large Cap Value Fund | 1,244,944,162 | 153,239,446 | 143,898,186 | 102,797,841 | (1,883,983) | (42,314,555) | 1,210,086,884 |
| Fidelity Series Value Discovery Fund | 884,624,024 | 87,907,602 | 88,935,065 | 51,954,222 | (346,484) | (23,709,382) | 859,540,695 |
| | $27,302,414,306 | $5,819,668,403 | $5,188,721,679 | $1,700,118,142 | $150,595,333 | $(1,030,071,137) | $27,053,885,226 |
Amounts in the income column in the above table include any capital gain distributions from underlying funds, which are presented in the corresponding line-item in the Statement of Operations, if applicable.
Investment Valuation
The following is a summary of the inputs used, as of March 31, 2019, involving the Fund's assets and liabilities carried at fair value. The inputs or methodology used for valuing securities may not be an indication of the risk associated with investing in those securities. For more information on valuation inputs, and their aggregation into the levels used below, please refer to the Investment Valuation section in the accompanying Notes to Financial Statements.
| | Valuation Inputs at Reporting Date: |
| Description | Total | Level 1 | Level 2 | Level 3 |
| Investments in Securities: | | | | |
| Other Short-Term Investments | $17,543,171 | $-- | $17,543,171 | $-- |
| Domestic Equity Funds | 10,812,098,314 | 10,812,098,314 | -- | -- |
| International Equity Funds | 6,003,477,169 | 6,003,477,169 | -- | -- |
| Bond Funds | 8,673,396,440 | 8,673,396,440 | -- | -- |
| Short-Term Funds | 1,650,385,859 | 1,650,385,859 | -- | -- |
| Total Investments in Securities: | $27,156,900,953 | $27,139,357,782 | $17,543,171 | $-- |
| Derivative Instruments: | | | | |
| Assets | | | | |
| Futures Contracts | $2,768,491 | $2,768,491 | $-- | $-- |
| Total Assets | $2,768,491 | $2,768,491 | $-- | $-- |
| Liabilities | | | | |
| Futures Contracts | $(5,441,462) | $(5,441,462) | $-- | $-- |
| Total Liabilities | $(5,441,462) | $(5,441,462) | $-- | $-- |
| Total Derivative Instruments: | $(2,672,971) | $(2,672,971) | $-- | $-- |
Value of Derivative Instruments
The following table is a summary of the Fund's value of derivative instruments by primary risk exposure as of March 31, 2019. For additional information on derivative instruments, please refer to the Derivative Instruments section in the accompanying Notes to Financial Statements.
| Primary Risk Exposure / Derivative Type | Value |
| | Asset | Liability |
| Equity Risk | | |
| Futures Contracts(a) | $0 | $(5,441,462) |
| Total Equity Risk | 0 | (5,441,462) |
| Interest Rate Risk | | |
| Futures Contracts | 2,768,491 | 0 |
| Total Interest Rate Risk | 2,768,491 | 0 |
| Total Value of Derivatives | $2,768,491 | $(5,441,462) |
(a) Reflects gross cumulative appreciation (depreciation) on futures contracts as presented in the Schedule of Investments. In the Statement of Assets and Liabilities, the period end daily variation margin is included in receivable or payable for daily variation margin on futures contracts, and the net cumulative appreciation (depreciation) is included in distributable earnings.
See accompanying notes which are an integral part of the financial statements.
Fidelity Freedom® 2025 Fund
Financial Statements
Statement of Assets and Liabilities
| | | March 31, 2019 |
| Assets | | |
Investment in securities, at value — See accompanying schedule:
Unaffiliated issuers (cost $17,542,813) | $17,543,171 | |
| Fidelity Central Funds (cost $85,471,226) | 85,472,556 | |
| Other affiliated issuers (cost $24,259,997,341) | 27,053,885,226 | |
| Total Investment in Securities (cost $24,363,011,380) | | $27,156,900,953 |
| Receivable for investments sold | | 101,399,412 |
| Receivable for fund shares sold | | 71,550,219 |
| Distributions receivable from Fidelity Central Funds | | 169,647 |
| Total assets | | 27,330,020,231 |
| Liabilities | | |
| Payable for investments purchased | $50,497,074 | |
| Payable for fund shares redeemed | 122,462,681 | |
| Accrued management fee | 13,277,604 | |
| Payable for daily variation margin on futures contracts | 2,624,303 | |
| Total liabilities | | 188,861,662 |
| Net Assets | | $27,141,158,569 |
| Net Assets consist of: | | |
| Paid in capital | | $23,634,883,246 |
| Total distributable earnings (loss) | | 3,506,275,323 |
| Net Assets | | $27,141,158,569 |
| Net Asset Value and Maximum Offering Price | | |
| Fidelity Freedom 2025 Fund: | | |
| Net Asset Value, offering price and redemption price per share ($10,953,001,874 ÷ 791,380,619 shares) | | $13.84 |
| Class K: | | |
| Net Asset Value, offering price and redemption price per share ($13,768,297,705 ÷ 996,332,820 shares) | | $13.82 |
| Class K6: | | |
| Net Asset Value, offering price and redemption price per share ($2,419,858,990 ÷ 175,239,764 shares) | | $13.81 |
See accompanying notes which are an integral part of the financial statements.
Statement of Operations
| | | Year ended March 31, 2019 |
| Investment Income | | |
| Dividends: | | |
| Affiliated issuers | | $631,705,564 |
| Interest | | 262,805 |
| Income from Fidelity Central Funds | | 674,913 |
| Total income | | 632,643,282 |
| Expenses | | |
| Management fee | $159,735,207 | |
| Independent trustees' fees and expenses | 127,129 | |
| Total expenses before reductions | 159,862,336 | |
| Expense reductions | (59) | |
| Total expenses after reductions | | 159,862,277 |
| Net investment income (loss) | | 472,781,005 |
| Realized and Unrealized Gain (Loss) | | |
| Net realized gain (loss) on: | | |
| Investment securities: | | |
| Unaffiliated issuers | 23,714 | |
| Fidelity Central Funds | (1,176) | |
| Other affiliated issuers | 150,595,333 | |
| Futures contracts | 20,400,366 | |
| Capital gain distributions from underlying funds: | | |
| Affiliated issuers | 1,068,412,578 | |
| Total net realized gain (loss) | | 1,239,430,815 |
| Change in net unrealized appreciation (depreciation) on: | | |
| Investment securities: | | |
| Unaffiliated issuers | 475 | |
| Fidelity Central Funds | 1,330 | |
| Other affiliated issuers | (1,030,071,137) | |
| Futures contracts | (2,672,971) | |
| Total change in net unrealized appreciation (depreciation) | | (1,032,742,303) |
| Net gain (loss) | | 206,688,512 |
| Net increase (decrease) in net assets resulting from operations | | $679,469,517 |
See accompanying notes which are an integral part of the financial statements.
Statement of Changes in Net Assets
| | Year ended March 31, 2019 | Year ended March 31, 2018 |
| Increase (Decrease) in Net Assets | | |
| Operations | | |
| Net investment income (loss) | $472,781,005 | $338,806,701 |
| Net realized gain (loss) | 1,239,430,815 | 1,044,395,111 |
| Change in net unrealized appreciation (depreciation) | (1,032,742,303) | 390,546,666 |
| Net increase (decrease) in net assets resulting from operations | 679,469,517 | 1,773,748,478 |
| Distributions to shareholders | (1,583,201,037) | – |
| Distributions to shareholders from net investment income | – | (337,178,441) |
| Distributions to shareholders from net realized gain | – | (559,307,494) |
| Total distributions | (1,583,201,037) | (896,485,935) |
| Share transactions - net increase (decrease) | 752,961,440 | 16,650,118,805 |
| Total increase (decrease) in net assets | (150,770,080) | 17,527,381,348 |
| Net Assets | | |
| Beginning of period | 27,291,928,649 | 9,764,547,301 |
| End of period | $27,141,158,569 | $27,291,928,649 |
| Other Information | | |
| Undistributed net investment income end of period | | $21,218,019 |
See accompanying notes which are an integral part of the financial statements.
Financial Highlights
Fidelity Freedom 2025 Fund
| Years ended March 31, | 2019 | 2018 | 2017 | 2016 | 2015 |
| Selected Per–Share Data | | | | | |
| Net asset value, beginning of period | $14.35 | $13.50 | $12.49 | $13.51 | $13.49 |
| Income from Investment Operations | | | | | |
| Net investment income (loss)A | .24 | .18 | .21 | .22 | .24 |
| Net realized and unrealized gain (loss) | .08 | 1.26 | 1.30 | (.54) | .69 |
| Total from investment operations | .32 | 1.44 | 1.51 | (.32) | .93 |
| Distributions from net investment income | (.23) | (.18) | (.21) | (.23) | (.25) |
| Distributions from net realized gain | (.59) | (.41) | (.29) | (.47) | (.66) |
| Total distributions | (.83)B | (.59) | (.50) | (.70) | (.91) |
| Net asset value, end of period | $13.84 | $14.35 | $13.50 | $12.49 | $13.51 |
| Total ReturnC | 2.53% | 10.81% | 12.46% | (2.50)% | 7.23% |
| Ratios to Average Net AssetsD,E | | | | | |
| Expenses before reductions | .65% | .56%F | - %G | - %G | - %G |
| Expenses net of fee waivers, if any | .65% | .56%F | -% | -% | -% |
| Expenses net of all reductions | .65% | .56%F | -% | -% | -% |
| Net investment income (loss) | 1.70% | 1.28% | 1.66% | 1.75% | 1.81% |
| Supplemental Data | | | | | |
| Net assets, end of period (000 omitted) | $10,953,002 | $10,923,217 | $9,764,547 | $8,717,568 | $9,054,681 |
| Portfolio turnover rateD | 19% | 18%H | 19% | 17% | 19% |
A Calculated based on average shares outstanding during the period.
B Total distributions of $.83 per share is comprised of distributions from net investment income of $.234 and distributions from net realized gain of $.591 per share.
C Total returns would have been lower if certain expenses had not been reduced during the applicable periods shown.
D Amounts do not include the activity of the Underlying Funds.
E Expense ratios reflect operating expenses of the class. Expenses before reductions do not reflect amounts reimbursed by the investment adviser or reductions from expense offset arrangements and do not represent the amount paid by the class during periods when reimbursements or reductions occur. Expenses net of fee waivers reflect expenses after reimbursement by the investment adviser but prior to reductions from expense offset arrangements. Expenses net of all reductions represent the net expenses paid by the class but do not include expenses of the underlying funds in which the Fund invests.
F On certain classes, the size and fluctuation of net assets and expense amounts may cause ratios to differ from contractual rates.
G Amount represents less than .005%.
H The portfolio turnover rate does not include the assets acquired in the merger.
See accompanying notes which are an integral part of the financial statements.
Fidelity Freedom 2025 Fund Class K
| Years ended March 31, | 2019 | 2018 A |
| Selected Per–Share Data | | |
| Net asset value, beginning of period | $14.33 | $14.02 |
| Income from Investment Operations | | |
| Net investment income (loss)B | .25 | .23 |
| Net realized and unrealized gain (loss) | .08 | .50 |
| Total from investment operations | .33 | .73 |
| Distributions from net investment income | (.24) | (.18) |
| Distributions from net realized gain | (.59) | (.24) |
| Total distributions | (.84)C | (.42) |
| Net asset value, end of period | $13.82 | $14.33 |
| Total ReturnD,E | 2.61% | 5.18% |
| Ratios to Average Net AssetsF,G | | |
| Expenses before reductions | .57% | .58%H,I |
| Expenses net of fee waivers, if any | .57% | .58%H,I |
| Expenses net of all reductions | .57% | .58%H,I |
| Net investment income (loss) | 1.79% | 2.28%H |
| Supplemental Data | | |
| Net assets, end of period (000 omitted) | $13,768,298 | $15,743,238 |
| Portfolio turnover rateF | 19% | 18%J |
A For the period July 20, 2017 (commencement of sale of shares) to March 31, 2018.
B Calculated based on average shares outstanding during the period.
C Total distributions of $.84 per share is comprised of distributions from net investment income of $.244 and distributions from net realized gain of $.591 per share.
D Total returns for periods of less than one year are not annualized.
E Total returns would have been lower if certain expenses had not been reduced during the applicable periods shown.
F Amounts do not include the activity of the Underlying Funds.
G Expense ratios reflect operating expenses of the class. Expenses before reductions do not reflect amounts reimbursed by the investment adviser or reductions from expense offset arrangements and do not represent the amount paid by the class during periods when reimbursements or reductions occur. Expense ratios before reductions for start-up periods may not be representative of longer-term operating periods. Expenses net of fee waivers reflect expenses after reimbursement by the investment adviser but prior to reductions from expense offset arrangements. Expenses net of all reductions represent the net expenses paid by the class but do not include expenses of the underlying funds in which the Fund invests.
H Annualized
I On certain classes, the size and fluctuation of net assets and expense amounts may cause ratios to differ from contractual rates.
J The portfolio turnover rate does not include the assets acquired in the merger.
See accompanying notes which are an integral part of the financial statements.
Fidelity Freedom 2025 Fund Class K6
| Years ended March 31, | 2019 | 2018 A |
| Selected Per–Share Data | | |
| Net asset value, beginning of period | $14.35 | $13.80 |
| Income from Investment Operations | | |
| Net investment income (loss)B | .26 | .21 |
| Net realized and unrealized gain (loss) | .08 | .76 |
| Total from investment operations | .34 | .97 |
| Distributions from net investment income | (.29) | (.19) |
| Distributions from net realized gain | (.59) | (.24) |
| Total distributions | (.88) | (.42)C |
| Net asset value, end of period | $13.81 | $14.35 |
| Total ReturnD,E | 2.73% | 7.02% |
| Ratios to Average Net AssetsF,G | | |
| Expenses before reductions | .45% | .46%H,I |
| Expenses net of fee waivers, if any | .45% | .46%H,I |
| Expenses net of all reductions | .45% | .46%H,I |
| Net investment income (loss) | 1.90% | 1.78%H |
| Supplemental Data | | |
| Net assets, end of period (000 omitted) | $2,419,859 | $625,475 |
| Portfolio turnover rateF | 19% | 18%J |
A For the period June 7, 2017 (commencement of sale of shares) to March 31, 2018.
B Calculated based on average shares outstanding during the period.
C Total distributions of $.42 per share is comprised of distributions from net investment income of $.186 and distributions from net realized gain of $.235 per share.
D Total returns for periods of less than one year are not annualized.
E Total returns would have been lower if certain expenses had not been reduced during the applicable periods shown.
F Amounts do not include the activity of the Underlying Funds.
G Expense ratios reflect operating expenses of the class. Expenses before reductions do not reflect amounts reimbursed by the investment adviser or reductions from expense offset arrangements and do not represent the amount paid by the class during periods when reimbursements or reductions occur. Expense ratios before reductions for start-up periods may not be representative of longer-term operating periods. Expenses net of fee waivers reflect expenses after reimbursement by the investment adviser but prior to reductions from expense offset arrangements. Expenses net of all reductions represent the net expenses paid by the class but do not include expenses of the underlying funds in which the Fund invests.
H Annualized
I On certain classes, the size and fluctuation of net assets and expense amounts may cause ratios to differ from contractual rates.
J The portfolio turnover rate does not include the assets acquired in the merger.
See accompanying notes which are an integral part of the financial statements.
Fidelity Freedom® 2030 Fund
Investment Summary (Unaudited)
The information in the following tables is based on the direct investments of the Fund.
Top Holdings as of March 31, 2019
| | % of fund's net assets |
| Fidelity Series Investment Grade Bond Fund | 15.4 |
| Fidelity Series Intrinsic Opportunities Fund | 7.9 |
| Fidelity Series Emerging Markets Opportunities Fund | 7.8 |
| Fidelity Series International Growth Fund | 7.3 |
| Fidelity Series International Value Fund | 7.1 |
| Fidelity Series Large Cap Stock Fund | 7.0 |
| Fidelity Series Growth Company Fund | 6.6 |
| Fidelity Series Long-Term Treasury Bond Index Fund | 5.8 |
| Fidelity Series Stock Selector Large Cap Value Fund | 5.3 |
| Fidelity Series Value Discovery Fund | 3.8 |
| | 74.0 |
Asset Allocation (% of fund's net assets)
| Period end |
| | Domestic Equity Funds | 47.6% |
| | International Equity Funds | 25.5% |
| | Bond Funds | 24.7% |
| | Short-Term Funds | 2.2% |
| | Short-Term Investments | 0.1% |
| | Net Other Assets (Liabilities)* | (0.1)% |

* Net Other Assets (Liabilities) are not included in the pie chart
Domestic Equity Funds category includes Fidelity Series Commodity Strategy Fund which invests in commodity-related investments.
Fidelity Freedom® 2030 Fund
Schedule of Investments March 31, 2019
Showing Percentage of Net Assets
| U.S. Treasury Obligations - 0.1% | | | |
| | | Principal Amount | Value |
| U.S. Treasury Bills, yield at date of purchase 2.37% to 2.4% 4/4/19 to 6/27/19 (a) | | | |
| (Cost $25,064,386) | | 25,150,000 | 25,065,500 |
| | | Shares | Value |
|
| Domestic Equity Funds - 47.6% | | | |
| Fidelity Series All-Sector Equity Fund (b) | | 59,075,318 | $568,895,313 |
| Fidelity Series Blue Chip Growth Fund (b) | | 75,979,177 | 1,120,692,859 |
| Fidelity Series Commodity Strategy Fund (b) | | 154,983,759 | 739,272,528 |
| Fidelity Series Growth Company Fund (b) | | 124,825,116 | 2,110,792,706 |
| Fidelity Series Intrinsic Opportunities Fund (b) | | 154,065,431 | 2,534,376,344 |
| Fidelity Series Large Cap Stock Fund (b) | | 153,410,559 | 2,247,464,693 |
| Fidelity Series Large Cap Value Index Fund (b) | | 51,324,909 | 636,942,117 |
| Fidelity Series Opportunistic Insights Fund (b) | | 65,317,228 | 1,141,745,148 |
| Fidelity Series Small Cap Discovery Fund (b) | | 27,701,381 | 308,039,361 |
| Fidelity Series Small Cap Opportunities Fund (b) | | 69,788,923 | 939,358,907 |
| Fidelity Series Stock Selector Large Cap Value Fund (b) | | 145,366,088 | 1,715,319,843 |
| Fidelity Series Value Discovery Fund (b) | | 97,575,673 | 1,218,720,153 |
| TOTAL DOMESTIC EQUITY FUNDS | | | |
| (Cost $12,471,828,644) | | | 15,281,619,972 |
|
| International Equity Funds - 25.5% | | | |
| Fidelity Series Canada Fund (b) | | 23,912,851 | 246,541,489 |
| Fidelity Series Emerging Markets Fund (b) | | 27,489,736 | 269,124,514 |
| Fidelity Series Emerging Markets Opportunities Fund (b) | | 135,584,307 | 2,512,377,212 |
| Fidelity Series International Growth Fund (b) | | 153,848,198 | 2,336,954,122 |
| Fidelity Series International Small Cap Fund (b) | | 35,269,316 | 547,732,479 |
| Fidelity Series International Value Fund (b) | | 243,891,973 | 2,268,195,348 |
| TOTAL INTERNATIONAL EQUITY FUNDS | | | |
| (Cost $7,124,365,824) | | | 8,180,925,164 |
|
| Bond Funds - 24.7% | | | |
| Fidelity Series Emerging Markets Debt Fund (b) | | 21,633,796 | 207,468,099 |
| Fidelity Series Floating Rate High Income Fund (b) | | 4,325,420 | 40,096,639 |
| Fidelity Series High Income Fund (b) | | 29,935,036 | 281,389,335 |
| Fidelity Series Inflation-Protected Bond Index Fund (b) | | 45,130,114 | 441,372,517 |
| Fidelity Series International Credit Fund (b) | | 1,567,441 | 15,501,991 |
| Fidelity Series Investment Grade Bond Fund (b) | | 440,935,335 | 4,929,657,050 |
| Fidelity Series Long-Term Treasury Bond Index Fund (b) | | 208,137,049 | 1,846,175,629 |
| Fidelity Series Real Estate Income Fund (b) | | 13,641,823 | 148,832,289 |
| TOTAL BOND FUNDS | | | |
| (Cost $7,879,324,762) | | | 7,910,493,549 |
|
| Short-Term Funds - 2.2% | | | |
| Fidelity Cash Central Fund, 2.48% (c) | | 164,393,065 | 164,425,943 |
| Fidelity Series Government Money Market Fund 2.50% (b)(d) | | 422,775,907 | 422,775,907 |
| Fidelity Series Short-Term Credit Fund (b) | | 10,606,326 | 105,745,071 |
| TOTAL SHORT-TERM FUNDS | | | |
| (Cost $692,427,704) | | | 692,946,921 |
| TOTAL INVESTMENT IN SECURITIES - 100.1% | | | |
| (Cost $28,193,011,320) | | | 32,091,051,106 |
| NET OTHER ASSETS (LIABILITIES) - (0.1)% | | | (20,283,380) |
| NET ASSETS - 100% | | | $32,070,767,726 |
| Futures Contracts | | | | | |
| | Number of contracts | Expiration Date | Notional Amount | Value | Unrealized Appreciation/(Depreciation) |
| Purchased | | | | | |
| Treasury Contracts | | | | | |
| CBOT 2-Year U.S. Treasury Note Contracts (United States) | 177 | June 2019 | $37,717,594 | $162,852 | $162,852 |
| CBOT 5-Year U.S. Treasury Note Contracts (United States) | 593 | June 2019 | 68,686,078 | 734,574 | 734,574 |
| CBOT Long Term U.S. Treasury Bond Contracts (United States) | 99 | June 2019 | 14,815,969 | 519,536 | 519,536 |
| CBOT Long Term U.S. Treasury Bond Contracts (United States) | 485 | June 2019 | 60,246,094 | 1,044,547 | 1,044,547 |
| CBOT Ultra Long Term U.S. Treasury Bond Contracts (United States) | 52 | June 2019 | 8,736,000 | 434,776 | 434,776 |
|
| TOTAL PURCHASED | | | | | 2,896,285 |
|
| Sold | | | | | |
| Equity Index Contracts | | | | | |
| CME E-mini S&P 500 Index Contracts (United States) | 1,053 | June 2019 | 149,410,170 | (4,522,336) | (4,522,336) |
| ICE E-mini MSCI Emerging Markets Index Contracts (United States) | 2,099 | June 2019 | 110,974,130 | (2,069,256) | (2,069,256) |
|
| TOTAL SOLD | | | | | (6,591,592) |
|
| TOTAL FUTURES CONTRACTS | | | | | $(3,695,307) |
The notional amount of futures purchased as a percentage of Net Assets is 0.6%
The notional amount of futures sold as a percentage of Net Assets is 0.8%
Legend
(a) Security or a portion of the security was pledged to cover margin requirements for futures contracts. At period end, the value of securities pledged amounted to $25,065,500.
(b) Affiliated Fund
(c) Affiliated fund that is generally available only to investment companies and other accounts managed by Fidelity Investments. The rate quoted is the annualized seven-day yield of the fund at period end. A complete unaudited listing of the fund's holdings as of its most recent quarter end is available upon request. In addition, each Fidelity Central Fund's financial statements, which are not covered by the Fund's Report of Independent Registered Public Accounting Firm, are available on the SEC's website or upon request.
(d) The rate quoted is the annualized seven-day yield of the fund at period end.
Affiliated Central Funds
Information regarding fiscal year to date income earned by the Fund from investments in Fidelity Central Funds is as follows:
| Fund | Income earned |
| Fidelity Cash Central Fund | $946,690 |
| Total | $946,690 |
Amounts in the income column in the above table include any capital gain distributions from underlying funds, which are presented in the corresponding line-item in the Statement of Operations, if applicable.
Affiliated Underlying Funds
Fiscal year to date information regarding the Fund's investments in affiliated Underlying Funds, excluding any Money Market Central Funds, is presented below. Exchanges between classes of the same affiliated Underlying Funds may occur.
| Affiliate | Value, beginning of period | Purchases | Sales Proceeds | Dividend Income | Realized Gain (loss) | Change in Unrealized appreciation (depreciation) | Value, end of period |
| Fidelity Series 100 Index Fund | $523,652,000 | $24 | $549,343,064 | $-- | $200,853,736 | $(175,162,696) | $-- |
| Fidelity Series All-Sector Equity Fund | 1,006,674,195 | 173,674,731 | 556,464,017 | 137,682,503 | 50,059,104 | (105,048,700) | 568,895,313 |
| Fidelity Series Blue Chip Growth Fund | 1,040,466,499 | 185,969,455 | 147,010,631 | 138,602,727 | 19,829,854 | 21,437,682 | 1,120,692,859 |
| Fidelity Series Canada Fund | 235,908,154 | 32,825,215 | 26,475,030 | 5,347,465 | 77,431 | 4,205,719 | 246,541,489 |
| Fidelity Series Commodity Strategy Fund | 678,337,536 | 256,559,010 | 111,612,507 | 43,840,891 | (42,797,560) | (41,213,951) | 739,272,528 |
| Fidelity Series Emerging Markets Debt Fund | 210,639,143 | 21,043,631 | 13,960,185 | 12,401,535 | (560,886) | (9,693,604) | 207,468,099 |
| Fidelity Series Emerging Markets Fund | -- | 256,030,287 | 7,150,245 | 1,040,797 | (124,712) | 20,369,184 | 269,124,514 |
| Fidelity Series Emerging Markets Opportunities Fund | 2,446,367,661 | 578,556,917 | 147,902,866 | 191,844,696 | (7,722,125) | (356,922,375) | 2,512,377,212 |
| Fidelity Series Floating Rate High Income Fund | 71,095,281 | 6,702,631 | 36,309,973 | 3,737,488 | (2,079,712) | 688,412 | 40,096,639 |
| Fidelity Series Government Money Market Fund 2.50% | 457,362,031 | 339,998,625 | 374,584,749 | 10,850,233 | -- | -- | 422,775,907 |
| Fidelity Series Growth Company Fund | 2,122,560,480 | 304,763,312 | 300,501,287 | 208,468,945 | 40,558,614 | (56,588,413) | 2,110,792,706 |
| Fidelity Series High Income Fund | 444,355,054 | 45,461,262 | 203,011,465 | 27,162,455 | (9,471,826) | 4,056,310 | 281,389,335 |
| Fidelity Series Inflation-Protected Bond Index Fund | 247,162,137 | 307,662,539 | 116,771,355 | 4,914,863 | (2,320,585) | 5,639,781 | 441,372,517 |
| Fidelity Series International Credit Fund | 15,086,864 | 753,400 | 296,613 | 753,340 | (4,075) | (37,585) | 15,501,991 |
| Fidelity Series International Growth Fund | 2,382,946,699 | 377,270,552 | 303,282,478 | 149,130,566 | 12,245,810 | (132,226,461) | 2,336,954,122 |
| Fidelity Series International Small Cap Fund | 594,583,372 | 96,199,579 | 49,295,260 | 50,185,425 | 293,722 | (94,048,934) | 547,732,479 |
| Fidelity Series International Value Fund | 2,404,694,160 | 307,015,432 | 160,125,012 | 81,694,748 | (6,540,146) | (276,849,086) | 2,268,195,348 |
| Fidelity Series Intrinsic Opportunities Fund | 2,568,837,729 | 323,315,228 | 122,410,751 | 206,423,985 | (2,905,291) | (232,460,571) | 2,534,376,344 |
| Fidelity Series Investment Grade Bond Fund | 4,977,920,975 | 698,565,299 | 809,702,786 | 156,223,641 | (25,149,724) | 88,023,286 | 4,929,657,050 |
| Fidelity Series Large Cap Stock Fund | 2,275,914,375 | 343,227,342 | 292,843,033 | 237,026,565 | 775,940 | (79,609,931) | 2,247,464,693 |
| Fidelity Series Large Cap Value Index Fund | 652,413,502 | 60,041,225 | 82,149,787 | 30,797,381 | 1,595,243 | 5,041,934 | 636,942,117 |
| Fidelity Series Long-Term Treasury Bond Index Fund | 706,504,608 | 1,319,556,474 | 248,540,772 | 44,723,758 | (8,264,531) | 76,919,850 | 1,846,175,629 |
| Fidelity Series Opportunistic Insights Fund | 1,140,294,140 | 147,263,768 | 156,169,535 | 95,173,355 | 5,512,536 | 4,844,239 | 1,141,745,148 |
| Fidelity Series Real Estate Equity Fund | 205,077,929 | 680,015 | 212,531,811 | 485,076 | 14,711,673 | (7,937,806) | -- |
| Fidelity Series Real Estate Income Fund | 139,377,400 | 17,273,189 | 10,516,328 | 10,503,618 | (148,627) | 2,846,655 | 148,832,289 |
| Fidelity Series Short-Term Credit Fund | 88,680,442 | 50,143,025 | 34,533,921 | 2,779,133 | (56,427) | 1,511,952 | 105,745,071 |
| Fidelity Series Small Cap Discovery Fund | 310,348,477 | 52,894,594 | 26,263,038 | 38,137,095 | (1,284,609) | (27,656,063) | 308,039,361 |
| Fidelity Series Small Cap Opportunities Fund | 947,696,222 | 150,980,337 | 107,531,069 | 108,274,924 | 4,066,262 | (55,852,845) | 939,358,907 |
| Fidelity Series Stock Selector Large Cap Value Fund | 1,777,139,590 | 226,893,729 | 224,518,079 | 147,152,369 | (5,317,132) | (58,878,265) | 1,715,319,843 |
| Fidelity Series Value Discovery Fund | 1,262,780,275 | 131,045,716 | 139,927,639 | 74,703,854 | (1,904,793) | (33,273,406) | 1,218,720,153 |
| | $31,934,876,930 | $6,812,366,543 | $5,571,735,286 | $2,220,063,431 | $233,927,164 | $(1,507,875,688) | $31,901,559,663 |
Amounts in the income column in the above table include any capital gain distributions from underlying funds, which are presented in the corresponding line-item in the Statement of Operations, if applicable.
Investment Valuation
The following is a summary of the inputs used, as of March 31, 2019, involving the Fund's assets and liabilities carried at fair value. The inputs or methodology used for valuing securities may not be an indication of the risk associated with investing in those securities. For more information on valuation inputs, and their aggregation into the levels used below, please refer to the Investment Valuation section in the accompanying Notes to Financial Statements.
| | Valuation Inputs at Reporting Date: |
| Description | Total | Level 1 | Level 2 | Level 3 |
| Investments in Securities: | | | | |
| Other Short-Term Investments | $25,065,500 | $-- | $25,065,500 | $-- |
| Domestic Equity Funds | 15,281,619,972 | 15,281,619,972 | -- | -- |
| International Equity Funds | 8,180,925,164 | 8,180,925,164 | -- | -- |
| Bond Funds | 7,910,493,549 | 7,910,493,549 | -- | -- |
| Short-Term Funds | 692,946,921 | 692,946,921 | -- | -- |
| Total Investments in Securities: | $32,091,051,106 | $32,065,985,606 | $25,065,500 | $-- |
| Derivative Instruments: | | | | |
| Assets | | | | |
| Futures Contracts | $2,896,285 | $2,896,285 | $-- | $-- |
| Total Assets | $2,896,285 | $2,896,285 | $-- | $-- |
| Liabilities | | | | |
| Futures Contracts | $(6,591,592) | $(6,591,592) | $-- | $-- |
| Total Liabilities | $(6,591,592) | $(6,591,592) | $-- | $-- |
| Total Derivative Instruments: | $(3,695,307) | $(3,695,307) | $-- | $-- |
Value of Derivative Instruments
The following table is a summary of the Fund's value of derivative instruments by primary risk exposure as of March 31, 2019. For additional information on derivative instruments, please refer to the Derivative Instruments section in the accompanying Notes to Financial Statements.
| Primary Risk Exposure / Derivative Type | Value |
| | Asset | Liability |
| Equity Risk | | |
| Futures Contracts(a) | $0 | $(6,591,592) |
| Total Equity Risk | 0 | (6,591,592) |
| Interest Rate Risk | | |
| Futures Contracts | 2,896,285 | 0 |
| Total Interest Rate Risk | 2,896,285 | 0 |
| Total Value of Derivatives | $2,896,285 | $(6,591,592) |
(a) Reflects gross cumulative appreciation (depreciation) on futures contracts as presented in the Schedule of Investments. In the Statement of Assets and Liabilities, the period end daily variation margin is included in receivable or payable for daily variation margin on futures contracts, and the net cumulative appreciation (depreciation) is included in distributable earnings.
See accompanying notes which are an integral part of the financial statements.
Fidelity Freedom® 2030 Fund
Financial Statements
Statement of Assets and Liabilities
| | | March 31, 2019 |
| Assets | | |
Investment in securities, at value — See accompanying schedule:
Unaffiliated issuers (cost $25,064,386) | $25,065,500 | |
| Fidelity Central Funds (cost $164,424,838) | 164,425,943 | |
| Other affiliated issuers (cost $28,003,522,096) | 31,901,559,663 | |
| Total Investment in Securities (cost $28,193,011,320) | | $32,091,051,106 |
| Receivable for investments sold | | 348,494,198 |
| Receivable for fund shares sold | | 79,107,725 |
| Distributions receivable from Fidelity Central Funds | | 326,494 |
| Other receivables | | 154,257 |
| Total assets | | 32,519,133,780 |
| Liabilities | | |
| Payable for investments purchased | $314,944,940 | |
| Payable for fund shares redeemed | 112,637,721 | |
| Accrued management fee | 16,677,253 | |
| Payable for daily variation margin on futures contracts | 3,951,878 | |
| Other payables and accrued expenses | 154,262 | |
| Total liabilities | | 448,366,054 |
| Net Assets | | $32,070,767,726 |
| Net Assets consist of: | | |
| Paid in capital | | $27,189,734,456 |
| Total distributable earnings (loss) | | 4,881,033,270 |
| Net Assets | | $32,070,767,726 |
| Net Asset Value and Maximum Offering Price | | |
| Fidelity Freedom 2030 Fund: | | |
| Net Asset Value, offering price and redemption price per share ($12,905,054,991 ÷ 750,210,861 shares) | | $17.20 |
| Class K: | | |
| Net Asset Value, offering price and redemption price per share ($16,527,856,316 ÷ 961,893,453 shares) | | $17.18 |
| Class K6: | | |
| Net Asset Value, offering price and redemption price per share ($2,637,856,419 ÷ 153,670,246 shares) | | $17.17 |
See accompanying notes which are an integral part of the financial statements.
Statement of Operations
| | | Year ended March 31, 2019 |
| Investment Income | | |
| Dividends: | | |
| Affiliated issuers | | $726,573,402 |
| Interest | | 352,903 |
| Income from Fidelity Central Funds | | 946,690 |
| Total income | | 727,872,995 |
| Expenses | | |
| Management fee | $199,642,089 | |
| Independent trustees' fees and expenses | 149,419 | |
| Total expenses before reductions | 199,791,508 | |
| Expense reductions | (55) | |
| Total expenses after reductions | | 199,791,453 |
| Net investment income (loss) | | 528,081,542 |
| Realized and Unrealized Gain (Loss) | | |
| Net realized gain (loss) on: | | |
| Investment securities: | | |
| Unaffiliated issuers | 36,051 | |
| Fidelity Central Funds | (495) | |
| Other affiliated issuers | 233,927,164 | |
| Futures contracts | 2,911,912 | |
| Capital gain distributions from underlying funds: | | |
| Affiliated issuers | 1,493,490,029 | |
| Total net realized gain (loss) | | 1,730,364,661 |
| Change in net unrealized appreciation (depreciation) on: | | |
| Investment securities: | | |
| Unaffiliated issuers | 1,251 | |
| Fidelity Central Funds | 1,105 | |
| Other affiliated issuers | (1,507,875,688) | |
| Futures contracts | (3,695,307) | |
| Total change in net unrealized appreciation (depreciation) | | (1,511,568,639) |
| Net gain (loss) | | 218,796,022 |
| Net increase (decrease) in net assets resulting from operations | | $746,877,564 |
See accompanying notes which are an integral part of the financial statements.
Statement of Changes in Net Assets
| | Year ended March 31, 2019 | Year ended March 31, 2018 |
| Increase (Decrease) in Net Assets | | |
| Operations | | |
| Net investment income (loss) | $528,081,542 | $381,629,218 |
| Net realized gain (loss) | 1,730,364,661 | 1,448,536,874 |
| Change in net unrealized appreciation (depreciation) | (1,511,568,639) | 643,449,189 |
| Net increase (decrease) in net assets resulting from operations | 746,877,564 | 2,473,615,281 |
| Distributions to shareholders | (2,065,119,501) | – |
| Distributions to shareholders from net investment income | – | (396,775,824) |
| Distributions to shareholders from net realized gain | – | (769,505,029) |
| Total distributions | (2,065,119,501) | (1,166,280,853) |
| Share transactions - net increase (decrease) | 1,467,380,800 | 19,308,625,938 |
| Total increase (decrease) in net assets | 149,138,863 | 20,615,960,366 |
| Net Assets | | |
| Beginning of period | 31,921,628,863 | 11,305,668,497 |
| End of period | $32,070,767,726 | $31,921,628,863 |
| Other Information | | |
| Distributions in excess of net investment income end of period | | $(146,564) |
See accompanying notes which are an integral part of the financial statements.
Financial Highlights
Fidelity Freedom 2030 Fund
| Years ended March 31, | 2019 | 2018 | 2017 | 2016 | 2015 |
| Selected Per–Share Data | | | | | |
| Net asset value, beginning of period | $18.00 | $16.72 | $15.20 | $16.62 | $16.47 |
| Income from Investment Operations | | | | | |
| Net investment income (loss)A | .28 | .21 | .25 | .25 | .27 |
| Net realized and unrealized gain (loss) | .07 | 1.90 | 1.90 | (.75) | .95 |
| Total from investment operations | .35 | 2.11 | 2.15 | (.50) | 1.22 |
| Distributions from net investment income | (.28) | (.22) | (.25) | (.26) | (.28) |
| Distributions from net realized gain | (.87) | (.61) | (.38) | (.67) | (.79) |
| Total distributions | (1.15) | (.83) | (.63) | (.92)B | (1.07) |
| Net asset value, end of period | $17.20 | $18.00 | $16.72 | $15.20 | $16.62 |
| Total ReturnC | 2.32% | 12.78% | 14.58% | (3.17)% | 7.76% |
| Ratios to Average Net AssetsD,E | | | | | |
| Expenses before reductions | .69%F | .59% | - %G | - %G | - %G |
| Expenses net of fee waivers, if any | .69%F | .59% | -% | -% | -% |
| Expenses net of all reductions | .69%F | .59% | -% | -% | -% |
| Net investment income (loss) | 1.61% | 1.20% | 1.57% | 1.59% | 1.68% |
| Supplemental Data | | | | | |
| Net assets, end of period (000 omitted) | $12,905,055 | $12,684,794 | $11,305,668 | $10,150,137 | $10,883,658 |
| Portfolio turnover rateD | 18% | 18%H | 17% | 16% | 17% |
A Calculated based on average shares outstanding during the period.
B Total distributions of $.92 per share is comprised of distributions from net investment income of $.257 and distributions from net realized gain of $.665 per share.
C Total returns would have been lower if certain expenses had not been reduced during the applicable periods shown.
D Amounts do not include the activity of the Underlying Funds.
E Expense ratios reflect operating expenses of the class. Expenses before reductions do not reflect amounts reimbursed by the investment adviser or reductions from expense offset arrangements and do not represent the amount paid by the class during periods when reimbursements or reductions occur. Expenses net of fee waivers reflect expenses after reimbursement by the investment adviser but prior to reductions from expense offset arrangements. Expenses net of all reductions represent the net expenses paid by the class but do not include expenses of the underlying funds in which the Fund invests.
F On certain classes, the size and fluctuation of net assets and expense amounts may cause ratios to differ from contractual rates.
G Amount represents less than .005%.
H The portfolio turnover rate does not include the assets acquired in the merger.
See accompanying notes which are an integral part of the financial statements.
Fidelity Freedom 2030 Fund Class K
| Years ended March 31, | 2019 | 2018 A |
| Selected Per–Share Data | | |
| Net asset value, beginning of period | $17.98 | $17.47 |
| Income from Investment Operations | | |
| Net investment income (loss)B | .30 | .28 |
| Net realized and unrealized gain (loss) | .06 | .81 |
| Total from investment operations | .36 | 1.09 |
| Distributions from net investment income | (.29) | (.24) |
| Distributions from net realized gain | (.87) | (.35) |
| Total distributions | (1.16) | (.58)C |
| Net asset value, end of period | $17.18 | $17.98 |
| Total ReturnD,E | 2.40% | 6.24% |
| Ratios to Average Net AssetsF,G | | |
| Expenses before reductions | .60% | .62%H,I |
| Expenses net of fee waivers, if any | .60% | .62%H,I |
| Expenses net of all reductions | .60% | .62%H,I |
| Net investment income (loss) | 1.70% | 2.23%H |
| Supplemental Data | | |
| Net assets, end of period (000 omitted) | $16,527,856 | $18,414,961 |
| Portfolio turnover rateF | 18% | 18%J |
A For the period July 20, 2017 (commencement of sale of shares) to March 31, 2018.
B Calculated based on average shares outstanding during the period.
C Total distributions of $.58 per share is comprised of distributions from net investment income of $.237 and distributions from net realized gain of $.345 per share.
D Total returns for periods of less than one year are not annualized.
E Total returns would have been lower if certain expenses had not been reduced during the applicable periods shown.
F Amounts do not include the activity of the Underlying Funds.
G Expense ratios reflect operating expenses of the class. Expenses before reductions do not reflect amounts reimbursed by the investment adviser or reductions from expense offset arrangements and do not represent the amount paid by the class during periods when reimbursements or reductions occur. Expense ratios before reductions for start-up periods may not be representative of longer-term operating periods. Expenses net of fee waivers reflect expenses after reimbursement by the investment adviser but prior to reductions from expense offset arrangements. Expenses net of all reductions represent the net expenses paid by the class but do not include expenses of the underlying funds in which the Fund invests.
H Annualized
I On certain classes, the size and fluctuation of net assets and expense amounts may cause ratios to differ from contractual rates.
J The portfolio turnover rate does not include the assets acquired in the merger.
See accompanying notes which are an integral part of the financial statements.
Fidelity Freedom 2030 Fund Class K6
| Years ended March 31, | 2019 | 2018 A |
| Selected Per–Share Data | | |
| Net asset value, beginning of period | $18.00 | $17.15 |
| Income from Investment Operations | | |
| Net investment income (loss)B | .31 | .26 |
| Net realized and unrealized gain (loss) | .08 | 1.18 |
| Total from investment operations | .39 | 1.44 |
| Distributions from net investment income | (.33) | (.24) |
| Distributions from net realized gain | (.89) | (.35) |
| Total distributions | (1.22) | (.59) |
| Net asset value, end of period | $17.17 | $18.00 |
| Total ReturnC,D | 2.57% | 8.35% |
| Ratios to Average Net AssetsE,F | | |
| Expenses before reductions | .47% | .48%G,H |
| Expenses net of fee waivers, if any | .47% | .48%G,H |
| Expenses net of all reductions | .47% | .48%G,H |
| Net investment income (loss) | 1.83% | 1.76%G |
| Supplemental Data | | |
| Net assets, end of period (000 omitted) | $2,637,856 | $821,874 |
| Portfolio turnover rateE | 18% | 18%I |
A For the period June 7, 2017 (commencement of sale of shares) to March 31, 2018.
B Calculated based on average shares outstanding during the period.
C Total returns for periods of less than one year are not annualized.
D Total returns would have been lower if certain expenses had not been reduced during the applicable periods shown.
E Amounts do not include the activity of the Underlying Funds.
F Expense ratios reflect operating expenses of the class. Expenses before reductions do not reflect amounts reimbursed by the investment adviser or reductions from expense offset arrangements and do not represent the amount paid by the class during periods when reimbursements or reductions occur. Expense ratios before reductions for start-up periods may not be representative of longer-term operating periods. Expenses net of fee waivers reflect expenses after reimbursement by the investment adviser but prior to reductions from expense offset arrangements. Expenses net of all reductions represent the net expenses paid by the class but do not include expenses of the underlying funds in which the Fund invests.
G Annualized
H On certain classes, the size and fluctuation of net assets and expense amounts may cause ratios to differ from contractual rates.
I The portfolio turnover rate does not include the assets acquired in the merger.
See accompanying notes which are an integral part of the financial statements.
Fidelity Freedom® 2035 Fund
Investment Summary (Unaudited)
The information in the following tables is based on the direct investments of the Fund.
Top Holdings as of March 31, 2019
| | % of fund's net assets |
| Fidelity Series Intrinsic Opportunities Fund | 9.7 |
| Fidelity Series Emerging Markets Opportunities Fund | 8.8 |
| Fidelity Series International Growth Fund | 8.7 |
| Fidelity Series Large Cap Stock Fund | 8.5 |
| Fidelity Series International Value Fund | 8.3 |
| Fidelity Series Growth Company Fund | 8.0 |
| Fidelity Series Stock Selector Large Cap Value Fund | 6.5 |
| Fidelity Series Long-Term Treasury Bond Index Fund | 5.8 |
| Fidelity Series Value Discovery Fund | 4.6 |
| Fidelity Series Opportunistic Insights Fund | 4.4 |
| | 73.3 |
Asset Allocation (% of fund's net assets)
| Period end |
| | Domestic Equity Funds | 57.4% |
| | International Equity Funds | 29.7% |
| | Bond Funds | 10.8% |
| | Short-Term Funds | 2.1% |
| | Short-Term Investments | 0.1% |
| | Net Other Assets (Liabilities)* | (0.1)% |

* Net Other Assets (Liabilities) are not included in the pie chart
Domestic Equity Funds category includes Fidelity Series Commodity Strategy Fund which invests in commodity-related investments.
Fidelity Freedom® 2035 Fund
Schedule of Investments March 31, 2019
Showing Percentage of Net Assets
| U.S. Treasury Obligations - 0.1% | | | |
| | | Principal Amount | Value |
| U.S. Treasury Bills, yield at date of purchase 2.39% to 2.43% 4/4/19 to 6/20/19 (a) | | | |
| (Cost $13,122,268) | | 13,150,000 | 13,122,693 |
| | | Shares | Value |
|
| Domestic Equity Funds - 57.4% | | | |
| Fidelity Series All-Sector Equity Fund(b) | | 50,439,890 | $485,736,145 |
| Fidelity Series Blue Chip Growth Fund (b) | | 62,525,008 | 922,243,872 |
| Fidelity Series Commodity Strategy Fund (b) | | 106,675,660 | 508,842,899 |
| Fidelity Series Growth Company Fund (b) | | 104,627,126 | 1,769,244,706 |
| Fidelity Series Intrinsic Opportunities Fund (b) | | 130,121,337 | 2,140,495,992 |
| Fidelity Series Large Cap Stock Fund (b) | | 128,937,940 | 1,888,940,826 |
| Fidelity Series Large Cap Value Index Fund (b) | | 43,214,774 | 536,295,348 |
| Fidelity Series Opportunistic Insights Fund (b) | | 54,932,067 | 960,212,537 |
| Fidelity Series Small Cap Discovery Fund (b) | | 22,485,240 | 250,035,864 |
| Fidelity Series Small Cap Opportunities Fund (b) | | 57,144,741 | 769,168,220 |
| Fidelity Series Stock Selector Large Cap Value Fund (b) | | 122,201,451 | 1,441,977,127 |
| Fidelity Series Value Discovery Fund (b) | | 81,763,403 | 1,021,224,899 |
| TOTAL DOMESTIC EQUITY FUNDS | | | |
| (Cost $10,657,572,700) | | | 12,694,418,435 |
|
| International Equity Funds - 29.7% | | | |
| Fidelity Series Canada Fund (b) | | 19,460,869 | 200,641,560 |
| Fidelity Series Emerging Markets Fund (b) | | 21,326,052 | 208,782,053 |
| Fidelity Series Emerging Markets Opportunities Fund (b) | | 105,174,467 | 1,948,882,881 |
| Fidelity Series International Growth Fund (b) | | 126,804,726 | 1,926,163,794 |
| Fidelity Series International Small Cap Fund (b) | | 28,915,982 | 449,065,197 |
| Fidelity Series International Value Fund (b) | | 198,285,785 | 1,844,057,802 |
| TOTAL INTERNATIONAL EQUITY FUNDS | | | |
| (Cost $5,844,457,565) | | | 6,577,593,287 |
|
| Bond Funds - 10.8% | | | |
| Fidelity Series Emerging Markets Debt Fund (b) | | 14,633,515 | 140,335,409 |
| Fidelity Series Floating Rate High Income Fund (b) | | 2,968,903 | 27,521,732 |
| Fidelity Series High Income Fund (b) | | 19,983,581 | 187,845,665 |
| Fidelity Series Inflation-Protected Bond Index Fund (b) | | 6,584,384 | 64,395,273 |
| Fidelity Series International Credit Fund (b) | | 1,043,827 | 10,323,448 |
| Fidelity Series Investment Grade Bond Fund (b) | | 53,261,254 | 595,460,824 |
| Fidelity Series Long-Term Treasury Bond Index Fund (b) | | 143,490,382 | 1,272,759,684 |
| Fidelity Series Real Estate Income Fund (b) | | 9,256,028 | 100,983,265 |
| TOTAL BOND FUNDS | | | |
| (Cost $2,359,283,282) | | | 2,399,625,300 |
|
| Short-Term Funds - 2.1% | | | |
| Fidelity Cash Central Fund, 2.48% (c) | | 91,714,490 | 91,732,832 |
| Fidelity Series Government Money Market Fund 2.50%(b)(d) | | 291,474,846 | 291,474,846 |
| Fidelity Series Short-Term Credit Fund (b) | | 7,312,183 | 72,902,460 |
| TOTAL SHORT-TERM FUNDS | | | |
| (Cost $455,783,487) | | | 456,110,138 |
| TOTAL INVESTMENT IN SECURITIES - 100.1% | | | |
| (Cost $19,330,219,302) | | | 22,140,869,853 |
| NET OTHER ASSETS (LIABILITIES) - (0.1)% | | | (13,959,097) |
| NET ASSETS - 100% | | | $22,126,910,756 |
| Futures Contracts | | | | | |
| | Number of contracts | Expiration Date | Notional Amount | Value | Unrealized Appreciation/(Depreciation) |
| Purchased | | | | | |
| Treasury Contracts | | | | | |
| CBOT 2-Year U.S. Treasury Note Contracts (United States) | 117 | June 2019 | $24,931,969 | $106,884 | $106,884 |
| CBOT 5-Year U.S. Treasury Note Contracts (United States) | 308 | June 2019 | 35,675,063 | 382,061 | 382,061 |
| CBOT Long Term U.S. Treasury Bond Contracts (United States) | 110 | June 2019 | 16,462,188 | 577,261 | 577,261 |
| CBOT Long Term U.S. Treasury Bond Contracts (United States) | 196 | June 2019 | 24,346,875 | 436,196 | 436,196 |
| CBOT Ultra Long Term U.S. Treasury Bond Contracts (United States) | 104 | June 2019 | 17,472,000 | 869,553 | 869,553 |
|
| TOTAL PURCHASED | | | | | 2,371,955 |
|
| Sold | | | | | |
| Equity Index Contracts | | | | | |
| CME E-mini S&P 500 Index Contracts (United States) | 859 | June 2019 | 121,883,510 | (3,689,161) | (3,689,161) |
| ICE E-mini MSCI Emerging Markets Index Contracts (United States) | 1,315 | June 2019 | 69,524,050 | (1,296,369) | (1,296,369) |
|
| TOTAL SOLD | | | | | (4,985,530) |
|
| TOTAL FUTURES CONTRACTS | | | | | $(2,613,575) |
The notional amount of futures purchased as a percentage of Net Assets is 0.5%
The notional amount of futures sold as a percentage of Net Assets is 0.9%
Legend
(a) Security or a portion of the security was pledged to cover margin requirements for futures contracts. At period end, the value of securities pledged amounted to $13,122,693.
(b) Affiliated Fund
(c) Affiliated fund that is generally available only to investment companies and other accounts managed by Fidelity Investments. The rate quoted is the annualized seven-day yield of the fund at period end. A complete unaudited listing of the fund's holdings as of its most recent quarter end is available upon request. In addition, each Fidelity Central Fund's financial statements , which are not covered by the Fund's Report of Independent Registered Public Accounting Firm, are available on the SEC's website or upon request.
(d) The rate quoted is the annualized seven-day yield of the fund at period end.
Affiliated Central Funds
Information regarding fiscal year to date income earned by the Fund from investments in Fidelity Central Funds is as follows:
| Fund | Income earned |
| Fidelity Cash Central Fund | $566,940 |
| Total | $566,940 |
Amounts in the income column in the above table include any capital gain distributions from underlying funds, which are presented in the corresponding line-item in the Statement of Operations, if applicable.
Affiliated Underlying Funds
Fiscal year to date information regarding the Fund's investments in affiliated Underlying Funds, excluding any Money Market Central Funds, is presented below. Exchanges between classes of the same affiliated Underlying Funds may occur.
| Affiliate | Value, beginning of period | Purchases | Sales Proceeds | Dividend Income | Realized Gain (loss) | Change in Unrealized appreciation (depreciation) | Value, end of period |
| Fidelity Series 100 Index Fund | $418,817,851 | $3,601 | $440,838,264 | $-- | $160,376,149 | $(138,359,337) | $-- |
| Fidelity Series All-Sector Equity Fund | 805,615,379 | 169,442,003 | 439,945,713 | 117,377,365 | 33,974,653 | (83,350,177) | 485,736,145 |
| Fidelity Series Blue Chip Growth Fund | 832,667,609 | 170,904,209 | 114,574,192 | 112,794,418 | 7,580,394 | 25,665,852 | 922,243,872 |
| Fidelity Series Canada Fund | 185,991,221 | 28,770,490 | 17,295,582 | 4,333,742 | (254,915) | 3,430,346 | 200,641,560 |
| Fidelity Series Commodity Strategy Fund | 453,122,550 | 193,802,628 | 79,645,282 | 30,187,481 | (27,010,307) | (31,426,690) | 508,842,899 |
| Fidelity Series Emerging Markets Debt Fund | 140,311,483 | 17,275,102 | 10,447,533 | 8,338,387 | (390,934) | (6,412,709) | 140,335,409 |
| Fidelity Series Emerging Markets Fund | -- | 207,972,895 | 9,071,497 | 806,158 | (104,392) | 9,985,047 | 208,782,053 |
| Fidelity Series Emerging Markets Opportunities Fund | 1,945,942,220 | 450,158,312 | 159,301,457 | 148,592,524 | 5,539,641 | (293,455,835) | 1,948,882,881 |
| Fidelity Series Floating Rate High Income Fund | 47,711,855 | 5,661,076 | 24,893,633 | 2,541,235 | (1,533,551) | 575,985 | 27,521,732 |
| Fidelity Series Government Money Market Fund 2.50% | 352,943,664 | 317,645,263 | 379,114,081 | 7,718,836 | -- | -- | 291,474,846 |
| Fidelity Series Growth Company Fund | 1,693,158,763 | 290,118,429 | 195,625,104 | 172,574,048 | 8,722,115 | (27,129,497) | 1,769,244,706 |
| Fidelity Series High Income Fund | 298,102,772 | 37,832,413 | 144,218,266 | 18,983,711 | (6,699,920) | 2,828,666 | 187,845,665 |
| Fidelity Series Inflation-Protected Bond Index Fund | 174,598,700 | 12,590,374 | 124,188,496 | 1,331,920 | (1,608,167) | 3,002,862 | 64,395,273 |
| Fidelity Series International Credit Fund | 10,076,621 | 503,623 | 228,757 | 502,047 | (3,047) | (24,992) | 10,323,448 |
| Fidelity Series International Growth Fund | 1,868,762,602 | 368,764,034 | 209,075,311 | 120,868,409 | (6,387,245) | (95,900,286) | 1,926,163,794 |
| Fidelity Series International Small Cap Fund | 466,280,560 | 92,802,222 | 34,801,967 | 40,758,797 | (1,013,483) | (74,202,135) | 449,065,197 |
| Fidelity Series International Value Fund | 1,895,917,767 | 271,299,841 | 93,325,543 | 66,311,515 | (4,645,527) | (225,188,736) | 1,844,057,802 |
| Fidelity Series Intrinsic Opportunities Fund | 2,060,082,541 | 363,442,741 | 85,729,409 | 170,934,869 | (2,038,269) | (195,261,612) | 2,140,495,992 |
| Fidelity Series Investment Grade Bond Fund | 615,546,408 | 347,539,893 | 372,857,867 | 15,712,137 | (9,997,373) | 15,229,763 | 595,460,824 |
| Fidelity Series Large Cap Stock Fund | 1,821,590,263 | 320,559,757 | 186,010,695 | 193,170,688 | 474,512 | (67,673,011) | 1,888,940,826 |
| Fidelity Series Large Cap Value Index Fund | 522,138,865 | 61,148,660 | 52,246,180 | 25,044,912 | (33,765) | 5,287,768 | 536,295,348 |
| Fidelity Series Long-Term Treasury Bond Index Fund | 491,792,423 | 901,942,085 | 168,205,247 | 30,932,846 | (5,996,748) | 53,227,171 | 1,272,759,684 |
| Fidelity Series Opportunistic Insights Fund | 912,528,026 | 141,672,882 | 101,357,307 | 78,067,480 | 2,650,240 | 4,718,696 | 960,212,537 |
| Fidelity Series Real Estate Equity Fund | 164,451,251 | 839,371 | 170,955,908 | 599,773 | 6,052,433 | (387,147) | -- |
| Fidelity Series Real Estate Income Fund | 92,891,573 | 14,077,469 | 7,818,369 | 7,079,003 | (152,025) | 1,984,617 | 100,983,265 |
| Fidelity Series Short-Term Credit Fund | 63,956,869 | 32,181,985 | 24,226,298 | 1,985,725 | (37,294) | 1,027,198 | 72,902,460 |
| Fidelity Series Small Cap Discovery Fund | 246,110,044 | 48,110,775 | 20,939,380 | 30,673,133 | (851,388) | (22,394,187) | 250,035,864 |
| Fidelity Series Small Cap Opportunities Fund | 755,904,140 | 140,007,540 | 84,356,055 | 87,878,355 | 921,258 | (43,308,663) | 769,168,220 |
| Fidelity Series Stock Selector Large Cap Value Fund | 1,415,005,805 | 236,524,650 | 154,389,989 | 122,234,915 | (2,943,392) | (52,219,947) | 1,441,977,127 |
| Fidelity Series Value Discovery Fund | 1,003,212,077 | 131,492,640 | 84,116,739 | 61,289,043 | (1,445,979) | (27,917,100) | 1,021,224,899 |
| | $21,755,231,902 | $5,375,086,963 | $3,989,800,121 | 1,679,623,472 | $153,143,674 | $(1,257,648,090) | $22,036,014,328 |
Amounts in the income column in the above table include any capital gain distributions from underlying funds, which are presented in the corresponding line-item in the Statement of Operations, if applicable.
Investment Valuation
The following is a summary of the inputs used, as of March 31, 2019, involving the Fund's assets and liabilities carried at fair value. The inputs or methodology used for valuing securities may not be an indication of the risk associated with investing in those securities. For more information on valuation inputs, and their aggregation into the levels used below, please refer to the Investment Valuation section in the accompanying Notes to Financial Statements.
| | Valuation Inputs at Reporting Date: |
| Description | Total | Level 1 | Level 2 | Level 3 |
| Investments in Securities: | | | | |
| Other Short-Term Investments | $13,122,693 | $-- | $13,122,693 | $-- |
| Domestic Equity Funds | 12,694,418,435 | 12,694,418,435 | -- | -- |
| International Equity Funds | 6,577,593,287 | 6,577,593,287 | -- | -- |
| Bond Funds | 2,399,625,300 | 2,399,625,300 | -- | -- |
| Short-Term Funds | 456,110,138 | 456,110,138 | -- | -- |
| Total Investments in Securities: | $22,140,869,853 | $22,127,747,160 | $13,122,693 | $-- |
| Derivative Instruments: | | | | |
| Assets | | | | |
| Futures Contracts | $2,371,955 | $2,371,955 | $-- | $-- |
| Total Assets | $2,371,955 | $2,371,955 | $-- | $-- |
| Liabilities | | | | |
| Futures Contracts | $(4,985,530) | $(4,985,530) | $-- | $-- |
| Total Liabilities | $(4,985,530) | $(4,985,530) | $-- | $-- |
| Total Derivative Instruments: | $(2,613,575) | $(2,613,575) | $-- | $-- |
Value of Derivative Instruments
The following table is a summary of the Fund's value of derivative instruments by primary risk exposure as of March 31, 2019. For additional information on derivative instruments, please refer to the Derivative Instruments section in the accompanying Notes to Financial Statements.
| Primary Risk Exposure / Derivative Type | Value |
| | Asset | Liability |
| Equity Risk | | |
| Futures Contracts(a) | $0 | $(4,985,530) |
| Total Equity Risk | 0 | (4,985,530) |
| Interest Rate Risk | | |
| Futures Contracts | 2,371,955 | 0 |
| Total Interest Rate Risk | 2,371,955 | 0 |
| Total Value of Derivatives | $2,371,955 | $(4,985,530) |
(a) Reflects gross cumulative appreciation (depreciation) on futures contracts as presented in the Schedule of Investments. In the Statement of Assets and Liabilities, the period end daily variation margin is included in receivable or payable for daily variation margin on futures contracts, and the net cumulative appreciation (depreciation) is included in distributable earnings.
See accompanying notes which are an integral part of the financial statements.
Fidelity Freedom® 2035 Fund
Financial Statements
Statement of Assets and Liabilities
| | | March 31, 2019 |
| Assets | | |
Investment in securities, at value — See accompanying schedule:
Unaffiliated issuers (cost $13,122,268) | $13,122,693 | |
| Fidelity Central Funds (cost $91,731,928) | 91,732,832 | |
| Other affiliated issuers (cost $19,225,365,106) | 22,036,014,328 | |
| Total Investment in Securities (cost $19,330,219,302) | | $22,140,869,853 |
| Receivable for investments sold | | 188,752,142 |
| Receivable for fund shares sold | | 62,597,634 |
| Distributions receivable from Fidelity Central Funds | | 179,557 |
| Total assets | | 22,392,399,186 |
| Liabilities | | |
| Payable for investments purchased | $151,140,078 | |
| Payable for fund shares redeemed | 100,194,301 | |
| Accrued management fee | 12,098,978 | |
| Payable for daily variation margin on futures contracts | 2,055,073 | |
| Total liabilities | | 265,488,430 |
| Net Assets | | $22,126,910,756 |
| Net Assets consist of: | | |
| Paid in capital | | $18,549,647,128 |
| Total distributable earnings (loss) | | 3,577,263,628 |
| Net Assets | | $22,126,910,756 |
| Net Asset Value and Maximum Offering Price | | |
| Fidelity Freedom 2035 Fund: | | |
| Net Asset Value, offering price and redemption price per share ($8,247,885,759 ÷ 571,789,912 shares) | | $14.42 |
| Class K: | | |
| Net Asset Value, offering price and redemption price per share ($11,661,819,287 ÷ 809,707,361 shares) | | $14.40 |
| Class K6: | | |
| Net Asset Value, offering price and redemption price per share ($2,217,205,710 ÷ 154,037,588 shares) | | $14.39 |
See accompanying notes which are an integral part of the financial statements.
Statement of Operations
| | | Year ended March 31, 2019 |
| Investment Income | | |
| Dividends: | | |
| Affiliated issuers | | $465,028,069 |
| Interest | | 229,582 |
| Income from Fidelity Central Funds | | 566,940 |
| Total income | | 465,824,591 |
| Expenses | | |
| Management fee | $144,313,031 | |
| Independent trustees' fees and expenses | 102,556 | |
| Total expenses before reductions | 144,415,587 | |
| Expense reductions | (351) | |
| Total expenses after reductions | | 144,415,236 |
| Net investment income (loss) | | 321,409,355 |
| Realized and Unrealized Gain (Loss) | | |
| Net realized gain (loss) on: | | |
| Investment securities: | | |
| Unaffiliated issuers | 60,724 | |
| Fidelity Central Funds | (801) | |
| Other affiliated issuers | 153,143,674 | |
| Futures contracts | (4,925,437) | |
| Capital gain distributions from underlying funds: | | |
| Affiliated issuers | 1,214,595,403 | |
| Total net realized gain (loss) | | 1,362,873,563 |
| Change in net unrealized appreciation (depreciation) on: | | |
| Investment securities: | | |
| Unaffiliated issuers | 425 | |
| Fidelity Central Funds | 904 | |
| Other affiliated issuers | (1,257,648,090) | |
| Futures contracts | (2,613,575) | |
| Total change in net unrealized appreciation (depreciation) | | (1,260,260,336) |
| Net gain (loss) | | 102,613,227 |
| Net increase (decrease) in net assets resulting from operations | | $424,022,582 |
See accompanying notes which are an integral part of the financial statements.
Statement of Changes in Net Assets
| | Year ended March 31, 2019 | Year ended March 31, 2018 |
| Increase (Decrease) in Net Assets | | |
| Operations | | |
| Net investment income (loss) | $321,409,355 | $234,969,726 |
| Net realized gain (loss) | 1,362,873,563 | 967,655,889 |
| Change in net unrealized appreciation (depreciation) | (1,260,260,336) | 651,152,594 |
| Net increase (decrease) in net assets resulting from operations | 424,022,582 | 1,853,778,209 |
| Distributions to shareholders | (1,465,758,420) | – |
| Distributions to shareholders from net investment income | – | (255,443,857) |
| Distributions to shareholders from net realized gain | – | (469,405,267) |
| Total distributions | (1,465,758,420) | (724,849,124) |
| Share transactions - net increase (decrease) | 1,425,813,293 | 13,724,076,087 |
| Total increase (decrease) in net assets | 384,077,455 | 14,853,005,172 |
| Net Assets | | |
| Beginning of period | 21,742,833,301 | 6,889,828,129 |
| End of period | $22,126,910,756 | $21,742,833,301 |
See accompanying notes which are an integral part of the financial statements.
Financial Highlights
Fidelity Freedom 2035 Fund
| Years ended March 31, | 2019 | 2018 | 2017 | 2016 | 2015 |
| Selected Per–Share Data | | | | | |
| Net asset value, beginning of period | $15.20 | $13.88 | $12.46 | $13.67 | $13.62 |
| Income from Investment Operations | | | | | |
| Net investment income (loss)A | .21 | .16 | .19 | .19 | .22 |
| Net realized and unrealized gain (loss) | .01 | 1.81 | 1.75 | (.65) | .80 |
| Total from investment operations | .22 | 1.97 | 1.94 | (.46) | 1.02 |
| Distributions from net investment income | (.22) | (.17) | (.18) | (.20) | (.23) |
| Distributions from net realized gain | (.78) | (.47) | (.34) | (.55) | (.75) |
| Total distributions | (1.00) | (.65)B | (.52) | (.75) | (.97)C |
| Net asset value, end of period | $14.42 | $15.20 | $13.88 | $12.46 | $13.67 |
| Total ReturnD | 1.85% | 14.32% | 16.09% | (3.59)% | 7.90% |
| Ratios to Average Net AssetsE,F | | | | | |
| Expenses before reductions | .74% | .63%G | - %H | - %H | - %H |
| Expenses net of fee waivers, if any | .74% | .63%G | -% | -% | -% |
| Expenses net of all reductions | .74% | .63%G | -% | -% | -% |
| Net investment income (loss) | 1.41% | 1.06% | 1.45% | 1.48% | 1.62% |
| Supplemental Data | | | | | |
| Net assets, end of period (000 omitted) | $8,247,886 | $8,050,659 | $6,889,828 | $5,961,088 | $6,289,345 |
| Portfolio turnover rateE | 18% | 17%I | 16% | 15% | 18% |
A Calculated based on average shares outstanding during the period.
B Total distributions of $.65 per share is comprised of distributions from net investment income of $.171 and distributions from net realized gain of $.474 per share.
C Total distributions of $.97 per share is comprised of distributions from net investment income of $.226 and distributions from net realized gain of $.746 per share.
D Total returns would have been lower if certain expenses had not been reduced during the applicable periods shown.
E Amounts do not include the activity of the Underlying Funds.
F Expense ratios reflect operating expenses of the class. Expenses before reductions do not reflect amounts reimbursed by the investment adviser or reductions from expense offset arrangements and do not represent the amount paid by the class during periods when reimbursements or reductions occur. Expenses net of fee waivers reflect expenses after reimbursement by the investment adviser but prior to reductions from expense offset arrangements. Expenses net of all reductions represent the net expenses paid by the class but do not include expenses of the underlying funds in which the Fund invests.
G On certain classes, the size and fluctuation of net assets and expense amounts may cause ratios to differ from contractual rates.
H Amount represents less than .005%.
I The portfolio turnover rate does not include the assets acquired in the merger.
See accompanying notes which are an integral part of the financial statements.
Fidelity Freedom 2035 Fund Class K
| Years ended March 31, | 2019 | 2018 A |
| Selected Per–Share Data | | |
| Net asset value, beginning of period | $15.18 | $14.60 |
| Income from Investment Operations | | |
| Net investment income (loss)B | .22 | .22 |
| Net realized and unrealized gain (loss) | .01 | .82 |
| Total from investment operations | .23 | 1.04 |
| Distributions from net investment income | (.23) | (.19) |
| Distributions from net realized gain | (.78) | (.26) |
| Total distributions | (1.01) | (.46)C |
| Net asset value, end of period | $14.40 | $15.18 |
| Total ReturnD,E | 1.95% | 7.09% |
| Ratios to Average Net AssetsF,G | | |
| Expenses before reductions | .64% | .65%H,I |
| Expenses net of fee waivers, if any | .64% | .65%H,I |
| Expenses net of all reductions | .64% | .65%H,I |
| Net investment income (loss) | 1.51% | 2.07%H |
| Supplemental Data | | |
| Net assets, end of period (000 omitted) | $11,661,819 | $12,979,898 |
| Portfolio turnover rateF | 18% | 17%J |
A For the period July 20, 2017 (commencement of sale of shares) to March 31, 2018.
B Calculated based on average shares outstanding during the period.
C Total distributions of $.46 per share is comprised of distributions from net investment income of $.193 and distributions from net realized gain of $.264 per share.
D Total returns for periods of less than one year are not annualized.
E Total returns would have been lower if certain expenses had not been reduced during the applicable periods shown.
F Amounts do not include the activity of the Underlying Funds.
G Expense ratios reflect operating expenses of the class. Expenses before reductions do not reflect amounts reimbursed by the investment adviser or reductions from expense offset arrangements and do not represent the amount paid by the class during periods when reimbursements or reductions occur. Expense ratios before reductions for start-up periods may not be representative of longer-term operating periods. Expenses net of fee waivers reflect expenses after reimbursement by the investment adviser but prior to reductions from expense offset arrangements. Expenses net of all reductions represent the net expenses paid by the class but do not include expenses of the underlying funds in which the Fund invests.
H Annualized
I On certain classes, the size and fluctuation of net assets and expense amounts may cause ratios to differ from contractual rates.
J The portfolio turnover rate does not include the assets acquired in the merger.
See accompanying notes which are an integral part of the financial statements.
Fidelity Freedom 2035 Fund Class K6
| Years ended March 31, | 2019 | 2018 A |
| Selected Per–Share Data | | |
| Net asset value, beginning of period | $15.20 | $14.30 |
| Income from Investment Operations | | |
| Net investment income (loss)B | .24 | .20 |
| Net realized and unrealized gain (loss) | .01 | 1.16 |
| Total from investment operations | .25 | 1.36 |
| Distributions from net investment income | (.27) | (.20) |
| Distributions from net realized gain | (.79) | (.26) |
| Total distributions | (1.06) | (.46) |
| Net asset value, end of period | $14.39 | $15.20 |
| Total ReturnC,D | 2.10% | 9.50% |
| Ratios to Average Net AssetsE,F | | |
| Expenses before reductions | .49% | .50%G,H |
| Expenses net of fee waivers, if any | .49% | .50%G,H |
| Expenses net of all reductions | .49% | .50%G,H |
| Net investment income (loss) | 1.65% | 1.61%G |
| Supplemental Data | | |
| Net assets, end of period (000 omitted) | $2,217,206 | $712,276 |
| Portfolio turnover rateE | 18% | 17%I |
A For the period June 7, 2017 (commencement of sale of shares) to March 31, 2018.
B Calculated based on average shares outstanding during the period.
C Total returns for periods of less than one year are not annualized.
D Total returns would have been lower if certain expenses had not been reduced during the applicable periods shown.
E Amounts do not include the activity of the Underlying Funds.
F Expense ratios reflect operating expenses of the class. Expenses before reductions do not reflect amounts reimbursed by the investment adviser or reductions from expense offset arrangements and do not represent the amount paid by the class during periods when reimbursements or reductions occur. Expense ratios before reductions for start-up periods may not be representative of longer-term operating periods. Expenses net of fee waivers reflect expenses after reimbursement by the investment adviser but prior to reductions from expense offset arrangements. Expenses net of all reductions represent the net expenses paid by the class but do not include expenses of the underlying funds in which the Fund invests.
G Annualized
H On certain classes, the size and fluctuation of net assets and expense amounts may cause ratios to differ from contractual rates.
I The portfolio turnover rate does not include the assets acquired in the merger.
See accompanying notes which are an integral part of the financial statements.
Fidelity Freedom® 2040 Fund
Investment Summary (Unaudited)
The information in the following tables is based on the direct investments of the Fund.
Top Holdings as of March 31, 2019
| | % of fund's net assets |
| Fidelity Series Intrinsic Opportunities Fund | 10.0 |
| Fidelity Series International Growth Fund | 9.3 |
| Fidelity Series Emerging Markets Opportunities Fund | 9.1 |
| Fidelity Series Large Cap Stock Fund | 8.9 |
| Fidelity Series Growth Company Fund | 8.9 |
| Fidelity Series International Value Fund | 8.7 |
| Fidelity Series Stock Selector Large Cap Value Fund | 6.8 |
| Fidelity Series Value Discovery Fund | 4.8 |
| Fidelity Series Opportunistic Insights Fund | 4.6 |
| Fidelity Series Blue Chip Growth Fund | 4.4 |
| | 75.5 |
Asset Allocation (% of fund's net assets)
| Period end |
| | Domestic Equity Funds | 60.8% |
| | International Equity Funds | 31.3% |
| | Bond Funds | 6.8% |
| | Short-Term Funds | 1.1% |
| | Short-Term Investments | 0.1% |
| | Net Other Assets (Liabilities)* | (0.1)% |

* Net Other Assets (Liabilities) are not included in the pie chart
Domestic Equity Funds category includes Fidelity Series Commodity Strategy Fund which invests in commodity-related investments.
Fidelity Freedom® 2040 Fund
Schedule of Investments March 31, 2019
Showing Percentage of Net Assets
| U.S. Treasury Obligations - 0.1% | | | |
| | | Principal Amount | Value |
| U.S. Treasury Bills, yield at date of purchase 2.39% 4/4/19 (a) | | | |
| (Cost $11,487,727) | | 11,490,000 | 11,487,739 |
| | | Shares | Value |
|
| Domestic Equity Funds - 60.8% | | | |
| Fidelity Series All-Sector Equity Fund (b) | | 57,952,261 | $558,080,270 |
| Fidelity Series Blue Chip Growth Fund (b) | | 67,219,607 | 991,489,200 |
| Fidelity Series Commodity Strategy Fund (b) | | 117,048,922 | 558,323,357 |
| Fidelity Series Growth Company Fund (b) | | 118,066,041 | 1,996,496,748 |
| Fidelity Series Intrinsic Opportunities Fund (b) | | 136,358,573 | 2,243,098,529 |
| Fidelity Series Large Cap Stock Fund (b) | | 136,914,117 | 2,005,791,811 |
| Fidelity Series Large Cap Value Index Fund (b) | | 45,612,797 | 566,054,815 |
| Fidelity Series Opportunistic Insights Fund (b) | | 59,090,216 | 1,032,896,974 |
| Fidelity Series Small Cap Discovery Fund (b) | | 23,423,226 | 260,466,275 |
| Fidelity Series Small Cap Opportunities Fund (b) | | 60,845,057 | 818,974,463 |
| Fidelity Series Stock Selector Large Cap Value Fund (b) | | 130,160,737 | 1,535,896,694 |
| Fidelity Series Value Discovery Fund (b) | | 86,138,127 | 1,075,865,209 |
| TOTAL DOMESTIC EQUITY FUNDS | | | |
| (Cost $11,424,043,000) | | | 13,643,434,345 |
|
| International Equity Funds - 31.3% | | | |
| Fidelity Series Canada Fund (b) | | 20,736,949 | 213,797,940 |
| Fidelity Series Emerging Markets Fund (b) | | 22,396,756 | 219,264,240 |
| Fidelity Series Emerging Markets Opportunities Fund (b) | | 110,648,289 | 2,050,312,796 |
| Fidelity Series International Growth Fund (b) | | 138,009,768 | 2,096,368,378 |
| Fidelity Series International Small Cap Fund (b) | | 31,189,246 | 484,368,989 |
| Fidelity Series International Value Fund (b) | | 210,835,330 | 1,960,768,572 |
| TOTAL INTERNATIONAL EQUITY FUNDS | | | |
| (Cost $6,249,572,052) | | | 7,024,880,915 |
|
| Bond Funds - 6.8% | | | |
| Fidelity Series Emerging Markets Debt Fund (b) | | 14,867,638 | 142,580,650 |
| Fidelity Series Floating Rate High Income Fund (b) | | 3,003,698 | 27,844,283 |
| Fidelity Series High Income Fund (b) | | 25,381,916 | 238,590,013 |
| Fidelity Series Inflation-Protected Bond Index Fund (b) | | 6,676,622 | 65,297,368 |
| Fidelity Series International Credit Fund (b) | | 1,014,729 | 10,035,669 |
| Fidelity Series Investment Grade Bond Fund (b) | | 12,292,912 | 137,434,757 |
| Fidelity Series Long-Term Treasury Bond Index Fund (b) | | 90,499,078 | 802,726,823 |
| Fidelity Series Real Estate Income Fund (b) | | 9,490,830 | 103,544,954 |
| TOTAL BOND FUNDS | | | |
| (Cost $1,509,312,665) | | | 1,528,054,517 |
|
| Short-Term Funds - 1.1% | | | |
| Fidelity Cash Central Fund, 2.48% (c) | | 34,220,402 | 34,227,246 |
| Fidelity Series Government Money Market Fund 2.50% (b)(d) | | 161,417,474 | 161,417,474 |
| Fidelity Series Short-Term Credit Fund (b) | | 4,469,640 | 44,562,312 |
| TOTAL SHORT-TERM FUNDS | | | |
| (Cost $240,109,456) | | | 240,207,032 |
| TOTAL INVESTMENT IN SECURITIES - 100.1% | | | |
| (Cost $19,434,524,900) | | | 22,448,064,548 |
| NET OTHER ASSETS (LIABILITIES) - (0.1)% | | | (13,105,805) |
| NET ASSETS - 100% | | | $22,434,958,743 |
| Futures Contracts | | | | | |
| | Number of contracts | Expiration Date | Notional Amount | Value | Unrealized Appreciation/(Depreciation) |
| Purchased | | | | | |
| Equity Index Contracts | | | | | |
| CME E-mini S&P 500 Index Contracts (United States) | 103 | June 2019 | $14,614,670 | $26 | $26 |
| Treasury Contracts | | | | | |
| CBOT 2-Year U.S. Treasury Note Contracts (United States) | 32 | June 2019 | 6,819,000 | 26,905 | 26,905 |
| CBOT 5-Year U.S. Treasury Note Contracts (United States) | 79 | June 2019 | 9,150,422 | 90,482 | 90,482 |
| CBOT Long Term U.S. Treasury Bond Contracts (United States) | 44 | June 2019 | 6,584,875 | 230,905 | 230,905 |
| CBOT Long Term U.S. Treasury Bond Contracts (United States) | 51 | June 2019 | 6,335,156 | 113,947 | 113,947 |
| CBOT Ultra Long Term U.S. Treasury Bond Contracts (United States) | 67 | June 2019 | 11,256,000 | 560,192 | 560,192 |
| TOTAL TREASURY CONTRACTS | | | | | 1,022,431 |
|
| TOTAL PURCHASED | | | | | 1,022,457 |
|
| Sold | | | | | |
| Equity Index Contracts | | | | | |
| ICE E-mini MSCI EAFE Index Contracts (United States) | 93 | June 2019 | 8,678,760 | (183,427) | (183,427) |
| ICE E-mini MSCI Emerging Markets Index Contracts (United States) | 1,137 | June 2019 | 60,113,190 | (1,120,889) | (1,120,889) |
|
| TOTAL SOLD | | | | | (1,304,316) |
|
| TOTAL FUTURES CONTRACTS | | | | | $(281,859) |
The notional amount of futures purchased as a percentage of Net Assets is 0.2%
The notional amount of futures sold as a percentage of Net Assets is 0.3%
Legend
(a) Security or a portion of the security was pledged to cover margin requirements for futures contracts. At period end, the value of securities pledged amounted to $4,404,133.
(b) Affiliated Fund
(c) Affiliated fund that is generally available only to investment companies and other accounts managed by Fidelity Investments. The rate quoted is the annualized seven-day yield of the fund at period end. A complete unaudited listing of the fund's holdings as of its most recent quarter end is available upon request. In addition, each Fidelity Central Fund's financial statements, which are not covered by the Fund's Report of Independent Registered Public Accounting Firm, are available on the SEC's website or upon request.
(d) The rate quoted is the annualized seven-day yield of the fund at period end.
Affiliated Central Funds
Information regarding fiscal year to date income earned by the Fund from investments in Fidelity Central Funds is as follows:
| Fund | Income earned |
| Fidelity Cash Central Fund | $404,016 |
| Total | $404,016 |
Amounts in the income column in the above table include any capital gain distributions from underlying funds, which are presented in the corresponding line-item in the Statement of Operations, if applicable.
Affiliated Underlying Funds
Fiscal year to date information regarding the Fund's investments in affiliated Underlying Funds, excluding any Money Market Central Funds, is presented below. Exchanges between classes of the same affiliated Underlying Funds may occur.
| Affiliate | Value, beginning of period | Purchases | Sales Proceeds | Dividend Income | Realized Gain (loss) | Change in Unrealized appreciation (depreciation) | Value, end of period |
| Fidelity Series 100 Index Fund | $443,201,000 | $27,501 | $474,621,171 | $-- | $177,785,602 | $(146,392,932) | $-- |
| Fidelity Series All-Sector Equity Fund | 852,293,455 | 174,965,168 | 404,659,418 | 135,239,392 | 30,482,635 | (95,001,570) | 558,080,270 |
| Fidelity Series Blue Chip Growth Fund | 880,936,658 | 179,810,832 | 103,089,783 | 121,277,326 | 6,087,051 | 27,744,442 | 991,489,200 |
| Fidelity Series Canada Fund | 196,369,345 | 29,886,597 | 15,741,289 | 4,627,555 | (133,497) | 3,416,784 | 213,797,940 |
| Fidelity Series Commodity Strategy Fund | 466,509,085 | 229,809,127 | 75,789,474 | 32,672,686 | (28,230,565) | (33,974,816) | 558,323,357 |
| Fidelity Series Emerging Markets Debt Fund | 144,474,691 | 16,291,565 | 11,169,369 | 8,527,508 | (399,799) | (6,616,438) | 142,580,650 |
| Fidelity Series Emerging Markets Fund | -- | 217,031,196 | 7,007,087 | 849,270 | (192,143) | 9,432,274 | 219,264,240 |
| Fidelity Series Emerging Markets Opportunities Fund | 2,040,911,915 | 508,029,323 | 189,166,756 | 156,793,131 | 3,293,494 | (312,755,180) | 2,050,312,796 |
| Fidelity Series Floating Rate High Income Fund | 48,961,247 | 5,209,492 | 25,441,614 | 2,571,377 | (1,469,187) | 584,345 | 27,844,283 |
| Fidelity Series Government Money Market Fund 2.50% | 359,251,220 | 372,105,049 | 569,938,795 | 5,673,686 | -- | -- | 161,417,474 |
| Fidelity Series Growth Company Fund | 1,792,770,541 | 389,182,200 | 159,124,548 | 195,366,983 | 1,691,958 | (28,023,403) | 1,996,496,748 |
| Fidelity Series High Income Fund | 309,170,419 | 35,755,267 | 102,401,099 | 19,381,839 | (4,851,580) | 917,006 | 238,590,013 |
| Fidelity Series Inflation-Protected Bond Index Fund | 179,663,816 | 20,883,665 | 136,421,851 | 1,373,825 | (1,785,812) | 2,957,550 | 65,297,368 |
| Fidelity Series International Credit Fund | 9,784,897 | 488,783 | 210,862 | 487,918 | (2,839) | (24,310) | 10,035,669 |
| Fidelity Series International Growth Fund | 1,977,736,139 | 407,197,272 | 178,165,706 | 129,015,132 | (6,169,819) | (104,229,508) | 2,096,368,378 |
| Fidelity Series International Small Cap Fund | 493,473,677 | 98,258,005 | 25,212,590 | 43,577,741 | (1,222,771) | (80,927,332) | 484,368,989 |
| Fidelity Series International Value Fund | 2,001,758,300 | 298,004,915 | 92,123,040 | 70,730,892 | (4,799,772) | (242,071,831) | 1,960,768,572 |
| Fidelity Series Intrinsic Opportunities Fund | 2,182,350,576 | 339,756,279 | 75,988,437 | 178,032,279 | (1,309,906) | (201,709,983) | 2,243,098,529 |
| Fidelity Series Investment Grade Bond Fund | 106,425,476 | 51,643,302 | 23,100,791 | 3,697,792 | (353,094) | 2,819,864 | 137,434,757 |
| Fidelity Series Large Cap Stock Fund | 1,927,084,035 | 325,502,767 | 176,238,498 | 203,829,322 | 251,786 | (70,808,279) | 2,005,791,811 |
| Fidelity Series Large Cap Value Index Fund | 549,397,749 | 59,945,549 | 49,006,812 | 26,128,816 | 50,252 | 5,668,077 | 566,054,815 |
| Fidelity Series Long-Term Treasury Bond Index Fund | 501,632,815 | 549,521,918 | 278,741,679 | 21,745,371 | (8,370,029) | 38,683,798 | 802,726,823 |
| Fidelity Series Opportunistic Insights Fund | 965,411,695 | 143,877,671 | 83,467,132 | 83,224,638 | 1,701,416 | 5,373,324 | 1,032,896,974 |
| Fidelity Series Real Estate Equity Fund | 176,406,153 | 1,945,989 | 185,854,727 | 1,804,383 | 8,722,617 | (1,220,032) | -- |
| Fidelity Series Real Estate Income Fund | 96,629,351 | 13,386,281 | 8,367,708 | 7,305,534 | (131,305) | 2,028,335 | 103,544,954 |
| Fidelity Series Short-Term Credit Fund | 65,675,427 | 11,942,998 | 33,651,555 | 1,634,189 | (216,700) | 812,142 | 44,562,312 |
| Fidelity Series Small Cap Discovery Fund | 257,910,452 | 49,591,764 | 22,957,057 | 32,060,239 | (736,554) | (23,342,330) | 260,466,275 |
| Fidelity Series Small Cap Opportunities Fund | 796,470,742 | 144,665,147 | 76,285,745 | 93,812,196 | 116,824 | (45,992,505) | 818,974,463 |
| Fidelity Series Stock Selector Large Cap Value Fund | 1,499,209,905 | 236,845,376 | 143,085,585 | 129,358,967 | (3,606,977) | (53,466,025) | 1,535,896,694 |
| Fidelity Series Value Discovery Fund | 1,063,662,736 | 135,554,875 | 92,667,688 | 64,770,376 | (1,507,261) | (29,177,453) | 1,075,865,209 |
| | $22,385,533,517 | $5,047,115,873 | $3,819,697,866 | $1,775,570,363 | $164,694,025 | $(1,375,295,986) | $22,402,349,563 |
Amounts in the income column in the above table include any capital gain distributions from underlying funds, which are presented in the corresponding line-item in the Statement of Operations, if applicable.
Investment Valuation
The following is a summary of the inputs used, as of March 31, 2019, involving the Fund's assets and liabilities carried at fair value. The inputs or methodology used for valuing securities may not be an indication of the risk associated with investing in those securities. For more information on valuation inputs, and their aggregation into the levels used below, please refer to the Investment Valuation section in the accompanying Notes to Financial Statements.
| | Valuation Inputs at Reporting Date: |
| Description | Total | Level 1 | Level 2 | Level 3 |
| Investments in Securities: | | | | |
| Other Short-Term Investments | $11,487,739 | $-- | $11,487,739 | $-- |
| Domestic Equity Funds | 13,643,434,345 | 13,643,434,345 | -- | -- |
| International Equity Funds | 7,024,880,915 | 7,024,880,915 | -- | -- |
| Bond Funds | 1,528,054,517 | 1,528,054,517 | -- | -- |
| Short-Term Funds | 240,207,032 | 240,207,032 | -- | -- |
| Total Investments in Securities: | $22,448,064,548 | $22,436,576,809 | $11,487,739 | $-- |
| Derivative Instruments: | | | | |
| Assets | | | | |
| Futures Contracts | $1,022,457 | $1,022,457 | $-- | $-- |
| Total Assets | $1,022,457 | $1,022,457 | $-- | $-- |
| Liabilities | | | | |
| Futures Contracts | $(1,304,316) | $(1,304,316) | $-- | $-- |
| Total Liabilities | $(1,304,316) | $(1,304,316) | $-- | $-- |
| Total Derivative Instruments: | $(281,859) | $(281,859) | $-- | $-- |
Value of Derivative Instruments
The following table is a summary of the Fund's value of derivative instruments by primary risk exposure as of March 31, 2019. For additional information on derivative instruments, please refer to the Derivative Instruments section in the accompanying Notes to Financial Statements.
| Primary Risk Exposure / Derivative Type | Value |
| | Asset | Liability |
| Equity Risk | | |
| Futures Contracts(a) | $26 | $(1,304,316) |
| Total Equity Risk | 26 | (1,304,316) |
| Interest Rate Risk | | |
| Futures Contracts | 1,022,431 | 0 |
| Total Interest Rate Risk | 1,022,431 | 0 |
| Total Value of Derivatives | $1,022,457 | $(1,304,316) |
(a) Reflects gross cumulative appreciation (depreciation) on futures contracts as presented in the Schedule of Investments. In the Statement of Assets and Liabilities, the period end daily variation margin is included in receivable or payable for daily variation margin on futures contracts, and the net cumulative appreciation (depreciation) is included in distributable earnings.
See accompanying notes which are an integral part of the financial statements.
Fidelity Freedom® 2040 Fund
Financial Statements
Statement of Assets and Liabilities
| | | March 31, 2019 |
| Assets | | |
Investment in securities, at value — See accompanying schedule:
Unaffiliated issuers (cost $11,487,727) | $11,487,739 | |
| Fidelity Central Funds (cost $34,226,829) | 34,227,246 | |
| Other affiliated issuers (cost $19,388,810,344) | 22,402,349,563 | |
| Total Investment in Securities (cost $19,434,524,900) | | $22,448,064,548 |
| Receivable for investments sold | | 68,786,034 |
| Receivable for fund shares sold | | 62,050,518 |
| Distributions receivable from Fidelity Central Funds | | 65,208 |
| Total assets | | 22,578,966,308 |
| Liabilities | | |
| Payable for investments purchased | $31,700,295 | |
| Payable for fund shares redeemed | 99,128,320 | |
| Accrued management fee | 12,448,242 | |
| Payable for daily variation margin on futures contracts | 728,608 | |
| Other payables and accrued expenses | 2,100 | |
| Total liabilities | | 144,007,565 |
| Net Assets | | $22,434,958,743 |
| Net Assets consist of: | | |
| Paid in capital | | $18,606,216,355 |
| Total distributable earnings (loss) | | 3,828,742,388 |
| Net Assets | | $22,434,958,743 |
| Net Asset Value and Maximum Offering Price | | |
| Fidelity Freedom 2040 Fund: | | |
| Net Asset Value, offering price and redemption price per share ($8,404,848,263 ÷ 833,381,060 shares) | | $10.09 |
| Class K: | | |
| Net Asset Value, offering price and redemption price per share ($11,994,623,332 ÷ 1,190,375,087 shares) | | $10.08 |
| Class K6: | | |
| Net Asset Value, offering price and redemption price per share ($2,035,487,148 ÷ 202,392,610 shares) | | $10.06 |
See accompanying notes which are an integral part of the financial statements.
Statement of Operations
| | | Year ended March 31, 2019 |
| Investment Income | | |
| Dividends: | | |
| Affiliated issuers | | $466,956,590 |
| Interest | | 235,555 |
| Income from Fidelity Central Funds | | 404,016 |
| Total income | | 467,596,161 |
| Expenses | | |
| Management fee | $149,329,028 | |
| Independent trustees' fees and expenses | 104,989 | |
| Total expenses before reductions | 149,434,017 | |
| Expense reductions | (42) | |
| Total expenses after reductions | | 149,433,975 |
| Net investment income (loss) | | 318,162,186 |
| Realized and Unrealized Gain (Loss) | | |
| Net realized gain (loss) on: | | |
| Investment securities: | | |
| Unaffiliated issuers | 63,271 | |
| Fidelity Central Funds | (353) | |
| Other affiliated issuers | 164,694,025 | |
| Futures contracts | (12,140,524) | |
| Capital gain distributions from underlying funds: | | |
| Affiliated issuers | 1,308,613,773 | |
| Total net realized gain (loss) | | 1,461,230,192 |
| Change in net unrealized appreciation (depreciation) on: | | |
| Investment securities: | | |
| Unaffiliated issuers | 12 | |
| Fidelity Central Funds | 417 | |
| Other affiliated issuers | (1,375,295,986) | |
| Futures contracts | (281,859) | |
| Total change in net unrealized appreciation (depreciation) | | (1,375,577,416) |
| Net gain (loss) | | 85,652,776 |
| Net increase (decrease) in net assets resulting from operations | | $403,814,962 |
See accompanying notes which are an integral part of the financial statements.
Statement of Changes in Net Assets
| | Year ended March 31, 2019 | Year ended March 31, 2018 |
| Increase (Decrease) in Net Assets | | |
| Operations | | |
| Net investment income (loss) | $318,162,186 | $241,539,734 |
| Net realized gain (loss) | 1,461,230,192 | 1,033,195,358 |
| Change in net unrealized appreciation (depreciation) | (1,375,577,416) | 685,250,223 |
| Net increase (decrease) in net assets resulting from operations | 403,814,962 | 1,959,985,315 |
| Distributions to shareholders | (1,543,664,947) | – |
| Distributions to shareholders from net investment income | – | (266,263,160) |
| Distributions to shareholders from net realized gain | – | (509,942,580) |
| Total distributions | (1,543,664,947) | (776,205,740) |
| Share transactions - net increase (decrease) | 1,202,056,606 | 13,924,513,839 |
| Total increase (decrease) in net assets | 62,206,621 | 15,108,293,414 |
| Net Assets | | |
| Beginning of period | 22,372,752,122 | 7,264,458,708 |
| End of period | $22,434,958,743 | $22,372,752,122 |
See accompanying notes which are an integral part of the financial statements.
Financial Highlights
Fidelity Freedom 2040 Fund
| Years ended March 31, | 2019 | 2018 | 2017 | 2016 | 2015 |
| Selected Per–Share Data | | | | | |
| Net asset value, beginning of period | $10.67 | $9.74 | $8.75 | $9.63 | $9.62 |
| Income from Investment Operations | | | | | |
| Net investment income (loss)A | .14 | .11 | .13 | .13 | .15 |
| Net realized and unrealized gain (loss) | –B | 1.29 | 1.24 | (.46) | .57 |
| Total from investment operations | .14 | 1.40 | 1.37 | (.33) | .72 |
| Distributions from net investment income | (.15) | (.12) | (.13) | (.14) | (.16) |
| Distributions from net realized gain | (.57) | (.35) | (.24) | (.41) | (.55) |
| Total distributions | (.72) | (.47) | (.38)C | (.55) | (.71) |
| Net asset value, end of period | $10.09 | $10.67 | $9.74 | $8.75 | $9.63 |
| Total ReturnD | 1.79% | 14.52% | 16.14% | (3.62)% | 7.86% |
| Ratios to Average Net AssetsE,F | | | | | |
| Expenses before reductions | .75% | .63%G | - %H | - %H | - %H |
| Expenses net of fee waivers, if any | .75% | .63%G | -% | -% | -% |
| Expenses net of all reductions | .75% | .63%G | -% | -% | -% |
| Net investment income (loss) | 1.36% | 1.04% | 1.44% | 1.47% | 1.61% |
| Supplemental Data | | | | | |
| Net assets, end of period (000 omitted) | $8,404,848 | $8,285,660 | $7,264,459 | $6,388,566 | $6,901,191 |
| Portfolio turnover rateE | 17% | 16%I | 15% | 16% | 17% |
A Calculated based on average shares outstanding during the period.
B Amount represents less than $.005 per share.
C Total distributions of $.38 per share is comprised of distributions from net investment income of $.132 and distributions from net realized gain of $.244 per share.
D Total returns would have been lower if certain expenses had not been reduced during the applicable periods shown.
E Amounts do not include the activity of the Underlying Funds.
F Expense ratios reflect operating expenses of the class. Expenses before reductions do not reflect amounts reimbursed by the investment adviser or reductions from expense offset arrangements and do not represent the amount paid by the class during periods when reimbursements or reductions occur. Expenses net of fee waivers reflect expenses after reimbursement by the investment adviser but prior to reductions from expense offset arrangements. Expenses net of all reductions represent the net expenses paid by the class but do not include expenses of the underlying funds in which the Fund invests.
G On certain classes, the size and fluctuation of net assets and expense amounts may cause ratios to differ from contractual rates.
H Amount represents less than .005%.
I The portfolio turnover rate does not include the assets acquired in the merger.
See accompanying notes which are an integral part of the financial statements.
Fidelity Freedom 2040 Fund Class K
| Years ended March 31, | 2019 | 2018 A |
| Selected Per–Share Data | | |
| Net asset value, beginning of period | $10.66 | $10.25 |
| Income from Investment Operations | | |
| Net investment income (loss)B | .15 | .15 |
| Net realized and unrealized gain (loss) | –C | .59 |
| Total from investment operations | .15 | .74 |
| Distributions from net investment income | (.16) | (.14) |
| Distributions from net realized gain | (.57) | (.19) |
| Total distributions | (.73) | (.33) |
| Net asset value, end of period | $10.08 | $10.66 |
| Total ReturnD,E | 1.87% | 7.21% |
| Ratios to Average Net AssetsF,G | | |
| Expenses before reductions | .64% | .65%H,I |
| Expenses net of fee waivers, if any | .64% | .65%H,I |
| Expenses net of all reductions | .64% | .65%H,I |
| Net investment income (loss) | 1.46% | 2.06%H |
| Supplemental Data | | |
| Net assets, end of period (000 omitted) | $11,994,623 | $13,434,642 |
| Portfolio turnover rateF | 17% | 16%J |
A For the period July 20, 2017 (commencement of sale of shares) to March 31, 2018.
B Calculated based on average shares outstanding during the period.
C Amount represents less than $.005 per share.
D Total returns for periods of less than one year are not annualized.
E Total returns would have been lower if certain expenses had not been reduced during the applicable periods shown.
F Amounts do not include the activity of the Underlying Funds.
G Expense ratios reflect operating expenses of the class. Expenses before reductions do not reflect amounts reimbursed by the investment adviser or reductions from expense offset arrangements and do not represent the amount paid by the class during periods when reimbursements or reductions occur. Expense ratios before reductions for start-up periods may not be representative of longer-term operating periods. Expenses net of fee waivers reflect expenses after reimbursement by the investment adviser but prior to reductions from expense offset arrangements. Expenses net of all reductions represent the net expenses paid by the class but do not include expenses of the underlying funds in which the Fund invests.
H Annualized
I On certain classes, the size and fluctuation of net assets and expense amounts may cause ratios to differ from contractual rates.
J The portfolio turnover rate does not include the assets acquired in the merger.
See accompanying notes which are an integral part of the financial statements.
Fidelity Freedom 2040 Fund Class K6
| Years ended March 31, | 2019 | 2018 A |
| Selected Per–Share Data | | |
| Net asset value, beginning of period | $10.66 | $10.03 |
| Income from Investment Operations | | |
| Net investment income (loss)B | .16 | .13 |
| Net realized and unrealized gain (loss) | .01 | .83 |
| Total from investment operations | .17 | .96 |
| Distributions from net investment income | (.19) | (.14) |
| Distributions from net realized gain | (.58) | (.19) |
| Total distributions | (.77) | (.33) |
| Net asset value, end of period | $10.06 | $10.66 |
| Total ReturnC,D | 2.06% | 9.60% |
| Ratios to Average Net AssetsE,F | | |
| Expenses before reductions | .50%G | .50%G,H |
| Expenses net of fee waivers, if any | .50%G | .50%G,H |
| Expenses net of all reductions | .50%G | .50%G,H |
| Net investment income (loss) | 1.61% | 1.55%H |
| Supplemental Data | | |
| Net assets, end of period (000 omitted) | $2,035,487 | $652,451 |
| Portfolio turnover rateE | 17% | 16%I |
A For the period June 7, 2017 (commencement of sale of shares) to March 31, 2018.
B Calculated based on average shares outstanding during the period.
C Total returns for periods of less than one year are not annualized.
D Total returns would have been lower if certain expenses had not been reduced during the applicable periods shown.
E Amounts do not include the activity of the Underlying Funds.
F Expense ratios reflect operating expenses of the class. Expenses before reductions do not reflect amounts reimbursed by the investment adviser or reductions from expense offset arrangements and do not represent the amount paid by the class during periods when reimbursements or reductions occur. Expense ratios before reductions for start-up periods may not be representative of longer-term operating periods. Expenses net of fee waivers reflect expenses after reimbursement by the investment adviser but prior to reductions from expense offset arrangements. Expenses net of all reductions represent the net expenses paid by the class but do not include expenses of the underlying funds in which the Fund invests.
G On certain classes, the size and fluctuation of net assets and expense amounts may cause ratios to differ from contractual rates.
H Annualized
I The portfolio turnover rate does not include the assets acquired in the merger.
See accompanying notes which are an integral part of the financial statements.
Fidelity Freedom® 2045 Fund
Investment Summary (Unaudited)
The information in the following tables is based on the direct investments of the Fund.
Top Holdings as of March 31, 2019
| | % of fund's net assets |
| Fidelity Series Intrinsic Opportunities Fund | 10.1 |
| Fidelity Series International Growth Fund | 9.3 |
| Fidelity Series Emerging Markets Opportunities Fund | 9.1 |
| Fidelity Series Large Cap Stock Fund | 9.0 |
| Fidelity Series Growth Company Fund | 8.9 |
| Fidelity Series International Value Fund | 8.7 |
| Fidelity Series Stock Selector Large Cap Value Fund | 6.8 |
| Fidelity Series Value Discovery Fund | 4.8 |
| Fidelity Series Opportunistic Insights Fund | 4.6 |
| Fidelity Series Blue Chip Growth Fund | 4.4 |
| | 75.7 |
Asset Allocation (% of fund's net assets)
| Period end |
| | Domestic Equity Funds | 60.9% |
| | International Equity Funds | 31.3% |
| | Bond Funds | 6.8% |
| | Short-Term Funds | 1.1% |
| | Net Other Assets (Liabilities)* | (0.1)% |

* Net Other Assets (Liabilities) are not included in the pie chart
Domestic Equity Funds category includes Fidelity Series Commodity Strategy Fund which invests in commodity-related investments.
Fidelity Freedom® 2045 Fund
Schedule of Investments March 31, 2019
Showing Percentage of Net Assets
| U.S. Treasury Obligations - 0.0% | | | |
| | | Principal Amount | Value |
| U.S. Treasury Bills, yield at date of purchase 2.39% 4/4/19 (a) | | | |
| (Cost $6,798,655) | | 6,800,000 | 6,798,662 |
| | | Shares | Value |
|
| Domestic Equity Funds - 60.9% | | | |
| Fidelity Series All-Sector Equity Fund (b) | | 35,592,846 | $342,759,111 |
| Fidelity Series Blue Chip Growth Fund (b) | | 41,330,022 | 609,617,828 |
| Fidelity Series Commodity Strategy Fund (b) | | 72,057,316 | 343,713,396 |
| Fidelity Series Growth Company Fund (b) | | 72,716,028 | 1,229,628,037 |
| Fidelity Series Intrinsic Opportunities Fund (b) | | 84,461,347 | 1,389,389,164 |
| Fidelity Series Large Cap Stock Fund (b) | | 84,446,015 | 1,237,134,113 |
| Fidelity Series Large Cap Value Index Fund (b) | | 28,093,416 | 348,639,288 |
| Fidelity Series Opportunistic Insights Fund (b) | | 36,422,646 | 636,667,857 |
| Fidelity Series Small Cap Discovery Fund (b) | | 14,392,188 | 160,041,128 |
| Fidelity Series Small Cap Opportunities Fund (b) | | 37,445,918 | 504,022,058 |
| Fidelity Series Stock Selector Large Cap Value Fund (b) | | 80,102,025 | 945,203,894 |
| Fidelity Series Value Discovery Fund (b) | | 53,015,285 | 662,160,913 |
| TOTAL DOMESTIC EQUITY FUNDS | | | |
| (Cost $7,220,497,135) | | | 8,408,976,787 |
|
| International Equity Funds - 31.3% | | | |
| Fidelity Series Canada Fund (b) | | 12,759,395 | 131,549,368 |
| Fidelity Series Emerging Markets Fund (b) | | 13,775,148 | 134,858,698 |
| Fidelity Series Emerging Markets Opportunities Fund (b) | | 68,039,197 | 1,260,766,325 |
| Fidelity Series International Growth Fund (b) | | 84,915,431 | 1,289,865,390 |
| Fidelity Series International Small Cap Fund (b) | | 19,189,229 | 298,008,728 |
| Fidelity Series International Value Fund (b) | | 129,726,153 | 1,206,453,222 |
| TOTAL INTERNATIONAL EQUITY FUNDS | | | |
| (Cost $3,906,978,176) | | | 4,321,501,731 |
|
| Bond Funds - 6.8% | | | |
| Fidelity Series Emerging Markets Debt Fund (b) | | 9,020,529 | 86,506,877 |
| Fidelity Series Floating Rate High Income Fund (b) | | 1,849,790 | 17,147,554 |
| Fidelity Series High Income Fund (b) | | 15,608,659 | 146,721,391 |
| Fidelity Series Inflation-Protected Bond Index Fund (b) | | 4,107,893 | 40,175,190 |
| Fidelity Series International Credit Fund (b) | | 603,737 | 5,970,961 |
| Fidelity Series Investment Grade Bond Fund (b) | | 7,480,933 | 83,636,826 |
| Fidelity Series Long-Term Treasury Bond Index Fund (b) | | 55,678,711 | 493,870,168 |
| Fidelity Series Real Estate Income Fund (b) | | 5,764,401 | 62,889,620 |
| TOTAL BOND FUNDS | | | |
| (Cost $923,507,913) | | | 936,918,587 |
|
| Short-Term Funds - 1.1% | | | |
| Fidelity Cash Central Fund, 2.48% (c) | | 20,576,302 | 20,580,417 |
| Fidelity Series Government Money Market Fund 2.50%(b)(d) | | 99,322,094 | 99,322,094 |
| Fidelity Series Short-Term Credit Fund (b) | | 2,745,011 | 27,367,758 |
| TOTAL SHORT-TERM FUNDS | | | |
| (Cost $147,196,837) | | | 147,270,269 |
| TOTAL INVESTMENT IN SECURITIES - 100.1% | | | |
| (Cost $12,204,978,716) | | | 13,821,466,036 |
| NET OTHER ASSETS (LIABILITIES) - (0.1)% | | | (7,972,997) |
| NET ASSETS - 100% | | | $13,813,493,039 |
| Futures Contracts | | | | | |
| | Number of contracts | Expiration Date | Notional Amount | Value | Unrealized Appreciation/(Depreciation) |
| Purchased | | | | | |
| Treasury Contracts | | | | | |
| CBOT 2-Year U.S. Treasury Note Contracts (United States) | 21 | June 2019 | $4,474,969 | $17,761 | $17,761 |
| CBOT 5-Year U.S. Treasury Note Contracts (United States) | 52 | June 2019 | 6,023,063 | 59,528 | 59,528 |
| CBOT Long Term U.S. Treasury Bond Contracts (United States) | 28 | June 2019 | 4,190,375 | 146,940 | 146,940 |
| CBOT Long Term U.S. Treasury Bond Contracts (United States) | 34 | June 2019 | 4,223,438 | 75,225 | 75,225 |
| CBOT Ultra Long Term U.S. Treasury Bond Contracts (United States) | 42 | June 2019 | 7,056,000 | 351,165 | 351,165 |
|
| TOTAL PURCHASED | | | | | 650,619 |
|
| Sold | | | | | |
| Equity Index Contracts | | | | | |
| ICE E-mini MSCI EAFE Index Contracts (United States) | 47 | June 2019 | 4,386,040 | (92,700) | (92,700) |
| ICE E-mini MSCI Emerging Markets Index Contracts (United States) | 676 | June 2019 | 35,740,120 | (666,420) | (666,420) |
|
| TOTAL SOLD | | | | | (759,120) |
|
| TOTAL FUTURES CONTRACTS | | | | | $(108,501) |
The notional amount of futures purchased as a percentage of Net Assets is 0.2%
The notional amount of futures sold as a percentage of Net Assets is 0.3%
Legend
(a) Security or a portion of the security was pledged to cover margin requirements for futures contracts. At period end, the value of securities pledged amounted to $2,628,483.
(b) Affiliated Fund
(c) Affiliated fund that is generally available only to investment companies and other accounts managed by Fidelity Investments. The rate quoted is the annualized seven-day yield of the fund at period end. A complete unaudited listing of the fund's holdings as of its most recent quarter end is available upon request. In addition, each Fidelity Central Fund's financial statements , which are not covered by the Fund's Report of Independent Registered Public Accounting Firm, are available on the SEC's website or upon request.
(d) The rate quoted is the annualized seven-day yield of the fund at period end.
Affiliated Central Funds
Information regarding fiscal year to date income earned by the Fund from investments in Fidelity Central Funds is as follows:
| Fund | Income earned |
| Fidelity Cash Central Fund | $240,668 |
| Total | $240,668 |
Amounts in the income column in the above table include any capital gain distributions from underlying funds, which are presented in the corresponding line-item in the Statement of Operations, if applicable.
Affiliated Underlying Funds
Fiscal year to date information regarding the Fund's investments in affiliated Underlying Funds, excluding any Money Market Central Funds, is presented below. Exchanges between classes of the same affiliated Underlying Funds may occur.
| Affiliate | Value, beginning of period | Purchases | Sales Proceeds | Dividend Income | Realized Gain (loss) | Change in Unrealized appreciation (depreciation) | Value, end of period |
| Fidelity Series 100 Index Fund | $263,182,195 | $35,408 | $281,858,315 | $-- | $118,503,464 | $(99,862,752) | $-- |
| Fidelity Series All-Sector Equity Fund | 507,057,960 | 122,923,424 | 247,272,614 | 82,492,757 | 16,938,518 | (56,888,177) | 342,759,111 |
| Fidelity Series Blue Chip Growth Fund | 524,034,296 | 131,087,690 | 66,117,732 | 73,270,154 | 2,555,383 | 18,058,191 | 609,617,828 |
| Fidelity Series Canada Fund | 116,819,435 | 23,551,973 | 10,798,228 | 2,824,137 | (65,375) | 2,041,563 | 131,549,368 |
| Fidelity Series Commodity Strategy Fund | 278,070,063 | 151,264,361 | 48,013,803 | 19,718,549 | (16,843,393) | (20,763,832) | 343,713,396 |
| Fidelity Series Emerging Markets Debt Fund | 84,775,451 | 13,100,834 | 7,280,917 | 5,092,373 | (294,625) | (3,793,866) | 86,506,877 |
| Fidelity Series Emerging Markets Fund | -- | 134,198,626 | 5,055,451 | 518,468 | (95,742) | 5,811,265 | 134,858,698 |
| Fidelity Series Emerging Markets Opportunities Fund | 1,214,195,749 | 343,013,556 | 112,122,064 | 95,718,070 | 320,929 | (184,641,845) | 1,260,766,325 |
| Fidelity Series Floating Rate High Income Fund | 29,413,979 | 4,299,137 | 16,025,857 | 1,567,476 | (1,057,454) | 517,749 | 17,147,554 |
| Fidelity Series Government Money Market Fund 2.50% | 212,944,275 | 232,074,472 | 345,696,653 | 3,434,546 | -- | -- | 99,322,094 |
| Fidelity Series Growth Company Fund | 1,066,317,020 | 287,898,017 | 107,447,102 | 119,560,204 | (811,619) | (16,328,279) | 1,229,628,037 |
| Fidelity Series High Income Fund | 182,802,662 | 28,563,303 | 62,283,868 | 11,709,473 | (2,729,500) | 368,794 | 146,721,391 |
| Fidelity Series Inflation-Protected Bond Index Fund | 107,538,333 | 15,127,778 | 83,190,038 | 837,727 | (1,129,327) | 1,828,444 | 40,175,190 |
| Fidelity Series International Credit Fund | 5,867,034 | 291,938 | 171,404 | 290,857 | (2,178) | (14,429) | 5,970,961 |
| Fidelity Series International Growth Fund | 1,176,177,691 | 296,545,811 | 116,790,017 | 78,773,999 | (3,936,396) | (62,131,699) | 1,289,865,390 |
| Fidelity Series International Small Cap Fund | 293,469,300 | 69,326,469 | 15,160,780 | 26,608,831 | (970,093) | (48,656,168) | 298,008,728 |
| Fidelity Series International Value Fund | 1,190,569,587 | 224,132,051 | 59,074,076 | 43,188,160 | (3,671,817) | (145,502,523) | 1,206,453,222 |
| Fidelity Series Intrinsic Opportunities Fund | 1,296,043,058 | 272,799,763 | 56,472,238 | 107,433,841 | (429,610) | (122,551,809) | 1,389,389,164 |
| Fidelity Series Investment Grade Bond Fund | 63,493,715 | 33,691,762 | 15,059,078 | 2,233,992 | (233,046) | 1,743,473 | 83,636,826 |
| Fidelity Series Large Cap Stock Fund | 1,146,756,357 | 246,545,989 | 113,231,065 | 123,091,805 | 158,933 | (43,096,101) | 1,237,134,113 |
| Fidelity Series Large Cap Value Index Fund | 326,476,656 | 50,315,775 | 31,446,905 | 15,986,344 | (133,617) | 3,427,379 | 348,639,288 |
| Fidelity Series Long-Term Treasury Bond Index Fund | 298,749,888 | 346,603,831 | 170,495,494 | 13,181,571 | (4,565,673) | 23,577,616 | 493,870,168 |
| Fidelity Series Opportunistic Insights Fund | 574,264,670 | 113,162,281 | 54,450,427 | 50,912,659 | (185,570) | 3,876,903 | 636,667,857 |
| Fidelity Series Real Estate Equity Fund | 104,846,888 | 1,163,810 | 110,503,750 | 1,022,178 | 2,026,500 | 2,466,552 | -- |
| Fidelity Series Real Estate Income Fund | 56,559,805 | 10,635,004 | 5,452,490 | 4,362,894 | (79,439) | 1,226,740 | 62,889,620 |
| Fidelity Series Short-Term Credit Fund | 39,780,377 | 8,379,138 | 21,157,244 | 1,000,913 | (134,268) | 499,755 | 27,367,758 |
| Fidelity Series Small Cap Discovery Fund | 153,285,060 | 36,298,752 | 14,969,457 | 19,396,257 | (603,452) | (13,969,775) | 160,041,128 |
| Fidelity Series Small Cap Opportunities Fund | 473,946,400 | 108,057,430 | 50,061,558 | 56,745,381 | 7,643 | (27,927,857) | 504,022,058 |
| Fidelity Series Stock Selector Large Cap Value Fund | 892,343,372 | 180,553,472 | 92,231,235 | 79,053,623 | (2,396,138) | (33,065,577) | 945,203,894 |
| Fidelity Series Value Discovery Fund | 633,054,295 | 108,623,036 | 60,459,461 | 39,557,536 | (1,136,190) | (17,920,767) | 662,160,913 |
| | $13,312,835,571 | $3,594,264,891 | $2,380,349,321 | $1,079,584,775 | $99,006,848 | $(831,671,032) | $13,794,086,957 |
Amounts in the income column in the above table include any capital gain distributions from underlying funds, which are presented in the corresponding line-item in the Statement of Operations, if applicable.
Investment Valuation
The following is a summary of the inputs used, as of March 31, 2019, involving the Fund's assets and liabilities carried at fair value. The inputs or methodology used for valuing securities may not be an indication of the risk associated with investing in those securities. For more information on valuation inputs, and their aggregation into the levels used below, please refer to the Investment Valuation section in the accompanying Notes to Financial Statements.
| | Valuation Inputs at Reporting Date: |
| Description | Total | Level 1 | Level 2 | Level 3 |
| Investments in Securities: | | | | |
| Other Short-Term Investments | $6,798,662 | $-- | $6,798,662 | $-- |
| Domestic Equity Funds | 8,408,976,787 | 8,408,976,787 | -- | -- |
| International Equity Funds | 4,321,501,731 | 4,321,501,731 | -- | -- |
| Bond Funds | 936,918,587 | 936,918,587 | -- | -- |
| Short-Term Funds | 147,270,269 | 147,270,269 | -- | -- |
| Total Investments in Securities: | $13,821,466,036 | $13,814,667,374 | $6,798,662 | $-- |
| Derivative Instruments: | | | | |
| Assets | | | | |
| Futures Contracts | $650,619 | $650,619 | $-- | $-- |
| Total Assets | $650,619 | $650,619 | $-- | $-- |
| Liabilities | | | | |
| Futures Contracts | $(759,120) | $(759,120) | $-- | $-- |
| Total Liabilities | $(759,120) | $(759,120) | $-- | $-- |
| Total Derivative Instruments: | $(108,501) | $(108,501) | $-- | $-- |
Value of Derivative Instruments
The following table is a summary of the Fund's value of derivative instruments by primary risk exposure as of March 31, 2019. For additional information on derivative instruments, please refer to the Derivative Instruments section in the accompanying Notes to Financial Statements.
| Primary Risk Exposure / Derivative Type | Value |
| | Asset | Liability |
| Equity Risk | | |
| Futures Contracts(a) | $0 | $(759,120) |
| Total Equity Risk | 0 | (759,120) |
| Interest Rate Risk | | |
| Futures Contracts | 650,619 | 0 |
| Total Interest Rate Risk | 650,619 | 0 |
| Total Value of Derivatives | $650,619 | $(759,120) |
(a) Reflects gross cumulative appreciation (depreciation) on futures contracts as presented in the Schedule of Investments. In the Statement of Assets and Liabilities, the period end daily variation margin is included in receivable or payable for daily variation margin on futures contracts, and the net cumulative appreciation (depreciation) is included in distributable earnings.
See accompanying notes which are an integral part of the financial statements.
Fidelity Freedom® 2045 Fund
Financial Statements
Statement of Assets and Liabilities
| | | March 31, 2019 |
| Assets | | |
Investment in securities, at value — See accompanying schedule:
Unaffiliated issuers (cost $6,798,655) | $6,798,662 | |
| Fidelity Central Funds (cost $20,580,098) | 20,580,417 | |
| Other affiliated issuers (cost $12,177,599,963) | 13,794,086,957 | |
| Total Investment in Securities (cost $12,204,978,716) | | $13,821,466,036 |
| Receivable for investments sold | | 27,206,511 |
| Receivable for fund shares sold | | 48,722,363 |
| Distributions receivable from Fidelity Central Funds | | 39,126 |
| Total assets | | 13,897,434,036 |
| Liabilities | | |
| Payable for investments purchased | $20,081,228 | |
| Payable for fund shares redeemed | 55,844,097 | |
| Accrued management fee | 7,555,247 | |
| Payable for daily variation margin on futures contracts | 437,387 | |
| Other payables and accrued expenses | 23,038 | |
| Total liabilities | | 83,940,997 |
| Net Assets | | $13,813,493,039 |
| Net Assets consist of: | | |
| Paid in capital | | $11,699,883,152 |
| Total distributable earnings (loss) | | 2,113,609,887 |
| Net Assets | | $13,813,493,039 |
| Net Asset Value and Maximum Offering Price | | |
| Fidelity Freedom 2045 Fund: | | |
| Net Asset Value, offering price and redemption price per share ($4,345,914,404 ÷ 379,767,089 shares) | | $11.44 |
| Class K: | | |
| Net Asset Value, offering price and redemption price per share ($7,982,073,373 ÷ 698,499,709 shares) | | $11.43 |
| Class K6: | | |
| Net Asset Value, offering price and redemption price per share ($1,485,505,262 ÷ 130,200,622 shares) | | $11.41 |
See accompanying notes which are an integral part of the financial statements.
Statement of Operations
| | | Year ended March 31, 2019 |
| Investment Income | | |
| Dividends: | | |
| Affiliated issuers | | $283,823,396 |
| Interest | | 141,892 |
| Income from Fidelity Central Funds | | 240,668 |
| Total income | | 284,205,956 |
| Expenses | | |
| Management fee | $89,434,920 | |
| Independent trustees' fees and expenses | 63,248 | |
| Total expenses before reductions | 89,498,168 | |
| Expense reductions | (36) | |
| Total expenses after reductions | | 89,498,132 |
| Net investment income (loss) | | 194,707,824 |
| Realized and Unrealized Gain (Loss) | | |
| Net realized gain (loss) on: | | |
| Investment securities: | | |
| Unaffiliated issuers | 15,145 | |
| Fidelity Central Funds | (281) | |
| Other affiliated issuers | 99,006,848 | |
| Futures contracts | (7,328,179) | |
| Capital gain distributions from underlying funds: | | |
| Affiliated issuers | 795,761,379 | |
| Total net realized gain (loss) | | 887,454,912 |
| Change in net unrealized appreciation (depreciation) on: | | |
| Investment securities: | | |
| Unaffiliated issuers | 7 | |
| Fidelity Central Funds | 319 | |
| Other affiliated issuers | (831,671,032) | |
| Futures contracts | (108,501) | |
| Total change in net unrealized appreciation (depreciation) | | (831,779,207) |
| Net gain (loss) | | 55,675,705 |
| Net increase (decrease) in net assets resulting from operations | | $250,383,529 |
See accompanying notes which are an integral part of the financial statements.
Statement of Changes in Net Assets
| | Year ended March 31, 2019 | Year ended March 31, 2018 |
| Increase (Decrease) in Net Assets | | |
| Operations | | |
| Net investment income (loss) | $194,707,824 | $142,234,368 |
| Net realized gain (loss) | 887,454,912 | 576,736,884 |
| Change in net unrealized appreciation (depreciation) | (831,779,207) | 374,497,649 |
| Net increase (decrease) in net assets resulting from operations | 250,383,529 | 1,093,468,901 |
| Distributions to shareholders | (922,311,809) | – |
| Distributions to shareholders from net investment income | – | (156,078,537) |
| Distributions to shareholders from net realized gain | – | (256,279,773) |
| Total distributions | (922,311,809) | (412,358,310) |
| Share transactions - net increase (decrease) | 1,180,095,049 | 9,128,031,725 |
| Total increase (decrease) in net assets | 508,166,769 | 9,809,142,316 |
| Net Assets | | |
| Beginning of period | 13,305,326,270 | 3,496,183,954 |
| End of period | $13,813,493,039 | $13,305,326,270 |
See accompanying notes which are an integral part of the financial statements.
Financial Highlights
Fidelity Freedom 2045 Fund
| Years ended March 31, | 2019 | 2018 | 2017 | 2016 | 2015 |
| Selected Per–Share Data | | | | | |
| Net asset value, beginning of period | $12.09 | $11.00 | $9.89 | $10.84 | $11.09 |
| Income from Investment Operations | | | | | |
| Net investment income (loss)A | .16 | .12 | .15 | .15 | .17 |
| Net realized and unrealized gain (loss) | (.01)B | 1.46 | 1.39 | (.52) | .64 |
| Total from investment operations | .15 | 1.58 | 1.54 | (.37) | .81 |
| Distributions from net investment income | (.17) | (.13) | (.15) | (.16) | (.18) |
| Distributions from net realized gain | (.63) | (.35) | (.28) | (.43) | (.89) |
| Total distributions | (.80) | (.49)C | (.43) | (.58)D | (1.06)E |
| Net asset value, end of period | $11.44 | $12.09 | $11.00 | $9.89 | $10.84 |
| Total ReturnF | 1.72% | 14.48% | 16.08% | (3.59)% | 7.93% |
| Ratios to Average Net AssetsG,H | | | | | |
| Expenses before reductions | .75% | .63%I | - %J | - %J | - %J |
| Expenses net of fee waivers, if any | .75% | .63%I | -% | -% | -% |
| Expenses net of all reductions | .75% | .63%I | -% | -% | -% |
| Net investment income (loss) | 1.37% | 1.04% | 1.45% | 1.48% | 1.62% |
| Supplemental Data | | | | | |
| Net assets, end of period (000 omitted) | $4,345,914 | $4,144,152 | $3,496,184 | $2,912,972 | $2,993,926 |
| Portfolio turnover rateH | 18% | 17%K | 15% | 17% | 21% |
A Calculated based on average shares outstanding during the period.
B The amount shown for a share outstanding does not correspond with the aggregate net gain (loss) on investments for the period due to the timing of sales and repurchases of shares in relation to fluctuating market values of the investments of the Fund.
C Total distributions of $.49 per share is comprised of distributions from net investment income of $.134 and distributions from net realized gain of $.352 per share.
D Total distributions of $.58 per share is comprised of distributions from net investment income of $.155 and distributions from net realized gain of $.427 per share.
E Total distributions of $1.06 per share is comprised of distributions from net investment income of $.178 and distributions from net realized gain of $.886 per share.
F Total returns would have been lower if certain expenses had not been reduced during the applicable periods shown.
G Expense ratios reflect operating expenses of the class. Expenses before reductions do not reflect amounts reimbursed by the investment adviser or reductions from expense offset arrangements and do not represent the amount paid by the class during periods when reimbursements or reductions occur. Expenses net of fee waivers reflect expenses after reimbursement by the investment adviser but prior to reductions from expense offset arrangements. Expenses net of all reductions represent the net expenses paid by the class but do not include expenses of the underlying funds in which the Fund invests.
H Amounts do not include the activity of the Underlying Funds.
I On certain classes, the size and fluctuation of net assets and expense amounts may cause ratios to differ from contractual rates.
J Amount represents less than .005%.
K The portfolio turnover rate does not include the assets acquired in the merger.
See accompanying notes which are an integral part of the financial statements.
Fidelity Freedom 2045 Fund Class K
| Years ended March 31, | 2019 | 2018 A |
| Selected Per–Share Data | | |
| Net asset value, beginning of period | $12.08 | $11.59 |
| Income from Investment Operations | | |
| Net investment income (loss)B | .17 | .17 |
| Net realized and unrealized gain (loss) | (.01)C | .67 |
| Total from investment operations | .16 | .84 |
| Distributions from net investment income | (.18) | (.15) |
| Distributions from net realized gain | (.63) | (.19) |
| Total distributions | (.81) | (.35)D |
| Net asset value, end of period | $11.43 | $12.08 |
| Total ReturnE,F | 1.83% | 7.21% |
| Ratios to Average Net AssetsG,H | | |
| Expenses before reductions | .64% | .65%I,J |
| Expenses net of fee waivers, if any | .64% | .65%I,J |
| Expenses net of all reductions | .64% | .65%I,J |
| Net investment income (loss) | 1.47% | 2.05%I |
| Supplemental Data | | |
| Net assets, end of period (000 omitted) | $7,982,073 | $8,748,416 |
| Portfolio turnover rateG | 18% | 17%K |
A For the period July 20, 2017 (commencement of sale of shares) to March 31, 2018.
B Calculated based on average shares outstanding during the period.
C The amount shown for a share outstanding does not correspond with the aggregate net gain (loss) on investments for the period due to the timing of sales and repurchases of shares in relation to fluctuating market values of the investments of the Fund.
D Total distributions of $.35 per share is comprised of distributions from net investment income of $.153 and distributions from net realized gain of $.194 per share.
E Total returns for periods of less than one year are not annualized.
F Total returns would have been lower if certain expenses had not been reduced during the applicable periods shown.
G Amounts do not include the activity of the Underlying Funds.
H Expense ratios reflect operating expenses of the class. Expenses before reductions do not reflect amounts reimbursed by the investment adviser or reductions from expense offset arrangements and do not represent the amount paid by the class during periods when reimbursements or reductions occur. Expense ratios before reductions for start-up periods may not be representative of longer-term operating periods. Expenses net of fee waivers reflect expenses after reimbursement by the investment adviser but prior to reductions from expense offset arrangements. Expenses net of all reductions represent the net expenses paid by the class but do not include expenses of the underlying funds in which the Fund invests.
I Annualized
J On certain classes, the size and fluctuation of net assets and expense amounts may cause ratios to differ from contractual rates.
K The portfolio turnover rate does not include the assets acquired in the merger.
See accompanying notes which are an integral part of the financial statements.
Fidelity Freedom 2045 Fund Class K6
| Years ended March 31, | 2019 | 2018 A |
| Selected Per–Share Data | | |
| Net asset value, beginning of period | $12.09 | $11.34 |
| Income from Investment Operations | | |
| Net investment income (loss)B | .18 | .14 |
| Net realized and unrealized gain (loss) | (.01)C | .96 |
| Total from investment operations | .17 | 1.10 |
| Distributions from net investment income | (.21) | (.16) |
| Distributions from net realized gain | (.64) | (.19) |
| Total distributions | (.85) | (.35) |
| Net asset value, end of period | $11.41 | $12.09 |
| Total ReturnD,E | 1.95% | 9.70% |
| Ratios to Average Net AssetsF,G | | |
| Expenses before reductions | .50%H | .50%H,I |
| Expenses net of fee waivers, if any | .50%H | .50%H,I |
| Expenses net of all reductions | .50%H | .50%H,I |
| Net investment income (loss) | 1.62% | 1.45%I |
| Supplemental Data | | |
| Net assets, end of period (000 omitted) | $1,485,505 | $412,758 |
| Portfolio turnover rateF | 18% | 17%J |
A For the period June 7, 2017 (commencement of sale of shares) to March 31, 2018.
B Calculated based on average shares outstanding during the period.
C The amount shown for a share outstanding does not correspond with the aggregate net gain (loss) on investments for the period due to the timing of sales and repurchases of shares in relation to fluctuating market values of the investments of the Fund.
D Total returns for periods of less than one year are not annualized.
E Total returns would have been lower if certain expenses had not been reduced during the applicable periods shown.
F Amounts do not include the activity of the Underlying Funds.
G Expense ratios reflect operating expenses of the class. Expenses before reductions do not reflect amounts reimbursed by the investment adviser or reductions from expense offset arrangements and do not represent the amount paid by the class during periods when reimbursements or reductions occur. Expense ratios before reductions for start-up periods may not be representative of longer-term operating periods. Expenses net of fee waivers reflect expenses after reimbursement by the investment adviser but prior to reductions from expense offset arrangements. Expenses net of all reductions represent the net expenses paid by the class but do not include expenses of the underlying funds in which the Fund invests.
H On certain classes, the size and fluctuation of net assets and expense amounts may cause ratios to differ from contractual rates.
I Annualized
J The portfolio turnover rate does not include the assets acquired in the merger.
See accompanying notes which are an integral part of the financial statements.
Fidelity Freedom® 2050 Fund
Investment Summary (Unaudited)
The information in the following tables is based on the direct investments of the Fund.
Top Holdings as of March 31, 2019
| | % of fund's net assets |
| Fidelity Series Intrinsic Opportunities Fund | 10.1 |
| Fidelity Series International Growth Fund | 9.3 |
| Fidelity Series Emerging Markets Opportunities Fund | 9.1 |
| Fidelity Series Large Cap Stock Fund | 8.9 |
| Fidelity Series Growth Company Fund | 8.9 |
| Fidelity Series International Value Fund | 8.7 |
| Fidelity Series Stock Selector Large Cap Value Fund | 6.8 |
| Fidelity Series Value Discovery Fund | 4.8 |
| Fidelity Series Opportunistic Insights Fund | 4.6 |
| Fidelity Series Blue Chip Growth Fund | 4.4 |
| | 75.6 |
Asset Allocation (% of fund's net assets)
| Period end |
| | Domestic Equity Funds | 60.9% |
| | International Equity Funds | 31.3% |
| | Bond Funds | 6.8% |
| | Short-Term Funds | 1.1% |
| | Net Other Assets (Liabilities)* | (0.1)% |

* Net Other Assets (Liabilities) are not included in the pie chart
Domestic Equity Funds category includes Fidelity Series Commodity Strategy Fund which invests in commodity-related investments.
Fidelity Freedom® 2050 Fund
Schedule of Investments March 31, 2019
Showing Percentage of Net Assets
| U.S. Treasury Obligations - 0.0% | | | |
| | | Principal Amount | Value |
| U.S. Treasury Bills, yield at date of purchase 2.39% 4/4/19 (a) | | | |
| (Cost $5,778,857) | | 5,780,000 | 5,778,862 |
| | | Shares | Value |
|
| Domestic Equity Funds - 60.9% | | | |
| Fidelity Series All-Sector Equity Fund (b) | | 30,513,299 | $293,843,071 |
| Fidelity Series Blue Chip Growth Fund (b) | | 35,464,388 | 523,099,724 |
| Fidelity Series Commodity Strategy Fund (b) | | 61,783,124 | 294,705,502 |
| Fidelity Series Growth Company Fund (b) | | 62,367,720 | 1,054,638,147 |
| Fidelity Series Intrinsic Opportunities Fund (b) | | 72,694,002 | 1,195,816,331 |
| Fidelity Series Large Cap Stock Fund (b) | | 72,345,366 | 1,059,859,617 |
| Fidelity Series Large Cap Value Index Fund (b) | | 24,077,169 | 298,797,673 |
| Fidelity Series Opportunistic Insights Fund (b) | | 31,254,407 | 546,327,032 |
| Fidelity Series Small Cap Discovery Fund (b) | | 12,359,133 | 137,433,557 |
| Fidelity Series Small Cap Opportunities Fund (b) | | 32,126,020 | 432,416,223 |
| Fidelity Series Stock Selector Large Cap Value Fund (b) | | 68,671,533 | 810,324,088 |
| Fidelity Series Value Discovery Fund (b) | | 45,451,936 | 567,694,681 |
| TOTAL DOMESTIC EQUITY FUNDS | | | |
| (Cost $6,232,919,611) | | | 7,214,955,646 |
|
| International Equity Funds - 31.3% | | | |
| Fidelity Series Canada Fund (b) | | 10,938,057 | 112,771,368 |
| Fidelity Series Emerging Markets Fund (b) | | 11,806,662 | 115,587,225 |
| Fidelity Series Emerging Markets Opportunities Fund (b) | | 58,308,121 | 1,080,449,482 |
| Fidelity Series International Growth Fund (b) | | 72,796,342 | 1,105,776,441 |
| Fidelity Series International Small Cap Fund (b) | | 16,448,972 | 255,452,528 |
| Fidelity Series International Value Fund (b) | | 111,207,932 | 1,034,233,769 |
| TOTAL INTERNATIONAL EQUITY FUNDS | | | |
| (Cost $3,360,134,305) | | | 3,704,270,813 |
|
| Bond Funds - 6.8% | | | |
| Fidelity Series Emerging Markets Debt Fund (b) | | 7,714,522 | 73,982,269 |
| Fidelity Series Floating Rate High Income Fund (b) | | 1,586,497 | 14,706,825 |
| Fidelity Series High Income Fund (b) | | 13,364,782 | 125,628,953 |
| Fidelity Series Inflation-Protected Bond Index Fund (b) | | 3,521,038 | 34,435,748 |
| Fidelity Series International Credit Fund (b) | | 510,429 | 5,048,144 |
| Fidelity Series Investment Grade Bond Fund (b) | | 6,369,638 | 71,212,556 |
| Fidelity Series Long-Term Treasury Bond Index Fund (b) | | 47,727,791 | 423,345,503 |
| Fidelity Series Real Estate Income Fund (b) | | 4,945,701 | 53,957,596 |
| TOTAL BOND FUNDS | | | |
| (Cost $790,866,315) | | | 802,317,594 |
|
| Short-Term Funds - 1.1% | | | |
| Fidelity Cash Central Fund, 2.48% (c) | | 17,529,324 | 17,532,830 |
| Fidelity Series Government Money Market Fund 2.50% (b)(d) | | 85,102,014 | 85,102,014 |
| Fidelity Series Short-Term Credit Fund (b) | | 2,346,217 | 23,391,782 |
| TOTAL SHORT-TERM FUNDS | | | |
| (Cost $125,960,342) | | | 126,026,626 |
| TOTAL INVESTMENT IN SECURITIES - 100.1% | | | |
| (Cost $10,515,659,430) | | | 11,853,349,541 |
| NET OTHER ASSETS (LIABILITIES) - (0.1)% | | | (6,789,704) |
| NET ASSETS - 100% | | | $11,846,559,837 |
| Futures Contracts | | | | | |
| | Number of contracts | Expiration Date | Notional Amount | Value | Unrealized Appreciation/(Depreciation) |
| Purchased | | | | | |
| Treasury Contracts | | | | | |
| CBOT 2-Year U.S. Treasury Note Contracts (United States) | 18 | June 2019 | $3,835,688 | $15,243 | $15,243 |
| CBOT 5-Year U.S. Treasury Note Contracts (United States) | 45 | June 2019 | 5,212,266 | 51,331 | 51,331 |
| CBOT Long Term U.S. Treasury Bond Contracts (United States) | 24 | June 2019 | 3,591,750 | 125,948 | 125,948 |
| CBOT Long Term U.S. Treasury Bond Contracts (United States) | 30 | June 2019 | 3,726,563 | 66,539 | 66,539 |
| CBOT Ultra Long Term U.S. Treasury Bond Contracts (United States) | 36 | June 2019 | 6,048,000 | 300,999 | 300,999 |
|
| TOTAL PURCHASED | | | | | 560,060 |
|
| Sold | | | | | |
| Equity Index Contracts | | | | | |
| CME E-mini S&P 500 Index Contracts (United States) | 22 | June 2019 | 3,121,580 | (3,123) | (3,123) |
| ICE E-mini MSCI EAFE Index Contracts (United States) | 33 | June 2019 | 3,079,560 | (65,087) | (65,087) |
| ICE E-mini MSCI Emerging Markets Index Contracts (United States) | 567 | June 2019 | 29,977,290 | (558,966) | (558,966) |
|
| TOTAL SOLD | | | | | (627,176) |
|
| TOTAL FUTURES CONTRACTS | | | | | $(67,116) |
The notional amount of futures purchased as a percentage of Net Assets is 0.1%
The notional amount of futures sold as a percentage of Net Assets is 0.3%
Legend
(a) Security or a portion of the security was pledged to cover margin requirements for futures contracts. At period end, the value of securities pledged amounted to $2,198,567.
(b) Affiliated Fund
(c) Affiliated fund that is generally available only to investment companies and other accounts managed by Fidelity Investments. The rate quoted is the annualized seven-day yield of the fund at period end. A complete unaudited listing of the fund's holdings as of its most recent quarter end is available upon request. In addition, each Fidelity Central Fund's financial statements , which are not covered by the Fund's Report of Independent Registered Public Accounting Firm, are available on the SEC's website or upon request.
(d) The rate quoted is the annualized seven-day yield of the fund at period end.
Affiliated Central Funds
Information regarding fiscal year to date income earned by the Fund from investments in Fidelity Central Funds is as follows:
| Fund | Income earned |
| Fidelity Cash Central Fund | $196,284 |
| Total | $196,284 |
Amounts in the income column in the above table include any capital gain distributions from underlying funds, which are presented in the corresponding line-item in the Statement of Operations, if applicable.
Affiliated Underlying Funds
Fiscal year to date information regarding the Fund's investments in affiliated Underlying Funds, excluding any Money Market Central Funds, is presented below. Exchanges between classes of the same affiliated Underlying Funds may occur.
| Affiliate | Value, beginning of period | Purchases | Sales Proceeds | Dividend Income | Realized Gain (loss) | Change in Unrealized appreciation (depreciation) | Value, end of period |
| Fidelity Series 100 Index Fund | $222,464,053 | $56,827 | $238,274,425 | $-- | $97,847,141 | $(82,093,596) | $-- |
| Fidelity Series All-Sector Equity Fund | 429,071,816 | 110,356,834 | 211,519,688 | 70,431,587 | 13,808,723 | (47,874,614) | 293,843,071 |
| Fidelity Series Blue Chip Growth Fund | 443,402,520 | 119,957,262 | 57,997,825 | 62,417,550 | 1,087,462 | 16,650,305 | 523,099,724 |
| Fidelity Series Canada Fund | 98,832,496 | 21,935,720 | 9,697,470 | 2,408,373 | (55,881) | 1,756,503 | 112,771,368 |
| Fidelity Series Commodity Strategy Fund | 235,237,103 | 133,356,931 | 41,838,759 | 16,790,674 | (13,075,535) | (18,974,238) | 294,705,502 |
| Fidelity Series Emerging Markets Debt Fund | 71,582,940 | 12,343,846 | 6,490,390 | 4,327,749 | (240,962) | (3,213,165) | 73,982,269 |
| Fidelity Series Emerging Markets Fund | -- | 115,370,951 | 4,731,946 | 442,394 | (80,196) | 5,028,416 | 115,587,225 |
| Fidelity Series Emerging Markets Opportunities Fund | 1,027,149,604 | 314,044,841 | 104,471,394 | 81,670,184 | (1,523,755) | (154,749,814) | 1,080,449,482 |
| Fidelity Series Floating Rate High Income Fund | 25,093,502 | 4,036,677 | 13,962,846 | 1,342,063 | (1,106,264) | 645,756 | 14,706,825 |
| Fidelity Series Government Money Market Fund 2.50% | 180,118,828 | 200,216,380 | 295,233,194 | 2,924,638 | -- | -- | 85,102,014 |
| Fidelity Series Growth Company Fund | 902,132,390 | 263,927,640 | 96,946,616 | 102,192,126 | (3,105,383) | (11,369,884) | 1,054,638,147 |
| Fidelity Series High Income Fund | 154,489,571 | 26,643,454 | 53,516,682 | 9,968,669 | (2,268,095) | 280,705 | 125,628,953 |
| Fidelity Series Inflation-Protected Bond Index Fund | 90,992,656 | 13,718,140 | 70,872,934 | 715,044 | (947,896) | 1,545,782 | 34,435,748 |
| Fidelity Series International Credit Fund | 4,937,865 | 247,533 | 123,438 | 245,628 | (1,613) | (12,203) | 5,048,144 |
| Fidelity Series International Growth Fund | 995,013,836 | 269,634,994 | 102,998,397 | 67,215,565 | (3,908,691) | (51,965,301) | 1,105,776,441 |
| Fidelity Series International Small Cap Fund | 248,264,939 | 64,551,363 | 15,165,466 | 22,705,010 | (889,380) | (41,308,928) | 255,452,528 |
| Fidelity Series International Value Fund | 1,007,232,591 | 211,340,130 | 57,400,954 | 36,852,447 | (4,048,289) | (122,889,709) | 1,034,233,769 |
| Fidelity Series Intrinsic Opportunities Fund | 1,095,273,542 | 247,061,747 | 41,424,136 | 91,637,606 | (394,050) | (104,700,772) | 1,195,816,331 |
| Fidelity Series Investment Grade Bond Fund | 53,699,737 | 29,530,749 | 13,304,841 | 1,899,577 | (198,286) | 1,485,197 | 71,212,556 |
| Fidelity Series Large Cap Stock Fund | 970,491,938 | 227,503,310 | 101,567,122 | 104,990,132 | (734,135) | (35,834,374) | 1,059,859,617 |
| Fidelity Series Large Cap Value Index Fund | 276,330,213 | 47,870,868 | 28,254,228 | 13,646,128 | (148,235) | 2,999,055 | 298,797,673 |
| Fidelity Series Long-Term Treasury Bond Index Fund | 252,756,420 | 299,868,022 | 145,647,472 | 11,233,612 | (4,246,052) | 20,614,585 | 423,345,503 |
| Fidelity Series Opportunistic Insights Fund | 485,903,915 | 106,632,155 | 49,420,963 | 43,495,297 | (477,396) | 3,689,321 | 546,327,032 |
| Fidelity Series Real Estate Equity Fund | 88,578,147 | 981,590 | 93,370,139 | 825,806 | 1,459,039 | 2,351,363 | -- |
| Fidelity Series Real Estate Income Fund | 47,880,196 | 9,983,047 | 4,892,410 | 3,718,324 | (41,803) | 1,028,566 | 53,957,596 |
| Fidelity Series Short-Term Credit Fund | 33,678,083 | 7,645,884 | 18,245,462 | 853,101 | (110,698) | 423,975 | 23,391,782 |
| Fidelity Series Small Cap Discovery Fund | 129,743,700 | 33,453,678 | 13,424,396 | 16,517,329 | (621,455) | (11,717,970) | 137,433,557 |
| Fidelity Series Small Cap Opportunities Fund | 401,012,829 | 99,496,447 | 44,493,186 | 48,330,770 | (285,258) | (23,314,609) | 432,416,223 |
| Fidelity Series Stock Selector Large Cap Value Fund | 755,175,216 | 167,567,924 | 82,230,888 | 67,489,773 | (2,905,492) | (27,282,672) | 810,324,088 |
| Fidelity Series Value Discovery Fund | 535,725,735 | 102,246,110 | 54,075,768 | 33,760,446 | (1,314,797) | (14,886,599) | 567,694,681 |
| Total | $11,262,266,381 | $3,261,581,054 | $2,071,593,435 | $921,047,602 | $71,472,768 | $(693,688,919) | $11,830,037,849 |
Amounts in the income column in the above table include any capital gain distributions from underlying funds, which are presented in the corresponding line-item in the Statement of Operations, if applicable.
Investment Valuation
The following is a summary of the inputs used, as of March 31, 2019, involving the Fund's assets and liabilities carried at fair value. The inputs or methodology used for valuing securities may not be an indication of the risk associated with investing in those securities. For more information on valuation inputs, and their aggregation into the levels used below, please refer to the Investment Valuation section in the accompanying Notes to Financial Statements.
| | Valuation Inputs at Reporting Date: |
| Description | Total | Level 1 | Level 2 | Level 3 |
| Investments in Securities: | | | | |
| Other Short-Term Investments | $5,778,862 | $-- | $5,778,862 | $-- |
| Domestic Equity Funds | 7,214,955,646 | 7,214,955,646 | -- | -- |
| International Equity Funds | 3,704,270,813 | 3,704,270,813 | -- | -- |
| Bond Funds | 802,317,594 | 802,317,594 | -- | -- |
| Short-Term Funds | 126,026,626 | 126,026,626 | -- | -- |
| Total Investments in Securities: | $11,853,349,541 | $11,847,570,679 | $5,778,862 | $-- |
| Derivative Instruments: | | | | |
| Assets | | | | |
| Futures Contracts | $560,060 | $560,060 | $-- | $-- |
| Total Assets | $560,060 | $560,060 | $-- | $-- |
| Liabilities | | | | |
| Futures Contracts | $(627,176) | $(627,176) | $-- | $-- |
| Total Liabilities | $(627,176) | $(627,176) | $-- | $-- |
| Total Derivative Instruments: | $(67,116) | $(67,116) | $-- | $-- |
Value of Derivative Instruments
The following table is a summary of the Fund's value of derivative instruments by primary risk exposure as of March 31, 2019. For additional information on derivative instruments, please refer to the Derivative Instruments section in the accompanying Notes to Financial Statements.
| Primary Risk Exposure / Derivative Type | Value |
| | Asset | Liability |
| Equity Risk | | |
| Futures Contracts(a) | $0 | $(627,176) |
| Total Equity Risk | 0 | (627,176) |
| Interest Rate Risk | | |
| Futures Contracts | 560,060 | 0 |
| Total Interest Rate Risk | 560,060 | 0 |
| Total Value of Derivatives | $560,060 | $(627,176) |
(a) Reflects gross cumulative appreciation (depreciation) on futures contracts as presented in the Schedule of Investments. In the Statement of Assets and Liabilities, the period end daily variation margin is included in receivable or payable for daily variation margin on futures contracts, and the net cumulative appreciation (depreciation) is included in distributable earnings.
See accompanying notes which are an integral part of the financial statements.
Fidelity Freedom® 2050 Fund
Financial Statements
Statement of Assets and Liabilities
| | | March 31, 2019 |
| Assets | | |
Investment in securities, at value — See accompanying schedule:
Unaffiliated issuers (cost $5,778,857) | $5,778,862 | |
| Fidelity Central Funds (cost $17,532,544) | 17,532,830 | |
| Other affiliated issuers (cost $10,492,348,029) | 11,830,037,849 | |
| Total Investment in Securities (cost $10,515,659,430) | | $11,853,349,541 |
| Receivable for investments sold | | 17,280,419 |
| Receivable for fund shares sold | | 44,971,278 |
| Distributions receivable from Fidelity Central Funds | | 33,316 |
| Other receivables | | 23,036 |
| Total assets | | 11,915,657,590 |
| Liabilities | | |
| Payable for investments purchased | $27,553,658 | |
| Payable for fund shares redeemed | 34,694,543 | |
| Accrued management fee | 6,478,699 | |
| Payable for daily variation margin on futures contracts | 370,853 | |
| Total liabilities | | 69,097,753 |
| Net Assets | | $11,846,559,837 |
| Net Assets consist of: | | |
| Paid in capital | | $10,091,588,463 |
| Total distributable earnings (loss) | | 1,754,971,374 |
| Net Assets | | $11,846,559,837 |
| Net Asset Value and Maximum Offering Price | | |
| Fidelity Freedom 2050 Fund: | | |
| Net Asset Value, offering price and redemption price per share ($3,679,537,596 ÷ 319,418,362 shares) | | $11.52 |
| Class K: | | |
| Net Asset Value, offering price and redemption price per share ($6,982,416,362 ÷ 607,060,917 shares) | | $11.50 |
| Class K6: | | |
| Net Asset Value, offering price and redemption price per share ($1,184,605,879 ÷ 103,057,202 shares) | | $11.49 |
See accompanying notes which are an integral part of the financial statements.
Statement of Operations
| | | Year ended March 31, 2019 |
| Investment Income | | |
| Dividends: | | |
| Affiliated issuers | | $241,979,718 |
| Interest | | 127,248 |
| Income from Fidelity Central Funds | | 196,284 |
| Total income | | 242,303,250 |
| Expenses | | |
| Management fee | $76,149,695 | |
| Independent trustees' fees and expenses | 53,760 | |
| Total expenses before reductions | 76,203,455 | |
| Expense reductions | (27) | |
| Total expenses after reductions | | 76,203,428 |
| Net investment income (loss) | | 166,099,822 |
| Realized and Unrealized Gain (Loss) | | |
| Net realized gain (loss) on: | | |
| Investment securities: | | |
| Unaffiliated issuers | 55,930 | |
| Fidelity Central Funds | (253) | |
| Other affiliated issuers | 71,472,768 | |
| Futures contracts | (6,341,552) | |
| Capital gain distributions from underlying funds: | | |
| Affiliated issuers | 679,067,884 | |
| Total net realized gain (loss) | | 744,254,777 |
| Change in net unrealized appreciation (depreciation) on: | | |
| Investment securities: | | |
| Unaffiliated issuers | 5 | |
| Fidelity Central Funds | 286 | |
| Other affiliated issuers | (693,688,919) | |
| Futures contracts | (67,116) | |
| Total change in net unrealized appreciation (depreciation) | | (693,755,744) |
| Net gain (loss) | | 50,499,033 |
| Net increase (decrease) in net assets resulting from operations | | $216,598,855 |
See accompanying notes which are an integral part of the financial statements.
Statement of Changes in Net Assets
| | Year ended March 31, 2019 | Year ended March 31, 2018 |
| Increase (Decrease) in Net Assets | | |
| Operations | | |
| Net investment income (loss) | $166,099,822 | $119,339,449 |
| Net realized gain (loss) | 744,254,777 | 479,169,493 |
| Change in net unrealized appreciation (depreciation) | (693,755,744) | 312,072,760 |
| Net increase (decrease) in net assets resulting from operations | 216,598,855 | 910,581,702 |
| Distributions to shareholders | (772,525,632) | – |
| Distributions to shareholders from net investment income | – | (131,450,258) |
| Distributions to shareholders from net realized gain | – | (213,055,694) |
| Total distributions | (772,525,632) | (344,505,952) |
| Share transactions - net increase (decrease) | 1,146,558,939 | 7,805,021,541 |
| Total increase (decrease) in net assets | 590,632,162 | 8,371,097,291 |
| Net Assets | | |
| Beginning of period | 11,255,927,675 | 2,884,830,384 |
| End of period | $11,846,559,837 | $11,255,927,675 |
| Other Information | | |
| Distributions in excess of net investment income end of period | | $(1,076,446) |
See accompanying notes which are an integral part of the financial statements.
Financial Highlights
Fidelity Freedom 2050 Fund
| Years ended March 31, | 2019 | 2018 | 2017 | 2016 | 2015 |
| Selected Per–Share Data | | | | | |
| Net asset value, beginning of period | $12.16 | $11.05 | $9.93 | $10.90 | $11.15 |
| Income from Investment Operations | | | | | |
| Net investment income (loss)A | .16 | .12 | .15 | .15 | .17 |
| Net realized and unrealized gain (loss) | –B | 1.48 | 1.40 | (.52) | .65 |
| Total from investment operations | .16 | 1.60 | 1.55 | (.37) | .82 |
| Distributions from net investment income | (.17) | (.14) | (.15) | (.16) | (.18) |
| Distributions from net realized gain | (.63) | (.35) | (.28) | (.44) | (.89) |
| Total distributions | (.80) | (.49) | (.43) | (.60) | (1.07) |
| Net asset value, end of period | $11.52 | $12.16 | $11.05 | $9.93 | $10.90 |
| Total ReturnC | 1.73% | 14.59% | 16.11% | (3.65)% | 7.91% |
| Ratios to Average Net AssetsD,E | | | | | |
| Expenses before reductions | .75% | .63%F | - %G | - %G | - %G |
| Expenses net of fee waivers, if any | .75% | .63%F | -% | -% | -% |
| Expenses net of all reductions | .75% | .63%F | -% | -% | -% |
| Net investment income (loss) | 1.37% | 1.04% | 1.45% | 1.49% | 1.62% |
| Supplemental Data | | | | | |
| Net assets, end of period (000 omitted) | $3,679,538 | $3,452,997 | $2,884,830 | $2,363,381 | $2,375,308 |
| Portfolio turnover rateE | 18% | 16%H | 15% | 17% | 23% |
A Calculated based on average shares outstanding during the period.
B Amount represents less than $.005 per share.
C Total returns would have been lower if certain expenses had not been reduced during the applicable periods shown.
D Expense ratios reflect operating expenses of the class. Expenses before reductions do not reflect amounts reimbursed by the investment adviser or reductions from expense offset arrangements and do not represent the amount paid by the class during periods when reimbursements or reductions occur. Expenses net of fee waivers reflect expenses after reimbursement by the investment adviser but prior to reductions from expense offset arrangements. Expenses net of all reductions represent the net expenses paid by the class but do not include expenses of the underlying funds in which the Fund invests.
E Amounts do not include the activity of the Underlying Funds.
F On certain classes, the size and fluctuation of net assets and expense amounts may cause ratios to differ from contractual rates.
G Amount represents less than .005%.
H The portfolio turnover rate does not include the assets acquired in the merger.
See accompanying notes which are an integral part of the financial statements.
Fidelity Freedom 2050 Fund Class K
| Years ended March 31, | 2019 | 2018 A |
| Selected Per–Share Data | | |
| Net asset value, beginning of period | $12.14 | $11.65 |
| Income from Investment Operations | | |
| Net investment income (loss)B | .17 | .17 |
| Net realized and unrealized gain (loss) | –C | .67 |
| Total from investment operations | .17 | .84 |
| Distributions from net investment income | (.18) | (.15) |
| Distributions from net realized gain | (.63) | (.19) |
| Total distributions | (.81) | (.35)D |
| Net asset value, end of period | $11.50 | $12.14 |
| Total ReturnE,F | 1.82% | 7.18% |
| Ratios to Average Net AssetsG,H | | |
| Expenses before reductions | .64% | .65%I,J |
| Expenses net of fee waivers, if any | .64% | .65%I,J |
| Expenses net of all reductions | .64% | .65%I,J |
| Net investment income (loss) | 1.48% | 2.04%I |
| Supplemental Data | | |
| Net assets, end of period (000 omitted) | $6,982,416 | $7,475,339 |
| Portfolio turnover rateH | 18% | 16%K |
A For the period July 20, 2017 (commencement of sale of shares) to March 31, 2018.
B Calculated based on average shares outstanding during the period.
C Amount represents less than $.005 per share.
D Total distributions of $.35 per share is comprised of distributions from net investment income of $.154 and distributions from net realized gain of $.194 per share.
E Total returns for periods of less than one year are not annualized.
F Total returns would have been lower if certain expenses had not been reduced during the applicable periods shown.
G Expense ratios reflect operating expenses of the class. Expenses before reductions do not reflect amounts reimbursed by the investment adviser or reductions from expense offset arrangements and do not represent the amount paid by the class during periods when reimbursements or reductions occur. Expense ratios before reductions for start-up periods may not be representative of longer-term operating periods. Expenses net of fee waivers reflect expenses after reimbursement by the investment adviser but prior to reductions from expense offset arrangements. Expenses net of all reductions represent the net expenses paid by the class but do not include expenses of the underlying funds in which the Fund invests.
H Amounts do not include the activity of the Underlying Funds.
I Annualized
J On certain classes, the size and fluctuation of net assets and expense amounts may cause ratios to differ from contractual rates.
K The portfolio turnover rate does not include the assets acquired in the merger.
See accompanying notes which are an integral part of the financial statements.
Fidelity Freedom 2050 Fund Class K6
| Years ended March 31, | 2019 | 2018 A |
| Selected Per–Share Data | | |
| Net asset value, beginning of period | $12.15 | $11.40 |
| Income from Investment Operations | | |
| Net investment income (loss)B | .19 | .14 |
| Net realized and unrealized gain (loss) | (.01)C | .96 |
| Total from investment operations | .18 | 1.10 |
| Distributions from net investment income | (.21) | (.16) |
| Distributions from net realized gain | (.63) | (.19) |
| Total distributions | (.84) | (.35) |
| Net asset value, end of period | $11.49 | $12.15 |
| Total ReturnD,E | 1.96% | 9.65% |
| Ratios to Average Net AssetsF,G | | |
| Expenses before reductions | .50%H | .50%H,I |
| Expenses net of fee waivers, if any | .50%H | .50%H,I |
| Expenses net of all reductions | .50%H | .50%H,I |
| Net investment income (loss) | 1.62% | 1.42%I |
| Supplemental Data | | |
| Net assets, end of period (000 omitted) | $1,184,606 | $327,591 |
| Portfolio turnover rateG | 18% | 16%J |
A For the period June 7, 2017 (commencement of sale of shares) to March 31, 2018.
B Calculated based on average shares outstanding during the period.
C The amount shown for a share outstanding does not correspond with the aggregate net gain (loss) on investments for the period due to the timing of sales and repurchases of shares in relation to fluctuating market values of the investments of the Fund.
D Total returns for periods of less than one year are not annualized.
E Total returns would have been lower if certain expenses had not been reduced during the applicable periods shown.
F Expense ratios reflect operating expenses of the class. Expenses before reductions do not reflect amounts reimbursed by the investment adviser or reductions from expense offset arrangements and do not represent the amount paid by the class during periods when reimbursements or reductions occur. Expense ratios before reductions for start-up periods may not be representative of longer-term operating periods. Expenses net of fee waivers reflect expenses after reimbursement by the investment adviser but prior to reductions from expense offset arrangements. Expenses net of all reductions represent the net expenses paid by the class but do not include expenses of the underlying funds in which the Fund invests.
G Amounts do not include the activity of the Underlying Funds.
H On certain classes, the size and fluctuation of net assets and expense amounts may cause ratios to differ from contractual rates.
I Annualized
J The portfolio turnover rate does not include the assets acquired in the merger.
See accompanying notes which are an integral part of the financial statements.
Fidelity Freedom® 2055 Fund
Investment Summary (Unaudited)
The information in the following tables is based on the direct investments of the Fund.
Top Holdings as of March 31, 2019
| | % of fund's net assets |
| Fidelity Series Intrinsic Opportunities Fund | 10.2 |
| Fidelity Series International Growth Fund | 9.3 |
| Fidelity Series Emerging Markets Opportunities Fund | 9.1 |
| Fidelity Series Large Cap Stock Fund | 9.0 |
| Fidelity Series Growth Company Fund | 8.9 |
| Fidelity Series International Value Fund | 8.7 |
| Fidelity Series Stock Selector Large Cap Value Fund | 6.8 |
| Fidelity Series Value Discovery Fund | 4.8 |
| Fidelity Series Opportunistic Insights Fund | 4.6 |
| Fidelity Series Blue Chip Growth Fund | 4.4 |
| | 75.8 |
Asset Allocation (% of fund's net assets)
| Period end |
| | Domestic Equity Funds | 61.0% |
| | International Equity Funds | 31.2% |
| | Bond Funds | 6.7% |
| | Short-Term Funds | 1.1% |
| | Short-Term Investments | 0.1% |
| | Net Other Assets (Liabilities)* | (0.1)% |

* Net Other Assets (Liabilities) are not included in the pie chart
Domestic Equity Funds category includes Fidelity Series Commodity Strategy Fund which invests in commodity-related investments.
Fidelity Freedom® 2055 Fund
Schedule of Investments March 31, 2019
Showing Percentage of Net Assets
| U.S. Treasury Obligations - 0.1% | | | |
| | | Principal Amount | Value |
| U.S. Treasury Bills, yield at date of purchase 2.39% 4/4/19 (a) | | | |
| (Cost $2,309,543) | | 2,310,000 | 2,309,545 |
| | | Shares | Value |
|
| Domestic Equity Funds - 61.0% | | | |
| Fidelity Series All-Sector Equity Fund (b) | | 13,088,359 | $126,040,895 |
| Fidelity Series Blue Chip Growth Fund (b) | | 15,501,549 | 228,647,841 |
| Fidelity Series Commodity Strategy Fund (b) | | 26,964,080 | 128,618,659 |
| Fidelity Series Growth Company Fund (b) | | 27,236,301 | 460,565,852 |
| Fidelity Series Intrinsic Opportunities Fund (b) | | 31,987,493 | 526,194,265 |
| Fidelity Series Large Cap Stock Fund (b) | | 31,642,141 | 463,557,362 |
| Fidelity Series Large Cap Value Index Fund (b) | | 10,546,133 | 130,877,508 |
| Fidelity Series Opportunistic Insights Fund (b) | | 13,671,582 | 238,979,253 |
| Fidelity Series Small Cap Discovery Fund (b) | | 5,405,153 | 60,105,304 |
| Fidelity Series Small Cap Opportunities Fund (b) | | 14,040,897 | 188,990,474 |
| Fidelity Series Stock Selector Large Cap Value Fund (b) | | 29,947,413 | 353,379,470 |
| Fidelity Series Value Discovery Fund (b) | | 19,827,028 | 247,639,583 |
| TOTAL DOMESTIC EQUITY FUNDS | | | |
| (Cost $2,953,472,930) | | | 3,153,596,466 |
|
| International Equity Funds - 31.2% | | | |
| Fidelity Series Canada Fund (b) | | 4,773,058 | 49,210,225 |
| Fidelity Series Emerging Markets Fund (b) | | 5,144,636 | 50,365,991 |
| Fidelity Series Emerging Markets Opportunities Fund (b) | | 25,392,608 | 470,525,029 |
| Fidelity Series International Growth Fund (b) | | 31,738,235 | 482,103,791 |
| Fidelity Series International Small Cap Fund (b) | | 7,172,634 | 111,391,005 |
| Fidelity Series International Value Fund (b) | | 48,515,636 | 451,195,414 |
| TOTAL INTERNATIONAL EQUITY FUNDS | | | |
| (Cost $1,553,673,403) | | | 1,614,791,455 |
|
| Bond Funds - 6.7% | | | |
| Fidelity Series Emerging Markets Debt Fund (b) | | 3,283,185 | 31,485,741 |
| Fidelity Series Floating Rate High Income Fund (b) | | 694,865 | 6,441,396 |
| Fidelity Series High Income Fund (b) | | 5,822,526 | 54,731,749 |
| Fidelity Series Inflation-Protected Bond Index Fund (b) | | 1,535,153 | 15,013,794 |
| Fidelity Series International Credit Fund (b) | | 172,476 | 1,705,788 |
| Fidelity Series Investment Grade Bond Fund (b) | | 2,707,782 | 30,273,003 |
| Fidelity Series Long-Term Treasury Bond Index Fund (b) | | 20,811,054 | 184,594,050 |
| Fidelity Series Real Estate Income Fund (b) | | 2,195,583 | 23,953,808 |
| TOTAL BOND FUNDS | | | |
| (Cost $342,698,228) | | | 348,199,329 |
|
| Short-Term Funds - 1.1% | | | |
| Fidelity Cash Central Fund, 2.48% (c) | | 7,376,363 | 7,377,839 |
| Fidelity Series Government Money Market Fund 2.50%(b)(d) | | 37,109,170 | 37,109,170 |
| Fidelity Series Short-Term Credit Fund (b) | | 1,020,455 | 10,173,937 |
| TOTAL SHORT-TERM FUNDS | | | |
| (Cost $54,613,910) | | | 54,660,946 |
| TOTAL INVESTMENT IN SECURITIES - 100.1% | | | |
| (Cost $4,906,768,014) | | | 5,173,557,741 |
| NET OTHER ASSETS (LIABILITIES) - (0.1)% | | | (3,013,138) |
| NET ASSETS - 100% | | | $5,170,544,603 |
| Futures Contracts | | | | | |
| | Number of contracts | Expiration Date | Notional Amount | Value | Unrealized Appreciation/(Depreciation) |
| Purchased | | | | | |
| Treasury Contracts | | | | | |
| CBOT 2-Year U.S. Treasury Note Contracts (United States) | 8 | June 2019 | $1,704,750 | $6,760 | $6,760 |
| CBOT 5-Year U.S. Treasury Note Contracts (United States) | 22 | June 2019 | 2,548,219 | 25,135 | 25,135 |
| CBOT Long Term U.S. Treasury Bond Contracts (United States) | 11 | June 2019 | 1,646,219 | 57,726 | 57,726 |
| CBOT Long Term U.S. Treasury Bond Contracts (United States) | 14 | June 2019 | 1,739,063 | 30,681 | 30,681 |
| CBOT Ultra Long Term U.S. Treasury Bond Contracts (United States) | 16 | June 2019 | 2,688,000 | 133,777 | 133,777 |
|
| TOTAL PURCHASED | | | | | 254,079 |
|
| Sold | | | | | |
| Equity Index Contracts | | | | | |
| CME E-mini S&P 500 Index Contracts (United States) | 42 | June 2019 | 5,959,380 | (180,378) | (180,378) |
| ICE E-mini MSCI EAFE Index Contracts (United States) | 7 | June 2019 | 653,240 | (13,806) | (13,806) |
| ICE E-mini MSCI Emerging Markets Index Contracts (United States) | 228 | June 2019 | 12,054,360 | (224,771) | (224,771) |
|
| TOTAL SOLD | | | | | (418,955 ) |
|
| TOTAL FUTURES CONTRACTS | | | | | $(164,876) |
The notional amount of futures purchased as a percentage of Net Assets is 0.2%
The notional amount of futures sold as a percentage of Net Assets is 0.4%
Legend
(a) Security or a portion of the security was pledged to cover margin requirements for futures contracts. At period end, the value of securities pledged amounted to $1,476,709.
(b) Affiliated Fund
(c) Affiliated fund that is generally available only to investment companies and other accounts managed by Fidelity Investments. The rate quoted is the annualized seven-day yield of the fund at period end. A complete unaudited listing of the fund's holdings as of its most recent quarter end is available upon request. In addition, each Fidelity Central Fund's financial statements , which are not covered by the Fund's Report of Independent Registered Public Accounting Firm, are available on the SEC's website or upon request.
(d) The rate quoted is the annualized seven-day yield of the fund at period end.
Affiliated Central Funds
Information regarding fiscal year to date income earned by the Fund from investments in Fidelity Central Funds is as follows:
| Fund | Income earned |
| Fidelity Cash Central Fund | $78,916 |
| Total | $78,916 |
Amounts in the income column in the above table include any capital gain distributions from underlying funds, which are presented in the corresponding line-item in the Statement of Operations, if applicable.
Affiliated Underlying Funds
Fiscal year to date information regarding the Fund's investments in affiliated Underlying Funds, excluding any Money Market Central Funds, is presented below. Exchanges between classes of the same affiliated Underlying Funds may occur.
| Affiliate | Value, beginning of period | Purchases | Sales Proceeds | Dividend Income | Realized Gain (loss) | Change in Unrealized appreciation (depreciation) | Value, end of period |
| Fidelity Series 100 Index Fund | $86,342,541 | $40,265 | $92,405,409 | $-- | $25,419,336 | $(19,396,733) | $-- |
| Fidelity Series All-Sector Equity Fund | 167,584,790 | 62,427,661 | 89,539,752 | 29,410,377 | 130,602 | (14,562,406) | 126,040,895 |
| Fidelity Series Blue Chip Growth Fund | 173,114,503 | 73,230,613 | 24,964,154 | 25,921,677 | (234,665) | 7,501,544 | 228,647,841 |
| Fidelity Series Canada Fund | 38,606,833 | 14,270,746 | 4,351,732 | 1,018,361 | (81,051) | 765,429 | 49,210,225 |
| Fidelity Series Commodity Strategy Fund | 91,934,990 | 67,913,057 | 17,970,797 | 6,947,524 | (3,614,260) | (9,644,331) | 128,618,659 |
| Fidelity Series Emerging Markets Debt Fund | 27,209,763 | 8,354,348 | 2,788,522 | 1,750,318 | (90,187) | (1,199,661) | 31,485,741 |
| Fidelity Series Emerging Markets Fund | -- | 50,584,581 | 2,484,821 | 187,425 | (26,772) | 2,293,003 | 50,365,991 |
| Fidelity Series Emerging Markets Opportunities Fund | 400,892,549 | 174,969,393 | 43,666,482 | 34,598,832 | (3,133,896) | (58,536,535) | 470,525,029 |
| Fidelity Series Floating Rate High Income Fund | 10,002,475 | 2,804,606 | 6,172,142 | 564,070 | (298,474) | 104,931 | 6,441,396 |
| Fidelity Series Government Money Market Fund 2.50% | 70,121,042 | 91,298,888 | 124,310,760 | 1,209,123 | -- | -- | 37,109,170 |
| Fidelity Series Growth Company Fund | 351,980,935 | 158,131,938 | 42,604,631 | 43,486,172 | (2,845,920) | (4,096,470) | 460,565,852 |
| Fidelity Series High Income Fund | 60,175,196 | 17,877,292 | 22,526,651 | 4,136,829 | (785,056) | (9,032) | 54,731,749 |
| Fidelity Series Inflation-Protected Bond Index Fund | 35,675,631 | 8,432,771 | 29,362,336 | 300,729 | (394,922) | 662,650 | 15,013,794 |
| Fidelity Series International Credit Fund | 1,668,964 | 84,028 | 42,532 | 83,004 | (551) | (4,121) | 1,705,788 |
| Fidelity Series International Growth Fund | 388,374,374 | 162,413,350 | 46,324,563 | 28,481,470 | (1,899,247) | (20,460,123) | 482,103,791 |
| Fidelity Series International Small Cap Fund | 96,898,872 | 38,362,947 | 6,527,790 | 9,621,557 | (862,791) | (16,480,233) | 111,391,005 |
| Fidelity Series International Value Fund | 393,238,509 | 137,658,731 | 27,302,815 | 15,616,914 | (3,075,307) | (49,323,704) | 451,195,414 |
| Fidelity Series Intrinsic Opportunities Fund | 427,000,743 | 161,487,780 | 17,730,136 | 38,179,786 | (226,003) | (44,338,119) | 526,194,265 |
| Fidelity Series Investment Grade Bond Fund | 20,925,164 | 14,597,998 | 5,803,246 | 782,409 | (94,866) | 647,953 | 30,273,003 |
| Fidelity Series Large Cap Stock Fund | 379,289,030 | 143,560,002 | 43,766,734 | 43,344,771 | (1,382,049) | (14,142,887) | 463,557,362 |
| Fidelity Series Large Cap Value Index Fund | 107,932,581 | 34,068,116 | 12,188,186 | 5,824,344 | (282,288) | 1,347,285 | 130,877,508 |
| Fidelity Series Long-Term Treasury Bond Index Fund | 98,801,847 | 136,086,559 | 57,700,089 | 4,672,455 | (1,378,669) | 8,784,402 | 184,594,050 |
| Fidelity Series Opportunistic Insights Fund | 189,694,018 | 70,497,562 | 21,994,657 | 18,495,975 | (961,852) | 1,744,182 | 238,979,253 |
| Fidelity Series Real Estate Equity Fund | 34,294,713 | 463,365 | 36,252,452 | 286,222 | (1,538,115) | 3,032,489 | -- |
| Fidelity Series Real Estate Income Fund | 18,928,290 | 6,729,598 | 2,134,347 | 1,569,260 | (33,081) | 463,348 | 23,953,808 |
| Fidelity Series Short-Term Credit Fund | 13,333,440 | 4,654,224 | 7,949,457 | 358,101 | (49,586) | 185,316 | 10,173,937 |
| Fidelity Series Small Cap Discovery Fund | 50,681,737 | 20,335,659 | 5,849,860 | 6,820,483 | (340,644) | (4,721,588) | 60,105,304 |
| Fidelity Series Small Cap Opportunities Fund | 156,598,303 | 61,594,463 | 19,155,788 | 20,120,799 | (809,222) | (9,237,282) | 188,990,474 |
| Fidelity Series Stock Selector Large Cap Value Fund | 295,167,577 | 106,625,099 | 35,133,393 | 28,646,860 | (1,588,596) | (11,691,217) | 353,379,470 |
| Fidelity Series Value Discovery Fund | 209,366,384 | 68,960,987 | 23,564,379 | 14,303,943 | (898,759) | (6,224,650) | 247,639,583 |
| Total | $4,395,835,794 | $1,898,516,627 | $872,568,613 | $386,739,790 | $(1,376,891) | $(256,536,560) | $5,163,870,357 |
Amounts in the income column in the above table include any capital gain distributions from underlying funds, which are presented in the corresponding line-item in the Statement of Operations, if applicable.
Investment Valuation
The following is a summary of the inputs used, as of March 31, 2019, involving the Fund's assets and liabilities carried at fair value. The inputs or methodology used for valuing securities may not be an indication of the risk associated with investing in those securities. For more information on valuation inputs, and their aggregation into the levels used below, please refer to the Investment Valuation section in the accompanying Notes to Financial Statements.
| | Valuation Inputs at Reporting Date: |
| Description | Total | Level 1 | Level 2 | Level 3 |
| Investments in Securities: | | | | |
| Other Short-Term Investments | $2,309,545 | $-- | $2,309,545 | $-- |
| Domestic Equity Funds | 3,153,596,466 | 3,153,596,466 | -- | -- |
| International Equity Funds | 1,614,791,455 | 1,614,791,455 | -- | -- |
| Bond Funds | 348,199,329 | 348,199,329 | -- | -- |
| Short-Term Funds | 54,660,946 | 54,660,946 | -- | -- |
| Total Investments in Securities: | $5,173,557,741 | $5,171,248,196 | $2,309,545 | $-- |
| Derivative Instruments: | | | | |
| Assets | | | | |
| Futures Contracts | $254,079 | $254,079 | $-- | $-- |
| Total Assets | $254,079 | $254,079 | $-- | $-- |
| Liabilities | | | | |
| Futures Contracts | $(418,955) | $(418,955) | $-- | $-- |
| Total Liabilities | $(418,955) | $(418,955) | $-- | $-- |
| Total Derivative Instruments: | $(164,876) | $(164,876) | $-- | $-- |
Value of Derivative Instruments
The following table is a summary of the Fund's value of derivative instruments by primary risk exposure as of March 31, 2019. For additional information on derivative instruments, please refer to the Derivative Instruments section in the accompanying Notes to Financial Statements.
| Primary Risk Exposure / Derivative Type | Value |
| | Asset | Liability |
| Equity Risk | | |
| Futures Contracts(a) | $0 | $(418,955) |
| Total Equity Risk | 0 | (418,955) |
| Interest Rate Risk | | |
| Futures Contracts | 254,079 | 0 |
| Total Interest Rate Risk | 254,079 | 0 |
| Total Value of Derivatives | $254,079 | $(418,955) |
(a) Reflects gross cumulative appreciation (depreciation) on futures contracts as presented in the Schedule of Investments. In the Statement of Assets and Liabilities, the period end daily variation margin is included in receivable or payable for daily variation margin on futures contracts, and the net cumulative appreciation (depreciation) is included in distributable earnings.
See accompanying notes which are an integral part of the financial statements.
Fidelity Freedom® 2055 Fund
Financial Statements
Statement of Assets and Liabilities
| | | March 31, 2019 |
| Assets | | |
Investment in securities, at value — See accompanying schedule:
Unaffiliated issuers (cost $2,309,543) | $2,309,545 | |
| Fidelity Central Funds (cost $7,377,690) | 7,377,839 | |
| Other affiliated issuers (cost $4,897,080,781) | 5,163,870,357 | |
| Total Investment in Securities (cost $4,906,768,014) | | $5,173,557,741 |
| Receivable for investments sold | | 7,511,871 |
| Receivable for fund shares sold | | 27,580,971 |
| Distributions receivable from Fidelity Central Funds | | 13,929 |
| Total assets | | 5,208,664,512 |
| Liabilities | | |
| Payable for investments purchased | $22,741,512 | |
| Payable for fund shares redeemed | 12,349,753 | |
| Accrued management fee | 2,797,338 | |
| Payable for daily variation margin on futures contracts | 231,306 | |
| Total liabilities | | 38,119,909 |
| Net Assets | | $5,170,544,603 |
| Net Assets consist of: | | |
| Paid in capital | | $4,737,703,861 |
| Total distributable earnings (loss) | | 432,840,742 |
| Net Assets | | $5,170,544,603 |
| Net Asset Value and Maximum Offering Price | | |
| Fidelity Freedom 2055 Fund: | | |
| Net Asset Value, offering price and redemption price per share ($1,490,392,687 ÷ 113,779,097 shares) | | $13.10 |
| Class K: | | |
| Net Asset Value, offering price and redemption price per share ($3,138,527,596 ÷ 239,821,361 shares) | | $13.09 |
| Class K6: | | |
| Net Asset Value, offering price and redemption price per share ($541,624,320 ÷ 41,419,655 shares) | | $13.08 |
See accompanying notes which are an integral part of the financial statements.
Statement of Operations
| | | Year ended March 31, 2019 |
| Investment Income | | |
| Dividends: | | |
| Affiliated issuers | | $101,578,399 |
| Interest | | 50,942 |
| Income from Fidelity Central Funds | | 78,916 |
| Total income | | 101,708,257 |
| Expenses | | |
| Management fee | $31,427,424 | |
| Independent trustees' fees and expenses | 21,947 | |
| Total expenses before reductions | 31,449,371 | |
| Expense reductions | (71) | |
| Total expenses after reductions | | 31,449,300 |
| Net investment income (loss) | | 70,258,957 |
| Realized and Unrealized Gain (Loss) | | |
| Net realized gain (loss) on: | | |
| Investment securities: | | |
| Unaffiliated issuers | 13,561 | |
| Fidelity Central Funds | (137) | |
| Other affiliated issuers | (1,376,891) | |
| Futures contracts | (2,653,024) | |
| Capital gain distributions from underlying funds: | | |
| Affiliated issuers | 285,161,391 | |
| Total net realized gain (loss) | | 281,144,900 |
| Change in net unrealized appreciation (depreciation) on: | | |
| Investment securities: | | |
| Unaffiliated issuers | 2 | |
| Fidelity Central Funds | 149 | |
| Other affiliated issuers | (256,536,560) | |
| Futures contracts | (164,876) | |
| Total change in net unrealized appreciation (depreciation) | | (256,701,285) |
| Net gain (loss) | | 24,443,615 |
| Net increase (decrease) in net assets resulting from operations | | $94,702,572 |
See accompanying notes which are an integral part of the financial statements.
Statement of Changes in Net Assets
| | Year ended March 31, 2019 | Year ended March 31, 2018 |
| Increase (Decrease) in Net Assets | | |
| Operations | | |
| Net investment income (loss) | $70,258,957 | $44,165,758 |
| Net realized gain (loss) | 281,144,900 | 169,529,579 |
| Change in net unrealized appreciation (depreciation) | (256,701,285) | 107,945,915 |
| Net increase (decrease) in net assets resulting from operations | 94,702,572 | 321,641,252 |
| Distributions to shareholders | (280,535,469) | – |
| Distributions to shareholders from net investment income | – | (48,627,128) |
| Distributions to shareholders from net realized gain | – | (70,153,488) |
| Total distributions | (280,535,469) | (118,780,616) |
| Share transactions - net increase (decrease) | 962,985,488 | 3,268,247,071 |
| Total increase (decrease) in net assets | 777,152,591 | 3,471,107,707 |
| Net Assets | | |
| Beginning of period | 4,393,392,012 | 922,284,305 |
| End of period | $5,170,544,603 | $4,393,392,012 |
| Other Information | | |
| Distributions in excess of net investment income end of period | | $(1,831,367) |
See accompanying notes which are an integral part of the financial statements.
Financial Highlights
Fidelity Freedom 2055 Fund
| Years ended March 31, | 2019 | 2018 | 2017 | 2016 | 2015 |
| Selected Per–Share Data | | | | | |
| Net asset value, beginning of period | $13.70 | $12.41 | $11.08 | $12.06 | $11.73 |
| Income from Investment Operations | | | | | |
| Net investment income (loss)A | .19 | .14 | .17 | .17 | .19 |
| Net realized and unrealized gain (loss) | –B | 1.64 | 1.57 | (.59) | .72 |
| Total from investment operations | .19 | 1.78 | 1.74 | (.42) | .91 |
| Distributions from net investment income | (.19) | (.15) | (.16) | (.17) | (.18) |
| Distributions from net realized gain | (.60) | (.34) | (.25) | (.39) | (.39) |
| Total distributions | (.79) | (.49) | (.41) | (.56) | (.58)C |
| Net asset value, end of period | $13.10 | $13.70 | $12.41 | $11.08 | $12.06 |
| Total ReturnD | 1.73% | 14.49% | 16.17% | (3.69)% | 7.98% |
| Ratios to Average Net AssetsE,F | | | | | |
| Expenses before reductions | .75% | .64%G | - %H | - %H | - %H |
| Expenses net of fee waivers, if any | .75% | .64%G | -% | -% | -% |
| Expenses net of all reductions | .75% | .64%G | -% | -% | -% |
| Net investment income (loss) | 1.40% | 1.06% | 1.46% | 1.51% | 1.64% |
| Supplemental Data | | | | | |
| Net assets, end of period (000 omitted) | $1,490,393 | $1,265,311 | $922,284 | $649,621 | $527,231 |
| Portfolio turnover rateE | 18% | 15%I | 18% | 20% | 21% |
A Calculated based on average shares outstanding during the period.
B Amount represents less than $.005 per share.
C Total distributions of $.58 per share is comprised of distributions from net investment income of $.184 and distributions from net realized gain of $.394 per share.
D Total returns would have been lower if certain expenses had not been reduced during the applicable periods shown.
E Amounts do not include the activity of the Underlying Funds.
F Expense ratios reflect operating expenses of the class. Expenses before reductions do not reflect amounts reimbursed by the investment adviser or reductions from expense offset arrangements and do not represent the amount paid by the class during periods when reimbursements or reductions occur. Expenses net of fee waivers reflect expenses after reimbursement by the investment adviser but prior to reductions from expense offset arrangements. Expenses net of all reductions represent the net expenses paid by the class but do not include expenses of the underlying funds in which the Fund invests.
G On certain classes, the size and fluctuation of net assets and expense amounts may cause ratios to differ from contractual rates.
H Amount represents less than .005%.
I The portfolio turnover rate does not include the assets acquired in the merger.
See accompanying notes which are an integral part of the financial statements.
Fidelity Freedom 2055 Fund Class K
| Years ended March 31, | 2019 | 2018 A |
| Selected Per–Share Data | | |
| Net asset value, beginning of period | $13.69 | $13.11 |
| Income from Investment Operations | | |
| Net investment income (loss)B | .20 | .19 |
| Net realized and unrealized gain (loss) | –C | .76 |
| Total from investment operations | .20 | .95 |
| Distributions from net investment income | (.20) | (.17) |
| Distributions from net realized gain | (.60) | (.20) |
| Total distributions | (.80) | (.37) |
| Net asset value, end of period | $13.09 | $13.69 |
| Total ReturnD,E | 1.84% | 7.26% |
| Ratios to Average Net AssetsF,G | | |
| Expenses before reductions | .64% | .65%H,I |
| Expenses net of fee waivers, if any | .64% | .65%H,I |
| Expenses net of all reductions | .64% | .65%H,I |
| Net investment income (loss) | 1.50% | 2.01%H |
| Supplemental Data | | |
| Net assets, end of period (000 omitted) | $3,138,528 | $2,992,599 |
| Portfolio turnover rateF | 18% | 15%J |
A For the period July 20, 2017 (commencement of sale of shares) to March 31, 2018.
B Calculated based on average shares outstanding during the period.
C Amount represents less than $.005 per share.
D Total returns for periods of less than one year are not annualized.
E Total returns would have been lower if certain expenses had not been reduced during the applicable periods shown.
F Amounts do not include the activity of the Underlying Funds.
G Expense ratios reflect operating expenses of the class. Expenses before reductions do not reflect amounts reimbursed by the investment adviser or reductions from expense offset arrangements and do not represent the amount paid by the class during periods when reimbursements or reductions occur. Expense ratios before reductions for start-up periods may not be representative of longer-term operating periods. Expenses net of fee waivers reflect expenses after reimbursement by the investment adviser but prior to reductions from expense offset arrangements. Expenses net of all reductions represent the net expenses paid by the class but do not include expenses of the underlying funds in which the Fund invests.
H Annualized
I On certain classes, the size and fluctuation of net assets and expense amounts may cause ratios to differ from contractual rates.
J The portfolio turnover rate does not include the assets acquired in the merger.
See accompanying notes which are an integral part of the financial statements.
Fidelity Freedom 2055 Fund Class K6
| Years ended March 31, | 2019 | 2018 A |
| Selected Per–Share Data | | |
| Net asset value, beginning of period | $13.70 | $12.83 |
| Income from Investment Operations | | |
| Net investment income (loss)B | .21 | .16 |
| Net realized and unrealized gain (loss) | –C | 1.09 |
| Total from investment operations | .21 | 1.25 |
| Distributions from net investment income | (.23) | (.17) |
| Distributions from net realized gain | (.60) | (.20) |
| Total distributions | (.83) | (.38)D |
| Net asset value, end of period | $13.08 | $13.70 |
| Total ReturnE,F | 1.97% | 9.70% |
| Ratios to Average Net AssetsG,H | | |
| Expenses before reductions | .50%I | .50%I,J |
| Expenses net of fee waivers, if any | .50%I | .50%I,J |
| Expenses net of all reductions | .50%I | .50%I,J |
| Net investment income (loss) | 1.65% | 1.43%J |
| Supplemental Data | | |
| Net assets, end of period (000 omitted) | $541,624 | $135,481 |
| Portfolio turnover rateG | 18% | 15%K |
A For the period June 7, 2017 (commencement of sale of shares) to March 31, 2018.
B Calculated based on average shares outstanding during the period.
C Amount represents less than $.005 per share.
D Total distributions of $.38 per share is comprised of distributions from net investment income of $.174 and distributions from net realized gain of $.202 per share.
E Total returns for periods of less than one year are not annualized.
F Total returns would have been lower if certain expenses had not been reduced during the applicable periods shown.
G Amounts do not include the activity of the Underlying Funds.
H Expense ratios reflect operating expenses of the class. Expenses before reductions do not reflect amounts reimbursed by the investment adviser or reductions from expense offset arrangements and do not represent the amount paid by the class during periods when reimbursements or reductions occur. Expense ratios before reductions for start-up periods may not be representative of longer-term operating periods. Expenses net of fee waivers reflect expenses after reimbursement by the investment adviser but prior to reductions from expense offset arrangements. Expenses net of all reductions represent the net expenses paid by the class but do not include expenses of the underlying funds in which the Fund invests.
I On certain classes, the size and fluctuation of net assets and expense amounts may cause ratios to differ from contractual rates.
J Annualized
K The portfolio turnover rate does not include the assets acquired in the merger.
See accompanying notes which are an integral part of the financial statements.
Fidelity Freedom® 2060 Fund
Investment Summary (Unaudited)
The information in the following tables is based on the direct investments of the Fund.
Top Holdings as of March 31, 2019
| | % of fund's net assets |
| Fidelity Series Intrinsic Opportunities Fund | 10.1 |
| Fidelity Series International Growth Fund | 9.3 |
| Fidelity Series Emerging Markets Opportunities Fund | 9.1 |
| Fidelity Series Large Cap Stock Fund | 9.0 |
| Fidelity Series Growth Company Fund | 8.9 |
| Fidelity Series International Value Fund | 8.8 |
| Fidelity Series Stock Selector Large Cap Value Fund | 6.9 |
| Fidelity Series Value Discovery Fund | 4.8 |
| Fidelity Series Opportunistic Insights Fund | 4.7 |
| Fidelity Series Blue Chip Growth Fund | 4.4 |
| | 76.0 |
Asset Allocation (% of fund's net assets)
| Period end |
| | Domestic Equity Funds | 61.0% |
| | International Equity Funds | 31.2% |
| | Bond Funds | 6.8% |
| | Short-Term Funds | 1.1% |
| | Net Other Assets (Liabilities)* | (0.1)% |

* Net Other Assets (Liabilities) are not included in the pie chart
Domestic Equity Funds category includes Fidelity Series Commodity Strategy Fund which invests in commodity-related investments.
Fidelity Freedom® 2060 Fund
Schedule of Investments March 31, 2019
Showing Percentage of Net Assets
| U.S. Treasury Obligations - 0.0% | | | |
| | | Principal Amount | Value |
| U.S. Treasury Bills, yield at date of purchase 2.39% 4/4/19 (a) | | | |
| (Cost $479,905) | | 480,000 | 479,906 |
| | | Shares | Value |
|
| Domestic Equity Funds - 61.0% | | | |
| Fidelity Series All-Sector Equity Fund (b) | | 3,109,791 | $29,947,285 |
| Fidelity Series Blue Chip Growth Fund (b) | | 3,877,461 | 57,192,555 |
| Fidelity Series Commodity Strategy Fund (b) | | 6,731,731 | 32,110,355 |
| Fidelity Series Growth Company Fund (b) | | 6,806,617 | 115,099,886 |
| Fidelity Series Intrinsic Opportunities Fund (b) | | 7,914,772 | 130,197,996 |
| Fidelity Series Large Cap Stock Fund (b) | | 7,929,263 | 116,163,701 |
| Fidelity Series Large Cap Value Index Fund (b) | | 2,636,642 | 32,720,731 |
| Fidelity Series Opportunistic Insights Fund (b) | | 3,429,127 | 59,941,148 |
| Fidelity Series Small Cap Discovery Fund (b) | | 1,369,685 | 15,230,898 |
| Fidelity Series Small Cap Opportunities Fund (b) | | 3,528,388 | 47,492,096 |
| Fidelity Series Stock Selector Large Cap Value Fund (b) | | 7,473,267 | 88,184,549 |
| Fidelity Series Value Discovery Fund (b) | | 4,957,084 | 61,913,982 |
| TOTAL DOMESTIC EQUITY FUNDS | | | |
| (Cost $781,834,777) | | | 786,195,182 |
|
| International Equity Funds - 31.2% | | | |
| Fidelity Series Canada Fund (b) | | 1,192,327 | 12,292,894 |
| Fidelity Series Emerging Markets Fund (b) | | 1,282,202 | 12,552,754 |
| Fidelity Series Emerging Markets Opportunities Fund (b) | | 6,314,455 | 117,006,846 |
| Fidelity Series International Growth Fund (b) | | 7,888,940 | 119,833,004 |
| Fidelity Series International Small Cap Fund (b) | | 1,789,457 | 27,790,262 |
| Fidelity Series International Value Fund (b) | | 12,136,069 | 112,865,444 |
| TOTAL INTERNATIONAL EQUITY FUNDS | | | |
| (Cost $401,791,666) | | | 402,341,204 |
|
| Bond Funds - 6.8% | | | |
| Fidelity Series Emerging Markets Debt Fund (b) | | 807,155 | 7,740,612 |
| Fidelity Series Floating Rate High Income Fund (b) | | 176,278 | 1,634,093 |
| Fidelity Series High Income Fund (b) | | 1,449,857 | 13,628,652 |
| Fidelity Series Inflation-Protected Bond Index Fund (b) | | 383,191 | 3,747,611 |
| Fidelity Series International Credit Fund (b) | | 25,299 | 250,207 |
| Fidelity Series Investment Grade Bond Fund (b) | | 687,137 | 7,682,189 |
| Fidelity Series Long-Term Treasury Bond Index Fund (b) | | 5,196,509 | 46,093,036 |
| Fidelity Series Real Estate Income Fund (b) | | 557,979 | 6,087,554 |
| TOTAL BOND FUNDS | | | |
| (Cost $84,813,739) | | | 86,863,954 |
|
| Short-Term Funds - 1.1% | | | |
| Fidelity Cash Central Fund, 2.48% (c) | | 1,938,520 | 1,938,908 |
| Fidelity Series Government Money Market Fund 2.50% (b)(d) | | 9,263,487 | 9,263,487 |
| Fidelity Series Short-Term Credit Fund (b) | | 255,671 | 2,549,041 |
| TOTAL SHORT-TERM FUNDS | | | |
| (Cost $13,731,811) | | | 13,751,436 |
| TOTAL INVESTMENT IN SECURITIES - 100.1% | | | |
| (Cost $1,282,651,898) | | | 1,289,631,682 |
| NET OTHER ASSETS (LIABILITIES) - (0.1)% | | | (736,773) |
| NET ASSETS - 100% | | | $1,288,894,909 |
| Futures Contracts | | | | | |
| | Number of contracts | Expiration Date | Notional Amount | Value | Unrealized Appreciation/(Depreciation) |
| Purchased | | | | | |
| Treasury Contracts | | | | | |
| CBOT 2-Year U.S. Treasury Note Contracts (United States) | 2 | June 2019 | $426,188 | $1,590 | $1,590 |
| CBOT 5-Year U.S. Treasury Note Contracts (United States) | 6 | June 2019 | 694,969 | 6,879 | 6,879 |
| CBOT Long Term U.S. Treasury Bond Contracts (United States) | 3 | June 2019 | 448,969 | 15,744 | 15,744 |
| CBOT Long Term U.S. Treasury Bond Contracts (United States) | 4 | June 2019 | 496,875 | 8,687 | 8,687 |
| CBOT Ultra Long Term U.S. Treasury Bond Contracts (United States) | 4 | June 2019 | 672,000 | 33,444 | 33,444 |
|
| TOTAL PURCHASED | | | | | 66,344 |
|
| Sold | | | | | |
| Equity Index Contracts | | | | | |
| CME E-mini S&P 500 Index Contracts (United States) | 11 | June 2019 | 1,560,790 | (47,242) | (47,242) |
| ICE E-mini MSCI EAFE Index Contracts (United States) | 2 | June 2019 | 186,640 | (3,945) | (3,945) |
| ICE E-mini MSCI Emerging Markets Index Contracts (United States) | 51 | June 2019 | 2,696,370 | (50,279) | (50,279) |
|
| TOTAL SOLD | | | | | (101,466) |
|
| TOTAL FUTURES CONTRACTS | | | | | $(35,122) |
The notional amount of futures purchased as a percentage of Net Assets is 0.2%
The notional amount of futures sold as a percentage of Net Assets is 0.3%
Legend
(a) Security or a portion of the security was pledged to cover margin requirements for futures contracts. At period end, the value of securities pledged amounted to $365,928.
(b) Affiliated Fund
(c) Affiliated fund that is generally available only to investment companies and other accounts managed by Fidelity Investments. The rate quoted is the annualized seven-day yield of the fund at period end. A complete unaudited listing of the fund's holdings as of its most recent quarter end is available upon request. In addition, each Fidelity Central Fund's financial statements , which are not covered by the Fund's Report of Independent Registered Public Accounting Firm, are available on the SEC's website or upon request.
(d) The rate quoted is the annualized seven-day yield of the fund at period end.
Affiliated Central Funds
Information regarding fiscal year to date income earned by the Fund from investments in Fidelity Central Funds is as follows:
| Fund | Income earned |
| Fidelity Cash Central Fund | $16,193 |
| Total | $16,193 |
Amounts in the income column in the above table include any capital gain distributions from underlying funds, which are presented in the corresponding line-item in the Statement of Operations, if applicable.
Affiliated Underlying Funds
Fiscal year to date information regarding the Fund's investments in affiliated Underlying Funds, excluding any Money Market Central Funds, is presented below. Exchanges between classes of the same affiliated Underlying Funds may occur.
| Affiliate | Value, beginning of period | Purchases | Sales Proceeds | Dividend Income | Realized Gain (loss) | Change in Unrealized appreciation (depreciation) | Value, end of period |
| Fidelity Series 100 Index Fund | $15,904,680 | $26,022 | $17,014,627 | $-- | $2,869,723 | $(1,785,798) | $-- |
| Fidelity Series All-Sector Equity Fund | 31,253,568 | 21,553,902 | 19,699,863 | 6,315,366 | 44,021 | (3,204,343) | 29,947,285 |
| Fidelity Series Blue Chip Growth Fund | 32,253,565 | 27,826,612 | 4,547,037 | 5,564,195 | (179,931) | 1,839,346 | 57,192,555 |
| Fidelity Series Canada Fund | 7,202,539 | 5,698,155 | 761,141 | 228,194 | (36,089) | 189,430 | 12,292,894 |
| Fidelity Series Commodity Strategy Fund | 17,145,686 | 21,192,871 | 3,420,975 | 1,473,000 | (205,617) | (2,601,610) | 32,110,355 |
| Fidelity Series Emerging Markets Debt Fund | 4,840,852 | 3,608,404 | 488,780 | 370,837 | (27,484) | (192,380) | 7,740,612 |
| Fidelity Series Emerging Markets Fund | -- | 12,478,774 | 483,199 | 42,219 | (9,477) | 566,656 | 12,552,754 |
| Fidelity Series Emerging Markets Opportunities Fund | 74,428,681 | 62,415,222 | 8,258,370 | 7,793,315 | (999,371) | (10,579,316) | 117,006,846 |
| Fidelity Series Floating Rate High Income Fund | 1,890,315 | 1,166,457 | 1,380,399 | 122,266 | (13,420) | (28,860) | 1,634,093 |
| Fidelity Series Government Money Market Fund 2.50% | 13,009,017 | 22,392,292 | 26,137,822 | 257,754 | -- | -- | 9,263,487 |
| Fidelity Series Growth Company Fund | 65,444,549 | 58,764,125 | 7,521,883 | 9,861,584 | (607,995) | (978,910) | 115,099,886 |
| Fidelity Series High Income Fund | 11,127,742 | 7,394,678 | 4,747,630 | 893,493 | (91,659) | (54,479) | 13,628,652 |
| Fidelity Series Inflation-Protected Bond Index Fund | 6,768,528 | 3,124,324 | 6,206,453 | 66,961 | (74,127) | 135,339 | 3,747,611 |
| Fidelity Series International Credit Fund | 244,476 | 12,908 | 6,495 | 12,171 | (86) | (596) | 250,207 |
| Fidelity Series International Growth Fund | 72,306,514 | 60,220,421 | 8,581,017 | 6,419,461 | (576,243) | (3,536,671) | 119,833,004 |
| Fidelity Series International Small Cap Fund | 18,039,162 | 14,780,457 | 1,436,727 | 2,169,895 | (196,989) | (3,395,641) | 27,790,262 |
| Fidelity Series International Value Fund | 73,255,562 | 55,977,840 | 5,361,700 | 3,521,058 | (592,923) | (10,413,335) | 112,865,444 |
| Fidelity Series Intrinsic Opportunities Fund | 79,157,527 | 63,590,348 | 2,480,933 | 8,330,550 | (51,985) | (10,016,961) | 130,197,996 |
| Fidelity Series Investment Grade Bond Fund | 3,875,761 | 4,708,663 | 1,046,143 | 168,978 | (13,854) | 157,762 | 7,682,189 |
| Fidelity Series Large Cap Stock Fund | 70,836,746 | 56,529,128 | 7,860,008 | 9,230,437 | (431,566) | (2,910,599) | 116,163,701 |
| Fidelity Series Large Cap Value Index Fund | 20,224,908 | 14,523,989 | 2,240,669 | 1,329,751 | (81,248) | 293,751 | 32,720,731 |
| Fidelity Series Long-Term Treasury Bond Index Fund | 18,521,138 | 35,739,454 | 10,149,680 | 1,012,841 | (317,954) | 2,300,078 | 46,093,036 |
| Fidelity Series Opportunistic Insights Fund | 35,335,440 | 28,538,093 | 3,967,455 | 4,203,724 | (226,747) | 261,817 | 59,941,148 |
| Fidelity Series Real Estate Equity Fund | 6,272,892 | 370,736 | 6,935,358 | 55,732 | (243,095) | 534,825 | -- |
| Fidelity Series Real Estate Income Fund | 3,580,706 | 2,780,189 | 379,918 | 344,770 | (11,216) | 117,793 | 6,087,554 |
| Fidelity Series Short-Term Credit Fund | 2,622,315 | 1,692,838 | 1,799,070 | 79,340 | (11,825) | 44,783 | 2,549,041 |
| Fidelity Series Small Cap Discovery Fund | 9,487,528 | 7,825,011 | 1,053,117 | 1,456,648 | (86,733) | (941,791) | 15,230,898 |
| Fidelity Series Small Cap Opportunities Fund | 29,169,642 | 23,835,036 | 3,381,816 | 4,334,245 | (224,951) | (1,905,815) | 47,492,096 |
| Fidelity Series Stock Selector Large Cap Value Fund | 55,114,043 | 42,511,755 | 6,307,323 | 6,498,302 | (424,924) | (2,709,002) | 88,184,549 |
| Fidelity Series Value Discovery Fund | 39,075,165 | 28,795,425 | 4,293,855 | 3,224,690 | (217,951) | (1,444,802) | 61,913,982 |
| Total | $818,389,247 | $690,074,129 | $167,949,463 | $85,381,777 | $(3,041,716) | $(50,259,329) | $1,287,212,868 |
Amounts in the income column in the above table include any capital gain distributions from underlying funds, which are presented in the corresponding line-item in the Statement of Operations, if applicable.
Investment Valuation
The following is a summary of the inputs used, as of March 31, 2019, involving the Fund's assets and liabilities carried at fair value. The inputs or methodology used for valuing securities may not be an indication of the risk associated with investing in those securities. For more information on valuation inputs, and their aggregation into the levels used below, please refer to the Investment Valuation section in the accompanying Notes to Financial Statements.
| | Valuation Inputs at Reporting Date: |
| Description | Total | Level 1 | Level 2 | Level 3 |
| Investments in Securities: | | | | |
| Other Short-Term Investments | $479,906 | $-- | $479,906 | $-- |
| Domestic Equity Funds | 786,195,182 | 786,195,182 | -- | -- |
| International Equity Funds | 402,341,204 | 402,341,204 | -- | -- |
| Bond Funds | 86,863,954 | 86,863,954 | -- | -- |
| Short-Term Funds | 13,751,436 | 13,751,436 | -- | -- |
| Total Investments in Securities: | $1,289,631,682 | $1,289,151,776 | $479,906 | $-- |
| Derivative Instruments: | | | | |
| Assets | | | | |
| Futures Contracts | $66,344 | $66,344 | $-- | $-- |
| Total Assets | $66,344 | $66,344 | $-- | $-- |
| Liabilities | | | | |
| Futures Contracts | $(101,466) | $(101,466) | $-- | $-- |
| Total Liabilities | $(101,466) | $(101,466) | $-- | $-- |
| Total Derivative Instruments: | $(35,122) | $(35,122) | $-- | $-- |
Value of Derivative Instruments
The following table is a summary of the Fund's value of derivative instruments by primary risk exposure as of March 31, 2019. For additional information on derivative instruments, please refer to the Derivative Instruments section in the accompanying Notes to Financial Statements.
| Primary Risk Exposure / Derivative Type | Value |
| | Asset | Liability |
| Equity Risk | | |
| Futures Contracts(a) | $0 | $(101,466) |
| Total Equity Risk | 0 | (101,466) |
| Interest Rate Risk | | |
| Futures Contracts | 66,344 | 0 |
| Total Interest Rate Risk | 66,344 | 0 |
| Total Value of Derivatives | $66,344 | $(101,466) |
(a) Reflects gross cumulative appreciation (depreciation) on futures contracts as presented in the Schedule of Investments. In the Statement of Assets and Liabilities, the period end daily variation margin is included in receivable or payable for daily variation margin on futures contracts, and the net cumulative appreciation (depreciation) is included in distributable earnings.
See accompanying notes which are an integral part of the financial statements.
Fidelity Freedom® 2060 Fund
Financial Statements
Statement of Assets and Liabilities
| | | March 31, 2019 |
| Assets | | |
Investment in securities, at value — See accompanying schedule:
Unaffiliated issuers (cost $479,905) | $479,906 | |
| Fidelity Central Funds (cost $1,938,869) | 1,938,908 | |
| Other affiliated issuers (cost $1,280,233,124) | 1,287,212,868 | |
| Total Investment in Securities (cost $1,282,651,898) | | $1,289,631,682 |
| Receivable for investments sold | | 1,870,574 |
| Receivable for fund shares sold | | 10,514,482 |
| Distributions receivable from Fidelity Central Funds | | 3,683 |
| Other receivables | | 1,677 |
| Total assets | | 1,302,022,098 |
| Liabilities | | |
| Payable for investments purchased | $9,693,115 | |
| Payable for fund shares redeemed | 2,691,506 | |
| Accrued management fee | 686,240 | |
| Payable for daily variation margin on futures contracts | 56,328 | |
| Total liabilities | | 13,127,189 |
| Net Assets | | $1,288,894,909 |
| Net Assets consist of: | | |
| Paid in capital | | $1,243,700,742 |
| Total distributable earnings (loss) | | 45,194,167 |
| Net Assets | | $1,288,894,909 |
| Net Asset Value and Maximum Offering Price | | |
| Fidelity Freedom 2060 Fund: | | |
| Net Asset Value, offering price and redemption price per share ($367,472,319 ÷ 31,255,278 shares) | | $11.76 |
| Class K: | | |
| Net Asset Value, offering price and redemption price per share ($784,848,434 ÷ 66,828,220 shares) | | $11.74 |
| Class K6: | | |
| Net Asset Value, offering price and redemption price per share ($136,574,156 ÷ 11,627,867 shares) | | $11.75 |
See accompanying notes which are an integral part of the financial statements.
Statement of Operations
| | | Year ended March 31, 2019 |
| Investment Income | | |
| Dividends: | | |
| Affiliated issuers | | $22,456,193 |
| Interest | | 10,765 |
| Income from Fidelity Central Funds | | 16,193 |
| Total income | | 22,483,151 |
| Expenses | | |
| Management fee | $6,761,209 | |
| Independent trustees' fees and expenses | 4,548 | |
| Total expenses before reductions | 6,765,757 | |
| Expense reductions | (88) | |
| Total expenses after reductions | | 6,765,669 |
| Net investment income (loss) | | 15,717,482 |
| Realized and Unrealized Gain (Loss) | | |
| Net realized gain (loss) on: | | |
| Investment securities: | | |
| Unaffiliated issuers | 2,761 | |
| Fidelity Central Funds | (37) | |
| Other affiliated issuers | (3,041,716) | |
| Futures contracts | (539,530) | |
| Capital gain distributions from underlying funds: | | |
| Affiliated issuers | 62,925,584 | |
| Total net realized gain (loss) | | 59,347,062 |
| Change in net unrealized appreciation (depreciation) on: | | |
| Investment securities: | | |
| Unaffiliated issuers | 1 | |
| Fidelity Central Funds | 39 | |
| Other affiliated issuers | (50,259,329) | |
| Futures contracts | (35,122) | |
| Total change in net unrealized appreciation (depreciation) | | (50,294,411) |
| Net gain (loss) | | 9,052,651 |
| Net increase (decrease) in net assets resulting from operations | | $24,770,133 |
See accompanying notes which are an integral part of the financial statements.
Statement of Changes in Net Assets
| | Year ended March 31, 2019 | Year ended March 31, 2018 |
| Increase (Decrease) in Net Assets | | |
| Operations | | |
| Net investment income (loss) | $15,717,482 | $6,919,637 |
| Net realized gain (loss) | 59,347,062 | 26,038,634 |
| Change in net unrealized appreciation (depreciation) | (50,294,411) | 12,512,816 |
| Net increase (decrease) in net assets resulting from operations | 24,770,133 | 45,471,087 |
| Distributions to shareholders | (52,942,972) | – |
| Distributions to shareholders from net investment income | – | (7,703,403) |
| Distributions to shareholders from net realized gain | – | (9,428,917) |
| Total distributions | (52,942,972) | (17,132,320) |
| Share transactions - net increase (decrease) | 499,126,039 | 673,447,954 |
| Total increase (decrease) in net assets | 470,953,200 | 701,786,721 |
| Net Assets | | |
| Beginning of period | 817,941,709 | 116,154,988 |
| End of period | $1,288,894,909 | $817,941,709 |
| Other Information | | |
| Distributions in excess of net investment income end of period | | $(655,535) |
See accompanying notes which are an integral part of the financial statements.
Financial Highlights
Fidelity Freedom 2060 Fund
| Years ended March 31, | 2019 | 2018 | 2017 | 2016 | 2015A |
| Selected Per–Share Data | | | | | |
| Net asset value, beginning of period | $12.20 | $11.01 | $9.78 | $10.45 | $10.00 |
| Income from Investment Operations | | | | | |
| Net investment income (loss)B | .17 | .13 | .16 | .16 | .10 |
| Net realized and unrealized gain (loss) | .01 | 1.46 | 1.37 | (.53) | .52 |
| Total from investment operations | .18 | 1.59 | 1.53 | (.37) | .62 |
| Distributions from net investment income | (.16) | (.13) | (.13) | (.12) | (.10) |
| Distributions from net realized gain | (.45) | (.26) | (.17) | (.17) | (.07) |
| Total distributions | (.62)C | (.40)D | (.30) | (.30)E | (.17) |
| Net asset value, end of period | $11.76 | $12.20 | $11.01 | $9.78 | $10.45 |
| Total ReturnF | 1.78% | 14.50% | 16.01% | (3.67)% | 6.22% |
| Ratios to Average Net AssetsG,H | | | | | |
| Expenses before reductions | .75% | .66%I | - %J | - %J | - %J,K |
| Expenses net of fee waivers, if any | .75% | .66%I | -% | -% | - %K |
| Expenses net of all reductions | .75% | .66%I | -% | -% | - %K |
| Net investment income (loss) | 1.46% | 1.09% | 1.54% | 1.67% | 1.54%K |
| Supplemental Data | | | | | |
| Net assets, end of period (000 omitted) | $367,472 | $241,896 | $116,155 | $47,019 | $8,968 |
| Portfolio turnover rateG | 16% | 11%L | 21% | 31% | 28%K |
A For the period August 5, 2014 (commencement of operations) to March 31, 2015.
B Calculated based on average shares outstanding during the period.
C Total distributions of $.62 per share is comprised of distributions from net investment income of $.161 and distributions from net realized gain of $.454 per share.
D Total distributions of $.40 per share is comprised of distributions from net investment income of $.132 and distributions from net realized gain of $.263 per share.
E Total distributions of $.30 per share is comprised of distributions from net investment income of $.121 and distributions from net realized gain of $.174 per share.
F Total returns would have been lower if certain expenses had not been reduced during the applicable periods shown.
G Amounts do not include the activity of the Underlying Funds.
H Expense ratios reflect operating expenses of the class. Expenses before reductions do not reflect amounts reimbursed by the investment adviser or reductions from expense offset arrangements and do not represent the amount paid by the class during periods when reimbursements or reductions occur. Expenses net of fee waivers reflect expenses after reimbursement by the investment adviser but prior to reductions from expense offset arrangements. Expenses net of all reductions represent the net expenses paid by the class but do not include expenses of the underlying funds in which the Fund invests.
I On certain classes, the size and fluctuation of net assets and expense amounts may cause ratios to differ from contractual rates.
J Amount represents less than .005%.
K Annualized
L The portfolio turnover rate does not include the assets acquired in the merger.
See accompanying notes which are an integral part of the financial statements.
Fidelity Freedom 2060 Fund Class K
| Years ended March 31, | 2019 | 2018 A |
| Selected Per–Share Data | | |
| Net asset value, beginning of period | $12.19 | $11.65 |
| Income from Investment Operations | | |
| Net investment income (loss)B | .19 | .16 |
| Net realized and unrealized gain (loss) | (.01)C | .68 |
| Total from investment operations | .18 | .84 |
| Distributions from net investment income | (.17) | (.15) |
| Distributions from net realized gain | (.45) | (.15) |
| Total distributions | (.63)D | (.30) |
| Net asset value, end of period | $11.74 | $12.19 |
| Total ReturnE,F | 1.80% | 7.19% |
| Ratios to Average Net AssetsG,H | | |
| Expenses before reductions | .64% | .65%I,J |
| Expenses net of fee waivers, if any | .64% | .65%I,J |
| Expenses net of all reductions | .64% | .65%I,J |
| Net investment income (loss) | 1.57% | 1.92%I |
| Supplemental Data | | |
| Net assets, end of period (000 omitted) | $784,848 | $549,158 |
| Portfolio turnover rateG | 16% | 11%K |
A For the period July 20, 2017 (commencement of sale of shares) to March 31, 2018.
B Calculated based on average shares outstanding during the period.
C The amount shown for a share outstanding does not correspond with the aggregate net gain (loss) on investments for the period due to the timing of sales and repurchases of shares in relation to fluctuating market values of the investments of the Fund.
D Total distributions of $.63 per share is comprised of distributions from net investment income of $.172 and distributions from net realized gain of $.454 per share.
E Total returns for periods of less than one year are not annualized.
F Total returns would have been lower if certain expenses had not been reduced during the applicable periods shown.
G Amounts do not include the activity of the Underlying Funds.
H Expense ratios reflect operating expenses of the class. Expenses before reductions do not reflect amounts reimbursed by the investment adviser or reductions from expense offset arrangements and do not represent the amount paid by the class during periods when reimbursements or reductions occur. Expense ratios before reductions for start-up periods may not be representative of longer-term operating periods. Expenses net of fee waivers reflect expenses after reimbursement by the investment adviser but prior to reductions from expense offset arrangements. Expenses net of all reductions represent the net expenses paid by the class but do not include expenses of the underlying funds in which the Fund invests.
I Annualized
J On certain classes, the size and fluctuation of net assets and expense amounts may cause ratios to differ from contractual rates.
K The portfolio turnover rate does not include the assets acquired in the merger.
See accompanying notes which are an integral part of the financial statements.
Fidelity Freedom 2060 Fund Class K6
| Years ended March 31, | 2019 | 2018 A |
| Selected Per–Share Data | | |
| Net asset value, beginning of period | $12.20 | $11.40 |
| Income from Investment Operations | | |
| Net investment income (loss)B | .20 | .14 |
| Net realized and unrealized gain (loss) | –C | .96 |
| Total from investment operations | .20 | 1.10 |
| Distributions from net investment income | (.20) | (.15) |
| Distributions from net realized gain | (.45) | (.15) |
| Total distributions | (.65) | (.30) |
| Net asset value, end of period | $11.75 | $12.20 |
| Total ReturnD,E | 2.05% | 9.65% |
| Ratios to Average Net AssetsF,G | | |
| Expenses before reductions | .50%H | .50%H,I |
| Expenses net of fee waivers, if any | .50%H | .50%H,I |
| Expenses net of all reductions | .50%H | .50%H,I |
| Net investment income (loss) | 1.71% | 1.44%I |
| Supplemental Data | | |
| Net assets, end of period (000 omitted) | $136,574 | $26,888 |
| Portfolio turnover rateF | 16% | 11%J |
A For the period June 7, 2017 (commencement of sale of shares) to March 31, 2018.
B Calculated based on average shares outstanding during the period.
C Amount represents less than $.005 per share.
D Total returns for periods of less than one year are not annualized.
E Total returns would have been lower if certain expenses had not been reduced during the applicable periods shown.
F Amounts do not include the activity of the Underlying Funds.
G Expense ratios reflect operating expenses of the class. Expenses before reductions do not reflect amounts reimbursed by the investment adviser or reductions from expense offset arrangements and do not represent the amount paid by the class during periods when reimbursements or reductions occur. Expense ratios before reductions for start-up periods may not be representative of longer-term operating periods. Expenses net of fee waivers reflect expenses after reimbursement by the investment adviser but prior to reductions from expense offset arrangements. Expenses net of all reductions represent the net expenses paid by the class but do not include expenses of the underlying funds in which the Fund invests.
H On certain classes, the size and fluctuation of net assets and expense amounts may cause ratios to differ from contractual rates.
I Annualized
J The portfolio turnover rate does not include the assets acquired in the merger.
See accompanying notes which are an integral part of the financial statements.
Notes to Financial Statements
For the period ended March 31, 2019
1. Organization.
Fidelity Freedom Income Fund, Fidelity Freedom 2005 Fund, Fidelity Freedom 2010 Fund, Fidelity Freedom 2015 Fund, Fidelity Freedom 2020 Fund, Fidelity Freedom 2025 Fund, Fidelity Freedom 2030 Fund, Fidelity Freedom 2035 Fund, Fidelity Freedom 2040 Fund, Fidelity Freedom 2045 Fund, Fidelity Freedom 2050 Fund, Fidelity Freedom 2055 Fund and Fidelity Freedom 2060 Fund (the Funds) are funds of Fidelity Aberdeen Street Trust (the Trust). The Trust is registered under the Investment Company Act of 1940, as amended (the 1940 Act), as an open-end management investment company organized as a Delaware statutory trust. Each Fund is authorized to issue an unlimited number of shares. Each Fund offers Fidelity Freedom, Class K and Class K6 shares, each of which has equal rights as to assets and voting privileges. Each class has exclusive voting rights with respect to matters that affect that class. The Funds invest primarily in a combination of other Fidelity equity, bond, and short-term funds (the Underlying Funds) managed by Fidelity Management & Research Company (FMR). Certain Underlying Funds incurred name changes since their most recent shareholder report. The names of the Underlying Funds are those in effect at period end. In the prior year, the Funds transitioned their portfolios to invest exclusively in classes of the Fidelity Series funds, offered only to certain other Fidelity funds advised by FMR or its affiliates.
2. Investments in Fidelity Central Funds.
The Funds may invest in Fidelity Central Funds, which are open-end investment companies generally available only to other investment companies and accounts managed by the investment adviser and its affiliates. The Funds' Schedules of Investments list each of the Fidelity Central Funds held as of period end, if any, as an investment of each Fund, but do not include the underlying holdings of each Fidelity Central Fund. As an Investing Fund, each Fund indirectly bears its proportionate share of the expenses of the underlying Fidelity Central Funds.
The Money Market Central Funds seek preservation of capital and current income and are managed by Fidelity Investments Money Management, Inc. (FIMM), an affiliate of the investment adviser. Annualized expenses of the Money Market Central Funds as of their most recent shareholder report date are less than .005%.
A complete unaudited list of holdings for each Fidelity Central Fund is available upon request or at the Securities and Exchange Commission (the SEC) website at www.sec.gov. In addition, the financial statements of the Fidelity Central Funds, which are not covered by the Funds' Report of Independent Registered Public Accounting Firm, are available on the SEC website or upon request.
3. Significant Accounting Policies.
Each Fund is an investment company and applies the accounting and reporting guidance of the Financial Accounting Standards Board (FASB) Accounting Standards Codification Topic 946 Financial Services – Investments Companies. The financial statements have been prepared in conformity with accounting principles generally accepted in the United States of America (GAAP), which require management to make certain estimates and assumptions at the date of the financial statements. Actual results could differ from those estimates. Subsequent events, if any, through the date that the financial statements were issued have been evaluated in the preparation of the financial statements. The following summarizes the significant accounting policies of the Funds:
Investment Valuation. Investments are valued as of 4:00 p.m. Eastern time on the last calendar day of the period. The Board of Trustees (the Board) has delegated the day to day responsibility for the valuation of each Fund's investments to the Fair Value Committee (the Committee) established by each Fund's investment adviser. In accordance with valuation policies and procedures approved by the Board, each Fund attempts to obtain prices from one or more third party pricing vendors or brokers to value its investments. When current market prices, quotations or currency exchange rates are not readily available or reliable, investments will be fair valued in good faith by the Committee, in accordance with procedures adopted by the Board. Factors used in determining fair value vary by investment type and may include market or investment specific events, changes in interest rates and credit quality. The frequency with which these procedures are used cannot be predicted and they may be utilized to a significant extent. The Committee oversees each Fund's valuation policies and procedures and reports to the Board on the Committee's activities and fair value determinations. The Board monitors the appropriateness of the procedures used in valuing each Fund's investments and ratifies the fair value determinations of the Committee. Each Fund categorizes the inputs to valuation techniques used to value its investments into a disclosure hierarchy consisting of three levels as shown below:
- Level 1 – quoted prices in active markets for identical investments
- Level 2 – other significant observable inputs (including quoted prices for similar investments, interest rates, prepayment speeds, etc.)
- Level 3 – unobservable inputs (including the Fund's own assumptions based on the best information available)
Valuation techniques used to value each Fund's investments by major category are as follows. Investments in the Underlying Funds are valued at their closing net asset value (NAV) each business day and are categorized as Level 1 in the hierarchy. Debt securities, including restricted securities, are valued based on evaluated prices received from third party pricing vendors or from brokers who make markets in such securities. U.S. government and government agency obligations are valued by pricing vendors who utilize matrix pricing which considers yield or price of bonds of comparable quality, coupon, maturity and type or by broker-supplied prices. When independent prices are unavailable or unreliable, debt securities may be valued utilizing pricing methodologies which consider similar factors that would be used by third party pricing vendors. Debt securities are generally categorized as Level 2 in the hierarchy but may be Level 3 depending on the circumstances.
Futures contracts are valued at the settlement price established each day by the board of trade or exchange on which they are traded and are categorized as Level 1 in the hierarchy.
The aggregate value of investments by input level as of March 31, 2019 is included at the end of each applicable Fund's Schedule of Investments.
Investment Transactions and Income. For financial reporting purposes, the Funds' investment holdings and NAV include trades executed through the end of the last business day of the period. The NAV per share for processing shareholder transactions is calculated as of the close of business of the New York Stock Exchange (NYSE), normally 4:00 p.m. Eastern time and includes trades executed through the end of the prior business day. Gains and losses on securities sold are determined on the basis of identified cost and include proceeds received from litigation. Income and capital gain distributions from the Underlying Funds, if any, are recorded on the ex-dividend date. Distributions from the Underlying Funds that are deemed to be return of capital are recorded as a reduction of cost of investments. Interest income is accrued as earned. Interest income includes coupon interest and amortization of premium and accretion of discount on debt securities as applicable.
Class Allocations and Expenses. Investment income, realized and unrealized capital gains and losses, common expenses of each Fund, and certain fund-level expense reductions, if any, are allocated daily on a pro-rata basis to each class based on the relative net assets of each class to the total net assets of each Fund. Each class differs with respect to fees incurred. Certain expense reductions may also differ by class. For the reporting period, the allocated portion of income and expenses to each class as a percent of its average net assets may vary due to the timing of recording these transactions in relation to fluctuating net assets of the classes. Expenses directly attributable to a fund are charged to that fund. Expenses attributable to more than one fund are allocated among the respective funds on the basis of relative net assets or other appropriate methods. Expenses included in the accompanying financial statements reflect the expenses of each Fund and do not include any expenses associated with the Underlying Funds. Although not included in each Fund's expenses, each Fund indirectly bears its proportionate share of the Underlying Funds' expenses through the impact of these expenses on each Underlying Fund's NAV. Expense estimates are accrued in the period to which they relate and adjustments are made when actual amounts are known.
Deferred Trustee Compensation. Under a Deferred Compensation Plan (the Plan) for certain funds, certain independent Trustees have elected to defer receipt of a portion of their annual compensation. Deferred amounts are invested in a cross-section of Fidelity funds, are marked-to-market and remain in each Fund until distributed in accordance with the Plan. The investment of deferred amounts and the offsetting payable to the Trustees presented below are included in each accompanying Statement of Assets and Liabilities in other receivables and other payables and accrued expenses, respectively.
| Fidelity Freedom 2010 Fund | $74,861 |
| Fidelity Freedom 2020 Fund | 180,424 |
| Fidelity Freedom 2030 Fund | 154,257 |
Income Tax Information and Distributions to Shareholders. Each year, each Fund intends to qualify as a regulated investment company under Subchapter M of the Internal Revenue Code, including distributing substantially all of its taxable income and realized gains. As a result, no provision for U.S. Federal income taxes is required. As of March 31, 2019, each Fund did not have any unrecognized tax benefits in the financial statements; nor is each Fund aware of any tax positions for which it is reasonably possible that the total amounts of unrecognized tax benefits will significantly change in the next twelve months. Each Fund files a U.S. federal tax return, in addition to state and local tax returns as required. Each Fund's federal income tax returns are subject to examination by the Internal Revenue Service (IRS) for a period of three fiscal years after they are filed. State and local tax returns may be subject to examination for an additional fiscal year depending on the jurisdiction.
Distributions are declared and recorded on the ex-dividend date. Income and capital gain distributions are declared separately for each class. Income and capital gain distributions are determined in accordance with income tax regulations, which may differ from GAAP.
Capital accounts within the financial statements are adjusted for permanent book-tax differences. These adjustments have no impact on net assets or the results of operations. Capital accounts are not adjusted for temporary book-tax differences which will reverse in a subsequent period.
Book-tax differences are primarily due to the short-term gain distributions from the Underlying Funds, futures contracts, market discount, deferred trustees compensation and losses deferred due to wash sales and excise tax regulations.
As of period end, the cost and unrealized appreciation (depreciation) in securities, and derivatives if applicable, for federal income tax purposes were as follows for each Fund:
| | Tax cost | Gross unrealized appreciation | Gross unrealized depreciation | Net unrealized appreciation (depreciation) |
| Fidelity Freedom Income Fund | $3,213,968,629 | $188,185,702 | $(18,494,434) | $169,691,268 |
| Fidelity Freedom 2005 Fund | 918,790,973 | 56,160,198 | (12,612,840) | 43,547,358 |
| Fidelity Freedom 2010 Fund | 5,397,227,672 | 511,443,822 | (58,178,817) | 453,265,005 |
| Fidelity Freedom 2015 Fund | 7,993,018,309 | 979,914,421 | (61,581,830) | 918,332,591 |
| Fidelity Freedom 2020 Fund | 24,840,731,808 | 3,172,493,452 | (261,827,305) | 2,910,666,147 |
| Fidelity Freedom 2025 Fund | 24,435,359,049 | 3,060,779,152 | (339,237,248) | 2,721,541,904 |
| Fidelity Freedom 2030 Fund | 28,285,481,512 | 4,212,042,675 | (406,473,081) | 3,805,569,594 |
| Fidelity Freedom 2035 Fund | 19,399,812,692 | 3,101,275,206 | (360,218,045) | 2,741,057,161 |
| Fidelity Freedom 2040 Fund | 19,512,227,914 | 3,331,850,576 | (396,013,942) | 2,935,836,634 |
| Fidelity Freedom 2045 Fund | 12,255,441,397 | 1,832,173,129 | (266,148,490) | 1,566,024,639 |
| Fidelity Freedom 2050 Fund | 10,565,517,074 | 1,523,980,844 | (236,148,377) | 1,287,832,467 |
| Fidelity Freedom 2055 Fund | 4,939,503,516 | 395,180,996 | (161,126,771) | 234,054,225 |
| Fidelity Freedom 2060 Fund | 1,289,514,513 | 52,436,232 | (52,319,063) | 117,169 |
The tax-based components of distributable earnings as of period end were as follows for each Fund:
| | Undistributed ordinary income | Undistributed long-term capital gain | Net unrealized appreciation (depreciation) on securities and other investments |
| Fidelity Freedom Income Fund | $5,759,593 | $22,970,704 | $169,691,268 |
| Fidelity Freedom 2005 Fund | 3,612,555 | 11,647,983 | 43,547,358 |
| Fidelity Freedom 2010 Fund | 16,514,017 | 93,665,651 | 453,265,005 |
| Fidelity Freedom 2015 Fund | 19,211,514 | 189,210,955 | 918,332,591 |
| Fidelity Freedom 2020 Fund | 55,028,315 | 677,134,613 | 2,910,666,147 |
| Fidelity Freedom 2025 Fund | 50,230,576 | 734,502,847 | 2,721,541,904 |
| Fidelity Freedom 2030 Fund | 33,054,298 | 1,042,563,637 | 3,805,569,594 |
| Fidelity Freedom 2035 Fund | 5,104,472 | 840,642,058 | 2,741,057,161 |
| Fidelity Freedom 2040 Fund | 3,635,746 | 906,486,819 | 2,935,836,634 |
| Fidelity Freedom 2045 Fund | 6,045,342 | 551,851,685 | 1,566,024,639 |
| Fidelity Freedom 2050 Fund | 5,959,692 | 470,031,584 | 1,287,832,467 |
| Fidelity Freedom 2055 Fund | 2,576,396 | 200,018,308 | 234,054,225 |
| Fidelity Freedom 2060 Fund | 400,512 | 45,587,861 | 117,169 |
The tax character of distributions paid was as follows:
| March 31, 2019 | | | |
| | Ordinary Income | Long-term Capital Gains | Total |
| Fidelity Freedom Income Fund | $85,762,017 | $92,431,324 | $178,193,341 |
| Fidelity Freedom 2005 Fund | 23,667,602 | 28,005,426 | 51,673,028 |
| Fidelity Freedom 2010 Fund | 147,745,652 | 255,632,399 | 403,378,051 |
| Fidelity Freedom 2015 Fund | 225,701,210 | 464,032,656 | 689,733,866 |
| Fidelity Freedom 2020 Fund | 659,329,138 | 1,208,075,925 | 1,867,405,063 |
| Fidelity Freedom 2025 Fund | 620,060,353 | 963,140,684 | 1,583,201,037 |
| Fidelity Freedom 2030 Fund | 685,028,902 | 1,380,090,599 | 2,065,119,501 |
| Fidelity Freedom 2035 Fund | 455,059,993 | 1,010,698,427 | 1,465,758,420 |
| Fidelity Freedom 2040 Fund | 459,497,027 | 1,084,167,920 | 1,543,664,947 |
| Fidelity Freedom 2045 Fund | 274,441,585 | 647,870,224 | 922,311,809 |
| Fidelity Freedom 2050 Fund | 230,344,728 | 542,180,904 | 772,525,632 |
| Fidelity Freedom 2055 Fund | 95,359,940 | 185,175,529 | 280,535,469 |
| Fidelity Freedom 2060 Fund | 20,901,956 | 32,041,016 | 52,942,972 |
| March 31, 2018 | | | |
| | Ordinary Income | Long-term Capital Gains | Total |
| Fidelity Freedom Income Fund | $59,848,117 | $59,542,043 | $119,390,160 |
| Fidelity Freedom 2005 Fund | 16,088,182 | 18,342,832 | 34,431,014 |
| Fidelity Freedom 2010 Fund | 110,846,319 | 175,338,147 | 286,184,466 |
| Fidelity Freedom 2015 Fund | 169,438,811 | 260,911,363 | 430,350,174 |
| Fidelity Freedom 2020 Fund | 485,379,607 | 623,034,628 | 1,108,414,235 |
| Fidelity Freedom 2025 Fund | 432,040,605 | 464,445,330 | 896,485,935 |
| Fidelity Freedom 2030 Fund | 523,900,861 | 642,379,992 | 1,166,280,853 |
| Fidelity Freedom 2035 Fund | 354,910,547 | 369,938,577 | 724,849,124 |
| Fidelity Freedom 2040 Fund | 367,209,112 | 408,996,628 | 776,205,740 |
| Fidelity Freedom 2045 Fund | 214,132,446 | 198,225,864 | 412,358,310 |
| Fidelity Freedom 2050 Fund | 181,104,825 | 163,401,127 | 344,505,952 |
| Fidelity Freedom 2055 Fund | 66,698,701 | 52,081,915 | 118,780,616 |
| Fidelity Freedom 2060 Fund | 10,534,555 | 6,597,765 | 17,132,320 |
Certain of the Funds elected to defer to the next fiscal year ordinary losses recognized during the period January 1, 2019 to March 31, 2019. Loss deferrals were as follows:
| | Ordinary losses |
| Fidelity Freedom 2035 Fund | $9,540,064 |
| Fidelity Freedom 2040 Fund | 17,216,812 |
| Fidelity Freedom 2045 Fund | 10,311,779 |
| Fidelity Freedom 2050 Fund | 8,852,372 |
| Fidelity Freedom 2055 Fund | 3,808,184 |
| Fidelity Freedom 2060 Fund | 911,375 |
New Rule Issuance. During August 2018, the U.S. Securities and Exchange Commission issued Final Rule Release No. 33-10532, Disclosure Update and Simplification. This Final Rule includes amendments specific to registered investment companies that are intended to eliminate overlap in disclosure requirements between Regulation S-X and GAAP. In accordance with these amendments, certain line-items in the Funds' financial statements have been combined or removed for the current period as outlined in the table below.
| Financial Statement | Current Line-Item Presentation (As Applicable) | Prior Line-Item Presentation (As Applicable) |
| Statement of Assets and Liabilities | Total distributable earnings (loss) | Undistributed/Distributions in excess of/Accumulated net investment income (loss)
Accumulated/Undistributed net realized gain (loss)
Net unrealized appreciation (depreciation) |
| Statement of Changes in Net Assets | N/A - removed | Undistributed/Distributions in excess of/Accumulated net investment income (loss) end of period |
| Statement of Changes in Net Assets | Distributions to shareholders | Distributions to shareholders from net investment income
Distributions to shareholders from net realized gain |
| Distributions to Shareholders Note to Financial Statements | Distributions to shareholders | Distributions to shareholders from net investment income
Distributions to shareholders from net realized gain |
4. Derivative Instruments.
Risk Exposures and the Use of Derivative Instruments. The Funds' investment objective allows the Funds to enter into various types of derivative contracts, including futures contracts. Derivatives are investments whose value is primarily derived from underlying assets, indices or reference rates and may be transacted on an exchange or over-the-counter (OTC). Derivatives may involve a future commitment to buy or sell a specified asset based on specified terms, to exchange future cash flows at periodic intervals based on a notional principal amount, or for one party to make one or more payments upon the occurrence of specified events in exchange for periodic payments from the other party.
The Funds used derivatives to increase returns and to manage exposure to certain risks as defined below. The success of any strategy involving derivatives depends on analysis of numerous economic factors, and if the strategies for investment do not work as intended, the Funds may not achieve their objectives.
The Funds' use of derivatives increased or decreased their exposure to the following risks:
| Equity Risk | Equity risk relates to the fluctuations in the value of financial instruments as a result of changes in market prices (other than those arising from interest rate risk or foreign exchange risk), whether caused by factors specific to an individual investment, its issuer, or all factors affecting all instruments traded in a market or market segment.
|
| Interest Rate Risk | Interest rate risk relates to the fluctuations in the value of interest-bearing securities due to changes in the prevailing levels of market interest rates. |
The Funds are also exposed to additional risks from investing in derivatives, such as liquidity risk and counterparty credit risk. Liquidity risk is the risk that the Funds will be unable to close out the derivative in the open market in a timely manner. Counterparty credit risk is the risk that the counterparty will not be able to fulfill its obligation to the Funds. Counterparty credit risk related to exchange-traded futures contracts may be mitigated by the protection provided by the exchange on which they trade.
Investing in derivatives may involve greater risks than investing in the underlying assets directly and, to varying degrees, may involve risk of loss in excess of any initial investment and collateral received and amounts recognized in the Statement of Assets and Liabilities. In addition, there may be the risk that the change in value of the derivative contract does not correspond to the change in value of the underlying instrument.
Net Realized Gain (Loss) and Change in Net Unrealized Appreciation (Depreciation) on Derivatives. The table below, which reflects the impacts of derivatives on the financial performance of the Funds, summarizes the net realized gain (loss) and change in net unrealized appreciation (depreciation) for derivatives during the period as presented in the Statement of Operations.
| Primary Risk Exposure / Derivative Type | Net Realized Gain (Loss) | Change in Net Unrealized Appreciation (Depreciation) |
| Fidelity Freedom Income Fund | | |
| Equity Risk | | |
| Futures Contracts | $209,324 | $(473,698) |
| Total Equity Risk | $209,324 | $(473,698) |
| Interest Rate Risk | | |
| Futures Contracts | $653,492 | $94,070 |
| Total Interest Rate Risk | 653,492 | 94,070 |
| Totals | $862,816 | $(379,628) |
| Fidelity Freedom 2005 Fund | | |
| Equity Risk | | |
| Futures Contracts | $166,743 | $(153,352) |
| Total Equity Risk | $166,743 | $(153,352) |
| Interest Rate Risk | | |
| Futures Contracts | $153,547 | $68,713 |
| Total Interest Rate Risk | 153,547 | 68,713 |
| Totals | $320,290 | $(84,639) |
| Fidelity Freedom 2010 Fund | | |
| Equity Risk | | |
| Futures Contracts | $2,051,361 | $(979,390) |
| Total Equity Risk | $2,051,361 | $(979,390) |
| Interest Rate Risk | | |
| Futures Contracts | $1,473,292 | $485,168 |
| Total Interest Rate Risk | 1,473,292 | 485,168 |
| Totals | $3,524,653 | $(494,222) |
| Fidelity Freedom 2015 Fund | | |
| Equity Risk | | |
| Futures Contracts | $2,101,934 | $(1,547,159) |
| Total Equity Risk | $2,101,934 | $(1,547,159) |
| Interest Rate Risk | | |
| Futures Contracts | $2,618,236 | $856,203 |
| Total Interest Rate Risk | 2,618,236 | 856,203 |
| Totals | $4,720,170 | $(690,956) |
| Fidelity Freedom 2020 Fund | | |
| Equity Risk | | |
| Futures Contracts | $12,079,298 | $(5,424,174) |
| Total Equity Risk | $12,079,298 | $(5,424,174) |
| Interest Rate Risk | | |
| Futures Contracts | $8,601,611 | $2,712,031 |
| Total Interest Rate Risk | 8,601,611 | 2,712,031 |
| Totals | $20,680,909 | $(2,712,143) |
| Fidelity Freedom 2025 Fund | | |
| Equity Risk | | |
| Futures Contracts | $11,297,881 | $(5,441,462) |
| Total Equity Risk | $11,297,881 | $(5,441,462) |
| Interest Rate Risk | | |
| Futures Contracts | $9,102,485 | $2,768,491 |
| Total Interest Rate Risk | 9,102,485 | 2,768,491 |
| Totals | $20,400,366 | $(2,672,971) |
| Fidelity Freedom 2030 Fund | | |
| Equity Risk | | |
| Futures Contracts | $(3,334,032) | $(6,591,592) |
| Total Equity Risk | $(3,334,032) | $(6,591,592) |
| Interest Rate Risk | | |
| Futures Contracts | $6,245,944 | $2,896,285 |
| Total Interest Rate Risk | 6,245,944 | 2,896,285 |
| Totals | $2,911,912 | $(3,695,307) |
| Fidelity Freedom 2035 Fund | | |
| Equity Risk | | |
| Futures Contracts | $(2,668,622) | $(4,985,530) |
| Total Equity Risk | $(2,668,622) | $(4,985,530) |
| Interest Rate Risk | | |
| Futures Contracts | $(2,256,815) | $2,371,955 |
| Total Interest Rate Risk | (2,256,815) | 2,371,955 |
| Totals | $(4,925,437) | $(2,613,575) |
| Fidelity Freedom 2040 Fund | | |
| Equity Risk | | |
| Futures Contracts | $(21,584,731) | $(1,304,290) |
| Total Equity Risk | $(21,584,731) | $(1,304,290) |
| Interest Rate Risk | | |
| Futures Contracts | $9,444,207 | $1,022,431 |
| Total Interest Rate Risk | 9,444,207 | 1,022,431 |
| Totals | $(12,140,524) | $(281,859) |
| Fidelity Freedom 2045 Fund | | |
| Equity Risk | | |
| Futures Contracts | $(12,327,262) | $(759,120) |
| Total Equity Risk | $(12,327,262) | $(759,120) |
| Interest Rate Risk | | |
| Futures Contracts | $4,999,083 | $650,619 |
| Total Interest Rate Risk | 4,999,083 | 650,619 |
| Totals | $(7,328,179) | $(108,501) |
| Fidelity Freedom 2050 Fund | | |
| Equity Risk | | |
| Futures Contracts | $(10,077,450) | $(627,176) |
| Total Equity Risk | $(10,077,450) | $(627,176) |
| Interest Rate Risk | | |
| Futures Contracts | $3,735,898 | $560,060 |
| Total Interest Rate Risk | $3,735,898 | 560,060 |
| Totals | $(6,341,552) | $(67,116) |
| Fidelity Freedom 2055 Fund | | |
| Equity Risk | | |
| Futures Contracts | $(3,341,645) | $(418,955) |
| Total Equity Risk | $(3,341,645) | $(418,955) |
| Interest Rate Risk | | |
| Futures Contracts | $688,621 | $254,079 |
| Total Interest Rate Risk | 688,621 | 254,079 |
| Totals | $(2,653,024) | $(164,876) |
| Fidelity Freedom 2060 Fund | | |
| Equity Risk | | |
| Futures Contracts | $(375,861) | $(101,466) |
| Total Equity Risk | $(375,861) | $(101,466) |
| Interest Rate Risk | | |
| Futures Contracts | $(163,669) | $66,344 |
| Total Interest Rate Risk | (163,669) | 66,344 |
| Totals | $(539,530) | $(35,122) |
A summary of the value of derivatives by primary risk exposure as of period end is included at the end of the Schedule of Investments.
Futures Contracts. A futures contract is an agreement between two parties to buy or sell a specified underlying instrument for a fixed price at a specified future date. The Funds used futures contracts to manage their exposure to the stock market, bond market and fluctuations in interest rates.
Upon entering into a futures contract, a fund is required to deposit either cash or securities (initial margin) with a clearing broker in an amount equal to a certain percentage of the face value of the contract. Futures contracts are marked-to-market daily and subsequent daily payments (variation margin) are made or received by a fund depending on the daily fluctuations in the value of the futures contracts and are recorded as unrealized appreciation or (depreciation). This receivable and/or payable, if any, is included in daily variation margin on futures contracts in the Statement of Assets and Liabilities. Realized gain or (loss) is recorded upon the expiration or closing of a futures contract. The net realized gain (loss) and change in net unrealized appreciation (depreciation) on futures contracts during the period is presented in the Statement of Operations.
Any open futures contracts at period end are presented in the Schedule of Investments under the caption "Futures Contracts". The notional amount at value reflects each contract's exposure to the underlying instrument or index at period end and is representative of volume of activity during the period.
5. Purchases and Sales of Investments.
Purchases and sales of securities, other than short-term securities, are noted in the table below.
| | Purchases ($) | Sales ($) |
| Fidelity Freedom Income Fund | 775,889,147 | 1,101,124,661 |
| Fidelity Freedom 2005 Fund | 255,834,333 | 311,311,625 |
| Fidelity Freedom 2010 Fund | 1,211,013,474 | 1,776,731,653 |
| Fidelity Freedom 2015 Fund | 1,772,221,549 | 2,805,256,163 |
| Fidelity Freedom 2020 Fund | 5,284,691,893 | 6,849,440,457 |
| Fidelity Freedom 2025 Fund | 5,819,668,403 | 5,188,721,679 |
| Fidelity Freedom 2030 Fund | 6,812,366,543 | 5,571,735,286 |
| Fidelity Freedom 2035 Fund | 5,375,086,963 | 3,989,800,121 |
| Fidelity Freedom 2040 Fund | 5,047,115,873 | 3,819,697,866 |
| Fidelity Freedom 2045 Fund | 3,594,264,891 | 2,380,349,321 |
| Fidelity Freedom 2050 Fund | 3,261,581,054 | 2,071,593,435 |
| Fidelity Freedom 2055 Fund | 1,898,516,627 | 872,568,613 |
| Fidelity Freedom 2060 Fund | 690,074,129 | 167,949,463 |
6. Fees and Other Transactions with Affiliates.
Management Fee and Expense Contract. FMR Co., Inc. (the investment adviser), an affiliate of FMR, and its affiliates provide the Funds with investment management related services. Under the management contract, effective June 1, 2017, each Class of each Fund pays a monthly management fee that is set at an annual rate by referring to each Fund's target date, indicated by its name, such that the management fee rate applicable to each Class of each Fund is reduced as the fund approaches, and then passes, its target date. In addition, under the management contract, the investment adviser pays all ordinary operating expenses of each Fund, except fees and expenses of the independent Trustees, and certain miscellaneous expenses such as proxy and shareholder meeting expenses. The management fee is reduced by an amount equal to the fees and expenses paid by each Fund to the independent Trustees. Prior to June 1, 2017, the investment advisor provided the Funds with investment management related services. The Funds did not pay any fees for these services. For the reporting period, the total annual management fee rate for each Class of each Fund was as follows:
| | Annual % of Class-Level Average Net Assets (Fidelity Freedom Class) | Annual % of Class-Level Average Net Assets
(Classes K and K6) |
| Fidelity Freedom Income Fund | .465% | .415% |
| Fidelity Freedom 2005 Fund | .482% | .428% |
| Fidelity Freedom 2010 Fund | .525% | .461% |
| Fidelity Freedom 2015 Fund | .567% | .496% |
| Fidelity Freedom 2020 Fund | .610% | .531% |
| Fidelity Freedom 2025 Fund | .652% | .566% |
| Fidelity Freedom 2030 Fund | .695% | .601% |
| Fidelity Freedom 2035 Fund | .737% | .636% |
| Fidelity Freedom 2040 Fund | .746% | .643% |
| Fidelity Freedom 2045 Fund | .746% | .643% |
| Fidelity Freedom 2050 Fund | .746% | .643% |
| Fidelity Freedom 2055 Fund | .746% | .643% |
| Fidelity Freedom 2060 Fund | .746% | .643% |
Under the expense contract, the investment adviser pays class-level expenses for Class K6 of each Fund as necessary so that Class K6 total expenses do not exceed certain amounts of Class K6 average net assets on an annual basis with certain exceptions, as noted in the following table:
| | Annual % of Class-Level Average Net Assets (Class K6) |
| Fidelity Freedom Income Fund | .365% |
| Fidelity Freedom 2005 Fund | .373% |
| Fidelity Freedom 2010 Fund | .392% |
| Fidelity Freedom 2015 Fund | .412% |
| Fidelity Freedom 2020 Fund | .431% |
| Fidelity Freedom 2025 Fund | .450% |
| Fidelity Freedom 2030 Fund | .470% |
| Fidelity Freedom 2035 Fund | .489% |
| Fidelity Freedom 2040 Fund | .493% |
| Fidelity Freedom 2045 Fund | .493% |
| Fidelity Freedom 2050 Fund | .493% |
| Fidelity Freedom 2055 Fund | .493% |
| Fidelity Freedom 2060 Fund | .493% |
Interfund Trades. The Funds may purchase from or sell securities to other Fidelity Funds under procedures adopted by the Board. The procedures have been designed to ensure these interfund trades are executed in accordance with Rule 17a-7 of the 1940 Act. Interfund trades are included within the respective purchases and sales amounts shown in the Purchases and Sales of Investments note.
Prior Fiscal Year Reallocation of Underlying Fund Investments. During the prior period, the investment adviser reallocated investments of the Funds. This involved taxable redemptions of the Funds' interest in Fidelity Series Value Discovery Fund, ("selected Underlying Fund") for investments and cash and non-taxable exchanges of those investments and cash for shares of Fidelity Series Intrinsic Opportunities Fund and Fidelity Series Growth & Income Fund which are affiliated investment companies managed by FMR.
Details of these transactions with the net related gain (loss) for the Funds are presented in the accompanying table:
| | Value of Investments and Cash reallocated | Net realized Gain (Loss) on redemptions of selected Underlying Fund |
| Fidelity Freedom Income Fund | $21,943,732 | $5,248,386 |
| Fidelity Freedom 2005 Fund | 9,132,913 | 818,016 |
| Fidelity Freedom 2010 Fund | 82,938,352 | 17,423,248 |
| Fidelity Freedom 2015 Fund | 132,300,852 | 26,218,924 |
| Fidelity Freedom 2020 Fund | 349,185,809 | 55,046,914 |
| Fidelity Freedom 2025 Fund | 312,149,126 | 36,476,750 |
| Fidelity Freedom 2030 Fund | 443,448,822 | 45,658,987 |
| Fidelity Freedom 2035 Fund | 315,567,651 | 25,385,650 |
| Fidelity Freedom 2040 Fund | 341,654,429 | 31,022,107 |
| Fidelity Freedom 2045 Fund | 165,214,747 | 12,941,012 |
| Fidelity Freedom 2050 Fund | 136,449,649 | 10,462,773 |
| Fidelity Freedom 2055 Fund | 44,625,815 | 2,684,111 |
| Fidelity Freedom 2060 Fund | 6,196,209 | 137,579 |
7. Expense Reductions.
Through arrangements with each applicable Fund's custodian, credits realized as a result of certain uninvested cash balances were used to reduce the Fund's expenses. All of the applicable expense reductions are noted in the table below.
| Fidelity Freedom Income Fund | $229 |
| Fidelity Freedom 2005 Fund | 206 |
| Fidelity Freedom 2010 Fund | 121 |
| Fidelity Freedom 2015 Fund | 118 |
| Fidelity Freedom 2020 Fund | 193 |
| Fidelity Freedom 2025 Fund | 59 |
| Fidelity Freedom 2030 Fund | 55 |
| Fidelity Freedom 2035 Fund | 351 |
| Fidelity Freedom 2040 Fund | 42 |
| Fidelity Freedom 2045 Fund | 36 |
| Fidelity Freedom 2050 Fund | 27 |
| Fidelity Freedom 2055 Fund | 71 |
| Fidelity Freedom 2060 Fund | 88 |
8. Distributions to Shareholders.
Distributions to shareholders of each class were as follows:
| | Year ended
March 31, 2019 | Year ended
March 31, 2018(a) |
| Fidelity Freedom Income Fund | | |
| Distributions to shareholders | | |
| Fidelity Freedom Income Fund | $102,717,403 | $– |
| Class K | 70,626,011 | – |
| Class K6 | 4,849,927 | – |
| Total | $178,193,341 | $– |
| From net investment income | | |
| Fidelity Freedom Income Fund | $– | $34,335,271 |
| Class K | – | 17,390,446 |
| Class K6 | – | 223,737 |
| Total | $– | $51,949,454 |
| From net realized gain | | |
| Fidelity Freedom Income Fund | $– | $44,712,535 |
| Class K | – | 22,488,873 |
| Class K6 | – | 239,298 |
| Total | $– | $67,440,706 |
| Fidelity Freedom 2005 Fund | | |
| Distributions to shareholders | | |
| Fidelity Freedom 2005 Fund | $29,853,841 | $– |
| Class K | 20,287,074 | – |
| Class K6 | 1,532,113 | – |
| Total | $51,673,028 | $– |
| From net investment income | | |
| Fidelity Freedom 2005 Fund | $– | $8,256,167 |
| Class K | – | 5,348,186 |
| Class K6 | – | 66,981 |
| Total | $– | $13,671,334 |
| From net realized gain | | |
| Fidelity Freedom 2005 Fund | $– | $14,263,444 |
| Class K | – | 6,417,819 |
| Class K6 | – | 78,417 |
| Total | $– | $20,759,680 |
| Fidelity Freedom 2010 Fund | | |
| Distributions to shareholders | | |
| Fidelity Freedom 2010 Fund | $253,919,287 | $– |
| Class K | 139,656,036 | – |
| Class K6 | 9,802,728 | – |
| Total | $403,378,051 | $– |
| From net investment income | | |
| Fidelity Freedom 2010 Fund | $– | $59,450,122 |
| Class K | – | 33,379,063 |
| Class K6 | – | 446,466 |
| Total | $– | $93,275,651 |
| From net realized gain | | |
| Fidelity Freedom 2010 Fund | $– | $138,121,654 |
| Class K | – | 54,086,430 |
| Class K6 | – | 700,731 |
| Total | $– | $192,908,815 |
| Fidelity Freedom 2015 Fund | | |
| Distributions to shareholders | | |
| Fidelity Freedom 2015 Fund | $377,354,021 | $– |
| Class K | 287,986,155 | – |
| Class K6 | 24,393,690 | – |
| Total | $689,733,866 | $– |
| From net investment income | | |
| Fidelity Freedom 2015 Fund | $– | $75,356,851 |
| Class K | – | 62,744,245 |
| Class K6 | – | 834,279 |
| Total | $– | $138,935,375 |
| From net realized gain | | |
| Fidelity Freedom 2015 Fund | $– | $187,400,162 |
| Class K | – | 102,672,333 |
| Class K6 | – | 1,342,304 |
| Total | $– | $291,414,799 |
| Fidelity Freedom 2020 Fund | | |
| Distributions to shareholders | | |
| Fidelity Freedom 2020 Fund | $826,399,967 | $– |
| Class K | 956,998,176 | – |
| Class K6 | 84,006,920 | – |
| Total | $1,867,405,063 | $– |
| From net investment income | | |
| Fidelity Freedom 2020 Fund | $– | $170,977,599 |
| Class K | – | 214,523,078 |
| Class K6 | – | 3,160,558 |
| Total | $– | $388,661,235 |
| From net realized gain | | |
| Fidelity Freedom 2020 Fund | $– | $406,127,361 |
| Class K | – | 309,195,087 |
| Class K6 | – | 4,430,552 |
| Total | $– | $719,753,000 |
| Fidelity Freedom 2025 Fund | | |
| Distributions to shareholders | | |
| Fidelity Freedom 2025 Fund | $643,389,684 | $– |
| Class K | 845,201,451 | – |
| Class K6 | 94,609,902 | – |
| Total | $1,583,201,037 | $– |
| From net investment income | | |
| Fidelity Freedom 2025 Fund | $– | $135,746,842 |
| Class K | – | 196,874,291 |
| Class K6 | – | 4,557,308 |
| Total | $– | $337,178,441 |
| From net realized gain | | |
| Fidelity Freedom 2025 Fund | $– | $300,732,953 |
| Class K | – | 252,816,654 |
| Class K6 | – | 5,757,887 |
| Total | $– | $559,307,494 |
| Fidelity Freedom 2030 Fund | | |
| Distributions to shareholders | | |
| Fidelity Freedom 2030 Fund | $832,766,884 | $– |
| Class K | 1,115,314,992 | – |
| Class K6 | 117,037,625 | – |
| Total | $2,065,119,501 | $– |
| From net investment income | | |
| Fidelity Freedom 2030 Fund | $– | $152,399,042 |
| Class K | – | 237,812,270 |
| Class K6 | – | 6,564,512 |
| Total | $– | $396,775,824 |
| From net realized gain | | |
| Fidelity Freedom 2030 Fund | $– | $413,872,411 |
| Class K | – | 346,196,136 |
| Class K6 | – | 9,436,482 |
| Total | $– | $769,505,029 |
| Fidelity Freedom 2035 Fund | | |
| Distributions to shareholders | | |
| Fidelity Freedom 2035 Fund | $550,912,169 | $– |
| Class K | 813,680,040 | – |
| Class K6 | 101,166,211 | – |
| Total | $1,465,758,420 | $– |
| From net investment income | | |
| Fidelity Freedom 2035 Fund | $– | $87,722,896 |
| Class K | – | 162,011,402 |
| Class K6 | – | 5,709,559 |
| Total | $– | $255,443,857 |
| From net realized gain | | |
| Fidelity Freedom 2035 Fund | $– | $240,142,544 |
| Class K | – | 221,611,338 |
| Class K6 | – | 7,651,385 |
| Total | $– | $469,405,267 |
| Fidelity Freedom 2040 Fund | | |
| Distributions to shareholders | | |
| Fidelity Freedom 2040 Fund | $581,170,903 | $– |
| Class K | 864,717,475 | – |
| Class K6 | 97,776,569 | – |
| Total | $1,543,664,947 | $– |
| From net investment income | | |
| Fidelity Freedom 2040 Fund | $– | $90,536,406 |
| Class K | – | 170,937,500 |
| Class K6 | – | 4,789,254 |
| Total | $– | $266,263,160 |
| From net realized gain | �� | |
| Fidelity Freedom 2040 Fund | $– | $261,248,683 |
| Class K | – | 242,057,363 |
| Class K6 | – | 6,636,534 |
| Total | $– | $509,942,580 |
| Fidelity Freedom 2045 Fund | | |
| Distributions to shareholders | | |
| Fidelity Freedom 2045 Fund | $293,629,110 | $– |
| Class K | 563,596,638 | – |
| Class K6 | 65,086,061 | – |
| Total | $922,311,809 | $– |
| From net investment income | | |
| Fidelity Freedom 2045 Fund | $– | $44,250,979 |
| Class K | – | 109,126,440 |
| Class K6 | – | 2,701,118 |
| Total | $– | $156,078,537 |
| From net realized gain | | |
| Fidelity Freedom 2045 Fund | $– | $114,572,629 |
| Class K | – | 138,369,458 |
| Class K6 | – | 3,337,686 |
| Total | $– | $256,279,773 |
| Fidelity Freedom 2050 Fund | | |
| Distributions to shareholders | | |
| Fidelity Freedom 2050 Fund | $241,462,546 | $– |
| Class K | 478,387,408 | – |
| Class K6 | 52,675,678 | – |
| Total | $772,525,632 | $– |
| From net investment income | | |
| Fidelity Freedom 2050 Fund | $– | $36,777,044 |
| Class K | – | 92,715,220 |
| Class K6 | – | 1,957,994 |
| Total | $– | $131,450,258 |
| From net realized gain | | |
| Fidelity Freedom 2050 Fund | $– | $93,839,199 |
| Class K | – | 116,797,064 |
| Class K6 | – | 2,419,431 |
| Total | $– | $213,055,694 |
| Fidelity Freedom 2055 Fund | | |
| Distributions to shareholders | | |
| Fidelity Freedom 2055 Fund | $81,845,595 | $– |
| Class K | 178,822,212 | – |
| Class K6 | 19,867,662 | – |
| Total | $280,535,469 | $– |
| From net investment income | | |
| Fidelity Freedom 2055 Fund | $– | $12,886,343 |
| Class K | – | 34,941,200 |
| Class K6 | – | 799,585 |
| Total | $– | $48,627,128 |
| From net realized gain | | |
| Fidelity Freedom 2055 Fund | $– | $27,949,675 |
| Class K | – | 41,275,560 |
| Class K6 | – | 928,253 |
| Total | $– | $70,153,488 |
| Fidelity Freedom 2060 Fund | | |
| Distributions to shareholders | | |
| Fidelity Freedom 2060 Fund | $15,371,631 | $– |
| Class K | 33,767,760 | – |
| Class K6 | 3,803,581 | – |
| Total | $52,942,972 | $– |
| From net investment income | | |
| Fidelity Freedom 2060 Fund | $– | $2,107,103 |
| Class K | – | 5,444,764 |
| Class K6 | – | 151,536 |
| Total | $– | $7,703,403 |
| From net realized gain | | |
| Fidelity Freedom 2060 Fund | $– | $3,721,242 |
| Class K | – | 5,555,128 |
| Class K6 | – | 152,547 |
| Total | $– | $9,428,917 |
(a) Amounts for Class K and Class K6 are for the period July 20, 2017 and June 7, 2017, respectively, (commencement of sale of shares) to March 31, 2018.
9. Share Transactions.
Share transactions for each class were as follows and may contain automatic conversions between classes or exchanges between affiliated funds:
| | Shares | Shares | Dollars | Dollars |
| | Year ended March 31, 2019 | Year ended March 31, 2018(a) | Year ended March 31, 2019 | Year ended March 31, 2018(a) |
| Fidelity Freedom Income Fund | | | | |
| Fidelity Freedom Income Fund | | | | |
| Shares sold | 25,058,541 | 27,221,111 | $286,757,008 | $320,765,917 |
| Reinvestment of distributions | 8,973,666 | 6,605,290 | 100,623,614 | 77,395,265 |
| Shares redeemed | (41,698,472) | (38,028,513) | (476,864,729) | (447,668,101) |
| Net increase (decrease) | (7,666,265) | (4,202,112) | $(89,484,107) | $(49,506,919) |
| Class K | | | | |
| Shares sold | 24,707,642 | 23,453,639 | $282,292,785 | $277,296,475 |
| Issued in exchange for the shares of Fidelity Freedom K Income Fund | – | 136,520,990 | – | 1,613,678,107 |
| Reinvestment of distributions | 6,301,112 | 3,392,232 | 70,626,011 | 39,879,319 |
| Shares redeemed | (57,099,968) | (29,017,558) | (651,962,576) | (343,144,692) |
| Net increase (decrease) | (26,091,214) | 134,349,303 | $(299,043,780) | $1,587,709,209 |
| Class K6 | | | | |
| Shares sold | 13,449,555 | 3,890,192 | $152,953,366 | $45,935,962 |
| Reinvestment of distributions | 436,212 | 39,381 | 4,849,927 | 463,035 |
| Shares redeemed | (2,583,945) | (569,053) | (29,297,281) | (6,709,845) |
| Net increase (decrease) | 11,301,822 | 3,360,520 | $128,506,012 | $39,689,152 |
| Fidelity Freedom 2005 Fund | | | | |
| Fidelity Freedom 2005 Fund | | | | |
| Shares sold | 8,707,889 | 7,378,209 | $105,898,952 | $92,645,422 |
| Reinvestment of distributions | 2,498,926 | 1,791,008 | 29,581,031 | 22,315,999 |
| Shares redeemed | (12,238,570) | (9,828,104) | (149,557,798) | (123,356,983) |
| Net increase (decrease) | (1,031,755) | (658,887) | $(14,077,815) | $(8,395,562) |
| Class K | | | | |
| Shares sold | 9,255,304 | 9,369,547 | $113,037,972 | $118,391,743 |
| Issued in exchange for the shares of Fidelity Freedom K 2005 Fund | – | 32,823,330 | – | 412,589,249 |
| Reinvestment of distributions | 1,716,365 | 938,278 | 20,287,074 | 11,766,005 |
| Shares redeemed | (15,495,358) | (9,282,767) | (188,855,616) | (117,477,612) |
| Net increase (decrease) | (4,523,689) | 33,848,388 | $(55,530,570) | $425,269,385 |
| Class K6 | | | | |
| Shares sold | 3,528,841 | 893,756 | $42,992,307 | $11,275,207 |
| Reinvestment of distributions | 131,530 | 11,585 | 1,532,113 | 145,398 |
| Shares redeemed | (1,034,182) | (106,187) | (12,433,043) | (1,340,558) |
| Net increase (decrease) | 2,626,189 | 799,154 | $32,091,377 | $10,080,047 |
| Fidelity Freedom 2010 Fund | | | | |
| Fidelity Freedom 2010 Fund | | | | |
| Shares sold | 22,137,663 | 23,767,583 | $343,265,947 | $381,761,384 |
| Reinvestment of distributions | 16,784,206 | 12,229,853 | 250,047,842 | 194,626,240 |
| Shares redeemed | (48,968,002) | (49,294,217) | (758,581,263) | (791,146,041) |
| Net increase (decrease) | (10,046,133) | (13,296,781) | $(165,267,474) | $(214,758,417) |
| Class K | | | | |
| Shares sold | 18,984,925 | 20,322,144 | $293,919,487 | $328,782,786 |
| Issued in exchange for the shares of Fidelity Freedom K 2010 Fund | – | 158,527,428 | – | 2,547,535,809 |
| Reinvestment of distributions | 9,374,907 | 5,452,961 | 139,656,036 | 87,465,493 |
| Shares redeemed | (53,900,418) | (34,234,425) | (833,905,445) | (555,204,634) |
| Net increase (decrease) | (25,540,586) | 150,068,108 | $(400,329,922) | $2,408,579,454 |
| Class K6 | | | | |
| Shares sold | 12,241,190 | 4,164,658 | $189,424,821 | $67,215,211 |
| Reinvestment of distributions | 670,199 | 71,521 | 9,802,728 | 1,147,196 |
| Shares redeemed | (2,696,778) | (490,870) | (41,281,520) | (7,955,488) |
| Net increase (decrease) | 10,214,611 | 3,745,309 | $157,946,029 | $60,406,919 |
| Fidelity Freedom 2015 Fund | | | | |
| Fidelity Freedom 2015 Fund | | | | |
| Shares sold | 68,644,548 | 72,616,042 | $886,402,243 | $968,356,768 |
| Reinvestment of distributions | 30,420,107 | 19,682,696 | 373,367,843 | 260,136,127 |
| Shares redeemed | (112,629,257) | (104,001,992) | (1,453,808,319) | (1,384,215,146) |
| Net increase (decrease) | (13,564,602) | (11,703,254) | $(194,038,233) | $(155,722,251) |
| Class K | | | | |
| Shares sold | 48,472,774 | 57,486,192 | $623,037,344 | $773,133,070 |
| Issued in exchange for the shares of Fidelity Freedom K 2015 Fund | – | 357,299,109 | – | 4,748,505,056 |
| Reinvestment of distributions | 23,474,505 | 12,372,220 | 287,986,155 | 165,416,578 |
| Shares redeemed | (145,174,941) | (79,691,095) | (1,869,172,103) | (1,075,934,728) |
| Net increase (decrease) | (73,227,662) | 347,466,426 | $(958,148,604) | $4,611,119,976 |
| Class K6 | | | | |
| Shares sold | 35,938,671 | 10,514,183 | $463,016,828 | $140,899,779 |
| Reinvestment of distributions | 2,034,205 | 162,796 | 24,393,690 | 2,176,583 |
| Shares redeemed | (7,934,238) | (2,096,076) | (100,776,398) | (28,077,012) |
| Net increase (decrease) | 30,038,638 | 8,580,903 | $386,634,120 | $114,999,350 |
| Fidelity Freedom 2020 Fund | | | | |
| Fidelity Freedom 2020 Fund | | | | |
| Shares sold | 174,048,484 | 152,441,221 | $2,786,786,989 | $2,504,940,140 |
| Reinvestment of distributions | 53,655,013 | 35,050,498 | 818,525,498 | 571,436,446 |
| Shares redeemed | (226,928,918) | (187,167,034) | (3,635,996,707) | (3,072,056,561) |
| Net increase (decrease) | 774,579 | 324,685 | $(30,684,220) | $4,320,025 |
| Class K | | | | |
| Shares sold | 159,909,895 | 159,801,375 | $2,553,281,316 | $2,656,458,207 |
| Issued in exchange for the shares of Fidelity Freedom K 2020 Fund | – | 997,191,746 | – | 16,284,141,352 |
| Reinvestment of distributions | 62,766,863 | 31,625,493 | 956,998,176 | 523,718,165 |
| Shares redeemed | (375,652,943) | (181,091,802) | (6,006,032,882) | (3,024,255,229) |
| Net increase (decrease) | (152,976,185) | 1,007,526,812 | $(2,495,753,390) | $16,440,062,495 |
| Class K6 | | | | |
| Shares sold | 99,609,081 | 31,475,610 | $1,599,046,170 | $521,683,894 |
| Reinvestment of distributions | 5,641,608 | 458,124 | 84,006,920 | 7,591,110 |
| Shares redeemed | (17,989,116) | (3,147,676) | (282,730,830) | (52,491,121) |
| Net increase (decrease) | 87,261,573 | 28,786,058 | $1,400,322,260 | $476,783,883 |
| Fidelity Freedom 2025 Fund | | | | |
| Fidelity Freedom 2025 Fund | | | | |
| Shares sold | 190,997,403 | 158,726,717 | $2,665,870,688 | $2,259,361,477 |
| Reinvestment of distributions | 48,080,617 | 30,656,487 | 639,002,472 | 433,261,289 |
| Shares redeemed | (208,942,009) | (151,675,334) | (2,921,895,528) | (2,154,686,419) |
| Net increase (decrease) | 30,136,011 | 37,707,870 | $382,977,632 | $537,936,347 |
| Class K | | | | |
| Shares sold | 219,109,631 | 199,976,963 | $3,047,407,947 | $2,881,263,698 |
| Issued in exchange for the shares of Fidelity Freedom K 2025 Fund | – | 1,039,138,058 | – | 14,641,455,337 |
| Reinvestment of distributions | 63,709,142 | 31,228,538 | 845,201,451 | 449,690,945 |
| Shares redeemed | (385,355,828) | (171,473,684) | (5,360,718,475) | (2,483,694,512) |
| Net increase (decrease) | (102,537,055) | 1,098,869,875 | $(1,468,109,077) | $15,488,715,468 |
| Class K6 | | | | |
| Shares sold | 143,847,621 | 47,051,793 | $2,010,911,795 | $673,422,348 |
| Reinvestment of distributions | 7,306,902 | 715,836 | 94,609,902 | 10,315,195 |
| Shares redeemed | (19,510,064) | (4,172,324) | (267,428,812) | (60,270,553) |
| Net increase (decrease) | 131,644,459 | 43,595,305 | $1,838,092,885 | $623,466,990 |
| Fidelity Freedom 2030 Fund | | | | |
| Fidelity Freedom 2030 Fund | | | | |
| Shares sold | 150,298,688 | 123,266,681 | $2,620,161,152 | $2,193,032,389 |
| Reinvestment of distributions | 50,125,929 | 31,803,918 | 826,346,269 | 561,630,140 |
| Shares redeemed | (154,952,069) | (126,546,656) | (2,709,471,936) | (2,245,714,755) |
| Net increase (decrease) | 45,472,548 | 28,523,943 | $737,035,485 | $508,947,774 |
| Class K | | | | |
| Shares sold | 187,359,164 | 159,214,941 | $3,255,368,824 | $2,878,963,957 |
| Issued in exchange for the shares of Fidelity Freedom K 2030 Fund | – | 980,848,240 | – | 17,213,886,716 |
| Reinvestment of distributions | 67,704,007 | 32,337,117 | 1,115,314,992 | 584,008,406 |
| Shares redeemed | (317,489,316) | (148,080,700) | (5,520,962,244) | (2,692,845,198) |
| Net increase (decrease) | (62,426,145) | 1,024,319,598 | $(1,150,278,428) | $17,984,013,881 |
| Class K6 | | | | |
| Shares sold | 114,242,961 | 47,995,734 | $1,995,309,716 | $858,334,852 |
| Reinvestment of distributions | 7,297,869 | 885,011 | 117,037,625 | 16,000,993 |
| Shares redeemed | (13,537,858) | (3,213,471) | (231,723,598) | (58,671,562) |
| Net increase (decrease) | 108,002,972 | 45,667,274 | $1,880,623,743 | $815,664,283 |
| Fidelity Freedom 2035 Fund | | | | |
| Fidelity Freedom 2035 Fund | | | | |
| Shares sold | 138,496,945 | 110,962,220 | $2,037,156,074 | $1,654,304,549 |
| Reinvestment of distributions | 39,740,764 | 21,957,182 | 547,688,796 | 325,960,643 |
| Shares redeemed | (136,013,816) | (99,897,658) | (2,013,190,111) | (1,486,838,456) |
| Net increase (decrease) | 42,223,893 | 33,021,744 | $571,654,759 | $493,426,736 |
| Class K | | | | |
| Shares sold | 185,251,656 | 152,904,028 | $2,714,632,551 | $2,323,823,499 |
| Issued in exchange for the shares of Fidelity Freedom K 2035 Fund | – | 810,190,579 | – | 11,861,189,816 |
| Reinvestment of distributions | 59,222,839 | 25,155,590 | 813,680,040 | 383,622,740 |
| Shares redeemed | (289,910,315) | (133,107,016) | (4,248,047,149) | (2,040,612,137) |
| Net increase (decrease) | (45,435,820) | 855,143,181 | $(719,734,558) | $12,528,023,918 |
| Class K6 | | | | |
| Shares sold | 112,638,479 | 48,428,487 | $1,660,559,280 | $727,016,849 |
| Reinvestment of distributions | 7,583,919 | 875,553 | 101,166,211 | 13,360,944 |
| Shares redeemed | (13,041,070) | (2,447,780) | (187,832,399) | (37,752,360) |
| Net increase (decrease) | 107,181,328 | 46,856,260 | $1,573,893,092 | $702,625,433 |
| Fidelity Freedom 2040 Fund | | | | |
| Fidelity Freedom 2040 Fund | | | | |
| Shares sold | 182,072,693 | 136,619,831 | $1,878,923,853 | $1,431,492,061 |
| Reinvestment of distributions | 59,905,740 | 33,488,676 | 576,239,377 | 348,747,375 |
| Shares redeemed | (185,049,244) | (139,529,622) | (1,921,335,739) | (1,457,941,134) |
| Net increase (decrease) | 56,929,189 | 30,578,885 | $533,827,491 | $322,298,302 |
| Class K | | | | |
| Shares sold | 258,792,906 | 204,272,570 | $2,655,852,866 | $2,180,144,652 |
| Issued in exchange for the shares of Fidelity Freedom K 2040 Fund | – | 1,209,417,175 | – | 12,432,808,583 |
| Reinvestment of distributions | 90,012,951 | 38,561,612 | 864,717,475 | 412,994,864 |
| Shares redeemed | (418,657,133) | (192,024,994) | (4,307,896,378) | (2,069,340,268) |
| Net increase (decrease) | (69,851,276) | 1,260,226,363 | $(787,326,037) | $12,956,607,831 |
| Class K6 | | | | |
| Shares sold | 146,798,962 | 63,538,724 | $1,520,211,796 | $671,238,294 |
| Reinvestment of distributions | 10,519,511 | 1,066,834 | 97,776,569 | 11,425,788 |
| Shares redeemed | (16,104,067) | (3,427,354) | (162,433,213) | (37,056,376) |
| Net increase (decrease) | 141,214,406 | 61,178,204 | $1,455,555,152 | $645,607,706 |
| Fidelity Freedom 2045 Fund | | | | |
| Fidelity Freedom 2045 Fund | | | | |
| Shares sold | 119,195,819 | 83,678,942 | $1,394,706,563 | $990,525,865 |
| Reinvestment of distributions | 26,703,997 | 13,350,262 | 291,331,809 | 157,549,317 |
| Shares redeemed | (108,800,376) | (72,278,251) | (1,284,013,422) | (853,762,795) |
| Net increase (decrease) | 37,099,440 | 24,750,953 | $402,024,950 | $294,312,387 |
| Class K | | | | |
| Shares sold | 183,374,163 | 138,438,372 | $2,134,406,191 | $1,672,115,670 |
| Issued in exchange for the shares of Fidelity Freedom K 2045 Fund | – | 680,392,245 | – | 7,906,157,717 |
| Reinvestment of distributions | 51,875,559 | 20,403,619 | 563,596,638 | 247,495,898 |
| Shares redeemed | (261,085,998) | (114,898,251) | (3,037,292,345) | (1,401,257,211) |
| Net increase (decrease) | (25,836,276) | 724,335,985 | $(339,289,516) | $8,424,512,074 |
| Class K6 | | | | |
| Shares sold | 99,663,304 | 35,416,332 | $1,164,218,713 | $424,716,328 |
| Reinvestment of distributions | 6,200,558 | 497,430 | 65,086,061 | 6,038,804 |
| Shares redeemed | (9,815,182) | (1,761,820) | (111,945,159) | (21,547,868) |
| Net increase (decrease) | 96,048,680 | 34,151,942 | $1,117,359,615 | $409,207,264 |
| Fidelity Freedom 2050 Fund | | | | |
| Fidelity Freedom 2050 Fund | | | | |
| Shares sold | 104,143,856 | 75,824,728 | $1,224,783,503 | $902,647,093 |
| Reinvestment of distributions | 21,745,643 | 10,861,802 | 238,582,101 | 128,951,626 |
| Shares redeemed | (90,449,638) | (63,697,605) | (1,071,655,417) | (756,367,850) |
| Net increase (decrease) | 35,439,861 | 22,988,925 | $391,710,187 | $275,230,869 |
| Class K | | | | |
| Shares sold | 175,911,537 | 122,562,514 | $2,056,748,125 | $1,491,197,304 |
| Issued in exchange for the shares of Fidelity Freedom K 2050 Fund | – | 572,849,516 | – | 6,690,882,218 |
| Reinvestment of distributions | 43,756,458 | 17,173,138 | 478,387,408 | 209,512,284 |
| Shares redeemed | (228,313,958) | (96,878,288) | (2,677,330,866) | (1,187,384,579) |
| Net increase (decrease) | (8,645,963) | 615,706,880 | $(142,195,333) | $7,204,207,227 |
| Class K6 | | | | |
| Shares sold | 80,095,292 | 28,136,620 | $947,863,380 | $340,101,592 |
| Reinvestment of distributions | 4,987,171 | 358,805 | 52,675,678 | 4,377,425 |
| Shares redeemed | (8,983,925) | (1,536,761) | (103,494,973) | (18,895,572) |
| Net increase (decrease) | 76,098,538 | 26,958,664 | $897,044,085 | $325,583,445 |
| Fidelity Freedom 2055 Fund | | | | |
| Fidelity Freedom 2055 Fund | | | | |
| Shares sold | 53,445,059 | 38,370,551 | $709,023,239 | $515,078,307 |
| Reinvestment of distributions | 6,462,035 | 2,987,887 | 80,509,228 | 40,144,179 |
| Shares redeemed | (38,484,032) | (23,349,667) | (514,580,553) | (313,087,284) |
| Net increase (decrease) | 21,423,062 | 18,008,771 | $274,951,914 | $242,135,202 |
| Class K | | | | |
| Shares sold | 98,682,302 | 61,914,305 | $1,305,321,274 | $850,947,947 |
| Issued in exchange for the shares of Fidelity Freedom K 2055 Fund | – | 187,145,598 | – | 2,460,964,568 |
| Reinvestment of distributions | 14,422,538 | 5,543,037 | 178,822,212 | 76,216,759 |
| Shares redeemed | (91,913,657) | (35,972,762) | (1,217,064,799) | (496,645,456) |
| Net increase (decrease) | 21,191,183 | 218,630,178 | $267,078,687 | $2,891,483,818 |
| Class K6 | | | | |
| Shares sold | 33,803,827 | 10,467,862 | $452,490,356 | $142,591,736 |
| Reinvestment of distributions | 1,656,647 | 125,661 | 19,867,662 | 1,727,838 |
| Shares redeemed | (3,933,170) | (701,172) | (51,403,131) | (9,691,523) |
| Net increase (decrease) | 31,527,304 | 9,892,351 | $420,954,887 | $134,628,051 |
| Fidelity Freedom 2060 Fund | | | | |
| Fidelity Freedom 2060 Fund | | | | |
| Shares sold | 20,107,238 | 13,553,573 | $237,700,369 | $162,527,190 |
| Reinvestment of distributions | 1,350,122 | 472,322 | 14,977,346 | 5,668,501 |
| Shares redeemed | (10,024,630) | (4,749,212) | (119,574,619) | (56,963,732) |
| Net increase (decrease) | 11,432,730 | 9,276,683 | $133,103,096 | $111,231,959 |
| Class K | | | | |
| Shares sold | 43,960,200 | 21,671,635 | $518,763,344 | $266,499,060 |
| Issued in exchange for the shares of Fidelity Freedom K 2060 Fund | – | 30,017,564 | – | 350,605,136 |
| Reinvestment of distributions | 3,063,146 | 897,950 | 33,767,760 | 10,999,891 |
| Shares redeemed | (25,243,734) | (7,538,541) | (298,055,315) | (92,630,473) |
| Net increase (decrease) | 21,779,612 | 45,048,608 | $254,475,789 | $535,473,614 |
| Class K6 | | | | |
| Shares sold | 10,340,589 | 2,364,906 | $122,533,903 | $28,724,895 |
| Reinvestment of distributions | 354,539 | 24,823 | 3,803,581 | 304,083 |
| Shares redeemed | (1,270,778) | (186,212) | (14,790,330) | (2,286,597) |
| Net increase (decrease) | 9,424,350 | 2,203,517 | $111,547,154 | $26,742,381 |
(a) Amounts for Class K and Class K6 are for the period July 20, 2017 and June 7, 2017, respectively, (commencement of sale of shares) to March 31, 2018.
10. Other.
The Funds' organizational documents provide former and current trustees and officers with a limited indemnification against liabilities arising in connection with the performance of their duties to the Funds. In the normal course of business, the Funds may also enter into contracts that provide general indemnifications. The Funds' maximum exposure under these arrangements is unknown as this would be dependent on future claims that may be made against the Funds. The risk of material loss from such claims is considered remote.
The Funds do not invest in the Underlying Funds for the purpose of exercising management or control; however, investments by the Funds within their principal investment strategies may represent a significant portion of the Underlying Fund's net assets. At the end of the period, the following Funds were the owners of record of 10% or more of the total outstanding shares of the Underlying Funds.
| | Fidelity Freedom 2015 Fund | Fidelity Freedom 2020 Fund | Fidelity Freedom 2025 Fund | Fidelity Freedom 2030 Fund | Fidelity Freedom 2035 Fund | Fidelity Freedom 2040 Fund | Fidelity Freedom 2045 Fund |
| Fidelity Series Small Cap Opportunities Fund | - | - | 11% | 16% | 13% | 14% | - |
| Fidelity Series Investment Grade Bond Fund | - | 25% | 21% | 19% | - | - | - |
| Fidelity Series All-Sector Equity Fund | - | - | 10% | 15% | 13% | 15% | - |
| Fidelity Series Emerging Markets Opportunities Fund | - | 12% | 12% | 16% | 13% | 13% | - |
| Fidelity Series Inflation-Protected Bond Index Fund | 10% | 24% | 19% | - | - | - | - |
| Fidelity Series High Income Fund | - | 13% | 13% | 15% | - | 13% | - |
| Fidelity Series Floating Rate High Income Fund | - | 14% | 13% | 16% | 11% | 11% | - |
| Fidelity Series Real Estate Income Fund | - | 14% | 14% | 16% | 11% | 11% | - |
| Fidelity Series Commodity Strategy Fund | - | 14% | 13% | 16% | 11% | 12% | - |
| Fidelity Series International Growth Fund | - | 11% | 12% | 16% | 13% | 14% | - |
| Fidelity Series International Value Fund | - | 11% | 12% | 16% | 13% | 14% | - |
| Fidelity Series International Small Cap Fund | - | 11% | 12% | 16% | 13% | 14% | - |
| Fidelity Series Emerging Markets Debt Fund | - | 14% | 14% | 16% | 11% | 11% | - |
| Fidelity Series Value Discovery Fund | - | - | 11% | 15% | 13% | 14% | - |
| Fidelity Series Intrinsic Opportunities Fund | - | 11% | 12% | 18% | 15% | 16% | - |
| Fidelity Series Large Cap Stock Fund | - | - | 11% | 16% | 13% | 14% | - |
| Fidelity Series Opportunistic Insights Fund | - | - | 11% | 15% | 13% | 14% | - |
| Fidelity Series Stock Selector Large Cap Value Fund | - | - | 11% | 16% | 13% | 14% | - |
| Fidelity Series Growth Company Fund | - | 11% | 12% | 17% | 15% | 16% | 10% |
| Fidelity Series Blue Chip Growth Fund | - | 11% | 12% | 18% | 15% | 16% | - |
| Fidelity Series Large Cap Value Index Fund | - | 11% | 12% | 17% | 14% | 15% | - |
| Fidelity Series Small Cap Discovery Fund | - | 11% | 13% | 18% | 15% | 15% | - |
| Fidelity Series Short-Term Credit Fund | 11% | 26% | 18% | - | - | - | - |
| Fidelity Series Government Money Market Fund | 11% | 26% | 18% | - | - | - | - |
| Fidelity Series Long-Term Treasury Bond Index Fund | - | 13% | 14% | 17% | 12% | - | - |
| Fidelity Series International Credit Fund | - | 18% | 15% | 15% | - | - | - |
| Fidelity Series Canada Fund | - | 11% | 12% | 16% | 13% | 14% | - |
| Fidelity Series Emerging Markets Fund | - | 12% | 12% | 16% | 13% | 13% | - |
The Funds, in aggregate, were the owners of record of more than 20% of the total outstanding shares of the following Underlying Funds.
| Fund | % of shares held |
| Fidelity Series Small Cap Opportunities Fund | 90% |
| Fidelity Series Investment Grade Bond Fund | 91% |
| Fidelity Series All-Sector Equity Fund | 88% |
| Fidelity Series Emerging Markets Opportunities Fund | 91% |
| Fidelity Series Inflation-Protected Bond Index Fund | 82% |
| Fidelity Series High Income Fund | 91% |
| Fidelity Series Floating Rate High Income Fund | 91% |
| Fidelity Series Real Estate Income Fund | 91% |
| Fidelity Series Commodity Strategy Fund | 91% |
| Fidelity Series International Growth Fund | 91% |
| Fidelity Series International Value Fund | 91% |
| Fidelity Series International Small Cap Fund | 91% |
| Fidelity Series Emerging Markets Debt Fund | 91% |
| Fidelity Series Value Discovery Fund | 86% |
| Fidelity Series Intrinsic Opportunities Fund | 100% |
| Fidelity Series Large Cap Stock Fund | 88% |
| Fidelity Series Opportunistic Insights Fund | 87% |
| Fidelity Series Stock Selector Large Cap Value Fund | 90% |
| Fidelity Series Growth Company Fund | 100% |
| Fidelity Series Blue Chip Growth Fund | 100% |
| Fidelity Series Large Cap Value Index Fund | 95% |
| Fidelity Series Small Cap Discovery Fund | 100% |
| Fidelity Series Short-Term Credit Fund | 91% |
| Fidelity Series Government Money Market Fund | 91% |
| Fidelity Series Long-Term Treasury Bond Index Fund | 83% |
| Fidelity Series International Credit Fund | 91% |
| Fidelity Series Canada Fund | 91% |
| Fidelity Series Emerging Markets Fund | 91% |
11. Prior Year Merger Information.
On September 8, 2017, each Surviving Fund acquired all of the assets and assumed all of the liabilities of each Target Fund pursuant to each Agreement and Plan of Reorganization approved by the Board of Trustees ("The Board"). Each acquisition was accomplished by an exchange of Class K shares of each Surviving Fund for corresponding shares then outstanding of each Target Fund, at their respective net asset value on the acquisition date. In addition, the Board approved the creation of additional classes of shares that commenced sale of shares on July 20, 2017. The reorganization provided shareholders of each Target Fund access to a larger portfolio with a similar investment objective and lower expenses. The reorganization qualified as a tax-free reorganization for federal income tax purposes with no gain or loss recognized to the funds or their shareholders.
Combined total net assets after the acquisition were as follows:
| Target Funds | Securities | Unrealized appreciation (depreciation) | Net Assets | Surviving Funds | Net assets | Total net assets after the acquisition |
| Fidelity Freedom K 2005 Fund | $412,419,889 | $40,449,279 | $412,589,249 | Fidelity Freedom 2005 Fund | $610,614,214 | $1,023,203,463 |
| Fidelity Freedom K 2010 Fund | 2,546,556,623 | 329,226,460 | 2,547,535,809 | Fidelity Freedom 2010 Fund | 4,238,458,400 | 6,785,994,209 |
| Fidelity Freedom K 2015 Fund | 4,746,815,623 | 696,286,166 | 4,748,505,056 | Fidelity Freedom 2015 Fund | 5,645,731,933 | 10,394,236,989 |
| Fidelity Freedom K 2020 Fund | 16,278,675,415 | 2,424,773,804 | 16,284,141,352 | Fidelity Freedom 2020 Fund | 13,414,449,646 | 29,698,590,998 |
| Fidelity Freedom K 2025 Fund | 14,636,906,056 | 2,237,270,202 | 14,641,455,337 | Fidelity Freedom 2025 Fund | 11,194,758,422 | 25,836,213,759 |
| Fidelity Freedom K 2030 Fund | 17,209,401,290 | 3,150,938,702 | 17,213,886,716 | Fidelity Freedom 2030 Fund | 12,912,345,253 | 30,126,231,969 |
| Fidelity Freedom K 2035 Fund | 11,858,805,237 | 2,326,083,837�� | 11,861,189,816 | Fidelity Freedom 2035 Fund | 8,269,361,979 | 20,130,551,795 |
| Fidelity Freedom K 2040 Fund | 12,430,342,176 | 2,512,607,175 | 12,432,808,583 | Fidelity Freedom 2040 Fund | 8,489,396,048 | 20,922,204,631 |
| Fidelity Freedom K 2045 Fund | 7,904,615,516 | 1,469,965,780 | 7,906,157,717 | Fidelity Freedom 2045 Fund | 4,301,147,363 | 12,207,305,080 |
| Fidelity Freedom K 2050 Fund | 6,689,588,035 | 1,219,930,995 | 6,690,882,218 | Fidelity Freedom 2050 Fund | 3,509,123,170 | 10,200,005,388 |
| Fidelity Freedom K 2055 Fund | 2,460,473,831 | 326,647,894 | 2,460,964,568 | Fidelity Freedom 2055 Fund | 1,221,516,226 | 3,682,480,794 |
| Fidelity Freedom K 2060 Fund | 350,535,702 | 37,076,005 | 350,605,136 | Fidelity Freedom 2060 Fund | 184,982,168 | 535,587,304 |
| Fidelity Freedom K Income Fund | 1,612,974,652 | 111,654,038 | 1,613,678,107 | Fidelity Freedom Income Fund | 2,180,776,091 | 3,794,454,198 |
Pro forma results of operations of the combined entity for the entire period ended March 31, 2018, as though the acquisition had occurred as of the beginning of the year (rather than on the actual acquisition date), were as follows:
| Surviving Funds | Net investment income (loss) | Total net realized gain (loss) | Total change in net unrealized appreciation (depreciation) | Net increase (decrease) in net assets resulting from operations |
| Fidelity Freedom 2005 Fund | $16,728,029 | $35,389,643 | $11,609,337 | $63,727,009 |
| Fidelity Freedom 2010 Fund | 106,763,939 | 333,966,494 | 71,884,105 | 512,614,538 |
| Fidelity Freedom 2015 Fund | 159,942,201 | 586,125,932 | 165,934,516 | 912,002,649 |
| Fidelity Freedom 2020 Fund | 450,417,256 | 1,534,035,495 | 849,346,252 | 2,833,799,003 |
| Fidelity Freedom 2025 Fund | 380,268,141 | 1,245,869,247 | 1,016,040,300 | 2,642,177,688 |
| Fidelity Freedom 2030 Fund | 412,091,376 | 1,721,922,624 | 1,479,580,811 | 3,613,594,811 |
| Fidelity Freedom 2035 Fund | 242,223,907 | 1,155,921,037 | 1,298,580,090 | 2,696,725,034 |
| Fidelity Freedom 2040 Fund | 248,017,447 | 1,233,803,836 | 1,365,296,048 | 2,847,117,331 |
| Fidelity Freedom 2045 Fund | 146,215,610 | 672,902,843 | 832,531,991 | 1,651,650,444 |
| Fidelity Freedom 2050 Fund | 122,703,111 | 561,458,056 | 703,867,025 | 1,388,028,192 |
| Fidelity Freedom 2055 Fund | 45,262,250 | 182,494,227 | 254,156,558 | 481,913,035 |
| Fidelity Freedom 2060 Fund | 7,044,354 | 27,215,638 | 32,045,178 | 66,305,170 |
| Fidelity Freedom Income Fund | 63,379,287 | 104,507,706 | 13,301,658 | 181,188,651 |
Because each combined investment portfolio has been managed as a single portfolio since each acquisition was completed, it is not practicable to separate the amounts of revenue and earnings of each Target Fund that have been included in the Surviving Fund's accompanying Statement of Operations since September 8, 2017.
Report of Independent Registered Public Accounting Firm
To the Board of Trustees of Fidelity Aberdeen Street Trust and Shareholders of Fidelity Freedom Income Fund, Fidelity Freedom 2005 Fund, Fidelity Freedom 2010 Fund, Fidelity Freedom 2015 Fund, Fidelity Freedom 2020 Fund, Fidelity Freedom 2025 Fund, Fidelity Freedom 2030 Fund, Fidelity Freedom 2035 Fund, Fidelity Freedom 2040 Fund, Fidelity Freedom 2045 Fund, Fidelity Freedom 2050 Fund, Fidelity Freedom 2055 Fund and Fidelity Freedom 2060 Fund:
Opinions on the Financial Statements
We have audited the accompanying statements of assets and liabilities, including the schedules of investments, of Fidelity Freedom Income Fund, Fidelity Freedom 2005 Fund, Fidelity Freedom 2010 Fund, Fidelity Freedom 2015 Fund, Fidelity Freedom 2020 Fund, Fidelity Freedom 2025 Fund, Fidelity Freedom 2030 Fund, Fidelity Freedom 2035 Fund, Fidelity Freedom 2040 Fund, Fidelity Freedom 2045 Fund, Fidelity Freedom 2050 Fund, Fidelity Freedom 2055 Fund and Fidelity Freedom 2060 Fund (thirteen of the funds constituting Fidelity Aberdeen Street Trust, hereafter collectively referred to as the "Funds") as of March 31, 2019, the related statements of operations for the year ended March 31, 2019, the statements of changes in net assets for each of the two years in the period ended March 31, 2019, including the related notes, and the financial highlights for each of the periods indicated therein (collectively referred to as the “financial statements”). In our opinion, the financial statements present fairly, in all material respects, the financial position of each of the Funds as of March 31, 2019, the results of each of their operations for the year then ended, the changes in each of their net assets for each of the two years in the period ended March 31, 2019 and each of the financial highlights for each of the periods indicated therein in conformity with accounting principles generally accepted in the United States of America.
Basis for Opinions
These financial statements are the responsibility of the Funds' management. Our responsibility is to express an opinion on the Funds' financial statements based on our audits. We are a public accounting firm registered with the Public Company Accounting Oversight Board (United States) (PCAOB) and are required to be independent with respect to the Funds in accordance with the U.S. federal securities laws and the applicable rules and regulations of the Securities and Exchange Commission and the PCAOB.
We conducted our audits of these financial statements in accordance with the standards of the PCAOB. Those standards require that we plan and perform the audit to obtain reasonable assurance about whether the financial statements are free of material misstatement, whether due to error or fraud.
Our audits included performing procedures to assess the risks of material misstatement of the financial statements, whether due to error or fraud, and performing procedures that respond to those risks. Such procedures included examining, on a test basis, evidence regarding the amounts and disclosures in the financial statements. Our audits also included evaluating the accounting principles used and significant estimates made by management, as well as evaluating the overall presentation of the financial statements. Our procedures included confirmation of securities owned as of March 31, 2019 by correspondence with the custodian. We believe that our audits provide a reasonable basis for our opinions.
PricewaterhouseCoopers LLP
Boston, Massachusetts
May 16, 2019
We have served as the auditor of one or more investment companies in the Fidelity group of funds since 1932.
Trustees and Officers
The Trustees, Members of the Advisory Board (if any), and officers of the trust and funds, as applicable, are listed below. The Board of Trustees governs each fund and is responsible for protecting the interests of shareholders. The Trustees are experienced executives who meet periodically throughout the year to oversee each fund's activities, review contractual arrangements with companies that provide services to each fund, oversee management of the risks associated with such activities and contractual arrangements, and review each fund's performance. If the interests of a fund and an underlying Fidelity® fund were to diverge, a conflict of interest could arise and affect how the Trustees and Members of the Advisory Board fulfill their fiduciary duties to the affected funds. FMRC has structured the funds to avoid these potential conflicts, although there may be situations where a conflict of interest is unavoidable. In such instances, FMRC, the Trustees, and Members of the Advisory Board would take reasonable steps to minimize and, if possible, eliminate the conflict. Each of the Trustees oversees 264 funds.
The Trustees hold office without limit in time except that (a) any Trustee may resign; (b) any Trustee may be removed by written instrument, signed by at least two-thirds of the number of Trustees prior to such removal; (c) any Trustee who requests to be retired or who has become incapacitated by illness or injury may be retired by written instrument signed by a majority of the other Trustees; and (d) any Trustee may be removed at any special meeting of shareholders by a two-thirds vote of the outstanding voting securities of the trust. Each Trustee who is not an interested person (as defined in the 1940 Act) of the trust and the funds is referred to herein as an Independent Trustee. Each Independent Trustee shall retire not later than the last day of the calendar year in which his or her 75th birthday occurs. The Independent Trustees may waive this mandatory retirement age policy with respect to individual Trustees. Officers and Advisory Board Members hold office without limit in time, except that any officer or Advisory Board Member may resign or may be removed by a vote of a majority of the Trustees at any regular meeting or any special meeting of the Trustees. Except as indicated, each individual has held the office shown or other offices in the same company for the past five years.
Each fund's Statement of Additional Information (SAI) includes more information about the Trustees. To request a free copy, call Fidelity at 1-800-544-8544 if you’re an individual investing directly with Fidelity, call 1-800-835-5092 if you’re a plan sponsor or participant with Fidelity as your recordkeeper or call 1-877-208-0098 on institutional accounts or if you’re an advisor or invest through one.
Experience, Skills, Attributes, and Qualifications of the Trustees. The Governance and Nominating Committee has adopted a statement of policy that describes the experience, qualifications, attributes, and skills that are necessary and desirable for potential Independent Trustee candidates (Statement of Policy). The Board believes that each Trustee satisfied at the time he or she was initially elected or appointed a Trustee, and continues to satisfy, the standards contemplated by the Statement of Policy. The Governance and Nominating Committee also engages professional search firms to help identify potential Independent Trustee candidates who have the experience, qualifications, attributes, and skills consistent with the Statement of Policy. From time to time, additional criteria based on the composition and skills of the current Independent Trustees, as well as experience or skills that may be appropriate in light of future changes to board composition, business conditions, and regulatory or other developments, have also been considered by the professional search firms and the Governance and Nominating Committee. In addition, the Board takes into account the Trustees' commitment and participation in Board and committee meetings, as well as their leadership of standing and ad hoc committees throughout their tenure.
In determining that a particular Trustee was and continues to be qualified to serve as a Trustee, the Board has considered a variety of criteria, none of which, in isolation, was controlling. The Board believes that, collectively, the Trustees have balanced and diverse experience, qualifications, attributes, and skills, which allow the Board to operate effectively in governing each fund and protecting the interests of shareholders. Information about the specific experience, skills, attributes, and qualifications of each Trustee, which in each case led to the Board's conclusion that the Trustee should serve (or continue to serve) as a trustee of the funds, is provided below.
Board Structure and Oversight Function. Abigail P. Johnson is an interested person and currently serves as Chairman. The Trustees have determined that an interested Chairman is appropriate and benefits shareholders because an interested Chairman has a personal and professional stake in the quality and continuity of services provided to the funds. Independent Trustees exercise their informed business judgment to appoint an individual of their choosing to serve as Chairman, regardless of whether the Trustee happens to be independent or a member of management. The Independent Trustees have determined that they can act independently and effectively without having an Independent Trustee serve as Chairman and that a key structural component for assuring that they are in a position to do so is for the Independent Trustees to constitute a substantial majority for the Board. The Independent Trustees also regularly meet in executive session. Arthur E. Johnson serves as Chairman of the Independent Trustees and as such (i) acts as a liaison between the Independent Trustees and management with respect to matters important to the Independent Trustees and (ii) with management prepares agendas for Board meetings.
Fidelity® funds are overseen by different Boards of Trustees. The funds' Board oversees Fidelity's investment-grade bond, money market, asset allocation and certain equity funds, and other Boards oversee Fidelity's high income and other equity funds. The asset allocation funds may invest in Fidelity® funds that are overseen by such other Boards. The use of separate Boards, each with its own committee structure, allows the Trustees of each group of Fidelity® funds to focus on the unique issues of the funds they oversee, including common research, investment, and operational issues. On occasion, the separate Boards establish joint committees to address issues of overlapping consequences for the Fidelity® funds overseen by each Board.
The Trustees operate using a system of committees to facilitate the timely and efficient consideration of all matters of importance to the Trustees, each fund, and fund shareholders and to facilitate compliance with legal and regulatory requirements and oversight of the funds' activities and associated risks. The Board, acting through its committees, has charged FMR and its affiliates with (i) identifying events or circumstances the occurrence of which could have demonstrably adverse effects on the funds' business and/or reputation; (ii) implementing processes and controls to lessen the possibility that such events or circumstances occur or to mitigate the effects of such events or circumstances if they do occur; and (iii) creating and maintaining a system designed to evaluate continuously business and market conditions in order to facilitate the identification and implementation processes described in (i) and (ii) above. Because the day-to-day operations and activities of the funds are carried out by or through FMR, its affiliates, and other service providers, the funds' exposure to risks is mitigated but not eliminated by the processes overseen by the Trustees. While each of the Board's committees has responsibility for overseeing different aspects of the funds' activities, oversight is exercised primarily through the Operations and Audit Committees. In addition, an ad hoc Board committee of Independent Trustees has worked with FMR to enhance the Board's oversight of investment and financial risks, legal and regulatory risks, technology risks, and operational risks, including the development of additional risk reporting to the Board. Appropriate personnel, including but not limited to the funds' Chief Compliance Officer (CCO), FMR's internal auditor, the independent accountants, the funds' Treasurer and portfolio management personnel, make periodic reports to the Board's committees, as appropriate, including an annual review of Fidelity's risk management program for the Fidelity® funds. The responsibilities of each standing committee, including their oversight responsibilities, are described further under "Standing Committees of the Trustees."
Interested Trustees*:
Correspondence intended for a Trustee who is an interested person may be sent to Fidelity Investments, 245 Summer Street, Boston, Massachusetts 02210.
Name, Year of Birth; Principal Occupations and Other Relevant Experience+
Abigail P. Johnson (1961)
Year of Election or Appointment: 2009
Trustee
Chairman of the Board of Trustees
Ms. Johnson also serves as Trustee of other Fidelity® funds. Ms. Johnson serves as Chairman (2016-present), Chief Executive Officer (2014-present), and Director (2007-present) of FMR LLC (diversified financial services company), President of Fidelity Financial Services (2012-present) and President of Personal, Workplace and Institutional Services (2005-present). Ms. Johnson is Chairman and Director of FMR Co., Inc. (investment adviser firm, 2011-present) and Chairman and Director of FMR (investment adviser firm, 2011-present). Previously, Ms. Johnson served as Vice Chairman (2007-2016) and President (2013-2016) of FMR LLC, President and a Director of FMR (2001-2005), a Trustee of other investment companies advised by FMR, Fidelity Investments Money Management, Inc. (investment adviser firm), and FMR Co., Inc. (2001-2005), Senior Vice President of the Fidelity® funds (2001-2005), and managed a number of Fidelity® funds. Ms. Abigail P. Johnson and Mr. Arthur E. Johnson are not related.
Jennifer Toolin McAuliffe (1959)
Year of Election or Appointment: 2016
Trustee
Ms. McAuliffe also serves as Trustee of other Fidelity® funds. Ms. McAuliffe previously served as a Member of the Advisory Board of certain Fidelity® funds (2016) and as Co-Head of Fixed Income of Fidelity Investments Limited (now known as FIL Limited (FIL)) (diversified financial services company). Earlier roles at FIL included Director of Research for FIL’s credit and quantitative teams in London, Hong Kong and Tokyo. Ms. McAuliffe also was the Director of Research for taxable and municipal bonds at Fidelity Investments Money Management, Inc. Ms. McAuliffe is also a director or trustee of several not-for-profit entities.
* Determined to be an “Interested Trustee” by virtue of, among other things, his or her affiliation with the trust or various entities under common control with FMR.
+ The information includes the Trustee's principal occupation during the last five years and other information relating to the experience, attributes, and skills relevant to the Trustee's qualifications to serve as a Trustee, which led to the conclusion that the Trustee should serve as a Trustee for each fund.
Independent Trustees:
Correspondence intended for an Independent Trustee may be sent to Fidelity Investments, P.O. Box 55235, Boston, Massachusetts 02205-5235.
Name, Year of Birth; Principal Occupations and Other Relevant Experience+
Elizabeth S. Acton (1951)
Year of Election or Appointment: 2013
Trustee
Ms. Acton also serves as Trustee of other Fidelity® funds. Prior to her retirement in April 2012, Ms. Acton was Executive Vice President, Finance (2011-2012), Executive Vice President, Chief Financial Officer (2002-2011), and Treasurer (2004-2005) of Comerica Incorporated (financial services). Prior to joining Comerica, Ms. Acton held a variety of positions at Ford Motor Company (1983-2002), including Vice President and Treasurer (2000-2002) and Executive Vice President and Chief Financial Officer of Ford Motor Credit Company (1998-2000). Ms. Acton currently serves as a member of the Board of Directors and Audit and Finance Committees of Beazer Homes USA, Inc. (homebuilding, 2012-present). Previously, Ms. Acton served as a Member of the Advisory Board of certain Fidelity® funds (2013-2016).
Ann E. Dunwoody (1953)
Year of Election or Appointment: 2018
Trustee
General Dunwoody also serves as Trustee of other Fidelity® funds. General Dunwoody (United States Army, Retired) was the first woman in U.S. military history to achieve the rank of four-star general and prior to her retirement in 2012 held a variety of positions within the U.S. Army, including Commanding General, U.S. Army Material Command (2008-2012). She is the President of First to Four LLC (leadership and mentoring services, 2012-present). She also serves as a member of the Board of Directors and Nominating and Corporate Governance Committee of L3 Technologies, Inc. (communication, electronic, sensor, and aerospace systems, 2013-present), Board of Directors and Nomination and Corporate Governance Committees of Kforce Inc. (professional staffing services, 2016-present) and Board of Directors of Automattic Inc. (software engineering, 2018-present). Previously, General Dunwoody served as a Member of the Advisory Board of certain Fidelity® funds (2018), a member of the Board of Directors and Audit and Sustainability and Corporate Responsibility Committees of Republic Services, Inc. (waste collection, disposal and recycling, 2013-2016). Ms. Dunwoody also serves on several boards for non-profit organizations, including as a member of the Board of Directors, Chair of the Nomination and Governance Committee and member of the Audit Committee of Logistics Management Institute (consulting non-profit, 2012-present), a member of the Board of Directors of the Army Historical Foundation (2015-present), a member of the Council of Trustees for the Association of the United States Army (advocacy non-profit, 2013-present) and a member of the Board of Trustees of Florida Institute of Technology (2015-present) and ThanksUSA (military family education non-profit, 2014-present).
John Engler (1948)
Year of Election or Appointment: 2014
Trustee
Mr. Engler also serves as Trustee of other Fidelity® funds. He serves on the board of directors for Universal Forest Products (manufacturer and distributor of wood and wood-alternative products, 2003-present) and K12 Inc. (technology-based education company, 2012-present). Previously, Mr. Engler served as interim president of Michigan State University (2018-2019), a Member of the Advisory Board of certain Fidelity® funds (2014-2016), president of the Business Roundtable (2011-2017), a trustee of The Munder Funds (2003-2014), president and CEO of the National Association of Manufacturers (2004-2011), member of the Board of Trustees of the Annie E. Casey Foundation (2004-2015), and as governor of Michigan (1991-2003). He is a past chairman of the National Governors Association.
Robert F. Gartland (1951)
Year of Election or Appointment: 2010
Trustee
Mr. Gartland also serves as Trustee of other Fidelity® funds. Mr. Gartland is Chairman and an investor in Gartland & Mellina Group Corp. (consulting, 2009-present). Previously, Mr. Gartland served as a partner and investor of Vietnam Partners LLC (investments and consulting, 2008-2011). Prior to his retirement, Mr. Gartland held a variety of positions at Morgan Stanley (financial services, 1979-2007), including Managing Director (1987-2007), and Chase Manhattan Bank (1975-1978).
Arthur E. Johnson (1947)
Year of Election or Appointment: 2008
Trustee
Chairman of the Independent Trustees
Mr. Johnson also serves as Trustee of other Fidelity® funds. Mr. Johnson serves as a member of the Board of Directors of Eaton Corporation plc (diversified power management, 2009-present) and Booz Allen Hamilton (management consulting, 2011-present). Prior to his retirement, Mr. Johnson served as Senior Vice President of Corporate Strategic Development of Lockheed Martin Corporation (defense contractor, 1999-2009). Mr. Johnson previously served as Vice Chairman (2015-2018) of the Independent Trustees of certain Fidelity® funds and on the Board of Directors of IKON Office Solutions, Inc. (1999-2008), AGL Resources, Inc. (holding company, 2002-2016), and Delta Airlines (2005-2007). Mr. Arthur E. Johnson is not related to Ms. Abigail P. Johnson.
Michael E. Kenneally (1954)
Year of Election or Appointment: 2009
Trustee
Vice Chairman of the Independent Trustees
Mr. Kenneally also serves as Trustee of other Fidelity® funds. Prior to his retirement, Mr. Kenneally served as Chairman and Global Chief Executive Officer of Credit Suisse Asset Management. Before joining Credit Suisse, he was an Executive Vice President and Chief Investment Officer for Bank of America Corporation. Earlier roles at Bank of America included Director of Research, Senior Portfolio Manager and Research Analyst, and Mr. Kenneally was awarded the Chartered Financial Analyst (CFA) designation in 1991.
Marie L. Knowles (1946)
Year of Election or Appointment: 2001
Trustee
Ms. Knowles also serves as Trustee of other Fidelity® funds. Prior to Ms. Knowles' retirement in June 2000, she served as Executive Vice President and Chief Financial Officer of Atlantic Richfield Company (ARCO) (diversified energy, 1996-2000). From 1993 to 1996, she was a Senior Vice President of ARCO and President of ARCO Transportation Company (pipeline and tanker operations). Ms. Knowles currently serves as a Director and Chairman of the Audit Committee of McKesson Corporation (healthcare service, since 2002). Ms. Knowles is a member of the Board of the Santa Catalina Island Company (real estate, 2009-present). Ms. Knowles is a Member of the Investment Company Institute Board of Governors and a Member of the Governing Council of the Independent Directors Council (2014-present). She also serves as a member of the Advisory Board for the School of Engineering of the University of Southern California. Previously, Ms. Knowles served as a Director of Phelps Dodge Corporation (copper mining and manufacturing, 1994-2007), URS Corporation (engineering and construction, 2000-2003) and America West (airline, 1999-2002). Ms. Knowles previously served as Chairman (2015-2018) and Vice Chairman (2012-2015) of the Independent Trustees of certain Fidelity® funds.
Mark A. Murray (1954)
Year of Election or Appointment: 2016
Trustee
Mr. Murray also serves as Trustee of other Fidelity® funds. Mr. Murray is Vice Chairman (2013-present) of Meijer, Inc. (regional retail chain). Previously, Mr. Murray served as a Member of the Advisory Board of certain Fidelity® funds (2016) and as Co-Chief Executive Officer (2013-2016) and President (2006-2013) of Meijer, Inc. Mr. Murray serves as a member of the Board of Directors and Nuclear Review and Public Policy and Responsibility Committees of DTE Energy Company (diversified energy company, 2009-present). Mr. Murray also serves as a member of the Board of Directors of Spectrum Health (not-for-profit health system, 2015-present). Mr. Murray previously served as President of Grand Valley State University (2001-2006), Treasurer for the State of Michigan (1999-2001), Vice President of Finance and Administration for Michigan State University (1998-1999), and a member of the Board of Directors and Audit Committee and Chairman of the Nominating and Corporate Governance Committee of Universal Forest Products, Inc. (manufacturer and distributor of wood and wood-alternative products, 2004-2016). Mr. Murray is also a director or trustee of many community and professional organizations.
+ The information includes the Trustee's principal occupation during the last five years and other information relating to the experience, attributes, and skills relevant to the Trustee's qualifications to serve as a Trustee, which led to the conclusion that the Trustee should serve as a Trustee for each fund.
Advisory Board Members and Officers:
Correspondence intended for an officer may be sent to Fidelity Investments, 245 Summer Street, Boston, Massachusetts 02210. Officers appear below in alphabetical order.
Name, Year of Birth; Principal Occupation
Elizabeth Paige Baumann (1968)
Year of Election or Appointment: 2017
Anti-Money Laundering (AML) Officer
Ms. Baumann also serves as AML Officer of other funds. She is Chief AML Officer (2012-present) and Senior Vice President (2014-present) of FMR LLC (diversified financial services company) and is an employee of Fidelity Investments. Previously, Ms. Baumann served as AML Officer of the funds (2012-2016), and Vice President (2007-2014) and Deputy Anti-Money Laundering Officer (2007-2012) of FMR LLC.
Craig S. Brown (1977)
Year of Election or Appointment: 2019
Assistant Treasurer
Mr. Brown also serves as Assistant Treasurer of other funds. Mr. Brown is an employee of Fidelity Investments (2013-present).
John J. Burke III (1964)
Year of Election or Appointment: 2018
Chief Financial Officer
Mr. Burke also serves as Chief Financial Officer of other funds. Mr. Burke serves as Head of Investment Operations for Fidelity Fund and Investment Operations (2018-present) and is an employee of Fidelity Investments (1998-present). Previously Mr. Burke served as head of Asset Management Investment Operations (2012-2018).
William C. Coffey (1969)
Year of Election or Appointment: 2018
Secretary and Chief Legal Officer (CLO)
Mr. Coffey also serves as Secretary and CLO of other funds. Mr. Coffey serves as CLO, Secretary, and Senior Vice President of Fidelity Management & Research Company and FMR Co., Inc. (investment adviser firms, 2018-present); Secretary of Fidelity SelectCo, LLC and Fidelity Investments Money Management, Inc. (investment adviser firms, 2018-present); and CLO of Fidelity Management & Research (Hong Kong) Limited, FMR Investment Management (UK) Limited, and Fidelity Management & Research (Japan) Limited (investment adviser firms, 2018-present). He is Senior Vice President and Deputy General Counsel of FMR LLC (diversified financial services company, 2010-present), and is an employee of Fidelity Investments. Previously, Mr. Coffey served as Assistant Secretary of certain funds (2009-2018) and as Vice President and Associate General Counsel of FMR LLC (2005-2009).
Jonathan Davis (1968)
Year of Election or Appointment: 2010
Assistant Treasurer
Mr. Davis also serves as Assistant Treasurer of other funds. Mr. Davis serves as Assistant Treasurer of FMR Capital, Inc. (2017-present) and is an employee of Fidelity Investments. Previously, Mr. Davis served as Vice President and Associate General Counsel of FMR LLC (diversified financial services company, 2003-2010).
Adrien E. Deberghes (1967)
Year of Election or Appointment: 2010
Assistant Treasurer
Mr. Deberghes also serves as an officer of other funds. He serves as Assistant Treasurer of FMR Capital, Inc. (2017-present), Executive Vice President of Fidelity Investments Money Management, Inc. (FIMM) (investment adviser firm, 2016-present), and is an employee of Fidelity Investments (2008-present). Previously, Mr. Deberghes served as President and Treasurer of certain Fidelity® funds (2013-2018). Prior to joining Fidelity Investments, Mr. Deberghes was Senior Vice President of Mutual Fund Administration at State Street Corporation (2007-2008), Senior Director of Mutual Fund Administration at Investors Bank & Trust (2005-2007), and Director of Finance for Dunkin' Brands (2000-2005). Previously, Mr. Deberghes served in other fund officer roles.
Laura M. Del Prato (1964)
Year of Election or Appointment: 2018
President and Treasurer
Ms. Del Prato also serves as an officer of other funds. Ms. Del Prato is an employee of Fidelity Investments (2017-present). Prior to joining Fidelity Investments, Ms. Del Prato served as a Managing Director and Treasurer of the JPMorgan Mutual Funds (2014-2017). Prior to JPMorgan, Ms. Del Prato served as a partner at Cohen Fund Audit Services (accounting firm, 2012-2013) and KPMG LLP (accounting firm, 2004-2012).
Colm A. Hogan (1973)
Year of Election or Appointment: 2016
Assistant Treasurer
Mr. Hogan also serves as an officer of other funds. Mr. Hogan serves as Assistant Treasurer of FMR Capital, Inc. (2017-present) and is an employee of Fidelity Investments (2005-present). Previously, Mr. Hogan served as Assistant Treasurer of certain Fidelity® funds (2016-2018).
Chris Maher (1972)
Year of Election or Appointment: 2013
Assistant Treasurer
Mr. Maher serves as Assistant Treasurer of other funds. Mr. Maher is Vice President of Valuation Oversight, serves as Assistant Treasurer of FMR Capital, Inc. (2017-present), and is an employee of Fidelity Investments. Previously, Mr. Maher served as Vice President of Asset Management Compliance (2013), Vice President of the Program Management Group of FMR (investment adviser firm, 2010-2013), and Vice President of Valuation Oversight (2008-2010).
John B. McGinty, Jr. (1962)
Year of Election or Appointment: 2016
Chief Compliance Officer
Mr. McGinty also serves as Chief Compliance Officer of other funds. Mr. McGinty is Senior Vice President of Asset Management Compliance for Fidelity Investments and is an employee of Fidelity Investments (2016-present). Mr. McGinty previously served as Vice President, Senior Attorney at Eaton Vance Management (investment management firm, 2015-2016), and prior to Eaton Vance as global CCO for all firm operations and registered investment companies at GMO LLC (investment management firm, 2009-2015). Before joining GMO LLC, Mr. McGinty served as Senior Vice President, Deputy General Counsel for Fidelity Investments (2007-2009).
Jason P. Pogorelec (1975)
Year of Election or Appointment: 2015
Assistant Secretary
Mr. Pogorelec also serves as Assistant Secretary of other funds. Mr. Pogorelec serves as Vice President, Associate General Counsel (2010-present) and is an employee of Fidelity Investments (2006-present).
Nancy D. Prior (1967)
Year of Election or Appointment: 2014
Vice President
Ms. Prior also serves as Vice President of other funds. Ms. Prior serves as President Fixed Income, High Income/Emerging Market Debt and Multi Asset Class Strategies of FIAM LLC (2018-present), President (2016-present) and Director (2014-present) of Fidelity Investments Money Management, Inc. (FIMM) (investment adviser firm), President, Fixed Income (2014-present), and is an employee of Fidelity Investments (2002-present). Previously, Ms. Prior served as Vice Chairman of FIAM LLC (investment adviser firm, 2014-2018), a Director of FMR Investment Management (UK) Limited (investment adviser firm, 2015-2018), President Multi-Asset Class Strategies of FMR's Global Asset Allocation Division (2017-2018), Vice President of Fidelity's Money Market Funds (2012-2014), President, Money Market and Short Duration Bond Group of Fidelity Management & Research (FMR) (investment adviser firm, 2013-2014), President, Money Market Group of FMR (2011-2013), Managing Director of Research (2009-2011), Senior Vice President and Deputy General Counsel (2007-2009), and Assistant Secretary of certain Fidelity® funds (2008-2009).
Stacie M. Smith (1974)
Year of Election or Appointment: 2013
Assistant Treasurer
Ms. Smith also serves as an officer of other funds. Ms. Smith serves as Assistant Treasurer of FMR Capital, Inc. (2017-present), is an employee of Fidelity Investments (2009-present), and has served in other fund officer roles. Prior to joining Fidelity Investments, Ms. Smith served as Senior Audit Manager of Ernst & Young LLP (accounting firm, 1996-2009). Previously, Ms. Smith served as Assistant Treasurer (2013-2018) and Deputy Treasurer (2013-2016) of certain Fidelity® funds.
Marc L. Spector (1972)
Year of Election or Appointment: 2016
Deputy Treasurer
Mr. Spector also serves as an officer of other funds. Mr. Spector serves as Assistant Treasurer of FMR Capital, Inc. (2017-present) and is an employee of Fidelity Investments (2016-present). Prior to joining Fidelity Investments, Mr. Spector served as Director at the Siegfried Group (accounting firm, 2013-2016), and prior to Siegfried Group as audit senior manager at Deloitte & Touche (accounting firm, 2005-2013).
Jim Wegmann (1979)
Year of Election or Appointment: 2019
Assistant Treasurer
Mr. Wegmann also serves as Assistant Treasurer of other funds. Mr. Wegmann is an employee of Fidelity Investments (2011-present).
Shareholder Expense Example
As a shareholder of a Fund, you incur two types of costs: (1) transaction costs, and (2) ongoing costs, including other Fund expenses. This Example is intended to help you understand your ongoing costs (in dollars) of investing in the Funds and to compare these costs with the ongoing costs of investing in other mutual funds.
The Example is based on an investment of $1,000 invested at the beginning of the period and held for the entire period (October 1, 2018 to March 31, 2019).
Actual Expenses
The first line of the accompanying table for each Class of each fund provides information about actual account values and actual expenses. You may use the information in this line, together with the amount you invested, to estimate the expenses that you paid over the period. Simply divide your account value by $1,000.00 (for example, an $8,600 account value divided by $1,000.00 = 8.6), then multiply the result by the number in the first line for a Class of the fund under the heading entitled "Expenses Paid During Period" to estimate the expenses you paid on your account during this period. In addition, each Fund, as a shareholder in underlying Fidelity Funds, will indirectly bear its pro-rata share of the fees and expenses incurred by the underlying Fidelity Funds. These fees and expenses are not included in each Fund's annualized expense ratio used to calculate the expense estimates in the table below.
Hypothetical Example for Comparison Purposes
The second line of the accompanying table for each Class of each fund provides information about hypothetical account values and hypothetical expenses based on a Class' actual expense ratio and an assumed rate of return of 5% per year before expenses, which is not the Class' actual return. The hypothetical account values and expenses may not be used to estimate the actual ending account balance or expenses you paid for the period. You may use this information to compare the ongoing costs of investing in the Fund and other funds. To do so, compare this 5% hypothetical example with the 5% hypothetical examples that appear in the shareholder reports of the other funds. In addition, each Fund, as a shareholder in underlying Fidelity Funds, will indirectly bear its pro-rata share of the fees and expenses incurred by the underlying Fidelity Funds. These fees and expenses are not included in each Fund's annualized expense ratio used to calculate the expense estimates in the table below.
Please note that the expenses shown in the table are meant to highlight your ongoing costs only and do not reflect any transaction costs. Therefore, the second line of the table is useful in comparing ongoing costs only, and will not help you determine the relative total costs of owning different funds.
| | Annualized Expense Ratio-A | Beginning
Account Value
October 1, 2018 | Ending
Account Value
March 31, 2019 | Expenses Paid
During Period-B
October 1, 2018
to March 31, 2019 |
| Fidelity Freedom Income Fund | | | | |
| Fidelity Freedom Income Fund | .47% | | | |
| Actual | | $1,000.00 | $1,022.30 | $2.37 |
| Hypothetical-C | | $1,000.00 | $1,022.59 | $2.37 |
| Class K | .42% | | | |
| Actual | | $1,000.00 | $1,022.50 | $2.12 |
| Hypothetical-C | | $1,000.00 | $1,022.84 | $2.12 |
| Class K6 | .37% | | | |
| Actual | | $1,000.00 | $1,023.10 | $1.87 |
| Hypothetical-C | | $1,000.00 | $1,023.09 | $1.87 |
| Fidelity Freedom 2005 Fund | | | | |
| Fidelity Freedom 2005 Fund | .48% | | | |
| Actual | | $1,000.00 | $1,017.20 | $2.41 |
| Hypothetical-C | | $1,000.00 | $1,022.54 | $2.42 |
| Class K | .43% | | | |
| Actual | | $1,000.00 | $1,017.70 | $2.16 |
| Hypothetical-C | | $1,000.00 | $1,022.79 | $2.17 |
| Class K6 | .37% | | | |
| Actual | | $1,000.00 | $1,017.80 | $1.86 |
| Hypothetical-C | | $1,000.00 | $1,023.09 | $1.87 |
| Fidelity Freedom 2010 Fund | | | | |
| Fidelity Freedom 2010 Fund | .53% | | | |
| Actual | | $1,000.00 | $1,011.60 | $2.66 |
| Hypothetical-C | | $1,000.00 | $1,022.29 | $2.67 |
| Class K | .46% | | | |
| Actual | | $1,000.00 | $1,012.00 | $2.31 |
| Hypothetical-C | | $1,000.00 | $1,022.64 | $2.32 |
| Class K6 | .39% | | | |
| Actual | | $1,000.00 | $1,012.10 | $1.96 |
| Hypothetical-C | | $1,000.00 | $1,022.99 | $1.97 |
| Fidelity Freedom 2015 Fund | | | | |
| Fidelity Freedom 2015 Fund | .57% | | | |
| Actual | | $1,000.00 | $1,005.70 | $2.85 |
| Hypothetical-C | | $1,000.00 | $1,022.09 | $2.87 |
| Class K | .50% | | | |
| Actual | | $1,000.00 | $1,006.20 | $2.50 |
| Hypothetical-C | | $1,000.00 | $1,022.44 | $2.52 |
| Class K6 | .41% | | | |
| Actual | | $1,000.00 | $1,006.20 | $2.05 |
| Hypothetical-C | | $1,000.00 | $1,022.89 | $2.07 |
| Fidelity Freedom 2020 Fund | | | | |
| Fidelity Freedom 2020 Fund | .61% | | | |
| Actual | | $1,000.00 | $1,001.60 | $3.04 |
| Hypothetical-C | | $1,000.00 | $1,021.89 | $3.07 |
| Class K | .53% | | | |
| Actual | | $1,000.00 | $1,001.50 | $2.64 |
| Hypothetical-C | | $1,000.00 | $1,022.29 | $2.67 |
| Class K6 | .43% | | | |
| Actual | | $1,000.00 | $1,001.60 | $2.15 |
| Hypothetical-C | | $1,000.00 | $1,022.79 | $2.17 |
| Fidelity Freedom 2025 Fund | | | | |
| Fidelity Freedom 2025 Fund | .65% | | | |
| Actual | | $1,000.00 | $996.60 | $3.24 |
| Hypothetical-C | | $1,000.00 | $1,021.69 | $3.28 |
| Class K | .57% | | | |
| Actual | | $1,000.00 | $997.30 | $2.84 |
| Hypothetical-C | | $1,000.00 | $1,022.09 | $2.87 |
| Class K6 | .45% | | | |
| Actual | | $1,000.00 | $997.80 | $2.24 |
| Hypothetical-C | | $1,000.00 | $1,022.69 | $2.27 |
| Fidelity Freedom 2030 Fund | | | | |
| Fidelity Freedom 2030 Fund | .70% | | | |
| Actual | | $1,000.00 | $988.40 | $3.47 |
| Hypothetical-C | | $1,000.00 | $1,021.44 | $3.53 |
| Class K | .60% | | | |
| Actual | | $1,000.00 | $989.10 | $2.98 |
| Hypothetical-C | | $1,000.00 | $1,021.94 | $3.02 |
| Class K6 | .47% | | | |
| Actual | | $1,000.00 | $990.10 | $2.33 |
| Hypothetical-C | | $1,000.00 | $1,022.59 | $2.37 |
| Fidelity Freedom 2035 Fund | | | | |
| Fidelity Freedom 2035 Fund | .74% | | | |
| Actual | | $1,000.00 | $977.10 | $3.65 |
| Hypothetical-C | | $1,000.00 | $1,021.24 | $3.73 |
| Class K | .64% | | | |
| Actual | | $1,000.00 | $977.30 | $3.16 |
| Hypothetical-C | | $1,000.00 | $1,021.74 | $3.23 |
| Class K6 | .49% | | | |
| Actual | | $1,000.00 | $978.20 | $2.42 |
| Hypothetical-C | | $1,000.00 | $1,022.49 | $2.47 |
| Fidelity Freedom 2040 Fund | | | | |
| Fidelity Freedom 2040 Fund | .75% | | | |
| Actual | | $1,000.00 | $974.20 | $3.69 |
| Hypothetical-C | | $1,000.00 | $1,021.19 | $3.78 |
| Class K | .64% | | | |
| Actual | | $1,000.00 | $974.00 | $3.15 |
| Hypothetical-C | | $1,000.00 | $1,021.74 | $3.23 |
| Class K6 | .49% | | | |
| Actual | | $1,000.00 | $975.00 | $2.41 |
| Hypothetical-C | | $1,000.00 | $1,022.49 | $2.47 |
| Fidelity Freedom 2045 Fund | | | | |
| Fidelity Freedom 2045 Fund | .75% | | | |
| Actual | | $1,000.00 | $973.10 | $3.69 |
| Hypothetical-C | | $1,000.00 | $1,021.19 | $3.78 |
| Class K | .64% | | | |
| Actual | | $1,000.00 | $974.00 | $3.15 |
| Hypothetical-C | | $1,000.00 | $1,021.74 | $3.23 |
| Class K6 | .49% | | | |
| Actual | | $1,000.00 | $974.60 | $2.41 |
| Hypothetical-C | | $1,000.00 | $1,022.49 | $2.47 |
| Fidelity Freedom 2050 Fund | | | | |
| Fidelity Freedom 2050 Fund | .75% | | | |
| Actual | | $1,000.00 | $973.60 | $3.69 |
| Hypothetical-C | | $1,000.00 | $1,021.19 | $3.78 |
| Class K | .64% | | | |
| Actual | | $1,000.00 | $973.70 | $3.15 |
| Hypothetical-C | | $1,000.00 | $1,021.74 | $3.23 |
| Class K6 | .49% | | | |
| Actual | | $1,000.00 | $974.20 | $2.41 |
| Hypothetical-C | | $1,000.00 | $1,022.49 | $2.47 |
| Fidelity Freedom 2055 Fund | | | | |
| Fidelity Freedom 2055 Fund | .75% | | | |
| Actual | | $1,000.00 | $973.70 | $3.69 |
| Hypothetical-C | | $1,000.00 | $1,021.19 | $3.78 |
| Class K | .64% | | | |
| Actual | | $1,000.00 | $974.00 | $3.15 |
| Hypothetical-C | | $1,000.00 | $1,021.74 | $3.23 |
| Class K6 | .49% | | | |
| Actual | | $1,000.00 | $974.60 | $2.41 |
| Hypothetical-C | | $1,000.00 | $1,022.49 | $2.47 |
| Fidelity Freedom 2060 Fund | | | | |
| Fidelity Freedom 2060 Fund | .75% | | | |
| Actual | | $1,000.00 | $974.00 | $3.69 |
| Hypothetical-C | | $1,000.00 | $1,021.19 | $3.78 |
| Class K | .64% | | | |
| Actual | | $1,000.00 | $973.40 | $3.15 |
| Hypothetical-C | | $1,000.00 | $1,021.74 | $3.23 |
| Class K6 | .49% | | | |
| Actual | | $1,000.00 | $975.00 | $2.41 |
| Hypothetical-C | | $1,000.00 | $1,022.49 | $2.47 |
A Annualized expense ratio reflects expenses net of applicable fee waivers.
B Expenses are equal to each Class' annualized expense ratio, multiplied by the average account value over the period, multiplied by 182/ 365 (to reflect the one-half year period). The fees and expenses of the underlying Fidelity Funds in which each Fund invests are not included in each Fund's annualized expense ratio.
C 5% return per year before expenses
Distributions (Unaudited)
The Board of Trustees of each fund voted to pay to shareholders of record at the opening of business on record date, the following distributions per share derived from capital gains realized from sales of portfolio securities and dividends derived from net investment income:
| | Pay Date | Record Date | Dividends | Capital Gains |
| Fidelity Freedom Income Fund | | | | |
| Fidelity Freedom Income Fund | 05/06/19 | 05/03/19 | $0.012 | $0.080 |
| Class K | 05/06/19 | 05/03/19 | $0.013 | $0.080 |
| Class K6 | 05/06/19 | 05/03/19 | $0.014 | $0.080 |
| Fidelity Freedom 2005 Fund | | | | |
| Fidelity Freedom 2005 Fund | 05/13/19 | 05/10/19 | $0.043 | $0.154 |
| Class K | 05/13/19 | 05/10/19 | $0.044 | $0.154 |
| Class K6 | 05/13/19 | 05/10/19 | $0.048 | $0.154 |
| Fidelity Freedom 2010 Fund | | | | |
| Fidelity Freedom 2010 Fund | 05/13/19 | 05/10/19 | $0.045 | $0.251 |
| Class K | 05/13/19 | 05/10/19 | $0.047 | $0.251 |
| Class K6 | 05/13/19 | 05/10/19 | $0.052 | $0.251 |
| Fidelity Freedom 2015 Fund | | | | |
| Fidelity Freedom 2015 Fund | 05/13/19 | 05/10/19 | $0.029 | $0.278 |
| Class K | 05/13/19 | 05/10/19 | $0.030 | $0.278 |
| Class K6 | 05/13/19 | 05/10/19 | $0.035 | $0.278 |
| Fidelity Freedom 2020 Fund | | | | |
| Fidelity Freedom 2020 Fund | 05/13/19 | 05/10/19 | $0.028 | $0.401 |
| Class K | 05/13/19 | 05/10/19 | $0.030 | $0.401 |
| Class K6 | 05/13/19 | 05/10/19 | $0.036 | $0.401 |
| Fidelity Freedom 2025 Fund | | | | |
| Fidelity Freedom 2025 Fund | 05/13/19 | 05/10/19 | $0.016 | $0.391 |
| Class K | 05/13/19 | 05/10/19 | $0.018 | $0.391 |
| Class K6 | 05/13/19 | 05/10/19 | $0.025 | $0.391 |
| Fidelity Freedom 2030 Fund | | | | |
| Fidelity Freedom 2030 Fund | 05/13/19 | 05/10/19 | $0.008 | $0.578 |
| Class K | 05/13/19 | 05/10/19 | $0.011 | $0.578 |
| Class K6 | 05/13/19 | 05/10/19 | $0.019 | $0.578 |
| Fidelity Freedom 2035 Fund | | | | |
| Fidelity Freedom 2035 Fund | 05/13/19 | 05/10/19 | $0.000 | $0.560 |
| Class K | 05/13/19 | 05/10/19 | $0.000 | $0.563 |
| Class K6 | 05/13/19 | 05/10/19 | $0.000 | $0.571 |
| Fidelity Freedom 2040 Fund | | | | |
| Fidelity Freedom 2040 Fund | 05/13/19 | 05/10/19 | $0.000 | $0.417 |
| Class K | 05/13/19 | 05/10/19 | $0.000 | $0.418 |
| Class K6 | 05/13/19 | 05/10/19 | $0.000 | $0.424 |
| Fidelity Freedom 2045 Fund | | | | |
| Fidelity Freedom 2045 Fund | 05/13/19 | 05/10/19 | $0.000 | $0.470 |
| Class K | 05/13/19 | 05/10/19 | $0.000 | $0.471 |
| Class K6 | 05/13/19 | 05/10/19 | $0.000 | $0.478 |
| Fidelity Freedom 2050 Fund | | | | |
| Fidelity Freedom 2050 Fund | 05/13/19 | 05/10/19 | $0.000 | $0.468 |
| Class K | 05/13/19 | 05/10/19 | $0.000 | $0.470 |
| Class K6 | 05/13/19 | 05/10/19 | $0.000 | $0.476 |
| Fidelity Freedom 2055 Fund | | | | |
| Fidelity Freedom 2055 Fund | 05/13/19 | 05/10/19 | $0.000 | $0.510 |
| Class K | 05/13/19 | 05/10/19 | $0.000 | $0.512 |
| Class K6 | 05/13/19 | 05/10/19 | $0.000 | $0.520 |
| Fidelity Freedom 2060 Fund | | | | |
| Fidelity Freedom 2060 Fund | 05/13/19 | 05/10/19 | $0.000 | $0.406 |
| Class K | 05/13/19 | 05/10/19 | $0.000 | $0.408 |
| Class K6 | 05/13/19 | 05/10/19 | $0.000 | $0.414 |
|
The funds hereby designate as capital gain dividend the amounts noted below for the taxable year ended March 31, 2019, or, if subsequently determined to be different, the net capital gain of such year.
| Fidelity Freedom Income Fund | $79,376,091 |
| Fidelity Freedom 2005 Fund | $25,787,988 |
| Fidelity Freedom 2010 Fund | $220,327,962 |
| Fidelity Freedom 2015 Fund | $430,339,783 |
| Fidelity Freedom 2020 Fund | $1,229,445,941 |
| Fidelity Freedom 2025 Fund | $1,122,662,032 |
| Fidelity Freedom 2030 Fund | $1,612,566,302 |
| Fidelity Freedom 2035 Fund | $1,275,193,176 |
| Fidelity Freedom 2040 Fund | $1,375,826,581 |
| Fidelity Freedom 2045 Fund | $842,919,553 |
| Fidelity Freedom 2050 Fund | $713,359,669 |
| Fidelity Freedom 2055 Fund | $277,206,748 |
| Fidelity Freedom 2060 Fund | $59,671,009 |
|
A percentage of the dividends distributed during the fiscal year for the following funds were derived from interest on U.S. Government securities which is generally exempt from state income tax
| Fidelity Freedom Income Fund | 17.69% |
| Fidelity Freedom 2005 Fund | 14.40% |
| Fidelity Freedom 2010 Fund | 11.60% |
| Fidelity Freedom 2015 Fund | 9.32% |
| Fidelity Freedom 2020 Fund | 7.69% |
| Fidelity Freedom 2025 Fund | 8.98% |
| Fidelity Freedom 2030 Fund | 5.89% |
| Fidelity Freedom 2035 Fund | 2.94% |
| Fidelity Freedom 2040 Fund | 2.07% |
| Fidelity Freedom 2045 Fund | 2.41% |
| Fidelity Freedom 2050 Fund | 2.36% |
| Fidelity Freedom 2055 Fund | 2.54% |
| Fidelity Freedom 2060 Fund | 1.98% |
|
A percentage of the dividends distributed during the fiscal year for the following funds qualify for the dividends–received deduction for corporate shareholders:
| | Retail | Class K | Class K6 |
| Fidelity Freedom Income Fund | | | |
| April 2018 | 0% | 0% | 0% |
| May 2018 | 3% | 3% | 2% |
| June 2018 | 6% | 6% | 5% |
| July 2018 | 6% | 6% | 6% |
| August 2018 | 6% | 5% | 5% |
| September 2018 | 6% | 6% | 5% |
| October 2018 | 6% | 6% | 5% |
| November 2018 | 6% | 6% | 5% |
| December 2018 | 6% | 6% | 6% |
| February 2019 | 1% | 1% | 1% |
| March 2019 | 1% | 1% | 1% |
| Fidelity Freedom 2005 Fund | | | |
| May 2018 | 1% | 1% | 1% |
| December 2018 | 9% | 9% | 9% |
| Fidelity Freedom 2010 Fund | | | |
| May 2018 | 2% | 2% | 1% |
| December 2018 | 13% | 13% | 12% |
| Fidelity Freedom 2015 Fund | | | |
| May 2018 | 2% | 2% | 2% |
| December 2018 | 17% | 17% | 15% |
| Fidelity Freedom 2020 Fund | | | |
| May 2018 | 3% | 3% | 2% |
| December 2018 | 21% | 20% | 18% |
| Fidelity Freedom 2025 Fund | | | |
| May 2018 | 5% | 4% | 3% |
| December 2018 | 23% | 22% | 20% |
| Fidelity Freedom 2030 Fund | | | |
| May 2018 | 10% | 9% | 6% |
| December 2018 | 29% | 28% | 25% |
| Fidelity Freedom 2035 Fund | | | |
| May 2018 | 29% | 26% | 12% |
| December 2018 | 35% | 33% | 30% |
| Fidelity Freedom 2040 Fund | | | |
| May 2018 | 84% | 56% | 15% |
| December 2018 | 36% | 35% | 31% |
| Fidelity Freedom 2045 Fund | | | |
| May 2018 | 86% | 58% | 16% |
| December 2018 | 37% | 35% | 31% |
| Fidelity Freedom 2050 Fund | | | |
| December 2018 | 37% | 36% | 31% |
| Fidelity Freedom 2055 Fund | | | |
| December 2018 | 38% | 36% | 32% |
| Fidelity Freedom 2060 Fund | | | |
| December 2018 | 38% | 36% | 32% |
|
A percentage of the dividends distributed during the fiscal year for the following funds may be taken into account as a dividend for purposes of the maximum rate under section 1(h)(11) of the Internal Revenue Code.
| | Retail | Class K | Class K6 |
| Fidelity Freedom Income Fund | | | |
| April 2018 | 0% | 0% | 0% |
| May 2018 | 7% | 7% | 7% |
| June 2018 | 15% | 15% | 14% |
| July 2018 | 15% | 15% | 14% |
| August 2018 | 16% | 15% | 15% |
| September 2018 | 15% | 15% | 14% |
| October 2018 | 15% | 15% | 14% |
| November 2018 | 15% | 15% | 14% |
| December 2018 | 15% | 15% | 15% |
| February 2019 | 1% | 1% | 1% |
| March 2019 | 1% | 1% | 1% |
| Fidelity Freedom 2005 Fund | | | |
| May 2018 | 2% | 2% | 2% |
| December 2018 | 22% | 22% | 20% |
| Fidelity Freedom 2010 Fund | | | |
| May 2018 | 3% | 3% | 2% |
| December 2018 | 30% | 29% | 27% |
| Fidelity Freedom 2015 Fund | | | |
| May 2018 | 4% | 4% | 3% |
| December 2018 | 37% | 36% | 33% |
| Fidelity Freedom 2020 Fund | | | |
| May 2018 | 5% | 4% | 4% |
| December 2018 | 44% | 42% | 38% |
| Fidelity Freedom 2025 Fund | | | |
| May 2018 | 6% | 6% | 5% |
| December 2018 | 48% | 47% | 42% |
| Fidelity Freedom 2030 Fund | | | |
| May 2018 | 15% | 14% | 9% |
| December 2018 | 59% | 57% | 51% |
| Fidelity Freedom 2035 Fund | | | |
| May 2018 | 41% | 37% | 18% |
| December 2018 | 70% | 68% | 60% |
| Fidelity Freedom 2040 Fund | | | |
| May 2018 | 100% | 85% | 24% |
| December 2018 | 73% | 70% | 62% |
| Fidelity Freedom 2045 Fund | | | |
| May 2018 | 100% | 87% | 24% |
| December 2018 | 75% | 72% | 63% |
| Fidelity Freedom 2050 Fund | | | |
| December 2018 | 76% | 72% | 64% |
| Fidelity Freedom 2055 Fund | | | |
| December 2018 | 77% | 74% | 65% |
| Fidelity Freedom 2060 Fund | | | |
| December 2018 | 78% | 74% | 67% |
|
The funds will notify shareholders in January 2020 of amounts for use in preparing 2019 income tax returns.

FF-ANN-0519
1.702316.121
Fidelity Advisor Freedom® Funds - Income, 2005, 2010, 2015, 2020, 2025, 2030, 2035, 2040, 2045, 2050, 2055, 2060
Annual Report March 31, 2019 |
|
Beginning on January 1, 2021, as permitted by regulations adopted by the Securities and Exchange Commission, paper copies of a fund’s shareholder reports will no longer be sent by mail, unless you specifically request paper copies of the reports from the fund or from your financial intermediary, such as a financial advisor, broker-dealer or bank. Instead, the reports will be made available on a website, and you will be notified by mail each time a report is posted and provided with a website link to access the report.
If you already elected to receive shareholder reports electronically, you will not be affected by this change and you need not take any action. You may elect to receive shareholder reports and other communications from a fund electronically, by contacting your financial intermediary. For Fidelity customers, visit Fidelity's web site or call Fidelity using the contact information listed below.
You may elect to receive all future reports in paper free of charge. If you wish to continue receiving paper copies of your shareholder reports, you may contact your financial intermediary or, if you are a Fidelity customer, visit Fidelity’s website, or call Fidelity at the applicable toll-free number listed below. Your election to receive reports in paper will apply to all funds held with the fund complex/your financial intermediary.
| Account Type | Website | Phone Number |
| Brokerage, Mutual Fund, or Annuity Contracts: | fidelity.com/mailpreferences | 1-800-343-3548 |
| Employer Provided Retirement Accounts: | netbenefits.fidelity.com/preferences (choose 'no' under Required Disclosures to continue to print) | 1-800-343-0860 |
| Advisor Sold Accounts Serviced Through Your Financial Intermediary: | Contact Your Financial Intermediary | Your Financial Intermediary's phone number |
| Advisor Sold Accounts Serviced by Fidelity: | institutional.fidelity.com | 1-877-208-0098 |
Contents
To view a fund's proxy voting guidelines and proxy voting record for the 12-month period ended June 30, visit http://www.fidelity.com/proxyvotingresults or visit the Securities and Exchange Commission's (SEC) web site at http://www.sec.gov.
You may also call 1-877-208-0098 to request a free copy of the proxy voting guidelines.
Standard & Poor's, S&P and S&P 500 are registered service marks of The McGraw-Hill Companies, Inc. and have been licensed for use by Fidelity Distributors Corporation.
Other third-party marks appearing herein are the property of their respective owners.
All other marks appearing herein are registered or unregistered trademarks or service marks of FMR LLC or an affiliated company. © 2019 FMR LLC. All rights reserved.
This report and the financial statements contained herein are submitted for the general information of the shareholders of the Funds. This report is not authorized for distribution to prospective investors in the Funds unless preceded or accompanied by an effective prospectus.
A fund files its complete schedule of portfolio holdings with the SEC for the first and third quarters of each fiscal year on Form N-PORT. Forms N-PORT are available on the SEC’s web site at http://www.sec.gov. A fund's Forms N-PORT may be reviewed and copied at the SEC’s Public Reference Room in Washington, DC. Information regarding the operation of the SEC's Public Reference Room may be obtained by calling 1-800-SEC-0330.
For a complete list of a fund's portfolio holdings, view the most recent holdings listing, semiannual report, or annual report on Fidelity's web site at http://www.fidelity.com, http://www.institutional.fidelity.com, or http://www.401k.com, as applicable.
NOT FDIC INSURED •MAY LOSE VALUE •NO BANK GUARANTEE
Neither the Funds nor Fidelity Distributors Corporation is a bank.
Fidelity Advisor Freedom® Income Fund
Performance: The Bottom Line
Average annual total return reflects the change in the value of an investment, assuming reinvestment of distributions from dividend income and capital gains (the profits earned upon the sale of securities that have grown in value, if any) and assuming a constant rate of performance each year. The hypothetical investment and the average annual total returns do not reflect the deduction of taxes that a shareholder would pay on fund distributions or the redemption of fund shares. During periods of reimbursement by Fidelity, a fund’s total return will be greater than it would be had the reimbursement not occurred. How a fund did yesterday is no guarantee of how it will do tomorrow.
Average Annual Total Returns
| For the periods ended March 31, 2019 | Past 1 year | Past 5 years | Past 10 years |
| Class A (incl. 5.75% sales charge) | (2.79)% | 2.04% | 4.91% |
| Class M (incl. 3.50% sales charge) | (0.81)% | 2.25% | 4.89% |
| Class C (incl. contingent deferred sales charge) | 1.37% | 2.49% | 4.75% |
| Class I | 3.30% | 3.50% | 5.80% |
| Class Z | 3.38% | 3.52% | 5.81% |
| Class Z6 | 3.48% | 3.55% | 5.82% |
Class C shares' contingent deferred sales charges included in the past one year, past five years and past ten years total return figures are 1%, 0% and 0%, respectively.
The initial offering of Class Z shares took place on October 2, 2018. Returns prior to October 2, 2018 are those of Class I.
The initial offering of Class Z6 shares took place on June 6, 2017. Returns prior to June 6, 2017 are those of Class I.
Prior to June 1, 2017, the fund operated under a different pricing structure. The fund’s historical performance prior to June 1, 2017 does not reflect the fund’s current pricing structure.
$10,000 Over 10 Years
Let's say hypothetically that $10,000 was invested in Fidelity Advisor Freedom® Income Fund - Class A on March 31, 2009, and the current 5.75% sales charge was paid.
The chart shows how the value of your investment would have changed, and also shows how the Bloomberg Barclays U.S. Aggregate Bond Index performed over the same period.
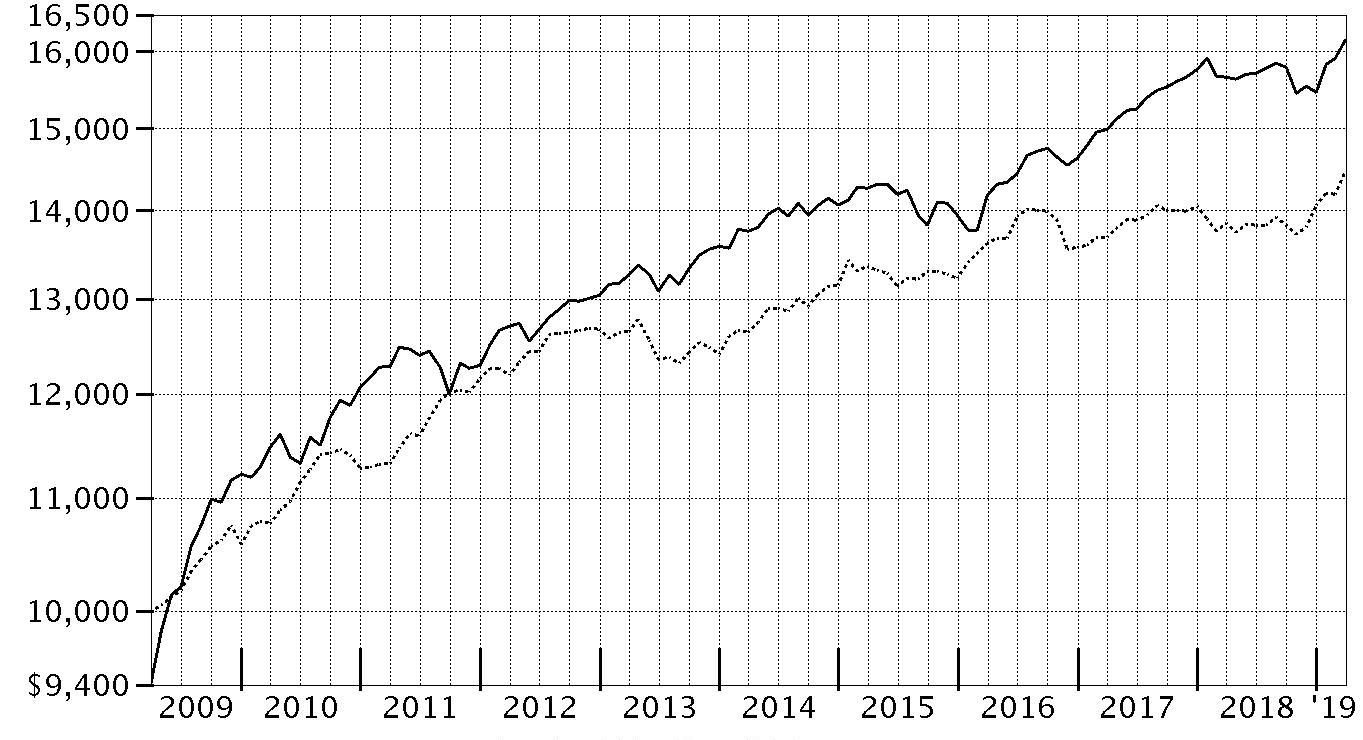
| Period Ending Values |
| $16,152 | Fidelity Advisor Freedom® Income Fund - Class A |
| $14,472 | Bloomberg Barclays U.S. Aggregate Bond Index |
Fidelity Advisor Freedom® 2005 Fund
Performance: The Bottom Line
Average annual total return reflects the change in the value of an investment, assuming reinvestment of distributions from dividend income and capital gains (the profits earned upon the sale of securities that have grown in value, if any) and assuming a constant rate of performance each year. The hypothetical investment and the average annual total returns do not reflect the deduction of taxes that a shareholder would pay on fund distributions or the redemption of fund shares. During periods of reimbursement by Fidelity, a fund’s total return will be greater than it would be had the reimbursement not occurred. How a fund did yesterday is no guarantee of how it will do tomorrow.
Average Annual Total Returns
| For the periods ended March 31, 2019 | Past 1 year | Past 5 years | Past 10 years |
| Class A (incl. 5.75% sales charge) | (2.70)% | 2.74% | 6.91% |
| Class M (incl. 3.50% sales charge) | (0.63)% | 2.98% | 6.90% |
| Class C (incl. contingent deferred sales charge) | 1.40% | 3.17% | 6.73% |
| Class I | 3.53% | 4.22% | 7.82% |
| Class Z | 3.54% | 4.23% | 7.82% |
| Class Z6 | 3.53% | 4.26% | 7.83% |
Class C shares' contingent deferred sales charges included in the past one year, past five years and past ten years total return figures are 1%, 0% and 0%, respectively.
The initial offering of Class Z shares took place on October 2, 2018. Returns prior to October 2, 2018 are those of Class I.
The initial offering of Class Z6 shares took place on June 6, 2017. Returns prior to June 6, 2017 are those of Class I.
Prior to June 1, 2017, the fund operated under a different pricing structure. The fund’s historical performance prior to June 1, 2017 does not reflect the fund’s current pricing structure.
$10,000 Over 10 Years
Let's say hypothetically that $10,000 was invested in Fidelity Advisor Freedom® 2005 Fund - Class A on March 31, 2009, and the current 5.75% sales charge was paid.
The chart shows how the value of your investment would have changed, and also shows how the Bloomberg Barclays U.S. Aggregate Bond Index performed over the same period.
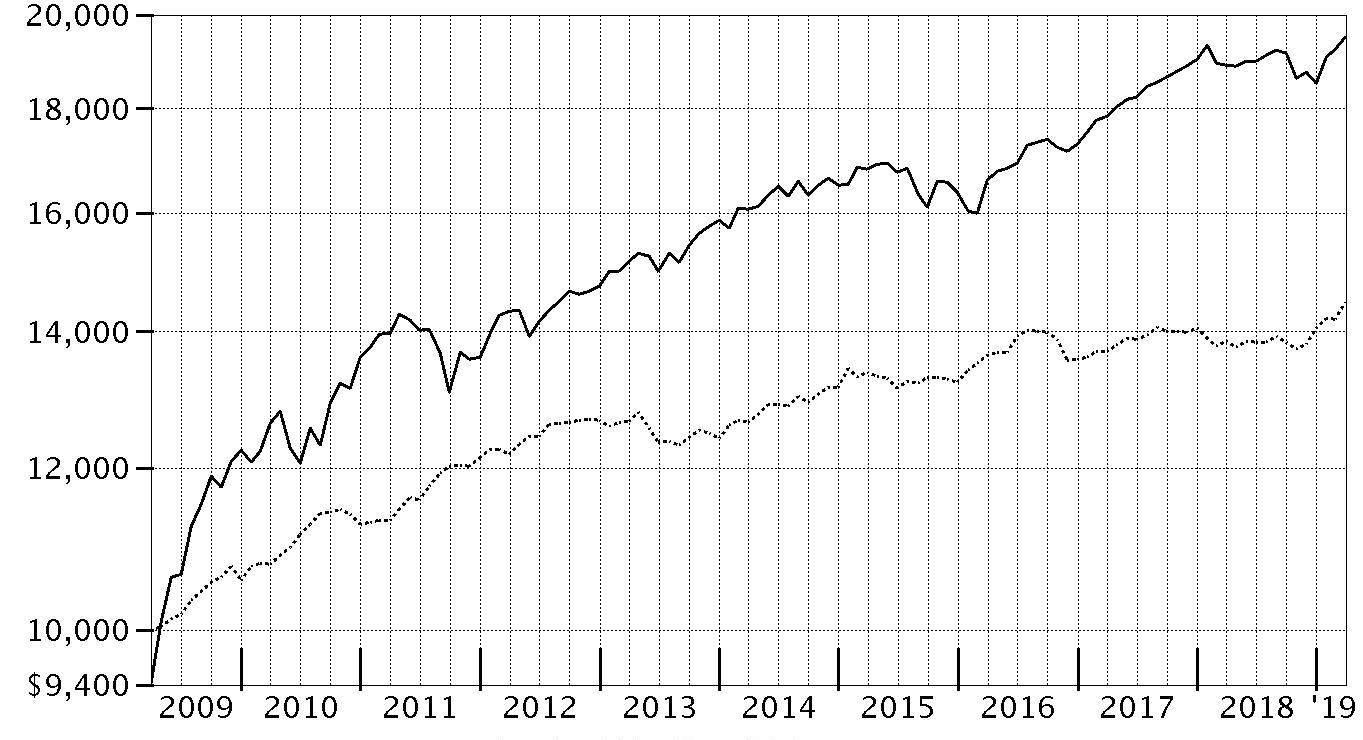
| Period Ending Values |
| $19,508 | Fidelity Advisor Freedom® 2005 Fund - Class A |
| $14,472 | Bloomberg Barclays U.S. Aggregate Bond Index |
Fidelity Advisor Freedom® 2010 Fund
Performance: The Bottom Line
Average annual total return reflects the change in the value of an investment, assuming reinvestment of distributions from dividend income and capital gains (the profits earned upon the sale of securities that have grown in value, if any) and assuming a constant rate of performance each year. The hypothetical investment and the average annual total returns do not reflect the deduction of taxes that a shareholder would pay on fund distributions or the redemption of fund shares. During periods of reimbursement by Fidelity, a fund’s total return will be greater than it would be had the reimbursement not occurred. How a fund did yesterday is no guarantee of how it will do tomorrow.
Average Annual Total Returns
| For the periods ended March 31, 2019 | Past 1 year | Past 5 years | Past 10 years |
| Class A (incl. 5.75% sales charge) | (2.66)% | 3.25% | 7.89% |
| Class M (incl. 3.50% sales charge) | (0.55)% | 3.49% | 7.88% |
| Class C (incl. contingent deferred sales charge) | 1.50% | 3.70% | 7.71% |
| Class I | 3.50% | 4.74% | 8.79% |
| Class Z | 3.51% | 4.75% | 8.80% |
| Class Z6 | 3.66% | 4.81% | 8.83% |
Class C shares' contingent deferred sales charges included in the past one year, past five years and past ten years total return figures are 1%, 0% and 0%, respectively.
The initial offering of Class Z shares took place on October 2, 2018. Returns prior to October 2, 2018 are those of Class I.
The initial offering of Class Z6 shares took place on June 6, 2017. Returns prior to June 6, 2017 are those of Class I.
Prior to June 1, 2017, the fund operated under a different pricing structure. The fund’s historical performance prior to June 1, 2017 does not reflect the fund’s current pricing structure.
$10,000 Over 10 Years
Let's say hypothetically that $10,000 was invested in Fidelity Advisor Freedom® 2010 Fund - Class A on March 31, 2009, and the current 5.75% sales charge was paid.
The chart shows how the value of your investment would have changed, and also shows how the Bloomberg Barclays U.S. Aggregate Bond Index performed over the same period.
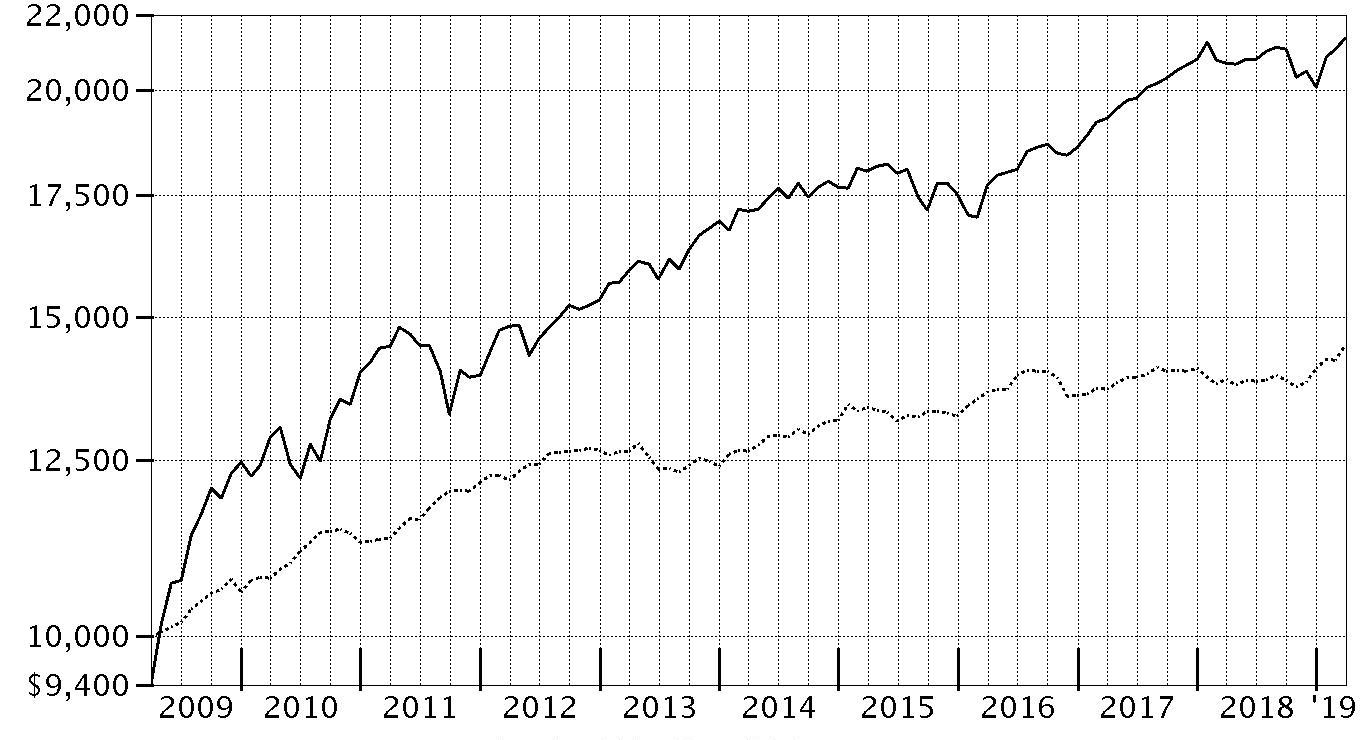
| Period Ending Values |
| $21,367 | Fidelity Advisor Freedom® 2010 Fund - Class A |
| $14,472 | Bloomberg Barclays U.S. Aggregate Bond Index |
Fidelity Advisor Freedom® 2015 Fund
Performance: The Bottom Line
Average annual total return reflects the change in the value of an investment, assuming reinvestment of distributions from dividend income and capital gains (the profits earned upon the sale of securities that have grown in value, if any) and assuming a constant rate of performance each year. The hypothetical investment and the average annual total returns do not reflect the deduction of taxes that a shareholder would pay on fund distributions or the redemption of fund shares. During periods of reimbursement by Fidelity, a fund’s total return will be greater than it would be had the reimbursement not occurred. How a fund did yesterday is no guarantee of how it will do tomorrow.
Average Annual Total Returns
| For the periods ended March 31, 2019 | Past 1 year | Past 5 years | Past 10 years |
| Class A (incl. 5.75% sales charge) | (2.68)% | 3.75% | 8.36% |
| Class M (incl. 3.50% sales charge) | (0.60)% | 3.97% | 8.34% |
| Class C (incl. contingent deferred sales charge) | 1.66% | 4.21% | 8.19% |
| Class I | 3.55% | 5.25% | 9.28% |
| Class Z | 3.63% | 5.26% | 9.29% |
| Class Z6 | 3.81% | 5.32% | 9.32% |
Class C shares' contingent deferred sales charges included in the past one year, past five years and past ten years total return figures are 1%, 0% and 0%, respectively.
The initial offering of Class Z shares took place on October 2, 2018. Returns prior to October 2, 2018 are those of Class I.
The initial offering of Class Z6 shares took place on June 6, 2017. Returns prior to June 6, 2017 are those of Class I.
Prior to June 1, 2017, the fund operated under a different pricing structure. The fund’s historical performance prior to June 1, 2017 does not reflect the fund’s current pricing structure.
$10,000 Over 10 Years
Let's say hypothetically that $10,000 was invested in Fidelity Advisor Freedom® 2015 Fund - Class A on March 31, 2009, and the current 5.75% sales charge was paid.
The chart shows how the value of your investment would have changed, and also shows how the Bloomberg Barclays U.S. Aggregate Bond Index performed over the same period.

| Period Ending Values |
| $22,315 | Fidelity Advisor Freedom® 2015 Fund - Class A |
| $14,472 | Bloomberg Barclays U.S. Aggregate Bond Index |
| $43,809 | S&P 500 Index |
Going forward, the fund’s performance will be compared to the Bloomberg Barclays U.S. Aggregate Bond Index, rather than the S&P 500® Index. The Bloomberg Barclays U.S. Aggregate Bond Index more closely represents the fund’s investment strategy, as fixed-income and short-term funds currently represent the majority of the fund’s assets.
Fidelity Advisor Freedom® 2020 Fund
Performance: The Bottom Line
Average annual total return reflects the change in the value of an investment, assuming reinvestment of distributions from dividend income and capital gains (the profits earned upon the sale of securities that have grown in value, if any) and assuming a constant rate of performance each year. The hypothetical investment and the average annual total returns do not reflect the deduction of taxes that a shareholder would pay on fund distributions or the redemption of fund shares. During periods of reimbursement by Fidelity, a fund’s total return will be greater than it would be had the reimbursement not occurred. How a fund did yesterday is no guarantee of how it will do tomorrow.
Average Annual Total Returns
| For the periods ended March 31, 2019 | Past 1 year | Past 5 years | Past 10 years |
| Class A (incl. 5.75% sales charge) | (2.55)% | 4.09% | 9.24% |
| Class M (incl. 3.50% sales charge) | (0.54)% | 4.31% | 9.23% |
| Class C (incl. contingent deferred sales charge) | 1.60% | 4.54% | 9.08% |
| Class I | 3.61% | 5.59% | 10.16% |
| Class Z | 3.64% | 5.60% | 10.16% |
| Class Z6 | 3.76% | 5.66% | 10.20% |
Class C shares' contingent deferred sales charges included in the past one year, past five years and past ten years total return figures are 1%, 0% and 0%, respectively.
The initial offering of Class Z shares took place on October 2, 2018. Returns prior to October 2, 2018 are those of Class I.
The initial offering of Class Z6 shares took place on June 6, 2017. Returns prior to June 6, 2017 are those of Class I.
Prior to June 1, 2017, the fund operated under a different pricing structure. The fund’s historical performance prior to June 1, 2017 does not reflect the fund’s current pricing structure.
$10,000 Over 10 Years
Let's say hypothetically that $10,000 was invested in Fidelity Advisor Freedom® 2020 Fund - Class A on March 31, 2009, and the current 5.75% sales charge was paid.
The chart shows how the value of your investment would have changed, and also shows how the S&P 500® Index performed over the same period.

| Period Ending Values |
| $24,198 | Fidelity Advisor Freedom® 2020 Fund - Class A |
| $43,809 | S&P 500® Index |
Fidelity Advisor Freedom® 2025 Fund
Performance: The Bottom Line
Average annual total return reflects the change in the value of an investment, assuming reinvestment of distributions from dividend income and capital gains (the profits earned upon the sale of securities that have grown in value, if any) and assuming a constant rate of performance each year. The hypothetical investment and the average annual total returns do not reflect the deduction of taxes that a shareholder would pay on fund distributions or the redemption of fund shares. During periods of reimbursement by Fidelity, a fund’s total return will be greater than it would be had the reimbursement not occurred. How a fund did yesterday is no guarantee of how it will do tomorrow.
Average Annual Total Returns
| For the periods ended March 31, 2019 | Past 1 year | Past 5 years | Past 10 years |
| Class A (incl. 5.75% sales charge) | (2.60)% | 4.39% | 9.97% |
| Class M (incl. 3.50% sales charge) | (0.52)% | 4.63% | 9.96% |
| Class C (incl. contingent deferred sales charge) | 1.64% | 4.85% | 9.80% |
| Class I | 3.63% | 5.91% | 10.90% |
| Class Z | 3.61% | 5.90% | 10.90% |
| Class Z6 | 3.85% | 5.99% | 10.94% |
Class C shares' contingent deferred sales charges included in the past one year, past five years and past ten years total return figures are 1%, 0% and 0%, respectively.
The initial offering of Class Z shares took place on October 2, 2018. Returns prior to October 2, 2018 are those of Class I.
The initial offering of Class Z6 shares took place on June 6, 2017. Returns prior to June 6, 2017 are those of Class I.
Prior to June 1, 2017, the fund operated under a different pricing structure. The fund’s historical performance prior to June 1, 2017 does not reflect the fund’s current pricing structure.
$10,000 Over 10 Years
Let's say hypothetically that $10,000 was invested in Fidelity Advisor Freedom® 2025 Fund - Class A on March 31, 2009, and the current 5.75% sales charge was paid.
The chart shows how the value of your investment would have changed, and also shows how the S&P 500® Index performed over the same period.

| Period Ending Values |
| $25,865 | Fidelity Advisor Freedom® 2025 Fund - Class A |
| $43,809 | S&P 500® Index |
Fidelity Advisor Freedom® 2030 Fund
Performance: The Bottom Line
Average annual total return reflects the change in the value of an investment, assuming reinvestment of distributions from dividend income and capital gains (the profits earned upon the sale of securities that have grown in value, if any) and assuming a constant rate of performance each year. The hypothetical investment and the average annual total returns do not reflect the deduction of taxes that a shareholder would pay on fund distributions or the redemption of fund shares. During periods of reimbursement by Fidelity, a fund’s total return will be greater than it would be had the reimbursement not occurred. How a fund did yesterday is no guarantee of how it will do tomorrow.
Average Annual Total Returns
| For the periods ended March 31, 2019 | Past 1 year | Past 5 years | Past 10 years |
| Class A (incl. 5.75% sales charge) | (2.52)% | 5.05% | 10.68% |
| Class M (incl. 3.50% sales charge) | (0.49)% | 5.28% | 10.66% |
| Class C (incl. contingent deferred sales charge) | 1.64% | 5.50% | 10.50% |
| Class I | 3.65% | 6.57% | 11.61% |
| Class Z | 3.70% | 6.58% | 11.61% |
| Class Z6 | 3.84% | 6.65% | 11.65% |
Class C shares' contingent deferred sales charges included in the past one year, past five years and past ten years total return figures are 1%, 0% and 0%, respectively.
The initial offering of Class Z shares took place on October 2, 2018. Returns prior to October 2, 2018 are those of Class I.
The initial offering of Class Z6 shares took place on June 6, 2017. Returns prior to June 6, 2017 are those of Class I.
Prior to June 1, 2017, the fund operated under a different pricing structure. The fund’s historical performance prior to June 1, 2017 does not reflect the fund’s current pricing structure.
$10,000 Over 10 Years
Let's say hypothetically that $10,000 was invested in Fidelity Advisor Freedom® 2030 Fund - Class A on March 31, 2009, and the current 5.75% sales charge was paid.
The chart shows how the value of your investment would have changed, and also shows how the S&P 500® Index performed over the same period.

| Period Ending Values |
| $27,581 | Fidelity Advisor Freedom® 2030 Fund - Class A |
| $43,809 | S&P 500® Index |
Fidelity Advisor Freedom® 2035 Fund
Performance: The Bottom Line
Average annual total return reflects the change in the value of an investment, assuming reinvestment of distributions from dividend income and capital gains (the profits earned upon the sale of securities that have grown in value, if any) and assuming a constant rate of performance each year. The hypothetical investment and the average annual total returns do not reflect the deduction of taxes that a shareholder would pay on fund distributions or the redemption of fund shares. During periods of reimbursement by Fidelity, a fund’s total return will be greater than it would be had the reimbursement not occurred. How a fund did yesterday is no guarantee of how it will do tomorrow.
Average Annual Total Returns
| For the periods ended March 31, 2019 | Past 1 year | Past 5 years | Past 10 years |
| Class A (incl. 5.75% sales charge) | (2.75)% | 5.48% | 11.22% |
| Class M (incl. 3.50% sales charge) | (0.71)% | 5.72% | 11.21% |
| Class C (incl. contingent deferred sales charge) | 1.47% | 5.95% | 11.04% |
| Class I | 3.47% | 7.02% | 12.16% |
| Class Z | 3.55% | 7.03% | 12.17% |
| Class Z6 | 3.65% | 7.11% | 12.21% |
Class C shares' contingent deferred sales charges included in the past one year, past five years and past ten years total return figures are 1%, 0% and 0%, respectively.
The initial offering of Class Z shares took place on October 2, 2018. Returns prior to October 2, 2018 are those of Class I.
The initial offering of Class Z6 shares took place on June 6, 2017. Returns prior to June 6, 2017 are those of Class I.
Prior to June 1, 2017, the fund operated under a different pricing structure. The fund’s historical performance prior to June 1, 2017 does not reflect the fund’s current pricing structure.
$10,000 Over 10 Years
Let's say hypothetically that $10,000 was invested in Fidelity Advisor Freedom® 2035 Fund - Class A on March 31, 2009, and the current 5.75% sales charge was paid.
The chart shows how the value of your investment would have changed, and also shows how the S&P 500® Index performed over the same period.

| Period Ending Values |
| $28,971 | Fidelity Advisor Freedom® 2035 Fund - Class A |
| $43,809 | S&P 500® Index |
Fidelity Advisor Freedom® 2040 Fund
Performance: The Bottom Line
Average annual total return reflects the change in the value of an investment, assuming reinvestment of distributions from dividend income and capital gains (the profits earned upon the sale of securities that have grown in value, if any) and assuming a constant rate of performance each year. The hypothetical investment and the average annual total returns do not reflect the deduction of taxes that a shareholder would pay on fund distributions or the redemption of fund shares. During periods of reimbursement by Fidelity, a fund’s total return will be greater than it would be had the reimbursement not occurred. How a fund did yesterday is no guarantee of how it will do tomorrow.
Average Annual Total Returns
| For the periods ended March 31, 2019 | Past 1 year | Past 5 years | Past 10 years |
| Class A (incl. 5.75% sales charge) | (2.89)% | 5.50% | 11.39% |
| Class M (incl. 3.50% sales charge) | (0.78)% | 5.74% | 11.37% |
| Class C (incl. contingent deferred sales charge) | 1.45% | 5.96% | 11.22% |
| Class I | 3.31% | 7.01% | 12.32% |
| Class Z | 3.44% | 7.04% | 12.33% |
| Class Z6 | 3.64% | 7.12% | 12.38% |
Class C shares' contingent deferred sales charges included in the past one year, past five years and past ten years total return figures are 1%, 0% and 0%, respectively.
The initial offering of Class Z shares took place on October 2, 2018. Returns prior to October 2, 2018 are those of Class I.
The initial offering of Class Z6 shares took place on June 6, 2017. Returns prior to June 6, 2017 are those of Class I.
Prior to June 1, 2017, the fund operated under a different pricing structure. The fund’s historical performance prior to June 1, 2017 does not reflect the fund’s current pricing structure.
$10,000 Over 10 Years
Let's say hypothetically that $10,000 was invested in Fidelity Advisor Freedom® 2040 Fund - Class A on March 31, 2009, and the current 5.75% sales charge was paid.
The chart shows how the value of your investment would have changed, and also shows how the S&P 500® Index performed over the same period.
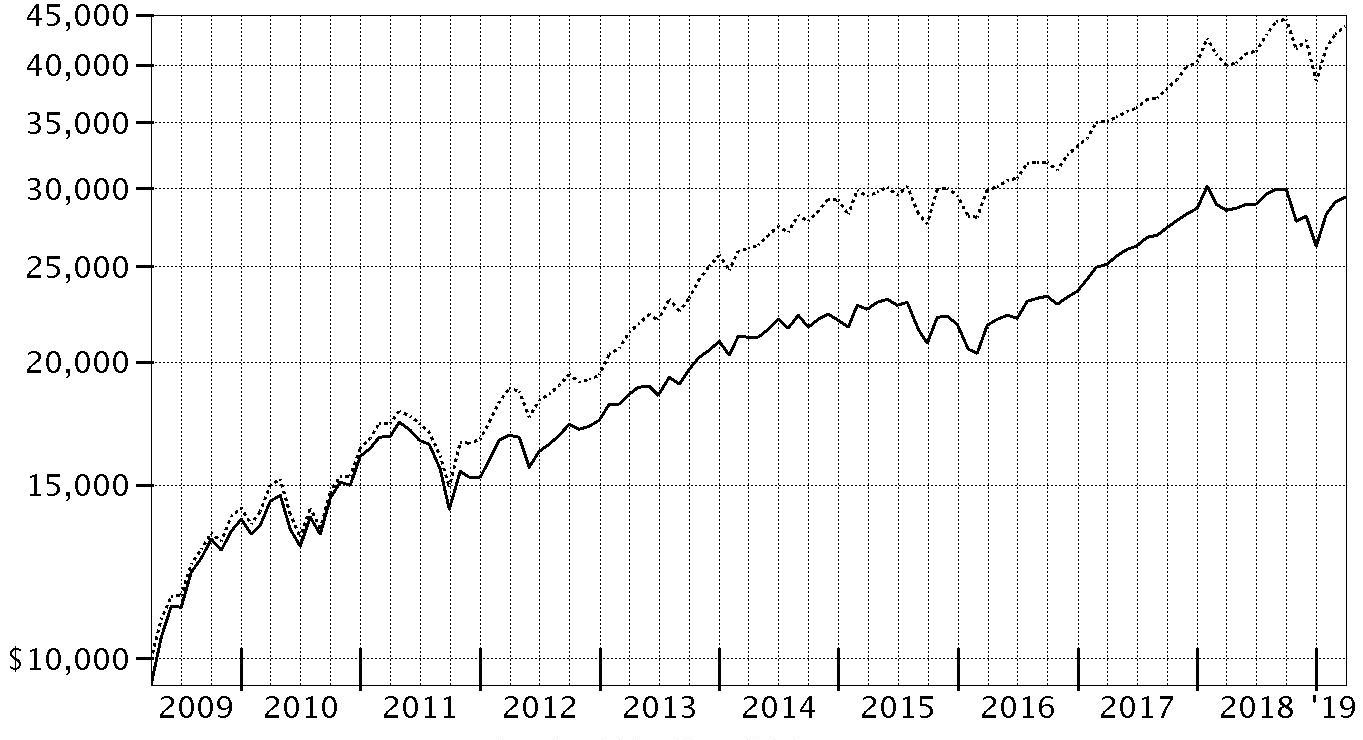
| Period Ending Values |
| $29,396 | Fidelity Advisor Freedom® 2040 Fund - Class A |
| $43,809 | S&P 500® Index |
Fidelity Advisor Freedom® 2045 Fund
Performance: The Bottom Line
Average annual total return reflects the change in the value of an investment, assuming reinvestment of distributions from dividend income and capital gains (the profits earned upon the sale of securities that have grown in value, if any) and assuming a constant rate of performance each year. The hypothetical investment and the average annual total returns do not reflect the deduction of taxes that a shareholder would pay on fund distributions or the redemption of fund shares. During periods of reimbursement by Fidelity, a fund’s total return will be greater than it would be had the reimbursement not occurred. How a fund did yesterday is no guarantee of how it will do tomorrow.
Average Annual Total Returns
| For the periods ended March 31, 2019 | Past 1 year | Past 5 years | Past 10 years |
| Class A (incl. 5.75% sales charge) | (2.80)% | 5.51% | 11.51% |
| Class M (incl. 3.50% sales charge) | (0.81)% | 5.73% | 11.49% |
| Class C (incl. contingent deferred sales charge) | 1.37% | 5.96% | 11.35% |
| Class I | 3.34% | 7.03% | 12.46% |
| Class Z | 3.34% | 7.03% | 12.46% |
| Class Z6 | 3.58% | 7.12% | 12.51% |
Class C shares' contingent deferred sales charges included in the past one year, past five years and past ten years total return figures are 1%, 0% and 0%, respectively.
The initial offering of Class Z shares took place on October 2, 2018. Returns prior to October 2, 2018 are those of Class I.
The initial offering of Class Z6 shares took place on June 6, 2017. Returns prior to June 6, 2017 are those of Class I.
Prior to June 1, 2017, the fund operated under a different pricing structure. The fund’s historical performance prior to June 1, 2017 does not reflect the fund’s current pricing structure.
$10,000 Over 10 Years
Let's say hypothetically that $10,000 was invested in Fidelity Advisor Freedom® 2045 Fund - Class A on March 31, 2009, and the current 5.75% sales charge was paid.
The chart shows how the value of your investment would have changed, and also shows how the S&P 500® Index performed over the same period.

| Period Ending Values |
| $29,714 | Fidelity Advisor Freedom® 2045 Fund - Class A |
| $43,809 | S&P 500® Index |
Fidelity Advisor Freedom® 2050 Fund
Performance: The Bottom Line
Average annual total return reflects the change in the value of an investment, assuming reinvestment of distributions from dividend income and capital gains (the profits earned upon the sale of securities that have grown in value, if any) and assuming a constant rate of performance each year. The hypothetical investment and the average annual total returns do not reflect the deduction of taxes that a shareholder would pay on fund distributions or the redemption of fund shares. During periods of reimbursement by Fidelity, a fund’s total return will be greater than it would be had the reimbursement not occurred. How a fund did yesterday is no guarantee of how it will do tomorrow.
Average Annual Total Returns
| For the periods ended March 31, 2019 | Past 1 year | Past 5 years | Past 10 years |
| Class A (incl. 5.75% sales charge) | (2.84)% | 5.50% | 11.66% |
| Class M (incl. 3.50% sales charge) | (0.77)% | 5.75% | 11.65% |
| Class C (incl. contingent deferred sales charge) | 1.41% | 5.96% | 11.52% |
| Class I | 3.30% | 7.02% | 12.62% |
| Class Z | 3.39% | 7.04% | 12.63% |
| Class Z6 | 3.55% | 7.11% | 12.67% |
Class C shares' contingent deferred sales charges included in the past one year, past five years and past ten years total return figures are 1%, 0% and 0%, respectively.
The initial offering of Class Z shares took place on October 2, 2018. Returns prior to October 2, 2018 are those of Class I.
The initial offering of Class Z6 shares took place on June 6, 2017. Returns prior to June 6, 2017 are those of Class I.
Prior to June 1, 2017, the fund operated under a different pricing structure. The fund’s historical performance prior to June 1, 2017 does not reflect the fund’s current pricing structure.
$10,000 Over 10 Years
Let's say hypothetically that $10,000 was invested in Fidelity Advisor Freedom® 2050 Fund - Class A on March 31, 2009, and the current 5.75% sales charge was paid.
The chart shows how the value of your investment would have changed, and also shows how the S&P 500® Index performed over the same period.

| Period Ending Values |
| $30,138 | Fidelity Advisor Freedom® 2050 Fund - Class A |
| $43,809 | S&P 500® Index |
Fidelity Advisor Freedom® 2055 Fund
Performance: The Bottom Line
Average annual total return reflects the change in the value of an investment, assuming reinvestment of distributions from dividend income and capital gains (the profits earned upon the sale of securities that have grown in value, if any) and assuming a constant rate of performance each year. The hypothetical investment and the average annual total returns do not reflect the deduction of taxes that a shareholder would pay on fund distributions or the redemption of fund shares. During periods of reimbursement by Fidelity, a fund’s total return will be greater than it would be had the reimbursement not occurred. How a fund did yesterday is no guarantee of how it will do tomorrow.
Average Annual Total Returns
| For the periods ended March 31, 2019 | Past 1 year | Past 5 years | Life of fundA |
| Class A (incl. 5.75% sales charge) | (2.84)% | 5.50% | 6.78% |
| Class M (incl. 3.50% sales charge) | (0.74)% | 5.75% | 6.84% |
| Class C (incl. contingent deferred sales charge) | 1.38% | 5.98% | 6.79% |
| Class I | 3.34% | 7.04% | 7.87% |
| Class Z | 3.38% | 7.05% | 7.87% |
| Class Z6 | 3.59% | 7.13% | 7.92% |
A From June 1, 2011
Class C shares' contingent deferred sales charges included in the past one year, past five years, and life of fund total return figures are 1%, 0%, and 0%, respectively.
The initial offering of Class Z shares took place on October 2, 2018. Returns prior to October 2, 2018 are those of Class I.
The initial offering of Class Z6 shares took place on June 6, 2017. Returns prior to June 6, 2017 are those of Class I.
Prior to June 1, 2017, the fund operated under a different pricing structure. The fund’s historical performance prior to June 1, 2017 does not reflect the fund’s current pricing structure.
$10,000 Over Life of Fund
Let's say hypothetically that $10,000 was invested in Fidelity Advisor Freedom® 2055 Fund - Class A on June 1, 2011, when the fund started, and the current 5.75% sales charge was paid.
The chart shows how the value of your investment would have changed, and also shows how the S&P 500® Index performed over the same period.
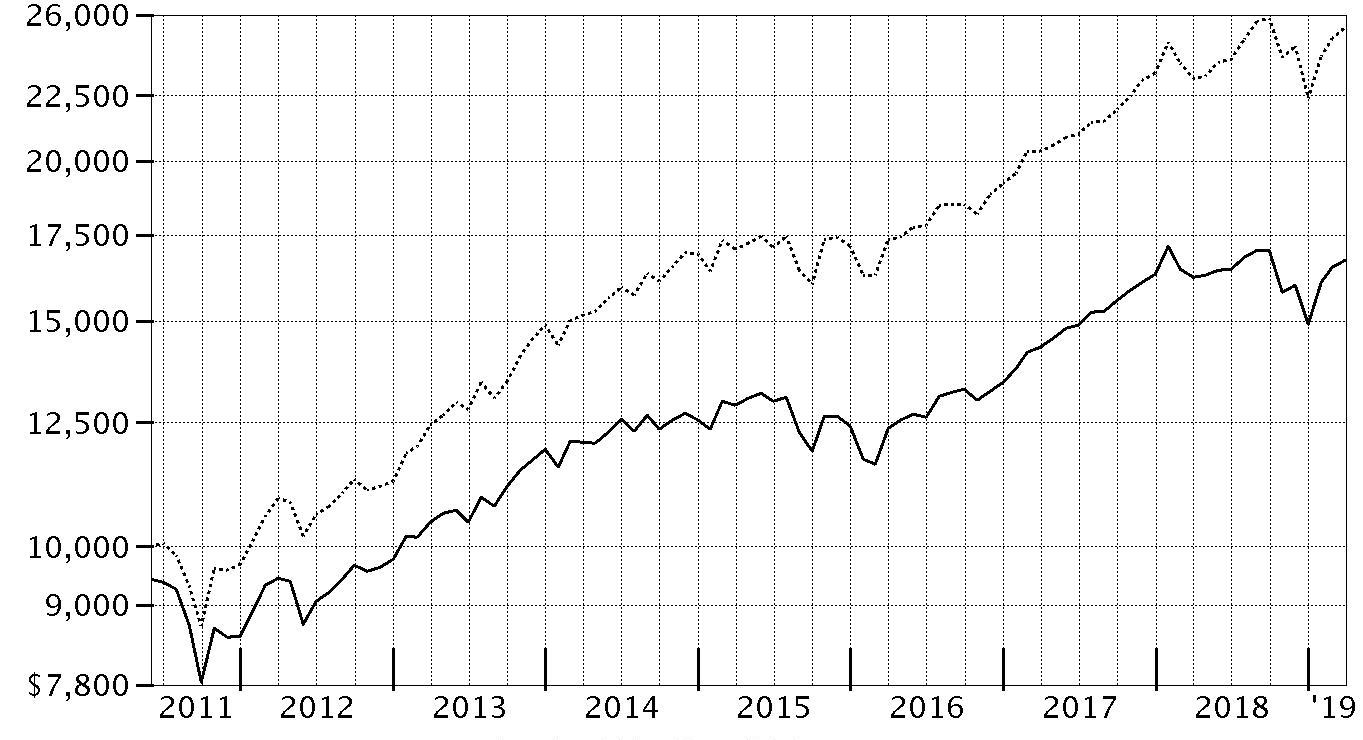
| Period Ending Values |
| $16,719 | Fidelity Advisor Freedom® 2055 Fund - Class A |
| $25,424 | S&P 500® Index |
Fidelity Advisor Freedom® 2060 Fund
Performance: The Bottom Line
Average annual total return reflects the change in the value of an investment, assuming reinvestment of distributions from dividend income and capital gains (the profits earned upon the sale of securities that have grown in value, if any) and assuming a constant rate of performance each year. The hypothetical investment and the average annual total returns do not reflect the deduction of taxes that a shareholder would pay on fund distributions or the redemption of fund shares. During periods of reimbursement by Fidelity, a fund’s total return will be greater than it would be had the reimbursement not occurred. How a fund did yesterday is no guarantee of how it will do tomorrow.
Average Annual Total Returns
| For the periods ended March 31, 2019 | Past 1 year | Life of fundA |
| Class A (incl. 5.75% sales charge) | (2.84)% | 5.59% |
| Class M (incl. 3.50% sales charge) | (0.78)% | 5.85% |
| Class C (incl. contingent deferred sales charge) | 1.38% | 6.14% |
| Class I | 3.38% | 7.21% |
| Class Z | 3.44% | 7.23% |
| Class Z6 | 3.63% | 7.32% |
A From August 5, 2014
Class C shares' contingent deferred sales charges included in the past one year and life of fund total return figures are 1% and 0%, respectively.
The initial offering of Class Z shares took place on October 2, 2018. Returns prior to October 2, 2018 are those of Class I.
The initial offering of Class Z6 shares took place on June 6, 2017. Returns prior to June 6, 2017 are those of Class I.
Prior to June 1, 2017, the fund operated under a different pricing structure. The fund’s historical performance prior to June 1, 2017 does not reflect the fund’s current pricing structure.
$10,000 Over Life of Fund
Let's say hypothetically that $10,000 was invested in Fidelity Advisor Freedom® 2060 Fund - Class A on August 5, 2014, when the fund started, and the current 5.75% sales charge was paid.
The chart shows how the value of your investment would have changed, and also shows how the S&P 500® Index performed over the same period.

| Period Ending Values |
| $12,882 | Fidelity Advisor Freedom® 2060 Fund - Class A |
| $16,256 | S&P 500® Index |
Management's Discussion of Fund Performance
Market Recap: The global economy remained in expansion for the 12 months ending March 31, 2019, but growth was less synchronous and uneven. Many major economies progressed toward more-advanced stages of the business cycle. Financial markets responded favorably to the U.S. Federal Reserve’s shift away from its monetary tightening bias in the first quarter of 2019. Most economic indicators remained tepid, although China displayed some initial signs of stabilizing activity, and stepped up the pace of fiscal and monetary stimulus in the first quarter. Against this backdrop, the MSCI World ex USA Index of non-U.S. equity markets returned -2.91% for the year. Much of the negative impact came in the volatile fourth quarter of 2018, when the index returned -13%, followed by a sharp rebound to begin 2019. Among regions in the index, stocks in resource-rich Canada gained 4%, benefiting from rising crude-oil prices early and late in the period, while Asia Pacific ex Japan (+4%) was aided by stabilizing returns in Hong Kong, which rose 8%. Conversely, stocks in Japan (-8%), emerging markets (0%) and Europe ex U.K. (-4%) lagged. Results at home were markedly better. The U.S. equity bellwether S&P 500
® index rose 9.50%. Nine of 11 sectors in the S&P 500
® had a positive return. Three defensive sectors stood out: real estate (+21%), utilities (+19%) and health care (+15%). Conversely, some economically sensitive sectors struggled, with financials (-5%) faring worst. The small-cap-oriented Russell 2000
® Index gained 2.05% for the 12 months. Commodities also lagged, as evidenced by the -5.25% result of the Bloomberg Barclays Commodity Index Total Return. U.S. investment-grade bonds gained 4.48%, according to the Bloomberg Barclays U.S. Aggregate Bond Index, largely driven by surging returns for credit-sensitive sectors. U.S. corporate bonds increased 4.89%, according to the Bloomberg Barclays Credit Bond Index. Elsewhere, securitized sectors fared well, led by commercial mortgage-backed securities (+5.43%). Agency bonds and Treasury Inflation-Protected Securities (TIPS) lagged, as measured by the 3.73% return of the Bloomberg Barclays U.S. Agency Bond Index and the 2.70% advance of the Bloomberg Barclays U.S. Treasury Inflation-Protected Securities Index (Series-L), respectively.
Comments from Co-Portfolio Managers Andrew Dierdorf and Brett Sumsion: For the fiscal year March 31, 2019, the Class I shares of each Advisor Freedom
® Fund posted a gain, ranging from roughly 3% to 4%. Each Fund lagged its respective Composite index by roughly 1 to 2 percentage points. Top-down active asset allocation decisions were primarily responsible for the Funds' underperformance of Composites, while underlying investment performance was a positive factor overall. In terms of active asset allocation, non-Composite exposure to commodities held back the Funds' results most, followed by an overweighting in non-U.S. equities. Within non-U.S. equities, an overweighting in emerging-markets investments notably held back the Funds' performance. Meanwhile, underweighting U.S. equities also detracted, as this was one of the better-performing asset classes this period. Intra-asset allocation decisions – investments made within the major asset classes (equities and fixed-income) – also had a negative influence on the Funds’ relative results. In particular, allocations within U.S. equities and non U.S.-equities proved disappointing. Specifically, allocations to small-cap-oriented and value-focused funds notably detracted within U.S. and non-U.S. equities, as these categories generally underperformed larger, growth-oriented styles the past year. Looking at the Funds' overall underlying investment performance, the relative outperformance of investments in U.S. equities added value versus Composites. Here, an investment in Fidelity Advisor Series Growth Opportunities Fund led the way, as its 38% gain handily outperformed the roughly 9% advance of the Dow Jones U.S. Total Stock Market Index, the Composite's benchmark for U.S. equities. The performance of the Funds' underlying investment-grade bond investments also added value versus Composites.
The views expressed above reflect those of the portfolio manager(s) only through the end of the period as stated on the cover of this report and do not necessarily represent the views of Fidelity or any other person in the Fidelity organization. Any such views are subject to change at any time based upon market or other conditions and Fidelity disclaims any responsibility to update such views. These views may not be relied on as investment advice and, because investment decisions for a Fidelity fund are based on numerous factors, may not be relied on as an indication of trading intent on behalf of any Fidelity fund.
Notes to Shareholders: At its May 2018 meeting, the Board of Trustees approved incremental updates to the glide path and strategic asset allocation of Fidelity Advisor Freedom Funds, adding U.S. Treasury Inflation-Protected Securities and long-term U.S. Treasury bonds, and slightly reducing the equity and short-term debt allocations for shorter-dated Funds. These updates have been fully implemented. At its May 2019 meeting, the Board of Trustees approved adjusting the equity composition of the strategic asset allocation of Fidelity Advisor Freedom Funds from 70%/30% to 60%/40% for U.S./non-U.S. equities.
Fidelity Advisor Freedom® Income Fund
Investment Summary (Unaudited)
The information in the following tables is based on the direct investments of the Fund.
Top Holdings as of March 31, 2019
| | % of fund's net assets |
| Fidelity Series Investment Grade Bond Fund | 37.4 |
| Fidelity Series Government Money Market Fund 2.50% | 17.8 |
| Fidelity Series Inflation-Protected Bond Index Fund | 13.1 |
| Fidelity Series Long-Term Treasury Bond Index Fund | 4.5 |
| Fidelity Series Short-Term Credit Fund | 4.5 |
| Fidelity Series Emerging Markets Opportunities Fund | 3.4 |
| Fidelity Series International Growth Fund | 2.3 |
| Fidelity Series Commodity Strategy Fund | 2.3 |
| Fidelity Series International Value Fund | 2.2 |
| Fidelity Series Large Cap Stock Fund | 1.8 |
| | 89.3 |
Asset Allocation (% of fund's net assets)
| Period end |
| | Domestic Equity Funds | 11.1% |
| | International Equity Funds | 9.1% |
| | Bond Funds | 57.4% |
| | Short-Term Funds | 22.4% |

Domestic Equity Funds category includes Fidelity Series Commodity Strategy Fund which invests in commodity-related investments.
Fidelity Advisor Freedom® Income Fund
Schedule of Investments March 31, 2019
Showing Percentage of Net Assets
| U.S. Treasury Obligations - 0.0% | | | |
| | | Principal Amount | Value |
| U.S. Treasury Bills, yield at date of purchase 2.39% to 2.4% 4/4/19 to 5/30/19 (a) | | | |
| (Cost $79,798) | | 80,000 | 79,801 |
| | | Shares | Value |
|
| Domestic Equity Funds - 11.1% | | | |
| Fidelity Advisor Series Equity Growth Fund (b) | | 175,920 | $2,450,563 |
| Fidelity Advisor Series Growth Opportunities Fund (b) | | 116,801 | 1,688,943 |
| Fidelity Advisor Series Small Cap Fund (b) | | 103,908 | 1,088,957 |
| Fidelity Series All-Sector Equity Fund (b) | | 102,766 | 989,640 |
| Fidelity Series Commodity Strategy Fund (b) | | 1,092,283 | 5,210,189 |
| Fidelity Series Large Cap Stock Fund (b) | | 282,068 | 4,132,298 |
| Fidelity Series Large Cap Value Index Fund (b) | | 36,968 | 458,775 |
| Fidelity Series Opportunistic Insights Fund (b) | | 128,024 | 2,237,855 |
| Fidelity Series Small Cap Opportunities Fund (b) | | 103,765 | 1,396,674 |
| Fidelity Series Stock Selector Large Cap Value Fund (b) | | 231,290 | 2,729,219 |
| Fidelity Series Value Discovery Fund (b) | | 214,404 | 2,677,903 |
| TOTAL DOMESTIC EQUITY FUNDS | | | |
| (Cost $21,559,049) | | | 25,061,016 |
|
| International Equity Funds - 9.1% | | | |
| Fidelity Series Canada Fund (b) | | 44,972 | 463,666 |
| Fidelity Series Emerging Markets Fund (b) | | 83,450 | 816,980 |
| Fidelity Series Emerging Markets Opportunities Fund (b) | | 411,506 | 7,625,209 |
| Fidelity Series International Growth Fund (b) | | 348,897 | 5,299,749 |
| Fidelity Series International Small Cap Fund (b) | | 82,777 | 1,285,533 |
| Fidelity Series International Value Fund (b) | | 547,528 | 5,092,008 |
| TOTAL INTERNATIONAL EQUITY FUNDS | | | |
| (Cost $16,737,677) | | | 20,583,145 |
|
| Bond Funds - 57.4% | | | |
| Fidelity Series Emerging Markets Debt Fund (b) | | 178,663 | 1,713,377 |
| Fidelity Series Floating Rate High Income Fund (b) | | 40,078 | 371,523 |
| Fidelity Series High Income Fund (b) | | 210,605 | 1,979,688 |
| Fidelity Series Inflation-Protected Bond Index Fund (b) | | 3,027,876 | 29,612,624 |
| Fidelity Series International Credit Fund (b) | | 11,796 | 116,665 |
| Fidelity Series Investment Grade Bond Fund (b) | | 7,537,739 | 84,271,921 |
| Fidelity Series Long-Term Treasury Bond Index Fund (b) | | 1,157,714 | 10,268,926 |
| Fidelity Series Real Estate Income Fund (b) | | 102,658 | 1,120,004 |
| TOTAL BOND FUNDS | | | |
| (Cost $126,921,248) | | | 129,454,728 |
|
| Short-Term Funds - 22.4% | | | |
| Fidelity Cash Central Fund, 2.48% (c) | | 343,986 | 344,055 |
| Fidelity Series Government Money Market Fund 2.50%(b)(d) | | 40,063,769 | 40,063,769 |
| Fidelity Series Short-Term Credit Fund (b) | | 1,009,370 | 10,063,420 |
| TOTAL SHORT-TERM FUNDS | | | |
| (Cost $50,434,514) | | | 50,471,244 |
| TOTAL INVESTMENT IN SECURITIES - 100.0% | | | |
| (Cost $215,732,286) | | | 225,649,934 |
| NET OTHER ASSETS (LIABILITIES) - 0.0% | | | (96,958) |
| NET ASSETS - 100% | | | $225,552,976 |
| Futures Contracts | | | | | |
| | Number of contracts | Expiration Date | Notional Amount | Value | Unrealized Appreciation/(Depreciation) |
| Purchased | | | | | |
| Treasury Contracts | | | | | |
| CBOT 2-Year U.S. Treasury Note Contracts (United States) | 1 | June 2019 | $213,094 | $928 | $928 |
| CBOT 5-Year U.S. Treasury Note Contracts (United States) | 1 | June 2019 | 115,828 | 1,318 | 1,318 |
| CBOT 10-Year U.S. Treasury Note Contracts (United States) | 1 | June 2019 | 124,219 | 2,311 | 2,311 |
|
| TOTAL PURCHASED | | | | | 4,557 |
|
| Sold | | | | | |
| Equity Index Contracts | | | | | |
| CME E-mini S&P 500 Index Contracts (United States) | 6 | June 2019 | 851,340 | (25,768) | (25,768) |
| ICE E-mini MSCI Emerging Markets Index Contracts (United States) | 8 | June 2019 | 422,960 | (7,889) | (7,889) |
|
| TOTAL SOLD | | | | | (33,657) |
|
| TOTAL FUTURES CONTRACTS | | | | | $(29,100) |
The notional amount of futures purchased as a percentage of Net Assets is 0.2%
The notional amount of futures sold as a percentage of Net Assets is 0.6%
Legend
(a) Security or a portion of the security was pledged to cover margin requirements for futures contracts. At period end, the value of securities pledged amounted to $79,801.
(b) Affiliated Fund
(c) Affiliated fund that is generally available only to investment companies and other accounts managed by Fidelity Investments. The rate quoted is the annualized seven-day yield of the fund at period end. A complete unaudited listing of the fund's holdings as of its most recent quarter end is available upon request. In addition, each Fidelity Central Fund's financial statements, which are not covered by the Fund's Report of Independent Registered Public Accounting Firm, are available on the SEC's website or upon request.
(d) The rate quoted is the annualized seven-day yield of the fund at period end.
Affiliated Central Funds
Information regarding fiscal year to date income earned by the Fund from investments in Fidelity Central Funds is as follows:
| Fund | Income earned |
| Fidelity Cash Central Fund | $3,957 |
| Total | $3,957 |
Amounts in the income column in the above table include any capital gain distributions from underlying funds, which are presented in the corresponding line-item in the Statement of Operations, if applicable.
Affiliated Underlying Funds
Fiscal year to date information regarding the Fund's investments in affiliated Underlying Funds, excluding any Money Market Central Funds, is presented below. Exchanges between classes of the same affiliated Underlying Funds may occur.
| Affiliate | Value, beginning of period | Purchases | Sales Proceeds | Dividend Income | Realized Gain (loss) | Change in Unrealized appreciation (depreciation) | Value, end of period |
| Fidelity Advisor Series Equity Growth Fund | $2,986,272 | $799,550 | $1,524,101 | $185,610 | $235,198 | $(46,356) | $2,450,563 |
| Fidelity Advisor Series Equity Value Fund | 3,441,952 | 554,340 | 1,263,737 | 91,665 | 155,363 | (651,254) | -- |
| Fidelity Advisor Series Growth & Income Fund | 5,267,197 | 1,126,409 | 2,094,596 | 408,911 | 147,730 | (1,111,601) | -- |
| Fidelity Advisor Series Growth Opportunities Fund | 1,963,092 | 698,340 | 1,316,470 | 291,912 | 309,089 | 34,892 | 1,688,943 |
| Fidelity Advisor Series Opportunistic Insights Fund | 2,809,288 | 550,119 | 1,177,658 | 174,096 | 310,240 | (1,149,788) | -- |
| Fidelity Advisor Series Small Cap Fund | 1,497,643 | 404,745 | 719,136 | 104,438 | 73,427 | (167,722) | 1,088,957 |
| Fidelity Advisor Series Stock Selector Large Cap Value Fund | 3,474,257 | 698,024 | 1,284,823 | 232,137 | 163,270 | (660,926) | -- |
| Fidelity Series 100 Index Fund | 1,480,375 | -- | 1,552,285 | -- | 970,147 | (898,237) | -- |
| Fidelity Series All-Sector Equity Fund | 2,050,720 | 646,821 | 1,634,905 | 247,553 | 341,587 | (414,583) | 989,640 |
| Fidelity Series Canada Fund | 536,118 | 142,213 | 226,787 | 10,397 | 1,071 | 11,051 | 463,666 |
| Fidelity Series Commodity Strategy Fund | 4,537,656 | 2,584,007 | 1,320,873 | 309,044 | (294,022) | (296,579) | 5,210,189 |
| Fidelity Series Emerging Markets Debt Fund | 1,670,287 | 389,349 | 264,607 | 102,878 | (4,018) | (77,634) | 1,713,377 |
| Fidelity Series Emerging Markets Fund | -- | 895,358 | 86,963 | 3,260 | (1,502) | 10,087 | 816,980 |
| Fidelity Series Emerging Markets Opportunities Fund | 6,576,903 | 3,363,370 | 1,356,304 | 600,390 | (47,417) | (911,343) | 7,625,209 |
| Fidelity Series Floating Rate High Income Fund | 531,740 | 136,265 | 284,692 | 31,322 | (13,779) | 1,989 | 371,523 |
| Fidelity Series Government Money Market Fund 2.50% | 49,380,363 | 13,752,580 | 23,069,174 | 933,276 | -- | -- | 40,063,769 |
| Fidelity Series High Income Fund | 3,122,185 | 808,239 | 1,915,245 | 188,137 | (59,646) | 24,155 | 1,979,688 |
| Fidelity Series Inflation-Protected Bond Index Fund | 8,056,431 | 25,985,055 | 4,547,523 | 536,662 | (51,927) | 170,588 | 29,612,624 |
| Fidelity Series International Credit Fund | 111,314 | 5,642 | -- | 5,642 | -- | (291) | 116,665 |
| Fidelity Series International Growth Fund | 5,569,432 | 2,343,974 | 2,348,345 | 344,523 | 189,906 | (455,218) | 5,299,749 |
| Fidelity Series International Small Cap Fund | 1,385,201 | 649,190 | 550,892 | 112,043 | 37,234 | (235,200) | 1,285,533 |
| Fidelity Series International Value Fund | 5,462,228 | 2,154,457 | 1,886,657 | 189,510 | 17,894 | (655,914) | 5,092,008 |
| Fidelity Series Investment Grade Bond Fund | 81,183,581 | 19,731,720 | 17,861,385 | 2,741,950 | (93,727) | 1,311,732 | 84,271,921 |
| Fidelity Series Large Cap Stock Fund | -- | 539,362 | 515,481 | 171,209 | (10,590) | 783,868 | 4,132,298 |
| Fidelity Series Large Cap Value Index Fund | 585,207 | 139,294 | 277,523 | 21,719 | 34,401 | (22,604) | 458,775 |
| Fidelity Series Long-Term Treasury Bond Index Fund | 4,509,835 | 8,552,150 | 3,246,162 | 238,187 | (70,116) | 523,219 | 10,268,926 |
| Fidelity Series Opportunistic Insights Fund | -- | 385,470 | 265,654 | 185,551 | (12,878) | 788,716 | 2,237,855 |
| Fidelity Series Real Estate Equity Fund | 358,281 | 5,201 | 378,004 | 4,736 | 63,967 | (49,445) | -- |
| Fidelity Series Real Estate Income Fund | 1,049,918 | 302,993 | 252,000 | 80,437 | (817) | 19,910 | 1,120,004 |
| Fidelity Series Short-Term Credit Fund | 12,143,757 | 2,613,659 | 4,805,632 | 289,932 | (36,762) | 148,398 | 10,063,420 |
| Fidelity Series Small Cap Opportunities Fund | 1,815,589 | 536,126 | 926,534 | 165,282 | 233,753 | (262,260) | 1,396,674 |
| Fidelity Series Stock Selector Large Cap Value Fund | -- | 476,211 | 331,484 | 235,997 | (7,412) | 202,102 | 2,729,219 |
| Fidelity Series Value Discovery Fund | -- | 402,759 | 323,925 | 165,918 | (5,364) | 367,769 | 2,677,903 |
| | $213,556,822 | $92,372,992 | $79,609,557 | $9,404,324 | $2,574,300 | $(3,668,479) | $225,226,078 |
Amounts in the income column in the above table include any capital gain distributions from underlying funds, which are presented in the corresponding line-item in the Statement of Operations, if applicable.
Investment Valuation
The following is a summary of the inputs used, as of March 31, 2019, involving the Fund's assets and liabilities carried at fair value. The inputs or methodology used for valuing securities may not be an indication of the risk associated with investing in those securities. For more information on valuation inputs, and their aggregation into the levels used below, please refer to the Investment Valuation section in the accompanying Notes to Financial Statements.
| | Valuation Inputs at Reporting Date: |
| Description | Total | Level 1 | Level 2 | Level 3 |
| Investments in Securities: | | | | |
| Other Short-Term Investments | $79,801 | $-- | $79,801 | $-- |
| Domestic Equity Funds | 25,061,016 | 25,061,016 | -- | -- |
| International Equity Funds | 20,583,145 | 20,583,145 | -- | -- |
| Bond Funds | 129,454,728 | 129,454,728 | -- | -- |
| Short-Term Funds | 50,471,244 | 50,471,244 | -- | -- |
| Total Investments in Securities: | $225,649,934 | $225,570,133 | $79,801 | $-- |
| Derivative Instruments: | | | | |
| Assets | | | | |
| Futures Contracts | $4,557 | $4,557 | $-- | $-- |
| Total Assets | $4,557 | $4,557 | $-- | $-- |
| Liabilities | | | | |
| Futures Contracts | $(33,657) | $(33,657) | $-- | $-- |
| Total Liabilities | $(33,657) | $(33,657) | $-- | $-- |
| Total Derivative Instruments: | $(29,100) | $(29,100) | $-- | $-- |
Value of Derivative Instruments
The following table is a summary of the Fund's value of derivative instruments by primary risk exposure as of March 31, 2019. For additional information on derivative instruments, please refer to the Derivative Instruments section in the accompanying Notes to Financial Statements.
| Primary Risk Exposure / Derivative Type | Value |
| | Asset | Liability |
| Equity Risk | | |
| Futures Contracts(a) | $0 | $(33,657) |
| Total Equity Risk | 0 | (33,657) |
| Interest Rate Risk | | |
| Futures Contracts(a) | 4,557 | 0 |
| Total Interest Rate Risk | 4,557 | 0 |
| Total Value of Derivatives | $4,557 | $(33,657) |
(a) Reflects gross cumulative appreciation (depreciation) on futures contracts as presented in the Schedule of Investments. In the Statement of Assets and Liabilities, the period end daily variation margin is included in receivable or payable for daily variation margin on futures contracts, and the net cumulative appreciation (depreciation) is included in distributable earnings.
See accompanying notes which are an integral part of the financial statements.
Fidelity Advisor Freedom® Income Fund
Financial Statements
Statement of Assets and Liabilities
| | | March 31, 2019 |
| Assets | | |
Investment in securities, at value — See accompanying schedule:
Unaffiliated issuers (cost $79,798) | $79,801 | |
| Fidelity Central Funds (cost $344,055) | 344,055 | |
| Other affiliated issuers (cost $215,308,433) | 225,226,078 | |
| Total Investment in Securities (cost $215,732,286) | | $225,649,934 |
| Cash | | 39,177 |
| Receivable for investments sold | | 650,980 |
| Receivable for fund shares sold | | 126,467 |
| Distributions receivable from Fidelity Central Funds | | 752 |
| Total assets | | 226,467,310 |
| Liabilities | | |
| Payable for investments purchased | $478,467 | |
| Payable for fund shares redeemed | 299,385 | |
| Accrued management fee | 85,110 | |
| Distribution and service plan fees payable | 39,035 | |
| Payable for daily variation margin on futures contracts | 12,337 | |
| Total liabilities | | 914,334 |
| Net Assets | | $225,552,976 |
| Net Assets consist of: | | |
| Paid in capital | | $214,075,649 |
| Total distributable earnings (loss) | | 11,477,327 |
| Net Assets | | $225,552,976 |
| Net Asset Value and Maximum Offering Price | | |
| Class A: | | |
| Net Asset Value and redemption price per share ($69,817,049 ÷ 6,491,252 shares) | | $10.76 |
| Maximum offering price per share (100/94.25 of $10.76) | | $11.42 |
| Class M: | | |
| Net Asset Value and redemption price per share ($38,059,126 ÷ 3,542,035 shares) | | $10.74 |
| Maximum offering price per share (100/96.50 of $10.74) | | $11.13 |
| Class C: | | |
| Net Asset Value and offering price per share ($8,915,323 ÷ 831,256 shares)(a) | | $10.73 |
| Class I: | | |
| Net Asset Value, offering price and redemption price per share ($82,974,498 ÷ 7,688,793 shares) | | $10.79 |
| Class Z: | | |
| Net Asset Value, offering price and redemption price per share ($765,096 ÷ 70,931 shares) | | $10.79 |
| Class Z6: | | |
| Net Asset Value, offering price and redemption price per share ($25,021,884 ÷ 2,321,436 shares) | | $10.78 |
(a) Redemption price per share is equal to net asset value less any applicable contingent deferred sales charge.
See accompanying notes which are an integral part of the financial statements.
Statement of Operations
| | | Year ended March 31, 2019 |
| Investment Income | | |
| Dividends: | | |
| Affiliated issuers | | $5,704,731 |
| Interest | | 1,433 |
| Income from Fidelity Central Funds | | 3,957 |
| Total income | | 5,710,121 |
| Expenses | | |
| Management fee | $1,020,726 | |
| Distribution and service plan fees | 490,109 | |
| Independent trustees' fees and expenses | 1,046 | |
| Total expenses before reductions | 1,511,881 | |
| Expense reductions | (170) | |
| Total expenses after reductions | | 1,511,711 |
| Net investment income (loss) | | 4,198,410 |
| Realized and Unrealized Gain (Loss) | | |
| Net realized gain (loss) on: | | |
| Investment securities: | | |
| Unaffiliated issuers | 99 | |
| Fidelity Central Funds | (9) | |
| Other affiliated issuers | 2,574,300 | |
| Futures contracts | 101,100 | |
| Capital gain distributions from underlying funds: | | |
| Affiliated issuers | 3,699,593 | |
| Total net realized gain (loss) | | 6,375,083 |
| Change in net unrealized appreciation (depreciation) on: | | |
| Investment securities: | | |
| Unaffiliated issuers | 4 | |
| Affiliated issuers | (3,668,479) | |
| Futures contracts | (29,100) | |
| Total change in net unrealized appreciation (depreciation) | | (3,697,575) |
| Net gain (loss) | | 2,677,508 |
| Net increase (decrease) in net assets resulting from operations | | $6,875,918 |
See accompanying notes which are an integral part of the financial statements.
Statement of Changes in Net Assets
| | Year ended March 31, 2019 | Year ended March 31, 2018 |
| Increase (Decrease) in Net Assets | | |
| Operations | | |
| Net investment income (loss) | $4,198,410 | $3,029,100 |
| Net realized gain (loss) | 6,375,083 | 6,815,367 |
| Change in net unrealized appreciation (depreciation) | (3,697,575) | (240,746) |
| Net increase (decrease) in net assets resulting from operations | 6,875,918 | 9,603,721 |
| Distributions to shareholders | (11,867,536) | – |
| Distributions to shareholders from net investment income | – | (2,967,012) |
| Distributions to shareholders from net realized gain | – | (5,087,952) |
| Total distributions | (11,867,536) | (8,054,964) |
| Share transactions - net increase (decrease) | 17,057,074 | (10,830,864) |
| Total increase (decrease) in net assets | 12,065,456 | (9,282,107) |
| Net Assets | | |
| Beginning of period | 213,487,520 | 222,769,627 |
| End of period | $225,552,976 | $213,487,520 |
| Other Information | | |
| Undistributed net investment income end of period | | $253,088 |
See accompanying notes which are an integral part of the financial statements.
Financial Highlights
Fidelity Advisor Freedom Income Fund Class A
| Years ended March 31, | 2019 | 2018 | 2017 | 2016 | 2015 |
| Selected Per–Share Data | | | | | |
| Net asset value, beginning of period | $11.01 | $10.94 | $10.64 | $11.07 | $11.20 |
| Income from Investment Operations | | | | | |
| Net investment income (loss)A | .20 | .15 | .16 | .18 | .16 |
| Net realized and unrealized gain (loss) | .12 | .34 | .44 | (.25) | .24 |
| Total from investment operations | .32 | .49 | .60 | (.07) | .40 |
| Distributions from net investment income | (.19) | (.15) | (.16)B | (.18) | (.17) |
| Distributions from net realized gain | (.38) | (.26) | (.14)B | (.19) | (.36) |
| Total distributions | (.57) | (.42)C | (.30) | (.36)D | (.53) |
| Net asset value, end of period | $10.76 | $11.01 | $10.94 | $10.64 | $11.07 |
| Total ReturnE,F | 3.14% | 4.47% | 5.74% | (.59)% | 3.65% |
| Ratios to Average Net AssetsG,H | | | | | |
| Expenses before reductions | .71%I | .63% | .25% | .25% | .25% |
| Expenses net of fee waivers, if any | .71%I | .63% | .25% | .25% | .25% |
| Expenses net of all reductions | .71%I | .63% | .25% | .25% | .25% |
| Net investment income (loss) | 1.84% | 1.38% | 1.47% | 1.63% | 1.48% |
| Supplemental Data | | | | | |
| Net assets, end of period (000 omitted) | $69,817 | $76,141 | $87,983 | $99,211 | $124,755 |
| Portfolio turnover rateH | 36% | 21% | 38% | 30% | 38% |
A Calculated based on average shares outstanding during the period.
B The amounts shown reflect certain reclassifications related to book to tax differences that were made in the year shown.
C Total distributions of $.42 per share is comprised of distributions from net investment income of $.153 and distributions from net realized gain of $.263 per share.
D Total distributions of $.36 per share is comprised of distributions from net investment income of $.176 and distributions from net realized gain of $.187 per share.
E Total returns would have been lower if certain expenses had not been reduced during the applicable periods shown.
F Total returns do not include the effect of the sales charges.
G Expense ratios reflect operating expenses of the class. Expenses before reductions do not reflect amounts reimbursed by the investment adviser or reductions from expense offset arrangements and do not represent the amount paid by the class during periods when reimbursements or reductions occur. Expenses net of fee waivers reflect expenses after reimbursement by the investment adviser but prior to reductions from expense offset arrangements. Expenses net of all reductions represent the net expenses paid by the class but do not include expenses of the underlying funds in which the Fund invests.
H Amounts do not include the activity of the Underlying Funds.
I On certain classes, the size and fluctuation of net assets and expense amounts may cause ratios to differ from contractual rates.
See accompanying notes which are an integral part of the financial statements.
Fidelity Advisor Freedom Income Fund Class M
| Years ended March 31, | 2019 | 2018 | 2017 | 2016 | 2015 |
| Selected Per–Share Data | | | | | |
| Net asset value, beginning of period | $11.00 | $10.93 | $10.62 | $11.06 | $11.19 |
| Income from Investment Operations | | | | | |
| Net investment income (loss)A | .17 | .13 | .13 | .15 | .14 |
| Net realized and unrealized gain (loss) | .12 | .33 | .45 | (.25) | .23 |
| Total from investment operations | .29 | .46 | .58 | (.10) | .37 |
| Distributions from net investment income | (.17) | (.13) | (.13)B | (.15) | (.14) |
| Distributions from net realized gain | (.38) | (.26) | (.14)B | (.19) | (.36) |
| Total distributions | (.55) | (.39) | (.27) | (.34) | (.50) |
| Net asset value, end of period | $10.74 | $11.00 | $10.93 | $10.62 | $11.06 |
| Total ReturnC,D | 2.78% | 4.22% | 5.56% | (.93)% | 3.39% |
| Ratios to Average Net AssetsE,F | | | | | |
| Expenses before reductions | .96%G | .89% | .50% | .50% | .50% |
| Expenses net of fee waivers, if any | .96%G | .89% | .50% | .50% | .50% |
| Expenses net of all reductions | .96%G | .89% | .50% | .50% | .50% |
| Net investment income (loss) | 1.59% | 1.13% | 1.22% | 1.38% | 1.23% |
| Supplemental Data | | | | | |
| Net assets, end of period (000 omitted) | $38,059 | $38,204 | $38,513 | $42,887 | $47,804 |
| Portfolio turnover rateF | 36% | 21% | 38% | 30% | 38% |
A Calculated based on average shares outstanding during the period.
B The amounts shown reflect certain reclassifications related to book to tax differences that were made in the year shown.
C Total returns would have been lower if certain expenses had not been reduced during the applicable periods shown.
D Total returns do not include the effect of the sales charges.
E Expense ratios reflect operating expenses of the class. Expenses before reductions do not reflect amounts reimbursed by the investment adviser or reductions from expense offset arrangements and do not represent the amount paid by the class during periods when reimbursements or reductions occur. Expenses net of fee waivers reflect expenses after reimbursement by the investment adviser but prior to reductions from expense offset arrangements. Expenses net of all reductions represent the net expenses paid by the class but do not include expenses of the underlying funds in which the Fund invests.
F Amounts do not include the activity of the Underlying Funds.
G On certain classes, the size and fluctuation of net assets and expense amounts may cause ratios to differ from contractual rates.
See accompanying notes which are an integral part of the financial statements.
Fidelity Advisor Freedom Income Fund Class C
| Years ended March 31, | 2019 | 2018 | 2017 | 2016 | 2015 |
| Selected Per–Share Data | | | | | |
| Net asset value, beginning of period | $10.98 | $10.91 | $10.61 | $11.04 | $11.17 |
| Income from Investment Operations | | | | | |
| Net investment income (loss)A | .12 | .07 | .08 | .09 | .08 |
| Net realized and unrealized gain (loss) | .12 | .33 | .44 | (.24) | .24 |
| Total from investment operations | .24 | .40 | .52 | (.15) | .32 |
| Distributions from net investment income | (.11) | (.07) | (.08)B | (.10) | (.09) |
| Distributions from net realized gain | (.38) | (.26) | (.14)B | (.19) | (.36) |
| Total distributions | (.49) | (.33) | (.22) | (.28)C | (.45) |
| Net asset value, end of period | $10.73 | $10.98 | $10.91 | $10.61 | $11.04 |
| Total ReturnD,E | 2.35% | 3.69% | 4.99% | (1.35)% | 2.90% |
| Ratios to Average Net AssetsF,G | | | | | |
| Expenses before reductions | 1.46%H | 1.39% | 1.00% | 1.00% | 1.00% |
| Expenses net of fee waivers, if any | 1.46%H | 1.39% | 1.00% | 1.00% | 1.00% |
| Expenses net of all reductions | 1.46%H | 1.39% | 1.00% | 1.00% | 1.00% |
| Net investment income (loss) | 1.09% | .63% | .72% | .88% | .73% |
| Supplemental Data | | | | | |
| Net assets, end of period (000 omitted) | $8,915 | $13,727 | $14,434 | $14,712 | $15,780 |
| Portfolio turnover rateG | 36% | 21% | 38% | 30% | 38% |
A Calculated based on average shares outstanding during the period.
B The amounts shown reflect certain reclassifications related to book to tax differences that were made in the year shown.
C Total distributions of $.28 per share is comprised of distributions from net investment income of $.095 and distributions from net realized gain of $.187 per share.
D Total returns would have been lower if certain expenses had not been reduced during the applicable periods shown.
E Total returns do not include the effect of the contingent deferred sales charge.
F Expense ratios reflect operating expenses of the class. Expenses before reductions do not reflect amounts reimbursed by the investment adviser or reductions from expense offset arrangements and do not represent the amount paid by the class during periods when reimbursements or reductions occur. Expenses net of fee waivers reflect expenses after reimbursement by the investment adviser but prior to reductions from expense offset arrangements. Expenses net of all reductions represent the net expenses paid by the class but do not include expenses of the underlying funds in which the Fund invests.
G Amounts do not include the activity of the Underlying Funds.
H On certain classes, the size and fluctuation of net assets and expense amounts may cause ratios to differ from contractual rates.
See accompanying notes which are an integral part of the financial statements.
Fidelity Advisor Freedom Income Fund Class I
| Years ended March 31, | 2019 | 2018 | 2017 | 2016 | 2015 |
| Selected Per–Share Data | | | | | |
| Net asset value, beginning of period | $11.05 | $10.98 | $10.67 | $11.10 | $11.23 |
| Income from Investment Operations | | | | | |
| Net investment income (loss)A | .23 | .18 | .19 | .20 | .19 |
| Net realized and unrealized gain (loss) | .11 | .33 | .45 | (.24) | .24 |
| Total from investment operations | .34 | .51 | .64 | (.04) | .43 |
| Distributions from net investment income | (.22) | (.18) | (.19)B | (.20) | (.19) |
| Distributions from net realized gain | (.38) | (.26) | (.14)B | (.19) | (.36) |
| Total distributions | (.60) | (.44) | (.33) | (.39) | (.56)C |
| Net asset value, end of period | $10.79 | $11.05 | $10.98 | $10.67 | $11.10 |
| Total ReturnD | 3.30% | 4.70% | 6.07% | (.34)% | 3.89% |
| Ratios to Average Net AssetsE,F | | | | | |
| Expenses before reductions | .46%G | .39% | –%H | –%H | –%H |
| Expenses net of fee waivers, if any | .46%G | .39% | -% | -% | -% |
| Expenses net of all reductions | .46%G | .39% | -% | -% | -% |
| Net investment income (loss) | 2.09% | 1.63% | 1.72% | 1.88% | 1.73% |
| Supplemental Data | | | | | |
| Net assets, end of period (000 omitted) | $82,975 | $83,723 | $81,839 | $83,497 | $83,253 |
| Portfolio turnover rateF | 36% | 21% | 38% | 30% | 38% |
A Calculated based on average shares outstanding during the period.
B The amounts shown reflect certain reclassifications related to book to tax differences that were made in the year shown.
C Total distributions of $.56 per share is comprised of distributions from net investment income of $.194 and distributions from net realized gain of $.361 per share.
D Total returns would have been lower if certain expenses had not been reduced during the applicable periods shown.
E Expense ratios reflect operating expenses of the class. Expenses before reductions do not reflect amounts reimbursed by the investment adviser or reductions from expense offset arrangements and do not represent the amount paid by the class during periods when reimbursements or reductions occur. Expenses net of fee waivers reflect expenses after reimbursement by the investment adviser but prior to reductions from expense offset arrangements. Expenses net of all reductions represent the net expenses paid by the class but do not include expenses of the underlying funds in which the Fund invests.
F Amounts do not include the activity of the Underlying Funds.
G On certain classes, the size and fluctuation of net assets may cause rounding of expense amounts and ratios to differ from contractual rates.
H Amount represents less than .005%.
See accompanying notes which are an integral part of the financial statements.
Fidelity Advisor Freedom Income Fund Class Z
| Year ended March 31, | 2019 A |
| Selected Per–Share Data | |
| Net asset value, beginning of period | $10.91 |
| Income from Investment Operations | |
| Net investment income (loss)B | .24 |
| Net realized and unrealized gain (loss) | .01 |
| Total from investment operations | .25 |
| Distributions from net investment income | (.15) |
| Distributions from net realized gain | (.22) |
| Total distributions | (.37) |
| Net asset value, end of period | $10.79 |
| Total ReturnC,D | 2.47% |
| Ratios to Average Net AssetsE,F | |
| Expenses before reductions | .42%G |
| Expenses net of fee waivers, if any | .42%G |
| Expenses net of all reductions | .42%G |
| Net investment income (loss) | 4.60%G |
| Supplemental Data | |
| Net assets, end of period (000 omitted) | $765 |
| Portfolio turnover rateF | 36% |
A For the period October 2, 2018 (commencement of sale of shares) to March 31, 2019.
B Calculated based on average shares outstanding during the period.
C Total returns for periods of less than one year are not annualized.
D Total returns would have been lower if certain expenses had not been reduced during the applicable periods shown.
E Expense ratios reflect operating expenses of the class. Expenses before reductions do not reflect amounts reimbursed by the investment adviser or reductions from expense offset arrangements and do not represent the amount paid by the class during periods when reimbursements or reductions occur. Expense ratios before reductions for start-up periods may not be representative of longer-term operating periods. Expenses net of fee waivers reflect expenses after reimbursement by the investment adviser but prior to reductions from expense offset arrangements. Expenses net of all reductions represent the net expenses paid by the class but do not include expenses of the underlying funds in which the Fund invests.
F Amounts do not include the activity of the Underlying Funds.
G Annualized
See accompanying notes which are an integral part of the financial statements.
Fidelity Advisor Freedom Income Fund Class Z6
| Years ended March 31, | 2019 | 2018 A |
| Selected Per–Share Data | | |
| Net asset value, beginning of period | $11.04 | $11.09 |
| Income from Investment Operations | | |
| Net investment income (loss)B | .23 | .27 |
| Net realized and unrealized gain (loss) | .13 | .03 |
| Total from investment operations | .36 | .30 |
| Distributions from net investment income | (.24) | (.16) |
| Distributions from net realized gain | (.38) | (.19) |
| Total distributions | (.62) | (.35) |
| Net asset value, end of period | $10.78 | $11.04 |
| Total ReturnC,D | 3.48% | 2.69% |
| Ratios to Average Net AssetsE,F | | |
| Expenses before reductions | .37% | .37%G |
| Expenses net of fee waivers, if any | .37% | .37%G |
| Expenses net of all reductions | .37% | .37%G |
| Net investment income (loss) | 2.19% | 2.92%G |
| Supplemental Data | | |
| Net assets, end of period (000 omitted) | $25,022 | $1,693 |
| Portfolio turnover rateF | 36% | 21% |
A For the period June 6, 2017 (commencement of sale of shares) to March 31, 2018.
B Calculated based on average shares outstanding during the period.
C Total returns for periods of less than one year are not annualized.
D Total returns would have been lower if certain expenses had not been reduced during the applicable periods shown.
E Expense ratios reflect operating expenses of the class. Expenses before reductions do not reflect amounts reimbursed by the investment adviser or reductions from expense offset arrangements and do not represent the amount paid by the class during periods when reimbursements or reductions occur. Expenses net of fee waivers reflect expenses after reimbursement by the investment adviser but prior to reductions from expense offset arrangements. Expenses net of all reductions represent the net expenses paid by the class but do not include expenses of the underlying funds in which the Fund invests.
F Amounts do not include the activity of the Underlying Funds.
G Annualized
See accompanying notes which are an integral part of the financial statements.
Fidelity Advisor Freedom® 2005 Fund
Investment Summary (Unaudited)
The information in the following tables is based on the direct investments of the Fund.
Top Holdings as of March 31, 2019
| | % of fund's net assets |
| Fidelity Series Investment Grade Bond Fund | 34.2 |
| Fidelity Series Government Money Market Fund 2.50% | 14.9 |
| Fidelity Series Inflation-Protected Bond Index Fund | 11.3 |
| Fidelity Series Long-Term Treasury Bond Index Fund | 4.7 |
| Fidelity Series Emerging Markets Opportunities Fund | 4.3 |
| Fidelity Series Short-Term Credit Fund | 3.7 |
| Fidelity Series International Growth Fund | 3.1 |
| Fidelity Series International Value Fund | 3.0 |
| Fidelity Series Large Cap Stock Fund | 3.0 |
| Fidelity Series Commodity Strategy Fund | 2.3 |
| | 84.5 |
Asset Allocation (% of fund's net assets)
| Period end |
| | Domestic Equity Funds | 16.6% |
| | International Equity Funds | 11.9% |
| | Bond Funds | 52.6% |
| | Short-Term Funds | 18.9% |
| | Short-Term Investments | 0.1% |
| | Net Other Assets (Liabilities)* | (0.1)% |

* Net Other Assets (Liabilities) are not included in the pie chart
Domestic Equity Funds category includes Fidelity Series Commodity Strategy Fund which invests in commodity-related investments.
Fidelity Advisor Freedom® 2005 Fund
Schedule of Investments March 31, 2019
Showing Percentage of Net Assets
| U.S. Treasury Obligations - 0.1% | | | |
| | | Principal Amount | Value |
| U.S. Treasury Bills, yield at date of purchase 2.37% to 2.4% 4/4/19 to 5/30/19 (a) | | | |
| (Cost $99,828) | | 100,000 | 99,830 |
| | | Shares | Value |
|
| Domestic Equity Funds - 16.6% | | | |
| Fidelity Advisor Series Equity Growth Fund (b) | | 206,088 | $2,870,805 |
| Fidelity Advisor Series Growth Opportunities Fund (b) | | 134,276 | 1,941,632 |
| Fidelity Advisor Series Small Cap Fund (b) | | 125,584 | 1,316,124 |
| Fidelity Series All-Sector Equity Fund (b) | | 125,477 | 1,208,342 |
| Fidelity Series Commodity Strategy Fund (b) | | 791,908 | 3,777,399 |
| Fidelity Series Large Cap Stock Fund (b) | | 334,801 | 4,904,833 |
| Fidelity Series Large Cap Value Index Fund (b) | | 45,438 | 563,882 |
| Fidelity Series Opportunistic Insights Fund (b) | | 153,246 | 2,678,749 |
| Fidelity Series Small Cap Opportunities Fund (b) | | 125,609 | 1,690,691 |
| Fidelity Series Stock Selector Large Cap Value Fund (b) | | 273,194 | 3,223,692 |
| Fidelity Series Value Discovery Fund (b) | | 255,062 | 3,185,718 |
| TOTAL DOMESTIC EQUITY FUNDS | | | |
| (Cost $22,326,769) | | | 27,361,867 |
|
| International Equity Funds - 11.9% | | | |
| Fidelity Series Canada Fund (b) | | 47,626 | 491,028 |
| Fidelity Series Emerging Markets Fund (b) | | 76,343 | 747,394 |
| Fidelity Series Emerging Markets Opportunities Fund (b) | | 376,624 | 6,978,846 |
| Fidelity Series International Growth Fund (b) | | 338,426 | 5,140,697 |
| Fidelity Series International Small Cap Fund (b) | | 78,175 | 1,214,064 |
| Fidelity Series International Value Fund (b) | | 534,033 | 4,966,505 |
| TOTAL INTERNATIONAL EQUITY FUNDS | | | |
| (Cost $15,129,637) | | | 19,538,534 |
|
| Bond Funds - 52.6% | | | |
| Fidelity Series Emerging Markets Debt Fund (b) | | 135,195 | 1,296,523 |
| Fidelity Series Floating Rate High Income Fund (b) | | 30,339 | 281,244 |
| Fidelity Series High Income Fund (b) | | 151,308 | 1,422,298 |
| Fidelity Series Inflation-Protected Bond Index Fund (b) | | 1,895,741 | 18,540,350 |
| Fidelity Series International Credit Fund (b) | | 11,211 | 110,876 |
| Fidelity Series Investment Grade Bond Fund (b) | | 5,033,488 | 56,274,393 |
| Fidelity Series Long-Term Treasury Bond Index Fund (b) | | 874,937 | 7,760,695 |
| Fidelity Series Real Estate Income Fund (b) | | 75,316 | 821,696 |
| TOTAL BOND FUNDS | | | |
| (Cost $84,893,620) | | | 86,508,075 |
|
| Short-Term Funds - 18.9% | | | |
| Fidelity Cash Central Fund, 2.48% (c) | | 541,961 | 542,069 |
| Fidelity Series Government Money Market Fund 2.50%(b)(d) | | 24,410,293 | 24,410,293 |
| Fidelity Series Short-Term Credit Fund (b) | | 606,401 | 6,045,818 |
| TOTAL SHORT-TERM FUNDS | | | |
| (Cost $30,983,673) | | | 30,998,180 |
| TOTAL INVESTMENT IN SECURITIES - 100.1% | | | |
| (Cost $153,433,527) | | | 164,506,486 |
| NET OTHER ASSETS (LIABILITIES) - (0.1)% | | | (103,843) |
| NET ASSETS - 100% | | | $164,402,643 |
| Futures Contracts | | | | | |
| | Number of contracts | Expiration Date | Notional Amount | Value | Unrealized Appreciation/(Depreciation) |
| Purchased | | | | | |
| Treasury Contracts | | | | | |
| CBOT 2-Year U.S. Treasury Note Contracts (United States) | 1 | June 2019 | $213,094 | $928 | $928 |
| CBOT 5-Year U.S. Treasury Note Contracts (United States) | 2 | June 2019 | 231,656 | 2,637 | 2,637 |
| CBOT 10-Year U.S. Treasury Note Contracts (United States) | 1 | June 2019 | 124,219 | 2,310 | 2,310 |
|
| TOTAL PURCHASED | | | | | 5,875 |
|
| Sold | | | | | |
| Equity Index Contracts | | | | | |
| CME E-mini S&P 500 Index Contracts (United States) | 4 | June 2019 | 567,560 | (17,179) | (17,179) |
| ICE E-mini MSCI Emerging Markets Index Contracts (United States) | 8 | June 2019 | 422,960 | (7,889) | (7,889) |
|
| TOTAL SOLD | | | | | (25,068) |
|
| TOTAL FUTURES CONTRACTS | | | | | $(19,193) |
The notional amount of futures purchased as a percentage of Net Assets is 0.3%
The notional amount of futures sold as a percentage of Net Assets is 0.6%
Legend
(a) Security or a portion of the security was pledged to cover margin requirements for futures contracts. At period end, the value of securities pledged amounted to $99,830.
(b) Affiliated Fund
(c) Affiliated fund that is generally available only to investment companies and other accounts managed by Fidelity Investments. The rate quoted is the annualized seven-day yield of the fund at period end. A complete unaudited listing of the fund's holdings as of its most recent quarter end is available upon request. In addition, each Fidelity Central Fund's financial statements, which are not covered by the Fund's Report of Independent Registered Public Accounting Firm, are available on the SEC's website or upon request.
(d) The rate quoted is the annualized seven-day yield of the fund at period end.
Affiliated Central Funds
Information regarding fiscal year to date income earned by the Fund from investments in Fidelity Central Funds is as follows:
| Fund | Income earned |
| Fidelity Cash Central Fund | $4,451 |
| Total | $4,451 |
Amounts in the income column in the above table include any capital gain distributions from underlying funds, which are presented in the corresponding line-item in the Statement of Operations, if applicable.
Affiliated Underlying Funds
Fiscal year to date information regarding the Fund's investments in affiliated Underlying Funds, excluding any Money Market Central Funds, is presented below. Exchanges between classes of the same affiliated Underlying Funds may occur.
| Affiliate | Value, beginning of period | Purchases | Sales Proceeds | Dividend Income | Realized Gain (loss) | Change in Unrealized appreciation (depreciation) | Value, end of period |
| Fidelity Advisor Series Equity Growth Fund | $4,047,155 | $463,115 | $1,851,434 | $229,875 | $400,326 | $(188,357) | $2,870,805 |
| Fidelity Advisor Series Equity Value Fund | 4,664,011 | 288,144 | 1,141,903 | 127,066 | 217,350 | (924,480) | -- |
| Fidelity Advisor Series Growth & Income Fund | 7,130,190 | 795,871 | 1,935,101 | 545,543 | 186,602 | (1,576,253) | -- |
| Fidelity Advisor Series Growth Opportunities Fund | 2,658,831 | 515,964 | 1,662,540 | 362,521 | 501,313 | (71,936) | 1,941,632 |
| Fidelity Advisor Series Opportunistic Insights Fund | 3,789,230 | 371,465 | 1,101,674 | 241,244 | 419,267 | (1,614,751) | -- |
| Fidelity Advisor Series Small Cap Fund | 2,027,176 | 243,033 | 812,165 | 128,499 | 107,966 | (249,886) | 1,316,124 |
| Fidelity Advisor Series Stock Selector Large Cap Value Fund | 4,707,725 | 482,249 | 1,160,459 | 322,638 | 216,415 | (929,438) | -- |
| Fidelity Series 100 Index Fund | 2,007,990 | -- | 2,088,591 | -- | 1,070,909 | (990,308) | -- |
| Fidelity Series All-Sector Equity Fund | 2,777,333 | 465,768 | 1,915,836 | 326,776 | 361,831 | (480,754) | 1,208,342 |
| Fidelity Series Canada Fund | 653,217 | 79,782 | 251,001 | 11,919 | (4,199) | 13,229 | 491,028 |
| Fidelity Series Commodity Strategy Fund | 4,089,262 | 1,487,154 | 1,313,254 | 255,517 | (534,790) | 49,027 | 3,777,399 |
| Fidelity Series Emerging Markets Debt Fund | 1,503,577 | 154,781 | 285,487 | 84,232 | (16,350) | (59,998) | 1,296,523 |
| Fidelity Series Emerging Markets Fund | -- | 877,709 | 131,031 | 3,198 | (5,709) | 6,425 | 747,394 |
| Fidelity Series Emerging Markets Opportunities Fund | 7,766,630 | 2,180,430 | 1,802,427 | 589,533 | 14,849 | (1,180,636) | 6,978,846 |
| Fidelity Series Floating Rate High Income Fund | 475,597 | 52,175 | 236,704 | 25,273 | (14,153) | 4,329 | 281,244 |
| Fidelity Series Government Money Market Fund 2.50% | 35,857,816 | 6,521,511 | 17,969,034 | 615,231 | -- | -- | 24,410,293 |
| Fidelity Series High Income Fund | 2,929,758 | 303,899 | 1,775,811 | 152,414 | (51,005) | 15,457 | 1,422,298 |
| Fidelity Series Inflation-Protected Bond Index Fund | 6,471,850 | 16,418,879 | 4,403,911 | 340,119 | (110,304) | 163,836 | 18,540,350 |
| Fidelity Series International Credit Fund | 105,791 | 5,362 | -- | 5,362 | -- | (277) | 110,876 |
| Fidelity Series International Growth Fund | 6,768,564 | 1,467,550 | 2,749,453 | 365,818 | 484,115 | (830,079) | 5,140,697 |
| Fidelity Series International Small Cap Fund | 1,676,957 | 391,340 | 624,538 | 115,621 | 133,376 | (363,071) | 1,214,064 |
| Fidelity Series International Value Fund | 6,654,429 | 1,156,312 | 2,117,422 | 199,342 | 92,366 | (819,180) | 4,966,505 |
| Fidelity Series Investment Grade Bond Fund | 67,757,886 | 6,180,988 | 18,298,115 | 2,009,308 | (391,383) | 1,025,017 | 56,274,393 |
| Fidelity Series Large Cap Stock Fund | -- | 389,643 | 1,155,419 | 226,464 | 63,422 | 1,005,878 | 4,904,833 |
| Fidelity Series Large Cap Value Index Fund | 789,577 | 73,158 | 310,397 | 28,372 | 51,145 | (39,601) | 563,882 |
| Fidelity Series Long-Term Treasury Bond Index Fund | 4,133,151 | 6,302,964 | 2,981,348 | 197,849 | (107,894) | 413,822 | 7,760,695 |
| Fidelity Series Opportunistic Insights Fund | -- | 341,748 | 581,149 | 243,155 | (18,220) | 1,072,833 | 2,678,749 |
| Fidelity Series Real Estate Equity Fund | 486,818 | 4,826 | 508,792 | 4,181 | 91,368 | (74,220) | -- |
| Fidelity Series Real Estate Income Fund | 922,555 | 120,537 | 234,103 | 65,288 | 6,210 | 6,497 | 821,696 |
| Fidelity Series Short-Term Credit Fund | 8,765,987 | 669,744 | 3,455,597 | 189,758 | (35,838) | 101,522 | 6,045,818 |
| Fidelity Series Small Cap Opportunities Fund | 2,472,892 | 367,500 | 1,071,994 | 225,845 | 305,512 | (383,219) | 1,690,691 |
| Fidelity Series Stock Selector Large Cap Value Fund | -- | 417,745 | 778,262 | 308,665 | (15,364) | 283,081 | 3,223,692 |
| Fidelity Series Value Discovery Fund | -- | 323,360 | 736,998 | 218,459 | 32,855 | 463,379 | 3,185,718 |
| | $194,091,955 | $49,914,706 | $77,441,950 | $8,765,085 | $3,451,988 | $(6,152,112) | $163,864,587 |
Amounts in the income column in the above table include any capital gain distributions from underlying funds, which are presented in the corresponding line-item in the Statement of Operations, if applicable.
Investment Valuation
The following is a summary of the inputs used, as of March 31, 2019, involving the Fund's assets and liabilities carried at fair value. The inputs or methodology used for valuing securities may not be an indication of the risk associated with investing in those securities. For more information on valuation inputs, and their aggregation into the levels used below, please refer to the Investment Valuation section in the accompanying Notes to Financial Statements.
| | Valuation Inputs at Reporting Date: |
| Description | Total | Level 1 | Level 2 | Level 3 |
| Investments in Securities: | | | | |
| Other Short-Term Investments | $99,830 | $-- | $99,830 | $-- |
| Domestic Equity Funds | 27,361,867 | 27,361,867 | -- | -- |
| International Equity Funds | 19,538,534 | 19,538,534 | -- | -- |
| Bond Funds | 86,508,075 | 86,508,075 | -- | -- |
| Short-Term Funds | 30,998,180 | 30,998,180 | -- | -- |
| Total Investments in Securities: | $164,506,486 | $164,406,656 | $99,830 | $-- |
| Derivative Instruments: | | | | |
| Assets | | | | |
| Futures Contracts | $5,875 | $5,875 | $-- | $-- |
| Total Assets | $5,875 | $5,875 | $-- | $-- |
| Liabilities | | | | |
| Futures Contracts | $(25,068) | $(25,068) | $-- | $-- |
| Total Liabilities | $(25,068) | $(25,068) | $-- | $-- |
| Total Derivative Instruments: | $(19,193) | $(19,193) | $-- | $-- |
Value of Derivative Instruments
The following table is a summary of the Fund's value of derivative instruments by primary risk exposure as of March 31, 2019. For additional information on derivative instruments, please refer to the Derivative Instruments section in the accompanying Notes to Financial Statements.
| Primary Risk Exposure / Derivative Type | Value |
| | Asset | Liability |
| Equity Risk | | |
| Futures Contracts(a) | $0 | $(25,068) |
| Total Equity Risk | 0 | (25,068) |
| Interest Rate Risk | | |
| Futures Contracts(a) | 5,875 | 0 |
| Total Interest Rate Risk | 5,875 | 0 |
| Total Value of Derivatives | $5,875 | $(25,068) |
(a) Reflects gross cumulative appreciation (depreciation) on futures contracts as presented in the Schedule of Investments. In the Statement of Assets and Liabilities, the period end daily variation margin is included in receivable or payable for daily variation margin on futures contracts, and the net cumulative appreciation (depreciation) is included in distributable earnings.
See accompanying notes which are an integral part of the financial statements.
Fidelity Advisor Freedom® 2005 Fund
Financial Statements
Statement of Assets and Liabilities
| | | March 31, 2019 |
| Assets | | |
Investment in securities, at value — See accompanying schedule:
Unaffiliated issuers (cost $99,828) | $99,830 | |
| Fidelity Central Funds (cost $542,069) | 542,069 | |
| Other affiliated issuers (cost $152,791,630) | 163,864,587 | |
| Total Investment in Securities (cost $153,433,527) | | $164,506,486 |
| Cash | | 5,604 |
| Receivable for investments sold | | 1,064,854 |
| Receivable for fund shares sold | | 104,621 |
| Distributions receivable from Fidelity Central Funds | | 1,060 |
| Total assets | | 165,682,625 |
| Liabilities | | |
| Payable for investments purchased | $1,108,160 | |
| Payable for fund shares redeemed | 61,134 | |
| Accrued management fee | 65,457 | |
| Distribution and service plan fees payable | 30,576 | |
| Payable for daily variation margin on futures contracts | 14,655 | |
| Total liabilities | | 1,279,982 |
| Net Assets | | $164,402,643 |
| Net Assets consist of: | | |
| Paid in capital | | $151,037,513 |
| Total distributable earnings (loss) | | 13,365,130 |
| Net Assets | | $164,402,643 |
| Net Asset Value and Maximum Offering Price | | |
| Class A: | | |
| Net Asset Value and redemption price per share ($86,981,131 ÷ 7,656,152 shares) | | $11.36 |
| Maximum offering price per share (100/94.25 of $11.36) | | $12.05 |
| Class M: | | |
| Net Asset Value and redemption price per share ($24,131,667 ÷ 2,126,980 shares) | | $11.35 |
| Maximum offering price per share (100/96.50 of $11.35) | | $11.76 |
| Class C: | | |
| Net Asset Value and offering price per share ($2,301,851 ÷ 202,722 shares)(a) | | $11.35 |
| Class I: | | |
| Net Asset Value, offering price and redemption price per share ($49,013,206 ÷ 4,282,200 shares) | | $11.45 |
| Class Z: | | |
| Net Asset Value, offering price and redemption price per share ($125,842 ÷ 11,029 shares) | | $11.41 |
| Class Z6: | | |
| Net Asset Value, offering price and redemption price per share ($1,848,946 ÷ 161,888 shares) | | $11.42 |
(a) Redemption price per share is equal to net asset value less any applicable contingent deferred sales charge.
See accompanying notes which are an integral part of the financial statements.
Statement of Operations
| | | Year ended March 31, 2019 |
| Investment Income | | |
| Dividends: | | |
| Affiliated issuers | | $4,563,680 |
| Interest | | 1,370 |
| Income from Fidelity Central Funds | | 4,451 |
| Total income | | 4,569,501 |
| Expenses | | |
| Management fee | $865,687 | |
| Distribution and service plan fees | 404,414 | |
| Independent trustees' fees and expenses | 869 | |
| Total expenses before reductions | 1,270,970 | |
| Expense reductions | (150) | |
| Total expenses after reductions | | 1,270,820 |
| Net investment income (loss) | | 3,298,681 |
| Realized and Unrealized Gain (Loss) | | |
| Net realized gain (loss) on: | | |
| Investment securities: | | |
| Unaffiliated issuers | 148 | |
| Fidelity Central Funds | (10) | |
| Other affiliated issuers | 3,451,988 | |
| Futures contracts | 129,290 | |
| Capital gain distributions from underlying funds: | | |
| Affiliated issuers | 4,201,405 | |
| Total net realized gain (loss) | | 7,782,821 |
| Change in net unrealized appreciation (depreciation) on: | | |
| Investment securities: | | |
| Unaffiliated issuers | 3 | |
| Affiliated issuers | (6,152,112) | |
| Futures contracts | (19,193) | |
| Total change in net unrealized appreciation (depreciation) | | (6,171,302) |
| Net gain (loss) | | 1,611,519 |
| Net increase (decrease) in net assets resulting from operations | | $4,910,200 |
See accompanying notes which are an integral part of the financial statements.
Statement of Changes in Net Assets
| | Year ended March 31, 2019 | Year ended March 31, 2018 |
| Increase (Decrease) in Net Assets | | |
| Operations | | |
| Net investment income (loss) | $3,298,681 | $2,777,359 |
| Net realized gain (loss) | 7,782,821 | 9,885,530 |
| Change in net unrealized appreciation (depreciation) | (6,171,302) | (528,591) |
| Net increase (decrease) in net assets resulting from operations | 4,910,200 | 12,134,298 |
| Distributions to shareholders | (13,484,722) | – |
| Distributions to shareholders from net investment income | – | (2,811,909) |
| Distributions to shareholders from net realized gain | – | (7,338,936) |
| Total distributions | (13,484,722) | (10,150,845) |
| Share transactions - net increase (decrease) | (21,054,341) | (18,509,645) |
| Total increase (decrease) in net assets | (29,628,863) | (16,526,192) |
| Net Assets | | |
| Beginning of period | 194,031,506 | 210,557,698 |
| End of period | $164,402,643 | $194,031,506 |
| Other Information | | |
| Undistributed net investment income end of period | | $383,515 |
See accompanying notes which are an integral part of the financial statements.
Financial Highlights
Fidelity Advisor Freedom 2005 Fund Class A
| Years ended March 31, | 2019 | 2018 | 2017 | 2016 | 2015 |
| Selected Per–Share Data | | | | | |
| Net asset value, beginning of period | $11.92 | $11.84 | $11.44 | $12.10 | $12.17 |
| Income from Investment Operations | | | | | |
| Net investment income (loss)A | .21 | .16 | .17 | .19 | .19 |
| Net realized and unrealized gain (loss) | .14 | .53 | .67 | (.34) | .36 |
| Total from investment operations | .35 | .69 | .84 | (.15) | .55 |
| Distributions from net investment income | (.22) | (.17) | (.19)B | (.20) | (.19) |
| Distributions from net realized gain | (.68) | (.44) | (.25)B | (.32) | (.42) |
| Total distributions | (.91)C | (.61) | (.44) | (.51)D | (.62)E |
| Net asset value, end of period | $11.36 | $11.92 | $11.84 | $11.44 | $12.10 |
| Total ReturnF,G | 3.24% | 5.87% | 7.55% | (1.23)% | 4.60% |
| Ratios to Average Net AssetsH,I | | | | | |
| Expenses before reductions | .73% | .66% | .25% | .25% | .25% |
| Expenses net of fee waivers, if any | .73% | .66% | .25% | .25% | .25% |
| Expenses net of all reductions | .73% | .66% | .25% | .25% | .25% |
| Net investment income (loss) | 1.80% | 1.34% | 1.46% | 1.62% | 1.54% |
| Supplemental Data | | | | | |
| Net assets, end of period (000 omitted) | $86,981 | $101,642 | $118,902 | $134,262 | $162,069 |
| Portfolio turnover rateI | 28% | 20% | 32% | 30% | 29% |
A Calculated based on average shares outstanding during the period.
B The amounts shown reflect certain reclassifications related to book to tax differences that were made in the year shown.
C Total distributions of $.91 per share is comprised of distributions from net investment income of $.222 and distributions from net realized gain of $.683 per share.
D Total distributions of $.51 per share is comprised of distributions from net investment income of $.196 and distributions from net realized gain of $.317 per share.
E Total distributions of $.62 per share is comprised of distributions from net investment income of $.193 and distributions from net realized gain of $.423 per share.
F Total returns would have been lower if certain expenses had not been reduced during the applicable periods shown.
G Total returns do not include the effect of the sales charges.
H Expense ratios reflect operating expenses of the class. Expenses before reductions do not reflect amounts reimbursed by the investment adviser or reductions from expense offset arrangements and do not represent the amount paid by the class during periods when reimbursements or reductions occur. Expenses net of fee waivers reflect expenses after reimbursement by the investment adviser but prior to reductions from expense offset arrangements. Expenses net of all reductions represent the net expenses paid by the class but do not include expenses of the underlying funds in which the Fund invests.
I Amounts do not include the activity of the Underlying Funds.
See accompanying notes which are an integral part of the financial statements.
Fidelity Advisor Freedom 2005 Fund Class M
| Years ended March 31, | 2019 | 2018 | 2017 | 2016 | 2015 |
| Selected Per–Share Data | | | | | |
| Net asset value, beginning of period | $11.91 | $11.83 | $11.43 | $12.09 | $12.16 |
| Income from Investment Operations | | | | | |
| Net investment income (loss)A | .18 | .13 | .14 | .16 | .16 |
| Net realized and unrealized gain (loss) | .14 | .53 | .67 | (.33) | .35 |
| Total from investment operations | .32 | .66 | .81 | (.17) | .51 |
| Distributions from net investment income | (.19) | (.14) | (.16)B | (.17) | (.16) |
| Distributions from net realized gain | (.68) | (.44) | (.25)B | (.32) | (.42) |
| Total distributions | (.88)C | (.58) | (.41) | (.49) | (.58) |
| Net asset value, end of period | $11.35 | $11.91 | $11.83 | $11.43 | $12.09 |
| Total ReturnD,E | 2.98% | 5.64% | 7.29% | (1.45)% | 4.33% |
| Ratios to Average Net AssetsF,G | | | | | |
| Expenses before reductions | .98% | .91% | .50% | .50% | .50% |
| Expenses net of fee waivers, if any | .98% | .91% | .50% | .50% | .50% |
| Expenses net of all reductions | .98% | .91% | .50% | .50% | .50% |
| Net investment income (loss) | 1.55% | 1.08% | 1.21% | 1.37% | 1.29% |
| Supplemental Data | | | | | |
| Net assets, end of period (000 omitted) | $24,132 | $25,730 | $27,091 | $29,347 | $29,246 |
| Portfolio turnover rateG | 28% | 20% | 32% | 30% | 29% |
A Calculated based on average shares outstanding during the period.
B The amounts shown reflect certain reclassifications related to book to tax differences that were made in the year shown.
C Total distributions of $.88 per share is comprised of distributions from net investment income of $.193 and distributions from net realized gain of $.683 per share.
D Total returns would have been lower if certain expenses had not been reduced during the applicable periods shown.
E Total returns do not include the effect of the sales charges.
F Expense ratios reflect operating expenses of the class. Expenses before reductions do not reflect amounts reimbursed by the investment adviser or reductions from expense offset arrangements and do not represent the amount paid by the class during periods when reimbursements or reductions occur. Expenses net of fee waivers reflect expenses after reimbursement by the investment adviser but prior to reductions from expense offset arrangements. Expenses net of all reductions represent the net expenses paid by the class but do not include expenses of the underlying funds in which the Fund invests.
G Amounts do not include the activity of the Underlying Funds.
See accompanying notes which are an integral part of the financial statements.
Fidelity Advisor Freedom 2005 Fund Class C
| Years ended March 31, | 2019 | 2018 | 2017 | 2016 | 2015 |
| Selected Per–Share Data | | | | | |
| Net asset value, beginning of period | $11.91 | $11.81 | $11.41 | $12.06 | $12.14 |
| Income from Investment Operations | | | | | |
| Net investment income (loss)A | .12 | .07 | .08 | .10 | .10 |
| Net realized and unrealized gain (loss) | .13 | .54 | .67 | (.33) | .34 |
| Total from investment operations | .25 | .61 | .75 | (.23) | .44 |
| Distributions from net investment income | (.12) | (.07) | (.10)B | (.10) | (.10) |
| Distributions from net realized gain | (.68) | (.44) | (.25)B | (.32) | (.42) |
| Total distributions | (.81)C | (.51) | (.35) | (.42) | (.52) |
| Net asset value, end of period | $11.35 | $11.91 | $11.81 | $11.41 | $12.06 |
| Total ReturnD,E | 2.35% | 5.21% | 6.75% | (1.98)% | 3.73% |
| Ratios to Average Net AssetsF,G | | | | | |
| Expenses before reductions | 1.48% | 1.41% | 1.00% | 1.00% | 1.00% |
| Expenses net of fee waivers, if any | 1.48% | 1.41% | 1.00% | 1.00% | 1.00% |
| Expenses net of all reductions | 1.48% | 1.41% | 1.00% | 1.00% | 1.00% |
| Net investment income (loss) | 1.05% | .58% | .71% | .87% | .79% |
| Supplemental Data | | | | | |
| Net assets, end of period (000 omitted) | $2,302 | $5,867 | $5,623 | $6,200 | $7,410 |
| Portfolio turnover rateG | 28% | 20% | 32% | 30% | 29% |
A Calculated based on average shares outstanding during the period.
B The amounts shown reflect certain reclassifications related to book to tax differences that were made in the year shown.
C Total distributions of $.81 per share is comprised of distributions from net investment income of $.124 and distributions from net realized gain of $.683 per share.
D Total returns would have been lower if certain expenses had not been reduced during the applicable periods shown.
E Total returns do not include the effect of the contingent deferred sales charge.
F Expense ratios reflect operating expenses of the class. Expenses before reductions do not reflect amounts reimbursed by the investment adviser or reductions from expense offset arrangements and do not represent the amount paid by the class during periods when reimbursements or reductions occur. Expenses net of fee waivers reflect expenses after reimbursement by the investment adviser but prior to reductions from expense offset arrangements. Expenses net of all reductions represent the net expenses paid by the class but do not include expenses of the underlying funds in which the Fund invests.
G Amounts do not include the activity of the Underlying Funds.
See accompanying notes which are an integral part of the financial statements.
Fidelity Advisor Freedom 2005 Fund Class I
| Years ended March 31, | 2019 | 2018 | 2017 | 2016 | 2015 |
| Selected Per–Share Data | | | | | |
| Net asset value, beginning of period | $12.00 | $11.92 | $11.51 | $12.18 | $12.25 |
| Income from Investment Operations | | | | | |
| Net investment income (loss)A | .24 | .19 | .20 | .22 | .22 |
| Net realized and unrealized gain (loss) | .14 | .54 | .68 | (.34) | .36 |
| Total from investment operations | .38 | .73 | .88 | (.12) | .58 |
| Distributions from net investment income | (.25) | (.20) | (.22)B | (.23) | (.23) |
| Distributions from net realized gain | (.68) | (.44) | (.25)B | (.32) | (.42) |
| Total distributions | (.93) | (.65)C | (.47) | (.55) | (.65) |
| Net asset value, end of period | $11.45 | $12.00 | $11.92 | $11.51 | $12.18 |
| Total ReturnD | 3.53% | 6.13% | 7.87% | (1.04)% | 4.85% |
| Ratios to Average Net AssetsE,F | | | | | |
| Expenses before reductions | .48% | .41% | –%G | –%G | –%G |
| Expenses net of fee waivers, if any | .48% | .41% | -% | -% | -% |
| Expenses net of all reductions | .48% | .41% | -% | -% | -% |
| Net investment income (loss) | 2.05% | 1.58% | 1.71% | 1.87% | 1.79% |
| Supplemental Data | | | | | |
| Net assets, end of period (000 omitted) | $49,013 | $59,386 | $58,940 | $61,440 | $66,255 |
| Portfolio turnover rateF | 28% | 20% | 32% | 30% | 29% |
A Calculated based on average shares outstanding during the period.
B The amounts shown reflect certain reclassifications related to book to tax differences that were made in the year shown.
C Total distributions of $.65 per share is comprised of distributions from net investment income of $.203 and distributions from net realized gain of $.443 per share.
D Total returns would have been lower if certain expenses had not been reduced during the applicable periods shown.
E Expense ratios reflect operating expenses of the class. Expenses before reductions do not reflect amounts reimbursed by the investment adviser or reductions from expense offset arrangements and do not represent the amount paid by the class during periods when reimbursements or reductions occur. Expenses net of fee waivers reflect expenses after reimbursement by the investment adviser but prior to reductions from expense offset arrangements. Expenses net of all reductions represent the net expenses paid by the class but do not include expenses of the underlying funds in which the Fund invests.
F Amounts do not include the activity of the Underlying Funds.
G Amount represents less than .005%.
See accompanying notes which are an integral part of the financial statements.
Fidelity Advisor Freedom 2005 Fund Class Z
| Year ended March 31, | 2019 A |
| Selected Per–Share Data | |
| Net asset value, beginning of period | $11.84 |
| Income from Investment Operations | |
| Net investment income (loss)B | .20 |
| Net realized and unrealized gain (loss) | .01 |
| Total from investment operations | .21 |
| Distributions from net investment income | (.26) |
| Distributions from net realized gain | (.39) |
| Total distributions | (.64)C |
| Net asset value, end of period | $11.41 |
| Total ReturnD,E | 2.09% |
| Ratios to Average Net AssetsF,G | |
| Expenses before reductions | .43%H |
| Expenses net of fee waivers, if any | .43%H |
| Expenses net of all reductions | .43%H |
| Net investment income (loss) | 3.58%H |
| Supplemental Data | |
| Net assets, end of period (000 omitted) | $126 |
| Portfolio turnover rateG | 28% |
A For the period October 2, 2018 (commencement of sale of shares) to March 31, 2019.
B Calculated based on average shares outstanding during the period.
C Total distributions of $.64 per share is comprised of distributions from net investment income of $.256 and distributions from net realized gain of $.385 per share.
D Total returns for periods of less than one year are not annualized.
E Total returns would have been lower if certain expenses had not been reduced during the applicable periods shown.
F Expense ratios reflect operating expenses of the class. Expenses before reductions do not reflect amounts reimbursed by the investment adviser or reductions from expense offset arrangements and do not represent the amount paid by the class during periods when reimbursements or reductions occur. Expense ratios before reductions for start-up periods may not be representative of longer-term operating periods. Expenses net of fee waivers reflect expenses after reimbursement by the investment adviser but prior to reductions from expense offset arrangements. Expenses net of all reductions represent the net expenses paid by the class but do not include expenses of the underlying funds in which the Fund invests.
G Amounts do not include the activity of the Underlying Funds.
H Annualized
See accompanying notes which are an integral part of the financial statements.
Fidelity Advisor Freedom 2005 Fund Class Z6
| Years ended March 31, | 2019 | 2018 A |
| Selected Per–Share Data | | |
| Net asset value, beginning of period | $12.00 | $12.04 |
| Income from Investment Operations | | |
| Net investment income (loss)B | .25 | .13 |
| Net realized and unrealized gain (loss) | .13 | .33 |
| Total from investment operations | .38 | .46 |
| Distributions from net investment income | (.28) | (.19) |
| Distributions from net realized gain | (.68) | (.31) |
| Total distributions | (.96) | (.50) |
| Net asset value, end of period | $11.42 | $12.00 |
| Total ReturnC,D | 3.53% | 3.78% |
| Ratios to Average Net AssetsE,F | | |
| Expenses before reductions | .37% | .39%G,H |
| Expenses net of fee waivers, if any | .37% | .39%G,H |
| Expenses net of all reductions | .37% | .39%G,H |
| Net investment income (loss) | 2.16% | 1.30%G |
| Supplemental Data | | |
| Net assets, end of period (000 omitted) | $1,849 | $1,408 |
| Portfolio turnover rateF | 28% | 20% |
A For the period June 6, 2017 (commencement of sale of shares) to March 31, 2018.
B Calculated based on average shares outstanding during the period.
C Total returns for periods of less than one year are not annualized.
D Total returns would have been lower if certain expenses had not been reduced during the applicable periods shown.
E Expense ratios reflect operating expenses of the class. Expenses before reductions do not reflect amounts reimbursed by the investment adviser or reductions from expense offset arrangements and do not represent the amount paid by the class during periods when reimbursements or reductions occur. Expenses net of fee waivers reflect expenses after reimbursement by the investment adviser but prior to reductions from expense offset arrangements. Expenses net of all reductions represent the net expenses paid by the class but do not include expenses of the underlying funds in which the Fund invests.
F Amounts do not include the activity of the Underlying Funds.
G Annualized
H On certain classes, the size and fluctuation of net assets and expense amounts may cause ratios to differ from contractual rates.
See accompanying notes which are an integral part of the financial statements.
Fidelity Advisor Freedom® 2010 Fund
Investment Summary (Unaudited)
The information in the following tables is based on the direct investments of the Fund.
Top Holdings as of March 31, 2019
| | % of fund's net assets |
| Fidelity Series Investment Grade Bond Fund | 30.5 |
| Fidelity Series Government Money Market Fund 2.50% | 11.7 |
| Fidelity Series Inflation-Protected Bond Index Fund | 9.2 |
| Fidelity Series Emerging Markets Opportunities Fund | 5.2 |
| Fidelity Series Long-Term Treasury Bond Index Fund | 4.9 |
| Fidelity Series Large Cap Stock Fund | 4.3 |
| Fidelity Series International Growth Fund | 4.0 |
| Fidelity Series International Value Fund | 3.9 |
| Fidelity Series Short-Term Credit Fund | 2.9 |
| Fidelity Series Stock Selector Large Cap Value Fund | 2.8 |
| | 79.4 |
Asset Allocation (% of fund's net assets)
| Period end |
| | Domestic Equity Funds | 23.1% |
| | International Equity Funds | 15.0% |
| | Bond Funds | 47.0% |
| | Short-Term Funds | 14.9% |
| | Short-Term Investments | 0.1% |
| | Net Other Assets (Liabilities)* | (0.1)% |

* Net Other Assets (Liabilities) are not included in the pie chart
Domestic Equity Funds category includes Fidelity Series Commodity Strategy Fund which invests in commodity-related investments.
Fidelity Advisor Freedom® 2010 Fund
Schedule of Investments March 31, 2019
Showing Percentage of Net Assets
| U.S. Treasury Obligations - 0.1% | | | |
| | | Principal Amount | Value |
| U.S. Treasury Bills, yield at date of purchase 2.37% to 2.4% 4/4/19 to 6/27/19 (a) | | | |
| (Cost $289,465) | | 290,000 | 289,472 |
| | | Shares | Value |
|
| Domestic Equity Funds - 23.1% | | | |
| Fidelity Advisor Series Equity Growth Fund (b) | | 760,200 | $10,589,589 |
| Fidelity Advisor Series Growth Opportunities Fund (b) | | 492,327 | 7,119,050 |
| Fidelity Advisor Series Small Cap Fund (b) | | 459,076 | 4,811,119 |
| Fidelity Series All-Sector Equity Fund (b) | | 503,801 | 4,851,607 |
| Fidelity Series Commodity Strategy Fund (b) | | 2,029,112 | 9,678,863 |
| Fidelity Series Large Cap Stock Fund (b) | | 1,241,392 | 18,186,395 |
| Fidelity Series Large Cap Value Index Fund (b) | | 164,183 | 2,037,509 |
| Fidelity Series Opportunistic Insights Fund (b) | | 564,876 | 9,874,029 |
| Fidelity Series Small Cap Opportunities Fund (b) | | 458,453 | 6,170,773 |
| Fidelity Series Stock Selector Large Cap Value Fund (b) | | 1,009,182 | 11,908,348 |
| Fidelity Series Value Discovery Fund (b) | | 942,103 | 11,766,870 |
| TOTAL DOMESTIC EQUITY FUNDS | | | |
| (Cost $79,496,625) | | | 96,994,152 |
|
| International Equity Funds - 15.0% | | | |
| Fidelity Series Canada Fund (b) | | 168,267 | 1,734,835 |
| Fidelity Series Emerging Markets Fund (b) | | 235,788 | 2,308,362 |
| Fidelity Series Emerging Markets Opportunities Fund (b) | | 1,173,467 | 21,744,347 |
| Fidelity Series International Growth Fund (b) | | 1,113,255 | 16,910,342 |
| Fidelity Series International Small Cap Fund (b) | | 253,952 | 3,943,868 |
| Fidelity Series International Value Fund (b) | | 1,746,865 | 16,245,843 |
| TOTAL INTERNATIONAL EQUITY FUNDS | | | |
| (Cost $50,199,451) | | | 62,887,597 |
|
| Bond Funds - 47.0% | | | |
| Fidelity Series Emerging Markets Debt Fund (b) | | 338,392 | 3,245,175 |
| Fidelity Series Floating Rate High Income Fund (b) | | 77,461 | 718,068 |
| Fidelity Series High Income Fund (b) | | 391,018 | 3,675,571 |
| Fidelity Series Inflation-Protected Bond Index Fund (b) | | 3,946,610 | 38,597,841 |
| Fidelity Series International Credit Fund (b) | | 26,943 | 266,462 |
| Fidelity Series Investment Grade Bond Fund (b) | | 11,459,793 | 128,120,489 |
| Fidelity Series Long-Term Treasury Bond Index Fund (b) | | 2,327,545 | 20,645,323 |
| Fidelity Series Real Estate Income Fund (b) | | 191,620 | 2,090,573 |
| TOTAL BOND FUNDS | | | |
| (Cost $193,168,484) | | | 197,359,502 |
|
| Short-Term Funds - 14.9% | | | |
| Fidelity Cash Central Fund, 2.48% (c) | | 1,345,363 | 1,345,632 |
| Fidelity Series Government Money Market Fund 2.50%(b)(d) | | 49,067,687 | 49,067,687 |
| Fidelity Series Short-Term Credit Fund (b) | | 1,218,631 | 12,149,751 |
| TOTAL SHORT-TERM FUNDS | | | |
| (Cost $62,546,163) | | | 62,563,070 |
| TOTAL INVESTMENT IN SECURITIES - 100.1% | | | |
| (Cost $385,700,188) | | | 420,093,793 |
| NET OTHER ASSETS (LIABILITIES) - (0.1)% | | | (297,641) |
| NET ASSETS - 100% | | | $419,796,152 |
| Futures Contracts | | | | | |
| | Number of contracts | Expiration Date | Notional Amount | Value | Unrealized Appreciation/(Depreciation) |
| Purchased | | | | | |
| Treasury Contracts | | | | | |
| CBOT 2-Year U.S. Treasury Note Contracts (United States) | 2 | June 2019 | $426,188 | $1,857 | $1,857 |
| CBOT 5-Year U.S. Treasury Note Contracts (United States) | 5 | June 2019 | 579,141 | 6,592 | 6,592 |
| CBOT 10-Year U.S. Treasury Note Contracts (United States) | 4 | June 2019 | 496,875 | 9,241 | 9,241 |
| CBOT Long Term U.S. Treasury Bond Contracts (United States) | 1 | June 2019 | 149,656 | 5,248 | 5,248 |
| CBOT Ultra Long Term U.S. Treasury Bond Contracts (United States) | 1 | June 2019 | 168,000 | 8,361 | 8,361 |
|
| TOTAL PURCHASED | | | | | 31,299 |
|
| Sold | | | | | |
| Equity Index Contracts | | | | | |
| CME E-mini S&P 500 Index Contracts (United States) | 10 | June 2019 | 1,418,900 | (42,947) | (42,947) |
| ICE E-mini MSCI EAFE Index Contracts (United States) | 3 | June 2019 | 279,960 | (5,917) | (5,917) |
| ICE E-mini MSCI Emerging Markets Index Contracts (United States) | 26 | June 2019 | 1,374,620 | (25,631) | (25,631) |
|
| TOTAL SOLD | | | | | (74,495) |
|
| TOTAL FUTURES CONTRACTS | | | | | $(43,196) |
The notional amount of futures purchased as a percentage of Net Assets is 0.4%
The notional amount of futures sold as a percentage of Net Assets is 0.7%
Legend
(a) Security or a portion of the security was pledged to cover margin requirements for futures contracts. At period end, the value of securities pledged amounted to $289,472.
(b) Affiliated Fund
(c) Affiliated fund that is generally available only to investment companies and other accounts managed by Fidelity Investments. The rate quoted is the annualized seven-day yield of the fund at period end. A complete unaudited listing of the fund's holdings as of its most recent quarter end is available upon request. In addition, each Fidelity Central Fund's financial statements, which are not covered by the Fund's Report of Independent Registered Public Accounting Firm, are available on the SEC's website or upon request.
(d) The rate quoted is the annualized seven-day yield of the fund at period end.
Affiliated Central Funds
Information regarding fiscal year to date income earned by the Fund from investments in Fidelity Central Funds is as follows:
| Fund | Income earned |
| Fidelity Cash Central Fund | $11,446 |
| Total | $11,446 |
Amounts in the income column in the above table include any capital gain distributions from underlying funds, which are presented in the corresponding line-item in the Statement of Operations, if applicable.
Affiliated Underlying Funds
Fiscal year to date information regarding the Fund's investments in affiliated Underlying Funds, excluding any Money Market Central Funds, is presented below. Exchanges between classes of the same affiliated Underlying Funds may occur.
| Affiliate | Value, beginning of period | Purchases | Sales Proceeds | Dividend Income | Realized Gain (loss) | Change in Unrealized appreciation (depreciation) | Value, end of period |
| Fidelity Advisor Series Equity Growth Fund | $13,023,682 | $1,204,593 | $4,322,035 | $836,873 | $907,666 | $(224,317) | $10,589,589 |
| Fidelity Advisor Series Equity Value Fund | 15,002,185 | 588,925 | 2,706,061 | 429,392 | 527,009 | (2,940,962) | -- |
| Fidelity Advisor Series Growth & Income Fund | 22,959,845 | 2,050,281 | 4,728,607 | 1,821,607 | 237,531 | (5,119,432) | -- |
| Fidelity Advisor Series Growth Opportunities Fund | 8,558,055 | 1,560,939 | 4,386,780 | 1,317,894 | 1,370,204 | 16,632 | 7,119,050 |
| Fidelity Advisor Series Opportunistic Insights Fund | 12,165,303 | 935,874 | 2,712,466 | 815,065 | 1,050,228 | (5,161,232) | -- |
| Fidelity Advisor Series Small Cap Fund | 6,526,055 | 649,456 | 1,873,098 | 470,423 | 266,068 | (757,362) | 4,811,119 |
| Fidelity Advisor Series Stock Selector Large Cap Value Fund | 15,144,178 | 1,233,923 | 2,700,278 | 1,088,543 | 548,007 | (2,987,555) | -- |
| Fidelity Series 100 Index Fund | 6,480,007 | -- | 6,717,475 | -- | 2,651,504 | (2,414,036) | -- |
| Fidelity Series All-Sector Equity Fund | 8,936,502 | 1,759,721 | 5,314,592 | 1,231,845 | 1,016,500 | (1,546,524) | 4,851,607 |
| Fidelity Series Canada Fund | 1,983,826 | 263,185 | 554,621 | 39,319 | 534 | 41,911 | 1,734,835 |
| Fidelity Series Commodity Strategy Fund | 10,008,890 | 3,513,172 | 2,674,440 | 611,522 | (1,204,304) | 35,545 | 9,678,863 |
| Fidelity Series Emerging Markets Debt Fund | 3,656,577 | 288,780 | 520,847 | 204,881 | (21,156) | (158,179) | 3,245,175 |
| Fidelity Series Emerging Markets Fund | -- | 2,507,048 | 226,903 | 9,385 | (4,579) | 32,796 | 2,308,362 |
| Fidelity Series Emerging Markets Opportunities Fund | 23,275,501 | 6,007,174 | 4,199,167 | 1,742,494 | 113,909 | (3,453,070) | 21,744,347 |
| Fidelity Series Floating Rate High Income Fund | 1,152,519 | 89,914 | 501,583 | 61,620 | (28,662) | 5,880 | 718,068 |
| Fidelity Series Government Money Market Fund 2.50% | 68,838,813 | 11,046,513 | 30,817,639 | 1,195,034 | -- | -- | 49,067,687 |
| Fidelity Series High Income Fund | 7,117,769 | 551,261 | 3,917,717 | 375,068 | (212,876) | 137,134 | 3,675,571 |
| Fidelity Series Inflation-Protected Bond Index Fund | 12,966,248 | 31,571,257 | 6,075,771 | 705,163 | (177,199) | 313,306 | 38,597,841 |
| Fidelity Series International Credit Fund | 254,240 | 12,887 | -- | 12,886 | -- | (665) | 266,462 |
| Fidelity Series International Growth Fund | 20,582,564 | 3,680,229 | 6,417,944 | 1,127,984 | 1,348,172 | (2,282,679) | 16,910,342 |
| Fidelity Series International Small Cap Fund | 5,097,991 | 997,629 | 1,452,128 | 365,059 | 335,586 | (1,035,210) | 3,943,868 |
| Fidelity Series International Value Fund | 20,222,495 | 2,604,810 | 4,413,432 | 616,140 | 312,357 | (2,480,387) | 16,245,843 |
| Fidelity Series Investment Grade Bond Fund | 150,574,589 | 9,785,812 | 33,824,628 | 4,433,433 | (825,780) | 2,410,496 | 128,120,489 |
| Fidelity Series Large Cap Stock Fund | -- | 1,193,823 | 2,237,698 | 777,541 | (1,951) | 3,832,603 | 18,186,395 |
| Fidelity Series Large Cap Value Index Fund | 2,542,533 | 169,184 | 715,167 | 97,979 | 126,369 | (85,410) | 2,037,509 |
| Fidelity Series Long-Term Treasury Bond Index Fund | 10,266,228 | 14,712,751 | 5,161,638 | 514,366 | (162,338) | 990,320 | 20,645,323 |
| Fidelity Series Opportunistic Insights Fund | -- | 1,201,695 | 1,238,681 | 848,350 | (91,207) | 3,724,515 | 9,874,029 |
| Fidelity Series Real Estate Equity Fund | 1,572,454 | 13,344 | 1,630,379 | 11,220 | 280,305 | (235,724) | -- |
| Fidelity Series Real Estate Income Fund | 2,235,813 | 223,650 | 407,425 | 157,900 | 14,425 | 24,110 | 2,090,573 |
| Fidelity Series Short-Term Credit Fund | 16,750,769 | 811,962 | 5,546,656 | 365,918 | (61,677) | 195,353 | 12,149,751 |
| Fidelity Series Small Cap Opportunities Fund | 7,960,899 | 989,264 | 2,519,957 | 766,976 | 634,673 | (894,106) | 6,170,773 |
| Fidelity Series Stock Selector Large Cap Value Fund | -- | 1,339,818 | 1,612,623 | 1,065,774 | (75,721) | 1,018,599 | 11,908,348 |
| Fidelity Series Value Discovery Fund | -- | 1,017,878 | 1,434,982 | 750,498 | 15,549 | 1,697,329 | 11,766,870 |
| | $475,856,530 | $104,576,752 | $153,563,418 | $24,868,152 | $8,889,146 | $(17,300,321) | $418,458,689 |
Amounts in the income column in the above table include any capital gain distributions from underlying funds, which are presented in the corresponding line-item in the Statement of Operations, if applicable.
Investment Valuation
The following is a summary of the inputs used, as of March 31, 2019, involving the Fund's assets and liabilities carried at fair value. The inputs or methodology used for valuing securities may not be an indication of the risk associated with investing in those securities. For more information on valuation inputs, and their aggregation into the levels used below, please refer to the Investment Valuation section in the accompanying Notes to Financial Statements.
| | Valuation Inputs at Reporting Date: |
| Description | Total | Level 1 | Level 2 | Level 3 |
| Investments in Securities: | | | | |
| Other Short-Term Investments | $289,472 | $-- | $289,472 | $-- |
| Domestic Equity Funds | 96,994,152 | 96,994,152 | -- | -- |
| International Equity Funds | 62,887,597 | 62,887,597 | -- | -- |
| Bond Funds | 197,359,502 | 197,359,502 | -- | -- |
| Short-Term Funds | 62,563,070 | 62,563,070 | -- | -- |
| Total Investments in Securities: | $420,093,793 | $419,804,321 | $289,472 | $-- |
| Derivative Instruments: | | | | |
| Assets | | | | |
| Futures Contracts | $31,299 | $31,299 | $-- | $-- |
| Total Assets | $31,299 | $31,299 | $-- | $-- |
| Liabilities | | | | |
| Futures Contracts | $(74,495) | $(74,495) | $-- | $-- |
| Total Liabilities | $(74,495) | $(74,495) | $-- | $-- |
| Total Derivative Instruments: | $(43,196) | $(43,196) | $-- | $-- |
Value of Derivative Instruments
The following table is a summary of the Fund's value of derivative instruments by primary risk exposure as of March 31, 2019. For additional information on derivative instruments, please refer to the Derivative Instruments section in the accompanying Notes to Financial Statements.
| Primary Risk Exposure / Derivative Type | Value |
| | Asset | Liability |
| Equity Risk | | |
| Futures Contracts(a) | $0 | $(74,495) |
| Total Equity Risk | 0 | (74,495) |
| Interest Rate Risk | | |
| Futures Contracts(a) | 31,299 | 0 |
| Total Interest Rate Risk | 31,299 | 0 |
| Total Value of Derivatives | $31,299 | $(74,495) |
(a) Reflects gross cumulative appreciation (depreciation) on futures contracts as presented in the Schedule of Investments. In the Statement of Assets and Liabilities, the period end daily variation margin is included in receivable or payable for daily variation margin on futures contracts, and the net cumulative appreciation (depreciation) is included in distributable earnings.
See accompanying notes which are an integral part of the financial statements.
Fidelity Advisor Freedom® 2010 Fund
Financial Statements
Statement of Assets and Liabilities
| | | March 31, 2019 |
| Assets | | |
Investment in securities, at value — See accompanying schedule:
Unaffiliated issuers (cost $289,465) | $289,472 | |
| Fidelity Central Funds (cost $1,345,632) | 1,345,632 | |
| Other affiliated issuers (cost $384,065,091) | 418,458,689 | |
| Total Investment in Securities (cost $385,700,188) | | $420,093,793 |
| Cash | | 14,912 |
| Receivable for investments sold | | 3,114,671 |
| Receivable for fund shares sold | | 276,567 |
| Distributions receivable from Fidelity Central Funds | | 2,706 |
| Total assets | | 423,502,649 |
| Liabilities | | |
| Payable for investments purchased | $2,271,555 | |
| Payable for fund shares redeemed | 1,125,230 | |
| Accrued management fee | 182,253 | |
| Distribution and service plan fees payable | 83,778 | |
| Payable for daily variation margin on futures contracts | 43,681 | |
| Total liabilities | | 3,706,497 |
| Net Assets | | $419,796,152 |
| Net Assets consist of: | | |
| Paid in capital | | $377,210,976 |
| Total distributable earnings (loss) | | 42,585,176 |
| Net Assets | | $419,796,152 |
| Net Asset Value and Maximum Offering Price | | |
| Class A: | | |
| Net Asset Value and redemption price per share ($198,632,972 ÷ 16,863,186 shares) | | $11.78 |
| Maximum offering price per share (100/94.25 of $11.78) | | $12.50 |
| Class M: | | |
| Net Asset Value and redemption price per share ($71,678,766 ÷ 6,112,812 shares) | | $11.73 |
| Maximum offering price per share (100/96.50 of $11.73) | | $12.16 |
| Class C: | | |
| Net Asset Value and offering price per share ($10,765,081 ÷ 922,876 shares)(a) | | $11.66 |
| Class I: | | |
| Net Asset Value, offering price and redemption price per share ($131,896,459 ÷ 11,154,996 shares) | | $11.82 |
| Class Z: | | |
| Net Asset Value, offering price and redemption price per share ($257,144 ÷ 21,820 shares) | | $11.78 |
| Class Z6: | | |
| Net Asset Value, offering price and redemption price per share ($6,565,730 ÷ 556,108 shares) | | $11.81 |
(a) Redemption price per share is equal to net asset value less any applicable contingent deferred sales charge.
See accompanying notes which are an integral part of the financial statements.
Statement of Operations
| | | Year ended March 31, 2019 |
| Investment Income | | |
| Dividends: | | |
| Affiliated issuers | | $11,176,904 |
| Interest | | 3,852 |
| Income from Fidelity Central Funds | | 11,446 |
| Total income | | 11,192,202 |
| Expenses | | |
| Management fee | $2,312,077 | |
| Distribution and service plan fees | 1,105,228 | |
| Independent trustees' fees and expenses | 2,125 | |
| Total expenses before reductions | 3,419,430 | |
| Expense reductions | (237) | |
| Total expenses after reductions | | 3,419,193 |
| Net investment income (loss) | | 7,773,009 |
| Realized and Unrealized Gain (Loss) | | |
| Net realized gain (loss) on: | | |
| Investment securities: | | |
| Unaffiliated issuers | 471 | |
| Fidelity Central Funds | (24) | |
| Other affiliated issuers | 8,889,146 | |
| Futures contracts | 404,436 | |
| Capital gain distributions from underlying funds: | | |
| Affiliated issuers | 13,691,248 | |
| Total net realized gain (loss) | | 22,985,277 |
| Change in net unrealized appreciation (depreciation) on: | | |
| Investment securities: | | |
| Unaffiliated issuers | 10 | |
| Affiliated issuers | (17,300,321) | |
| Futures contracts | (43,196) | |
| Total change in net unrealized appreciation (depreciation) | | (17,343,507) |
| Net gain (loss) | | 5,641,770 |
| Net increase (decrease) in net assets resulting from operations | | $13,414,779 |
See accompanying notes which are an integral part of the financial statements.
Statement of Changes in Net Assets
| | Year ended March 31, 2019 | Year ended March 31, 2018 |
| Increase (Decrease) in Net Assets | | |
| Operations | | |
| Net investment income (loss) | $7,773,009 | $6,311,536 |
| Net realized gain (loss) | 22,985,277 | 29,999,898 |
| Change in net unrealized appreciation (depreciation) | (17,343,507) | (1,539,645) |
| Net increase (decrease) in net assets resulting from operations | 13,414,779 | 34,771,789 |
| Distributions to shareholders | (36,141,003) | – |
| Distributions to shareholders from net investment income | – | (6,662,107) |
| Distributions to shareholders from net realized gain | – | (24,206,337) |
| Total distributions | (36,141,003) | (30,868,444) |
| Share transactions - net increase (decrease) | (33,088,521) | (36,175,930) |
| Total increase (decrease) in net assets | (55,814,745) | (32,272,585) |
| Net Assets | | |
| Beginning of period | 475,610,897 | 507,883,482 |
| End of period | $419,796,152 | $475,610,897 |
| Other Information | | |
| Undistributed net investment income end of period | | $640,647 |
See accompanying notes which are an integral part of the financial statements.
Financial Highlights
Fidelity Advisor Freedom 2010 Fund Class A
| Years ended March 31, | 2019 | 2018 | 2017 | 2016 | 2015 |
| Selected Per–Share Data | | | | | |
| Net asset value, beginning of period | $12.42 | $12.34 | $11.87 | $12.72 | $12.91 |
| Income from Investment Operations | | | | | |
| Net investment income (loss)A | .21 | .16 | .18 | .20 | .20 |
| Net realized and unrealized gain (loss) | .15 | .72 | .84 | (.41) | .44 |
| Total from investment operations | .36 | .88 | 1.02 | (.21) | .64 |
| Distributions from net investment income | (.21) | (.17) | (.19) | (.21) | (.22) |
| Distributions from net realized gain | (.79) | (.62) | (.36) | (.44) | (.61) |
| Total distributions | (1.00) | (.80)B | (.55) | (.64)C | (.83) |
| Net asset value, end of period | $11.78 | $12.42 | $12.34 | $11.87 | $12.72 |
| Total ReturnD,E | 3.28% | 7.18% | 8.87% | (1.67)% | 5.08% |
| Ratios to Average Net AssetsF,G | | | | | |
| Expenses before reductions | .77%H | .69% | .25% | .25% | .25% |
| Expenses net of fee waivers, if any | .77%H | .69% | .25% | .25% | .25% |
| Expenses net of all reductions | .77%H | .69% | .25% | .25% | .25% |
| Net investment income (loss) | 1.75% | 1.29% | 1.45% | 1.63% | 1.55% |
| Supplemental Data | | | | | |
| Net assets, end of period (000 omitted) | $198,633 | $230,553 | $263,496 | $328,232 | $431,498 |
| Portfolio turnover rateG | 24% | 20% | 26% | 21% | 22% |
A Calculated based on average shares outstanding during the period.
B Total distributions of $.80 per share is comprised of distributions from net investment income of $.173 and distributions from net realized gain of $.624 per share.
C Total distributions of $.64 per share is comprised of distributions from net investment income of $.206 and distributions from net realized gain of $.437 per share.
D Total returns would have been lower if certain expenses had not been reduced during the applicable periods shown.
E Total returns do not include the effect of the sales charges.
F Expense ratios reflect operating expenses of the class. Expenses before reductions do not reflect amounts reimbursed by the investment adviser or reductions from expense offset arrangements and do not represent the amount paid by the class during periods when reimbursements or reductions occur. Expenses net of fee waivers reflect expenses after reimbursement by the investment adviser but prior to reductions from expense offset arrangements. Expenses net of all reductions represent the net expenses paid by the class but do not include expenses of the underlying funds in which the Fund invests.
G Amounts do not include the activity of the Underlying Funds.
H On certain classes, the size and fluctuation of net assets and expense amounts may cause ratios to differ from contractual rates.
See accompanying notes which are an integral part of the financial statements.
Fidelity Advisor Freedom 2010 Fund Class M
| Years ended March 31, | 2019 | 2018 | 2017 | 2016 | 2015 |
| Selected Per–Share Data | | | | | |
| Net asset value, beginning of period | $12.37 | $12.30 | $11.83 | $12.68 | $12.87 |
| Income from Investment Operations | | | | | |
| Net investment income (loss)A | .18 | .13 | .14 | .17 | .17 |
| Net realized and unrealized gain (loss) | .15 | .71 | .85 | (.41) | .43 |
| Total from investment operations | .33 | .84 | .99 | (.24) | .60 |
| Distributions from net investment income | (.18) | (.15) | (.16) | (.18) | (.18) |
| Distributions from net realized gain | (.79) | (.62) | (.36) | (.44) | (.61) |
| Total distributions | (.97) | (.77) | (.52) | (.61)B | (.79) |
| Net asset value, end of period | $11.73 | $12.37 | $12.30 | $11.83 | $12.68 |
| Total ReturnC,D | 3.06% | 6.89% | 8.63% | (1.92)% | 4.81% |
| Ratios to Average Net AssetsE,F | | | | | |
| Expenses before reductions | 1.02%G | .94% | .50% | .50% | .50% |
| Expenses net of fee waivers, if any | 1.02%G | .94% | .50% | .50% | .50% |
| Expenses net of all reductions | 1.02%G | .94% | .50% | .50% | .50% |
| Net investment income (loss) | 1.50% | 1.03% | 1.20% | 1.38% | 1.30% |
| Supplemental Data | | | | | |
| Net assets, end of period (000 omitted) | $71,679 | $77,068 | $83,881 | $92,543 | $106,189 |
| Portfolio turnover rateF | 24% | 20% | 26% | 21% | 22% |
A Calculated based on average shares outstanding during the period.
B Total distributions of $.61 per share is comprised of distributions from net investment income of $.176 and distributions from net realized gain of $.437 per share.
C Total returns would have been lower if certain expenses had not been reduced during the applicable periods shown.
D Total returns do not include the effect of the sales charges.
E Expense ratios reflect operating expenses of the class. Expenses before reductions do not reflect amounts reimbursed by the investment adviser or reductions from expense offset arrangements and do not represent the amount paid by the class during periods when reimbursements or reductions occur. Expenses net of fee waivers reflect expenses after reimbursement by the investment adviser but prior to reductions from expense offset arrangements. Expenses net of all reductions represent the net expenses paid by the class but do not include expenses of the underlying funds in which the Fund invests.
F Amounts do not include the activity of the Underlying Funds.
G On certain classes, the size and fluctuation of net assets and expense amounts may cause ratios to differ from contractual rates.
See accompanying notes which are an integral part of the financial statements.
Fidelity Advisor Freedom 2010 Fund Class C
| Years ended March 31, | 2019 | 2018 | 2017 | 2016 | 2015 |
| Selected Per–Share Data | | | | | |
| Net asset value, beginning of period | $12.29 | $12.22 | $11.76 | $12.60 | $12.79 |
| Income from Investment Operations | | | | | |
| Net investment income (loss)A | .12 | .07 | .08 | .11 | .10 |
| Net realized and unrealized gain (loss) | .14 | .70 | .84 | (.40) | .44 |
| Total from investment operations | .26 | .77 | .92 | (.29) | .54 |
| Distributions from net investment income | (.11) | (.08) | (.10) | (.11) | (.12) |
| Distributions from net realized gain | (.78) | (.62) | (.36) | (.44) | (.61) |
| Total distributions | (.89) | (.70) | (.46) | (.55) | (.73) |
| Net asset value, end of period | $11.66 | $12.29 | $12.22 | $11.76 | $12.60 |
| Total ReturnB,C | 2.45% | 6.37% | 8.07% | (2.39)% | 4.33% |
| Ratios to Average Net AssetsD,E | | | | | |
| Expenses before reductions | 1.52%F | 1.44% | 1.00% | 1.00% | 1.00% |
| Expenses net of fee waivers, if any | 1.52%F | 1.44% | 1.00% | 1.00% | 1.00% |
| Expenses net of all reductions | 1.52%F | 1.44% | 1.00% | 1.00% | 1.00% |
| Net investment income (loss) | 1.00% | .54% | .70% | .88% | .80% |
| Supplemental Data | | | | | |
| Net assets, end of period (000 omitted) | $10,765 | $26,227 | $29,290 | $30,150 | $34,839 |
| Portfolio turnover rateE | 24% | 20% | 26% | 21% | 22% |
A Calculated based on average shares outstanding during the period.
B Total returns would have been lower if certain expenses had not been reduced during the applicable periods shown.
C Total returns do not include the effect of the contingent deferred sales charge.
D Expense ratios reflect operating expenses of the class. Expenses before reductions do not reflect amounts reimbursed by the investment adviser or reductions from expense offset arrangements and do not represent the amount paid by the class during periods when reimbursements or reductions occur. Expenses net of fee waivers reflect expenses after reimbursement by the investment adviser but prior to reductions from expense offset arrangements. Expenses net of all reductions represent the net expenses paid by the class but do not include expenses of the underlying funds in which the Fund invests.
E Amounts do not include the activity of the Underlying Funds.
F On certain classes, the size and fluctuation of net assets and expense amounts may cause ratios to differ from contractual rates.
See accompanying notes which are an integral part of the financial statements.
Fidelity Advisor Freedom 2010 Fund Class I
| Years ended March 31, | 2019 | 2018 | 2017 | 2016 | 2015 |
| Selected Per–Share Data | | | | | |
| Net asset value, beginning of period | $12.47 | $12.40 | $11.92 | $12.77 | $12.96 |
| Income from Investment Operations | | | | | |
| Net investment income (loss)A | .24 | .19 | .21 | .23 | .23 |
| Net realized and unrealized gain (loss) | .14 | .72 | .85 | (.40) | .44 |
| Total from investment operations | .38 | .91 | 1.06 | (.17) | .67 |
| Distributions from net investment income | (.25) | (.21) | (.22) | (.24) | (.25) |
| Distributions from net realized gain | (.79) | (.62) | (.36) | (.44) | (.61) |
| Total distributions | (1.03)B | (.84)C | (.58) | (.68) | (.86) |
| Net asset value, end of period | $11.82 | $12.47 | $12.40 | $11.92 | $12.77 |
| Total ReturnD | 3.50% | 7.39% | 9.22% | (1.40)% | 5.34% |
| Ratios to Average Net AssetsE,F | | | | | |
| Expenses before reductions | .52%G | .45% | –%H | –%H | –%H |
| Expenses net of fee waivers, if any | .52%G | .45% | -% | -% | -% |
| Expenses net of all reductions | .52%G | .45% | -% | -% | -% |
| Net investment income (loss) | 2.00% | 1.53% | 1.70% | 1.88% | 1.80% |
| Supplemental Data | | | | | |
| Net assets, end of period (000 omitted) | $131,896 | $137,019 | $131,216 | $143,715 | $158,071 |
| Portfolio turnover rateF | 24% | 20% | 26% | 21% | 22% |
A Calculated based on average shares outstanding during the period.
B Total distributions of $1.03 per share is comprised of distributions from net investment income of $.245 and distributions from net realized gain of $.788 per share.
C Total distributions of $.84 per share is comprised of distributions from net investment income of $.212 and distributions from net realized gain of $.624 per share.
D Total returns would have been lower if certain expenses had not been reduced during the applicable periods shown.
E Expense ratios reflect operating expenses of the class. Expenses before reductions do not reflect amounts reimbursed by the investment adviser or reductions from expense offset arrangements and do not represent the amount paid by the class during periods when reimbursements or reductions occur. Expenses net of fee waivers reflect expenses after reimbursement by the investment adviser but prior to reductions from expense offset arrangements. Expenses net of all reductions represent the net expenses paid by the class but do not include expenses of the underlying funds in which the Fund invests.
F Amounts do not include the activity of the Underlying Funds.
G On certain classes, the size and fluctuation of net assets and expense amounts may cause ratios to differ from contractual rates.
H Amount represents less than .005% per share.
See accompanying notes which are an integral part of the financial statements.
Fidelity Advisor Freedom 2010 Fund Class Z
| Year ended March 31, | 2019 A |
| Selected Per–Share Data | |
| Net asset value, beginning of period | $12.30 |
| Income from Investment Operations | |
| Net investment income (loss)B | .27 |
| Net realized and unrealized gain (loss) | (.11)C |
| Total from investment operations | .16 |
| Distributions from net investment income | (.26) |
| Distributions from net realized gain | (.42) |
| Total distributions | (.68) |
| Net asset value, end of period | $11.78 |
| Total ReturnD,E | 1.65% |
| Ratios to Average Net AssetsF,G | |
| Expenses before reductions | .47%H,I |
| Expenses net of fee waivers, if any | .47%H,I |
| Expenses net of all reductions | .47%H,I |
| Net investment income (loss) | 4.58%H |
| Supplemental Data | |
| Net assets, end of period (000 omitted) | $257 |
| Portfolio turnover rateG | 24% |
A For the period October 2, 2018 (commencement of sale of shares) to March 31, 2019.
B Calculated based on average shares outstanding during the period.
C The amount shown for a share outstanding does not correspond with the aggregate net gain (loss) on investments for the period due to the timing of sales and repurchases of shares in relation to fluctuating market values of the investments of the Fund.
D Total returns for periods of less than one year are not annualized.
E Total returns would have been lower if certain expenses had not been reduced during the applicable periods shown.
F Expense ratios reflect operating expenses of the class. Expenses before reductions do not reflect amounts reimbursed by the investment adviser or reductions from expense offset arrangements and do not represent the amount paid by the class during periods when reimbursements or reductions occur. Expense ratios before reductions for start-up periods may not be representative of longer-term operating periods. Expenses net of fee waivers reflect expenses after reimbursement by the investment adviser but prior to reductions from expense offset arrangements. Expenses net of all reductions represent the net expenses paid by the class but do not include expenses of the underlying funds in which the Fund invests.
G Amounts do not include the activity of the Underlying Funds.
H Annualized
I On certain classes, the size and fluctuation of net assets and expense amounts may cause ratios to differ from contractual rates.
See accompanying notes which are an integral part of the financial statements.
Fidelity Advisor Freedom 2010 Fund Class Z6
| Years ended March 31, | 2019 | 2018 A |
| Selected Per–Share Data | | |
| Net asset value, beginning of period | $12.47 | $12.50 |
| Income from Investment Operations | | |
| Net investment income (loss)B�� | .25 | .05 |
| Net realized and unrealized gain (loss) | .15 | .53 |
| Total from investment operations | .40 | .58 |
| Distributions from net investment income | (.27) | (.20) |
| Distributions from net realized gain | (.79) | (.42) |
| Total distributions | (1.06) | (.61)C |
| Net asset value, end of period | $11.81 | $12.47 |
| Total ReturnD,E | 3.66% | 4.62% |
| Ratios to Average Net AssetsF,G | | |
| Expenses before reductions | .39% | .41%H,I |
| Expenses net of fee waivers, if any | .39% | .41%H,I |
| Expenses net of all reductions | .39% | .41%H,I |
| Net investment income (loss) | 2.13% | .45%H |
| Supplemental Data | | |
| Net assets, end of period (000 omitted) | $6,566 | $4,744 |
| Portfolio turnover rateG | 24% | 20% |
A For the period June 6, 2017 (commencement of sale of shares) to March 31, 2018.
B Calculated based on average shares outstanding during the period.
C Total distributions of $.61 per share is comprised of distributions from net investment income of $.195 and distributions from net realized gain of $.416 per share.
D Total returns for periods of less than one year are not annualized.
E Total returns would have been lower if certain expenses had not been reduced during the applicable periods shown.
F Expense ratios reflect operating expenses of the class. Expenses before reductions do not reflect amounts reimbursed by the investment adviser or reductions from expense offset arrangements and do not represent the amount paid by the class during periods when reimbursements or reductions occur. Expenses net of fee waivers reflect expenses after reimbursement by the investment adviser but prior to reductions from expense offset arrangements. Expenses net of all reductions represent the net expenses paid by the class but do not include expenses of the underlying funds in which the Fund invests.
G Amounts do not include the activity of the Underlying Funds.
H Annualized
I On certain classes, the size and fluctuation of net assets may cause rounding of expense amounts and ratios to differ from contractual rates.
See accompanying notes which are an integral part of the financial statements.
Fidelity Advisor Freedom® 2015 Fund
Investment Summary (Unaudited)
The information in the following tables is based on the direct investments of the Fund.
Top Holdings as of March 31, 2019
| | % of fund's net assets |
| Fidelity Series Investment Grade Bond Fund | 26.7 |
| Fidelity Series Government Money Market Fund 2.50% | 8.9 |
| Fidelity Series Inflation-Protected Bond Index Fund | 7.1 |
| Fidelity Series Emerging Markets Opportunities Fund | 5.9 |
| Fidelity Series Large Cap Stock Fund | 5.7 |
| Fidelity Series Long-Term Treasury Bond Index Fund | 5.0 |
| Fidelity Series International Growth Fund | 4.9 |
| Fidelity Series International Value Fund | 4.7 |
| Fidelity Series Stock Selector Large Cap Value Fund | 3.7 |
| Fidelity Series Value Discovery Fund | 3.7 |
| | 76.3 |
Asset Allocation (% of fund's net assets)
| Period end |
| | Domestic Equity Funds | 29.6% |
| | International Equity Funds | 17.8% |
| | Bond Funds | 41.2% |
| | Short-Term Funds | 11.4% |
| | Short-Term Investments | 0.1% |
| | Net Other Assets (Liabilities)* | (0.1)% |

* Net Other Assets (Liabilities) are not included in the pie chart
Domestic Equity Funds category includes Fidelity Series Commodity Strategy Fund which invests in commodity-related investments.
Fidelity Advisor Freedom® 2015 Fund
Schedule of Investments March 31, 2019
Showing Percentage of Net Assets
| U.S. Treasury Obligations - 0.1% | | | |
| | | Principal Amount | Value |
| U.S. Treasury Bills, yield at date of purchase 2.37% to 2.43% 4/4/19 to 6/27/19 (a) | | | |
| (Cost $718,413) | | 720,000 | 718,435 |
| | | Shares | Value |
|
| Domestic Equity Funds - 29.6% | | | |
| Fidelity Advisor Series Equity Growth Fund (b) | | 2,336,452 | $32,546,778 |
| Fidelity Advisor Series Growth Opportunities Fund (b) | | 1,510,990 | 21,848,910 |
| Fidelity Advisor Series Small Cap Fund (b) | | 1,405,570 | 14,730,372 |
| Fidelity Series All-Sector Equity Fund (b) | | 1,499,443 | 14,439,639 |
| Fidelity Series Commodity Strategy Fund (b) | | 4,760,981 | 22,709,877 |
| Fidelity Series Large Cap Stock Fund (b) | | 3,819,861 | 55,960,959 |
| Fidelity Series Large Cap Value Index Fund (b) | | 509,366 | 6,321,235 |
| Fidelity Series Opportunistic Insights Fund (b) | | 1,735,825 | 30,342,218 |
| Fidelity Series Small Cap Opportunities Fund (b) | | 1,401,041 | 18,858,008 |
| Fidelity Series Stock Selector Large Cap Value Fund (b) | | 3,102,713 | 36,612,014 |
| Fidelity Series Value Discovery Fund (b) | | 2,896,433 | 36,176,450 |
| TOTAL DOMESTIC EQUITY FUNDS | | | |
| (Cost $235,359,306) | | | 290,546,460 |
|
| International Equity Funds - 17.8% | | | |
| Fidelity Series Canada Fund (b) | | 490,898 | 5,061,159 |
| Fidelity Series Emerging Markets Fund (b) | | 625,391 | 6,122,573 |
| Fidelity Series Emerging Markets Opportunities Fund (b) | | 3,106,356 | 57,560,785 |
| Fidelity Series International Growth Fund (b) | | 3,187,429 | 48,417,041 |
| Fidelity Series International Small Cap Fund (b) | | 727,030 | 11,290,776 |
| Fidelity Series International Value Fund (b) | | 4,979,969 | 46,313,712 |
| TOTAL INTERNATIONAL EQUITY FUNDS | | | |
| (Cost $136,393,610) | | | 174,766,046 |
|
| Bond Funds - 41.2% | | | |
| Fidelity Series Emerging Markets Debt Fund (b) | | 766,528 | 7,351,000 |
| Fidelity Series Floating Rate High Income Fund (b) | | 167,380 | 1,551,611 |
| Fidelity Series High Income Fund (b) | | 920,822 | 8,655,724 |
| Fidelity Series Inflation-Protected Bond Index Fund (b) | | 7,182,887 | 70,248,640 |
| Fidelity Series International Credit Fund (b) | | 64,128 | 634,225 |
| Fidelity Series Investment Grade Bond Fund (b) | | 23,466,558 | 262,356,116 |
| Fidelity Series Long-Term Treasury Bond Index Fund (b) | | 5,555,315 | 49,275,645 |
| Fidelity Series Real Estate Income Fund (b) | | 446,702 | 4,873,522 |
| TOTAL BOND FUNDS | | | |
| (Cost $395,611,594) | | | 404,946,483 |
|
| Short-Term Funds - 11.4% | | | |
| Fidelity Cash Central Fund, 2.48% (c) | | 3,309,927 | 3,310,589 |
| Fidelity Series Government Money Market Fund 2.50% (b)(d) | | 87,309,321 | 87,309,321 |
| Fidelity Series Short-Term Credit Fund (b) | | 2,175,246 | 21,687,199 |
| TOTAL SHORT-TERM FUNDS | | | |
| (Cost $112,299,718) | | | 112,307,109 |
| TOTAL INVESTMENT IN SECURITIES - 100.1% | | | |
| (Cost $880,382,641) | | | 983,284,533 |
| NET OTHER ASSETS (LIABILITIES) - (0.1)% | | | (757,273) |
| NET ASSETS - 100% | | | $982,527,260 |
| Futures Contracts | | | | | |
| | Number of contracts | Expiration Date | Notional Amount | Value | Unrealized Appreciation/(Depreciation) |
| Purchased | | | | | |
| Treasury Contracts | | | | | |
| CBOT 2-Year U.S. Treasury Note Contracts (United States) | 6 | June 2019 | $1,278,563 | $5,570 | $5,570 |
| CBOT 5-Year U.S. Treasury Note Contracts (United States) | 13 | June 2019 | 1,505,766 | 17,138 | 17,138 |
| CBOT 10-Year U.S. Treasury Note Contracts (United States) | 10 | June 2019 | 1,242,188 | 23,104 | 23,104 |
| CBOT Long Term U.S. Treasury Bond Contracts (United States) | 3 | June 2019 | 448,969 | 15,744 | 15,744 |
| CBOT Ultra Long Term U.S. Treasury Bond Contracts (United States) | 3 | June 2019 | 504,000 | 25,083 | 25,083 |
|
| TOTAL PURCHASED | | | | | 86,639 |
|
| Sold | | | | | |
| Equity Index Contracts | | | | | |
| CME E-mini S&P 500 Index Contracts (United States) | 26 | June 2019 | 3,689,140 | (111,663) | (111,663) |
| ICE E-mini MSCI EAFE Index Contracts (United States) | 10 | June 2019 | 933,200 | (19,723) | (19,723) |
| ICE E-mini MSCI Emerging Markets Index Contracts (United States) | 62 | June 2019 | 3,277,940 | (61,119) | (61,119) |
|
| TOTAL SOLD | | | | | (192,505) |
|
| TOTAL FUTURES CONTRACTS | | | | | $(105,866) |
The notional amount of futures purchased as a percentage of Net Assets is 0.5%
The notional amount of futures sold as a percentage of Net Assets is 0.8%
Legend
(a) Security or a portion of the security was pledged to cover margin requirements for futures contracts. At period end, the value of securities pledged amounted to $718,435.
(b) Affiliated Fund
(c) Affiliated fund that is generally available only to investment companies and other accounts managed by Fidelity Investments. The rate quoted is the annualized seven-day yield of the fund at period end. A complete unaudited listing of the fund's holdings as of its most recent quarter end is available upon request. In addition, each Fidelity Central Fund's financial statements, which are not covered by the Fund's Report of Independent Registered Public Accounting Firm, are available on the SEC's website or upon request.
(d) The rate quoted is the annualized seven-day yield of the fund at period end.
Affiliated Central Funds
Information regarding fiscal year to date income earned by the Fund from investments in Fidelity Central Funds is as follows:
| Fund | Income earned |
| Fidelity Cash Central Fund | $25,546 |
| Total | $25,546 |
Amounts in the income column in the above table include any capital gain distributions from underlying funds, which are presented in the corresponding line-item in the Statement of Operations, if applicable.
Affiliated Underlying Funds
Fiscal year to date information regarding the Fund's investments in affiliated Underlying Funds, excluding any Money Market Central Funds, is presented below. Exchanges between classes of the same affiliated Underlying Funds may occur.
| Affiliate | Value, beginning of period | Purchases | Sales Proceeds | Dividend Income | Realized Gain (loss) | Change in Unrealized appreciation (depreciation) | Value, end of period |
| Fidelity Advisor Series Equity Growth Fund | $37,891,446 | $3,147,561 | $10,392,710 | $2,555,835 | $2,090,804 | $(190,323) | $32,546,778 |
| Fidelity Advisor Series Equity Value Fund | 43,651,783 | 1,656,198 | 5,722,680 | 1,314,556 | 1,056,853 | (8,551,333) | -- |
| Fidelity Advisor Series Growth & Income Fund | 66,814,273 | 5,971,811 | 10,530,736 | 5,486,224 | 504,557 | (14,109,562) | -- |
| Fidelity Advisor Series Growth Opportunities Fund | 24,894,051 | 4,411,166 | 11,469,475 | 4,021,150 | 3,635,465 | 377,703 | 21,848,910 |
| Fidelity Advisor Series Opportunistic Insights Fund | 35,344,528 | 2,747,572 | 6,063,396 | 2,496,531 | 2,234,625 | (15,007,785) | -- |
| Fidelity Advisor Series Small Cap Fund | 18,976,799 | 1,726,672 | 4,412,136 | 1,438,080 | 604,318 | (2,165,281) | 14,730,372 |
| Fidelity Advisor Series Stock Selector Large Cap Value Fund | 44,062,046 | 3,642,226 | 5,808,563 | 3,333,550 | 1,101,002 | (8,686,915) | -- |
| Fidelity Series 100 Index Fund | 18,832,089 | -- | 19,671,736 | -- | 9,254,652 | (8,415,005) | -- |
| Fidelity Series All-Sector Equity Fund | 25,994,366 | 4,547,823 | 14,459,584 | 3,661,909 | 2,838,240 | (4,481,206) | 14,439,639 |
| Fidelity Series Canada Fund | 5,562,712 | 713,915 | 1,329,272 | 114,077 | (1,842) | 115,646 | 5,061,159 |
| Fidelity Series Commodity Strategy Fund | 23,427,565 | 7,956,527 | 5,936,468 | 1,437,858 | (2,801,950) | 64,203 | 22,709,877 |
| Fidelity Series Emerging Markets Debt Fund | 8,307,794 | 568,482 | 1,116,634 | 465,116 | (45,066) | (363,576) | 7,351,000 |
| Fidelity Series Emerging Markets Fund | -- | 6,494,759 | 544,000 | 24,812 | (14,099) | 185,913 | 6,122,573 |
| Fidelity Series Emerging Markets Opportunities Fund | 62,250,067 | 14,367,482 | 10,030,778 | 4,600,330 | 198,939 | (9,224,925) | 57,560,785 |
| Fidelity Series Floating Rate High Income Fund | 2,656,415 | 175,192 | 1,228,022 | 139,100 | (71,580) | 19,606 | 1,551,611 |
| Fidelity Series Government Money Market Fund 2.50% | 119,493,654 | 20,143,577 | 52,327,910 | 2,123,689 | -- | -- | 87,309,321 |
| Fidelity Series High Income Fund | 16,441,680 | 1,101,163 | 8,707,509 | 882,892 | (397,670) | 218,060 | 8,655,724 |
| Fidelity Series Inflation-Protected Bond Index Fund | 21,521,301 | 58,263,660 | 9,757,661 | 1,280,507 | (221,120) | 442,460 | 70,248,640 |
| Fidelity Series International Credit Fund | 605,136 | 30,671 | -- | 30,672 | -- | (1,582) | 634,225 |
| Fidelity Series International Growth Fund | 57,433,691 | 8,447,079 | 14,731,311 | 3,197,999 | 2,933,807 | (5,666,225) | 48,417,041 |
| Fidelity Series International Small Cap Fund | 14,297,809 | 2,448,059 | 3,440,267 | 1,054,021 | 790,374 | (2,805,199) | 11,290,776 |
| Fidelity Series International Value Fund | 56,727,990 | 5,665,556 | 9,892,735 | 1,751,242 | 675,543 | (6,862,642) | 46,313,712 |
| Fidelity Series Investment Grade Bond Fund | 312,691,131 | 17,218,762 | 70,690,183 | 9,108,680 | (2,291,401) | 5,427,807 | 262,356,116 |
| Fidelity Series Large Cap Stock Fund | -- | 2,925,167 | 5,846,374 | 2,362,934 | (280,399) | 10,512,222 | 55,960,959 |
| Fidelity Series Large Cap Value Index Fund | 7,381,653 | 436,503 | 1,591,001 | 303,163 | 265,049 | (170,969) | 6,321,235 |
| Fidelity Series Long-Term Treasury Bond Index Fund | 24,264,680 | 33,673,816 | 10,640,419 | 1,246,898 | (390,264) | 2,367,832 | 49,275,645 |
| Fidelity Series Opportunistic Insights Fund | -- | 3,350,778 | 3,401,055 | 2,592,090 | (267,943) | 11,404,894 | 30,342,218 |
| Fidelity Series Real Estate Equity Fund | 4,572,433 | 35,205 | 4,731,454 | 31,043 | 793,797 | (669,981) | -- |
| Fidelity Series Real Estate Income Fund | 5,209,016 | 449,885 | 874,476 | 368,816 | 32,393 | 56,704 | 4,873,522 |
| Fidelity Series Short-Term Credit Fund | 29,016,136 | 1,079,894 | 8,646,510 | 643,811 | (99,331) | 337,010 | 21,687,199 |
| Fidelity Series Small Cap Opportunities Fund | 23,153,614 | 2,703,956 | 6,071,322 | 2,344,145 | 1,361,091 | (2,289,331) | 18,858,008 |
| Fidelity Series Stock Selector Large Cap Value Fund | -- | 3,615,188 | 4,224,357 | 3,242,780 | (215,217) | 3,126,604 | 36,612,014 |
| Fidelity Series Value Discovery Fund | -- | 2,643,649 | 3,818,491 | 2,282,543 | 75,397 | 5,185,074 | 36,176,450 |
| | $1,111,475,858 | $222,359,954 | $328,109,225 | $65,937,053 | $23,349,024 | $(49,820,102) | $979,255,509 |
Amounts in the income column in the above table include any capital gain distributions from underlying funds, which are presented in the corresponding line-item in the Statement of Operations, if applicable.
Investment Valuation
The following is a summary of the inputs used, as of March 31, 2019, involving the Fund's assets and liabilities carried at fair value. The inputs or methodology used for valuing securities may not be an indication of the risk associated with investing in those securities. For more information on valuation inputs, and their aggregation into the levels used below, please refer to the Investment Valuation section in the accompanying Notes to Financial Statements.
| | Valuation Inputs at Reporting Date: |
| Description | Total | Level 1 | Level 2 | Level 3 |
| Investments in Securities: | | | | |
| Other Short-Term Investments | $718,435 | $-- | $718,435 | $-- |
| Domestic Equity Funds | 290,546,460 | 290,546,460 | -- | -- |
| International Equity Funds | 174,766,046 | 174,766,046 | -- | -- |
| Bond Funds | 404,946,483 | 404,946,483 | -- | -- |
| Short-Term Funds | 112,307,109 | 112,307,109 | -- | -- |
| Total Investments in Securities: | $983,284,533 | $982,566,098 | $718,435 | $-- |
| Derivative Instruments: | | | | |
| Assets | | | | |
| Futures Contracts | $86,639 | $86,639 | $-- | $-- |
| Total Assets | $86,639 | $86,639 | $-- | $-- |
| Liabilities | | | | |
| Futures Contracts | $(192,505) | $(192,505) | $-- | $-- |
| Total Liabilities | $(192,505) | $(192,505) | $-- | $-- |
| Total Derivative Instruments: | $(105,866) | $(105,866) | $-- | $-- |
Value of Derivative Instruments
The following table is a summary of the Fund's value of derivative instruments by primary risk exposure as of March 31, 2019. For additional information on derivative instruments, please refer to the Derivative Instruments section in the accompanying Notes to Financial Statements.
| Primary Risk Exposure / Derivative Type | Value |
| | Asset | Liability |
| Equity Risk | | |
| Futures Contracts(a) | $0 | $(192,505) |
| Total Equity Risk | 0 | (192,505) |
| Interest Rate Risk | | |
| Futures Contracts(a) | 86,639 | 0 |
| Total Interest Rate Risk | 86,639 | 0 |
| Total Value of Derivatives | $86,639 | $(192,505) |
(a) Reflects gross cumulative appreciation (depreciation) on futures contracts as presented in the Schedule of Investments. In the Statement of Assets and Liabilities, the period end daily variation margin is included in receivable or payable for daily variation margin on futures contracts, and the net cumulative appreciation (depreciation) is included in distributable earnings.
See accompanying notes which are an integral part of the financial statements.
Fidelity Advisor Freedom® 2015 Fund
Financial Statements
Statement of Assets and Liabilities
| | | March 31, 2019 |
| Assets | | |
Investment in securities, at value — See accompanying schedule:
Unaffiliated issuers (cost $718,413) | $718,435 | |
| Fidelity Central Funds (cost $3,310,587) | 3,310,589 | |
| Other affiliated issuers (cost $876,353,641) | 979,255,509 | |
| Total Investment in Securities (cost $880,382,641) | | $983,284,533 |
| Receivable for investments sold | | 5,586,261 |
| Receivable for fund shares sold | | 556,412 |
| Distributions receivable from Fidelity Central Funds | | 6,561 |
| Total assets | | 989,433,767 |
| Liabilities | | |
| Payable for investments purchased | $5,185,813 | |
| Payable for fund shares redeemed | 957,465 | |
| Accrued management fee | 460,589 | |
| Distribution and service plan fees payable | 194,392 | |
| Payable for daily variation margin on futures contracts | 108,248 | |
| Total liabilities | | 6,906,507 |
| Net Assets | | $982,527,260 |
| Net Assets consist of: | | |
| Paid in capital | | $855,141,175 |
| Total distributable earnings (loss) | | 127,386,085 |
| Net Assets | | $982,527,260 |
| Net Asset Value and Maximum Offering Price | | |
| Class A: | | |
| Net Asset Value and redemption price per share ($476,762,793 ÷ 40,427,886 shares) | | $11.79 |
| Maximum offering price per share (100/94.25 of $11.79) | | $12.51 |
| Class M: | | |
| Net Asset Value and redemption price per share ($152,211,903 ÷ 12,938,546 shares) | | $11.76 |
| Maximum offering price per share (100/96.50 of $11.76) | | $12.19 |
| Class C: | | |
| Net Asset Value and offering price per share ($31,274,166 ÷ 2,676,018 shares)(a) | | $11.69 |
| Class I: | | |
| Net Asset Value, offering price and redemption price per share ($304,220,790 ÷ 25,582,681 shares) | | $11.89 |
| Class Z: | | |
| Net Asset Value, offering price and redemption price per share ($1,521,660 ÷ 128,460 shares) | | $11.85 |
| Class Z6: | | |
| Net Asset Value, offering price and redemption price per share ($16,535,948 ÷ 1,393,603 shares) | | $11.87 |
(a) Redemption price per share is equal to net asset value less any applicable contingent deferred sales charge.
See accompanying notes which are an integral part of the financial statements.
Statement of Operations
| | | Year ended March 31, 2019 |
| Investment Income | | |
| Dividends: | | |
| Affiliated issuers | | $26,099,975 |
| Interest | | 9,149 |
| Income from Fidelity Central Funds | | 25,546 |
| Total income | | 26,134,670 |
| Expenses | | |
| Management fee | $5,841,595 | |
| Distribution and service plan fees | 2,543,608 | |
| Independent trustees' fees and expenses | 4,975 | |
| Total expenses before reductions | 8,390,178 | |
| Expense reductions | (177) | |
| Total expenses after reductions | | 8,390,001 |
| Net investment income (loss) | | 17,744,669 |
| Realized and Unrealized Gain (Loss) | | |
| Net realized gain (loss) on: | | |
| Investment securities: | | |
| Unaffiliated issuers | 1,594 | |
| Fidelity Central Funds | (37) | |
| Other affiliated issuers | 23,349,024 | |
| Futures contracts | 987,516 | |
| Capital gain distributions from underlying funds: | | |
| Affiliated issuers | 39,837,078 | |
| Total net realized gain (loss) | | 64,175,175 |
| Change in net unrealized appreciation (depreciation) on: | | |
| Investment securities: | | |
| Unaffiliated issuers | 27 | |
| Fidelity Central Funds | 2 | |
| Other affiliated issuers | (49,820,102) | |
| Futures contracts | (105,866) | |
| Total change in net unrealized appreciation (depreciation) | | (49,925,939) |
| Net gain (loss) | | 14,249,236 |
| Net increase (decrease) in net assets resulting from operations | | $31,993,905 |
See accompanying notes which are an integral part of the financial statements.
Statement of Changes in Net Assets
| | Year ended March 31, 2019 | Year ended March 31, 2018 |
| Increase (Decrease) in Net Assets | | |
| Operations | | |
| Net investment income (loss) | $17,744,669 | $14,255,743 |
| Net realized gain (loss) | 64,175,175 | 81,625,051 |
| Change in net unrealized appreciation (depreciation) | (49,925,939) | 210,738 |
| Net increase (decrease) in net assets resulting from operations | 31,993,905 | 96,091,532 |
| Distributions to shareholders | (96,090,230) | – |
| Distributions to shareholders from net investment income | – | (15,646,822) |
| Distributions to shareholders from net realized gain | – | (63,171,458) |
| Total distributions | (96,090,230) | (78,818,280) |
| Share transactions - net increase (decrease) | (64,212,519) | (118,085,087) |
| Total increase (decrease) in net assets | (128,308,844) | (100,811,835) |
| Net Assets | | |
| Beginning of period | 1,110,836,104 | 1,211,647,939 |
| End of period | $982,527,260 | $1,110,836,104 |
| Other Information | | |
| Undistributed net investment income end of period | | $957,886 |
See accompanying notes which are an integral part of the financial statements.
Financial Highlights
Fidelity Advisor Freedom 2015 Fund Class A
| Years ended March 31, | 2019 | 2018 | 2017 | 2016 | 2015 |
| Selected Per–Share Data | | | | | |
| Net asset value, beginning of period | $12.59 | $12.43 | $11.81 | $12.70 | $12.87 |
| Income from Investment Operations | | | | | |
| Net investment income (loss)A | .21 | .16 | .18 | .20 | .20 |
| Net realized and unrealized gain (loss) | .14 | .87 | .99 | (.45) | .49 |
| Total from investment operations | .35 | 1.03 | 1.17 | (.25) | .69 |
| Distributions from net investment income | (.21) | (.18) | (.19) | (.21) | (.21) |
| Distributions from net realized gain | (.94) | (.70) | (.36) | (.43) | (.64) |
| Total distributions | (1.15) | (.87)B | (.55) | (.64) | (.86)C |
| Net asset value, end of period | $11.79 | $12.59 | $12.43 | $11.81 | $12.70 |
| Total ReturnD,E | 3.26% | 8.42% | 10.23% | (2.07)% | 5.51% |
| Ratios to Average Net AssetsF,G | | | | | |
| Expenses before reductions | .82% | .72% | .25% | .25% | .25% |
| Expenses net of fee waivers, if any | .82% | .72% | .25% | .25% | .25% |
| Expenses net of all reductions | .82% | .72% | .25% | .25% | .25% |
| Net investment income (loss) | 1.71% | 1.22% | 1.46% | 1.64% | 1.58% |
| Supplemental Data | | | | | |
| Net assets, end of period (000 omitted) | $476,763 | $551,179 | $653,982 | $739,929 | $967,164 |
| Portfolio turnover rateF | 21% | 19% | 22% | 20% | 21% |
A Calculated based on average shares outstanding during the period.
B Total distributions of $.87 per share is comprised of distributions from net investment income of $.175 and distributions from net realized gain of $.699 per share.
C Total distributions of $.86 per share is comprised of distributions from net investment income of $.214 and distributions from net realized gain of $.642 per share.
D Total returns would have been lower if certain expenses had not been reduced during the applicable periods shown.
E Total returns do not include the effect of the sales charges.
F Amounts do not include the activity of the Underlying Funds.
G Expense ratios reflect operating expenses of the class. Expenses before reductions do not reflect amounts reimbursed by the investment adviser or reductions from expense offset arrangements and do not represent the amount paid by the class during periods when reimbursements or reductions occur. Expenses net of fee waivers reflect expenses after reimbursement by the investment adviser but prior to reductions from expense offset arrangements. Expenses net of all reductions represent the net expenses paid by the class but do not include expenses of the underlying funds in which the Fund invests.
See accompanying notes which are an integral part of the financial statements.
Fidelity Advisor Freedom 2015 Fund Class M
| Years ended March 31, | 2019 | 2018 | 2017 | 2016 | 2015 |
| Selected Per–Share Data | | | | | |
| Net asset value, beginning of period | $12.56 | $12.41 | $11.79 | $12.68 | $12.85 |
| Income from Investment Operations | | | | | |
| Net investment income (loss)A | .17 | .12 | .15 | .17 | .17 |
| Net realized and unrealized gain (loss) | .15 | .87 | .99 | (.45) | .48 |
| Total from investment operations | .32 | .99 | 1.14 | (.28) | .65 |
| Distributions from net investment income | (.18) | (.15) | (.16) | (.18) | (.18) |
| Distributions from net realized gain | (.94) | (.70) | (.36) | (.43) | (.64) |
| Total distributions | (1.12) | (.84)B | (.52) | (.61) | (.82) |
| Net asset value, end of period | $11.76 | $12.56 | $12.41 | $11.79 | $12.68 |
| Total ReturnC,D | 3.01% | 8.10% | 9.98% | (2.32)% | 5.26% |
| Ratios to Average Net AssetsE,F | | | | | |
| Expenses before reductions | 1.07% | .98% | .50% | .50% | .50% |
| Expenses net of fee waivers, if any | 1.07% | .98% | .50% | .50% | .50% |
| Expenses net of all reductions | 1.07% | .98% | .50% | .50% | .50% |
| Net investment income (loss) | 1.45% | .96% | 1.21% | 1.39% | 1.33% |
| Supplemental Data | | | | | |
| Net assets, end of period (000 omitted) | $152,212 | $167,835 | $178,795 | $190,018 | $208,468 |
| Portfolio turnover rateE | 21% | 19% | 22% | 20% | 21% |
A Calculated based on average shares outstanding during the period.
B Total distributions of $.84 per share is comprised of distributions from net investment income of $.145 and distributions from net realized gain of $.699 per share.
C Total returns would have been lower if certain expenses had not been reduced during the applicable periods shown.
D Total returns do not include the effect of the sales charges.
E Amounts do not include the activity of the Underlying Funds.
F Expense ratios reflect operating expenses of the class. Expenses before reductions do not reflect amounts reimbursed by the investment adviser or reductions from expense offset arrangements and do not represent the amount paid by the class during periods when reimbursements or reductions occur. Expenses net of fee waivers reflect expenses after reimbursement by the investment adviser but prior to reductions from expense offset arrangements. Expenses net of all reductions represent the net expenses paid by the class but do not include expenses of the underlying funds in which the Fund invests.
See accompanying notes which are an integral part of the financial statements.
Fidelity Advisor Freedom 2015 Fund Class C
| Years ended March 31, | 2019 | 2018 | 2017 | 2016 | 2015 |
| Selected Per–Share Data | | | | | |
| Net asset value, beginning of period | $12.47 | $12.32 | $11.72 | $12.60 | $12.77 |
| Income from Investment Operations | | | | | |
| Net investment income (loss)A | .11 | .06 | .08 | .11 | .11 |
| Net realized and unrealized gain (loss) | .16 | .86 | .98 | (.45) | .48 |
| Total from investment operations | .27 | .92 | 1.06 | (.34) | .59 |
| Distributions from net investment income | (.13) | (.08) | (.10) | (.11) | (.12) |
| Distributions from net realized gain | (.93) | (.70) | (.36) | (.43) | (.64) |
| Total distributions | (1.05)B | (.77)C | (.46) | (.54) | (.76) |
| Net asset value, end of period | $11.69 | $12.47 | $12.32 | $11.72 | $12.60 |
| Total ReturnD,E | 2.60% | 7.57% | 9.33% | (2.76)% | 4.75% |
| Ratios to Average Net AssetsF,G | | | | | |
| Expenses before reductions | 1.57% | 1.48% | 1.00% | 1.00% | 1.00% |
| Expenses net of fee waivers, if any | 1.57% | 1.48% | 1.00% | 1.00% | 1.00% |
| Expenses net of all reductions | 1.57% | 1.48% | 1.00% | 1.00% | 1.00% |
| Net investment income (loss) | .96% | .47% | .71% | .89% | .83% |
| Supplemental Data | | | | | |
| Net assets, end of period (000 omitted) | $31,274 | $54,730 | $61,332 | $63,443 | $72,725 |
| Portfolio turnover rateF | 21% | 19% | 22% | 20% | 21% |
A Calculated based on average shares outstanding during the period.
B Total distributions of $1.05 per share is comprised of distributions from net investment income of $.125 and distributions from net realized gain of $.926 per share.
C Total distributions of $.77 per share is comprised of distributions from net investment income of $.075 and distributions from net realized gain of $.699 per share.
D Total returns would have been lower if certain expenses had not been reduced during the applicable periods shown.
E Total returns do not include the effect of the contingent deferred sales charge.
F Amounts do not include the activity of the Underlying Funds.
G Expense ratios reflect operating expenses of the class. Expenses before reductions do not reflect amounts reimbursed by the investment adviser or reductions from expense offset arrangements and do not represent the amount paid by the class during periods when reimbursements or reductions occur. Expenses net of fee waivers reflect expenses after reimbursement by the investment adviser but prior to reductions from expense offset arrangements. Expenses net of all reductions represent the net expenses paid by the class but do not include expenses of the underlying funds in which the Fund invests.
See accompanying notes which are an integral part of the financial statements.
Fidelity Advisor Freedom 2015 Fund Class I
| Years ended March 31, | 2019 | 2018 | 2017 | 2016 | 2015 |
| Selected Per–Share Data | | | | | |
| Net asset value, beginning of period | $12.69 | $12.53 | $11.90 | $12.79 | $12.96 |
| Income from Investment Operations | | | | | |
| Net investment income (loss)A | .24 | .19 | .21 | .23 | .24 |
| Net realized and unrealized gain (loss) | .14 | .88 | 1.00 | (.45) | .48 |
| Total from investment operations | .38 | 1.07 | 1.21 | (.22) | .72 |
| Distributions from net investment income | (.24) | (.21) | (.22) | (.24) | (.25) |
| Distributions from net realized gain | (.94) | (.70) | (.36) | (.43) | (.64) |
| Total distributions | (1.18) | (.91) | (.58) | (.67) | (.89) |
| Net asset value, end of period | $11.89 | $12.69 | $12.53 | $11.90 | $12.79 |
| Total ReturnB | 3.55% | 8.66% | 10.53% | (1.80)% | 5.74% |
| Ratios to Average Net AssetsC,D | | | | | |
| Expenses before reductions | .57% | .48% | - %E | - %E | - %E |
| Expenses net of fee waivers, if any | .57% | .48% | -% | -% | -% |
| Expenses net of all reductions | .57% | .48% | -% | -% | -% |
| Net investment income (loss) | 1.95% | 1.46% | 1.71% | 1.89% | 1.83% |
| Supplemental Data | | | | | |
| Net assets, end of period (000 omitted) | $304,221 | $324,189 | $317,539 | $361,722 | $425,176 |
| Portfolio turnover rateC | 21% | 19% | 22% | 20% | 21% |
A Calculated based on average shares outstanding during the period.
B Total returns would have been lower if certain expenses had not been reduced during the applicable periods shown.
C Amounts do not include the activity of the Underlying Funds.
D Expense ratios reflect operating expenses of the class. Expenses before reductions do not reflect amounts reimbursed by the investment adviser or reductions from expense offset arrangements and do not represent the amount paid by the class during periods when reimbursements or reductions occur. Expenses net of fee waivers reflect expenses after reimbursement by the investment adviser but prior to reductions from expense offset arrangements. Expenses net of all reductions represent the net expenses paid by the class but do not include expenses of the underlying funds in which the Fund invests.
E Amount represents less than .005%.
See accompanying notes which are an integral part of the financial statements.
Fidelity Advisor Freedom 2015 Fund Class Z
| Year ended March 31, | 2019 A |
| Selected Per–Share Data | |
| Net asset value, beginning of period | $12.50 |
| Income from Investment Operations | |
| Net investment income (loss)B | .27 |
| Net realized and unrealized gain (loss) | (.17)C |
| Total from investment operations | .10 |
| Distributions from net investment income | (.27) |
| Distributions from net realized gain | (.48) |
| Total distributions | (.75) |
| Net asset value, end of period | $11.85 |
| Total ReturnD,E | 1.29% |
| Ratios to Average Net AssetsF,G | |
| Expenses before reductions | .51%H,I |
| Expenses net of fee waivers, if any | .51%H,I |
| Expenses net of all reductions | .51%H,I |
| Net investment income (loss) | 4.73%H |
| Supplemental Data | |
| Net assets, end of period (000 omitted) | $1,522 |
| Portfolio turnover rateF | 21% |
A For the period October 2, 2018 (commencement of sale of shares) to March 31, 2019.
B Calculated based on average shares outstanding during the period.
C The amount shown for a share outstanding does not correspond with the aggregate net gain (loss) on investments for the period due to the timing of sales and repurchases of shares in relation to fluctuating market values of the investments of the Fund.
D Total returns for periods of less than one year are not annualized.
E Total returns would have been lower if certain expenses had not been reduced during the applicable periods shown.
F Amounts do not include the activity of the Underlying Funds.
G Expense ratios reflect operating expenses of the class. Expenses before reductions do not reflect amounts reimbursed by the investment adviser or reductions from expense offset arrangements and do not represent the amount paid by the class during periods when reimbursements or reductions occur. Expense ratios before reductions for start-up periods may not be representative of longer-term operating periods. Expenses net of fee waivers reflect expenses after reimbursement by the investment adviser but prior to reductions from expense offset arrangements. Expenses net of all reductions represent the net expenses paid by the class but do not include expenses of the underlying funds in which the Fund invests.
H Annualized
I On certain classes, the size and fluctuation of net assets and expense amounts may cause ratios to differ from contractual rates.
See accompanying notes which are an integral part of the financial statements.
Fidelity Advisor Freedom 2015 Fund Class Z6
| Years ended March 31, | 2019 | 2018 A |
| Selected Per–Share Data | | |
| Net asset value, beginning of period | $12.67 | $12.66 |
| Income from Investment Operations | | |
| Net investment income (loss)B | .25 | .18 |
| Net realized and unrealized gain (loss) | .16 | .51 |
| Total from investment operations | .41 | .69 |
| Distributions from net investment income | (.27) | (.21) |
| Distributions from net realized gain | (.94) | (.47) |
| Total distributions | (1.21) | (.68) |
| Net asset value, end of period | $11.87 | $12.67 |
| Total ReturnC,D | 3.81% | 5.42% |
| Ratios to Average Net AssetsE,F | | |
| Expenses before reductions | .41% | .43%G,H |
| Expenses net of fee waivers, if any | .41% | .43%G,H |
| Expenses net of all reductions | .41% | .43%G,H |
| Net investment income (loss) | 2.11% | 1.75%G |
| Supplemental Data | | |
| Net assets, end of period (000 omitted) | $16,536 | $12,903 |
| Portfolio turnover rateE | 21% | 19% |
A For the period June 6, 2017 (commencement of sale of shares) to March 31, 2018.
B Calculated based on average shares outstanding during the period.
C Total returns for periods of less than one year are not annualized.
D Total returns would have been lower if certain expenses had not been reduced during the applicable periods shown.
E Amounts do not include the activity of the Underlying Funds.
F Expense ratios reflect operating expenses of the class. Expenses before reductions do not reflect amounts reimbursed by the investment adviser or reductions from expense offset arrangements and do not represent the amount paid by the class during periods when reimbursements or reductions occur. Expenses net of fee waivers reflect expenses after reimbursement by the investment adviser but prior to reductions from expense offset arrangements. Expenses net of all reductions represent the net expenses paid by the class but do not include expenses of the underlying funds in which the Fund invests.
G Annualized
H On certain classes, the size and fluctuation of net assets and expense amounts may cause ratios to differ from contractual rates.
See accompanying notes which are an integral part of the financial statements.
Fidelity Advisor Freedom® 2020 Fund
Investment Summary (Unaudited)
The information in the following tables is based on the direct investments of the Fund.
Top Holdings as of March 31, 2019
| | % of fund's net assets |
| Fidelity Series Investment Grade Bond Fund | 23.5 |
| Fidelity Series Large Cap Stock Fund | 6.8 |
| Fidelity Series Government Money Market Fund 2.50% | 6.6 |
| Fidelity Series Emerging Markets Opportunities Fund | 6.4 |
| Fidelity Series International Growth Fund | 5.7 |
| Fidelity Series International Value Fund | 5.4 |
| Fidelity Series Inflation-Protected Bond Index Fund | 5.2 |
| Fidelity Series Long-Term Treasury Bond Index Fund | 5.1 |
| Fidelity Series Stock Selector Large Cap Value Fund | 4.5 |
| Fidelity Series Value Discovery Fund | 4.4 |
| | 73.6 |
Asset Allocation (% of fund's net assets)
| Period end |
| | Domestic Equity Funds | 35.1% |
| | International Equity Funds | 20.1% |
| | Bond Funds | 36.1% |
| | Short-Term Funds | 8.7% |
| | Short-Term Investments | 0.1% |
| | Net Other Assets (Liabilities)* | (0.1)% |

* Net Other Assets (Liabilities) are not included in the pie chart
Domestic Equity Funds category includes Fidelity Series Commodity Strategy Fund which invests in commodity-related investments.
Fidelity Advisor Freedom® 2020 Fund
Schedule of Investments March 31, 2019
Showing Percentage of Net Assets
| U.S. Treasury Obligations - 0.1% | | | |
| | | Principal Amount | Value |
| U.S. Treasury Bills, yield at date of purchase 2.39% to 2.43% 4/4/19 to 6/27/19 (a) | | | |
| (Cost $1,508,071) | | 1,510,000 | 1,508,096 |
| | | Shares | Value |
|
| Domestic Equity Funds - 35.1% | | | |
| Fidelity Advisor Series Equity Growth Fund (b) | | 6,632,039 | $92,384,310 |
| Fidelity Advisor Series Growth Opportunities Fund (b) | | 4,312,702 | 62,361,675 |
| Fidelity Advisor Series Small Cap Fund (b) | | 3,906,601 | 40,941,178 |
| Fidelity Series All-Sector Equity Fund (b) | | 4,250,241 | 40,929,825 |
| Fidelity Series Commodity Strategy Fund (b) | | 11,210,108 | 53,472,213 |
| Fidelity Series Large Cap Stock Fund (b) | | 10,576,507 | 154,945,821 |
| Fidelity Series Large Cap Value Index Fund (b) | | 1,409,881 | 17,496,625 |
| Fidelity Series Opportunistic Insights Fund (b) | | 4,907,191 | 85,777,692 |
| Fidelity Series Small Cap Opportunities Fund (b) | | 3,911,010 | 52,642,198 |
| Fidelity Series Stock Selector Large Cap Value Fund (b) | | 8,667,420 | 102,275,559 |
| Fidelity Series Value Discovery Fund (b) | | 8,032,165 | 100,321,739 |
| TOTAL DOMESTIC EQUITY FUNDS | | | |
| (Cost $661,945,982) | | | 803,548,835 |
|
| International Equity Funds - 20.1% | | | |
| Fidelity Series Canada Fund (b) | | 1,308,121 | 13,486,729 |
| Fidelity Series Emerging Markets Fund (b) | | 1,603,233 | 15,695,656 |
| Fidelity Series Emerging Markets Opportunities Fund (b) | | 7,963,299 | 147,559,925 |
| Fidelity Series International Growth Fund (b) | | 8,513,777 | 129,324,278 |
| Fidelity Series International Small Cap Fund (b) | | 1,965,183 | 30,519,298 |
| Fidelity Series International Value Fund (b) | | 13,297,078 | 123,662,826 |
| TOTAL INTERNATIONAL EQUITY FUNDS | | | |
| (Cost $368,378,640) | | | 460,248,712 |
|
| Bond Funds - 36.1% | | | |
| Fidelity Series Emerging Markets Debt Fund (b) | | 1,707,175 | 16,371,811 |
| Fidelity Series Floating Rate High Income Fund (b) | | 336,610 | 3,120,379 |
| Fidelity Series High Income Fund (b) | | 2,206,943 | 20,745,261 |
| Fidelity Series Inflation-Protected Bond Index Fund (b) | | 12,287,339 | 120,170,173 |
| Fidelity Series International Credit Fund (b) | | 137,833 | 1,363,168 |
| Fidelity Series Investment Grade Bond Fund (b) | | 48,140,853 | 538,214,733 |
| Fidelity Series Long-Term Treasury Bond Index Fund (b) | | 13,230,504 | 117,354,568 |
| Fidelity Series Real Estate Income Fund (b) | | 1,023,650 | 11,168,017 |
| TOTAL BOND FUNDS | | | |
| (Cost $822,281,424) | | | 828,508,110 |
|
| Short-Term Funds - 8.7% | | | |
| Fidelity Cash Central Fund, 2.48%(c) | | 8,368,511 | 8,370,185 |
| Fidelity Series Government Money Market Fund 2.50%(b)(d) | | 152,159,909 | 152,159,909 |
| Fidelity Series Short-Term Credit Fund (b) | | 3,843,587 | 38,320,567 |
| TOTAL SHORT-TERM FUNDS | | | |
| (Cost $198,834,422) | | | 198,850,661 |
| TOTAL INVESTMENT IN SECURITIES - 100.1% | | | |
| (Cost $2,052,948,539) | | | 2,292,664,414 |
| NET OTHER ASSETS (LIABILITIES) - (0.1)% | | | (1,789,199) |
| NET ASSETS - 100% | | | $2,290,875,215 |
| Futures Contracts | | | | | |
| | Number of contracts | Expiration Date | Notional Amount | Value | Unrealized Appreciation/(Depreciation) |
| Purchased | | | | | |
| Treasury Contracts | | | | | |
| CBOT 2-Year U.S. Treasury Note Contracts (United States) | 13 | June 2019 | $2,770,219 | $12,069 | $12,069 |
| CBOT 5-Year U.S. Treasury Note Contracts (United States) | 29 | June 2019 | 3,359,016 | 38,231 | 38,231 |
| CBOT 10-Year U.S. Treasury Note Contracts (United States) | 21 | June 2019 | 2,608,594 | 48,518 | 48,518 |
| CBOT Long Term U.S. Treasury Bond Contracts (United States) | 8 | June 2019 | 1,197,250 | 41,983 | 41,983 |
| CBOT Ultra Long Term U.S. Treasury Bond Contracts (United States) | 9 | June 2019 | 1,512,000 | 75,249 | 75,249 |
|
| TOTAL PURCHASED | | | | | 216,050 |
|
| Sold | | | | | |
| Equity Index Contracts | | | | | |
| CME E-mini S&P 500 Index Contracts (United States) | 65 | June 2019 | 9,222,850 | (279,157) | (279,157) |
| ICE E-mini MSCI Emerging Markets Index Contracts (United States) | 144 | June 2019 | 7,613,280 | (141,960) | (141,960) |
|
| TOTAL SOLD | | | | | (421,117) |
|
| TOTAL FUTURES CONTRACTS | | | | | $(205,067) |
The notional amount of futures purchased as a percentage of Net Assets is 0.5%
The notional amount of futures sold as a percentage of Net Assets is 0.7%
Legend
(a) Security or a portion of the security was pledged to cover margin requirements for futures contracts. At period end, the value of securities pledged amounted to $1,508,096.
(b) Affiliated Fund
(c) Affiliated fund that is generally available only to investment companies and other accounts managed by Fidelity Investments. The rate quoted is the annualized seven-day yield of the fund at period end. A complete unaudited listing of the fund's holdings as of its most recent quarter end is available upon request. In addition, each Fidelity Central Fund's financial statements, which are not covered by the Fund's Report of Independent Registered Public Accounting Firm, are available on the SEC's website or upon request.
(d) The rate quoted is the annualized seven-day yield of the fund at period end.
Affiliated Central Funds
Information regarding fiscal year to date income earned by the Fund from investments in Fidelity Central Funds is as follows:
| Fund | Income earned |
| Fidelity Cash Central Fund | $59,331 |
| Total | $59,331 |
Amounts in the income column in the above table include any capital gain distributions from underlying funds, which are presented in the corresponding line-item in the Statement of Operations, if applicable.
Affiliated Underlying Funds
Fiscal year to date information regarding the Fund's investments in affiliated Underlying Funds, excluding any Money Market Central Funds, is presented below. Exchanges between classes of the same affiliated Underlying Funds may occur.
| Affiliate | Value, beginning of period | Purchases | Sales Proceeds | Dividend Income | Realized Gain (loss) | Change in Unrealized appreciation (depreciation) | Value, end of period |
| Fidelity Advisor Series Equity Growth Fund | $97,996,442 | $9,767,939 | $20,098,771 | $7,099,080 | $2,537,228 | $2,181,472 | $92,384,310 |
| Fidelity Advisor Series Equity Value Fund | 112,977,029 | 4,851,014 | 9,367,482 | 3,592,703 | 575,945 | (21,311,894) | -- |
| Fidelity Advisor Series Growth & Income Fund | 172,970,500 | 16,688,508 | 19,127,430 | 14,741,472 | 964,547 | (32,886,455) | -- |
| Fidelity Advisor Series Growth Opportunities Fund | 64,366,555 | 12,509,295 | 24,924,105 | 11,114,246 | 7,277,779 | 3,132,151 | 62,361,675 |
| Fidelity Advisor Series Opportunistic Insights Fund | 91,315,922 | 7,831,255 | 11,088,207 | 6,822,654 | 2,240,465 | (37,653,473) | -- |
| Fidelity Advisor Series Small Cap Fund | 49,077,299 | 5,181,293 | 8,917,445 | 3,986,217 | 751,288 | (5,151,257) | 40,941,178 |
| Fidelity Advisor Series Stock Selector Large Cap Value Fund | 114,047,646 | 10,209,187 | 9,656,058 | 9,096,431 | 653,530 | (21,613,588) | -- |
| Fidelity Series 100 Index Fund | 48,677,255 | -- | 51,233,085 | --�� | 20,253,867 | (17,698,037) | -- |
| Fidelity Series All-Sector Equity Fund | 67,245,550 | 13,582,840 | 34,858,575 | 10,389,949 | 6,127,336 | (11,167,326) | 40,929,825 |
| Fidelity Series Canada Fund | 14,121,725 | 1,176,922 | 2,027,910 | 304,846 | (29,245) | 245,237 | 13,486,729 |
| Fidelity Series Commodity Strategy Fund | 53,066,753 | 18,408,347 | 11,696,258 | 3,319,206 | (5,639,207) | (667,422) | 53,472,213 |
| Fidelity Series Emerging Markets Debt Fund | 18,075,963 | 1,340,983 | 2,159,754 | 1,028,488 | (88,167) | (797,214) | 16,371,811 |
| Fidelity Series Emerging Markets Fund | -- | 15,957,723 | 1,140,447 | 63,759 | (26,834) | 905,214 | 15,695,656 |
| Fidelity Series Emerging Markets Opportunities Fund | 154,150,718 | 37,521,886 | 21,263,604 | 11,817,697 | (560,481) | (22,288,594) | 147,559,925 |
| Fidelity Series Floating Rate High Income Fund | 5,870,063 | 412,891 | 3,055,202 | 299,940 | (174,745) | 67,372 | 3,120,379 |
| Fidelity Series Government Money Market Fund 2.50% | 204,141,698 | 40,519,434 | 92,501,223 | 3,723,314 | -- | -- | 152,159,909 |
| Fidelity Series High Income Fund | 36,542,127 | 2,704,733 | 18,090,603 | 2,056,913 | (964,557) | 553,561 | 20,745,261 |
| Fidelity Series Inflation-Protected Bond Index Fund | 28,559,768 | 105,536,202 | 14,256,570 | 2,200,036 | (495,591) | 826,364 | 120,170,173 |
| Fidelity Series International Credit Fund | 1,300,646 | 65,924 | -- | 65,924 | -- | (3,402) | 1,363,168 |
| Fidelity Series International Growth Fund | 144,970,532 | 22,144,445 | 30,615,155 | 8,560,730 | 4,483,533 | (11,659,077) | 129,324,278 |
| Fidelity Series International Small Cap Fund | 36,256,739 | 7,032,031 | 7,458,052 | 2,830,143 | 1,074,275 | (6,385,695) | 30,519,298 |
| Fidelity Series International Value Fund | 143,946,261 | 15,973,786 | 19,953,561 | 4,686,771 | 526,008 | (16,829,668) | 123,662,826 |
| Fidelity Series Investment Grade Bond Fund | 637,028,192 | 37,645,413 | 142,975,240 | 18,644,331 | (5,857,595) | 12,373,963 | 538,214,733 |
| Fidelity Series Large Cap Stock Fund | -- | 8,342,129 | 14,324,138 | 6,541,881 | (837,821) | 23,155,981 | 154,945,821 |
| Fidelity Series Large Cap Value Index Fund | 19,081,531 | 1,320,208 | 3,117,122 | 840,925 | 384,083 | (172,075) | 17,496,625 |
| Fidelity Series Long-Term Treasury Bond Index Fund | 55,292,489 | 79,688,061 | 22,307,987 | 2,951,301 | (724,795) | 5,406,800 | 117,354,568 |
| Fidelity Series Opportunistic Insights Fund | -- | 10,223,131 | 7,538,195 | 7,236,285 | (609,575) | 31,056,369 | 85,777,692 |
| Fidelity Series Real Estate Equity Fund | 11,817,048 | 75,560 | 12,196,466 | 64,942 | 1,586,811 | (1,282,953) | -- |
| Fidelity Series Real Estate Income Fund | 11,569,965 | 1,082,468 | 1,688,806 | 837,466 | 43,671 | 160,719 | 11,168,017 |
| Fidelity Series Short-Term Credit Fund | 49,294,490 | 2,123,147 | 13,517,928 | 1,127,665 | (143,887) | 564,745 | 38,320,567 |
| Fidelity Series Small Cap Opportunities Fund | 59,875,853 | 7,991,831 | 12,500,896 | 6,443,829 | 1,553,126 | (4,277,716) | 52,642,198 |
| Fidelity Series Stock Selector Large Cap Value Fund | -- | 10,312,347 | 9,522,364 | 8,995,611 | (542,565) | 8,387,424 | 102,275,559 |
| Fidelity Series Value Discovery Fund | -- | 7,489,559 | 9,209,103 | 6,332,656 | (44,999) | 14,361,670 | 100,321,739 |
| | $2,503,636,759 | $515,710,492 | $662,387,742 | $167,817,411 | $34,293,428 | $(108,466,804) | $2,282,786,133 |
Amounts in the income column in the above table include any capital gain distributions from underlying funds, which are presented in the corresponding line-item in the Statement of Operations, if applicable.
Investment Valuation
The following is a summary of the inputs used, as of March 31, 2019, involving the Fund's assets and liabilities carried at fair value. The inputs or methodology used for valuing securities may not be an indication of the risk associated with investing in those securities. For more information on valuation inputs, and their aggregation into the levels used below, please refer to the Investment Valuation section in the accompanying Notes to Financial Statements.
| | Valuation Inputs at Reporting Date: |
| Description | Total | Level 1 | Level 2 | Level 3 |
| Investments in Securities: | | | | |
| Other Short-Term Investments | $1,508,096 | $-- | $1,508,096 | $-- |
| Domestic Equity Funds | 803,548,835 | 803,548,835 | -- | -- |
| International Equity Funds | 460,248,712 | 460,248,712 | -- | -- |
| Bond Funds | 828,508,110 | 828,508,110 | -- | -- |
| Short-Term Funds | 198,850,661 | 198,850,661 | -- | -- |
| Total Investments in Securities: | $2,292,664,414 | $2,291,156,318 | $1,508,096 | $-- |
| Derivative Instruments: | | | | |
| Assets | | | | |
| Futures Contracts | $216,050 | $216,050 | $-- | $-- |
| Total Assets | $216,050 | $216,050 | $-- | $-- |
| Liabilities | | | | |
| Futures Contracts | $(421,117) | $(421,117) | $-- | $-- |
| Total Liabilities | $(421,117) | $(421,117) | $-- | $-- |
| Total Derivative Instruments: | $(205,067) | $(205,067) | $-- | $-- |
Value of Derivative Instruments
The following table is a summary of the Fund's value of derivative instruments by primary risk exposure as of March 31, 2019. For additional information on derivative instruments, please refer to the Derivative Instruments section in the accompanying Notes to Financial Statements.
| Primary Risk Exposure / Derivative Type | Value |
| | Asset | Liability |
| Equity Risk | | |
| Futures Contracts(a) | $0 | $(421,117) |
| Total Equity Risk | 0 | (421,117) |
| Interest Rate Risk | | |
| Futures Contracts(a) | 216,050 | 0 |
| Total Interest Rate Risk | 216,050 | 0 |
| Total Value of Derivatives | $216,050 | $(421,117) |
(a) Reflects gross cumulative appreciation (depreciation) on futures contracts as presented in the Schedule of Investments. In the Statement of Assets and Liabilities, the period end daily variation margin is included in receivable or payable for daily variation margin on futures contracts, and the net cumulative appreciation (depreciation) is included in distributable earnings.
See accompanying notes which are an integral part of the financial statements.
Fidelity Advisor Freedom® 2020 Fund
Financial Statements
Statement of Assets and Liabilities
| | | March 31, 2019 |
| Assets | | |
Investment in securities, at value — See accompanying schedule:
Unaffiliated issuers (cost $1,508,071) | $1,508,096 | |
| Fidelity Central Funds (cost $8,370,185) | 8,370,185 | |
| Other affiliated issuers (cost $2,043,070,283) | 2,282,786,133 | |
| Total Investment in Securities (cost $2,052,948,539) | | $2,292,664,414 |
| Receivable for investments sold | | 10,334,424 |
| Receivable for fund shares sold | | 1,377,333 |
| Distributions receivable from Fidelity Central Funds | | 16,390 |
| Total assets | | 2,304,392,561 |
| Liabilities | | |
| Payable for investments purchased | $6,175,317 | |
| Payable for fund shares redeemed | 5,535,187 | |
| Accrued management fee | 1,155,886 | |
| Distribution and service plan fees payable | 422,199 | |
| Payable for daily variation margin on futures contracts | 228,757 | |
| Total liabilities | | 13,517,346 |
| Net Assets | | $2,290,875,215 |
| Net Assets consist of: | | |
| Paid in capital | | $1,985,321,837 |
| Total distributable earnings (loss) | | 305,553,378 |
| Net Assets | | $2,290,875,215 |
| Net Asset Value and Maximum Offering Price | | |
| Class A: | | |
| Net Asset Value and redemption price per share ($1,038,298,952 ÷ 80,083,285 shares) | | $12.97 |
| Maximum offering price per share (100/94.25 of $12.97) | | $13.76 |
| Class M: | | |
| Net Asset Value and redemption price per share ($345,810,320 ÷ 26,688,151 shares) | | $12.96 |
| Maximum offering price per share (100/96.50 of $12.96) | | $13.43 |
| Class C: | | |
| Net Asset Value and offering price per share ($63,123,183 ÷ 4,908,816 shares)(a) | | $12.86 |
| Class I: | | |
| Net Asset Value, offering price and redemption price per share ($795,372,390 ÷ 60,856,954 shares) | | $13.07 |
| Class Z: | | |
| Net Asset Value, offering price and redemption price per share ($2,584,634 ÷ 198,513 shares) | | $13.02 |
| Class Z6: | | |
| Net Asset Value, offering price and redemption price per share ($45,685,736 ÷ 3,504,055 shares) | | $13.04 |
(a) Redemption price per share is equal to net asset value less any applicable contingent deferred sales charge.
See accompanying notes which are an integral part of the financial statements.
Statement of Operations
| | | Year ended March 31, 2019 |
| Investment Income | | |
| Dividends: | | |
| Affiliated issuers | | $60,399,715 |
| Interest | | 22,430 |
| Income from Fidelity Central Funds | | 59,331 |
| Total income | | 60,481,476 |
| Expenses | | |
| Management fee | $14,463,453 | |
| Distribution and service plan fees | 5,446,220 | |
| Independent trustees' fees and expenses | 11,392 | |
| Total expenses before reductions | 19,921,065 | |
| Expense reductions | (220) | |
| Total expenses after reductions | | 19,920,845 |
| Net investment income (loss) | | 40,560,631 |
| Realized and Unrealized Gain (Loss) | | |
| Net realized gain (loss) on: | | |
| Investment securities: | | |
| Unaffiliated issuers | 4,186 | |
| Fidelity Central Funds | (35) | |
| Other affiliated issuers | 34,293,428 | |
| Futures contracts | 2,162,245 | |
| Capital gain distributions from underlying funds: | | |
| Affiliated issuers | 107,417,696 | |
| Total net realized gain (loss) | | 143,877,520 |
| Change in net unrealized appreciation (depreciation) on: | | |
| Investment securities: | | |
| Unaffiliated issuers | 37 | |
| Affiliated issuers | (108,466,804) | |
| Futures contracts | (205,067) | |
| Total change in net unrealized appreciation (depreciation) | | (108,671,834) |
| Net gain (loss) | | 35,205,686 |
| Net increase (decrease) in net assets resulting from operations | | $75,766,317 |
See accompanying notes which are an integral part of the financial statements.
Statement of Changes in Net Assets
| | Year ended March 31, 2019 | Year ended March 31, 2018 |
| Increase (Decrease) in Net Assets | | |
| Operations | | |
| Net investment income (loss) | $40,560,631 | $30,214,061 |
| Net realized gain (loss) | 143,877,520 | 162,690,491 |
| Change in net unrealized appreciation (depreciation) | (108,671,834) | 32,981,869 |
| Net increase (decrease) in net assets resulting from operations | 75,766,317 | 225,886,421 |
| Distributions to shareholders | (202,406,934) | – |
| Distributions to shareholders from net investment income | – | (33,576,472) |
| Distributions to shareholders from net realized gain | – | (112,956,333) |
| Total distributions | (202,406,934) | (146,532,805) |
| Share transactions - net increase (decrease) | (84,654,253) | (133,083,804) |
| Total increase (decrease) in net assets | (211,294,870) | (53,730,188) |
| Net Assets | | |
| Beginning of period | 2,502,170,085 | 2,555,900,273 |
| End of period | $2,290,875,215 | $2,502,170,085 |
| Other Information | | |
| Undistributed net investment income end of period | | $1,145,206 |
See accompanying notes which are an integral part of the financial statements.
Financial Highlights
Fidelity Advisor Freedom 2020 Fund Class A
| Years ended March 31, | 2019 | 2018 | 2017 | 2016 | 2015 |
| Selected Per–Share Data | | | | | |
| Net asset value, beginning of period | $13.71 | $13.31 | $12.51 | $13.44 | $13.54 |
| Income from Investment Operations | | | | | |
| Net investment income (loss)A | .22 | .16 | .19 | .21 | .22 |
| Net realized and unrealized gain (loss) | .18 | 1.05 | 1.16 | (.51) | .55 |
| Total from investment operations | .40 | 1.21 | 1.35 | (.30) | .77 |
| Distributions from net investment income | (.22) | (.18) | (.19) | (.21) | (.23) |
| Distributions from net realized gain | (.92) | (.62) | (.36) | (.41) | (.64) |
| Total distributions | (1.14) | (.81)B | (.55) | (.63)C | (.87) |
| Net asset value, end of period | $12.97 | $13.71 | $13.31 | $12.51 | $13.44 |
| Total ReturnD,E | 3.40% | 9.15% | 11.17% | (2.35)% | 5.82% |
| Ratios to Average Net AssetsF,G | | | | | |
| Expenses before reductions | .86% | .76% | .25% | .25% | .25% |
| Expenses net of fee waivers, if any | .86% | .76% | .25% | .25% | .25% |
| Expenses net of all reductions | .86% | .76% | .25% | .25% | .25% |
| Net investment income (loss) | 1.68% | 1.18% | 1.46% | 1.62% | 1.59% |
| Supplemental Data | | | | | |
| Net assets, end of period (000 omitted) | $1,038,299 | $1,196,128 | $1,315,261 | $1,442,826 | $1,775,399 |
| Portfolio turnover rateG | 22% | 20% | 19% | 20% | 21% |
A Calculated based on average shares outstanding during the period.
B Total distributions of $.81 per share is comprised of distributions from net investment income of $.184 and distributions from net realized gain of $.621 per share.
C Total distributions of $.63 per share is comprised of distributions from net investment income of $.214 and distributions from net realized gain of $.411 per share.
D Total returns would have been lower if certain expenses had not been reduced during the applicable periods shown.
E Total returns do not include the effect of the sales charges.
F Expense ratios reflect operating expenses of the class. Expenses before reductions do not reflect amounts reimbursed by the investment adviser or reductions from expense offset arrangements and do not represent the amount paid by the class during periods when reimbursements or reductions occur. Expenses net of fee waivers reflect expenses after reimbursement by the investment adviser but prior to reductions from expense offset arrangements. Expenses net of all reductions represent the net expenses paid by the class but do not include expenses of the underlying funds in which the Fund invests.
G Amounts do not include the activity of the Underlying Funds.
See accompanying notes which are an integral part of the financial statements.
Fidelity Advisor Freedom 2020 Fund Class M
| Years ended March 31, | 2019 | 2018 | 2017 | 2016 | 2015 |
| Selected Per–Share Data | | | | | |
| Net asset value, beginning of period | $13.71 | $13.30 | $12.51 | $13.44 | $13.54 |
| Income from Investment Operations | | | | | |
| Net investment income (loss)A | .19 | .13 | .15 | .18 | .18 |
| Net realized and unrealized gain (loss) | .17 | 1.05 | 1.16 | (.52) | .55 |
| Total from investment operations | .36 | 1.18 | 1.31 | (.34) | .73 |
| Distributions from net investment income | (.19) | (.15) | (.16) | (.18) | (.19) |
| Distributions from net realized gain | (.92) | (.62) | (.36) | (.41) | (.64) |
| Total distributions | (1.11) | (.77) | (.52) | (.59) | (.83) |
| Net asset value, end of period | $12.96 | $13.71 | $13.30 | $12.51 | $13.44 |
| Total ReturnB,C | 3.07% | 8.97% | 10.81% | (2.59)% | 5.56% |
| Ratios to Average Net AssetsD,E | | | | | |
| Expenses before reductions | 1.11% | 1.01% | .50% | .50% | .50% |
| Expenses net of fee waivers, if any | 1.11% | 1.01% | .50% | .50% | .50% |
| Expenses net of all reductions | 1.11% | 1.01% | .50% | .50% | .50% |
| Net investment income (loss) | 1.43% | .92% | 1.21% | 1.37% | 1.34% |
| Supplemental Data | | | | | |
| Net assets, end of period (000 omitted) | $345,810 | $374,470 | $396,330 | $394,406 | $440,674 |
| Portfolio turnover rateE | 22% | 20% | 19% | 20% | 21% |
A Calculated based on average shares outstanding during the period.
B Total returns would have been lower if certain expenses had not been reduced during the applicable periods shown.
C Total returns do not include the effect of the sales charges.
D Expense ratios reflect operating expenses of the class. Expenses before reductions do not reflect amounts reimbursed by the investment adviser or reductions from expense offset arrangements and do not represent the amount paid by the class during periods when reimbursements or reductions occur. Expenses net of fee waivers reflect expenses after reimbursement by the investment adviser but prior to reductions from expense offset arrangements. Expenses net of all reductions represent the net expenses paid by the class but do not include expenses of the underlying funds in which the Fund invests.
E Amounts do not include the activity of the Underlying Funds.
See accompanying notes which are an integral part of the financial statements.
Fidelity Advisor Freedom 2020 Fund Class C
| Years ended March 31, | 2019 | 2018 | 2017 | 2016 | 2015 |
| Selected Per–Share Data | | | | | |
| Net asset value, beginning of period | $13.60 | $13.20 | $12.42 | $13.35 | $13.45 |
| Income from Investment Operations | | | | | |
| Net investment income (loss)A | .12 | .06 | .09 | .11 | .11 |
| Net realized and unrealized gain (loss) | .17 | 1.05 | 1.15 | (.51) | .55 |
| Total from investment operations | .29 | 1.11 | 1.24 | (.40) | .66 |
| Distributions from net investment income | (.14) | (.09) | (.10) | (.12) | (.12) |
| Distributions from net realized gain | (.90) | (.62) | (.36) | (.41) | (.64) |
| Total distributions | (1.03)B | (.71) | (.46) | (.53) | (.76) |
| Net asset value, end of period | $12.86 | $13.60 | $13.20 | $12.42 | $13.35 |
| Total ReturnC,D | 2.55% | 8.45% | 10.26% | (3.11)% | 5.07% |
| Ratios to Average Net AssetsE,F | | | | | |
| Expenses before reductions | 1.61% | 1.52% | 1.00% | 1.00% | 1.00% |
| Expenses net of fee waivers, if any | 1.61% | 1.52% | 1.00% | 1.00% | 1.00% |
| Expenses net of all reductions | 1.61% | 1.52% | 1.00% | 1.00% | 1.00% |
| Net investment income (loss) | .93% | .42% | .71% | .87% | .84% |
| Supplemental Data | | | | | |
| Net assets, end of period (000 omitted) | $63,123 | $98,878 | $101,268 | $105,128 | $112,535 |
| Portfolio turnover rateF | 22% | 20% | 19% | 20% | 21% |
A Calculated based on average shares outstanding during the period.
B Total distributions of $1.03 per share is comprised of distributions from net investment income of $.137 and distributions from net realized gain of $.895 per share.
C Total returns would have been lower if certain expenses had not been reduced during the applicable periods shown.
D Total returns do not include the effect of the contingent deferred sales charge.
E Expense ratios reflect operating expenses of the class. Expenses before reductions do not reflect amounts reimbursed by the investment adviser or reductions from expense offset arrangements and do not represent the amount paid by the class during periods when reimbursements or reductions occur. Expenses net of fee waivers reflect expenses after reimbursement by the investment adviser but prior to reductions from expense offset arrangements. Expenses net of all reductions represent the net expenses paid by the class but do not include expenses of the underlying funds in which the Fund invests.
F Amounts do not include the activity of the Underlying Funds.
See accompanying notes which are an integral part of the financial statements.
Fidelity Advisor Freedom 2020 Fund Class I
| Years ended March 31, | 2019 | 2018 | 2017 | 2016 | 2015 |
| Selected Per–Share Data | | | | | |
| Net asset value, beginning of period | $13.82 | $13.41 | $12.61 | $13.54 | $13.63 |
| Income from Investment Operations | | | | | |
| Net investment income (loss)A | .26 | .20 | .22 | .24 | .25 |
| Net realized and unrealized gain (loss) | .17 | 1.05 | 1.16 | (.51) | .56 |
| Total from investment operations | .43 | 1.25 | 1.38 | (.27) | .81 |
| Distributions from net investment income | (.26) | (.22) | (.22) | (.25) | (.26) |
| Distributions from net realized gain | (.92) | (.62) | (.36) | (.41) | (.64) |
| Total distributions | (1.18) | (.84) | (.58) | (.66) | (.90) |
| Net asset value, end of period | $13.07 | $13.82 | $13.41 | $12.61 | $13.54 |
| Total ReturnB | 3.61% | 9.45% | 11.36% | (2.07)% | 6.13% |
| Ratios to Average Net AssetsC,D | | | | | |
| Expenses before reductions | .61% | .52% | –%E | –%E | –%E |
| Expenses net of fee waivers, if any | .61% | .52% | -% | -% | -% |
| Expenses net of all reductions | .61% | .52% | -% | -% | -% |
| Net investment income (loss) | 1.92% | 1.42% | 1.71% | 1.87% | 1.84% |
| Supplemental Data | | | | | |
| Net assets, end of period (000 omitted) | $795,372 | $803,562 | $743,042 | $767,908 | $836,880 |
| Portfolio turnover rateD | 22% | 20% | 19% | 20% | 21% |
A Calculated based on average shares outstanding during the period.
B Total returns would have been lower if certain expenses had not been reduced during the applicable periods shown.
C Expense ratios reflect operating expenses of the class. Expenses before reductions do not reflect amounts reimbursed by the investment adviser or reductions from expense offset arrangements and do not represent the amount paid by the class during periods when reimbursements or reductions occur. Expenses net of fee waivers reflect expenses after reimbursement by the investment adviser but prior to reductions from expense offset arrangements. Expenses net of all reductions represent the net expenses paid by the class but do not include expenses of the underlying funds in which the Fund invests.
D Amounts do not include the activity of the Underlying Funds.
E Amount represents less than .005%.
See accompanying notes which are an integral part of the financial statements.
Fidelity Advisor Freedom 2020 Fund Class Z
| Year ended March 31, | 2019 A |
| Selected Per–Share Data | |
| Net asset value, beginning of period | $13.69 |
| Income from Investment Operations | |
| Net investment income (loss)B | .21 |
| Net realized and unrealized gain (loss) | (.15)C |
| Total from investment operations | .06 |
| Distributions from net investment income | (.30) |
| Distributions from net realized gain | (.43) |
| Total distributions | (.73) |
| Net asset value, end of period | $13.02 |
| Total ReturnD,E | .91% |
| Ratios to Average Net AssetsF,G | |
| Expenses before reductions | .54%H,I |
| Expenses net of fee waivers, if any | .54%H,I |
| Expenses net of all reductions | .54%H,I |
| Net investment income (loss) | 3.41%H |
| Supplemental Data | |
| Net assets, end of period (000 omitted) | $2,585 |
| Portfolio turnover rateG | 22% |
A For the period October 2, 2018 (commencement of sale of shares) to March 31, 2019.
B Calculated based on average shares outstanding during the period.
C The amount shown for a share outstanding does not correspond with the aggregate net gain (loss) on investments for the period due to the timing of sales and repurchases of shares in relation to fluctuating market values of the investments of the Fund.
D Total returns for periods of less than one year are not annualized.
E Total returns would have been lower if certain expenses had not been reduced during the applicable periods shown.
F Expense ratios reflect operating expenses of the class. Expenses before reductions do not reflect amounts reimbursed by the investment adviser or reductions from expense offset arrangements and do not represent the amount paid by the class during periods when reimbursements or reductions occur. Expense ratios before reductions for start-up periods may not be representative of longer-term operating periods. Expenses net of fee waivers reflect expenses after reimbursement by the investment adviser but prior to reductions from expense offset arrangements. Expenses net of all reductions represent the net expenses paid by the class but do not include expenses of the underlying funds in which the Fund invests.
G Amounts do not include the activity of the Underlying Funds.
H Annualized
I On certain classes, the size and fluctuation of net assets and expense amounts may cause ratios to differ from contractual rates.
See accompanying notes which are an integral part of the financial statements.
Fidelity Advisor Freedom 2020 Fund Class Z6
| Years ended March 31, | 2019 | 2018 A |
| Selected Per–Share Data | | |
| Net asset value, beginning of period | $13.81 | $13.62 |
| Income from Investment Operations | | |
| Net investment income (loss)B | .28 | .08 |
| Net realized and unrealized gain (loss) | .17 | .75 |
| Total from investment operations | .45 | .83 |
| Distributions from net investment income | (.30) | (.23) |
| Distributions from net realized gain | (.92) | (.41) |
| Total distributions | (1.22) | (.64) |
| Net asset value, end of period | $13.04 | $13.81 |
| Total ReturnC,D | 3.76% | 6.08% |
| Ratios to Average Net AssetsE,F | | |
| Expenses before reductions | .43% | .45%G,H |
| Expenses net of fee waivers, if any | .43% | .45%G,H |
| Expenses net of all reductions | .43% | .45%G,H |
| Net investment income (loss) | 2.10% | .71%G |
| Supplemental Data | | |
| Net assets, end of period (000 omitted) | $45,686 | $29,132 |
| Portfolio turnover rateF | 22% | 20% |
A For the period June 6, 2017 (commencement of sale of shares) to March 31, 2018.
B Calculated based on average shares outstanding during the period.
C Total returns for periods of less than one year are not annualized.
D Total returns would have been lower if certain expenses had not been reduced during the applicable periods shown.
E Expense ratios reflect operating expenses of the class. Expenses before reductions do not reflect amounts reimbursed by the investment adviser or reductions from expense offset arrangements and do not represent the amount paid by the class during periods when reimbursements or reductions occur. Expenses net of fee waivers reflect expenses after reimbursement by the investment adviser but prior to reductions from expense offset arrangements. Expenses net of all reductions represent the net expenses paid by the class but do not include expenses of the underlying funds in which the Fund invests.
F Amounts do not include the activity of the Underlying Funds.
G Annualized
H On certain classes, the size and fluctuation of net assets may cause rounding of expense amounts and ratios to differ from contractual rates.
See accompanying notes which are an integral part of the financial statements.
Fidelity Advisor Freedom® 2025 Fund
Investment Summary (Unaudited)
The information in the following tables is based on the direct investments of the Fund.
Top Holdings as of March 31, 2019
| | % of fund's net assets |
| Fidelity Series Investment Grade Bond Fund | 19.9 |
| Fidelity Series Large Cap Stock Fund | 7.7 |
| Fidelity Series Emerging Markets Opportunities Fund | 6.9 |
| Fidelity Series International Growth Fund | 6.3 |
| Fidelity Series International Value Fund | 6.0 |
| Fidelity Series Long-Term Treasury Bond Index Fund | 5.6 |
| Fidelity Series Stock Selector Large Cap Value Fund | 5.1 |
| Fidelity Series Value Discovery Fund | 5.0 |
| Fidelity Advisor Series Equity Growth Fund | 4.6 |
| Fidelity Series Government Money Market Fund 2.50% | 4.6 |
| | 71.7 |
Asset Allocation (% of fund's net assets)
| Period end |
| | Domestic Equity Funds | 39.9% |
| | International Equity Funds | 22.0% |
| | Bond Funds | 32.0% |
| | Short-Term Funds | 6.1% |
| | Short-Term Investments | 0.1% |
| | Net Other Assets (Liabilities)* | (0.1)% |

* Net Other Assets (Liabilities) are not included in the pie chart
Domestic Equity Funds category includes Fidelity Series Commodity Strategy Fund which invests in commodity-related investments.
Fidelity Advisor Freedom® 2025 Fund
Schedule of Investments March 31, 2019
Showing Percentage of Net Assets
| U.S. Treasury Obligations - 0.1% | | | |
| | | Principal Amount | Value |
| U.S. Treasury Bills, yield at date of purchase 2.37% to 2.43% 4/4/19 to 6/27/19 (a) | | | |
| (Cost $1,826,175) | | 1,830,000 | 1,826,227 |
| | | Shares | Value |
|
| Domestic Equity Funds - 39.9% | | | |
| Fidelity Advisor Series Equity Growth Fund (b) | | 9,611,594 | $133,889,507 |
| Fidelity Advisor Series Growth Opportunities Fund (b) | | 6,378,703 | 92,236,051 |
| Fidelity Advisor Series Small Cap Fund (b) | | 5,683,046 | 59,558,327 |
| Fidelity Series All-Sector Equity Fund (b) | | 6,231,055 | 60,005,061 |
| Fidelity Series Commodity Strategy Fund (b) | | 14,216,642 | 67,813,381 |
| Fidelity Series Large Cap Stock Fund (b) | | 15,337,663 | 224,696,763 |
| Fidelity Series Large Cap Value Index Fund (b) | | 2,006,005 | 24,894,526 |
| Fidelity Series Opportunistic Insights Fund (b) | | 7,110,651 | 124,294,179 |
| Fidelity Series Small Cap Opportunities Fund (b) | | 5,712,373 | 76,888,547 |
| Fidelity Series Stock Selector Large Cap Value Fund (b) | | 12,545,280 | 148,034,308 |
| Fidelity Series Value Discovery Fund (b) | | 11,627,280 | 145,224,728 |
| TOTAL DOMESTIC EQUITY FUNDS | | | |
| (Cost $974,445,843) | | | 1,157,535,378 |
|
| International Equity Funds - 22.0% | | | |
| Fidelity Series Canada Fund (b) | | 1,853,782 | 19,112,491 |
| Fidelity Series Emerging Markets Fund (b) | | 2,184,673 | 21,387,953 |
| Fidelity Series Emerging Markets Opportunities Fund (b) | | 10,820,158 | 200,497,526 |
| Fidelity Series International Growth Fund (b) | | 11,983,959 | 182,036,344 |
| Fidelity Series International Small Cap Fund (b) | | 2,770,399 | 43,024,293 |
| Fidelity Series International Value Fund (b) | | 18,707,852 | 173,983,022 |
| TOTAL INTERNATIONAL EQUITY FUNDS | | | |
| (Cost $527,628,498) | | | 640,041,629 |
|
| Bond Funds - 32.0% | | | |
| Fidelity Series Emerging Markets Debt Fund (b) | | 2,092,974 | 20,071,618 |
| Fidelity Series Floating Rate High Income Fund (b) | | 426,168 | 3,950,579 |
| Fidelity Series High Income Fund (b) | | 2,799,617 | 26,316,404 |
| Fidelity Series Inflation-Protected Bond Index Fund (b) | | 12,364,069 | 120,920,595 |
| Fidelity Series International Credit Fund (b) | | 159,799 | 1,580,415 |
| Fidelity Series Investment Grade Bond Fund (b) | | 51,747,904 | 578,541,563 |
| Fidelity Series Long-Term Treasury Bond Index Fund (b) | | 18,426,361 | 163,441,825 |
| Fidelity Series Real Estate Income Fund (b) | | 1,270,720 | 13,863,553 |
| TOTAL BOND FUNDS | | | |
| (Cost $925,260,106) | | | 928,686,552 |
|
| Short-Term Funds - 6.1% | | | |
| Fidelity Cash Central Fund, 2.48% (c) | | 10,346,269 | 10,348,339 |
| Fidelity Series Government Money Market Fund 2.50%(b)(d) | | 133,487,839 | 133,487,839 |
| Fidelity Series Short-Term Credit Fund (b) | | 3,369,344 | 33,592,360 |
| TOTAL SHORT-TERM FUNDS | | | |
| (Cost $177,423,266) | | | 177,428,538 |
| TOTAL INVESTMENT IN SECURITIES - 100.1% | | | |
| (Cost $2,606,583,888) | | | 2,905,518,324 |
| NET OTHER ASSETS (LIABILITIES) - (0.1)% | | | (2,304,206) |
| NET ASSETS - 100% | | | $2,903,214,118 |
| Futures Contracts | | | | | |
| | Number of contracts | Expiration Date | Notional Amount | Value | Unrealized Appreciation/(Depreciation) |
| Purchased | | | | | |
| Treasury Contracts | | | | | |
| CBOT 2-Year U.S. Treasury Note Contracts (United States) | 15 | June 2019 | $3,196,406 | $13,925 | $13,925 |
| CBOT 5-Year U.S. Treasury Note Contracts (United States) | 37 | June 2019 | 4,285,641 | 48,777 | 48,777 |
| CBOT 10-Year U.S. Treasury Note Contracts (United States) | 26 | June 2019 | 3,229,688 | 60,070 | 60,070 |
| CBOT Long Term U.S. Treasury Bond Contracts (United States) | 12 | June 2019 | 1,795,875 | 62,974 | 62,974 |
| CBOT Ultra Long Term U.S. Treasury Bond Contracts (United States) | 13 | June 2019 | 2,184,000 | 108,694 | 108,694 |
|
| TOTAL PURCHASED | | | | | 294,441 |
|
| Sold | | | | | |
| Equity Index Contracts | | | | | |
| CME E-mini S&P 500 Index Contracts (United States) | 89 | June 2019 | 12,628,210 | (382,230) | (382,230) |
| ICE E-mini MSCI Emerging Markets Index Contracts (United States) | 163 | June 2019 | 8,617,810 | (160,690) | (160,690) |
|
| TOTAL SOLD | | | | | (542,920) |
|
| TOTAL FUTURES CONTRACTS | | | | | $(248,479) |
The notional amount of futures purchased as a percentage of Net Assets is 0.5%
The notional amount of futures sold as a percentage of Net Assets is 0.7%
Legend
(a) Security or a portion of the security was pledged to cover margin requirements for futures contracts. At period end, the value of securities pledged amounted to $1,826,227.
(b) Affiliated Fund
(c) Affiliated fund that is generally available only to investment companies and other accounts managed by Fidelity Investments. The rate quoted is the annualized seven-day yield of the fund at period end. A complete unaudited listing of the fund's holdings as of its most recent quarter end is available upon request. In addition, each Fidelity Central Fund's financial statements, which are not covered by the Fund's Report of Independent Registered Public Accounting Firm, are available on the SEC's website or upon request.
(d) The rate quoted is the annualized seven-day yield of the fund at period end.
Affiliated Central Funds
Information regarding fiscal year to date income earned by the Fund from investments in Fidelity Central Funds is as follows:
| Fund | Income earned |
| Fidelity Cash Central Fund | $75,190 |
| Total | $75,190 |
Amounts in the income column in the above table include any capital gain distributions from underlying funds, which are presented in the corresponding line-item in the Statement of Operations, if applicable.
Affiliated Underlying Funds
Fiscal year to date information regarding the Fund's investments in affiliated Underlying Funds, excluding any Money Market Central Funds, is presented below. Exchanges between classes of the same affiliated Underlying Funds may occur.
| Affiliate | Value, beginning of period | Purchases | Sales Proceeds | Dividend Income | Realized Gain (loss) | Change in Unrealized appreciation (depreciation) | Value, end of period |
| Fidelity Advisor Series Equity Growth Fund | $131,910,093 | $16,586,889 | $20,953,834 | $10,012,542 | $1,489,705 | $4,856,654 | $133,889,507 |
| Fidelity Advisor Series Equity Value Fund | 152,092,384 | 7,220,187 | 8,850,175 | 4,975,873 | 15,369 | (27,114,731) | -- |
| Fidelity Advisor Series Growth & Income Fund | 232,877,392 | 23,627,036 | 19,584,205 | 20,284,891 | 893,424 | (40,937,622) | -- |
| Fidelity Advisor Series Growth Opportunities Fund | 86,630,974 | 18,940,086 | 27,428,685 | 15,630,033 | 7,142,729 | 6,950,947 | 92,236,051 |
| Fidelity Advisor Series Opportunistic Insights Fund | 122,841,576 | 11,177,854 | 11,719,625 | 9,443,105 | 1,028,545 | (49,877,717) | -- |
| Fidelity Advisor Series Small Cap Fund | 66,053,566 | 8,750,758 | 9,066,900 | 5,632,562 | 380,106 | (6,559,203) | 59,558,327 |
| Fidelity Advisor Series Stock Selector Large Cap Value Fund | 153,544,687 | 14,783,410 | 9,378,405 | 12,604,505 | (25,500) | (27,284,594) | -- |
| Fidelity Series 100 Index Fund | 65,608,385 | -- | 69,164,115 | -- | 30,450,312 | (26,894,582) | -- |
| Fidelity Series All-Sector Equity Fund | 90,515,999 | 20,493,107 | 43,524,776 | 14,792,803 | 7,713,695 | (15,192,964) | 60,005,061 |
| Fidelity Series Canada Fund | 18,652,399 | 2,947,089 | 2,852,818 | 419,089 | 6,592 | 359,229 | 19,112,491 |
| Fidelity Series Commodity Strategy Fund | 64,190,392 | 23,403,429 | 12,075,654 | 4,041,063 | (4,573,029) | (3,131,757) | 67,813,381 |
| Fidelity Series Emerging Markets Debt Fund | 21,250,839 | 1,883,708 | 2,027,754 | 1,223,902 | (44,604) | (990,571) | 20,071,618 |
| Fidelity Series Emerging Markets Fund | -- | 21,930,929 | 994,129 | 84,354 | (16,200) | 467,353 | 21,387,953 |
| Fidelity Series Emerging Markets Opportunities Fund | 200,253,721 | 50,827,832 | 20,695,841 | 15,607,024 | (467,521) | (29,420,665) | 200,497,526 |
| Fidelity Series Floating Rate High Income Fund | 6,978,916 | 578,273 | 3,483,662 | 361,276 | (181,223) | 58,275 | 3,950,579 |
| Fidelity Series Government Money Market Fund 2.50% | 191,905,833 | 41,963,821 | 100,381,815 | 3,250,411 | -- | -- | 133,487,839 |
| Fidelity Series High Income Fund | 42,751,545 | 3,862,483 | 19,807,538 | 2,492,157 | (829,552) | 339,466 | 26,316,404 |
| Fidelity Series Inflation-Protected Bond Index Fund | 24,067,874 | 106,842,583 | 10,407,136 | 2,161,275 | (110,685) | 527,959 | 120,920,595 |
| Fidelity Series International Credit Fund | 1,507,928 | 76,431 | -- | 76,431 | -- | (3,944) | 1,580,415 |
| Fidelity Series International Growth Fund | 190,574,782 | 32,840,221 | 31,956,066 | 11,668,532 | 3,415,311 | (12,837,904) | 182,036,344 |
| Fidelity Series International Small Cap Fund | 47,564,731 | 8,792,227 | 6,113,867 | 3,885,135 | 600,331 | (7,819,129) | 43,024,293 |
| Fidelity Series International Value Fund | 190,117,014 | 26,467,929 | 20,589,653 | 6,395,227 | 260,105 | (22,272,373) | 173,983,022 |
| Fidelity Series Investment Grade Bond Fund | 663,099,615 | 52,822,153 | 144,501,583 | 19,385,367 | (6,656,630) | 13,778,008 | 578,541,563 |
| Fidelity Series Large Cap Stock Fund | -- | 14,693,843 | 13,324,364 | 9,191,045 | (483,263) | 26,934,522 | 224,696,763 |
| Fidelity Series Large Cap Value Index Fund | 25,669,107 | 2,174,792 | 3,229,703 | 1,165,777 | 267,550 | 12,780 | 24,894,526 |
| Fidelity Series Long-Term Treasury Bond Index Fund | 67,087,281 | 115,604,173 | 25,730,307 | 4,045,380 | (806,176) | 7,286,854 | 163,441,825 |
| Fidelity Series Opportunistic Insights Fund | -- | 16,095,112 | 6,920,186 | 10,190,604 | (461,617) | 42,130,237 | 124,294,179 |
| Fidelity Series Real Estate Equity Fund | 15,933,541 | 90,689 | 16,421,405 | 77,109 | 1,659,698 | (1,262,523) | -- |
| Fidelity Series Real Estate Income Fund | 13,677,837 | 1,519,858 | 1,587,932 | 1,003,044 | (1,949) | 255,739 | 13,863,553 |
| Fidelity Series Short-Term Credit Fund | 43,250,992 | 2,456,620 | 12,479,598 | 981,940 | (133,486) | 497,832 | 33,592,360 |
| Fidelity Series Small Cap Opportunities Fund | 80,597,666 | 13,175,015 | 12,998,805 | 8,961,104 | 1,321,642 | (5,206,971) | 76,888,547 |
| Fidelity Series Stock Selector Large Cap Value Fund | -- | 16,296,128 | 8,760,819 | 12,664,557 | (429,043) | 9,288,444 | 148,034,308 |
| Fidelity Series Value Discovery Fund | -- | 12,435,319 | 8,560,421 | 8,900,329 | (332,365) | 18,319,161 | 145,224,728 |
| | $3,011,207,069 | $691,359,984 | $705,571,776 | $221,608,446 | $41,092,271 | $(144,743,790) | $2,893,343,758 |
Amounts in the income column in the above table include any capital gain distributions from underlying funds, which are presented in the corresponding line-item in the Statement of Operations, if applicable.
Investment Valuation
The following is a summary of the inputs used, as of March 31, 2019, involving the Fund's assets and liabilities carried at fair value. The inputs or methodology used for valuing securities may not be an indication of the risk associated with investing in those securities. For more information on valuation inputs, and their aggregation into the levels used below, please refer to the Investment Valuation section in the accompanying Notes to Financial Statements.
| | Valuation Inputs at Reporting Date: |
| Description | Total | Level 1 | Level 2 | Level 3 |
| Investments in Securities: | | | | |
| Other Short-Term Investments | $1,826,227 | $-- | $1,826,227 | $-- |
| Domestic Equity Funds | 1,157,535,378 | 1,157,535,378 | -- | -- |
| International Equity Funds | 640,041,629 | 640,041,629 | -- | -- |
| Bond Funds | 928,686,552 | 928,686,552 | -- | -- |
| Short-Term Funds | 177,428,538 | 177,428,538 | -- | -- |
| Total Investments in Securities: | $2,905,518,324 | $2,903,692,097 | $1,826,227 | $-- |
| Derivative Instruments: | | | | |
| Assets | | | | |
| Futures Contracts | $294,441 | $294,441 | $-- | $-- |
| Total Assets | $294,441 | $294,441 | $-- | $-- |
| Liabilities | | | | |
| Futures Contracts | $(542,920) | $(542,920) | $-- | $-- |
| Total Liabilities | $(542,920) | $(542,920) | $-- | $-- |
| Total Derivative Instruments: | $(248,479) | $(248,479) | $-- | $-- |
Value of Derivative Instruments
The following table is a summary of the Fund's value of derivative instruments by primary risk exposure as of March 31, 2019. For additional information on derivative instruments, please refer to the Derivative Instruments section in the accompanying Notes to Financial Statements.
| Primary Risk Exposure / Derivative Type | Value |
| | Asset | Liability |
| Equity Risk | | |
| Futures Contracts(a) | $0 | $(542,920) |
| Total Equity Risk | 0 | (542,920) |
| Interest Rate Risk | | |
| Futures Contracts(a) | 294,441 | 0 |
| Total Interest Rate Risk | 294,441 | 0 |
| Total Value of Derivatives | $294,441 | $(542,920) |
(a) Reflects gross cumulative appreciation (depreciation) on futures contracts as presented in the Schedule of Investments. In the Statement of Assets and Liabilities, the period end daily variation margin is included in receivable or payable for daily variation margin on futures contracts, and the net cumulative appreciation (depreciation) is included in distributable earnings.
See accompanying notes which are an integral part of the financial statements.
Fidelity Advisor Freedom® 2025 Fund
Financial Statements
Statement of Assets and Liabilities
| | | March 31, 2019 |
| Assets | | |
Investment in securities, at value — See accompanying schedule:
Unaffiliated issuers (cost $1,826,175) | $1,826,227 | |
| Fidelity Central Funds (cost $10,348,307) | 10,348,339 | |
| Other affiliated issuers (cost $2,594,409,406) | 2,893,343,758 | |
| Total Investment in Securities (cost $2,606,583,888) | | $2,905,518,324 |
| Receivable for investments sold | | 9,382,752 |
| Receivable for fund shares sold | | 2,844,954 |
| Distributions receivable from Fidelity Central Funds | | 20,221 |
| Total assets | | 2,917,766,251 |
| Liabilities | | |
| Payable for investments purchased | $8,591,715 | |
| Payable for fund shares redeemed | 3,624,838 | |
| Distributions payable | 117 | |
| Accrued management fee | 1,553,806 | |
| Distribution and service plan fees payable | 506,289 | |
| Payable for daily variation margin on futures contracts | 275,368 | |
| Total liabilities | | 14,552,133 |
| Net Assets | | $2,903,214,118 |
| Net Assets consist of: | | |
| Paid in capital | | $2,510,350,649 |
| Total distributable earnings (loss) | | 392,863,469 |
| Net Assets | | $2,903,214,118 |
| Net Asset Value and Maximum Offering Price | | |
| Class A: | | |
| Net Asset Value and redemption price per share ($1,304,019,750 ÷ 100,375,645 shares) | | $12.99 |
| Maximum offering price per share (100/94.25 of $12.99) | | $13.78 |
| Class M: | | |
| Net Asset Value and redemption price per share ($423,583,858 ÷ 32,547,169 shares) | | $13.01 |
| Maximum offering price per share (100/96.50 of $13.01) | | $13.48 |
| Class C: | | |
| Net Asset Value and offering price per share ($64,691,397 ÷ 5,053,888 shares)(a) | | $12.80 |
| Class I: | | |
| Net Asset Value, offering price and redemption price per share ($1,051,420,038 ÷ 80,199,660 shares) | | $13.11 |
| Class Z: | | |
| Net Asset Value, offering price and redemption price per share ($3,395,832 ÷ 260,152 shares) | | $13.05 |
| Class Z6: | | |
| Net Asset Value, offering price and redemption price per share ($56,103,243 ÷ 4,289,504 shares) | | $13.08 |
(a) Redemption price per share is equal to net asset value less any applicable contingent deferred sales charge.
See accompanying notes which are an integral part of the financial statements.
Statement of Operations
| | | Year ended March 31, 2019 |
| Investment Income | | |
| Dividends: | | |
| Affiliated issuers | | $73,442,962 |
| Interest | | 26,812 |
| Income from Fidelity Central Funds | | 75,190 |
| Total income | | 73,544,964 |
| Expenses | | |
| Management fee | $18,894,516 | |
| Distribution and service plan fees | 6,368,226 | |
| Independent trustees' fees and expenses | 13,849 | |
| Total expenses before reductions | 25,276,591 | |
| Expense reductions | (168) | |
| Total expenses after reductions | | 25,276,423 |
| Net investment income (loss) | | 48,268,541 |
| Realized and Unrealized Gain (Loss) | | |
| Net realized gain (loss) on: | | |
| Investment securities: | | |
| Unaffiliated issuers | 5,600 | |
| Fidelity Central Funds | (59) | |
| Other affiliated issuers | 41,092,271 | |
| Futures contracts | 3,744,632 | |
| Capital gain distributions from underlying funds: | | |
| Affiliated issuers | 148,165,484 | |
| Total net realized gain (loss) | | 193,007,928 |
| Change in net unrealized appreciation (depreciation) on: | | |
| Investment securities: | | |
| Unaffiliated issuers | 65 | |
| Fidelity Central Funds | 32 | |
| Other affiliated issuers | (144,743,790) | |
| Futures contracts | (248,479) | |
| Total change in net unrealized appreciation (depreciation) | | (144,992,172) |
| Net gain (loss) | | 48,015,756 |
| Net increase (decrease) in net assets resulting from operations | | $96,284,297 |
See accompanying notes which are an integral part of the financial statements.
Statement of Changes in Net Assets
| | Year ended March 31, 2019 | Year ended March 31, 2018 |
| Increase (Decrease) in Net Assets | | |
| Operations | | |
| Net investment income (loss) | $48,268,541 | $33,835,159 |
| Net realized gain (loss) | 193,007,928 | 183,273,762 |
| Change in net unrealized appreciation (depreciation) | (144,992,172) | 66,482,962 |
| Net increase (decrease) in net assets resulting from operations | 96,284,297 | 283,591,883 |
| Distributions to shareholders | (246,718,993) | – |
| Distributions to shareholders from net investment income | – | (38,001,071) |
| Distributions to shareholders from net realized gain | – | (117,185,415) |
| Total distributions | (246,718,993) | (155,186,486) |
| Share transactions - net increase (decrease) | 44,282,154 | (18,870,598) |
| Total increase (decrease) in net assets | (106,152,542) | 109,534,799 |
| Net Assets | | |
| Beginning of period | 3,009,366,660 | 2,899,831,861 |
| End of period | $2,903,214,118 | $3,009,366,660 |
| Other Information | | |
| Undistributed net investment income end of period | | $174,202 |
See accompanying notes which are an integral part of the financial statements.
Financial Highlights
Fidelity Advisor Freedom 2025 Fund Class A
| Years ended March 31, | 2019 | 2018 | 2017 | 2016 | 2015 |
| Selected Per–Share Data | | | | | |
| Net asset value, beginning of period | $13.74 | $13.16 | $12.29 | $13.25 | $13.33 |
| Income from Investment Operations | | | | | |
| Net investment income (loss)A | .21 | .15 | .18 | .19 | .21 |
| Net realized and unrealized gain (loss) | .18 | 1.15 | 1.24 | (.54) | .60 |
| Total from investment operations | .39 | 1.30 | 1.42 | (.35) | .81 |
| Distributions from net investment income | (.21) | (.17) | (.18) | (.20) | (.22) |
| Distributions from net realized gain | (.93) | (.55) | (.37) | (.42) | (.67) |
| Total distributions | (1.14) | (.72) | (.55) | (.61)B | (.89) |
| Net asset value, end of period | $12.99 | $13.74 | $13.16 | $12.29 | $13.25 |
| Total ReturnC,D | 3.34% | 9.96% | 12.00% | (2.72)% | 6.26% |
| Ratios to Average Net AssetsE,F | | | | | |
| Expenses before reductions | .90% | .80% | .25% | .25% | .25% |
| Expenses net of fee waivers, if any | .90% | .80% | .25% | .25% | .25% |
| Expenses net of all reductions | .90% | .80% | .25% | .25% | .25% |
| Net investment income (loss) | 1.62% | 1.11% | 1.43% | 1.53% | 1.55% |
| Supplemental Data | | | | | |
| Net assets, end of period (000 omitted) | $1,304,020 | $1,435,987 | $1,503,384 | $1,543,665 | $1,853,121 |
| Portfolio turnover rateE | 24% | 23% | 20% | 24% | 23% |
A Calculated based on average shares outstanding during the period.
B Total distributions of $.61 per share is comprised of distributions from net investment income of $.195 and distributions from net realized gain of $.419 per share.
C Total returns would have been lower if certain expenses had not been reduced during the applicable periods shown.
D Total returns do not include the effect of the sales charges.
E Amounts do not include the activity of the Underlying Funds.
F Expense ratios reflect operating expenses of the class. Expenses before reductions do not reflect amounts reimbursed by the investment adviser or reductions from expense offset arrangements and do not represent the amount paid by the class during periods when reimbursements or reductions occur. Expenses net of fee waivers reflect expenses after reimbursement by the investment adviser but prior to reductions from expense offset arrangements. Expenses net of all reductions represent the net expenses paid by the class but do not include expenses of the underlying funds in which the Fund invests.
See accompanying notes which are an integral part of the financial statements.
Fidelity Advisor Freedom 2025 Fund Class M
| Years ended March 31, | 2019 | 2018 | 2017 | 2016 | 2015 |
| Selected Per–Share Data | | | | | |
| Net asset value, beginning of period | $13.76 | $13.18 | $12.31 | $13.27 | $13.35 |
| Income from Investment Operations | | | | | |
| Net investment income (loss)A | .18 | .12 | .15 | .16 | .17 |
| Net realized and unrealized gain (loss) | .18 | 1.15 | 1.24 | (.54) | .61 |
| Total from investment operations | .36 | 1.27 | 1.39 | (.38) | .78 |
| Distributions from net investment income | (.19) | (.14) | (.15) | (.16) | (.19) |
| Distributions from net realized gain | (.92) | (.55) | (.37) | (.42) | (.67) |
| Total distributions | (1.11) | (.69) | (.52) | (.58) | (.86) |
| Net asset value, end of period | $13.01 | $13.76 | $13.18 | $12.31 | $13.27 |
| Total ReturnB,C | 3.09% | 9.69% | 11.70% | (2.95)% | 6.00% |
| Ratios to Average Net AssetsD,E | | | | | |
| Expenses before reductions | 1.15% | 1.05% | .50% | .50% | .50% |
| Expenses net of fee waivers, if any | 1.15% | 1.05% | .50% | .50% | .50% |
| Expenses net of all reductions | 1.15% | 1.05% | .50% | .50% | .50% |
| Net investment income (loss) | 1.37% | .86% | 1.18% | 1.28% | 1.30% |
| Supplemental Data | | | | | |
| Net assets, end of period (000 omitted) | $423,584 | $432,227 | $418,713 | $399,088 | $405,224 |
| Portfolio turnover rateD | 24% | 23% | 20% | 24% | 23% |
A Calculated based on average shares outstanding during the period.
B Total returns would have been lower if certain expenses had not been reduced during the applicable periods shown.
C Total returns do not include the effect of the sales charges.
D Amounts do not include the activity of the Underlying Funds.
E Expense ratios reflect operating expenses of the class. Expenses before reductions do not reflect amounts reimbursed by the investment adviser or reductions from expense offset arrangements and do not represent the amount paid by the class during periods when reimbursements or reductions occur. Expenses net of fee waivers reflect expenses after reimbursement by the investment adviser but prior to reductions from expense offset arrangements. Expenses net of all reductions represent the net expenses paid by the class but do not include expenses of the underlying funds in which the Fund invests.
See accompanying notes which are an integral part of the financial statements.
Fidelity Advisor Freedom 2025 Fund Class C
| Years ended March 31, | 2019 | 2018 | 2017 | 2016 | 2015 |
| Selected Per–Share Data | | | | | |
| Net asset value, beginning of period | $13.54 | $12.98 | $12.14 | $13.09 | $13.19 |
| Income from Investment Operations | | | | | |
| Net investment income (loss)A | .11 | .05 | .08 | .10 | .11 |
| Net realized and unrealized gain (loss) | .18 | 1.13 | 1.23 | (.53) | .59 |
| Total from investment operations | .29 | 1.18 | 1.31 | (.43) | .70 |
| Distributions from net investment income | (.13) | (.08) | (.10) | (.11) | (.12) |
| Distributions from net realized gain | (.91) | (.54) | (.37) | (.41) | (.67) |
| Total distributions | (1.03)B | (.62) | (.47) | (.52) | (.80)C |
| Net asset value, end of period | $12.80 | $13.54 | $12.98 | $12.14 | $13.09 |
| Total ReturnD,E | 2.59% | 9.14% | 11.13% | (3.40)% | 5.42% |
| Ratios to Average Net AssetsF,G | | | | | |
| Expenses before reductions | 1.65% | 1.55% | 1.00% | 1.00% | 1.00% |
| Expenses net of fee waivers, if any | 1.65% | 1.55% | 1.00% | 1.00% | 1.00% |
| Expenses net of all reductions | 1.65% | 1.55% | 1.00% | 1.00% | 1.00% |
| Net investment income (loss) | .87% | .36% | .68% | .78% | .80% |
| Supplemental Data | | | | | |
| Net assets, end of period (000 omitted) | $64,691 | $97,691 | $97,994 | $91,941 | $94,878 |
| Portfolio turnover rateF | 24% | 23% | 20% | 24% | 23% |
A Calculated based on average shares outstanding during the period.
B Total distributions of $1.03 per share is comprised of distributions from net investment income of $.128 and distributions from net realized gain of $.905 per share.
C Total distributions of $.80 per share is comprised of distributions from net investment income of $.124 and distributions from net realized gain of $.672 per share.
D Total returns would have been lower if certain expenses had not been reduced during the applicable periods shown.
E Total returns do not include the effect of the contingent deferred sales charge.
F Amounts do not include the activity of the Underlying Funds.
G Expense ratios reflect operating expenses of the class. Expenses before reductions do not reflect amounts reimbursed by the investment adviser or reductions from expense offset arrangements and do not represent the amount paid by the class during periods when reimbursements or reductions occur. Expenses net of fee waivers reflect expenses after reimbursement by the investment adviser but prior to reductions from expense offset arrangements. Expenses net of all reductions represent the net expenses paid by the class but do not include expenses of the underlying funds in which the Fund invests.
See accompanying notes which are an integral part of the financial statements.
Fidelity Advisor Freedom 2025 Fund Class I
| Years ended March 31, | 2019 | 2018 | 2017 | 2016 | 2015 |
| Selected Per–Share Data | | | | | |
| Net asset value, beginning of period | $13.86 | $13.27 | $12.39 | $13.35 | $13.43 |
| Income from Investment Operations | | | | | |
| Net investment income (loss)A | .25 | .19 | .21 | .23 | .24 |
| Net realized and unrealized gain (loss) | .18 | 1.16 | 1.26 | (.54) | .60 |
| Total from investment operations | .43 | 1.35 | 1.47 | (.31) | .84 |
| Distributions from net investment income | (.25) | (.21) | (.21) | (.23) | (.25) |
| Distributions from net realized gain | (.93) | (.55) | (.37) | (.42) | (.67) |
| Total distributions | (1.18) | (.76) | (.59)B | (.65) | (.92) |
| Net asset value, end of period | $13.11 | $13.86 | $13.27 | $12.39 | $13.35 |
| Total ReturnC | 3.63% | 10.26% | 12.26% | (2.44)% | 6.48% |
| Ratios to Average Net AssetsD,E | | | | | |
| Expenses before reductions | .65% | .56% | - %F | - %F | - %F |
| Expenses net of fee waivers, if any | .65% | .56% | -% | -% | -% |
| Expenses net of all reductions | .65% | .56% | -% | -% | -% |
| Net investment income (loss) | 1.87% | 1.35% | 1.68% | 1.78% | 1.80% |
| Supplemental Data | | | | | |
| Net assets, end of period (000 omitted) | $1,051,420 | $1,018,536 | $879,740 | $870,772 | $838,616 |
| Portfolio turnover rateD | 24% | 23% | 20% | 24% | 23% |
A Calculated based on average shares outstanding during the period.
B Total distributions of $.59 per share is comprised of distributions from net investment income of $.212 and distributions from net realized gain of $.373 per share.
C Total returns would have been lower if certain expenses had not been reduced during the applicable periods shown.
D Amounts do not include the activity of the Underlying Funds.
E Expense ratios reflect operating expenses of the class. Expenses before reductions do not reflect amounts reimbursed by the investment adviser or reductions from expense offset arrangements and do not represent the amount paid by the class during periods when reimbursements or reductions occur. Expenses net of fee waivers reflect expenses after reimbursement by the investment adviser but prior to reductions from expense offset arrangements. Expenses net of all reductions represent the net expenses paid by the class but do not include expenses of the underlying funds in which the Fund invests.
F Amount represents less than .005%.
See accompanying notes which are an integral part of the financial statements.
Fidelity Advisor Freedom 2025 Fund Class Z
| Year ended March 31, | 2019 A |
| Selected Per–Share Data | |
| Net asset value, beginning of period | $13.78 |
| Income from Investment Operations | |
| Net investment income (loss)B | .03 |
| Net realized and unrealized gain (loss) | (.02)C |
| Total from investment operations | .01 |
| Distributions from net investment income | (.30) |
| Distributions from net realized gain | (.44) |
| Total distributions | (.74) |
| Net asset value, end of period | $13.05 |
| Total ReturnD,E | 0.56% |
| Ratios to Average Net AssetsF,G | |
| Expenses before reductions | .56%H |
| Expenses net of fee waivers, if any | .56%H |
| Expenses net of all reductions | .56%H |
| Net investment income (loss) | .43%H |
| Supplemental Data | |
| Net assets, end of period (000 omitted) | $3,396 |
| Portfolio turnover rateF | 24% |
A For the period October 2, 2018 (commencement of sale of shares) to March 31, 2019.
B Calculated based on average shares outstanding during the period.
C The amount shown for a share outstanding does not correspond with the aggregate net gain (loss) on investments for the period due to the timing of sales and repurchases of shares in relation to fluctuating market values of the investments of the Fund.
D Total returns for periods of less than one year are not annualized.
E Total returns would have been lower if certain expenses had not been reduced during the applicable periods shown.
F Amounts do not include the activity of the Underlying Funds.
G Expense ratios reflect operating expenses of the class. Expenses before reductions do not reflect amounts reimbursed by the investment adviser or reductions from expense offset arrangements and do not represent the amount paid by the class during periods when reimbursements or reductions occur. Expense ratios before reductions for start-up periods may not be representative of longer-term operating periods. Expenses net of fee waivers reflect expenses after reimbursement by the investment adviser but prior to reductions from expense offset arrangements. Expenses net of all reductions represent the net expenses paid by the class but do not include expenses of the underlying funds in which the Fund invests.
H Annualized
See accompanying notes which are an integral part of the financial statements.
Fidelity Advisor Freedom 2025 Fund Class Z6
| Years ended March 31, | 2019 | 2018 A |
| Selected Per–Share Data | | |
| Net asset value, beginning of period | $13.85 | $13.53 |
| Income from Investment Operations | | |
| Net investment income (loss)B | .27 | .10 |
| Net realized and unrealized gain (loss) | .18 | .80 |
| Total from investment operations | .45 | .90 |
| Distributions from net investment income | (.29) | (.22) |
| Distributions from net realized gain | (.93) | (.36) |
| Total distributions | (1.22) | (.58) |
| Net asset value, end of period | $13.08 | $13.85 |
| Total ReturnC,D | 3.85% | 6.61% |
| Ratios to Average Net AssetsE,F | | |
| Expenses before reductions | .45% | .47%G,H |
| Expenses net of fee waivers, if any | .45% | .47%G,H |
| Expenses net of all reductions | .45% | .47%G,H |
| Net investment income (loss) | 2.07% | .89%G |
| Supplemental Data | | |
| Net assets, end of period (000 omitted) | $56,103 | $24,926 |
| Portfolio turnover rateE | 24% | 23% |
A For the period June 6, 2017 (commencement of sale of shares) to March 31, 2018.
B Calculated based on average shares outstanding during the period.
C Total returns for periods of less than one year are not annualized.
D Total returns would have been lower if certain expenses had not been reduced during the applicable periods shown.
E Amounts do not include the activity of the Underlying Funds.
F Expense ratios reflect operating expenses of the class. Expenses before reductions do not reflect amounts reimbursed by the investment adviser or reductions from expense offset arrangements and do not represent the amount paid by the class during periods when reimbursements or reductions occur. Expenses net of fee waivers reflect expenses after reimbursement by the investment adviser but prior to reductions from expense offset arrangements. Expenses net of all reductions represent the net expenses paid by the class but do not include expenses of the underlying funds in which the Fund invests.
G Annualized
H On certain classes, the size and fluctuation of net assets and expense amounts may cause ratios to differ from contractual rates.
See accompanying notes which are an integral part of the financial statements.
Fidelity Advisor Freedom® 2030 Fund
Investment Summary (Unaudited)
The information in the following tables is based on the direct investments of the Fund.
Top Holdings as of March 31, 2019
| | % of fund's net assets |
| Fidelity Series Investment Grade Bond Fund | 15.4 |
| Fidelity Series Large Cap Stock Fund | 9.5 |
| Fidelity Series Emerging Markets Opportunities Fund | 7.8 |
| Fidelity Series International Growth Fund | 7.3 |
| Fidelity Series International Value Fund | 7.1 |
| Fidelity Series Stock Selector Large Cap Value Fund | 6.2 |
| Fidelity Series Value Discovery Fund | 6.1 |
| Fidelity Series Long-Term Treasury Bond Index Fund | 5.7 |
| Fidelity Advisor Series Equity Growth Fund | 5.5 |
| Fidelity Series Opportunistic Insights Fund | 5.2 |
| | 75.8 |
Asset Allocation (% of fund's net assets)
| Period end |
| | Domestic Equity Funds | 47.7% |
| | International Equity Funds | 25.5% |
| | Bond Funds | 24.7% |
| | Short-Term Funds | 2.1% |
| | Short-Term Investments | 0.1% |
| | Net Other Assets (Liabilities)* | (0.1)% |

* Net Other Assets (Liabilities) are not included in the pie chart
Domestic Equity Funds category includes Fidelity Series Commodity Strategy Fund which invests in commodity-related investments.
Fidelity Advisor Freedom® 2030 Fund
Schedule of Investments March 31, 2019
Showing Percentage of Net Assets
| U.S. Treasury Obligations - 0.1% | | | |
| | | Principal Amount | Value |
| U.S. Treasury Bills, yield at date of purchase 2.39% to 2.43% 4/4/19 to 6/27/19 (a) | | | |
| (Cost $2,174,118) | | 2,180,000 | 2,174,206 |
| | | Shares | Value |
|
| Domestic Equity Funds - 47.7% | | | |
| Fidelity Advisor Series Equity Growth Fund (b) | | 11,777,464 | $164,060,070 |
| Fidelity Advisor Series Growth Opportunities Fund (b) | | 7,596,543 | 109,846,006 |
| Fidelity Advisor Series Small Cap Fund (b) | | 7,052,864 | 73,914,014 |
| Fidelity Series All-Sector Equity Fund (b) | | 7,523,395 | 72,450,297 |
| Fidelity Series Commodity Strategy Fund (b) | | 14,443,425 | 68,895,139 |
| Fidelity Series Large Cap Stock Fund (b) | | 19,300,649 | 282,754,506 |
| Fidelity Series Large Cap Value Index Fund (b) | | 2,530,674 | 31,405,664 |
| Fidelity Series Opportunistic Insights Fund (b) | | 8,746,690 | 152,892,141 |
| Fidelity Series Small Cap Opportunities Fund (b) | | 7,102,270 | 95,596,558 |
| Fidelity Series Stock Selector Large Cap Value Fund (b) | | 15,650,297 | 184,673,503 |
| Fidelity Series Value Discovery Fund (b) | | 14,536,166 | 181,556,710 |
| TOTAL DOMESTIC EQUITY FUNDS | | | |
| (Cost $1,209,629,007) | | | 1,418,044,608 |
|
| International Equity Funds - 25.5% | | | |
| Fidelity Series Canada Fund (b) | | 2,214,626 | 22,832,798 |
| Fidelity Series Emerging Markets Fund (b) | | 2,504,607 | 24,520,099 |
| Fidelity Series Emerging Markets Opportunities Fund (b) | | 12,514,253 | 231,889,100 |
| Fidelity Series International Growth Fund (b) | | 14,357,694 | 218,093,372 |
| Fidelity Series International Small Cap Fund(b) | | 3,279,454 | 50,929,926 |
| Fidelity Series International Value Fund (b) | | 22,511,679 | 209,358,613 |
| TOTAL INTERNATIONAL EQUITY FUNDS | | | |
| (Cost $634,137,204) | | | 757,623,908 |
|
| Bond Funds - 24.7% | | | |
| Fidelity Series Emerging Markets Debt Fund (b) | | 2,068,284 | 19,834,842 |
| Fidelity Series Floating Rate High Income Fund (b) | | 420,127 | 3,894,582 |
| Fidelity Series High Income Fund (b) | | 2,818,262 | 26,491,659 |
| Fidelity Series Inflation-Protected Bond Index Fund (b) | | 4,223,474 | 41,305,577 |
| Fidelity Series International Credit Fund (b) | | 156,678 | 1,549,545 |
| Fidelity Series Investment Grade Bond Fund (b) | | 40,897,109 | 457,229,674 |
| Fidelity Series Long-Term Treasury Bond Index Fund (b) | | 19,287,649 | 171,081,450 |
| Fidelity Series Real Estate Income Fund (b) | | 1,270,509 | 13,861,248 |
| TOTAL BOND FUNDS | | | |
| (Cost $729,076,769) | | | 735,248,577 |
|
| Short-Term Funds - 2.1% | | | |
| Fidelity Cash Central Fund, 2.48% (c) | | 12,883,858 | 12,886,435 |
| Fidelity Series Government Money Market Fund 2.50% (b)(d) | | 39,180,732 | 39,180,732 |
| Fidelity Series Short-Term Credit Fund (b) | | 982,906 | 9,799,575 |
| TOTAL SHORT-TERM FUNDS | | | |
| (Cost $61,808,079) | | | 61,866,742 |
| TOTAL INVESTMENT IN SECURITIES - 100.1% | | | |
| (Cost $2,636,825,177) | | | 2,974,958,041 |
| NET OTHER ASSETS (LIABILITIES) - (0.1)% | | | (2,529,012) |
| NET ASSETS - 100% | | | $2,972,429,029 |
| Futures Contracts | | | | | |
| | Number of contracts | Expiration Date | Notional Amount | Value | Unrealized Appreciation/(Depreciation) |
| Purchased | | | | | |
| Treasury Contracts | | | | | |
| CBOT 2-Year U.S. Treasury Note Contracts (United States) | 14 | June 2019 | $2,983,313 | $12,997 | $12,997 |
| CBOT 5-Year U.S. Treasury Note Contracts (United States) | 47 | June 2019 | 5,443,922 | 61,445 | 61,445 |
| CBOT 10-Year U.S. Treasury Note Contracts (United States) | 41 | June 2019 | 5,092,969 | 91,951 | 91,951 |
| CBOT Long Term U.S. Treasury Bond Contracts (United States) | 8 | June 2019 | 1,197,250 | 41,983 | 41,983 |
| CBOT Ultra Long Term U.S. Treasury Bond Contracts (United States) | 6 | June 2019 | 1,008,000 | 50,167 | 50,167 |
|
| TOTAL PURCHASED | | | | | 258,543 |
|
| Sold | | | | | |
| Equity Index Contracts | | | | | |
| CME E-mini S&P 500 Index Contracts (United States) | 99 | June 2019 | 14,047,110 | (425,177) | (425,177) |
| ICE E-mini MSCI Emerging Markets Index Contracts (United States) | 176 | June 2019 | 9,305,120 | (173,505) | (173,505) |
|
| TOTAL SOLD | | | | | (598,682) |
|
| TOTAL FUTURES CONTRACTS | | | | | $(340,139) |
The notional amount of futures purchased as a percentage of Net Assets is 0.5%
The notional amount of futures sold as a percentage of Net Assets is 0.8%
Legend
(a) Security or a portion of the security was pledged to cover margin requirements for futures contracts. At period end, the value of securities pledged amounted to $2,174,206.
(b) Affiliated Fund
(c) Affiliated fund that is generally available only to investment companies and other accounts managed by Fidelity Investments. The rate quoted is the annualized seven-day yield of the fund at period end. A complete unaudited listing of the fund's holdings as of its most recent quarter end is available upon request. In addition, each Fidelity Central Fund's financial statements, which are not covered by the Fund's Report of Independent Registered Public Accounting Firm, are available on the SEC's website or upon request.
(d) The rate quoted is the annualized seven-day yield of the fund at period end.
Affiliated Central Funds
Information regarding fiscal year to date income earned by the Fund from investments in Fidelity Central Funds is as follows:
| Fund | Income earned |
| Fidelity Cash Central Fund | $96,114 |
| Total | $96,114 |
Amounts in the income column in the above table include any capital gain distributions from underlying funds, which are presented in the corresponding line-item in the Statement of Operations, if applicable.
Affiliated Underlying Funds
Fiscal year to date information regarding the Fund's investments in affiliated Underlying Funds, excluding any Money Market Central Funds, is presented below. Exchanges between classes of the same affiliated Underlying Funds may occur.
| Affiliate | Value, beginning of period | Purchases | Sales Proceeds | Dividend Income | Realized Gain (loss) | Change in Unrealized appreciation (depreciation) | Value, end of period |
| Fidelity Advisor Series Equity Growth Fund | $160,105,288 | $20,981,153 | $24,829,843 | $12,320,933 | $1,568,468 | $6,235,004 | $164,060,070 |
| Fidelity Advisor Series Equity Value Fund | 184,673,886 | 10,441,310 | 8,856,983 | 6,157,241 | 50,846 | (29,651,736) | -- |
| Fidelity Advisor Series Growth & Income Fund | 282,815,807 | 31,809,428 | 19,123,670 | 25,142,533 | 717,692 | (46,871,778) | -- |
| Fidelity Advisor Series Growth Opportunities Fund | 105,130,031 | 25,284,201 | 37,844,420 | 19,584,082 | 9,219,789 | 8,056,405 | 109,846,006 |
| Fidelity Advisor Series Opportunistic Insights Fund | 148,960,609 | 15,259,899 | 11,514,929 | 11,765,598 | 826,448 | (59,487,019) | -- |
| Fidelity Advisor Series Small Cap Fund | 80,158,042 | 11,153,325 | 9,778,067 | 6,930,774 | (85,997) | (7,533,289) | 73,914,014 |
| Fidelity Advisor Series Stock Selector Large Cap Value Fund | 186,438,157 | 19,697,823 | 8,899,129 | 15,628,608 | 18,504 | (29,303,322) | -- |
| Fidelity Series 100 Index Fund | 79,553,910 | -- | 83,647,945 | -- | 32,125,583 | (28,031,548) | -- |
| Fidelity Series All-Sector Equity Fund | 109,869,027 | 22,833,784 | 51,392,833 | 17,765,703 | 8,649,569 | (17,509,250) | 72,450,297 |
| Fidelity Series Canada Fund | 22,113,942 | 3,379,190 | 3,075,123 | 499,953 | 11,748 | 403,041 | 22,832,798 |
| Fidelity Series Commodity Strategy Fund | 63,089,625 | 24,285,786 | 10,511,923 | 4,176,032 | (3,963,667) | (4,004,682) | 68,895,139 |
| Fidelity Series Emerging Markets Debt Fund | 20,524,216 | 2,134,985 | 1,827,769 | 1,199,581 | (29,202) | (967,388) | 19,834,842 |
| Fidelity Series Emerging Markets Fund | -- | 24,227,929 | 1,081,531 | 96,157 | (4,506) | 1,378,207 | 24,520,099 |
| Fidelity Series Emerging Markets Opportunities Fund | 229,181,656 | 58,236,990 | 20,826,943 | 17,945,698 | (452,782) | (34,249,821) | 231,889,100 |
| Fidelity Series Floating Rate High Income Fund | 6,775,351 | 675,926 | 3,422,148 | 358,095 | (194,132) | 59,585 | 3,894,582 |
| Fidelity Series Government Money Market Fund 2.50% | 43,596,913 | 41,998,355 | 46,414,536 | 1,039,073 | -- | -- | 39,180,732 |
| Fidelity Series High Income Fund | 42,436,867 | 4,514,211 | 19,967,431 | 2,543,187 | (1,003,141) | 511,153 | 26,491,659 |
| Fidelity Series Inflation-Protected Bond Index Fund | 23,288,678 | 29,959,667 | 12,260,034 | 462,375 | (196,854) | 514,120 | 41,305,577 |
| Fidelity Series International Credit Fund | 1,478,474 | 74,938 | -- | 74,938 | -- | (3,867) | 1,549,545 |
| Fidelity Series International Growth Fund | 223,420,738 | 38,258,584 | 32,135,451 | 13,979,311 | 1,176,614 | (12,627,113) | 218,093,372 |
| Fidelity Series International Small Cap Fund | 55,748,352 | 10,170,223 | 6,247,727 | 4,708,950 | 217,961 | (8,958,883) | 50,929,926 |
| Fidelity Series International Value Fund | 225,385,847 | 31,976,655 | 21,479,842 | 7,648,601 | (419,410) | (26,104,637) | 209,358,613 |
| Fidelity Series Investment Grade Bond Fund | 465,066,009 | 72,408,369 | 86,152,146 | 14,625,085 | (1,914,333) | 7,821,775 | 457,229,674 |
| Fidelity Series Large Cap Stock Fund | -- | 20,064,703 | 15,757,580 | 11,500,218 | (721,010) | 29,820,914 | 282,754,506 |
| Fidelity Series Large Cap Value Index Fund | 31,129,323 | 3,107,536 | 3,160,370 | 1,463,286 | 23,468 | 305,707 | 31,405,664 |
| Fidelity Series Long-Term Treasury Bond Index Fund | 65,647,248 | 126,301,617 | 27,301,548 | 4,216,526 | (812,728) | 7,246,861 | 171,081,450 |
| Fidelity Series Opportunistic Insights Fund | -- | 18,596,100 | 9,258,530 | 12,559,234 | (420,188) | 49,929,751 | 152,892,141 |
| Fidelity Series Real Estate Equity Fund | 19,318,083 | 264 | 19,796,788 | 154 | 1,704,398 | (1,225,957) | -- |
| Fidelity Series Real Estate Income Fund | 13,306,628 | 1,724,471 | 1,424,811 | 992,350 | (10,439) | 265,399 | 13,861,248 |
| Fidelity Series Short-Term Credit Fund | 8,273,138 | 4,987,660 | 3,597,506 | 258,432 | (1,945) | 138,228 | 9,799,575 |
| Fidelity Series Small Cap Opportunities Fund | 97,802,834 | 16,371,889 | 13,546,786 | 11,141,279 | 826,832 | (5,858,211) | 95,596,558 |
| Fidelity Series Stock Selector Large Cap Value Fund | -- | 21,595,064 | 11,215,242 | 15,772,294 | (1,031,557) | 7,373,205 | 184,673,503 |
| Fidelity Series Value Discovery Fund | -- | 16,565,042 | 9,969,444 | 11,060,754 | (483,046) | 18,786,835 | 181,556,710 |
| | $2,995,288,679 | $729,077,077 | $636,319,028 | $253,617,035 | $45,392,983 | $(173,542,311) | $2,959,897,400 |
Amounts in the income column in the above table include any capital gain distributions from underlying funds, which are presented in the corresponding line-item in the Statement of Operations, if applicable.
Investment Valuation
The following is a summary of the inputs used, as of March 31, 2019, involving the Fund's assets and liabilities carried at fair value. The inputs or methodology used for valuing securities may not be an indication of the risk associated with investing in those securities. For more information on valuation inputs, and their aggregation into the levels used below, please refer to the Investment Valuation section in the accompanying Notes to Financial Statements.
| | Valuation Inputs at Reporting Date: |
| Description | Total | Level 1 | Level 2 | Level 3 |
| Investments in Securities: | | | | |
| Other Short-Term Investments | $2,174,206 | $-- | $2,174,206 | $-- |
| Domestic Equity Funds | 1,418,044,608 | 1,418,044,608 | -- | -- |
| International Equity Funds | 757,623,908 | 757,623,908 | -- | -- |
| Bond Funds | 735,248,577 | 735,248,577 | -- | -- |
| Short-Term Funds | 61,866,742 | 61,866,742 | -- | -- |
| Total Investments in Securities: | $2,974,958,041 | $2,972,783,835 | $2,174,206 | $-- |
| Derivative Instruments: | | | | |
| Assets | | | | |
| Futures Contracts | $258,543 | $258,543 | $-- | $-- |
| Total Assets | $258,543 | $258,543 | $-- | $-- |
| Liabilities | | | | |
| Futures Contracts | $(598,682) | $(598,682) | $-- | $-- |
| Total Liabilities | $(598,682) | $(598,682) | $-- | $-- |
| Total Derivative Instruments: | $(340,139) | $(340,139) | $-- | $-- |
Value of Derivative Instruments
The following table is a summary of the Fund's value of derivative instruments by primary risk exposure as of March 31, 2019. For additional information on derivative instruments, please refer to the Derivative Instruments section in the accompanying Notes to Financial Statements.
| Primary Risk Exposure / Derivative Type | Value |
| | Asset | Liability |
| Equity Risk | | |
| Futures Contracts(a) | $0 | $(598,682) |
| Total Equity Risk | 0 | (598,682) |
| Interest Rate Risk | | |
| Futures Contracts(a) | 258,543 | 0 |
| Total Interest Rate Risk | 258,543 | 0 |
| Total Value of Derivatives | $258,543 | $(598,682) |
(a) Reflects gross cumulative appreciation (depreciation) on futures contracts as presented in the Schedule of Investments. In the Statement of Assets and Liabilities, the period end daily variation margin is included in receivable or payable for daily variation margin on futures contracts, and the net cumulative appreciation (depreciation) is included in distributable earnings.
See accompanying notes which are an integral part of the financial statements.
Fidelity Advisor Freedom® 2030 Fund
Financial Statements
Statement of Assets and Liabilities
| | | March 31, 2019 |
| Assets | | |
Investment in securities, at value — See accompanying schedule:
Unaffiliated issuers (cost $2,174,118) | $2,174,206 | |
| Fidelity Central Funds (cost $12,886,382) | 12,886,435 | |
| Other affiliated issuers (cost $2,621,764,677) | 2,959,897,400 | |
| Total Investment in Securities (cost $2,636,825,177) | | $2,974,958,041 |
| Receivable for investments sold | | 34,285,685 |
| Receivable for fund shares sold | | 2,307,501 |
| Distributions receivable from Fidelity Central Funds | | 25,608 |
| Other receivables | | 2 |
| Total assets | | 3,011,576,837 |
| Liabilities | | |
| Payable for investments purchased | $27,680,626 | |
| Payable for fund shares redeemed | 8,911,756 | |
| Accrued management fee | 1,698,300 | |
| Distribution and service plan fees payable | 516,636 | |
| Payable for daily variation margin on futures contracts | 340,490 | |
| Total liabilities | | 39,147,808 |
| Net Assets | | $2,972,429,029 |
| Net Assets consist of: | | |
| Paid in capital | | $2,522,119,329 |
| Total distributable earnings (loss) | | 450,309,700 |
| Net Assets | | $2,972,429,029 |
| Net Asset Value and Maximum Offering Price | | |
| Class A: | | |
| Net Asset Value and redemption price per share ($1,279,896,027 ÷ 91,385,922 shares) | | $14.01 |
| Maximum offering price per share (100/94.25 of $14.01) | | $14.86 |
| Class M: | | |
| Net Asset Value and redemption price per share ($453,916,641 ÷ 32,584,543 shares) | | $13.93 |
| Maximum offering price per share (100/96.50 of $13.93) | | $14.44 |
| Class C: | | |
| Net Asset Value and offering price per share ($66,504,608 ÷ 4,836,120 shares)(a) | | $13.75 |
| Class I: | | |
| Net Asset Value, offering price and redemption price per share ($1,108,683,987 ÷ 78,693,474 shares) | | $14.09 |
| Class Z: | | |
| Net Asset Value, offering price and redemption price per share ($2,947,654 ÷ 210,091 shares) | | $14.03 |
| Class Z6: | | |
| Net Asset Value, offering price and redemption price per share ($60,480,112 ÷ 4,304,048 shares) | | $14.05 |
(a) Redemption price per share is equal to net asset value less any applicable contingent deferred sales charge.
See accompanying notes which are an integral part of the financial statements.
Statement of Operations
| | | Year ended March 31, 2019 |
| Investment Income | | |
| Dividends: | | |
| Affiliated issuers | | $74,217,022 |
| Interest | | 29,070 |
| Income from Fidelity Central Funds | | 96,114 |
| Total income | | 74,342,206 |
| Expenses | | |
| Management fee | $20,391,005 | |
| Distribution and service plan fees | 6,421,985 | |
| Independent trustees' fees and expenses | 13,972 | |
| Total expenses before reductions | 26,826,962 | |
| Expense reductions | (197) | |
| Total expenses after reductions | | 26,826,765 |
| Net investment income (loss) | | 47,515,441 |
| Realized and Unrealized Gain (Loss) | | |
| Net realized gain (loss) on: | | |
| Investment securities: | | |
| Unaffiliated issuers | 6,979 | |
| Fidelity Central Funds | (120) | |
| Other affiliated issuers | 45,392,983 | |
| Futures contracts | 1,101,269 | |
| Capital gain distributions from underlying funds: | | |
| Affiliated issuers | 179,400,013 | |
| Total net realized gain (loss) | | 225,901,124 |
| Change in net unrealized appreciation (depreciation) on: | | |
| Investment securities: | | |
| Unaffiliated issuers | 101 | |
| Fidelity Central Funds | 53 | |
| Other affiliated issuers | (173,542,311) | |
| Futures contracts | (340,139) | |
| Total change in net unrealized appreciation (depreciation) | | (173,882,296) |
| Net gain (loss) | | 52,018,828 |
| Net increase (decrease) in net assets resulting from operations | | $99,534,269 |
See accompanying notes which are an integral part of the financial statements.
Statement of Changes in Net Assets
| | Year ended March 31, 2019 | Year ended March 31, 2018 |
| Increase (Decrease) in Net Assets | | |
| Operations | | |
| Net investment income (loss) | $47,515,441 | $29,589,232 |
| Net realized gain (loss) | 225,901,124 | 206,631,223 |
| Change in net unrealized appreciation (depreciation) | (173,882,296) | 87,525,917 |
| Net increase (decrease) in net assets resulting from operations | 99,534,269 | 323,746,372 |
| Distributions to shareholders | (274,553,385) | – |
| Distributions to shareholders from net investment income | – | (32,430,120) |
| Distributions to shareholders from net realized gain | – | (127,678,746) |
| Total distributions | (274,553,385) | (160,108,866) |
| Share transactions - net increase (decrease) | 154,113,608 | 6,442,311 |
| Total increase (decrease) in net assets | (20,905,508) | 170,079,817 |
| Net Assets | | |
| Beginning of period | 2,993,334,537 | 2,823,254,720 |
| End of period | $2,972,429,029 | $2,993,334,537 |
| Other Information | | |
| Undistributed net investment income end of period | | $322 |
See accompanying notes which are an integral part of the financial statements.
Financial Highlights
Fidelity Advisor Freedom 2030 Fund Class A
| Years ended March 31, | 2019 | 2018 | 2017 | 2016 | 2015 |
| Selected Per–Share Data | | | | | |
| Net asset value, beginning of period | $14.95 | $14.12 | $12.99 | $14.13 | $14.15 |
| Income from Investment Operations | | | | | |
| Net investment income (loss)A | .23 | .15 | .18 | .19 | .20 |
| Net realized and unrealized gain (loss) | .19 | 1.50 | 1.57 | (.64) | .70 |
| Total from investment operations | .42 | 1.65 | 1.75 | (.45) | .90 |
| Distributions from net investment income | (.24) | (.16) | (.18) | (.19) | (.21) |
| Distributions from net realized gain | (1.13) | (.66) | (.44) | (.50) | (.71) |
| Total distributions | (1.36)B | (.82) | (.62) | (.69) | (.92) |
| Net asset value, end of period | $14.01 | $14.95 | $14.12 | $12.99 | $14.13 |
| Total ReturnC,D | 3.43% | 11.80% | 14.02% | (3.36)% | 6.54% |
| Ratios to Average Net AssetsE,F | | | | | |
| Expenses before reductions | .94%G | .84% | .25% | .25% | .25% |
| Expenses net of fee waivers, if any | .94%G | .84% | .25% | .25% | .25% |
| Expenses net of all reductions | .94%G | .84% | .25% | .25% | .25% |
| Net investment income (loss) | 1.57% | .99% | 1.34% | 1.39% | 1.42% |
| Supplemental Data | | | | | |
| Net assets, end of period (000 omitted) | $1,279,896 | $1,374,112 | $1,414,388 | $1,409,909 | $1,704,036 |
| Portfolio turnover rateF | 22% | 25% | 18% | 22% | 24% |
A Calculated based on average shares outstanding during the period.
B Total distributions of $1.36 per share is comprised of distributions from net investment income of $.235 and distributions from net realized gain of $1.127 per share.
C Total returns would have been lower if certain expenses had not been reduced during the applicable periods shown.
D Total returns do not include the effect of the sales charges.
E Expense ratios reflect operating expenses of the class. Expenses before reductions do not reflect amounts reimbursed by the investment adviser or reductions from expense offset arrangements and do not represent the amount paid by the class during periods when reimbursements or reductions occur. Expenses net of fee waivers reflect expenses after reimbursement by the investment adviser but prior to reductions from expense offset arrangements. Expenses net of all reductions represent the net expenses paid by the class but do not include expenses of the underlying funds in which the Fund invests.
F Amounts do not include the activity of the Underlying Funds.
G On certain classes, the size and fluctuation of net assets and expense amounts may cause ratios to differ from contractual rates.
See accompanying notes which are an integral part of the financial statements.
Fidelity Advisor Freedom 2030 Fund Class M
| Years ended March 31, | 2019 | 2018 | 2017 | 2016 | 2015 |
| Selected Per–Share Data | | | | | |
| Net asset value, beginning of period | $14.88 | $14.06 | $12.94 | $14.09 | $14.10 |
| Income from Investment Operations | | | | | |
| Net investment income (loss)A | .19 | .11 | .15 | .15 | .17 |
| Net realized and unrealized gain (loss) | .19 | 1.50 | 1.56 | (.64) | .71 |
| Total from investment operations | .38 | 1.61 | 1.71 | (.49) | .88 |
| Distributions from net investment income | (.21) | (.13) | (.15) | (.16) | (.18) |
| Distributions from net realized gain | (1.12) | (.66) | (.44) | (.50) | (.71) |
| Total distributions | (1.33) | (.79) | (.59) | (.66) | (.89) |
| Net asset value, end of period | $13.93 | $14.88 | $14.06 | $12.94 | $14.09 |
| Total ReturnB,C | 3.12% | 11.53% | 13.74% | (3.67)% | 6.37% |
| Ratios to Average Net AssetsD,E | | | | | |
| Expenses before reductions | 1.19%F | 1.09% | .50% | .50% | .50% |
| Expenses net of fee waivers, if any | 1.19%F | 1.09% | .50% | .50% | .50% |
| Expenses net of all reductions | 1.19%F | 1.09% | .50% | .50% | .50% |
| Net investment income (loss) | 1.32% | .74% | 1.09% | 1.14% | 1.17% |
| Supplemental Data | | | | | |
| Net assets, end of period (000 omitted) | $453,917 | $452,750 | $442,505 | $423,312 | $453,137 |
| Portfolio turnover rateE | 22% | 25% | 18% | 22% | 24% |
A Calculated based on average shares outstanding during the period.
B Total returns would have been lower if certain expenses had not been reduced during the applicable periods shown.
C Total returns do not include the effect of the sales charges.
D Expense ratios reflect operating expenses of the class. Expenses before reductions do not reflect amounts reimbursed by the investment adviser or reductions from expense offset arrangements and do not represent the amount paid by the class during periods when reimbursements or reductions occur. Expenses net of fee waivers reflect expenses after reimbursement by the investment adviser but prior to reductions from expense offset arrangements. Expenses net of all reductions represent the net expenses paid by the class but do not include expenses of the underlying funds in which the Fund invests.
E Amounts do not include the activity of the Underlying Funds.
F On certain classes, the size and fluctuation of net assets and expense amounts may cause ratios to differ from contractual rates.
See accompanying notes which are an integral part of the financial statements.
Fidelity Advisor Freedom 2030 Fund Class C
| Years ended March 31, | 2019 | 2018 | 2017 | 2016 | 2015 |
| Selected Per–Share Data | | | | | |
| Net asset value, beginning of period | $14.71 | $13.92 | $12.83 | $13.97 | $14.00 |
| Income from Investment Operations | | | | | |
| Net investment income (loss)A | .12 | .03 | .08 | .08 | .09 |
| Net realized and unrealized gain (loss) | .18 | 1.48 | 1.55 | (.63) | .70 |
| Total from investment operations | .30 | 1.51 | 1.63 | (.55) | .79 |
| Distributions from net investment income | (.15) | (.07) | (.10) | (.11) | (.12) |
| Distributions from net realized gain | (1.11) | (.65) | (.44) | (.48) | (.70) |
| Total distributions | (1.26) | (.72) | (.54) | (.59) | (.82) |
| Net asset value, end of period | $13.75 | $14.71 | $13.92 | $12.83 | $13.97 |
| Total ReturnB,C | 2.57% | 10.97% | 13.21% | (4.10)% | 5.76% |
| Ratios to Average Net AssetsD,E | | | | | |
| Expenses before reductions | 1.69%F | 1.59% | 1.00% | 1.00% | 1.00% |
| Expenses net of fee waivers, if any | 1.69%F | 1.59% | 1.00% | 1.00% | 1.00% |
| Expenses net of all reductions | 1.69%F | 1.59% | 1.00% | 1.00% | 1.00% |
| Net investment income (loss) | .82% | .24% | .59% | .64% | .67% |
| Supplemental Data | | | | | |
| Net assets, end of period (000 omitted) | $66,505 | $96,199 | $94,517 | $87,691 | $91,154 |
| Portfolio turnover rateE | 22% | 25% | 18% | 22% | 24% |
A Calculated based on average shares outstanding during the period.
B Total returns would have been lower if certain expenses had not been reduced during the applicable periods shown.
C Total returns do not include the effect of the contingent deferred sales charge.
D Expense ratios reflect operating expenses of the class. Expenses before reductions do not reflect amounts reimbursed by the investment adviser or reductions from expense offset arrangements and do not represent the amount paid by the class during periods when reimbursements or reductions occur. Expenses net of fee waivers reflect expenses after reimbursement by the investment adviser but prior to reductions from expense offset arrangements. Expenses net of all reductions represent the net expenses paid by the class but do not include expenses of the underlying funds in which the Fund invests.
E Amounts do not include the activity of the Underlying Funds.
F On certain classes, the size and fluctuation of net assets and expense amounts may cause ratios to differ from contractual rates.
See accompanying notes which are an integral part of the financial statements.
Fidelity Advisor Freedom 2030 Fund Class I
| Years ended March 31, | 2019 | 2018 | 2017 | 2016 | 2015 |
| Selected Per–Share Data | | | | | |
| Net asset value, beginning of period | $15.04 | $14.21 | $13.06 | $14.21 | $14.22 |
| Income from Investment Operations | | | | | |
| Net investment income (loss)A | .26 | .18 | .21 | .22 | .24 |
| Net realized and unrealized gain (loss) | .19 | 1.51 | 1.59 | (.65) | .71 |
| Total from investment operations | .45 | 1.69 | 1.80 | (.43) | .95 |
| Distributions from net investment income | (.27) | (.21) | (.21) | (.23) | (.25) |
| Distributions from net realized gain | (1.14) | (.66) | (.44) | (.50) | (.71) |
| Total distributions | (1.40)B | (.86)C | (.65) | (.72)D | (.96) |
| Net asset value, end of period | $14.09 | $15.04 | $14.21 | $13.06 | $14.21 |
| Total ReturnE | 3.65% | 12.04% | 14.38% | (3.16)% | 6.85% |
| Ratios to Average Net AssetsF,G | | | | | |
| Expenses before reductions | .69%H | .60% | –%I | –%I | –%I |
| Expenses net of fee waivers, if any | .69%H | .60% | -% | -% | -% |
| Expenses net of all reductions | .69%H | .60% | -% | -% | -% |
| Net investment income (loss) | 1.82% | 1.23% | 1.59% | 1.64% | 1.67% |
| Supplemental Data | | | | | |
| Net assets, end of period (000 omitted) | $1,108,684 | $1,043,420 | $871,845 | $861,408 | $919,561 |
| Portfolio turnover rateG | 22% | 25% | 18% | 22% | 24% |
A Calculated based on average shares outstanding during the period.
B Total distributions of $1.40 per share is comprised of distributions from net investment income of $.266 and distributions from net realized gain of $1.137 per share.
C Total distributions of $.86 per share is comprised of distributions from net investment income of $.205 and distributions from net realized gain of $.656 per share.
D Total distributions of $.72 per share is comprised of distributions from net investment income of $.225 and distributions from net realized gain of $.499 per share.
E Total returns would have been lower if certain expenses had not been reduced during the applicable periods shown.
F Expense ratios reflect operating expenses of the class. Expenses before reductions do not reflect amounts reimbursed by the investment adviser or reductions from expense offset arrangements and do not represent the amount paid by the class during periods when reimbursements or reductions occur. Expenses net of fee waivers reflect expenses after reimbursement by the investment adviser but prior to reductions from expense offset arrangements. Expenses net of all reductions represent the net expenses paid by the class but do not include expenses of the underlying funds in which the Fund invests.
G Amounts do not include the activity of the Underlying Funds.
H On certain classes, the size and fluctuation of net assets and expense amounts may cause ratios to differ from contractual rates.
I Amount represents less than .005%.
See accompanying notes which are an integral part of the financial statements.
Fidelity Advisor Freedom 2030 Fund Class Z
| Year ended March 31, | 2019 A |
| Selected Per–Share Data | |
| Net asset value, beginning of period | $14.99 |
| Income from Investment Operations | |
| Net investment income (loss)B | .04 |
| Net realized and unrealized gain (loss) | (.15)C |
| Total from investment operations | (.11) |
| Distributions from net investment income | (.33) |
| Distributions from net realized gain | (.53) |
| Total distributions | (.85)D |
| Net asset value, end of period | $14.03 |
| Total ReturnE,F | (.09)% |
| Ratios to Average Net AssetsG,H | |
| Expenses before reductions | .60%I |
| Expenses net of fee waivers, if any | .60%I |
| Expenses net of all reductions | .60%I |
| Net investment income (loss) | .65%I |
| Supplemental Data | |
| Net assets, end of period (000 omitted) | $2,948 |
| Portfolio turnover rateH | 22% |
A For the period October 2, 2018 (commencement of sale of shares) to March 31, 2019.
B Calculated based on average shares outstanding during the period.
C The amount shown for a share outstanding does not correspond with the aggregate net gain (loss) on investments for the period due to the timing of sales and repurchases of shares in relation to fluctuating market values of the investments of the Fund.
D Total distributions of $.85 per share is comprised of distributions from net investment income of $.327 and distributions from net realized gain of $.527 per share.
E Total returns for periods of less than one year are not annualized.
F Total returns would have been lower if certain expenses had not been reduced during the applicable periods shown.
G Expense ratios reflect operating expenses of the class. Expenses before reductions do not reflect amounts reimbursed by the investment adviser or reductions from expense offset arrangements and do not represent the amount paid by the class during periods when reimbursements or reductions occur. Expense ratios before reductions for start-up periods may not be representative of longer-term operating periods. Expenses net of fee waivers reflect expenses after reimbursement by the investment adviser but prior to reductions from expense offset arrangements. Expenses net of all reductions represent the net expenses paid by the class but do not include expenses of the underlying funds in which the Fund invests.
H Amounts do not include the activity of the Underlying Funds.
I Annualized
See accompanying notes which are an integral part of the financial statements.
Fidelity Advisor Freedom 2030 Fund Class Z6
| Years ended March 31, | 2019 | 2018 A |
| Selected Per–Share Data | | |
| Net asset value, beginning of period | $15.03 | $14.53 |
| Income from Investment Operations | | |
| Net investment income (loss)B | .29 | .16 |
| Net realized and unrealized gain (loss) | .19 | .99 |
| Total from investment operations | .48 | 1.15 |
| Distributions from net investment income | (.30) | (.23) |
| Distributions from net realized gain | (1.15) | (.42) |
| Total distributions | (1.46)C | (.65) |
| Net asset value, end of period | $14.05 | $15.03 |
| Total ReturnD,E | 3.84% | 7.90% |
| Ratios to Average Net AssetsF | | |
| Expenses before reductions | .47% | .49%G,H |
| Expenses net of fee waivers, if any | .47% | .49%G,H |
| Expenses net of all reductions | .47% | .49%G,H |
| Net investment income (loss) | 2.05% | 1.29%G |
| Supplemental Data | | |
| Net assets, end of period (000 omitted) | $60,480 | $26,854 |
| Portfolio turnover rateI | 22% | 25% |
A For the period June 6, 2017 (commencement of sale of shares) to March 31, 2018.
B Calculated based on average shares outstanding during the period.
C Total distributions of $1.46 per share is comprised of distributions from net investment income of $.301 and distributions from net realized gain of $1.154 per share.
D Total returns for periods of less than one year are not annualized.
E Total returns would have been lower if certain expenses had not been reduced during the applicable periods shown.
F Expense ratios reflect operating expenses of the class. Expenses before reductions do not reflect amounts reimbursed by the investment adviser or reductions from expense offset arrangements and do not represent the amount paid by the class during periods when reimbursements or reductions occur. Expenses net of fee waivers reflect expenses after reimbursement by the investment adviser but prior to reductions from expense offset arrangements. Expenses net of all reductions represent the net expenses paid by the class but do not include expenses of the underlying funds in which the Fund invests.
G Annualized
H On certain classes, the size and fluctuation of net assets may cause rounding of expense amounts and ratios to differ from contractual rates.
I Amount does not include the portfolio activity of any underlying Fidelity Central Funds.
See accompanying notes which are an integral part of the financial statements.
Fidelity Advisor Freedom® 2035 Fund
Investment Summary (Unaudited)
The information in the following tables is based on the direct investments of the Fund.
Top Holdings as of March 31, 2019
| | % of fund's net assets |
| Fidelity Series Large Cap Stock Fund | 11.4 |
| Fidelity Series Emerging Markets Opportunities Fund | 8.8 |
| Fidelity Series International Growth Fund | 8.8 |
| Fidelity Series International Value Fund | 8.3 |
| Fidelity Series Stock Selector Large Cap Value Fund | 7.4 |
| Fidelity Series Value Discovery Fund | 7.2 |
| Fidelity Advisor Series Equity Growth Fund | 6.8 |
| Fidelity Series Opportunistic Insights Fund | 6.3 |
| Fidelity Series Long-Term Treasury Bond Index Fund | 5.7 |
| Fidelity Advisor Series Growth Opportunities Fund | 4.7 |
| | 75.4 |
Asset Allocation (% of fund's net assets)
| Period end |
| | Domestic Equity Funds | 57.4% |
| | International Equity Funds | 29.7% |
| | Bond Funds | 10.9% |
| | Short-Term Funds | 2.0% |
| | Short-Term Investments | 0.1% |
| | Net Other Assets (Liabilities)* | (0.1)% |

* Net Other Assets (Liabilities) are not included in the pie chart
Domestic Equity Funds category includes Fidelity Series Commodity Strategy Fund which invests in commodity-related investments.
Fidelity Advisor Freedom® 2035 Fund
Schedule of Investments March 31, 2019
Showing Percentage of Net Assets
| U.S. Treasury Obligations - 0.1% | | | |
| | | Principal Amount | Value |
| U.S. Treasury Bills, yield at date of purchase 2.39% to 2.43% 4/4/19 to 6/20/19 (a) | | | |
| (Cost $1,408,095) | | 1,410,000 | 1,408,123 |
| | | Shares | Value |
|
| Domestic Equity Funds - 57.4% | | | |
| Fidelity Advisor Series Equity Growth Fund (b) | | 11,715,657 | $163,199,101 |
| Fidelity Advisor Series Growth Opportunities Fund (b) | | 7,825,441 | 113,155,881 |
| Fidelity Advisor Series Small Cap Fund (b) | | 7,000,384 | 73,364,029 |
| Fidelity Series All-Sector Equity Fund (b) | | 7,494,061 | 72,167,804 |
| Fidelity Series Commodity Strategy Fund (b) | | 11,581,469 | 55,243,606 |
| Fidelity Series Large Cap Stock Fund (b) | | 18,606,552 | 272,585,994 |
| Fidelity Series Large Cap Value Index Fund (b) | | 2,383,763 | 29,582,499 |
| Fidelity Series Opportunistic Insights Fund (b) | | 8,670,933 | 151,567,911 |
| Fidelity Series Small Cap Opportunities Fund (b) | | 6,971,264 | 93,833,213 |
| Fidelity Series Stock Selector Large Cap Value Fund (b) | | 14,989,740 | 176,878,931 |
| Fidelity Series Value Discovery Fund (b) | | 13,824,590 | 172,669,131 |
| TOTAL DOMESTIC EQUITY FUNDS | | | |
| (Cost $1,190,175,942) | | | 1,374,248,100 |
|
| International Equity Funds - 29.7% | | | |
| Fidelity Series Canada Fund (b) | | 2,097,758 | 21,627,882 |
| Fidelity Series Emerging Markets Fund (b) | | 2,293,812 | 22,456,421 |
| Fidelity Series Emerging Markets Opportunities Fund (b) | | 11,316,372 | 209,692,371 |
| Fidelity Series International Growth Fund (b) | | 13,766,043 | 209,106,186 |
| Fidelity Series International Small Cap Fund (b) | | 3,128,103 | 48,579,447 |
| Fidelity Series International Value Fund (b) | | 21,340,129 | 198,463,196 |
| TOTAL INTERNATIONAL EQUITY FUNDS | | | |
| (Cost $604,574,979) | | | 709,925,503 |
|
| Bond Funds - 10.9% | | | |
| Fidelity Series Emerging Markets Debt Fund (b) | | 1,598,433 | 15,328,974 |
| Fidelity Series Floating Rate High Income Fund (b) | | 319,182 | 2,958,818 |
| Fidelity Series High Income Fund (b) | | 2,238,470 | 21,041,620 |
| Fidelity Series Inflation-Protected Bond Index Fund (b) | | 709,151 | 6,935,494 |
| Fidelity Series International Credit Fund (b) | | 123,676 | 1,223,153 |
| Fidelity Series Investment Grade Bond Fund (b) | | 5,824,746 | 65,120,663 |
| Fidelity Series Long-Term Treasury Bond Index Fund (b) | | 15,510,395 | 137,577,206 |
| Fidelity Series Real Estate Income Fund (b) | | 1,002,834 | 10,940,922 |
| TOTAL BOND FUNDS | | | |
| (Cost $256,090,361) | | | 261,126,850 |
|
| Short-Term Funds - 2.0% | | | |
| Fidelity Cash Central Fund, 2.48% (c) | | 8,287,362 | 8,289,020 |
| Fidelity Series Government Money Market Fund 2.50%(b)(d) | | 31,508,841 | 31,508,841 |
| Fidelity Series Short-Term Credit Fund (b) | | 790,419 | 7,880,473 |
| TOTAL SHORT-TERM FUNDS | | | |
| (Cost $47,625,949) | | | 47,678,334 |
| TOTAL INVESTMENT IN SECURITIES - 100.1% | | | |
| (Cost $2,099,875,326) | | | 2,394,386,910 |
| NET OTHER ASSETS (LIABILITIES) - (0.1)% | | | (2,050,559) |
| NET ASSETS - 100% | | | $2,392,336,351 |
| Futures Contracts | | | | | |
| | Number of contracts | Expiration Date | Notional Amount | Value | Unrealized Appreciation/(Depreciation) |
| Purchased | | | | | |
| Treasury Contracts | | | | | |
| CBOT 2-Year U.S. Treasury Note Contracts (United States) | 13 | June 2019 | $2,770,219 | $12,069 | $12,069 |
| CBOT 5-Year U.S. Treasury Note Contracts (United States) | 31 | June 2019 | 3,590,672 | 40,867 | 40,867 |
| CBOT 10-Year U.S. Treasury Note Contracts (United States) | 20 | June 2019 | 2,484,375 | 46,208 | 46,208 |
| CBOT Long Term U.S. Treasury Bond Contracts (United States) | 11 | June 2019 | 1,646,219 | 57,726 | 57,726 |
| CBOT Ultra Long Term U.S. Treasury Bond Contracts (United States) | 12 | June 2019 | 2,016,000 | 100,333 | 100,333 |
|
| TOTAL PURCHASED | | | | | 257,203 |
|
| Sold | | | | | |
| Equity Index Contracts | | | | | |
| CME E-mini S&P 500 Index Contracts (United States) | 96 | June 2019 | 13,621,440 | (412,293) | (412,293) |
| ICE E-mini MSCI EAFE Index Contracts (United States) | 4 | June 2019 | 373,280 | (7,889) | (7,889) |
| ICE E-mini MSCI Emerging Markets Index Contracts (United States) | 130 | June 2019 | 6,873,100 | (128,158) | (128,158) |
|
| TOTAL SOLD | | | | | (548,340) |
|
| TOTAL FUTURES CONTRACTS | | | | | $(291,137) |
The notional amount of futures purchased as a percentage of Net Assets is 0.5%
The notional amount of futures sold as a percentage of Net Assets is 0.9%
Legend
(a) Security or a portion of the security was pledged to cover margin requirements for futures contracts. At period end, the value of securities pledged amounted to $1,408,123.
(b) Affiliated Fund
(c) Affiliated fund that is generally available only to investment companies and other accounts managed by Fidelity Investments. The rate quoted is the annualized seven-day yield of the fund at period end. A complete unaudited listing of the fund's holdings as of its most recent quarter end is available upon request. In addition, each Fidelity Central Fund's financial statements, which are not covered by the Fund's Report of Independent Registered Public Accounting Firm, are available on the SEC's website or upon request.
(d) The rate quoted is the annualized seven-day yield of the fund at period end.
Affiliated Central Funds
Information regarding fiscal year to date income earned by the Fund from investments in Fidelity Central Funds is as follows:
| Fund | Income earned |
| Fidelity Cash Central Fund | $67,897 |
| Total | $67,897 |
Amounts in the income column in the above table include any capital gain distributions from underlying funds, which are presented in the corresponding line-item in the Statement of Operations, if applicable.
Affiliated Underlying Funds
Fiscal year to date information regarding the Fund's investments in affiliated Underlying Funds, excluding any Money Market Central Funds, is presented below. Exchanges between classes of the same affiliated Underlying Funds may occur.
| Affiliate | Value, beginning of period | Purchases | Sales Proceeds | Dividend Income | Realized Gain (loss) | Change in Unrealized appreciation (depreciation) | Value, end of period |
| Fidelity Advisor Series Equity Growth Fund | $150,443,525 | $24,316,907 | $18,709,140 | $12,083,271 | $807,701 | $6,340,108 | $163,199,101 |
| Fidelity Advisor Series Equity Value Fund | 173,506,004 | 10,161,919 | 8,970,094 | 5,777,955 | 19,833 | (24,184,445) | -- |
| Fidelity Advisor Series Growth & Income Fund | 265,948,888 | 30,860,979 | 13,869,397 | 24,005,982 | 268,512 | (40,994,581) | -- |
| Fidelity Advisor Series Growth Opportunities Fund | 98,717,003 | 25,573,692 | 27,298,409 | 18,992,449 | 5,288,849 | 10,874,746 | 113,155,881 |
| Fidelity Advisor Series Opportunistic Insights Fund | 139,796,668 | 14,890,529 | 7,734,189 | 11,306,712 | 438,538 | (53,339,875) | -- |
| Fidelity Advisor Series Small Cap Fund | 75,222,187 | 13,679,822 | 8,001,771 | 6,863,984 | (114,087) | (7,422,122) | 73,364,029 |
| Fidelity Advisor Series Stock Selector Large Cap Value Fund | 175,247,506 | 18,975,974 | 8,963,165 | 14,681,290 | (37,770) | (24,040,272) | -- |
| Fidelity Series 100 Index Fund | 74,585,869 | -- | 79,175,002 | -- | 32,848,617 | (28,259,484) | -- |
| Fidelity Series All-Sector Equity Fund | 103,183,521 | 24,321,000 | 46,276,115 | 17,630,363 | 4,963,290 | (14,023,892) | 72,167,804 |
| Fidelity Series Canada Fund | 20,489,780 | 3,176,876 | 2,391,074 | 471,010 | (4,626) | 356,926 | 21,627,882 |
| Fidelity Series Commodity Strategy Fund | 49,722,217 | 21,259,763 | 9,217,965 | 3,387,398 | (3,583,115) | (2,937,294) | 55,243,606 |
| Fidelity Series Emerging Markets Debt Fund | 15,939,875 | 1,822,882 | 1,664,434 | 923,339 | (26,638) | (742,711) | 15,328,974 |
| Fidelity Series Emerging Markets Fund | -- | 22,534,323 | 962,286 | 87,750 | (7,703) | 892,087 | 22,456,421 |
| Fidelity Series Emerging Markets Opportunities Fund | 214,011,029 | 57,638,397 | 30,075,710 | 16,175,558 | 795,285 | (32,676,630) | 209,692,371 |
| Fidelity Series Floating Rate High Income Fund | 5,296,327 | 569,012 | 2,807,751 | 275,663 | (149,643) | 50,873 | 2,958,818 |
| Fidelity Series Government Money Market Fund 2.50% | 39,244,766 | 38,197,215 | 45,933,140 | 841,805 | -- | -- | 31,508,841 |
| Fidelity Series High Income Fund | 33,209,545 | 4,000,377 | 15,754,804 | 2,068,755 | (751,107) | 337,609 | 21,041,620 |
| Fidelity Series Inflation-Protected Bond Index Fund | 18,823,072 | 1,868,232 | 13,907,397 | 144,118 | (129,839) | 281,426 | 6,935,494 |
| Fidelity Series International Credit Fund | 1,167,052 | 59,153 | -- | 59,153 | -- | (3,052) | 1,223,153 |
| Fidelity Series International Growth Fund | 205,931,630 | 42,228,490 | 27,644,034 | 13,176,789 | (433,879) | (10,976,021) | 209,106,186 |
| Fidelity Series International Small Cap Fund | 51,382,631 | 11,371,484 | 5,789,112 | 4,444,531 | (227,903) | (8,157,653) | 48,579,447 |
| Fidelity Series International Value Fund | 208,848,910 | 35,697,656 | 20,831,022 | 7,224,698 | (685,320) | (24,567,028) | 198,463,196 |
| Fidelity Series Investment Grade Bond Fund | 67,616,932 | 38,006,918 | 41,094,204 | 1,726,973 | (1,029,628) | 1,620,645 | 65,120,663 |
| Fidelity Series Large Cap Stock Fund | -- | 21,722,333 | 15,383,191 | 11,033,142 | (525,220) | 24,557,671 | 272,585,994 |
| Fidelity Series Large Cap Value Index Fund | 28,939,369 | 3,480,588 | 3,136,074 | 1,374,145 | 10,512 | 288,104 | 29,582,499 |
| Fidelity Series Long-Term Treasury Bond Index Fund | 53,989,913 | 102,653,184 | 24,219,468 | 3,392,047 | (873,078) | 6,026,655 | 137,577,206 |
| Fidelity Series Opportunistic Insights Fund | -- | 21,666,110 | 7,926,724 | 12,312,749 | (553,238) | 44,330,092 | 151,567,911 |
| Fidelity Series Real Estate Equity Fund | 18,057,338 | -- | 18,571,957 | -- | 1,255,944 | (741,325) | -- |
| Fidelity Series Real Estate Income Fund | 10,443,233 | 1,485,204 | 1,187,444 | 779,629 | (1,161) | 201,090 | 10,940,922 |
| Fidelity Series Short-Term Credit Fund | 6,886,600 | 5,280,991 | 4,390,540 | 222,221 | (14,861) | 118,283 | 7,880,473 |
| Fidelity Series Small Cap Opportunities Fund | 91,742,421 | 17,332,250 | 9,969,880 | 10,816,177 | 79,043 | (5,350,621) | 93,833,213 |
| Fidelity Series Stock Selector Large Cap Value Fund | -- | 23,235,754 | 9,919,145 | 15,003,114 | (800,912) | 3,180,961 | 176,878,931 |
| Fidelity Series Value Discovery Fund | -- | 18,430,338 | 9,762,038 | 10,485,618 | (267,758) | 13,735,372 | 172,669,131 |
| | $2,398,393,811 | $656,498,352 | $541,536,676 | $227,768,388 | $36,558,638 | $(165,224,358) | $2,384,689,767 |
Amounts in the income column in the above table include any capital gain distributions from underlying funds, which are presented in the corresponding line-item in the Statement of Operations, if applicable.
Investment Valuation
The following is a summary of the inputs used, as of March 31, 2019, involving the Fund's assets and liabilities carried at fair value. The inputs or methodology used for valuing securities may not be an indication of the risk associated with investing in those securities. For more information on valuation inputs, and their aggregation into the levels used below, please refer to the Investment Valuation section in the accompanying Notes to Financial Statements.
| | Valuation Inputs at Reporting Date: |
| Description | Total | Level 1 | Level 2 | Level 3 |
| Investments in Securities: | | | | |
| Other Short-Term Investments | $1,408,123 | $-- | $1,408,123 | $-- |
| Domestic Equity Funds | 1,374,248,100 | 1,374,248,100 | -- | -- |
| International Equity Funds | 709,925,503 | 709,925,503 | -- | -- |
| Bond Funds | 261,126,850 | 261,126,850 | -- | -- |
| Short-Term Funds | 47,678,334 | 47,678,334 | -- | -- |
| Total Investments in Securities: | $2,394,386,910 | $2,392,978,787 | $1,408,123 | $-- |
| Derivative Instruments: | | | | |
| Assets | | | | |
| Futures Contracts | $257,203 | $257,203 | $-- | $-- |
| Total Assets | $257,203 | $257,203 | $-- | $-- |
| Liabilities | | | | |
| Futures Contracts | $(548,340) | $(548,340) | $-- | $-- |
| Total Liabilities | $(548,340) | $(548,340) | $-- | $-- |
| Total Derivative Instruments: | $(291,137) | $(291,137) | $-- | $-- |
Value of Derivative Instruments
The following table is a summary of the Fund's value of derivative instruments by primary risk exposure as of March 31, 2019. For additional information on derivative instruments, please refer to the Derivative Instruments section in the accompanying Notes to Financial Statements.
| Primary Risk Exposure / Derivative Type | Value |
| | Asset | Liability |
| Equity Risk | | |
| Futures Contracts(a) | $0 | $(548,340) |
| Total Equity Risk | 0 | (548,340) |
| Interest Rate Risk | | |
| Futures Contracts(a) | 257,203 | 0 |
| Total Interest Rate Risk | 257,203 | 0 |
| Total Value of Derivatives | $257,203 | $(548,340) |
(a) Reflects gross cumulative appreciation (depreciation) on futures contracts as presented in the Schedule of Investments. In the Statement of Assets and Liabilities, the period end daily variation margin is included in receivable or payable for daily variation margin on futures contracts, and the net cumulative appreciation (depreciation) is included in distributable earnings.
See accompanying notes which are an integral part of the financial statements.
Fidelity Advisor Freedom® 2035 Fund
Financial Statements
Statement of Assets and Liabilities
| | | March 31, 2019 |
| Assets | | |
Investment in securities, at value — See accompanying schedule:
Unaffiliated issuers (cost $1,408,095) | $1,408,123 | |
| Fidelity Central Funds (cost $8,288,960) | 8,289,020 | |
| Other affiliated issuers (cost $2,090,178,271) | 2,384,689,767 | |
| Total Investment in Securities (cost $2,099,875,326) | | $2,394,386,910 |
| Receivable for investments sold | | 17,899,572 |
| Receivable for fund shares sold | | 2,393,543 |
| Distributions receivable from Fidelity Central Funds | | 16,170 |
| Total assets | | 2,414,696,195 |
| Liabilities | | |
| Payable for investments purchased | $16,571,005 | |
| Payable for fund shares redeemed | 3,720,776 | |
| Accrued management fee | 1,445,833 | |
| Distribution and service plan fees payable | 405,424 | |
| Payable for daily variation margin on futures contracts | 216,806 | |
| Total liabilities | | 22,359,844 |
| Net Assets | | $2,392,336,351 |
| Net Assets consist of: | | |
| Paid in capital | | $1,996,442,955 |
| Total distributable earnings (loss) | | 395,893,396 |
| Net Assets | | $2,392,336,351 |
| Net Asset Value and Maximum Offering Price | | |
| Class A: | | |
| Net Asset Value and redemption price per share ($1,026,415,550 ÷ 75,566,414 shares) | | $13.58 |
| Maximum offering price per share (100/94.25 of $13.58) | | $14.41 |
| Class M: | | |
| Net Asset Value and redemption price per share ($366,073,915 ÷ 27,231,015 shares) | | $13.44 |
| Maximum offering price per share (100/96.50 of $13.44) | | $13.93 |
| Class C: | | |
| Net Asset Value and offering price per share ($44,302,445 ÷ 3,356,045 shares)(a) | | $13.20 |
| Class I: | | |
| Net Asset Value, offering price and redemption price per share ($907,368,743 ÷ 66,282,331 shares) | | $13.69 |
| Class Z: | | |
| Net Asset Value, offering price and redemption price per share ($2,820,795 ÷ 207,025 shares) | | $13.63 |
| Class Z6: | | |
| Net Asset Value, offering price and redemption price per share ($45,354,903 ÷ 3,317,397 shares) | | $13.67 |
(a) Redemption price per share is equal to net asset value less any applicable contingent deferred sales charge.
See accompanying notes which are an integral part of the financial statements.
Statement of Operations
| | | Year ended March 31, 2019 |
| Investment Income | | |
| Dividends: | | |
| Affiliated issuers | | $56,428,973 |
| Interest | | 24,838 |
| Income from Fidelity Central Funds | | 67,897 |
| Total income | | 56,521,708 |
| Expenses | | |
| Management fee | $17,340,983 | |
| Distribution and service plan fees | 5,003,389 | |
| Independent trustees' fees and expenses | 11,205 | |
| Total expenses before reductions | 22,355,577 | |
| Expense reductions | (46) | |
| Total expenses after reductions | | 22,355,531 |
| Net investment income (loss) | | 34,166,177 |
| Realized and Unrealized Gain (Loss) | | |
| Net realized gain (loss) on: | | |
| Investment securities: | | |
| Unaffiliated issuers | 6,480 | |
| Fidelity Central Funds | (75) | |
| Other affiliated issuers | 36,558,638 | |
| Futures contracts | (599,627) | |
| Capital gain distributions from underlying funds: | | |
| Affiliated issuers | 171,339,415 | |
| Total net realized gain (loss) | | 207,304,831 |
| Change in net unrealized appreciation (depreciation) on: | | |
| Investment securities: | | |
| Unaffiliated issuers | 28 | |
| Fidelity Central Funds | 60 | |
| Other affiliated issuers | (165,224,358) | |
| Futures contracts | (291,137) | |
| Total change in net unrealized appreciation (depreciation) | | (165,515,407) |
| Net gain (loss) | | 41,789,424 |
| Net increase (decrease) in net assets resulting from operations | | $75,955,601 |
See accompanying notes which are an integral part of the financial statements.
Statement of Changes in Net Assets
| | Year ended March 31, 2019 | Year ended March 31, 2018 |
| Increase (Decrease) in Net Assets | | |
| Operations | | |
| Net investment income (loss) | $34,166,177 | $19,282,132 |
| Net realized gain (loss) | 207,304,831 | 167,323,622 |
| Change in net unrealized appreciation (depreciation) | (165,515,407) | 99,438,855 |
| Net increase (decrease) in net assets resulting from operations | 75,955,601 | 286,044,609 |
| Distributions to shareholders | (237,149,030) | – |
| Distributions to shareholders from net investment income | – | (22,868,765) |
| Distributions to shareholders from net realized gain | – | (96,748,987) |
| Total distributions | (237,149,030) | (119,617,752) |
| Share transactions - net increase (decrease) | 157,081,350 | 25,065,653 |
| Total increase (decrease) in net assets | (4,112,079) | 191,492,510 |
| Net Assets | | |
| Beginning of period | 2,396,448,430 | 2,204,955,920 |
| End of period | $2,392,336,351 | $2,396,448,430 |
| Other Information | | |
| Distributions in excess of net investment income end of period | | $(877,686) |
See accompanying notes which are an integral part of the financial statements.
Financial Highlights
Fidelity Advisor Freedom 2035 Fund Class A
| Years ended March 31, | 2019 | 2018 | 2017 | 2016 | 2015 |
| Selected Per–Share Data | | | | | |
| Net asset value, beginning of period | $14.65 | $13.61 | $12.37 | $13.51 | $13.54 |
| Income from Investment Operations | | | | | |
| Net investment income (loss)A | .20 | .12 | .16 | .16 | .19 |
| Net realized and unrealized gain (loss) | .16 | 1.67 | 1.68 | (.66) | .71 |
| Total from investment operations | .36 | 1.79 | 1.84 | (.50) | .90 |
| Distributions from net investment income | (.22) | (.14) | (.16) | (.17) | (.19) |
| Distributions from net realized gain | (1.22) | (.61) | (.44) | (.47) | (.73) |
| Total distributions | (1.43)B | (.75) | (.60) | (.64) | (.93)C |
| Net asset value, end of period | $13.58 | $14.65 | $13.61 | $12.37 | $13.51 |
| Total ReturnD,E | 3.19% | 13.26% | 15.51% | (3.92)% | 6.81% |
| Ratios to Average Net AssetsF,G | | | | | |
| Expenses before reductions | .99% | .87% | .25% | .25% | .25% |
| Expenses net of fee waivers, if any | .99% | .87% | .25% | .25% | .25% |
| Expenses net of all reductions | .99% | .87% | .25% | .25% | .25% |
| Net investment income (loss) | 1.40% | .80% | 1.22% | 1.28% | 1.36% |
| Supplemental Data | | | | | |
| Net assets, end of period (000 omitted) | $1,026,416 | $1,082,982 | $1,117,175 | $1,094,459 | $1,313,452 |
| Portfolio turnover rateF | 23% | 23% | 18% | 22% | 25% |
A Calculated based on average shares outstanding during the period.
B Total distributions of $1.43 per share is comprised of distributions from net investment income of $.216 and distributions from net realized gain of $1.218 per share.
C Total distributions of $.93 per share is comprised of distributions from net investment income of $.194 and distributions from net realized gain of $.733 per share.
D Total returns would have been lower if certain expenses had not been reduced during the applicable periods shown.
E Total returns do not include the effect of the sales charges.
F Amounts do not include the activity of the Underlying Funds.
G Expense ratios reflect operating expenses of the class. Expenses before reductions do not reflect amounts reimbursed by the investment adviser or reductions from expense offset arrangements and do not represent the amount paid by the class during periods when reimbursements or reductions occur. Expenses net of fee waivers reflect expenses after reimbursement by the investment adviser but prior to reductions from expense offset arrangements. Expenses net of all reductions represent the net expenses paid by the class but do not include expenses of the underlying funds in which the Fund invests.
See accompanying notes which are an integral part of the financial statements.
Fidelity Advisor Freedom 2035 Fund Class M
| Years ended March 31, | 2019 | 2018 | 2017 | 2016 | 2015 |
| Selected Per–Share Data | | | | | |
| Net asset value, beginning of period | $14.53 | $13.51 | $12.29 | $13.42 | $13.46 |
| Income from Investment Operations | | | | | |
| Net investment income (loss)A | .16 | .08 | .12 | .13 | .15 |
| Net realized and unrealized gain (loss) | .16 | 1.66 | 1.68 | (.65) | .71 |
| Total from investment operations | .32 | 1.74 | 1.80 | (.52) | .86 |
| Distributions from net investment income | (.19) | (.12) | (.14) | (.14) | (.16) |
| Distributions from net realized gain | (1.22) | (.60) | (.44) | (.46) | (.73) |
| Total distributions | (1.41) | (.72) | (.58) | (.61)B | (.90)C |
| Net asset value, end of period | $13.44 | $14.53 | $13.51 | $12.29 | $13.42 |
| Total ReturnD,E | 2.89% | 12.98% | 15.24% | (4.08)% | 6.52% |
| Ratios to Average Net AssetsF,G | | | | | |
| Expenses before reductions | 1.24% | 1.13% | .50% | .50% | .50% |
| Expenses net of fee waivers, if any | 1.24% | 1.13% | .50% | .50% | .50% |
| Expenses net of all reductions | 1.24% | 1.13% | .50% | .50% | .50% |
| Net investment income (loss) | 1.15% | .55% | .97% | 1.03% | 1.11% |
| Supplemental Data | | | | | |
| Net assets, end of period (000 omitted) | $366,074 | $364,455 | $336,939 | $299,952 | $303,711 |
| Portfolio turnover rateF | 23% | 23% | 18% | 22% | 25% |
A Calculated based on average shares outstanding during the period.
B Total distributions of $.61 per share is comprised of distributions from net investment income of $.143 and distributions from net realized gain of $.464 per share.
C Total distributions of $.90 per share is comprised of distributions from net investment income of $.162 and distributions from net realized gain of $.733 per share.
D Total returns would have been lower if certain expenses had not been reduced during the applicable periods shown.
E Total returns do not include the effect of the sales charges.
F Amounts do not include the activity of the Underlying Funds.
G Expense ratios reflect operating expenses of the class. Expenses before reductions do not reflect amounts reimbursed by the investment adviser or reductions from expense offset arrangements and do not represent the amount paid by the class during periods when reimbursements or reductions occur. Expenses net of fee waivers reflect expenses after reimbursement by the investment adviser but prior to reductions from expense offset arrangements. Expenses net of all reductions represent the net expenses paid by the class but do not include expenses of the underlying funds in which the Fund invests.
See accompanying notes which are an integral part of the financial statements.
Fidelity Advisor Freedom 2035 Fund Class C
| Years ended March 31, | 2019 | 2018 | 2017 | 2016 | 2015 |
| Selected Per–Share Data | | | | | |
| Net asset value, beginning of period | $14.29 | $13.32 | $12.14 | $13.27 | $13.32 |
| Income from Investment Operations | | | | | |
| Net investment income (loss)A | .09 | .01 | .06 | .07 | .08 |
| Net realized and unrealized gain (loss) | .17 | 1.62 | 1.65 | (.65) | .70 |
| Total from investment operations | .26 | 1.63 | 1.71 | (.58) | .78 |
| Distributions from net investment income | (.13) | (.07) | (.09) | (.10) | (.11) |
| Distributions from net realized gain | (1.22) | (.60) | (.44) | (.45) | (.72) |
| Total distributions | (1.35) | (.66)B | (.53) | (.55) | (.83) |
| Net asset value, end of period | $13.20 | $14.29 | $13.32 | $12.14 | $13.27 |
| Total ReturnC,D | 2.39% | 12.40% | 14.69% | (4.58)% | 6.01% |
| Ratios to Average Net AssetsE,F | | | | | |
| Expenses before reductions | 1.73%G | 1.63% | 1.00% | 1.00% | 1.00% |
| Expenses net of fee waivers, if any | 1.73%G | 1.63% | 1.00% | 1.00% | 1.00% |
| Expenses net of all reductions | 1.73%G | 1.63% | 1.00% | 1.00% | 1.00% |
| Net investment income (loss) | .65% | .05% | .47% | .53% | .61% |
| Supplemental Data | | | | | |
| Net assets, end of period (000 omitted) | $44,302 | $65,519 | $61,581 | $54,813 | $56,318 |
| Portfolio turnover rateE | 23% | 23% | 18% | 22% | 25% |
A Calculated based on average shares outstanding during the period.
B Total distributions of $.66 per share is comprised of distributions from net investment income of $.066 and distributions from net realized gain of $.598 per share.
C Total returns would have been lower if certain expenses had not been reduced during the applicable periods shown.
D Total returns do not include the effect of the contingent deferred sales charge.
E Amounts do not include the activity of the Underlying Funds.
F Expense ratios reflect operating expenses of the class. Expenses before reductions do not reflect amounts reimbursed by the investment adviser or reductions from expense offset arrangements and do not represent the amount paid by the class during periods when reimbursements or reductions occur. Expenses net of fee waivers reflect expenses after reimbursement by the investment adviser but prior to reductions from expense offset arrangements. Expenses net of all reductions represent the net expenses paid by the class but do not include expenses of the underlying funds in which the Fund invests.
G On certain classes, the size and fluctuation of net assets and expense amounts may cause ratios to differ from contractual rates.
See accompanying notes which are an integral part of the financial statements.
Fidelity Advisor Freedom 2035 Fund Class I
| Years ended March 31, | 2019 | 2018 | 2017 | 2016 | 2015 |
| Selected Per–Share Data | | | | | |
| Net asset value, beginning of period | $14.75 | $13.71 | $12.45 | $13.59 | $13.61 |
| Income from Investment Operations | | | | | |
| Net investment income (loss)A | .23 | .15 | .19 | .20 | .22 |
| Net realized and unrealized gain (loss) | .17 | 1.68 | 1.70 | (.67) | .72 |
| Total from investment operations | .40 | 1.83 | 1.89 | (.47) | .94 |
| Distributions from net investment income | (.25) | (.17) | (.19) | (.20) | (.23) |
| Distributions from net realized gain | (1.22) | (.62) | (.44) | (.47) | (.73) |
| Total distributions | (1.46)B | (.79) | (.63) | (.67) | (.96) |
| Net asset value, end of period | $13.69 | $14.75 | $13.71 | $12.45 | $13.59 |
| Total ReturnC | 3.47% | 13.50% | 15.79% | (3.63)% | 7.11% |
| Ratios to Average Net AssetsD,E | | | | | |
| Expenses before reductions | .74% | .64% | - %F | - %F | - %F |
| Expenses net of fee waivers, if any | .74% | .64% | -% | -% | -% |
| Expenses net of all reductions | .74% | .64% | -% | -% | -% |
| Net investment income (loss) | 1.65% | 1.04% | 1.47% | 1.53% | 1.61% |
| Supplemental Data | | | | | |
| Net assets, end of period (000 omitted) | $907,369 | $867,707 | $689,261 | $684,976 | $710,667 |
| Portfolio turnover rateD | 23% | 23% | 18% | 22% | 25% |
A Calculated based on average shares outstanding during the period.
B Total distributions of $1.46 per share is comprised of distributions from net investment income of $.245 and distributions from net realized gain of $1.218 per share.
C Total returns would have been lower if certain expenses had not been reduced during the applicable periods shown.
D Amounts do not include the activity of the Underlying Funds.
E Expense ratios reflect operating expenses of the class. Expenses before reductions do not reflect amounts reimbursed by the investment adviser or reductions from expense offset arrangements and do not represent the amount paid by the class during periods when reimbursements or reductions occur. Expenses net of fee waivers reflect expenses after reimbursement by the investment adviser but prior to reductions from expense offset arrangements. Expenses net of all reductions represent the net expenses paid by the class but do not include expenses of the underlying funds in which the Fund invests.
F Amount represents less than .005%.
See accompanying notes which are an integral part of the financial statements.
Fidelity Advisor Freedom 2035 Fund Class Z
| Year ended March 31, | 2019 A |
| Selected Per–Share Data | |
| Net asset value, beginning of period | $14.78 |
| Income from Investment Operations | |
| Net investment income (loss)B | .07 |
| Net realized and unrealized gain (loss) | (.32)C |
| Total from investment operations | (.25) |
| Distributions from net investment income | (.31) |
| Distributions from net realized gain | (.59) |
| Total distributions | (.90) |
| Net asset value, end of period | $13.63 |
| Total ReturnD,E | (.96)% |
| Ratios to Average Net AssetsF,G | |
| Expenses before reductions | .63%H,I |
| Expenses net of fee waivers, if any | .63%H,I |
| Expenses net of all reductions | .63%H,I |
| Net investment income (loss) | 1.01%H |
| Supplemental Data | |
| Net assets, end of period (000 omitted) | $2,821 |
| Portfolio turnover rateF | 23% |
A For the period October 2, 2018 (commencement of sale of shares) to March 31, 2019.
B Calculated based on average shares outstanding during the period.
C The amount shown for a share outstanding does not correspond with the aggregate net gain (loss) on investments for the period due to the timing of sales and repurchases of shares in relation to fluctuating market values of the investments of the Fund.
D Total returns for periods of less than one year are not annualized.
E Total returns would have been lower if certain expenses had not been reduced during the applicable periods shown.
F Amounts do not include the activity of the Underlying Funds.
G Expense ratios reflect operating expenses of the class. Expenses before reductions do not reflect amounts reimbursed by the investment adviser or reductions from expense offset arrangements and do not represent the amount paid by the class during periods when reimbursements or reductions occur. Expense ratios before reductions for start-up periods may not be representative of longer-term operating periods. Expenses net of fee waivers reflect expenses after reimbursement by the investment adviser but prior to reductions from expense offset arrangements. Expenses net of all reductions represent the net expenses paid by the class but do not include expenses of the underlying funds in which the Fund invests.
H Annualized
I On certain classes, the size and fluctuation of net assets and expense amounts may cause ratios to differ from contractual rates.
See accompanying notes which are an integral part of the financial statements.
Fidelity Advisor Freedom 2035 Fund Class Z6
| Years ended March 31, | 2019 | 2018 A |
| Selected Per–Share Data | | |
| Net asset value, beginning of period | $14.75 | $14.07 |
| Income from Investment Operations | | |
| Net investment income (loss)B | .26 | .12 |
| Net realized and unrealized gain (loss) | .16 | 1.15 |
| Total from investment operations | .42 | 1.27 |
| Distributions from net investment income | (.29) | (.22) |
| Distributions from net realized gain | (1.22) | (.38) |
| Total distributions | (1.50)C | (.59)D |
| Net asset value, end of period | $13.67 | $14.75 |
| Total ReturnE,F | 3.65% | 9.03% |
| Ratios to Average Net AssetsG,H | | |
| Expenses before reductions | .49% | .51%I,J |
| Expenses net of fee waivers, if any | .49% | .51%I,J |
| Expenses net of all reductions | .49% | .51%I,J |
| Net investment income (loss) | 1.90% | .97%I |
| Supplemental Data | | |
| Net assets, end of period (000 omitted) | $45,355 | $15,784 |
| Portfolio turnover rateG | 23% | 23% |
A For the period June 6, 2017 (commencement of sale of shares) to March 31, 2018.
B Calculated based on average shares outstanding during the period.
C Total distributions of $1.50 per share is comprised of distributions from net investment income of $.285 and distributions from net realized gain of $1.218 per share.
D Total distributions of $.59 per share is comprised of distributions from net investment income of $.216 and distributions from net realized gain of $.378 per share.
E Total returns for periods of less than one year are not annualized.
F Total returns would have been lower if certain expenses had not been reduced during the applicable periods shown.
G Amounts do not include the activity of the Underlying Funds.
H Expense ratios reflect operating expenses of the class. Expenses before reductions do not reflect amounts reimbursed by the investment adviser or reductions from expense offset arrangements and do not represent the amount paid by the class during periods when reimbursements or reductions occur. Expenses net of fee waivers reflect expenses after reimbursement by the investment adviser but prior to reductions from expense offset arrangements. Expenses net of all reductions represent the net expenses paid by the class but do not include expenses of the underlying funds in which the Fund invests.
I Annualized
J On certain classes, the size and fluctuation of net assets and expense amounts may cause ratios to differ from contractual rates.
See accompanying notes which are an integral part of the financial statements.
Fidelity Advisor Freedom® 2040 Fund
Investment Summary (Unaudited)
The information in the following tables is based on the direct investments of the Fund.
Top Holdings as of March 31, 2019
| | % of fund's net assets |
| Fidelity Series Large Cap Stock Fund | 12.0 |
| Fidelity Series International Growth Fund | 9.3 |
| Fidelity Series Emerging Markets Opportunities Fund | 9.1 |
| Fidelity Series International Value Fund | 8.7 |
| Fidelity Series Stock Selector Large Cap Value Fund | 7.8 |
| Fidelity Series Value Discovery Fund | 7.6 |
| Fidelity Advisor Series Equity Growth Fund | 7.2 |
| Fidelity Series Opportunistic Insights Fund | 6.7 |
| Fidelity Advisor Series Growth Opportunities Fund | 5.3 |
| Fidelity Series Small Cap Opportunities Fund | 4.1 |
| | 77.8 |
Asset Allocation (% of fund's net assets)
| Period end |
| | Domestic Equity Funds | 61.0% |
| | International Equity Funds | 31.2% |
| | Bond Funds | 6.8% |
| | Short-Term Funds | 1.1% |
| | Net Other Assets (Liabilities)* | (0.1)% |

* Net Other Assets (Liabilities) are not included in the pie chart
Domestic Equity Funds category includes Fidelity Series Commodity Strategy Fund which invests in commodity-related investments.
Fidelity Advisor Freedom® 2040 Fund
Schedule of Investments March 31, 2019
Showing Percentage of Net Assets
| U.S. Treasury Obligations - 0.0% | | | |
| | | Principal Amount | Value |
| U.S. Treasury Bills, yield at date of purchase 2.39% 4/4/19 (a) | | | |
| (Cost $829,837) | | 830,000 | 829,837 |
| | | Shares | Value |
|
| Domestic Equity Funds - 61.0% | | | |
| Fidelity Advisor Series Equity Growth Fund (b) | | 11,218,868 | $156,278,837 |
| Fidelity Advisor Series Growth Opportunities Fund (b) | | 7,927,463 | 114,631,108 |
| Fidelity Advisor Series Small Cap Fund (b) | | 6,673,390 | 69,937,130 |
| Fidelity Series All-Sector Equity Fund (b) | | 7,522,137 | 72,438,183 |
| Fidelity Series Commodity Strategy Fund (b) | | 11,311,894 | 53,957,733 |
| Fidelity Series Large Cap Stock Fund (b) | | 17,716,344 | 259,544,447 |
| Fidelity Series Large Cap Value Index Fund (b) | | 2,286,685 | 28,377,759 |
| Fidelity Series Opportunistic Insights Fund (b) | | 8,301,409 | 145,108,638 |
| Fidelity Series Small Cap Opportunities Fund (b) | | 6,657,060 | 89,604,022 |
| Fidelity Series Stock Selector Large Cap Value Fund (b) | | 14,378,321 | 169,664,183 |
| Fidelity Series Value Discovery Fund (b) | | 13,268,623 | 165,725,099 |
| TOTAL DOMESTIC EQUITY FUNDS | | | |
| (Cost $1,154,450,638) | | | 1,325,267,139 |
|
| International Equity Funds - 31.2% | | | |
| Fidelity Series Canada Fund (b) | | 1,979,225 | 20,405,806 |
| Fidelity Series Emerging Markets Fund (b) | | 2,162,472 | 21,170,601 |
| Fidelity Series Emerging Markets Opportunities Fund (b) | | 10,656,527 | 197,465,452 |
| Fidelity Series International Growth Fund (b) | | 13,317,390 | 202,291,154 |
| Fidelity Series International Small Cap Fund (b) | | 2,994,994 | 46,512,254 |
| Fidelity Series International Value Fund (b) | | 20,352,924 | 189,282,195 |
| TOTAL INTERNATIONAL EQUITY FUNDS | | | |
| (Cost $577,022,020) | | | 677,127,462 |
|
| Bond Funds - 6.8% | | | |
| Fidelity Series Emerging Markets Debt Fund (b) | | 1,467,824 | 14,076,429 |
| Fidelity Series Floating Rate High Income Fund (b) | | 289,730 | 2,685,794 |
| Fidelity Series High Income Fund (b) | | 2,445,406 | 22,986,815 |
| Fidelity Series Inflation-Protected Bond Index Fund (b) | | 644,638 | 6,304,555 |
| Fidelity Series International Credit Fund (b) | | 112,637 | 1,113,984 |
| Fidelity Series Investment Grade Bond Fund (b) | | 1,244,292 | 13,911,189 |
| Fidelity Series Long-Term Treasury Bond Index Fund (b) | | 8,736,434 | 77,492,172 |
| Fidelity Series Real Estate Income Fund (b) | | 911,419 | 9,943,579 |
| TOTAL BOND FUNDS | | | |
| (Cost $146,642,004) | | | 148,514,517 |
|
| Short-Term Funds - 1.1% | | | |
| Fidelity Cash Central Fund, 2.48% (c) | | 4,124,872 | 4,125,697 |
| Fidelity Series Government Money Market Fund 2.50%(b)(d) | | 15,575,950 | 15,575,950 |
| Fidelity Series Short-Term Credit Fund (b) | | 426,595 | 4,253,155 |
| TOTAL SHORT-TERM FUNDS | | | |
| (Cost $23,944,176) | | | 23,954,802 |
| TOTAL INVESTMENT IN SECURITIES - 100.1% | | | |
| (Cost $1,902,888,675) | | | 2,175,693,757 |
| NET OTHER ASSETS (LIABILITIES) - (0.1)% | | | (1,776,837) |
| NET ASSETS - 100% | | | $2,173,916,920 |
| Futures Contracts | | | | | |
| | Number of contracts | Expiration Date | Notional Amount | Value | Unrealized Appreciation/(Depreciation) |
| Purchased | | | | | |
| Treasury Contracts | | | | | |
| CBOT 2-Year U.S. Treasury Note Contracts (United States) | 2 | June 2019 | $426,188 | $1,857 | $1,857 |
| CBOT 5-Year U.S. Treasury Note Contracts (United States) | 6 | June 2019 | 694,969 | 7,910 | 7,910 |
| CBOT 10-Year U.S. Treasury Note Contracts (United States) | 4 | June 2019 | 496,875 | 9,242 | 9,242 |
| CBOT Long Term U.S. Treasury Bond Contracts (United States) | 4 | June 2019 | 598,625 | 20,991 | 20,991 |
| CBOT Ultra Long Term U.S. Treasury Bond Contracts (United States) | 6 | June 2019 | 1,008,000 | 50,166 | 50,166 |
|
| TOTAL PURCHASED | | | | | 90,166 |
|
| Sold | | | | | |
| Equity Index Contracts | | | | | |
| CME E-mini S&P 500 Index Contracts (United States) | 9 | June 2019 | 1,277,010 | (1,278) | (1,278) |
| ICE E-mini MSCI Emerging Markets Index Contracts (United States) | 94 | June 2019 | 4,969,780 | (92,669) | (92,669) |
|
| TOTAL SOLD | | | | | (93,947) |
|
| TOTAL FUTURES CONTRACTS | | | | | $(3,781) |
The notional amount of futures purchased as a percentage of Net Assets is 0.1%
The notional amount of futures sold as a percentage of Net Assets is 0.3%
Legend
(a) Security or a portion of the security was pledged to cover margin requirements for futures contracts. At period end, the value of securities pledged amounted to $500,901.
(b) Affiliated Fund
(c) Affiliated fund that is generally available only to investment companies and other accounts managed by Fidelity Investments. The rate quoted is the annualized seven-day yield of the fund at period end. A complete unaudited listing of the fund's holdings as of its most recent quarter end is available upon request. In addition, each Fidelity Central Fund's financial statements, which are not covered by the Fund's Report of Independent Registered Public Accounting Firm, are available on the SEC's website or upon request.
(d) The rate quoted is the annualized seven-day yield of the fund at period end.
Affiliated Central Funds
Information regarding fiscal year to date income earned by the Fund from investments in Fidelity Central Funds is as follows:
| Fund | Income earned |
| Fidelity Cash Central Fund | $51,737 |
| Total | $51,737 |
Amounts in the income column in the above table include any capital gain distributions from underlying funds, which are presented in the corresponding line-item in the Statement of Operations, if applicable.
Affiliated Underlying Funds
Fiscal year to date information regarding the Fund's investments in affiliated Underlying Funds, excluding any Money Market Central Funds, is presented below. Exchanges between classes of the same affiliated Underlying Funds may occur.
| Affiliate | Value, beginning of period | Purchases | Sales Proceeds | Dividend Income | Realized Gain (loss) | Change in Unrealized appreciation (depreciation) | Value, end of period |
| Fidelity Advisor Series Equity Growth Fund | $140,682,362 | $23,167,003 | $14,221,469 | $11,504,958 | $447,770 | $6,203,171 | $156,278,837 |
| Fidelity Advisor Series Equity Value Fund | 162,239,363 | 14,846,287 | 7,538,783 | 5,595,859 | (57,730) | (23,785,932) | -- |
| Fidelity Advisor Series Growth & Income Fund | 248,668,633 | 33,284,766 | 11,706,552 | 22,620,220 | 188,101 | (38,338,164) | -- |
| Fidelity Advisor Series Growth Opportunities Fund | 92,316,051 | 23,983,824 | 16,876,686 | 18,050,431 | 2,405,857 | 12,802,062 | 114,631,108 |
| Fidelity Advisor Series Opportunistic Insights Fund | 130,719,494 | 15,285,834 | 6,147,581 | 10,739,473 | 234,454 | (50,881,217) | -- |
| Fidelity Advisor Series Small Cap Fund | 70,269,615 | 13,827,824 | 7,104,472 | 6,503,254 | (57,645) | (6,998,192) | 69,937,130 |
| Fidelity Advisor Series Stock Selector Large Cap Value Fund | 163,792,386 | 23,058,658 | 7,605,462 | 14,178,217 | (65,106) | (23,665,293) | -- |
| Fidelity Series 100 Index Fund | 69,719,202 | -- | 75,057,597 | -- | 30,843,158 | (25,504,763) | -- |
| Fidelity Series All-Sector Equity Fund | 96,485,101 | 22,296,154 | 36,306,160 | 17,617,860 | 2,753,808 | (12,790,720) | 72,438,183 |
| Fidelity Series Canada Fund | 19,115,913 | 3,163,106 | 2,185,297 | 447,291 | (20,939) | 333,023 | 20,405,806 |
| Fidelity Series Commodity Strategy Fund | 45,218,312 | 22,851,448 | 8,080,476 | 3,168,180 | (2,423,727) | (3,607,824) | 53,957,733 |
| Fidelity Series Emerging Markets Debt Fund | 14,499,809 | 1,587,601 | 1,307,254 | 847,685 | (20,972) | (682,755) | 14,076,429 |
| Fidelity Series Emerging Markets Fund | -- | 21,361,038 | 882,715 | 82,388 | (6,889) | 699,167 | 21,170,601 |
| Fidelity Series Emerging Markets Opportunities Fund | 198,131,267 | 61,121,410 | 31,830,692 | 15,169,683 | (321,326) | (29,635,207) | 197,465,452 |
| Fidelity Series Floating Rate High Income Fund | 4,805,312 | 495,099 | 2,525,400 | 250,048 | (134,880) | 45,663 | 2,685,794 |
| Fidelity Series Government Money Market Fund 2.50% | 35,343,924 | 32,442,231 | 52,210,205 | 546,854 | -- | -- | 15,575,950 |
| Fidelity Series High Income Fund | 30,392,696 | 3,454,938 | 10,490,734 | 1,873,823 | (514,262) | 144,177 | 22,986,815 |
| Fidelity Series Inflation-Protected Bond Index Fund | 17,270,143 | 2,638,668 | 13,728,820 | 131,992 | (131,367) | 255,931 | 6,304,555 |
| Fidelity Series International Credit Fund | 1,062,890 | 53,874 | -- | 53,873 | -- | (2,780) | 1,113,984 |
| Fidelity Series International Growth Fund | 192,586,304 | 42,324,122 | 21,910,348 | 12,496,695 | (462,489) | (10,246,435) | 202,291,154 |
| Fidelity Series International Small Cap Fund | 48,053,368 | 11,088,689 | 4,709,439 | 4,188,472 | (94,519) | (7,825,845) | 46,512,254 |
| Fidelity Series International Value Fund | 194,847,297 | 36,988,983 | 18,653,605 | 6,860,811 | (464,586) | (23,435,894) | 189,282,195 |
| Fidelity Series Investment Grade Bond Fund | 10,253,916 | 5,771,072 | 2,374,166 | 366,983 | (33,774) | 294,141 | 13,911,189 |
| Fidelity Series Large Cap Stock Fund | -- | 19,239,101 | 14,001,585 | 10,467,189 | (748,835) | 22,958,982 | 259,544,447 |
| Fidelity Series Large Cap Value Index Fund | 27,203,330 | 3,695,691 | 2,817,771 | 1,313,502 | 15,972 | 280,537 | 28,377,759 |
| Fidelity Series Long-Term Treasury Bond Index Fund | 48,736,296 | 54,641,835 | 28,812,758 | 2,114,412 | (906,481) | 3,833,280 | 77,492,172 |
| Fidelity Series Opportunistic Insights Fund | -- | 21,158,729 | 7,120,817 | 11,741,591 | (503,514) | 42,363,256 | 145,108,638 |
| Fidelity Series Real Estate Equity Fund | 16,888,409 | 140,813 | 17,708,455 | 89,155 | 1,454,060 | (774,827) | -- |
| Fidelity Series Real Estate Income Fund | 9,492,141 | 1,286,850 | 1,018,967 | 707,662 | (11,392) | 194,947 | 9,943,579 |
| Fidelity Series Short-Term Credit Fund | 6,224,937 | 1,173,408 | 3,203,332 | 154,820 | (12,339) | 70,481 | 4,253,155 |
| Fidelity Series Small Cap Opportunities Fund | 85,799,818 | 17,498,098 | 8,826,797 | 10,183,811 | (4,907) | (4,862,190) | 89,604,022 |
| Fidelity Series Stock Selector Large Cap Value Fund | -- | 20,601,373 | 9,112,975 | 14,336,618 | (719,033) | 3,379,635 | 169,664,183 |
| Fidelity Series Value Discovery Fund | -- | 15,660,866 | 9,002,774 | 10,020,654 | (353,758) | 13,717,560 | 165,725,099 |
| | $2,180,818,289 | $570,189,393 | $455,080,144 | $214,424,464 | $30,272,710 | $(155,462,025) | $2,170,738,223 |
Amounts in the income column in the above table include any capital gain distributions from underlying funds, which are presented in the corresponding line-item in the Statement of Operations, if applicable.
Investment Valuation
The following is a summary of the inputs used, as of March 31, 2019, involving the Fund's assets and liabilities carried at fair value. The inputs or methodology used for valuing securities may not be an indication of the risk associated with investing in those securities. For more information on valuation inputs, and their aggregation into the levels used below, please refer to the Investment Valuation section in the accompanying Notes to Financial Statements.
| | Valuation Inputs at Reporting Date: |
| Description | Total | Level 1 | Level 2 | Level 3 |
| Investments in Securities: | | | | |
| Other Short-Term Investments | $829,837 | $-- | $829,837 | $-- |
| Domestic Equity Funds | 1,325,267,139 | 1,325,267,139 | -- | -- |
| International Equity Funds | 677,127,462 | 677,127,462 | -- | -- |
| Bond Funds | 148,514,517 | 148,514,517 | -- | -- |
| Short-Term Funds | 23,954,802 | 23,954,802 | -- | -- |
| Total Investments in Securities: | $2,175,693,757 | $2,174,863,920 | $829,837 | $-- |
| Derivative Instruments: | | | | |
| Assets | | | | |
| Futures Contracts | $90,166 | $90,166 | $-- | $-- |
| Total Assets | $90,166 | $90,166 | $-- | $-- |
| Liabilities | | | | |
| Futures Contracts | $(93,947) | $(93,947) | $-- | $-- |
| Total Liabilities | $(93,947) | $(93,947) | $-- | $-- |
| Total Derivative Instruments: | $(3,781) | $(3,781) | $-- | $-- |
Value of Derivative Instruments
The following table is a summary of the Fund's value of derivative instruments by primary risk exposure as of March 31, 2019. For additional information on derivative instruments, please refer to the Derivative Instruments section in the accompanying Notes to Financial Statements.
| Primary Risk Exposure / Derivative Type | Value |
| | Asset | Liability |
| Equity Risk | | |
| Futures Contracts(a) | $0 | $(93,947) |
| Total Equity Risk | 0 | (93,947) |
| Interest Rate Risk | | |
| Futures Contracts(a) | 90,166 | 0 |
| Total Interest Rate Risk | 90,166 | 0 |
| Total Value of Derivatives | $90,166 | $(93,947) |
(a) Net Other Assets (Liabilities) are not included in the pie chart
See accompanying notes which are an integral part of the financial statements.
Fidelity Advisor Freedom® 2040 Fund
Financial Statements
Statement of Assets and Liabilities
| | | March 31, 2019 |
| Assets | | |
Investment in securities, at value — See accompanying schedule:
Unaffiliated issuers (cost $829,837) | $829,837 | |
| Fidelity Central Funds (cost $4,125,690) | 4,125,697 | |
| Other affiliated issuers (cost $1,897,933,148) | 2,170,738,223 | |
| Total Investment in Securities (cost $1,902,888,675) | | $2,175,693,757 |
| Receivable for investments sold | | 7,354,777 |
| Receivable for fund shares sold | | 2,106,107 |
| Distributions receivable from Fidelity Central Funds | | 8,286 |
| Total assets | | 2,185,162,927 |
| Liabilities | | |
| Payable for investments purchased | $3,087,506 | |
| Payable for fund shares redeemed | 6,374,747 | |
| Accrued management fee | 1,333,276 | |
| Distribution and service plan fees payable | 391,199 | |
| Payable for daily variation margin on futures contracts | 59,279 | |
| Total liabilities | | 11,246,007 |
| Net Assets | | $2,173,916,920 |
| Net Assets consist of: | | |
| Paid in capital | | $1,805,378,935 |
| Total distributable earnings (loss) | | 368,537,985 |
| Net Assets | | $2,173,916,920 |
| Net Asset Value and Maximum Offering Price | | |
| Class A: | | |
| Net Asset Value and redemption price per share ($916,426,196 ÷ 63,099,421 shares) | | $14.52 |
| Maximum offering price per share (100/94.25 of $14.52) | | $15.41 |
| Class M: | | |
| Net Asset Value and redemption price per share ($356,106,752 ÷ 24,659,431 shares) | | $14.44 |
| Maximum offering price per share (100/96.50 of $14.44) | | $14.96 |
| Class C: | | |
| Net Asset Value and offering price per share ($53,714,863 ÷ 3,799,820 shares)(a) | | $14.14 |
| Class I: | | |
| Net Asset Value, offering price and redemption price per share ($805,101,929 ÷ 55,054,674 shares) | | $14.62 |
| Class Z: | | |
| Net Asset Value, offering price and redemption price per share ($1,501,080 ÷ 103,131 shares) | | $14.56 |
| Class Z6: | | |
| Net Asset Value, offering price and redemption price per share ($41,066,100 ÷ 2,813,299 shares) | | $14.60 |
(a) Redemption price per share is equal to net asset value less any applicable contingent deferred sales charge.
See accompanying notes which are an integral part of the financial statements.
Statement of Operations
| | | Year ended March 31, 2019 |
| Investment Income | | |
| Dividends: | | |
| Affiliated issuers | | $50,913,030 |
| Interest | | 22,994 |
| Income from Fidelity Central Funds | | 51,737 |
| Total income | | 50,987,761 |
| Expenses | | |
| Management fee | $15,967,129 | |
| Distribution and service plan fees | 4,779,846 | |
| Independent trustees' fees and expenses | 10,193 | |
| Total expenses before reductions | 20,757,168 | |
| Expense reductions | (56) | |
| Total expenses after reductions | | 20,757,112 |
| Net investment income (loss) | | 30,230,649 |
| Realized and Unrealized Gain (Loss) | | |
| Net realized gain (loss) on: | | |
| Investment securities: | | |
| Unaffiliated issuers | 4,183 | |
| Fidelity Central Funds | (11) | |
| Other affiliated issuers | 30,272,710 | |
| Futures contracts | (916,130) | |
| Capital gain distributions from underlying funds: | | |
| Affiliated issuers | 163,511,435 | |
| Total net realized gain (loss) | | 192,872,187 |
| Change in net unrealized appreciation (depreciation) on: | | |
| Investment securities: | | |
| Fidelity Central Funds | 7 | |
| Other affiliated issuers | (155,462,025) | |
| Futures contracts | (3,781) | |
| Total change in net unrealized appreciation (depreciation) | | (155,465,799) |
| Net gain (loss) | | 37,406,388 |
| Net increase (decrease) in net assets resulting from operations | | $67,637,037 |
See accompanying notes which are an integral part of the financial statements.
Statement of Changes in Net Assets
| | Year ended March 31, 2019 | Year ended March 31, 2018 |
| Increase (Decrease) in Net Assets | | |
| Operations | | |
| Net investment income (loss) | $30,230,649 | $16,946,944 |
| Net realized gain (loss) | 192,872,187 | 154,265,342 |
| Change in net unrealized appreciation (depreciation) | (155,465,799) | 91,725,502 |
| Net increase (decrease) in net assets resulting from operations | 67,637,037 | 262,937,788 |
| Distributions to shareholders | (214,667,735) | – |
| Distributions to shareholders from net investment income | – | (20,779,436) |
| Distributions to shareholders from net realized gain | – | (90,229,747) |
| Total distributions | (214,667,735) | (111,009,183) |
| Share transactions - net increase (decrease) | 141,920,324 | 7,294,311 |
| Total increase (decrease) in net assets | (5,110,374) | 159,222,916 |
| Net Assets | | |
| Beginning of period | 2,179,027,294 | 2,019,804,378 |
| End of period | $2,173,916,920 | $2,179,027,294 |
| Other Information | | |
| Distributions in excess of net investment income end of period | | $(1,775,924) |
See accompanying notes which are an integral part of the financial statements.
Financial Highlights
Fidelity Advisor Freedom 2040 Fund Class A
| Years ended March 31, | 2019 | 2018 | 2017 | 2016 | 2015 |
| Selected Per–Share Data | | | | | |
| Net asset value, beginning of period | $15.69 | $14.57 | $13.25 | $14.49 | $14.51 |
| Income from Investment Operations | | | | | |
| Net investment income (loss)A | .21 | .12 | .17 | .17 | .20 |
| Net realized and unrealized gain (loss) | .15 | 1.81 | 1.80 | (.69) | .76 |
| Total from investment operations | .36 | 1.93 | 1.97 | (.52) | .96 |
| Distributions from net investment income | (.23) | (.15) | (.17) | (.18) | (.21) |
| Distributions from net realized gain | (1.31) | (.66) | (.48) | (.54) | (.77) |
| Total distributions | (1.53)B | (.81) | (.65) | (.72) | (.98) |
| Net asset value, end of period | $14.52 | $15.69 | $14.57 | $13.25 | $14.49 |
| Total ReturnC,D | 3.04% | 13.42% | 15.53% | (3.82)% | 6.76% |
| Ratios to Average Net AssetsE,F | | | | | |
| Expenses before reductions | .99%G | .87% | .25% | .25% | .25% |
| Expenses net of fee waivers, if any | .99%G | .87% | .25% | .25% | .25% |
| Expenses net of all reductions | .99%G | .87% | .25% | .25% | .25% |
| Net investment income (loss) | 1.37% | .78% | 1.22% | 1.27% | 1.35% |
| Supplemental Data | | | | | |
| Net assets, end of period (000 omitted) | $916,426 | $948,970 | $965,401 | $950,816 | $1,154,277 |
| Portfolio turnover rateF | 21% | 23% | 18% | 21% | 24% |
A Calculated based on average shares outstanding during the period.
B Total distributions of $1.53 per share is comprised of distributions from net investment income of $.226 and distributions from net realized gain of $1.308 per share.
C Total returns would have been lower if certain expenses had not been reduced during the applicable periods shown.
D Total returns do not include the effect of the sales charges.
E Expense ratios reflect operating expenses of the class. Expenses before reductions do not reflect amounts reimbursed by the investment adviser or reductions from expense offset arrangements and do not represent the amount paid by the class during periods when reimbursements or reductions occur. Expenses net of fee waivers reflect expenses after reimbursement by the investment adviser but prior to reductions from expense offset arrangements. Expenses net of all reductions represent the net expenses paid by the class but do not include expenses of the underlying funds in which the Fund invests.
F Amounts do not include the activity of the Underlying Funds.
G On certain classes, the size and fluctuation of net assets and expense amounts may cause ratios to differ from contractual rates.
See accompanying notes which are an integral part of the financial statements.
Fidelity Advisor Freedom 2040 Fund Class M
| Years ended March 31, | 2019 | 2018 | 2017 | 2016 | 2015 |
| Selected Per–Share Data | | | | | |
| Net asset value, beginning of period | $15.62 | $14.52 | $13.21 | $14.45 | $14.47 |
| Income from Investment Operations | | | | | |
| Net investment income (loss)A | .17 | .08 | .13 | .14 | .16 |
| Net realized and unrealized gain (loss) | .16 | 1.80 | 1.81 | (.70) | .76 |
| Total from investment operations | .33 | 1.88 | 1.94 | (.56) | .92 |
| Distributions from net investment income | (.20) | (.12) | (.15) | (.15) | (.17) |
| Distributions from net realized gain | (1.31) | (.66) | (.48) | (.53) | (.77) |
| Total distributions | (1.51) | (.78) | (.63) | (.68) | (.94) |
| Net asset value, end of period | $14.44 | $15.62 | $14.52 | $13.21 | $14.45 |
| Total ReturnB,C | 2.82% | 13.11% | 15.26% | (4.07)% | 6.51% |
| Ratios to Average Net AssetsD,E | | | | | |
| Expenses before reductions | 1.25% | 1.13% | .50% | .50% | .50% |
| Expenses net of fee waivers, if any | 1.25% | 1.13% | .50% | .50% | .50% |
| Expenses net of all reductions | 1.25% | 1.13% | .50% | .50% | .50% |
| Net investment income (loss) | 1.12% | .53% | .97% | 1.02% | 1.10% |
| Supplemental Data | | | | | |
| Net assets, end of period (000 omitted) | $356,107 | $343,164 | $324,990 | $310,107 | $333,069 |
| Portfolio turnover rateE | 21% | 23% | 18% | 21% | 24% |
A Calculated based on average shares outstanding during the period.
B Total returns would have been lower if certain expenses had not been reduced during the applicable periods shown.
C Total returns do not include the effect of the sales charges.
D Expense ratios reflect operating expenses of the class. Expenses before reductions do not reflect amounts reimbursed by the investment adviser or reductions from expense offset arrangements and do not represent the amount paid by the class during periods when reimbursements or reductions occur. Expenses net of fee waivers reflect expenses after reimbursement by the investment adviser but prior to reductions from expense offset arrangements. Expenses net of all reductions represent the net expenses paid by the class but do not include expenses of the underlying funds in which the Fund invests.
E Amounts do not include the activity of the Underlying Funds.
See accompanying notes which are an integral part of the financial statements.
Fidelity Advisor Freedom 2040 Fund Class C
| Years ended March 31, | 2019 | 2018 | 2017 | 2016 | 2015 |
| Selected Per–Share Data | | | | | |
| Net asset value, beginning of period | $15.32 | $14.28 | $13.02 | $14.27 | $14.30 |
| Income from Investment Operations | | | | | |
| Net investment income (loss)A | .09 | –B | .06 | .07 | .09 |
| Net realized and unrealized gain (loss) | .18 | 1.77 | 1.78 | (.70) | .75 |
| Total from investment operations | .27 | 1.77 | 1.84 | (.63) | .84 |
| Distributions from net investment income | (.14) | (.07) | (.10) | (.10) | (.12) |
| Distributions from net realized gain | (1.31) | (.66) | (.48) | (.52) | (.75) |
| Total distributions | (1.45) | (.73) | (.58) | (.62) | (.87) |
| Net asset value, end of period | $14.14 | $15.32 | $14.28 | $13.02 | $14.27 |
| Total ReturnC,D | 2.37% | 12.52% | 14.70% | (4.63)% | 6.01% |
| Ratios to Average Net AssetsE,F | | | | | |
| Expenses before reductions | 1.74%G | 1.63% | 1.00% | 1.00% | 1.00% |
| Expenses net of fee waivers, if any | 1.74%G | 1.63% | 1.00% | 1.00% | 1.00% |
| Expenses net of all reductions | 1.74%G | 1.63% | 1.00% | 1.00% | 1.00% |
| Net investment income (loss) | .62% | .03% | .48% | .52% | .60% |
| Supplemental Data | | | | | |
| Net assets, end of period (000 omitted) | $53,715 | $84,365 | $79,480 | $73,036 | $77,130 |
| Portfolio turnover rateF | 21% | 23% | 18% | 21% | 24% |
A Calculated based on average shares outstanding during the period.
B Amount represents less than $.005 per share.
C Total returns would have been lower if certain expenses had not been reduced during the applicable periods shown.
D Total returns do not include the effect of the contingent deferred sales charge.
E Expense ratios reflect operating expenses of the class. Expenses before reductions do not reflect amounts reimbursed by the investment adviser or reductions from expense offset arrangements and do not represent the amount paid by the class during periods when reimbursements or reductions occur. Expenses net of fee waivers reflect expenses after reimbursement by the investment adviser but prior to reductions from expense offset arrangements. Expenses net of all reductions represent the net expenses paid by the class but do not include expenses of the underlying funds in which the Fund invests.
F Amounts do not include the activity of the Underlying Funds.
G On certain classes, the size and fluctuation of net assets and expense amounts may cause ratios to differ from contractual rates.
See accompanying notes which are an integral part of the financial statements.
Fidelity Advisor Freedom 2040 Fund Class I
| Years ended March 31, | 2019 | 2018 | 2017 | 2016 | 2015 |
| Selected Per–Share Data | | | | | |
| Net asset value, beginning of period | $15.78 | $14.65 | $13.32 | $14.57 | $14.59 |
| Income from Investment Operations | | | | | |
| Net investment income (loss)A | .24 | .16 | .20 | .21 | .23 |
| Net realized and unrealized gain (loss) | .16 | 1.83 | 1.82 | (.71) | .76 |
| Total from investment operations | .40 | 1.99 | 2.02 | (.50) | .99 |
| Distributions from net investment income | (.26) | (.19) | (.20) | (.22) | (.24) |
| Distributions from net realized gain | (1.31) | (.67) | (.49) | (.54) | (.77) |
| Total distributions | (1.56)B | (.86) | (.69) | (.75)C | (1.01) |
| Net asset value, end of period | $14.62 | $15.78 | $14.65 | $13.32 | $14.57 |
| Total ReturnD | 3.31% | 13.74% | 15.82% | (3.62)% | 6.99% |
| Ratios to Average Net AssetsE,F | | | | | |
| Expenses before reductions | .75% | .63% | –%G | –%G | –%G |
| Expenses net of fee waivers, if any | .75% | .63% | -% | -% | -% |
| Expenses net of all reductions | .75% | .63% | -% | -% | -% |
| Net investment income (loss) | 1.62% | 1.02% | 1.47% | 1.52% | 1.60% |
| Supplemental Data | | | | | |
| Net assets, end of period (000 omitted) | $805,102 | $790,667 | $649,934 | $629,599 | $688,278 |
| Portfolio turnover rateF | 21% | 23% | 18% | 21% | 24% |
A Calculated based on average shares outstanding during the period.
B Total distributions of $1.56 per share is comprised of distributions from net investment income of $.256 and distributions from net realized gain of $1.308 per share.
C Total distributions of $.75 per share is comprised of distributions from net investment income of $.216 and distributions from net realized gain of $.535 per share.
D Total returns would have been lower if certain expenses had not been reduced during the applicable periods shown.
E Expense ratios reflect operating expenses of the class. Expenses before reductions do not reflect amounts reimbursed by the investment adviser or reductions from expense offset arrangements and do not represent the amount paid by the class during periods when reimbursements or reductions occur. Expenses net of fee waivers reflect expenses after reimbursement by the investment adviser but prior to reductions from expense offset arrangements. Expenses net of all reductions represent the net expenses paid by the class but do not include expenses of the underlying funds in which the Fund invests.
F Amounts do not include the activity of the Underlying Funds.
G Amount represents less than .005%.
See accompanying notes which are an integral part of the financial statements.
Fidelity Advisor Freedom 2040 Fund Class Z
| Year ended March 31, | 2019 A |
| Selected Per–Share Data | |
| Net asset value, beginning of period | $15.85 |
| Income from Investment Operations | |
| Net investment income (loss)B | .36 |
| Net realized and unrealized gain (loss) | (.69)C |
| Total from investment operations | (.33) |
| Distributions from net investment income | (.33) |
| Distributions from net realized gain | (.63) |
| Total distributions | (.96) |
| Net asset value, end of period | $14.56 |
| Total ReturnD,E | (1.30)% |
| Ratios to Average Net AssetsF,G | |
| Expenses before reductions | .65%H,I |
| Expenses net of fee waivers, if any | .65%H,I |
| Expenses net of all reductions | .65%H,I |
| Net investment income (loss) | 5.06%H |
| Supplemental Data | |
| Net assets, end of period (000 omitted) | $1,501 |
| Portfolio turnover rateG | 21% |
A For the period October 2, 2018 (commencement of sale of shares) to March 31, 2019.
B Calculated based on average shares outstanding during the period.
C The amount shown for a share outstanding does not correspond with the aggregate net gain (loss) on investments for the period due to the timing of sales and repurchases of shares in relation to fluctuating market values of the investments of the Fund.
D Total returns for periods of less than one year are not annualized.
E Total returns would have been lower if certain expenses had not been reduced during the applicable periods shown.
F Expense ratios reflect operating expenses of the class. Expenses before reductions do not reflect amounts reimbursed by the investment adviser or reductions from expense offset arrangements and do not represent the amount paid by the class during periods when reimbursements or reductions occur. Expense ratios before reductions for start-up periods may not be representative of longer-term operating periods. Expenses net of fee waivers reflect expenses after reimbursement by the investment adviser but prior to reductions from expense offset arrangements. Expenses net of all reductions represent the net expenses paid by the class but do not include expenses of the underlying funds in which the Fund invests.
G Amounts do not include the activity of the Underlying Funds.
H Annualized
I On certain classes, the size and fluctuation of net assets and expense amounts may cause ratios to differ from contractual rates.
See accompanying notes which are an integral part of the financial statements.
Fidelity Advisor Freedom 2040 Fund Class Z6
| Years ended March 31, | 2019 | 2018 A |
| Selected Per–Share Data | | |
| Net asset value, beginning of period | $15.76 | $15.04 |
| Income from Investment Operations | | |
| Net investment income (loss)B | .28 | .18 |
| Net realized and unrealized gain (loss) | .17 | 1.20 |
| Total from investment operations | .45 | 1.38 |
| Distributions from net investment income | (.30) | (.23) |
| Distributions from net realized gain | (1.31) | (.42) |
| Total distributions | (1.61) | (.66)C |
| Net asset value, end of period | $14.60 | $15.76 |
| Total ReturnD,E | 3.64% | 9.12% |
| Ratios to Average Net AssetsF,G | | |
| Expenses before reductions | .49% | .51%H,I |
| Expenses net of fee waivers, if any | .49% | .51%H,I |
| Expenses net of all reductions | .49% | .51%H,I |
| Net investment income (loss) | 1.87% | 1.39%H |
| Supplemental Data | | |
| Net assets, end of period (000 omitted) | $41,066 | $11,861 |
| Portfolio turnover rateG | 21% | 23% |
A For the period June 6, 2017 (commencement of sale of shares) to March 31, 2018.
B Calculated based on average shares outstanding during the period.
C Total distributions of $.66 per share is comprised of distributions from net investment income of $.234 and distributions from net realized gain of $.421 per share.
D Total returns for periods of less than one year are not annualized.
E Total returns would have been lower if certain expenses had not been reduced during the applicable periods shown.
F Expense ratios reflect operating expenses of the class. Expenses before reductions do not reflect amounts reimbursed by the investment adviser or reductions from expense offset arrangements and do not represent the amount paid by the class during periods when reimbursements or reductions occur. Expenses net of fee waivers reflect expenses after reimbursement by the investment adviser but prior to reductions from expense offset arrangements. Expenses net of all reductions represent the net expenses paid by the class but do not include expenses of the underlying funds in which the Fund invests.
G Amounts do not include the activity of the Underlying Funds.
H Annualized
I On certain classes, the size and fluctuation of net assets may cause rounding of expense amounts and ratios to differ from contractual rates.
See accompanying notes which are an integral part of the financial statements.
Fidelity Advisor Freedom�� 2045 Fund
Investment Summary (Unaudited)
The information in the following tables is based on the direct investments of the Fund.
Top Holdings as of March 31, 2019
| | % of fund's net assets |
| Fidelity Series Large Cap Stock Fund | 12.0 |
| Fidelity Series International Growth Fund | 9.3 |
| Fidelity Series Emerging Markets Opportunities Fund | 9.1 |
| Fidelity Series International Value Fund | 8.7 |
| Fidelity Series Stock Selector Large Cap Value Fund | 7.8 |
| Fidelity Series Value Discovery Fund | 7.6 |
| Fidelity Advisor Series Equity Growth Fund | 7.2 |
| Fidelity Series Opportunistic Insights Fund | 6.7 |
| Fidelity Advisor Series Growth Opportunities Fund | 5.3 |
| Fidelity Series Small Cap Opportunities Fund | 4.1 |
| | 77.8 |
Asset Allocation (% of fund's net assets)
| Period end |
| | Domestic Equity Funds | 61.0% |
| | International Equity Funds | 31.2% |
| | Bond Funds | 6.8% |
| | Short-Term Funds | 1.1% |
| | Net Other Assets (Liabilities)* | (0.1)% |

* Net Other Assets (Liabilities) are not included in the pie chart
Domestic Equity Funds category includes Fidelity Series Commodity Strategy Fund which invests in commodity-related investments.
Fidelity Advisor Freedom® 2045 Fund
Schedule of Investments March 31, 2019
Showing Percentage of Net Assets
| U.S. Treasury Obligations - 0.0% | | | |
| | | Principal Amount | Value |
| U.S. Treasury Bills, yield at date of purchase 2.39% 4/4/19 (a) | | | |
| (Cost $529,896) | | 530,000 | 529,896 |
| | | Shares | Value |
|
| Domestic Equity Funds - 61.0% | | | |
| Fidelity Advisor Series Equity Growth Fund (b) | | 7,194,962 | $100,225,825 |
| Fidelity Advisor Series Growth Opportunities Fund (b) | | 5,078,433 | 73,434,142 |
| Fidelity Advisor Series Small Cap Fund (b) | | 4,284,083 | 44,897,186 |
| Fidelity Series All-Sector Equity Fund (b) | | 4,822,327 | 46,439,012 |
| Fidelity Series Commodity Strategy Fund (b) | | 7,250,443 | 34,584,614 |
| Fidelity Series Large Cap Stock Fund (b) | | 11,357,251 | 166,383,723 |
| Fidelity Series Large Cap Value Index Fund (b) | | 1,466,124 | 18,194,605 |
| Fidelity Series Opportunistic Insights Fund (b) | | 5,324,085 | 93,065,012 |
| Fidelity Series Small Cap Opportunities Fund (b) | | 4,271,930 | 57,500,174 |
| Fidelity Series Stock Selector Large Cap Value Fund (b) | | 9,218,785 | 108,781,667 |
| Fidelity Series Value Discovery Fund (b) | | 8,506,813 | 106,250,097 |
| TOTAL DOMESTIC EQUITY FUNDS | | | |
| (Cost $756,570,094) | | | 849,756,057 |
|
| International Equity Funds - 31.2% | | | |
| Fidelity Series Canada Fund (b) | | 1,269,792 | 13,091,551 |
| Fidelity Series Emerging Markets Fund (b) | | 1,386,329 | 13,572,163 |
| Fidelity Series Emerging Markets Opportunities Fund (b) | | 6,830,666 | 126,572,242 |
| Fidelity Series International Growth Fund (b) | | 8,535,621 | 129,656,079 |
| Fidelity Series International Small Cap Fund (b) | | 1,920,917 | 29,831,844 |
| Fidelity Series International Value Fund (b) | | 13,051,348 | 121,377,539 |
| TOTAL INTERNATIONAL EQUITY FUNDS | | | |
| (Cost $381,733,434) | | | 434,101,418 |
|
| Bond Funds - 6.8% | | | |
| Fidelity Series Emerging Markets Debt Fund (b) | | 927,037 | 8,890,287 |
| Fidelity Series Floating Rate High Income Fund (b) | | 186,006 | 1,724,279 |
| Fidelity Series High Income Fund (b) | | 1,564,075 | 14,702,301 |
| Fidelity Series Inflation-Protected Bond Index Fund (b) | | 413,399 | 4,043,045 |
| Fidelity Series International Credit Fund (b) | | 67,861 | 671,144 |
| Fidelity Series Investment Grade Bond Fund (b) | | 811,295 | 9,070,281 |
| Fidelity Series Long-Term Treasury Bond Index Fund (b) | | 5,600,729 | 49,678,462 |
| Fidelity Series Real Estate Income Fund (b) | | 582,043 | 6,350,088 |
| TOTAL BOND FUNDS | | | |
| (Cost $93,684,055) | | | 95,129,887 |
|
| Short-Term Funds - 1.1% | | | |
| Fidelity Cash Central Fund, 2.48% (c) | | 2,602,111 | 2,602,631 |
| Fidelity Series Government Money Market Fund 2.50%(b)(d) | | 9,971,816 | 9,971,816 |
| Fidelity Series Short-Term Credit Fund (b) | | 272,204 | 2,713,873 |
| TOTAL SHORT-TERM FUNDS | | | |
| (Cost $15,280,737) | | | 15,288,320 |
| TOTAL INVESTMENT IN SECURITIES - 100.1% | | | |
| (Cost $1,247,798,216) | | | 1,394,805,578 |
| NET OTHER ASSETS (LIABILITIES) - (0.1)% | | | (1,115,244) |
| NET ASSETS - 100% | | | $1,393,690,334 |
| Futures Contracts | | | | | |
| | Number of contracts | Expiration Date | Notional Amount | Value | Unrealized Appreciation/(Depreciation) |
| Purchased | | | | | |
| Treasury Contracts | | | | | |
| CBOT 2-Year U.S. Treasury Note Contracts (United States) | 1 | June 2019 | $213,094 | $928 | $928 |
| CBOT 5-Year U.S. Treasury Note Contracts (United States) | 4 | June 2019 | 463,313 | 5,273 | 5,273 |
| CBOT 10-Year U.S. Treasury Note Contracts (United States) | 2 | June 2019 | 248,438 | 4,621 | 4,621 |
| CBOT Long Term U.S. Treasury Bond Contracts (United States) | 2 | June 2019 | 299,313 | 10,496 | 10,496 |
| CBOT Ultra Long Term U.S. Treasury Bond Contracts (United States) | 4 | June 2019 | 672,000 | 33,444 | 33,444 |
|
| TOTAL PURCHASED | | | | | 54,762 |
|
| Sold | | | | | |
| Equity Index Contracts | | | | | |
| CME E-mini S&P 500 Index Contracts (United States) | 7 | June 2019 | 993,230 | (30,063) | (30,063) |
| ICE E-mini MSCI Emerging Markets Index Contracts (United States) | 60 | June 2019 | 3,172,200 | (59,150) | (59,150) |
|
| TOTAL SOLD | | | | | (89,213) |
|
| TOTAL FUTURES CONTRACTS | | | | | $(34,451) |
The notional amount of futures purchased as a percentage of Net Assets is 0.1%
The notional amount of futures sold as a percentage of Net Assets is 0.3%
Legend
(a) Security or a portion of the security was pledged to cover margin requirements for futures contracts. At period end, the value of securities pledged amounted to $322,936.
(b) Affiliated Fund
(c) Affiliated fund that is generally available only to investment companies and other accounts managed by Fidelity Investments. The rate quoted is the annualized seven-day yield of the fund at period end. A complete unaudited listing of the fund's holdings as of its most recent quarter end is available upon request. In addition, each Fidelity Central Fund's financial statements, which are not covered by the Fund's Report of Independent Registered Public Accounting Firm, are available on the SEC's website or upon request.
(d) The rate quoted is the annualized seven-day yield of the fund at period end.
Affiliated Central Funds
Information regarding fiscal year to date income earned by the Fund from investments in Fidelity Central Funds is as follows:
| Fund | Income earned |
| Fidelity Cash Central Fund | $32,994 |
| Total | $32,994 |
Amounts in the income column in the above table include any capital gain distributions from underlying funds, which are presented in the corresponding line-item in the Statement of Operations, if applicable.
Affiliated Underlying Funds
Fiscal year to date information regarding the Fund's investments in affiliated Underlying Funds, excluding any Money Market Central Funds, is presented below. Exchanges between classes of the same affiliated Underlying Funds may occur.
| Affiliate | Value, beginning of period | Purchases | Sales Proceeds | Dividend Income | Realized Gain (loss) | Change in Unrealized appreciation (depreciation) | Value, end of period |
| Fidelity Advisor Series Equity Growth Fund | $87,585,095 | $18,068,837 | $9,545,951 | $7,309,485 | $45,011 | $4,072,833 | $100,225,825 |
| Fidelity Advisor Series Equity Value Fund | 101,062,304 | 10,772,182 | 4,243,501 | 3,549,420 | (13,968) | (11,254,877) | -- |
| Fidelity Advisor Series Growth & Income Fund | 154,913,386 | 23,199,677 | 6,588,966 | 14,317,406 | 71,885 | (21,854,702) | -- |
| Fidelity Advisor Series Growth Opportunities Fund | 57,467,634 | 17,422,218 | 10,986,973 | 11,465,700 | 1,157,924 | 8,373,339 | 73,434,142 |
| Fidelity Advisor Series Opportunistic Insights Fund | 81,384,078 | 10,890,542 | 3,463,613 | 6,811,697 | 50,151 | (27,571,504) | -- |
| Fidelity Advisor Series Small Cap Fund | 43,759,112 | 10,382,511 | 4,726,043 | 4,132,852 | (168,742) | (4,349,652) | 44,897,186 |
| Fidelity Advisor Series Stock Selector Large Cap Value Fund | 102,033,097 | 15,983,029 | 4,260,771 | 8,993,313 | (37,896) | (11,088,764) | -- |
| Fidelity Series 100 Index Fund | 43,308,860 | -- | 46,620,020 | -- | 20,937,928 | (17,626,768) | -- |
| Fidelity Series All-Sector Equity Fund | 60,085,583 | 15,965,730 | 23,139,124 | 11,227,564 | 1,349,062 | (7,822,239) | 46,439,012 |
| Fidelity Series Canada Fund | 11,904,189 | 2,457,011 | 1,454,552 | 285,375 | (18,774) | 203,677 | 13,091,551 |
| Fidelity Series Commodity Strategy Fund | 28,249,093 | 15,521,775 | 5,350,855 | 2,015,002 | (1,800,458) | (2,034,941) | 34,584,614 |
| Fidelity Series Emerging Markets Debt Fund | 8,907,300 | 1,284,813 | 867,203 | 528,897 | (12,107) | (422,516) | 8,890,287 |
| Fidelity Series Emerging Markets Fund | -- | 13,824,352 | 691,370 | 52,490 | (8,785) | 447,966 | 13,572,163 |
| Fidelity Series Emerging Markets Opportunities Fund | 123,530,365 | 42,723,311 | 20,826,507 | 9,666,313 | (485,090) | (18,369,837) | 126,572,242 |
| Fidelity Series Floating Rate High Income Fund | 3,008,295 | 411,027 | 1,638,034 | 158,964 | (125,039) | 68,030 | 1,724,279 |
| Fidelity Series Government Money Market Fund 2.50% | 21,893,886 | 21,338,182 | 33,260,252 | 345,619 | -- | -- | 9,971,816 |
| Fidelity Series High Income Fund | 18,707,935 | 2,777,249 | 6,546,407 | 1,180,595 | (180,066) | (56,410) | 14,702,301 |
| Fidelity Series Inflation-Protected Bond Index Fund | 10,812,378 | 1,811,610 | 8,658,422 | 83,843 | (96,406) | 173,885 | 4,043,045 |
| Fidelity Series International Credit Fund | 640,362 | 32,457 | -- | 32,457 | -- | (1,675) | 671,144 |
| Fidelity Series International Growth Fund | 119,909,466 | 31,189,349 | 14,613,454 | 7,962,687 | (412,363) | (6,416,919) | 129,656,079 |
| Fidelity Series International Small Cap Fund | 29,918,661 | 8,134,436 | 3,192,801 | 2,669,212 | (112,934) | (4,915,518) | 29,831,844 |
| Fidelity Series International Value Fund | 121,339,335 | 27,801,482 | 12,555,555 | 4,371,955 | (468,642) | (14,739,081) | 121,377,539 |
| Fidelity Series Investment Grade Bond Fund | 6,440,580 | 4,058,382 | 1,599,980 | 234,260 | (23,287) | 194,586 | 9,070,281 |
| Fidelity Series Large Cap Stock Fund | -- | 15,812,476 | 10,689,675 | 6,666,008 | (464,333) | 11,983,974 | 166,383,722 |
| Fidelity Series Large Cap Value Index Fund | 16,906,145 | 2,989,777 | 1,877,001 | 836,767 | 521 | 175,163 | 18,194,605 |
| Fidelity Series Long-Term Treasury Bond Index Fund | 30,339,836 | 35,956,804 | 18,503,031 | 1,339,914 | (575,045) | 2,459,898 | 49,678,462 |
| Fidelity Series Opportunistic Insights Fund | -- | 15,402,805 | 5,443,204 | 7,485,720 | (455,801) | 22,271,558 | 93,065,012 |
| Fidelity Series Real Estate Equity Fund | 10,477,062 | 88,288 | 10,987,257 | 55,604 | 580,263 | (158,356) | -- |
| Fidelity Series Real Estate Income Fund | 5,876,043 | 1,037,769 | 678,220 | 446,566 | (10,851) | 125,347 | 6,350,088 |
| Fidelity Series Short-Term Credit Fund | 3,944,220 | 824,077 | 2,091,430 | 99,096 | (7,998) | 45,004 | 2,713,873 |
| Fidelity Series Small Cap Opportunities Fund | 53,422,944 | 13,120,085 | 5,878,356 | 6,472,946 | (123,636) | (3,040,863) | 57,500,174 |
| Fidelity Series Stock Selector Large Cap Value Fund | -- | 15,451,528 | 6,969,943 | 9,133,779 | (574,932) | (1,753,681) | 108,781,667 |
| Fidelity Series Value Discovery Fund | -- | 12,265,368 | 6,873,589 | 6,384,232 | (324,745) | 4,860,923 | 106,250,097 |
| | $1,357,827,244 | $408,999,139 | $294,822,060 | $136,315,738 | $17,690,847 | $(98,022,120) | $1,391,673,050 |
Amounts in the income column in the above table include any capital gain distributions from underlying funds, which are presented in the corresponding line-item in the Statement of Operations, if applicable.
Investment Valuation
The following is a summary of the inputs used, as of March 31, 2019, involving the Fund's assets and liabilities carried at fair value. The inputs or methodology used for valuing securities may not be an indication of the risk associated with investing in those securities. For more information on valuation inputs, and their aggregation into the levels used below, please refer to the Investment Valuation section in the accompanying Notes to Financial Statements.
| | Valuation Inputs at Reporting Date: |
| Description | Total | Level 1 | Level 2 | Level 3 |
| Investments in Securities: | | | | |
| Other Short-Term Investments | $529,896 | $-- | $529,896 | $-- |
| Domestic Equity Funds | 849,756,057 | 849,756,057 | -- | -- |
| International Equity Funds | 434,101,418 | 434,101,418 | -- | -- |
| Bond Funds | 95,129,887 | 95,129,887 | -- | -- |
| Short-Term Funds | 15,288,320 | 15,288,320 | -- | -- |
| Total Investments in Securities: | $1,394,805,578 | $1,394,275,682 | $529,896 | $-- |
| Derivative Instruments: | | | | |
| Assets | | | | |
| Futures Contracts | $54,762 | $54,762 | $-- | $-- |
| Total Assets | $54,762 | $54,762 | $-- | $-- |
| Liabilities | | | | |
| Futures Contracts | $(89,213) | $(89,213) | $-- | $-- |
| Total Liabilities | $(89,213) | $(89,213) | $-- | $-- |
| Total Derivative Instruments: | $(34,451) | $(34,451) | $-- | $-- |
Value of Derivative Instruments
The following table is a summary of the Fund's value of derivative instruments by primary risk exposure as of March 31, 2019. For additional information on derivative instruments, please refer to the Derivative Instruments section in the accompanying Notes to Financial Statements.
| Primary Risk Exposure / Derivative Type | Value |
| | Asset | Liability |
| Equity Risk | | |
| Futures Contracts(a) | $0 | $(89,213) |
| Total Equity Risk | 0 | (89,213) |
| Interest Rate Risk | | |
| Futures Contracts(a) | 54,762 | 0 |
| Total Interest Rate Risk | 54,762 | 0 |
| Total Value of Derivatives | $54,762 | $(89,213) |
(a) Reflects gross cumulative appreciation (depreciation) on futures contracts as presented in the Schedule of Investments. In the Statement of Assets and Liabilities, the period end daily variation margin is included in receivable or payable for daily variation margin on futures contracts, and the net cumulative appreciation (depreciation) is included in distributable earnings.
See accompanying notes which are an integral part of the financial statements.
Fidelity Advisor Freedom® 2045 Fund
Financial Statements
Statement of Assets and Liabilities
| | | March 31, 2019 |
| Assets | | |
Investment in securities, at value — See accompanying schedule:
Unaffiliated issuers (cost $529,896) | $529,896 | |
| Fidelity Central Funds (cost $2,602,627) | 2,602,631 | |
| Other affiliated issuers (cost $1,244,665,693) | 1,391,673,051 | |
| Total Investment in Securities (cost $1,247,798,216) | | $1,394,805,578 |
| Receivable for investments sold | | 2,054,646 |
| Receivable for fund shares sold | | 1,860,726 |
| Distributions receivable from Fidelity Central Funds | | 5,226 |
| Total assets | | 1,398,726,176 |
| Liabilities | | |
| Payable for investments purchased | $2,581,044 | |
| Payable for fund shares redeemed | 1,333,840 | |
| Accrued management fee | 848,718 | |
| Distribution and service plan fees payable | 221,105 | |
| Payable for daily variation margin on futures contracts | 51,135 | |
| Total liabilities | | 5,035,842 |
| Net Assets | | $1,393,690,334 |
| Net Assets consist of: | | |
| Paid in capital | | $1,188,210,278 |
| Total distributable earnings (loss) | | 205,480,056 |
| Net Assets | | $1,393,690,334 |
| Net Asset Value and Maximum Offering Price | | |
| Class A: | | |
| Net Asset Value and redemption price per share ($547,562,967 ÷ 48,346,223 shares) | | $11.33 |
| Maximum offering price per share (100/94.25 of $11.33) | | $12.02 |
| Class M: | | |
| Net Asset Value and redemption price per share ($210,624,798 ÷ 18,767,358 shares) | | $11.22 |
| Maximum offering price per share (100/96.50 of $11.22) | | $11.63 |
| Class C: | | |
| Net Asset Value and offering price per share ($25,382,573 ÷ 2,293,382 shares)(a) | | $11.07 |
| Class I: | | |
| Net Asset Value, offering price and redemption price per share ($577,251,815 ÷ 50,610,709 shares) | | $11.41 |
| Class Z: | | |
| Net Asset Value, offering price and redemption price per share ($1,375,538 ÷ 121,205 shares) | | $11.35 |
| Class Z6: | | |
| Net Asset Value, offering price and redemption price per share ($31,492,643 ÷ 2,764,832 shares) | | $11.39 |
(a) Redemption price per share is equal to net asset value less any applicable contingent deferred sales charge.
See accompanying notes which are an integral part of the financial statements.
Statement of Operations
| | | Year ended March 31, 2019 |
| Investment Income | | |
| Dividends: | | |
| Affiliated issuers | | $32,346,031 |
| Interest | | 14,624 |
| Income from Fidelity Central Funds | | 32,994 |
| Total income | | 32,393,649 |
| Expenses | | |
| Management fee | $10,096,908 | |
| Distribution and service plan fees | 2,695,484 | |
| Independent trustees' fees and expenses | 6,427 | |
| Total expenses before reductions | 12,798,819 | |
| Expense reductions | (112) | |
| Total expenses after reductions | | 12,798,707 |
| Net investment income (loss) | | 19,594,942 |
| Realized and Unrealized Gain (Loss) | | |
| Net realized gain (loss) on: | | |
| Investment securities: | | |
| Unaffiliated issuers | 2,697 | |
| Fidelity Central Funds | (3) | |
| Other affiliated issuers | 17,690,847 | |
| Futures contracts | (552,365) | |
| Capital gain distributions from underlying funds: | | |
| Affiliated issuers | 103,969,707 | |
| Total net realized gain (loss) | | 121,110,883 |
| Change in net unrealized appreciation (depreciation) on: | | |
| Investment securities: | | |
| Fidelity Central Funds | 4 | |
| Other affiliated issuers | (98,022,120) | |
| Futures contracts | (34,451) | |
| Total change in net unrealized appreciation (depreciation) | | (98,056,567) |
| Net gain (loss) | | 23,054,316 |
| Net increase (decrease) in net assets resulting from operations | | $42,649,258 |
See accompanying notes which are an integral part of the financial statements.
Statement of Changes in Net Assets
| | Year ended March 31, 2019 | Year ended March 31, 2018 |
| Increase (Decrease) in Net Assets | | |
| Operations | | |
| Net investment income (loss) | $19,594,942 | $10,671,463 |
| Net realized gain (loss) | 121,110,883 | 86,422,686 |
| Change in net unrealized appreciation (depreciation) | (98,056,567) | 61,790,750 |
| Net increase (decrease) in net assets resulting from operations | 42,649,258 | 158,884,899 |
| Distributions to shareholders | (133,342,942) | – |
| Distributions to shareholders from net investment income | – | (12,899,292) |
| Distributions to shareholders from net realized gain | – | (46,138,745) |
| Total distributions | (133,342,942) | (59,038,037) |
| Share transactions - net increase (decrease) | 127,638,941 | 66,150,547 |
| Total increase (decrease) in net assets | 36,945,257 | 165,997,409 |
| Net Assets | | |
| Beginning of period | 1,356,745,077 | 1,190,747,668 |
| End of period | $1,393,690,334 | $1,356,745,077 |
| Other Information | | |
| Distributions in excess of net investment income end of period | | $(761,157) |
See accompanying notes which are an integral part of the financial statements.
Financial Highlights
Fidelity Advisor Freedom 2045 Fund Class A
| Years ended March 31, | 2019 | 2018 | 2017 | 2016 | 2015 |
| Selected Per–Share Data | | | | | |
| Net asset value, beginning of period | $12.21 | $11.26 | $10.23 | $11.15 | $11.31 |
| Income from Investment Operations | | | | | |
| Net investment income (loss)A | .16 | .10 | .13 | .13 | .15 |
| Net realized and unrealized gain (loss) | .13 | 1.40 | 1.39 | (.54) | .59 |
| Total from investment operations | .29 | 1.50 | 1.52 | (.41) | .74 |
| Distributions from net investment income | (.18) | (.12) | (.13) | (.14) | (.16) |
| Distributions from net realized gain | (.99) | (.43) | (.36) | (.37) | (.74) |
| Total distributions | (1.17) | (.55) | (.49) | (.51) | (.90) |
| Net asset value, end of period | $11.33 | $12.21 | $11.26 | $10.23 | $11.15 |
| Total ReturnB,C | 3.13% | 13.44% | 15.50% | (3.85)% | 6.80% |
| Ratios to Average Net AssetsD,E | | | | | |
| Expenses before reductions | .99%F | .87% | .25% | .25% | .25% |
| Expenses net of fee waivers, if any | .99%F | .87% | .25% | .25% | .25% |
| Expenses net of all reductions | .99%F | .87% | .25% | .25% | .25% |
| Net investment income (loss) | 1.38% | .79% | 1.22% | 1.27% | 1.37% |
| Supplemental Data | | | | | |
| Net assets, end of period (000 omitted) | $547,563 | $566,474 | $556,090 | $531,510 | $623,734 |
| Portfolio turnover rateD | 22% | 21% | 22% | 26% | 27% |
A Calculated based on average shares outstanding during the period.
B Total returns would have been lower if certain expenses had not been reduced during the applicable periods shown.
C Total returns do not include the effect of the sales charges.
D Amounts do not include the activity of the Underlying Funds.
E Expense ratios reflect operating expenses of the class. Expenses before reductions do not reflect amounts reimbursed by the investment adviser or reductions from expense offset arrangements and do not represent the amount paid by the class during periods when reimbursements or reductions occur. Expenses net of fee waivers reflect expenses after reimbursement by the investment adviser but prior to reductions from expense offset arrangements. Expenses net of all reductions represent the net expenses paid by the class but do not include expenses of the underlying funds in which the Fund invests.
F On certain classes, the size and fluctuation of net assets and expense amounts may cause ratios to differ from contractual rates.
See accompanying notes which are an integral part of the financial statements.
Fidelity Advisor Freedom 2045 Fund Class M
| Years ended March 31, | 2019 | 2018 | 2017 | 2016 | 2015 |
| Selected Per–Share Data | | | | | |
| Net asset value, beginning of period | $12.12 | $11.19 | $10.17 | $11.09 | $11.26 |
| Income from Investment Operations | | | | | |
| Net investment income (loss)A | .13 | .06 | .10 | .11 | .13 |
| Net realized and unrealized gain (loss) | .12 | 1.39 | 1.39 | (.54) | .57 |
| Total from investment operations | .25 | 1.45 | 1.49 | (.43) | .70 |
| Distributions from net investment income | (.16) | (.10) | (.11) | (.12) | (.13) |
| Distributions from net realized gain | (.99) | (.43) | (.36) | (.37) | (.74) |
| Total distributions | (1.15) | (.52)B | (.47) | (.49) | (.87) |
| Net asset value, end of period | $11.22 | $12.12 | $11.19 | $10.17 | $11.09 |
| Total ReturnC,D | 2.79% | 13.12% | 15.29% | (4.10)% | 6.50% |
| Ratios to Average Net AssetsE,F | | | | | |
| Expenses before reductions | 1.24%G | 1.13% | .50% | .50% | .50% |
| Expenses net of fee waivers, if any | 1.24%G | 1.13% | .50% | .50% | .50% |
| Expenses net of all reductions | 1.24%G | 1.13% | .50% | .50% | .50% |
| Net investment income (loss) | 1.13% | .54% | .97% | 1.02% | 1.12% |
| Supplemental Data | | | | | |
| Net assets, end of period (000 omitted) | $210,625 | $207,442 | $186,200 | $158,557 | $153,677 |
| Portfolio turnover rateE | 22% | 21% | 22% | 26% | 27% |
A Calculated based on average shares outstanding during the period.
B Total distributions of $.52 per share is comprised of distributions from net investment income of $.096 and distributions from net realized gain of $.428 per share.
C Total returns would have been lower if certain expenses had not been reduced during the applicable periods shown.
D Total returns do not include the effect of the sales charges.
E Amounts do not include the activity of the Underlying Funds.
F Expense ratios reflect operating expenses of the class. Expenses before reductions do not reflect amounts reimbursed by the investment adviser or reductions from expense offset arrangements and do not represent the amount paid by the class during periods when reimbursements or reductions occur. Expenses net of fee waivers reflect expenses after reimbursement by the investment adviser but prior to reductions from expense offset arrangements. Expenses net of all reductions represent the net expenses paid by the class but do not include expenses of the underlying funds in which the Fund invests.
G On certain classes, the size and fluctuation of net assets and expense amounts may cause ratios to differ from contractual rates.
See accompanying notes which are an integral part of the financial statements.
Fidelity Advisor Freedom 2045 Fund Class C
| Years ended March 31, | 2019 | 2018 | 2017 | 2016 | 2015 |
| Selected Per–Share Data | | | | | |
| Net asset value, beginning of period | $11.98 | $11.08 | $10.09 | $11.01 | $11.19 |
| Income from Investment Operations | | | | | |
| Net investment income (loss)A | .07 | –B | .05 | .05 | .07 |
| Net realized and unrealized gain (loss) | .13 | 1.38 | 1.38 | (.53) | .57 |
| Total from investment operations | .20 | 1.38 | 1.43 | (.48) | .64 |
| Distributions from net investment income | (.12) | (.05) | (.08) | (.08) | (.09) |
| Distributions from net realized gain | (.99) | (.43) | (.36) | (.36) | (.73) |
| Total distributions | (1.11) | (.48) | (.44) | (.44) | (.82) |
| Net asset value, end of period | $11.07 | $11.98 | $11.08 | $10.09 | $11.01 |
| Total ReturnC,D | 2.29% | 12.59% | 14.71% | (4.59)% | 5.95% |
| Ratios to Average Net AssetsE,F | | | | | |
| Expenses before reductions | 1.74%G | 1.63% | 1.00% | 1.00% | 1.00% |
| Expenses net of fee waivers, if any | 1.74%G | 1.63% | 1.00% | 1.00% | 1.00% |
| Expenses net of all reductions | 1.74%G | 1.63% | 1.00% | 1.00% | 1.00% |
| Net investment income (loss) | .63% | .04% | .47% | .53% | .62% |
| Supplemental Data | | | | | |
| Net assets, end of period (000 omitted) | $25,383 | $30,549 | $27,491 | $23,423 | $22,493 |
| Portfolio turnover rateE | 22% | 21% | 22% | 26% | 27% |
A Calculated based on average shares outstanding during the period.
B Amount represents less than $.005 per share.
C Total returns would have been lower if certain expenses had not been reduced during the applicable periods shown.
D Total returns do not include the effect of the contingent deferred sales charge.
E Amounts do not include the activity of the Underlying Funds.
F Expense ratios reflect operating expenses of the class. Expenses before reductions do not reflect amounts reimbursed by the investment adviser or reductions from expense offset arrangements and do not represent the amount paid by the class during periods when reimbursements or reductions occur. Expenses net of fee waivers reflect expenses after reimbursement by the investment adviser but prior to reductions from expense offset arrangements. Expenses net of all reductions represent the net expenses paid by the class but do not include expenses of the underlying funds in which the Fund invests.
G On certain classes, the size and fluctuation of net assets and expense amounts may cause ratios to differ from contractual rates.
See accompanying notes which are an integral part of the financial statements.
Fidelity Advisor Freedom 2045 Fund Class I
| Years ended March 31, | 2019 | 2018 | 2017 | 2016 | 2015 |
| Selected Per–Share Data | | | | | |
| Net asset value, beginning of period | $12.29 | $11.33 | $10.28 | $11.21 | $11.37 |
| Income from Investment Operations | | | | | |
| Net investment income (loss)A | .19 | .12 | .16 | .16 | .18 |
| Net realized and unrealized gain (loss) | .13 | 1.42 | 1.40 | (.55) | .59 |
| Total from investment operations | .32 | 1.54 | 1.56 | (.39) | .77 |
| Distributions from net investment income | (.20) | (.14) | (.15) | (.17) | (.19) |
| Distributions from net realized gain | (.99) | (.44) | (.36) | (.37) | (.74) |
| Total distributions | (1.20)B | (.58) | (.51) | (.54) | (.93) |
| Net asset value, end of period | $11.41 | $12.29 | $11.33 | $10.28 | $11.21 |
| Total ReturnC | 3.34% | 13.77% | 15.83% | (3.66)% | 7.03% |
| Ratios to Average Net AssetsD,E | | | | | |
| Expenses before reductions | .75% | .64% | - %F | - %F | - %F |
| Expenses net of fee waivers, if any | .75% | .64% | -% | -% | -% |
| Expenses net of all reductions | .75% | .64% | -% | -% | -% |
| Net investment income (loss) | 1.63% | 1.03% | 1.47% | 1.52% | 1.62% |
| Supplemental Data | | | | | |
| Net assets, end of period (000 omitted) | $577,252 | $543,170 | $420,967 | $390,675 | $400,667 |
| Portfolio turnover rateD | 22% | 21% | 22% | 26% | 27% |
A Calculated based on average shares outstanding during the period.
B Total distributions of $1.20 per share is comprised of distributions from net investment income of $.204 and distributions from net realized gain of $.993 per share.
C Total returns would have been lower if certain expenses had not been reduced during the applicable periods shown.
D Amounts do not include the activity of the Underlying Funds.
E Expense ratios reflect operating expenses of the class. Expenses before reductions do not reflect amounts reimbursed by the investment adviser or reductions from expense offset arrangements and do not represent the amount paid by the class during periods when reimbursements or reductions occur. Expenses net of fee waivers reflect expenses after reimbursement by the investment adviser but prior to reductions from expense offset arrangements. Expenses net of all reductions represent the net expenses paid by the class but do not include expenses of the underlying funds in which the Fund invests.
F Amount represents less than .005%.
See accompanying notes which are an integral part of the financial statements.
Fidelity Advisor Freedom 2045 Fund Class Z
| Year ended March 31, | 2019 A |
| Selected Per–Share Data | |
| Net asset value, beginning of period | $12.36 |
| Income from Investment Operations | |
| Net investment income (loss)B | .20 |
| Net realized and unrealized gain (loss) | (.46)C |
| Total from investment operations | (.26) |
| Distributions from net investment income | (.26) |
| Distributions from net realized gain | (.49) |
| Total distributions | (.75) |
| Net asset value, end of period | $11.35 |
| Total ReturnD,E | (1.33)% |
| Ratios to Average Net AssetsF,G | |
| Expenses before reductions | .64%H |
| Expenses net of fee waivers, if any | .64%H |
| Expenses net of all reductions | .64%H |
| Net investment income (loss) | 3.71%H |
| Supplemental Data | |
| Net assets, end of period (000 omitted) | $1,376 |
| Portfolio turnover rateF | 22% |
A For the period October 2, 2018 (commencement of sale of shares) to March 31, 2019.
B Calculated based on average shares outstanding during the period.
C The amount shown for a share outstanding does not correspond with the aggregate net gain (loss) on investments for the period due to the timing of sales and repurchases of shares in relation to fluctuating market values of the investments of the Fund.
D Total returns for periods of less than one year are not annualized.
E Total returns would have been lower if certain expenses had not been reduced during the applicable periods shown.
F Amounts do not include the activity of the Underlying Funds.
G Expense ratios reflect operating expenses of the class. Expenses before reductions do not reflect amounts reimbursed by the investment adviser or reductions from expense offset arrangements and do not represent the amount paid by the class during periods when reimbursements or reductions occur. Expense ratios before reductions for start-up periods may not be representative of longer-term operating periods. Expenses net of fee waivers reflect expenses after reimbursement by the investment adviser but prior to reductions from expense offset arrangements. Expenses net of all reductions represent the net expenses paid by the class but do not include expenses of the underlying funds in which the Fund invests.
H Annualized
See accompanying notes which are an integral part of the financial statements.
Fidelity Advisor Freedom 2045 Fund Class Z6
| Years ended March 31, | 2019 | 2018 A |
| Selected Per–Share Data | | |
| Net asset value, beginning of period | $12.28 | $11.65 |
| Income from Investment Operations | | |
| Net investment income (loss)B | .22 | .15 |
| Net realized and unrealized gain (loss) | .12 | .92 |
| Total from investment operations | .34 | 1.07 |
| Distributions from net investment income | (.24) | (.18) |
| Distributions from net realized gain | (.99) | (.26) |
| Total distributions | (1.23) | (.44) |
| Net asset value, end of period | $11.39 | $12.28 |
| Total ReturnC,D | 3.58% | 9.15% |
| Ratios to Average Net AssetsE,F | | |
| Expenses before reductions | .50%G | .51%G,H |
| Expenses net of fee waivers, if any | .50%G | .51%G,H |
| Expenses net of all reductions | .50%G | .51%G,H |
| Net investment income (loss) | 1.88% | 1.50%H |
| Supplemental Data | | |
| Net assets, end of period (000 omitted) | $31,493 | $9,112 |
| Portfolio turnover rateE | 22% | 21% |
A For the period June 6, 2017 (commencement of sale of shares) to March 31, 2018.
B Calculated based on average shares outstanding during the period.
C Total returns for periods of less than one year are not annualized.
D Total returns would have been lower if certain expenses had not been reduced during the applicable periods shown.
E Amounts do not include the activity of the Underlying Funds.
F Expense ratios reflect operating expenses of the class. Expenses before reductions do not reflect amounts reimbursed by the investment adviser or reductions from expense offset arrangements and do not represent the amount paid by the class during periods when reimbursements or reductions occur. Expenses net of fee waivers reflect expenses after reimbursement by the investment adviser but prior to reductions from expense offset arrangements. Expenses net of all reductions represent the net expenses paid by the class but do not include expenses of the underlying funds in which the Fund invests.
G On certain classes, the size and fluctuation of net assets and expense amounts may cause ratios to differ from contractual rates.
H Annualized
See accompanying notes which are an integral part of the financial statements.
Fidelity Advisor Freedom® 2050 Fund
Investment Summary (Unaudited)
The information in the following tables is based on the direct investments of the Fund.
Top Holdings as of March 31, 2019
| | % of fund's net assets |
| Fidelity Series Large Cap Stock Fund | 12.0 |
| Fidelity Series International Growth Fund | 9.3 |
| Fidelity Series Emerging Markets Opportunities Fund | 9.1 |
| Fidelity Series International Value Fund | 8.7 |
| Fidelity Series Stock Selector Large Cap Value Fund | 7.8 |
| Fidelity Series Value Discovery Fund | 7.6 |
| Fidelity Advisor Series Equity Growth Fund | 7.2 |
| Fidelity Series Opportunistic Insights Fund | 6.7 |
| Fidelity Advisor Series Growth Opportunities Fund | 5.3 |
| Fidelity Series Small Cap Opportunities Fund | 4.1 |
| | 77.8 |
Asset Allocation (% of fund's net assets)
| Period end |
| | Domestic Equity Funds | 61.0% |
| | International Equity Funds | 31.2% |
| | Bond Funds | 6.8% |
| | Short-Term Funds | 1.1% |
| | Net Other Assets (Liabilities)* | (0.1)% |

* Net Other Assets (Liabilities) are not included in the pie chart
Domestic Equity Funds category includes Fidelity Series Commodity Strategy Fund which invests in commodity-related investments.
Fidelity Advisor Freedom® 2050 Fund
Schedule of Investments March 31, 2019
Showing Percentage of Net Assets
| U.S. Treasury Obligations - 0.0% | | | |
| | | Principal Amount | Value |
| U.S. Treasury Bills, yield at date of purchase 2.39% 4/4/19 (a) | | | |
| (Cost $419,917) | | 420,000 | 419,917 |
| | | Shares | Value |
|
| Domestic Equity Funds - 61.0% | | | |
| Fidelity Advisor Series Equity Growth Fund (b) | | 5,821,320 | $81,090,981 |
| Fidelity Advisor Series Growth Opportunities Fund (b) | | 4,108,506 | 59,408,997 |
| Fidelity Advisor Series Small Cap Fund (b) | | 3,466,172 | 36,325,479 |
| Fidelity Series All-Sector Equity Fund (b) | | 3,901,948 | 37,575,763 |
| Fidelity Series Commodity Strategy Fund (b) | | 5,868,691 | 27,993,656 |
| Fidelity Series Large Cap Stock Fund (b) | | 9,186,989 | 134,589,392 |
| Fidelity Series Large Cap Value Index Fund (b) | | 1,186,025 | 14,718,574 |
| Fidelity Series Opportunistic Insights Fund (b) | | 4,307,941 | 75,302,800 |
| Fidelity Series Small Cap Opportunities Fund (b) | | 3,456,199 | 46,520,436 |
| Fidelity Series Stock Selector Large Cap Value Fund (b) | | 7,457,374 | 87,997,014 |
| Fidelity Series Value Discovery Fund (b) | | 6,881,713 | 85,952,601 |
| TOTAL DOMESTIC EQUITY FUNDS | | | |
| (Cost $615,395,641) | | | 687,475,693 |
|
| International Equity Funds - 31.2% | | | |
| Fidelity Series Canada Fund (b) | | 1,027,556 | 10,594,107 |
| Fidelity Series Emerging Markets Fund (b) | | 1,121,517 | 10,979,648 |
| Fidelity Series Emerging Markets Opportunities Fund (b) | | 5,527,352 | 102,421,835 |
| Fidelity Series International Growth Fund (b) | | 6,904,527 | 104,879,771 |
| Fidelity Series International Small Cap Fund (b) | | 1,554,099 | 24,135,150 |
| Fidelity Series International Value Fund (b) | | 10,556,185 | 98,172,520 |
| TOTAL INTERNATIONAL EQUITY FUNDS | | | |
| (Cost $310,568,924) | | | 351,183,031 |
|
| Bond Funds - 6.8% | | | |
| Fidelity Series Emerging Markets Debt Fund (b) | | 747,012 | 7,163,841 |
| Fidelity Series Floating Rate High Income Fund (b) | | 150,399 | 1,394,196 |
| Fidelity Series High Income Fund (b) | | 1,266,983 | 11,909,642 |
| Fidelity Series Inflation-Protected Bond Index Fund (b) | | 334,341 | 3,269,858 |
| Fidelity Series International Credit Fund (b) | | 53,331 | 527,447 |
| Fidelity Series Investment Grade Bond Fund (b) | | 647,902 | 7,243,540 |
| Fidelity Series Long-Term Treasury Bond Index Fund (b) | | 4,530,316 | 40,183,907 |
| Fidelity Series Real Estate Income Fund (b) | | 471,646 | 5,145,657 |
| TOTAL BOND FUNDS | | | |
| (Cost $75,872,977) | | | 76,838,088 |
|
| Short-Term Funds - 1.1% | | | |
| Fidelity Cash Central Fund, 2.48% (c) | | 2,108,782 | 2,109,204 |
| Fidelity Series Government Money Market Fund 2.50%(b)(d) | | 8,078,560 | 8,078,560 |
| Fidelity Series Short-Term Credit Fund (b) | | 221,419 | 2,207,545 |
| TOTAL SHORT-TERM FUNDS | | | |
| (Cost $12,388,494) | | | 12,395,309 |
| TOTAL INVESTMENT IN SECURITIES - 100.1% | | | |
| (Cost $1,014,645,953) | | | 1,128,312,038 |
| NET OTHER ASSETS (LIABILITIES) - (0.1)% | | | (906,143) |
| NET ASSETS - 100% | | | $1,127,405,895 |
| Futures Contracts | | | | | |
| | Number of contracts | Expiration Date | Notional Amount | Value | Unrealized Appreciation/(Depreciation) |
| Purchased | | | | | |
| Treasury Contracts | | | | | |
| CBOT 2-Year U.S. Treasury Note Contracts (United States) | 1 | June 2019 | $213,094 | $928 | $928 |
| CBOT 5-Year U.S. Treasury Note Contracts (United States) | 3 | June 2019 | 347,484 | 3,955 | 3,955 |
| CBOT 10-Year U.S. Treasury Note Contracts (United States) | 2 | June 2019 | 248,438 | 4,621 | 4,621 |
| CBOT Long Term U.S. Treasury Bond Contracts (United States) | 2 | June 2019 | 299,313 | 10,496 | 10,496 |
| CBOT Ultra Long Term U.S. Treasury Bond Contracts (United States) | 3 | June 2019 | 504,000 | 25,083 | 25,083 |
|
| TOTAL PURCHASED | | | | | 45,083 |
|
| Sold | | | | | |
| Equity Index Contracts | | | | | |
| CME E-mini S&P 500 Index Contracts (United States) | 6 | June 2019 | 851,340 | (25,768) | (25,768) |
| ICE E-mini MSCI Emerging Markets Index Contracts (United States) | 50 | June 2019 | 2,643,500 | (49,292) | (49,292) |
|
| TOTAL SOLD | | | | | (75,060) |
|
| TOTAL FUTURES CONTRACTS | | | | | $(29,977) |
The notional amount of futures purchased as a percentage of Net Assets is 0.1%
The notional amount of futures sold as a percentage of Net Assets is 0.3%
Legend
(a) Security or a portion of the security was pledged to cover margin requirements for futures contracts. At period end, the value of securities pledged amounted to $401,921.
(b) Affiliated Fund
(c) Affiliated fund that is generally available only to investment companies and other accounts managed by Fidelity Investments. The rate quoted is the annualized seven-day yield of the fund at period end. A complete unaudited listing of the fund's holdings as of its most recent quarter end is available upon request. In addition, each Fidelity Central Fund's financial statements, which are not covered by the Fund's Report of Independent Registered Public Accounting Firm, are available on the SEC's website or upon request.
(d) The rate quoted is the annualized seven-day yield of the fund at period end.
Affiliated Central Funds
Information regarding fiscal year to date income earned by the Fund from investments in Fidelity Central Funds is as follows:
| Fund | Income earned |
| Fidelity Cash Central Fund | $26,490 |
| Total | $26,490 |
Amounts in the income column in the above table include any capital gain distributions from underlying funds, which are presented in the corresponding line-item in the Statement of Operations, if applicable.
Affiliated Underlying Funds
Fiscal year to date information regarding the Fund's investments in affiliated Underlying Funds, excluding any Money Market Central Funds, is presented below. Exchanges between classes of the same affiliated Underlying Funds may occur.
| Affiliate | Value, beginning of period | Purchases | Sales Proceeds | Dividend Income | Realized Gain (loss) | Change in Unrealized appreciation (depreciation) | Value, end of period |
| Fidelity Advisor Series Equity Growth Fund | $70,351,965 | $16,664,727 | $9,231,111 | $5,905,787 | $(33,890) | $3,339,290 | $81,090,981 |
| Fidelity Advisor Series Equity Value Fund | 81,184,995 | 9,855,105 | 3,708,773 | 2,879,441 | (35,683) | (8,589,666) | -- |
| Fidelity Advisor Series Growth & Income Fund | 124,458,830 | 20,534,456 | 5,760,025 | 11,601,731 | 44,166 | (16,838,229) | -- |
| Fidelity Advisor Series Growth Opportunities Fund | 46,159,904 | 15,426,937 | 9,879,296 | 9,263,006 | 995,041 | 6,706,411 | 59,408,997 |
| Fidelity Advisor Series Opportunistic Insights Fund | 65,364,078 | 9,792,962 | 3,042,074 | 5,525,925 | 27,726 | (21,284,157) | -- |
| Fidelity Advisor Series Small Cap Fund | 35,146,093 | 9,446,061 | 4,597,373 | 3,338,742 | (216,324) | (3,452,978) | 36,325,479 |
| Fidelity Advisor Series Stock Selector Large Cap Value Fund | 81,966,944 | 13,879,105 | 3,743,821 | 7,276,804 | (37,495) | (8,311,521) | -- |
| Fidelity Series 100 Index Fund | 34,748,219 | -- | 37,407,729 | -- | 16,279,802 | (13,620,292) | -- |
| Fidelity Series All-Sector Equity Fund | 48,267,467 | 14,076,384 | 19,491,704 | 9,109,054 | 936,073 | (6,212,457) | 37,575,763 |
| Fidelity Series Canada Fund | 9,565,126 | 2,280,403 | 1,396,450 | 231,543 | (23,962) | 168,990 | 10,594,107 |
| Fidelity Series Commodity Strategy Fund | 22,713,854 | 13,137,648 | 4,745,198 | 1,633,029 | (1,425,213) | (1,687,435) | 27,993,656 |
| Fidelity Series Emerging Markets Debt Fund | 7,129,561 | 1,208,790 | 825,422 | 426,563 | (25,282) | (323,806) | 7,163,841 |
| Fidelity Series Emerging Markets Fund | -- | 11,322,900 | 698,593 | 42,587 | (11,730) | 367,071 | 10,979,648 |
| Fidelity Series Emerging Markets Opportunities Fund | 99,246,751 | 37,076,605 | 18,674,333 | 7,843,871 | (643,364) | (14,583,824) | 102,421,835 |
| Fidelity Series Floating Rate High Income Fund | 2,426,049 | 394,105 | 1,379,636 | 129,060 | (108,587) | 62,265 | 1,394,196 |
| Fidelity Series Government Money Market Fund 2.50% | 17,563,064 | 17,644,392 | 27,128,896 | 280,176 | -- | -- | 8,078,560 |
| Fidelity Series High Income Fund | 14,946,932 | 2,620,924 | 5,465,584 | 953,708 | (127,879) | (64,751) | 11,909,642 |
| Fidelity Series Inflation-Protected Bond Index Fund | 8,708,325 | 1,589,936 | 7,090,768 | 67,841 | (81,366) | 143,731 | 3,269,858 |
| Fidelity Series International Credit Fund | 503,256 | 25,507 | -- | 25,508 | -- | (1,316) | 527,447 |
| Fidelity Series International Growth Fund | 96,317,039 | 27,962,646 | 13,842,172 | 6,460,201 | (462,021) | (5,095,721) | 104,879,771 |
| Fidelity Series International Small Cap Fund | 24,031,703 | 7,241,695 | 3,059,091 | 2,166,132 | (137,782) | (3,941,375) | 24,135,150 |
| Fidelity Series International Value Fund | 97,470,380 | 25,336,425 | 12,284,672 | 3,547,022 | (458,793) | (11,890,820) | 98,172,520 |
| Fidelity Series Investment Grade Bond Fund | 5,182,457 | 3,346,111 | 1,420,950 | 188,655 | (18,793) | 154,715 | 7,243,540 |
| Fidelity Series Large Cap Stock Fund | -- | 14,313,067 | 10,576,202 | 5,409,204 | (574,938) | 8,988,267 | 134,589,392 |
| Fidelity Series Large Cap Value Index Fund | 13,577,147 | 2,803,966 | 1,801,977 | 678,551 | (3,169) | 142,607 | 14,718,574 |
| Fidelity Series Long-Term Treasury Bond Index Fund | 24,382,002 | 29,992,161 | 15,715,506 | 1,085,257 | (477,061) | 2,002,311 | 40,183,907 |
| Fidelity Series Opportunistic Insights Fund | -- | 13,445,441 | 5,572,138 | 6,073,574 | (410,853) | 16,981,815 | 75,302,800 |
| Fidelity Series Real Estate Equity Fund | 8,433,757 | 71,693 | 8,845,994 | 45,364 | 399,314 | (58,770) | -- |
| Fidelity Series Real Estate Income Fund | 4,723,812 | 973,881 | 644,903 | 361,889 | (15,470) | 108,337 | 5,145,657 |
| Fidelity Series Short-Term Credit Fund | 3,186,925 | 740,028 | 1,749,340 | 80,596 | (7,080) | 37,012 | 2,207,545 |
| Fidelity Series Small Cap Opportunities Fund | 42,907,982 | 11,932,648 | 5,726,306 | 5,243,575 | (137,442) | (2,456,446) | 46,520,436 |
| Fidelity Series Stock Selector Large Cap Value Fund | -- | 13,689,029 | 6,881,373 | 7,408,171 | (493,155) | (2,070,699) | 87,997,014 |
| Fidelity Series Value Discovery Fund | -- | 10,905,434 | 6,800,921 | 5,180,344 | (343,171) | 3,485,281 | 85,952,601 |
| | $1,090,664,617 | $359,731,172 | $259,188,331 | $110,462,911 | $12,371,619 | $(77,796,160) | $1,125,782,917 |
Amounts in the income column in the above table include any capital gain distributions from underlying funds, which are presented in the corresponding line-item in the Statement of Operations, if applicable.
Investment Valuation
The following is a summary of the inputs used, as of March 31, 2019, involving the Fund's assets and liabilities carried at fair value. The inputs or methodology used for valuing securities may not be an indication of the risk associated with investing in those securities. For more information on valuation inputs, and their aggregation into the levels used below, please refer to the Investment Valuation section in the accompanying Notes to Financial Statements.
| | Valuation Inputs at Reporting Date: |
| Description | Total | Level 1 | Level 2 | Level 3 |
| Investments in Securities: | | | | |
| Other Short-Term Investments | $419,917 | $-- | $419,917 | $-- |
| Domestic Equity Funds | 687,475,693 | 687,475,693 | -- | -- |
| International Equity Funds | 351,183,031 | 351,183,031 | -- | -- |
| Bond Funds | 76,838,088 | 76,838,088 | -- | -- |
| Short-Term Funds | 12,395,309 | 12,395,309 | -- | -- |
| Total Investments in Securities: | $1,128,312,038 | $1,127,892,121 | $419,917 | $-- |
| Derivative Instruments: | | | | |
| Assets | | | | |
| Futures Contracts | $45,083 | $45,083 | $-- | $-- |
| Total Assets | $45,083 | $45,083 | $-- | $-- |
| Liabilities | | | | |
| Futures Contracts | $(75,060) | $(75,060) | $-- | $-- |
| Total Liabilities | $(75,060) | $(75,060) | $-- | $-- |
| Total Derivative Instruments: | $(29,977) | $(29,977) | $-- | $-- |
Value of Derivative Instruments
The following table is a summary of the Fund's value of derivative instruments by primary risk exposure as of March 31, 2019. For additional information on derivative instruments, please refer to the Derivative Instruments section in the accompanying Notes to Financial Statements.
| Primary Risk Exposure / Derivative Type | Value |
| | Asset | Liability |
| Equity Risk | | |
| Futures Contracts(a) | $0 | $(75,060) |
| Total Equity Risk | 0 | (75,060) |
| Interest Rate Risk | | |
| Futures Contracts(a) | 45,083 | 0 |
| Total Interest Rate Risk | 45,083 | 0 |
| Total Value of Derivatives | $45,083 | $(75,060) |
(a) Reflects gross cumulative appreciation (depreciation) on futures contracts as presented in the Schedule of Investments. In the Statement of Assets and Liabilities, the period end daily variation margin is included in receivable or payable for daily variation margin on futures contracts, and the net cumulative appreciation (depreciation) is included in distributable earnings.
See accompanying notes which are an integral part of the financial statements.
Fidelity Advisor Freedom® 2050 Fund
Financial Statements
Statement of Assets and Liabilities
| | | March 31, 2019 |
| Assets | | |
Investment in securities, at value — See accompanying schedule:
Unaffiliated issuers (cost $419,917) | $419,917 | |
| Fidelity Central Funds (cost $2,109,204) | 2,109,204 | |
| Other affiliated issuers (cost $1,012,116,832) | 1,125,782,917 | |
| Total Investment in Securities (cost $1,014,645,953) | | $1,128,312,038 |
| Receivable for investments sold | | 2,573,347 |
| Receivable for fund shares sold | | 1,708,630 |
| Distributions receivable from Fidelity Central Funds | | 4,223 |
| Total assets | | 1,132,598,238 |
| Liabilities | | |
| Payable for investments purchased | $1,661,359 | |
| Payable for fund shares redeemed | 2,620,226 | |
| Accrued management fee | 687,417 | |
| Distribution and service plan fees payable | 180,534 | |
| Payable for daily variation margin on futures contracts | 42,807 | |
| Total liabilities | | 5,192,343 |
| Net Assets | | $1,127,405,895 |
| Net Assets consist of: | | |
| Paid in capital | | $967,372,479 |
| Total distributable earnings (loss) | | 160,033,416 |
| Net Assets | | $1,127,405,895 |
| Net Asset Value and Maximum Offering Price | | |
| Class A: | | |
| Net Asset Value and redemption price per share ($417,583,337 ÷ 36,915,237 shares) | | $11.31 |
| Maximum offering price per share (100/94.25 of $11.31) | | $12.00 |
| Class M: | | |
| Net Asset Value and redemption price per share ($172,973,799 ÷ 15,392,428 shares) | | $11.24 |
| Maximum offering price per share (100/96.50 of $11.24) | | $11.65 |
| Class C: | | |
| Net Asset Value and offering price per share ($26,138,573 ÷ 2,355,741 shares)(a) | | $11.10 |
| Class I: | | |
| Net Asset Value, offering price and redemption price per share ($488,166,845 ÷ 42,856,082 shares) | | $11.39 |
| Class Z: | | |
| Net Asset Value, offering price and redemption price per share ($650,415 ÷ 57,352 shares) | | $11.34 |
| Class Z6: | | |
| Net Asset Value, offering price and redemption price per share ($21,892,926 ÷ 1,924,770 shares) | | $11.37 |
(a) Redemption price per share is equal to net asset value less any applicable contingent deferred sales charge.
See accompanying notes which are an integral part of the financial statements.
Statement of Operations
| | | Year ended March 31, 2019 |
| Investment Income | | |
| Dividends: | | |
| Affiliated issuers | | $26,218,050 |
| Interest | | 11,825 |
| Income from Fidelity Central Funds | | 26,490 |
| Total income | | 26,256,365 |
| Expenses | | |
| Management fee | $8,180,351 | |
| Distribution and service plan fees | 2,176,541 | |
| Independent trustees' fees and expenses | 5,195 | |
| Total expenses before reductions | 10,362,087 | |
| Expense reductions | (100) | |
| Total expenses after reductions | | 10,361,987 |
| Net investment income (loss) | | 15,894,378 |
| Realized and Unrealized Gain (Loss) | | |
| Net realized gain (loss) on: | | |
| Investment securities: | | |
| Unaffiliated issuers | 2,202 | |
| Affiliated issuers | 12,371,619 | |
| Futures contracts | (437,086) | |
| Capital gain distributions from underlying funds: | | |
| Affiliated issuers | 84,244,861 | |
| Total net realized gain (loss) | | 96,181,596 |
| Change in net unrealized appreciation (depreciation) on: | | |
| Investment securities: | | |
| Affiliated issuers | (77,796,160) | |
| Futures contracts | (29,977) | |
| Total change in net unrealized appreciation (depreciation) | | (77,826,137) |
| Net gain (loss) | | 18,355,459 |
| Net increase (decrease) in net assets resulting from operations | | $34,249,837 |
See accompanying notes which are an integral part of the financial statements.
Statement of Changes in Net Assets
| | Year ended March 31, 2019 | Year ended March 31, 2018 |
| Increase (Decrease) in Net Assets | | |
| Operations | | |
| Net investment income (loss) | $15,894,378 | $8,457,626 |
| Net realized gain (loss) | 96,181,596 | 66,828,415 |
| Change in net unrealized appreciation (depreciation) | (77,826,137) | 49,404,768 |
| Net increase (decrease) in net assets resulting from operations | 34,249,837 | 124,690,809 |
| Distributions to shareholders | (105,626,516) | – |
| Distributions to shareholders from net investment income | – | (10,251,675) |
| Distributions to shareholders from net realized gain | – | (34,153,397) |
| Total distributions | (105,626,516) | (44,405,072) |
| Share transactions - net increase (decrease) | 108,985,768 | 79,870,312 |
| Total increase (decrease) in net assets | 37,609,089 | 160,156,049 |
| Net Assets | | |
| Beginning of period | 1,089,796,806 | 929,640,757 |
| End of period | $1,127,405,895 | $1,089,796,806 |
| Other Information | | |
| Distributions in excess of net investment income end of period | | $(898,477) |
See accompanying notes which are an integral part of the financial statements.
Financial Highlights
Fidelity Advisor Freedom 2050 Fund Class A
| Years ended March 31, | 2019 | 2018 | 2017 | 2016 | 2015 |
| Selected Per–Share Data | | | | | |
| Net asset value, beginning of period | $12.17 | $11.20 | $10.16 | $11.06 | $11.24 |
| Income from Investment Operations | | | | | |
| Net investment income (loss)A | .16 | .09 | .13 | .13 | .15 |
| Net realized and unrealized gain (loss) | .13 | 1.40 | 1.39 | (.53) | .58 |
| Total from investment operations | .29 | 1.49 | 1.52 | (.40) | .73 |
| Distributions from net investment income | (.18) | (.12) | (.13) | (.14) | (.16) |
| Distributions from net realized gain | (.97) | (.40) | (.34) | (.36) | (.76) |
| Total distributions | (1.15) | (.52) | (.48)B | (.50) | (.91)C |
| Net asset value, end of period | $11.31 | $12.17 | $11.20 | $10.16 | $11.06 |
| Total ReturnD,E | 3.08% | 13.42% | 15.52% | (3.84)% | 6.77% |
| Ratios to Average Net AssetsF,G | | | | | |
| Expenses before reductions | .99%H | .88% | .25% | .25% | .25% |
| Expenses net of fee waivers, if any | .99%H | .88% | .25% | .25% | .25% |
| Expenses net of all reductions | .99%H | .88% | .25% | .25% | .25% |
| Net investment income (loss) | 1.38% | .79% | 1.22% | 1.28% | 1.37% |
| Supplemental Data | | | | | |
| Net assets, end of period (000 omitted) | $417,583 | $418,313 | $396,373 | $363,199 | $415,103 |
| Portfolio turnover rateF | 23% | 20% | 25% | 24% | 30% |
A Calculated based on average shares outstanding during the period.
B Total distributions of $.48 per share is comprised of distributions from net investment income of $.131 and distributions from net realized gain of $.344 per share.
C Total distributions of $.91 per share is comprised of distributions from net investment income of $.155 and distributions from net realized gain of $.755 per share.
D Total returns would have been lower if certain expenses had not been reduced during the applicable periods shown.
E Total returns do not include the effect of the sales charges.
F Amounts do not include the activity of the Underlying Funds.
G Expense ratios reflect operating expenses of the class. Expenses before reductions do not reflect amounts reimbursed by the investment adviser or reductions from expense offset arrangements and do not represent the amount paid by the class during periods when reimbursements or reductions occur. Expenses net of fee waivers reflect expenses after reimbursement by the investment adviser but prior to reductions from expense offset arrangements. Expenses net of all reductions represent the net expenses paid by the class but do not include expenses of the underlying funds in which the Fund invests.
H On certain classes, the size and fluctuation of net assets and expense amounts may cause ratios to differ from contractual rates.
See accompanying notes which are an integral part of the financial statements.
Fidelity Advisor Freedom 2050 Fund Class M
| Years ended March 31, | 2019 | 2018 | 2017 | 2016 | 2015 |
| Selected Per–Share Data | | | | | |
| Net asset value, beginning of period | $12.11 | $11.15 | $10.12 | $11.02 | $11.20 |
| Income from Investment Operations | | | | | |
| Net investment income (loss)A | .13 | .06 | .10 | .11 | .12 |
| Net realized and unrealized gain (loss) | .13 | 1.39 | 1.38 | (.54) | .58 |
| Total from investment operations | .26 | 1.45 | 1.48 | (.43) | .70 |
| Distributions from net investment income | (.16) | (.10) | (.11) | (.12) | (.13) |
| Distributions from net realized gain | (.97) | (.40) | (.34) | (.36) | (.76) |
| Total distributions | (1.13) | (.49)B | (.45) | (.47)C | (.88)D |
| Net asset value, end of period | $11.24 | $12.11 | $11.15 | $10.12 | $11.02 |
| Total ReturnE,F | 2.83% | 13.16% | 15.22% | (4.08)% | 6.54% |
| Ratios to Average Net AssetsG,H | | | | | |
| Expenses before reductions | 1.25% | 1.13% | .50% | .50% | .50% |
| Expenses net of fee waivers, if any | 1.25% | 1.13% | .50% | .50% | .50% |
| Expenses net of all reductions | 1.25% | 1.13% | .50% | .50% | .50% |
| Net investment income (loss) | 1.13% | .54% | .97% | 1.04% | 1.12% |
| Supplemental Data | | | | | |
| Net assets, end of period (000 omitted) | $172,974 | $166,634 | $147,601 | $127,842 | $126,987 |
| Portfolio turnover rateG | 23% | 20% | 25% | 24% | 30% |
A Calculated based on average shares outstanding during the period.
B Total distributions of $.49 per share is comprised of distributions from net investment income of $.096 and distributions from net realized gain of $.398 per share.
C Total distributions of $.47 per share is comprised of distributions from net investment income of $.115 and distributions from net realized gain of $.355 per share.
D Total distributions of $.88 per share is comprised of distributions from net investment income of $.128 and distributions from net realized gain of $.755 per share.
E Total returns would have been lower if certain expenses had not been reduced during the applicable periods shown.
F Total returns do not include the effect of the sales charges.
G Amounts do not include the activity of the Underlying Funds.
H Expense ratios reflect operating expenses of the class. Expenses before reductions do not reflect amounts reimbursed by the investment adviser or reductions from expense offset arrangements and do not represent the amount paid by the class during periods when reimbursements or reductions occur. Expenses net of fee waivers reflect expenses after reimbursement by the investment adviser but prior to reductions from expense offset arrangements. Expenses net of all reductions represent the net expenses paid by the class but do not include expenses of the underlying funds in which the Fund invests.
See accompanying notes which are an integral part of the financial statements.
Fidelity Advisor Freedom 2050 Fund Class C
| Years ended March 31, | 2019 | 2018 | 2017 | 2016 | 2015 |
| Selected Per–Share Data | | | | | |
| Net asset value, beginning of period | $11.98 | $11.05 | $10.04 | $10.95 | $11.14 |
| Income from Investment Operations | | | | | |
| Net investment income (loss)A | .07 | –B | .05 | .06 | .07 |
| Net realized and unrealized gain (loss) | .14 | 1.38 | 1.37 | (.55) | .57 |
| Total from investment operations | .21 | 1.38 | 1.42 | (.49) | .64 |
| Distributions from net investment income | (.11) | (.06) | (.08) | (.08) | (.09) |
| Distributions from net realized gain | (.97) | (.39) | (.34) | (.34) | (.74) |
| Total distributions | (1.09)C | (.45) | (.41)D | (.42) | (.83) |
| Net asset value, end of period | $11.10 | $11.98 | $11.05 | $10.04 | $10.95 |
| Total ReturnE,F | 2.34% | 12.59% | 14.73% | (4.67)% | 6.01% |
| Ratios to Average Net AssetsG,H | | | | | |
| Expenses before reductions | 1.74%I | 1.63% | 1.00% | 1.00% | 1.00% |
| Expenses net of fee waivers, if any | 1.74%I | 1.63% | 1.00% | 1.00% | 1.00% |
| Expenses net of all reductions | 1.74%I | 1.63% | 1.00% | 1.00% | 1.00% |
| Net investment income (loss) | .63% | .04% | .47% | .54% | .63% |
| Supplemental Data | | | | | |
| Net assets, end of period (000 omitted) | $26,139 | $32,763 | $28,268 | $24,460 | $24,652 |
| Portfolio turnover rateG | 23% | 20% | 25% | 24% | 30% |
A Calculated based on average shares outstanding during the period.
B Amount represents less than $.005 per share.
C Total distributions of $1.09 per share is comprised of distributions from net investment income of $.113 and distributions from net realized gain of $.972 per share.
D Total distributions of $.41 per share is comprised of distributions from net investment income of $.075 and distributions from net realized gain of $.339 per share.
E Total returns would have been lower if certain expenses had not been reduced during the applicable periods shown.
F Total returns do not include the effect of the contingent deferred sales charge.
G Amounts do not include the activity of the Underlying Funds.
H Expense ratios reflect operating expenses of the class. Expenses before reductions do not reflect amounts reimbursed by the investment adviser or reductions from expense offset arrangements and do not represent the amount paid by the class during periods when reimbursements or reductions occur. Expenses net of fee waivers reflect expenses after reimbursement by the investment adviser but prior to reductions from expense offset arrangements. Expenses net of all reductions represent the net expenses paid by the class but do not include expenses of the underlying funds in which the Fund invests.
I On certain classes, the size and fluctuation of net assets and expense amounts may cause ratios to differ from contractual rates.
See accompanying notes which are an integral part of the financial statements.
Fidelity Advisor Freedom 2050 Fund Class I
| Years ended March 31, | 2019 | 2018 | 2017 | 2016 | 2015 |
| Selected Per–Share Data | | | | | |
| Net asset value, beginning of period | $12.25 | $11.27 | $10.22 | $11.13 | $11.30 |
| Income from Investment Operations | | | | | |
| Net investment income (loss)A | .19 | .12 | .16 | .16 | .18 |
| Net realized and unrealized gain (loss) | .12 | 1.41 | 1.39 | (.55) | .59 |
| Total from investment operations | .31 | 1.53 | 1.55 | (.39) | .77 |
| Distributions from net investment income | (.20) | (.14) | (.15) | (.16) | (.18) |
| Distributions from net realized gain | (.97) | (.41) | (.35) | (.36) | (.76) |
| Total distributions | (1.17) | (.55) | (.50) | (.52) | (.94) |
| Net asset value, end of period | $11.39 | $12.25 | $11.27 | $10.22 | $11.13 |
| Total ReturnB | 3.30% | 13.74% | 15.81% | (3.65)% | 7.10% |
| Ratios to Average Net AssetsC,D | | | | | |
| Expenses before reductions | .75% | .64% | - %E | - %E | - %E |
| Expenses net of fee waivers, if any | .75% | .64% | -% | -% | -% |
| Expenses net of all reductions | .75% | .64% | -% | -% | -% |
| Net investment income (loss) | 1.63% | 1.03% | 1.47% | 1.53% | 1.62% |
| Supplemental Data | | | | | |
| Net assets, end of period (000 omitted) | $488,167 | $466,677 | $357,398 | $320,449 | $303,017 |
| Portfolio turnover rateC | 23% | 20% | 25% | 24% | 30% |
A Calculated based on average shares outstanding during the period.
B Total returns would have been lower if certain expenses had not been reduced during the applicable periods shown.
C Amounts do not include the activity of the Underlying Funds.
D Expense ratios reflect operating expenses of the class. Expenses before reductions do not reflect amounts reimbursed by the investment adviser or reductions from expense offset arrangements and do not represent the amount paid by the class during periods when reimbursements or reductions occur. Expenses net of fee waivers reflect expenses after reimbursement by the investment adviser but prior to reductions from expense offset arrangements. Expenses net of all reductions represent the net expenses paid by the class but do not include expenses of the underlying funds in which the Fund invests.
E Amount represents less than .005%.
See accompanying notes which are an integral part of the financial statements.
Fidelity Advisor Freedom 2050 Fund Class Z
| Year ended March 31, | 2019 A |
| Selected Per–Share Data | |
| Net asset value, beginning of period | $12.34 |
| Income from Investment Operations | |
| Net investment income (loss)B | .28 |
| Net realized and unrealized gain (loss) | (.54)C |
| Total from investment operations | (.26) |
| Distributions from net investment income | (.25) |
| Distributions from net realized gain | (.49) |
| Total distributions | (.74) |
| Net asset value, end of period | $11.34 |
| Total ReturnD,E | (1.34)% |
| Ratios to Average Net AssetsF,G | |
| Expenses before reductions | .65%H,I |
| Expenses net of fee waivers, if any | .65%H,I |
| Expenses net of all reductions | .65%H,I |
| Net investment income (loss) | 5.18%H |
| Supplemental Data | |
| Net assets, end of period (000 omitted) | $650 |
| Portfolio turnover rateF | 23% |
A For the period October 2, 2018 (commencement of sale of shares) to March 31, 2019.
B Calculated based on average shares outstanding during the period.
C The amount shown for a share outstanding does not correspond with the aggregate net gain (loss) on investments for the period due to the timing of sales and repurchases of shares in relation to fluctuating market values of the investments of the Fund.
D Total returns for periods of less than one year are not annualized.
E Total returns would have been lower if certain expenses had not been reduced during the applicable periods shown.
F Amounts do not include the activity of the Underlying Funds.
G Expense ratios reflect operating expenses of the class. Expenses before reductions do not reflect amounts reimbursed by the investment adviser or reductions from expense offset arrangements and do not represent the amount paid by the class during periods when reimbursements or reductions occur. Expense ratios before reductions for start-up periods may not be representative of longer-term operating periods. Expenses net of fee waivers reflect expenses after reimbursement by the investment adviser but prior to reductions from expense offset arrangements. Expenses net of all reductions represent the net expenses paid by the class but do not include expenses of the underlying funds in which the Fund invests.
H Annualized
I On certain classes, the size and fluctuation of net assets and expense amounts may cause ratios to differ from contractual rates.
See accompanying notes which are an integral part of the financial statements.
Fidelity Advisor Freedom 2050 Fund Class Z6
| Years ended March 31, | 2019 | 2018 A |
| Selected Per–Share Data | | |
| Net asset value, beginning of period | $12.24 | $11.59 |
| Income from Investment Operations | | |
| Net investment income (loss)B | .22 | .23 |
| Net realized and unrealized gain (loss) | .12 | .83 |
| Total from investment operations | .34 | 1.06 |
| Distributions from net investment income | (.24) | (.17) |
| Distributions from net realized gain | (.97) | (.24) |
| Total distributions | (1.21) | (.41) |
| Net asset value, end of period | $11.37 | $12.24 |
| Total ReturnC,D | 3.55% | 9.15% |
| Ratios to Average Net AssetsE,F | | |
| Expenses before reductions | .50%G | .51%G,H |
| Expenses net of fee waivers, if any | .50%G | .51%G,H |
| Expenses net of all reductions | .50%G | .51%G,H |
| Net investment income (loss) | 1.88% | 2.27%H |
| Supplemental Data | | |
| Net assets, end of period (000 omitted) | $21,893 | $5,410 |
| Portfolio turnover rateE | 23% | 20% |
A For the period June 6, 2017 (commencement of sale of shares) to March 31, 2018.
B Calculated based on average shares outstanding during the period.
C Total returns for periods of less than one year are not annualized.
D Total returns would have been lower if certain expenses had not been reduced during the applicable periods shown.
E Amounts do not include the activity of the Underlying Funds.
F Expense ratios reflect operating expenses of the class. Expenses before reductions do not reflect amounts reimbursed by the investment adviser or reductions from expense offset arrangements and do not represent the amount paid by the class during periods when reimbursements or reductions occur. Expenses net of fee waivers reflect expenses after reimbursement by the investment adviser but prior to reductions from expense offset arrangements. Expenses net of all reductions represent the net expenses paid by the class but do not include expenses of the underlying funds in which the Fund invests.
G On certain classes, the size and fluctuation of net assets and expense amounts may cause ratios to differ from contractual rates.
H Annualized
See accompanying notes which are an integral part of the financial statements.
Fidelity Advisor Freedom® 2055 Fund
Investment Summary (Unaudited)
The information in the following tables is based on the direct investments of the Fund.
Top Holdings as of March 31, 2019
| | % of fund's net assets |
| Fidelity Series Large Cap Stock Fund | 11.9 |
| Fidelity Series International Growth Fund | 9.3 |
| Fidelity Series Emerging Markets Opportunities Fund | 9.1 |
| Fidelity Series International Value Fund | 8.7 |
| Fidelity Series Stock Selector Large Cap Value Fund | 7.8 |
| Fidelity Series Value Discovery Fund | 7.6 |
| Fidelity Advisor Series Equity Growth Fund | 7.2 |
| Fidelity Series Opportunistic Insights Fund | 6.7 |
| Fidelity Advisor Series Growth Opportunities Fund | 5.3 |
| Fidelity Series Small Cap Opportunities Fund | 4.2 |
| | 77.8 |
Asset Allocation (% of fund's net assets)
| Period end |
| | Domestic Equity Funds | 61.0% |
| | International Equity Funds | 31.2% |
| | Bond Funds | 6.7% |
| | Short-Term Funds | 1.2% |
| | Net Other Assets (Liabilities)* | (0.1)% |

* Net Other Assets (Liabilities) are not included in the pie chart
Domestic Equity Funds category includes Fidelity Series Commodity Strategy Fund which invests in commodity-related investments.
Fidelity Advisor Freedom® 2055 Fund
Schedule of Investments March 31, 2019
Showing Percentage of Net Assets
| U.S. Treasury Obligations - 0.0% | | | |
| | | Principal Amount | Value |
| U.S. Treasury Bills, yield at date of purchase 2.4% to 2.4% 5/30/19 (a) | | | |
| (Cost $159,373) | | 160,000 | 159,383 |
| | | Shares | Value |
|
| Domestic Equity Funds - 61.0% | | | |
| Fidelity Advisor Series Equity Growth Fund (b) | | 3,252,185 | $45,302,936 |
| Fidelity Advisor Series Growth Opportunities Fund (b) | | 2,288,741 | 33,095,188 |
| Fidelity Advisor Series Small Cap Fund (b) | | 1,943,276 | 20,365,537 |
| Fidelity Series All-Sector Equity Fund (b) | | 2,176,974 | 20,964,257 |
| Fidelity Series Commodity Strategy Fund (b) | | 3,282,072 | 15,655,481 |
| Fidelity Series Large Cap Stock Fund (b) | | 5,124,405 | 75,072,540 |
| Fidelity Series Large Cap Value Index Fund (b) | | 661,878 | 8,213,907 |
| Fidelity Series Opportunistic Insights Fund (b) | | 2,406,870 | 42,072,080 |
| Fidelity Series Small Cap Opportunities Fund (b) | | 1,935,045 | 26,045,702 |
| Fidelity Series Stock Selector Large Cap Value Fund (b) | | 4,161,646 | 49,107,421 |
| Fidelity Series Value Discovery Fund (b) | | 3,838,980 | 47,948,861 |
| TOTAL DOMESTIC EQUITY FUNDS | | | |
| (Cost $371,190,113) | | | 383,843,910 |
|
| International Equity Funds - 31.2% | | | |
| Fidelity Series Canada Fund (b) | | 575,216 | 5,930,475 |
| Fidelity Series Emerging Markets Fund (b) | | 625,040 | 6,119,139 |
| Fidelity Series Emerging Markets Opportunities Fund (b) | | 3,081,982 | 57,109,129 |
| Fidelity Series International Growth Fund (b) | | 3,850,700 | 58,492,128 |
| Fidelity Series International Small Cap Fund (b) | | 868,314 | 13,484,922 |
| Fidelity Series International Value Fund (b) | | 5,893,673 | 54,811,158 |
| TOTAL INTERNATIONAL EQUITY FUNDS | | | |
| (Cost $187,452,714) | | | 195,946,951 |
|
| Bond Funds - 6.7% | | | |
| Fidelity Series Emerging Markets Debt Fund (b) | | 402,496 | 3,859,937 |
| Fidelity Series Floating Rate High Income Fund (b) | | 84,248 | 780,983 |
| Fidelity Series High Income Fund (b) | | 710,083 | 6,674,782 |
| Fidelity Series Inflation-Protected Bond Index Fund (b) | | 186,579 | 1,824,747 |
| Fidelity Series International Credit Fund (b) | | 24,358 | 240,898 |
| Fidelity Series Investment Grade Bond Fund (b) | | 331,746 | 3,708,923 |
| Fidelity Series Long-Term Treasury Bond Index Fund (b) | | 2,528,324 | 22,426,236 |
| Fidelity Series Real Estate Income Fund (b) | | 263,379 | 2,873,463 |
| TOTAL BOND FUNDS | | | |
| (Cost $41,718,757) | | | 42,389,969 |
|
| Short-Term Funds - 1.2% | | | |
| Fidelity Cash Central Fund, 2.48% (c) | | 1,401,536 | 1,401,817 |
| Fidelity Series Government Money Market Fund 2.50%(b)(d) | | 4,523,020 | 4,523,020 |
| Fidelity Series Short-Term Credit Fund (b) | | 125,072 | 1,246,968 |
| TOTAL SHORT-TERM FUNDS | | | |
| (Cost $7,165,904) | | | 7,171,805 |
| TOTAL INVESTMENT IN SECURITIES - 100.1% | | | |
| (Cost $607,686,861) | | | 629,512,018 |
| NET OTHER ASSETS (LIABILITIES) - (0.1)% | | | (473,026) |
| NET ASSETS - 100% | | | $629,038,992 |
| Futures Contracts | | | | | |
| | Number of contracts | Expiration Date | Notional Amount | Value | Unrealized Appreciation/(Depreciation) |
| Purchased | | | | | |
| Treasury Contracts | | | | | |
| CBOT 2-Year U.S. Treasury Note Contracts (United States) | 1 | June 2019 | $213,094 | $928 | $928 |
| CBOT 5-Year U.S. Treasury Note Contracts (United States) | 2 | June 2019 | 231,656 | 2,637 | 2,637 |
| CBOT 10-Year U.S. Treasury Note Contracts (United States) | 1 | June 2019 | 124,219 | 2,310 | 2,310 |
| CBOT Long Term U.S. Treasury Bond Contracts (United States) | 1 | June 2019 | 149,656 | 5,248 | 5,248 |
| CBOT Ultra Long Term U.S. Treasury Bond Contracts (United States) | 2 | June 2019 | 336,000 | 16,722 | 16,722 |
|
| TOTAL PURCHASED | | | | | 27,845 |
|
| Sold | | | | | |
| Equity Index Contracts | | | | | |
| CME E-mini S&P 500 Index Contracts (United States) | 5 | June 2019 | 709,450 | (21,474) | (21,474) |
| ICE E-mini MSCI Emerging Markets Index Contracts (United States) | 27 | June 2019 | 1,427,490 | (26,617) | (26,617) |
|
| TOTAL SOLD | | | | | (48,091) |
|
| TOTAL FUTURES CONTRACTS | | | | | $(20,246) |
The notional amount of futures purchased as a percentage of Net Assets is 0.2%
The notional amount of futures sold as a percentage of Net Assets is 0.3%
Legend
(a) Security or a portion of the security was pledged to cover margin requirements for futures contracts. At period end, the value of securities pledged amounted to $159,383.
(b) Affiliated Fund
(c) Affiliated fund that is generally available only to investment companies and other accounts managed by Fidelity Investments. The rate quoted is the annualized seven-day yield of the fund at period end. A complete unaudited listing of the fund's holdings as of its most recent quarter end is available upon request. In addition, each Fidelity Central Fund's financial statements, which are not covered by the Fund's Report of Independent Registered Public Accounting Firm, are available on the SEC's website or upon request.
(d) The rate quoted is the annualized seven-day yield of the fund at period end.
Affiliated Central Funds
Information regarding fiscal year to date income earned by the Fund from investments in Fidelity Central Funds is as follows:
| Fund | Income earned |
| Fidelity Cash Central Fund | $14,738 |
| Total | $14,738 |
Amounts in the income column in the above table include any capital gain distributions from underlying funds, which are presented in the corresponding line-item in the Statement of Operations, if applicable.
Affiliated Underlying Funds
Fiscal year to date information regarding the Fund's investments in affiliated Underlying Funds, excluding any Money Market Central Funds, is presented below. Exchanges between classes of the same affiliated Underlying Funds may occur.
| Affiliate | Value, beginning of period | Purchases | Sales Proceeds | Dividend Income | Realized Gain (loss) | Change in Unrealized appreciation (depreciation) | Value, end of period |
| Fidelity Advisor Series Equity Growth Fund | $35,257,766 | $14,739,403 | $6,373,554 | $3,214,689 | $(131,612) | $1,810,933 | $45,302,936 |
| Fidelity Advisor Series Equity Value Fund | 40,711,563 | 8,794,623 | 2,954,979 | 1,532,713 | (29,410) | (1,526,372) | -- |
| Fidelity Advisor Series Growth & Income Fund | 62,431,831 | 16,416,685 | 4,551,923 | 6,157,447 | (18,915) | (5,700,139) | -- |
| Fidelity Advisor Series Growth Opportunities Fund | 23,131,051 | 12,124,615 | 6,165,465 | 5,038,742 | 168,126 | 3,836,861 | 33,095,188 |
| Fidelity Advisor Series Opportunistic Insights Fund | 32,751,801 | 8,132,560 | 2,378,126 | 2,940,841 | 3,433 | (6,223,305) | -- |
| Fidelity Advisor Series Small Cap Fund | 17,635,097 | 7,871,488 | 3,128,055 | 1,820,589 | (148,111) | (1,864,882) | 20,365,537 |
| Fidelity Advisor Series Stock Selector Large Cap Value Fund | 41,106,481 | 10,891,588 | 2,948,552 | 3,870,324 | (26,490) | (856,706) | -- |
| Fidelity Series 100 Index Fund | 17,322,149 | -- | 18,596,135 | -- | 5,457,697 | (4,183,711) | -- |
| Fidelity Series All-Sector Equity Fund | 24,199,576 | 10,981,001 | 11,239,407 | 4,979,265 | (176,878) | (2,800,035) | 20,964,257 |
| Fidelity Series Canada Fund | 4,795,728 | 1,990,757 | 925,476 | 126,234 | (16,294) | 85,760 | 5,930,475 |
| Fidelity Series Commodity Strategy Fund | 11,380,188 | 8,924,539 | 2,974,299 | 872,930 | (479,183) | (1,195,764) | 15,655,481 |
| Fidelity Series Emerging Markets Debt Fund | 3,454,885 | 1,137,795 | 562,473 | 220,129 | (16,033) | (154,237) | 3,859,937 |
| Fidelity Series Emerging Markets Fund | -- | 6,389,085 | 470,483 | 23,227 | (9,155) | 209,692 | 6,119,139 |
| Fidelity Series Emerging Markets Opportunities Fund | 49,716,265 | 27,082,445 | 11,817,788 | 4,282,144 | (539,495) | (7,332,298) | 57,109,129 |
| Fidelity Series Floating Rate High Income Fund | 1,232,572 | 393,333 | 819,637 | 69,662 | (44,033) | 18,748 | 780,983 |
| Fidelity Series Government Money Market Fund 2.50% | 8,792,437 | 10,496,070 | 14,765,487 | 149,392 | -- | -- | 4,523,020 |
| Fidelity Series High Income Fund | 7,612,274 | 2,443,935 | 3,278,244 | 514,723 | (81,959) | (21,224) | 6,674,782 |
| Fidelity Series Inflation-Protected Bond Index Fund | 4,372,056 | 1,316,819 | 3,898,135 | 36,648 | (47,986) | 81,993 | 1,824,747 |
| Fidelity Series International Credit Fund | 229,849 | 11,650 | -- | 11,650 | -- | (601) | 240,898 |
| Fidelity Series International Growth Fund | 48,270,376 | 22,449,944 | 9,288,759 | 3,527,197 | (314,089) | (2,625,344) | 58,492,128 |
| Fidelity Series International Small Cap Fund | 12,042,724 | 5,702,621 | 2,079,679 | 1,184,725 | (125,817) | (2,054,927) | 13,484,922 |
| Fidelity Series International Value Fund | 48,858,175 | 21,008,497 | 8,423,453 | 1,937,070 | (443,605) | (6,188,456) | 54,811,158 |
| Fidelity Series Investment Grade Bond Fund | 2,594,775 | 1,900,265 | 852,706 | 97,273 | (11,827) | 78,416 | 3,708,923 |
| Fidelity Series Large Cap Stock Fund | -- | 12,107,143 | 6,736,424 | 2,944,534 | (377,578) | 1,501,860 | 75,072,540 |
| Fidelity Series Large Cap Value Index Fund | 6,806,286 | 2,571,752 | 1,228,513 | 371,060 | (16,415) | 80,797 | 8,213,907 |
| Fidelity Series Long-Term Treasury Bond Index Fund | 12,223,528 | 18,404,412 | 9,088,160 | 581,130 | (237,248) | 1,123,704 | 22,426,236 |
| Fidelity Series Opportunistic Insights Fund | -- | 9,750,352 | 3,567,817 | 3,322,086 | (314,747) | 3,917,929 | 42,072,080 |
| Fidelity Series Real Estate Equity Fund | 4,170,084 | 90,948 | 4,430,922 | 21,233 | (113,492) | 283,382 | -- |
| Fidelity Series Real Estate Income Fund | 2,352,341 | 910,869 | 440,149 | 193,400 | (4,621) | 55,023 | 2,873,463 |
| Fidelity Series Short-Term Credit Fund | 1,606,596 | 640,043 | 1,016,244 | 43,498 | (4,454) | 21,027 | 1,246,968 |
| Fidelity Series Small Cap Opportunities Fund | 21,522,309 | 9,854,459 | 3,883,890 | 2,820,902 | (149,284) | (1,297,892) | 26,045,702 |
| Fidelity Series Stock Selector Large Cap Value Fund | -- | 10,367,250 | 4,391,538 | 4,048,822 | (414,117) | (4,620,495) | 49,107,421 |
| Fidelity Series Value Discovery Fund | -- | 8,738,007 | 4,331,614 | 2,826,615 | (280,970) | (1,171,987) | 47,948,861 |
| | $546,580,763 | $274,634,953 | $157,608,086 | $59,780,894 | $1,055,438 | $(36,712,250) | $627,950,818 |
Amounts in the income column in the above table include any capital gain distributions from underlying funds, which are presented in the corresponding line-item in the Statement of Operations, if applicable.
Investment Valuation
The following is a summary of the inputs used, as of March 31, 2019, involving the Fund's assets and liabilities carried at fair value. The inputs or methodology used for valuing securities may not be an indication of the risk associated with investing in those securities. For more information on valuation inputs, and their aggregation into the levels used below, please refer to the Investment Valuation section in the accompanying Notes to Financial Statements.
| | Valuation Inputs at Reporting Date: |
| Description | Total | Level 1 | Level 2 | Level 3 |
| Investments in Securities: | | | | |
| Other Short-Term Investments | $159,383 | $-- | $159,383 | $-- |
| Domestic Equity Funds | 383,843,910 | 383,843,910 | -- | -- |
| International Equity Funds | 195,946,951 | 195,946,951 | -- | -- |
| Bond Funds | 42,389,969 | 42,389,969 | -- | -- |
| Short-Term Funds | 7,171,805 | 7,171,805 | -- | -- |
| Total Investments in Securities: | $629,512,018 | $629,352,635 | $159,383 | $-- |
| Derivative Instruments: | | | | |
| Assets | | | | |
| Futures Contracts | $27,845 | $27,845 | $-- | $-- |
| Total Assets | $27,845 | $27,845 | $-- | $-- |
| Liabilities | | | | |
| Futures Contracts | $(48,091) | $(48,091) | $-- | $-- |
| Total Liabilities | $(48,091) | $(48,091) | $-- | $-- |
| Total Derivative Instruments: | $(20,246) | $(20,246) | $-- | $-- |
Value of Derivative Instruments
The following table is a summary of the Fund's value of derivative instruments by primary risk exposure as of March 31, 2019. For additional information on derivative instruments, please refer to the Derivative Instruments section in the accompanying Notes to Financial Statements.
| Primary Risk Exposure / Derivative Type | Value |
| | Asset | Liability |
| Equity Risk | | |
| Futures Contracts(a) | $0 | $(48,091) |
| Total Equity Risk | 0 | (48,091) |
| Interest Rate Risk | | |
| Futures Contracts(a) | 27,845 | 0 |
| Total Interest Rate Risk | 27,845 | 0 |
| Total Value of Derivatives | $27,845 | $(48,091) |
(a) Reflects gross cumulative appreciation (depreciation) on futures contracts as presented in the Schedule of Investments. In the Statement of Assets and Liabilities, the period end daily variation margin is included in receivable or payable for daily variation margin on futures contracts, and the net cumulative appreciation (depreciation) is included in distributable earnings.
See accompanying notes which are an integral part of the financial statements.
Fidelity Advisor Freedom® 2055 Fund
Financial Statements
Statement of Assets and Liabilities
| | | March 31, 2019 |
| Assets | | |
Investment in securities, at value — See accompanying schedule:
Unaffiliated issuers (cost $159,373) | $159,383 | |
| Fidelity Central Funds (cost $1,401,817) | 1,401,817 | |
| Other affiliated issuers (cost $606,125,671) | 627,950,818 | |
| Total Investment in Securities (cost $607,686,861) | | $629,512,018 |
| Cash | | 15,964 |
| Receivable for investments sold | | 948,999 |
| Receivable for fund shares sold | | 1,162,911 |
| Distributions receivable from Fidelity Central Funds | | 2,843 |
| Total assets | | 631,642,735 |
| Liabilities | | |
| Payable for investments purchased | $1,539,382 | |
| Payable for fund shares redeemed | 572,461 | |
| Accrued management fee | 380,291 | |
| Distribution and service plan fees payable | 86,631 | |
| Payable for daily variation margin on futures contracts | 24,978 | |
| Total liabilities | | 2,603,743 |
| Net Assets | | $629,038,992 |
| Net Assets consist of: | | |
| Paid in capital | | $583,486,398 |
| Total distributable earnings (loss) | | 45,552,594 |
| Net Assets | | $629,038,992 |
| Net Asset Value and Maximum Offering Price | | |
| Class A: | | |
| Net Asset Value and redemption price per share ($212,427,867 ÷ 16,880,624 shares) | | $12.58 |
| Maximum offering price per share (100/94.25 of $12.58) | | $13.35 |
| Class M: | | |
| Net Asset Value and redemption price per share ($83,857,871 ÷ 6,705,094 shares) | | $12.51 |
| Maximum offering price per share (100/96.50 of $12.51) | | $12.96 |
| Class C: | | |
| Net Asset Value and offering price per share ($10,991,245 ÷ 883,832 shares)(a) | | $12.44 |
| Class I: | | |
| Net Asset Value, offering price and redemption price per share ($308,366,459 ÷ 24,402,824 shares) | | $12.64 |
| Class Z: | | |
| Net Asset Value, offering price and redemption price per share ($427,961 ÷ 34,018 shares) | | $12.58 |
| Class Z6: | | |
| Net Asset Value, offering price and redemption price per share ($12,967,589 ÷ 1,027,663 shares) | | $12.62 |
(a) Redemption price per share is equal to net asset value less any applicable contingent deferred sales charge.
See accompanying notes which are an integral part of the financial statements.
Statement of Operations
| | | Year ended March 31, 2019 |
| Investment Income | | |
| Dividends: | | |
| Affiliated issuers | | $14,159,702 |
| Interest | | 6,680 |
| Income from Fidelity Central Funds | | 14,738 |
| Total income | | 14,181,120 |
| Expenses | | |
| Management fee | $4,365,282 | |
| Distribution and service plan fees | 1,004,683 | |
| Independent trustees' fees and expenses | 2,735 | |
| Total expenses before reductions | 5,372,700 | |
| Expense reductions | (70) | |
| Total expenses after reductions | | 5,372,630 |
| Net investment income (loss) | | 8,808,490 |
| Realized and Unrealized Gain (Loss) | | |
| Net realized gain (loss) on: | | |
| Investment securities: | | |
| Unaffiliated issuers | 1,300 | |
| Fidelity Central Funds | 2 | |
| Other affiliated issuers | 1,055,438 | |
| Futures contracts | (205,021) | |
| Capital gain distributions from underlying funds: | | |
| Affiliated issuers | 45,621,192 | |
| Total net realized gain (loss) | | 46,472,911 |
| Change in net unrealized appreciation (depreciation) on: | | |
| Investment securities: | | |
| Unaffiliated issuers | 10 | |
| Affiliated issuers | (36,712,250) | |
| Futures contracts | (20,246) | |
| Total change in net unrealized appreciation (depreciation) | | (36,732,486) |
| Net gain (loss) | | 9,740,425 |
| Net increase (decrease) in net assets resulting from operations | | $18,548,915 |
See accompanying notes which are an integral part of the financial statements.
Statement of Changes in Net Assets
| | Year ended March 31, 2019 | Year ended March 31, 2018 |
| Increase (Decrease) in Net Assets | | |
| Operations | | |
| Net investment income (loss) | $8,808,490 | $4,172,517 |
| Net realized gain (loss) | 46,472,911 | 28,526,248 |
| Change in net unrealized appreciation (depreciation) | (36,732,486) | 24,677,049 |
| Net increase (decrease) in net assets resulting from operations | 18,548,915 | 57,375,814 |
| Distributions to shareholders | (49,941,562) | – |
| Distributions to shareholders from net investment income | – | (5,050,072) |
| Distributions to shareholders from net realized gain | – | (11,461,480) |
| Total distributions | (49,941,562) | (16,511,552) |
| Share transactions - net increase (decrease) | 114,273,357 | 102,640,679 |
| Total increase (decrease) in net assets | 82,880,710 | 143,504,941 |
| Net Assets | | |
| Beginning of period | 546,158,282 | 402,653,341 |
| End of period | $629,038,992 | $546,158,282 |
| Other Information | | |
| Distributions in excess of net investment income end of period | | $(451,800) |
See accompanying notes which are an integral part of the financial statements.
Financial Highlights
Fidelity Advisor Freedom 2055 Fund Class A
| Years ended March 31, | 2019 | 2018 | 2017 | 2016 | 2015 |
| Selected Per–Share Data | | | | | |
| Net asset value, beginning of period | $13.37 | $12.19 | $11.02 | $11.92 | $11.71 |
| Income from Investment Operations | | | | | |
| Net investment income (loss)A | .18 | .11 | .14 | .15 | .16 |
| Net realized and unrealized gain (loss) | .15 | 1.51 | 1.51 | (.59) | .62 |
| Total from investment operations | .33 | 1.62 | 1.65 | (.44) | .78 |
| Distributions from net investment income | (.19) | (.13) | (.14) | (.14) | (.15) |
| Distributions from net realized gain | (.93) | (.32) | (.34) | (.31) | (.42) |
| Total distributions | (1.12) | (.44)B | (.48) | (.46)C | (.57) |
| Net asset value, end of period | $12.58 | $13.37 | $12.19 | $11.02 | $11.92 |
| Total ReturnD,E | 3.08% | 13.40% | 15.49% | (3.89)% | 6.85% |
| Ratios to Average Net AssetsF,G | | | | | |
| Expenses before reductions | .99%H | .88% | .25% | .25% | .25% |
| Expenses net of fee waivers, if any | .99%H | .88% | .25% | .25% | .25% |
| Expenses net of all reductions | .99%H | .88% | .25% | .25% | .25% |
| Net investment income (loss) | 1.41% | .81% | 1.24% | 1.31% | 1.39% |
| Supplemental Data | | | | | |
| Net assets, end of period (000 omitted) | $212,428 | $209,824 | $170,352 | $130,309 | $115,666 |
| Portfolio turnover rateF | 27% | 18% | 24% | 24% | 29% |
A Calculated based on average shares outstanding during the period.
B Total distributions of $.44 per share is comprised of distributions from net investment income of $.125 and distributions from net realized gain of $.317 per share.
C Total distributions of $.46 per share is comprised of distributions from net investment income of $.141 and distributions from net realized gain of $.314 per share.
D Total returns would have been lower if certain expenses had not been reduced during the applicable periods shown.
E Total returns do not include the effect of the sales charges.
F Amounts do not include the activity of the Underlying Funds.
G Expense ratios reflect operating expenses of the class. Expenses before reductions do not reflect amounts reimbursed by the investment adviser or reductions from expense offset arrangements and do not represent the amount paid by the class during periods when reimbursements or reductions occur. Expenses net of fee waivers reflect expenses after reimbursement by the investment adviser but prior to reductions from expense offset arrangements. Expenses net of all reductions represent the net expenses paid by the class but do not include expenses of the underlying funds in which the Fund invests.
H On certain classes, the size and fluctuation of net assets and expense amounts may cause ratios to differ from contractual rates.
See accompanying notes which are an integral part of the financial statements.
Fidelity Advisor Freedom 2055 Fund Class M
| Years ended March 31, | 2019 | 2018 | 2017 | 2016 | 2015 |
| Selected Per–Share Data | | | | | |
| Net asset value, beginning of period | $13.31 | $12.14 | $10.98 | $11.88 | $11.68 |
| Income from Investment Operations | | | | | |
| Net investment income (loss)A | .15 | .07 | .11 | .12 | .13 |
| Net realized and unrealized gain (loss) | .15 | 1.52 | 1.51 | (.59) | .62 |
| Total from investment operations | .30 | 1.59 | 1.62 | (.47) | .75 |
| Distributions from net investment income | (.18) | (.11) | (.12) | (.12) | (.13) |
| Distributions from net realized gain | (.93) | (.31) | (.34) | (.31) | (.42) |
| Total distributions | (1.10)B | (.42) | (.46) | (.43) | (.55) |
| Net asset value, end of period | $12.51 | $13.31 | $12.14 | $10.98 | $11.88 |
| Total ReturnC,D | 2.86% | 13.15% | 15.27% | (4.11)% | 6.55% |
| Ratios to Average Net AssetsE,F | | | | | |
| Expenses before reductions | 1.25% | 1.14% | .50% | .50% | .50% |
| Expenses net of fee waivers, if any | 1.25% | 1.14% | .50% | .50% | .50% |
| Expenses net of all reductions | 1.25% | 1.14% | .50% | .50% | .50% |
| Net investment income (loss) | 1.16% | .56% | .99% | 1.06% | 1.14% |
| Supplemental Data | | | | | |
| Net assets, end of period (000 omitted) | $83,858 | $73,101 | $58,052 | $41,956 | $33,436 |
| Portfolio turnover rateE | 27% | 18% | 24% | 24% | 29% |
A Calculated based on average shares outstanding during the period.
B Total distributions of $1.10 per share is comprised of distributions from net investment income of $.175 and distributions from net realized gain of $.927 per share.
C Total returns would have been lower if certain expenses had not been reduced during the applicable periods shown.
D Total returns do not include the effect of the sales charges.
E Amounts do not include the activity of the Underlying Funds.
F Expense ratios reflect operating expenses of the class. Expenses before reductions do not reflect amounts reimbursed by the investment adviser or reductions from expense offset arrangements and do not represent the amount paid by the class during periods when reimbursements or reductions occur. Expenses net of fee waivers reflect expenses after reimbursement by the investment adviser but prior to reductions from expense offset arrangements. Expenses net of all reductions represent the net expenses paid by the class but do not include expenses of the underlying funds in which the Fund invests.
See accompanying notes which are an integral part of the financial statements.
Fidelity Advisor Freedom 2055 Fund Class C
| Years ended March 31, | 2019 | 2018 | 2017 | 2016 | 2015 |
| Selected Per–Share Data | | | | | |
| Net asset value, beginning of period | $13.26 | $12.11 | $10.98 | $11.88 | $11.69 |
| Income from Investment Operations | | | | | |
| Net investment income (loss)A | .08 | .01 | .06 | .06 | .08 |
| Net realized and unrealized gain (loss) | .16 | 1.51 | 1.49 | (.58) | .61 |
| Total from investment operations | .24 | 1.52 | 1.55 | (.52) | .69 |
| Distributions from net investment income | (.13) | (.06) | (.08) | (.08) | (.09) |
| Distributions from net realized gain | (.93) | (.31) | (.34) | (.30) | (.41) |
| Total distributions | (1.06) | (.37) | (.42) | (.38) | (.50) |
| Net asset value, end of period | $12.44 | $13.26 | $12.11 | $10.98 | $11.88 |
| Total ReturnB,C | 2.32% | 12.62% | 14.62% | (4.53)% | 6.01% |
| Ratios to Average Net AssetsD,E | | | | | |
| Expenses before reductions | 1.74%F | 1.64% | 1.00% | 1.00% | 1.00% |
| Expenses net of fee waivers, if any | 1.74%F | 1.64% | 1.00% | 1.00% | 1.00% |
| Expenses net of all reductions | 1.74%F | 1.64% | 1.00% | 1.00% | 1.00% |
| Net investment income (loss) | .66% | .05% | .49% | .56% | .65% |
| Supplemental Data | | | | | |
| Net assets, end of period (000 omitted) | $10,991 | $10,685 | $8,529 | $5,671 | $4,180 |
| Portfolio turnover rateD | 27% | 18% | 24% | 24% | 29% |
A Calculated based on average shares outstanding during the period.
B Total returns would have been lower if certain expenses had not been reduced during the applicable periods shown.
C Total returns do not include the effect of the contingent deferred sales charge.
D Amounts do not include the activity of the Underlying Funds.
E Expense ratios reflect operating expenses of the class. Expenses before reductions do not reflect amounts reimbursed by the investment adviser or reductions from expense offset arrangements and do not represent the amount paid by the class during periods when reimbursements or reductions occur. Expenses net of fee waivers reflect expenses after reimbursement by the investment adviser but prior to reductions from expense offset arrangements. Expenses net of all reductions represent the net expenses paid by the class but do not include expenses of the underlying funds in which the Fund invests.
F On certain classes, the size and fluctuation of net assets and expense amounts may cause ratios to differ from contractual rates.
See accompanying notes which are an integral part of the financial statements.
Fidelity Advisor Freedom 2055 Fund Class I
| Years ended March 31, | 2019 | 2018 | 2017 | 2016 | 2015 |
| Selected Per–Share Data | | | | | |
| Net asset value, beginning of period | $13.43 | $12.24 | $11.06 | $11.96 | $11.74 |
| Income from Investment Operations | | | | | |
| Net investment income (loss)A | .21 | .14 | .17 | .18 | .19 |
| Net realized and unrealized gain (loss) | .15 | 1.53 | 1.51 | (.60) | .63 |
| Total from investment operations | .36 | 1.67 | 1.68 | (.42) | .82 |
| Distributions from net investment income | (.22) | (.16) | (.16) | (.17) | (.18) |
| Distributions from net realized gain | (.93) | (.32) | (.34) | (.31) | (.42) |
| Total distributions | (1.15) | (.48) | (.50) | (.48) | (.60) |
| Net asset value, end of period | $12.64 | $13.43 | $12.24 | $11.06 | $11.96 |
| Total ReturnB | 3.34% | 13.74% | 15.81% | (3.64)% | 7.15% |
| Ratios to Average Net AssetsC,D | | | | | |
| Expenses before reductions | .75% | .64% | - %E | - %E | - %E |
| Expenses net of fee waivers, if any | .75% | .64% | -% | -% | -% |
| Expenses net of all reductions | .75% | .64% | -% | -% | -% |
| Net investment income (loss) | 1.66% | 1.05% | 1.49% | 1.56% | 1.64% |
| Supplemental Data | | | | | |
| Net assets, end of period (000 omitted) | $308,366 | $249,432 | $165,720 | $119,597 | $87,769 |
| Portfolio turnover rateC | 27% | 18% | 24% | 24% | 29% |
A Calculated based on average shares outstanding during the period.
B Total returns would have been lower if certain expenses had not been reduced during the applicable periods shown.
C Amounts do not include the activity of the Underlying Funds.
D Expense ratios reflect operating expenses of the class. Expenses before reductions do not reflect amounts reimbursed by the investment adviser or reductions from expense offset arrangements and do not represent the amount paid by the class during periods when reimbursements or reductions occur. Expenses net of fee waivers reflect expenses after reimbursement by the investment adviser but prior to reductions from expense offset arrangements. Expenses net of all reductions represent the net expenses paid by the class but do not include expenses of the underlying funds in which the Fund invests.
E Amount represents less than .005%.
See accompanying notes which are an integral part of the financial statements.
Fidelity Advisor Freedom 2055 Fund Class Z
| Year ended March 31, | 2019 A |
| Selected Per–Share Data | |
| Net asset value, beginning of period | $13.57 |
| Income from Investment Operations | |
| Net investment income (loss)B | .38 |
| Net realized and unrealized gain (loss) | (.65)C |
| Total from investment operations | (.27) |
| Distributions from net investment income | (.28) |
| Distributions from net realized gain | (.43) |
| Total distributions | (.72)D |
| Net asset value, end of period | $12.58 |
| Total ReturnE,F | (1.35)% |
| Ratios to Average Net AssetsG,H | |
| Expenses before reductions | .65%I,J |
| Expenses net of fee waivers, if any | .65%I,J |
| Expenses net of all reductions | .65%I,J |
| Net investment income (loss) | 6.29%I |
| Supplemental Data | |
| Net assets, end of period (000 omitted) | $428 |
| Portfolio turnover rateG | 27% |
A For the period October 2, 2018 (commencement of sale of shares) to March 31, 2019.
B Calculated based on average shares outstanding during the period.
C The amount shown for a share outstanding does not correspond with the aggregate net gain (loss) on investments for the period due to the timing of sales and repurchases of shares in relation to fluctuating market values of the investments of the Fund.
D Total distributions of $.72 per share is comprised of distributions from net investment income of $.281 and distributions from net realized gain of $.434 per share.
E Total returns for periods of less than one year are not annualized.
F Total returns would have been lower if certain expenses had not been reduced during the applicable periods shown.
G Amounts do not include the activity of the Underlying Funds.
H Expense ratios reflect operating expenses of the class. Expenses before reductions do not reflect amounts reimbursed by the investment adviser or reductions from expense offset arrangements and do not represent the amount paid by the class during periods when reimbursements or reductions occur. Expense ratios before reductions for start-up periods may not be representative of longer-term operating periods. Expenses net of fee waivers reflect expenses after reimbursement by the investment adviser but prior to reductions from expense offset arrangements. Expenses net of all reductions represent the net expenses paid by the class but do not include expenses of the underlying funds in which the Fund invests.
I Annualized
J On certain classes, the size and fluctuation of net assets and expense amounts may cause ratios to differ from contractual rates.
See accompanying notes which are an integral part of the financial statements.
Fidelity Advisor Freedom 2055 Fund Class Z6
| Years ended March 31, | 2019 | 2018 A |
| Selected Per–Share Data | | |
| Net asset value, beginning of period | $13.42 | $12.63 |
| Income from Investment Operations | | |
| Net investment income (loss)B | .24 | .47 |
| Net realized and unrealized gain (loss) | .15 | .69 |
| Total from investment operations | .39 | 1.16 |
| Distributions from net investment income | (.26) | (.19) |
| Distributions from net realized gain | (.93) | (.18) |
| Total distributions | (1.19) | (.37) |
| Net asset value, end of period | $12.62 | $13.42 |
| Total ReturnC,D | 3.59% | 9.16% |
| Ratios to Average Net AssetsE,F | | |
| Expenses before reductions | .50%G | .50%G,H |
| Expenses net of fee waivers, if any | .50%G | .50%G,H |
| Expenses net of all reductions | .50%G | .50%G,H |
| Net investment income (loss) | 1.91% | 4.26%H |
| Supplemental Data | | |
| Net assets, end of period (000 omitted) | $12,968 | $3,116 |
| Portfolio turnover rateE | 27% | 18% |
A For the period June 6, 2017 (commencement of sale of shares) to March 31, 2018.
B Calculated based on average shares outstanding during the period.
C Total returns for periods of less than one year are not annualized.
D Total returns would have been lower if certain expenses had not been reduced during the applicable periods shown.
E Amounts do not include the activity of the Underlying Funds.
F Expense ratios reflect operating expenses of the class. Expenses before reductions do not reflect amounts reimbursed by the investment adviser or reductions from expense offset arrangements and do not represent the amount paid by the class during periods when reimbursements or reductions occur. Expenses net of fee waivers reflect expenses after reimbursement by the investment adviser but prior to reductions from expense offset arrangements. Expenses net of all reductions represent the net expenses paid by the class but do not include expenses of the underlying funds in which the Fund invests.
G On certain classes, the size and fluctuation of net assets and expense amounts may cause ratios to differ from contractual rates.
H Annualized
See accompanying notes which are an integral part of the financial statements.
Fidelity Advisor Freedom® 2060 Fund
Investment Summary (Unaudited)
The information in the following tables is based on the direct investments of the Fund.
Top Holdings as of March 31, 2019
| | % of fund's net assets |
| Fidelity Series Large Cap Stock Fund | 12.0 |
| Fidelity Series International Growth Fund | 9.3 |
| Fidelity Series Emerging Markets Opportunities Fund | 9.1 |
| Fidelity Series International Value Fund | 8.7 |
| Fidelity Series Stock Selector Large Cap Value Fund | 7.8 |
| Fidelity Series Value Discovery Fund | 7.6 |
| Fidelity Advisor Series Equity Growth Fund | 7.2 |
| Fidelity Series Opportunistic Insights Fund | 6.7 |
| Fidelity Advisor Series Growth Opportunities Fund | 5.2 |
| Fidelity Series Small Cap Opportunities Fund | 4.2 |
| | 77.8 |
Asset Allocation (% of fund's net assets)
| Period end |
| | Domestic Equity Funds | 61.1% |
| | International Equity Funds | 31.2% |
| | Bond Funds | 6.7% |
| | Short-Term Funds | 1.1% |
| | Net Other Assets (Liabilities)* | (0.1)% |

* Net Other Assets (Liabilities) are not included in the pie chart
Domestic Equity Funds category includes Fidelity Series Commodity Strategy Fund which invests in commodity-related investments.
Fidelity Advisor Freedom® 2060 Fund
Schedule of Investments March 31, 2019
Showing Percentage of Net Assets
| U.S. Treasury Obligations - 0.0% | | | |
| | | Principal Amount | Value |
| U.S. Treasury Bills, yield at date of purchase 2.4% 5/30/19 (a) | | | |
| (Cost $39,844) | | 40,000 | 39,846 |
| | | Shares | Value |
|
| Domestic Equity Funds - 61.1% | | | |
| Fidelity Advisor Series Equity Growth Fund (b) | | 775,842 | $10,807,476 |
| Fidelity Advisor Series Growth Opportunities Fund (b) | | 541,315 | 7,827,409 |
| Fidelity Advisor Series Small Cap Fund (b) | | 466,912 | 4,893,239 |
| Fidelity Series All-Sector Equity Fund (b) | | 516,110 | 4,970,143 |
| Fidelity Series Commodity Strategy Fund (b) | | 781,557 | 3,728,027 |
| Fidelity Series Large Cap Stock Fund (b) | | 1,221,629 | 17,896,860 |
| Fidelity Series Large Cap Value Index Fund (b) | | 157,634 | 1,956,244 |
| Fidelity Series Opportunistic Insights Fund (b) | | 573,667 | 10,027,695 |
| Fidelity Series Small Cap Opportunities Fund (b) | | 463,754 | 6,242,123 |
| Fidelity Series Stock Selector Large Cap Value Fund (b) | | 991,047 | 11,694,360 |
| Fidelity Series Value Discovery Fund (b) | | 914,723 | 11,424,896 |
| TOTAL DOMESTIC EQUITY FUNDS | | | |
| (Cost $92,800,547) | | | 91,468,472 |
|
| International Equity Funds - 31.2% | | | |
| Fidelity Series Canada Fund (b) | | 137,206 | 1,414,595 |
| Fidelity Series Emerging Markets Fund (b) | | 148,566 | 1,454,460 |
| Fidelity Series Emerging Markets Opportunities Fund (b) | | 731,386 | 13,552,589 |
| Fidelity Series International Growth Fund (b) | | 916,489 | 13,921,466 |
| Fidelity Series International Small Cap Fund (b) | | 206,991 | 3,214,565 |
| Fidelity Series International Value Fund (b) | | 1,405,186 | 13,068,231 |
| TOTAL INTERNATIONAL EQUITY FUNDS | | | |
| (Cost $46,417,499) | | | 46,625,906 |
|
| Bond Funds - 6.7% | | | |
| Fidelity Series Emerging Markets Debt Fund (b) | | 92,816 | 890,104 |
| Fidelity Series Floating Rate High Income Fund (b) | | 20,320 | 188,363 |
| Fidelity Series High Income Fund (b) | | 168,781 | 1,586,541 |
| Fidelity Series Inflation-Protected Bond Index Fund (b) | | 44,380 | 434,037 |
| Fidelity Series International Credit Fund (b) | | 3,241 | 32,058 |
| Fidelity Series Investment Grade Bond Fund (b) | | 76,655 | 856,998 |
| Fidelity Series Long-Term Treasury Bond Index Fund (b) | | 602,599 | 5,345,055 |
| Fidelity Series Real Estate Income Fund (b) | | 64,308 | 701,595 |
| TOTAL BOND FUNDS | | | |
| (Cost $9,798,041) | | | 10,034,751 |
|
| Short-Term Funds - 1.1% | | | |
| Fidelity Cash Central Fund, 2.48% (c) | | 298,189 | 298,248 |
| Fidelity Series Government Money Market Fund 2.50%(b)(d) | | 1,076,148 | 1,076,148 |
| Fidelity Series Short-Term Credit Fund (b) | | 29,722 | 296,330 |
| TOTAL SHORT-TERM FUNDS | | | |
| (Cost $1,668,526) | | | 1,670,726 |
| TOTAL INVESTMENT IN SECURITIES - 100.1% | | | |
| (Cost $150,724,457) | | | 149,839,701 |
| NET OTHER ASSETS (LIABILITIES) - (0.1)% | | | (91,981) |
| NET ASSETS - 100% | | | $149,747,720 |
| Futures Contracts | | | | | |
| | Number of contracts | Expiration Date | Notional Amount | Value | Unrealized Appreciation/(Depreciation) |
| Sold | | | | | |
| Equity Index Contracts | | | | | |
| CME E-mini S&P 500 Index Contracts (United States) | 2 | June 2019 | $283,780 | $(8,589) | $(8,589) |
| ICE E-mini MSCI Emerging Markets Index Contracts (United States) | 6 | June 2019 | 317,220 | (5,914) | (5,914) |
| TOTAL FUTURES CONTRACTS | | | | | $(14,503) |
The notional amount of futures sold as a percentage of Net Assets is 0.4%
Legend
(a) Security or a portion of the security was pledged to cover margin requirements for futures contracts. At period end, the value of securities pledged amounted to $39,846.
(b) Affiliated Fund
(c) Affiliated fund that is generally available only to investment companies and other accounts managed by Fidelity Investments. The rate quoted is the annualized seven-day yield of the fund at period end. A complete unaudited listing of the fund's holdings as of its most recent quarter end is available upon request. In addition, each Fidelity Central Fund's financial statements, which are not covered by the Fund's Report of Independent Registered Public Accounting Firm, are available on the SEC's website or upon request.
(d) The rate quoted is the annualized seven-day yield of the fund at period end.
Affiliated Central Funds
Information regarding fiscal year to date income earned by the Fund from investments in Fidelity Central Funds is as follows:
| Fund | Income earned |
| Fidelity Cash Central Fund | $2,788 |
| Total | $2,788 |
Amounts in the income column in the above table include any capital gain distributions from underlying funds, which are presented in the corresponding line-item in the Statement of Operations, if applicable.
Affiliated Underlying Funds
Fiscal year to date information regarding the Fund's investments in affiliated Underlying Funds, excluding any Money Market Central Funds, is presented below. Exchanges between classes of the same affiliated Underlying Funds may occur.
| Affiliate | Value, beginning of period | Purchases | Sales Proceeds | Dividend Income | Realized Gain (loss) | Change in Unrealized appreciation (depreciation) | Value, end of period |
| Fidelity Advisor Series Equity Growth Fund | $6,288,635 | $5,658,877 | $1,466,370 | $707,967 | $(46,767) | $373,101 | $10,807,476 |
| Fidelity Advisor Series Equity Value Fund | 7,280,061 | 2,863,215 | 506,547 | 315,375 | (6,329) | 30,552 | -- |
| Fidelity Advisor Series Growth & Income Fund | 11,166,059 | 4,992,961 | 775,814 | 1,232,413 | (8,249) | (462,261) | -- |
| Fidelity Advisor Series Growth Opportunities Fund | 4,124,065 | 4,247,197 | 1,329,614 | 1,106,480 | (26,036) | 811,797 | 7,827,409 |
| Fidelity Advisor Series Opportunistic Insights Fund | 5,834,760 | 2,587,956 | 411,082 | 604,806 | (1,541) | (483,852) | -- |
| Fidelity Advisor Series Small Cap Fund | 3,146,914 | 2,888,999 | 712,594 | 401,871 | (36,207) | (393,873) | 4,893,239 |
| Fidelity Advisor Series Stock Selector Large Cap Value Fund | 7,352,294 | 3,217,852 | 506,995 | 790,396 | (7,650) | 80,511 | -- |
| Fidelity Series 100 Index Fund | 3,048,825 | -- | 3,273,764 | -- | 568,573 | (343,634) | -- |
| Fidelity Series All-Sector Equity Fund | 4,321,439 | 3,689,555 | 2,350,476 | 1,090,197 | (75,009) | (615,366) | 4,970,143 |
| Fidelity Series Canada Fund | 856,840 | 749,059 | 206,339 | 27,335 | (5,725) | 20,760 | 1,414,595 |
| Fidelity Series Commodity Strategy Fund | 2,033,402 | 2,659,334 | 619,463 | 179,489 | (25,671) | (319,575) | 3,728,027 |
| Fidelity Series Emerging Markets Debt Fund | 582,422 | 461,328 | 126,170 | 44,315 | (6,867) | (20,609) | 890,104 |
| Fidelity Series Emerging Markets Fund | -- | 1,534,127 | 131,766 | 5,077 | (3,908) | 56,007 | 1,454,460 |
| Fidelity Series Emerging Markets Opportunities Fund | 8,861,174 | 8,570,217 | 2,448,208 | 935,876 | (210,497) | (1,220,097) | 13,552,589 |
| Fidelity Series Floating Rate High Income Fund | 232,073 | 155,520 | 193,765 | 14,958 | (1,947) | (3,518) | 188,363 |
| Fidelity Series Government Money Market Fund 2.50% | 1,561,672 | 2,706,400 | 3,191,924 | 30,945 | -- | -- | 1,076,148 |
| Fidelity Series High Income Fund | 1,351,010 | 972,792 | 717,943 | 107,637 | (9,084) | (10,234) | 1,586,541 |
| Fidelity Series Inflation-Protected Bond Index Fund | 790,717 | 425,866 | 789,749 | 7,904 | (8,274) | 15,477 | 434,037 |
| Fidelity Series International Credit Fund | 30,588 | 1,550 | -- | 1,550 | -- | (80) | 32,058 |
| Fidelity Series International Growth Fund | 8,611,222 | 7,889,101 | 2,039,372 | 771,850 | (83,727) | (455,758) | 13,921,466 |
| Fidelity Series International Small Cap Fund | 2,147,956 | 1,977,288 | 470,863 | 259,374 | (38,395) | (401,421) | 3,214,565 |
| Fidelity Series International Value Fund | 8,722,314 | 7,606,918 | 1,907,767 | 423,637 | (169,045) | (1,184,189) | 13,068,231 |
| Fidelity Series Investment Grade Bond Fund | 462,499 | 621,724 | 242,838 | 20,289 | (2,951) | 18,564 | 856,998 |
| Fidelity Series Large Cap Stock Fund | -- | 5,246,673 | 1,775,640 | 640,197 | (108,096) | (378,773) | 17,896,860 |
| Fidelity Series Large Cap Value Index Fund | 1,220,452 | 1,000,958 | 277,059 | 81,874 | (6,117) | 18,010 | 1,956,244 |
| Fidelity Series Long-Term Treasury Bond Index Fund | 2,189,125 | 4,759,447 | 1,828,872 | 122,027 | (41,692) | 267,047 | 5,345,055 |
| Fidelity Series Opportunistic Insights Fund | -- | 3,547,330 | 951,546 | 730,243 | (67,958) | (26,372) | 10,027,695 |
| Fidelity Series Real Estate Equity Fund | 730,473 | 46,531 | 807,279 | 3,914 | (29,795) | 60,070 | -- |
| Fidelity Series Real Estate Income Fund | 427,825 | 360,480 | 98,779 | 41,359 | (1,430) | 13,499 | 701,595 |
| Fidelity Series Short-Term Credit Fund | 295,984 | 226,706 | 230,264 | 9,310 | (941) | 4,845 | 296,330 |
| Fidelity Series Small Cap Opportunities Fund | 3,829,440 | 3,604,231 | 888,556 | 587,435 | (39,806) | (263,186) | 6,242,123 |
| Fidelity Series Stock Selector Large Cap Value Fund | -- | 4,041,289 | 1,156,405 | 890,477 | (139,712) | (1,186,824) | 11,694,360 |
| Fidelity Series Value Discovery Fund | -- | 3,580,817 | 1,141,945 | 617,980 | (75,092) | (599,836) | 11,424,896 |
| | $97,500,240 | $92,892,298 | $33,575,768 | $12,804,557 | $(715,945) | $(6,599,218) | $149,501,607 |
Amounts in the income column in the above table include any capital gain distributions from underlying funds, which are presented in the corresponding line-item in the Statement of Operations, if applicable.
Investment Valuation
The following is a summary of the inputs used, as of March 31, 2019, involving the Fund's assets and liabilities carried at fair value. The inputs or methodology used for valuing securities may not be an indication of the risk associated with investing in those securities. For more information on valuation inputs, and their aggregation into the levels used below, please refer to the Investment Valuation section in the accompanying Notes to Financial Statements.
| | Valuation Inputs at Reporting Date: |
| Description | Total | Level 1 | Level 2 | Level 3 |
| Investments in Securities: | | | | |
| Other Short-Term Investments | $39,846 | $-- | $39,846 | $-- |
| Domestic Equity Funds | 91,468,472 | 91,468,472 | -- | -- |
| International Equity Funds | 46,625,906 | 46,625,906 | -- | -- |
| Bond Funds | 10,034,751 | 10,034,751 | -- | -- |
| Short-Term Funds | 1,670,726 | 1,670,726 | -- | -- |
| Total Investments in Securities: | $149,839,701 | $149,799,855 | $39,846 | $-- |
| Derivative Instruments: | | | | |
| Liabilities | | | | |
| Futures Contracts | $(14,503) | $(14,503) | $-- | $-- |
| Total Liabilities | $(14,503) | $(14,503) | $-- | $-- |
| Total Derivative Instruments: | $(14,503) | $(14,503) | $-- | $-- |
Value of Derivative Instruments
The following table is a summary of the Fund's value of derivative instruments by primary risk exposure as of March 31, 2019. For additional information on derivative instruments, please refer to the Derivative Instruments section in the accompanying Notes to Financial Statements.
| Primary Risk Exposure / Derivative Type | Value |
| | Asset | Liability |
| Equity Risk | | |
| Futures Contracts(a) | $0 | $(14,503) |
| Total Equity Risk | 0 | (14,503) |
| Total Value of Derivatives | $0 | $(14,503) |
(a) Reflects gross cumulative appreciation (depreciation) on futures contracts as presented in the Schedule of Investments. In the Statement of Assets and Liabilities, the period end daily variation margin is included in receivable or payable for daily variation margin on futures contracts, and the net cumulative appreciation (depreciation) is included in distributable earnings.
See accompanying notes which are an integral part of the financial statements.
Fidelity Advisor Freedom® 2060 Fund
Financial Statements
Statement of Assets and Liabilities
| | | March 31, 2019 |
| Assets | | |
Investment in securities, at value — See accompanying schedule:
Unaffiliated issuers (cost $39,844) | $39,846 | |
| Fidelity Central Funds (cost $298,248) | 298,248 | |
| Other affiliated issuers (cost $150,386,365) | 149,501,607 | |
| Total Investment in Securities (cost $150,724,457) | | $149,839,701 |
| Cash | | 24,492 |
| Receivable for investments sold | | 232,278 |
| Receivable for fund shares sold | | 678,645 |
| Distributions receivable from Fidelity Central Funds | | 623 |
| Total assets | | 150,775,739 |
| Liabilities | | |
| Payable for investments purchased | $743,645 | |
| Payable for fund shares redeemed | 167,243 | |
| Accrued management fee | 89,523 | |
| Distribution and service plan fees payable | 22,005 | |
| Payable for daily variation margin on futures contracts | 5,603 | |
| Total liabilities | | 1,028,019 |
| Net Assets | | $149,747,720 |
| Net Assets consist of: | | |
| Paid in capital | | $145,681,099 |
| Total distributable earnings (loss) | | 4,066,621 |
| Net Assets | | $149,747,720 |
| Net Asset Value and Maximum Offering Price | | |
| Class A: | | |
| Net Asset Value and redemption price per share ($55,732,192 ÷ 4,927,522 shares) | | $11.31 |
| Maximum offering price per share (100/94.25 of $11.31) | | $12.00 |
| Class M: | | |
| Net Asset Value and redemption price per share ($19,069,951 ÷ 1,688,459 shares) | | $11.29 |
| Maximum offering price per share (100/96.50 of $11.29) | | $11.70 |
| Class C: | | |
| Net Asset Value and offering price per share ($3,723,456 ÷ 329,767 shares)(a) | | $11.29 |
| Class I: | | |
| Net Asset Value, offering price and redemption price per share ($68,445,441 ÷ 6,026,165 shares) | | $11.36 |
| Class Z: | | |
| Net Asset Value, offering price and redemption price per share ($283,695 ÷ 25,059 shares) | | $11.32 |
| Class Z6: | | |
| Net Asset Value, offering price and redemption price per share ($2,492,985 ÷ 219,493 shares) | | $11.36 |
(a) Redemption price per share is equal to net asset value less any applicable contingent deferred sales charge.
See accompanying notes which are an integral part of the financial statements.
Statement of Operations
| | | Year ended March 31, 2019 |
| Investment Income | | |
| Dividends: | | |
| Affiliated issuers | | $3,023,221 |
| Interest | | 1,513 |
| Income from Fidelity Central Funds | | 2,788 |
| Total income | | 3,027,522 |
| Expenses | | |
| Management fee | $908,409 | |
| Distribution and service plan fees | 221,828 | |
| Independent trustees' fees and expenses | 548 | |
| Total expenses before reductions | 1,130,785 | |
| Expense reductions | (119)�� | |
| Total expenses after reductions | | 1,130,666 |
| Net investment income (loss) | | 1,896,856 |
| Realized and Unrealized Gain (Loss) | | |
| Net realized gain (loss) on: | | |
| Investment securities: | | |
| Unaffiliated issuers | 270 | |
| Affiliated issuers | (715,945) | |
| Futures contracts | (2,165) | |
| Capital gain distributions from underlying funds: | | |
| Affiliated issuers | 9,781,336 | |
| Total net realized gain (loss) | | 9,063,496 |
| Change in net unrealized appreciation (depreciation) on: | | |
| Investment securities: | | |
| Unaffiliated issuers | 2 | |
| Affiliated issuers | (6,599,218) | |
| Futures contracts | (14,503) | |
| Total change in net unrealized appreciation (depreciation) | | (6,613,719) |
| Net gain (loss) | | 2,449,777 |
| Net increase (decrease) in net assets resulting from operations | | $4,346,633 |
See accompanying notes which are an integral part of the financial statements.
Statement of Changes in Net Assets
| | Year ended March 31, 2019 | Year ended March 31, 2018 |
| Increase (Decrease) in Net Assets | | |
| Operations | | |
| Net investment income (loss) | $1,896,856 | $632,280 |
| Net realized gain (loss) | 9,063,496 | 4,117,080 |
| Change in net unrealized appreciation (depreciation) | (6,613,719) | 2,766,010 |
| Net increase (decrease) in net assets resulting from operations | 4,346,633 | 7,515,370 |
| Distributions to shareholders | (8,781,108) | – |
| Distributions to shareholders from net investment income | – | (781,225) |
| Distributions to shareholders from net realized gain | – | (1,302,479) |
| Total distributions | (8,781,108) | (2,083,704) |
| Share transactions - net increase (decrease) | 56,756,059 | 48,422,056 |
| Total increase (decrease) in net assets | 52,321,584 | 53,853,722 |
| Net Assets | | |
| Beginning of period | 97,426,136 | 43,572,414 |
| End of period | $149,747,720 | $97,426,136 |
| Other Information | | |
| Distributions in excess of net investment income end of period | | $(92,114) |
See accompanying notes which are an integral part of the financial statements.
Financial Highlights
Fidelity Advisor Freedom 2060 Fund Class A
| Years ended March 31, | 2019 | 2018 | 2017 | 2016 | 2015 A |
| Selected Per–Share Data | | | | | |
| Net asset value, beginning of period | $11.86 | $10.76 | $9.62 | $10.34 | $10.00 |
| Income from Investment Operations | | | | | |
| Net investment income (loss)B | .17 | .10 | .13 | .12 | .15 |
| Net realized and unrealized gain (loss) | .13 | 1.34 | 1.33 | (.51) | .37 |
| Total from investment operations | .30 | 1.44 | 1.46 | (.39) | .52 |
| Distributions from net investment income | (.17) | (.11) | (.12) | (.11) | (.10) |
| Distributions from net realized gain | (.68) | (.23) | (.20) | (.22) | (.08) |
| Total distributions | (.85) | (.34) | (.32) | (.33) | (.18) |
| Net asset value, end of period | $11.31 | $11.86 | $10.76 | $9.62 | $10.34 |
| Total ReturnC,D,E | 3.09% | 13.44% | 15.55% | (3.89)% | 5.24% |
| Ratios to Average Net AssetsF,G | | | | | |
| Expenses before reductions | 1.00% | .91% | .25% | .25% | .25%H |
| Expenses net of fee waivers, if any | 1.00% | .91% | .25% | .25% | .25%H |
| Expenses net of all reductions | 1.00% | .91% | .25% | .25% | .25%H |
| Net investment income (loss) | 1.48% | .84% | 1.30% | 1.29% | 2.24%H |
| Supplemental Data | | | | | |
| Net assets, end of period (000 omitted) | $55,732 | $37,880 | $18,482 | $9,058 | $2,267 |
| Portfolio turnover rateF | 27% | 16% | 32% | 64% | 47%H |
A For the period August 5, 2014 (commencement of operations) to March 31, 2015.
B Calculated based on average shares outstanding during the period.
C Total returns for periods of less than one year are not annualized.
D Total returns would have been lower if certain expenses had not been reduced during the applicable periods shown.
E Total returns do not include the effect of the sales charges.
F Amounts do not include the activity of the Underlying Funds.
G Expense ratios reflect operating expenses of the class. Expenses before reductions do not reflect amounts reimbursed by the investment adviser or reductions from expense offset arrangements and do not represent the amount paid by the class during periods when reimbursements or reductions occur. Expenses net of fee waivers reflect expenses after reimbursement by the investment adviser but prior to reductions from expense offset arrangements. Expenses net of all reductions represent the net expenses paid by the class but do not include expenses of the underlying funds in which the Fund invests.
H Annualized
See accompanying notes which are an integral part of the financial statements.
Fidelity Advisor Freedom 2060 Fund Class M
| Years ended March 31, | 2019 | 2018 | 2017 | 2016 | 2015 A |
| Selected Per–Share Data | | | | | |
| Net asset value, beginning of period | $11.85 | $10.77 | $9.63 | $10.33 | $10.00 |
| Income from Investment Operations | | | | | |
| Net investment income (loss)B | .14 | .07 | .11 | .10 | .13 |
| Net realized and unrealized gain (loss) | .14 | 1.33 | 1.33 | (.51) | .38 |
| Total from investment operations | .28 | 1.40 | 1.44 | (.41) | .51 |
| Distributions from net investment income | (.16) | (.10) | (.10) | (.08) | (.09) |
| Distributions from net realized gain | (.68) | (.22) | (.20) | (.21) | (.08) |
| Total distributions | (.84) | (.32) | (.30) | (.29) | (.18)C |
| Net asset value, end of period | $11.29 | $11.85 | $10.77 | $9.63 | $10.33 |
| Total ReturnD,E,F | 2.82% | 13.04% | 15.29% | (4.09)% | 5.07% |
| Ratios to Average Net AssetsG,H | | | | | |
| Expenses before reductions | 1.25% | 1.16% | .50% | .50% | .51%I,J |
| Expenses net of fee waivers, if any | 1.25% | 1.16% | .50% | .50% | .51%I,J |
| Expenses net of all reductions | 1.25% | 1.16% | .50% | .50% | .51%I,J |
| Net investment income (loss) | 1.23% | .59% | 1.05% | 1.04% | 1.98%I |
| Supplemental Data | | | | | |
| Net assets, end of period (000 omitted) | $19,070 | $12,628 | $5,719 | $3,189 | $2,062 |
| Portfolio turnover rateG | 27% | 16% | 32% | 64% | 47%I |
A For the period August 5, 2014 (commencement of operations) to March 31, 2015.
B Calculated based on average shares outstanding during the period.
C Total distributions of $.18 per share is comprised of distributions from net investment income of $.094 and distributions from net realized gain of $.081 per share.
D Total returns for periods of less than one year are not annualized.
E Total returns would have been lower if certain expenses had not been reduced during the applicable periods shown.
F Total returns do not include the effect of the sales charges.
G Amounts do not include the activity of the Underlying Funds.
H Expense ratios reflect operating expenses of the class. Expenses before reductions do not reflect amounts reimbursed by the investment adviser or reductions from expense offset arrangements and do not represent the amount paid by the class during periods when reimbursements or reductions occur. Expenses net of fee waivers reflect expenses after reimbursement by the investment adviser but prior to reductions from expense offset arrangements. Expenses net of all reductions represent the net expenses paid by the class but do not include expenses of the underlying funds in which the Fund invests.
I Annualized
J On certain classes, the size and fluctuation of net assets and expense amounts may cause ratios to differ from contractual rates.
See accompanying notes which are an integral part of the financial statements.
Fidelity Advisor Freedom 2060 Fund Class C
| Years ended March 31, | 2019 | 2018 | 2017 | 2016 | 2015 A |
| Selected Per–Share Data | | | | | |
| Net asset value, beginning of period | $11.87 | $10.81 | $9.68 | $10.31 | $10.00 |
| Income from Investment Operations | | | | | |
| Net investment income (loss)B | .08 | .01 | .06 | .05 | .10 |
| Net realized and unrealized gain (loss) | .14 | 1.34 | 1.33 | (.51) | .38 |
| Total from investment operations | .22 | 1.35 | 1.39 | (.46) | .48 |
| Distributions from net investment income | (.12) | (.07) | (.06) | – | (.08) |
| Distributions from net realized gain | (.68) | (.22) | (.20) | (.17) | (.08) |
| Total distributions | (.80) | (.29) | (.26) | (.17) | (.17)C |
| Net asset value, end of period | $11.29 | $11.87 | $10.81 | $9.68 | $10.31 |
| Total ReturnD,E,F | 2.33% | 12.53% | 14.65% | (4.60)% | 4.77% |
| Ratios to Average Net AssetsG,H | | | | | |
| Expenses before reductions | 1.75% | 1.66% | 1.00% | .99% | 1.02%I,J |
| Expenses net of fee waivers, if any | 1.75% | 1.66% | 1.00% | .99% | 1.02%I,J |
| Expenses net of all reductions | 1.75% | 1.66% | 1.00% | .99% | 1.02%I,J |
| Net investment income (loss) | .72% | .09% | .55% | .55% | 1.47%I |
| Supplemental Data | | | | | |
| Net assets, end of period (000 omitted) | $3,723 | $2,604 | $1,209 | $1,292 | $1,322 |
| Portfolio turnover rateG | 27% | 16% | 32% | 64% | 47%I |
A For the period August 5, 2014 (commencement of operations) to March 31, 2015.
B Calculated based on average shares outstanding during the period.
C Total distributions of $.17 per share is comprised of distributions from net investment income of $.084 and distributions from net realized gain of $.081 per share.
D Total returns for periods of less than one year are not annualized.
E Total returns would have been lower if certain expenses had not been reduced during the applicable periods shown.
F Total returns do not include the effect of the contingent deferred sales charge.
G Amounts do not include the activity of the Underlying Funds.
H Expense ratios reflect operating expenses of the class. Expenses before reductions do not reflect amounts reimbursed by the investment adviser or reductions from expense offset arrangements and do not represent the amount paid by the class during periods when reimbursements or reductions occur. Expenses net of fee waivers reflect expenses after reimbursement by the investment adviser but prior to reductions from expense offset arrangements. Expenses net of all reductions represent the net expenses paid by the class but do not include expenses of the underlying funds in which the Fund invests.
I Annualized
J On certain classes, the size and fluctuation of net assets and expense amounts may cause ratios to differ from contractual rates.
See accompanying notes which are an integral part of the financial statements.
Fidelity Advisor Freedom 2060 Fund Class I
| Years ended March 31, | 2019 | 2018 | 2017 | 2016 | 2015 A |
| Selected Per–Share Data | | | | | |
| Net asset value, beginning of period | $11.90 | $10.80 | $9.65 | $10.35 | $10.00 |
| Income from Investment Operations | | | | | |
| Net investment income (loss)B | .20 | .13 | .16 | .15 | .17 |
| Net realized and unrealized gain (loss) | .13 | 1.33 | 1.33 | (.50) | .37 |
| Total from investment operations | .33 | 1.46 | 1.49 | (.35) | .54 |
| Distributions from net investment income | (.20) | (.13) | (.13) | (.12) | (.10) |
| Distributions from net realized gain | (.68) | (.23) | (.20) | (.23) | (.08) |
| Total distributions | (.87)C | (.36) | (.34)D | (.35) | (.19)E |
| Net asset value, end of period | $11.36 | $11.90 | $10.80 | $9.65 | $10.35 |
| Total ReturnF,G | 3.38% | 13.63% | 15.82% | (3.54)% | 5.38% |
| Ratios to Average Net AssetsH,I | | | | | |
| Expenses before reductions | .75% | .66% | - %J | - %J | - %J,K |
| Expenses net of fee waivers, if any | .75% | .66% | -% | -% | - %K |
| Expenses net of all reductions | .75% | .66% | -% | -% | - %K |
| Net investment income (loss) | 1.73% | 1.09% | 1.55% | 1.54% | 2.49%K |
| Supplemental Data | | | | | |
| Net assets, end of period (000 omitted) | $68,445 | $43,513 | $18,162 | $5,845 | $399 |
| Portfolio turnover rateH | 27% | 16% | 32% | 64% | 47%K |
A For the period August 5, 2014 (commencement of operations) to March 31, 2015.
B Calculated based on average shares outstanding during the period.
C Total distributions of $.87 per share is comprised of distributions from net investment income of $.195 and distributions from net realized gain of $.679 per share.
D Total distributions of $.34 per share is comprised of distributions from net investment income of $.132 and distributions from net realized gain of $.204 per share.
E Total distributions of $.19 per share is comprised of distributions from net investment income of $.104 and distributions from net realized gain of $.081 per share.
F Total returns for periods of less than one year are not annualized.
G Total returns would have been lower if certain expenses had not been reduced during the applicable periods shown.
H Amounts do not include the activity of the Underlying Funds.
I Expense ratios reflect operating expenses of the class. Expenses before reductions do not reflect amounts reimbursed by the investment adviser or reductions from expense offset arrangements and do not represent the amount paid by the class during periods when reimbursements or reductions occur. Expenses net of fee waivers reflect expenses after reimbursement by the investment adviser but prior to reductions from expense offset arrangements. Expenses net of all reductions represent the net expenses paid by the class but do not include expenses of the underlying funds in which the Fund invests.
J Amount represents less than .005%.
K Annualized
See accompanying notes which are an integral part of the financial statements.
Fidelity Advisor Freedom 2060 Fund Class Z
| Year ended March 31, | 2019 A |
| Selected Per–Share Data | |
| Net asset value, beginning of period | $12.10 |
| Income from Investment Operations | |
| Net investment income (loss)B | .23 |
| Net realized and unrealized gain (loss) | (.46)C |
| Total from investment operations | (.23) |
| Distributions from net investment income | (.24) |
| Distributions from net realized gain | (.31) |
| Total distributions | (.55) |
| Net asset value, end of period | $11.32 |
| Total ReturnD,E | (1.34)% |
| Ratios to Average Net AssetsF,G | |
| Expenses before reductions | .64%H,I |
| Expenses net of fee waivers, if any | .64%H,I |
| Expenses net of all reductions | .64%H,I |
| Net investment income (loss) | 4.28%H |
| Supplemental Data | |
| Net assets, end of period (000 omitted) | $284 |
| Portfolio turnover rateF | 27% |
A For the period October 2, 2018 (commencement of sale of shares) to March 31, 2019.
B Calculated based on average shares outstanding during the period.
C The amount shown for a share outstanding does not correspond with the aggregate net gain (loss) on investments for the period due to the timing of sales and repurchases of shares in relation to fluctuating market values of the investments of the Fund.
D Total returns for periods of less than one year are not annualized.
E Total returns would have been lower if certain expenses had not been reduced during the applicable periods shown.
F Amounts do not include the activity of the Underlying Funds.
G Expense ratios reflect operating expenses of the class. Expenses before reductions do not reflect amounts reimbursed by the investment adviser or reductions from expense offset arrangements and do not represent the amount paid by the class during periods when reimbursements or reductions occur. Expense ratios before reductions for start-up periods may not be representative of longer-term operating periods. Expenses net of fee waivers reflect expenses after reimbursement by the investment adviser but prior to reductions from expense offset arrangements. Expenses net of all reductions represent the net expenses paid by the class but do not include expenses of the underlying funds in which the Fund invests.
H Annualized
I On certain classes, the size and fluctuation of net assets and expense amounts may cause ratios to differ from contractual rates.
See accompanying notes which are an integral part of the financial statements.
Fidelity Advisor Freedom 2060 Fund Class Z6
| Years ended March 31, | 2019 | 2018 A |
| Selected Per–Share Data | | |
| Net asset value, beginning of period | $11.90 | $11.16 |
| Income from Investment Operations | | |
| Net investment income (loss)B | .23 | .33 |
| Net realized and unrealized gain (loss) | .13 | .69 |
| Total from investment operations | .36 | 1.02 |
| Distributions from net investment income | (.22) | (.16) |
| Distributions from net realized gain | (.68) | (.13) |
| Total distributions | (.90) | (.28)C |
| Net asset value, end of period | $11.36 | $11.90 |
| Total ReturnD,E | 3.63% | 9.14% |
| Ratios to Average Net AssetsF,G | | |
| Expenses before reductions | .50%H | .50%H,I |
| Expenses net of fee waivers, if any | .50%H | .50%H,I |
| Expenses net of all reductions | .50%H | .50%H,I |
| Net investment income (loss) | 1.98% | 3.41%I |
| Supplemental Data | | |
| Net assets, end of period (000 omitted) | $2,493 | $802 |
| Portfolio turnover rateF | 27% | 16% |
A For the period June 6, 2017 (commencement of sale of shares) to March 31, 2018.
B Calculated based on average shares outstanding during the period.
C Total distributions of $.28 per share is comprised of distributions from net investment income of $.155 and distributions from net realized gain of $.127 per share.
D Total returns for periods of less than one year are not annualized.
E Total returns would have been lower if certain expenses had not been reduced during the applicable periods shown.
F Amounts do not include the activity of the Underlying Funds.
G Expense ratios reflect operating expenses of the class. Expenses before reductions do not reflect amounts reimbursed by the investment adviser or reductions from expense offset arrangements and do not represent the amount paid by the class during periods when reimbursements or reductions occur. Expenses net of fee waivers reflect expenses after reimbursement by the investment adviser but prior to reductions from expense offset arrangements. Expenses net of all reductions represent the net expenses paid by the class but do not include expenses of the underlying funds in which the Fund invests.
H On certain classes, the size and fluctuation of net assets and expense amounts may cause ratios to differ from contractual rates.
I Annualized
See accompanying notes which are an integral part of the financial statements.
Notes to Financial Statements
For the period ended March 31, 2019
1. Organization.
Fidelity Advisor Freedom Income Fund, Fidelity Advisor Freedom 2005 Fund, Fidelity Advisor Freedom 2010 Fund, Fidelity Advisor Freedom 2015 Fund, Fidelity Advisor Freedom 2020 Fund, Fidelity Advisor Freedom 2025 Fund, Fidelity Advisor Freedom 2030 Fund, Fidelity Advisor Freedom 2035 Fund, Fidelity Advisor Freedom 2040 Fund, Fidelity Advisor Freedom 2045 Fund, Fidelity Advisor Freedom 2050 Fund, Fidelity Advisor Freedom 2055 Fund and Fidelity Advisor Freedom 2060 Fund (the Funds) are funds of Fidelity Aberdeen Street Trust (the Trust). The Trust is registered under the Investment Company Act of 1940, as amended (the 1940 Act), as an open-end management investment company organized as a Delaware statutory trust. Each Fund is authorized to issue an unlimited number of shares. Each Fund offers Class A, Class M, Class C, Class I, Class Z and Class Z6 shares, each of which has equal rights as to assets and voting privileges. Each class has exclusive voting rights with respect to matters that affect that class. Each Fund commenced sale of Class Z shares on October 2, 2018. Effective March 1, 2019, Class C shares will automatically convert to Class A shares after a holding period of ten years from the initial date of purchase, with certain exceptions. The Funds invest primarily in a combination of other Fidelity equity, bond, and short-term funds (the Underlying Funds) managed by Fidelity Management & Research Company (FMR). Certain Underlying Funds incurred name changes since their most recent shareholder report. The names of the Underlying Funds are those in effect at period end. In the prior year, the Funds transitioned their portfolios to invest exclusively in classes of the Fidelity Series funds, offered only to certain other Fidelity funds advised by FMR or its affiliates. During the period, certain of the Underlying Funds merged as follows:
| Target Fund | Acquiring Fund | Merger Date |
| Fidelity Advisor Series Equity Value Fund | Fidelity Series Value Discovery Fund | September 21, 2018 |
| Fidelity Advisor Series Growth & Income Fund | Fidelity Series Large Cap Stock Fund | September 21, 2018 |
| Fidelity Advisor Series Opportunistic Insights Fund | Fidelity Series Opportunistic Insights Fund | September 21, 2018 |
| Fidelity Advisor Series Stock Selector Large Cap Value Fund | Fidelity Series Stock Selector Large Cap Value Fund | September 14, 2018 |
2. Investments in Fidelity Central Funds.
The Funds invest in Fidelity Central Funds, which are open-end investment companies generally available only to other investment companies and accounts managed by the investment adviser and its affiliates. The Funds' Schedules of Investments list each of the Fidelity Central Funds held as of period end, if any, as an investment of each Fund, but does not include the underlying holdings of each Fidelity Central Fund. As an Investing Fund, each Fund indirectly bears its proportionate share of the expenses of the underlying Fidelity Central Funds.
The Money Market Central Funds seek preservation of capital and current income and are managed by Fidelity Investments Money Management, Inc. (FIMM), an affiliate of the investment adviser. Annualized expenses of the Money Market Central Funds as of their most recent shareholder report date are less than .005%.
A complete unaudited list of holdings for each Fidelity Central Fund is available upon request or at the Securities and Exchange Commission (the SEC) website at www.sec.gov. In addition, the financial statements of the Fidelity Central Funds, which are not covered by the Funds' Report of Independent Registered Public Accounting Firm, are available on the SEC website or upon request.
3. Significant Accounting Policies.
Each Fund is an investment company and applies the accounting and reporting guidance of the Financial Accounting Standards Board (FASB) Accounting Standards Codification Topic 946 Financial Services – Investments Companies. The financial statements have been prepared in conformity with accounting principles generally accepted in the United States of America (GAAP), which require management to make certain estimates and assumptions at the date of the financial statements. Actual results could differ from those estimates. Subsequent events, if any, through the date that the financial statements were issued have been evaluated in the preparation of the financial statements. The following summarizes the significant accounting policies of the Funds:
Investment Valuation. Investments are valued as of 4:00 p.m. Eastern time on the last calendar day of the period. The Board of Trustees (the Board) has delegated the day to day responsibility for the valuation of each Fund's investments to the Fair Value Committee (the Committee) established by the each Fund's investment adviser. In accordance with valuation policies and procedures approved by the Board, each Fund attempts to obtain prices from one or more third party pricing vendors or brokers to value its investments. When current market prices, quotations or currency exchange rates are not readily available or reliable, investments will be fair valued in good faith by the Committee, in accordance with procedures adopted by the Board. Factors used in determining fair value vary by investment type and may include market or investment specific events, changes in interest rates and credit quality. The frequency with which these procedures are used cannot be predicted and they may be utilized to a significant extent. The Committee oversees each Fund's valuation policies and procedures and reports to the Board on the Committee's activities and fair value determinations. The Board monitors the appropriateness of the procedures used in valuing each Fund's investments and ratifies the fair value determinations of the Committee. Each Fund categorizes the inputs to valuation techniques used to value its investments into a disclosure hierarchy consisting of three levels as shown below:
- Level 1 – quoted prices in active markets for identical investments
- Level 2 – other significant observable inputs (including quoted prices for similar investments, interest rates, prepayment speeds, etc.)
- Level 3 – unobservable inputs (including the Fund's own assumptions based on the best information available)
Valuation techniques used to value each Fund's investments by major category are as follows. Investments in the Underlying Funds are valued at their closing net asset value (NAV) each business day and are categorized as Level 1 in the hierarchy. Debt securities, including restricted securities, are valued based on evaluated prices received from third party pricing vendors or from brokers who make markets in such securities. U.S. government and government agency obligations are valued by pricing vendors who utilize matrix pricing which considers yield or price of bonds of comparable quality, coupon, maturity and type or by broker-supplied prices. When independent prices are unavailable or unreliable, debt securities may be valued utilizing pricing methodologies which consider similar factors that would be used by third party pricing vendors. Debt securities are generally categorized as Level 2 in the hierarchy but may be Level 3 depending on the circumstances.
Futures contracts are valued at the settlement price established each day by the board of trade or exchange on which they are traded and are categorized as Level 1 in the hierarchy.
Investment Transactions and Income. For financial reporting purposes, the Funds' investment holdings and NAV include trades executed through the end of the last business day of the period. The NAV per share for processing shareholder transactions is calculated as of the close of business of the New York Stock Exchange (NYSE), normally 4:00 p.m. Eastern time and includes trades executed through the end of the prior business day. Gains and losses on securities sold are determined on the basis of identified cost and include proceeds received from litigation. Income and capital gain distributions from the Underlying Funds, if any, are recorded on the ex-dividend date. Interest income is accrued as earned. Interest income includes coupon interest and amortization of premium and accretion of discount on debt securities as applicable.
Class Allocations and Expenses. Investment income, realized and unrealized capital gains and losses, common expenses of each Fund, and certain fund-level expense reductions, if any, are allocated daily on a pro-rata basis to each class based on the relative net assets of each class to the total net assets of each Fund. Each class differs with respect to distribution and service plan fees incurred. Certain expense reductions may also differ by class. For the reporting period, the allocated portion of income and expenses to each class as a percent of its average net assets may vary due to the timing of recording these transactions in relation to fluctuating net assets of the classes. Expenses directly attributable to a fund are charged to that fund. Expenses attributable to more than one fund are allocated among the respective funds on the basis of relative net assets or other appropriate methods. Expenses included in the accompanying financial statements reflect the expenses of each Fund and do not include any expenses associated with the Underlying Funds. Although not included in each Fund's expenses, each Fund indirectly bears its proportionate share of the Underlying Funds' expenses through the impact of these expenses on each Underlying Fund's NAV. Expense estimates are accrued in the period to which they relate and adjustments are made when actual amounts are known.
Income Tax Information and Distributions to Shareholders. Each year, each Fund intends to qualify as a regulated investment company under Subchapter M of the Internal Revenue Code, including distributing substantially all of its taxable income and realized gains. As a result, no provision for U.S. Federal income taxes is required. As of March 31, 2019, each Fund did not have any unrecognized tax benefits in the financial statements; nor is each Fund aware of any tax positions for which it is reasonably possible that the total amounts of unrecognized tax benefits will significantly change in the next twelve months. Each Fund files a U.S. federal tax return, in addition to state and local tax returns as required. Each Fund's federal income tax returns are subject to examination by the Internal Revenue Service (IRS) for a period of three fiscal years after they are filed. State and local tax returns may be subject to examination for an additional fiscal year depending on the jurisdiction.
Distributions are declared and recorded on the ex-dividend date. Income and capital gain distributions are declared separately for each class. Income and capital gain distributions are determined in accordance with income tax regulations, which may differ from GAAP.
Capital accounts within the financial statements are adjusted for permanent book-tax differences. These adjustments have no impact on net assets or the results of operations. Capital accounts are not adjusted for temporary book-tax differences which will reverse in a subsequent period.
Book-tax differences are primarily due to the short-term capital gain distributions from the Underlying Funds, futures contracts, market discount and losses deferred due to wash sales and excise tax regulations.
As of period end, the cost and unrealized appreciation (depreciation) in securities, and derivatives if applicable, for federal income tax purposes were as follows for each Fund:
| | Tax cost | Gross unrealized appreciation | Gross unrealized depreciation | Net unrealized appreciation (depreciation) |
| Advisor Freedom Income | $216,538,309 | $10,886,025 | $(1,774,400) | $9,111,625 |
| Advisor Freedom 2005 | 153,776,089 | 11,344,195 | (613,798) | 10,730,397 |
| Advisor Freedom 2010 | 386,814,087 | 35,220,793 | (1,941,087) | 33,279,706 |
| Advisor Freedom 2015 | 882,507,294 | 105,718,804 | (4,941,565) | 100,777,239 |
| Advisor Freedom 2020 | 2,057,981,156 | 252,055,117 | (17,371,859) | 234,683,258 |
| Advisor Freedom 2025 | 2,613,894,761 | 324,499,856 | (32,876,293) | 291,623,563 |
| Advisor Freedom 2030 | 2,647,219,201 | 366,700,172 | (38,961,332) | 327,738,840 |
| Advisor Freedom 2035 | 2,109,583,182 | 325,295,006 | (40,491,278) | 284,803,728 |
| Advisor Freedom 2040 | 1,911,521,917 | 303,550,886 | (39,379,046) | 264,171,840 |
| Advisor Freedom 2045 | 1,255,801,238 | 172,220,768 | (33,216,428) | 139,004,340 |
| Advisor Freedom 2050 | 1,021,915,433 | 134,392,233 | (27,995,628) | 106,396,605 |
| Advisor Freedom 2055 | 613,222,778 | 43,038,098 | (26,748,858) | 16,289,240 |
| Advisor Freedom 2060 | 152,308,828 | 5,807,168 | (8,276,295) | (2,469,127) |
The tax-based components of distributable earnings as of period end were as follows for each Fund:
| | Undistributed ordinary income | Undistributed long-term capital gain | Net unrealized appreciation (depreciation) on securities and other investments |
| Advisor Freedom Income | $345,796 | $2,019,907 | $9,111,625 |
| Advisor Freedom 2005 | 442,943 | 2,191,790 | 10,730,397 |
| Advisor Freedom 2010 | 910,875 | 8,394,594 | 33,279,706 |
| Advisor Freedom 2015 | 1,421,298 | 25,187,548 | 100,777,239 |
| Advisor Freedom 2020 | 1,835,173 | 69,656,063 | 234,683,258 |
| Advisor Freedom 2025 | 2,739,475 | 98,500,431 | 291,623,563 |
| Advisor Freedom 2030 | 1,457,365 | 121,811,569 | 327,738,840 |
| Advisor Freedom 2035 | 1,190,585 | 113,192,512 | 284,803,728 |
| Advisor Freedom 2040 | 963,725 | 107,206,314 | 264,171,840 |
| Advisor Freedom 2045 | 718,788 | 68,090,258 | 139,004,340 |
| Advisor Freedom 2050 | 813,787 | 54,719,761 | 106,396,605 |
| Advisor Freedom 2055 | 563,699 | 29,699,729 | 16,289,240 |
| Advisor Freedom 2060 | 154,982 | 6,613,385 | (2,469,127) |
Certain of the Funds intend to elect to defer to the next fiscal year capital losses recognized during the period November 1, 2018 to December 31, 2018. Loss deferrals were as follows:
| | Capital losses |
| Advisor Freedom 2020 | $621,115 |
Certain of the Funds intend to elect to defer to the next fiscal year ordinary losses recognized during the period January 1, 2019 to March 31, 2019. Loss deferrals were as follows:
| | Ordinary Losses |
| Advisor Freedom 2030 | $698,073 |
| Advisor Freedom 2035 | 3,293,429 |
| Advisor Freedom 2040 | 3,803,893 |
| Advisor Freedom 2045 | 2,333,328 |
| Advisor Freedom 2050 | 1,896,738 |
| Advisor Freedom 2055 | 1,000,074 |
| Advisor Freedom 2060 | 232,619 |
The tax character of distributions paid was as follows:
| March 31, 2019 | | | |
| | Ordinary Income | Long-term Capital Gains | Total |
| Advisor Freedom Income | $5,220,574 | $6,646,962 | $11,867,536 |
| Advisor Freedom 2005 | 4,168,017 | 9,316,705 | 13,484,722 |
| Advisor Freedom 2010 | 9,986,497 | 26,154,506 | 36,141,003 |
| Advisor Freedom 2015 | 23,645,771 | 72,444,459 | 96,090,230 |
| Advisor Freedom 2020 | 55,628,035 | 146,778,899 | 202,406,934 |
| Advisor Freedom 2025 | 68,464,636 | 178,254,357 | 246,718,993 |
| Advisor Freedom 2030 | 68,808,412 | 205,744,973 | 274,553,385 |
| Advisor Freedom 2035 | 51,664,592 | 185,484,438 | 237,149,030 |
| Advisor Freedom 2040 | 45,669,659 | 168,998,076 | 214,667,735 |
| Advisor Freedom 2045 | 29,480,638 | 103,862,304 | 133,342,942 |
| Advisor Freedom 2050 | 23,407,319 | 82,219,197 | 105,626,516 |
| Advisor Freedom 2055 | 12,761,189 | 37,180,373 | 49,941,562 |
| Advisor Freedom 2060 | 2,743,748 | 6,037,360 | 8,781,108 |
| March 31, 2018 | | | |
| | Ordinary Income | Long-term Capital Gains | Total |
| Advisor Freedom Income | $3,479,795 | $4,575,169 | $8,054,964 |
| Advisor Freedom 2005 | 3,441,596 | 6,709,249 | 10,150,845 |
| Advisor Freedom 2010 | 8,293,057 | 22,575,387 | 30,868,444 |
| Advisor Freedom 2015 | 20,730,129 | 58,088,151 | 78,818,280 |
| Advisor Freedom 2020 | 45,067,657 | 101,465,148 | 146,532,805 |
| Advisor Freedom 2025 | 52,699,296 | 102,487,190 | 155,186,486 |
| Advisor Freedom 2030 | 48,565,136 | 111,543,730 | 160,108,866 |
| Advisor Freedom 2035 | 37,748,798 | 81,868,954 | 119,617,752 |
| Advisor Freedom 2040 | 33,812,317 | 77,196,866 | 111,009,183 |
| Advisor Freedom 2045 | 21,019,495 | 38,018,542 | 59,038,037 |
| Advisor Freedom 2050 | 17,138,592 | 27,266,480 | 44,405,072 |
| Advisor Freedom 2055 | 8,442,111 | 8,069,441 | 16,511,552 |
| Advisor Freedom 2060 | 1,263,393 | 820,311 | 2,083,704 |
New Rule Issuance. During August 2018, the U.S. Securities and Exchange Commission issued Final Rule Release No. 33-10532, Disclosure Update and Simplification. This Final Rule includes amendments specific to registered investment companies that are intended to eliminate overlap in disclosure requirements between Regulation S-X and GAAP. In accordance with these amendments, certain line-items in the Funds' financial statements have been combined or removed for the current period as outlined in the table below.
| Financial Statement | Current Line-Item Presentation (As Applicable) | Prior Line-Item Presentation (As Applicable) |
| Statement of Assets and Liabilities | Total distributable earnings (loss) | Undistributed/Distributions in excess of/Accumulated net investment income (loss)
Accumulated/Undistributed net realized gain (loss)
Net unrealized appreciation (depreciation) |
| Statement of Changes in Net Assets | N/A - removed | Undistributed/Distributions in excess of/Accumulated net investment income (loss) end of period |
| Statement of Changes in Net Assets | Distributions to shareholders | Distributions to shareholders from net investment income
Distributions to shareholders from net realized gain |
| Distributions to Shareholders Note to Financial Statements | Distributions to shareholders | Distributions to shareholders from net investment income
Distributions to shareholders from net realized gain |
4. Derivative Instruments.
Risk Exposures and the Use of Derivative Instruments. The Funds' investment objective allows the Funds to enter into various types of derivative contracts, including futures contracts. Derivatives are investments whose value is primarily derived from underlying assets, indices or reference rates and may be transacted on an exchange or over-the-counter (OTC). Derivatives may involve a future commitment to buy or sell a specified asset based on specified terms, to exchange future cash flows at periodic intervals based on a notional principal amount, or for one party to make one or more payments upon the occurrence of specified events in exchange for periodic payments from the other party.
The Funds used derivatives to increase returns and to manage exposure to certain risks as defined below. The success of any strategy involving derivatives depends on analysis of numerous economic factors, and if the strategies for investment do not work as intended, the Funds may not achieve their objectives.
The Funds' use of derivatives increased or decreased their exposure to the following risks:
| Equity Risk | Equity risk relates to the fluctuations in the value of financial instruments as a result of changes in market prices (other than those arising from interest rate risk or foreign exchange risk), whether caused by factors specific to an individual investment, its issuer, or all factors affecting all instruments traded in a market or market segment.
|
| Interest Rate Risk | Interest rate risk relates to the fluctuations in the value of interest-bearing securities due to changes in the prevailing levels of market interest rates. |
The Funds are also exposed to additional risks from investing in derivatives, such as liquidity risk and counterparty credit risk. Liquidity risk is the risk that the Funds will be unable to close out the derivative in the open market in a timely manner. Counterparty credit risk is the risk that the counterparty will not be able to fulfill its obligation to the Funds. Counterparty credit risk related to exchange-traded futures contracts may be mitigated by the protection provided by the exchange on which they trade.
Investing in derivatives may involve greater risks than investing in the underlying assets directly and, to varying degrees, may involve risk of loss in excess of any initial investment and collateral received and amounts recognized in the Statement of Assets and Liabilities. In addition, there may be the risk that the change in value of the derivative contract does not correspond to the change in value of the underlying instrument.
Net Realized Gain (Loss) and Change in Net Unrealized Appreciation (Depreciation) on Derivatives. The table below, which reflects the impacts of derivatives on the financial performance of the Funds, summarizes the net realized gain (loss) and change in net unrealized appreciation (depreciation) for derivatives during the period as presented in the Statement of Operations.
| Primary Risk Exposure / Derivative Type | Net Realized Gain (Loss) | Change in Net Unrealized Appreciation (Depreciation) |
| Advisor Freedom Income | | |
| Equity Risk | | |
| Futures Contracts | $12,096 | $(33,657) |
| Total Equity Risk | 12,096 | (33,657) |
| Interest Rate Risk | | |
| Futures Contracts | 89,004 | 4,557 |
| Total Interest Rate Risk | 89,004 | 4,557 |
| Totals | $101,100 | $(29,100) |
| Advisor Freedom 2005 | | |
| Equity Risk | | |
| Futures Contracts | $33,440 | $(25,068) |
| Total Equity Risk | 33,440 | (25,068) |
| Interest Rate Risk | | |
| Futures Contracts | 95,850 | 5,875 |
| Total Interest Rate Risk | 95,850 | 5,875 |
| Totals | $129,290 | $(19,193) |
| Advisor Freedom 2010 | | |
| Equity Risk | | |
| Futures Contracts | $304,071 | $(74,495) |
| Total Equity Risk | 304,071 | (74,495) |
| Interest Rate Risk | | |
| Futures Contracts | 100,365 | 31,299 |
| Total Interest Rate Risk | 100,365 | 31,299 |
| Totals | $404,436 | $(43,196) |
| Advisor Freedom 2015 | | |
| Equity Risk | | |
| Futures Contracts | $712,610 | $(192,505) |
| Total Equity Risk | 712,610 | (192,505) |
| Interest Rate Risk | | |
| Futures Contracts | 274,906 | 86,639 |
| Total Interest Rate Risk | 274,906 | 86,639 |
| Totals | $987,516 | $(105,866) |
| Advisor Freedom 2020 | | |
| Equity Risk | | |
| Futures Contracts | $1,548,049 | $(421,117) |
| Total Equity Risk | 1,548,049 | (421,117) |
| Interest Rate Risk | | |
| Futures Contracts | 614,196 | 216,050 |
| Total Interest Rate Risk | 614,196 | 216,050 |
| Totals | $2,162,245 | $(205,067) |
| Advisor Freedom 2025 | | |
| Equity Risk | | |
| Futures Contracts | $2,923,328 | $(542,920) |
| Total Equity Risk | 2,923,328 | (542,920) |
| Interest Rate Risk | | |
| Futures Contracts | 821,304 | 294,441 |
| Total Interest Rate Risk | 821,304 | 294,441 |
| Totals | $3,744,632 | $(248,479) |
| Advisor Freedom 2030 | | |
| Equity Risk | | |
| Futures Contracts | $577,471 | $(598,682) |
| Total Equity Risk | 577,471 | (598,682) |
| Interest Rate Risk | | |
| Futures Contracts | 523,798 | 258,543 |
| Total Interest Rate Risk | 523,798 | 258,543 |
| Totals | $1,101,269 | $(340,139) |
| Advisor Freedom 2035 | | |
| Equity Risk | | |
| Futures Contracts | $383,976 | $(548,340) |
| Total Equity Risk | 383,976 | (548,340) |
| Interest Rate Risk | | |
| Futures Contracts | (983,603) | 257,203 |
| Total Interest Rate Risk | (983,603) | 257,203 |
| Totals | $(599,627) | $(291,137) |
| Advisor Freedom 2040 | | |
| Equity Risk | | |
| Futures Contracts | $(787,829) | $(93,947) |
| Total Equity Risk | (787,829) | (93,947) |
| Interest Rate Risk | | |
| Futures Contracts | (128,301) | 90,166 |
| Total Interest Rate Risk | (128,301) | 90,166 |
| Totals | $(916,130) | $(3,781) |
| Advisor Freedom 2045 | | |
| Equity Risk | | |
| Futures Contracts | $(457,862) | $(89,213) |
| Total Equity Risk | (457,862) | (89,213) |
| Interest Rate Risk | | |
| Futures Contracts | (94,503) | 54,762 |
| Total Interest Rate Risk | (94,503) | 54,762 |
| Totals | $(552,365) | $(34,451) |
| Advisor Freedom 2050 | | |
| Equity Risk | | |
| Futures Contracts | $(409,685) | $(75,060) |
| Total Equity Risk | (409,685) | (75,060) |
| Interest Rate Risk | | |
| Futures Contracts | (27,401) | 45,083 |
| Total Interest Rate Risk | (27,401) | 45,083 |
| Totals | $(437,086) | $(29,977) |
| Advisor Freedom 2055 | | |
| Equity Risk | | |
| Futures Contracts | $(208,050) | $(48,091) |
| Total Equity Risk | (208,050) | (48,091) |
| Interest Rate Risk | | |
| Futures Contracts | 3,029 | 27,845 |
| Total Interest Rate Risk | 3,029 | 27,845 |
| Totals | $(205,021) | $(20,246) |
| Advisor Freedom 2060 | | |
| Equity Risk | | |
| Futures Contracts | $(37,029) | $(14,503) |
| Total Equity Risk | (37,029) | (14,503) |
| Interest Rate Risk | | |
| Futures Contracts | – | – |
| Total Interest Rate Risk | – | – |
| Totals | $(37,029) | $(14,503) |
A summary of the value of derivatives by primary risk exposure as of period end is included at the end of the Schedule of Investments.
Futures Contracts. A futures contract is an agreement between two parties to buy or sell a specified underlying instrument for a fixed price at a specified future date. The Funds used futures contracts to manage their exposure to the stock market.
Upon entering into a futures contract, a fund is required to deposit either cash or securities (initial margin) with a clearing broker in an amount equal to a certain percentage of the face value of the contract. Futures contracts are marked-to-market daily and subsequent daily payments (variation margin) are made or received by a fund depending on the daily fluctuations in the value of the futures contracts and are recorded as unrealized appreciation or (depreciation). This receivable and/or payable, if any, is included in daily variation margin on futures contracts in the Statement of Assets and Liabilities. Realized gain or (loss) is recorded upon the expiration or closing of a futures contract. The net realized gain (loss) and change in net unrealized appreciation (depreciation) on futures contracts during the period is presented in the Statement of Operations.
Any open futures contracts at period end are presented in the Schedule of Investments under the caption "Futures Contracts". The notional amount at value reflects each contract's exposure to the underlying instrument or index at period end and is representative of volume of activity during the period. Securities deposited to meet initial margin requirements are identified in the Schedule of Investments.
5. Purchases and Sales of Investments.
Purchases and sales of securities including the Underlying Fund shares, other than short-term securities, are noted in the table below.
| | Purchases ($) | Sales ($) |
| Advisor Freedom Income | 92,372,992 | 79,609,557 |
| Advisor Freedom 2005 | 49,914,706 | 77,441,950 |
| Advisor Freedom 2010 | 104,576,752 | 153,563,418 |
| Advisor Freedom 2015 | 222,359,954 | 328,109,225 |
| Advisor Freedom 2020 | 515,710,492 | 662,387,742 |
| Advisor Freedom 2025 | 691,359,984 | 705,571,776 |
| Advisor Freedom 2030 | 729,077,077 | 636,319,028 |
| Advisor Freedom 2035 | 656,498,352 | 541,536,676 |
| Advisor Freedom 2040 | 570,189,393 | 455,080,144 |
| Advisor Freedom 2045 | 408,999,139 | 294,822,060 |
| Advisor Freedom 2050 | 359,731,172 | 259,188,331 |
| Advisor Freedom 2055 | 274,634,953 | 157,608,086 |
| Advisor Freedom 2060 | 92,892,298 | 33,575,768 |
6. Fees and Other Transactions with Affiliates.
Management Fee and Expense Contract. FMR Co., Inc. (the investment adviser), an affiliate of FMR, and its affiliates provide the Funds with investment management related services. Under the management contract, effective June 1, 2017, each Class of each Fund pays a monthly management fee that is set at an annual rate by referring to each Fund's target date, indicated by its name, such that the management fee rate applicable to each Class of each Fund is reduced as the fund approaches, and then passes, its target date. In addition, under the management contract, the investment adviser pays all ordinary operating expenses of each Fund, except distribution and service plan fees, fees and expenses of the independent Trustees, and certain miscellaneous expenses such as proxy and shareholder meeting expenses. The management fee is reduced by an amount equal to the fees and expenses paid by each Fund to the independent Trustees. Prior to June 1, 2017, the investment advisor provided the Funds with investment management related services. The Funds did not pay any fees for these services. For the reporting period, the total annual management fee rate for each Class of each Fund was as follows:
| | Annual % of Class-Level Average Net Assets (Classes A, M, C, I) | Annual % of Class-Level Average Net Assets
(Classes Z, Z6) |
| Fidelity Advisor Freedom Income Fund | .465% | .415% |
| Fidelity Advisor Freedom 2005 Fund | .482% | .428% |
| Fidelity Advisor Freedom 2010 Fund | .525% | .461% |
| Fidelity Advisor Freedom 2015 Fund | .567% | .496% |
| Fidelity Advisor Freedom 2020 Fund | .610% | .531% |
| Fidelity Advisor Freedom 2025 Fund | .652% | .566% |
| Fidelity Advisor Freedom 2030 Fund | .695% | .601% |
| Fidelity Advisor Freedom 2035 Fund | .737% | .636% |
| Fidelity Advisor Freedom 2040 Fund | .746% | .643% |
| Fidelity Advisor Freedom 2045 Fund | .746% | .643% |
| Fidelity Advisor Freedom 2050 Fund | .746% | .643% |
| Fidelity Advisor Freedom 2055 Fund | .746% | .643% |
| Fidelity Advisor Freedom 2060 Fund | .746% | .643% |
Under the expense contract, the investment adviser pays class-level expenses for Class Z6 of each Fund as necessary so that Class Z6 total expenses do not exceed certain amounts of Class Z6 average net assets on an annual basis with certain exceptions, as noted in the following table:
| | Annual % of Class-Level Average Net Assets (Class Z6) |
| Fidelity Advisor Freedom Income Fund | .365% |
| Fidelity Advisor Freedom 2005 Fund | .373% |
| Fidelity Advisor Freedom 2010 Fund | .392% |
| Fidelity Advisor Freedom 2015 Fund | .412% |
| Fidelity Advisor Freedom 2020 Fund | .431% |
| Fidelity Advisor Freedom 2025 Fund | .450% |
| Fidelity Advisor Freedom 2030 Fund | .470% |
| Fidelity Advisor Freedom 2035 Fund | .489% |
| Fidelity Advisor Freedom 2040 Fund | .493% |
| Fidelity Advisor Freedom 2045 Fund | .493% |
| Fidelity Advisor Freedom 2050 Fund | .493% |
| Fidelity Advisor Freedom 2055 Fund | .493% |
| Fidelity Advisor Freedom 2060 Fund | .493% |
Distribution and Service Plan Fees. In accordance with Rule 12b-1 of the 1940 Act, each Fund has adopted separate Distribution and Service Plans for each class of shares. Certain classes pay Fidelity Distributors Corporation (FDC), an affiliate of the investment adviser, separate Distribution and Service Fees, each of which is based on an annual percentage of each class' average net assets. In addition, FDC may pay financial intermediaries for selling shares of each Fund and providing shareholder support services. For the period, the Distribution and Service Fee rates, total fees and amounts retained by FDC were as follows:
| | Distribution Fee | Service Fee | Total Fees | Retained by FDC |
| Advisor Freedom Income | | | | |
| Class A | -% | .25% | $177,160 | $3,098 |
| Class M | .25% | .25% | 189,340 | 182 |
| Class C | .75% | .25% | 123,609 | 10,969 |
| | | | $490,109 | $14,249 |
| Advisor Freedom 2005 | | | | |
| Class A | -% | .25% | $230,024 | $7,226 |
| Class M | .25% | .25% | 123,346 | 950 |
| Class C | .75% | .25% | 51,044 | 1,498 |
| | | | $404,414 | $9,674 |
| Advisor Freedom 2010 | | | | |
| Class A | -% | .25% | $509,737 | $21,024 |
| Class M | .25% | .25% | 367,892 | 6,771 |
| Class C | .75% | .25% | 227,599 | 7,061 |
| | | | $1,105,228 | $34,856 |
| Advisor Freedom 2015 | | | | |
| Class A | -% | .25% | $1,251,729 | $44,310 |
| Class M | .25% | .25% | 787,892 | 6,324 |
| Class C | .75% | .25% | 503,987 | 26,261 |
| | | | $2,543,608 | $76,895 |
| Advisor Freedom 2020 | | | | |
| Class A | -% | .25% | $2,728,397 | $90,632 |
| Class M | .25% | .25% | 1,790,090 | 19,704 |
| Class C | .75% | .25% | 927,733 | 85,772 |
| | | | $5,446,220 | $196,108 |
| Advisor Freedom 2025 | | | | |
| Class A | -% | .25% | $3,344,909 | $136,839 |
| Class M | .25% | .25% | 2,118,012 | 17,221 |
| Class C | .75% | .25% | 905,305 | 86,996 |
| | | | $6,368,226 | $241,056 |
| Advisor Freedom 2030 | | | | |
| Class A | -% | .25% | $3,246,386 | $104,024 |
| Class M | .25% | .25% | 2,246,728 | 13,465 |
| Class C | .75% | .25% | 928,871 | 102,513 |
| | | | $6,421,985 | $220,002 |
| Advisor Freedom 2035 | | | | |
| Class A | -% | .25% | $2,584,579 | $95,648 |
| Class M | .25% | .25% | 1,796,174 | 16,089 |
| Class C | .75% | .25% | 622,636 | 69,886 |
| | | | $5,003,389 | $181,623 |
| Advisor Freedom 2040 | | | | |
| Class A | -% | .25% | $2,266,051 | $77,667 |
| Class M | .25% | .25% | 1,721,102 | 9,455 |
| Class C | .75% | .25% | 792,693 | 72,079 |
| | | | $4,779,846 | $159,201 |
| Advisor Freedom 2045 | | | | |
| Class A | -% | .25% | $1,366,114 | $49,801 |
| Class M | .25% | .25% | 1,029,694 | 7,662 |
| Class C | .75% | .25% | 299,676 | 42,247 |
| | | | $2,695,484 | $99,710 |
| Advisor Freedom 2050 | | | | |
| Class A | -% | .25% | $1,014,412 | $28,671 |
| Class M | .25% | .25% | 840,864 | 4,831 |
| Class C | .75% | .25% | 321,265 | 44,954 |
| | | | $2,176,541 | $78,456 |
| Advisor Freedom 2055 | | | | |
| Class A | -% | .25% | $509,715 | $13,523 |
| Class M | .25% | .25% | 384,758 | 1,068 |
| Class C | .75% | .25% | 110,210 | 20,717 |
| | | | $1,004,683 | $35,308 |
| Advisor Freedom 2060 | | | | |
| Class A | -% | .25% | $112,363 | $3,210 |
| Class M | .25% | .25% | 78,014 | – |
| Class C | .75% | .25% | 31,451 | 13,790 |
| | | | $221,828 | $17,000 |
Sales Load. FDC may receive a front-end sales charge of up to 5.75% for selling Class A shares and 3.50% for selling Class M shares, some of which is paid to financial intermediaries for selling shares of each Fund. Depending on the holding period, FDC may receive contingent deferred sales charges levied on Class A, Class M and Class C redemptions. The deferred sales charges are 1.00% for Class C shares, 1.00% for certain purchases of Class A shares and .25% for certain purchases of Class M shares.
For the period, sales charge amounts retained by FDC were as follows:
| | Retained by FDC |
| Advisor Freedom Income | |
| Class A | $9,879 |
| Class M | 1,245 |
| Class C(a) | 1,514 |
| | $12,638 |
| Advisor Freedom 2005 | |
| Class A | $1,943 |
| Class M | 1,500 |
| Class C(a) | 430 |
| | $3,873 |
| Advisor Freedom 2010 | |
| Class A | $5,364 |
| Class M | 1,626 |
| Class C(a) | 706 |
| | $7,696 |
| Advisor Freedom 2015 | |
| Class A | $14,896 |
| Class M | 5,228 |
| Class C(a) | 4,998 |
| | $25,122 |
| Advisor Freedom 2020 | |
| Class A | $43,253 |
| Class M | 17,222 |
| Class C A | 6,954 |
| | $67,429 |
| Advisor Freedom 2025 | |
| Class A | $64,353 |
| Class M | 28,653 |
| Class C(a) | 8,317 |
| | $101,323 |
| Advisor Freedom 2030 | |
| Class A | $84,323 |
| Class M | 30,930 |
| Class C(a) | 12,102 |
| | $127,355 |
| Advisor Freedom 2035 | |
| Class A | $71,780 |
| Class M | 28,692 |
| Class C(a) | 11,962 |
| | $112,434 |
| Advisor Freedom 2040 | |
| Class A | $79,015 |
| Class M | 24,014 |
| Class C(a) | 7,448 |
| | $110,477 |
| Advisor Freedom 2045 | |
| Class A | $56,463 |
| Class M | 16,881 |
| Class C(a) | 4,641 |
| | $77,985 |
| Advisor Freedom 2050 | |
| Class A | $63,902 |
| Class M | 13,536 |
| Class C(a) | 5,322 |
| | $82,760 |
| Advisor Freedom 2055 | |
| Class A | $32,800 |
| Class M | 9,888 |
| Class C(a) | 3,094 |
| | $45,782 |
| Advisor Freedom 2060 | |
| Class A | $15,130 |
| Class M | 3,198 |
| Class C(a) | 1,097 |
| | $19,425 |
(a) When Class C shares are initially sold, FDC pays commissions from its own resources to financial intermediaries through which the sales are made.
Prior Fiscal Year Reallocation of Underlying Fund Investments. During the prior period, the investment adviser reallocated investments of the Funds. This involved taxable redemptions of the Funds' interest in Fidelity Advisor Series Equity Value Fund ("selected Underlying Fund") for investments and cash and non-taxable exchanges of those investments and cash for shares of Fidelity Advisor Series Growth & Income Fund which is an affiliated investment company managed by FMR.
Details of these transactions with the related net gain (loss) for the Funds are presented in the accompanying table:
| | Value of Investments and Cash reallocated | Net realized Gain (Loss) on redemptions of selected Underlying Funds |
| Advisor Freedom Income | $1,835,460 | $263,976 |
| Advisor Freedom 2005 | 2,600,106 | 473,487 |
| Advisor Freedom 2010 | 8,110,167 | 1,996,669 |
| Advisor Freedom 2015 | 23,603,334 | 4,562,791 |
| Advisor Freedom 2020 | 57,172,267 | 5,489,085 |
| Advisor Freedom 2025 | 73,263,952 | 6,487,561 |
| Advisor Freedom 2030 | 87,711,735 | 7,386,714 |
| Advisor Freedom 2035 | 79,733,333 | 5,964,782 |
| Advisor Freedom 2040 | 74,045,368 | 5,798,888 |
| Advisor Freedom 2045 | 44,156,583 | 3,196,466 |
| Advisor Freedom 2050 | 34,515,108 | 2,535,731 |
| Advisor Freedom 2055 | 15,452,315 | 540,986 |
| Advisor Freedom 2060 | 1,885,573 | 23,858 |
Interfund Trades. The Funds may purchase from or sell securities to other Fidelity Funds under procedures adopted by the Board. The procedures have been designed to ensure these interfund trades are executed in accordance with Rule 17a-7 of the 1940 Act. Interfund trades are included within the respective purchases and sales amounts shown in the Purchases and Sales of Investments note.
7. Expense Reductions.
Through arrangements with each applicable Fund's custodian and each class' transfer agent, credits realized as a result of certain uninvested cash balances were used to reduce the Fund's expenses. All of the applicable expense reductions are noted in the table below.
| | Custody credits | Transfer Agent credits |
| Advisor Freedom Income | $170 | $– |
| Advisor Freedom 2005 | 150 | – |
| Advisor Freedom 2010 | 237 | – |
| Advisor Freedom 2015 | 177 | – |
| Advisor Freedom 2020 | 200 | – |
| Advisor Freedom 2020 - Class C | | 20 |
| Advisor Freedom 2025 | 168 | – |
| Advisor Freedom 2030 | 197 | – |
| Advisor Freedom 2035 | 46 | – |
| Advisor Freedom 2040 | 56 | – |
| Advisor Freedom 2045 | 112 | – |
| Advisor Freedom 2050 | 100 | – |
| Advisor Freedom 2055 | 70 | – |
| Advisor Freedom 2060 | 119 | – |
8. Distributions to Shareholders.
Distributions to shareholders of each class were as follows:
| | Year ended
March 31, 2019(a) | Year ended
March 31, 2018 (b) |
| Advisor Freedom Income | | |
| Distributions to shareholders | | |
| Class A | $3,719,592 | $– |
| Class M | 1,910,164 | – |
| Class C | 554,170 | – |
| Class I | 4,702,881 | – |
| Class Z | 24,313 | – |
| Class Z6 | 956,416 | – |
| Total | $11,867,536 | $– |
| From net investment income | | |
| Class A | $– | $1,099,143 |
| Class M | – | 434,009 |
| Class C | – | 84,788 |
| Class I | – | 1,334,162 |
| Class Z6 | – | 14,910 |
| Total | $– | $2,967,012 |
| From net realized gain | | |
| Class A | $– | $1,878,730 |
| Class M | – | 905,373 |
| Class C | – | 326,433 |
| Class I | – | 1,957,623 |
| Class Z6 | – | 19,793 |
| Total | $– | $5,087,952 |
| Advisor Freedom 2005 | | |
| Distributions to shareholders | | |
| Class A | $7,049,550 | $– |
| Class M | 1,813,526 | – |
| Class C | 357,920 | – |
| Class I | 4,121,296 | – |
| Class Z | 5,414 | – |
| Class Z6 | 137,016 | – |
| Total | $13,484,722 | $– |
| From net investment income | | |
| Class A | $– | $1,499,668 |
| Class M | – | 314,597 |
| Class C | – | 29,260 |
| Class I | – | 965,073 |
| Class Z6 | – | 3,311 |
| Total | $– | $2,811,909 |
| From net realized gain | | |
| Class A | $– | $4,027,753 |
| Class M | – | 991,902 |
| Class C | – | 192,899 |
| Class I | – | 2,120,987 |
| Class Z6 | – | 5,395 |
| Total | $– | $7,338,936 |
| Advisor Freedom 2010 | | |
| Distributions to shareholders | | |
| Class A | $16,675,337 | $– |
| Class M | 5,904,302 | – |
| Class C | 1,674,171 | – |
| Class I | 11,374,349 | – |
| Class Z | 12,443 | – |
| Class Z6 | 500,401 | – |
| Total | $36,141,003 | $– |
| From net investment income | | |
| Class A | $– | $3,281,846 |
| Class M | – | 928,807 |
| Class C | – | 171,747 |
| Class I | – | 2,274,695 |
| Class Z6 | – | 5,012 |
| Total | $– | $6,662,107 |
| From net realized gain | | |
| Class A | $– | $12,108,352 |
| Class M | – | 4,030,464 |
| Class C | – | 1,392,028 |
| Class I | – | 6,664,800 |
| Class Z6 | – | 10,693 |
| Total | $– | $24,206,337 |
| Advisor Freedom 2015 | | |
| Distributions to shareholders | | |
| Class A | $46,432,815 | $– |
| Class M | 14,273,744 | – |
| Class C | 4,341,088 | – |
| Class I | 29,585,610 | – |
| Class Z | 51,261 | – |
| Class Z6 | 1,405,712 | – |
| Total | $96,090,230 | $– |
| From net investment income | | |
| Class A | $– | $7,973,130 |
| Class M | – | 1,948,902 |
| Class C | – | 332,783 |
| Class I | – | 5,348,653 |
| Class Z6 | – | 43,354 |
| Total | $– | $15,646,822 |
| From net realized gain | | |
| Class A | $– | $32,654,337 |
| Class M | – | 9,539,452 |
| Class C | – | 3,208,781 |
| Class I | – | 17,671,857 |
| Class Z6 | – | 97,031 |
| Total | $– | $63,171,458 |
| Advisor Freedom 2020 | | |
| Distributions to shareholders | | |
| Class A | $92,940,211 | $– |
| Class M | 29,603,011 | – |
| Class C | 7,197,787 | – |
| Class I | 69,167,552 | – |
| Class Z | 47,484 | – |
| Class Z6 | 3,450,889 | – |
| Total | $202,406,934 | $– |
| From net investment income | | |
| Class A | $– | $16,243,820 |
| Class M | – | 4,166,252 |
| Class C | – | 631,334 |
| Class I | – | 12,480,682 |
| Class Z6 | – | 54,384 |
| Total | $– | $33,576,472 |
| From net realized gain | | |
| Class A | $– | $56,102,883 |
| Class M | – | 17,427,080 |
| Class C | – | 4,617,388 |
| Class I | – | 34,710,233 |
| Class Z6 | – | 98,749 |
| Total | $– | $112,956,333 |
| Advisor Freedom 2025 | | |
| Distributions to shareholders | | |
| Class A | $113,159,727 | $– |
| Class M | 34,967,109 | – |
| Class C | 6,974,801 | – |
| Class I | 87,942,916 | – |
| Class Z | 22,710 | – |
| Class Z6 | 3,651,730 | – |
| Total | $246,718,993 | $– |
| From net investment income | | |
| Class A | $– | $18,093,765 |
| Class M | – | 4,378,723 |
| Class C | – | 563,682 |
| Class I | – | 14,900,347 |
| Class Z6 | – | 64,554 |
| Total | $– | $38,001,071 |
| From net realized gain | | |
| Class A | $– | $58,214,610 |
| Class M | – | 17,087,190 |
| Class C | – | 3,945,982 |
| Class I | – | 37,833,645 |
| Class Z6 | – | 103,988 |
| Total | $– | $117,185,415 |
| Advisor Freedom 2030 | | |
| Distributions to shareholders | | |
| Class A | $120,850,924 | $– |
| Class M | 40,810,071 | – |
| Class C | 8,147,415 | – |
| Class I | 100,237,223 | – |
| Class Z | 24,278 | – |
| Class Z6 | 4,483,474 | – |
| Total | $274,553,385 | $– |
| From net investment income | | |
| Class A | $– | $14,665,530 |
| Class M | – | 3,839,299 |
| Class C | – | 484,808 |
| Class I | – | 13,363,681 |
| Class Z6 | – | 76,802 |
| Total | $– | $32,430,120 |
| From net realized gain | | |
| Class A | $– | $61,142,849 |
| Class M | – | 19,943,569 |
| Class C | – | 4,240,085 |
| Class I | – | 42,210,713 |
| Class Z6 | – | 141,530 |
| Total | $– | $127,678,746 |
| Advisor Freedom 2035 | | |
| Distributions to shareholders | | |
| Class A | $103,682,962 | $– |
| Class M | 35,751,347 | – |
| Class C | 5,966,150 | – |
| Class I | 88,150,440 | – |
| Class Z | 16,723 | – |
| Class Z6 | 3,581,408 | – |
| Total | $237,149,030 | $– |
| From net investment income | | |
| Class A | $– | $10,040,682 |
| Class M | – | 2,832,544 |
| Class C | – | 299,727 |
| Class I | – | 9,653,819 |
| Class Z6 | – | 41,993 |
| Total | $– | $22,868,765 |
| From net realized gain | | |
| Class A | $– | $46,063,469 |
| Class M | – | 14,617,860 |
| Class C | – | 2,740,366 |
| Class I | – | 33,253,804 |
| Class Z6 | – | 73,488 |
| Total | $– | $96,748,987 |
| Advisor Freedom 2040 | | |
| Distributions to shareholders | | |
| Class A | $90,574,926 | $– |
| Class M | 34,055,844 | – |
| Class C | 7,700,684 | – |
| Class I | 79,158,942 | – |
| Class Z | 42,878 | – |
| Class Z6 | 3,134,461 | – |
| Total | $214,667,735 | $– |
| From net investment income | | |
| Class A | $– | $8,881,190 |
| Class M | – | 2,655,243 |
| Class C | – | 390,961 |
| Class I | – | 8,816,392 |
| Class Z6 | – | 35,650 |
| Total | $– | $20,779,436 |
| From net realized gain | | |
| Class A | $– | $40,808,993 |
| Class M | – | 14,342,170 |
| Class C | – | 3,641,921 |
| Class I | – | 31,372,523 |
| Class Z6 | – | 64,140 |
| Total | $– | $90,229,747 |
| Advisor Freedom 2045 | | |
| Distributions to shareholders | | |
| Class A | $53,425,416 | $– |
| Class M | 19,988,683 | – |
| Class C | 2,861,435 | – |
| Class I | 54,655,664 | – |
| Class Z | 23,397 | – |
| Class Z6 | 2,388,347 | – |
| Total | $133,342,942 | $– |
| From net investment income | | |
| Class A | $– | $5,219,007 |
| Class M | – | 1,576,055 |
| Class C | – | 129,725 |
| Class I | – | 5,947,360 |
| Class Z6 | – | 27,145 |
| Total | $– | $12,899,292 |
| From net realized gain | | |
| Class A | $– | $20,301,003 |
| Class M | – | 7,111,464 |
| Class C | – | 1,051,413 |
| Class I | – | 17,635,957 |
| Class Z6 | – | 38,908 |
| Total | $– | $46,138,745 |
| Advisor Freedom 2050 | | |
| Distributions to shareholders | | |
| Class A | $38,880,173 | $– |
| Class M | 15,954,954 | – |
| Class C | 2,996,255 | – |
| Class I | 46,138,730 | – |
| Class Z | 18,714 | – |
| Class Z6 | 1,637,690 | – |
| Total | $105,626,516 | $– |
| From net investment income | | |
| Class A | $– | $3,857,081 |
| Class M | – | 1,283,517 |
| Class C | – | 145,803 |
| Class I | – | 4,942,896 |
| Class Z6 | – | 22,378 |
| Total | $– | $10,251,675 |
| From net realized gain | | |
| Class A | $– | $13,859,582 |
| Class M | – | 5,314,395 |
| Class C | – | 1,032,638 |
| Class I | – | 13,916,045 |
| Class Z6 | – | 30,737 |
| Total | $– | $34,153,397 |
| Advisor Freedom 2055 | | |
| Distributions to shareholders | | |
| Class A | $16,991,913 | $– |
| Class M | 6,421,567 | – |
| Class C | 910,713 | – |
| Class I | 24,818,868 | – |
| Class Z | 11,382 | – |
| Class Z6 | 787,119 | – |
| Total | $49,941,562 | $– |
| From net investment income | | |
| Class A | $– | $1,844,591 |
| Class M | – | 555,719 |
| Class C | – | 45,985 |
| Class I | – | 2,580,264 |
| Class Z6 | – | 23,513 |
| Total | $– | $5,050,072 |
| From net realized gain | | |
| Class A | $– | $4,611,171 |
| Class M | – | 1,578,617 |
| Class C | – | 232,494 |
| Class I | – | 5,016,561 |
| Class Z6 | – | 22,637 |
| Total | $– | $11,461,480 |
| Advisor Freedom 2060 | | |
| Distributions to shareholders | | |
| Class A | $3,183,825 | $– |
| Class M | 1,092,888 | – |
| Class C | 216,286 | – |
| Class I | 4,135,890 | – |
| Class Z | 6,659 | – |
| Class Z6 | 145,560 | – |
| Total | $8,781,108 | $– |
| From net investment income | | |
| Class A | $– | $303,602 |
| Class M | – | 87,416 |
| Class C | – | 11,911 |
| Class I | – | 372,369 |
| Class Z6 | – | 5,927 |
| Total | $– | $781,225 |
| From net realized gain | | |
| Class A | $– | $536,013 |
| Class M | – | 172,103 |
| Class C | – | 34,235 |
| Class I | – | 555,272 |
| Class Z6 | – | 4,856 |
| Total | $– | $1,302,479 |
(a) Distributions for Class Z are for the period October 2, 2018 (commencement of sale of shares) to March 31, 2019.
(b) Distributions for Class Z6 are for the period June 6, 2017 (commencement of sale of shares) to March 31, 2018 .
9. Share Transactions.
Share transactions for each class were as follows and may contain automatic conversions between classes or exchanges between affiliated funds:
| | Shares | Shares | Dollars | Dollars |
| | Year ended March 31, 2019(a) | Year ended March 31, 2018 (b) | Year ended March 31, 2019 (a) | Year ended March 31, 2018 (b) |
| Advisor Freedom Income | | | | |
| Class A | | | | |
| Shares sold | 1,932,113 | 1,561,114 | $20,788,935 | $17,372,724 |
| Reinvestment of distributions | 346,490 | 267,313 | 3,653,146 | 2,956,413 |
| Shares redeemed | (2,702,121) | (2,954,671) | (29,102,868) | (32,858,285) |
| Net increase (decrease) | (423,518) | (1,126,244) | $(4,660,787) | $(12,529,148) |
| Class M | | | | |
| Shares sold | 1,307,353 | 1,231,544 | $13,973,167 | $13,671,270 |
| Reinvestment of distributions | 178,770 | 119,232 | 1,881,149 | 1,317,819 |
| Shares redeemed | (1,417,023) | (1,400,766) | (15,158,255) | (15,542,444) |
| Net increase (decrease) | 69,100 | (49,990) | $696,061 | $(553,355) |
| Class C | | | | |
| Shares sold | 138,607 | 273,309 | $1,478,943 | $3,025,706 |
| Reinvestment of distributions | 50,236 | 33,546 | 527,327 | 370,253 |
| Shares redeemed | (607,897) | (379,554) | (6,510,741) | (4,206,642) |
| Net increase (decrease) | (419,054) | (72,699) | $(4,504,471) | $(810,683) |
| Class I | | | | |
| Shares sold | 2,858,444 | 2,536,795 | $30,911,890 | $28,278,478 |
| Reinvestment of distributions | 439,528 | 293,632 | 4,646,792 | 3,259,663 |
| Shares redeemed | (3,187,993) | (2,708,353) | (34,275,486) | (30,196,704) |
| Net increase (decrease) | 109,979 | 122,074 | $1,283,196 | $1,341,437 |
| Class Z | | | | |
| Shares sold | 81,771 | – | $875,601 | $– |
| Reinvestment of distributions | 2,344 | – | 24,280 | – |
| Shares redeemed | (13,184) | – | (140,510) | – |
| Net increase (decrease) | 70,931 | – | $759,371 | $– |
| Class Z6 | | | | |
| Shares sold | 2,433,234 | 206,804 | $26,352,197 | $2,315,726 |
| Reinvestment of distributions | 91,446 | 3,119 | 956,416 | 34,703 |
| Shares redeemed | (356,549) | (56,618) | (3,824,909) | (629,544) |
| Net increase (decrease) | 2,168,131 | 153,305 | $23,483,704 | $1,720,885 |
| Advisor Freedom 2005 | | | | |
| Class A | | | | |
| Shares sold | 1,475,181 | 1,335,163 | $16,997,499 | $16,124,405 |
| Reinvestment of distributions | 618,999 | 452,684 | 6,866,741 | 5,409,480 |
| Shares redeemed | (2,961,826) | (3,307,757) | (34,157,876) | (40,042,858) |
| Net increase (decrease) | (867,646) | (1,519,910) | $(10,293,636) | $(18,508,973) |
| Class M | | | | |
| Shares sold | 412,017 | 594,769 | $4,683,960 | $7,157,573 |
| Reinvestment of distributions | 163,481 | 108,652 | 1,809,977 | 1,298,447 |
| Shares redeemed | (609,077) | (833,574) | (6,974,256) | (10,035,595) |
| Net increase (decrease) | (33,579) | (130,153) | $(480,319) | $(1,579,575) |
| Class C | | | | |
| Shares sold | 30,697 | 112,314 | $351,080 | $1,348,518 |
| Reinvestment of distributions | 31,426 | 17,487 | 349,478 | 209,035 |
| Shares redeemed | (352,196) | (113,001) | (3,967,909) | (1,365,341) |
| Net increase (decrease) | (290,073) | 16,800 | $(3,267,351) | $192,212 |
| Class I | | | | |
| Shares sold | 1,492,131 | 1,578,344 | $17,428,926 | $19,235,581 |
| Reinvestment of distributions | 367,693 | 255,470 | 4,111,616 | 3,073,797 |
| Shares redeemed | (2,525,114) | (1,832,308) | (29,193,012) | (22,354,226) |
| Net increase (decrease) | (665,290) | 1,506 | $(7,652,470) | $(44,848) |
| Class Z | | | | |
| Shares sold | 10,528 | – | $123,421 | $– |
| Reinvestment of distributions | 501 | – | 5,414 | – |
| Net increase (decrease) | 11,029 | – | $128,835 | $– |
| Class Z6 | | | | |
| Shares sold | 74,161 | 122,579 | $859,219 | $1,494,714 |
| Reinvestment of distributions | 12,363 | 722 | 137,016 | 8,706 |
| Shares redeemed | (41,986) | (5,951) | (485,635) | (71,881) |
| Net increase (decrease) | 44,538 | 117,350 | $510,600 | $1,431,539 |
| Advisor Freedom 2010 | | | | |
| Class A | | | | |
| Shares sold | 2,690,577 | 3,564,998 | $31,929,407 | $44,943,820 |
| Reinvestment of distributions | 1,436,145 | 1,224,022 | 16,485,373 | 15,229,168 |
| Shares redeemed | (5,824,809) | (7,574,224) | (69,776,556) | (95,614,997) |
| Net increase (decrease) | (1,698,087) | (2,785,204) | $(21,361,776) | $(35,442,009) |
| Class M | | | | |
| Shares sold | 1,145,538 | 1,361,175 | $13,545,715 | $17,164,227 |
| Reinvestment of distributions | 515,771 | 398,510 | 5,885,548 | 4,940,676 |
| Shares redeemed | (1,777,323) | (2,349,250) | (21,042,403) | (29,490,893) |
| Net increase (decrease) | (116,014) | (589,565) | $(1,611,140) | $(7,385,990) |
| Class C | | | | |
| Shares sold | 68,555 | 116,566 | $803,764 | $1,455,262 |
| Reinvestment of distributions | 144,087 | 120,905 | 1,644,281 | 1,491,052 |
| Shares redeemed | (1,423,730) | (499,934) | (16,650,264) | (6,234,706) |
| Net increase (decrease) | (1,211,088) | (262,463) | $(14,202,219) | $(3,288,392) |
| Class I | | | | |
| Shares sold | 2,366,556 | 3,628,003 | $28,480,238 | $46,034,277 |
| Reinvestment of distributions | 970,317 | 704,786 | 11,136,673 | 8,802,985 |
| Shares redeemed | (3,168,660) | (3,930,369) | (37,874,643) | (49,731,898) |
| Net increase (decrease) | 168,213 | 402,420 | $1,742,268 | $5,105,364 |
| Class Z | | | | |
| Shares sold | 21,020 | – | $252,219 | $– |
| Reinvestment of distributions | 800 | – | 8,827 | – |
| Net increase (decrease) | 21,820 | – | $261,046 | $– |
| Class Z6 | | | | |
| Shares sold | 319,785 | 425,699 | $3,838,728 | $5,402,891 |
| Reinvestment of distributions | 43,970 | 1,253 | 500,401 | 15,705 |
| Shares redeemed | (188,166) | (46,433) | (2,255,829) | (583,499) |
| Net increase (decrease) | 175,589 | 380,519 | $2,083,300 | $4,835,097 |
| Advisor Freedom 2015 | | | | |
| Class A | | | | |
| Shares sold | 5,818,830 | 6,359,677 | $69,623,803 | $81,015,805 |
| Reinvestment of distributions | 4,011,128 | 3,202,904 | 46,053,900 | 40,291,135 |
| Shares redeemed | (13,197,358) | (18,372,028) | (158,962,664) | (233,983,987) |
| Net increase (decrease) | (3,367,400) | (8,809,447) | $(43,284,961) | $(112,677,047) |
| Class M | | | | |
| Shares sold | 1,948,078 | 2,736,122 | $23,381,501 | $34,744,143 |
| Reinvestment of distributions | 1,241,019 | 907,945 | 14,204,206 | 11,406,069 |
| Shares redeemed | (3,615,691) | (4,687,987) | (43,427,448) | (59,601,397) |
| Net increase (decrease) | (426,594) | (1,043,920) | $(5,841,741) | $(13,451,185) |
| Class C | | | | |
| Shares sold | 392,253 | 430,509 | $4,640,240 | $5,422,977 |
| Reinvestment of distributions | 377,469 | 276,036 | 4,306,006 | 3,447,300 |
| Shares redeemed | (2,481,857) | (1,295,042) | (29,080,495) | (16,430,837) |
| Net increase (decrease) | (1,712,135) | (588,497) | $(20,134,249) | $(7,560,560) |
| Class I | | | | |
| Shares sold | 5,358,142 | 8,187,613 | $65,110,459 | $105,325,150 |
| Reinvestment of distributions | 2,526,473 | 1,790,662 | 29,153,863 | 22,716,014 |
| Shares redeemed | (7,852,844) | (9,768,474) | (95,159,360) | (125,622,049) |
| Net increase (decrease) | 31,771 | 209,801 | $(895,038) | $2,419,115 |
| Class Z | | | | |
| Shares sold | 131,064 | – | $1,551,650 | $– |
| Reinvestment of distributions | 2,691 | – | 29,547 | – |
| Shares redeemed | (5,295) | – | (61,244) | – |
| Net increase (decrease) | 128,460 | – | $1,519,953 | $– |
| Class Z6 | | | | |
| Shares sold | 645,794 | 1,089,010 | $7,810,668 | $14,093,662 |
| Reinvestment of distributions | 120,773 | 11,019 | 1,385,371 | 140,385 |
| Shares redeemed | (391,082) | (81,911) | (4,772,522) | (1,049,457) |
| Net increase (decrease) | 375,485 | 1,018,118 | $4,423,517 | $13,184,590 |
| Advisor Freedom 2020 | | | | |
| Class A | | | | |
| Shares sold | 14,374,598 | 15,638,670 | $188,194,286 | $215,678,977 |
| Reinvestment of distributions | 7,326,361 | 5,240,623 | 92,026,831 | 71,580,589 |
| Shares redeemed | (28,842,898) | (32,501,753) | (379,068,425) | (448,248,436) |
| Net increase (decrease) | (7,141,939) | (11,622,460) | $(98,847,308) | $(160,988,870) |
| Class M | | | | |
| Shares sold | 4,760,483 | 5,929,123 | $62,516,929 | $81,613,945 |
| Reinvestment of distributions | 2,344,315 | 1,564,174 | 29,405,054 | 21,368,634 |
| Shares redeemed | (7,737,157) | (9,968,053) | (101,425,179) | (137,166,621) |
| Net increase (decrease) | (632,359) | (2,474,756) | $(9,503,196) | $(34,184,042) |
| Class C | | | | |
| Shares sold | 811,582 | 948,078 | $10,584,311 | $12,932,083 |
| Reinvestment of distributions | 567,909 | 375,317 | 7,092,063 | 5,093,860 |
| Shares redeemed | (3,742,948) | (1,720,609) | (48,138,778) | (23,548,361) |
| Net increase (decrease) | (2,363,457) | (397,214) | $(30,462,404) | $(5,522,418) |
| Class I | | | | |
| Shares sold | 16,111,430 | 18,997,484 | $213,422,542 | $264,269,563 |
| Reinvestment of distributions | 5,400,494 | 3,388,242 | 68,110,509 | 46,653,405 |
| Shares redeemed | (18,792,750) | (19,661,892) | (248,342,793) | (273,240,745) |
| Net increase (decrease) | 2,719,174 | 2,723,834 | $33,190,258 | $37,682,223 |
| Class Z | | | | |
| Shares sold | 201,565 | – | $2,595,947 | $– |
| Reinvestment of distributions | 1,318 | – | 15,774 | – |
| Shares redeemed | (4,370) | – | (54,839) | – |
| Net increase (decrease) | 198,513 | – | $2,556,882 | $– |
| Class Z6 | | | | |
| Shares sold | 2,070,697 | 2,198,548 | $27,540,182 | $31,162,379 |
| Reinvestment of distributions | 272,668 | 11,033 | 3,417,063 | 153,133 |
| Shares redeemed | (949,502) | (99,389) | (12,545,730) | (1,386,209) |
| Net increase (decrease) | 1,393,863 | 2,110,192 | $18,411,515 | $29,929,303 |
| Advisor Freedom 2025 | | | | |
| Class A | | | | |
| Shares sold | 18,576,216 | 21,155,632 | $243,899,864 | $291,258,604 |
| Reinvestment of distributions | 8,991,273 | 5,553,494 | 112,666,699 | 75,773,123 |
| Shares redeemed | (31,708,950) | (36,469,562) | (417,958,164) | (500,742,895) |
| Net increase (decrease) | (4,141,461) | (9,760,436) | $(61,391,601) | $(133,711,168) |
| Class M | | | | |
| Shares sold | 6,367,361 | 7,381,740 | $83,840,691 | $101,335,661 |
| Reinvestment of distributions | 2,765,989 | 1,551,203 | 34,652,392 | 21,218,934 |
| Shares redeemed | (7,990,398) | (9,297,407) | (105,125,123) | (127,887,305) |
| Net increase (decrease) | 1,142,952 | (364,464) | $13,367,960 | $(5,332,710) |
| Class C | | | | |
| Shares sold | 751,967 | 1,054,413 | $9,756,669 | $14,230,748 |
| Reinvestment of distributions | 554,184 | 326,578 | 6,878,431 | 4,400,480 |
| Shares redeemed | (3,466,811) | (1,717,786) | (44,462,125) | (23,308,720) |
| Net increase (decrease) | (2,160,660) | (336,795) | $(27,827,025) | $(4,677,492) |
| Class I | | | | |
| Shares sold | 21,160,572 | 25,378,468 | $281,515,024 | $351,808,654 |
| Reinvestment of distributions | 6,845,479 | 3,774,323 | 86,240,671 | 51,976,785 |
| Shares redeemed | (21,285,533) | (21,969,142) | (283,862,119) | (304,482,920) |
| Net increase (decrease) | 6,720,518 | 7,183,649 | $83,893,576 | $99,302,519 |
| Class Z | | | | |
| Shares sold | 267,841 | – | $3,462,110 | $– |
| Reinvestment of distributions | 1,558 | – | 18,554 | – |
| Shares redeemed | (9,247) | – | (120,151) | – |
| Net increase (decrease) | 260,152 | – | $3,360,513 | $– |
| Class Z6 | | | | |
| Shares sold | 3,145,643 | 1,889,983 | $41,844,748 | $26,814,303 |
| Reinvestment of distributions | 292,525 | 12,099 | 3,639,110 | 168,542 |
| Shares redeemed | (948,177) | (102,569) | (12,605,127) | (1,434,592) |
| Net increase (decrease) | 2,489,991 | 1,799,513 | $32,878,731 | $25,548,253 |
| Advisor Freedom 2030 | | | | |
| Class A | | | | |
| Shares sold | 17,980,070 | 18,673,471 | $255,271,834 | $278,431,607 |
| Reinvestment of distributions | 8,905,505 | 5,074,757 | 120,053,170 | 75,068,077 |
| Shares redeemed | (27,387,212) | (31,998,170) | (390,712,550) | (475,713,945) |
| Net increase (decrease) | (501,637) | (8,249,942) | $(15,387,546) | $(122,214,261) |
| Class M | | | | |
| Shares sold | 6,524,933 | 6,811,790 | $92,422,241 | $100,640,388 |
| Reinvestment of distributions | 3,014,113 | 1,596,336 | 40,374,345 | 23,510,770 |
| Shares redeemed | (7,375,731) | (9,448,868) | (104,478,572) | (139,471,738) |
| Net increase (decrease) | 2,163,315 | (1,040,742) | $28,318,014 | $(15,320,580) |
| Class C | | | | |
| Shares sold | 961,504 | 964,743 | $13,418,893 | $14,139,943 |
| Reinvestment of distributions | 606,734 | 315,301 | 8,059,733 | 4,593,826 |
| Shares redeemed | (3,271,986) | (1,529,804) | (45,021,964) | (22,415,105) |
| Net increase (decrease) | (1,703,748) | (249,760) | $(23,543,338) | $(3,681,336) |
| Class I | | | | |
| Shares sold | 22,457,609 | 24,584,566 | $320,953,527 | $367,677,762 |
| Reinvestment of distributions | 7,225,475 | 3,663,231 | 97,542,752 | 54,563,348 |
| Shares redeemed | (20,355,587) | (20,246,824) | (292,815,292) | (302,278,371) |
| Net increase (decrease) | 9,327,497 | 8,000,973 | $125,680,987 | $119,962,739 |
| Class Z | | | | |
| Shares sold | 221,132 | – | $3,080,674 | $– |
| Reinvestment of distributions | 1,735 | – | 21,946 | – |
| Shares redeemed | (12,776) | – | (178,243) | – |
| Net increase (decrease) | 210,091 | – | $2,924,377 | $– |
| Class Z6 | | | | |
| Shares sold | 2,749,987 | 1,841,365 | $39,767,415 | $28,526,620 |
| Reinvestment of distributions | 336,470 | 14,449 | 4,480,080 | 218,332 |
| Shares redeemed | (569,263) | (68,960) | (8,126,381) | (1,049,203) |
| Net increase (decrease) | 2,517,194 | 1,786,854 | $36,121,114 | $27,695,749 |
| Advisor Freedom 2035 | | | | |
| Class A | | | | |
| Shares sold | 15,577,255 | 16,076,305 | $215,880,275 | $233,388,018 |
| Reinvestment of distributions | 7,931,975 | 3,857,946 | 103,250,766 | 55,595,824 |
| Shares redeemed | (21,845,142) | (28,095,944) | (304,538,618) | (406,790,784) |
| Net increase (decrease) | 1,664,088 | (8,161,693) | $14,592,423 | $(117,806,942) |
| Class M | | | | |
| Shares sold | 6,158,292 | 6,398,268 | $84,742,679 | $91,831,716 |
| Reinvestment of distributions | 2,758,614 | 1,206,444 | 35,538,297 | 17,272,407 |
| Shares redeemed | (6,770,016) | (7,462,512) | (92,881,274) | (106,846,943) |
| Net increase (decrease) | 2,146,890 | 142,200 | $27,399,702 | $2,257,180 |
| Class C | | | | |
| Shares sold | 661,692 | 693,842 | $8,898,073 | $9,794,664 |
| Reinvestment of distributions | 462,267 | 212,457 | 5,899,592 | 2,989,811 |
| Shares redeemed | (2,352,914) | (945,420) | (31,185,700) | (13,367,741) |
| Net increase (decrease) | (1,228,955) | (39,121) | $(16,388,035) | $(583,266) |
| Class I | | | | |
| Shares sold | 19,561,819 | 21,843,836 | $274,193,535 | $318,376,949 |
| Reinvestment of distributions | 6,540,915 | 2,892,062 | 85,477,034 | 42,049,701 |
| Shares redeemed | (18,631,854) | (16,207,972) | (262,614,157) | (235,522,368) |
| Net increase (decrease) | 7,470,880 | 8,527,926 | $97,056,412 | $124,904,282 |
| Class Z | | | | |
| Shares sold | 206,821 | – | $2,804,466 | $– |
| Reinvestment of distributions | 1,049 | – | 12,715 | – |
| Shares redeemed | (845) | – | (10,694) | – |
| Net increase (decrease) | 207,025 | – | $2,806,487 | $– |
| Class Z6 | | | | |
| Shares sold | 2,477,161 | 1,087,189 | $35,081,126 | $16,548,830 |
| Reinvestment of distributions | 279,162 | 7,787 | 3,580,829 | 115,481 |
| Shares redeemed | (509,353) | (24,549) | (7,047,594) | (369,912) |
| Net increase (decrease) | 2,246,970 | 1,070,427 | $31,614,361 | $16,294,399 |
| Advisor Freedom 2040 | | | | |
| Class A | | | | |
| Shares sold | 13,508,451 | 13,534,093 | $199,404,291 | $210,888,429 |
| Reinvestment of distributions | 6,486,862 | 3,189,871 | 90,120,681 | 49,256,170 |
| Shares redeemed | (17,392,234) | (22,500,034) | (259,736,681) | (348,416,945) |
| Net increase (decrease) | 2,603,079 | (5,776,070) | $29,788,291 | $(88,272,346) |
| Class M | | | | |
| Shares sold | 5,365,211 | 5,361,973 | $79,122,210 | $82,647,592 |
| Reinvestment of distributions | 2,447,376 | 1,095,300 | 33,775,381 | 16,854,754 |
| Shares redeemed | (5,123,803) | (6,875,453) | (76,072,511) | (106,016,831) |
| Net increase (decrease) | 2,688,784 | (418,180) | $36,825,080 | $(6,514,485) |
| Class C | | | | |
| Shares sold | 593,503 | 663,291 | $8,629,433 | $10,055,292 |
| Reinvestment of distributions | 563,167 | 263,236 | 7,669,773 | 3,975,590 |
| Shares redeemed | (2,861,996) | (987,718) | (40,626,069) | (15,051,497) |
| Net increase (decrease) | (1,705,326) | (61,191) | $(24,326,863) | $(1,020,615) |
| Class I | | | | |
| Shares sold | 16,023,155 | 18,668,939 | $239,554,969 | $291,013,150 |
| Reinvestment of distributions | 5,518,800 | 2,537,951 | 76,957,491 | 39,478,312 |
| Shares redeemed | (16,596,129) | (15,449,375) | (249,372,401) | (239,687,652) |
| Net increase (decrease) | 4,945,826 | 5,757,515 | $67,140,059 | $90,803,810 |
| Class Z | | | | |
| Shares sold | 114,448 | – | $1,663,715 | $– |
| Reinvestment of distributions | 2,846 | – | 36,681 | – |
| Shares redeemed | (14,163) | – | (199,531) | – |
| Net increase (decrease) | 103,131 | – | $1,500,865 | $– |
| Class Z6 | | | | |
| Shares sold | 2,108,972 | 794,020 | $32,016,553 | $12,962,617 |
| Reinvestment of distributions | 228,914 | 6,296 | 3,132,498 | 99,790 |
| Shares redeemed | (277,137) | (47,766) | (4,156,159) | (764,460) |
| Net increase (decrease) | 2,060,749 | 752,550 | $30,992,892 | $12,297,947 |
| Advisor Freedom 2045 | | | | |
| Class A | | | | |
| Shares sold | 12,635,987 | 13,727,303 | $146,031,787 | $165,419,383 |
| Reinvestment of distributions | 4,937,864 | 2,111,307 | 53,389,530 | 25,306,735 |
| Shares redeemed | (15,619,333) | (18,819,577) | (181,788,398) | (226,166,494) |
| Net increase (decrease) | 1,954,518 | (2,980,967) | $17,632,919 | $(35,440,376) |
| Class M | | | | |
| Shares sold | 4,970,917 | 5,337,435 | $56,988,809 | $63,538,185 |
| Reinvestment of distributions | 1,860,679 | 725,117 | 19,919,722 | 8,629,046 |
| Shares redeemed | (5,181,765) | (5,588,094) | (59,325,065) | (66,670,324) |
| Net increase (decrease) | 1,649,831 | 474,458 | $17,583,466 | $5,496,907 |
| Class C | | | | |
| Shares sold | 458,481 | 538,892 | $5,224,727 | $6,337,359 |
| Reinvestment of distributions | 268,698 | 100,141 | 2,852,475 | 1,176,826 |
| Shares redeemed | (984,683) | (569,666) | (10,921,440) | (6,680,355) |
| Net increase (decrease) | (257,504) | 69,367 | $(2,844,238) | $833,830 |
| Class I | | | | |
| Shares sold | 16,922,941 | 18,230,130 | $197,386,314 | $220,391,466 |
| Reinvestment of distributions | 4,868,513 | 1,909,984 | 52,766,313 | 23,065,247 |
| Shares redeemed | (15,394,337) | (13,073,999) | (179,991,531) | (157,647,342) |
| Net increase (decrease) | 6,397,117 | 7,066,115 | $70,161,096 | $85,809,371 |
| Class Z | | | | |
| Shares sold | 129,714 | – | $1,476,927 | $– |
| Reinvestment of distributions | 2,238 | – | 22,487 | – |
| Shares redeemed | (10,747) | – | (113,514) | – |
| Net increase (decrease) | 121,205 | – | $1,385,900 | $– |
| Class Z6 | | | | |
| Shares sold | 2,107,413 | 773,539 | $24,953,608 | $9,848,378 |
| Reinvestment of distributions | 224,047 | 5,348 | 2,383,471 | 66,053 |
| Shares redeemed | (308,731) | (36,784) | (3,617,281) | (463,616) |
| Net increase (decrease) | 2,022,729 | 742,103 | $23,719,798 | $9,450,815 |
| Advisor Freedom 2050 | | | | |
| Class A | | | | |
| Shares sold | 11,521,746 | 11,534,676 | $132,970,720 | $138,373,199 |
| Reinvestment of distributions | 3,597,274 | 1,468,363 | 38,813,519 | 17,545,962 |
| Shares redeemed | (12,570,491) | (14,017,700) | (146,649,559) | (167,648,735) |
| Net increase (decrease) | 2,548,529 | (1,014,661) | $25,134,680 | $(11,729,574) |
| Class M | | | | |
| Shares sold | 4,564,698 | 4,567,158 | $52,383,074 | $54,283,581 |
| Reinvestment of distributions | 1,479,768 | 548,964 | 15,848,909 | 6,528,163 |
| Shares redeemed | (4,414,543) | (4,589,984) | (50,603,396) | (54,563,744) |
| Net increase (decrease) | 1,629,923 | 526,138 | $17,628,587 | $6,248,000 |
| Class C | | | | |
| Shares sold | 475,264 | 549,763 | $5,411,651 | $6,479,431 |
| Reinvestment of distributions | 281,386 | 99,910 | 2,991,669 | 1,175,213 |
| Shares redeemed | (1,136,298) | (472,463) | (12,643,583) | (5,565,541) |
| Net increase (decrease) | (379,648) | 177,210 | $(4,240,263) | $2,089,103 |
| Class I | | | | |
| Shares sold | 15,773,850 | 15,917,116 | $183,903,268 | $191,830,629 |
| Reinvestment of distributions | 4,125,443 | 1,535,401 | 44,635,052 | 18,474,731 |
| Shares redeemed | (15,152,813) | (11,055,908) | (176,066,479) | (132,614,886) |
| Net increase (decrease) | 4,746,480 | 6,396,609 | $52,471,841 | $77,690,474 |
| Class Z | | | | |
| Shares sold | 55,866 | – | $642,437 | $– |
| Reinvestment of distributions | 1,864 | – | 18,714 | – |
| Shares redeemed | (378) | – | (4,188) | – |
| Net increase (decrease) | 57,352 | – | $656,963 | $– |
| Class Z6 | | | | |
| Shares sold | 1,578,089 | 472,741 | $18,585,296 | $5,954,232 |
| Reinvestment of distributions | 154,167 | 4,315 | 1,636,405 | 53,115 |
| Shares redeemed | (249,597) | (34,945) | (2,887,741) | (435,038) |
| Net increase (decrease) | 1,482,659 | 442,111 | $17,333,960 | $5,572,309 |
| Advisor Freedom 2055 | | | | |
| Class A | | | | |
| Shares sold | 7,405,861 | 7,389,570 | $94,792,637 | $97,025,975 |
| Reinvestment of distributions | 1,417,723 | 464,392 | 16,974,227 | 6,094,883 |
| Shares redeemed | (7,631,599) | (6,137,615) | (98,796,720) | (80,819,354) |
| Net increase (decrease) | 1,191,985 | 1,716,347 | $12,970,144 | $22,301,504 |
| Class M | | | | |
| Shares sold | 2,614,120 | 2,572,643 | $33,190,301 | $33,545,253 |
| Reinvestment of distributions | 538,926 | 162,770 | 6,411,358 | 2,128,319 |
| Shares redeemed | (1,939,650) | (2,024,835) | (24,671,431) | (26,432,101) |
| Net increase (decrease) | 1,213,396 | 710,578 | $14,930,228 | $9,241,471 |
| Class C | | | | |
| Shares sold | 271,244 | 234,550 | $3,412,171 | $3,032,224 |
| Reinvestment of distributions | 76,657 | 21,409 | 910,546 | 278,373 |
| Shares redeemed | (270,006) | (154,192) | (3,363,512) | (2,007,723) |
| Net increase (decrease) | 77,895 | 101,767 | $959,205 | $1,302,874 |
| Class I | | | | |
| Shares sold | 12,655,914 | 9,490,266 | $163,216,802 | $125,145,410 |
| Reinvestment of distributions | 1,969,656 | 575,059 | 23,537,468 | 7,595,782 |
| Shares redeemed | (8,801,212) | (5,026,424) | (111,998,695) | (66,081,707) |
| Net increase (decrease) | 5,824,358 | 5,038,901 | $74,755,575 | $66,659,485 |
| Class Z | | | | |
| Shares sold | 35,699 | – | $454,001 | $– |
| Reinvestment of distributions | 1,022 | – | 11,382 | – |
| Shares redeemed | (2,703) | – | (33,886) | – |
| Net increase (decrease) | 34,018 | – | $431,497 | $– |
| Class Z6 | | | | |
| Shares sold | 861,230 | 249,882 | $11,149,348 | $3,376,620 |
| Reinvestment of distributions | 67,158 | 3,421 | 786,682 | 46,150 |
| Shares redeemed | (133,007) | (21,021) | (1,709,322) | (287,425) |
| Net increase (decrease) | 795,381 | 232,282 | $10,226,708 | $3,135,345 |
| Advisor Freedom 2060 | | | | |
| Class A | | | | |
| Shares sold | 3,282,040 | 2,518,107 | $37,368,210 | $29,318,657 |
| Reinvestment of distributions | 299,518 | 69,940 | 3,182,787 | 818,159 |
| Shares redeemed | (1,847,915) | (1,111,272) | (21,083,392) | (13,053,777) |
| Net increase (decrease) | 1,733,643 | 1,476,775 | $19,467,605 | $17,083,039 |
| Class M | | | | |
| Shares sold | 1,171,715 | 853,066 | $13,350,367 | $9,913,922 |
| Reinvestment of distributions | 102,745 | 22,158 | 1,092,888 | 259,519 |
| Shares redeemed | (651,352) | (341,132) | (7,395,540) | (4,020,381) |
| Net increase (decrease) | 623,108 | 534,092 | $7,047,715 | $6,153,060 |
| Class C | | | | |
| Shares sold | 200,839 | 143,405 | $2,286,734 | $1,675,744 |
| Reinvestment of distributions | 20,307 | 3,926 | 216,263 | 46,030 |
| Shares redeemed | (110,667) | (39,845) | (1,249,222) | (460,687) |
| Net increase (decrease) | 110,479 | 107,486 | $1,253,775 | $1,261,087 |
| Class I | | | | |
| Shares sold | 4,677,855 | 2,852,854 | $53,503,953 | $33,462,097 |
| Reinvestment of distributions | 369,553 | 78,919 | 3,936,080 | 927,618 |
| Shares redeemed | (2,677,596) | (957,855) | (30,477,647) | (11,278,135) |
| Net increase (decrease) | 2,369,812 | 1,973,918 | $26,962,386 | $23,111,580 |
| Class Z | | | | |
| Shares sold | 24,691 | – | $283,518 | $– |
| Reinvestment of distributions | 665 | – | 6,659 | – |
| Shares redeemed | (297) | – | (3,251) | – |
| Net increase (decrease) | 25,059 | – | $286,926 | $– |
| Class Z6 | | | | |
| Shares sold | 222,835 | 137,048 | $2,572,083 | $1,670,098 |
| Reinvestment of distributions | 13,174 | 901 | 139,481 | 10,783 |
| Shares redeemed | (83,912) | (70,553) | (973,912) | (867,591) |
| Net increase (decrease) | 152,097 | 67,396 | $1,737,652 | $813,290 |
(a) Share transactions for Class Z are for the period October 2, 2018 (commencement of sale of shares) to March 31, 2019.
(b) Share transactions for Class Z6 are for the period June 6, 2017 (commencement of sale of shares) to March 31, 2018.
10. Other.
The Funds' organizational documents provide former and current trustees and officers with a limited indemnification against liabilities arising in connection with the performance of their duties to the Funds. In the normal course of business, the Funds may also enter into contracts that provide general indemnifications. The Funds' maximum exposure under these arrangements is unknown as this would be dependent on future claims that may be made against the Funds. The risk of material loss from such claims is considered remote.
The Funds do not invest in the Underlying Funds for the purpose of exercising management or control; however, investments by the Funds within their principal investment strategies may represent a significant portion of the Underlying Fund's net assets. At the end of the period, the following Funds were the owners of record of 10% or more of the total outstanding shares of the Underlying Funds.
| Fund | Fidelity Advisor Freedom 2025 Fund | Fidelity Advisor Freedom 2030 Fund | Fidelity Advisor Freedom 2035 Fund | Fidelity Advisor Freedom 2040 Fund | Fidelity Advisor Freedom 2045 Fund |
| Fidelity Advisor Series Equity Growth Fund | 13% | 16% | 16% | 16% | 10% |
| Fidelity Advisor Series Growth Opportunities Fund | 13% | 16% | 16% | 16% | 11% |
| Fidelity Advisor Series Small Cap Fund | 13% | 17% | 16% | 16% | 10% |
The Funds, in aggregate, were the owners of record of more than 20% of the total outstanding shares of the following Underlying Funds.
| Fund | % of shares held |
| Fidelity Advisor Series Equity Growth Fund | 100% |
| Fidelity Advisor Series Growth Opportunities Fund | 100% |
| Fidelity Advisor Series Small Cap Fund | 100% |
Report of Independent Registered Public Accounting Firm
To the Board of Trustees of Fidelity Aberdeen Street Trust and the Shareholders of Fidelity Advisor Freedom Income Fund, Fidelity Advisor Freedom 2005 Fund, Fidelity Advisor Freedom 2010 Fund, Fidelity Advisor Freedom 2015 Fund, Fidelity Advisor Freedom 2020 Fund, Fidelity Advisor Freedom 2025 Fund, Fidelity Advisor Freedom 2030 Fund, Fidelity Advisor Freedom 2035 Fund, Fidelity Advisor Freedom 2040 Fund, Fidelity Advisor Freedom 2045 Fund, Fidelity Advisor Freedom 2050 Fund, Fidelity Advisor Freedom 2055 Fund and Fidelity Advisor Freedom 2060 Fund:
Opinion on the Financial Statements and Financial Highlights
We have audited the accompanying statements of assets and liabilities of Fidelity Advisor Freedom Income Fund, Fidelity Advisor Freedom 2005 Fund, Fidelity Advisor Freedom 2010 Fund, Fidelity Advisor Freedom 2015 Fund, Fidelity Advisor Freedom 2020 Fund, Fidelity Advisor Freedom 2025 Fund, Fidelity Advisor Freedom 2030 Fund, Fidelity Advisor Freedom 2035 Fund, Fidelity Advisor Freedom 2040 Fund, Fidelity Advisor Freedom 2045 Fund, Fidelity Advisor Freedom 2050 Fund, Fidelity Advisor Freedom 2055 Fund and Fidelity Advisor Freedom 2060 Fund (the "Funds"), each a fund of Fidelity Aberdeen Street Trust, including the schedules of investments, as of March 31, 2019, the related statements of operations for the year then ended, the statements of changes in net assets for each of the two years in the period then ended, the financial highlights for each of the five years in the period then ended for the Funds, except Fidelity Advisor Freedom 2060 Fund; the related statement of operations for the year then ended, the statement of changes in net assets for each of the two years in the period then ended, and the financial highlights for each of the four years in the period then ended and for the period from August 5, 2014 to March 31, 2015 for the Fidelity Advisor Freedom 2060 Fund; and the related notes. In our opinion, the financial statements and financial highlights present fairly, in all material respects, the financial position of each of the Funds as of March 31, 2019, and the results of their operations for the year then ended, the changes in their net assets for each of the two years in the period then ended, and the financial highlights for each of the five years in the period then ended (or for the period mentioned above), in conformity with accounting principles generally accepted in the United States of America.
Basis for Opinion
These financial statements and financial highlights are the responsibility of the Funds' management. Our responsibility is to express an opinion on the Funds' financial statements and financial highlights based on our audits. We are a public accounting firm registered with the Public Company Accounting Oversight Board (United States) (PCAOB) and are required to be independent with respect to the Funds in accordance with the U.S. federal securities laws and the applicable rules and regulations of the Securities and Exchange Commission and the PCAOB.
We conducted our audits in accordance with the standards of the PCAOB. Those standards require that we plan and perform the audit to obtain reasonable assurance about whether the financial statements and financial highlights are free of material misstatement, whether due to error or fraud. The Funds are not required to have, nor were we engaged to perform, an audit of their internal control over financial reporting. As part of our audits we are required to obtain an understanding of internal control over financial reporting but not for the purpose of expressing an opinion on the effectiveness of the Funds' internal control over financial reporting. Accordingly, we express no such opinion.
Our audits included performing procedures to assess the risks of material misstatement of the financial statements and financial highlights, whether due to error or fraud, and performing procedures that respond to those risks. Such procedures included examining, on a test basis, evidence regarding the amounts and disclosures in the financial statements and financial highlights. Our audits also included evaluating the accounting principles used and significant estimates made by management, as well as evaluating the overall presentation of the financial statements and financial highlights. Our procedures included confirmation of securities owned as of March 31, 2019, by correspondence with the custodians and brokers; when replies were not received from brokers, we performed other auditing procedures. We believe that our audits provide a reasonable basis for our opinion.
/s/ Deloitte & Touche LLP
Boston, Massachusetts
May 16, 2019
We have served as the auditor of one or more of the Fidelity investment companies since 1999.
Trustees and Officers
The Trustees, Members of the Advisory Board (if any), and officers of the trust and funds, as applicable, are listed below. The Board of Trustees governs each fund and is responsible for protecting the interests of shareholders. The Trustees are experienced executives who meet periodically throughout the year to oversee each fund's activities, review contractual arrangements with companies that provide services to each fund, oversee management of the risks associated with such activities and contractual arrangements, and review each fund's performance. If the interests of a fund and an underlying Fidelity® fund were to diverge, a conflict of interest could arise and affect how the Trustees and Members of the Advisory Board fulfill their fiduciary duties to the affected funds. FMRC has structured the funds to avoid these potential conflicts, although there may be situations where a conflict of interest is unavoidable. In such instances, FMRC, the Trustees, and Members of the Advisory Board would take reasonable steps to minimize and, if possible, eliminate the conflict. Each of the Trustees oversees 264 funds.
The Trustees hold office without limit in time except that (a) any Trustee may resign; (b) any Trustee may be removed by written instrument, signed by at least two-thirds of the number of Trustees prior to such removal; (c) any Trustee who requests to be retired or who has become incapacitated by illness or injury may be retired by written instrument signed by a majority of the other Trustees; and (d) any Trustee may be removed at any special meeting of shareholders by a two-thirds vote of the outstanding voting securities of the trust. Each Trustee who is not an interested person (as defined in the 1940 Act) of the trust and the funds is referred to herein as an Independent Trustee. Each Independent Trustee shall retire not later than the last day of the calendar year in which his or her 75th birthday occurs. The Independent Trustees may waive this mandatory retirement age policy with respect to individual Trustees. Officers and Advisory Board Members hold office without limit in time, except that any officer or Advisory Board Member may resign or may be removed by a vote of a majority of the Trustees at any regular meeting or any special meeting of the Trustees. Except as indicated, each individual has held the office shown or other offices in the same company for the past five years.
Each fund’s Statement of Additional Information (SAI) includes more information about the Trustees. To request a free copy, call Fidelity at 1-877-208-0098.
Experience, Skills, Attributes, and Qualifications of the Trustees. The Governance and Nominating Committee has adopted a statement of policy that describes the experience, qualifications, attributes, and skills that are necessary and desirable for potential Independent Trustee candidates (Statement of Policy). The Board believes that each Trustee satisfied at the time he or she was initially elected or appointed a Trustee, and continues to satisfy, the standards contemplated by the Statement of Policy. The Governance and Nominating Committee also engages professional search firms to help identify potential Independent Trustee candidates who have the experience, qualifications, attributes, and skills consistent with the Statement of Policy. From time to time, additional criteria based on the composition and skills of the current Independent Trustees, as well as experience or skills that may be appropriate in light of future changes to board composition, business conditions, and regulatory or other developments, have also been considered by the professional search firms and the Governance and Nominating Committee. In addition, the Board takes into account the Trustees' commitment and participation in Board and committee meetings, as well as their leadership of standing and ad hoc committees throughout their tenure.
In determining that a particular Trustee was and continues to be qualified to serve as a Trustee, the Board has considered a variety of criteria, none of which, in isolation, was controlling. The Board believes that, collectively, the Trustees have balanced and diverse experience, qualifications, attributes, and skills, which allow the Board to operate effectively in governing each fund and protecting the interests of shareholders. Information about the specific experience, skills, attributes, and qualifications of each Trustee, which in each case led to the Board's conclusion that the Trustee should serve (or continue to serve) as a trustee of the funds, is provided below.
Board Structure and Oversight Function. Abigail P. Johnson is an interested person and currently serves as Chairman. The Trustees have determined that an interested Chairman is appropriate and benefits shareholders because an interested Chairman has a personal and professional stake in the quality and continuity of services provided to the funds. Independent Trustees exercise their informed business judgment to appoint an individual of their choosing to serve as Chairman, regardless of whether the Trustee happens to be independent or a member of management. The Independent Trustees have determined that they can act independently and effectively without having an Independent Trustee serve as Chairman and that a key structural component for assuring that they are in a position to do so is for the Independent Trustees to constitute a substantial majority for the Board. The Independent Trustees also regularly meet in executive session. Arthur E. Johnson serves as Chairman of the Independent Trustees and as such (i) acts as a liaison between the Independent Trustees and management with respect to matters important to the Independent Trustees and (ii) with management prepares agendas for Board meetings.
Fidelity® funds are overseen by different Boards of Trustees. The funds' Board oversees Fidelity's investment-grade bond, money market, asset allocation and certain equity funds, and other Boards oversee Fidelity's high income and other equity funds. The asset allocation funds may invest in Fidelity® funds that are overseen by such other Boards. The use of separate Boards, each with its own committee structure, allows the Trustees of each group of Fidelity® funds to focus on the unique issues of the funds they oversee, including common research, investment, and operational issues. On occasion, the separate Boards establish joint committees to address issues of overlapping consequences for the Fidelity® funds overseen by each Board.
The Trustees operate using a system of committees to facilitate the timely and efficient consideration of all matters of importance to the Trustees, each fund, and fund shareholders and to facilitate compliance with legal and regulatory requirements and oversight of the funds' activities and associated risks. The Board, acting through its committees, has charged FMR and its affiliates with (i) identifying events or circumstances the occurrence of which could have demonstrably adverse effects on the funds' business and/or reputation; (ii) implementing processes and controls to lessen the possibility that such events or circumstances occur or to mitigate the effects of such events or circumstances if they do occur; and (iii) creating and maintaining a system designed to evaluate continuously business and market conditions in order to facilitate the identification and implementation processes described in (i) and (ii) above. Because the day-to-day operations and activities of the funds are carried out by or through FMR, its affiliates, and other service providers, the funds' exposure to risks is mitigated but not eliminated by the processes overseen by the Trustees. While each of the Board's committees has responsibility for overseeing different aspects of the funds' activities, oversight is exercised primarily through the Operations and Audit Committees. In addition, an ad hoc Board committee of Independent Trustees has worked with FMR to enhance the Board's oversight of investment and financial risks, legal and regulatory risks, technology risks, and operational risks, including the development of additional risk reporting to the Board. Appropriate personnel, including but not limited to the funds' Chief Compliance Officer (CCO), FMR's internal auditor, the independent accountants, the funds' Treasurer and portfolio management personnel, make periodic reports to the Board's committees, as appropriate, including an annual review of Fidelity's risk management program for the Fidelity® funds. The responsibilities of each standing committee, including their oversight responsibilities, are described further under "Standing Committees of the Trustees."
Interested Trustees*:
Correspondence intended for a Trustee who is an interested person may be sent to Fidelity Investments, 245 Summer Street, Boston, Massachusetts 02210.
Name, Year of Birth; Principal Occupations and Other Relevant Experience+
Abigail P. Johnson (1961)
Year of Election or Appointment: 2009
Trustee
Chairman of the Board of Trustees
Ms. Johnson also serves as Trustee of other Fidelity® funds. Ms. Johnson serves as Chairman (2016-present), Chief Executive Officer (2014-present), and Director (2007-present) of FMR LLC (diversified financial services company), President of Fidelity Financial Services (2012-present) and President of Personal, Workplace and Institutional Services (2005-present). Ms. Johnson is Chairman and Director of FMR Co., Inc. (investment adviser firm, 2011-present) and Chairman and Director of FMR (investment adviser firm, 2011-present). Previously, Ms. Johnson served as Vice Chairman (2007-2016) and President (2013-2016) of FMR LLC, President and a Director of FMR (2001-2005), a Trustee of other investment companies advised by FMR, Fidelity Investments Money Management, Inc. (investment adviser firm), and FMR Co., Inc. (2001-2005), Senior Vice President of the Fidelity® funds (2001-2005), and managed a number of Fidelity® funds. Ms. Abigail P. Johnson and Mr. Arthur E. Johnson are not related.
Jennifer Toolin McAuliffe (1959)
Year of Election or Appointment: 2016
Trustee
Ms. McAuliffe also serves as Trustee of other Fidelity® funds. Ms. McAuliffe previously served as a Member of the Advisory Board of certain Fidelity® funds (2016) and as Co-Head of Fixed Income of Fidelity Investments Limited (now known as FIL Limited (FIL)) (diversified financial services company). Earlier roles at FIL included Director of Research for FIL’s credit and quantitative teams in London, Hong Kong and Tokyo. Ms. McAuliffe also was the Director of Research for taxable and municipal bonds at Fidelity Investments Money Management, Inc. Ms. McAuliffe is also a director or trustee of several not-for-profit entities.
* Determined to be an “Interested Trustee” by virtue of, among other things, his or her affiliation with the trust or various entities under common control with FMR.
+ The information includes the Trustee's principal occupation during the last five years and other information relating to the experience, attributes, and skills relevant to the Trustee's qualifications to serve as a Trustee, which led to the conclusion that the Trustee should serve as a Trustee for each fund.
Independent Trustees:
Correspondence intended for an Independent Trustee may be sent to Fidelity Investments, P.O. Box 55235, Boston, Massachusetts 02205-5235.
Name, Year of Birth; Principal Occupations and Other Relevant Experience+
Elizabeth S. Acton (1951)
Year of Election or Appointment: 2013
Trustee
Ms. Acton also serves as Trustee of other Fidelity® funds. Prior to her retirement in April 2012, Ms. Acton was Executive Vice President, Finance (2011-2012), Executive Vice President, Chief Financial Officer (2002-2011), and Treasurer (2004-2005) of Comerica Incorporated (financial services). Prior to joining Comerica, Ms. Acton held a variety of positions at Ford Motor Company (1983-2002), including Vice President and Treasurer (2000-2002) and Executive Vice President and Chief Financial Officer of Ford Motor Credit Company (1998-2000). Ms. Acton currently serves as a member of the Board of Directors and Audit and Finance Committees of Beazer Homes USA, Inc. (homebuilding, 2012-present). Previously, Ms. Acton served as a Member of the Advisory Board of certain Fidelity® funds (2013-2016).
Ann E. Dunwoody (1953)
Year of Election or Appointment: 2018
Trustee
General Dunwoody also serves as Trustee of other Fidelity® funds. General Dunwoody (United States Army, Retired) was the first woman in U.S. military history to achieve the rank of four-star general and prior to her retirement in 2012 held a variety of positions within the U.S. Army, including Commanding General, U.S. Army Material Command (2008-2012). She is the President of First to Four LLC (leadership and mentoring services, 2012-present). She also serves as a member of the Board of Directors and Nominating and Corporate Governance Committee of L3 Technologies, Inc. (communication, electronic, sensor, and aerospace systems, 2013-present), Board of Directors and Nomination and Corporate Governance Committees of Kforce Inc. (professional staffing services, 2016-present) and Board of Directors of Automattic Inc. (software engineering, 2018-present). Previously, General Dunwoody served as a Member of the Advisory Board of certain Fidelity® funds (2018), a member of the Board of Directors and Audit and Sustainability and Corporate Responsibility Committees of Republic Services, Inc. (waste collection, disposal and recycling, 2013-2016). Ms. Dunwoody also serves on several boards for non-profit organizations, including as a member of the Board of Directors, Chair of the Nomination and Governance Committee and member of the Audit Committee of Logistics Management Institute (consulting non-profit, 2012-present), a member of the Board of Directors of the Army Historical Foundation (2015-present), a member of the Council of Trustees for the Association of the United States Army (advocacy non-profit, 2013-present) and a member of the Board of Trustees of Florida Institute of Technology (2015-present) and ThanksUSA (military family education non-profit, 2014-present).
John Engler (1948)
Year of Election or Appointment: 2014
Trustee
Mr. Engler also serves as Trustee of other Fidelity® funds. He serves on the board of directors for Universal Forest Products (manufacturer and distributor of wood and wood-alternative products, 2003-present) and K12 Inc. (technology-based education company, 2012-present). Previously, Mr. Engler served as interim president of Michigan State University (2018-2019), a Member of the Advisory Board of certain Fidelity® funds (2014-2016), president of the Business Roundtable (2011-2017), a trustee of The Munder Funds (2003-2014), president and CEO of the National Association of Manufacturers (2004-2011), member of the Board of Trustees of the Annie E. Casey Foundation (2004-2015), and as governor of Michigan (1991-2003). He is a past chairman of the National Governors Association.
Robert F. Gartland (1951)
Year of Election or Appointment: 2010
Trustee
Mr. Gartland also serves as Trustee of other Fidelity® funds. Mr. Gartland is Chairman and an investor in Gartland & Mellina Group Corp. (consulting, 2009-present). Previously, Mr. Gartland served as a partner and investor of Vietnam Partners LLC (investments and consulting, 2008-2011). Prior to his retirement, Mr. Gartland held a variety of positions at Morgan Stanley (financial services, 1979-2007), including Managing Director (1987-2007), and Chase Manhattan Bank (1975-1978).
Arthur E. Johnson (1947)
Year of Election or Appointment: 2008
Trustee
Chairman of the Independent Trustees
Mr. Johnson also serves as Trustee of other Fidelity® funds. Mr. Johnson serves as a member of the Board of Directors of Eaton Corporation plc (diversified power management, 2009-present) and Booz Allen Hamilton (management consulting, 2011-present). Prior to his retirement, Mr. Johnson served as Senior Vice President of Corporate Strategic Development of Lockheed Martin Corporation (defense contractor, 1999-2009). Mr. Johnson previously served as Vice Chairman (2015-2018) of the Independent Trustees of certain Fidelity® funds and on the Board of Directors of IKON Office Solutions, Inc. (1999-2008), AGL Resources, Inc. (holding company, 2002-2016), and Delta Airlines (2005-2007). Mr. Arthur E. Johnson is not related to Ms. Abigail P. Johnson.
Michael E. Kenneally (1954)
Year of Election or Appointment: 2009
Trustee
Vice Chairman of the Independent Trustees
Mr. Kenneally also serves as Trustee of other Fidelity® funds. Prior to his retirement, Mr. Kenneally served as Chairman and Global Chief Executive Officer of Credit Suisse Asset Management. Before joining Credit Suisse, he was an Executive Vice President and Chief Investment Officer for Bank of America Corporation. Earlier roles at Bank of America included Director of Research, Senior Portfolio Manager and Research Analyst, and Mr. Kenneally was awarded the Chartered Financial Analyst (CFA) designation in 1991.
Marie L. Knowles (1946)
Year of Election or Appointment: 2001
Trustee
Ms. Knowles also serves as Trustee of other Fidelity® funds. Prior to Ms. Knowles' retirement in June 2000, she served as Executive Vice President and Chief Financial Officer of Atlantic Richfield Company (ARCO) (diversified energy, 1996-2000). From 1993 to 1996, she was a Senior Vice President of ARCO and President of ARCO Transportation Company (pipeline and tanker operations). Ms. Knowles currently serves as a Director and Chairman of the Audit Committee of McKesson Corporation (healthcare service, since 2002). Ms. Knowles is a member of the Board of the Santa Catalina Island Company (real estate, 2009-present). Ms. Knowles is a Member of the Investment Company Institute Board of Governors and a Member of the Governing Council of the Independent Directors Council (2014-present). She also serves as a member of the Advisory Board for the School of Engineering of the University of Southern California. Previously, Ms. Knowles served as a Director of Phelps Dodge Corporation (copper mining and manufacturing, 1994-2007), URS Corporation (engineering and construction, 2000-2003) and America West (airline, 1999-2002). Ms. Knowles previously served as Chairman (2015-2018) and Vice Chairman (2012-2015) of the Independent Trustees of certain Fidelity® funds.
Mark A. Murray (1954)
Year of Election or Appointment: 2016
Trustee
Mr. Murray also serves as Trustee of other Fidelity® funds. Mr. Murray is Vice Chairman (2013-present) of Meijer, Inc. (regional retail chain). Previously, Mr. Murray served as a Member of the Advisory Board of certain Fidelity® funds (2016) and as Co-Chief Executive Officer (2013-2016) and President (2006-2013) of Meijer, Inc. Mr. Murray serves as a member of the Board of Directors and Nuclear Review and Public Policy and Responsibility Committees of DTE Energy Company (diversified energy company, 2009-present). Mr. Murray also serves as a member of the Board of Directors of Spectrum Health (not-for-profit health system, 2015-present). Mr. Murray previously served as President of Grand Valley State University (2001-2006), Treasurer for the State of Michigan (1999-2001), Vice President of Finance and Administration for Michigan State University (1998-1999), and a member of the Board of Directors and Audit Committee and Chairman of the Nominating and Corporate Governance Committee of Universal Forest Products, Inc. (manufacturer and distributor of wood and wood-alternative products, 2004-2016). Mr. Murray is also a director or trustee of many community and professional organizations.
+ The information includes the Trustee's principal occupation during the last five years and other information relating to the experience, attributes, and skills relevant to the Trustee's qualifications to serve as a Trustee, which led to the conclusion that the Trustee should serve as a Trustee for each fund.
Advisory Board Members and Officers:
Correspondence intended for an officer may be sent to Fidelity Investments, 245 Summer Street, Boston, Massachusetts 02210. Officers appear below in alphabetical order.
Name, Year of Birth; Principal Occupation
Elizabeth Paige Baumann (1968)
Year of Election or Appointment: 2017
Anti-Money Laundering (AML) Officer
Ms. Baumann also serves as AML Officer of other funds. She is Chief AML Officer (2012-present) and Senior Vice President (2014-present) of FMR LLC (diversified financial services company) and is an employee of Fidelity Investments. Previously, Ms. Baumann served as AML Officer of the funds (2012-2016), and Vice President (2007-2014) and Deputy Anti-Money Laundering Officer (2007-2012) of FMR LLC.
Craig S. Brown (1977)
Year of Election or Appointment: 2019
Assistant Treasurer
Mr. Brown also serves as Assistant Treasurer of other funds. Mr. Brown is an employee of Fidelity Investments (2013-present).
John J. Burke III (1964)
Year of Election or Appointment: 2018
Chief Financial Officer
Mr. Burke also serves as Chief Financial Officer of other funds. Mr. Burke serves as Head of Investment Operations for Fidelity Fund and Investment Operations (2018-present) and is an employee of Fidelity Investments (1998-present). Previously Mr. Burke served as head of Asset Management Investment Operations (2012-2018).
William C. Coffey (1969)
Year of Election or Appointment: 2018
Secretary and Chief Legal Officer (CLO)
Mr. Coffey also serves as Secretary and CLO of other funds. Mr. Coffey serves as CLO, Secretary, and Senior Vice President of Fidelity Management & Research Company and FMR Co., Inc. (investment adviser firms, 2018-present); Secretary of Fidelity SelectCo, LLC and Fidelity Investments Money Management, Inc. (investment adviser firms, 2018-present); and CLO of Fidelity Management & Research (Hong Kong) Limited, FMR Investment Management (UK) Limited, and Fidelity Management & Research (Japan) Limited (investment adviser firms, 2018-present). He is Senior Vice President and Deputy General Counsel of FMR LLC (diversified financial services company, 2010-present), and is an employee of Fidelity Investments. Previously, Mr. Coffey served as Assistant Secretary of certain funds (2009-2018) and as Vice President and Associate General Counsel of FMR LLC (2005-2009).
Jonathan Davis (1968)
Year of Election or Appointment: 2010
Assistant Treasurer
Mr. Davis also serves as Assistant Treasurer of other funds. Mr. Davis serves as Assistant Treasurer of FMR Capital, Inc. (2017-present) and is an employee of Fidelity Investments. Previously, Mr. Davis served as Vice President and Associate General Counsel of FMR LLC (diversified financial services company, 2003-2010).
Adrien E. Deberghes (1967)
Year of Election or Appointment: 2010
Assistant Treasurer
Mr. Deberghes also serves as an officer of other funds. He serves as Assistant Treasurer of FMR Capital, Inc. (2017-present), Executive Vice President of Fidelity Investments Money Management, Inc. (FIMM) (investment adviser firm, 2016-present), and is an employee of Fidelity Investments (2008-present). Previously, Mr. Deberghes served as President and Treasurer of certain Fidelity® funds (2013-2018). Prior to joining Fidelity Investments, Mr. Deberghes was Senior Vice President of Mutual Fund Administration at State Street Corporation (2007-2008), Senior Director of Mutual Fund Administration at Investors Bank & Trust (2005-2007), and Director of Finance for Dunkin' Brands (2000-2005). Previously, Mr. Deberghes served in other fund officer roles.
Laura M. Del Prato (1964)
Year of Election or Appointment: 2018
President and Treasurer
Ms. Del Prato also serves as an officer of other funds. Ms. Del Prato is an employee of Fidelity Investments (2017-present). Prior to joining Fidelity Investments, Ms. Del Prato served as a Managing Director and Treasurer of the JPMorgan Mutual Funds (2014-2017). Prior to JPMorgan, Ms. Del Prato served as a partner at Cohen Fund Audit Services (accounting firm, 2012-2013) and KPMG LLP (accounting firm, 2004-2012).
Colm A. Hogan (1973)
Year of Election or Appointment: 2016
Assistant Treasurer
Mr. Hogan also serves as an officer of other funds. Mr. Hogan serves as Assistant Treasurer of FMR Capital, Inc. (2017-present) and is an employee of Fidelity Investments (2005-present). Previously, Mr. Hogan served as Assistant Treasurer of certain Fidelity® funds (2016-2018).
Chris Maher (1972)
Year of Election or Appointment: 2013
Assistant Treasurer
Mr. Maher serves as Assistant Treasurer of other funds. Mr. Maher is Vice President of Valuation Oversight, serves as Assistant Treasurer of FMR Capital, Inc. (2017-present), and is an employee of Fidelity Investments. Previously, Mr. Maher served as Vice President of Asset Management Compliance (2013), Vice President of the Program Management Group of FMR (investment adviser firm, 2010-2013), and Vice President of Valuation Oversight (2008-2010).
John B. McGinty, Jr. (1962)
Year of Election or Appointment: 2016
Chief Compliance Officer
Mr. McGinty also serves as Chief Compliance Officer of other funds. Mr. McGinty is Senior Vice President of Asset Management Compliance for Fidelity Investments and is an employee of Fidelity Investments (2016-present). Mr. McGinty previously served as Vice President, Senior Attorney at Eaton Vance Management (investment management firm, 2015-2016), and prior to Eaton Vance as global CCO for all firm operations and registered investment companies at GMO LLC (investment management firm, 2009-2015). Before joining GMO LLC, Mr. McGinty served as Senior Vice President, Deputy General Counsel for Fidelity Investments (2007-2009).
Jason P. Pogorelec (1975)
Year of Election or Appointment: 2015
Assistant Secretary
Mr. Pogorelec also serves as Assistant Secretary of other funds. Mr. Pogorelec serves as Vice President, Associate General Counsel (2010-present) and is an employee of Fidelity Investments (2006-present).
Nancy D. Prior (1967)
Year of Election or Appointment: 2014
Vice President
Ms. Prior also serves as Vice President of other funds. Ms. Prior serves as President Fixed Income, High Income/Emerging Market Debt and Multi Asset Class Strategies of FIAM LLC (2018-present), President (2016-present) and Director (2014-present) of Fidelity Investments Money Management, Inc. (FIMM) (investment adviser firm), President, Fixed Income (2014-present), and is an employee of Fidelity Investments (2002-present). Previously, Ms. Prior served as Vice Chairman of FIAM LLC (investment adviser firm, 2014-2018), a Director of FMR Investment Management (UK) Limited (investment adviser firm, 2015-2018), President Multi-Asset Class Strategies of FMR's Global Asset Allocation Division (2017-2018), Vice President of Fidelity's Money Market Funds (2012-2014), President, Money Market and Short Duration Bond Group of Fidelity Management & Research (FMR) (investment adviser firm, 2013-2014), President, Money Market Group of FMR (2011-2013), Managing Director of Research (2009-2011), Senior Vice President and Deputy General Counsel (2007-2009), and Assistant Secretary of certain Fidelity® funds (2008-2009).
Stacie M. Smith (1974)
Year of Election or Appointment: 2013
Assistant Treasurer
Ms. Smith also serves as an officer of other funds. Ms. Smith serves as Assistant Treasurer of FMR Capital, Inc. (2017-present), is an employee of Fidelity Investments (2009-present), and has served in other fund officer roles. Prior to joining Fidelity Investments, Ms. Smith served as Senior Audit Manager of Ernst & Young LLP (accounting firm, 1996-2009). Previously, Ms. Smith served as Assistant Treasurer (2013-2018) and Deputy Treasurer (2013-2016) of certain Fidelity® funds.
Marc L. Spector (1972)
Year of Election or Appointment: 2016
Deputy Treasurer
Mr. Spector also serves as an officer of other funds. Mr. Spector serves as Assistant Treasurer of FMR Capital, Inc. (2017-present) and is an employee of Fidelity Investments (2016-present). Prior to joining Fidelity Investments, Mr. Spector served as Director at the Siegfried Group (accounting firm, 2013-2016), and prior to Siegfried Group as audit senior manager at Deloitte & Touche (accounting firm, 2005-2013).
Jim Wegmann (1979)
Year of Election or Appointment: 2019
Assistant Treasurer
Mr. Wegmann also serves as Assistant Treasurer of other funds. Mr. Wegmann is an employee of Fidelity Investments (2011-present).
Shareholder Expense Example
As a shareholder of the Fund, you incur two types of costs: (1) transaction costs, including sales charges (loads) on purchase payments or redemption proceeds, and (2) ongoing costs, including distribution and/or service (12b-1) fees and other Fund expenses. This Example is intended to help you understand your ongoing costs (in dollars) of investing in the Fund and to compare these costs with the ongoing costs of investing in other mutual funds.
The actual expense Example is based on an investment of $1,000 invested at the beginning of the period and held for the entire period (October 1, 2018 to March 31, 2019) for Class A, Class M, Class C, Class I and Class Z6 and for the period (October 2, 2018 to March 31, 2019) for Class Z. The hypothetical expense Example is based on an investment of $1,000 invested for the one-half year period (October 1, 2018 to March 31, 2019).
Actual Expenses
The first line of the accompanying table for each Class of each fund provides information about actual account values and actual expenses. You may use the information in this line, together with the amount you invested, to estimate the expenses that you paid over the period. Simply divide your account value by $1,000.00 (for example, an $8,600 account value divided by $1,000.00 = 8.6), then multiply the result by the number in the first line for a Class of the fund under the heading entitled "Expenses Paid During Period" to estimate the expenses you paid on your account during this period. In addition, each Fund, as a shareholder in underlying Fidelity Funds, will indirectly bear its pro-rata share of the fees and expenses incurred by the underlying Fidelity Funds. These fees and expenses are not included in each Fund's annualized expense ratio used to calculate the expense estimates in the table below.
Hypothetical Example for Comparison Purposes
The second line of the accompanying table for each Class of each fund provides information about hypothetical account values and hypothetical expenses based on a Class' actual expense ratio and an assumed rate of return of 5% per year before expenses, which is not the Class' actual return. The hypothetical account values and expenses may not be used to estimate the actual ending account balance or expenses you paid for the period. You may use this information to compare the ongoing costs of investing in the Fund and other funds. To do so, compare this 5% hypothetical example with the 5% hypothetical examples that appear in the shareholder reports of the other funds. In addition, each Fund, as a shareholder in underlying Fidelity Funds, will indirectly bear its pro-rata share of the fees and expenses incurred by the underlying Fidelity Funds. These fees and expenses are not included in each Fund's annualized expense ratio used to calculate the expense estimates in the table below.
Please note that the expenses shown in the table are meant to highlight your ongoing costs only and do not reflect any transaction costs. Therefore, the second line of the table is useful in comparing ongoing costs only, and will not help you determine the relative total costs of owning different funds. In addition, if these transactional costs were included, your costs would have been higher.
| | Annualized Expense Ratio-A | Beginning
Account Value | Ending
Account Value
March 31, 2019 | Expenses Paid
During Period |
| Advisor Freedom Income | | | | |
| Class A | .71% | | | |
| Actual | | $1,000.00 | $1,022.80 | $3.58-B |
| Hypothetical-C | | $1,000.00 | $1,021.39 | $3.58-D |
| Class M | .96% | | | |
| Actual | | $1,000.00 | $1,020.60 | $4.84-B |
| Hypothetical-C | | $1,000.00 | $1,020.14 | $4.84-D |
| Class C | 1.47% | | | |
| Actual | | $1,000.00 | $1,018.80 | $7.40-B |
| Hypothetical-C | | $1,000.00 | $1,017.60 | $7.39-D |
| Class I | .46% | | | |
| Actual | | $1,000.00 | $1,023.90 | $2.32-B |
| Hypothetical-C | | $1,000.00 | $1,022.64 | $2.32-D |
| Class Z | .42% | | | |
| Actual | | $1,000.00 | $1,024.70 | $2.11-B |
| Hypothetical-C | | $1,000.00 | $1,022.84 | $2.12-D |
| Class Z6 | .37% | | | |
| Actual | | $1,000.00 | $1,024.70 | $1.87-B |
| Hypothetical-C | | $1,000.00 | $1,023.09 | $1.87-D |
| Advisor Freedom 2005 | | | | |
| Class A | .73% | | | |
| Actual | | $1,000.00 | $1,018.40 | $3.67-B |
| Hypothetical-C | | $1,000.00 | $1,021.29 | $3.68-D |
| Class M | .98% | | | |
| Actual | | $1,000.00 | $1,017.40 | $4.93-B |
| Hypothetical-C | | $1,000.00 | $1,020.04 | $4.94-D |
| Class C | 1.48% | | | |
| Actual | | $1,000.00 | $1,014.80 | $7.43-B |
| Hypothetical-C | | $1,000.00 | $1,017.55 | $7.44-D |
| Class I | .48% | | | |
| Actual | | $1,000.00 | $1,019.90 | $2.42-B |
| Hypothetical-C | | $1,000.00 | $1,022.54 | $2.42-D |
| Class Z | .43% | | | |
| Actual | | $1,000.00 | $1,020.00 | $2.15-B |
| Hypothetical-C | | $1,000.00 | $1,022.79 | $2.17-D |
| Class Z6 | .37% | | | |
| Actual | | $1,000.00 | $1,020.10 | $1.86-B |
| Hypothetical-C | | $1,000.00 | $1,023.09 | $1.87-D |
| Advisor Freedom 2010 | | | | |
| Class A | .77% | | | |
| Actual | | $1,000.00 | $1,014.00 | $3.87-B |
| Hypothetical-C | | $1,000.00 | $1,021.09 | $3.88-D |
| Class M | 1.02% | | | |
| Actual | | $1,000.00 | $1,013.30 | $5.12-B |
| Hypothetical-C | | $1,000.00 | $1,019.85 | $5.14-D |
| Class C | 1.52% | | | |
| Actual | | $1,000.00 | $1,010.20 | $7.62-B |
| Hypothetical-C | | $1,000.00 | $1,017.35 | $7.64-D |
| Class I | .52% | | | |
| Actual | | $1,000.00 | $1,015.50 | $2.61-B |
| Hypothetical-C | | $1,000.00 | $1,022.34 | $2.62-D |
| Class Z | .47% | | | |
| Actual | | $1,000.00 | $1,016.50 | $2.35-B |
| Hypothetical-C | | $1,000.00 | $1,022.59 | $2.37-D |
| Class Z6 | .39% | | | |
| Actual | | $1,000.00 | $1,016.50 | $1.96-B |
| Hypothetical-C | | $1,000.00 | $1,022.99 | $1.97-D |
| Advisor Freedom 2015 | | | | |
| Class A | .82% | | | |
| Actual | | $1,000.00 | $1,009.00 | $4.11-B |
| Hypothetical-C | | $1,000.00 | $1,020.84 | $4.13-D |
| Class M | 1.07% | | | |
| Actual | | $1,000.00 | $1,008.00 | $5.36-B |
| Hypothetical-C | | $1,000.00 | $1,019.60 | $5.39-D |
| Class C | 1.57% | | | |
| Actual | | $1,000.00 | $1,005.90 | $7.85-B |
| Hypothetical-C | | $1,000.00 | $1,017.10 | $7.90-D |
| Class I | .57% | | | |
| Actual | | $1,000.00 | $1,010.50 | $2.86-B |
| Hypothetical-C | | $1,000.00 | $1,022.09 | $2.87-D |
| Class Z | .51% | | | |
| Actual | | $1,000.00 | $1,012.90 | $2.55-B |
| Hypothetical-C | | $1,000.00 | $1,022.39 | $2.57-D |
| Class Z6 | .41% | | | |
| Actual | | $1,000.00 | $1,012.30 | $2.06-B |
| Hypothetical-C | | $1,000.00 | $1,022.89 | $2.07-D |
| Advisor Freedom 2020 | | | | |
| Class A | .86% | | | |
| Actual | | $1,000.00 | $1,006.40 | $4.30-B |
| Hypothetical-C | | $1,000.00 | $1,020.64 | $4.33-D |
| Class M | 1.11% | | | |
| Actual | | $1,000.00 | $1,004.60 | $5.55-B |
| Hypothetical-C | | $1,000.00 | $1,019.40 | $5.59-D |
| Class C | 1.61% | | | |
| Actual | | $1,000.00 | $1,002.20 | $8.04-B |
| Hypothetical-C | | $1,000.00 | $1,016.90 | $8.10-D |
| Class I | .61% | | | |
| Actual | | $1,000.00 | $1,007.30 | $3.05-B |
| Hypothetical-C | | $1,000.00 | $1,021.89 | $3.07-D |
| Class Z | .54% | | | |
| Actual | | $1,000.00 | $1,009.10 | $2.69-B |
| Hypothetical-C | | $1,000.00 | $1,022.24 | $2.72-D |
| Class Z6 | .43% | | | |
| Actual | | $1,000.00 | $1,007.80 | $2.15-B |
| Hypothetical-C | | $1,000.00 | $1,022.79 | $2.17-D |
| Advisor Freedom 2025 | | | | |
| Class A | .90% | | | |
| Actual | | $1,000.00 | $1,002.00 | $4.49-B |
| Hypothetical-C | | $1,000.00 | $1,020.44 | $4.53-D |
| Class M | 1.15% | | | |
| Actual | | $1,000.00 | $1,001.00 | $5.74-B |
| Hypothetical-C | | $1,000.00 | $1,019.20 | $5.79-D |
| Class C | 1.65% | | | |
| Actual | | $1,000.00 | $998.70 | $8.22-B |
| Hypothetical-C | | $1,000.00 | $1,016.70 | $8.30-D |
| Class I | .65% | | | |
| Actual | | $1,000.00 | $1,003.60 | $3.25-B |
| Hypothetical-C | | $1,000.00 | $1,021.69 | $3.28-D |
| Class Z | .57% | | | |
| Actual | | $1,000.00 | $1,005.60 | $2.83-B |
| Hypothetical-C | | $1,000.00 | $1,022.09 | $2.87-D |
| Class Z6 | .45% | | | |
| Actual | | $1,000.00 | $1,004.70 | $2.25-B |
| Hypothetical-C | | $1,000.00 | $1,022.69 | $2.27-D |
| Advisor Freedom 2030 | | | | |
| Class A | .94% | | | |
| Actual | | $1,000.00 | $995.60 | $4.68-B |
| Hypothetical-C | | $1,000.00 | $1,020.24 | $4.73-D |
| Class M | 1.19% | | | |
| Actual | | $1,000.00 | $993.70 | $5.92-B |
| Hypothetical-C | | $1,000.00 | $1,019.00 | $5.99-D |
| Class C | 1.69% | | | |
| Actual | | $1,000.00 | $991.30 | $8.39-B |
| Hypothetical-C | | $1,000.00 | $1,016.50 | $8.50-D |
| Class I | .69% | | | |
| Actual | | $1,000.00 | $996.70 | $3.43-B |
| Hypothetical-C | | $1,000.00 | $1,021.49 | $3.48-D |
| Class Z | .60% | | | |
| Actual | | $1,000.00 | $999.10 | $2.97-B |
| Hypothetical-C | | $1,000.00 | $1,021.94 | $3.02-D |
| Class Z6 | .47% | | | |
| Actual | | $1,000.00 | $997.30 | $2.34-B |
| Hypothetical-C | | $1,000.00 | $1,022.59 | $2.37-D |
| Advisor Freedom 2035 | | | | |
| Class A | .99% | | | |
| Actual | | $1,000.00 | $985.30 | $4.90-B |
| Hypothetical-C | | $1,000.00 | $1,020.00 | $4.99-D |
| Class M | 1.24% | | | |
| Actual | | $1,000.00 | $984.10 | $6.13-B |
| Hypothetical-C | | $1,000.00 | $1,018.75 | $6.24-D |
| Class C | 1.73% | | | |
| Actual | | $1,000.00 | $982.00 | $8.55-B |
| Hypothetical-C | | $1,000.00 | $1,016.31 | $8.70-D |
| Class I | .74% | | | |
| Actual | | $1,000.00 | $987.00 | $3.67-B |
| Hypothetical-C | | $1,000.00 | $1,021.24 | $3.73-D |
| Class Z | .63% | | | |
| Actual | | $1,000.00 | $990.40 | $3.11-B |
| Hypothetical-C | | $1,000.00 | $1,021.79 | $3.18-D |
| Class Z6 | .49% | | | |
| Actual | | $1,000.00 | $988.00 | $2.43-B |
| Hypothetical-C | | $1,000.00 | $1,022.49 | $2.47-D |
| Advisor Freedom 2040 | | | | |
| Class A | .99% | | | |
| Actual | | $1,000.00 | $981.60 | $4.89-B |
| Hypothetical-C | | $1,000.00 | $1,020.00 | $4.99-D |
| Class M | 1.25% | | | |
| Actual | | $1,000.00 | $980.50 | $6.17-B |
| Hypothetical-C | | $1,000.00 | $1,018.70 | $6.29-D |
| Class C | 1.74% | | | |
| Actual | | $1,000.00 | $978.50 | $8.58-B |
| Hypothetical-C | | $1,000.00 | $1,016.26 | $8.75-D |
| Class I | .75% | | | |
| Actual | | $1,000.00 | $983.30 | $3.71-B |
| Hypothetical-C | | $1,000.00 | $1,021.19 | $3.78-D |
| Class Z | .65% | | | |
| Actual | | $1,000.00 | $987.00 | $3.20-B |
| Hypothetical-C | | $1,000.00 | $1,021.69 | $3.28-D |
| Class Z6 | .49% | | | |
| Actual | | $1,000.00 | $985.10 | $2.43-B |
| Hypothetical-C | | $1,000.00 | $1,022.49 | $2.47-D |
| Advisor Freedom 2045 | | | | |
| Class A | .99% | | | |
| Actual | | $1,000.00 | $982.80 | $4.89-B |
| Hypothetical-C | | $1,000.00 | $1,020.00 | $4.99-D |
| Class M | 1.24% | | | |
| Actual | | $1,000.00 | $980.80 | $6.12-B |
| Hypothetical-C | | $1,000.00 | $1,018.75 | $6.24-D |
| Class C | 1.74% | | | |
| Actual | | $1,000.00 | $978.70 | $8.58-B |
| Hypothetical-C | | $1,000.00 | $1,016.26 | $8.75-D |
| Class I | .75% | | | |
| Actual | | $1,000.00 | $983.60 | $3.71-B |
| Hypothetical-C | | $1,000.00 | $1,021.19 | $3.78-D |
| Class Z | .64% | | | |
| Actual | | $1,000.00 | $986.70 | $3.15-B |
| Hypothetical-C | | $1,000.00 | $1,021.74 | $3.23-D |
| Class Z6 | .49% | | | |
| Actual | | $1,000.00 | $984.30 | $2.42-B |
| Hypothetical-C | | $1,000.00 | $1,022.49 | $2.47-D |
| Advisor Freedom 2050 | | | | |
| Class A | .99% | | | |
| Actual | | $1,000.00 | $981.80 | $4.89-B |
| Hypothetical-C | | $1,000.00 | $1,020.00 | $4.99-D |
| Class M | 1.24% | | | |
| Actual | | $1,000.00 | $980.70 | $6.12-B |
| Hypothetical-C | | $1,000.00 | $1,018.75 | $6.24-D |
| Class C | 1.74% | | | |
| Actual | | $1,000.00 | $978.70 | $8.58-B |
| Hypothetical-C | | $1,000.00 | $1,016.26 | $8.75-D |
| Class I | .75% | | | |
| Actual | | $1,000.00 | $983.40 | $3.71-B |
| Hypothetical-C | | $1,000.00 | $1,021.19 | $3.78-D |
| Class Z | .65% | | | |
| Actual | | $1,000.00 | $986.60 | $3.20-B |
| Hypothetical-C | | $1,000.00 | $1,021.69 | $3.28-D |
| Class Z6 | .49% | | | |
| Actual | | $1,000.00 | $984.10 | $2.42-B |
| Hypothetical-C | | $1,000.00 | $1,022.49 | $2.47-D |
| Advisor Freedom 2055 | | | | |
| Class A | .99% | | | |
| Actual | | $1,000.00 | $982.10 | $4.89-B |
| Hypothetical-C | | $1,000.00 | $1,020.00 | $4.99-D |
| Class M | 1.25% | | | |
| Actual | | $1,000.00 | $981.20 | $6.17-B |
| Hypothetical-C | | $1,000.00 | $1,018.70 | $6.29-D |
| Class C | 1.74% | | | |
| Actual | | $1,000.00 | $978.70 | $8.58-B |
| Hypothetical-C | | $1,000.00 | $1,016.26 | $8.75-D |
| Class I | .75% | | | |
| Actual | | $1,000.00 | $983.30 | $3.71-B |
| Hypothetical-C | | $1,000.00 | $1,021.19 | $3.78-D |
| Class Z | .65% | | | |
| Actual | | $1,000.00 | $986.50 | $3.20-B |
| Hypothetical-C | | $1,000.00 | $1,021.69 | $3.28-D |
| Class Z6 | .49% | | | |
| Actual | | $1,000.00 | $984.90 | $2.42-B |
| Hypothetical-C | | $1,000.00 | $1,022.49 | $2.47-D |
| Advisor Freedom 2060 | | | | |
| Class A | 1.00% | | | |
| Actual | | $1,000.00 | $982.30 | $4.94-B |
| Hypothetical-C | | $1,000.00 | $1,019.95 | $5.04-D |
| Class M | 1.25% | | | |
| Actual | | $1,000.00 | $980.50 | $6.17-B |
| Hypothetical-C | | $1,000.00 | $1,018.70 | $6.29-D |
| Class C | 1.75% | | | |
| Actual | | $1,000.00 | $978.30 | $8.63-B |
| Hypothetical-C | | $1,000.00 | $1,016.21 | $8.80-D |
| Class I | .75% | | | |
| Actual | | $1,000.00 | $983.50 | $3.71-B |
| Hypothetical-C | | $1,000.00 | $1,021.19 | $3.78-D |
| Class Z | .65% | | | |
| Actual | | $1,000.00 | $986.60 | $3.20-B |
| Hypothetical-C | | $1,000.00 | $1,021.69 | $3.28-D |
| Class Z6 | .49% | | | |
| Actual | | $1,000.00 | $985.10 | $2.43-B |
| Hypothetical-C | | $1,000.00 | $1,022.49 | $2.47-D |
A Annualized expense ratio reflects expenses net of applicable fee waivers.
B Actual expenses are equal to each Class' annualized expense ratio, multiplied by the average account value over the period, multiplied by 182/365 (to reflect the one-half year period) for Class A, Class M, Class C, Class I and Class Z6 and multiplied by 181/365 (to reflect the period October 2, 2018 to March 31, 2019) for Class Z.
C 5% return per year before expenses
D Hypothetical expenses are equal to each Class' annualized expense ratio, multiplied by the average account value over the period, multiplied by 182/365 (to reflect the one-half year period)
Distributions (Unaudited)
The Board of Trustees of each fund voted to pay to shareholders of record at the opening of business on record date, the following distributions per share derived from capital gains realized from sales of portfolio securities and dividends derived from net investment income:
| | Pay Date | Record Date | Dividends | Capital Gains |
| Fidelity Advisor Freedom Income Fund | | | | |
| Class A | 05/06/19 | 05/03/19 | $0.012 | $0.097 |
| Class M | 05/06/19 | 05/03/19 | $0.010 | $0.097 |
| Class C | 05/06/19 | 05/03/19 | $0.004 | $0.097 |
| Class I | 05/06/19 | 05/03/19 | $0.014 | $0.097 |
| Class Z | 05/06/19 | 05/03/19 | $0.014 | $0.097 |
| Class Z6 | 05/06/19 | 05/03/19 | $0.015 | $0.097 |
| Fidelity Advisor Freedom 2005 Fund | | | | |
| Class A | 05/13/19 | 05/10/19 | $0.032 | $0.149 |
| Class M | 05/13/19 | 05/10/19 | $0.024 | $0.149 |
| Class C | 05/13/19 | 05/10/19 | $0.000 | $0.149 |
| Class I | 05/13/19 | 05/10/19 | $0.038 | $0.149 |
| Class Z | 05/13/19 | 05/10/19 | $0.051 | $0.149 |
| Class Z6 | 05/13/19 | 05/10/19 | $0.042 | $0.149 |
| Fidelity Advisor Freedom 2010 Fund | | | | |
| Class A | 05/13/19 | 05/10/19 | $0.027 | $0.238 |
| Class M | 05/13/19 | 05/10/19 | $0.019 | $0.238 |
| Class C | 05/13/19 | 05/10/19 | $0.000 | $0.238 |
| Class I | 05/13/19 | 05/10/19 | $0.034 | $0.238 |
| Class Z | 05/13/19 | 05/10/19 | $0.048 | $0.238 |
| Class Z6 | 05/13/19 | 05/10/19 | $0.039 | $0.238 |
| Fidelity Advisor Freedom 2015 Fund | | | | |
| Class A | 05/13/19 | 05/10/19 | $0.019 | $0.310 |
| Class M | 05/13/19 | 05/10/19 | $0.011 | $0.310 |
| Class C | 05/13/19 | 05/10/19 | $0.000 | $0.310 |
| Class I | 05/13/19 | 05/10/19 | $0.025 | $0.310 |
| Class Z | 05/13/19 | 05/10/19 | $0.039 | $0.310 |
| Class Z6 | 05/13/19 | 05/10/19 | $0.031 | $0.310 |
| Fidelity Advisor Freedom 2020 Fund | | | | |
| Class A | 05/13/19 | 05/10/19 | $0.011 | $0.401 |
| Class M | 05/13/19 | 05/10/19 | $0.003 | $0.401 |
| Class C | 05/13/19 | 05/10/19 | $0.000 | $0.401 |
| Class I | 05/13/19 | 05/10/19 | $0.018 | $0.401 |
| Class Z | 05/13/19 | 05/10/19 | $0.037 | $0.401 |
| Class Z6 | 05/13/19 | 05/10/19 | $0.026 | $0.401 |
| Fidelity Advisor Freedom 2025 Fund | | | | |
| Class A | 05/13/19 | 05/10/19 | $0.004 | $0.453 |
| Class M | 05/13/19 | 05/10/19 | $0.000 | $0.449 |
| Class C | 05/13/19 | 05/10/19 | $0.000 | $0.445 |
| Class I | 05/13/19 | 05/10/19 | $0.011 | $0.453 |
| Class Z | 05/13/19 | 05/10/19 | $0.030 | $0.453 |
| Class Z6 | 05/13/19 | 05/10/19 | $0.020 | $0.453 |
| Fidelity Advisor Freedom 2030 Fund | | | | |
| Class A | 05/13/19 | 05/10/19 | $0.000 | $0.582 |
| Class M | 05/13/19 | 05/10/19 | $0.000 | $0.576 |
| Class C | 05/13/19 | 05/10/19 | $0.000 | $0.576 |
| Class I | 05/13/19 | 05/10/19 | $0.000 | $0.590 |
| Class Z | 05/13/19 | 05/10/19 | $0.000 | $0.612 |
| Class Z6 | 05/13/19 | 05/10/19 | $0.000 | $0.600 |
| Fidelity Advisor Freedom 2035 Fund | | | | |
| Class A | 05/13/19 | 05/10/19 | $0.000 | $0.650 |
| Class M | 05/13/19 | 05/10/19 | $0.000 | $0.644 |
| Class C | 05/13/19 | 05/10/19 | $0.000 | $0.644 |
| Class I | 05/13/19 | 05/10/19 | $0.000 | $0.658 |
| Class Z | 05/13/19 | 05/10/19 | $0.000 | $0.680 |
| Class Z6 | 05/13/19 | 05/10/19 | $0.000 | $0.668 |
| Fidelity Advisor Freedom 2040 Fund | | | | |
| Class A | 05/13/19 | 05/10/19 | $0.000 | $0.726 |
| Class M | 05/13/19 | 05/10/19 | $0.000 | $0.720 |
| Class C | 05/13/19 | 05/10/19 | $0.000 | $0.720 |
| Class I | 05/13/19 | 05/10/19 | $0.000 | $0.734 |
| Class Z | 05/13/19 | 05/10/19 | $0.000 | $0.756 |
| Class Z6 | 05/13/19 | 05/10/19 | $0.000 | $0.746 |
| Fidelity Advisor Freedom 2045 Fund | | | | |
| Class A | 05/13/19 | 05/10/19 | $0.000 | $0.558 |
| Class M | 05/13/19 | 05/10/19 | $0.000 | $0.553 |
| Class C | 05/13/19 | 05/10/19 | $0.000 | $0.553 |
| Class I | 05/13/19 | 05/10/19 | $0.000 | $0.565 |
| Class Z | 05/13/19 | 05/10/19 | $0.000 | $0.581 |
| Class Z6 | 05/13/19 | 05/10/19 | $0.000 | $0.573 |
| Fidelity Advisor Freedom 2050 Fund | | | | |
| Class A | 05/13/19 | 05/10/19 | $0.000 | $0.557 |
| Class M | 05/13/19 | 05/10/19 | $0.000 | $0.548 |
| Class C | 05/13/19 | 05/10/19 | $0.000 | $0.548 |
| Class I | 05/13/19 | 05/10/19 | $0.000 | $0.563 |
| Class Z | 05/13/19 | 05/10/19 | $0.000 | $0.575 |
| Class Z6 | 05/13/19 | 05/10/19 | $0.000 | $0.571 |
| Fidelity Advisor Freedom 2055 Fund | | | | |
| Class A | 05/13/19 | 05/10/19 | $0.000 | $0.597 |
| Class M | 05/13/19 | 05/10/19 | $0.000 | $0.590 |
| Class C | 05/13/19 | 05/10/19 | $0.000 | $0.587 |
| Class I | 05/13/19 | 05/10/19 | $0.000 | $0.604 |
| Class Z | 05/13/19 | 05/10/19 | $0.000 | $0.622 |
| Class Z6 | 05/13/19 | 05/10/19 | $0.000 | $0.613 |
| Fidelity Advisor Freedom 2060 Fund | | | | |
| Class A | 05/13/19 | 05/10/19 | $0.000 | $0.488 |
| Class M | 05/13/19 | 05/10/19 | $0.000 | $0.481 |
| Class C | 05/13/19 | 05/10/19 | $0.000 | $0.477 |
| Class I | 05/13/19 | 05/10/19 | $0.000 | $0.494 |
| Class Z | 05/13/19 | 05/10/19 | $0.000 | $0.500 |
| Class Z6 | 05/13/19 | 05/10/19 | $0.000 | $0.500 |
|
The funds hereby designate as capital gain dividend the amounts noted below for the taxable year ended March 31, 2019, or, if subsequently determined to be different, the net capital gain of such year.
| Fidelity Advisor Freedom Income Fund | $5,686,514 |
| Fidelity Advisor Freedom 2005 Fund | $6,964,619 |
| Fidelity Advisor Freedom 2010 Fund | $21,326,124 |
| Fidelity Advisor Freedom 2015 Fund | $59,930,858 |
| Fidelity Advisor Freedom 2020 Fund | $132,867,679 |
| Fidelity Advisor Freedom 2025 Fund | $175,855,012 |
| Fidelity Advisor Freedom 2030 Fund | $210,951,656 |
| Fidelity Advisor Freedom 2035 Fund | $196,084,414 |
| Fidelity Advisor Freedom 2040 Fund | $182,822,000 |
| Fidelity Advisor Freedom 2045 Fund | $116,180,802 |
| Fidelity Advisor Freedom 2050 Fund�� | $93,214,862 |
| Fidelity Advisor Freedom 2055 Fund | $46,180,741 |
| Fidelity Advisor Freedom 2060 Fund | $9,430,408 |
|
A percentage of the dividends distributed during the fiscal year for the following funds were derived from interest on U.S. Government securities which is generally exempt from state income tax:
| Fidelity Advisor Freedom Income Fund | |
| Class A | 16.30% |
| Class M | 16.30% |
| Class C | 16.30% |
| Class I | 16.30% |
| Class Z | 16.30% |
| Class Z6 | 16.30% |
| Fidelity Advisor Freedom 2005 Fund | |
| Class A | 12.71% |
| Class M | 12.71% |
| Class C | 12.71% |
| Class I | 12.71% |
| Class Z | 12.71% |
| Class Z6 | 12.71% |
| Fidelity Advisor Freedom 2010 Fund | |
| Class A | 11.90% |
| Class M | 11.90% |
| Class C | 11.90% |
| Class I | 11.90% |
| Class Z | 11.90% |
| Class Z6 | 11.90% |
| Fidelity Advisor Freedom 2015 Fund | |
| Class A | 7.94% |
| Class M | 7.94% |
| Class C | 7.94% |
| Class I | 7.94% |
| Class Z | 7.94% |
| Class Z6 | 7.94% |
| Fidelity Advisor Freedom 2020 Fund | |
| Class A | 6.46% |
| Class M | 6.46% |
| Class C | 6.46% |
| Class I | 6.46% |
| Class Z | 6.46% |
| Class Z6 | 6.46% |
| Fidelity Advisor Freedom 2025 Fund | |
| Class A | 5.56% |
| Class M | 5.56% |
| Class C | 5.56% |
| Class I | 5.56% |
| Class Z | 5.56% |
| Class Z6 | 5.56% |
| Fidelity Advisor Freedom 2030 Fund | |
| Class A | 4.90% |
| Class M | 4.90% |
| Class C | 4.90% |
| Class I | 4.90% |
| Class Z | 4.90% |
| Class Z6 | 4.90% |
| Fidelity Advisor Freedom 2035 Fund | |
| Class A | 2.15% |
| Class M | 2.15% |
| Class C | 2.15% |
| Class I | 2.15% |
| Class Z | 2.15% |
| Class Z6 | 2.15% |
| Fidelity Advisor Freedom 2040 Fund | |
| Class A | 1.60% |
| Class M | 1.60% |
| Class C | 1.60% |
| Class I | 1.60% |
| Class Z | 1.60% |
| Class Z6 | 1.60% |
| Fidelity Advisor Freedom 2045 Fund | |
| Class A | 2.08% |
| Class M | 2.08% |
| Class C | 2.08% |
| Class I | 2.08% |
| Class Z | 2.08% |
| Class Z6 | 2.08% |
| Fidelity Advisor Freedom 2050 Fund | |
| Class A | 2.08% |
| Class M | 2.08% |
| Class C | 2.08% |
| Class I | 2.08% |
| Class Z | 2.08% |
| Class Z6 | 2.08% |
| Fidelity Advisor Freedom 2055 Fund | |
| Class A | 1.62% |
| Class M | 1.62% |
| Class C | 1.62% |
| Class I | 1.62% |
| Class Z | 1.62% |
| Class Z6 | 1.62% |
| Fidelity Advisor Freedom 2060 Fund | |
| Class A | 1.59% |
| Class C | 1.59% |
| Class I | 1.59% |
| Class M | 1.59% |
| Class Z | 1.59% |
| Class Z6 | 1.59% |
|
A percentage of the dividends distributed during the fiscal year for the following funds qualify for the dividends–received deduction for corporate shareholders:
| | Class A | Class M | Class C | Class I | Class Z | Class Z6 |
| Fidelity Advisor Freedom Income Fund | | | | | | |
| April 2018 | 0% | 0% | 0% | 0% | N/A | 0% |
| May 2018 | 3% | 3% | 4% | 2% | N/A | 2% |
| June 2018 | 6% | 9% | 22% | 5% | N/A | 4% |
| July 2018 | 6% | 8% | 19% | 5% | N/A | 4% |
| August 2018 | 6% | 8% | 14% | 5% | N/A | 5% |
| September 2018 | 6% | 8% | 19% | 5% | N/A | 5% |
| October 2018 | 6% | 7% | 10% | 6% | 6% | 5% |
| November 2018 | 6% | 7% | 13% | 5% | 4% | 5% |
| December 2018 | 6% | 7% | 7% | 6% | 6% | 6% |
| February 2019 | 1% | 1% | 2% | 1% | 1% | 1% |
| March 2019 | 1% | 1% | 3% | 1% | 1% | 1% |
| Fidelity Advisor Freedom 2005 Fund | | | | | | |
| May 2018 | 2% | 3% | 4% | 2% | N/A | 1% |
| December 2018 | 10% | 11% | 14% | 9% | 8% | 9% |
| Fidelity Advisor Freedom 2010 Fund | | | | | | |
| May 2018 | 3% | 4% | 10% | 2% | N/A | 2% |
| December 2018 | 14% | 15% | 21% | 12% | 11% | 12% |
| Fidelity Advisor Freedom 2015 Fund | | | | | | |
| May 2018 | 4% | 6% | 14% | 3% | N/A | 3% |
| December 2018 | 17% | 18% | 23% | 15% | 13% | 14% |
| Fidelity Advisor Freedom 2020 Fund | | | | | | |
| May 2018 | 6% | 9% | – | 5% | N/A | 4% |
| December 2018 | 19% | 20% | 26% | 17% | 15% | 16% |
| Fidelity Advisor Freedom 2025 Fund | | | | | | |
| May 2018 | 10% | 18% | – | 7% | N/A | 5% |
| December 2018 | 24% | 26% | 34% | 22% | 19% | 20% |
| Fidelity Advisor Freedom 2030 Fund | | | | | | |
| May 2018 | 15% | 31% | – | 9% | N/A | 6% |
| December 2018 | 29% | 31% | 39% | 26% | 22% | 26% |
| Fidelity Advisor Freedom 2035 Fund | | | | | | |
| December 2018 | 32% | 34% | 45% | 29% | 24% | 26% |
| Fidelity Advisor Freedom 2040 Fund | | | | | | |
| December 2018 | 32% | 35% | 44% | 29% | 25% | 26% |
| Fidelity Advisor Freedom 2045 Fund | | | | | | |
| December 2018 | 36% | 39% | 48% | 33% | 27% | 29% |
| Fidelity Advisor Freedom 2050 Fund | | | | | | |
| December 2018 | 34% | 37% | 46% | 31% | 26% | 28% |
| Fidelity Advisor Freedom 2055 Fund | | | | | | |
| December 2018 | 35% | 38% | 46% | 32% | 27% | 28% |
| Fidelity Advisor Freedom 2060 Fund | | | | | | |
| December 2018 | 34% | 36% | 43% | 31% | 27% | 28% |
|
A percentage of the dividends distributed during the fiscal year for the following funds may be taken into account as a dividend for purposes of the maximum rate under section 1(h)(11) of the Internal Revenue Code.
| | Class A | Class M | Class C | Class I | Class Z | Class Z6 |
| Fidelity Advisor Freedom Income Fund | | | | | | |
| April 2018 | 0% | 0% | 0% | 0% | N/A | 0% |
| May 2018 | 9% | 10% | 14% | 8% | N/A | 7% |
| June 2018 | 19% | 26% | 64% | 15% | N/A | 13% |
| July 2018 | 19% | 25% | 56% | 15% | N/A | 13% |
| August 2018 | 19% | 23% | 40% | 16% | N/A | 15% |
| September 2018 | 19% | 25% | 56% | 15% | N/A | 14% |
| October 2018 | 18% | 20% | 29% | 17% | 17% | 16% |
| November 2018 | 19% | 20% | 40% | 16% | 14% | 15% |
| December 2018 | 18% | 19% | 21% | 18% | 17% | 17% |
| February 2019 | 1% | 1% | 2% | 1% | 1% | 1% |
| March 2019 | 1% | 1% | 3% | 1% | 1% | 1% |
| Fidelity Advisor Freedom 2005 Fund | | | | | | |
| May 2018 | 3% | 4% | 6% | 3% | N/A | 2% |
| December 2018 | 27% | 29% | 38% | 25% | 22% | 23% |
| Fidelity Advisor Freedom 2010 Fund | | | | | | |
| May 2018 | 5% | 6% | 13% | 4% | N/A | 3% |
| December 2018 | 36% | 38% | 53% | 32% | 28% | 30% |
| Fidelity Advisor Freedom 2015 Fund | | | | | | |
| May 2018 | 7% | 9% | 20% | 5% | N/A | 5% |
| December 2018 | 44% | 48% | 61% | 40% | 34% | 37% |
| Fidelity Advisor Freedom 2020 Fund | | | | | | |
| May 2018 | 9% | 13% | – | 7% | N/A | 5% |
| December 2018 | 46% | 50% | 63% | 42% | 36% | 39% |
| Fidelity Advisor Freedom 2025 Fund | | | | | | |
| May 2018 | 13% | 24% | – | 9% | N/A | 6% |
| December 2018 | 53% | 57% | 75% | 49% | 42% | 44% |
| Fidelity Advisor Freedom 2030 Fund | | | | | | |
| May 2018 | 18% | 38% | – | 12% | N/A | 7% |
| December 2018 | 64% | 69% | 86% | 58% | 50% | 53% |
| Fidelity Advisor Freedom 2035 Fund | | | | | | |
| December 2018 | 76% | 81% | 100% | 69% | 58% | 62% |
| Fidelity Advisor Freedom 2040 Fund | | | | | | |
| December 2018 | 81% | 87% | 100% | 74% | 62% | 67% |
| Fidelity Advisor Freedom 2045 Fund | | | | | | |
| December 2018 | 80% | 87% | 100% | 73% | 62% | 65% |
| Fidelity Advisor Freedom 2050 Fund | | | | | | |
| December 2018 | 81% | 88% | 100% | 74% | 62% | 66% |
| Fidelity Advisor Freedom 2055 Fund | | | | | | |
| December 2018 | 82% | 88% | 100% | 74% | 62% | 66% |
| Fidelity Advisor Freedom 2060 Fund | | | | | | |
| December 2018 | 80% | 87% | 100% | 74% | 63% | 67% |
|
The funds will notify shareholders in January 2020 of amounts for use in preparing 2019 income tax returns.
AFF-ANN-0519
1.792114.116
Fidelity Freedom® Index Funds - Income, 2005, 2010, 2015, 2020, 2025, 2030, 2035, 2040, 2045, 2050, 2055, 2060
Annual Report March 31, 2019 |
|
Beginning on January 1, 2021, as permitted by regulations adopted by the Securities and Exchange Commission, paper copies of a fund’s shareholder reports will no longer be sent by mail, unless you specifically request paper copies of the reports from the fund or from your financial intermediary, such as a financial advisor, broker-dealer or bank. Instead, the reports will be made available on a website, and you will be notified by mail each time a report is posted and provided with a website link to access the report.
If you already elected to receive shareholder reports electronically, you will not be affected by this change and you need not take any action. You may elect to receive shareholder reports and other communications from a fund electronically, by contacting your financial intermediary. For Fidelity customers, visit Fidelity's web site or call Fidelity using the contact information listed below.
You may elect to receive all future reports in paper free of charge. If you wish to continue receiving paper copies of your shareholder reports, you may contact your financial intermediary or, if you are a Fidelity customer, visit Fidelity’s website, or call Fidelity at the applicable toll-free number listed below. Your election to receive reports in paper will apply to all funds held with the fund complex/your financial intermediary.
| Account Type | Website | Phone Number |
| Brokerage, Mutual Fund, or Annuity Contracts: | fidelity.com/mailpreferences | 1-800-343-3548 |
| Employer Provided Retirement Accounts: | netbenefits.fidelity.com/preferences (choose 'no' under Required Disclosures to continue to print) | 1-800-343-0860 |
| Advisor Sold Accounts Serviced Through Your Financial Intermediary: | Contact Your Financial Intermediary | Your Financial Intermediary's phone number |
| Advisor Sold Accounts Serviced by Fidelity: | institutional.fidelity.com | 1-877-208-0098 |
Contents
To view a fund's proxy voting guidelines and proxy voting record for the 12-month period ended June 30, visit http://www.fidelity.com/proxyvotingresults or visit the Securities and Exchange Commission's (SEC) web site at http://www.sec.gov.
You may also call 1-800-835-5092 (plan accounts and Institutional Premium Class) or 1-800-544-8544 (all other accounts) to request a free copy of the proxy voting guidelines.
Standard & Poor's, S&P and S&P 500 are registered service marks of The McGraw-Hill Companies, Inc. and have been licensed for use by Fidelity Distributors Corporation.
Other third-party marks appearing herein are the property of their respective owners.
All other marks appearing herein are registered or unregistered trademarks or service marks of FMR LLC or an affiliated company. © 2019 FMR LLC. All rights reserved.
This report and the financial statements contained herein are submitted for the general information of the shareholders of the Funds. This report is not authorized for distribution to prospective investors in the Funds unless preceded or accompanied by an effective prospectus.
A fund files its complete schedule of portfolio holdings with the SEC for the first and third quarters of each fiscal year on Form N-PORT. Forms N-PORT are available on the SEC’s web site at http://www.sec.gov. A fund's Forms N-PORT may be reviewed and copied at the SEC’s Public Reference Room in Washington, DC. Information regarding the operation of the SEC's Public Reference Room may be obtained by calling 1-800-SEC-0330.
For a complete list of a fund's portfolio holdings, view the most recent holdings listing, semiannual report, or annual report on Fidelity's web site at http://www.fidelity.com, http://www.institutional.fidelity.com, or http://www.401k.com, as applicable.
NOT FDIC INSURED •MAY LOSE VALUE •NO BANK GUARANTEE
Neither the Funds nor Fidelity Distributors Corporation is a bank.
Fidelity Freedom® Index Income Fund
Performance: The Bottom Line
Average annual total return reflects the change in the value of an investment, assuming reinvestment of distributions from dividend income and capital gains (the profits earned upon the sale of securities that have grown in value, if any) and assuming a constant rate of performance each year. The hypothetical investment and the average annual total returns do not reflect the deduction of taxes that a shareholder would pay on fund distributions or the redemption of fund shares. During periods of reimbursement by Fidelity, a fund’s total return will be greater than it would be had the reimbursement not occurred. How a fund did yesterday is no guarantee of how it will do tomorrow.
Average Annual Total Returns
| For the periods ended March 31, 2019 | Past 1 year | Past 5 years | Life of fundA |
| Investor Class | 4.09% | 3.20% | 3.77% |
| Institutional Premium Class | 4.16% | 3.23% | 3.78% |
A From October 2, 2009
The initial offering of Institutional Premium Class took place on June 24, 2015. Returns prior to June 24, 2015 are those of Investor Class, the original class of the fund.
$10,000 Over Life of Fund
Let's say hypothetically that $10,000 was invested in Fidelity Freedom® Index Income Fund - Investor Class on October 2, 2009, when the fund started.
The chart shows how the value of your investment would have changed, and also shows how the Bloomberg Barclays U.S. Aggregate Bond Index performed over the same period.
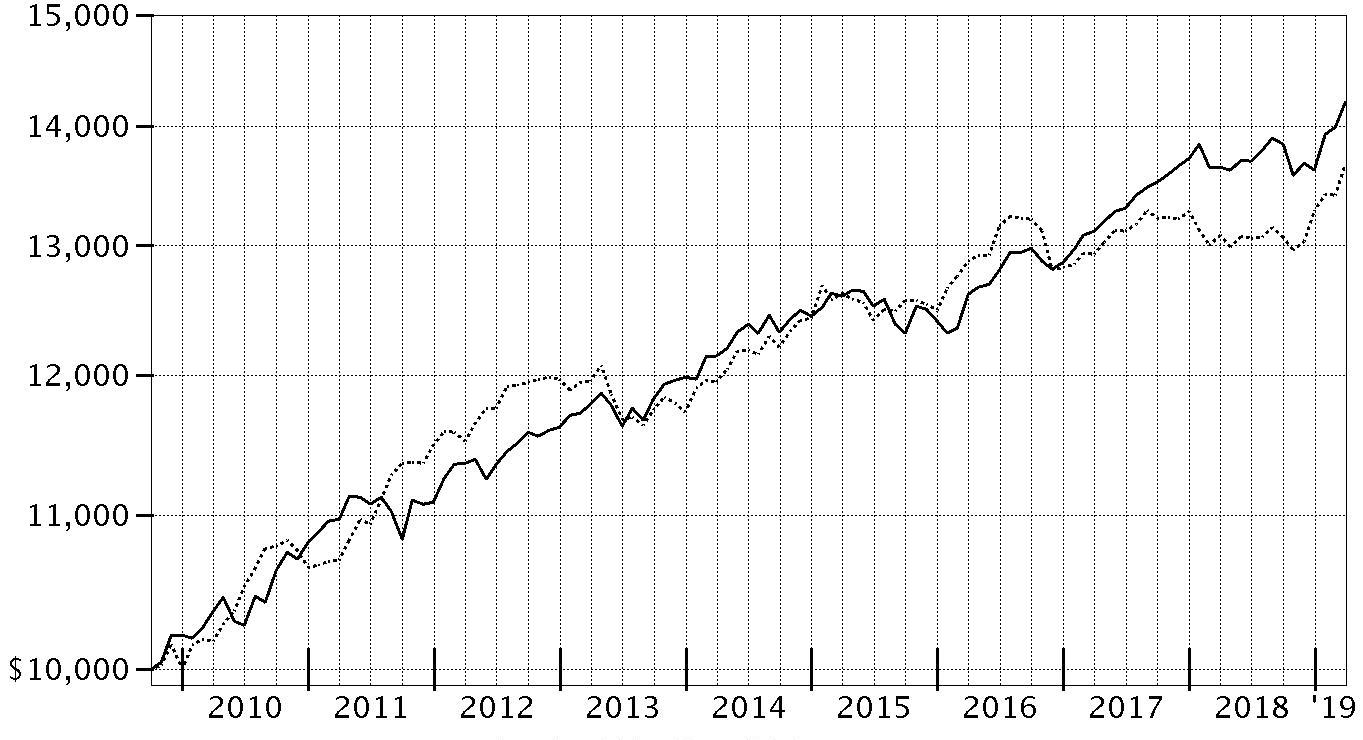
| Period Ending Values |
| $14,206 | Fidelity Freedom® Index Income Fund - Investor Class |
| $13,671 | Bloomberg Barclays U.S. Aggregate Bond Index |
Fidelity Freedom® Index 2005 Fund
Performance: The Bottom Line
Average annual total return reflects the change in the value of an investment, assuming reinvestment of distributions from dividend income and capital gains (the profits earned upon the sale of securities that have grown in value, if any) and assuming a constant rate of performance each year. The hypothetical investment and the average annual total returns do not reflect the deduction of taxes that a shareholder would pay on fund distributions or the redemption of fund shares. During periods of reimbursement by Fidelity, a fund’s total return will be greater than it would be had the reimbursement not occurred. How a fund did yesterday is no guarantee of how it will do tomorrow.
Average Annual Total Returns
| For the periods ended March 31, 2019 | Past 1 year | Past 5 years | Life of fundA |
| Investor Class | 4.25% | 3.97% | 5.24% |
| Institutional Premium Class | 4.31% | 4.01% | 5.26% |
A From October 2, 2009
The initial offering of Institutional Premium Class took place on June 24, 2015. Returns prior to June 24, 2015 are those of Investor Class, the original class of the fund.
$10,000 Over Life of Fund
Let's say hypothetically that $10,000 was invested in Fidelity Freedom® Index 2005 Fund - Investor Class on October 2, 2009, when the fund started.
The chart shows how the value of your investment would have changed, and also shows how the Bloomberg Barclays U.S. Aggregate Bond Index performed over the same period.
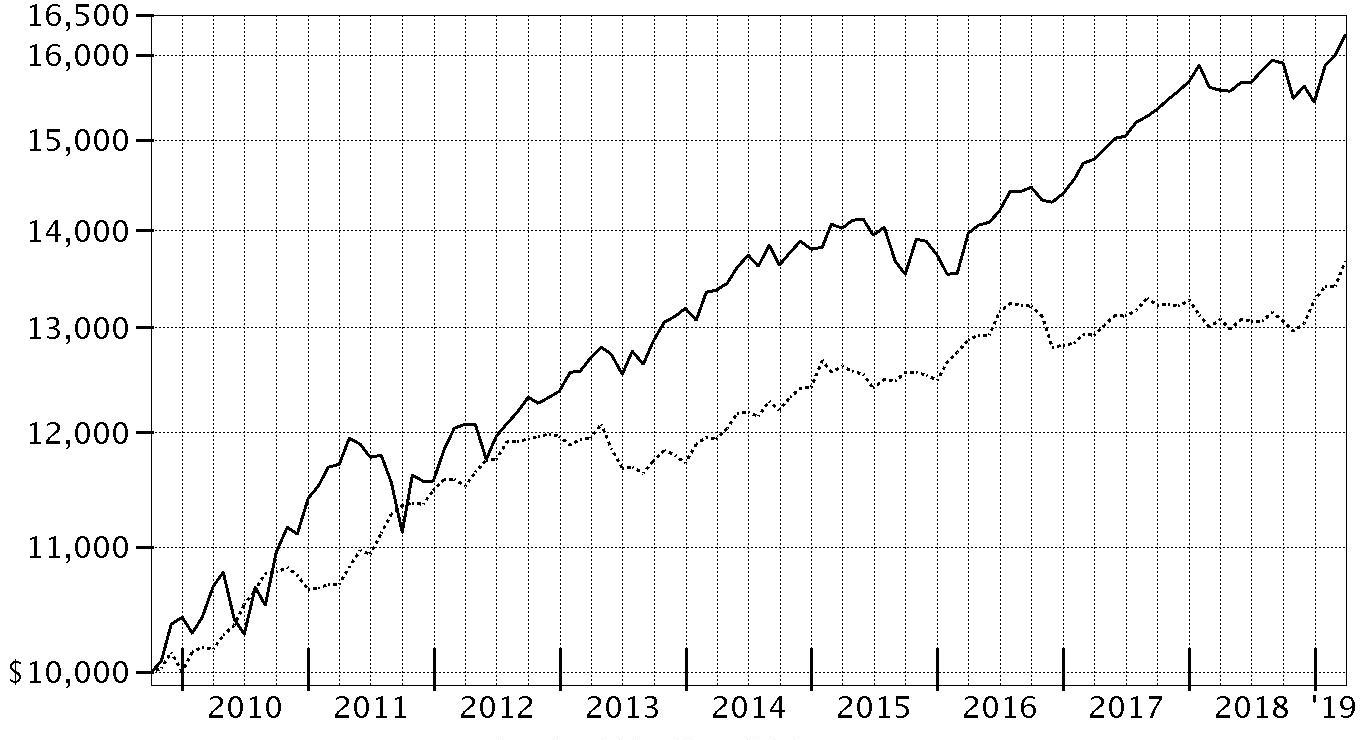
| Period Ending Values |
| $16,244 | Fidelity Freedom® Index 2005 Fund - Investor Class |
| $13,671 | Bloomberg Barclays U.S. Aggregate Bond Index |
Fidelity Freedom® Index 2010 Fund
Performance: The Bottom Line
Average annual total return reflects the change in the value of an investment, assuming reinvestment of distributions from dividend income and capital gains (the profits earned upon the sale of securities that have grown in value, if any) and assuming a constant rate of performance each year. The hypothetical investment and the average annual total returns do not reflect the deduction of taxes that a shareholder would pay on fund distributions or the redemption of fund shares. During periods of reimbursement by Fidelity, a fund’s total return will be greater than it would be had the reimbursement not occurred. How a fund did yesterday is no guarantee of how it will do tomorrow.
Average Annual Total Returns
| For the periods ended March 31, 2019 | Past 1 year | Past 5 years | Life of fundA |
| Investor Class | 4.43% | 4.55% | 6.18% |
| Institutional Premium Class | 4.49% | 4.60% | 6.20% |
A From October 2, 2009
The initial offering of Institutional Premium Class took place on June 24, 2015. Returns prior to June 24, 2015 are those of Investor Class, the original class of the fund.
$10,000 Over Life of Fund
Let's say hypothetically that $10,000 was invested in Fidelity Freedom® Index 2010 Fund - Investor Class on October 2, 2009, when the fund started.
The chart shows how the value of your investment would have changed, and also shows how the Bloomberg Barclays U.S. Aggregate Bond Index performed over the same period.

| Period Ending Values |
| $17,668 | Fidelity Freedom® Index 2010 Fund - Investor Class |
| $13,671 | Bloomberg Barclays U.S. Aggregate Bond Index |
Fidelity Freedom® Index 2015 Fund
Performance: The Bottom Line
Average annual total return reflects the change in the value of an investment, assuming reinvestment of distributions from dividend income and capital gains (the profits earned upon the sale of securities that have grown in value, if any) and assuming a constant rate of performance each year. The hypothetical investment and the average annual total returns do not reflect the deduction of taxes that a shareholder would pay on fund distributions or the redemption of fund shares. During periods of reimbursement by Fidelity, a fund’s total return will be greater than it would be had the reimbursement not occurred. How a fund did yesterday is no guarantee of how it will do tomorrow.
Average Annual Total Returns
| For the periods ended March 31, 2019 | Past 1 year | Past 5 years | Life of fundA |
| Investor Class | 4.55% | 5.11% | 6.62% |
| Institutional Premium Class | 4.55% | 5.15% | 6.64% |
A From October 2, 2009
The initial offering of Institutional Premium Class took place on June 24, 2015. Returns prior to June 24, 2015 are those of Investor Class, the original class of the fund.
$10,000 Over Life of Fund
Let's say hypothetically that $10,000 was invested in Fidelity Freedom® Index 2015 Fund - Investor Class on October 2, 2009, when the fund started.
The chart shows how the value of your investment would have changed, and also shows how the Bloomberg Barclays U.S. Aggregate Bond Index performed over the same period.
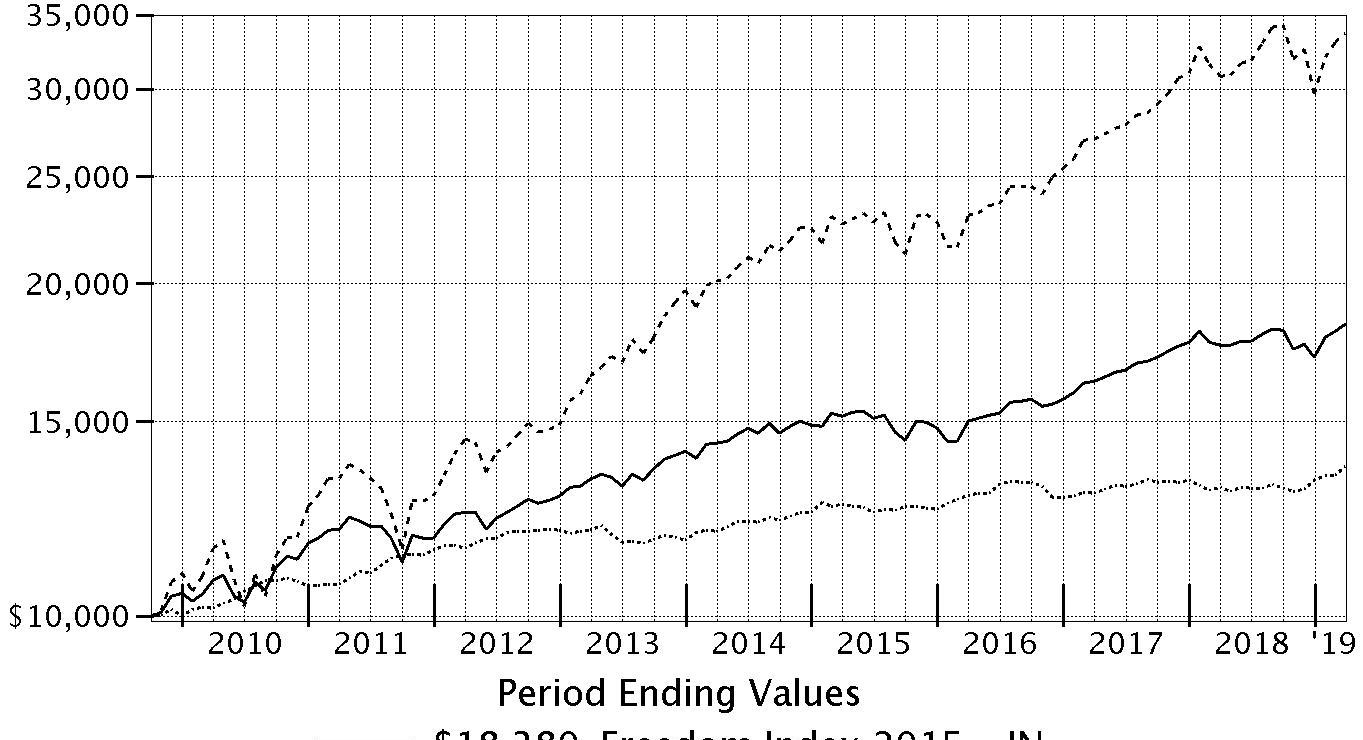
| Period Ending Values |
| $18,380 | Fidelity Freedom® Index 2015 Fund - Investor Class |
| $13,671 | Bloomberg Barclays U.S. Aggregate Bond Index |
| $33,703 | S&P 500 Index |
Going forward, the fund’s performance will be compared to the Bloomberg Barclays U.S. Aggregate Bond Index, rather than the S&P 500® Index. The Bloomberg Barclays U.S. Aggregate Bond Index more closely represents the fund’s investment strategy, as fixed-income and short-term funds currently represent the majority of the fund’s assets.
Fidelity Freedom® Index 2020 Fund
Performance: The Bottom Line
Average annual total return reflects the change in the value of an investment, assuming reinvestment of distributions from dividend income and capital gains (the profits earned upon the sale of securities that have grown in value, if any) and assuming a constant rate of performance each year. The hypothetical investment and the average annual total returns do not reflect the deduction of taxes that a shareholder would pay on fund distributions or the redemption of fund shares. During periods of reimbursement by Fidelity, a fund’s total return will be greater than it would be had the reimbursement not occurred. How a fund did yesterday is no guarantee of how it will do tomorrow.
Average Annual Total Returns
| For the periods ended March 31, 2019 | Past 1 year | Past 5 years | Life of fundA |
| Investor Class | 4.59% | 5.49% | 7.20% |
| Institutional Premium Class | 4.65% | 5.54% | 7.23% |
A From October 2, 2009
The initial offering of Institutional Premium Class took place on June 24, 2015. Returns prior to June 24, 2015 are those of Investor Class, the original class of the fund.
$10,000 Over Life of Fund
Let's say hypothetically that $10,000 was invested in Fidelity Freedom® Index 2020 Fund - Investor Class on October 2, 2009, when the fund started.
The chart shows how the value of your investment would have changed, and also shows how the S&P 500® Index performed over the same period.
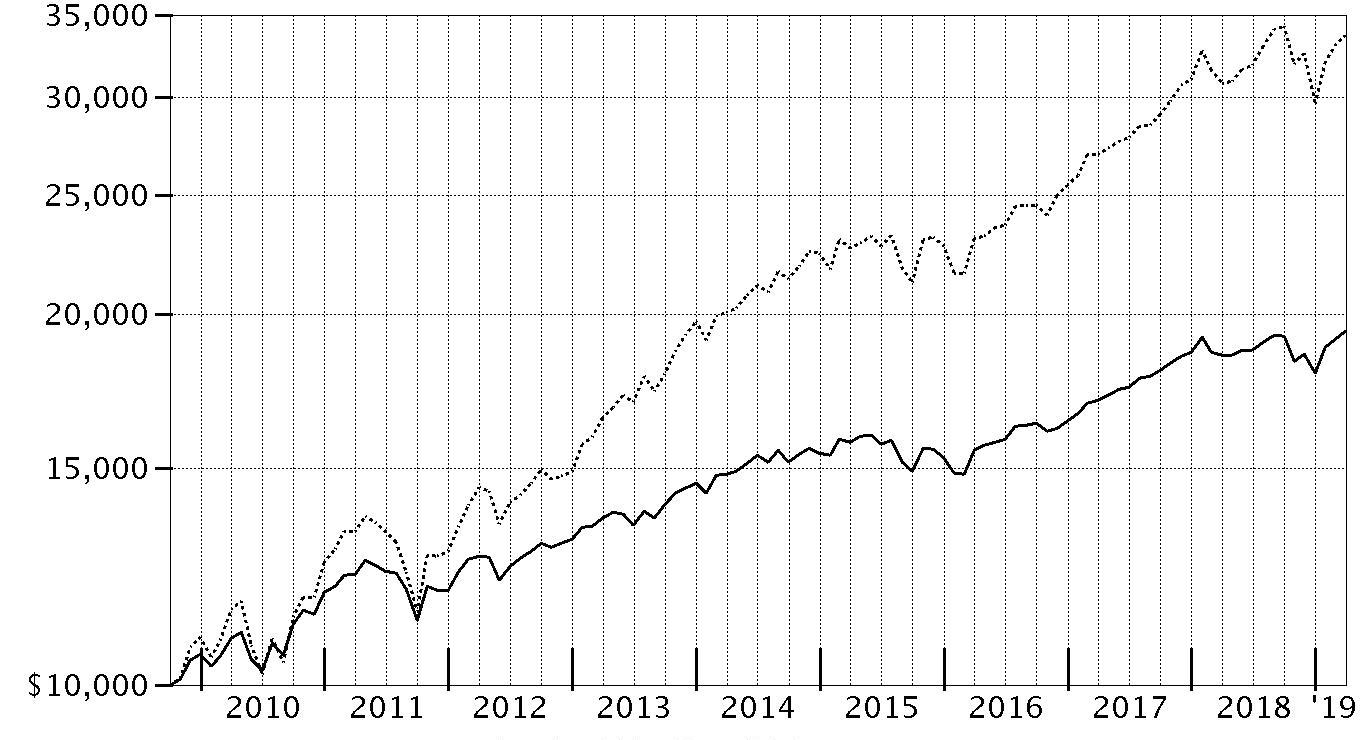
| Period Ending Values |
| $19,361 | Fidelity Freedom® Index 2020 Fund - Investor Class |
| $33,703 | S&P 500® Index |
Fidelity Freedom® Index 2025 Fund
Performance: The Bottom Line
Average annual total return reflects the change in the value of an investment, assuming reinvestment of distributions from dividend income and capital gains (the profits earned upon the sale of securities that have grown in value, if any) and assuming a constant rate of performance each year. The hypothetical investment and the average annual total returns do not reflect the deduction of taxes that a shareholder would pay on fund distributions or the redemption of fund shares. During periods of reimbursement by Fidelity, a fund’s total return will be greater than it would be had the reimbursement not occurred. How a fund did yesterday is no guarantee of how it will do tomorrow.
Average Annual Total Returns
| For the periods ended March 31, 2019 | Past 1 year | Past 5 years | Life of fundA |
| Investor Class | 4.64% | 5.88% | 7.93% |
| Institutional Premium Class | 4.70% | 5.92% | 7.96% |
A From October 2, 2009
The initial offering of Institutional Premium Class took place on June 24, 2015. Returns prior to June 24, 2015 are those of Investor Class, the original class of the fund.
$10,000 Over Life of Fund
Let's say hypothetically that $10,000 was invested in Fidelity Freedom® Index 2025 Fund - Investor Class on October 2, 2009, when the fund started.
The chart shows how the value of your investment would have changed, and also shows how the S&P 500® Index performed over the same period.
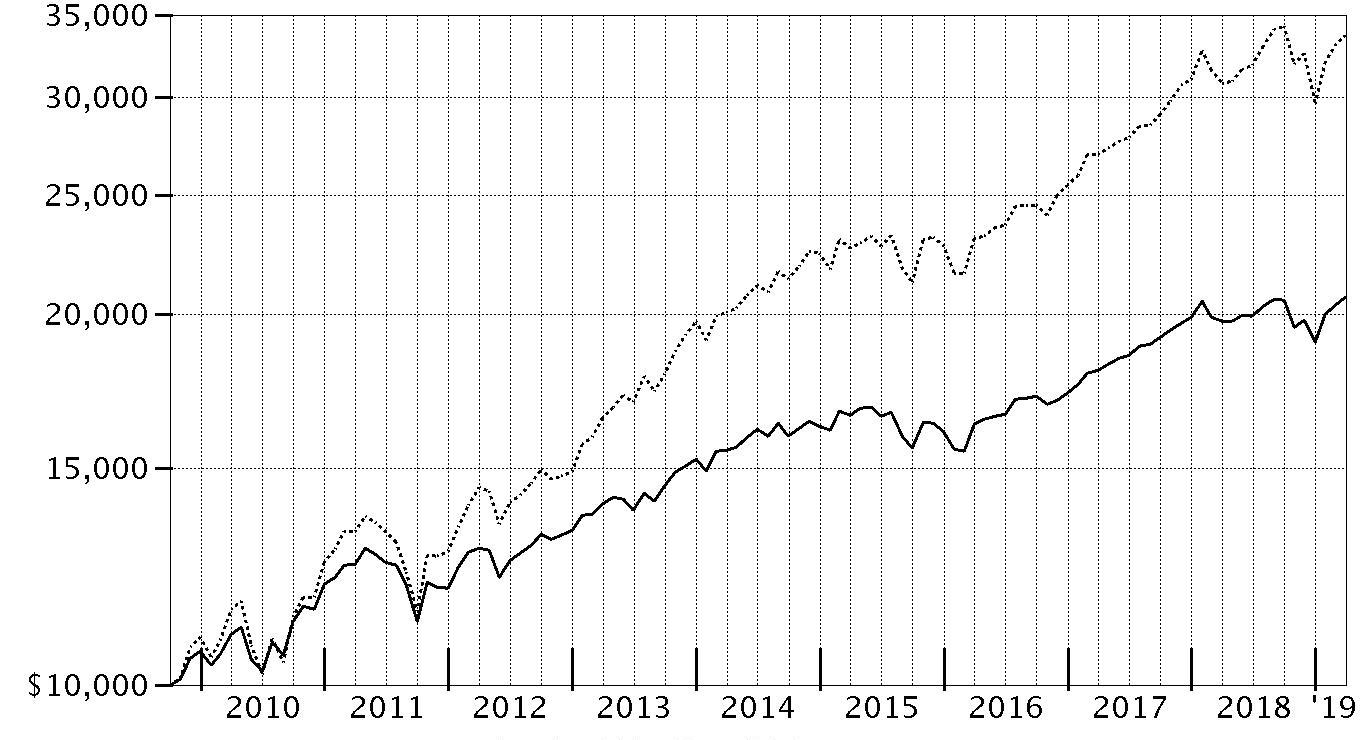
| Period Ending Values |
| $20,649 | Fidelity Freedom® Index 2025 Fund - Investor Class |
| $33,703 | S&P 500® Index |
Fidelity Freedom® Index 2030 Fund
Performance: The Bottom Line
Average annual total return reflects the change in the value of an investment, assuming reinvestment of distributions from dividend income and capital gains (the profits earned upon the sale of securities that have grown in value, if any) and assuming a constant rate of performance each year. The hypothetical investment and the average annual total returns do not reflect the deduction of taxes that a shareholder would pay on fund distributions or the redemption of fund shares. During periods of reimbursement by Fidelity, a fund’s total return will be greater than it would be had the reimbursement not occurred. How a fund did yesterday is no guarantee of how it will do tomorrow.
Average Annual Total Returns
| For the periods ended March 31, 2019 | Past 1 year | Past 5 years | Life of fundA |
| Investor Class | 4.71% | 6.63% | 8.55% |
| Institutional Premium Class | 4.82% | 6.68% | 8.58% |
A From October 2, 2009
The initial offering of Institutional Premium Class took place on June 24, 2015. Returns prior to June 24, 2015 are those of Investor Class, the original class of the fund.
$10,000 Over Life of Fund
Let's say hypothetically that $10,000 was invested in Fidelity Freedom® Index 2030 Fund - Investor Class on October 2, 2009, when the fund started.
The chart shows how the value of your investment would have changed, and also shows how the S&P 500® Index performed over the same period.
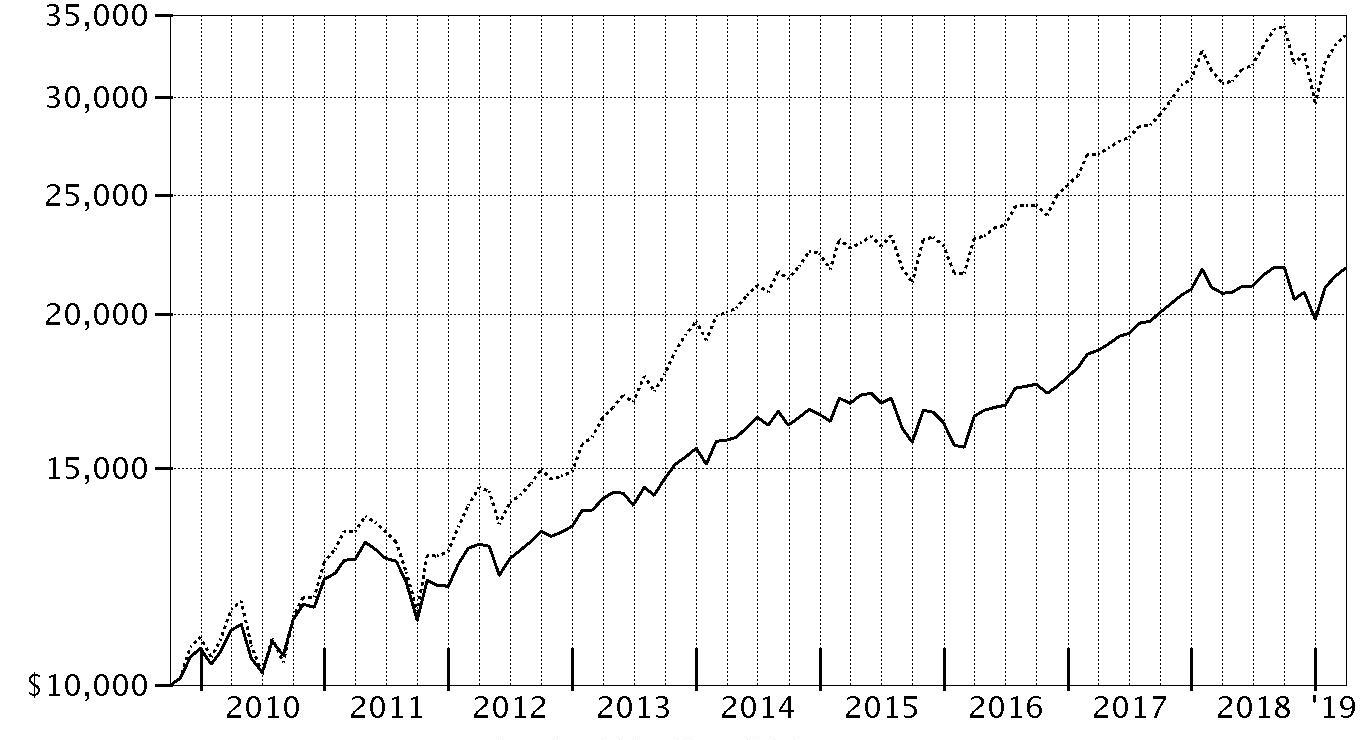
| Period Ending Values |
| $21,796 | Fidelity Freedom® Index 2030 Fund - Investor Class |
| $33,703 | S&P 500® Index |
Fidelity Freedom® Index 2035 Fund
Performance: The Bottom Line
Average annual total return reflects the change in the value of an investment, assuming reinvestment of distributions from dividend income and capital gains (the profits earned upon the sale of securities that have grown in value, if any) and assuming a constant rate of performance each year. The hypothetical investment and the average annual total returns do not reflect the deduction of taxes that a shareholder would pay on fund distributions or the redemption of fund shares. During periods of reimbursement by Fidelity, a fund’s total return will be greater than it would be had the reimbursement not occurred. How a fund did yesterday is no guarantee of how it will do tomorrow.
Average Annual Total Returns
| For the periods ended March 31, 2019 | Past 1 year | Past 5 years | Life of fundA |
| Investor Class | 4.63% | 7.16% | 9.18% |
| Institutional Premium Class | 4.69% | 7.21% | 9.21% |
A From October 2, 2009
The initial offering of Institutional Premium Class took place on June 24, 2015. Returns prior to June 24, 2015 are those of Investor Class, the original class of the fund.
$10,000 Over Life of Fund
Let's say hypothetically that $10,000 was invested in Fidelity Freedom® Index 2035 Fund - Investor Class on October 2, 2009, when the fund started.
The chart shows how the value of your investment would have changed, and also shows how the S&P 500® Index performed over the same period.

| Period Ending Values |
| $23,030 | Fidelity Freedom® Index 2035 Fund - Investor Class |
| $33,703 | S&P 500® Index |
Fidelity Freedom® Index 2040 Fund
Performance: The Bottom Line
Average annual total return reflects the change in the value of an investment, assuming reinvestment of distributions from dividend income and capital gains (the profits earned upon the sale of securities that have grown in value, if any) and assuming a constant rate of performance each year. The hypothetical investment and the average annual total returns do not reflect the deduction of taxes that a shareholder would pay on fund distributions or the redemption of fund shares. During periods of reimbursement by Fidelity, a fund’s total return will be greater than it would be had the reimbursement not occurred. How a fund did yesterday is no guarantee of how it will do tomorrow.
Average Annual Total Returns
| For the periods ended March 31, 2019 | Past 1 year | Past 5 years | Life of fundA |
| Investor Class | 4.56% | 7.19% | 9.25% |
| Institutional Premium Class | 4.61% | 7.23% | 9.28% |
A From October 2, 2009
The initial offering of Institutional Premium Class took place on June 24, 2015. Returns prior to June 24, 2015 are those of Investor Class, the original class of the fund.
$10,000 Over Life of Fund
Let's say hypothetically that $10,000 was invested in Fidelity Freedom® Index 2040 Fund - Investor Class on October 2, 2009, when the fund started.
The chart shows how the value of your investment would have changed, and also shows how the S&P 500® Index performed over the same period.

| Period Ending Values |
| $23,180 | Fidelity Freedom® Index 2040 Fund - Investor Class |
| $33,703 | S&P 500® Index |
Fidelity Freedom® Index 2045 Fund
Performance: The Bottom Line
Average annual total return reflects the change in the value of an investment, assuming reinvestment of distributions from dividend income and capital gains (the profits earned upon the sale of securities that have grown in value, if any) and assuming a constant rate of performance each year. The hypothetical investment and the average annual total returns do not reflect the deduction of taxes that a shareholder would pay on fund distributions or the redemption of fund shares. During periods of reimbursement by Fidelity, a fund’s total return will be greater than it would be had the reimbursement not occurred. How a fund did yesterday is no guarantee of how it will do tomorrow.
Average Annual Total Returns
| For the periods ended March 31, 2019 | Past 1 year | Past 5 years | Life of fundA |
| Investor Class | 4.58% | 7.18% | 9.33% |
| Institutional Premium Class | 4.58% | 7.23% | 9.35% |
A From October 2, 2009
The initial offering of Institutional Premium Class took place on June 24, 2015. Returns prior to June 24, 2015 are those of Investor Class, the original class of the fund.
$10,000 Over Life of Fund
Let's say hypothetically that $10,000 was invested in Fidelity Freedom® Index 2045 Fund - Investor Class on October 2, 2009, when the fund started.
The chart shows how the value of your investment would have changed, and also shows how the S&P 500® Index performed over the same period.

| Period Ending Values |
| $23,324 | Fidelity Freedom® Index 2045 Fund - Investor Class |
| $33,703 | S&P 500® Index |
Fidelity Freedom® Index 2050 Fund
Performance: The Bottom Line
Average annual total return reflects the change in the value of an investment, assuming reinvestment of distributions from dividend income and capital gains (the profits earned upon the sale of securities that have grown in value, if any) and assuming a constant rate of performance each year. The hypothetical investment and the average annual total returns do not reflect the deduction of taxes that a shareholder would pay on fund distributions or the redemption of fund shares. During periods of reimbursement by Fidelity, a fund’s total return will be greater than it would be had the reimbursement not occurred. How a fund did yesterday is no guarantee of how it will do tomorrow.
Average Annual Total Returns
| For the periods ended March 31, 2019 | Past 1 year | Past 5 years | Life of fundA |
| Investor Class | 4.53% | 7.18% | 9.37% |
| Institutional Premium Class | 4.59% | 7.22% | 9.40% |
A From October 2, 2009
The initial offering of Institutional Premium Class took place on June 24, 2015. Returns prior to June 24, 2015 are those of Investor Class, the original class of the fund.
$10,000 Over Life of Fund
Let's say hypothetically that $10,000 was invested in Fidelity Freedom® Index 2050 Fund - Investor Class on October 2, 2009, when the fund started.
The chart shows how the value of your investment would have changed, and also shows how the S&P 500® Index performed over the same period.
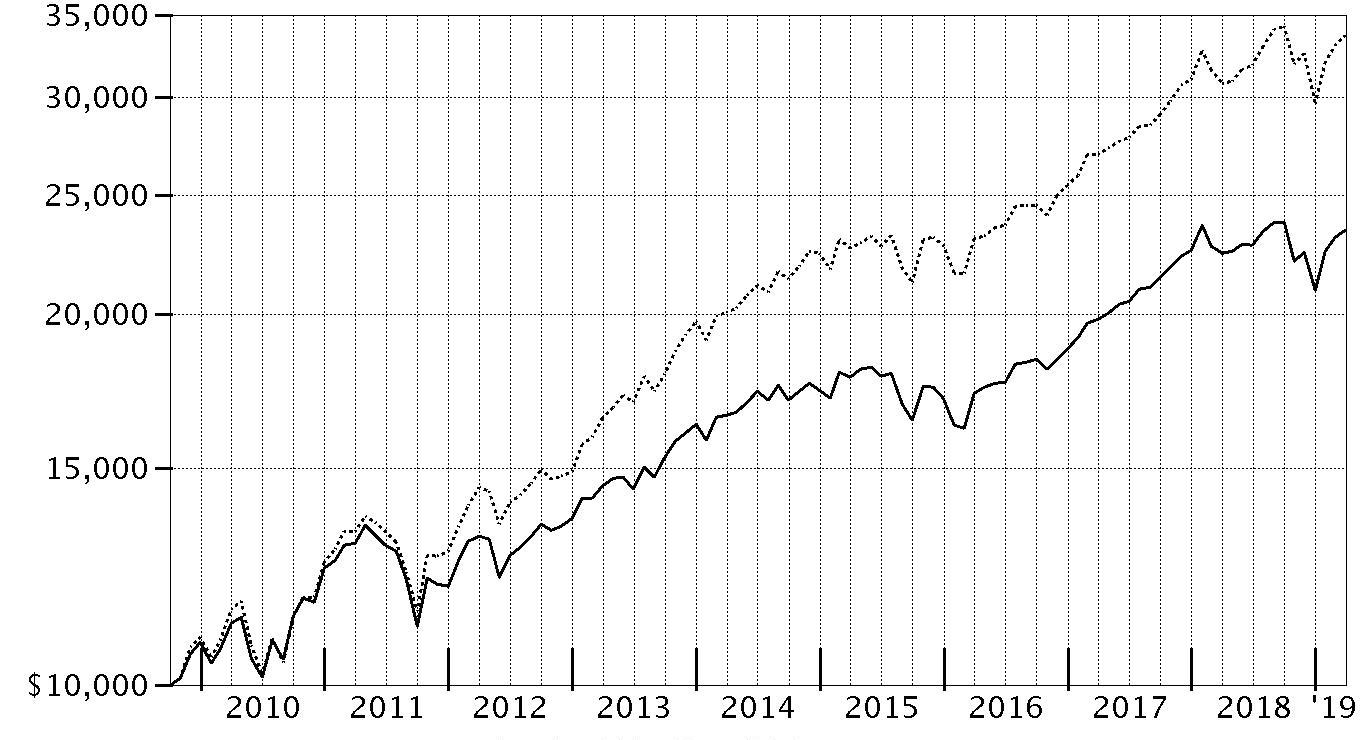
| Period Ending Values |
| $23,424 | Fidelity Freedom® Index 2050 Fund - Investor Class |
| $33,703 | S&P 500® Index |
Fidelity Freedom® Index 2055 Fund
Performance: The Bottom Line
Average annual total return reflects the change in the value of an investment, assuming reinvestment of distributions from dividend income and capital gains (the profits earned upon the sale of securities that have grown in value, if any) and assuming a constant rate of performance each year. The hypothetical investment and the average annual total returns do not reflect the deduction of taxes that a shareholder would pay on fund distributions or the redemption of fund shares. During periods of reimbursement by Fidelity, a fund’s total return will be greater than it would be had the reimbursement not occurred. How a fund did yesterday is no guarantee of how it will do tomorrow.
Average Annual Total Returns
| For the periods ended March 31, 2019 | Past 1 year | Past 5 years | Life of fundA |
| Investor Class | 4.57% | 7.18% | 7.91% |
| Institutional Premium Class | 4.61% | 7.22% | 7.93% |
A From June 1, 2011
The initial offering of Institutional Premium Class took place on June 24, 2015. Returns prior to June 24, 2015 are those of Investor Class, the original class of the fund.
$10,000 Over Life of Fund
Let's say hypothetically that $10,000 was invested in Fidelity Freedom® Index 2055 Fund - Investor Class on June 1, 2011, when the fund started.
The chart shows how the value of your investment would have changed, and also shows how the S&P 500® Index performed over the same period.
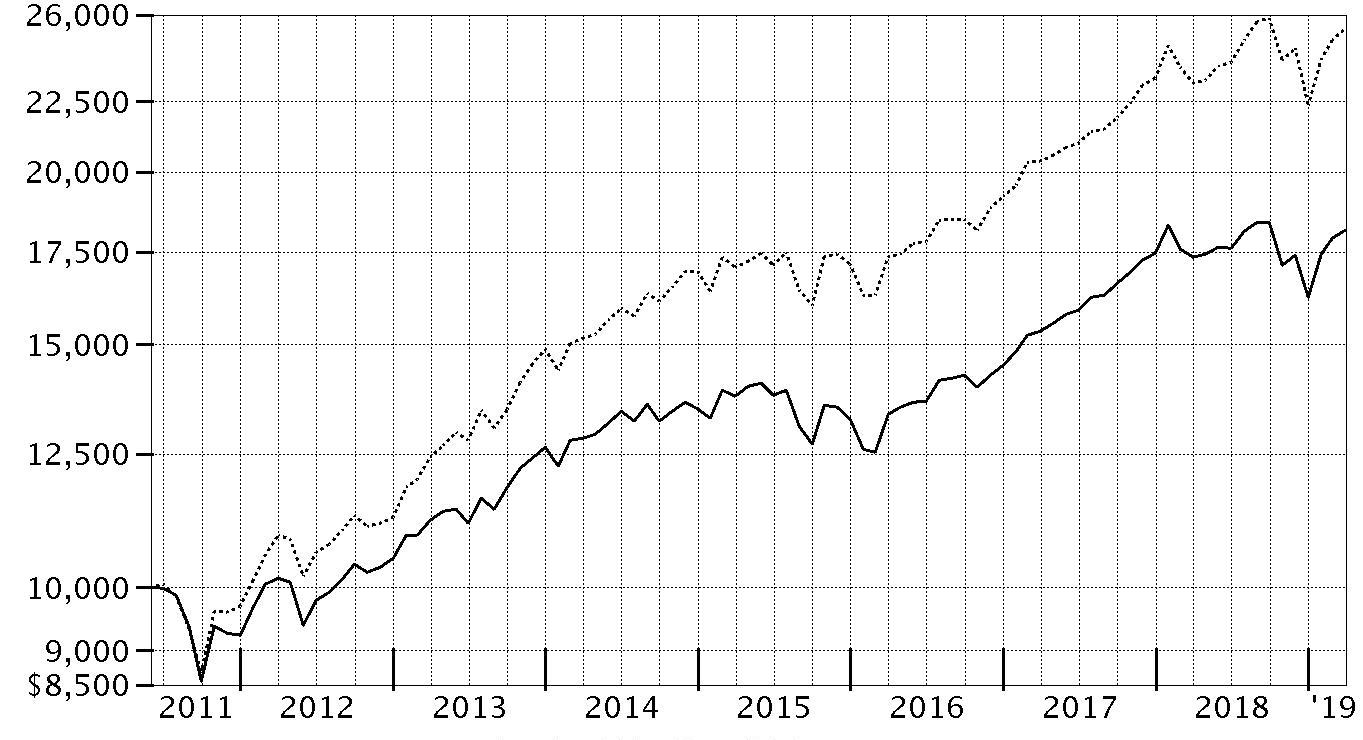
| Period Ending Values |
| $18,151 | Fidelity Freedom® Index 2055 Fund - Investor Class |
| $25,424 | S&P 500® Index |
Fidelity Freedom® Index 2060 Fund
Performance: The Bottom Line
Average annual total return reflects the change in the value of an investment, assuming reinvestment of distributions from dividend income and capital gains (the profits earned upon the sale of securities that have grown in value, if any) and assuming a constant rate of performance each year. The hypothetical investment and the average annual total returns do not reflect the deduction of taxes that a shareholder would pay on fund distributions or the redemption of fund shares. During periods of reimbursement by Fidelity, a fund’s total return will be greater than it would be had the reimbursement not occurred. How a fund did yesterday is no guarantee of how it will do tomorrow.
Average Annual Total Returns
| For the periods ended March 31, 2019 | Past 1 year | Life of fundA |
| Investor Class | 4.54% | 7.21% |
| Institutional Premium Class | 4.66% | 7.26% |
A From August 5, 2014
The initial offering of Institutional Premium Class took place on June 24, 2015. Returns prior to June 24, 2015 are those of Investor Class, the original class of the fund.
$10,000 Over Life of Fund
Let's say hypothetically that $10,000 was invested in Fidelity Freedom® Index 2060 Fund - Investor Class on August 5, 2014, when the fund started.
The chart shows how the value of your investment would have changed, and also shows how the S&P 500® Index performed over the same period.
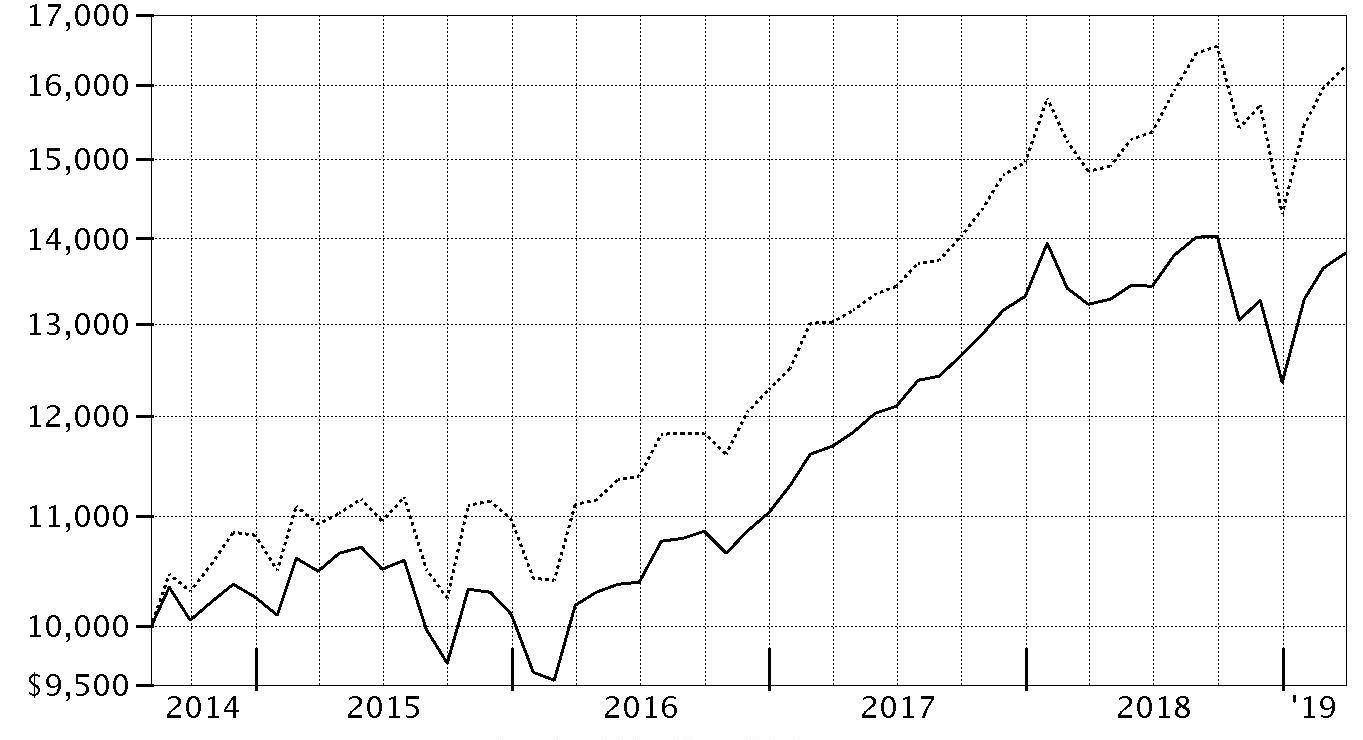
| Period Ending Values |
| $13,828 | Fidelity Freedom® Index 2060 Fund - Investor Class |
| $16,256 | S&P 500® Index |
Management's Discussion of Fund Performance
Market Recap: The global economy remained in expansion for the 12 months ending March 31, 2019, but growth was less synchronous and uneven. Many major economies progressed toward more-advanced stages of the business cycle. Financial markets responded favorably to the U.S. Federal Reserve’s shift away from its monetary tightening bias in the first quarter of 2019. Most economic indicators remained tepid, although China displayed some initial signs of stabilizing activity, and stepped up the pace of fiscal and monetary stimulus in the first quarter. Against this backdrop, the MSCI World ex USA Index of non-U.S. equity markets returned -2.91% for the year. Much of the negative impact came in the volatile fourth quarter of 2018, when the index returned -13%, followed by a sharp rebound to begin 2019. Among regions in the index, stocks in resource-rich Canada gained 4%, benefiting from rising crude-oil prices early and late in the period, while Asia Pacific ex Japan (+4%) was aided by stabilizing returns in Hong Kong, which rose 8%. Conversely, stocks in Japan (-8%), emerging markets (0%) and Europe ex U.K. (-4%) lagged. Results at home were markedly better. The U.S. equity bellwether S&P 500
® index rose 9.50%. Nine of 11 sectors in the S&P 500
® had a positive return. Three defensive sectors stood out: real estate (+21%), utilities (+19%) and health care (+15%). Conversely, some economically sensitive sectors struggled, with financials (-5%) faring worst. The small-cap-oriented Russell 2000
® Index gained 2.05% for the 12 months. Commodities also lagged, as evidenced by the -5.25% result of the Bloomberg Barclays Commodity Index Total Return. U.S. investment-grade bonds gained 4.48%, according to the Bloomberg Barclays U.S. Aggregate Bond Index, largely driven by surging returns for credit-sensitive sectors. U.S. corporate bonds increased 4.89%, according to the Bloomberg Barclays Credit Bond Index. Elsewhere, securitized sectors fared well, led by commercial mortgage-backed securities (+5.43%). Agency bonds and Treasury Inflation-Protected Securities (TIPS) lagged, as measured by the 3.73% return of the Bloomberg Barclays U.S. Agency Bond Index and the 2.70% advance of the Bloomberg Barclays U.S. Treasury Inflation-Protected Securities Index (Series-L), respectively.
Comments from Co-Portfolio Managers Andrew Dierdorf, Brett Sumsion and Finola McGuire Foley: For the fiscal year ending March 31, 2019, the Investor Class shares of each Fidelity Freedom
® Index Fund posted a gain, ranging from 4.09% for Fidelity Freedom
® Index Income Fund to 4.71% for Fidelity Freedom Index 2030 Fund. Each Fund performed roughly in line with its respective Composite index. U.S. equities were the top-performing asset class, benefiting from a stable economic backdrop and consistent earnings growth, on average, despite some significant fourth-quarter volatility. The Funds’ investment in Fidelity
® Total Market Index Fund Class F, which invests in large and small-cap stocks as well as growth and value stocks, gained 8.67% the past 12 months, about in line with the performance of the benchmark Dow Jones U.S. Total Stock Market Index. Underlying investment performance in non-U.S. equities modestly held back the Funds' performance versus Composites. More specifically, the performance of Fidelity Series Global ex U.S. Index Fund moderately trailed the return of -4.04% return of the MSCI All Country World ex U.S.A. Index, the Composites' benchmark for non-U.S. equities. Conversely, the Funds' investment in Fidelity U.S. Bond Index Fund slightly outperformed the Bloomberg Barclays U.S. Aggregate Bond Index, the benchmark for investment-grade bonds. Elsewhere, the Funds' investment in Fidelity
® Series Long-Term Treasury Bond Index Fund, which was phased in to the glide path during the second half of 2018, returned 6.19%, compared with a 5.91% advance for the Bloomberg Barclays U.S. Long-Term Treasury Bond Index.
The views expressed above reflect those of the portfolio manager(s) only through the end of the period as stated on the cover of this report and do not necessarily represent the views of Fidelity or any other person in the Fidelity organization. Any such views are subject to change at any time based upon market or other conditions and Fidelity disclaims any responsibility to update such views. These views may not be relied on as investment advice and, because investment decisions for a Fidelity fund are based on numerous factors, may not be relied on as an indication of trading intent on behalf of any Fidelity fund.
Notes to Shareholders: At its May 2018 meeting, the Board of Trustees approved incremental updates to the glide path and strategic asset allocation of Fidelity Freedom Index Funds, adding U.S. Treasury Inflation-Protected Securities and long-term U.S. Treasury bonds as fixed exposures in the Funds’ bond allocations, and slightly reducing the equity and short-term debt allocations for shorter-dated Funds. These updates have been fully implemented. At its May 2019 meeting, the Board of Trustees approved adjusting the equity composition of the strategic asset allocation from 70%/30% to 60%/40% for U.S./non-U.S. equities. On June 15, 2018, Finola McGuire Foley joined Andrew Dierdorf and Brett Sumsion as a co-manager for the Funds.
Fidelity Freedom® Index Income Fund
Investment Summary (Unaudited)
The information in the following tables is based on the direct investments of the Fund.
Top Holdings as of March 31, 2019
| | % of fund's net assets |
| Fidelity U.S. Bond Index Fund Class F | 45.6 |
| Fidelity Series Treasury Bill Index Fund | 22.5 |
| Fidelity Total Market Index Fund Class F | 13.3 |
| Fidelity Series Inflation-Protected Bond Index Fund | 9.9 |
| Fidelity Series Global ex U.S. Index Fund | 5.7 |
| Fidelity Series Long-Term Treasury Bond Index Fund | 3.0 |
| Fidelity Cash Central Fund, 2.48% | 0.0 |
| | 100.0 |
Asset Allocation (% of fund's net assets)
| Period end |
| | Domestic Equity Funds | 13.3% |
| | International Equity Funds | 5.7% |
| | Bond Funds | 48.6% |
| | Inflation-Protected Bond Funds | 9.9% |
| | Short-Term Funds | 22.5% |
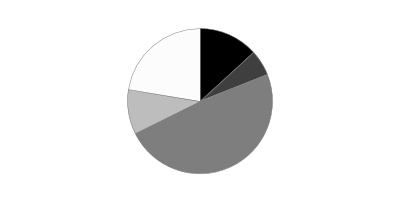
Percentages shown as 0.0% may reflect amounts less than 0.05%.
Fidelity Freedom® Index Income Fund
Schedule of Investments March 31, 2019
Showing Percentage of Net Assets
| Domestic Equity Funds - 13.3% | | | |
| | | Shares | Value |
| Fidelity Total Market Index Fund Class F (a) | | | |
| (Cost $24,193,991) | | 583,670 | 46,997,134 |
|
| International Equity Funds - 5.7% | | | |
| Fidelity Series Global ex U.S. Index Fund (a) | | | |
| (Cost $17,172,987) | | 1,645,670 | 20,110,090 |
|
| Bond Funds - 48.6% | | | |
| Fidelity Series Long-Term Treasury Bond Index Fund (a) | | 1,212,045 | 10,750,841 |
| Fidelity U.S. Bond Index Fund Class F (a) | | 13,967,506 | 161,045,339 |
| TOTAL BOND FUNDS | | | |
| (Cost $170,260,488) | | | 171,796,180 |
|
| Inflation-Protected Bond Funds - 9.9% | | | |
| Fidelity Series Inflation-Protected Bond Index Fund (a) | | | |
| (Cost $36,080,645) | | 3,593,837 | 35,147,725 |
|
| Short-Term Funds - 22.5% | | | |
| Fidelity Cash Central Fund, 2.48% (b) | | 4 | 4 |
| Fidelity Series Treasury Bill Index Fund (a) | | 7,940,190 | 79,322,502 |
| TOTAL SHORT-TERM FUNDS | | | |
| (Cost $79,399,726) | | | 79,322,506 |
| TOTAL INVESTMENT IN SECURITIES - 100.0% | | | |
| (Cost $327,107,837) | | | 353,373,635 |
| NET OTHER ASSETS (LIABILITIES) - 0.0% | | | (26,353) |
| NET ASSETS - 100% | | | $353,347,282 |
Legend
(a) Affiliated Fund
(b) Affiliated fund that is generally available only to investment companies and other accounts managed by Fidelity Investments. The rate quoted is the annualized seven-day yield of the fund at period end. A complete unaudited listing of the fund's holdings as of its most recent quarter end is available upon request. In addition, each Fidelity Central Fund's financial statements, which are not covered by the Fund's Report of Independent Registered Public Accounting Firm, are available on the SEC's website or upon request.
Affiliated Central Funds
Information regarding fiscal year to date income earned by the Fund from investments in Fidelity Central Funds is as follows:
| Fund | Income earned |
| Fidelity Cash Central Fund | $15 |
| Total | $15 |
Amounts in the income column in the above table include any capital gain distributions from underlying funds, which are presented in the corresponding line-item in the Statement of Operations, if applicable.
Affiliated Underlying Funds
Fiscal year to date information regarding the Fund's investments in affiliated Underlying Funds, excluding any Money Market Central Funds, is presented below. Exchanges between classes of the same affiliated Underlying Funds may occur.
| Affiliate | Value, beginning of period | Purchases | Sales Proceeds | Dividend Income | Realized Gain (loss) | Change in Unrealized appreciation (depreciation) | Value, end of period |
| Fidelity Commodity Strategy Fund Class F | $3,156,179 | $314,220 | $3,402,568 | $-- | $86,287 | $(154,118) | $-- |
| Fidelity Series Global ex U.S. Index Fund | 20,722,646 | 7,527,118 | 6,941,522 | 477,981 | 68,795 | (1,266,947) | 20,110,090 |
| Fidelity Series Government Money Market Fund 2.5% | 87,010,072 | 10,442,274 | 97,452,346 | 665,246 | -- | -- | -- |
| Fidelity Series Inflation-Protected Bond Index Fund | 17,437,302 | 21,324,755 | 3,868,015 | 583,125 | (9,934) | 263,617 | 35,147,725 |
| Fidelity Series Long-Term Treasury Bond Index Fund | -- | 11,685,498 | 1,426,439 | 191,884 | 2,372 | 489,410 | 10,750,841 |
| Fidelity Series Treasury Bill Index Fund | -- | 87,364,405 | 7,963,397 | 1,155,264 | (1,286) | (77,220) | 79,322,502 |
| Fidelity Total Market Index Fund Class F | 45,648,675 | 18,094,961 | 20,620,545 | 973,379 | 2,270,339 | 1,603,704 | 46,997,134 |
| Fidelity U.S. Bond Index Fund Class F | 116,416,217 | 64,744,280 | 23,008,528 | 3,931,518 | (146,911) | 3,040,281 | 161,045,339 |
| | $290,391,091 | $221,497,511 | $164,683,360 | $7,978,397 | $2,269,662 | $3,898,727 | $353,373,631 |
Amounts in the income column in the above table include any capital gain distributions from underlying funds, which are presented in the corresponding line-item in the Statement of Operations, if applicable.
Investment Valuation
All investments are categorized as Level 1 under the Fair Value Hierarchy. The inputs or methodology used for valuing securities may not be an indication of the risk associated with investing in those securities. For more information on valuation inputs please refer to the Investment Valuation section in the accompanying Notes to Financial Statements.
See accompanying notes which are an integral part of the financial statements.
Fidelity Freedom® Index Income Fund
Financial Statements
Statement of Assets and Liabilities
| | | March 31, 2019 |
| Assets | | |
Investment in securities, at value — See accompanying schedule:
| | |
| Fidelity Central Funds (cost $4) | $4 | |
| Other affiliated issuers (cost $327,107,833) | 353,373,631 | |
| Total Investment in Securities (cost $327,107,837) | | $353,373,635 |
| Cash | | 16 |
| Receivable for investments sold | | 1,449,112 |
| Receivable for fund shares sold | | 372,337 |
| Receivable from investment adviser for expense reductions | | 9,849 |
| Total assets | | 355,204,949 |
| Liabilities | | |
| Payable for investments purchased | $575,045 | |
| Payable for fund shares redeemed | 1,246,425 | |
| Transfer agent fees payable | 36,197 | |
| Total liabilities | | 1,857,667 |
| Net Assets | | $353,347,282 |
| Net Assets consist of: | | |
| Paid in capital | | $327,300,048 |
| Total distributable earnings (loss) | | 26,047,234 |
| Net Assets | | $353,347,282 |
| Net Asset Value and Maximum Offering Price | | |
| Investor Class: | | |
| Net Asset Value, offering price and redemption price per share ($167,641,301 ÷ 13,996,303 shares) | | $11.98 |
| Institutional Premium Class: | | |
| Net Asset Value, offering price and redemption price per share ($185,705,981 ÷ 15,523,025 shares) | | $11.96 |
See accompanying notes which are an integral part of the financial statements.
Statement of Operations
| | | Year ended March 31, 2019 |
| Investment Income | | |
| Dividends: | | |
| Affiliated issuers | | $7,313,854 |
| Income from Fidelity Central Funds | | 15 |
| Total income | | 7,313,869 |
| Expenses | | |
| Transfer agent fees | $394,841 | |
| Independent trustees' fees and expenses | 1,482 | |
| Total expenses before reductions | 396,323 | |
| Expense reductions | (105,939) | |
| Total expenses after reductions | | 290,384 |
| Net investment income (loss) | | 7,023,485 |
| Realized and Unrealized Gain (Loss) | | |
| Net realized gain (loss) on: | | |
| Investment securities: | | |
| Affiliated issuers | 2,269,662 | |
| Capital gain distributions from underlying funds: | | |
| Affiliated issuers | 664,543 | |
| Total net realized gain (loss) | | 2,934,205 |
| Change in net unrealized appreciation (depreciation) on: | | |
| Investment securities: | | |
| Affiliated issuers | 3,898,727 | |
| Total change in net unrealized appreciation (depreciation) | | 3,898,727 |
| Net gain (loss) | | 6,832,932 |
| Net increase (decrease) in net assets resulting from operations | | $13,856,417 |
See accompanying notes which are an integral part of the financial statements.
Statement of Changes in Net Assets
| | Year ended March 31, 2019 | Year ended March 31, 2018 |
| Increase (Decrease) in Net Assets | | |
| Operations | | |
| Net investment income (loss) | $7,023,485 | $4,737,255 |
| Net realized gain (loss) | 2,934,205 | 392,551 |
| Change in net unrealized appreciation (depreciation) | 3,898,727 | 5,485,884 |
| Net increase (decrease) in net assets resulting from operations | 13,856,417 | 10,615,690 |
| Distributions to shareholders | (9,588,519) | – |
| Distributions to shareholders from net investment income | – | (4,573,579) |
| Distributions to shareholders from net realized gain | – | (992,287) |
| Total distributions | (9,588,519) | (5,565,866) |
| Share transactions - net increase (decrease) | 58,712,635 | 20,903,404 |
| Total increase (decrease) in net assets | 62,980,533 | 25,953,228 |
| Net Assets | | |
| Beginning of period | 290,366,749 | 264,413,521 |
| End of period | $353,347,282 | $290,366,749 |
| Other Information | | |
| Undistributed net investment income end of period | | $427,760 |
See accompanying notes which are an integral part of the financial statements.
Financial Highlights
Fidelity Freedom Index Income Fund Investor Class
| Years ended March 31, | 2019 | 2018 | 2017 | 2016 | 2015 |
| Selected Per–Share Data | | | | | |
| Net asset value, beginning of period | $11.86 | $11.63 | $11.36 | $11.52 | $11.32 |
| Income from Investment Operations | | | | | |
| Net investment income (loss)A | .25 | .20 | .17 | .16 | .17 |
| Net realized and unrealized gain (loss) | .22 | .27 | .28 | (.15) | .26 |
| Total from investment operations | .47 | .47 | .45 | .01 | .43 |
| Distributions from net investment income | (.25) | (.19) | (.17) | (.16) | (.16) |
| Distributions from net realized gain | (.10) | (.04) | (.01) | (.01) | (.07) |
| Total distributions | (.35) | (.24)B | (.18) | (.17) | (.23) |
| Net asset value, end of period | $11.98 | $11.86 | $11.63 | $11.36 | $11.52 |
| Total ReturnC | 4.09% | 4.02% | 4.02% | .10% | 3.83% |
| Ratios to Average Net AssetsD,E | | | | | |
| Expenses before reductions | .15% | .15% | .15% | .15% | .15% |
| Expenses net of fee waivers, if any | .12% | .12% | .08% | .07% | .08% |
| Expenses net of all reductions | .12% | .12% | .08% | .07% | .08% |
| Net investment income (loss) | 2.15% | 1.69% | 1.48% | 1.39% | 1.49% |
| Supplemental Data | | | | | |
| Net assets, end of period (000 omitted) | $167,641 | $126,634 | $118,421 | $140,481 | $244,260 |
| Portfolio turnover rateE | 51% | 17% | 52% | 22% | 20%F |
A Calculated based on average shares outstanding during the period.
B Total distributions of $.24 per share is comprised of distributions from net investment income of $.192 and distributions from net realized gain of $.043 per share.
C Total returns would have been lower if certain expenses had not been reduced during the applicable periods shown.
D Expense ratios reflect operating expenses of the class. Expenses before reductions do not reflect amounts reimbursed by the investment adviser or reductions from expense offset arrangements and do not represent the amount paid by the class during periods when reimbursements or reductions occur. Expenses net of fee waivers reflect expenses after reimbursement by the investment adviser but prior to reductions from expense offset arrangements. Expenses net of all reductions represent the net expenses paid by the class.
E Amount does not include the portfolio activity of any Underlying Funds.
F The portfolio turnover rate does not include the assets acquired in the merger.
See accompanying notes which are an integral part of the financial statements.
Fidelity Freedom Index Income Fund Institutional Premium Class
| Years ended March 31, | 2019 | 2018 | 2017 | 2016 A |
| Selected Per–Share Data | | | | |
| Net asset value, beginning of period | $11.84 | $11.61 | $11.35 | $11.48 |
| Income from Investment Operations | | | | |
| Net investment income (loss)B | .26 | .21 | .18 | .18 |
| Net realized and unrealized gain (loss) | .22 | .26 | .27 | (.15) |
| Total from investment operations | .48 | .47 | .45 | .03 |
| Distributions from net investment income | (.26) | (.20) | (.18) | (.15) |
| Distributions from net realized gain | (.10) | (.04) | (.01) | (.01) |
| Total distributions | (.36) | (.24) | (.19) | (.16) |
| Net asset value, end of period | $11.96 | $11.84 | $11.61 | $11.35 |
| Total ReturnC,D | 4.16% | 4.07% | 4.00% | .26% |
| Ratios to Average Net AssetsE,F | | | | |
| Expenses before reductions | .10% | .10% | .09% | .05%G |
| Expenses net of fee waivers, if any | .06% | .07% | .03% | .01%G |
| Expenses net of all reductions | .06% | .07% | .03% | .01%G |
| Net investment income (loss) | 2.21% | 1.74% | 1.54% | 2.12%G |
| Supplemental Data | | | | |
| Net assets, end of period (000 omitted) | $185,706 | $163,733 | $145,993 | $108,865 |
| Portfolio turnover rateF | 51% | 17% | 52% | 22% |
A For the period June 24, 2015 (commencement of sale of shares) to March 31, 2016.
B Calculated based on average shares outstanding during the period.
C Total returns for periods of less than one year are not annualized.
D Total returns would have been lower if certain expenses had not been reduced during the applicable periods shown.
E Expense ratios reflect operating expenses of the class. Expenses before reductions do not reflect amounts reimbursed by the investment adviser or reductions from expense offset arrangements and do not represent the amount paid by the class during periods when reimbursements or reductions occur. Expense ratios before reductions for start-up periods may not be representative of longer-term operating periods. Expenses net of fee waivers reflect expenses after reimbursement by the investment adviser but prior to reductions from expense offset arrangements. Expenses net of all reductions represent the net expenses paid by the class.
F Amount does not include the portfolio activity of any Underlying Funds.
G Annualized
See accompanying notes which are an integral part of the financial statements.
Fidelity Freedom® Index 2005 Fund
Investment Summary (Unaudited)
The information in the following tables is based on the direct investments of the Fund.
Top Holdings as of March 31, 2019
| | % of fund's net assets |
| Fidelity U.S. Bond Index Fund Class F | 42.8 |
| Fidelity Total Market Index Fund Class F | 18.8 |
| Fidelity Series Treasury Bill Index Fund | 18.7 |
| Fidelity Series Inflation-Protected Bond Index Fund | 8.6 |
| Fidelity Series Global ex U.S. Index Fund | 8.1 |
| Fidelity Series Long-Term Treasury Bond Index Fund | 3.0 |
| | 100.0 |
Asset Allocation (% of fund's net assets)
| Period end |
| | Domestic Equity Funds | 18.8% |
| | International Equity Funds | 8.1% |
| | Bond Funds | 45.8% |
| | Inflation-Protected Bond Funds | 8.6% |
| | Short-Term Funds | 18.7% |
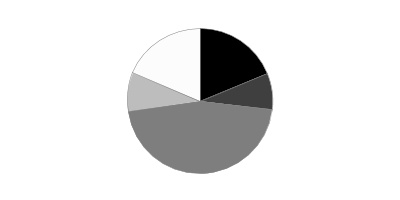
Fidelity Freedom® Index 2005 Fund
Schedule of Investments March 31, 2019
Showing Percentage of Net Assets
| Domestic Equity Funds - 18.8% | | | |
| | | Shares | Value |
| Fidelity Total Market Index Fund Class F (a) | | | |
| (Cost $12,665,660) | | 305,876 | 24,629,144 |
|
| International Equity Funds - 8.1% | | | |
| Fidelity Series Global ex U.S. Index Fund (a) | | | |
| (Cost $9,265,647) | | 865,248 | 10,573,328 |
|
| Bond Funds - 45.8% | | | |
| Fidelity Series Long-Term Treasury Bond Index Fund (a) | | 449,104 | 3,983,556 |
| Fidelity U.S. Bond Index Fund Class F (a) | | 4,852,228 | 55,946,192 |
| TOTAL BOND FUNDS | | | |
| (Cost $59,463,634) | | | 59,929,748 |
|
| Inflation-Protected Bond Funds - 8.6% | | | |
| Fidelity Series Inflation-Protected Bond Index Fund (a) | | | |
| (Cost $11,414,906) | | 1,145,417 | 11,202,177 |
|
| Short-Term Funds - 18.7% | | | |
| Fidelity Series Treasury Bill Index Fund (a) | | | |
| (Cost $24,530,095) | | 2,453,175 | 24,507,215 |
| TOTAL INVESTMENT IN SECURITIES - 100.0% | | | |
| (Cost $117,339,942) | | | 130,841,612 |
| NET OTHER ASSETS (LIABILITIES) - 0.0% | | | (9,826) |
| NET ASSETS - 100% | | | $130,831,786 |
Legend
(a) Affiliated Fund
Affiliated Underlying Funds
Fiscal year to date information regarding the Fund's investments in affiliated Underlying Funds, excluding any Money Market Central Funds, is presented below. Exchanges between classes of the same affiliated Underlying Funds may occur.
| Affiliate | Value, beginning of period | Purchases | Sales Proceeds | Dividend Income | Realized Gain (loss) | Change in Unrealized appreciation (depreciation) | Value, end of period |
| Fidelity Commodity Strategy Fund Class F | $1,212,894 | $63,617 | $1,252,923 | $-- | $31,879 | $(55,467) | $-- |
| Fidelity Series Global ex U.S. Index Fund | 11,171,164 | 3,826,373 | 3,783,339 | 257,960 | 35,122 | (675,992) | 10,573,328 |
| Fidelity Series Government Money Market Fund 2.5% | 27,224,733 | 1,940,164 | 29,164,897 | 196,273 | -- | -- | -- |
| Fidelity Series Inflation-Protected Bond Index Fund | 5,796,442 | 6,864,302 | 1,539,022 | 185,125 | (8,901) | 89,356 | 11,202,177 |
| Fidelity Series Long-Term Treasury Bond Index Fund | -- | 4,411,419 | 613,918 | 69,953 | 558 | 185,497 | 3,983,556 |
| Fidelity Series Treasury Bill Index Fund | -- | 27,287,492 | 2,756,630 | 346,816 | (767) | (22,880) | 24,507,215 |
| Fidelity Total Market Index Fund Class F | 25,037,660 | 9,503,354 | 11,817,407 | 521,446 | 1,121,795 | 783,742 | 24,629,144 |
| Fidelity U.S. Bond Index Fund Class F | 42,778,527 | 22,167,567 | 10,000,043 | 1,342,341 | (42,087) | 1,042,228 | 55,946,192 |
| | $113,221,420 | $76,064,288 | $60,928,179 | $2,919,914 | $1,137,599 | $1,346,484 | $130,841,612 |
Amounts in the income column in the above table include any capital gain distributions from underlying funds, which are presented in the corresponding line-item in the Statement of Operations, if applicable.
Investment Valuation
All investments are categorized as Level 1 under the Fair Value Hierarchy. The inputs or methodology used for valuing securities may not be an indication of the risk associated with investing in those securities. For more information on valuation inputs please refer to the Investment Valuation section in the accompanying Notes to Financial Statements.
See accompanying notes which are an integral part of the financial statements.
Fidelity Freedom® Index 2005 Fund
Financial Statements
Statement of Assets and Liabilities
| | | March 31, 2019 |
| Assets | | |
Investment in securities, at value — See accompanying schedule:
| | |
| Affiliated issuers (cost $117,339,942) | $130,841,612 | |
| Total Investment in Securities (cost $117,339,942) | | $130,841,612 |
| Cash | | 3 |
| Receivable for investments sold | | 410,033 |
| Receivable for fund shares sold | | 107,772 |
| Receivable from investment adviser for expense reductions | | 3,804 |
| Total assets | | 131,363,224 |
| Liabilities | | |
| Payable for investments purchased | $304,908 | |
| Payable for fund shares redeemed | 212,934 | |
| Transfer agent fees payable | 13,596 | |
| Total liabilities | | 531,438 |
| Net Assets | | $130,831,786 |
| Net Assets consist of: | | |
| Paid in capital | | $117,131,039 |
| Total distributable earnings (loss) | | 13,700,747 |
| Net Assets | | $130,831,786 |
| Net Asset Value and Maximum Offering Price | | |
| Investor Class: | | |
| Net Asset Value, offering price and redemption price per share ($66,875,355 ÷ 4,953,213 shares) | | $13.50 |
| Institutional Premium Class: | | |
| Net Asset Value, offering price and redemption price per share ($63,956,431 ÷ 4,736,106 shares) | | $13.50 |
See accompanying notes which are an integral part of the financial statements.
Statement of Operations
| | | Year ended March 31, 2019 |
| Investment Income | | |
| Dividends: | | |
| Affiliated issuers | | $2,668,735 |
| Expenses | | |
| Transfer agent fees | $147,679 | |
| Independent trustees' fees and expenses | 544 | |
| Total expenses before reductions | 148,223 | |
| Expense reductions | (40,391) | |
| Total expenses after reductions | | 107,832 |
| Net investment income (loss) | | 2,560,903 |
| Realized and Unrealized Gain (Loss) | | |
| Net realized gain (loss) on: | | |
| Investment securities: | | |
| Affiliated issuers | 1,137,599 | |
| Capital gain distributions from underlying funds: | | |
| Affiliated issuers | 251,179 | |
| Total net realized gain (loss) | | 1,388,778 |
| Change in net unrealized appreciation (depreciation) on: | | |
| Investment securities: | | |
| Affiliated issuers | 1,346,484 | |
| Total change in net unrealized appreciation (depreciation) | | 1,346,484 |
| Net gain (loss) | | 2,735,262 |
| Net increase (decrease) in net assets resulting from operations | | $5,296,165 |
See accompanying notes which are an integral part of the financial statements.
Statement of Changes in Net Assets
| | Year ended March 31, 2019 | Year ended March 31, 2018 |
| Increase (Decrease) in Net Assets | | |
| Operations | | |
| Net investment income (loss) | $2,560,903 | $1,789,880 |
| Net realized gain (loss) | 1,388,778 | 135,404 |
| Change in net unrealized appreciation (depreciation) | 1,346,484 | 3,048,242 |
| Net increase (decrease) in net assets resulting from operations | 5,296,165 | 4,973,526 |
| Distributions to shareholders | (3,609,349) | – |
| Distributions to shareholders from net investment income | – | (1,657,960) |
| Distributions to shareholders from net realized gain | – | (480,582) |
| Total distributions | (3,609,349) | (2,138,542) |
| Share transactions - net increase (decrease) | 15,933,338 | 19,616,925 |
| Total increase (decrease) in net assets | 17,620,154 | 22,451,909 |
| Net Assets | | |
| Beginning of period | 113,211,632 | 90,759,723 |
| End of period | $130,831,786 | $113,211,632 |
| Other Information | | |
| Undistributed net investment income end of period | | $335,631 |
See accompanying notes which are an integral part of the financial statements.
Financial Highlights
Fidelity Freedom Index 2005 Fund Investor Class
| Years ended March 31, | 2019 | 2018 | 2017 | 2016 | 2015 |
| Selected Per–Share Data | | | | | |
| Net asset value, beginning of period | $13.36 | $12.94 | $12.45 | $12.71 | $12.50 |
| Income from Investment Operations | | | | | |
| Net investment income (loss)A | .29 | .23 | .20 | .20 | .21 |
| Net realized and unrealized gain (loss) | .26 | .47 | .52 | (.25) | .39 |
| Total from investment operations | .55 | .70 | .72 | (.05) | .60 |
| Distributions from net investment income | (.26) | (.21) | (.20) | (.20) | (.33) |
| Distributions from net realized gain | (.14) | (.07) | (.03) | –B | (.06) |
| Total distributions | (.41)C | (.28) | (.23) | (.21)D | (.39) |
| Net asset value, end of period | $13.50 | $13.36 | $12.94 | $12.45 | $12.71 |
| Total ReturnE | 4.25% | 5.41% | 5.84% | (.40)% | 4.87% |
| Ratios to Average Net AssetsF,G | | | | | |
| Expenses before reductions | .15% | .15% | .15% | .15% | .15% |
| Expenses net of fee waivers, if any | .12% | .12% | .09% | .07% | .08% |
| Expenses net of all reductions | .12% | .12% | .09% | .07% | .08% |
| Net investment income (loss) | 2.16% | 1.74% | 1.60% | 1.58% | 1.65% |
| Supplemental Data | | | | | |
| Net assets, end of period (000 omitted) | $66,875 | $60,299 | $43,767 | $50,790 | $74,516 |
| Portfolio turnover rateG | 52% | 26% | 52% | 28% | 22% |
A Calculated based on average shares outstanding during the period.
B Amount represents less than $.005 per share.
C Total distributions of $.41 per share is comprised of distributions from net investment income of $.264 and distributions from net realized gain of $.142 per share.
D Total distributions of $.21 per share is comprised of distributions from net investment income of $.203 and distributions from net realized gain of $.004 per share.
E Total returns would have been lower if certain expenses had not been reduced during the applicable periods shown.
F Expense ratios reflect operating expenses of the class. Expenses before reductions do not reflect amounts reimbursed by the investment adviser or reductions from expense offset arrangements and do not represent the amount paid by the class during periods when reimbursements or reductions occur. Expenses net of fee waivers reflect expenses after reimbursement by the investment adviser but prior to reductions from expense offset arrangements. Expenses net of all reductions represent the net expenses paid by the class.
G Amount does not include the portfolio activity of any Underlying Funds.
See accompanying notes which are an integral part of the financial statements.
Fidelity Freedom Index 2005 Fund Institutional Premium Class
| Years ended March 31, | 2019 | 2018 | 2017 | 2016 A |
| Selected Per–Share Data | | | | |
| Net asset value, beginning of period | $13.36 | $12.94 | $12.45 | $12.73 |
| Income from Investment Operations | | | | |
| Net investment income (loss)B | .30 | .24 | .21 | .21 |
| Net realized and unrealized gain (loss) | .25 | .46 | .52 | (.30) |
| Total from investment operations | .55 | .70 | .73 | (.09) |
| Distributions from net investment income | (.27) | (.22) | (.21) | (.18) |
| Distributions from net realized gain | (.14) | (.07) | (.03) | –C |
| Total distributions | (.41) | (.28)D | (.24) | (.19)E |
| Net asset value, end of period | $13.50 | $13.36 | $12.94 | $12.45 |
| Total ReturnF,G | 4.31% | 5.45% | 5.90% | (.73)% |
| Ratios to Average Net AssetsH,I | | | | |
| Expenses before reductions | .10% | .10% | .09% | .05%J |
| Expenses net of fee waivers, if any | .06% | .07% | .03% | .01%J |
| Expenses net of all reductions | .06% | .07% | .03% | .01%J |
| Net investment income (loss) | 2.22% | 1.79% | 1.66% | 2.28%J |
| Supplemental Data | | | | |
| Net assets, end of period (000 omitted) | $63,956 | $52,913 | $46,992 | $28,910 |
| Portfolio turnover rateI | 52% | 26% | 52% | 28% |
A For the period June 24, 2015 (commencement of sale of shares) to March 31, 2016.
B Calculated based on average shares outstanding during the period.
C Amount represents less than $.005 per share.
D Total distributions of $.28 per share is comprised of distributions from net investment income of $.217 and distributions from net realized gain of $.066 per share.
E Total distributions of $.19 per share is comprised of distributions from net investment income of $.181 and distributions from net realized gain of $.004 per share.
F Total returns for periods of less than one year are not annualized.
G Total returns would have been lower if certain expenses had not been reduced during the applicable periods shown.
H Expense ratios reflect operating expenses of the class. Expenses before reductions do not reflect amounts reimbursed by the investment adviser or reductions from expense offset arrangements and do not represent the amount paid by the class during periods when reimbursements or reductions occur. Expense ratios before reductions for start-up periods may not be representative of longer-term operating periods. Expenses net of fee waivers reflect expenses after reimbursement by the investment adviser but prior to reductions from expense offset arrangements. Expenses net of all reductions represent the net expenses paid by the class.
I Amount does not include the portfolio activity of any Underlying Funds.
J Annualized
See accompanying notes which are an integral part of the financial statements.
Fidelity Freedom® Index 2010 Fund
Investment Summary (Unaudited)
The information in the following tables is based on the direct investments of the Fund.
Top Holdings as of March 31, 2019
| | % of fund's net assets |
| Fidelity U.S. Bond Index Fund Class F | 39.2 |
| Fidelity Total Market Index Fund Class F | 25.3 |
| Fidelity Series Treasury Bill Index Fund | 14.6 |
| Fidelity Series Global ex U.S. Index Fund | 10.8 |
| Fidelity Series Inflation-Protected Bond Index Fund | 7.1 |
| Fidelity Series Long-Term Treasury Bond Index Fund | 3.0 |
| Fidelity Cash Central Fund, 2.48% | 0.0 |
| | 100.0 |
Asset Allocation (% of fund's net assets)
| Period end |
| | Domestic Equity Funds | 25.3% |
| | International Equity Funds | 10.8% |
| | Bond Funds | 42.2% |
| | Inflation-Protected Bond Funds | 7.1% |
| | Short-Term Funds | 14.6% |

Percentages shown as 0.0% may reflect amounts less than 0.05%.
Fidelity Freedom® Index 2010 Fund
Schedule of Investments March 31, 2019
Showing Percentage of Net Assets
| Domestic Equity Funds - 25.3% | | | |
| | | Shares | Value |
| Fidelity Total Market Index Fund Class F (a) | | | |
| (Cost $62,743,808) | | 1,768,475 | 142,397,568 |
|
| International Equity Funds - 10.8% | | | |
| Fidelity Series Global ex U.S. Index Fund (a) | | | |
| (Cost $51,176,824) | | 4,990,978 | 60,989,749 |
|
| Bond Funds - 42.2% | | | |
| Fidelity Series Long-Term Treasury Bond Index Fund (a) | | 1,938,301 | 17,192,727 |
| Fidelity U.S. Bond Index Fund Class F (a) | | 19,168,456 | 221,012,303 |
| TOTAL BOND FUNDS | | | |
| (Cost $236,301,100) | | | 238,205,030 |
|
| Inflation-Protected Bond Funds - 7.1% | | | |
| Fidelity Series Inflation-Protected Bond Index Fund (a) | | | |
| (Cost $40,910,425) | | 4,111,391 | 40,209,406 |
|
| Short-Term Funds - 14.6% | | | |
| Fidelity Cash Central Fund, 2.48% (b) | | 5 | 5 |
| Fidelity Series Treasury Bill Index Fund (a) | | 8,247,097 | 82,388,494 |
| TOTAL SHORT-TERM FUNDS | | | |
| (Cost $82,466,510) | | | 82,388,499 |
| TOTAL INVESTMENT IN SECURITIES - 100.0% | | | |
| (Cost $473,598,667) | | | 564,190,252 |
| NET OTHER ASSETS (LIABILITIES) - 0.0% | | | (38,646) |
| NET ASSETS - 100% | | | $564,151,606 |
Legend
(a) Affiliated Fund
(b) Affiliated fund that is generally available only to investment companies and other accounts managed by Fidelity Investments. The rate quoted is the annualized seven-day yield of the fund at period end. A complete unaudited listing of the fund's holdings as of its most recent quarter end is available upon request. In addition, each Fidelity Central Fund's financial statements, which are not covered by the Fund's Report of Independent Registered Public Accounting Firm, are available on the SEC's website or upon request.
Affiliated Central Funds
Information regarding fiscal year to date income earned by the Fund from investments in Fidelity Central Funds is as follows:
| Fund | Income earned |
| Fidelity Cash Central Fund | $23 |
| Total | $23 |
Amounts in the income column in the above table include any capital gain distributions from underlying funds, which are presented in the corresponding line-item in the Statement of Operations, if applicable.
Affiliated Underlying Funds
Fiscal year to date information regarding the Fund's investments in affiliated Underlying Funds, excluding any Money Market Central Funds, is presented below. Exchanges between classes of the same affiliated Underlying Funds may occur.
| Affiliate | Value, beginning of period | Purchases | Sales Proceeds | Dividend Income | Realized Gain (loss) | Change in Unrealized appreciation (depreciation) | Value, end of period |
| Fidelity Commodity Strategy Fund Class F | $6,128,984 | $160,916 | $6,172,496 | $-- | $174,426 | $(291,830) | $-- |
| Fidelity Series Global ex U.S. Index Fund | 69,890,623 | 13,951,346 | 18,335,057 | 1,589,549 | 433,292 | (4,950,455) | 60,989,749 |
| Fidelity Series Government Money Market Fund 2.5% | 104,377,971 | 5,402,970 | 109,780,941 | 756,877 | -- | -- | -- |
| Fidelity Series Inflation-Protected Bond Index Fund | 24,063,708 | 21,908,160 | 6,006,895 | 705,230 | (167,072) | 411,505 | 40,209,406 |
| Fidelity Series Long-Term Treasury Bond Index Fund | -- | 19,351,521 | 2,936,094 | 323,626 | (5,883) | 783,183 | 17,192,727 |
| Fidelity Series Treasury Bill Index Fund | -- | 92,625,014 | 10,156,205 | 1,226,728 | (2,304) | (78,011) | 82,388,494 |
| Fidelity Total Market Index Fund Class F | 157,960,054 | 33,869,516 | 60,400,408 | 3,234,797 | 12,102,929 | (1,134,523) | 142,397,568 |
| Fidelity U.S. Bond Index Fund Class F | 196,531,759 | 62,860,516 | 41,993,015 | 5,822,259 | (668,358) | 4,281,401 | 221,012,303 |
| | $558,953,099 | $250,129,959 | $255,781,111 | $13,659,066 | $11,867,030 | $(978,730) | $564,190,247 |
Amounts in the income column in the above table include any capital gain distributions from underlying funds, which are presented in the corresponding line-item in the Statement of Operations, if applicable.
Investment Valuation
All investments are categorized as Level 1 under the Fair Value Hierarchy. The inputs or methodology used for valuing securities may not be an indication of the risk associated with investing in those securities. For more information on valuation inputs please refer to the Investment Valuation section in the accompanying Notes to Financial Statements.
See accompanying notes which are an integral part of the financial statements.
Fidelity Freedom® Index 2010 Fund
Financial Statements
Statement of Assets and Liabilities
| | | March 31, 2019 |
| Assets | | |
Investment in securities, at value — See accompanying schedule:
| | |
| Fidelity Central Funds (cost $5) | $5 | |
| Other affiliated issuers (cost $473,598,662) | 564,190,247 | |
| Total Investment in Securities (cost $473,598,667) | | $564,190,252 |
| Cash | | 24 |
| Receivable for investments sold | | 960,845 |
| Receivable for fund shares sold | | 422,093 |
| Receivable from investment adviser for expense reductions | | 17,623 |
| Total assets | | 565,590,837 |
| Liabilities | | |
| Payable for investments purchased | $1,234,770 | |
| Payable for fund shares redeemed | 148,044 | |
| Transfer agent fees payable | 56,417 | |
| Total liabilities | | 1,439,231 |
| Net Assets | | $564,151,606 |
| Net Assets consist of: | | |
| Paid in capital | | $472,391,642 |
| Total distributable earnings (loss) | | 91,759,964 |
| Net Assets | | $564,151,606 |
| Net Asset Value and Maximum Offering Price | | |
| Investor Class: | | |
| Net Asset Value, offering price and redemption price per share ($254,371,020 ÷ 17,951,219 shares) | | $14.17 |
| Institutional Premium Class: | | |
| Net Asset Value, offering price and redemption price per share ($309,780,586 ÷ 21,859,896 shares) | | $14.17 |
See accompanying notes which are an integral part of the financial statements.
Statement of Operations
| | | Year ended March 31, 2019 |
| Investment Income | | |
| Dividends: | | |
| Affiliated issuers | | $12,475,481 |
| Income from Fidelity Central Funds | | 23 |
| Total income | | 12,475,504 |
| Expenses | | |
| Transfer agent fees | $673,197 | |
| Independent trustees' fees and expenses | 2,618 | |
| Total expenses before reductions | 675,815 | |
| Expense reductions | (205,819) | |
| Total expenses after reductions | | 469,996 |
| Net investment income (loss) | | 12,005,508 |
| Realized and Unrealized Gain (Loss) | | |
| Net realized gain (loss) on: | | |
| Investment securities: | | |
| Affiliated issuers | 11,867,030 | |
| Capital gain distributions from underlying funds: | | |
| Affiliated issuers | 1,183,585 | |
| Total net realized gain (loss) | | 13,050,615 |
| Change in net unrealized appreciation (depreciation) on: | | |
| Investment securities: | | |
| Affiliated issuers | (978,730) | |
| Total change in net unrealized appreciation (depreciation) | | (978,730) |
| Net gain (loss) | | 12,071,885 |
| Net increase (decrease) in net assets resulting from operations | | $24,077,393 |
See accompanying notes which are an integral part of the financial statements.
Statement of Changes in Net Assets
| | Year ended March 31, 2019 | Year ended March 31, 2018 |
| Increase (Decrease) in Net Assets | | |
| Operations | | |
| Net investment income (loss) | $12,005,508 | $9,438,265 |
| Net realized gain (loss) | 13,050,615 | 3,283,824 |
| Change in net unrealized appreciation (depreciation) | (978,730) | 19,510,988 |
| Net increase (decrease) in net assets resulting from operations | 24,077,393 | 32,233,077 |
| Distributions to shareholders | (25,813,763) | – |
| Distributions to shareholders from net investment income | – | (8,877,889) |
| Distributions to shareholders from net realized gain | – | (4,895,182) |
| Total distributions | (25,813,763) | (13,773,071) |
| Share transactions - net increase (decrease) | 6,980,109 | 49,007,232 |
| Total increase (decrease) in net assets | 5,243,739 | 67,467,238 |
| Net Assets | | |
| Beginning of period | 558,907,867 | 491,440,629 |
| End of period | $564,151,606 | $558,907,867 |
| Other Information | | |
| Undistributed net investment income end of period | | $1,607,760 |
See accompanying notes which are an integral part of the financial statements.
Financial Highlights
Fidelity Freedom Index 2010 Fund Investor Class
| Years ended March 31, | 2019 | 2018 | 2017 | 2016 | 2015 |
| Selected Per–Share Data | | | | | |
| Net asset value, beginning of period | $14.25 | $13.72 | $13.03 | $13.36 | $13.08 |
| Income from Investment Operations | | | | | |
| Net investment income (loss)A | .30 | .25 | .23 | .20 | .23 |
| Net realized and unrealized gain (loss) | .29 | .65 | .71 | (.30) | .46 |
| Total from investment operations | .59 | .90 | .94 | (.10) | .69 |
| Distributions from net investment income | (.30) | (.24) | (.22) | (.23) | (.35) |
| Distributions from net realized gain | (.37) | (.14) | (.02) | –B | (.05) |
| Total distributions | (.67) | (.37)C | (.25)D | (.23) | (.41)E |
| Net asset value, end of period | $14.17 | $14.25 | $13.72 | $13.03 | $13.36 |
| Total ReturnF | 4.43% | 6.62% | 7.24% | (.72)% | 5.36% |
| Ratios to Average Net AssetsG,H | | | | | |
| Expenses before reductions | .15% | .15% | .15% | .15% | .15% |
| Expenses net of fee waivers, if any | .12% | .12% | .09% | .08% | .08% |
| Expenses net of all reductions | .12% | .12% | .09% | .08% | .08% |
| Net investment income (loss) | 2.13% | 1.77% | 1.70% | 1.52% | 1.72% |
| Supplemental Data | | | | | |
| Net assets, end of period (000 omitted) | $254,371 | $239,660 | $205,267 | $232,187 | $480,861 |
| Portfolio turnover rateH | 45% | 22% | 36% | 22% | 23% |
A Calculated based on average shares outstanding during the period.
B Amount represents less than $.005 per share.
C Total distributions of $.37 per share is comprised of distributions from net investment income of $.235 and distributions from net realized gain of $.137 per share.
D Total distributions of $.25 per share is comprised of distributions from net investment income of $.221 and distributions from net realized gain of $.024 per share.
E Total distributions of $.41 per share is comprised of distributions from net investment income of $.353 and distributions from net realized gain of $.055 per share.
F Total returns would have been lower if certain expenses had not been reduced during the applicable periods shown.
G Expense ratios reflect operating expenses of the class. Expenses before reductions do not reflect amounts reimbursed by the investment adviser or reductions from expense offset arrangements and do not represent the amount paid by the class during periods when reimbursements or reductions occur. Expenses net of fee waivers reflect expenses after reimbursement by the investment adviser but prior to reductions from expense offset arrangements. Expenses net of all reductions represent the net expenses paid by the class.
H Amount does not include the portfolio activity of any Underlying Funds.
See accompanying notes which are an integral part of the financial statements.
Fidelity Freedom Index 2010 Fund Institutional Premium Class
| Years ended March 31, | 2019 | 2018 | 2017 | 2016 A |
| Selected Per–Share Data | | | | |
| Net asset value, beginning of period | $14.25 | $13.73 | $13.03 | $13.43 |
| Income from Investment Operations | | | | |
| Net investment income (loss)B | .31 | .26 | .24 | .27 |
| Net realized and unrealized gain (loss) | .29 | .64 | .71 | (.46) |
| Total from investment operations | .60 | .90 | .95 | (.19) |
| Distributions from net investment income | (.31) | (.24) | (.23) | (.21) |
| Distributions from net realized gain | (.37) | (.14) | (.02) | –C |
| Total distributions | (.68) | (.38) | (.25) | (.21) |
| Net asset value, end of period | $14.17 | $14.25 | $13.73 | $13.03 |
| Total ReturnD,E | 4.49% | 6.59% | 7.39% | (1.39)% |
| Ratios to Average Net AssetsF,G | | | | |
| Expenses before reductions | .10% | .10% | .09% | .05%H |
| Expenses net of fee waivers, if any | .06% | .07% | .04% | .02%H |
| Expenses net of all reductions | .06% | .07% | .04% | .02%H |
| Net investment income (loss) | 2.19% | 1.82% | 1.75% | 2.81%H |
| Supplemental Data | | | | |
| Net assets, end of period (000 omitted) | $309,781 | $319,248 | $286,173 | $215,392 |
| Portfolio turnover rateG | 45% | 22% | 36% | 22% |
A For the period June 24, 2015 (commencement of sale of shares) to March 31, 2016.
B Calculated based on average shares outstanding during the period.
C Amount represents less than $.005 per share.
D Total returns for periods of less than one year are not annualized.
E Total returns would have been lower if certain expenses had not been reduced during the applicable periods shown.
F Expense ratios reflect operating expenses of the class. Expenses before reductions do not reflect amounts reimbursed by the investment adviser or reductions from expense offset arrangements and do not represent the amount paid by the class during periods when reimbursements or reductions occur. Expense ratios before reductions for start-up periods may not be representative of longer-term operating periods. Expenses net of fee waivers reflect expenses after reimbursement by the investment adviser but prior to reductions from expense offset arrangements. Expenses net of all reductions represent the net expenses paid by the class.
G Amount does not include the portfolio activity of any Underlying Funds.
H Annualized
See accompanying notes which are an integral part of the financial statements.
Fidelity Freedom® Index 2015 Fund
Investment Summary (Unaudited)
The information in the following tables is based on the direct investments of the Fund.
Top Holdings as of March 31, 2019
| | % of fund's net assets |
| Fidelity U.S. Bond Index Fund Class F | 35.4 |
| Fidelity Total Market Index Fund Class F | 31.7 |
| Fidelity Series Global ex U.S. Index Fund | 13.5 |
| Fidelity Series Treasury Bill Index Fund | 10.4 |
| Fidelity Series Inflation-Protected Bond Index Fund | 5.9 |
| Fidelity Series Long-Term Treasury Bond Index Fund | 3.1 |
| Fidelity Cash Central Fund, 2.48% | 0.0 |
| | 100.0 |
Asset Allocation (% of fund's net assets)
| Period end |
| | Domestic Equity Funds | 31.7% |
| | International Equity Funds | 13.5% |
| | Bond Funds | 38.5% |
| | Inflation-Protected Bond Funds | 5.9% |
| | Short-Term Funds | 10.4% |
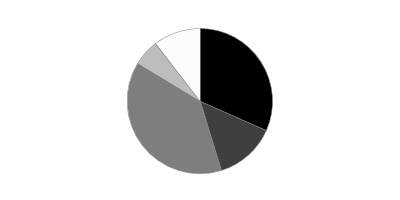
Percentages shown as 0.0% may reflect amounts less than 0.05%.
Fidelity Freedom® Index 2015 Fund
Schedule of Investments March 31, 2019
Showing Percentage of Net Assets
| Domestic Equity Funds - 31.7% | | | |
| | | Shares | Value |
| Fidelity Total Market Index Fund Class F (a) | | | |
| (Cost $205,627,150) | | 5,191,249 | 417,999,393 |
|
| International Equity Funds - 13.5% | | | |
| Fidelity Series Global ex U.S. Index Fund (a) | | | |
| (Cost $155,370,946) | | 14,624,286 | 178,708,770 |
|
| Bond Funds - 38.5% | | | |
| Fidelity Series Long-Term Treasury Bond Index Fund (a) | | 4,544,597 | 40,310,575 |
| Fidelity U.S. Bond Index Fund Class F (a) | | 40,498,897 | 466,952,280 |
| TOTAL BOND FUNDS | | | |
| (Cost $503,869,168) | | | 507,262,855 |
|
| Inflation-Protected Bond Funds - 5.9% | | | |
| Fidelity Series Inflation-Protected Bond Index Fund (a) | | | |
| (Cost $79,122,685) | | 7,933,466 | 77,589,300 |
|
| Short-Term Funds - 10.4% | | | |
| Fidelity Cash Central Fund, 2.48% (b) | | 13 | 13 |
| Fidelity Series Treasury Bill Index Fund (a) | | 13,793,274 | 137,794,811 |
| TOTAL SHORT-TERM FUNDS | | | |
| (Cost $137,925,567) | | | 137,794,824 |
| TOTAL INVESTMENT IN SECURITIES - 100.0% | | | |
| (Cost $1,081,915,516) | | | 1,319,355,142 |
| NET OTHER ASSETS (LIABILITIES) - 0.0% | | | (95,075) |
| NET ASSETS - 100% | | | $1,319,260,067 |
Legend
(a) Affiliated Fund
(b) Affiliated fund that is generally available only to investment companies and other accounts managed by Fidelity Investments. The rate quoted is the annualized seven-day yield of the fund at period end. A complete unaudited listing of the fund's holdings as of its most recent quarter end is available upon request. In addition, each Fidelity Central Fund's financial statements, which are not covered by the Fund's Report of Independent Registered Public Accounting Firm, are available on the SEC's website or upon request.
Affiliated Central Funds
Information regarding fiscal year to date income earned by the Fund from investments in Fidelity Central Funds is as follows:
| Fund | Income earned |
| Fidelity Cash Central Fund | $37 |
| Total | $37 |
Amounts in the income column in the above table include any capital gain distributions from underlying funds, which are presented in the corresponding line-item in the Statement of Operations, if applicable.
Affiliated Underlying Funds
Fiscal year to date information regarding the Fund's investments in affiliated Underlying Funds, excluding any Money Market Central Funds, is presented below. Exchanges between classes of the same affiliated Underlying Funds may occur.
| Affiliate | Value, beginning of period | Purchases | Sales Proceeds | Dividend Income | Realized Gain (loss) | Change in Unrealized appreciation (depreciation) | Value, end of period |
| Fidelity Commodity Strategy Fund Class F | $13,941,549 | $815,494 | $14,465,739 | $-- | $370,610 | $(661,914) | $-- |
| Fidelity Series Global ex U.S. Index Fund | 181,915,405 | 44,518,228 | 35,507,423 | 4,520,754 | (515,537) | (11,701,903) | 178,708,770 |
| Fidelity Series Government Money Market Fund 2.5% | 159,390,236 | 13,574,275 | 172,964,511 | 1,192,251 | -- | -- | -- |
| Fidelity Series Inflation-Protected Bond Index Fund | 41,930,197 | 43,818,028 | 8,653,438 | 1,324,878 | (79,149) | 573,662 | 77,589,300 |
| Fidelity Series Long-Term Treasury Bond Index Fund | -- | 44,414,381 | 5,962,036 | 743,467 | (4,041) | 1,862,271 | 40,310,575 |
| Fidelity Series Treasury Bill Index Fund | -- | 150,872,379 | 12,942,632 | 2,001,900 | (4,192) | (130,744) | 137,794,811 |
| Fidelity Total Market Index Fund Class F | 412,852,646 | 105,243,672 | 130,582,020 | 9,096,126 | 13,812,804 | 16,672,291 | 417,999,393 |
| Fidelity U.S. Bond Index Fund Class F | 387,717,936 | 142,233,147 | 70,879,751 | 11,952,417 | (1,520,786) | 9,401,734 | 466,952,280 |
| | $1,197,747,969 | $545,489,604 | $451,957,550 | $30,831,793 | $12,059,709 | $16,015,397 | $1,319,355,129 |
Amounts in the income column in the above table include any capital gain distributions from underlying funds, which are presented in the corresponding line-item in the Statement of Operations, if applicable.
Investment Valuation
All investments are categorized as Level 1 under the Fair Value Hierarchy. The inputs or methodology used for valuing securities may not be an indication of the risk associated with investing in those securities. For more information on valuation inputs please refer to the Investment Valuation section in the accompanying Notes to Financial Statements.
See accompanying notes which are an integral part of the financial statements.
Fidelity Freedom® Index 2015 Fund
Financial Statements
Statement of Assets and Liabilities
| | | March 31, 2019 |
| Assets | | |
Investment in securities, at value — See accompanying schedule:
| | |
| Fidelity Central Funds (cost $13) | $13 | |
| Other affiliated issuers (cost $1,081,915,503) | 1,319,355,129 | |
| Total Investment in Securities (cost $1,081,915,516) | | $1,319,355,142 |
| Cash | | 30 |
| Receivable for investments sold | | 2,039,226 |
| Receivable for fund shares sold | | 1,287,710 |
| Receivable from investment adviser for expense reductions | | 42,878 |
| Total assets | | 1,322,724,986 |
| Liabilities | | |
| Payable for investments purchased | $2,112,910 | |
| Payable for fund shares redeemed | 1,213,465 | |
| Transfer agent fees payable | 138,544 | |
| Total liabilities | | 3,464,919 |
| Net Assets | | $1,319,260,067 |
| Net Assets consist of: | | |
| Paid in capital | | $1,080,557,864 |
| Total distributable earnings (loss) | | 238,702,203 |
| Net Assets | | $1,319,260,067 |
| Net Asset Value and Maximum Offering Price | | |
| Investor Class: | | |
| Net Asset Value, offering price and redemption price per share ($721,922,090 ÷ 47,840,758 shares) | | $15.09 |
| Institutional Premium Class: | | |
| Net Asset Value, offering price and redemption price per share ($597,337,977 ÷ 39,602,326 shares) | | $15.08 |
See accompanying notes which are an integral part of the financial statements.
Statement of Operations
| | | Year ended March 31, 2019 |
| Investment Income | | |
| Dividends: | | |
| Affiliated issuers | | $28,030,330 |
| Income from Fidelity Central Funds | | 37 |
| Total income | | 28,030,367 |
| Expenses | | |
| Transfer agent fees | $1,583,007 | |
| Independent trustees' fees and expenses | 5,845 | |
| Total expenses before reductions | 1,588,852 | |
| Expense reductions | (482,151) | |
| Total expenses after reductions | | 1,106,701 |
| Net investment income (loss) | | 26,923,666 |
| Realized and Unrealized Gain (Loss) | | |
| Net realized gain (loss) on: | | |
| Investment securities: | | |
| Affiliated issuers | 12,059,709 | |
| Capital gain distributions from underlying funds: | | |
| Affiliated issuers | 2,801,463 | |
| Total net realized gain (loss) | | 14,861,172 |
| Change in net unrealized appreciation (depreciation) on: | | |
| Investment securities: | | |
| Affiliated issuers | 16,015,397 | |
| Total change in net unrealized appreciation (depreciation) | | 16,015,397 |
| Net gain (loss) | | 30,876,569 |
| Net increase (decrease) in net assets resulting from operations | | $57,800,235 |
See accompanying notes which are an integral part of the financial statements.
Statement of Changes in Net Assets
| | Year ended March 31, 2019 | Year ended March 31, 2018 |
| Increase (Decrease) in Net Assets | | |
| Operations | | |
| Net investment income (loss) | $26,923,666 | $20,647,350 |
| Net realized gain (loss) | 14,861,172 | 2,325,860 |
| Change in net unrealized appreciation (depreciation) | 16,015,397 | 59,059,272 |
| Net increase (decrease) in net assets resulting from operations | 57,800,235 | 82,032,482 |
| Distributions to shareholders | (39,581,607) | – |
| Distributions to shareholders from net investment income | – | (19,558,222) |
| Distributions to shareholders from net realized gain | – | (3,080,301) |
| Total distributions | (39,581,607) | (22,638,523) |
| Share transactions - net increase (decrease) | 103,392,576 | 101,046,987 |
| Total increase (decrease) in net assets | 121,611,204 | 160,440,946 |
| Net Assets | | |
| Beginning of period | 1,197,648,863 | 1,037,207,917 |
| End of period | $1,319,260,067 | $1,197,648,863 |
| Other Information | | |
| Undistributed net investment income end of period | | $2,842,220 |
See accompanying notes which are an integral part of the financial statements.
Financial Highlights
Fidelity Freedom Index 2015 Fund Investor Class
| Years ended March 31, | 2019 | 2018 | 2017 | 2016 | 2015 |
| Selected Per–Share Data | | | | | |
| Net asset value, beginning of period | $14.92 | $14.11 | $13.22 | $13.62 | $13.31 |
| Income from Investment Operations | | | | | |
| Net investment income (loss)A | .32 | .27 | .25 | .23 | .25 |
| Net realized and unrealized gain (loss) | .33 | .83 | .89 | (.38) | .52 |
| Total from investment operations | .65 | 1.10 | 1.14 | (.15) | .77 |
| Distributions from net investment income | (.31) | (.25) | (.24) | (.25) | (.41) |
| Distributions from net realized gain | (.17) | (.04) | (.01) | –B | (.05) |
| Total distributions | (.48) | (.29) | (.25) | (.25) | (.46) |
| Net asset value, end of period | $15.09 | $14.92 | $14.11 | $13.22 | $13.62 |
| Total ReturnC | 4.55% | 7.82% | 8.71% | (1.10)% | 5.87% |
| Ratios to Average Net AssetsD,E | | | | | |
| Expenses before reductions | .15% | .15% | .15% | .15% | .15% |
| Expenses net of fee waivers, if any | .12% | .12% | .10% | .08% | .08% |
| Expenses net of all reductions | .12% | .12% | .10% | .08% | .08% |
| Net investment income (loss) | 2.12% | 1.81% | 1.80% | 1.70% | 1.86% |
| Supplemental Data | | | | | |
| Net assets, end of period (000 omitted) | $721,922 | $637,221 | $516,456 | $577,905 | $910,801 |
| Portfolio turnover rateE | 36% | 17% | 29% | 22% | 19% |
A Calculated based on average shares outstanding during the period.
B Amount represents less than $.005 per share.
C Total returns would have been lower if certain expenses had not been reduced during the applicable periods shown.
D Expense ratios reflect operating expenses of the class. Expenses before reductions do not reflect amounts reimbursed by the investment adviser or reductions from expense offset arrangements and do not represent the amount paid by the class during periods when reimbursements or reductions occur. Expenses net of fee waivers reflect expenses after reimbursement by the investment adviser but prior to reductions from expense offset arrangements. Expenses net of all reductions represent the net expenses paid by the class.
E Amount does not include the portfolio activity of any Underlying Funds.
See accompanying notes which are an integral part of the financial statements.
Fidelity Freedom Index 2015 Fund Institutional Premium Class
| Years ended March 31, | 2019 | 2018 | 2017 | 2016 A |
| Selected Per–Share Data | | | | |
| Net asset value, beginning of period | $14.92 | $14.10 | $13.21 | $13.72 |
| Income from Investment Operations | | | | |
| Net investment income (loss)B | .33 | .27 | .25 | .28 |
| Net realized and unrealized gain (loss) | .31 | .85 | .90 | (.56) |
| Total from investment operations | .64 | 1.12 | 1.15 | (.28) |
| Distributions from net investment income | (.32) | (.26) | (.25) | (.23) |
| Distributions from net realized gain | (.17) | (.04) | (.01) | –C |
| Total distributions | (.48)D | (.30) | (.26) | (.23) |
| Net asset value, end of period | $15.08 | $14.92 | $14.10 | $13.21 |
| Total ReturnE,F | 4.55% | 7.94% | 8.79% | (2.03)% |
| Ratios to Average Net AssetsG,H | | | | |
| Expenses before reductions | .10% | .10% | .09% | .05%I |
| Expenses net of fee waivers, if any | .06% | .07% | .04% | .02%I |
| Expenses net of all reductions | .06% | .07% | .04% | .02%I |
| Net investment income (loss) | 2.18% | 1.86% | 1.85% | 2.84%I |
| Supplemental Data | | | | |
| Net assets, end of period (000 omitted) | $597,338 | $560,428 | $520,752 | $330,221 |
| Portfolio turnover rateH | 36% | 17% | 29% | 22% |
A For the period June 24, 2015 (commencement of sale of shares) to March 31, 2016.
B Calculated based on average shares outstanding during the period.
C Amount represents less than $.005 per share.
D Total distributions of $.48 per share is comprised of distributions from net investment income of $.315 and distributions from net realized gain of $.169 per share.
E Total returns for periods of less than one year are not annualized.
F Total returns would have been lower if certain expenses had not been reduced during the applicable periods shown.
G Expense ratios reflect operating expenses of the class. Expenses before reductions do not reflect amounts reimbursed by the investment adviser or reductions from expense offset arrangements and do not represent the amount paid by the class during periods when reimbursements or reductions occur. Expense ratios before reductions for start-up periods may not be representative of longer-term operating periods. Expenses net of fee waivers reflect expenses after reimbursement by the investment adviser but prior to reductions from expense offset arrangements. Expenses net of all reductions represent the net expenses paid by the class.
H Amount does not include the portfolio activity of any Underlying Funds.
I Annualized
See accompanying notes which are an integral part of the financial statements.
Fidelity Freedom® Index 2020 Fund
Investment Summary (Unaudited)
The information in the following tables is based on the direct investments of the Fund.
Top Holdings as of March 31, 2019
| | % of fund's net assets |
| Fidelity Total Market Index Fund Class F | 37.1 |
| Fidelity U.S. Bond Index Fund Class F | 32.2 |
| Fidelity Series Global ex U.S. Index Fund | 15.8 |
| Fidelity Series Treasury Bill Index Fund | 7.0 |
| Fidelity Series Inflation-Protected Bond Index Fund | 4.8 |
| Fidelity Series Long-Term Treasury Bond Index Fund | 3.1 |
| Fidelity Cash Central Fund, 2.48% | 0.0 |
| | 100.0 |
Asset Allocation (% of fund's net assets)
| Period end |
| | Domestic Equity Funds | 37.1% |
| | International Equity Funds | 15.8% |
| | Bond Funds | 35.3% |
| | Inflation-Protected Bond Funds | 4.8% |
| | Short-Term Funds | 7.0% |

Percentages shown as 0.0% may reflect amounts less than 0.05%.
Fidelity Freedom® Index 2020 Fund
Schedule of Investments March 31, 2019
Showing Percentage of Net Assets
| Domestic Equity Funds - 37.1% | | | |
| | | Shares | Value |
| Fidelity Total Market Index Fund Class F (a) | | | |
| (Cost $977,657,303) | | 20,758,224 | 1,671,452,164 |
|
| International Equity Funds - 15.8% | | | |
| Fidelity Series Global ex U.S. Index Fund (a) | | | |
| (Cost $642,616,130) | | 58,351,768 | 713,058,609 |
|
| Bond Funds - 35.3% | | | |
| Fidelity Series Long-Term Treasury Bond Index Fund (a) | | 15,553,048 | 137,955,533 |
| Fidelity U.S. Bond Index Fund Class F (a) | | 125,613,557 | 1,448,324,317 |
| TOTAL BOND FUNDS | | | |
| (Cost $1,578,649,495) | | | 1,586,279,850 |
|
| Inflation-Protected Bond Funds - 4.8% | | | |
| Fidelity Series Inflation-Protected Bond Index Fund (a) | | | |
| (Cost $216,745,731) | | 21,924,737 | 214,423,927 |
|
| Short-Term Funds - 7.0% | | | |
| Fidelity Cash Central Fund, 2.48% (b) | | 1 | 1 |
| Fidelity Series Treasury Bill Index Fund (a) | | 31,551,832 | 315,202,799 |
| TOTAL SHORT-TERM FUNDS | | | |
| (Cost $315,499,428) | | | 315,202,800 |
| TOTAL INVESTMENT IN SECURITIES - 100.0% | | | |
| (Cost $3,731,168,087) | | | 4,500,417,350 |
| NET OTHER ASSETS (LIABILITIES) - 0.0% | | | (292,421) |
| NET ASSETS - 100% | | | $4,500,124,929 |
Legend
(a) Affiliated Fund
(b) Affiliated fund that is generally available only to investment companies and other accounts managed by Fidelity Investments. The rate quoted is the annualized seven-day yield of the fund at period end. A complete unaudited listing of the fund's holdings as of its most recent quarter end is available upon request. In addition, each Fidelity Central Fund's financial statements, which are not covered by the Fund's Report of Independent Registered Public Accounting Firm, are available on the SEC's website or upon request.
Affiliated Central Funds
Information regarding fiscal year to date income earned by the Fund from investments in Fidelity Central Funds is as follows:
| Fund | Income earned |
| Fidelity Cash Central Fund | $160 |
| Total | $160 |
Amounts in the income column in the above table include any capital gain distributions from underlying funds, which are presented in the corresponding line-item in the Statement of Operations, if applicable.
Affiliated Underlying Funds
Fiscal year to date information regarding the Fund's investments in affiliated Underlying Funds, excluding any Money Market Central Funds, is presented below. Exchanges between classes of the same affiliated Underlying Funds may occur.
| Affiliate | Value, beginning of period | Purchases | Sales Proceeds | Dividend Income | Realized Gain (loss) | Change in Unrealized appreciation (depreciation) | Value, end of period |
| Fidelity Commodity Strategy Fund Class F | $47,482,685 | $2,113,609 | $48,633,352 | $-- | $1,293,723 | $(2,256,665) | $-- |
| Fidelity Series Global ex U.S. Index Fund | 678,623,098 | 158,901,926 | 78,193,338 | 17,582,157 | (1,551,472) | (44,721,605) | 713,058,609 |
| Fidelity Series Government Money Market Fund 2.5% | 366,497,885 | 25,183,237 | 391,681,122 | 2,706,667 | -- | -- | -- |
| Fidelity Series Inflation-Protected Bond Index Fund | 106,069,446 | 124,631,238 | 17,605,812 | 3,599,790 | (611,487) | 1,940,542 | 214,423,927 |
| Fidelity Series Long-Term Treasury Bond Index Fund | -- | 148,610,064 | 16,986,041 | 2,480,809 | (108,437) | 6,439,947 | 137,955,533 |
| Fidelity Series Treasury Bill Index Fund | -- | 336,928,665 | 21,421,841 | 4,484,447 | (7,398) | (296,627) | 315,202,799 |
| Fidelity Total Market Index Fund Class F | 1,544,841,749 | 360,418,757 | 347,904,949 | 35,131,418 | 14,787,379 | 99,309,228 | 1,671,452,164 |
| Fidelity U.S. Bond Index Fund Class F | 1,199,342,406 | 402,987,403 | 178,161,996 | 36,458,214 | (4,965,119) | 29,121,623 | 1,448,324,317 |
| | $3,942,857,269 | $1,559,774,899 | $1,100,588,451 | $102,443,502 | $8,837,189 | $89,536,443 | $4,500,417,349 |
Amounts in the income column in the above table include any capital gain distributions from underlying funds, which are presented in the corresponding line-item in the Statement of Operations, if applicable.
Investment Valuation
All investments are categorized as Level 1 under the Fair Value Hierarchy. The inputs or methodology used for valuing securities may not be an indication of the risk associated with investing in those securities. For more information on valuation inputs please refer to the Investment Valuation section in the accompanying Notes to Financial Statements.
See accompanying notes which are an integral part of the financial statements.
Fidelity Freedom® Index 2020 Fund
Financial Statements
Statement of Assets and Liabilities
| | | March 31, 2019 |
| Assets | | |
Investment in securities, at value — See accompanying schedule:
| | |
| Fidelity Central Funds (cost $1) | $1 | |
| Other affiliated issuers (cost $3,731,168,086) | 4,500,417,349 | |
| Total Investment in Securities (cost $3,731,168,087) | | $4,500,417,350 |
| Cash | | 158 |
| Receivable for investments sold | | 3,066,213 |
| Receivable for fund shares sold | | 5,160,404 |
| Receivable from investment adviser for expense reductions | | 156,951 |
| Total assets | | 4,508,801,076 |
| Liabilities | | |
| Payable for investments purchased | $5,755,285 | |
| Payable for fund shares redeemed | 2,469,751 | |
| Transfer agent fees payable | 451,111 | |
| Total liabilities | | 8,676,147 |
| Net Assets | | $4,500,124,929 |
| Net Assets consist of: | | |
| Paid in capital | | $3,729,302,225 |
| Total distributable earnings (loss) | | 770,822,704 |
| Net Assets | | $4,500,124,929 |
| Net Asset Value and Maximum Offering Price | | |
| Investor Class: | | |
| Net Asset Value, offering price and redemption price per share ($1,971,676,075 ÷ 123,122,640 shares) | | $16.01 |
| Institutional Premium Class: | | |
| Net Asset Value, offering price and redemption price per share ($2,528,448,854 ÷ 157,931,248 shares) | | $16.01 |
See accompanying notes which are an integral part of the financial statements.
Statement of Operations
| | | Year ended March 31, 2019 |
| Investment Income | | |
| Dividends: | | |
| Affiliated issuers | | $92,839,715 |
| Income from Fidelity Central Funds | | 160 |
| Total income | | 92,839,875 |
| Expenses | | |
| Transfer agent fees | $5,020,215 | |
| Independent trustees' fees and expenses | 19,329 | |
| Total expenses before reductions | 5,039,544 | |
| Expense reductions | (1,709,914) | |
| Total expenses after reductions | | 3,329,630 |
| Net investment income (loss) | | 89,510,245 |
| Realized and Unrealized Gain (Loss) | | |
| Net realized gain (loss) on: | | |
| Investment securities: | | |
| Affiliated issuers | 8,837,189 | |
| Capital gain distributions from underlying funds: | | |
| Affiliated issuers | 9,603,787 | |
| Total net realized gain (loss) | | 18,440,976 |
| Change in net unrealized appreciation (depreciation) on: | | |
| Investment securities: | | |
| Affiliated issuers | 89,536,443 | |
| Total change in net unrealized appreciation (depreciation) | | 89,536,443 |
| Net gain (loss) | | 107,977,419 |
| Net increase (decrease) in net assets resulting from operations | | $197,487,664 |
See accompanying notes which are an integral part of the financial statements.
Statement of Changes in Net Assets
| | Year ended March 31, 2019 | Year ended March 31, 2018 |
| Increase (Decrease) in Net Assets | | |
| Operations | | |
| Net investment income (loss) | $89,510,245 | $69,254,977 |
| Net realized gain (loss) | 18,440,976 | 6,838,412 |
| Change in net unrealized appreciation (depreciation) | 89,536,443 | 219,825,684 |
| Net increase (decrease) in net assets resulting from operations | 197,487,664 | 295,919,073 |
| Distributions to shareholders | (98,529,776) | – |
| Distributions to shareholders from net investment income | – | (66,426,677) |
| Distributions to shareholders from net realized gain | – | (5,015,590) |
| Total distributions | (98,529,776) | (71,442,267) |
| Share transactions - net increase (decrease) | 458,613,878 | 428,000,426 |
| Total increase (decrease) in net assets | 557,571,766 | 652,477,232 |
| Net Assets | | |
| Beginning of period | 3,942,553,163 | 3,290,075,931 |
| End of period | $4,500,124,929 | $3,942,553,163 |
| Other Information | | |
| Undistributed net investment income end of period | | $8,069,799 |
See accompanying notes which are an integral part of the financial statements.
Financial Highlights
Fidelity Freedom Index 2020 Fund Investor Class
| Years ended March 31, | 2019 | 2018 | 2017 | 2016 | 2015 |
| Selected Per–Share Data | | | | | |
| Net asset value, beginning of period | $15.69 | $14.70 | $13.65 | $14.10 | $13.72 |
| Income from Investment Operations | | | | | |
| Net investment income (loss)A | .33 | .29 | .27 | .23 | .26 |
| Net realized and unrealized gain (loss) | .36 | .99 | 1.04 | (.42) | .57 |
| Total from investment operations | .69 | 1.28 | 1.31 | (.19) | .83 |
| Distributions from net investment income | (.32) | (.27) | (.25) | (.26) | (.41) |
| Distributions from net realized gain | (.05) | (.02) | (.01) | –B | (.04) |
| Total distributions | (.37) | (.29) | (.26) | (.26) | (.45) |
| Net asset value, end of period | $16.01 | $15.69 | $14.70 | $13.65 | $14.10 |
| Total ReturnC | 4.59% | 8.72% | 9.68% | (1.34)% | 6.18% |
| Ratios to Average Net AssetsD,E | | | | | |
| Expenses before reductions | .15% | .15% | .15% | .15% | .15% |
| Expenses net of fee waivers, if any | .11% | .12% | .10% | .08% | .08% |
| Expenses net of all reductions | .11% | .12% | .10% | .08% | .08% |
| Net investment income (loss) | 2.12% | 1.86% | 1.88% | 1.69% | 1.90% |
| Supplemental Data | | | | | |
| Net assets, end of period (000 omitted) | $1,971,676 | $1,638,441 | $1,295,896 | $1,410,489 | $2,458,061 |
| Portfolio turnover rateE | 26% | 11% | 20% | 16% | 16% |
A Calculated based on average shares outstanding during the period.
B Amount represents less than $.005 per share.
C Total returns would have been lower if certain expenses had not been reduced during the applicable periods shown.
D Expense ratios reflect operating expenses of the class. Expenses before reductions do not reflect amounts reimbursed by the investment adviser or reductions from expense offset arrangements and do not represent the amount paid by the class during periods when reimbursements or reductions occur. Expenses net of fee waivers reflect expenses after reimbursement by the investment adviser but prior to reductions from expense offset arrangements. Expenses net of all reductions represent the net expenses paid by the class.
E Amount does not include the portfolio activity of any Underlying Funds.
See accompanying notes which are an integral part of the financial statements.
Fidelity Freedom Index 2020 Fund Institutional Premium Class
| Years ended March 31, | 2019 | 2018 | 2017 | 2016 A |
| Selected Per–Share Data | | | | |
| Net asset value, beginning of period | $15.69 | $14.70 | $13.65 | $14.24 |
| Income from Investment Operations | | | | |
| Net investment income (loss)B | .34 | .30 | .27 | .32 |
| Net realized and unrealized gain (loss) | .36 | .99 | 1.05 | (.67) |
| Total from investment operations | .70 | 1.29 | 1.32 | (.35) |
| Distributions from net investment income | (.33) | (.28) | (.26) | (.24) |
| Distributions from net realized gain | (.05) | (.02) | (.01) | –C |
| Total distributions | (.38) | (.30) | (.27) | (.24) |
| Net asset value, end of period | $16.01 | $15.69 | $14.70 | $13.65 |
| Total ReturnD,E | 4.65% | 8.77% | 9.75% | (2.42)% |
| Ratios to Average Net AssetsF,G | | | | |
| Expenses before reductions | .10% | .10% | .09% | .05%H |
| Expenses net of fee waivers, if any | .06% | .07% | .05% | .02%H |
| Expenses net of all reductions | .06% | .07% | .05% | .02%H |
| Net investment income (loss) | 2.18% | 1.91% | 1.93% | 3.12%H |
| Supplemental Data | | | | |
| Net assets, end of period (000 omitted) | $2,528,449 | $2,304,112 | $1,994,180 | $1,249,900 |
| Portfolio turnover rateG | 26% | 11% | 20% | 16% |
A For the period June 24, 2015 (commencement of sale of shares) to March 31, 2016.
B Calculated based on average shares outstanding during the period.
C Amount represents less than $.005 per share.
D Total returns for periods of less than one year are not annualized.
E Total returns would have been lower if certain expenses had not been reduced during the applicable periods shown.
F Expense ratios reflect operating expenses of the class. Expenses before reductions do not reflect amounts reimbursed by the investment adviser or reductions from expense offset arrangements and do not represent the amount paid by the class during periods when reimbursements or reductions occur. Expense ratios before reductions for start-up periods may not be representative of longer-term operating periods. Expenses net of fee waivers reflect expenses after reimbursement by the investment adviser but prior to reductions from expense offset arrangements. Expenses net of all reductions represent the net expenses paid by the class.
G Amount does not include the portfolio activity of any Underlying Funds.
H Annualized
See accompanying notes which are an integral part of the financial statements.
Fidelity Freedom® Index 2025 Fund
Investment Summary (Unaudited)
The information in the following tables is based on the direct investments of the Fund.
Top Holdings as of March 31, 2019
| | % of fund's net assets |
| Fidelity Total Market Index Fund Class F | 41.7 |
| Fidelity U.S. Bond Index Fund Class F | 29.6 |
| Fidelity Series Global ex U.S. Index Fund | 17.8 |
| Fidelity Series Inflation-Protected Bond Index Fund | 4.0 |
| Fidelity Series Treasury Bill Index Fund | 3.8 |
| Fidelity Series Long-Term Treasury Bond Index Fund | 3.1 |
| Fidelity Cash Central Fund, 2.48% | 0.0 |
| | 100.0 |
Asset Allocation (% of fund's net assets)
| Period end |
| | Domestic Equity Funds | 41.7% |
| | International Equity Funds | 17.8% |
| | Bond Funds | 32.7% |
| | Inflation-Protected Bond Funds | 4.0% |
| | Short-Term Funds | 3.8% |

Percentages shown as 0.0% may reflect amounts less than 0.05%.
Fidelity Freedom® Index 2025 Fund
Schedule of Investments March 31, 2019
Showing Percentage of Net Assets
| Domestic Equity Funds - 41.7% | | | |
| | | Shares | Value |
| Fidelity Total Market Index Fund Class F (a) | | | |
| (Cost $1,353,770,613) | | 24,689,697 | 1,988,014,399 |
|
| International Equity Funds - 17.8% | | | |
| Fidelity Series Global ex U.S. Index Fund (a) | | | |
| (Cost $788,622,759) | | 69,371,964 | 847,725,401 |
|
| Bond Funds - 32.7% | | | |
| Fidelity Series Long-Term Treasury Bond Index Fund (a) | | 16,495,161 | 146,312,082 |
| Fidelity U.S. Bond Index Fund Class F (a) | | 122,392,377 | 1,411,184,110 |
| TOTAL BOND FUNDS | | | |
| (Cost $1,546,559,975) | | | 1,557,496,192 |
|
| Inflation-Protected Bond Funds - 4.0% | | | |
| Fidelity Series Inflation-Protected Bond Index Fund (a) | | | |
| (Cost $191,698,605) | | 19,564,056 | 191,336,468 |
|
| Short-Term Funds - 3.8% | | | |
| Fidelity Cash Central Fund, 2.48% (b) | | 24 | 24 |
| Fidelity Series Treasury Bill Index Fund (a) | | 17,892,808 | 178,749,152 |
| TOTAL SHORT-TERM FUNDS | | | |
| (Cost $178,912,140) | | | 178,749,176 |
| TOTAL INVESTMENT IN SECURITIES - 100.0% | | | |
| (Cost $4,059,564,092) | | | 4,763,321,636 |
| NET OTHER ASSETS (LIABILITIES) - 0.0% | | | (316,797) |
| NET ASSETS - 100% | | | $4,763,004,839 |
Legend
(a) Affiliated Fund
(b) Affiliated fund that is generally available only to investment companies and other accounts managed by Fidelity Investments. The rate quoted is the annualized seven-day yield of the fund at period end. A complete unaudited listing of the fund's holdings as of its most recent quarter end is available upon request. In addition, each Fidelity Central Fund's financial statements, which are not covered by the Fund's Report of Independent Registered Public Accounting Firm, are available on the SEC's website or upon request.
Affiliated Central Funds
Information regarding fiscal year to date income earned by the Fund from investments in Fidelity Central Funds is as follows:
| Fund | Income earned |
| Fidelity Cash Central Fund | $97 |
| Total | $97 |
Amounts in the income column in the above table include any capital gain distributions from underlying funds, which are presented in the corresponding line-item in the Statement of Operations, if applicable.
Affiliated Underlying Funds
Fiscal year to date information regarding the Fund's investments in affiliated Underlying Funds, excluding any Money Market Central Funds, is presented below. Exchanges between classes of the same affiliated Underlying Funds may occur.
| Affiliate | Value, beginning of period | Purchases | Sales Proceeds | Dividend Income | Realized Gain (loss) | Change in Unrealized appreciation (depreciation) | Value, end of period |
| Fidelity Commodity Strategy Fund Class F | $46,124,245 | $3,949,789 | $49,023,505 | $-- | $1,040,826 | $(2,091,355) | $-- |
| Fidelity Series Global ex U.S. Index Fund | 685,349,266 | 263,616,523 | 52,328,891 | 19,979,911 | (2,204,514) | (46,706,983) | 847,725,401 |
| Fidelity Series Government Money Market Fund 2.5% | 213,104,497 | 24,410,358 | 237,514,855 | 1,594,819 | -- | -- | -- |
| Fidelity Series Inflation-Protected Bond Index Fund | 67,903,098 | 135,875,367 | 13,615,842 | 3,063,470 | (577,386) | 1,751,231 | 191,336,468 |
| Fidelity Series Long-Term Treasury Bond Index Fund | -- | 156,651,755 | 17,108,338 | 2,517,512 | (103,667) | 6,872,332 | 146,312,082 |
| Fidelity Series Treasury Bill Index Fund | -- | 187,039,820 | 8,124,577 | 2,410,728 | (3,126) | (162,965) | 178,749,152 |
| Fidelity Total Market Index Fund Class F | 1,561,728,775 | 579,267,466 | 278,190,635 | 39,309,532 | 1,297,584 | 123,911,209 | 1,988,014,399 |
| Fidelity U.S. Bond Index Fund Class F | 1,043,505,486 | 490,175,659 | 146,993,414 | 33,668,795 | (4,517,125) | 29,013,504 | 1,411,184,110 |
| | $3,617,715,367 | $1,840,986,737 | $802,900,057 | $102,544,767 | $(5,067,408) | $112,586,973 | $4,763,321,612 |
Amounts in the income column in the above table include any capital gain distributions from underlying funds, which are presented in the corresponding line-item in the Statement of Operations, if applicable.
Investment Valuation
All investments are categorized as Level 1 under the Fair Value Hierarchy. The inputs or methodology used for valuing securities may not be an indication of the risk associated with investing in those securities. For more information on valuation inputs please refer to the Investment Valuation section in the accompanying Notes to Financial Statements.
See accompanying notes which are an integral part of the financial statements.
Fidelity Freedom® Index 2025 Fund
Financial Statements
Statement of Assets and Liabilities
| | | March 31, 2019 |
| Assets | | |
Investment in securities, at value — See accompanying schedule:
| | |
| Fidelity Central Funds (cost $24) | $24 | |
| Other affiliated issuers (cost $4,059,564,068) | 4,763,321,612 | |
| Total Investment in Securities (cost $4,059,564,092) | | $4,763,321,636 |
| Cash | | 96 |
| Receivable for investments sold | | 811,520 |
| Receivable for fund shares sold | | 10,684,390 |
| Receivable from investment adviser for expense reductions | | 169,981 |
| Total assets | | 4,774,987,623 |
| Liabilities | | |
| Payable for investments purchased | $8,895,660 | |
| Payable for fund shares redeemed | 2,599,210 | |
| Transfer agent fees payable | 487,914 | |
| Total liabilities | | 11,982,784 |
| Net Assets | | $4,763,004,839 |
| Net Assets consist of: | | |
| Paid in capital | | $4,063,936,579 |
| Total distributable earnings (loss) | | 699,068,260 |
| Net Assets | | $4,763,004,839 |
| Net Asset Value and Maximum Offering Price | | |
| Investor Class: | | |
| Net Asset Value, offering price and redemption price per share ($2,382,205,838 ÷ 139,739,321 shares) | | $17.05 |
| Institutional Premium Class: | | |
| Net Asset Value, offering price and redemption price per share ($2,380,799,001 ÷ 139,630,525 shares) | | $17.05 |
See accompanying notes which are an integral part of the financial statements.
Statement of Operations
| | | Year ended March 31, 2019 |
| Investment Income | | |
| Dividends: | | |
| Affiliated issuers | | $92,490,740 |
| Income from Fidelity Central Funds | | 97 |
| Total income | | 92,490,837 |
| Expenses | | |
| Transfer agent fees | $5,116,486 | |
| Independent trustees' fees and expenses | 18,867 | |
| Total expenses before reductions | 5,135,353 | |
| Expense reductions | (1,752,241) | |
| Total expenses after reductions | | 3,383,112 |
| Net investment income (loss) | | 89,107,725 |
| Realized and Unrealized Gain (Loss) | | |
| Net realized gain (loss) on: | | |
| Investment securities: | | |
| Affiliated issuers | (5,067,408) | |
| Capital gain distributions from underlying funds: | | |
| Affiliated issuers | 10,054,027 | |
| Total net realized gain (loss) | | 4,986,619 |
| Change in net unrealized appreciation (depreciation) on: | | |
| Investment securities: | | |
| Affiliated issuers | 112,586,973 | |
| Total change in net unrealized appreciation (depreciation) | | 112,586,973 |
| Net gain (loss) | | 117,573,592 |
| Net increase (decrease) in net assets resulting from operations | | $206,681,317 |
See accompanying notes which are an integral part of the financial statements.
Statement of Changes in Net Assets
| | Year ended March 31, 2019 | Year ended March 31, 2018 |
| Increase (Decrease) in Net Assets | | |
| Operations | | |
| Net investment income (loss) | $89,107,725 | $61,864,354 |
| Net realized gain (loss) | 4,986,619 | 8,148,696 |
| Change in net unrealized appreciation (depreciation) | 112,586,973 | 204,023,909 |
| Net increase (decrease) in net assets resulting from operations | 206,681,317 | 274,036,959 |
| Distributions to shareholders | (91,659,489) | – |
| Distributions to shareholders from net investment income | – | (59,481,033) |
| Distributions to shareholders from net realized gain | – | (3,473,804) |
| Total distributions | (91,659,489) | (62,954,837) |
| Share transactions - net increase (decrease) | 1,030,551,053 | 722,009,775 |
| Total increase (decrease) in net assets | 1,145,572,881 | 933,091,897 |
| Net Assets | | |
| Beginning of period | 3,617,431,958 | 2,684,340,061 |
| End of period | $4,763,004,839 | $3,617,431,958 |
| Other Information | | |
| Undistributed net investment income end of period | | $6,368,015 |
See accompanying notes which are an integral part of the financial statements.
Financial Highlights
Fidelity Freedom Index 2025 Fund Investor Class
| Years ended March 31, | 2019 | 2018 | 2017 | 2016 | 2015 |
| Selected Per–Share Data | | | | | |
| Net asset value, beginning of period | $16.67 | $15.50 | $14.27 | $14.80 | $14.36 |
| Income from Investment Operations | | | | | |
| Net investment income (loss)A | .36 | .31 | .29 | .27 | .30 |
| Net realized and unrealized gain (loss) | .38 | 1.17 | 1.22 | (.52) | .65 |
| Total from investment operations | .74 | 1.48 | 1.51 | (.25) | .95 |
| Distributions from net investment income | (.34) | (.29) | (.27) | (.27) | (.48)B |
| Distributions from net realized gain | (.03) | (.02) | (.01) | –C | (.03)B |
| Total distributions | (.36)D | (.31) | (.28) | (.28)E | (.51) |
| Net asset value, end of period | $17.05 | $16.67 | $15.50 | $14.27 | $14.80 |
| Total ReturnF | 4.64% | 9.53% | 10.67% | (1.72)% | 6.73% |
| Ratios to Average Net AssetsG,H | | | | | |
| Expenses before reductions | .15% | .15% | .15% | .15% | .15% |
| Expenses net of fee waivers, if any | .11% | .12% | .10% | .08% | .08% |
| Expenses net of all reductions | .11% | .12% | .10% | .08% | .08% |
| Net investment income (loss) | 2.13% | 1.91% | 1.97% | 1.84% | 2.03% |
| Supplemental Data | | | | | |
| Net assets, end of period (000 omitted) | $2,382,206 | $1,761,022 | $1,227,802 | $1,179,785 | $1,723,943 |
| Portfolio turnover rateH | 19% | 9% | 18% | 17% | 15% |
A Calculated based on average shares outstanding during the period.
B The amounts shown reflect certain reclassifications related to book to tax differences that were made in the year shown.
C Amount represents less than $.005 per share.
D Total distributions of $.36 per share is comprised of distributions from net investment income of $.027 and distributions from net realized gain of $.335 per share.
E Total distributions of $.28 per share is comprised of distributions from net investment income of $.272 and distributions from net realized gain of $.003 per share.
F Total returns would have been lower if certain expenses had not been reduced during the applicable periods shown.
G Expense ratios reflect operating expenses of the class. Expenses before reductions do not reflect amounts reimbursed by the investment adviser or reductions from expense offset arrangements and do not represent the amount paid by the class during periods when reimbursements or reductions occur. Expenses net of fee waivers reflect expenses after reimbursement by the investment adviser but prior to reductions from expense offset arrangements. Expenses net of all reductions represent the net expenses paid by the class.
H Amount does not include the portfolio activity of any Underlying Funds.
See accompanying notes which are an integral part of the financial statements.
Fidelity Freedom Index 2025 Fund Institutional Premium Class
| Years ended March 31, | 2019 | 2018 | 2017 | 2016 A |
| Selected Per–Share Data | | | | |
| Net asset value, beginning of period | $16.67 | $15.50 | $14.27 | $15.00 |
| Income from Investment Operations | | | | |
| Net investment income (loss)B | .37 | .32 | .30 | .33 |
| Net realized and unrealized gain (loss) | .38 | 1.17 | 1.22 | (.79) |
| Total from investment operations | .75 | 1.49 | 1.52 | (.46) |
| Distributions from net investment income | (.34) | (.30) | (.28) | (.27) |
| Distributions from net realized gain | (.03) | (.02) | (.01) | –C |
| Total distributions | (.37) | (.32) | (.29) | (.27) |
| Net asset value, end of period | $17.05 | $16.67 | $15.50 | $14.27 |
| Total ReturnD,E | 4.70% | 9.58% | 10.74% | (3.07)% |
| Ratios to Average Net AssetsF,G | | | | |
| Expenses before reductions | .10% | .10% | .09% | .05%H |
| Expenses net of fee waivers, if any | .05% | .07% | .05% | .02%H |
| Expenses net of all reductions | .05% | .07% | .05% | .02%H |
| Net investment income (loss) | 2.19% | 1.96% | 2.02% | 3.08%H |
| Supplemental Data | | | | |
| Net assets, end of period (000 omitted) | $2,380,799 | $1,856,410 | $1,456,538 | $792,922 |
| Portfolio turnover rateG | 19% | 9% | 18% | 17% |
A For the period June 24, 2015 (commencement of sale of shares) to March 31, 2016.
B Calculated based on average shares outstanding during the period.
C Amount represents less than $.005 per share.
D Total returns for periods of less than one year are not annualized.
E Total returns would have been lower if certain expenses had not been reduced during the applicable periods shown.
F Expense ratios reflect operating expenses of the class. Expenses before reductions do not reflect amounts reimbursed by the investment adviser or reductions from expense offset arrangements and do not represent the amount paid by the class during periods when reimbursements or reductions occur. Expense ratios before reductions for start-up periods may not be representative of longer-term operating periods. Expenses net of fee waivers reflect expenses after reimbursement by the investment adviser but prior to reductions from expense offset arrangements. Expenses net of all reductions represent the net expenses paid by the class.
G Amount does not include the portfolio activity of any Underlying Funds.
H Annualized
See accompanying notes which are an integral part of the financial statements.
Fidelity Freedom® Index 2030 Fund
Investment Summary (Unaudited)
The information in the following tables is based on the direct investments of the Fund.
Top Holdings as of March 31, 2019
| | % of fund's net assets |
| Fidelity Total Market Index Fund Class F | 49.5 |
| Fidelity U.S. Bond Index Fund Class F | 25.0 |
| Fidelity Series Global ex U.S. Index Fund | 21.1 |
| Fidelity Series Long-Term Treasury Bond Index Fund | 3.1 |
| Fidelity Series Inflation-Protected Bond Index Fund | 1.3 |
| | 100.0 |
Asset Allocation (% of fund's net assets)
| Period end |
| | Domestic Equity Funds | 49.5% |
| | International Equity Funds | 21.1% |
| | Bond Funds | 28.1% |
| | Inflation-Protected Bond Funds | 1.3% |

Fidelity Freedom® Index 2030 Fund
Schedule of Investments March 31, 2019
Showing Percentage of Net Assets
| Domestic Equity Funds - 49.5% | | | |
| | | Shares | Value |
| Fidelity Total Market Index Fund Class F (a) | | | |
| (Cost $1,942,713,412) | | 35,462,912 | 2,855,473,703 |
|
| International Equity Funds - 21.1% | | | |
| Fidelity Series Global ex U.S. Index Fund (a) | | | |
| (Cost $1,142,374,865) | | 99,859,589 | 1,220,284,176 |
|
| Bond Funds - 28.1% | | | |
| Fidelity Series Long-Term Treasury Bond Index Fund (a) | | 20,077,756 | 178,089,695 |
| Fidelity U.S. Bond Index Fund Class F (a) | | 125,179,411 | 1,443,318,609 |
| TOTAL BOND FUNDS | | | |
| (Cost $1,605,866,301) | | | 1,621,408,304 |
|
| Inflation-Protected Bond Funds - 1.3% | | | |
| Fidelity Series Inflation-Protected Bond Index Fund (a) | | | |
| (Cost $72,412,418) | | 7,489,868 | 73,250,907 |
| TOTAL INVESTMENT IN SECURITIES - 100.0% | | | |
| (Cost $4,763,366,996) | | | 5,770,417,090 |
| NET OTHER ASSETS (LIABILITIES) - 0.0% | | | (350,504) |
| NET ASSETS - 100% | | | $5,770,066,586 |
Legend
(a) Affiliated Fund
Affiliated Central Funds
Information regarding fiscal year to date income earned by the Fund from investments in Fidelity Central Funds is as follows:
| Fund | Income earned |
| Fidelity Cash Central Fund | $156 |
| Total | $156 |
Amounts in the income column in the above table include any capital gain distributions from underlying funds, which are presented in the corresponding line-item in the Statement of Operations, if applicable.
Affiliated Underlying Funds
Fiscal year to date information regarding the Fund's investments in affiliated Underlying Funds, excluding any Money Market Central Funds, is presented below. Exchanges between classes of the same affiliated Underlying Funds may occur.
| Affiliate | Value, beginning of period | Purchases | Sales Proceeds | Dividend Income | Realized Gain (loss) | Change in Unrealized appreciation (depreciation) | Value, end of period |
| Fidelity Commodity Strategy Fund Class F | $59,460,652 | $3,907,202 | $62,061,527 | $-- | $1,392,663 | $(2,698,990) | $-- |
| Fidelity Series Global ex U.S. Index Fund | 1,016,892,451 | 349,219,073 | 72,008,373 | 29,213,228 | (2,839,557) | (70,979,418) | 1,220,284,176 |
| Fidelity Series Inflation-Protected Bond Index Fund | 47,485,726 | 60,993,525 | 36,225,849 | 690,416 | (974,409) | 1,971,914 | 73,250,907 |
| Fidelity Series Long-Term Treasury Bond Index Fund | -- | 190,589,087 | 20,725,170 | 3,062,294 | (198,988) | 8,424,766 | 178,089,695 |
| Fidelity Total Market Index Fund Class F | 2,318,668,430 | 709,177,146 | 346,842,738 | 57,601,169 | 748,873 | 173,721,992 | 2,855,473,703 |
| Fidelity U.S. Bond Index Fund Class F | 1,057,327,370 | 520,995,967 | 160,177,404 | 34,145,187 | (5,626,202) | 30,798,878 | 1,443,318,609 |
| | $4,499,834,629 | $1,834,882,000 | $698,041,061 | $124,712,294 | $(7,497,620) | $141,239,142 | $5,770,417,090 |
Amounts in the income column in the above table include any capital gain distributions from underlying funds, which are presented in the corresponding line-item in the Statement of Operations, if applicable.
Investment Valuation
All investments are categorized as Level 1 under the Fair Value Hierarchy. The inputs or methodology used for valuing securities may not be an indication of the risk associated with investing in those securities. For more information on valuation inputs please refer to the Investment Valuation section in the accompanying Notes to Financial Statements.
See accompanying notes which are an integral part of the financial statements.
Fidelity Freedom® Index 2030 Fund
Financial Statements
Statement of Assets and Liabilities
| | | March 31, 2019 |
| Assets | | |
Investment in securities, at value — See accompanying schedule:
| | |
| Affiliated issuers (cost $4,763,366,996) | $5,770,417,090 | |
| Total Investment in Securities (cost $4,763,366,996) | | $5,770,417,090 |
| Cash | | 157 |
| Receivable for investments sold | | 5,488,571 |
| Receivable for fund shares sold | | 8,531,865 |
| Receivable from investment adviser for expense reductions | | 222,793 |
| Total assets | | 5,784,660,476 |
| Liabilities | | |
| Payable for investments purchased | $12,545,430 | |
| Payable for fund shares redeemed | 1,473,941 | |
| Transfer agent fees payable | 574,519 | |
| Total liabilities | | 14,593,890 |
| Net Assets | | $5,770,066,586 |
| Net Assets consist of: | | |
| Paid in capital | | $4,765,349,578 |
| Total distributable earnings (loss) | | 1,004,717,008 |
| Net Assets | | $5,770,066,586 |
| Net Asset Value and Maximum Offering Price | | |
| Investor Class: | | |
| Net Asset Value, offering price and redemption price per share ($2,500,478,726 ÷ 138,963,209 shares) | | $17.99 |
| Institutional Premium Class: | | |
| Net Asset Value, offering price and redemption price per share ($3,269,587,860 ÷ 181,690,804 shares) | | $18.00 |
See accompanying notes which are an integral part of the financial statements.
Statement of Operations
| | | Year ended March 31, 2019 |
| Investment Income | | |
| Dividends: | | |
| Affiliated issuers | | $113,197,925 |
| Income from Fidelity Central Funds | | 156 |
| Total income | | 113,198,081 |
| Expenses | | |
| Transfer agent fees | $6,077,373 | |
| Independent trustees' fees and expenses | 23,077 | |
| Total expenses before reductions | 6,100,450 | |
| Expense reductions | (2,289,868) | |
| Total expenses after reductions | | 3,810,582 |
| Net investment income (loss) | | 109,387,499 |
| Realized and Unrealized Gain (Loss) | | |
| Net realized gain (loss) on: | | |
| Investment securities: | | |
| Affiliated issuers | (7,497,620) | |
| Capital gain distributions from underlying funds: | | |
| Affiliated issuers | 11,514,369 | |
| Total net realized gain (loss) | | 4,016,749 |
| Change in net unrealized appreciation (depreciation) on: | | |
| Investment securities: | | |
| Affiliated issuers | 141,239,142 | |
| Total change in net unrealized appreciation (depreciation) | | 141,239,142 |
| Net gain (loss) | | 145,255,891 |
| Net increase (decrease) in net assets resulting from operations | | $254,643,390 |
See accompanying notes which are an integral part of the financial statements.
Statement of Changes in Net Assets
| | Year ended March 31, 2019 | Year ended March 31, 2018 |
| Increase (Decrease) in Net Assets | | |
| Operations | | |
| Net investment income (loss) | $109,387,499 | $77,497,934 |
| Net realized gain (loss) | 4,016,749 | 10,848,890 |
| Change in net unrealized appreciation (depreciation) | 141,239,142 | 315,081,052 |
| Net increase (decrease) in net assets resulting from operations | 254,643,390 | 403,427,876 |
| Distributions to shareholders | (109,066,308) | – |
| Distributions to shareholders from net investment income | – | (75,072,440) |
| Distributions to shareholders from net realized gain | – | (3,357,942) |
| Total distributions | (109,066,308) | (78,430,382) |
| Share transactions - net increase (decrease) | 1,124,986,747 | 815,123,759 |
| Total increase (decrease) in net assets | 1,270,563,829 | 1,140,121,253 |
| Net Assets | | |
| Beginning of period | 4,499,502,757 | 3,359,381,504 |
| End of period | $5,770,066,586 | $4,499,502,757 |
| Other Information | | |
| Undistributed net investment income end of period | | $5,848,579 |
See accompanying notes which are an integral part of the financial statements.
Financial Highlights
Fidelity Freedom Index 2030 Fund Investor Class
| Years ended March 31, | 2019 | 2018 | 2017 | 2016 | 2015 |
| Selected Per–Share Data | | | | | |
| Net asset value, beginning of period | $17.57 | $16.07 | $14.49 | $15.15 | $14.62 |
| Income from Investment Operations | | | | | |
| Net investment income (loss)A | .38 | .33 | .31 | .26 | .30 |
| Net realized and unrealized gain (loss) | .41 | 1.50 | 1.57 | (.63) | .73 |
| Total from investment operations | .79 | 1.83 | 1.88 | (.37) | 1.03 |
| Distributions from net investment income | (.36) | (.31) | (.29) | (.29) | (.48) |
| Distributions from net realized gain | (.01) | (.01) | (.01) | –B | (.02) |
| Total distributions | (.37) | (.33)C | (.30) | (.29) | (.50) |
| Net asset value, end of period | $17.99 | $17.57 | $16.07 | $14.49 | $15.15 |
| Total ReturnD | 4.71% | 11.35% | 13.07% | (2.44)% | 7.16% |
| Ratios to Average Net AssetsE,F | | | | | |
| Expenses before reductions | .15% | .15% | .15% | .15% | .15% |
| Expenses net of fee waivers, if any | .11% | .12% | .10% | .08% | .08% |
| Expenses net of all reductions | .11% | .12% | .10% | .08% | .08% |
| Net investment income (loss) | 2.14% | 1.92% | 2.03% | 1.75% | 1.99% |
| Supplemental Data | | | | | |
| Net assets, end of period (000 omitted) | $2,500,479 | $1,856,566 | $1,333,880 | $1,315,200 | $2,224,676 |
| Portfolio turnover rateF | 14% | 9% | 13% | 13% | 12% |
A Calculated based on average shares outstanding during the period.
B Amount represents less than $.005 per share.
C Total distributions of $.33 per share is comprised of distributions from net investment income of $.311 and distributions from net realized gain of $.014 per share.
D Total returns would have been lower if certain expenses had not been reduced during the applicable periods shown.
E Expense ratios reflect operating expenses of the class. Expenses before reductions do not reflect amounts reimbursed by the investment adviser or reductions from expense offset arrangements and do not represent the amount paid by the class during periods when reimbursements or reductions occur. Expenses net of fee waivers reflect expenses after reimbursement by the investment adviser but prior to reductions from expense offset arrangements. Expenses net of all reductions represent the net expenses paid by the class.
F Amount does not include the portfolio activity of any Underlying Funds.
See accompanying notes which are an integral part of the financial statements.
Fidelity Freedom Index 2030 Fund Institutional Premium Class
| Years ended March 31, | 2019 | 2018 | 2017 | 2016 A |
| Selected Per–Share Data | | | | |
| Net asset value, beginning of period | $17.57 | $16.07 | $14.49 | $15.44 |
| Income from Investment Operations | | | | |
| Net investment income (loss)B | .39 | .34 | .32 | .38 |
| Net realized and unrealized gain (loss) | .42 | 1.49 | 1.57 | (1.04) |
| Total from investment operations | .81 | 1.83 | 1.89 | (.66) |
| Distributions from net investment income | (.37) | (.32) | (.30) | (.29) |
| Distributions from net realized gain | (.01) | (.01) | (.01) | –C |
| Total distributions | (.38) | (.33) | (.31) | (.29) |
| Net asset value, end of period | $18.00 | $17.57 | $16.07 | $14.49 |
| Total ReturnD,E | 4.82% | 11.39% | 13.13% | (4.28)% |
| Ratios to Average Net AssetsF,G | | | | |
| Expenses before reductions | .10% | .10% | .09% | .05%H |
| Expenses net of fee waivers, if any | .05% | .07% | .05% | .02%H |
| Expenses net of all reductions | .05% | .07% | .05% | .02%H |
| Net investment income (loss) | 2.20% | 1.97% | 2.08% | 3.54%H |
| Supplemental Data | | | | |
| Net assets, end of period (000 omitted) | $3,269,588 | $2,642,936 | $2,025,502 | $1,165,165 |
| Portfolio turnover rateG | 14% | 9% | 13% | 13% |
A For the period June 24, 2015 (commencement of sale of shares) to March 31, 2016.
B Calculated based on average shares outstanding during the period.
C Amount represents less than $.005 per share.
D Total returns for periods of less than one year are not annualized.
E Total returns would have been lower if certain expenses had not been reduced during the applicable periods shown.
F Expense ratios reflect operating expenses of the class. Expenses before reductions do not reflect amounts reimbursed by the investment adviser or reductions from expense offset arrangements and do not represent the amount paid by the class during periods when reimbursements or reductions occur. Expense ratios before reductions for start-up periods may not be representative of longer-term operating periods. Expenses net of fee waivers reflect expenses after reimbursement by the investment adviser but prior to reductions from expense offset arrangements. Expenses net of all reductions represent the net expenses paid by the class.
G Amount does not include the portfolio activity of any Underlying Funds.
H Annualized
See accompanying notes which are an integral part of the financial statements.
Fidelity Freedom® Index 2035 Fund
Investment Summary (Unaudited)
The information in the following tables is based on the direct investments of the Fund.
Top Holdings as of March 31, 2019
| | % of fund's net assets |
| Fidelity Total Market Index Fund Class F | 59.3 |
| Fidelity Series Global ex U.S. Index Fund | 25.3 |
| Fidelity U.S. Bond Index Fund Class F | 12.3 |
| Fidelity Series Long-Term Treasury Bond Index Fund | 3.1 |
| Fidelity Cash Central Fund, 2.48% | 0.0 |
| | 100.0 |
Asset Allocation (% of fund's net assets)
| Period end |
| | Domestic Equity Funds | 59.3% |
| | International Equity Funds | 25.3% |
| | Bond Funds | 15.4% |

Percentages shown as 0.0% may reflect amounts less than 0.05%.
Fidelity Freedom® Index 2035 Fund
Schedule of Investments March 31, 2019
Showing Percentage of Net Assets
| Domestic Equity Funds - 59.3% | | | |
| | | Shares | Value |
| Fidelity Total Market Index Fund Class F (a) | | | |
| (Cost $1,745,565,207) | | 29,583,435 | 2,382,058,169 |
|
| International Equity Funds - 25.3% | | | |
| Fidelity Series Global ex U.S. Index Fund (a) | | | |
| (Cost $965,586,071) | | 83,298,670 | 1,017,909,745 |
|
| Bond Funds - 15.4% | | | |
| Fidelity Series Long-Term Treasury Bond Index Fund (a) | | 13,913,004 | 123,408,346 |
| Fidelity U.S. Bond Index Fund Class F (a) | | 42,936,289 | 495,055,418 |
| TOTAL BOND FUNDS | | | |
| (Cost $609,464,211) | | | 618,463,764 |
|
| Short-Term Funds - 0.0% | | | |
| Fidelity Cash Central Fund, 2.48% (b) | | | |
| (Cost $3) | | 3 | 3 |
| TOTAL INVESTMENT IN SECURITIES - 100.0% | | | |
| (Cost $3,320,615,492) | | | 4,018,431,681 |
| NET OTHER ASSETS (LIABILITIES) - 0.0% | | | (257,036) |
| NET ASSETS - 100% | | | $4,018,174,645 |
Legend
(a) Affiliated Fund
(b) Affiliated fund that is generally available only to investment companies and other accounts managed by Fidelity Investments. The rate quoted is the annualized seven-day yield of the fund at period end. A complete unaudited listing of the fund's holdings as of its most recent quarter end is available upon request. In addition, each Fidelity Central Fund's financial statements, which are not covered by the Fund's Report of Independent Registered Public Accounting Firm, are available on the SEC's website or upon request.
Affiliated Central Funds
Information regarding fiscal year to date income earned by the Fund from investments in Fidelity Central Funds is as follows:
| Fund | Income earned |
| Fidelity Cash Central Fund | $49 |
| Total | $49 |
Amounts in the income column in the above table include any capital gain distributions from underlying funds, which are presented in the corresponding line-item in the Statement of Operations, if applicable.
Affiliated Underlying Funds
Fiscal year to date information regarding the Fund's investments in affiliated Underlying Funds, excluding any Money Market Central Funds, is presented below. Exchanges between classes of the same affiliated Underlying Funds may occur.
| Affiliate | Value, beginning of period | Purchases | Sales Proceeds | Dividend Income | Realized Gain (loss) | Change in Unrealized appreciation (depreciation) | Value, end of period |
| Fidelity Commodity Strategy Fund Class F | $39,049,622 | $3,503,344 | $41,680,814 | $-- | $851,714 | $(1,723,866) | $-- |
| Fidelity Series Global ex U.S. Index Fund | 763,524,116 | 355,116,738 | 42,755,385 | 23,623,053 | (4,710,660) | (53,265,064) | 1,017,909,745 |
| Fidelity Series Inflation-Protected Bond Index Fund | 6,235,479 | 1,625,131 | 7,899,562 | 8,031 | (44,589) | 83,541 | -- |
| Fidelity Series Long-Term Treasury Bond Index Fund | -- | 135,528,201 | 17,837,795 | 2,082,070 | (180,954) | 5,898,894 | 123,408,346 |
| Fidelity Total Market Index Fund Class F | 1,745,523,415 | 658,630,262 | 158,912,850 | 46,125,362 | (2,236,234) | 139,053,576 | 2,382,058,169 |
| Fidelity U.S. Bond Index Fund Class F | 359,317,454 | 212,290,496 | 85,078,873 | 11,189,664 | (1,959,897) | 10,486,238 | 495,055,418 |
| | $2,913,650,086 | $1,366,694,172 | $354,165,279 | $83,028,180 | $(8,280,620) | $100,533,319 | $4,018,431,678 |
Amounts in the income column in the above table include any capital gain distributions from underlying funds, which are presented in the corresponding line-item in the Statement of Operations, if applicable.
Investment Valuation
All investments are categorized as Level 1 under the Fair Value Hierarchy. The inputs or methodology used for valuing securities may not be an indication of the risk associated with investing in those securities. For more information on valuation inputs please refer to the Investment Valuation section in the accompanying Notes to Financial Statements.
See accompanying notes which are an integral part of the financial statements.
Fidelity Freedom® Index 2035 Fund
Financial Statements
Statement of Assets and Liabilities
| | | March 31, 2019 |
| Assets | | |
Investment in securities, at value — See accompanying schedule:
| | |
| Fidelity Central Funds (cost $3) | $3 | |
| Other affiliated issuers (cost $3,320,615,489) | 4,018,431,678 | |
| Total Investment in Securities (cost $3,320,615,492) | | $4,018,431,681 |
| Cash | | 50 |
| Receivable for investments sold | | 3,723,289 |
| Receivable for fund shares sold | | 7,695,864 |
| Receivable from investment adviser for expense reductions | | 152,762 |
| Total assets | | 4,030,003,646 |
| Liabilities | | |
| Payable for investments purchased | $10,128,249 | |
| Payable for fund shares redeemed | 1,290,179 | |
| Transfer agent fees payable | 410,573 | |
| Total liabilities | | 11,829,001 |
| Net Assets | | $4,018,174,645 |
| Net Assets consist of: | | |
| Paid in capital | | $3,325,685,711 |
| Total distributable earnings (loss) | | 692,488,934 |
| Net Assets | | $4,018,174,645 |
| Net Asset Value and Maximum Offering Price | | |
| Investor Class: | | |
| Net Asset Value, offering price and redemption price per share ($2,003,135,388 ÷ 105,045,238 shares) | | $19.07 |
| Institutional Premium Class: | | |
| Net Asset Value, offering price and redemption price per share ($2,015,039,257 ÷ 105,631,547 shares) | | $19.08 |
See accompanying notes which are an integral part of the financial statements.
Statement of Operations
| | | Year ended March 31, 2019 |
| Investment Income | | |
| Dividends: | | |
| Affiliated issuers | | $74,188,706 |
| Income from Fidelity Central Funds | | 49 |
| Total income | | 74,188,755 |
| Expenses | | |
| Transfer agent fees | $4,202,054 | |
| Independent trustees' fees and expenses | 15,423 | |
| Total expenses before reductions | 4,217,477 | |
| Expense reductions | (1,528,339) | |
| Total expenses after reductions | | 2,689,138 |
| Net investment income (loss) | | 71,499,617 |
| Realized and Unrealized Gain (Loss) | | |
| Net realized gain (loss) on: | | |
| Investment securities: | | |
| Affiliated issuers | (8,280,620) | |
| Capital gain distributions from underlying funds: | | |
| Affiliated issuers | 8,839,474 | |
| Total net realized gain (loss) | | 558,854 |
| Change in net unrealized appreciation (depreciation) on: | | |
| Investment securities: | | |
| Affiliated issuers | 100,533,319 | |
| Total change in net unrealized appreciation (depreciation) | | 100,533,319 |
| Net gain (loss) | | 101,092,173 |
| Net increase (decrease) in net assets resulting from operations | | $172,591,790 |
See accompanying notes which are an integral part of the financial statements.
Statement of Changes in Net Assets
| | Year ended March 31, 2019 | Year ended March 31, 2018 |
| Increase (Decrease) in Net Assets | | |
| Operations | | |
| Net investment income (loss) | $71,499,617 | $48,018,384 |
| Net realized gain (loss) | 558,854 | 7,779,322 |
| Change in net unrealized appreciation (depreciation) | 100,533,319 | 230,704,670 |
| Net increase (decrease) in net assets resulting from operations | 172,591,790 | 286,502,376 |
| Distributions to shareholders | (71,688,773) | – |
| Distributions to shareholders from net investment income | – | (46,982,742) |
| Distributions to shareholders from net realized gain | – | (2,454,277) |
| Total distributions | (71,688,773) | (49,437,019) |
| Share transactions - net increase (decrease) | 1,003,843,494 | 609,809,287 |
| Total increase (decrease) in net assets | 1,104,746,511 | 846,874,644 |
| Net Assets | | |
| Beginning of period | 2,913,428,134 | 2,066,553,490 |
| End of period | $4,018,174,645 | $2,913,428,134 |
| Other Information | | |
| Undistributed net investment income end of period | | $1,397,272 |
See accompanying notes which are an integral part of the financial statements.
Financial Highlights
Fidelity Freedom Index 2035 Fund Investor Class
| Years ended March 31, | 2019 | 2018 | 2017 | 2016 | 2015 |
| Selected Per–Share Data | | | | | |
| Net asset value, beginning of period | $18.63 | $16.79 | $14.91 | $15.67 | $15.11 |
| Income from Investment Operations | | | | | |
| Net investment income (loss)A | .39 | .34 | .32 | .27 | .31 |
| Net realized and unrealized gain (loss) | .43 | 1.84 | 1.87 | (.73) | .77 |
| Total from investment operations | .82 | 2.18 | 2.19 | (.46) | 1.08 |
| Distributions from net investment income | (.37) | (.32) | (.30) | (.30) | (.51) |
| Distributions from net realized gain | (.01) | (.02) | (.01) | –B | (.01) |
| Total distributions | (.38) | (.34) | (.31) | (.30) | (.52) |
| Net asset value, end of period | $19.07 | $18.63 | $16.79 | $14.91 | $15.67 |
| Total ReturnC | 4.63% | 12.96% | 14.81% | (2.93)% | 7.25% |
| Ratios to Average Net AssetsD,E | | | | | |
| Expenses before reductions | .15% | .15% | .15% | .15% | .15% |
| Expenses net of fee waivers, if any | .11% | .12% | .10% | .08% | .08% |
| Expenses net of all reductions | .11% | .12% | .10% | .08% | .08% |
| Net investment income (loss) | 2.08% | 1.89% | 2.02% | 1.79% | 2.02% |
| Supplemental Data | | | | | |
| Net assets, end of period (000 omitted) | $2,003,135 | $1,390,826 | $936,458 | $880,845 | $1,282,091 |
| Portfolio turnover rateE | 10% | 7% | 13% | 11% | 13% |
A Calculated based on average shares outstanding during the period.
B Amount represents less than $.005 per share.
C Total returns would have been lower if certain expenses had not been reduced during the applicable periods shown.
D Expense ratios reflect operating expenses of the class. Expenses before reductions do not reflect amounts reimbursed by the investment adviser or reductions from expense offset arrangements and do not represent the amount paid by the class during periods when reimbursements or reductions occur. Expenses net of fee waivers reflect expenses after reimbursement by the investment adviser but prior to reductions from expense offset arrangements. Expenses net of all reductions represent the net expenses paid by the class.
E Amount does not include the portfolio activity of any Underlying Funds.
See accompanying notes which are an integral part of the financial statements.
Fidelity Freedom Index 2035 Fund Institutional Premium Class
| Years ended March 31, | 2019 | 2018 | 2017 | 2016 A |
| Selected Per–Share Data | | | | |
| Net asset value, beginning of period | $18.64 | $16.80 | $14.92 | $16.03 |
| Income from Investment Operations | | | | |
| Net investment income (loss)B | .40 | .35 | .33 | .39 |
| Net realized and unrealized gain (loss) | .43 | 1.84 | 1.87 | (1.20) |
| Total from investment operations | .83 | 2.19 | 2.20 | (.81) |
| Distributions from net investment income | (.38) | (.33) | (.31) | (.30) |
| Distributions from net realized gain | (.01) | (.02) | (.01) | –C |
| Total distributions | (.39) | (.35) | (.32) | (.30) |
| Net asset value, end of period | $19.08 | $18.64 | $16.80 | $14.92 |
| Total ReturnD,E | 4.69% | 13.00% | 14.87% | (5.04)% |
| Ratios to Average Net AssetsF,G | | | | |
| Expenses before reductions | .10% | .10% | .09% | .05%H |
| Expenses net of fee waivers, if any | .05% | .07% | .05% | .01%H |
| Expenses net of all reductions | .05% | .07% | .05% | .01%H |
| Net investment income (loss) | 2.14% | 1.94% | 2.07% | 3.53%H |
| Supplemental Data | | | | |
| Net assets, end of period (000 omitted) | $2,015,039 | $1,522,603 | $1,130,096 | $581,231 |
| Portfolio turnover rateG | 10% | 7% | 13% | 11% |
A For the period June 24, 2015 (commencement of sale of shares) to March 31, 2016.
B Calculated based on average shares outstanding during the period.
C Amount represents less than $.005 per share.
D Total returns for periods of less than one year are not annualized.
E Total returns would have been lower if certain expenses had not been reduced during the applicable periods shown.
F Expense ratios reflect operating expenses of the class. Expenses before reductions do not reflect amounts reimbursed by the investment adviser or reductions from expense offset arrangements and do not represent the amount paid by the class during periods when reimbursements or reductions occur. Expense ratios before reductions for start-up periods may not be representative of longer-term operating periods. Expenses net of fee waivers reflect expenses after reimbursement by the investment adviser but prior to reductions from expense offset arrangements. Expenses net of all reductions represent the net expenses paid by the class.
G Amount does not include the portfolio activity of any Underlying Funds.
H Annualized
See accompanying notes which are an integral part of the financial statements.
Fidelity Freedom® Index 2040 Fund
Investment Summary (Unaudited)
The information in the following tables is based on the direct investments of the Fund.
Top Holdings as of March 31, 2019
| | % of fund's net assets |
| Fidelity Total Market Index Fund Class F | 63.0 |
| Fidelity Series Global ex U.S. Index Fund | 26.9 |
| Fidelity U.S. Bond Index Fund Class F | 7.0 |
| Fidelity Series Long-Term Treasury Bond Index Fund | 3.1 |
| | 100.0 |
Asset Allocation (% of fund's net assets)
| Period end |
| | Domestic Equity Funds | 63.0% |
| | International Equity Funds | 26.9% |
| | Bond Funds | 10.1% |

Fidelity Freedom® Index 2040 Fund
Schedule of Investments March 31, 2019
Showing Percentage of Net Assets
| Domestic Equity Funds - 63.0% | | | |
| | | Shares | Value |
| Fidelity Total Market Index Fund Class F (a) | | | |
| (Cost $1,879,557,936) | | 32,361,032 | 2,605,710,296 |
|
| International Equity Funds - 26.9% | | | |
| Fidelity Series Global ex U.S. Index Fund (a) | | | |
| (Cost $1,053,308,620) | | 91,172,667 | 1,114,129,989 |
|
| Bond Funds - 10.1% | | | |
| Fidelity Series Long-Term Treasury Bond Index Fund (a) | | 14,169,068 | 125,679,631 |
| Fidelity U.S. Bond Index Fund Class F (a) | | 25,238,228 | 290,996,773 |
| TOTAL BOND FUNDS | | | |
| (Cost $409,653,540) | | | 416,676,404 |
| TOTAL INVESTMENT IN SECURITIES - 100.0% | | | |
| (Cost $3,342,520,096) | | | 4,136,516,689 |
| NET OTHER ASSETS (LIABILITIES) - 0.0% | | | (249,250) |
| NET ASSETS - 100% | | | $4,136,267,439 |
Legend
(a) Affiliated Fund
Affiliated Central Funds
Information regarding fiscal year to date income earned by the Fund from investments in Fidelity Central Funds is as follows:
| Fund | Income earned |
| Fidelity Cash Central Fund | $50 |
| Total | $50 |
Amounts in the income column in the above table include any capital gain distributions from underlying funds, which are presented in the corresponding line-item in the Statement of Operations, if applicable.
Affiliated Underlying Funds
Fiscal year to date information regarding the Fund's investments in affiliated Underlying Funds, excluding any Money Market Central Funds, is presented below. Exchanges between classes of the same affiliated Underlying Funds may occur.
| Affiliate | Value, beginning of period | Purchases | Sales Proceeds | Dividend Income | Realized Gain (loss) | Change in Unrealized appreciation (depreciation) | Value, end of period |
| Fidelity Commodity Strategy Fund Class F | $43,562,265 | $2,375,024 | $44,984,770 | $-- | $980,541 | $(1,933,060) | $-- |
| Fidelity Series Global ex U.S. Index Fund | 866,105,013 | 360,782,216 | 46,673,803 | 26,079,334 | (5,746,474) | (60,336,963) | 1,114,129,989 |
| Fidelity Series Long-Term Treasury Bond Index Fund | -- | 139,946,872 | 20,179,574 | 2,180,970 | (13,756) | 5,926,089 | 125,679,631 |
| Fidelity Total Market Index Fund Class F | 1,981,539,621 | 591,069,031 | 113,469,650 | 51,103,342 | (1,951,235) | 148,522,529 | 2,605,710,296 |
| Fidelity U.S. Bond Index Fund Class F | 320,248,391 | 96,423,007 | 129,727,011 | 7,917,278 | (4,125,893) | 8,178,279 | 290,996,773 |
| | $3,211,455,290 | $1,190,596,150 | $355,034,808 | $87,280,924 | $(10,856,817) | $100,356,874 | $4,136,516,689 |
Amounts in the income column in the above table include any capital gain distributions from underlying funds, which are presented in the corresponding line-item in the Statement of Operations, if applicable.
Investment Valuation
All investments are categorized as Level 1 under the Fair Value Hierarchy. The inputs or methodology used for valuing securities may not be an indication of the risk associated with investing in those securities. For more information on valuation inputs please refer to the Investment Valuation section in the accompanying Notes to Financial Statements.
See accompanying notes which are an integral part of the financial statements.
Fidelity Freedom® Index 2040 Fund
Financial Statements
Statement of Assets and Liabilities
| | | March 31, 2019 |
| Assets | | |
Investment in securities, at value — See accompanying schedule:
| | |
| Affiliated issuers (cost $3,342,520,096) | $4,136,516,689 | |
| Total Investment in Securities (cost $3,342,520,096) | | $4,136,516,689 |
| Cash | | 58 |
| Receivable for investments sold | | 2,736,968 |
| Receivable for fund shares sold | | 8,378,222 |
| Receivable from investment adviser for expense reductions | | 160,296 |
| Total assets | | 4,147,792,233 |
| Liabilities | | |
| Payable for investments purchased | $8,977,087 | |
| Payable for fund shares redeemed | 2,138,412 | |
| Transfer agent fees payable | 409,295 | |
| Total liabilities | | 11,524,794 |
| Net Assets | | $4,136,267,439 |
| Net Assets consist of: | | |
| Paid in capital | | $3,350,040,724 |
| Total distributable earnings (loss) | | 786,226,715 |
| Net Assets | | $4,136,267,439 |
| Net Asset Value and Maximum Offering Price | | |
| Investor Class: | | |
| Net Asset Value, offering price and redemption price per share ($1,731,927,342 ÷ 90,247,339 shares) | | $19.19 |
| Institutional Premium Class: | | |
| Net Asset Value, offering price and redemption price per share ($2,404,340,097 ÷ 125,313,138 shares) | | $19.19 |
See accompanying notes which are an integral part of the financial statements.
Statement of Operations
| | | Year ended March 31, 2019 |
| Investment Income | | |
| Dividends: | | |
| Affiliated issuers | | $77,514,683 |
| Income from Fidelity Central Funds | | 50 |
| Total income | | 77,514,733 |
| Expenses | | |
| Transfer agent fees | $4,305,259 | |
| Independent trustees' fees and expenses | 16,416 | |
| Total expenses before reductions | 4,321,675 | |
| Expense reductions | (1,636,040) | |
| Total expenses after reductions | | 2,685,635 |
| Net investment income (loss) | | 74,829,098 |
| Realized and Unrealized Gain (Loss) | | |
| Net realized gain (loss) on: | | |
| Investment securities: | | |
| Affiliated issuers | (10,856,817) | |
| Capital gain distributions from underlying funds: | | |
| Affiliated issuers | 9,766,241 | |
| Total net realized gain (loss) | | (1,090,576) |
| Change in net unrealized appreciation (depreciation) on: | | |
| Investment securities: | | |
| Affiliated issuers | 100,356,874 | |
| Total change in net unrealized appreciation (depreciation) | | 100,356,874 |
| Net gain (loss) | | 99,266,298 |
| Net increase (decrease) in net assets resulting from operations | | $174,095,396 |
See accompanying notes which are an integral part of the financial statements.
Statement of Changes in Net Assets
| | Year ended March 31, 2019 | Year ended March 31, 2018 |
| Increase (Decrease) in Net Assets | | |
| Operations | | |
| Net investment income (loss) | $74,829,098 | $53,073,570 |
| Net realized gain (loss) | (1,090,576) | 7,407,962 |
| Change in net unrealized appreciation (depreciation) | 100,356,874 | 263,292,142 |
| Net increase (decrease) in net assets resulting from operations | 174,095,396 | 323,773,674 |
| Distributions to shareholders | (76,331,747) | – |
| Distributions to shareholders from net investment income | – | (52,237,907) |
| Distributions to shareholders from net realized gain | – | (2,681,758) |
| Total distributions | (76,331,747) | (54,919,665) |
| Share transactions - net increase (decrease) | 827,283,554 | 604,288,654 |
| Total increase (decrease) in net assets | 925,047,203 | 873,142,663 |
| Net Assets | | |
| Beginning of period | 3,211,220,236 | 2,338,077,573 |
| End of period | $4,136,267,439 | $3,211,220,236 |
| Other Information | | |
| Undistributed net investment income end of period | | $1,209,633 |
See accompanying notes which are an integral part of the financial statements.
Financial Highlights
Fidelity Freedom Index 2040 Fund Investor Class
| Years ended March 31, | 2019 | 2018 | 2017 | 2016 | 2015 |
| Selected Per–Share Data | | | | | |
| Net asset value, beginning of period | $18.77 | $16.90 | $15.00 | $15.76 | $15.18 |
| Income from Investment Operations | | | | | |
| Net investment income (loss)A | .39 | .34 | .32 | .26 | .31 |
| Net realized and unrealized gain (loss) | .42 | 1.87 | 1.90 | (.72) | .78 |
| Total from investment operations | .81 | 2.21 | 2.22 | (.46) | 1.09 |
| Distributions from net investment income | (.38) | (.33) | (.31) | (.30) | (.50) |
| Distributions from net realized gain | (.01) | (.02) | (.01) | –B | –B |
| Total distributions | (.39) | (.34)C | (.32) | (.30) | (.51)D |
| Net asset value, end of period | $19.19 | $18.77 | $16.90 | $15.00 | $15.76 |
| Total ReturnE | 4.56% | 13.08% | 14.90% | (2.91)% | 7.27% |
| Ratios to Average Net AssetsF,G | | | | | |
| Expenses before reductions | .15% | .15% | .15% | .15% | .15% |
| Expenses net of fee waivers, if any | .11% | .12% | .10% | .08% | .08% |
| Expenses net of all reductions | .11% | .12% | .10% | .08% | .08% |
| Net investment income (loss) | 2.06% | 1.87% | 2.02% | 1.70% | 1.99% |
| Supplemental Data | | | | | |
| Net assets, end of period (000 omitted) | $1,731,927 | $1,281,722 | $900,067 | $910,880 | $1,511,298 |
| Portfolio turnover rateG | 10% | 6% | 13% | 9% | 12% |
A Calculated based on average shares outstanding during the period.
B Amount represents less than $.005 per share.
C Total distributions of $.34 per share is comprised of distributions from net investment income of $.327 and distributions from net realized gain of $.017 per share.
D Total distributions of $.51 per share is comprised of distributions from net investment income of $.502 and distributions from net realized gain of $.003 per share.
E Total returns would have been lower if certain expenses had not been reduced during the applicable periods shown.
F Expense ratios reflect operating expenses of the class. Expenses before reductions do not reflect amounts reimbursed by the investment adviser or reductions from expense offset arrangements and do not represent the amount paid by the class during periods when reimbursements or reductions occur. Expenses net of fee waivers reflect expenses after reimbursement by the investment adviser but prior to reductions from expense offset arrangements. Expenses net of all reductions represent the net expenses paid by the class.
G Amount does not include the portfolio activity of any Underlying Funds.
See accompanying notes which are an integral part of the financial statements.
Fidelity Freedom Index 2040 Fund Institutional Premium Class
| Years ended March 31, | 2019 | 2018 | 2017 | 2016 A |
| Selected Per–Share Data | | | | |
| Net asset value, beginning of period | $18.77 | $16.89 | $15.00 | $16.12 |
| Income from Investment Operations | | | | |
| Net investment income (loss)B | .40 | .35 | .33 | .41 |
| Net realized and unrealized gain (loss) | .42 | 1.88 | 1.89 | (1.22) |
| Total from investment operations | .82 | 2.23 | 2.22 | (.81) |
| Distributions from net investment income | (.39) | (.34) | (.32) | (.30) |
| Distributions from net realized gain | (.01) | (.02) | (.01) | –C |
| Total distributions | (.40) | (.35)D | (.33) | (.31)E |
| Net asset value, end of period | $19.19 | $18.77 | $16.89 | $15.00 |
| Total ReturnF,G | 4.61% | 13.20% | 14.90% | (5.06)% |
| Ratios to Average Net AssetsH,I | | | | |
| Expenses before reductions | .10% | .10% | .09% | .05%J |
| Expenses net of fee waivers, if any | .05% | .07% | .05% | .01%J |
| Expenses net of all reductions | .05% | .07% | .05% | .01%J |
| Net investment income (loss) | 2.12% | 1.92% | 2.07% | 3.69%J |
| Supplemental Data | | | | |
| Net assets, end of period (000 omitted) | $2,404,340 | $1,929,498 | $1,438,010 | $830,093 |
| Portfolio turnover rateI | 10% | 6% | 13% | 9% |
A For the period June 24, 2015 (commencement of sale of shares) to March 31, 2016.
B Calculated based on average shares outstanding during the period.
C Amount represents less than $.005 per share.
D Total distributions of $.35 per share is comprised of distributions from net investment income of $.335 and distributions from net realized gain of $.017 per share.
E Total distributions of $.31 per share is comprised of distributions from net investment income of $.309 and distributions from net realized gain of $.003 per share.
F Total returns for periods of less than one year are not annualized.
G Total returns would have been lower if certain expenses had not been reduced during the applicable periods shown.
H Expense ratios reflect operating expenses of the class. Expenses before reductions do not reflect amounts reimbursed by the investment adviser or reductions from expense offset arrangements and do not represent the amount paid by the class during periods when reimbursements or reductions occur. Expense ratios before reductions for start-up periods may not be representative of longer-term operating periods. Expenses net of fee waivers reflect expenses after reimbursement by the investment adviser but prior to reductions from expense offset arrangements. Expenses net of all reductions represent the net expenses paid by the class.
I Amount does not include the portfolio activity of any Underlying Funds.
J Annualized
See accompanying notes which are an integral part of the financial statements.
Fidelity Freedom® Index 2045 Fund
Investment Summary (Unaudited)
The information in the following tables is based on the direct investments of the Fund.
Top Holdings as of March 31, 2019
| | % of fund's net assets |
| Fidelity Total Market Index Fund Class F | 63.0 |
| Fidelity Series Global ex U.S. Index Fund | 26.9 |
| Fidelity U.S. Bond Index Fund Class F | 7.0 |
| Fidelity Series Long-Term Treasury Bond Index Fund | 3.1 |
| Fidelity Cash Central Fund, 2.48% | 0.0 |
| | 100.0 |
Asset Allocation (% of fund's net assets)
| Period end |
| | Domestic Equity Funds | 63.0% |
| | International Equity Funds | 26.9% |
| | Bond Funds | 10.1% |

Percentages shown as 0.0% may reflect amounts less than 0.05%.
Fidelity Freedom® Index 2045 Fund
Schedule of Investments March 31, 2019
Showing Percentage of Net Assets
| Domestic Equity Funds - 63.0% | | | |
| | | Shares | Value |
| Fidelity Total Market Index Fund Class F (a) | | | |
| (Cost $1,291,396,484) | | 21,046,471 | 1,694,661,859 |
|
| International Equity Funds - 26.9% | | | |
| Fidelity Series Global ex U.S. Index Fund (a) | | | |
| (Cost $691,248,202) | | 59,295,597 | 724,592,198 |
|
| Bond Funds - 10.1% | | | |
| Fidelity Series Long-Term Treasury Bond Index Fund (a) | | 9,214,918 | 81,736,319 |
| Fidelity U.S. Bond Index Fund Class F (a) | | 16,413,902 | 189,252,294 |
| TOTAL BOND FUNDS | | | |
| (Cost $266,469,583) | | | 270,988,613 |
|
| Short-Term Funds - 0.0% | | | |
| Fidelity Cash Central Fund, 2.48% (b) | | | |
| (Cost $5) | | 5 | 5 |
| TOTAL INVESTMENT IN SECURITIES - 100.0% | | | |
| (Cost $2,249,114,274) | | | 2,690,242,675 |
| NET OTHER ASSETS (LIABILITIES) - 0.0% | | | (167,644) |
| NET ASSETS - 100% | | | $2,690,075,031 |
Legend
(a) Affiliated Fund
(b) Affiliated fund that is generally available only to investment companies and other accounts managed by Fidelity Investments. The rate quoted is the annualized seven-day yield of the fund at period end. A complete unaudited listing of the fund's holdings as of its most recent quarter end is available upon request. In addition, each Fidelity Central Fund's financial statements, which are not covered by the Fund's Report of Independent Registered Public Accounting Firm, are available on the SEC's website or upon request.
Affiliated Central Funds
Information regarding fiscal year to date income earned by the Fund from investments in Fidelity Central Funds is as follows:
| Fund | Income earned |
| Fidelity Cash Central Fund | $11 |
| Total | $11 |
Amounts in the income column in the above table include any capital gain distributions from underlying funds, which are presented in the corresponding line-item in the Statement of Operations, if applicable.
Affiliated Underlying Funds
Fiscal year to date information regarding the Fund's investments in affiliated Underlying Funds, excluding any Money Market Central Funds, is presented below. Exchanges between classes of the same affiliated Underlying Funds may occur.
| Affiliate | Value, beginning of period | Purchases | Sales Proceeds | Dividend Income | Realized Gain (loss) | Change in Unrealized appreciation (depreciation) | Value, end of period |
| Fidelity Commodity Strategy Fund Class F | $26,255,219 | $2,109,606�� | $27,762,394 | $-- | $538,574 | $(1,141,005) | $-- |
| Fidelity Series Global ex U.S. Index Fund | 521,952,944 | 273,693,459 | 30,993,160 | 16,414,384 | (4,178,445) | (35,882,600) | 724,592,198 |
| Fidelity Series Long-Term Treasury Bond Index Fund | -- | 90,869,831 | 12,983,889 | 1,383,835 | (30,659) | 3,881,036 | 81,736,319 |
| Fidelity Total Market Index Fund Class F | 1,194,165,689 | 486,305,313 | 80,134,015 | 31,992,381 | (1,609,710) | 95,934,582 | 1,694,661,859 |
| Fidelity U.S. Bond Index Fund Class F | 192,994,166 | 73,601,867 | 80,094,733 | 4,963,429 | (2,453,693) | 5,204,687 | 189,252,294 |
| | $1,935,368,018 | $926,580,076 | $231,968,191 | $54,754,029 | $(7,733,933) | $67,996,700 | $2,690,242,670 |
Amounts in the income column in the above table include any capital gain distributions from underlying funds, which are presented in the corresponding line-item in the Statement of Operations, if applicable.
Investment Valuation
All investments are categorized as Level 1 under the Fair Value Hierarchy. The inputs or methodology used for valuing securities may not be an indication of the risk associated with investing in those securities. For more information on valuation inputs please refer to the Investment Valuation section in the accompanying Notes to Financial Statements.
See accompanying notes which are an integral part of the financial statements.
Fidelity Freedom® Index 2045 Fund
Financial Statements
Statement of Assets and Liabilities
| | | March 31, 2019 |
| Assets | | |
Investment in securities, at value — See accompanying schedule:
| | |
| Fidelity Central Funds (cost $5) | $5 | |
| Other affiliated issuers (cost $2,249,114,269) | 2,690,242,670 | |
| Total Investment in Securities (cost $2,249,114,274) | | $2,690,242,675 |
| Cash | | 11 |
| Receivable for investments sold | | 1,711,736 |
| Receivable for fund shares sold | | 7,318,348 |
| Receivable from investment adviser for expense reductions | | 102,790 |
| Total assets | | 2,699,375,560 |
| Liabilities | | |
| Payable for investments purchased | $8,051,247 | |
| Payable for fund shares redeemed | 979,005 | |
| Transfer agent fees payable | 270,277 | |
| Total liabilities | | 9,300,529 |
| Net Assets | | $2,690,075,031 |
| Net Assets consist of: | | |
| Paid in capital | | $2,254,801,865 |
| Total distributable earnings (loss) | | 435,273,166 |
| Net Assets | | $2,690,075,031 |
| Net Asset Value and Maximum Offering Price | | |
| Investor Class: | | |
| Net Asset Value, offering price and redemption price per share ($1,244,020,080 ÷ 64,368,535 shares) | | $19.33 |
| Institutional Premium Class: | | |
| Net Asset Value, offering price and redemption price per share ($1,446,054,951 ÷ 74,803,961 shares) | | $19.33 |
See accompanying notes which are an integral part of the financial statements.
Statement of Operations
| | | Year ended March 31, 2019 |
| Investment Income | | |
| Dividends: | | |
| Affiliated issuers | | $48,613,596 |
| Income from Fidelity Central Funds | | 11 |
| Total income | | 48,613,607 |
| Expenses | | |
| Transfer agent fees | $2,755,336 | |
| Independent trustees' fees and expenses | 10,220 | |
| Total expenses before reductions | 2,765,556 | |
| Expense reductions | (1,019,940) | |
| Total expenses after reductions | | 1,745,616 |
| Net investment income (loss) | | 46,867,991 |
| Realized and Unrealized Gain (Loss) | | |
| Net realized gain (loss) on: | | |
| Investment securities: | | |
| Affiliated issuers | (7,733,933) | |
| Capital gain distributions from underlying funds: | | |
| Affiliated issuers | 6,140,433 | |
| Total net realized gain (loss) | | (1,593,500) |
| Change in net unrealized appreciation (depreciation) on: | | |
| Investment securities: | | |
| Affiliated issuers | 67,996,700 | |
| Total change in net unrealized appreciation (depreciation) | | 67,996,700 |
| Net gain (loss) | | 66,403,200 |
| Net increase (decrease) in net assets resulting from operations | | $113,271,191 |
See accompanying notes which are an integral part of the financial statements.
Statement of Changes in Net Assets
| | Year ended March 31, 2019 | Year ended March 31, 2018 |
| Increase (Decrease) in Net Assets | | |
| Operations | | |
| Net investment income (loss) | $46,867,991 | $31,416,724 |
| Net realized gain (loss) | (1,593,500) | 4,978,956 |
| Change in net unrealized appreciation (depreciation) | 67,996,700 | 152,405,983 |
| Net increase (decrease) in net assets resulting from operations | 113,271,191 | 188,801,663 |
| Distributions to shareholders | (48,855,589) | – |
| Distributions to shareholders from net investment income | – | (31,021,585) |
| Distributions to shareholders from net realized gain | – | (2,702,847) |
| Total distributions | (48,855,589) | (33,724,432) |
| Share transactions - net increase (decrease) | 690,437,422 | 452,606,471 |
| Total increase (decrease) in net assets | 754,853,024 | 607,683,702 |
| Net Assets | | |
| Beginning of period | 1,935,222,007 | 1,327,538,305 |
| End of period | $2,690,075,031 | $1,935,222,007 |
| Other Information | | |
| Undistributed net investment income end of period | | $771,366 |
See accompanying notes which are an integral part of the financial statements.
Financial Highlights
Fidelity Freedom Index 2045 Fund Investor Class
| Years ended March 31, | 2019 | 2018 | 2017 | 2016 | 2015 |
| Selected Per–Share Data | | | | | |
| Net asset value, beginning of period | $18.91 | $17.04 | $15.13 | $15.89 | $15.32 |
| Income from Investment Operations | | | | | |
| Net investment income (loss)A | .39 | .35 | .33 | .28 | .32 |
| Net realized and unrealized gain (loss) | .43 | 1.88 | 1.90 | (.74) | .77 |
| Total from investment operations | .82 | 2.23 | 2.23 | (.46) | 1.09 |
| Distributions from net investment income | (.38) | (.33) | (.31) | (.30) | (.51) |
| Distributions from net realized gain | (.02) | (.03) | (.01) | –B | (.01) |
| Total distributions | (.40) | (.36) | (.32) | (.30) | (.52) |
| Net asset value, end of period | $19.33 | $18.91 | $17.04 | $15.13 | $15.89 |
| Total ReturnC | 4.58% | 13.08% | 14.87% | (2.88)% | 7.22% |
| Ratios to Average Net AssetsD,E | | | | | |
| Expenses before reductions | .15% | .15% | .15% | .15% | .15% |
| Expenses net of fee waivers, if any | .11% | .12% | .10% | .08% | .08% |
| Expenses net of all reductions | .11% | .12% | .10% | .08% | .08% |
| Net investment income (loss) | 2.06% | 1.89% | 2.04% | 1.79% | 2.04% |
| Supplemental Data | | | | | |
| Net assets, end of period (000 omitted) | $1,244,020 | $872,779 | $583,893 | $542,581 | $750,330 |
| Portfolio turnover rateE | 10% | 6% | 15% | 8% | 12% |
A Calculated based on average shares outstanding during the period.
B Amount represents less than $.005 per share.
C Total returns would have been lower if certain expenses had not been reduced during the applicable periods shown.
D Expense ratios reflect operating expenses of the class. Expenses before reductions do not reflect amounts reimbursed by the investment adviser or reductions from expense offset arrangements and do not represent the amount paid by the class during periods when reimbursements or reductions occur. Expenses net of fee waivers reflect expenses after reimbursement by the investment adviser but prior to reductions from expense offset arrangements. Expenses net of all reductions represent the net expenses paid by the class.
E Amount does not include the portfolio activity of any Underlying Funds.
See accompanying notes which are an integral part of the financial statements.
Fidelity Freedom Index 2045 Fund Institutional Premium Class
| Years ended March 31, | 2019 | 2018 | 2017 | 2016 A |
| Selected Per–Share Data | | | | |
| Net asset value, beginning of period | $18.92 | $17.04 | $15.13 | $16.26 |
| Income from Investment Operations | | | | |
| Net investment income (loss)B | .40 | .36 | .34 | .40 |
| Net realized and unrealized gain (loss) | .42 | 1.89 | 1.90 | (1.22) |
| Total from investment operations | .82 | 2.25 | 2.24 | (.82) |
| Distributions from net investment income | (.39) | (.34) | (.32) | (.30) |
| Distributions from net realized gain | (.02) | (.03) | (.01) | –C |
| Total distributions | (.41) | (.37) | (.33) | (.31)D |
| Net asset value, end of period | $19.33 | $18.92 | $17.04 | $15.13 |
| Total ReturnE,F | 4.58% | 13.20% | 14.94% | (5.08)% |
| Ratios to Average Net AssetsG,H | | | | |
| Expenses before reductions | .10% | .10% | .09% | .05%I |
| Expenses net of fee waivers, if any | .05% | .07% | .05% | .01%I |
| Expenses net of all reductions | .05% | .07% | .05% | .01%I |
| Net investment income (loss) | 2.11% | 1.94% | 2.09% | 3.56%I |
| Supplemental Data | | | | |
| Net assets, end of period (000 omitted) | $1,446,055 | $1,062,443 | $743,645 | $386,977 |
| Portfolio turnover rateH | 10% | 6% | 15% | 8% |
A For the period June 24, 2015 (commencement of sale of shares) to March 31, 2016.
B Calculated based on average shares outstanding during the period.
C Amount represents less than $.005 per share.
D Total distributions of $.31 per share is comprised of distributions from net investment income of $.303 and distributions from net realized gain of $.003 per share.
E Total returns for periods of less than one year are not annualized.
F Total returns would have been lower if certain expenses had not been reduced during the applicable periods shown.
G Expense ratios reflect operating expenses of the class. Expenses before reductions do not reflect amounts reimbursed by the investment adviser or reductions from expense offset arrangements and do not represent the amount paid by the class during periods when reimbursements or reductions occur. Expense ratios before reductions for start-up periods may not be representative of longer-term operating periods. Expenses net of fee waivers reflect expenses after reimbursement by the investment adviser but prior to reductions from expense offset arrangements. Expenses net of all reductions represent the net expenses paid by the class.
H Amount does not include the portfolio activity of any Underlying Funds.
I Annualized
See accompanying notes which are an integral part of the financial statements.
Fidelity Freedom® Index 2050 Fund
Investment Summary (Unaudited)
The information in the following tables is based on the direct investments of the Fund.
Top Holdings as of March 31, 2019
| | % of fund's net assets |
| Fidelity Total Market Index Fund Class F | 63.0 |
| Fidelity Series Global ex U.S. Index Fund | 26.9 |
| Fidelity U.S. Bond Index Fund Class F | 7.0 |
| Fidelity Series Long-Term Treasury Bond Index Fund | 3.1 |
| Fidelity Cash Central Fund, 2.48% | 0.0 |
| | 100.0 |
Asset Allocation (% of fund's net assets)
| Period end |
| | Domestic Equity Funds | 63.0% |
| | International Equity Funds | 26.9% |
| | Bond Funds | 10.1% |

Percentages shown as 0.0% may reflect amounts less than 0.05%.
Fidelity Freedom® Index 2050 Fund
Schedule of Investments March 31, 2019
Showing Percentage of Net Assets
| Domestic Equity Funds - 63.0% | | | |
| | | Shares | Value |
| Fidelity Total Market Index Fund Class F (a) | | | |
| (Cost $1,159,846,625) | | 18,981,344 | 1,528,377,784 |
|
| International Equity Funds - 26.9% | | | |
| Fidelity Series Global ex U.S. Index Fund (a) | | | |
| (Cost $622,446,068) | | 53,477,415 | 653,494,014 |
|
| Bond Funds - 10.1% | | | |
| Fidelity Series Long-Term Treasury Bond Index Fund (a) | | 8,310,660 | 73,715,553 |
| Fidelity U.S. Bond Index Fund Class F (a) | | 14,803,244 | 170,681,400 |
| TOTAL BOND FUNDS | | | |
| (Cost $240,716,537) | | | 244,396,953 |
|
| Short-Term Funds - 0.0% | | | |
| Fidelity Cash Central Fund, 2.48% (b) | | | |
| (Cost $5) | | 5 | 5 |
| TOTAL INVESTMENT IN SECURITIES - 100.0% | | | |
| (Cost $2,023,009,235) | | | 2,426,268,756 |
| NET OTHER ASSETS (LIABILITIES) - 0.0% | | | (147,168) |
| NET ASSETS - 100% | | | $2,426,121,588 |
Legend
(a) Affiliated Fund
(b) Affiliated fund that is generally available only to investment companies and other accounts managed by Fidelity Investments. The rate quoted is the annualized seven-day yield of the fund at period end. A complete unaudited listing of the fund's holdings as of its most recent quarter end is available upon request. In addition, each Fidelity Central Fund's financial statements, which are not covered by the Fund's Report of Independent Registered Public Accounting Firm, are available on the SEC's website or upon request.
Affiliated Central Funds
Information regarding fiscal year to date income earned by the Fund from investments in Fidelity Central Funds is as follows:
| Fund | Income earned |
| Fidelity Cash Central Fund | $13 |
| Total | $13 |
Amounts in the income column in the above table include any capital gain distributions from underlying funds, which are presented in the corresponding line-item in the Statement of Operations, if applicable.
Affiliated Underlying Funds
Fiscal year to date information regarding the Fund's investments in affiliated Underlying Funds, excluding any Money Market Central Funds, is presented below. Exchanges between classes of the same affiliated Underlying Funds may occur.
| Affiliate | Value, beginning of period | Purchases | Sales Proceeds | Dividend Income | Realized Gain (loss) | Change in Unrealized appreciation (depreciation) | Value, end of period |
| Fidelity Commodity Strategy Fund Class F | $24,471,106 | $1,837,036 | $25,765,641 | $-- | $519,266 | $(1,061,767) | $-- |
| Fidelity Series Global ex U.S. Index Fund | 486,461,725 | 242,348,146 | 38,166,652 | 14,911,347 | (3,814,638) | (33,334,567) | 653,494,014 |
| Fidelity Series Long-Term Treasury Bond Index Fund | -- | 82,436,887 | 12,176,091 | 1,256,220 | (39,887) | 3,494,644 | 73,715,553 |
| Fidelity Total Market Index Fund Class F | 1,112,966,999 | 417,309,043 | 86,337,130 | 29,154,638 | (1,609,398) | 86,048,270 | 1,528,377,784 |
| Fidelity U.S. Bond Index Fund Class F | 179,870,698 | 64,878,210 | 76,482,523 | 4,523,238 | (2,171,804) | 4,586,819 | 170,681,400 |
| | $1,803,770,528 | $808,809,322 | $238,928,037 | $49,845,443 | $(7,116,461) | $59,733,399 | $2,426,268,751 |
Amounts in the income column in the above table include any capital gain distributions from underlying funds, which are presented in the corresponding line-item in the Statement of Operations, if applicable.
Investment Valuation
All investments are categorized as Level 1 under the Fair Value Hierarchy. The inputs or methodology used for valuing securities may not be an indication of the risk associated with investing in those securities. For more information on valuation inputs please refer to the Investment Valuation section in the accompanying Notes to Financial Statements.
See accompanying notes which are an integral part of the financial statements.
Fidelity Freedom® Index 2050 Fund
Financial Statements
Statement of Assets and Liabilities
| | | March 31, 2019 |
| Assets | | |
Investment in securities, at value — See accompanying schedule:
| | |
| Fidelity Central Funds (cost $5) | $5 | |
| Other affiliated issuers (cost $2,023,009,230) | 2,426,268,751 | |
| Total Investment in Securities (cost $2,023,009,235) | | $2,426,268,756 |
| Cash | | 13 |
| Receivable for investments sold | | 1,522,642 |
| Receivable for fund shares sold | | 7,761,134 |
| Receivable from investment adviser for expense reductions | | 93,145 |
| Total assets | | 2,435,645,690 |
| Liabilities | | |
| Payable for investments purchased | $7,956,714 | |
| Payable for fund shares redeemed | 1,327,216 | |
| Transfer agent fees payable | 240,172 | |
| Total liabilities | | 9,524,102 |
| Net Assets | | $2,426,121,588 |
| Net Assets consist of: | | |
| Paid in capital | | $2,030,127,869 |
| Total distributable earnings (loss) | | 395,993,719 |
| Net Assets | | $2,426,121,588 |
| Net Asset Value and Maximum Offering Price | | |
| Investor Class: | | |
| Net Asset Value, offering price and redemption price per share ($1,049,434,405 ÷ 54,060,681 shares) | | $19.41 |
| Institutional Premium Class: | | |
| Net Asset Value, offering price and redemption price per share ($1,376,687,183 ÷ 70,926,393 shares) | | $19.41 |
See accompanying notes which are an integral part of the financial statements.
Statement of Operations
| | | Year ended March 31, 2019 |
| Investment Income | | |
| Dividends: | | |
| Affiliated issuers | | $44,260,720 |
| Income from Fidelity Central Funds | | 13 |
| Total income | | 44,260,733 |
| Expenses | | |
| Transfer agent fees | $2,475,331 | |
| Independent trustees' fees and expenses | 9,347 | |
| Total expenses before reductions | 2,484,678 | |
| Expense reductions | (934,266) | |
| Total expenses after reductions | | 1,550,412 |
| Net investment income (loss) | | 42,710,321 |
| Realized and Unrealized Gain (Loss) | | |
| Net realized gain (loss) on: | | |
| Investment securities: | | |
| Affiliated issuers | (7,116,461) | |
| Capital gain distributions from underlying funds: | | |
| Affiliated issuers | 5,584,723 | |
| Total net realized gain (loss) | | (1,531,738) |
| Change in net unrealized appreciation (depreciation) on: | | |
| Investment securities: | | |
| Affiliated issuers | 59,733,399 | |
| Total change in net unrealized appreciation (depreciation) | | 59,733,399 |
| Net gain (loss) | | 58,201,661 |
| Net increase (decrease) in net assets resulting from operations | | $100,911,982 |
See accompanying notes which are an integral part of the financial statements.
Statement of Changes in Net Assets
| | Year ended March 31, 2019 | Year ended March 31, 2018 |
| Increase (Decrease) in Net Assets | | |
| Operations | | |
| Net investment income (loss) | $42,710,321 | $29,220,103 |
| Net realized gain (loss) | (1,531,738) | 5,119,528 |
| Change in net unrealized appreciation (depreciation) | 59,733,399 | 140,888,470 |
| Net increase (decrease) in net assets resulting from operations | 100,911,982 | 175,228,101 |
| Distributions to shareholders | (44,851,696) | – |
| Distributions to shareholders from net investment income | – | (28,745,530) |
| Distributions to shareholders from net realized gain | – | (4,868,444) |
| Total distributions | (44,851,696) | (33,613,974) |
| Share transactions - net increase (decrease) | 566,423,597 | 425,700,354 |
| Total increase (decrease) in net assets | 622,483,883 | 567,314,481 |
| Net Assets | | |
| Beginning of period | 1,803,637,705 | 1,236,323,224 |
| End of period | $2,426,121,588 | $1,803,637,705 |
| Other Information | | |
| Undistributed net investment income end of period | | $760,359 |
See accompanying notes which are an integral part of the financial statements.
Financial Highlights
Fidelity Freedom Index 2050 Fund Investor Class
| Years ended March 31, | 2019 | 2018 | 2017 | 2016 | 2015 |
| Selected Per–Share Data | | | | | |
| Net asset value, beginning of period | $19.00 | $17.14 | $15.24 | $16.01 | $15.42 |
| Income from Investment Operations | | | | | |
| Net investment income (loss)A | .39 | .35 | .33 | .28 | .32 |
| Net realized and unrealized gain (loss) | .42 | 1.90 | 1.91 | (.74) | .78 |
| Total from investment operations | .81 | 2.25 | 2.24 | (.46) | 1.10 |
| Distributions from net investment income | (.38) | (.33) | (.33) | (.30) | (.50) |
| Distributions from net realized gain | (.02) | (.06) | (.01) | –B | (.01) |
| Total distributions | (.40) | (.39) | (.34) | (.31)C | (.51) |
| Net asset value, end of period | $19.41 | $19.00 | $17.14 | $15.24 | $16.01 |
| Total ReturnD | 4.53% | 13.15% | 14.82% | (2.92)% | 7.25% |
| Ratios to Average Net AssetsE,F | | | | | |
| Expenses before reductions | .15% | .15% | .15% | .15% | .15% |
| Expenses net of fee waivers, if any | .11% | .12% | .10% | .08% | .08% |
| Expenses net of all reductions | .11% | .12% | .10% | .08% | .08% |
| Net investment income (loss) | 2.06% | 1.89% | 2.06% | 1.80% | 2.02% |
| Supplemental Data | | | | | |
| Net assets, end of period (000 omitted) | $1,049,434 | $739,919 | $513,543 | $486,444 | $729,639 |
| Portfolio turnover rateF | 12% | 6% | 19% | 7% | 10% |
A Calculated based on average shares outstanding during the period.
B Amount represents less than $.005 per share.
C Total distributions of $.31 per share is comprised of distributions from net investment income of $.302 and distributions from net realized gain of $.003 per share.
D Total returns would have been lower if certain expenses had not been reduced during the applicable periods shown.
E Expense ratios reflect operating expenses of the class. Expenses before reductions do not reflect amounts reimbursed by the investment adviser or reductions from expense offset arrangements and do not represent the amount paid by the class during periods when reimbursements or reductions occur. Expenses net of fee waivers reflect expenses after reimbursement by the investment adviser but prior to reductions from expense offset arrangements. Expenses net of all reductions represent the net expenses paid by the class.
F Amount does not include the portfolio activity of any Underlying Funds.
See accompanying notes which are an integral part of the financial statements.
Fidelity Freedom Index 2050 Fund Institutional Premium Class
| Years ended March 31, | 2019 | 2018 | 2017 | 2016 A |
| Selected Per–Share Data | | | | |
| Net asset value, beginning of period | $19.00 | $17.14 | $15.24 | $16.37 |
| Income from Investment Operations | | | | |
| Net investment income (loss)B | .40 | .36 | .34 | .38 |
| Net realized and unrealized gain (loss) | .42 | 1.90 | 1.91 | (1.20) |
| Total from investment operations | .82 | 2.26 | 2.25 | (.82) |
| Distributions from net investment income | (.39) | (.34) | (.34) | (.30) |
| Distributions from net realized gain | (.02) | (.06) | (.01) | –C |
| Total distributions | (.41) | (.40) | (.35) | (.31)D |
| Net asset value, end of period | $19.41 | $19.00 | $17.14 | $15.24 |
| Total ReturnE,F | 4.59% | 13.20% | 14.88% | (5.04)% |
| Ratios to Average Net AssetsG,H | | | | |
| Expenses before reductions | .10% | .10% | .09% | .05%I |
| Expenses net of fee waivers, if any | .05% | .07% | .05% | .01%I |
| Expenses net of all reductions | .05% | .07% | .05% | .01%I |
| Net investment income (loss) | 2.11% | 1.94% | 2.11% | 3.40%I |
| Supplemental Data | | | | |
| Net assets, end of period (000 omitted) | $1,376,687 | $1,063,718 | $722,781 | $434,989 |
| Portfolio turnover rateH | 12% | 6% | 19% | 7% |
A For the period June 24, 2015 (commencement of sale of shares) to March 31, 2016.
B Calculated based on average shares outstanding during the period.
C Amount represents less than $.005 per share.
D Total distributions of $.31 per share is comprised of distributions from net investment income of $.304 and distributions from net realized gain of $.003 per share.
E Total returns for periods of less than one year are not annualized.
F Total returns would have been lower if certain expenses had not been reduced during the applicable periods shown.
G Expense ratios reflect operating expenses of the class. Expenses before reductions do not reflect amounts reimbursed by the investment adviser or reductions from expense offset arrangements and do not represent the amount paid by the class during periods when reimbursements or reductions occur. Expense ratios before reductions for start-up periods may not be representative of longer-term operating periods. Expenses net of fee waivers reflect expenses after reimbursement by the investment adviser but prior to reductions from expense offset arrangements. Expenses net of all reductions represent the net expenses paid by the class.
H Amount does not include the portfolio activity of any Underlying Funds.
I Annualized
See accompanying notes which are an integral part of the financial statements.
Fidelity Freedom® Index 2055 Fund
Investment Summary (Unaudited)
The information in the following tables is based on the direct investments of the Fund.
Top Holdings as of March 31, 2019
| | % of fund's net assets |
| Fidelity Total Market Index Fund Class F | 63.0 |
| Fidelity Series Global ex U.S. Index Fund | 26.9 |
| Fidelity U.S. Bond Index Fund Class F | 7.0 |
| Fidelity Series Long-Term Treasury Bond Index Fund | 3.1 |
| | 100.0 |
Asset Allocation (% of fund's net assets)
| Period end |
| | Domestic Equity Funds | 63.0% |
| | International Equity Funds | 26.9% |
| | Bond Funds | 10.1% |

Fidelity Freedom® Index 2055 Fund
Schedule of Investments March 31, 2019
Showing Percentage of Net Assets
| Domestic Equity Funds - 63.0% | | | |
| | | Shares | Value |
| Fidelity Total Market Index Fund Class F (a) | | | |
| (Cost $537,906,839) | | 8,032,302 | 646,760,920 |
|
| International Equity Funds - 26.9% | | | |
| Fidelity Series Global ex U.S. Index Fund (a) | | | |
| (Cost $267,166,216) | | 22,629,994 | 276,538,524 |
|
| Bond Funds - 10.1% | | | |
| Fidelity Series Long-Term Treasury Bond Index Fund (a) | | 3,516,737 | 31,193,457 |
| Fidelity U.S. Bond Index Fund Class F (a) | | 6,264,183 | 72,226,028 |
| TOTAL BOND FUNDS | | | |
| (Cost $101,559,070) | | | 103,419,485 |
| TOTAL INVESTMENT IN SECURITIES - 100.0% | | | |
| (Cost $906,632,125) | | | 1,026,718,929 |
| NET OTHER ASSETS (LIABILITIES) - 0.0% | | | (65,369) |
| NET ASSETS - 100% | | | $1,026,653,560 |
Legend
(a) Affiliated Fund
Affiliated Underlying Funds
Fiscal year to date information regarding the Fund's investments in affiliated Underlying Funds, excluding any Money Market Central Funds, is presented below. Exchanges between classes of the same affiliated Underlying Funds may occur.
| Affiliate | Value, beginning of period | Purchases | Sales Proceeds | Dividend Income | Realized Gain (loss) | Change in Unrealized appreciation (depreciation) | Value, end of period |
| Fidelity Commodity Strategy Fund Class F | $8,795,629 | $1,150,518 | $9,727,525 | $-- | $145,158 | $(363,780) | $-- |
| Fidelity Series Global ex U.S. Index Fund | 174,792,866 | 127,580,110 | 12,287,053 | 5,955,811 | (1,738,162) | (11,809,237) | 276,538,524 |
| Fidelity Series Long-Term Treasury Bond Index Fund | -- | 34,762,615 | 5,042,859 | 506,312 | (24,847) | 1,498,548 | 31,193,457 |
| Fidelity Total Market Index Fund Class F | 399,908,097 | 247,494,139 | 35,250,361 | 11,498,775 | (1,051,763) | 35,660,808 | 646,760,920 |
| Fidelity U.S. Bond Index Fund Class F | 64,628,593 | 35,270,166 | 28,788,108 | 1,777,184 | (665,282) | 1,780,659 | 72,226,028 |
| | $648,125,185 | $446,257,548 | $91,095,906 | $19,738,082 | $(3,334,896) | $26,766,998 | $1,026,718,929 |
Amounts in the income column in the above table include any capital gain distributions from underlying funds, which are presented in the corresponding line-item in the Statement of Operations, if applicable.
Investment Valuation
All investments are categorized as Level 1 under the Fair Value Hierarchy. The inputs or methodology used for valuing securities may not be an indication of the risk associated with investing in those securities. For more information on valuation inputs please refer to the Investment Valuation section in the accompanying Notes to Financial Statements.
See accompanying notes which are an integral part of the financial statements.
Fidelity Freedom® Index 2055 Fund
Financial Statements
Statement of Assets and Liabilities
| | | March 31, 2019 |
| Assets | | |
Investment in securities, at value — See accompanying schedule:
| | |
| Affiliated issuers (cost $906,632,125) | $1,026,718,929 | |
| Total Investment in Securities (cost $906,632,125) | | $1,026,718,929 |
| Cash | | 1 |
| Receivable for investments sold | | 616,118 |
| Receivable for fund shares sold | | 4,357,012 |
| Receivable from investment adviser for expense reductions | | 38,562 |
| Total assets | | 1,031,730,622 |
| Liabilities | | |
| Payable for investments purchased | $4,312,731 | |
| Payable for fund shares redeemed | 660,449 | |
| Transfer agent fees payable | 103,882 | |
| Total liabilities | | 5,077,062 |
| Net Assets | | $1,026,653,560 |
| Net Assets consist of: | | |
| Paid in capital | | $909,112,774 |
| Total distributable earnings (loss) | | 117,540,786 |
| Net Assets | | $1,026,653,560 |
| Net Asset Value and Maximum Offering Price | | |
| Investor Class: | | |
| Net Asset Value, offering price and redemption price per share ($510,460,044 ÷ 33,297,866 shares) | | $15.33 |
| Institutional Premium Class: | | |
| Net Asset Value, offering price and redemption price per share ($516,193,516 ÷ 33,645,938 shares) | | $15.34 |
See accompanying notes which are an integral part of the financial statements.
Statement of Operations
| | | Year ended March 31, 2019 |
| Investment Income | | |
| Dividends: | | |
| Affiliated issuers | | $17,514,092 |
| Expenses | | |
| Transfer agent fees | $998,277 | |
| Independent trustees' fees and expenses | 3,616 | |
| Total expenses before reductions | 1,001,893 | |
| Expense reductions | (365,573) | |
| Total expenses after reductions | | 636,320 |
| Net investment income (loss) | | 16,877,772 |
| Realized and Unrealized Gain (Loss) | | |
| Net realized gain (loss) on: | | |
| Investment securities: | | |
| Affiliated issuers | (3,334,896) | |
| Capital gain distributions from underlying funds: | | |
| Affiliated issuers | 2,223,990 | |
| Total net realized gain (loss) | | (1,110,906) |
| Change in net unrealized appreciation (depreciation) on: | | |
| Investment securities: | | |
| Affiliated issuers | 26,766,998 | |
| Total change in net unrealized appreciation (depreciation) | | 26,766,998 |
| Net gain (loss) | | 25,656,092 |
| Net increase (decrease) in net assets resulting from operations | | $42,533,864 |
See accompanying notes which are an integral part of the financial statements.
Statement of Changes in Net Assets
| | Year ended March 31, 2019 | Year ended March 31, 2018 |
| Increase (Decrease) in Net Assets | | |
| Operations | | |
| Net investment income (loss) | $16,877,772 | $10,044,680 |
| Net realized gain (loss) | (1,110,906) | 2,291,231 |
| Change in net unrealized appreciation (depreciation) | 26,766,998 | 46,016,533 |
| Net increase (decrease) in net assets resulting from operations | 42,533,864 | 58,352,444 |
| Distributions to shareholders | (18,251,363) | – |
| Distributions to shareholders from net investment income | – | (9,831,029) |
| Distributions to shareholders from net realized gain | – | (1,192,955) |
| Total distributions | (18,251,363) | (11,023,984) |
| Share transactions - net increase (decrease) | 354,294,793 | 208,298,327 |
| Total increase (decrease) in net assets | 378,577,294 | 255,626,787 |
| Net Assets | | |
| Beginning of period | 648,076,266 | 392,449,479 |
| End of period | $1,026,653,560 | $648,076,266 |
| Other Information | | |
| Undistributed net investment income end of period | | $218,367 |
See accompanying notes which are an integral part of the financial statements.
Financial Highlights
Fidelity Freedom Index 2055 Fund Investor Class
| Years ended March 31, | 2019 | 2018 | 2017 | 2016 | 2015 |
| Selected Per–Share Data | | | | | |
| Net asset value, beginning of period | $15.01 | $13.53 | $12.06 | $12.71 | $12.07 |
| Income from Investment Operations | | | | | |
| Net investment income (loss)A | .31 | .28 | .28 | .25 | .26 |
| Net realized and unrealized gain (loss) | .34 | 1.49 | 1.50 | (.63) | .62 |
| Total from investment operations | .65 | 1.77 | 1.78 | (.38) | .88 |
| Distributions from net investment income | (.30) | (.26) | (.29) | (.24)B | (.24) |
| Distributions from net realized gain | (.03) | (.04) | (.02) | (.01)B | – |
| Tax return of capital | – | – | – | (.02) | – |
| Total distributions | (.33) | (.29)C | (.31) | (.27) | (.24) |
| Net asset value, end of period | $15.33 | $15.01 | $13.53 | $12.06 | $12.71 |
| Total ReturnD | 4.57% | 13.09% | 14.90% | (2.96)% | 7.27% |
| Ratios to Average Net AssetsE,F | | | | | |
| Expenses before reductions | .15% | .15% | .15% | .15% | .15% |
| Expenses net of fee waivers, if any | .11% | .12% | .10% | .08% | .08% |
| Expenses net of all reductions | .11% | .12% | .10% | .08% | .08% |
| Net investment income (loss) | 2.06% | 1.90% | 2.18% | 2.03% | 2.10% |
| Supplemental Data | | | | | |
| Net assets, end of period (000 omitted) | $510,460 | $305,192 | $181,697 | $150,332 | $183,117 |
| Portfolio turnover rateF | 11% | 6% | 33% | 7% | 8% |
A Calculated based on average shares outstanding during the period.
B The amounts shown reflect certain reclassifications related to book to tax differences that were made in the year shown.
C Total distributions of $.29 per share is comprised of distributions from net investment income of $.255 and distributions from net realized gain of $.036 per share.
D Total returns would have been lower if certain expenses had not been reduced during the applicable periods shown.
E Expense ratios reflect operating expenses of the class. Expenses before reductions do not reflect amounts reimbursed by the investment adviser or reductions from expense offset arrangements and do not represent the amount paid by the class during periods when reimbursements or reductions occur. Expenses net of fee waivers reflect expenses after reimbursement by the investment adviser but prior to reductions from expense offset arrangements. Expenses net of all reductions represent the net expenses paid by the class.
F Amount does not include the portfolio activity of any Underlying Funds.
See accompanying notes which are an integral part of the financial statements.
Fidelity Freedom Index 2055 Fund Institutional Premium Class
| Years ended March 31, | 2019 | 2018 | 2017 | 2016 A |
| Selected Per–Share Data | | | | |
| Net asset value, beginning of period | $15.02 | $13.54 | $12.06 | $13.00 |
| Income from Investment Operations | | | | |
| Net investment income (loss)B | .32 | .29 | .28 | .23 |
| Net realized and unrealized gain (loss) | .34 | 1.49 | 1.51 | (.89) |
| Total from investment operations | .66 | 1.78 | 1.79 | (.66) |
| Distributions from net investment income | (.30) | (.26) | (.29) | (.25)C |
| Distributions from net realized gain | (.03) | (.04) | (.02) | (.01)C |
| Tax return of capital | – | – | – | (.02) |
| Total distributions | (.34)D | (.30) | (.31) | (.28) |
| Net asset value, end of period | $15.34 | $15.02 | $13.54 | $12.06 |
| Total ReturnE,F | 4.61% | 13.13% | 14.98% | (5.11)% |
| Ratios to Average Net AssetsG,H | | | | |
| Expenses before reductions | .10% | .10% | .09% | .05%I |
| Expenses net of fee waivers, if any | .05% | .07% | .05% | .01%I |
| Expenses net of all reductions | .05% | .07% | .05% | .01%I |
| Net investment income (loss) | 2.12% | 1.95% | 2.23% | 2.63%I |
| Supplemental Data | | | | |
| Net assets, end of period (000 omitted) | $516,194 | $342,884 | $210,752 | $135,214 |
| Portfolio turnover rateH | 11% | 6% | 33% | 7% |
A For the period June 24, 2015 (commencement of sale of shares) to March 31, 2016.
B Calculated based on average shares outstanding during the period.
C The amounts shown reflect certain reclassifications related to book to tax differences that were made in the year shown.
D Total distributions of $.34 per share is comprised of distributions from net investment income of $.302 and distributions from net realized gain of $.033 per share.
E Total returns for periods of less than one year are not annualized.
F Total returns would have been lower if certain expenses had not been reduced during the applicable periods shown.
G Expense ratios reflect operating expenses of the class. Expenses before reductions do not reflect amounts reimbursed by the investment adviser or reductions from expense offset arrangements and do not represent the amount paid by the class during periods when reimbursements or reductions occur. Expense ratios before reductions for start-up periods may not be representative of longer-term operating periods. Expenses net of fee waivers reflect expenses after reimbursement by the investment adviser but prior to reductions from expense offset arrangements. Expenses net of all reductions represent the net expenses paid by the class.
H Amount does not include the portfolio activity of any Underlying Funds.
I Annualized
See accompanying notes which are an integral part of the financial statements.
Fidelity Freedom® Index 2060 Fund
Investment Summary (Unaudited)
The information in the following tables is based on the direct investments of the Fund.
Top Holdings as of March 31, 2019
| | % of fund's net assets |
| Fidelity Total Market Index Fund Class F | 63.0 |
| Fidelity Series Global ex U.S. Index Fund | 26.9 |
| Fidelity U.S. Bond Index Fund Class F | 7.0 |
| Fidelity Series Long-Term Treasury Bond Index Fund | 3.1 |
| | 100.0 |
Asset Allocation (% of fund's net assets)
| Period end |
| | Domestic Equity Funds | 63.0% |
| | International Equity Funds | 26.9% |
| | Bond Funds | 10.1% |

Fidelity Freedom® Index 2060 Fund
Schedule of Investments March 31, 2019
Showing Percentage of Net Assets
| Domestic Equity Funds - 63.0% | | | |
| | | Shares | Value |
| Fidelity Total Market Index Fund Class F (a) | | | |
| (Cost $168,940,963) | | 2,335,945 | 188,090,302 |
|
| International Equity Funds - 26.9% | | | |
| Fidelity Series Global ex U.S. Index Fund (a) | | | |
| (Cost $79,000,857) | | 6,581,249 | 80,422,864 |
|
| Bond Funds - 10.1% | | | |
| Fidelity Series Long-Term Treasury Bond Index Fund (a) | | 1,022,692 | 9,071,274 |
| Fidelity U.S. Bond Index Fund Class F (a) | | 1,821,685 | 21,004,026 |
| TOTAL BOND FUNDS | | | |
| (Cost $29,457,152) | | | 30,075,300 |
| TOTAL INVESTMENT IN SECURITIES - 100.0% | | | |
| (Cost $277,398,972) | | | 298,588,466 |
| NET OTHER ASSETS (LIABILITIES) - 0.0% | | | (19,397) |
| NET ASSETS - 100% | | | $298,569,069 |
Legend
(a) Affiliated Fund
Affiliated Underlying Funds
Fiscal year to date information regarding the Fund's investments in affiliated Underlying Funds, excluding any Money Market Central Funds, is presented below. Exchanges between classes of the same affiliated Underlying Funds may occur.
| Affiliate | Value, beginning of period | Purchases | Sales Proceeds | Dividend Income | Realized Gain (loss) | Change in Unrealized appreciation (depreciation) | Value, end of period |
| Fidelity Commodity Strategy Fund Class F | $2,116,181 | $477,917 | $2,536,314 | $-- | $18,526 | $(76,310) | $-- |
| Fidelity Series Global ex U.S. Index Fund | 42,014,997 | 47,598,282 | 5,715,104 | 1,665,252 | (778,544) | (2,696,767) | 80,422,864 |
| Fidelity Series Long-Term Treasury Bond Index Fund | -- | 10,224,731 | 1,591,410 | 139,541 | (8,611) | 446,564 | 9,071,274 |
| Fidelity Total Market Index Fund Class F | 96,127,986 | 97,138,953 | 13,885,571 | 3,159,676 | (600,012) | 9,308,946 | 188,090,302 |
| Fidelity U.S. Bond Index Fund Class F | 15,533,738 | 13,407,205 | 8,287,235 | 472,063 | (147,235) | 497,553 | 21,004,026 |
| | $155,792,902 | $168,847,088 | $32,015,634 | $5,436,532 | $(1,515,876) | $7,479,986 | $298,588,466 |
Amounts in the income column in the above table include any capital gain distributions from underlying funds, which are presented in the corresponding line-item in the Statement of Operations, if applicable.
Investment Valuation
All investments are categorized as Level 1 under the Fair Value Hierarchy. The inputs or methodology used for valuing securities may not be an indication of the risk associated with investing in those securities. For more information on valuation inputs please refer to the Investment Valuation section in the accompanying Notes to Financial Statements.
See accompanying notes which are an integral part of the financial statements.
Fidelity Freedom® Index 2060 Fund
Financial Statements
Statement of Assets and Liabilities
| | | March 31, 2019 |
| Assets | | |
Investment in securities, at value — See accompanying schedule:
| | |
| Affiliated issuers (cost $277,398,972) | $298,588,466 | |
| Total Investment in Securities (cost $277,398,972) | | $298,588,466 |
| Cash | | 1 |
| Receivable for investments sold | | 168,687 |
| Receivable for fund shares sold | | 1,537,118 |
| Receivable from investment adviser for expense reductions | | 10,915 |
| Total assets | | 300,305,187 |
| Liabilities | | |
| Payable for investments purchased | $1,617,022 | |
| Payable for fund shares redeemed | 88,804 | |
| Transfer agent fees payable | 30,292 | |
| Total liabilities | | 1,736,118 |
| Net Assets | | $298,569,069 |
| Net Assets consist of: | | |
| Paid in capital | | $278,584,844 |
| Total distributable earnings (loss) | | 19,984,225 |
| Net Assets | | $298,569,069 |
| Net Asset Value and Maximum Offering Price | | |
| Investor Class: | | |
| Net Asset Value, offering price and redemption price per share ($160,476,912 ÷ 12,848,063 shares) | | $12.49 |
| Institutional Premium Class: | | |
| Net Asset Value, offering price and redemption price per share ($138,092,157 ÷ 11,049,519 shares) | | $12.50 |
See accompanying notes which are an integral part of the financial statements.
Statement of Operations
| | | Year ended March 31, 2019 |
| Investment Income | | |
| Dividends: | | |
| Affiliated issuers | | $4,817,097 |
| Expenses | | |
| Transfer agent fees | $271,590 | |
| Independent trustees' fees and expenses | 945 | |
| Total expenses before reductions | 272,535 | |
| Expense reductions | (97,011) | |
| Total expenses after reductions | | 175,524 |
| Net investment income (loss) | | 4,641,573 |
| Realized and Unrealized Gain (Loss) | | |
| Net realized gain (loss) on: | | |
| Investment securities: | | |
| Affiliated issuers | (1,515,876) | |
| Capital gain distributions from underlying funds: | | |
| Affiliated issuers | 619,435 | |
| Total net realized gain (loss) | | (896,441) |
| Change in net unrealized appreciation (depreciation) on: | | |
| Investment securities: | | |
| Affiliated issuers | 7,479,986 | |
| Total change in net unrealized appreciation (depreciation) | | 7,479,986 |
| Net gain (loss) | | 6,583,545 |
| Net increase (decrease) in net assets resulting from operations | | $11,225,118 |
See accompanying notes which are an integral part of the financial statements.
Statement of Changes in Net Assets
| | Year ended March 31, 2019 | Year ended March 31, 2018 |
| Increase (Decrease) in Net Assets | | |
| Operations | | |
| Net investment income (loss) | $4,641,573 | $2,139,283 |
| Net realized gain (loss) | (896,441) | 506,757 |
| Change in net unrealized appreciation (depreciation) | 7,479,986 | 8,422,450 |
| Net increase (decrease) in net assets resulting from operations | 11,225,118 | 11,068,490 |
| Distributions to shareholders | (4,993,298) | – |
| Distributions to shareholders from net investment income | – | (2,099,984) |
| Distributions to shareholders from net realized gain | – | (422,478) |
| Total distributions | (4,993,298) | (2,522,462) |
| Share transactions - net increase (decrease) | 136,556,276 | 80,743,596 |
| Total increase (decrease) in net assets | 142,788,096 | 89,289,624 |
| Net Assets | | |
| Beginning of period | 155,780,973 | 66,491,349 |
| End of period | $298,569,069 | $155,780,973 |
| Other Information | | |
| Undistributed net investment income end of period | | $50,902 |
See accompanying notes which are an integral part of the financial statements.
Financial Highlights
Fidelity Freedom Index 2060 Fund Investor Class
| Years ended March 31, | 2019 | 2018 | 2017 | 2016 | 2015 A |
| Selected Per–Share Data | | | | | |
| Net asset value, beginning of period | $12.23 | $11.04 | $9.85 | $10.33 | $10.00 |
| Income from Investment Operations | | | | | |
| Net investment income (loss)B | .26 | .24 | .25 | .25 | .09 |
| Net realized and unrealized gain (loss) | .27 | 1.21 | 1.19 | (.55) | .40 |
| Total from investment operations | .53 | 1.45 | 1.44 | (.30) | .49 |
| Distributions from net investment income | (.24) | (.20) | (.22) | (.18) | (.16) |
| Distributions from net realized gain | (.03) | (.06) | (.03) | –C | –C |
| Total distributions | (.27) | (.26) | (.25) | (.18) | (.16) |
| Net asset value, end of period | $12.49 | $12.23 | $11.04 | $9.85 | $10.33 |
| Total ReturnD,E | 4.54% | 13.17% | 14.80% | (2.94)% | 4.90% |
| Ratios to Average Net AssetsF,G | | | | | |
| Expenses before reductions | .15% | .15% | .15% | .15% | .15%H |
| Expenses net of fee waivers, if any | .11% | .12% | .11% | .08% | .09%H |
| Expenses net of all reductions | .11% | .12% | .11% | .08% | .09%H |
| Net investment income (loss) | 2.13% | 1.97% | 2.41% | 2.57% | 1.35%H |
| Supplemental Data | | | | | |
| Net assets, end of period (000 omitted) | $160,477 | $82,123 | $38,013 | $16,979 | $3,660 |
| Portfolio turnover rateG | 15% | 7% | 41% | 8% | 33%H |
A For the period August 5, 2014 (commencement of operations) to March 31, 2015.
B Calculated based on average shares outstanding during the period.
C Amount represents less than $.005 per share.
D Total returns for periods of less than one year are not annualized.
E Total returns would have been lower if certain expenses had not been reduced during the applicable periods shown.
F Expense ratios reflect operating expenses of the class. Expenses before reductions do not reflect amounts reimbursed by the investment adviser or reductions from expense offset arrangements and do not represent the amount paid by the class during periods when reimbursements or reductions occur. Expense ratios before reductions for start-up periods may not be representative of longer-term operating periods. Expenses net of fee waivers reflect expenses after reimbursement by the investment adviser but prior to reductions from expense offset arrangements. Expenses net of all reductions represent the net expenses paid by the class.
G Amount does not include the portfolio activity of any Underlying Funds.
H Annualized
See accompanying notes which are an integral part of the financial statements.
Fidelity Freedom Index 2060 Fund Institutional Premium Class
| Years ended March 31, | 2019 | 2018 | 2017 | 2016 A |
| Selected Per–Share Data | | | | |
| Net asset value, beginning of period | $12.23 | $11.05 | $9.85 | $10.56 |
| Income from Investment Operations | | | | |
| Net investment income (loss)B | .27 | .24 | .26 | .13 |
| Net realized and unrealized gain (loss) | .27 | 1.21 | 1.19 | (.66) |
| Total from investment operations | .54 | 1.45 | 1.45 | (.53) |
| Distributions from net investment income | (.24) | (.21) | (.22) | (.18) |
| Distributions from net realized gain | (.03) | (.06) | (.03) | –C |
| Total distributions | (.27) | (.27) | (.25) | (.18) |
| Net asset value, end of period | $12.50 | $12.23 | $11.05 | $9.85 |
| Total ReturnD,E | 4.66% | 13.12% | 14.93% | (5.05)% |
| Ratios to Average Net AssetsF,G | | | | |
| Expenses before reductions | .10% | .10% | .09% | .05%H |
| Expenses net of fee waivers, if any | .05% | .07% | .06% | .01%H |
| Expenses net of all reductions | .05% | .07% | .06% | .01%H |
| Net investment income (loss) | 2.19% | 2.02% | 2.47% | 1.80%H |
| Supplemental Data | | | | |
| Net assets, end of period (000 omitted) | $138,092 | $73,658 | $28,478 | $9,543 |
| Portfolio turnover rateG | 15% | 7% | 41% | 8% |
A For the period June 24, 2015 (commencement of sale of shares) to March 31, 2016.
B Calculated based on average shares outstanding during the period.
C Amount represents less than $.005 per share.
D Total returns for periods of less than one year are not annualized.
E Total returns would have been lower if certain expenses had not been reduced during the applicable periods shown.
F Expense ratios reflect operating expenses of the class. Expenses before reductions do not reflect amounts reimbursed by the investment adviser or reductions from expense offset arrangements and do not represent the amount paid by the class during periods when reimbursements or reductions occur. Expense ratios before reductions for start-up periods may not be representative of longer-term operating periods. Expenses net of fee waivers reflect expenses after reimbursement by the investment adviser but prior to reductions from expense offset arrangements. Expenses net of all reductions represent the net expenses paid by the class.
G Amount does not include the portfolio activity of any Underlying Funds.
H Annualized
See accompanying notes which are an integral part of the financial statements.
Notes to Financial Statements
For the period ended March 31, 2019
1. Organization.
Fidelity Freedom Index Income Fund, Fidelity Freedom Index 2005 Fund, Fidelity Freedom Index 2010 Fund, Fidelity Freedom Index 2015 Fund, Fidelity Freedom Index 2020 Fund, Fidelity Freedom Index 2025 Fund, Fidelity Freedom Index 2030 Fund, Fidelity Freedom Index 2035 Fund, Fidelity Freedom Index 2040 Fund, Fidelity Freedom Index 2045 Fund, Fidelity Freedom Index 2050 Fund, Fidelity Freedom Index 2055 Fund and Fidelity Freedom Index 2060 Fund (the Funds) are funds of Fidelity Aberdeen Street Trust (the Trust). The Trust is registered under the Investment Company Act of 1940, as amended (the 1940 Act), as an open-end management investment company organized as a Delaware statutory trust. Each Fund is authorized to issue an unlimited number of shares. The Funds invest primarily in a combination of other Fidelity equity, bond, and short-term funds (the Underlying Funds) managed by Fidelity Management & Research Company (FMR). Each Fund offers Investor Class and Institutional Premium Class shares, each of which has equal rights as to assets and voting privileges. Each class has exclusive voting rights with respect to matters that affect that class.
2. Investments in Fidelity Central Funds.
The Funds may invest in Fidelity Central Funds, which are open-end investment companies generally available only to other investment companies and accounts managed by the investment adviser and its affiliates. The Funds' Schedules of Investments list each of the Fidelity Central Funds held as of period end, if any, as an investment of each Fund, but do not include the underlying holdings of each Fidelity Central Fund. As an Investing Fund, each Fund indirectly bears its proportionate share of the expenses of the underlying Fidelity Central Funds.
The Money Market Central Funds seek preservation of capital and current income and are managed by Fidelity Investments Money Management, Inc. (FIMM), an affiliate of the investment adviser. Annualized expenses of the Money Market Central Funds as of their most recent shareholder report date are less than .005%.
A complete unaudited list of holdings for each Fidelity Central Fund is available upon request or at the Securities and Exchange Commission (the SEC) website at www.sec.gov. In addition, the financial statements of the Fidelity Central Funds, which are not covered by the Funds' Report of Independent Registered Public Accounting Firm, are available on the SEC website or upon request.
3. Significant Accounting Policies.
Each Fund is an investment company and applies the accounting and reporting guidance of the Financial Accounting Standards Board (FASB) Accounting Standards Codification Topic 946 Financial Services – Investments Companies. The financial statements have been prepared in conformity with accounting principles generally accepted in the United States of America (GAAP), which require management to make certain estimates and assumptions at the date of the financial statements. Actual results could differ from those estimates. Subsequent events, if any, through the date that the financial statements were issued have been evaluated in the preparation of the financial statements. The following summarizes the significant accounting policies of the Funds:
Investment Valuation. Investments are valued as of 4:00 p.m. Eastern time on the last calendar day of the period. Each Fund categorizes the inputs to valuation techniques used to value its investments into a disclosure hierarchy consisting of three levels as shown below:
- Level 1 – quoted prices in active markets for identical investments
- Level 2 – other significant observable inputs (including quoted prices for similar investments, interest rates, prepayment speeds, etc.)
- Level 3 – unobservable inputs (including the Fund's own assumptions based on the best information available)
Valuation techniques used to value each Fund's investments by major category are as follows. Investments in the Underlying Funds are valued at their closing net asset value (NAV) each business day and are categorized as Level 1 in the hierarchy.
Investment Transactions and Income. For financial reporting purposes, the Funds' investment holdings and NAV include trades executed through the end of the last business day of the period. The NAV per share for processing shareholder transactions is calculated as of the close of business of the New York Stock Exchange (NYSE), normally 4:00 p.m. Eastern time and includes trades executed through the end of the prior business day. Gains and losses on securities sold are determined on the basis of identified cost. Income and capital gain distributions from the Underlying Funds, if any, are recorded on the ex-dividend date.
Class Allocations and Expenses. Investment income, realized and unrealized capital gains and losses, common expenses of each Fund, and certain fund-level expense reductions, if any, are allocated daily on a pro-rata basis to each class based on the relative net assets of each class to the total net assets of each Fund. Each class differs with respect to transfer agent fees incurred. Certain expense reductions may also differ by class. For the reporting period, the allocated portion of income and expenses to each class as a percent of its average net assets may vary due to the timing of recording these transactions in relation to fluctuating net assets of the classes. Expenses directly attributable to a fund are charged to that fund. Expenses attributable to more than one fund are allocated among the respective funds on the basis of relative net assets or other appropriate methods. Expenses included in the accompanying financial statements reflect the expenses of each Fund and do not include any expenses associated with the Underlying Funds. Although not included in each Fund's expenses, each Fund indirectly bears its proportionate share of the Underlying Funds' expenses through the impact of these expenses on each Underlying Fund's NAV. Expense estimates are accrued in the period to which they relate and adjustments are made when actual amounts are known.
Income Tax Information and Distributions to Shareholders. Each year, each Fund intends to qualify as a regulated investment company under Subchapter M of the Internal Revenue Code, including distributing substantially all of its taxable income and realized gains. As a result, no provision for U.S. Federal income taxes is required. As of March 31, 2019, each Fund did not have any unrecognized tax benefits in the financial statements; nor is each Fund aware of any tax positions for which it is reasonably possible that the total amounts of unrecognized tax benefits will significantly change in the next twelve months. Each Fund files a U.S. federal tax return, in addition to state and local tax returns as required. Each Fund's federal income tax returns are subject to examination by the Internal Revenue Service (IRS) for a period of three fiscal years after they are filed. State and local tax returns may be subject to examination for an additional fiscal year depending on the jurisdiction.
Distributions are declared and recorded on the ex-dividend date. Income and capital gain distributions are declared separately for each class. Income and capital gain distributions are determined in accordance with income tax regulations, which may differ from GAAP.
Capital accounts within the financial statements are adjusted for permanent book-tax differences. These adjustments have no impact on net assets or the results of operations. Capital accounts are not adjusted for temporary book-tax differences which will reverse in a subsequent period.
Book-tax differences are primarily due to the short-term gain distributions from the Underlying Funds, capital loss carryforwards and losses deferred due to wash sales.
As of period end, the cost and unrealized appreciation (depreciation) in securities, and derivatives if applicable, for federal income tax purposes were as follows for each Fund:
| | Tax cost | Gross unrealized appreciation | Gross unrealized depreciation | Net unrealized appreciation (depreciation) |
| Fidelity Freedom Index Income Fund | $328,157,191 | $27,578,306 | $(2,361,862) | $25,216,444 |
| Fidelity Freedom Index 2005 Fund | 117,790,885 | 13,747,919 | (697,192) | 13,050,727 |
| Fidelity Freedom Index 2010 Fund | 475,427,210 | 91,268,255 | (2,505,213) | 88,763,042 |
| Fidelity Freedom Index 2015 Fund | 1,087,019,008 | 238,295,576 | (5,959,442) | 232,336,134 |
| Fidelity Freedom Index 2020 Fund | 3,745,936,743 | 774,608,075 | (20,127,468) | 754,480,607 |
| Fidelity Freedom Index 2025 Fund | 4,081,134,156 | 708,337,592 | (26,150,112) | 682,187,480 |
| Fidelity Freedom Index 2030 Fund | 4,783,615,305 | 1,012,341,921 | (25,540,136) | 986,801,785 |
| Fidelity Freedom Index 2035 Fund | 3,337,089,196 | 703,013,987 | (21,671,502) | 681,342,485 |
| Fidelity Freedom Index 2040 Fund | 3,358,766,514 | 799,943,896 | (22,193,721) | 777,750,175 |
| Fidelity Freedom Index 2045 Fund | 2,260,500,113 | 445,929,800 | (16,187,238) | 429,742,562 |
| Fidelity Freedom Index 2050 Fund | 2,035,015,564 | 406,052,364 | (14,799,172) | 391,253,192 |
| Fidelity Freedom Index 2055 Fund | 911,421,164 | 122,770,532 | (7,472,767) | 115,297,765 |
| Fidelity Freedom Index 2060 Fund | 279,271,478 | 22,383,548 | (3,066,560) | 19,316,988 |
The tax-based components of distributable earnings as of period end were as follows for each Fund:
| | Undistributed ordinary income | Undistributed long-term capital gain | Net unrealized appreciation (depreciation) on securities and other investments |
| Fidelity Freedom Index Income Fund | $692,709 | $138,081 | $25,216,444 |
| Fidelity Freedom Index 2005 Fund | 577,883 | 72,137 | 13,050,727 |
| Fidelity Freedom Index 2010 Fund | 2,946,100 | 50,824 | 88,763,042 |
| Fidelity Freedom Index 2015 Fund | 5,785,572 | 580,497 | 232,336,134 |
| Fidelity Freedom Index 2020 Fund | 14,652,867 | 1,689,229 | 754,480,607 |
| Fidelity Freedom Index 2025 Fund | 12,059,439 | 4,821,343 | 682,190,480 |
| Fidelity Freedom Index 2030 Fund | 11,203,029 | 6,712,194 | 986,801,785 |
| Fidelity Freedom Index 2035 Fund | 4,557,828 | 6,588,621 | 681,342,485 |
| Fidelity Freedom Index 2040 Fund | 3,537,072 | 4,939,470 | 777,750,175 |
| Fidelity Freedom Index 2045 Fund | 2,250,913 | 3,279,692 | 429,742,562 |
| Fidelity Freedom Index 2050 Fund | 2,030,734 | 2,709,793 | 391,253,192 |
| Fidelity Freedom Index 2055 Fund | 790,418 | 1,452,603 | 115,297,765 |
| Fidelity Freedom Index 2060 Fund | 216,454 | 450,782 | 19,316,988 |
The tax character of distributions paid was as follows:
| March 31, 2019 | | | |
| | Ordinary Income | Long-term Capital Gains | Total |
| Fidelity Freedom Index Income Fund | $7,541,272 | $2,047,247 | $9,588,519 |
| Fidelity Freedom Index 2005 Fund | 2,547,247 | 1,062,102 | 3,609,349 |
| Fidelity Freedom Index 2010 Fund | 12,477,743 | 13,336,020 | 25,813,763 |
| Fidelity Freedom Index 2015 Fund | 27,521,935 | 12,059,672 | 39,581,607 |
| Fidelity Freedom Index 2020 Fund | 91,695,043 | 6,834,734 | 98,529,777 |
| Fidelity Freedom Index 2025 Fund | 90,147,932 | 1,511,557 | 91,659,489 |
| Fidelity Freedom Index 2030 Fund | 108,481,070 | 585,238 | 109,066,308 |
| Fidelity Freedom Index 2035 Fund | 70,562,163 | 1,126,610 | 71,688,773 |
| Fidelity Freedom Index 2040 Fund | 74,410,280 | 1,921,467 | 76,331,747 |
| Fidelity Freedom Index 2045 Fund | 46,624,232 | 2,231,357 | 48,855,589 |
| Fidelity Freedom Index 2050 Fund | 42,530,297 | 2,321,399 | 44,851,696 |
| Fidelity Freedom Index 2055 Fund | 16,743,275 | 1,508,088 | 18,251,363 |
| Fidelity Freedom Index 2060 Fund | 4,599,275 | 394,023 | 4,993,298 |
| March 31, 2018 | | | |
| | Ordinary Income | Long-term Capital Gains | Total |
| Fidelity Freedom Index Income Fund | $5,050,685 | $515,181 | $5,565,866 |
| Fidelity Freedom Index 2005 Fund | 1,855,707 | 282,835 | 2,138,542 |
| Fidelity Freedom Index 2010 Fund | 9,944,923 | 3,828,148 | 13,773,071 |
| Fidelity Freedom Index 2015 Fund | 21,105,181 | 1,533,342 | 22,638,523 |
| Fidelity Freedom Index 2020 Fund | 71,442,267 | – | 71,442,267 |
| Fidelity Freedom Index 2025 Fund | 62,954,837 | – | 62,954,837 |
| Fidelity Freedom Index 2030 Fund | 78,430,382 | – | 78,430,382 |
| Fidelity Freedom Index 2035 Fund | 49,437,019 | – | 49,437,019 |
| Fidelity Freedom Index 2040 Fund | 54,919,665 | – | 54,919,665 |
| Fidelity Freedom Index 2045 Fund | 32,605,887 | 1,118,545 | 33,724,432 |
| Fidelity Freedom Index 2050 Fund | 30,214,079 | 3,399,895 | 33,613,974 |
| Fidelity Freedom Index 2055 Fund | 10,659,719 | 364,265 | 11,023,984 |
| Fidelity Freedom Index 2060 Fund | 2,290,162 | 232,300 | 2,522,462 |
New Rule Issuance. During August 2018, the U.S. Securities and Exchange Commission issued Final Rule Release No. 33-10532, Disclosure Update and Simplification. This Final Rule includes amendments specific to registered investment companies that are intended to eliminate overlap in disclosure requirements between Regulation S-X and GAAP. In accordance with these amendments, certain line-items in the Funds' financial statements have been combined or removed for the current period as outlined in the table below.
| Financial Statement | Current Line-Item Presentation (As Applicable) | Prior Line-Item Presentation (As Applicable) |
| Statement of Assets and Liabilities | Total distributable earnings (loss) | Undistributed/Distributions in excess of/Accumulated net investment income (loss)
Accumulated/Undistributed net realized gain (loss)
Net unrealized appreciation (depreciation) |
| Statement of Changes in Net Assets | N/A - removed | Undistributed/Distributions in excess of/Accumulated net investment income (loss) end of period |
| Statement of Changes in Net Assets | Distributions to shareholders | Distributions to shareholders from net investment income
Distributions to shareholders from net realized gain |
| Distributions to Shareholders Note to Financial Statements | Distributions to shareholders | Distributions to shareholders from net investment income
Distributions to shareholders from net realized gain |
4. Purchases and Sales of Investments.
Purchases and sales of securities, other than short-term securities, are noted in the table below.
| | Purchases ($) | Sales ($) |
| Fidelity Freedom Index Income Fund | 221,497,511 | 164,683,360 |
| Fidelity Freedom Index 2005 Fund | 76,064,288 | 60,928,179 |
| Fidelity Freedom Index 2010 Fund | 250,129,959 | 255,781,111 |
| Fidelity Freedom Index 2015 Fund | 545,489,604 | 451,957,550 |
| Fidelity Freedom Index 2020 Fund | 1,559,774,899 | 1,100,588,451 |
| Fidelity Freedom Index 2025 Fund | 1,840,986,737 | 802,900,057 |
| Fidelity Freedom Index 2030 Fund | 1,834,882,000 | 698,041,061 |
| Fidelity Freedom Index 2035 Fund | 1,366,694,172 | 354,165,279 |
| Fidelity Freedom Index 2040 Fund | 1,190,596,150 | 355,034,808 |
| Fidelity Freedom Index 2045 Fund | 926,580,076 | 231,968,191 |
| Fidelity Freedom Index 2050 Fund | 808,809,322 | 238,928,037 |
| Fidelity Freedom Index 2055 Fund | 446,257,548 | 91,095,906 |
| Fidelity Freedom Index 2060 Fund | 168,847,088 | 32,015,634 |
5. Fees and Other Transactions with Affiliates.
Management Fee. FMR Co., Inc. (the investment adviser), an affiliate of FMR, provides the Funds with investment management related services. The Funds do not pay any fees for these services.
The Board of Trustees (Board) approved an amended and restated management contract for each Fund effective June 1, 2019. Under the management contract, Investor Class and Institutional Premium Class of each Fund will pay a monthly management fee at an annual rate of .12% and .08% of class-level average net assets, respectively. Under the management contract, each Fund's investment adviser will pay all ordinary operating expenses of the Fund, except fees and expenses of the independent Trustees and certain miscellaneous expenses such as interest, including commitment fees. In addition, the Board approved an expense contract for each class of each Fund effective June 1, 2019. Under the expense contract, total expenses, including acquired fund fees and expenses, will be limited to an annual rate of .12% and .08% of class-level average net assets for Investor Class and Institutional Premium Class, respectively, with certain exceptions.
Transfer Agent Fees. Fidelity Investments Institutional Operations Company, Inc., (FIIOC), an affiliate of the investment adviser, is the transfer, dividend disbursing and shareholder servicing agent for each class of the Funds. FIIOC receives an asset-based fee of .15% and .10% of class-level average net assets for each Investor Class and Institutional Premium Class, respectively. FIIOC pays for typesetting, printing and mailing of shareholder reports, except proxy statements. For the period, transfer agent fees for each applicable class were as follows:
| | Amount |
| Fidelity Freedom Index Income Fund | |
| Investor Class | $220,016 |
| Institutional Premium Class | 174,825 |
| | $394,841 |
| Fidelity Freedom Index 2005 Fund | |
| Investor Class | $91,158 |
| Institutional Premium Class | 56,521 |
| | $147,679 |
| Fidelity Freedom Index 2010 Fund | |
| Investor Class | $356,468 |
| Institutional Premium Class | 316,729 |
| | $673,197 |
| Fidelity Freedom Index 2015 Fund | |
| Investor Class | $993,066 |
| Institutional Premium Class | 589,941 |
| | $1,583,007 |
| Fidelity Freedom Index 2020 Fund | |
| Investor Class | $2,605,280 |
| Institutional Premium Class | 2,414,935 |
| | $5,020,215 |
| Fidelity Freedom Index 2025 Fund | |
| Investor Class | $2,971,761 |
| Institutional Premium Class | 2,144,725 |
| | $5,116,486 |
| Fidelity Freedom Index 2030 Fund | |
| Investor Class | $3,151,603 |
| Institutional Premium Class | 2,925,770 |
| | $6,077,373 |
| Fidelity Freedom Index 2035 Fund | |
| Investor Class | $2,439,346 |
| Institutional Premium Class | 1,762,708 |
| | $4,202,054 |
| Fidelity Freedom Index 2040 Fund | |
| Investor Class | $2,186,401 |
| Institutional Premium Class | 2,118,858 |
| | $4,305,259 |
| Fidelity Freedom Index 2045 Fund | |
| Investor Class | $1,524,519 |
| Institutional Premium Class | 1,230,817 |
| | $2,755,336 |
| Fidelity Freedom Index 2050 Fund | |
| Investor Class | $1,286,945 |
| Institutional Premium Class | 1,188,386 |
| | $2,475,331 |
| Fidelity Freedom Index 2055 Fund | |
| Investor Class | $571,043 |
| Institutional Premium Class | 427,234 |
| | $998,277 |
| Fidelity Freedom Index 2060 Fund | |
| Investor Class | $166,621 |
| Institutional Premium Class | 104,969 |
| | $271,590 |
Effective June 1, 2019, transfer agent fees will be paid by the investment adviser and not by the Funds.
Interfund Trades. The Funds may purchase from or sell securities to other Fidelity Funds under procedures adopted by the Board. The procedures have been designed to ensure these interfund trades are executed in accordance with Rule 17a-7 of the 1940 Act. Interfund trades are included within the respective purchases and sales amounts shown in the Purchases and Sales of Investments note.
6. Expense Reductions.
FMR contractually agreed to reimburse each class of each Fund to the extent annual operating expenses, including acquired fund fees and expenses, exceeded certain levels of class-level average net assets as noted in the table below. Some expenses, for example the compensation of the independent Trustees, and certain other expenses such as interest expense, are excluded from this reimbursement.
The following classes of each applicable Fund were in reimbursement during the period:
| | Expense Limitations(a) | Reimbursement |
| Fidelity Freedom Index Income Fund | | |
| Investor Class | .14% | $41,718 |
| Institutional Premium Class | .08% | 64,221 |
| Fidelity Freedom Index 2005 Fund | | |
| Investor Class | .14% | $18,455 |
| Institutional Premium Class | .08% | 21,936 |
| Fidelity Freedom Index 2010 Fund | | |
| Investor Class | .14% | $76,922 |
| Institutional Premium Class | .08% | 128,897 |
| Fidelity Freedom Index 2015 Fund | | |
| Investor Class | .14% | $229,021 |
| Institutional Premium Class | .08% | 253,130 |
| Fidelity Freedom Index 2020 Fund | | |
| Investor Class | .14% | $631,193 |
| Institutional Premium Class | .08% | 1,078,721 |
| Fidelity Freedom Index 2025 Fund | | |
| Investor Class | .14% | $754,399 |
| Institutional Premium Class | .08% | 997,841 |
| Fidelity Freedom Index 2030 Fund | | |
| Investor Class | .14% | $854,399 |
| Institutional Premium Class | .08% | 1,435,409 |
| Fidelity Freedom Index 2035 Fund | | |
| Investor Class | .14% | $662,001 |
| Institutional Premium Class | .08% | 866,338 |
| Fidelity Freedom Index 2040 Fund | | |
| Investor Class | .14% | $594,277 |
| Institutional Premium Class | .08% | 1,041,763 |
| Fidelity Freedom Index 2045 Fund | | |
| Investor Class | .14% | $414,175 |
| Institutional Premium Class | .08% | 605,765 |
| Fidelity Freedom Index 2050 Fund | | |
| Investor Class | .14% | $349,698 |
| Institutional Premium Class | .08% | 584,568 |
| Fidelity Freedom Index 2055 Fund | | |
| Investor Class | .14% | $155,065 |
| Institutional Premium Class | .08% | 210,504 |
| Fidelity Freedom Index 2060 Fund | | |
| Investor Class | .14% | $45,157 |
| Institutional Premium Class | .08% | 51,854 |
(a) Percentages represent expense limitations effective June 1, 2018. Prior to June 1, 2018, the expense limitations for each Fund were .15% and .10% for Investor Class and Institutional Premium Class, respectively.
Effective June 1, 2019, the expense limitations will be discontinued.
In addition, through arrangements with each applicable Fund's custodian, credits realized as a result of certain uninvested cash balances were used to reduce the Fund's expenses. All of the applicable expense reductions are noted in the table below.
| | Custody expense reduction |
| Fidelity Freedom Index 2025 Fund | $1 |
| Fidelity Freedom Index 2030 Fund | 60 |
| Fidelity Freedom Index 2055 Fund | 4 |
7. Distributions to Shareholders.
Distributions to shareholders of each class were as follows:
| | Year ended
March 31, 2019 | Year ended
March 31, 2018 |
| Fidelity Freedom Index Income Fund | | |
| Distributions to shareholders | | |
| Investor Class | $4,309,033 | $– |
| Investor Class | 5,279,486 | – |
| Total | $9,588,519 | $– |
| From net investment income | | |
| Investor Class | $– | $2,060,275 |
| Institutional Premium Class | – | 2,513,304 |
| Total | $– | $4,573,579 |
| From net realized gain | | |
| Investor Class | $– | $452,238 |
| Institutional Premium Class | – | 540,049 |
| Total | $– | $992,287 |
| Fidelity Freedom Index 2005 Fund | | |
| Distributions to shareholders | | |
| Investor Class | $1,825,871 | $– |
| Institutional Premium Class | 1,783,478 | – |
| Total | $3,609,349 | $– |
| From net investment income | | |
| Investor Class | $– | $858,233 |
| Institutional Premium Class | – | 799,727 |
| Total | $– | $1,657,960 |
| From net realized gain | | |
| Investor Class | $– | $239,716 |
| Institutional Premium Class | – | 240,866 |
| Total | $– | $480,582 |
| Fidelity Freedom Index 2010 Fund | | |
| Distributions to shareholders | | |
| Investor Class | $11,154,439 | $– |
| Institutional Premium Class | 14,659,324 | – |
| Total | $25,813,763 | $– |
| From net investment income | | |
| Investor Class | $– | $3,926,080 |
| Institutional Premium Class | – | 4,951,809 |
| Total | $– | $8,877,889 |
| From net realized gain | | |
| Investor Class | $– | $2,079,285 |
| Institutional Premium Class | – | 2,815,897 |
| Total | $– | $4,895,182 |
| Fidelity Freedom Index 2015 Fund | | |
| Distributions to shareholders | | |
| Investor Class | $20,834,219 | $– |
| Institutional Premium Class | 18,747,388 | – |
| Total | $39,581,607 | $– |
| From net investment income | | |
| Investor Class | $– | $10,274,814 |
| Institutional Premium Class | – | 9,283,408 |
| Total | $– | $19,558,222 |
| From net realized gain | | |
| Investor Class | $– | $1,601,066 |
| Institutional Premium Class | – | 1,479,235 |
| Total | $– | $3,080,301 |
| Fidelity Freedom Index 2020 Fund | | |
| Distributions to shareholders | | |
| Investor Class | $41,266,067 | $– |
| Institutional Premium Class | 57,263,709 | – |
| Total | $98,529,776 | $– |
| From net investment income | | |
| Investor Class | $– | $27,914,520 |
| Institutional Premium Class | – | 38,512,157 |
| Total | $– | $66,426,677 |
| From net realized gain | | |
| Investor Class | $– | $2,119,394 |
| Institutional Premium Class | – | 2,896,196 |
| Total | $– | $5,015,590 |
| Fidelity Freedom Index 2025 Fund | | |
| Distributions to shareholders | | |
| Investor Class | $43,728,986 | $– |
| Institutional Premium Class | 47,930,503 | – |
| Total | $91,659,489 | $– |
| From net investment income | | |
| Investor Class | $– | $28,811,409 |
| Institutional Premium Class | – | 30,669,624 |
| Total | $– | $59,481,033 |
| From net realized gain | | |
| Investor Class | $– | $1,710,263 |
| Institutional Premium Class | – | 1,763,541 |
| Total | $– | $3,473,804 |
| Fidelity Freedom Index 2030 Fund | | |
| Distributions to shareholders | | |
| Investor Class | $45,602,939 | $– |
| Institutional Premium Class | 63,463,369 | – |
| Total | $109,066,308 | $– |
| From net investment income | | |
| Investor Class | $– | $31,367,417 |
| Institutional Premium Class | – | 43,705,023 |
| Total | $– | $75,072,440 |
| From net realized gain | | |
| Investor Class | $– | $1,424,508 |
| Institutional Premium Class | – | 1,933,434 |
| Total | $– | $3,357,942 |
| Fidelity Freedom Index 2035 Fund | | |
| Distributions to shareholders | | |
| Investor Class | $34,567,942 | $– |
| Institutional Premium Class | 37,120,831 | – |
| Total | $71,688,773 | $– |
| From net investment income | | |
| Investor Class | $– | $22,129,663 |
| Institutional Premium Class | – | 24,853,079 |
| Total | $– | $46,982,742 |
| From net realized gain | | |
| Investor Class | $– | $1,171,326 |
| Institutional Premium Class | – | 1,282,951 |
| Total | $– | $2,454,277 |
| Fidelity Freedom Index 2040 Fund | | |
| Distributions to shareholders | | |
| Investor Class | $31,350,412 | $– |
| Institutional Premium Class | 44,981,335 | – |
| Total | $76,331,747 | $– |
| From net investment income | | |
| Investor Class | $– | $20,714,478 |
| Institutional Premium Class | – | 31,523,429 |
| Total | $– | $52,237,907 |
| From net realized gain | | |
| Investor Class | $– | $1,079,123 |
| Institutional Premium Class | – | 1,602,635 |
| Total | $– | $2,681,758 |
| Fidelity Freedom Index 2045 Fund | | |
| Distributions to shareholders | | |
| Investor Class | $22,205,976 | $– |
| Institutional Premium Class | 26,649,613 | – |
| Total | $48,855,589 | $– |
| From net investment income | | |
| Investor Class | $– | $13,778,964 |
| Institutional Premium Class | – | 17,242,621 |
| Total | $– | $31,021,585 |
| From net realized gain | | |
| Investor Class | $– | $1,210,582 |
| Institutional Premium Class | – | 1,492,265 |
| Total | $– | $2,702,847 |
| Fidelity Freedom Index 2050 Fund | | |
| Distributions to shareholders | | |
| Investor Class | $19,232,468 | $– |
| Institutional Premium Class | 25,619,228 | – |
| Total | $44,851,696 | $– |
| From net investment income | | |
| Investor Class | $– | $11,874,898 |
| Institutional Premium Class | – | 16,870,632 |
| Total | $– | $28,745,530 |
| From net realized gain | | |
| Investor Class | $– | $2,042,020 |
| Institutional Premium Class | – | 2,826,424 |
| Total | $– | $4,868,444 |
| Fidelity Freedom Index 2055 Fund | | |
| Distributions to shareholders | | |
| Investor Class | $8,724,993 | $– |
| Institutional Premium Class | 9,526,370 | – |
| Total | $18,251,363 | $– |
| From net investment income | | |
| Investor Class | $– | $4,545,026 |
| Institutional Premium Class | – | 5,286,003 |
| Total | $– | $9,831,029 |
| From net realized gain | | |
| Investor Class | $– | $559,064 |
| Institutional Premium Class | – | 633,891 |
| Total | $– | $1,192,955 |
| Fidelity Freedom Index 2060 Fund | | |
| Distributions to shareholders | | |
| Investor Class | $2,638,488 | $– |
| Institutional Premium Class | 2,354,810 | – |
| Total | $4,993,298 | $– |
| From net investment income | | |
| Investor Class | $– | $1,127,154 |
| Institutional Premium Class | – | 972,830 |
| Total | $– | $2,099,984 |
| From net realized gain | | |
| Investor Class | $– | $237,021 |
| Institutional Premium Class | – | 185,457 |
| Total | $– | $422,478 |
8. Share Transactions.
Share transactions for each class were as follows and may contain automatic conversions between classes or exchanges between affiliated funds:
| | Shares | Shares | Dollars | Dollars |
| | Year ended March 31, 2019 | Year ended March 31, 2018 | Year ended March 31, 2019 | Year ended March 31, 2018 |
| Fidelity Freedom Index Income Fund | | | | |
| Investor Class | | | | |
| Shares sold | 7,035,250 | 5,270,832 | $82,758,749 | $62,606,215 |
| Reinvestment of distributions | 366,694 | 211,431 | 4,269,683 | 2,504,402 |
| Shares redeemed | (4,086,293) | (4,985,581) | (48,160,938) | (59,164,225) |
| Net increase (decrease) | 3,315,651 | 496,682 | $38,867,494 | $5,946,392 |
| Institutional Premium Class | | | | |
| Shares sold | 5,886,820 | 4,123,153 | $69,374,216 | $48,941,669 |
| Reinvestment of distributions | 453,713 | 258,152 | 5,279,486 | 3,053,353 |
| Shares redeemed | (4,643,305) | (3,126,138) | (54,808,561) | (37,038,010) |
| Net increase (decrease) | 1,697,228 | 1,255,167 | $19,845,141 | $14,957,012 |
| Fidelity Freedom Index 2005 Fund | | | | |
| Investor Class | | | | |
| Shares sold | 2,253,310 | 2,605,617 | $29,947,370 | $34,897,679 |
| Reinvestment of distributions | 140,272 | 80,794 | 1,803,843 | 1,077,418 |
| Shares redeemed | (1,953,826) | (1,555,080) | (26,057,217) | (20,723,954) |
| Net increase (decrease) | 439,756 | 1,131,331 | $5,693,996 | $15,251,143 |
| Institutional Premium Class | | | | |
| Shares sold | 1,620,499 | 1,311,524 | $21,540,891 | $17,485,786 |
| Reinvestment of distributions | 138,724 | 78,133 | 1,783,478 | 1,040,593 |
| Shares redeemed | (983,108) | (1,061,065) | (13,085,027) | (14,160,597) |
| Net increase (decrease) | 776,115 | 328,592 | $10,239,342 | $4,365,782 |
| Fidelity Freedom Index 2010 Fund | | | | |
| Investor Class | | | | |
| Shares sold | 5,771,585 | 9,097,238 | $81,505,254 | $129,602,976 |
| Reinvestment of distributions | 823,634 | 422,300 | 11,068,928 | 5,966,009 |
| Shares redeemed | (5,457,456) | (7,662,358) | (77,073,023) | (108,947,096) |
| Net increase (decrease) | 1,137,763 | 1,857,180 | $15,501,159 | $26,621,889 |
| Institutional Premium Class | | | | |
| Shares sold | 4,337,444 | 6,289,496 | $61,124,398 | $89,722,927 |
| Reinvestment of distributions | 1,090,496 | 550,590 | 14,659,324 | 7,767,705 |
| Shares redeemed | (5,965,314) | (5,293,191) | (84,304,772) | (75,105,289) |
| Net increase (decrease) | (537,374) | 1,546,895 | $(8,521,050) | $22,385,343 |
| Fidelity Freedom Index 2015 Fund | | | | |
| Investor Class | | | | |
| Shares sold | 17,774,428 | 18,789,509 | $264,687,745 | $278,514,171 |
| Reinvestment of distributions | 1,473,364 | 793,802 | 20,768,001 | 11,845,144 |
| Shares redeemed | (14,106,234) | (13,485,936) | (210,347,643) | (199,624,180) |
| Net increase (decrease) | 5,141,558 | 6,097,375 | $75,108,103 | $90,735,135 |
| Institutional Premium Class | | | | |
| Shares sold | 12,287,250 | 9,699,686 | $182,433,555 | $143,909,496 |
| Reinvestment of distributions | 1,330,071 | 722,091 | 18,747,388 | 10,762,643 |
| Shares redeemed | (11,585,083) | (9,775,693) | (172,896,470) | (144,360,287) |
| Net increase (decrease) | 2,032,238 | 646,084 | $28,284,473 | $10,311,852 |
| Fidelity Freedom Index 2020 Fund | | | | |
| Investor Class | | | | |
| Shares sold | 50,193,972 | 46,676,293 | $787,934,660 | $724,366,488 |
| Reinvestment of distributions | 2,768,771 | 1,900,549 | 41,081,740 | 29,918,887 |
| Shares redeemed | (34,254,076) | (32,303,403) | (536,638,542) | (503,035,813) |
| Net increase (decrease) | 18,708,667 | 16,273,439 | $292,377,858 | $251,249,562 |
| Institutional Premium Class | | | | |
| Shares sold | 47,876,632 | 35,691,973 | $749,518,480 | $555,197,499 |
| Reinvestment of distributions | 3,856,922 | 2,634,326 | 57,263,709 | 41,408,353 |
| Shares redeemed | (40,690,617) | (27,129,181) | (640,546,169) | (419,854,988) |
| Net increase (decrease) | 11,042,937 | 11,197,118 | $166,236,020 | $176,750,864 |
| Fidelity Freedom Index 2025 Fund | | | | |
| Investor Class | | | | |
| Shares sold | 61,472,271 | 50,306,958 | $1,025,488,901 | $827,693,491 |
| Reinvestment of distributions | 2,779,801 | 1,818,856 | 43,582,590 | 30,448,676 |
| Shares redeemed | (30,179,744) | (25,680,740) | (503,791,920) | (423,486,960) |
| Net increase (decrease) | 34,072,328 | 26,445,074 | $565,279,571 | $434,655,207 |
| Institutional Premium Class | | | | |
| Shares sold | 50,063,202 | 28,457,247 | $833,661,681 | $468,684,110 |
| Reinvestment of distributions | 3,055,412 | 1,938,990 | 47,930,503 | 32,433,165 |
| Shares redeemed | (24,864,319) | (12,997,440) | (416,320,702) | (213,762,707) |
| Net increase (decrease) | 28,254,295 | 17,398,797 | $465,271,482 | $287,354,568 |
| Fidelity Freedom Index 2030 Fund | | | | |
| Investor Class | | | | |
| Shares sold | 61,247,727 | 48,151,518 | $1,075,752,581 | $833,049,685 |
| Reinvestment of distributions | 2,781,424 | 1,853,302 | 45,475,945 | 32,734,769 |
| Shares redeemed | (30,759,454) | (27,332,469) | (535,990,755) | (475,495,111) |
| Net increase (decrease) | 33,269,697 | 22,672,351 | $585,237,771 | $390,289,343 |
| Institutional Premium Class | | | | |
| Shares sold | 52,465,628 | 36,473,271 | $920,277,350 | $631,777,090 |
| Reinvestment of distributions | 3,878,934 | 2,585,746 | 63,463,369 | 45,638,457 |
| Shares redeemed | (25,113,110) | (14,679,369) | (443,991,743) | (252,581,131) |
| Net increase (decrease) | 31,231,452 | 24,379,648 | $539,748,976 | $424,834,416 |
| Fidelity Freedom Index 2035 Fund | | | | |
| Investor Class | | | | |
| Shares sold | 48,198,907 | 35,873,441 | $898,339,757 | $655,085,363 |
| Reinvestment of distributions | 2,015,651 | 1,238,632 | 34,341,782 | 23,270,096 |
| Shares redeemed | (19,821,822) | (18,227,142) | (368,557,433) | (332,963,701) |
| Net increase (decrease) | 30,392,736 | 18,884,931 | $564,124,106 | $345,391,758 |
| Institutional Premium Class | | | | |
| Shares sold | 35,972,492 | 21,221,516 | $669,708,444 | $386,744,447 |
| Reinvestment of distributions | 2,175,524 | 1,391,995 | 37,120,831 | 26,136,030 |
| Shares redeemed | (14,215,858) | (8,196,588) | (267,109,887) | (148,462,948) |
| Net increase (decrease) | 23,932,158 | 14,416,923 | $439,719,388 | $264,417,529 |
| Fidelity Freedom Index 2040 Fund | | | | |
| Investor Class | | | | |
| Shares sold | 41,329,948 | 31,885,175 | $774,688,756 | $587,361,959 |
| Reinvestment of distributions | 1,827,516 | 1,150,478 | 31,275,666 | 21,773,814 |
| Shares redeemed | (21,182,507) | (18,031,620) | (393,490,190) | (332,440,351) |
| Net increase (decrease) | 21,974,957 | 15,004,033 | $412,474,232 | $276,695,422 |
| Institutional Premium Class | | | | |
| Shares sold | 37,037,978 | 26,478,063 | $694,294,350 | $486,695,318 |
| Reinvestment of distributions | 2,626,265 | 1,752,195 | 44,981,335 | 33,126,064 |
| Shares redeemed | (17,159,339) | (10,558,906) | (324,466,363) | (192,228,150) |
| Net increase (decrease) | 22,504,904 | 17,671,352 | $414,809,322 | $327,593,232 |
| Fidelity Freedom Index 2045 Fund | | | | |
| Investor Class | | | | |
| Shares sold | 31,102,330 | 22,795,428 | $587,084,685 | $422,432,733 |
| Reinvestment of distributions | 1,281,792 | 787,814 | 22,141,391 | 14,967,831 |
| Shares redeemed | (14,162,066) | (11,711,569) | (266,043,441) | (217,232,633) |
| Net increase (decrease) | 18,222,056 | 11,871,673 | $343,182,635 | $220,167,931 |
| Institutional Premium Class | | | | |
| Shares sold | 27,665,080 | 16,857,917 | $521,974,540 | $311,218,678 |
| Reinvestment of distributions | 1,540,297 | 986,800 | 26,649,613 | 18,734,886 |
| Shares redeemed | (10,564,473) | (5,325,846) | (201,369,366) | (97,515,024) |
| Net increase (decrease) | 18,640,904 | 12,518,871 | $347,254,787 | $232,438,540 |
| Fidelity Freedom Index 2050 Fund | | | | |
| Investor Class | | | | |
| Shares sold | 27,266,599 | 19,485,896 | $515,705,720 | $362,838,945 |
| Reinvestment of distributions | 1,103,518 | 733,407 | 19,161,115 | 13,906,968 |
| Shares redeemed | (13,249,805) | (11,232,335) | (247,155,684) | (209,630,208) |
| Net increase (decrease) | 15,120,312 | 8,986,968 | $287,711,151 | $167,115,705 |
| Institutional Premium Class | | | | |
| Shares sold | 26,474,364 | 19,205,023 | $502,180,707 | $357,353,233 |
| Reinvestment of distributions | 1,473,866 | 1,038,931 | 25,619,228 | 19,697,056 |
| Shares redeemed | (13,013,944) | (6,421,264) | (249,087,489) | (118,465,640) |
| Net increase (decrease) | 14,934,286 | 13,822,690 | $278,712,446 | $258,584,649 |
| Fidelity Freedom Index 2055 Fund | | | | |
| Investor Class | | | | |
| Shares sold | 19,363,119 | 11,734,275 | $289,383,068 | $172,500,761 |
| Reinvestment of distributions | 633,759 | 338,818 | 8,717,335 | 5,101,760 |
| Shares redeemed | (7,026,163) | (5,176,289) | (104,209,605) | (76,127,408) |
| Net increase (decrease) | 12,970,715 | 6,896,804 | $193,890,798 | $101,475,113 |
| Institutional Premium Class | | | | |
| Shares sold | 15,924,100 | 9,594,512 | $238,583,757 | $140,660,073 |
| Reinvestment of distributions | 691,027 | 393,287 | 9,526,370 | 5,919,894 |
| Shares redeemed | (5,791,641) | (2,733,034) | (87,706,132) | (39,756,753) |
| Net increase (decrease) | 10,823,486 | 7,254,765 | $160,403,995 | $106,823,214 |
| Fidelity Freedom Index 2060 Fund | | | | |
| Investor Class | | | | |
| Shares sold | 9,205,501 | 4,872,076 | $112,467,080 | $58,667,848 |
| Reinvestment of distributions | 234,999 | 111,693 | 2,633,167 | 1,361,004 |
| Shares redeemed | (3,307,359) | (1,710,846) | (39,824,298) | (20,585,300) |
| Net increase (decrease) | 6,133,141 | 3,272,923 | $75,275,949 | $39,443,552 |
| Institutional Premium Class | | | | |
| Shares sold | 7,592,609 | 4,305,772 | $92,988,816 | $51,680,005 |
| Reinvestment of distributions | 209,909 | 94,964 | 2,354,810 | 1,158,287 |
| Shares redeemed | (2,773,756) | (957,866) | (34,063,299) | (11,538,248) |
| Net increase (decrease) | 5,028,762 | 3,442,870 | $61,280,327 | $41,300,044 |
9. Other.
The Funds' organizational documents provide former and current trustees and officers with a limited indemnification against liabilities arising in connection with the performance of their duties to the Funds. In the normal course of business, the Funds may also enter into contracts that provide general indemnifications. The Funds' maximum exposure under these arrangements is unknown as this would be dependent on future claims that may be made against the Funds. The risk of material loss from such claims is considered remote.
The Funds do not invest in the Underlying Funds for the purpose of exercising management or control; however, investments by the Funds within their principal investment strategies may represent a significant portion of the Underlying Fund's net assets. At the end of the period, the following Funds were the owners of record of 10% or more of the total outstanding shares of the Underlying Funds.
| Fund | Fidelity Freedom Index 2015 Fund | Fidelity Freedom Index 2020 Fund | Fidelity Freedom Index 2025 Fund | Fidelity Freedom Index 2030 Fund | Fidelity Freedom Index 2035 Fund | Fidelity Freedom Index 2040 Fund |
| Fidelity Series Global ex U.S. Index Fund | - | 10% | 12% | 18% | 15% | 16% |
| Fidelity Series Treasury Bill Index Fund | 17% | 38% | 22% | -% | -% | -% |
| Fund | Fidelity Freedom Index 2045 Fund |
| Fidelity Series Global ex U.S. Index Fund | 10% |
| Fidelity Series Treasury Bill Index Fund | – |
The Funds, in aggregate, were the owners of record of more than 20% of the total outstanding shares of the following Underlying Funds.
| Fund | % of shares held |
| Fidelity Series Treasury Bill Index Fund | 99% |
| Fidelity Series Global ex U.S. Index Fund | 100% |
| Fidelity Total Market Index Fund | 26% |
Subsequent to period end, the investment adviser reallocated investments of certain Funds. This involved a taxable redemption of certain Funds' interest in Fidelity Total Market Index Fund Class F and Fidelity U.S. Bond Index Fund Class F in-kind for investments, including accrued interest, and cash and a non-taxable exchange of those investments and cash for shares of Fidelity Series Total Market Index Fund and Fidelity Series Bond Index Fund. As a result of this redemption, the Funds' ownership of Fidelity Total Market Index Fund Class F and Fidelity U.S. Bond Index Fund Class F was reduced to 0%.
Report of Independent Registered Public Accounting Firm
To the Board of Trustees of Fidelity Aberdeen Street Trust and the Shareholders of Fidelity Freedom Index Income Fund, Fidelity Freedom Index 2005 Fund, Fidelity Freedom Index 2010 Fund, Fidelity Freedom Index 2015 Fund, Fidelity Freedom Index 2020 Fund, Fidelity Freedom Index 2025 Fund, Fidelity Freedom Index 2030 Fund, Fidelity Freedom Index 2035 Fund, Fidelity Freedom Index 2040 Fund, Fidelity Freedom Index 2045 Fund, Fidelity Freedom Index 2050 Fund, Fidelity Freedom Index 2055 Fund and Fidelity Freedom Index 2060 Fund:
Opinion on the Financial Statements and Financial Highlights
We have audited the accompanying statements of assets and liabilities of Fidelity Freedom Index Income Fund, Fidelity Freedom Index 2005 Fund, Fidelity Freedom Index 2010 Fund, Fidelity Freedom Index 2015 Fund, Fidelity Freedom Index 2020 Fund, Fidelity Freedom Index 2025 Fund, Fidelity Freedom Index 2030 Fund, Fidelity Freedom Index 2035 Fund, Fidelity Freedom Index 2040 Fund, Fidelity Freedom Index 2045 Fund, Fidelity Freedom Index 2050 Fund, Fidelity Freedom Index 2055 Fund and Fidelity Freedom Index 2060 Fund (the "Funds"), each a fund of Fidelity Aberdeen Street Trust, including the schedules of investments, as of March 31, 2019, the related statements of operations for the year then ended, the statements of changes in net assets for each of the two years in the period then ended, the financial highlights for each of the five years in the period then ended for the Funds, except Fidelity Freedom Index 2060 Fund; the related statement of operations for the year then ended, the statement of changes in net assets for each of the two years in the period then ended, and the financial highlights for each of the four years in the period then ended and for the period from August 5, 2014 to March 31, 2015 for the Fidelity Freedom Index 2060 Fund; and the related notes. In our opinion, the financial statements and financial highlights present fairly, in all material respects, the financial position of each of the Funds as of March 31, 2019, and the results of their operations for the year then ended, the changes in their net assets for each of the two years in the period then ended, and the financial highlights for each of the five years in the period then ended (or for the period mentioned above), in conformity with accounting principles generally accepted in the United States of America.
Basis for Opinion
These financial statements and financial highlights are the responsibility of the Funds' management. Our responsibility is to express an opinion on the Funds' financial statements and financial highlights based on our audits. We are a public accounting firm registered with the Public Company Accounting Oversight Board (United States) (PCAOB) and are required to be independent with respect to the Funds in accordance with the U.S. federal securities laws and the applicable rules and regulations of the Securities and Exchange Commission and the PCAOB.
We conducted our audits in accordance with the standards of the PCAOB. Those standards require that we plan and perform the audit to obtain reasonable assurance about whether the financial statements and financial highlights are free of material misstatement, whether due to error or fraud. The Funds are not required to have, nor were we engaged to perform, an audit of their internal control over financial reporting. As part of our audits we are required to obtain an understanding of internal control over financial reporting but not for the purpose of expressing an opinion on the effectiveness of the Funds' internal control over financial reporting. Accordingly, we express no such opinion.
Our audits included performing procedures to assess the risks of material misstatement of the financial statements and financial highlights, whether due to error or fraud, and performing procedures that respond to those risks. Such procedures included examining, on a test basis, evidence regarding the amounts and disclosures in the financial statements and financial highlights. Our audits also included evaluating the accounting principles used and significant estimates made by management, as well as evaluating the overall presentation of the financial statements and financial highlights. Our procedures included confirmation of securities owned as of March 31, 2019, by correspondence with the custodians and brokers; when replies were not received from brokers, we performed other auditing procedures. We believe that our audits provide a reasonable basis for our opinion.
/s/ Deloitte & Touche LLP
Boston, Massachusetts
May 17, 2019
We have served as the auditor of one or more of the Fidelity investment companies since 1999.
Trustees and Officers
The Trustees, Members of the Advisory Board (if any), and officers of the trust and funds, as applicable, are listed below. The Board of Trustees governs each fund and is responsible for protecting the interests of shareholders. The Trustees are experienced executives who meet periodically throughout the year to oversee each fund's activities, review contractual arrangements with companies that provide services to each fund, oversee management of the risks associated with such activities and contractual arrangements, and review each fund's performance. If the interests of a fund and an underlying Fidelity® fund were to diverge, a conflict of interest could arise and affect how the Trustees and Members of the Advisory Board fulfill their fiduciary duties to the affected funds. FMRC has structured the funds to avoid these potential conflicts, although there may be situations where a conflict of interest is unavoidable. In such instances, FMRC, the Trustees, and Members of the Advisory Board would take reasonable steps to minimize and, if possible, eliminate the conflict. Each of the Trustees oversees 260 funds.
The Trustees hold office without limit in time except that (a) any Trustee may resign; (b) any Trustee may be removed by written instrument, signed by at least two-thirds of the number of Trustees prior to such removal; (c) any Trustee who requests to be retired or who has become incapacitated by illness or injury may be retired by written instrument signed by a majority of the other Trustees; and (d) any Trustee may be removed at any special meeting of shareholders by a two-thirds vote of the outstanding voting securities of the trust. Each Trustee who is not an interested person (as defined in the 1940 Act) of the trust and the funds is referred to herein as an Independent Trustee. Each Independent Trustee shall retire not later than the last day of the calendar year in which his or her 75th birthday occurs. The Independent Trustees may waive this mandatory retirement age policy with respect to individual Trustees. Officers and Advisory Board Members hold office without limit in time, except that any officer or Advisory Board Member may resign or may be removed by a vote of a majority of the Trustees at any regular meeting or any special meeting of the Trustees. Except as indicated, each individual has held the office shown or other offices in the same company for the past five years.
Each fund’s Statement of Additional Information (SAI) includes more information about the Trustees. To request a free copy, call Fidelity at 1-800-835-5092 (plan accounts) or 1-800-544-8544 (all other accounts).
Experience, Skills, Attributes, and Qualifications of the Trustees. The Governance and Nominating Committee has adopted a statement of policy that describes the experience, qualifications, attributes, and skills that are necessary and desirable for potential Independent Trustee candidates (Statement of Policy). The Board believes that each Trustee satisfied at the time he or she was initially elected or appointed a Trustee, and continues to satisfy, the standards contemplated by the Statement of Policy. The Governance and Nominating Committee also engages professional search firms to help identify potential Independent Trustee candidates who have the experience, qualifications, attributes, and skills consistent with the Statement of Policy. From time to time, additional criteria based on the composition and skills of the current Independent Trustees, as well as experience or skills that may be appropriate in light of future changes to board composition, business conditions, and regulatory or other developments, have also been considered by the professional search firms and the Governance and Nominating Committee. In addition, the Board takes into account the Trustees' commitment and participation in Board and committee meetings, as well as their leadership of standing and ad hoc committees throughout their tenure.
In determining that a particular Trustee was and continues to be qualified to serve as a Trustee, the Board has considered a variety of criteria, none of which, in isolation, was controlling. The Board believes that, collectively, the Trustees have balanced and diverse experience, qualifications, attributes, and skills, which allow the Board to operate effectively in governing each fund and protecting the interests of shareholders. Information about the specific experience, skills, attributes, and qualifications of each Trustee, which in each case led to the Board's conclusion that the Trustee should serve (or continue to serve) as a trustee of the funds, is provided below.
Board Structure and Oversight Function. Abigail P. Johnson is an interested person and currently serves as Chairman. The Trustees have determined that an interested Chairman is appropriate and benefits shareholders because an interested Chairman has a personal and professional stake in the quality and continuity of services provided to the funds. Independent Trustees exercise their informed business judgment to appoint an individual of their choosing to serve as Chairman, regardless of whether the Trustee happens to be independent or a member of management. The Independent Trustees have determined that they can act independently and effectively without having an Independent Trustee serve as Chairman and that a key structural component for assuring that they are in a position to do so is for the Independent Trustees to constitute a substantial majority for the Board. The Independent Trustees also regularly meet in executive session. Arthur E. Johnson serves as Chairman of the Independent Trustees and as such (i) acts as a liaison between the Independent Trustees and management with respect to matters important to the Independent Trustees and (ii) with management prepares agendas for Board meetings.
Fidelity® funds are overseen by different Boards of Trustees. The funds' Board oversees Fidelity's investment-grade bond, money market, asset allocation and certain equity funds, and other Boards oversee Fidelity's high income and other equity funds. The asset allocation funds may invest in Fidelity® funds that are overseen by such other Boards. The use of separate Boards, each with its own committee structure, allows the Trustees of each group of Fidelity® funds to focus on the unique issues of the funds they oversee, including common research, investment, and operational issues. On occasion, the separate Boards establish joint committees to address issues of overlapping consequences for the Fidelity® funds overseen by each Board.
The Trustees operate using a system of committees to facilitate the timely and efficient consideration of all matters of importance to the Trustees, each fund, and fund shareholders and to facilitate compliance with legal and regulatory requirements and oversight of the funds' activities and associated risks. The Board, acting through its committees, has charged FMR and its affiliates with (i) identifying events or circumstances the occurrence of which could have demonstrably adverse effects on the funds' business and/or reputation; (ii) implementing processes and controls to lessen the possibility that such events or circumstances occur or to mitigate the effects of such events or circumstances if they do occur; and (iii) creating and maintaining a system designed to evaluate continuously business and market conditions in order to facilitate the identification and implementation processes described in (i) and (ii) above. Because the day-to-day operations and activities of the funds are carried out by or through FMR, its affiliates, and other service providers, the funds' exposure to risks is mitigated but not eliminated by the processes overseen by the Trustees. While each of the Board's committees has responsibility for overseeing different aspects of the funds' activities, oversight is exercised primarily through the Operations and Audit Committees. In addition, an ad hoc Board committee of Independent Trustees has worked with FMR to enhance the Board's oversight of investment and financial risks, legal and regulatory risks, technology risks, and operational risks, including the development of additional risk reporting to the Board. Appropriate personnel, including but not limited to the funds' Chief Compliance Officer (CCO), FMR's internal auditor, the independent accountants, the funds' Treasurer and portfolio management personnel, make periodic reports to the Board's committees, as appropriate, including an annual review of Fidelity's risk management program for the Fidelity® funds. The responsibilities of each standing committee, including their oversight responsibilities, are described further under "Standing Committees of the Trustees."
Interested Trustees*:
Correspondence intended for a Trustee who is an interested person may be sent to Fidelity Investments, 245 Summer Street, Boston, Massachusetts 02210.
Name, Year of Birth; Principal Occupations and Other Relevant Experience+
Abigail P. Johnson (1961)
Year of Election or Appointment: 2009
Trustee
Chairman of the Board of Trustees
Ms. Johnson also serves as Trustee of other Fidelity® funds. Ms. Johnson serves as Chairman (2016-present), Chief Executive Officer (2014-present), and Director (2007-present) of FMR LLC (diversified financial services company), President of Fidelity Financial Services (2012-present) and President of Personal, Workplace and Institutional Services (2005-present). Ms. Johnson is Chairman and Director of FMR Co., Inc. (investment adviser firm, 2011-present) and Chairman and Director of FMR (investment adviser firm, 2011-present). Previously, Ms. Johnson served as Vice Chairman (2007-2016) and President (2013-2016) of FMR LLC, President and a Director of FMR (2001-2005), a Trustee of other investment companies advised by FMR, Fidelity Investments Money Management, Inc. (investment adviser firm), and FMR Co., Inc. (2001-2005), Senior Vice President of the Fidelity® funds (2001-2005), and managed a number of Fidelity® funds. Ms. Abigail P. Johnson and Mr. Arthur E. Johnson are not related.
Jennifer Toolin McAuliffe (1959)
Year of Election or Appointment: 2016
Trustee
Ms. McAuliffe also serves as Trustee of other Fidelity® funds. Ms. McAuliffe previously served as a Member of the Advisory Board of certain Fidelity® funds (2016) and as Co-Head of Fixed Income of Fidelity Investments Limited (now known as FIL Limited (FIL)) (diversified financial services company). Earlier roles at FIL included Director of Research for FIL’s credit and quantitative teams in London, Hong Kong and Tokyo. Ms. McAuliffe also was the Director of Research for taxable and municipal bonds at Fidelity Investments Money Management, Inc. Ms. McAuliffe is also a director or trustee of several not-for-profit entities.
* Determined to be an “Interested Trustee” by virtue of, among other things, his or her affiliation with the trust or various entities under common control with FMR.
+ The information includes the Trustee's principal occupation during the last five years and other information relating to the experience, attributes, and skills relevant to the Trustee's qualifications to serve as a Trustee, which led to the conclusion that the Trustee should serve as a Trustee for each fund.
Independent Trustees:
Correspondence intended for an Independent Trustee may be sent to Fidelity Investments, P.O. Box 55235, Boston, Massachusetts 02205-5235.
Name, Year of Birth; Principal Occupations and Other Relevant Experience+
Elizabeth S. Acton (1951)
Year of Election or Appointment: 2013
Trustee
Ms. Acton also serves as Trustee of other Fidelity® funds. Prior to her retirement in April 2012, Ms. Acton was Executive Vice President, Finance (2011-2012), Executive Vice President, Chief Financial Officer (2002-2011), and Treasurer (2004-2005) of Comerica Incorporated (financial services). Prior to joining Comerica, Ms. Acton held a variety of positions at Ford Motor Company (1983-2002), including Vice President and Treasurer (2000-2002) and Executive Vice President and Chief Financial Officer of Ford Motor Credit Company (1998-2000). Ms. Acton currently serves as a member of the Board of Directors and Audit and Finance Committees of Beazer Homes USA, Inc. (homebuilding, 2012-present). Previously, Ms. Acton served as a Member of the Advisory Board of certain Fidelity® funds (2013-2016).
Ann E. Dunwoody (1953)
Year of Election or Appointment: 2018
Trustee
General Dunwoody also serves as Trustee of other Fidelity® funds. General Dunwoody (United States Army, Retired) was the first woman in U.S. military history to achieve the rank of four-star general and prior to her retirement in 2012 held a variety of positions within the U.S. Army, including Commanding General, U.S. Army Material Command (2008-2012). She is the President of First to Four LLC (leadership and mentoring services, 2012-present). She also serves as a member of the Board of Directors and Nominating and Corporate Governance Committee of L3 Technologies, Inc. (communication, electronic, sensor, and aerospace systems, 2013-present), Board of Directors and Nomination and Corporate Governance Committees of Kforce Inc. (professional staffing services, 2016-present) and Board of Directors of Automattic Inc. (software engineering, 2018-present). Previously, General Dunwoody served as a Member of the Advisory Board of certain Fidelity® funds (2018), a member of the Board of Directors and Audit and Sustainability and Corporate Responsibility Committees of Republic Services, Inc. (waste collection, disposal and recycling, 2013-2016). Ms. Dunwoody also serves on several boards for non-profit organizations, including as a member of the Board of Directors, Chair of the Nomination and Governance Committee and member of the Audit Committee of Logistics Management Institute (consulting non-profit, 2012-present), a member of the Board of Directors of the Army Historical Foundation (2015-present), a member of the Council of Trustees for the Association of the United States Army (advocacy non-profit, 2013-present) and a member of the Board of Trustees of Florida Institute of Technology (2015-present) and ThanksUSA (military family education non-profit, 2014-present).
John Engler (1948)
Year of Election or Appointment: 2014
Trustee
Mr. Engler also serves as Trustee of other Fidelity® funds. He serves on the board of directors for Universal Forest Products (manufacturer and distributor of wood and wood-alternative products, 2003-present) and K12 Inc. (technology-based education company, 2012-present). Previously, Mr. Engler served as interim president of Michigan State University (2018-2019), a Member of the Advisory Board of certain Fidelity® funds (2014-2016), president of the Business Roundtable (2011-2017), a trustee of The Munder Funds (2003-2014), president and CEO of the National Association of Manufacturers (2004-2011), member of the Board of Trustees of the Annie E. Casey Foundation (2004-2015), and as governor of Michigan (1991-2003). He is a past chairman of the National Governors Association.
Robert F. Gartland (1951)
Year of Election or Appointment: 2010
Trustee
Mr. Gartland also serves as Trustee of other Fidelity® funds. Mr. Gartland is Chairman and an investor in Gartland & Mellina Group Corp. (consulting, 2009-present). Previously, Mr. Gartland served as a partner and investor of Vietnam Partners LLC (investments and consulting, 2008-2011). Prior to his retirement, Mr. Gartland held a variety of positions at Morgan Stanley (financial services, 1979-2007), including Managing Director (1987-2007), and Chase Manhattan Bank (1975-1978).
Arthur E. Johnson (1947)
Year of Election or Appointment: 2008
Trustee
Chairman of the Independent Trustees
Mr. Johnson also serves as Trustee of other Fidelity® funds. Mr. Johnson serves as a member of the Board of Directors of Eaton Corporation plc (diversified power management, 2009-present) and Booz Allen Hamilton (management consulting, 2011-present). Prior to his retirement, Mr. Johnson served as Senior Vice President of Corporate Strategic Development of Lockheed Martin Corporation (defense contractor, 1999-2009). Mr. Johnson previously served as Vice Chairman (2015-2018) of the Independent Trustees of certain Fidelity® funds and on the Board of Directors of IKON Office Solutions, Inc. (1999-2008), AGL Resources, Inc. (holding company, 2002-2016), and Delta Airlines (2005-2007). Mr. Arthur E. Johnson is not related to Ms. Abigail P. Johnson.
Michael E. Kenneally (1954)
Year of Election or Appointment: 2009
Trustee
Vice Chairman of the Independent Trustees
Mr. Kenneally also serves as Trustee of other Fidelity® funds. Prior to his retirement, Mr. Kenneally served as Chairman and Global Chief Executive Officer of Credit Suisse Asset Management. Before joining Credit Suisse, he was an Executive Vice President and Chief Investment Officer for Bank of America Corporation. Earlier roles at Bank of America included Director of Research, Senior Portfolio Manager and Research Analyst, and Mr. Kenneally was awarded the Chartered Financial Analyst (CFA) designation in 1991.
Marie L. Knowles (1946)
Year of Election or Appointment: 2001
Trustee
Ms. Knowles also serves as Trustee of other Fidelity® funds. Prior to Ms. Knowles' retirement in June 2000, she served as Executive Vice President and Chief Financial Officer of Atlantic Richfield Company (ARCO) (diversified energy, 1996-2000). From 1993 to 1996, she was a Senior Vice President of ARCO and President of ARCO Transportation Company (pipeline and tanker operations). Ms. Knowles currently serves as a Director and Chairman of the Audit Committee of McKesson Corporation (healthcare service, since 2002). Ms. Knowles is a member of the Board of the Santa Catalina Island Company (real estate, 2009-present). Ms. Knowles is a Member of the Investment Company Institute Board of Governors and a Member of the Governing Council of the Independent Directors Council (2014-present). She also serves as a member of the Advisory Board for the School of Engineering of the University of Southern California. Previously, Ms. Knowles served as a Director of Phelps Dodge Corporation (copper mining and manufacturing, 1994-2007), URS Corporation (engineering and construction, 2000-2003) and America West (airline, 1999-2002). Ms. Knowles previously served as Chairman (2015-2018) and Vice Chairman (2012-2015) of the Independent Trustees of certain Fidelity® funds.
Mark A. Murray (1954)
Year of Election or Appointment: 2016
Trustee
Mr. Murray also serves as Trustee of other Fidelity® funds. Mr. Murray is Vice Chairman (2013-present) of Meijer, Inc. (regional retail chain). Previously, Mr. Murray served as a Member of the Advisory Board of certain Fidelity® funds (2016) and as Co-Chief Executive Officer (2013-2016) and President (2006-2013) of Meijer, Inc. Mr. Murray serves as a member of the Board of Directors and Nuclear Review and Public Policy and Responsibility Committees of DTE Energy Company (diversified energy company, 2009-present). Mr. Murray also serves as a member of the Board of Directors of Spectrum Health (not-for-profit health system, 2015-present). Mr. Murray previously served as President of Grand Valley State University (2001-2006), Treasurer for the State of Michigan (1999-2001), Vice President of Finance and Administration for Michigan State University (1998-1999), and a member of the Board of Directors and Audit Committee and Chairman of the Nominating and Corporate Governance Committee of Universal Forest Products, Inc. (manufacturer and distributor of wood and wood-alternative products, 2004-2016). Mr. Murray is also a director or trustee of many community and professional organizations.
+ The information includes the Trustee's principal occupation during the last five years and other information relating to the experience, attributes, and skills relevant to the Trustee's qualifications to serve as a Trustee, which led to the conclusion that the Trustee should serve as a Trustee for each fund.
Advisory Board Members and Officers:
Correspondence intended for an officer may be sent to Fidelity Investments, 245 Summer Street, Boston, Massachusetts 02210. Officers appear below in alphabetical order.
Name, Year of Birth; Principal Occupation
Elizabeth Paige Baumann (1968)
Year of Election or Appointment: 2017
Anti-Money Laundering (AML) Officer
Ms. Baumann also serves as AML Officer of other funds. She is Chief AML Officer (2012-present) and Senior Vice President (2014-present) of FMR LLC (diversified financial services company) and is an employee of Fidelity Investments. Previously, Ms. Baumann served as AML Officer of the funds (2012-2016), and Vice President (2007-2014) and Deputy Anti-Money Laundering Officer (2007-2012) of FMR LLC.
Craig S. Brown (1977)
Year of Election or Appointment: 2019
Assistant Treasurer
Mr. Brown also serves as Assistant Treasurer of other funds. Mr. Brown is an employee of Fidelity Investments (2013-present).
John J. Burke III (1964)
Year of Election or Appointment: 2018
Chief Financial Officer
Mr. Burke also serves as Chief Financial Officer of other funds. Mr. Burke serves as Head of Investment Operations for Fidelity Fund and Investment Operations (2018-present) and is an employee of Fidelity Investments (1998-present). Previously Mr. Burke served as head of Asset Management Investment Operations (2012-2018).
William C. Coffey (1969)
Year of Election or Appointment: 2018
Secretary and Chief Legal Officer (CLO)
Mr. Coffey also serves as Secretary and CLO of other funds. Mr. Coffey serves as CLO, Secretary, and Senior Vice President of Fidelity Management & Research Company and FMR Co., Inc. (investment adviser firms, 2018-present); Secretary of Fidelity SelectCo, LLC and Fidelity Investments Money Management, Inc. (investment adviser firms, 2018-present); and CLO of Fidelity Management & Research (Hong Kong) Limited, FMR Investment Management (UK) Limited, and Fidelity Management & Research (Japan) Limited (investment adviser firms, 2018-present). He is Senior Vice President and Deputy General Counsel of FMR LLC (diversified financial services company, 2010-present), and is an employee of Fidelity Investments. Previously, Mr. Coffey served as Assistant Secretary of certain funds (2009-2018) and as Vice President and Associate General Counsel of FMR LLC (2005-2009).
Jonathan Davis (1968)
Year of Election or Appointment: 2010
Assistant Treasurer
Mr. Davis also serves as Assistant Treasurer of other funds. Mr. Davis serves as Assistant Treasurer of FMR Capital, Inc. (2017-present) and is an employee of Fidelity Investments. Previously, Mr. Davis served as Vice President and Associate General Counsel of FMR LLC (diversified financial services company, 2003-2010).
Adrien E. Deberghes (1967)
Year of Election or Appointment: 2010
Assistant Treasurer
Mr. Deberghes also serves as an officer of other funds. He serves as Assistant Treasurer of FMR Capital, Inc. (2017-present), Executive Vice President of Fidelity Investments Money Management, Inc. (FIMM) (investment adviser firm, 2016-present), and is an employee of Fidelity Investments (2008-present). Previously, Mr. Deberghes served as President and Treasurer of certain Fidelity® funds (2013-2018). Prior to joining Fidelity Investments, Mr. Deberghes was Senior Vice President of Mutual Fund Administration at State Street Corporation (2007-2008), Senior Director of Mutual Fund Administration at Investors Bank & Trust (2005-2007), and Director of Finance for Dunkin' Brands (2000-2005). Previously, Mr. Deberghes served in other fund officer roles.
Laura M. Del Prato (1964)
Year of Election or Appointment: 2018
President and Treasurer
Ms. Del Prato also serves as an officer of other funds. Ms. Del Prato is an employee of Fidelity Investments (2017-present). Prior to joining Fidelity Investments, Ms. Del Prato served as a Managing Director and Treasurer of the JPMorgan Mutual Funds (2014-2017). Prior to JPMorgan, Ms. Del Prato served as a partner at Cohen Fund Audit Services (accounting firm, 2012-2013) and KPMG LLP (accounting firm, 2004-2012).
Colm A. Hogan (1973)
Year of Election or Appointment: 2016
Assistant Treasurer
Mr. Hogan also serves as an officer of other funds. Mr. Hogan serves as Assistant Treasurer of FMR Capital, Inc. (2017-present) and is an employee of Fidelity Investments (2005-present). Previously, Mr. Hogan served as Assistant Treasurer of certain Fidelity® funds (2016-2018).
Chris Maher (1972)
Year of Election or Appointment: 2013
Assistant Treasurer
Mr. Maher serves as Assistant Treasurer of other funds. Mr. Maher is Vice President of Valuation Oversight, serves as Assistant Treasurer of FMR Capital, Inc. (2017-present), and is an employee of Fidelity Investments. Previously, Mr. Maher served as Vice President of Asset Management Compliance (2013), Vice President of the Program Management Group of FMR (investment adviser firm, 2010-2013), and Vice President of Valuation Oversight (2008-2010).
John B. McGinty, Jr. (1962)
Year of Election or Appointment: 2016
Chief Compliance Officer
Mr. McGinty also serves as Chief Compliance Officer of other funds. Mr. McGinty is Senior Vice President of Asset Management Compliance for Fidelity Investments and is an employee of Fidelity Investments (2016-present). Mr. McGinty previously served as Vice President, Senior Attorney at Eaton Vance Management (investment management firm, 2015-2016), and prior to Eaton Vance as global CCO for all firm operations and registered investment companies at GMO LLC (investment management firm, 2009-2015). Before joining GMO LLC, Mr. McGinty served as Senior Vice President, Deputy General Counsel for Fidelity Investments (2007-2009).
Jason P. Pogorelec (1975)
Year of Election or Appointment: 2015
Assistant Secretary
Mr. Pogorelec also serves as Assistant Secretary of other funds. Mr. Pogorelec serves as Vice President, Associate General Counsel (2010-present) and is an employee of Fidelity Investments (2006-present).
Nancy D. Prior (1967)
Year of Election or Appointment: 2014
Vice President
Ms. Prior also serves as Vice President of other funds. Ms. Prior serves as President Fixed Income, High Income/Emerging Market Debt and Multi Asset Class Strategies of FIAM LLC (2018-present), President (2016-present) and Director (2014-present) of Fidelity Investments Money Management, Inc. (FIMM) (investment adviser firm), President, Fixed Income (2014-present), and is an employee of Fidelity Investments (2002-present). Previously, Ms. Prior served as Vice Chairman of FIAM LLC (investment adviser firm, 2014-2018), a Director of FMR Investment Management (UK) Limited (investment adviser firm, 2015-2018), President Multi-Asset Class Strategies of FMR's Global Asset Allocation Division (2017-2018), Vice President of Fidelity's Money Market Funds (2012-2014), President, Money Market and Short Duration Bond Group of Fidelity Management & Research (FMR) (investment adviser firm, 2013-2014), President, Money Market Group of FMR (2011-2013), Managing Director of Research (2009-2011), Senior Vice President and Deputy General Counsel (2007-2009), and Assistant Secretary of certain Fidelity® funds (2008-2009).
Stacie M. Smith (1974)
Year of Election or Appointment: 2013
Assistant Treasurer
Ms. Smith also serves as an officer of other funds. Ms. Smith serves as Assistant Treasurer of FMR Capital, Inc. (2017-present), is an employee of Fidelity Investments (2009-present), and has served in other fund officer roles. Prior to joining Fidelity Investments, Ms. Smith served as Senior Audit Manager of Ernst & Young LLP (accounting firm, 1996-2009). Previously, Ms. Smith served as Assistant Treasurer (2013-2018) and Deputy Treasurer (2013-2016) of certain Fidelity® funds.
Marc L. Spector (1972)
Year of Election or Appointment: 2016
Deputy Treasurer
Mr. Spector also serves as an officer of other funds. Mr. Spector serves as Assistant Treasurer of FMR Capital, Inc. (2017-present) and is an employee of Fidelity Investments (2016-present). Prior to joining Fidelity Investments, Mr. Spector served as Director at the Siegfried Group (accounting firm, 2013-2016), and prior to Siegfried Group as audit senior manager at Deloitte & Touche (accounting firm, 2005-2013).
Jim Wegmann (1979)
Year of Election or Appointment: 2019
Assistant Treasurer
Mr. Wegmann also serves as Assistant Treasurer of other funds. Mr. Wegmann is an employee of Fidelity Investments (2011-present).
Shareholder Expense Example
As a shareholder of a Fund, you incur two types of costs: (1) transaction costs and (2) ongoing costs, including other Fund expenses. This Example is intended to help you understand your ongoing costs (in dollars) of investing in the Funds and to compare these costs with the ongoing costs of investing in other mutual funds.
The Example is based on an investment of $1,000 invested at the beginning of the period and held for the entire period (October 1, 2018 to March 31, 2019).
Actual Expenses
The first line of the accompanying table for each Class of each fund provides information about actual account values and actual expenses. You may use the information in this line, together with the amount you invested, to estimate the expenses that you paid over the period. Simply divide your account value by $1,000.00 (for example, an $8,600 account value divided by $1,000.00 = 8.6), then multiply the result by the number in the first line for a Class of the fund under the heading entitled "Expenses Paid During Period" to estimate the expenses you paid on your account during this period. In addition, each Fund, as a shareholder in underlying Fidelity Funds, will indirectly bear its pro-rata share of the fees and expenses incurred by the underlying Fidelity Funds. These fees and expenses are not included in each Fund's annualized expense ratio used to calculate the expense estimates in the table below.
Hypothetical Example for Comparison Purposes
The second line of the accompanying table for each Class of each fund provides information about hypothetical account values and hypothetical expenses based on a Class' actual expense ratio and an assumed rate of return of 5% per year before expenses, which is not the Class' actual return. The hypothetical account values and expenses may not be used to estimate the actual ending account balance or expenses you paid for the period. You may use this information to compare the ongoing costs of investing in the Fund and other funds. To do so, compare this 5% hypothetical example with the 5% hypothetical examples that appear in the shareholder reports of the other funds. In addition, each Fund, as a shareholder in underlying Fidelity Funds, will indirectly bear its pro-rata share of the fees and expenses incurred by the underlying Fidelity Funds. These fees and expenses are not included in each Fund's annualized expense ratio used to calculate the expense estimates in the table below.
Please note that the expenses shown in the table are meant to highlight your ongoing costs only and do not reflect any transaction costs. Therefore, the second line of the table is useful in comparing ongoing costs only, and will not help you determine the relative total costs of owning different funds.
| | Annualized Expense Ratio-A | Beginning
Account Value
October 1, 2018 | Ending
Account Value
March 31, 2019 | Expenses Paid
During Period-B
October 1, 2018
to March 31, 2019 |
| Fidelity Freedom Index Income Fund | | | | |
| Investor Class | .12% | | | |
| Actual | | $1,000.00 | $1,026.30 | $.61 |
| Hypothetical-C | | $1,000.00 | $1,024.33 | $.61 |
| Institutional Premium Class | .06% | | | |
| Actual | | $1,000.00 | $1,026.00 | $.30 |
| Hypothetical-C | | $1,000.00 | $1,024.63 | $.30 |
| Fidelity Freedom Index 2005 Fund | | | | |
| Investor Class | .12% | | | |
| Actual | | $1,000.00 | $1,021.70 | $.60 |
| Hypothetical-C | | $1,000.00 | $1,024.33 | $.61 |
| Institutional Premium Class | .06% | | | |
| Actual | | $1,000.00 | $1,021.40 | $.30 |
| Hypothetical-C | | $1,000.00 | $1,024.63 | $.30 |
| Fidelity Freedom Index 2010 Fund | | | | |
| Investor Class | .12% | | | |
| Actual | | $1,000.00 | $1,017.40 | $.60 |
| Hypothetical-C | | $1,000.00 | $1,024.33 | $.61 |
| Institutional Premium Class | .06% | | | |
| Actual | | $1,000.00 | $1,017.10 | $.30 |
| Hypothetical-C | | $1,000.00 | $1,024.63 | $.30 |
| Fidelity Freedom Index 2015 Fund | | | | |
| Investor Class | .12% | | | |
| Actual | | $1,000.00 | $1,012.50 | $.60 |
| Hypothetical-C | | $1,000.00 | $1,024.33 | $.61 |
| Institutional Premium Class | .06% | | | |
| Actual | | $1,000.00 | $1,012.90 | $.30 |
| Hypothetical-C | | $1,000.00 | $1,024.63 | $.30 |
| Fidelity Freedom Index 2020 Fund | | | | |
| Investor Class | .11% | | | |
| Actual | | $1,000.00 | $1,008.50 | $.55 |
| Hypothetical-C | | $1,000.00 | $1,024.38 | $.56 |
| Institutional Premium Class | .05% | | | |
| Actual | | $1,000.00 | $1,009.50 | $.25 |
| Hypothetical-C | | $1,000.00 | $1,024.68 | $.25 |
| Fidelity Freedom Index 2025 Fund | | | | |
| Investor Class | .11% | | | |
| Actual | | $1,000.00 | $1,005.40 | $.55 |
| Hypothetical-C | | $1,000.00 | $1,024.38 | $.56 |
| Institutional Premium Class | .05% | | | |
| Actual | | $1,000.00 | $1,005.90 | $.25 |
| Hypothetical-C | | $1,000.00 | $1,024.68 | $.25 |
| Fidelity Freedom Index 2030 Fund | | | | |
| Investor Class | .11% | | | |
| Actual | | $1,000.00 | $998.50 | $.55 |
| Hypothetical-C | | $1,000.00 | $1,024.38 | $.56 |
| Institutional Premium Class | .05% | | | |
| Actual | | $1,000.00 | $999.40 | $.25 |
| Hypothetical-C | | $1,000.00 | $1,024.68 | $.25 |
| Fidelity Freedom Index 2035 Fund | | | | |
| Investor Class | .11% | | | |
| Actual | | $1,000.00 | $989.00 | $.55 |
| Hypothetical-C | | $1,000.00 | $1,024.38 | $.56 |
| Institutional Premium Class | .05% | | | |
| Actual | | $1,000.00 | $989.40 | $.25 |
| Hypothetical-C | | $1,000.00 | $1,024.68 | $.25 |
| Fidelity Freedom Index 2040 Fund | | | | |
| Investor Class | .11% | | | |
| Actual | | $1,000.00 | $985.70 | $.54 |
| Hypothetical-C | | $1,000.00 | $1,024.38 | $.56 |
| Institutional Premium Class | .05% | | | |
| Actual | | $1,000.00 | $986.60 | $.25 |
| Hypothetical-C | | $1,000.00 | $1,024.68 | $.25 |
| Fidelity Freedom Index 2045 Fund | | | | |
| Investor Class | .11% | | | |
| Actual | | $1,000.00 | $986.30 | $.54 |
| Hypothetical-C | | $1,000.00 | $1,024.38 | $.56 |
| Institutional Premium Class | .05% | | | |
| Actual | | $1,000.00 | $986.20 | $.25 |
| Hypothetical-C | | $1,000.00 | $1,024.68 | $.25 |
| Fidelity Freedom Index 2050 Fund | | | | |
| Investor Class | .11% | | | |
| Actual | | $1,000.00 | $985.50 | $.54 |
| Hypothetical-C | | $1,000.00 | $1,024.38 | $.56 |
| Institutional Premium Class | .05% | | | |
| Actual | | $1,000.00 | $986.40 | $.25 |
| Hypothetical-C | | $1,000.00 | $1,024.68 | $.25 |
| Fidelity Freedom Index 2055 Fund | | | | |
| Investor Class | .11% | | | |
| Actual | | $1,000.00 | $985.90 | $.54 |
| Hypothetical-C | | $1,000.00 | $1,024.38 | $.56 |
| Institutional Premium Class | .05% | | | |
| Actual | | $1,000.00 | $986.30 | $.25 |
| Hypothetical-C | | $1,000.00 | $1,024.68 | $.25 |
| Fidelity Freedom Index 2060 Fund | | | | |
| Investor Class | .11% | | | |
| Actual | | $1,000.00 | $986.10 | $.54 |
| Hypothetical-C | | $1,000.00 | $1,024.38 | $.56 |
| Institutional Premium Class | .05% | | | |
| Actual | | $1,000.00 | $986.40 | $.25 |
| Hypothetical-C | | $1,000.00 | $1,024.68 | $.25 |
A Annualized expense ratio reflects expenses net of applicable fee waivers.
B Expenses are equal to each Class' annualized expense ratio, multiplied by the average account value over the period, multiplied by 182/ 365 (to reflect the one-half year period). The fees and expenses of the underlying Fidelity Funds in which each Fund invests are not included in each Fund's annualized expense ratio.
C 5% return per year before expenses
Distributions (Unaudited)
The Board of Trustees of each fund voted to pay to shareholders of record at the opening of business on record date, the following distributions per share derived from capital gains realized from sales of portfolio securities and dividends derived from net investment income:
| | Pay Date | Record Date | Dividends | Capital Gains |
| Fidelity Freedom Index Income Fund | | | | |
| Investor Class | 05/06/19 | 05/03/19 | $0.021 | $0.008 |
| Institutional Premium Class | 05/06/19 | 05/03/19 | $0.022 | $0.008 |
| Fidelity Freedom Index 2005 Fund | | | | |
| Investor Class | 05/13/19 | 05/10/19 | $0.055 | $0.013 |
| Institutional Premium Class | 05/13/19 | 05/10/19 | $0.057 | $0.013 |
| Fidelity Freedom Index 2010 Fund | | | | |
| Investor Class | 05/13/19 | 05/10/19 | $0.048 | $0.027 |
| Institutional Premium Class | 05/13/19 | 05/10/19 | $0.049 | $0.027 |
| Fidelity Freedom Index 2015 Fund | | | | |
| Investor Class | 05/13/19 | 05/10/19 | $0.046 | $0.027 |
| Institutional Premium Class | 05/13/19 | 05/10/19 | $0.048 | $0.027 |
| Fidelity Freedom Index 2020 Fund | | | | |
| Investor Class | 05/13/19 | 05/10/19 | $0.041 | $0.018 |
| Institutional Premium Class | 05/13/19 | 05/10/19 | $0.043 | $0.018 |
| Fidelity Freedom Index 2025 Fund | | | | |
| Investor Class | 05/13/19 | 05/10/19 | $0.036 | $0.024 |
| Institutional Premium Class | 05/13/19 | 05/10/19 | $0.038 | $0.024 |
| Fidelity Freedom Index 2030 Fund | | | | |
| Investor Class | 05/13/19 | 05/10/19 | $0.028 | $0.028 |
| Institutional Premium Class | 05/13/19 | 05/10/19 | $0.030 | $0.028 |
| Fidelity Freedom Index 2035 Fund | | | | |
| Investor Class | 05/13/19 | 05/10/19 | $0.013 | $0.040 |
| Institutional Premium Class | 05/13/19 | 05/10/19 | $0.016 | $0.040 |
| Fidelity Freedom Index 2040 Fund | | | | |
| Investor Class | 05/13/19 | 05/10/19 | $0.006 | $0.033 |
| Institutional Premium Class | 05/13/19 | 05/10/19 | $0.008 | $0.033 |
| Fidelity Freedom Index 2045 Fund | | | | |
| Investor Class | 05/13/19 | 05/10/19 | $0.006 | $0.034 |
| Institutional Premium Class | 05/13/19 | 05/10/19 | $0.009 | $0.034 |
| Fidelity Freedom Index 2050 Fund | | | | |
| Investor Class | 05/13/19 | 05/10/19 | $0.006 | $0.032 |
| Institutional Premium Class | 05/13/19 | 05/10/19 | $0.008 | $0.032 |
| Fidelity Freedom Index 2055 Fund | | | | |
| Investor Class | 05/13/19 | 05/10/19 | $0.004 | $0.029 |
| Institutional Premium Class | 05/13/19 | 05/10/19 | $0.006 | $0.029 |
| Fidelity Freedom Index 2060 Fund | | | | |
| Investor Class | 05/13/19 | 05/10/19 | $0.003 | $0.025 |
| Institutional Premium Class | 05/13/19 | 05/10/19 | $0.004 | $0.025 |
|
The funds hereby designate as capital gain dividend the amounts noted below for the taxable year ended March 31, 2019, or, if subsequently determined to be different, the net capital gain of such year.
| Fidelity Freedom Index Income Fund | $ 2,185,327 |
| Fidelity Freedom Index 2005 Fund | $ 1,134,239 |
| Fidelity Freedom Index 2010 Fund | $ 11,275,532 |
| Fidelity Freedom Index 2015 Fund | $ 12,640,169 |
| Fidelity Freedom Index 2020 Fund | $ 8,523,963 |
| Fidelity Freedom Index 2025 Fund | $ 6,332,899 |
| Fidelity Freedom Index 2030 Fund | $ 7,297,432 |
| Fidelity Freedom Index 2035 Fund | $ 7,681,935 |
| Fidelity Freedom Index 2040 Fund | $ 4,939,470 |
| Fidelity Freedom Index 2045 Fund | $ 3,279,692 |
| Fidelity Freedom Index 2050 Fund | $ 2,741,834 |
| Fidelity Freedom Index 2055 Fund | $ 1,465,366 |
| Fidelity Freedom Index 2060 Fund | $ 453,995 |
A percentage of the dividends distributed during the fiscal year for the following funds were derived from interest on U.S. Government securities which is generally exempt from state income tax:
| Fidelity Freedom Index Income Fund | 43.92% |
| Fidelity Freedom Index 2005 Fund | 34.13% |
| Fidelity Freedom Index 2010 Fund | 30.04% |
| Fidelity Freedom Index 2015 Fund | 27.27% |
| Fidelity Freedom Index 2020 Fund | 21.62% |
| Fidelity Freedom Index 2025 Fund | 18.22% |
| Fidelity Freedom Index 2030 Fund | 11.71% |
| Fidelity Freedom Index 2035 Fund | 6.80% |
| Fidelity Freedom Index 2040 Fund | 5.38% |
| Fidelity Freedom Index 2045 Fund | 5.41% |
| Fidelity Freedom Index 2050 Fund | 5.40% |
| Fidelity Freedom Index 2055 Fund | 5.43% |
| Fidelity Freedom Index 2060 Fund | 5.32% |
|
A percentage of the dividends distributed during the fiscal year for the following funds qualify for the dividends–received deduction for corporate shareholders:
| | Investor Class | Institutional Premium Class |
| Fidelity Freedom Index Income Fund | | |
| April 2018 | 0% | 0% |
| May 2018 | 12% | 12% |
| June 2018 | 12% | 12% |
| July 2018 | 12% | 12% |
| August 2018 | 12% | 12% |
| September 2018 | 13% | 12% |
| October 2018 | 13% | 12% |
| November 2018 | 13% | 12% |
| December 2018 | 13% | 12% |
| February 2019 | 0% | 0% |
| March 2019 | 0% | 0% |
| Fidelity Freedom Index 2005 Fund | | |
| May 2018 | 1% | 1% |
| December 2018 | 19% | 18% |
| Fidelity Freedom Index 2010 Fund | | |
| May 2018 | 1% | 1% |
| December 2018 | 24% | 23% |
| Fidelity Freedom Index 2015 Fund | | |
| May 2018 | 2% | 2% |
| December 2018 | 29% | 28% |
| Fidelity Freedom Index 2020 Fund | | |
| May 2018 | 2% | 2% |
| December 2018 | 33% | 32% |
| Fidelity Freedom Index 2025 Fund | | |
| May 2018 | 3% | 3% |
| December 2018 | 37% | 36% |
| Fidelity Freedom Index 2030 Fund | | |
| May 2018 | 4% | 4% |
| December 2018 | 44% | 43% |
| Fidelity Freedom Index 2035 Fund | | |
| May 2018 | 12% | 9% |
| December 2018 | 52% | 51% |
| Fidelity Freedom Index 2040 Fund | | |
| May 2018 | 15% | 12% |
| December 2018 | 55% | 54% |
| Fidelity Freedom Index 2045 Fund | | |
| May 2018 | 16% | 12% |
| December 2018 | 55% | 54% |
| Fidelity Freedom Index 2050 Fund | | |
| May 2018 | 9% | 7% |
| December 2018 | 55% | 54% |
| Fidelity Freedom Index 2055 Fund | | |
| May 2018 | 14% | 10% |
| December 2018 | 55% | 54% |
| Fidelity Freedom Index 2060 Fund | | |
| May 2018 | 19% | 16% |
| December 2018 | 54% | 54% |
|
A percentage of the dividends distributed during the fiscal year for the following funds may be taken into account as a dividend for purposes of the maximum rate under section 1(h)(11) of the Internal Revenue Code:
| | Investor Class | Institutional Premium Class |
| Fidelity Freedom Index Income Fund | | |
| April 2018 | 0% | 0% |
| May 2018 | 19% | 19% |
| June 2018 | 20% | 20% |
| July 2018 | 20% | 20% |
| August 2018 | 20% | 20% |
| September 2018 | 20% | 19% |
| October 2018 | 21% | 19% |
| November 2018 | 21% | 19% |
| December 2018 | 20% | 20% |
| February 2019 | 0% | 0% |
| March 2019 | 0% | 0% |
| Fidelity Freedom Index 2005 Fund | | |
| May 2018 | 2% | 2% |
| December 2018 | 38% | 37% |
| Fidelity Freedom Index 2010 Fund | | |
| May 2018 | 2% | 2% |
| December 2018 | 44% | 43% |
| Fidelity Freedom Index 2015 Fund | | |
| May 2018 | 3% | 3% |
| December 2018 | 50% | 49% |
| Fidelity Freedom Index 2020 Fund | | |
| May 2018 | 3% | 3% |
| December 2018 | 55% | 54% |
| Fidelity Freedom Index 2025 Fund | | |
| May 2018 | 5% | 5% |
| December 2018 | 60% | 59% |
| Fidelity Freedom Index 2030 Fund | | |
| May 2018 | 7% | 7% |
| December 2018 | 70% | 69% |
| Fidelity Freedom Index 2035 Fund | | |
| May 2018 | 19% | 14% |
| December 2018 | 84% | 82% |
| Fidelity Freedom Index 2040 Fund | | |
| May 2018 | 25% | 20% |
| December 2018 | 87% | 86% |
| Fidelity Freedom Index 2045 Fund | | |
| May 2018 | 26% | 19% |
| December 2018 | 88% | 86% |
| Fidelity Freedom Index 2050 Fund | | |
| May 2018 | 15% | 12% |
| December 2018 | 87% | 86% |
| Fidelity Freedom Index 2055 Fund | | |
| May 2018 | 23% | 17% |
| December 2018 | 87% | 86% |
| Fidelity Freedom Index 2060 Fund | | |
| May 2018 | 31% | 26% |
| December 2018 | 88% | 87% |
|
The funds will notify shareholders in January 2020 of amounts for use in preparing 2019 income tax returns.
Board Approval of Investment Advisory Contracts and Management Fees
Fidelity Freedom Index Funds
In January 2019, the Board of Trustees, including the Independent Trustees (together, the Board), voted to approve the amended and restated management contract (Amended Advisory Contract) between FMR Co., Inc. (FMRC), an affiliate of Fidelity Management & Research Company (FMR), and each fund to add a management fee payable by each fund. The Board, assisted by the advice of fund counsel and Independent Trustees' counsel, considered a range of information.
The Board noted that, under each fund's current management contract (Current Advisory Contract), the funds do not pay a management fee to FMRC. Instead, the Board noted, each fund currently indirectly incurs a portion of the management fee and other expenses of each underlying fund in which each fund invests (Underlying Funds) and that such expenses are currently reflected in each fund's expense ratio as acquired fund fees and expenses. The Board considered that, under each fund's Amended Advisory Contract, each class of each fund will pay a monthly management fee to FMRC at an annual rate for the class.
The Board considered that the increase in each fund's management fee under the Amended Advisory Contract will result in the fund's management fee rate ranking equal to the median of the management fee rates of its competitor funds based on the competitive mapped group data provided to the Board in July 2018 in connection with the annual renewal of advisory contracts. However, the Board further considered that the increase in management fees will be offset by a decrease in each fund's acquired fund fees and expenses as a result of allocations to new Underlying Funds and fee reductions for certain existing Underlying Funds under amended management contracts, sub-advisory agreements, transfer agent agreements, and pricing and bookkeeping agreements (collectively, the Amended Underlying Fund Arrangements). The Board noted that, once the Amended Underlying Fund Arrangements take effect, the Underlying Funds will no longer pay any operating expenses, except 12b-1 fees, interest and taxes, independent trustee expenses, custodian fees, expenses related to proxy solicitations and extraordinary expenses (such as litigation expenses), and thus the funds' acquired fund fees and expenses will be significantly reduced. The Board also noted that each class's management fee under the Amended Advisory Contract will be set at or below the existing "capped" total expense level provided by separate contractual arrangements and that, as a result, the total expenses incurred by shareholders of each class of each fund under the Amended Advisory Contract will be equal to or less than the total expenses that each class of each fund would have paid under the current pricing structure. The Board also noted that, once the Amended Underlying Fund Arrangements take effect, the funds' total expenses are expected to be more predictable because all the Underlying Funds will be priced similarly and, thus, the funds' investment decisions will not result in shifting expense levels.
The Board considered that the approval of each Amended Advisory Contract would not result in any changes in (i) the investment process or strategies employed in the management of each fund's assets; (ii) the nature, extent or quality of services provided to each fund; or (iii) the day-to-day management of each fund and the personnel primarily responsible for such management. The Board considered that, like the Current Advisory Contracts, the Amended Advisory Contracts provide that FMRC or an affiliate undertakes to pay all operating expenses of the funds, except 12b-1 fees, Independent Trustee expenses, interest, taxes, expenses related to proxy solicitation, and extraordinary expenses (such as litigation expenses).
In connection with its consideration of future renewals of each fund's management contract, the Board will consider, among other things,: (i) the nature, extent and quality of services provided to the fund, including shareholder and administrative services and investment performance; (ii) the competitiveness of the management fee and total expenses for each class of the fund; (iii) the costs of the services and profitability, including the revenues earned and the expenses incurred in conducting the business of developing, marketing, distributing, managing, administering, and servicing the fund and its shareholders, to the extent applicable; and (iv) whether there have been economies of scale in respect of the Fidelity funds, whether the Fidelity funds (including the fund) have appropriately benefited from any such economies of scale, and whether there is the potential for realization of any further economies.
Based on its evaluation of all of the conclusions noted above, and after considering all factors it believed relevant, the Board ultimately concluded that each fund's management fee structure is fair and reasonable, and that each fund's Amended Advisory Contract should be approved.
FRX-ANN-0519
1.899264.109
Fidelity Flex℠ Freedom Funds - Income, 2005, 2010, 2015, 2020, 2025, 2030, 2035, 2040, 2045, 2050, 2055, 2060
Annual Report March 31, 2019 |
|
Beginning on January 1, 2021, as permitted by regulations adopted by the Securities and Exchange Commission, paper copies of a fund’s shareholder reports will no longer be sent by mail, unless you specifically request paper copies of the reports from the fund or from your financial intermediary, such as a financial advisor, broker-dealer or bank. Instead, the reports will be made available on a website, and you will be notified by mail each time a report is posted and provided with a website link to access the report.
If you already elected to receive shareholder reports electronically, you will not be affected by this change and you need not take any action. You may elect to receive shareholder reports and other communications from a fund electronically, by contacting your financial intermediary. For Fidelity customers, visit Fidelity's web site or call Fidelity using the contact information listed below.
You may elect to receive all future reports in paper free of charge. If you wish to continue receiving paper copies of your shareholder reports, you may contact your financial intermediary or, if you are a Fidelity customer, visit Fidelity’s website, or call Fidelity at the applicable toll-free number listed below. Your election to receive reports in paper will apply to all funds held with the fund complex/your financial intermediary.
| Account Type | Website | Phone Number |
| Brokerage, Mutual Fund, or Annuity Contracts: | fidelity.com/mailpreferences | 1-800-343-3548 |
| Employer Provided Retirement Accounts: | netbenefits.fidelity.com/preferences (choose 'no' under Required Disclosures to continue to print) | 1-800-343-0860 |
| Advisor Sold Accounts Serviced Through Your Financial Intermediary: | Contact Your Financial Intermediary | Your Financial Intermediary's phone number |
| Advisor Sold Accounts Serviced by Fidelity: | institutional.fidelity.com | 1-877-208-0098 |
Contents
To view a fund's proxy voting guidelines and proxy voting record for the 12-month period ended June 30, visit http://www.fidelity.com/proxyvotingresults or visit the Securities and Exchange Commission's (SEC) web site at http://www.sec.gov.
You may also call 1-800-835-5092 to request a free copy of the proxy voting guidelines.
Standard & Poor's, S&P and S&P 500 are registered service marks of The McGraw-Hill Companies, Inc. and have been licensed for use by Fidelity Distributors Corporation.
Other third-party marks appearing herein are the property of their respective owners.
All other marks appearing herein are registered or unregistered trademarks or service marks of FMR LLC or an affiliated company. © 2019 FMR LLC. All rights reserved.
This report and the financial statements contained herein are submitted for the general information of the shareholders of the Funds. This report is not authorized for distribution to prospective investors in the Funds unless preceded or accompanied by an effective prospectus.
A fund files its complete schedule of portfolio holdings with the SEC for the first and third quarters of each fiscal year on Form N-PORT. Forms N-PORT are available on the SEC’s web site at http://www.sec.gov. A fund's Forms N-PORT may be reviewed and copied at the SEC’s Public Reference Room in Washington, DC. Information regarding the operation of the SEC's Public Reference Room may be obtained by calling 1-800-SEC-0330.
For a complete list of a fund's portfolio holdings, view the most recent holdings listing, semiannual report, or annual report on Fidelity's web site at http://www.fidelity.com, http://www.institutional.fidelity.com, or http://www.401k.com, as applicable.
NOT FDIC INSURED •MAY LOSE VALUE •NO BANK GUARANTEE
Neither the Funds nor Fidelity Distributors Corporation is a bank.
Fidelity Flex℠ Freedom Income Fund
Performance: The Bottom Line
Average annual total return reflects the change in the value of an investment, assuming reinvestment of distributions from dividend income and capital gains (the profits earned upon the sale of securities that have grown in value, if any) and assuming a constant rate of performance each year. The hypothetical investment and the average annual total returns do not reflect the deduction of taxes that a shareholder would pay on fund distributions or the redemption of fund shares. During periods of reimbursement by Fidelity, a fund’s total return will be greater than it would be had the reimbursement not occurred. How a fund did yesterday is no guarantee of how it will do tomorrow.
Average Annual Total Returns
| Periods ended March 31, 2019 | Past 1 year | Life of FundA |
| Fidelity Flex℠ Freedom Income Fund | 3.63% | 3.75% |
A Fund commenced operations on June 8, 2017.
$10,000 Over Life of Fund
Let's say hypothetically that $10,000 was invested in Fidelity Flex℠ Freedom Income Fund on June 8, 2017, when the fund started.
The chart shows how the value of your investment would have changed, and also shows how the Bloomberg Barclays U.S. Aggregate Bond Index performed over the same period.
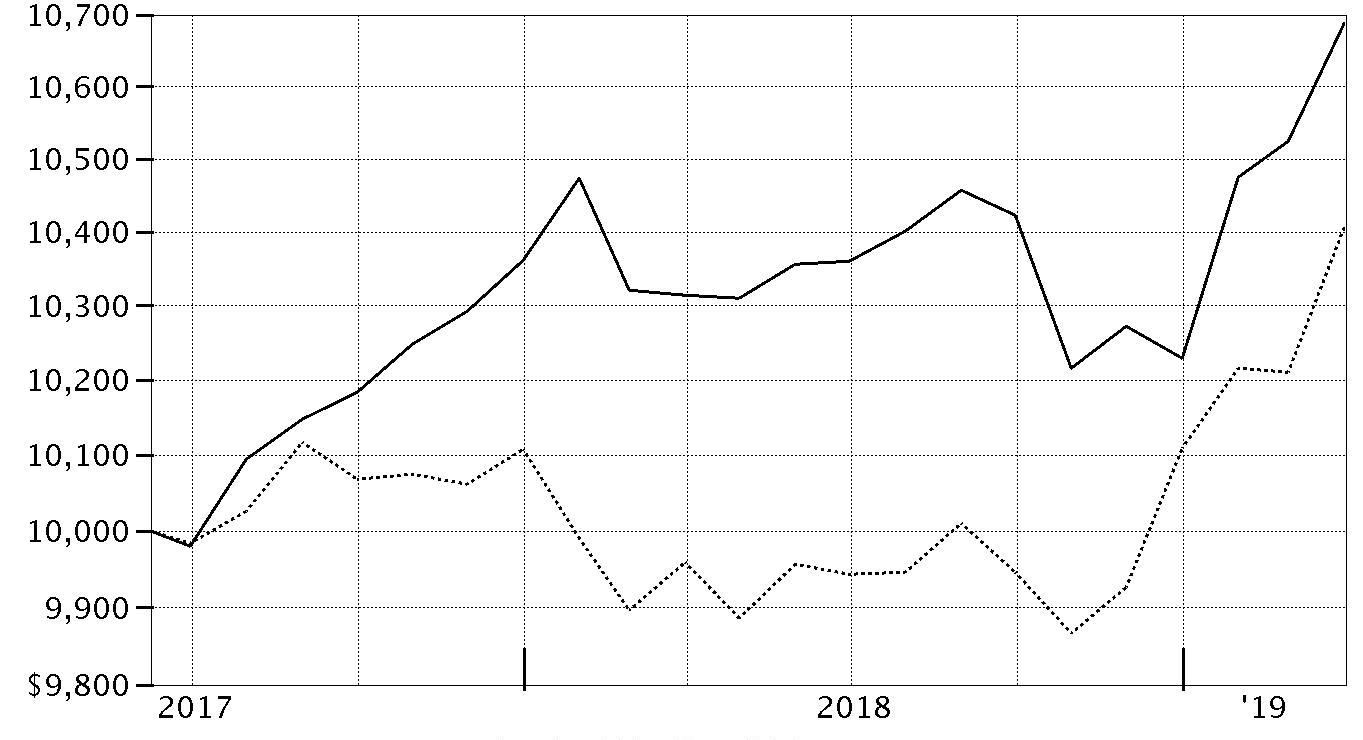
| Period Ending Values |
| $10,689 | Fidelity Flex℠ Freedom Income Fund |
| $10,406 | Bloomberg Barclays U.S. Aggregate Bond Index |
Fidelity Flex℠ Freedom 2005 Fund
Performance: The Bottom Line
Average annual total return reflects the change in the value of an investment, assuming reinvestment of distributions from dividend income and capital gains (the profits earned upon the sale of securities that have grown in value, if any) and assuming a constant rate of performance each year. The hypothetical investment and the average annual total returns do not reflect the deduction of taxes that a shareholder would pay on fund distributions or the redemption of fund shares. During periods of reimbursement by Fidelity, a fund’s total return will be greater than it would be had the reimbursement not occurred. How a fund did yesterday is no guarantee of how it will do tomorrow.
Average Annual Total Returns
| Periods ended March 31, 2019 | Past 1 year | Life of FundA |
| Fidelity Flex℠ Freedom 2005 Fund | 3.43% | 4.27% |
A Fund commenced operations on June 8, 2017.
$10,000 Over Life of Fund
Let's say hypothetically that $10,000 was invested in Fidelity Flex℠ Freedom 2005 Fund on June 8, 2017, when the fund started.
The chart shows how the value of your investment would have changed, and also shows how the Bloomberg Barclays U.S. Aggregate Bond Index performed over the same period.
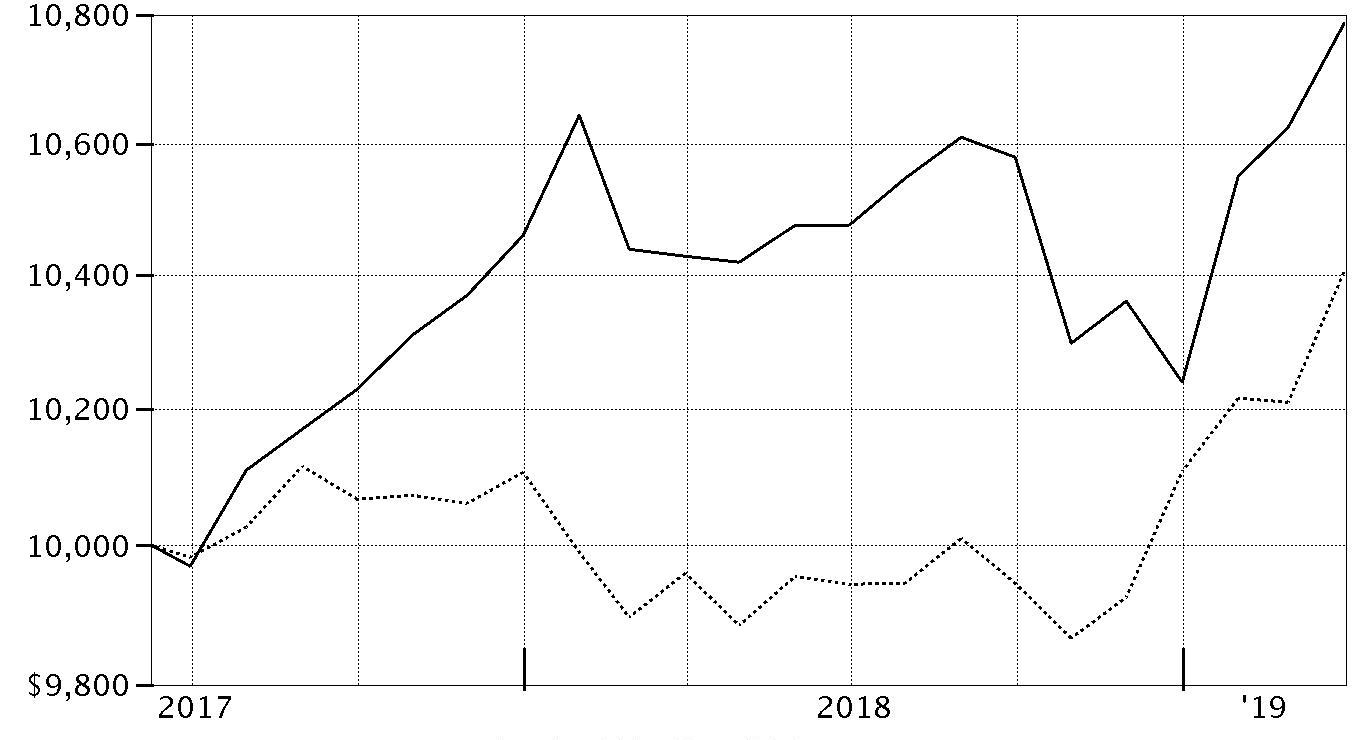
| Period Ending Values |
| $10,787 | Fidelity Flex℠ Freedom 2005 Fund |
| $10,406 | Bloomberg Barclays U.S. Aggregate Bond Index |
Fidelity Flex℠ Freedom 2010 Fund
Performance: The Bottom Line
Average annual total return reflects the change in the value of an investment, assuming reinvestment of distributions from dividend income and capital gains (the profits earned upon the sale of securities that have grown in value, if any) and assuming a constant rate of performance each year. The hypothetical investment and the average annual total returns do not reflect the deduction of taxes that a shareholder would pay on fund distributions or the redemption of fund shares. During periods of reimbursement by Fidelity, a fund’s total return will be greater than it would be had the reimbursement not occurred. How a fund did yesterday is no guarantee of how it will do tomorrow.
Average Annual Total Returns
| Periods ended March 31, 2019 | Past 1 year | Life of FundA |
| Fidelity Flex℠ Freedom 2010 Fund | 3.40% | 4.75% |
A Fund commenced operations on June 8, 2017.
$10,000 Over Life of Fund
Let's say hypothetically that $10,000 was invested in Fidelity Flex℠ Freedom 2010 Fund on June 8, 2017, when the fund started.
The chart shows how the value of your investment would have changed, and also shows how the Bloomberg Barclays U.S. Aggregate Bond Index performed over the same period.

| Period Ending Values |
| $10,877 | Fidelity Flex℠ Freedom 2010 Fund |
| $10,406 | Bloomberg Barclays U.S. Aggregate Bond Index |
Fidelity Flex℠ Freedom 2015 Fund
Performance: The Bottom Line
Average annual total return reflects the change in the value of an investment, assuming reinvestment of distributions from dividend income and capital gains (the profits earned upon the sale of securities that have grown in value, if any) and assuming a constant rate of performance each year. The hypothetical investment and the average annual total returns do not reflect the deduction of taxes that a shareholder would pay on fund distributions or the redemption of fund shares. During periods of reimbursement by Fidelity, a fund’s total return will be greater than it would be had the reimbursement not occurred. How a fund did yesterday is no guarantee of how it will do tomorrow.
Average Annual Total Returns
| Periods ended March 31, 2019 | Past 1 year | Life of FundA |
| Fidelity Flex℠ Freedom 2015 Fund | 3.37% | 5.23% |
A Fund commenced operations on June 8, 2017.
$10,000 Over Life of Fund
Let's say hypothetically that $10,000 was invested in Fidelity Flex℠ Freedom 2015 Fund on June 8, 2017, when the fund started.
The chart shows how the value of your investment would have changed, and also shows how the Bloomberg Barclays U.S. Aggregate Bond Index and the S&P 500® Index performed over the same period.
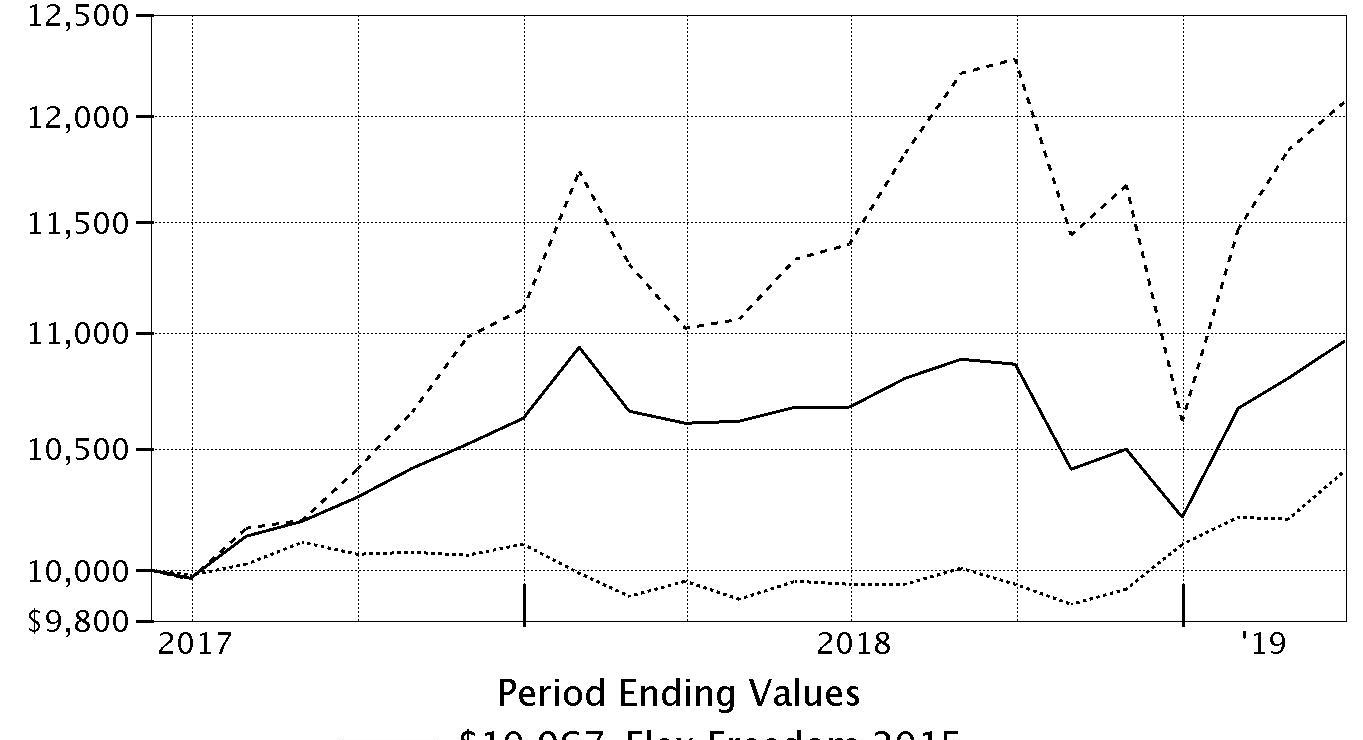
| Period Ending Values |
| $10,967 | Fidelity Flex℠ Freedom 2015 Fund |
| $10,406 | Bloomberg Barclays U.S. Aggregate Bond Index |
| $12,068 | S&P 500® Index |
Going forward, the fund’s performance will be compared to the Bloomberg Barclays U.S. Aggregate Bond Index, rather than the S&P 500® Index. The Bloomberg Barclays U.S. Aggregate Bond Index more closely represents the fund’s investment strategy, as fixed-income and short-term funds currently represent the majority of the fund’s assets.
Fidelity Flex℠ Freedom 2020 Fund
Performance: The Bottom Line
Average annual total return reflects the change in the value of an investment, assuming reinvestment of distributions from dividend income and capital gains (the profits earned upon the sale of securities that have grown in value, if any) and assuming a constant rate of performance each year. The hypothetical investment and the average annual total returns do not reflect the deduction of taxes that a shareholder would pay on fund distributions or the redemption of fund shares. During periods of reimbursement by Fidelity, a fund’s total return will be greater than it would be had the reimbursement not occurred. How a fund did yesterday is no guarantee of how it will do tomorrow.
Average Annual Total Returns
| Periods ended March 31, 2019 | Past 1 year | Life of FundA |
| Fidelity Flex℠ Freedom 2020 Fund | 3.28% | 5.52% |
A Fund commenced operations on June 8, 2017.
$10,000 Over Life of Fund
Let's say hypothetically that $10,000 was invested in Fidelity Flex℠ Freedom 2020 Fund on June 8, 2017, when the fund started.
The chart shows how the value of your investment would have changed, and also shows how the S&P 500® Index performed over the same period.
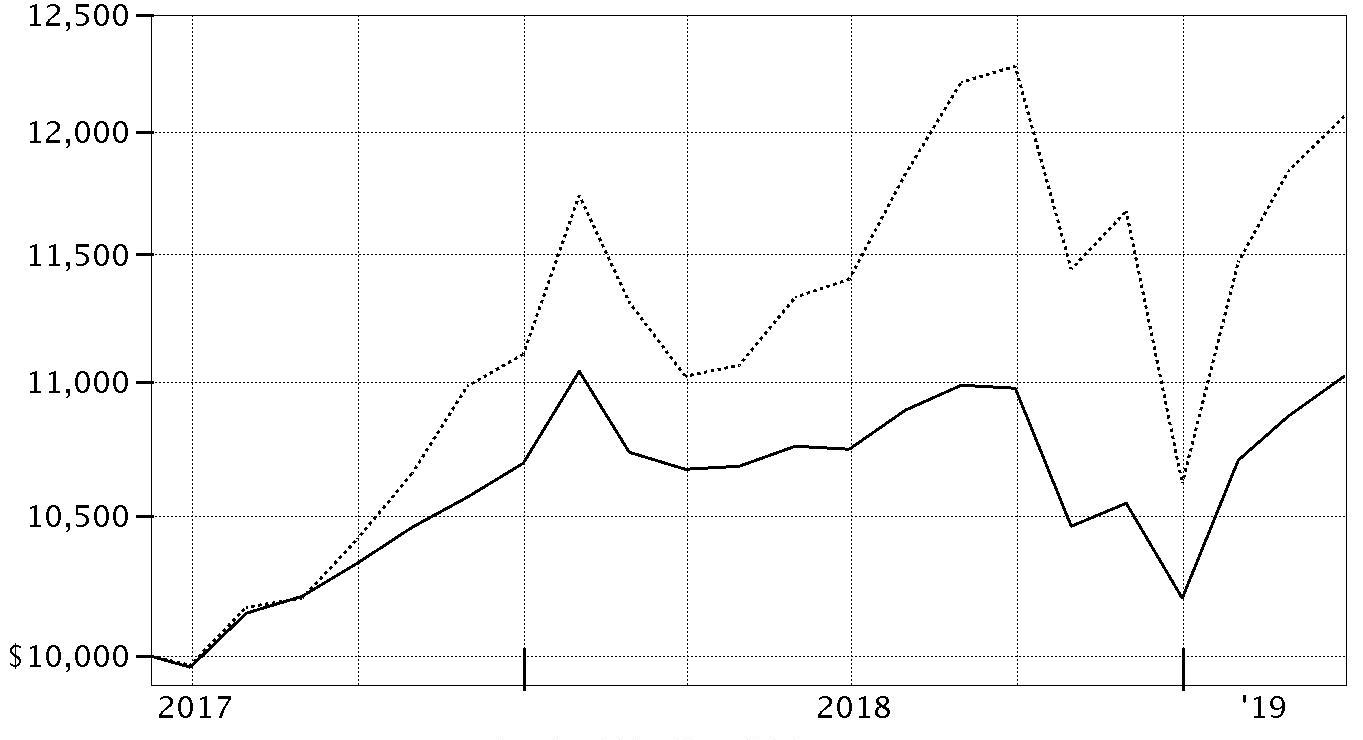
| Period Ending Values |
| $11,022 | Fidelity Flex℠ Freedom 2020 Fund |
| $12,068 | S&P 500® Index |
Fidelity Flex℠ Freedom 2025 Fund
Performance: The Bottom Line
Average annual total return reflects the change in the value of an investment, assuming reinvestment of distributions from dividend income and capital gains (the profits earned upon the sale of securities that have grown in value, if any) and assuming a constant rate of performance each year. The hypothetical investment and the average annual total returns do not reflect the deduction of taxes that a shareholder would pay on fund distributions or the redemption of fund shares. During periods of reimbursement by Fidelity, a fund’s total return will be greater than it would be had the reimbursement not occurred. How a fund did yesterday is no guarantee of how it will do tomorrow.
Average Annual Total Returns
| Periods ended March 31, 2019 | Past 1 year | Life of FundA |
| Fidelity Flex℠ Freedom 2025 Fund | 3.28% | 5.80% |
A Fund commenced operations on June 8, 2017.
$10,000 Over Life of Fund
Let's say hypothetically that $10,000 was invested in Fidelity Flex℠ Freedom 2025 Fund on June 8, 2017, when the fund started.
The chart shows how the value of your investment would have changed, and also shows how the S&P 500® Index performed over the same period.
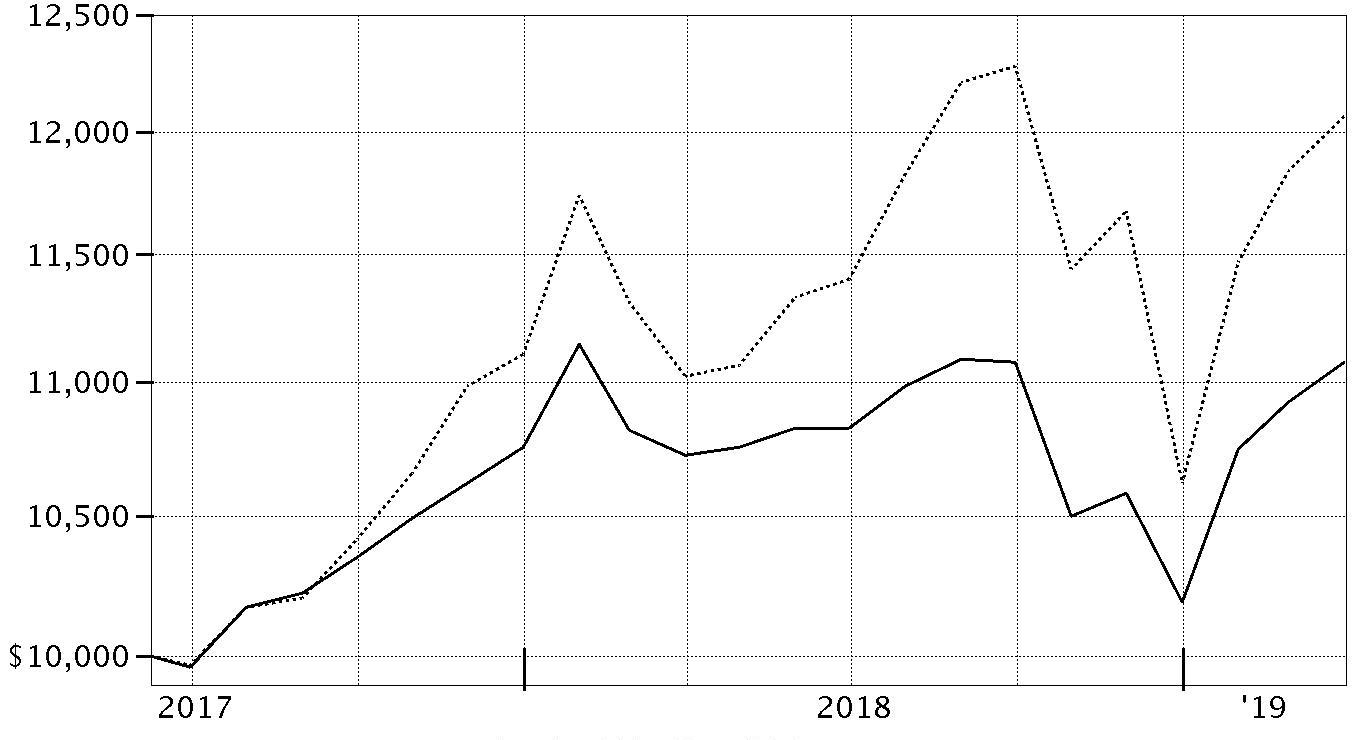
| Period Ending Values |
| $11,076 | Fidelity Flex℠ Freedom 2025 Fund |
| $12,068 | S&P 500® Index |
Fidelity Flex℠ Freedom 2030 Fund
Performance: The Bottom Line
Average annual total return reflects the change in the value of an investment, assuming reinvestment of distributions from dividend income and capital gains (the profits earned upon the sale of securities that have grown in value, if any) and assuming a constant rate of performance each year. The hypothetical investment and the average annual total returns do not reflect the deduction of taxes that a shareholder would pay on fund distributions or the redemption of fund shares. During periods of reimbursement by Fidelity, a fund’s total return will be greater than it would be had the reimbursement not occurred. How a fund did yesterday is no guarantee of how it will do tomorrow.
Average Annual Total Returns
| Periods ended March 31, 2019 | Past 1 year | Life of FundA |
| Fidelity Flex℠ Freedom 2030 Fund | 3.09% | 6.45% |
A Fund commenced operations on June 8, 2017.
$10,000 Over Life of Fund
Let's say hypothetically that $10,000 was invested in Fidelity Flex℠ Freedom 2030 Fund on June 8, 2017, when the fund started.
The chart shows how the value of your investment would have changed, and also shows how the S&P 500® Index performed over the same period.

| Period Ending Values |
| $11,199 | Fidelity Flex℠ Freedom 2030 Fund |
| $12,068 | S&P 500® Index |
Fidelity Flex℠ Freedom 2035 Fund
Performance: The Bottom Line
Average annual total return reflects the change in the value of an investment, assuming reinvestment of distributions from dividend income and capital gains (the profits earned upon the sale of securities that have grown in value, if any) and assuming a constant rate of performance each year. The hypothetical investment and the average annual total returns do not reflect the deduction of taxes that a shareholder would pay on fund distributions or the redemption of fund shares. During periods of reimbursement by Fidelity, a fund’s total return will be greater than it would be had the reimbursement not occurred. How a fund did yesterday is no guarantee of how it will do tomorrow.
Average Annual Total Returns
| Periods ended March 31, 2019 | Past 1 year | Life of FundA |
| Fidelity Flex℠ Freedom 2035 Fund | 2.75% | 6.87% |
A Fund commenced operations on June 8, 2017.
$10,000 Over Life of Fund
Let's say hypothetically that $10,000 was invested in Fidelity Flex℠ Freedom 2035 Fund on June 8, 2017, when the fund started.
The chart shows how the value of your investment would have changed, and also shows how the S&P 500® Index performed over the same period.
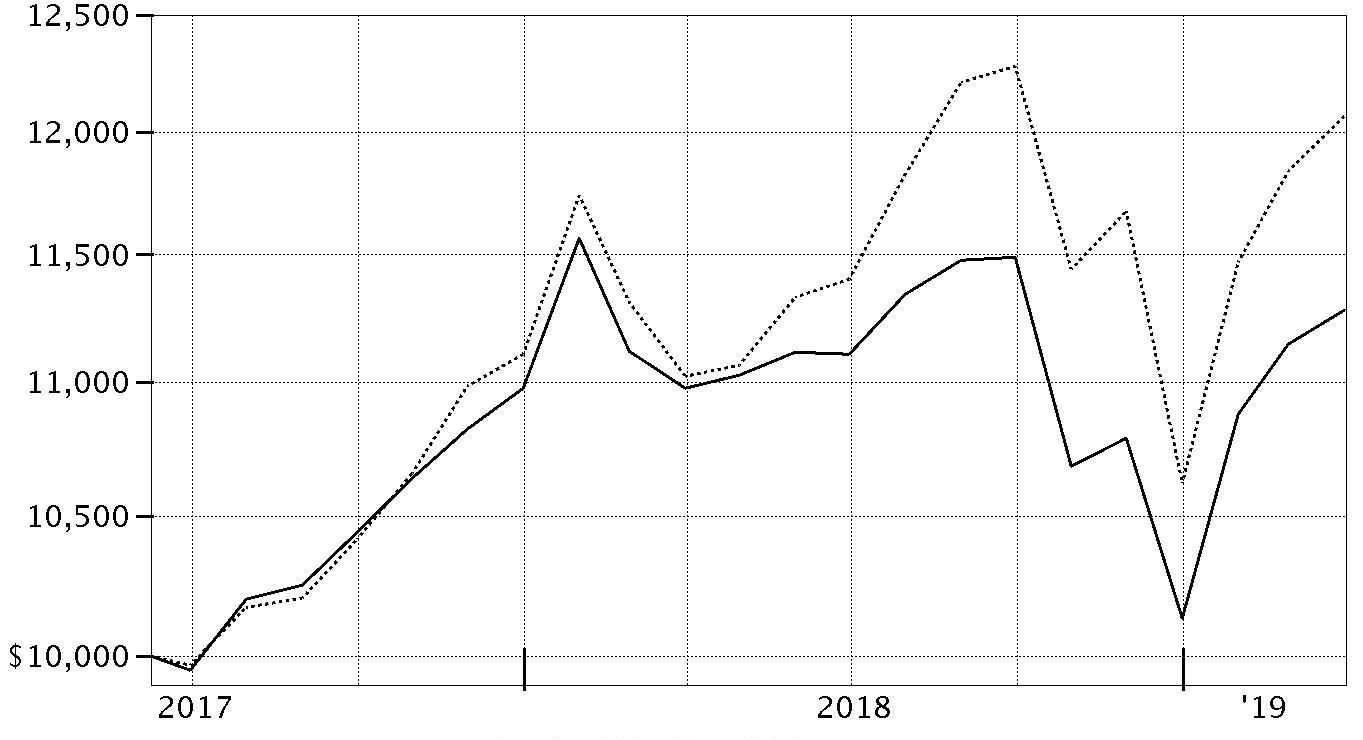
| Period Ending Values |
| $11,279 | Fidelity Flex℠ Freedom 2035 Fund |
| $12,068 | S&P 500® Index |
Fidelity Flex℠ Freedom 2040 Fund
Performance: The Bottom Line
Average annual total return reflects the change in the value of an investment, assuming reinvestment of distributions from dividend income and capital gains (the profits earned upon the sale of securities that have grown in value, if any) and assuming a constant rate of performance each year. The hypothetical investment and the average annual total returns do not reflect the deduction of taxes that a shareholder would pay on fund distributions or the redemption of fund shares. During periods of reimbursement by Fidelity, a fund’s total return will be greater than it would be had the reimbursement not occurred. How a fund did yesterday is no guarantee of how it will do tomorrow.
Average Annual Total Returns
| Periods ended March 31, 2019 | Past 1 year | Life of FundA |
| Fidelity Flex℠ Freedom 2040 Fund | 2.57% | 6.83% |
A Fund commenced operations on June 8, 2017.
$10,000 Over Life of Fund
Let's say hypothetically that $10,000 was invested in Fidelity Flex℠ Freedom 2040 Fund on June 8, 2017, when the fund started.
The chart shows how the value of your investment would have changed, and also shows how the S&P 500® Index performed over the same period.

| Period Ending Values |
| $11,271 | Fidelity Flex℠ Freedom 2040 Fund |
| $12,068 | S&P 500® Index |
Fidelity Flex℠ Freedom 2045 Fund
Performance: The Bottom Line
Average annual total return reflects the change in the value of an investment, assuming reinvestment of distributions from dividend income and capital gains (the profits earned upon the sale of securities that have grown in value, if any) and assuming a constant rate of performance each year. The hypothetical investment and the average annual total returns do not reflect the deduction of taxes that a shareholder would pay on fund distributions or the redemption of fund shares. During periods of reimbursement by Fidelity, a fund’s total return will be greater than it would be had the reimbursement not occurred. How a fund did yesterday is no guarantee of how it will do tomorrow.
Average Annual Total Returns
| Periods ended March 31, 2019 | Past 1 year | Life of FundA |
| Fidelity Flex℠ Freedom 2045 Fund | 2.55% | 6.83% |
A Fund commenced operations on June 8, 2017.
$10,000 Over Life of Fund
Let's say hypothetically that $10,000 was invested in Fidelity Flex℠ Freedom 2045 Fund on June 8, 2017, when the fund started.
The chart shows how the value of your investment would have changed, and also shows how the S&P 500® Index performed over the same period.

| Period Ending Values |
| $11,271 | Fidelity Flex℠ Freedom 2045 Fund |
| $12,068 | S&P 500® Index |
Fidelity Flex℠ Freedom 2050 Fund
Performance: The Bottom Line
Average annual total return reflects the change in the value of an investment, assuming reinvestment of distributions from dividend income and capital gains (the profits earned upon the sale of securities that have grown in value, if any) and assuming a constant rate of performance each year. The hypothetical investment and the average annual total returns do not reflect the deduction of taxes that a shareholder would pay on fund distributions or the redemption of fund shares. During periods of reimbursement by Fidelity, a fund’s total return will be greater than it would be had the reimbursement not occurred. How a fund did yesterday is no guarantee of how it will do tomorrow.
Average Annual Total Returns
| Periods ended March 31, 2019 | Past 1 year | Life of FundA |
| Fidelity Flex℠ Freedom 2050 Fund | 2.55% | 6.82% |
A Fund commenced operations on June 8, 2017.
$10,000 Over Life of Fund
Let's say hypothetically that $10,000 was invested in Fidelity Flex℠ Freedom 2050 Fund on June 8, 2017, when the fund started.
The chart shows how the value of your investment would have changed, and also shows how the S&P 500® Index performed over the same period.

| Period Ending Values |
| $11,269 | Fidelity Flex℠ Freedom 2050 Fund |
| $12,068 | S&P 500® Index |
Fidelity Flex℠ Freedom 2055 Fund
Performance: The Bottom Line
Average annual total return reflects the change in the value of an investment, assuming reinvestment of distributions from dividend income and capital gains (the profits earned upon the sale of securities that have grown in value, if any) and assuming a constant rate of performance each year. The hypothetical investment and the average annual total returns do not reflect the deduction of taxes that a shareholder would pay on fund distributions or the redemption of fund shares. During periods of reimbursement by Fidelity, a fund’s total return will be greater than it would be had the reimbursement not occurred. How a fund did yesterday is no guarantee of how it will do tomorrow.
Average Annual Total Returns
| Periods ended March 31, 2019 | Past 1 year | Life of FundA |
| Fidelity Flex℠ Freedom 2055 Fund | 2.56% | 6.83% |
A Fund commenced operations on June 8, 2017.
$10,000 Over Life of Fund
Let's say hypothetically that $10,000 was invested in Fidelity Flex℠ Freedom 2055 Fund on June 8, 2017, when the fund started.
The chart shows how the value of your investment would have changed, and also shows how the S&P 500® Index performed over the same period.
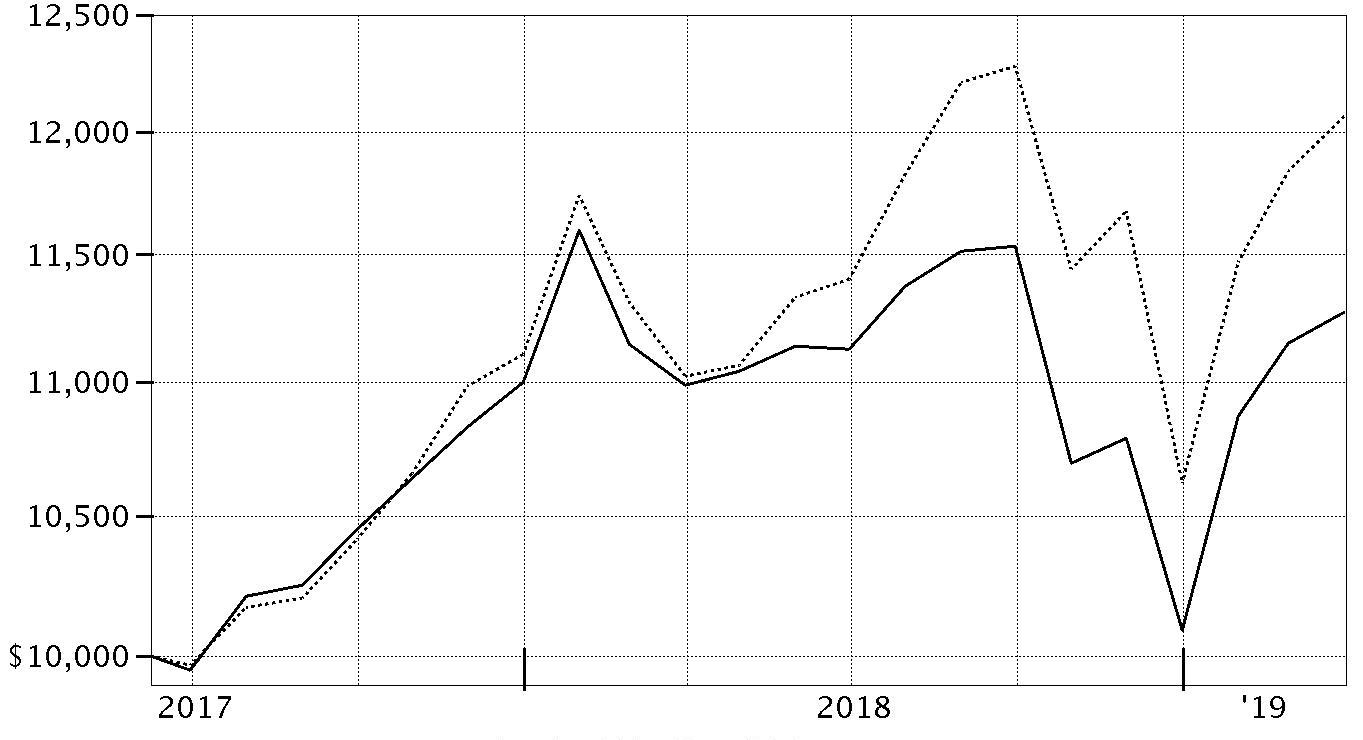
| Period Ending Values |
| $11,271 | Fidelity Flex℠ Freedom 2055 Fund |
| $12,068 | S&P 500® Index |
Fidelity Flex℠ Freedom 2060 Fund
Performance: The Bottom Line
Average annual total return reflects the change in the value of an investment, assuming reinvestment of distributions from dividend income and capital gains (the profits earned upon the sale of securities that have grown in value, if any) and assuming a constant rate of performance each year. The hypothetical investment and the average annual total returns do not reflect the deduction of taxes that a shareholder would pay on fund distributions or the redemption of fund shares. During periods of reimbursement by Fidelity, a fund’s total return will be greater than it would be had the reimbursement not occurred. How a fund did yesterday is no guarantee of how it will do tomorrow.
Average Annual Total Returns
| Periods ended March 31, 2019 | Past 1 year | Life of FundA |
| Fidelity Flex℠ Freedom 2060 Fund | 2.55% | 6.82% |
A Fund commenced operations on June 8, 2017.
$10,000 Over Life of Fund
Let's say hypothetically that $10,000 was invested in Fidelity Flex℠ Freedom 2060 Fund on June 8, 2017, when the fund started.
The chart shows how the value of your investment would have changed, and also shows how the S&P 500® Index performed over the same period.

| Period Ending Values |
| $11,269 | Fidelity Flex℠ Freedom 2060 Fund |
| $12,068 | S&P 500® Index |
Management's Discussion of Fund Performance
Market Recap: The global economy remained in expansion for the 12 months ending March 31, 2019, but growth was less synchronous and uneven. Many major economies progressed toward more-advanced stages of the business cycle. Financial markets responded favorably to the U.S. Federal Reserve’s shift away from its monetary tightening bias in the first quarter of 2019. Most economic indicators remained tepid, although China displayed some initial signs of stabilizing activity, and stepped up the pace of fiscal and monetary stimulus in the first quarter. Against this backdrop, the MSCI World ex USA Index of non-U.S. equity markets returned -2.91% for the year. Much of the negative impact came in the volatile fourth quarter of 2018, when the index returned -13%, followed by a sharp rebound to begin 2019. Among regions in the index, stocks in resource-rich Canada gained 4%, benefiting from rising crude-oil prices early and late in the period, while Asia Pacific ex Japan (+4%) was aided by stabilizing returns in Hong Kong, which rose 8%. Conversely, stocks in Japan (-8%), emerging markets (0%) and Europe ex U.K. (-4%) lagged. Results at home were markedly better. The U.S. equity bellwether S&P 500
® index rose 9.50%. Nine of 11 sectors in the S&P 500
® had a positive return. Three defensive sectors stood out: real estate (+21%), utilities (+19%) and health care (+15%). Conversely, some economically sensitive sectors struggled, with financials (-5%) faring worst. The small-cap-oriented Russell 2000
® Index gained 2.05% for the 12 months. Commodities also lagged, as evidenced by the -5.25% result of the Bloomberg Barclays Commodity Index Total Return. U.S. investment-grade bonds gained 4.48%, according to the Bloomberg Barclays U.S. Aggregate Bond Index, largely driven by surging returns for credit-sensitive sectors. U.S. corporate bonds increased 4.89%, according to the Bloomberg Barclays Credit Bond Index. Elsewhere, securitized sectors fared well, led by commercial mortgage-backed securities (+5.43%). Agency bonds and Treasury Inflation-Protected Securities (TIPS) lagged, as measured by the 3.73% return of the Bloomberg Barclays Agency Bond Index and the 2.70% advance of the Bloomberg Barclays U.S. Treasury Inflation-Protected Securities Index (Series-L), respectively.
Comments from Co-Portfolio Managers Andrew Dierdorf and Brett Sumsion: For the fiscal year ending March 31, 2019, shares of each Fidelity Flex Freedom
® Fund posted a gain, ranging from 3.63% for Fidelity Flex Freedom Income Fund to 2.55% for Fidelity Flex Freedom 2060 Fund. Each Fund lagged its respective Composite index by roughly 1 to 2 percentage points. Both underlying investment performance and top-down active asset allocation were responsible for the Funds' underperformance of Composites. In terms of investment performance, returns among underlying U.S. equity funds detracted most. Most notable was an investment in Fidelity Series Intrinsic Opportunities Fund, which trailed its benchmark, the Russell 3000
® Index, by nearly 10 percentage points the past year because the manager's value-oriented investment style was out of favor. To a lesser extent, the Funds' overall exposure to non-U.S. equities also hurt relative performance, as returns here lagged the -4.04% return of the MSCI All Country World ex U.S.A. Index, the Composites' benchmark for the asset class. Conversely, the performance of the Funds' underlying investment-grade bond investments added value versus Composites. From an active asset allocation perspective, non-Composite exposure to commodities held back the Funds' results most. Overweighting emerging-markets funds also detracted, as did underweighting U.S. equities – one of the better-performing asset classes. Intra-asset allocation decisions – investments made within the major asset classes (equities and fixed-income) – also had a negative influence on the Funds’ relative results. In particular, allocations within U.S. equities and non U.S.-equities proved disappointing the past year.
The views expressed above reflect those of the portfolio manager(s) only through the end of the period as stated on the cover of this report and do not necessarily represent the views of Fidelity or any other person in the Fidelity organization. Any such views are subject to change at any time based upon market or other conditions and Fidelity disclaims any responsibility to update such views. These views may not be relied on as investment advice and, because investment decisions for a Fidelity fund are based on numerous factors, may not be relied on as an indication of trading intent on behalf of any Fidelity fund.
Notes to Shareholders: At its May 2018 meeting, the Board of Trustees approved incremental updates to the glide path and strategic asset allocation of Fidelity Flex Freedom Funds, adding U.S. Treasury Inflation-Protected Securities and long-term U.S. Treasury bonds, and slightly reducing the equity and short-term debt allocations for shorter-dated Funds. These updates have been fully implemented. At its May 2019 meeting, the Board of Trustees approved adjusting the equity composition of the strategic asset allocation from 70%/30% to 60%/40% for U.S./non-U.S. equities.
Fidelity Flex℠ Freedom Income Fund
Investment Summary (Unaudited)
The information in the following tables is based on the direct investments of the Fund.
Top Holdings as of March 31, 2019
| | % of fund's net assets |
| Fidelity Series Investment Grade Bond Fund | 37.4 |
| Fidelity Series Government Money Market Fund 2.50% | 17.8 |
| Fidelity Series Inflation-Protected Bond Index Fund | 13.3 |
| Fidelity Series Long-Term Treasury Bond Index Fund | 4.5 |
| Fidelity Series Short-Term Credit Fund | 4.5 |
| Fidelity Series Emerging Markets Opportunities Fund | 3.2 |
| Fidelity Series Commodity Strategy Fund | 3.0 |
| Fidelity Series International Growth Fund | 2.3 |
| Fidelity Series International Value Fund | 2.3 |
| Fidelity Series Intrinsic Opportunities Fund | 1.5 |
| | 89.8 |
Asset Allocation (% of fund's net assets)
| Period end |
| | Domestic Equity Funds | 11.3% |
| | International Equity Funds | 9.0% |
| | Bond Funds | 57.4% |
| | Short-Term Funds | 22.3% |

Domestic Equity Funds category includes Fidelity Series Commodity Strategy Fund which invests in commodity-related investments.
Fidelity Flex℠ Freedom Income Fund
Schedule of Investments March 31, 2019
Showing Percentage of Net Assets
| Domestic Equity Funds - 11.3% | | | |
| | | Shares | Value |
| Fidelity Series All-Sector Equity Fund (a) | | 37 | $354 |
| Fidelity Series Blue Chip Growth Fund (a) | | 44 | 649 |
| Fidelity Series Commodity Strategy Fund (a) | | 669 | 3,191 |
| Fidelity Series Growth Company Fund (a) | | 77 | 1,298 |
| Fidelity Series Intrinsic Opportunities Fund (a) | | 97 | 1,595 |
| Fidelity Series Large Cap Stock Fund (a) | | 94 | 1,380 |
| Fidelity Series Large Cap Value Index Fund (a) | | 31 | 386 |
| Fidelity Series Opportunistic Insights Fund (a) | | 40 | 698 |
| Fidelity Series Small Cap Discovery Fund (a) | | 17 | 187 |
| Fidelity Series Small Cap Opportunities Fund (a) | | 43 | 573 |
| Fidelity Series Stock Selector Large Cap Value Fund (a) | | 89 | 1,051 |
| Fidelity Series Value Discovery Fund (a) | | 60 | 743 |
| TOTAL DOMESTIC EQUITY FUNDS | | | |
| (Cost $12,329) | | | 12,105 |
|
| International Equity Funds - 9.0% | | | |
| Fidelity Series Canada Fund (a) | | 26 | 267 |
| Fidelity Series Emerging Markets Fund (a) | | 39 | 379 |
| Fidelity Series Emerging Markets Opportunities Fund (a) | | 185 | 3,431 |
| Fidelity Series International Growth Fund (a) | | 164 | 2,489 |
| Fidelity Series International Small Cap Fund (a) | | 38 | 597 |
| Fidelity Series International Value Fund (a) | | 266 | 2,473 |
| TOTAL INTERNATIONAL EQUITY FUNDS | | | |
| (Cost $9,919) | | | 9,636 |
|
| Bond Funds - 57.4% | | | |
| Fidelity Series Emerging Markets Debt Fund (a) | | 78 | 750 |
| Fidelity Series Floating Rate High Income Fund (a) | | 17 | 161 |
| Fidelity Series High Income Fund (a) | | 86 | 805 |
| Fidelity Series Inflation-Protected Bond Index Fund (a) | | 1,455 | 14,228 |
| Fidelity Series International Credit Fund (a) | | 6 | 54 |
| Fidelity Series Investment Grade Bond Fund (a) | | 3,569 | 39,905 |
| Fidelity Series Long-Term Treasury Bond Index Fund (a) | | 547 | 4,854 |
| Fidelity Series Real Estate Income Fund (a) | | 46 | 501 |
| TOTAL BOND FUNDS | | | |
| (Cost $61,475) | | | 61,258 |
|
| Short-Term Funds - 22.3% | | | |
| Fidelity Series Government Money Market Fund 2.50% (a)(b) | | 19,073 | 19,073 |
| Fidelity Series Short-Term Credit Fund (a) | | 478 | 4,769 |
| TOTAL SHORT-TERM FUNDS | | | |
| (Cost $23,846) | | | 23,842 |
| TOTAL INVESTMENT IN SECURITIES - 100.0% | | | |
| (Cost $107,569) | | | 106,841 |
| NET OTHER ASSETS (LIABILITIES) - 0.0% | | | (2) |
| NET ASSETS - 100% | | | $106,839 |
Legend
(a) Affiliated Fund
(b) The rate quoted is the annualized seven-day yield of the fund at period end.
Affiliated Underlying Funds
Fiscal year to date information regarding the Fund's investments in affiliated Underlying Funds, excluding any Money Market Central Funds, is presented below. Exchanges between classes of the same affiliated Underlying Funds may occur.
| Affiliate | Value, beginning of period | Purchases | Sales Proceeds | Dividend Income | Realized Gain (loss) | Change in Unrealized appreciation (depreciation) | Value, end of period |
| Fidelity Series 100 Index Fund | $443 | $-- | $460 | $-- | $48 | $(31) | $-- |
| Fidelity Series All-Sector Equity Fund | 849 | 136 | 617 | 88 | 7 | (21) | 354 |
| Fidelity Series Blue Chip Growth Fund | 878 | 195 | 483 | 88 | 42 | 17 | 649 |
| Fidelity Series Canada Fund | 259 | 90 | 90 | 6 | -- | 8 | 267 |
| Fidelity Series Commodity Strategy Fund | 2,193 | 1,599 | 349 | 133 | (3) | (249) | 3,191 |
| Fidelity Series Emerging Markets Debt Fund | 782 | 170 | 164 | 46 | (14) | (24) | 750 |
| Fidelity Series Emerging Markets Fund | -- | 384 | 10 | 1 | -- | 5 | 379 |
| Fidelity Series Emerging Markets Opportunities Fund | 3,179 | 1,636 | 931 | 276 | (5) | (448) | 3,431 |
| Fidelity Series Floating Rate High Income Fund | 250 | 26 | 108 | 16 | (3) | (4) | 161 |
| Fidelity Series Government Money Market Fund 2.50% | 23,960 | 3,597 | 8,484 | 438 | -- | -- | 19,073 |
| Fidelity Series Growth Company Fund | 1,755 | 418 | 908 | 145 | 89 | (56) | 1,298 |
| Fidelity Series High Income Fund | 1,552 | 98 | 827 | 93 | (23) | 5 | 805 |
| Fidelity Series Inflation-Protected Bond Index Fund | 3,913 | 10,286 | 37 | 247 | (1) | 67 | 14,228 |
| Fidelity Series International Credit Fund | 38 | 16 | -- | 3 | -- | -- | 54 |
| Fidelity Series International Growth Fund | 2,691 | 854 | 941 | 158 | (1) | (114) | 2,489 |
| Fidelity Series International Small Cap Fund | 668 | 223 | 200 | 52 | (2) | (92) | 597 |
| Fidelity Series International Value Fund | 2,640 | 674 | 544 | 86 | (4) | (293) | 2,473 |
| Fidelity Series Intrinsic Opportunities Fund | 2,156 | 309 | 751 | 130 | 60 | (179) | 1,595 |
| Fidelity Series Investment Grade Bond Fund | 39,273 | 2,308 | 2,251 | 1,277 | (42) | 617 | 39,905 |
| Fidelity Series Large Cap Stock Fund | 1,920 | 373 | 901 | 159 | 39 | (51) | 1,380 |
| Fidelity Series Large Cap Value Index Fund | 550 | 71 | 248 | 18 | 12 | 1 | 386 |
| Fidelity Series Long-Term Treasury Bond Index Fund | 2,147 | 3,453 | 942 | 108 | (41) | 237 | 4,854 |
| Fidelity Series Opportunistic Insights Fund | 962 | 159 | 458 | 61 | 30 | 5 | 698 |
| Fidelity Series Real Estate Equity Fund | 173 | 8 | 189 | 3 | (9) | 17 | -- |
| Fidelity Series Real Estate Income Fund | 472 | 46 | 26 | 37 | (1) | 10 | 501 |
| Fidelity Series Short-Term Credit Fund | 5,864 | 626 | 1,774 | 133 | (21) | 74 | 4,769 |
| Fidelity Series Small Cap Discovery Fund | 262 | 51 | 110 | 28 | 1 | (17) | 187 |
| Fidelity Series Small Cap Opportunities Fund | 799 | 155 | 376 | 68 | 13 | (18) | 573 |
| Fidelity Series Stock Selector Large Cap Value Fund | 1,499 | 190 | 621 | 92 | 1 | (18) | 1,051 |
| Fidelity Series Value Discovery Fund | 1,065 | 138 | 453 | 46 | 4 | (11) | 743 |
| Total | $103,192 | $28,289 | $24,253 | $4,036 | $176 | $(563) | $106,841 |
Amounts in the income column in the above table include any capital gain distributions from underlying funds, which are presented in the corresponding line-item in the Statement of Operations, if applicable.
Investment Valuation
All investments are categorized as Level 1 under the Fair Value Hierarchy. The inputs or methodology used for valuing securities may not be an indication of the risk associated with investing in those securities. For more information on valuation inputs please refer to the Investment Valuation section in the accompanying Notes to Financial Statements.
See accompanying notes which are an integral part of the financial statements.
Fidelity Flex℠ Freedom Income Fund
Financial Statements
Statement of Assets and Liabilities
| | | March 31, 2019 |
| Assets | | |
Investment in securities, at value — See accompanying schedule:
| | |
| Affiliated issuers (cost $107,569) | $106,841 | |
| Total Investment in Securities (cost $107,569) | | $106,841 |
| Receivable for investments sold | | 1,001 |
| Total assets | | 107,842 |
| Liabilities | | |
| Payable for investments purchased | $1,003 | |
| Total liabilities | | 1,003 |
| Net Assets | | $106,839 |
| Net Assets consist of: | | |
| Paid in capital | | $106,723 |
| Total distributable earnings (loss) | | 116 |
| Net Assets, for 10,678 shares outstanding | | $106,839 |
| Net Asset Value, offering price and redemption price per share ($106,839 ÷ 10,678 shares) | | $10.01 |
See accompanying notes which are an integral part of the financial statements.
Statement of Operations
| | | Year ended March 31, 2019 |
| Investment Income | | |
| Dividends: | | |
| Affiliated issuers | | $2,606 |
| Expenses | | |
| Independent trustees' fees and expenses | $1 | |
| Total expenses | | 1 |
| Net investment income (loss) | | 2,605 |
| Realized and Unrealized Gain (Loss) | | |
| Net realized gain (loss) on: | | |
| Investment securities: | | |
| Affiliated issuers | 176 | |
| Capital gain distributions from underlying funds: | | |
| Affiliated issuers | 1,430 | |
| Total net realized gain (loss) | | 1,606 |
| Change in net unrealized appreciation (depreciation) on: | | |
| Investment securities: | | |
| Affiliated issuers | (563) | |
| Total change in net unrealized appreciation (depreciation) | | (563) |
| Net gain (loss) | | 1,043 |
| Net increase (decrease) in net assets resulting from operations | | $3,648 |
See accompanying notes which are an integral part of the financial statements.
Statement of Changes in Net Assets
| | Year ended March 31, 2019 | For the period
June 8, 2017 (commencement of operations) to March 31, 2018 |
| Increase (Decrease) in Net Assets | | |
| Operations | | |
| Net investment income (loss) | $2,605 | $1,843 |
| Net realized gain (loss) | 1,606 | 1,513 |
| Change in net unrealized appreciation (depreciation) | (563) | (165) |
| Net increase (decrease) in net assets resulting from operations | 3,648 | 3,191 |
| Distributions to shareholders | (4,468) | – |
| Distributions to shareholders from net investment income | – | (1,651) |
| Distributions to shareholders from net realized gain | – | (604) |
| Total distributions | (4,468) | (2,255) |
| Share transactions | | |
| Proceeds from sales of shares | – | 100,000 |
| Reinvestment of distributions | 4,468 | 2,255 |
| Net increase (decrease) in net assets resulting from share transactions | 4,468 | 102,255 |
| Total increase (decrease) in net assets | 3,648 | 103,191 |
| Net Assets | | |
| Beginning of period | 103,191 | – |
| End of period | $106,839 | $103,191 |
| Other Information | | |
| Undistributed net investment income end of period | | $192 |
| Shares | | |
| Sold | – | 10,000 |
| Issued in reinvestment of distributions | 456 | 222 |
| Net increase (decrease) | 456 | 10,222 |
See accompanying notes which are an integral part of the financial statements.
Financial Highlights
Fidelity Flex Freedom Income Fund
| | | |
| Years ended March 31, | 2019 | 2018 A |
| Selected Per–Share Data | | |
| Net asset value, beginning of period | $10.09 | $10.00 |
| Income from Investment Operations | | |
| Net investment income (loss)B | .25 | .18 |
| Net realized and unrealized gain (loss) | .10 | .13 |
| Total from investment operations | .35 | .31 |
| Distributions from net investment income | (.25) | (.16) |
| Distributions from net realized gain | (.18) | (.06) |
| Total distributions | (.43) | (.22) |
| Net asset value, end of period | $10.01 | $10.09 |
| Total ReturnC | 3.63% | 3.14% |
| Ratios to Average Net AssetsD,E | | |
| Expenses before reductions | - %F | - %G |
| Expenses net of fee waivers, if any | - %F | - %G |
| Expenses net of all reductions | - %F | - %G |
| Net investment income (loss) | 2.51% | 2.21%G |
| Supplemental Data | | |
| Net assets, end of period (000 omitted) | $107 | $103 |
| Portfolio turnover rateD | 23% | 10%G |
A For the period June 8, 2017 (commencement of operations) to March 31, 2018.
B Calculated based on average shares outstanding during the period.
C Total returns for periods of less than one year are not annualized.
D Amounts do not include the activity of the Underlying Funds.
E Expense ratios reflect operating expenses of the Fund. Expenses before reductions do not reflect amounts reimbursed by the investment adviser or reductions from expense offset arrangements and do not represent the amount paid by the Fund during periods when reimbursements or reductions occur. Expenses net of fee waivers reflect expenses after reimbursement by the investment adviser but prior to reductions from expense offset arrangements. Expenses net of all reductions represent the net expenses paid by the Fund but do not include expenses of the underlying funds in which the Fund invests.
F Amount represents less than .005%.
G Annualized
See accompanying notes which are an integral part of the financial statements.
Fidelity Flex℠ Freedom 2005 Fund
Investment Summary (Unaudited)
The information in the following tables is based on the direct investments of the Fund.
Top Holdings as of March 31, 2019
| | % of fund's net assets |
| Fidelity Series Investment Grade Bond Fund | 34.5 |
| Fidelity Series Government Money Market Fund 2.50% | 14.9 |
| Fidelity Series Inflation-Protected Bond Index Fund | 11.5 |
| Fidelity Series Long-Term Treasury Bond Index Fund | 4.7 |
| Fidelity Series Emerging Markets Opportunities Fund | 4.0 |
| Fidelity Series Short-Term Credit Fund | 3.7 |
| Fidelity Series International Growth Fund | 3.1 |
| Fidelity Series International Value Fund | 3.1 |
| Fidelity Series Commodity Strategy Fund | 3.0 |
| Fidelity Series Intrinsic Opportunities Fund | 2.5 |
| | 85.0 |
Asset Allocation (% of fund's net assets)
| Period end |
| | Domestic Equity Funds | 16.9% |
| | International Equity Funds | 11.6% |
| | Bond Funds | 52.9% |
| | Short-Term Funds | 18.6% |

Domestic Equity Funds category includes Fidelity Series Commodity Strategy Fund which invests in commodity-related investments.
Fidelity Flex℠ Freedom 2005 Fund
Schedule of Investments March 31, 2019
Showing Percentage of Net Assets
| Domestic Equity Funds - 16.9% | | | |
| | | Shares | Value |
| Fidelity Series All-Sector Equity Fund (a) | | 62 | $599 |
| Fidelity Series Blue Chip Growth Fund (a) | | 73 | 1,076 |
| Fidelity Series Commodity Strategy Fund (a) | | 675 | 3,221 |
| Fidelity Series Growth Company Fund (a) | | 129 | 2,181 |
| Fidelity Series Intrinsic Opportunities Fund (a) | | 163 | 2,679 |
| Fidelity Series Large Cap Stock Fund (a) | | 159 | 2,323 |
| Fidelity Series Large Cap Value Index Fund (a) | | 52 | 649 |
| Fidelity Series Opportunistic Insights Fund (a) | | 67 | 1,173 |
| Fidelity Series Small Cap Discovery Fund (a) | | 28 | 313 |
| Fidelity Series Small Cap Opportunities Fund (a) | | 72 | 963 |
| Fidelity Series Stock Selector Large Cap Value Fund (a) | | 150 | 1,768 |
| Fidelity Series Value Discovery Fund (a) | | 100 | 1,253 |
| TOTAL DOMESTIC EQUITY FUNDS | | | |
| (Cost $18,493) | | | 18,198 |
|
| International Equity Funds - 11.6% | | | |
| Fidelity Series Canada Fund (a) | | 35 | 357 |
| Fidelity Series Emerging Markets Fund (a) | | 49 | 475 |
| Fidelity Series Emerging Markets Opportunities Fund (a) | | 232 | 4,295 |
| Fidelity Series International Growth Fund (a) | | 219 | 3,325 |
| Fidelity Series International Small Cap Fund (a) | | 51 | 797 |
| Fidelity Series International Value Fund (a) | | 355 | 3,303 |
| TOTAL INTERNATIONAL EQUITY FUNDS | | | |
| (Cost $12,950) | | | 12,552 |
|
| Bond Funds - 52.9% | | | |
| Fidelity Series Emerging Markets Debt Fund (a) | | 79 | 757 |
| Fidelity Series Floating Rate High Income Fund (a) | | 17 | 162 |
| Fidelity Series High Income Fund (a) | | 86 | 812 |
| Fidelity Series Inflation-Protected Bond Index Fund (a) | | 1,268 | 12,403 |
| Fidelity Series International Credit Fund (a) | | 6 | 55 |
| Fidelity Series Investment Grade Bond Fund (a) | | 3,331 | 37,236 |
| Fidelity Series Long-Term Treasury Bond Index Fund (a) | | 573 | 5,082 |
| Fidelity Series Real Estate Income Fund (a) | | 46 | 506 |
| TOTAL BOND FUNDS | | | |
| (Cost $57,198) | | | 57,013 |
|
| Short-Term Funds - 18.6% | | | |
| Fidelity Series Government Money Market Fund 2.50% (a)(b) | | 16,087 | 16,087 |
| Fidelity Series Short-Term Credit Fund (a) | | 403 | 4,023 |
| TOTAL SHORT-TERM FUNDS | | | |
| (Cost $20,110) | | | 20,110 |
| TOTAL INVESTMENT IN SECURITIES - 100.0% | | | |
| (Cost $108,751) | | | 107,873 |
| NET OTHER ASSETS (LIABILITIES) - 0.0% | | | 0 |
| NET ASSETS - 100% | | | $107,873 |
Legend
(a) Affiliated Fund
(b) The rate quoted is the annualized seven-day yield of the fund at period end.
Affiliated Underlying Funds
Fiscal year to date information regarding the Fund's investments in affiliated Underlying Funds, excluding any Money Market Central Funds, is presented below. Exchanges between classes of the same affiliated Underlying Funds may occur.
| Affiliate | Value, beginning of period | Purchases | Sales Proceeds | Dividend Income | Realized Gain (loss) | Change in Unrealized appreciation (depreciation) | Value, end of period |
| Fidelity Series 100 Index Fund | $668 | $-- | $690 | $-- | $68 | $(46) | $-- |
| Fidelity Series All-Sector Equity Fund | 1,281 | 217 | 856 | 153 | 6 | (49) | 599 |
| Fidelity Series Blue Chip Growth Fund | 1,338 | 285 | 625 | 148 | 46 | 32 | 1,076 |
| Fidelity Series Canada Fund | 351 | 96 | 99 | 8 | -- | 9 | 357 |
| Fidelity Series Commodity Strategy Fund | 2,201 | 1,544 | 261 | 140 | (7) | (256) | 3,221 |
| Fidelity Series Emerging Markets Debt Fund | 772 | 161 | 138 | 45 | (12) | (26) | 757 |
| Fidelity Series Emerging Markets Fund | -- | 495 | 26 | 2 | (1) | 7 | 475 |
| Fidelity Series Emerging Markets Opportunities Fund | 4,172 | 1,836 | 1,096 | 349 | (32) | (585) | 4,295 |
| Fidelity Series Floating Rate High Income Fund | 250 | 18 | 99 | 16 | (3) | (4) | 162 |
| Fidelity Series Government Money Market Fund 2.50% | 19,357 | 3,640 | 6,910 | 363 | -- | -- | 16,087 |
| Fidelity Series Growth Company Fund | 2,647 | 640 | 1,135 | 241 | 94 | (65) | 2,181 |
| Fidelity Series High Income Fund | 1,555 | 100 | 824 | 95 | (24) | 5 | 812 |
| Fidelity Series Inflation-Protected Bond Index Fund | 3,511 | 8,871 | 37 | 213 | (1) | 59 | 12,403 |
| Fidelity Series International Credit Fund | 51 | 4 | -- | 3 | -- | -- | 55 |
| Fidelity Series International Growth Fund | 3,624 | 880 | 1,012 | 217 | (3) | (164) | 3,325 |
| Fidelity Series International Small Cap Fund | 900 | 258 | 228 | 73 | (4) | (129) | 797 |
| Fidelity Series International Value Fund | 3,575 | 612 | 482 | 118 | (4) | (398) | 3,303 |
| Fidelity Series Intrinsic Opportunities Fund | 3,236 | 437 | 773 | 220 | 54 | (275) | 2,679 |
| Fidelity Series Investment Grade Bond Fund | 36,345 | 2,575 | 2,218 | 1,182 | (44) | 578 | 37,236 |
| Fidelity Series Large Cap Stock Fund | 2,895 | 555 | 1,087 | 261 | 35 | (75) | 2,323 |
| Fidelity Series Large Cap Value Index Fund | 830 | 92 | 290 | 31 | 14 | 3 | 649 |
| Fidelity Series Long-Term Treasury Bond Index Fund | 2,293 | 3,543 | 958 | 115 | (35) | 239 | 5,082 |
| Fidelity Series Opportunistic Insights Fund | 1,451 | 249 | 563 | 106 | 29 | 7 | 1,173 |
| Fidelity Series Real Estate Equity Fund | 261 | 3 | 272 | 2 | (17) | 25 | -- |
| Fidelity Series Real Estate Income Fund | 485 | 41 | 29 | 37 | (1) | 10 | 506 |
| Fidelity Series Short-Term Credit Fund | 4,728 | 751 | 1,500 | 110 | (17) | 61 | 4,023 |
| Fidelity Series Small Cap Discovery Fund | 395 | 77 | 131 | 44 | (1) | (27) | 313 |
| Fidelity Series Small Cap Opportunities Fund | 1,205 | 246 | 464 | 115 | 7 | (31) | 963 |
| Fidelity Series Stock Selector Large Cap Value Fund | 2,260 | 280 | 733 | 154 | (5) | (34) | 1,768 |
| Fidelity Series Value Discovery Fund | 1,606 | 189 | 521 | 78 | 1 | (22) | 1,253 |
| Total | $104,243 | $28,695 | $24,057 | $4,639 | $143 | $(1,151) | $107,873 |
Amounts in the income column in the above table include any capital gain distributions from underlying funds, which are presented in the corresponding line-item in the Statement of Operations, if applicable.
Investment Valuation
All investments are categorized as Level 1 under the Fair Value Hierarchy. The inputs or methodology used for valuing securities may not be an indication of the risk associated with investing in those securities. For more information on valuation inputs please refer to the Investment Valuation section in the accompanying Notes to Financial Statements.
See accompanying notes which are an integral part of the financial statements.
Fidelity Flex℠ Freedom 2005 Fund
Financial Statements
Statement of Assets and Liabilities
| | | March 31, 2019 |
| Assets | | |
Investment in securities, at value — See accompanying schedule:
| | |
| Affiliated issuers (cost $108,751) | $107,873 | |
| Total Investment in Securities (cost $108,751) | | $107,873 |
| Receivable for investments sold | | 1,014 |
| Total assets | | 108,887 |
| Liabilities | | |
| Payable for investments purchased | $1,014 | |
| Total liabilities | | 1,014 |
| Net Assets | | $107,873 |
| Net Assets consist of: | | |
| Paid in capital | | $107,239 |
| Total distributable earnings (loss) | | 634 |
| Net Assets, for 10,734 shares outstanding | | $107,873 |
| Net Asset Value, offering price and redemption price per share ($107,873 ÷ 10,734 shares) | | $10.05 |
See accompanying notes which are an integral part of the financial statements.
Statement of Operations
| | | Year ended March 31, 2019 |
| Investment Income | | |
| Dividends: | | |
| Affiliated issuers | | $2,603 |
| Expenses | | |
| Independent trustees' fees and expenses | $1 | |
| Total expenses | | 1 |
| Net investment income (loss) | | 2,602 |
| Realized and Unrealized Gain (Loss) | | |
| Net realized gain (loss) on: | | |
| Investment securities: | | |
| Affiliated issuers | 143 | |
| Capital gain distributions from underlying funds: | | |
| Affiliated issuers | 2,036 | |
| Total net realized gain (loss) | | 2,179 |
| Change in net unrealized appreciation (depreciation) on: | | |
| Investment securities: | | |
| Affiliated issuers | (1,151) | |
| Total change in net unrealized appreciation (depreciation) | | (1,151) |
| Net gain (loss) | | 1,028 |
| Net increase (decrease) in net assets resulting from operations | | $3,630 |
See accompanying notes which are an integral part of the financial statements.
Statement of Changes in Net Assets
| | Year ended March 31, 2019 | For the period
June 8, 2017 (commencement of operations) to March 31, 2018 |
| Increase (Decrease) in Net Assets | | |
| Operations | | |
| Net investment income (loss) | $2,602 | $1,856 |
| Net realized gain (loss) | 2,179 | 2,114 |
| Change in net unrealized appreciation (depreciation) | (1,151) | 273 |
| Net increase (decrease) in net assets resulting from operations | 3,630 | 4,243 |
| Distributions to shareholders | (5,040) | – |
| Distributions to shareholders from net investment income | – | (1,400) |
| Distributions to shareholders from net realized gain | – | (800) |
| Total distributions | (5,040) | (2,200) |
| Share transactions | | |
| Proceeds from sales of shares | – | 100,000 |
| Reinvestment of distributions | 5,040 | 2,200 |
| Net increase (decrease) in net assets resulting from share transactions | 5,040 | 102,200 |
| Total increase (decrease) in net assets | 3,630 | 104,243 |
| Net Assets | | |
| Beginning of period | 104,243 | – |
| End of period | $107,873 | $104,243 |
| Other Information | | |
| Undistributed net investment income end of period | | $456 |
| Shares | | |
| Sold | – | 10,000 |
| Issued in reinvestment of distributions | 519 | 215 |
| Net increase (decrease) | 519 | 10,215 |
See accompanying notes which are an integral part of the financial statements.
Financial Highlights
Fidelity Flex Freedom 2005 Fund
| | | |
| Years ended March 31, | 2019 | 2018 A |
| Selected Per–Share Data | | |
| Net asset value, beginning of period | $10.21 | $10.00 |
| Income from Investment Operations | | |
| Net investment income (loss)B | .25 | .18 |
| Net realized and unrealized gain (loss) | .08 | .25 |
| Total from investment operations | .33 | .43 |
| Distributions from net investment income | (.25) | (.14) |
| Distributions from net realized gain | (.24) | (.08) |
| Total distributions | (.49) | (.22) |
| Net asset value, end of period | $10.05 | $10.21 |
| Total ReturnC | 3.43% | 4.29% |
| Ratios to Average Net AssetsD,E | | |
| Expenses before reductions | - %F | - %G |
| Expenses net of fee waivers, if any | - %F | - %G |
| Expenses net of all reductions | - %F | - %G |
| Net investment income (loss) | 2.49% | 2.21%G |
| Supplemental Data | | |
| Net assets, end of period (000 omitted) | $108 | $104 |
| Portfolio turnover rateD | 23% | 13%G |
A For the period June 8, 2017 (commencement of operations) to March 31, 2018.
B Calculated based on average shares outstanding during the period.
C Total returns for periods of less than one year are not annualized.
D Amounts do not include the activity of the Underlying Funds.
E Expense ratios reflect operating expenses of the Fund. Expenses before reductions do not reflect amounts reimbursed by the investment adviser or reductions from expense offset arrangements and do not represent the amount paid by the Fund during periods when reimbursements or reductions occur. Expenses net of fee waivers reflect expenses after reimbursement by the investment adviser but prior to reductions from expense offset arrangements. Expenses net of all reductions represent the net expenses paid by the Fund but do not include expenses of the underlying funds in which the Fund invests.
F Amount represents less than .005%.
G Annualized
See accompanying notes which are an integral part of the financial statements.
Fidelity Flex℠ Freedom 2010 Fund
Investment Summary (Unaudited)
The information in the following tables is based on the direct investments of the Fund.
Top Holdings as of March 31, 2019
| | % of fund's net assets |
| Fidelity Series Investment Grade Bond Fund | 30.9 |
| Fidelity Series Government Money Market Fund 2.50% | 11.8 |
| Fidelity Series Inflation-Protected Bond Index Fund | 9.4 |
| Fidelity Series Long-Term Treasury Bond Index Fund | 4.9 |
| Fidelity Series Emerging Markets Opportunities Fund | 4.9 |
| Fidelity Series International Growth Fund | 4.0 |
| Fidelity Series International Value Fund | 3.9 |
| Fidelity Series Intrinsic Opportunities Fund | 3.6 |
| Fidelity Series Large Cap Stock Fund | 3.1 |
| Fidelity Series Commodity Strategy Fund | 3.0 |
| | 79.5 |
Asset Allocation (% of fund's net assets)
| Period end |
| | Domestic Equity Funds | 23.3% |
| | International Equity Funds | 14.6% |
| | Bond Funds | 47.4% |
| | Short-Term Funds | 14.7% |

Domestic Equity Funds category includes Fidelity Series Commodity Strategy Fund which invests in commodity-related investments.
Fidelity Flex℠ Freedom 2010 Fund
Schedule of Investments March 31, 2019
Showing Percentage of Net Assets
| Domestic Equity Funds - 23.3% | | | |
| | | Shares | Value |
| Fidelity Series All-Sector Equity Fund (a) | | 91 | $881 |
| Fidelity Series Blue Chip Growth Fund (a) | | 108 | 1,587 |
| Fidelity Series Commodity Strategy Fund (a) | | 681 | 3,246 |
| Fidelity Series Growth Company Fund (a) | | 190 | 3,217 |
| Fidelity Series Intrinsic Opportunities Fund (a) | | 240 | 3,953 |
| Fidelity Series Large Cap Stock Fund (a) | | 234 | 3,426 |
| Fidelity Series Large Cap Value Index Fund (a) | | 77 | 956 |
| Fidelity Series Opportunistic Insights Fund (a) | | 99 | 1,730 |
| Fidelity Series Small Cap Discovery Fund (a) | | 42 | 463 |
| Fidelity Series Small Cap Opportunities Fund (a) | | 106 | 1,420 |
| Fidelity Series Stock Selector Large Cap Value Fund (a) | | 221 | 2,610 |
| Fidelity Series Value Discovery Fund (a) | | 148 | 1,848 |
| TOTAL DOMESTIC EQUITY FUNDS | | | |
| (Cost $25,701) | | | 25,337 |
|
| International Equity Funds - 14.6% | | | |
| Fidelity Series Canada Fund (a) | | 45 | 461 |
| Fidelity Series Emerging Markets Fund (a) | | 60 | 584 |
| Fidelity Series Emerging Markets Opportunities Fund (a) | | 285 | 5,285 |
| Fidelity Series International Growth Fund (a) | | 283 | 4,296 |
| Fidelity Series International Small Cap Fund (a) | | 66 | 1,030 |
| Fidelity Series International Value Fund (a) | | 459 | 4,268 |
| TOTAL INTERNATIONAL EQUITY FUNDS | | | |
| (Cost $16,448) | | | 15,924 |
|
| Bond Funds - 47.4% | | | |
| Fidelity Series Emerging Markets Debt Fund (a) | | 80 | 762 |
| Fidelity Series Floating Rate High Income Fund (a) | | 18 | 163 |
| Fidelity Series High Income Fund (a) | | 87 | 819 |
| Fidelity Series Inflation-Protected Bond Index Fund (a) | | 1,046 | 10,235 |
| Fidelity Series International Credit Fund (a) | | 6 | 56 |
| Fidelity Series Investment Grade Bond Fund (a) | | 3,008 | 33,629 |
| Fidelity Series Long-Term Treasury Bond Index Fund (a) | | 602 | 5,340 |
| Fidelity Series Real Estate Income Fund (a) | | 47 | 510 |
| TOTAL BOND FUNDS | | | |
| (Cost $51,661) | | | 51,514 |
|
| Short-Term Funds - 14.7% | | | |
| Fidelity Series Government Money Market Fund 2.50% (a)(b) | | 12,791 | 12,791 |
| Fidelity Series Short-Term Credit Fund (a) | | 321 | 3,198 |
| TOTAL SHORT-TERM FUNDS | | | |
| (Cost $15,989) | | | 15,989 |
| TOTAL INVESTMENT IN SECURITIES - 100.0% | | | |
| (Cost $109,799) | | | 108,764 |
| NET OTHER ASSETS (LIABILITIES) - 0.0% | | | 0 |
| NET ASSETS - 100% | | | $108,764 |
Legend
(a) Affiliated Fund
(b) The rate quoted is the annualized seven-day yield of the fund at period end.
Affiliated Underlying Funds
Fiscal year to date information regarding the Fund's investments in affiliated Underlying Funds, excluding any Money Market Central Funds, is presented below. Exchanges between classes of the same affiliated Underlying Funds may occur.
| Affiliate | Value, beginning of period | Purchases | Sales Proceeds | Dividend Income | Realized Gain (loss) | Change in Unrealized appreciation (depreciation) | Value, end of period |
| Fidelity Series 100 Index Fund | $884 | $-- | $917 | $-- | $94 | $(61) | $-- |
| Fidelity Series All-Sector Equity Fund | 1,696 | 308 | 1,064 | 212 | 9 | (68) | 881 |
| Fidelity Series Blue Chip Growth Fund | 1,753 | 392 | 648 | 213 | 39 | 51 | 1,587 |
| Fidelity Series Canada Fund | 439 | 123 | 111 | 10 | (3) | 13 | 461 |
| Fidelity Series Commodity Strategy Fund | 2,222 | 1,521 | 226 | 144 | (7) | (264) | 3,246 |
| Fidelity Series Emerging Markets Debt Fund | 762 | 181 | 144 | 45 | (12) | (25) | 762 |
| Fidelity Series Emerging Markets Fund | -- | 606 | 30 | 2 | (1) | 9 | 584 |
| Fidelity Series Emerging Markets Opportunities Fund | 5,149 | 2,112 | 1,202 | 427 | (43) | (731) | 5,285 |
| Fidelity Series Floating Rate High Income Fund | 250 | 28 | 109 | 16 | (2) | (4) | 163 |
| Fidelity Series Government Money Market Fund 2.50% | 15,228 | 3,464 | 5,901 | 289 | -- | -- | 12,791 |
| Fidelity Series Growth Company Fund | 3,506 | 898 | 1,202 | 348 | 80 | (65) | 3,217 |
| Fidelity Series High Income Fund | 1,558 | 96 | 815 | 96 | (25) | 5 | 819 |
| Fidelity Series Inflation-Protected Bond Index Fund | 2,900 | 7,430 | 141 | 176 | (4) | 50 | 10,235 |
| Fidelity Series International Credit Fund | 51 | 5 | -- | 3 | -- | -- | 56 |
| Fidelity Series International Growth Fund | 4,533 | 968 | 988 | 278 | (7) | (210) | 4,296 |
| Fidelity Series International Small Cap Fund | 1,127 | 267 | 192 | 94 | (5) | (167) | 1,030 |
| Fidelity Series International Value Fund | 4,474 | 771 | 461 | 152 | (8) | (508) | 4,268 |
| Fidelity Series Intrinsic Opportunities Fund | 4,286 | 763 | 761 | 317 | 39 | (374) | 3,953 |
| Fidelity Series Investment Grade Bond Fund | 33,239 | 2,668 | 2,751 | 1,066 | (56) | 529 | 33,629 |
| Fidelity Series Large Cap Stock Fund | 3,919 | 786 | 1,212 | 367 | 31 | (98) | 3,426 |
| Fidelity Series Large Cap Value Index Fund | 1,099 | 137 | 301 | 45 | 13 | 8 | 956 |
| Fidelity Series Long-Term Treasury Bond Index Fund | 2,246 | 3,643 | 766 | 122 | (25) | 242 | 5,340 |
| Fidelity Series Opportunistic Insights Fund | 1,922 | 347 | 585 | 147 | 26 | 20 | 1,730 |
| Fidelity Series Real Estate Equity Fund | 342 | 2 | 354 | 3 | (23) | 33 | -- |
| Fidelity Series Real Estate Income Fund | 474 | 57 | 31 | 37 | (1) | 11 | 510 |
| Fidelity Series Short-Term Credit Fund | 3,833 | 585 | 1,255 | 88 | (14) | 49 | 3,198 |
| Fidelity Series Small Cap Discovery Fund | 523 | 113 | 133 | 61 | (4) | (36) | 463 |
| Fidelity Series Small Cap Opportunities Fund | 1,620 | 357 | 508 | 166 | 1 | (50) | 1,420 |
| Fidelity Series Stock Selector Large Cap Value Fund | 2,994 | 435 | 749 | 225 | (7) | (63) | 2,610 |
| Fidelity Series Value Discovery Fund | 2,128 | 287 | 532 | 113 | -- | (35) | 1,848 |
| Total | $105,157 | $29,350 | $24,089 | $5,262 | $85 | $(1,739) | $108,764 |
Amounts in the income column in the above table include any capital gain distributions from underlying funds, which are presented in the corresponding line-item in the Statement of Operations, if applicable.
Investment Valuation
All investments are categorized as Level 1 under the Fair Value Hierarchy. The inputs or methodology used for valuing securities may not be an indication of the risk associated with investing in those securities. For more information on valuation inputs please refer to the Investment Valuation section in the accompanying Notes to Financial Statements.
See accompanying notes which are an integral part of the financial statements.
Fidelity Flex℠ Freedom 2010 Fund
Financial Statements
Statement of Assets and Liabilities
| | | March 31, 2019 |
| Assets | | |
Investment in securities, at value — See accompanying schedule:
| | |
| Affiliated issuers (cost $109,799) | $108,764 | |
| Total Investment in Securities (cost $109,799) | | $108,764 |
| Receivable for investments sold | | 1,108 |
| Total assets | | 109,872 |
| Liabilities | | |
| Payable for investments purchased | $1,108 | |
| Total liabilities | | 1,108 |
| Net Assets | | $108,764 |
| Net Assets consist of: | | |
| Paid in capital | | $107,920 |
| Total distributable earnings (loss) | | 844 |
| Net Assets, for 10,802 shares outstanding | | $108,764 |
| Net Asset Value, offering price and redemption price per share ($108,764 ÷ 10,802 shares) | | $10.07 |
See accompanying notes which are an integral part of the financial statements.
Statement of Operations
| | | Year ended March 31, 2019 |
| Investment Income | | |
| Dividends: | | |
| Affiliated issuers | | $2,594 |
| Expenses | | |
| Independent trustees' fees and expenses | $1 | |
| Total expenses | | 1 |
| Net investment income (loss) | | 2,593 |
| Realized and Unrealized Gain (Loss) | | |
| Net realized gain (loss) on: | | |
| Investment securities: | | |
| Affiliated issuers | 85 | |
| Capital gain distributions from underlying funds: | | |
| Affiliated issuers | 2,668 | |
| Total net realized gain (loss) | | 2,753 |
| Change in net unrealized appreciation (depreciation) on: | | |
| Investment securities: | | |
| Affiliated issuers | (1,739) | |
| Total change in net unrealized appreciation (depreciation) | | (1,739) |
| Net gain (loss) | | 1,014 |
| Net increase (decrease) in net assets resulting from operations | | $3,607 |
See accompanying notes which are an integral part of the financial statements.
Statement of Changes in Net Assets
| | Year ended March 31, 2019 | For the period
June 8, 2017 (commencement of operations) to March 31, 2018 |
| Increase (Decrease) in Net Assets | | |
| Operations | | |
| Net investment income (loss) | $2,593 | $1,868 |
| Net realized gain (loss) | 2,753 | 2,585 |
| Change in net unrealized appreciation (depreciation) | (1,739) | 704 |
| Net increase (decrease) in net assets resulting from operations | 3,607 | 5,157 |
| Distributions to shareholders | (5,511) | – |
| Distributions to shareholders from net investment income | – | (1,460) |
| Distributions to shareholders from net realized gain | – | (950) |
| Total distributions | (5,511) | (2,410) |
| Share transactions | | |
| Proceeds from sales of shares | – | 100,000 |
| Reinvestment of distributions | 5,511 | 2,410 |
| Net increase (decrease) in net assets resulting from share transactions | 5,511 | 102,410 |
| Total increase (decrease) in net assets | 3,607 | 105,157 |
| Net Assets | | |
| Beginning of period | 105,157 | – |
| End of period | $108,764 | $105,157 |
| Other Information | | |
| Undistributed net investment income end of period | | $408 |
| Shares | | |
| Sold | – | 10,000 |
| Issued in reinvestment of distributions | 568 | 234 |
| Net increase (decrease) | 568 | 10,234 |
See accompanying notes which are an integral part of the financial statements.
Financial Highlights
Fidelity Flex Freedom 2010 Fund
| | | |
| Years ended March 31, | 2019 | 2018 A |
| Selected Per–Share Data | | |
| Net asset value, beginning of period | $10.28 | $10.00 |
| Income from Investment Operations | | |
| Net investment income (loss)B | .25 | .19 |
| Net realized and unrealized gain (loss) | .07 | .33 |
| Total from investment operations | .32 | .52 |
| Distributions from net investment income | (.25) | (.15) |
| Distributions from net realized gain | (.29) | (.10) |
| Total distributions | (.53)C | (.24)D |
| Net asset value, end of period | $10.07 | $10.28 |
| Total ReturnE | 3.40% | 5.20% |
| Ratios to Average Net AssetsF,G | | |
| Expenses before reductions | - %H | - %I |
| Expenses net of fee waivers, if any | - %H | - %I |
| Expenses net of all reductions | - %H | - %I |
| Net investment income (loss) | 2.46% | 2.22%I |
| Supplemental Data | | |
| Net assets, end of period (000 omitted) | $109 | $105 |
| Portfolio turnover rateF | 23% | 13%I |
A For the period June 8, 2017 (commencement of operations) to March 31, 2018.
B Calculated based on average shares outstanding during the period.
C Total distributions of $.53 per share is comprised of distributions from net investment income of $.246 and distributions from net realized gain of $.286 per share.
D Total distributions of $.24 per share is comprised of distributions from net investment income of $.146 and distributions from net realized gain of $.095 per share.
E Total returns for periods of less than one year are not annualized.
F Amounts do not include the activity of the Underlying Funds.
G Expense ratios reflect operating expenses of the Fund. Expenses before reductions do not reflect amounts reimbursed by the investment adviser or reductions from expense offset arrangements and do not represent the amount paid by the Fund during periods when reimbursements or reductions occur. Expenses net of fee waivers reflect expenses after reimbursement by the investment adviser but prior to reductions from expense offset arrangements. Expenses net of all reductions represent the net expenses paid by the Fund but do not include expenses of the underlying funds in which the Fund invests.
H Amount represents less than .005%.
I Annualized
See accompanying notes which are an integral part of the financial statements.
Fidelity Flex℠ Freedom 2015 Fund
Investment Summary (Unaudited)
The information in the following tables is based on the direct investments of the Fund.
Top Holdings as of March 31, 2019
| | % of fund's net assets |
| Fidelity Series Investment Grade Bond Fund | 27.1 |
| Fidelity Series Government Money Market Fund 2.50% | 9.0 |
| Fidelity Series Inflation-Protected Bond Index Fund | 7.4 |
| Fidelity Series Emerging Markets Opportunities Fund | 5.5 |
| Fidelity Series Long-Term Treasury Bond Index Fund | 5.0 |
| Fidelity Series International Growth Fund | 4.8 |
| Fidelity Series International Value Fund | 4.8 |
| Fidelity Series Intrinsic Opportunities Fund | 4.8 |
| Fidelity Series Large Cap Stock Fund | 4.1 |
| Fidelity Series Growth Company Fund | 3.9 |
| | 76.4 |
Asset Allocation (% of fund's net assets)
| Period end |
| | Domestic Equity Funds | 29.8% |
| | International Equity Funds | 17.4% |
| | Bond Funds | 41.6% |
| | Short-Term Funds | 11.2% |

Domestic Equity Funds category includes Fidelity Series Commodity Strategy Fund which invests in commodity-related investments.
Fidelity Flex℠ Freedom 2015 Fund
Schedule of Investments March 31, 2019
Showing Percentage of Net Assets
| Domestic Equity Funds - 29.8% | | | |
| | | Shares | Value |
| Fidelity Series All-Sector Equity Fund (a) | | 122 | $1,172 |
| Fidelity Series Blue Chip Growth Fund (a) | | 143 | 2,112 |
| Fidelity Series Commodity Strategy Fund (a) | | 686 | 3,270 |
| Fidelity Series Growth Company Fund (a) | | 253 | 4,276 |
| Fidelity Series Intrinsic Opportunities Fund (a) | | 319 | 5,248 |
| Fidelity Series Large Cap Stock Fund (a) | | 310 | 4,537 |
| Fidelity Series Large Cap Value Index Fund (a) | | 102 | 1,269 |
| Fidelity Series Opportunistic Insights Fund (a) | | 131 | 2,297 |
| Fidelity Series Small Cap Discovery Fund (a) | | 55 | 615 |
| Fidelity Series Small Cap Opportunities Fund (a) | | 140 | 1,888 |
| Fidelity Series Stock Selector Large Cap Value Fund (a) | | 294 | 3,465 |
| Fidelity Series Value Discovery Fund (a) | | 196 | 2,451 |
| TOTAL DOMESTIC EQUITY FUNDS | | | |
| (Cost $33,081) | | | 32,600 |
|
| International Equity Funds - 17.4% | | | |
| Fidelity Series Canada Fund (a) | | 55 | 567 |
| Fidelity Series Emerging Markets Fund (a) | | 69 | 671 |
| Fidelity Series Emerging Markets Opportunities Fund (a) | | 328 | 6,070 |
| Fidelity Series International Growth Fund (a) | | 348 | 5,284 |
| Fidelity Series International Small Cap Fund (a) | | 82 | 1,267 |
| Fidelity Series International Value Fund (a) | | 565 | 5,250 |
| TOTAL INTERNATIONAL EQUITY FUNDS | | | |
| (Cost $19,779) | | | 19,109 |
|
| Bond Funds - 41.6% | | | |
| Fidelity Series Emerging Markets Debt Fund (a) | | 80 | 768 |
| Fidelity Series Floating Rate High Income Fund (a) | | 18 | 165 |
| Fidelity Series High Income Fund (a) | | 88 | 825 |
| Fidelity Series Inflation-Protected Bond Index Fund (a) | | 825 | 8,072 |
| Fidelity Series International Credit Fund (a) | | 6 | 57 |
| Fidelity Series Investment Grade Bond Fund (a) | | 2,659 | 29,732 |
| Fidelity Series Long-Term Treasury Bond Index Fund (a) | | 619 | 5,489 |
| Fidelity Series Real Estate Income Fund (a) | | 47 | 514 |
| TOTAL BOND FUNDS | | | |
| (Cost $45,722) | | | 45,622 |
|
| Short-Term Funds - 11.2% | | | |
| Fidelity Series Government Money Market Fund 2.50% (a)(b) | | 9,832 | 9,832 |
| Fidelity Series Short-Term Credit Fund (a) | | 247 | 2,458 |
| TOTAL SHORT-TERM FUNDS | | | |
| (Cost $12,290) | | | 12,290 |
| TOTAL INVESTMENT IN SECURITIES - 100.0% | | | |
| (Cost $110,872) | | | 109,621 |
| NET OTHER ASSETS (LIABILITIES) - 0.0% | | | (1) |
| NET ASSETS - 100% | | | $109,620 |
Legend
(a) Affiliated Fund
(b) The rate quoted is the annualized seven-day yield of the fund at period end.
Affiliated Underlying Funds
Fiscal year to date information regarding the Fund's investments in affiliated Underlying Funds, excluding any Money Market Central Funds, is presented below. Exchanges between classes of the same affiliated Underlying Funds may occur.
| Affiliate | Value, beginning of period | Purchases | Sales Proceeds | Dividend Income | Realized Gain (loss) | Change in Unrealized appreciation (depreciation) | Value, end of period |
| Fidelity Series 100 Index Fund | $1,112 | $-- | $1,151 | $-- | $116 | $(77) | $-- |
| Fidelity Series All-Sector Equity Fund | 2,132 | 428 | 1,284 | 292 | 17 | (121) | 1,172 |
| Fidelity Series Blue Chip Growth Fund | 2,204 | 500 | 699 | 279 | 36 | 71 | 2,112 |
| Fidelity Series Canada Fund | 532 | 139 | 115 | 12 | (1) | 12 | 567 |
| Fidelity Series Commodity Strategy Fund | 2,252 | 1,499 | 202 | 147 | (8) | (271) | 3,270 |
| Fidelity Series Emerging Markets Debt Fund | 741 | 180 | 117 | 44 | (10) | (26) | 768 |
| Fidelity Series Emerging Markets Fund | -- | 690 | 28 | 3 | (1) | 10 | 671 |
| Fidelity Series Emerging Markets Opportunities Fund | 5,947 | 2,240 | 1,222 | 488 | (48) | (847) | 6,070 |
| Fidelity Series Floating Rate High Income Fund | 250 | 34 | 114 | 14 | (1) | (4) | 165 |
| Fidelity Series Government Money Market Fund 2.50% | 11,499 | 3,387 | 5,054 | 222 | -- | -- | 9,832 |
| Fidelity Series Growth Company Fund | 4,439 | 1,173 | 1,341 | 454 | 72 | (67) | 4,276 |
| Fidelity Series High Income Fund | 1,550 | 104 | 808 | 98 | (26) | 5 | 825 |
| Fidelity Series Inflation-Protected Bond Index Fund | 2,090 | 6,191 | 243 | 139 | (6) | 40 | 8,072 |
| Fidelity Series International Credit Fund | 51 | 6 | -- | 3 | -- | -- | 57 |
| Fidelity Series International Growth Fund | 5,462 | 1,099 | 1,006 | 341 | (9) | (262) | 5,284 |
| Fidelity Series International Small Cap Fund | 1,365 | 316 | 202 | 116 | (5) | (207) | 1,267 |
| Fidelity Series International Value Fund | 5,419 | 914 | 448 | 187 | (3) | (632) | 5,250 |
| Fidelity Series Intrinsic Opportunities Fund | 5,389 | 964 | 655 | 415 | 30 | (480) | 5,248 |
| Fidelity Series Investment Grade Bond Fund | 29,661 | 2,710 | 3,049 | 945 | (67) | 477 | 29,732 |
| Fidelity Series Large Cap Stock Fund | 4,974 | 954 | 1,292 | 476 | 26 | (125) | 4,537 |
| Fidelity Series Large Cap Value Index Fund | 1,382 | 179 | 317 | 59 | 13 | 12 | 1,269 |
| Fidelity Series Long-Term Treasury Bond Index Fund | 2,362 | 3,776 | 870 | 126 | (28) | 249 | 5,489 |
| Fidelity Series Opportunistic Insights Fund | 2,416 | 453 | 608 | 200 | 20 | 16 | 2,297 |
| Fidelity Series Real Estate Equity Fund | 426 | 4 | 441 | 3 | (30) | 41 | -- |
| Fidelity Series Real Estate Income Fund | 475 | 61 | 32 | 37 | (1) | 11 | 514 |
| Fidelity Series Short-Term Credit Fund | 2,821 | 648 | 1,039 | 67 | (9) | 37 | 2,458 |
| Fidelity Series Small Cap Discovery Fund | 657 | 152 | 137 | 81 | (6) | (51) | 615 |
| Fidelity Series Small Cap Opportunities Fund | 2,007 | 458 | 508 | 215 | (6) | (63) | 1,888 |
| Fidelity Series Stock Selector Large Cap Value Fund | 3,764 | 600 | 800 | 294 | (9) | (90) | 3,465 |
| Fidelity Series Value Discovery Fund | 2,674 | 356 | 528 | 148 | (1) | (50) | 2,451 |
| Total | $106,053 | $30,215 | $24,310 | $5,905 | $55 | $(2,392) | $109,621 |
Amounts in the income column in the above table include any capital gain distributions from underlying funds, which are presented in the corresponding line-item in the Statement of Operations, if applicable.
Investment Valuation
All investments are categorized as Level 1 under the Fair Value Hierarchy. The inputs or methodology used for valuing securities may not be an indication of the risk associated with investing in those securities. For more information on valuation inputs please refer to the Investment Valuation section in the accompanying Notes to Financial Statements.
See accompanying notes which are an integral part of the financial statements.
Fidelity Flex℠ Freedom 2015 Fund
Financial Statements
Statement of Assets and Liabilities
| | | March 31, 2019 |
| Assets | | |
Investment in securities, at value — See accompanying schedule:
| | |
| Affiliated issuers (cost $110,872) | $109,621 | |
| Total Investment in Securities (cost $110,872) | | $109,621 |
| Receivable for investments sold | | 1,215 |
| Total assets | | 110,836 |
| Liabilities | | |
| Payable for investments purchased | $1,216 | |
| Total liabilities | | 1,216 |
| Net Assets | | $109,620 |
| Net Assets consist of: | | |
| Paid in capital | | $108,594 |
| Total distributable earnings (loss) | | 1,026 |
| Net Assets, for 10,868 shares outstanding | | $109,620 |
| Net Asset Value, offering price and redemption price per share ($109,620 ÷ 10,868 shares) | | $10.09 |
See accompanying notes which are an integral part of the financial statements.
Statement of Operations
| | | Year ended March 31, 2019 |
| Investment Income | | |
| Dividends: | | |
| Affiliated issuers | | $2,583 |
| Expenses | | |
| Independent trustees' fees and expenses | $1 | |
| Total expenses | | 1 |
| Net investment income (loss) | | 2,582 |
| Realized and Unrealized Gain (Loss) | | |
| Net realized gain (loss) on: | | |
| Investment securities: | | |
| Affiliated issuers | 55 | |
| Capital gain distributions from underlying funds: | | |
| Affiliated issuers | 3,322 | |
| Total net realized gain (loss) | | 3,377 |
| Change in net unrealized appreciation (depreciation) on: | | |
| Investment securities: | | |
| Affiliated issuers | (2,392) | |
| Total change in net unrealized appreciation (depreciation) | | (2,392) |
| Net gain (loss) | | 985 |
| Net increase (decrease) in net assets resulting from operations | | $3,567 |
See accompanying notes which are an integral part of the financial statements.
Statement of Changes in Net Assets
| | Year ended March 31, 2019 | For the period
June 8, 2017 (commencement of operations) to March 31, 2018 |
| Increase (Decrease) in Net Assets | | |
| Operations | | |
| Net investment income (loss) | $2,582 | $1,876 |
| Net realized gain (loss) | 3,377 | 3,036 |
| Change in net unrealized appreciation (depreciation) | (2,392) | 1,141 |
| Net increase (decrease) in net assets resulting from operations | 3,567 | 6,053 |
| Distributions to shareholders | (5,994) | – |
| Distributions to shareholders from net investment income | – | (1,520) |
| Distributions to shareholders from net realized gain | – | (1,080) |
| Total distributions | (5,994) | (2,600) |
| Share transactions | | |
| Proceeds from sales of shares | – | 100,000 |
| Reinvestment of distributions | 5,994 | 2,600 |
| Net increase (decrease) in net assets resulting from share transactions | 5,994 | 102,600 |
| Total increase (decrease) in net assets | 3,567 | 106,053 |
| Net Assets | | |
| Beginning of period | 106,053 | – |
| End of period | $109,620 | $106,053 |
| Other Information | | |
| Undistributed net investment income end of period | | $356 |
| Shares | | |
| Sold | – | 10,000 |
| Issued in reinvestment of distributions | 618 | 250 |
| Net increase (decrease) | 618 | 10,250 |
See accompanying notes which are an integral part of the financial statements.
Financial Highlights
Fidelity Flex Freedom 2015 Fund
| | | |
| Years ended March 31, | 2019 | 2018 A |
| Selected Per–Share Data | | |
| Net asset value, beginning of period | $10.35 | $10.00 |
| Income from Investment Operations | | |
| Net investment income (loss)B | .24 | .19 |
| Net realized and unrealized gain (loss) | .08 | .42 |
| Total from investment operations | .32 | .61 |
| Distributions from net investment income | (.24) | (.15) |
| Distributions from net realized gain | (.33) | (.11) |
| Total distributions | (.58)C | (.26) |
| Net asset value, end of period | $10.09 | $10.35 |
| Total ReturnD | 3.37% | 6.09% |
| Ratios to Average Net AssetsE,F | | |
| Expenses before reductions | - %G | - %H |
| Expenses net of fee waivers, if any | - %G | - %H |
| Expenses net of all reductions | - %G | - %H |
| Net investment income (loss) | 2.43% | 2.21%H |
| Supplemental Data | | |
| Net assets, end of period (000 omitted) | $110 | $106 |
| Portfolio turnover rateE | 23% | 14%H |
A For the period June 8, 2017 (commencement of operations) to March 31, 2018.
B Calculated based on average shares outstanding during the period.
C Total distributions of $.58 per share is comprised of distributions from net investment income of $.244 and distributions from net realized gain of $.333 per share.
D Total returns for periods of less than one year are not annualized.
E Amounts do not include the activity of the Underlying Funds.
F Expense ratios reflect operating expenses of the Fund. Expenses before reductions do not reflect amounts reimbursed by the investment adviser or reductions from expense offset arrangements and do not represent the amount paid by the Fund during periods when reimbursements or reductions occur. Expenses net of fee waivers reflect expenses after reimbursement by the investment adviser but prior to reductions from expense offset arrangements. Expenses net of all reductions represent the net expenses paid by the Fund but do not include expenses of the underlying funds in which the Fund invests.
G Amount represents less than .005%.
H Annualized
See accompanying notes which are an integral part of the financial statements.
Fidelity Flex℠ Freedom 2020 Fund
Investment Summary (Unaudited)
The information in the following tables is based on the direct investments of the Fund.
Top Holdings as of March 31, 2019
| | % of fund's net assets |
| Fidelity Series Investment Grade Bond Fund | 23.9 |
| Fidelity Series Government Money Market Fund 2.50% | 6.7 |
| Fidelity Series Emerging Markets Opportunities Fund | 6.1 |
| Fidelity Series Intrinsic Opportunities Fund | 5.7 |
| Fidelity Series International Growth Fund | 5.6 |
| Fidelity Series International Value Fund | 5.5 |
| Fidelity Series Inflation-Protected Bond Index Fund | 5.4 |
| Fidelity Series Long-Term Treasury Bond Index Fund | 5.1 |
| Fidelity Series Large Cap Stock Fund | 5.0 |
| Fidelity Series Growth Company Fund | 4.7 |
| | 73.7 |
Asset Allocation (% of fund's net assets)
| Period end |
| | Domestic Equity Funds | 35.2% |
| | International Equity Funds | 19.8% |
| | Bond Funds | 36.6% |
| | Short-Term Funds | 8.4% |

Domestic Equity Funds category includes Fidelity Series Commodity Strategy Fund which invests in commodity-related investments.
Fidelity Flex℠ Freedom 2020 Fund
Schedule of Investments March 31, 2019
Showing Percentage of Net Assets
| Domestic Equity Funds - 35.2% | | | |
| | | Shares | Value |
| Fidelity Series All-Sector Equity Fund (a) | | 147 | $1,415 |
| Fidelity Series Blue Chip Growth Fund (a) | | 174 | 2,561 |
| Fidelity Series Commodity Strategy Fund (a) | | 689 | 3,285 |
| Fidelity Series Growth Company Fund (a) | | 306 | 5,179 |
| Fidelity Series Intrinsic Opportunities Fund (a) | | 386 | 6,350 |
| Fidelity Series Large Cap Stock Fund (a) | | 375 | 5,488 |
| Fidelity Series Large Cap Value Index Fund (a) | | 124 | 1,534 |
| Fidelity Series Opportunistic Insights Fund (a) | | 160 | 2,791 |
| Fidelity Series Small Cap Discovery Fund (a) | | 66 | 734 |
| Fidelity Series Small Cap Opportunities Fund (a) | | 169 | 2,281 |
| Fidelity Series Stock Selector Large Cap Value Fund (a) | | 355 | 4,193 |
| Fidelity Series Value Discovery Fund (a) | | 237 | 2,964 |
| TOTAL DOMESTIC EQUITY FUNDS | | | |
| (Cost $39,339) | | | 38,775 |
|
| International Equity Funds - 19.8% | | | |
| Fidelity Series Canada Fund (a) | | 64 | 657 |
| Fidelity Series Emerging Markets Fund (a) | | 76 | 746 |
| Fidelity Series Emerging Markets Opportunities Fund (a) | | 365 | 6,759 |
| Fidelity Series International Growth Fund (a) | | 403 | 6,126 |
| Fidelity Series International Small Cap Fund (a) | | 95 | 1,469 |
| Fidelity Series International Value Fund (a) | | 654 | 6,086 |
| TOTAL INTERNATIONAL EQUITY FUNDS | | | |
| (Cost $22,628) | | | 21,843 |
|
| Bond Funds - 36.6% | | | |
| Fidelity Series Emerging Markets Debt Fund (a) | | 80 | 770 |
| Fidelity Series Floating Rate High Income Fund (a) | | 18 | 163 |
| Fidelity Series High Income Fund (a) | | 88 | 829 |
| Fidelity Series Inflation-Protected Bond Index Fund (a) | | 613 | 5,994 |
| Fidelity Series International Credit Fund (a) | | 7 | 69 |
| Fidelity Series Investment Grade Bond Fund (a) | | 2,356 | 26,338 |
| Fidelity Series Long-Term Treasury Bond Index Fund (a) | | 636 | 5,638 |
| Fidelity Series Real Estate Income Fund (a) | | 47 | 516 |
| TOTAL BOND FUNDS | | | |
| (Cost $40,386) | | | 40,317 |
|
| Short-Term Funds - 8.4% | | | |
| Fidelity Series Government Money Market Fund 2.50% (a)(b) | | 7,418 | 7,418 |
| Fidelity Series Short-Term Credit Fund (a) | | 186 | 1,855 |
| TOTAL SHORT-TERM FUNDS | | | |
| (Cost $9,272) | | | 9,273 |
| TOTAL INVESTMENT IN SECURITIES - 100.0% | | | |
| (Cost $111,625) | | | 110,208 |
| NET OTHER ASSETS (LIABILITIES) - 0.0% | | | 0 |
| NET ASSETS - 100% | | | $110,208 |
Legend
(a) Affiliated Fund
(b) The rate quoted is the annualized seven-day yield of the fund at period end.
Affiliated Underlying Funds
Fiscal year to date information regarding the Fund's investments in affiliated Underlying Funds, excluding any Money Market Central Funds, is presented below. Exchanges between classes of the same affiliated Underlying Funds may occur.
| Affiliate | Value, beginning of period | Purchases | Sales Proceeds | Dividend Income | Realized Gain (loss) | Change in Unrealized appreciation (depreciation) | Value, end of period |
| Fidelity Series 100 Index Fund | $1,284 | $3 | $1,328 | $-- | $130 | $(89) | $-- |
| Fidelity Series All-Sector Equity Fund | 2,464 | 472 | 1,410 | 336 | 23 | (134) | 1,415 |
| Fidelity Series Blue Chip Growth Fund | 2,547 | 632 | 735 | 334 | 27 | 90 | 2,561 |
| Fidelity Series Canada Fund | 602 | 160 | 116 | 14 | -- | 11 | 657 |
| Fidelity Series Commodity Strategy Fund | 2,267 | 1,512 | 214 | 147 | (8) | (272) | 3,285 |
| Fidelity Series Emerging Markets Debt Fund | 741 | 163 | 99 | 43 | (8) | (27) | 770 |
| Fidelity Series Emerging Markets Fund | -- | 751 | 14 | 3 | -- | 9 | 746 |
| Fidelity Series Emerging Markets Opportunities Fund | 6,573 | 2,509 | 1,324 | 540 | (56) | (943) | 6,759 |
| Fidelity Series Floating Rate High Income Fund | 250 | 16 | 98 | 14 | (1) | (4) | 163 |
| Fidelity Series Government Money Market Fund 2.50% | 8,790 | 3,201 | 4,573 | 170 | -- | -- | 7,418 |
| Fidelity Series Growth Company Fund | 5,134 | 1,405 | 1,331 | 553 | 49 | (78) | 5,179 |
| Fidelity Series High Income Fund | 1,550 | 100 | 799 | 99 | (27) | 5 | 829 |
| Fidelity Series Inflation-Protected Bond Index Fund | 1,236 | 4,914 | 179 | 102 | (4) | 27 | 5,994 |
| Fidelity Series International Credit Fund | 51 | 18 | -- | 3 | -- | -- | 69 |
| Fidelity Series International Growth Fund | 6,164 | 1,154 | 875 | 394 | (14) | (303) | 6,126 |
| Fidelity Series International Small Cap Fund | 1,544 | 345 | 176 | 134 | (5) | (239) | 1,469 |
| Fidelity Series International Value Fund | 6,138 | 1,050 | 375 | 214 | (1) | (726) | 6,086 |
| Fidelity Series Intrinsic Opportunities Fund | 6,227 | 1,255 | 587 | 493 | 14 | (559) | 6,350 |
| Fidelity Series Investment Grade Bond Fund | 26,901 | 2,477 | 3,394 | 847 | (85) | 439 | 26,338 |
| Fidelity Series Large Cap Stock Fund | 5,804 | 1,098 | 1,287 | 565 | 22 | (149) | 5,488 |
| Fidelity Series Large Cap Value Index Fund | 1,597 | 208 | 299 | 71 | 11 | 17 | 1,534 |
| Fidelity Series Long-Term Treasury Bond Index Fund | 2,388 | 3,872 | 850 | 131 | (24) | 252 | 5,638 |
| Fidelity Series Opportunistic Insights Fund | 2,791 | 566 | 605 | 238 | 17 | 22 | 2,791 |
| Fidelity Series Real Estate Equity Fund | 487 | 36 | 540 | 5 | (31) | 48 | -- |
| Fidelity Series Real Estate Income Fund | 485 | 40 | 18 | 37 | (1) | 10 | 516 |
| Fidelity Series Short-Term Credit Fund | 2,154 | 582 | 902 | 51 | (8) | 29 | 1,855 |
| Fidelity Series Small Cap Discovery Fund | 760 | 164 | 122 | 95 | (8) | (60) | 734 |
| Fidelity Series Small Cap Opportunities Fund | 2,319 | 565 | 505 | 259 | (12) | (86) | 2,281 |
| Fidelity Series Stock Selector Large Cap Value Fund | 4,349 | 585 | 619 | 351 | (9) | (113) | 4,193 |
| Fidelity Series Value Discovery Fund | 3,090 | 403 | 464 | 177 | -- | (65) | 2,964 |
| Total | $106,687 | $30,256 | $23,838 | $6,420 | $(9) | $(2,888) | $110,208 |
Amounts in the income column in the above table include any capital gain distributions from underlying funds, which are presented in the corresponding line-item in the Statement of Operations, if applicable.
Investment Valuation
All investments are categorized as Level 1 under the Fair Value Hierarchy. The inputs or methodology used for valuing securities may not be an indication of the risk associated with investing in those securities. For more information on valuation inputs please refer to the Investment Valuation section in the accompanying Notes to Financial Statements.
See accompanying notes which are an integral part of the financial statements.
Fidelity Flex℠ Freedom 2020 Fund
Financial Statements
Statement of Assets and Liabilities
| | | March 31, 2019 |
| Assets | | |
Investment in securities, at value — See accompanying schedule:
| | |
| Affiliated issuers (cost $111,625) | $110,208 | |
| Total Investment in Securities (cost $111,625) | | $110,208 |
| Receivable for investments sold | | 1,396 |
| Total assets | | 111,604 |
| Liabilities | | |
| Payable for investments purchased | $1,396 | |
| Total liabilities | | 1,396 |
| Net Assets | | $110,208 |
| Net Assets consist of: | | |
| Paid in capital | | $109,039 |
| Total distributable earnings (loss) | | 1,169 |
| Net Assets, for 10,913 shares outstanding | | $110,208 |
| Net Asset Value, offering price and redemption price per share ($110,208 ÷ 10,913 shares) | | $10.10 |
See accompanying notes which are an integral part of the financial statements.
Statement of Operations
| | | Year ended March 31, 2019 |
| Investment Income | | |
| Dividends: | | |
| Affiliated issuers | | $2,577 |
| Expenses | | |
| Independent trustees' fees and expenses | $1 | |
| Total expenses | | 1 |
| Net investment income (loss) | | 2,576 |
| Realized and Unrealized Gain (Loss) | | |
| Net realized gain (loss) on: | | |
| Investment securities: | | |
| Affiliated issuers | (9) | |
| Capital gain distributions from underlying funds: | | |
| Affiliated issuers | 3,843 | |
| Total net realized gain (loss) | | 3,834 |
| Change in net unrealized appreciation (depreciation) on: | | |
| Investment securities: | | |
| Affiliated issuers | (2,888) | |
| Total change in net unrealized appreciation (depreciation) | | (2,888) |
| Net gain (loss) | | 946 |
| Net increase (decrease) in net assets resulting from operations | | $3,522 |
See accompanying notes which are an integral part of the financial statements.
Statement of Changes in Net Assets
| | Year ended March 31, 2019 | For the period
June 8, 2017 (commencement of operations) to March 31, 2018 |
| Increase (Decrease) in Net Assets | | |
| Operations | | |
| Net investment income (loss) | $2,576 | $1,888 |
| Net realized gain (loss) | 3,834 | 3,327 |
| Change in net unrealized appreciation (depreciation) | (2,888) | 1,471 |
| Net increase (decrease) in net assets resulting from operations | 3,522 | 6,686 |
| Distributions to shareholders | (6,307) | – |
| Distributions to shareholders from net investment income | – | (1,570) |
| Distributions to shareholders from net realized gain | – | (1,160) |
| Total distributions | (6,307) | (2,730) |
| Share transactions | | |
| Proceeds from sales of shares | – | 100,000 |
| Reinvestment of distributions | 6,307 | 2,730 |
| Net increase (decrease) in net assets resulting from share transactions | 6,307 | 102,730 |
| Total increase (decrease) in net assets | 3,522 | 106,686 |
| Net Assets | | |
| Beginning of period | 106,686 | – |
| End of period | $110,208 | $106,686 |
| Other Information | | |
| Undistributed net investment income end of period | | $317 |
| Shares | | |
| Sold | – | 10,000 |
| Issued in reinvestment of distributions | 651 | 262 |
| Net increase (decrease) | 651 | 10,262 |
See accompanying notes which are an integral part of the financial statements.
Financial Highlights
Fidelity Flex Freedom 2020 Fund
| | | |
| Years ended March 31, | 2019 | 2018 A |
| Selected Per–Share Data | | |
| Net asset value, beginning of period | $10.40 | $10.00 |
| Income from Investment Operations | | |
| Net investment income (loss)B | .24 | .19 |
| Net realized and unrealized gain (loss) | .07 | .48 |
| Total from investment operations | .31 | .67 |
| Distributions from net investment income | (.24) | (.16) |
| Distributions from net realized gain | (.36) | (.12) |
| Total distributions | (.61)C | (.27)D |
| Net asset value, end of period | $10.10 | $10.40 |
| Total ReturnE | 3.28% | 6.72% |
| Ratios to Average Net AssetsF,G | | |
| Expenses before reductions | - %H | - %I |
| Expenses net of fee waivers, if any | - %H | - %I |
| Expenses net of all reductions | - %H | - %I |
| Net investment income (loss) | 2.41% | 2.22%I |
| Supplemental Data | | |
| Net assets, end of period (000 omitted) | $110 | $107 |
| Portfolio turnover rateF | 22% | 14%I |
A For the period June 8, 2017 (commencement of operations) to March 31, 2018.
B Calculated based on average shares outstanding during the period.
C Total distributions of $.61 per share is comprised of distributions from net investment income of $.243 and distributions from net realized gain of $.363 per share.
D Total distributions of $.27 per share is comprised of distributions from net investment income of $.157 and distributions from net realized gain of $.116 per share.
E Total returns for periods of less than one year are not annualized.
F Amounts do not include the activity of the Underlying Funds.
G Expense ratios reflect operating expenses of the Fund. Expenses before reductions do not reflect amounts reimbursed by the investment adviser or reductions from expense offset arrangements and do not represent the amount paid by the Fund during periods when reimbursements or reductions occur. Expenses net of fee waivers reflect expenses after reimbursement by the investment adviser but prior to reductions from expense offset arrangements. Expenses net of all reductions represent the net expenses paid by the Fund but do not include expenses of the underlying funds in which the Fund invests.
H Amount represents less than .005%.
I Annualized
See accompanying notes which are an integral part of the financial statements.
Fidelity Flex℠ Freedom 2025 Fund
Investment Summary (Unaudited)
The information in the following tables is based on the direct investments of the Fund.
Top Holdings as of March 31, 2019
| | % of fund's net assets |
| Fidelity Series Investment Grade Bond Fund | 20.3 |
| Fidelity Series Emerging Markets Opportunities Fund | 6.6 |
| Fidelity Series Intrinsic Opportunities Fund | 6.6 |
| Fidelity Series International Growth Fund | 6.2 |
| Fidelity Series International Value Fund | 6.1 |
| Fidelity Series Large Cap Stock Fund | 5.7 |
| Fidelity Series Long-Term Treasury Bond Index Fund | 5.6 |
| Fidelity Series Growth Company Fund | 5.4 |
| Fidelity Series Government Money Market Fund 2.50% | 4.6 |
| Fidelity Series Stock Selector Large Cap Value Fund | 4.4 |
| | 71.5 |
Asset Allocation (% of fund's net assets)
| Period end |
| | Domestic Equity Funds | 40.0% |
| | International Equity Funds | 21.8% |
| | Bond Funds | 32.4% |
| | Short-Term Funds | 5.8% |

Domestic Equity Funds category includes Fidelity Series Commodity Strategy Fund which invests in commodity-related investments.
Fidelity Flex℠ Freedom 2025 Fund
Schedule of Investments March 31, 2019
Showing Percentage of Net Assets
| Domestic Equity Funds - 40.0% | | | |
| | | Shares | Value |
| Fidelity Series All-Sector Equity Fund (a) | | 170 | $1,637 |
| Fidelity Series Blue Chip Growth Fund (a) | | 200 | 2,947 |
| Fidelity Series Commodity Strategy Fund (a) | | 692 | 3,301 |
| Fidelity Series Growth Company Fund (a) | | 353 | 5,970 |
| Fidelity Series Intrinsic Opportunities Fund (a) | | 446 | 7,331 |
| Fidelity Series Large Cap Stock Fund (a) | | 434 | 6,355 |
| Fidelity Series Large Cap Value Index Fund (a) | | 143 | 1,773 |
| Fidelity Series Opportunistic Insights Fund (a) | | 184 | 3,212 |
| Fidelity Series Small Cap Discovery Fund (a) | | 76 | 847 |
| Fidelity Series Small Cap Opportunities Fund (a) | | 196 | 2,637 |
| Fidelity Series Stock Selector Large Cap Value Fund (a) | | 410 | 4,841 |
| Fidelity Series Value Discovery Fund (a) | | 274 | 3,423 |
| TOTAL DOMESTIC EQUITY FUNDS | | | |
| (Cost $44,968) | | | 44,274 |
|
| International Equity Funds - 21.8% | | | |
| Fidelity Series Canada Fund (a) | | 71 | 734 |
| Fidelity Series Emerging Markets Fund (a) | | 83 | 810 |
| Fidelity Series Emerging Markets Opportunities Fund (a) | | 396 | 7,333 |
| Fidelity Series International Growth Fund (a) | | 451 | 6,847 |
| Fidelity Series International Small Cap Fund (a) | | 106 | 1,642 |
| Fidelity Series International Value Fund (a) | | 731 | 6,801 |
| TOTAL INTERNATIONAL EQUITY FUNDS | | | |
| (Cost $25,064) | | | 24,167 |
|
| Bond Funds - 32.4% | | | |
| Fidelity Series Emerging Markets Debt Fund (a) | | 81 | 774 |
| Fidelity Series Floating Rate High Income Fund (a) | | 18 | 164 |
| Fidelity Series High Income Fund (a) | | 89 | 833 |
| Fidelity Series Inflation-Protected Bond Index Fund (a) | | 492 | 4,810 |
| Fidelity Series International Credit Fund (a) | | 7 | 69 |
| Fidelity Series Investment Grade Bond Fund (a) | | 2,015 | 22,523 |
| Fidelity Series Long-Term Treasury Bond Index Fund (a) | | 702 | 6,228 |
| Fidelity Series Real Estate Income Fund (a) | | 48 | 519 |
| TOTAL BOND FUNDS | | | |
| (Cost $35,934) | | | 35,920 |
|
| Short-Term Funds - 5.8% | | | |
| Fidelity Series Government Money Market Fund 2.50% (a)(b) | | 5,119 | 5,119 |
| Fidelity Series Short-Term Credit Fund (a) | | 128 | 1,280 |
| TOTAL SHORT-TERM FUNDS | | | |
| (Cost $6,398) | | | 6,399 |
| TOTAL INVESTMENT IN SECURITIES - 100.0% | | | |
| (Cost $112,364) | | | 110,760 |
| NET OTHER ASSETS (LIABILITIES) - 0.0% | | | 1 |
| NET ASSETS - 100% | | | $110,761 |
Legend
(a) Affiliated Fund
(b) The rate quoted is the annualized seven-day yield of the fund at period end.
Affiliated Underlying Funds
Fiscal year to date information regarding the Fund's investments in affiliated Underlying Funds, excluding any Money Market Central Funds, is presented below. Exchanges between classes of the same affiliated Underlying Funds may occur.
| Affiliate | Value, beginning of period | Purchases | Sales Proceeds | Dividend Income | Realized Gain (loss) | Change in Unrealized appreciation (depreciation) | Value, end of period |
| Fidelity Series 100 Index Fund | $1,446 | $-- | $1,496 | $-- | $150 | $(100) | $-- |
| Fidelity Series All-Sector Equity Fund | 2,774 | 553 | 1,535 | 401 | 30 | (185) | 1,637 |
| Fidelity Series Blue Chip Growth Fund | 2,867 | 646 | 688 | 384 | 19 | 103 | 2,947 |
| Fidelity Series Canada Fund | 665 | 179 | 121 | 16 | (2) | 13 | 734 |
| Fidelity Series Commodity Strategy Fund | 2,284 | 1,517 | 216 | 150 | (11) | (273) | 3,301 |
| Fidelity Series Emerging Markets Debt Fund | 731 | 160 | 82 | 43 | (7) | (28) | 774 |
| Fidelity Series Emerging Markets Fund | -- | 825 | 24 | 3 | (1) | 10 | 810 |
| Fidelity Series Emerging Markets Opportunities Fund | 7,122 | 2,619 | 1,320 | 584 | (63) | (1,025) | 7,333 |
| Fidelity Series Floating Rate High Income Fund | 250 | 18 | 99 | 14 | (1) | (4) | 164 |
| Fidelity Series Government Money Market Fund 2.50% | 6,818 | 2,632 | 4,331 | 122 | -- | -- | 5,119 |
| Fidelity Series Growth Company Fund | 5,867 | 1,563 | 1,412 | 635 | 42 | (90) | 5,970 |
| Fidelity Series High Income Fund | 1,540 | 99 | 784 | 99 | (27) | 5 | 833 |
| Fidelity Series Inflation-Protected Bond Index Fund | 877 | 4,032 | 117 | 81 | (3) | 21 | 4,810 |
| Fidelity Series International Credit Fund | 51 | 18 | -- | 3 | -- | -- | 69 |
| Fidelity Series International Growth Fund | 6,786 | 1,099 | 684 | 438 | (16) | (338) | 6,847 |
| Fidelity Series International Small Cap Fund | 1,693 | 325 | 104 | 149 | (3) | (269) | 1,642 |
| Fidelity Series International Value Fund | 6,778 | 1,156 | 322 | 240 | 4 | (815) | 6,801 |
| Fidelity Series Intrinsic Opportunities Fund | 6,932 | 1,514 | 474 | 568 | -- | (641) | 7,331 |
| Fidelity Series Investment Grade Bond Fund | 23,448 | 2,340 | 3,568 | 721 | (78) | 381 | 22,523 |
| Fidelity Series Large Cap Stock Fund | 6,472 | 1,199 | 1,160 | 647 | 16 | (172) | 6,355 |
| Fidelity Series Large Cap Value Index Fund | 1,797 | 218 | 271 | 82 | 10 | 19 | 1,773 |
| Fidelity Series Long-Term Treasury Bond Index Fund | 2,390 | 4,531 | 951 | 147 | (30) | 288 | 6,228 |
| Fidelity Series Opportunistic Insights Fund | 3,142 | 585 | 544 | 276 | 9 | 20 | 3,212 |
| Fidelity Series Real Estate Equity Fund | 543 | 45 | 607 | 6 | (34) | 53 | -- |
| Fidelity Series Real Estate Income Fund | 475 | 51 | 16 | 37 | -- | 9 | 519 |
| Fidelity Series Short-Term Credit Fund | 1,699 | 420 | 854 | 37 | (8) | 23 | 1,280 |
| Fidelity Series Small Cap Discovery Fund | 855 | 175 | 110 | 107 | (7) | (66) | 847 |
| Fidelity Series Small Cap Opportunities Fund | 2,611 | 636 | 490 | 299 | (17) | (103) | 2,637 |
| Fidelity Series Stock Selector Large Cap Value Fund | 4,896 | 664 | 567 | 405 | (12) | (140) | 4,841 |
| Fidelity Series Value Discovery Fund | 3,479 | 405 | 381 | 203 | (2) | (78) | 3,423 |
| Total | $107,288 | $30,224 | $23,328 | $6,897 | $(42) | $(3,382) | $110,760 |
Amounts in the income column in the above table include any capital gain distributions from underlying funds, which are presented in the corresponding line-item in the Statement of Operations, if applicable.
Investment Valuation
All investments are categorized as Level 1 under the Fair Value Hierarchy. The inputs or methodology used for valuing securities may not be an indication of the risk associated with investing in those securities. For more information on valuation inputs please refer to the Investment Valuation section in the accompanying Notes to Financial Statements.
See accompanying notes which are an integral part of the financial statements.
Fidelity Flex℠ Freedom 2025 Fund
Financial Statements
Statement of Assets and Liabilities
| | | March 31, 2019 |
| Assets | | |
Investment in securities, at value — See accompanying schedule:
| | |
| Affiliated issuers (cost $112,364) | $110,760 | |
| Total Investment in Securities (cost $112,364) | | $110,760 |
| Receivable for investments sold | | 1,513 |
| Total assets | | 112,273 |
| Liabilities | | |
| Payable for investments purchased | $1,512 | |
| Total liabilities | | 1,512 |
| Net Assets | | $110,761 |
| Net Assets consist of: | | |
| Paid in capital | | $109,461 |
| Total distributable earnings (loss) | | 1,300 |
| Net Assets, for 10,955 shares outstanding | | $110,761 |
| Net Asset Value, offering price and redemption price per share ($110,761 ÷ 10,955 shares) | | $10.11 |
See accompanying notes which are an integral part of the financial statements.
Statement of Operations
| | | Year ended March 31, 2019 |
| Investment Income | | |
| Dividends: | | |
| Affiliated issuers | | $2,554 |
| Expenses | | |
| Independent trustees' fees and expenses | $1 | |
| Total expenses | | 1 |
| Net investment income (loss) | | 2,553 |
| Realized and Unrealized Gain (Loss) | | |
| Net realized gain (loss) on: | | |
| Investment securities: | | |
| Affiliated issuers | (42) | |
| Capital gain distributions from underlying funds: | | |
| Affiliated issuers | 4,343 | |
| Total net realized gain (loss) | | 4,301 |
| Change in net unrealized appreciation (depreciation) on: | | |
| Investment securities: | | |
| Affiliated issuers | (3,382) | |
| Total change in net unrealized appreciation (depreciation) | | (3,382) |
| Net gain (loss) | | 919 |
| Net increase (decrease) in net assets resulting from operations | | $3,472 |
See accompanying notes which are an integral part of the financial statements.
Statement of Changes in Net Assets
| | Year ended March 31, 2019 | For the period
June 8, 2017 (commencement of operations) to March 31, 2018 |
| Increase (Decrease) in Net Assets | | |
| Operations | | |
| Net investment income (loss) | $2,553 | $1,878 |
| Net realized gain (loss) | 4,301 | 3,633 |
| Change in net unrealized appreciation (depreciation) | (3,382) | 1,778 |
| Net increase (decrease) in net assets resulting from operations | 3,472 | 7,289 |
| Distributions to shareholders | (6,609) | – |
| Distributions to shareholders from net investment income | – | (1,600) |
| Distributions to shareholders from net realized gain | – | (1,250) |
| Total distributions | (6,609) | (2,850) |
| Share transactions | | |
| Proceeds from sales of shares | – | 100,000 |
| Reinvestment of distributions | 6,609 | 2,850 |
| Net increase (decrease) in net assets resulting from share transactions | 6,609 | 102,850 |
| Total increase (decrease) in net assets | 3,472 | 107,289 |
| Net Assets | | |
| Beginning of period | 107,289 | – |
| End of period | $110,761 | $107,289 |
| Other Information | | |
| Undistributed net investment income end of period | | $278 |
| Shares | | |
| Sold | – | 10,000 |
| Issued in reinvestment of distributions | 683 | 272 |
| Net increase (decrease) | 683 | 10,272 |
See accompanying notes which are an integral part of the financial statements.
Financial Highlights
Fidelity Flex Freedom 2025 Fund
| | | |
| Years ended March 31, | 2019 | 2018 A |
| Selected Per–Share Data | | |
| Net asset value, beginning of period | $10.44 | $10.00 |
| Income from Investment Operations | | |
| Net investment income (loss)B | .24 | .19 |
| Net realized and unrealized gain (loss) | .06 | .54 |
| Total from investment operations | .30 | .73 |
| Distributions from net investment income | (.24) | (.16) |
| Distributions from net realized gain | (.39) | (.13) |
| Total distributions | (.63) | (.29) |
| Net asset value, end of period | $10.11 | $10.44 |
| Total ReturnC | 3.28% | 7.24% |
| Ratios to Average Net AssetsD,E | | |
| Expenses before reductions | - %F | - %G |
| Expenses net of fee waivers, if any | - %F | - %G |
| Expenses net of all reductions | - %F | - %G |
| Net investment income (loss) | 2.37% | 2.20%G |
| Supplemental Data | | |
| Net assets, end of period (000 omitted) | $111 | $107 |
| Portfolio turnover rateD | 22% | 14%G |
A For the period June 8, 2017 (commencement of operations) to March 31, 2018.
B Calculated based on average shares outstanding during the period.
C Total returns for periods of less than one year are not annualized.
D Amounts do not include the activity of the Underlying Funds.
E Expense ratios reflect operating expenses of the Fund. Expenses before reductions do not reflect amounts reimbursed by the investment adviser or reductions from expense offset arrangements and do not represent the amount paid by the Fund during periods when reimbursements or reductions occur. Expenses net of fee waivers reflect expenses after reimbursement by the investment adviser but prior to reductions from expense offset arrangements. Expenses net of all reductions represent the net expenses paid by the Fund but do not include expenses of the underlying funds in which the Fund invests.
F Amount represents less than .005%.
G Annualized
See accompanying notes which are an integral part of the financial statements.
Fidelity Flex℠ Freedom 2030 Fund
Investment Summary (Unaudited)
The information in the following tables is based on the direct investments of the Fund.
Top Holdings as of March 31, 2019
| | % of fund's net assets |
| Fidelity Series Investment Grade Bond Fund | 15.8 |
| Fidelity Series Intrinsic Opportunities Fund | 8.0 |
| Fidelity Series Emerging Markets Opportunities Fund | 7.5 |
| Fidelity Series International Growth Fund | 7.2 |
| Fidelity Series International Value Fund | 7.2 |
| Fidelity Series Large Cap Stock Fund | 7.0 |
| Fidelity Series Growth Company Fund | 6.5 |
| Fidelity Series Long-Term Treasury Bond Index Fund | 5.7 |
| Fidelity Series Stock Selector Large Cap Value Fund | 5.3 |
| Fidelity Series Value Discovery Fund | 3.8 |
| | 74.0 |
Asset Allocation (% of fund's net assets)
| Period end |
| | Domestic Equity Funds | 47.8% |
| | International Equity Funds | 25.2% |
| | Bond Funds | 25.3% |
| | Short-Term Funds | 1.7% |

Domestic Equity Funds category includes Fidelity Series Commodity Strategy Fund which invests in commodity-related investments.
Fidelity Flex℠ Freedom 2030 Fund
Schedule of Investments March 31, 2019
Showing Percentage of Net Assets
| Domestic Equity Funds - 47.8% | | | |
| | | Shares | Value |
| Fidelity Series All-Sector Equity Fund (a) | | 208 | $2,003 |
| Fidelity Series Blue Chip Growth Fund (a) | | 245 | 3,608 |
| Fidelity Series Commodity Strategy Fund (a) | | 700 | 3,337 |
| Fidelity Series Growth Company Fund (a) | | 433 | 7,314 |
| Fidelity Series Intrinsic Opportunities Fund (a) | | 546 | 8,986 |
| Fidelity Series Large Cap Stock Fund (a) | | 532 | 7,794 |
| Fidelity Series Large Cap Value Index Fund (a) | | 175 | 2,173 |
| Fidelity Series Opportunistic Insights Fund (a) | | 225 | 3,933 |
| Fidelity Series Small Cap Discovery Fund (a) | | 95 | 1,054 |
| Fidelity Series Small Cap Opportunities Fund (a) | | 240 | 3,228 |
| Fidelity Series Stock Selector Large Cap Value Fund (a) | | 502 | 5,922 |
| Fidelity Series Value Discovery Fund (a) | | 337 | 4,207 |
| TOTAL DOMESTIC EQUITY FUNDS | | | |
| (Cost $54,470) | | | 53,559 |
|
| International Equity Funds - 25.2% | | | |
| Fidelity Series Canada Fund (a) | | 84 | 868 |
| Fidelity Series Emerging Markets Fund (a) | | 95 | 927 |
| Fidelity Series Emerging Markets Opportunities Fund (a) | | 452 | 8,384 |
| Fidelity Series International Growth Fund (a) | | 533 | 8,091 |
| Fidelity Series International Small Cap Fund (a) | | 125 | 1,941 |
| Fidelity Series International Value Fund (a) | | 864 | 8,038 |
| TOTAL INTERNATIONAL EQUITY FUNDS | | | |
| (Cost $29,336) | | | 28,249 |
|
| Bond Funds - 25.3% | | | |
| Fidelity Series Emerging Markets Debt Fund (a) | | 82 | 784 |
| Fidelity Series Floating Rate High Income Fund (a) | | 18 | 168 |
| Fidelity Series High Income Fund (a) | | 90 | 842 |
| Fidelity Series Inflation-Protected Bond Index Fund (a) | | 183 | 1,794 |
| Fidelity Series International Credit Fund (a) | | 6 | 59 |
| Fidelity Series Investment Grade Bond Fund (a) | | 1,584 | 17,708 |
| Fidelity Series Long-Term Treasury Bond Index Fund (a) | | 726 | 6,438 |
| Fidelity Series Real Estate Income Fund (a) | | 48 | 524 |
| TOTAL BOND FUNDS | | | |
| (Cost $28,232) | | | 28,317 |
|
| Short-Term Funds - 1.7% | | | |
| Fidelity Series Government Money Market Fund 2.50% (a)(b) | | 1,475 | 1,475 |
| Fidelity Series Short-Term Credit Fund (a) | | 37 | 369 |
| TOTAL SHORT-TERM FUNDS | | | |
| (Cost $1,840) | | | 1,844 |
| TOTAL INVESTMENT IN SECURITIES - 100.0% | | | |
| (Cost $113,878) | | | 111,969 |
| NET OTHER ASSETS (LIABILITIES) - 0.0% | | | 0 |
| NET ASSETS - 100% | | | $111,969 |
Legend
(a) Affiliated Fund
(b) The rate quoted is the annualized seven-day yield of the fund at period end.
Affiliated Underlying Funds
Fiscal year to date information regarding the Fund's investments in affiliated Underlying Funds, excluding any Money Market Central Funds, is presented below. Exchanges between classes of the same affiliated Underlying Funds may occur.
| Affiliate | Value, beginning of period | Purchases | Sales Proceeds | Dividend Income | Realized Gain (loss) | Change in Unrealized appreciation (depreciation) | Value, end of period |
| Fidelity Series 100 Index Fund | $1,787 | $-- | $1,841 | $-- | $178 | $(124) | $-- |
| Fidelity Series All-Sector Equity Fund | 3,427 | 624 | 1,853 | 495 | 40 | (235) | 2,003 |
| Fidelity Series Blue Chip Growth Fund | 3,543 | 701 | 777 | 475 | 22 | 119 | 3,608 |
| Fidelity Series Canada Fund | 802 | 214 | 160 | 19 | (1) | 13 | 868 |
| Fidelity Series Commodity Strategy Fund | 2,300 | 1,551 | 225 | 152 | (12) | (277) | 3,337 |
| Fidelity Series Emerging Markets Debt Fund | 720 | 165 | 66 | 43 | (6) | (29) | 784 |
| Fidelity Series Emerging Markets Fund | -- | 955 | 37 | 4 | (2) | 11 | 927 |
| Fidelity Series Emerging Markets Opportunities Fund | 8,381 | 2,891 | 1,606 | 670 | (57) | (1,225) | 8,384 |
| Fidelity Series Floating Rate High Income Fund | 239 | 22 | 88 | 14 | (1) | (4) | 168 |
| Fidelity Series Government Money Market Fund 2.50% | 1,625 | 2,048 | 2,198 | 39 | -- | -- | 1,475 |
| Fidelity Series Growth Company Fund | 7,220 | 1,745 | 1,566 | 781 | 34 | (119) | 7,314 |
| Fidelity Series High Income Fund | 1,519 | 99 | 755 | 98 | (25) | 4 | 842 |
| Fidelity Series Inflation-Protected Bond Index Fund | 840 | 1,275 | 344 | 18 | (4) | 27 | 1,794 |
| Fidelity Series International Credit Fund | 51 | 8 | -- | 3 | -- | -- | 59 |
| Fidelity Series International Growth Fund | 8,098 | 1,217 | 791 | 519 | (26) | (407) | 8,091 |
| Fidelity Series International Small Cap Fund | 2,021 | 393 | 144 | 177 | (2) | (327) | 1,941 |
| Fidelity Series International Value Fund | 8,176 | 1,298 | 471 | 285 | 5 | (970) | 8,038 |
| Fidelity Series Intrinsic Opportunities Fund | 8,600 | 1,752 | 562 | 708 | (7) | (797) | 8,986 |
| Fidelity Series Investment Grade Bond Fund | 16,810 | 2,800 | 2,150 | 546 | (59) | 307 | 17,708 |
| Fidelity Series Large Cap Stock Fund | 7,747 | 1,373 | 1,110 | 801 | 4 | (220) | 7,794 |
| Fidelity Series Large Cap Value Index Fund | 2,221 | 213 | 293 | 101 | 9 | 23 | 2,173 |
| Fidelity Series Long-Term Treasury Bond Index Fund | 2,462 | 4,858 | 1,140 | 153 | (43) | 301 | 6,438 |
| Fidelity Series Opportunistic Insights Fund | 3,883 | 639 | 620 | 339 | 9 | 22 | 3,933 |
| Fidelity Series Real Estate Equity Fund | 666 | 8 | 699 | 7 | (40) | 65 | -- |
| Fidelity Series Real Estate Income Fund | 475 | 45 | 6 | 36 | -- | 10 | 524 |
| Fidelity Series Short-Term Credit Fund | 345 | 512 | 493 | 12 | (3) | 8 | 369 |
| Fidelity Series Small Cap Discovery Fund | 1,056 | 205 | 109 | 132 | (11) | (87) | 1,054 |
| Fidelity Series Small Cap Opportunities Fund | 3,227 | 724 | 566 | 371 | (22) | (135) | 3,228 |
| Fidelity Series Stock Selector Large Cap Value Fund | 6,050 | 771 | 703 | 499 | (14) | (182) | 5,922 |
| Fidelity Series Value Discovery Fund | 4,300 | 447 | 436 | 250 | (2) | (102) | 4,207 |
| Total | $108,591 | $29,553 | $21,809 | $7,747 | $(36) | $(4,330) | $111,969 |
Amounts in the income column in the above table include any capital gain distributions from underlying funds, which are presented in the corresponding line-item in the Statement of Operations, if applicable.
Investment Valuation
All investments are categorized as Level 1 under the Fair Value Hierarchy. The inputs or methodology used for valuing securities may not be an indication of the risk associated with investing in those securities. For more information on valuation inputs please refer to the Investment Valuation section in the accompanying Notes to Financial Statements.
See accompanying notes which are an integral part of the financial statements.
Fidelity Flex℠ Freedom 2030 Fund
Financial Statements
Statement of Assets and Liabilities
| | | March 31, 2019 |
| Assets | | |
Investment in securities, at value — See accompanying schedule:
| | |
| Affiliated issuers (cost $113,878) | $111,969 | |
| Total Investment in Securities (cost $113,878) | | $111,969 |
| Receivable for investments sold | | 1,593 |
| Total assets | | 113,562 |
| Liabilities | | |
| Payable for investments purchased | $1,593 | |
| Total liabilities | | 1,593 |
| Net Assets | | $111,969 |
| Net Assets consist of: | | |
| Paid in capital | | $110,466 |
| Total distributable earnings (loss) | | 1,503 |
| Net Assets, for 11,055 shares outstanding | | $111,969 |
| Net Asset Value, offering price and redemption price per share ($111,969 ÷ 11,055 shares) | | $10.13 |
See accompanying notes which are an integral part of the financial statements.
Statement of Operations
| | | Year ended March 31, 2019 |
| Investment Income | | |
| Dividends: | | |
| Affiliated issuers | | $2,534 |
| Expenses | | |
| Independent trustees' fees and expenses | $1 | |
| Total expenses | | 1 |
| Net investment income (loss) | | 2,533 |
| Realized and Unrealized Gain (Loss) | | |
| Net realized gain (loss) on: | | |
| Investment securities: | | |
| Affiliated issuers | (36) | |
| Capital gain distributions from underlying funds: | | |
| Affiliated issuers | 5,213 | |
| Total net realized gain (loss) | | 5,177 |
| Change in net unrealized appreciation (depreciation) on: | | |
| Investment securities: | | |
| Affiliated issuers | (4,330) | |
| Total change in net unrealized appreciation (depreciation) | | (4,330) |
| Net gain (loss) | | 847 |
| Net increase (decrease) in net assets resulting from operations | | $3,380 |
See accompanying notes which are an integral part of the financial statements.
Statement of Changes in Net Assets
| | Year ended March 31, 2019 | For the period
June 8, 2017 (commencement of operations) to March 31, 2018 |
| Increase (Decrease) in Net Assets | | |
| Operations | | |
| Net investment income (loss) | $2,533 | $1,849 |
| Net realized gain (loss) | 5,177 | 4,320 |
| Change in net unrealized appreciation (depreciation) | (4,330) | 2,421 |
| Net increase (decrease) in net assets resulting from operations | 3,380 | 8,590 |
| Distributions to shareholders | (7,326) | – |
| Distributions to shareholders from net investment income | – | (1,650) |
| Distributions to shareholders from net realized gain | – | (1,490) |
| Total distributions | (7,326) | (3,140) |
| Share transactions | | |
| Proceeds from sales of shares | – | 100,000 |
| Reinvestment of distributions | 7,325 | 3,140 |
| Net increase (decrease) in net assets resulting from share transactions | 7,325 | 103,140 |
| Total increase (decrease) in net assets | 3,379 | 108,590 |
| Net Assets | | |
| Beginning of period | 108,590 | – |
| End of period | $111,969 | $108,590 |
| Other Information | | |
| Undistributed net investment income end of period | | $199 |
| Shares | | |
| Sold | – | 10,000 |
| Issued in reinvestment of distributions | 758 | 297 |
| Net increase (decrease) | 758 | 10,297 |
See accompanying notes which are an integral part of the financial statements.
Financial Highlights
Fidelity Flex Freedom 2030 Fund
| | | |
| Years ended March 31, | 2019 | 2018 A |
| Selected Per–Share Data | | |
| Net asset value, beginning of period | $10.55 | $10.00 |
| Income from Investment Operations | | |
| Net investment income (loss)B | .24 | .18 |
| Net realized and unrealized gain (loss) | .04 | .68 |
| Total from investment operations | .28 | .86 |
| Distributions from net investment income | (.24) | (.17) |
| Distributions from net realized gain | (.46) | (.15) |
| Total distributions | (.70) | (.31)C |
| Net asset value, end of period | $10.13 | $10.55 |
| Total ReturnD | 3.09% | 8.63% |
| Ratios to Average Net AssetsE,F | | |
| Expenses before reductions | - %G | - %H |
| Expenses net of fee waivers, if any | - %G | - %H |
| Expenses net of all reductions | - %G | - %H |
| Net investment income (loss) | 2.32% | 2.15%H |
| Supplemental Data | | |
| Net assets, end of period (000 omitted) | $112 | $109 |
| Portfolio turnover rateE | 20% | 15%H |
A For the period June 8, 2017 (commencement of operations) to March 31, 2018.
B Calculated based on average shares outstanding during the period.
C Total distributions of $.31 per share is comprised of distributions from net investment income of $.165 and distributions from net realized gain of $.149 per share.
D Total returns for periods of less than one year are not annualized.
E Amounts do not include the activity of the Underlying Funds.
F Expense ratios reflect operating expenses of the Fund. Expenses before reductions do not reflect amounts reimbursed by the investment adviser or reductions from expense offset arrangements and do not represent the amount paid by the Fund during periods when reimbursements or reductions occur. Expenses net of fee waivers reflect expenses after reimbursement by the investment adviser but prior to reductions from expense offset arrangements. Expenses net of all reductions represent the net expenses paid by the Fund but do not include expenses of the underlying funds in which the Fund invests.
G Amount represents less than .005%.
H Annualized
See accompanying notes which are an integral part of the financial statements.
Fidelity Flex℠ Freedom 2035 Fund
Investment Summary (Unaudited)
The information in the following tables is based on the direct investments of the Fund.
Top Holdings as of March 31, 2019
| | % of fund's net assets |
| Fidelity Series Intrinsic Opportunities Fund | 9.8 |
| Fidelity Series International Growth Fund | 8.5 |
| Fidelity Series International Value Fund | 8.5 |
| Fidelity Series Emerging Markets Opportunities Fund | 8.5 |
| Fidelity Series Large Cap Stock Fund | 8.5 |
| Fidelity Series Growth Company Fund | 7.9 |
| Fidelity Series Stock Selector Large Cap Value Fund | 6.4 |
| Fidelity Series Long-Term Treasury Bond Index Fund | 5.7 |
| Fidelity Series Value Discovery Fund | 4.6 |
| Fidelity Series Opportunistic Insights Fund | 4.3 |
| | 72.7 |
Asset Allocation (% of fund's net assets)
| Period end |
| | Domestic Equity Funds | 57.6% |
| | International Equity Funds | 29.4% |
| | Bond Funds | 11.3% |
| | Short-Term Funds | 1.7% |

Domestic Equity Funds category includes Fidelity Series Commodity Strategy Fund which invests in commodity-related investments.
Fidelity Flex℠ Freedom 2035 Fund
Schedule of Investments March 31, 2019
Showing Percentage of Net Assets
| Domestic Equity Funds - 57.6% | | | |
| | | Shares | Value |
| Fidelity Series All-Sector Equity Fund (a) | | 255 | $2,455 |
| Fidelity Series Blue Chip Growth Fund (a) | | 300 | 4,428 |
| Fidelity Series Commodity Strategy Fund (a) | | 704 | 3,359 |
| Fidelity Series Growth Company Fund (a) | | 530 | 8,966 |
| Fidelity Series Intrinsic Opportunities Fund (a) | | 670 | 11,016 |
| Fidelity Series Large Cap Stock Fund (a) | | 652 | 9,550 |
| Fidelity Series Large Cap Value Index Fund (a) | | 215 | 2,669 |
| Fidelity Series Opportunistic Insights Fund (a) | | 276 | 4,822 |
| Fidelity Series Small Cap Discovery Fund (a) | | 117 | 1,296 |
| Fidelity Series Small Cap Opportunities Fund (a) | | 294 | 3,958 |
| Fidelity Series Stock Selector Large Cap Value Fund (a) | | 616 | 7,274 |
| Fidelity Series Value Discovery Fund (a) | | 411 | 5,137 |
| TOTAL DOMESTIC EQUITY FUNDS | | | |
| (Cost $66,162) | | | 64,930 |
|
| International Equity Funds - 29.4% | | | |
| Fidelity Series Canada Fund (a) | | 100 | 1,034 |
| Fidelity Series Emerging Markets Fund (a) | | 108 | 1,056 |
| Fidelity Series Emerging Markets Opportunities Fund (a) | | 515 | 9,551 |
| Fidelity Series International Growth Fund (a) | | 634 | 9,635 |
| Fidelity Series International Small Cap Fund (a) | | 149 | 2,311 |
| Fidelity Series International Value Fund (a) | | 1,029 | 9,573 |
| TOTAL INTERNATIONAL EQUITY FUNDS | | | |
| (Cost $34,485) | | | 33,160 |
|
| Bond Funds - 11.3% | | | |
| Fidelity Series Emerging Markets Debt Fund (a) | | 82 | 789 |
| Fidelity Series Floating Rate High Income Fund (a) | | 18 | 169 |
| Fidelity Series High Income Fund (a) | | 90 | 848 |
| Fidelity Series Inflation-Protected Bond Index Fund (a) | | 35 | 338 |
| Fidelity Series International Credit Fund (a) | | 5 | 48 |
| Fidelity Series Investment Grade Bond Fund (a) | | 321 | 3,587 |
| Fidelity Series Long-Term Treasury Bond Index Fund (a) | | 731 | 6,480 |
| Fidelity Series Real Estate Income Fund (a) | | 48 | 529 |
| TOTAL BOND FUNDS | | | |
| (Cost $12,603) | | | 12,788 |
|
| Short-Term Funds - 1.7% | | | |
| Fidelity Series Government Money Market Fund 2.50% (a)(b) | | 1,485 | 1,485 |
| Fidelity Series Short-Term Credit Fund (a) | | 37 | 372 |
| TOTAL SHORT-TERM FUNDS | | | |
| (Cost $1,855) | | | 1,857 |
| TOTAL INVESTMENT IN SECURITIES - 100.0% | | | |
| (Cost $115,105) | | | 112,735 |
| NET OTHER ASSETS (LIABILITIES) - 0.0% | | | 1 |
| NET ASSETS - 100% | | | $112,736 |
Legend
(a) Affiliated Fund
(b) The rate quoted is the annualized seven-day yield of the fund at period end.
Affiliated Underlying Funds
Fiscal year to date information regarding the Fund's investments in affiliated Underlying Funds, excluding any Money Market Central Funds, is presented below. Exchanges between classes of the same affiliated Underlying Funds may occur.
| Affiliate | Value, beginning of period | Purchases | Sales Proceeds | Dividend Income | Realized Gain (loss) | Change in Unrealized appreciation (depreciation) | Value, end of period |
| Fidelity Series 100 Index Fund | $2,123 | $-- | $2,195 | $-- | $218 | $(146) | $-- |
| Fidelity Series All-Sector Equity Fund | 4,071 | 695 | 2,068 | 599 | 59 | (302) | 2,455 |
| Fidelity Series Blue Chip Growth Fund | 4,208 | 942 | 864 | 588 | -- | 142 | 4,428 |
| Fidelity Series Canada Fund | 938 | 230 | 147 | 22 | (3) | 16 | 1,034 |
| Fidelity Series Commodity Strategy Fund | 2,284 | 1,634 | 265 | 155 | (17) | (277) | 3,359 |
| Fidelity Series Emerging Markets Debt Fund | 710 | 207 | 95 | 42 | (6) | (27) | 789 |
| Fidelity Series Emerging Markets Fund | -- | 1,091 | 43 | 4 | (3) | 11 | 1,056 |
| Fidelity Series Emerging Markets Opportunities Fund | 9,789 | 3,368 | 2,122 | 759 | (45) | (1,439) | 9,551 |
| Fidelity Series Floating Rate High Income Fund | 239 | 27 | 89 | 14 | (1) | (7) | 169 |
| Fidelity Series Government Money Market Fund 2.50% | 1,785 | 1,519 | 1,819 | 38 | -- | -- | 1,485 |
| Fidelity Series Growth Company Fund | 8,679 | 1,996 | 1,575 | 948 | 9 | (143) | 8,966 |
| Fidelity Series High Income Fund | 1,509 | 98 | 738 | 98 | (24) | 3 | 848 |
| Fidelity Series Inflation-Protected Bond Index Fund | 881 | 70 | 621 | 6 | (8) | 16 | 338 |
| Fidelity Series International Credit Fund | 52 | 2 | 6 | 2 | -- | -- | 48 |
| Fidelity Series International Growth Fund | 9,425 | 1,675 | 936 | 615 | (35) | (494) | 9,635 |
| Fidelity Series International Small Cap Fund | 2,352 | 440 | 89 | 210 | (1) | (391) | 2,311 |
| Fidelity Series International Value Fund | 9,564 | 1,669 | 504 | 338 | (3) | (1,153) | 9,573 |
| Fidelity Series Intrinsic Opportunities Fund | 10,294 | 2,254 | 537 | 863 | (23) | (972) | 11,016 |
| Fidelity Series Investment Grade Bond Fund | 3,132 | 2,341 | 1,942 | 88 | (55) | 111 | 3,587 |
| Fidelity Series Large Cap Stock Fund | 9,204 | 1,619 | 990 | 967 | (2) | (281) | 9,550 |
| Fidelity Series Large Cap Value Index Fund | 2,636 | 233 | 232 | 123 | 3 | 29 | 2,669 |
| Fidelity Series Long-Term Treasury Bond Index Fund | 2,455 | 5,070 | 1,297 | 156 | (46) | 298 | 6,480 |
| Fidelity Series Opportunistic Insights Fund | 4,611 | 701 | 524 | 405 | 3 | 31 | 4,822 |
| Fidelity Series Real Estate Equity Fund | 786 | 65 | 885 | 9 | (42) | 76 | -- |
| Fidelity Series Real Estate Income Fund | 465 | 60 | 6 | 36 | -- | 10 | 529 |
| Fidelity Series Short-Term Credit Fund | 349 | 388 | 370 | 11 | (2) | 7 | 372 |
| Fidelity Series Small Cap Discovery Fund | 1,238 | 255 | 74 | 159 | (9) | (114) | 1,296 |
| Fidelity Series Small Cap Opportunities Fund | 3,810 | 838 | 482 | 452 | (25) | (183) | 3,958 |
| Fidelity Series Stock Selector Large Cap Value Fund | 7,097 | 1,021 | 587 | 608 | (8) | (249) | 7,274 |
| Fidelity Series Value Discovery Fund | 5,065 | 536 | 324 | 304 | (4) | (136) | 5,137 |
| Total | $109,751 | $31,044 | $22,426 | $8,619 | $(70) | $(5,564) | $112,735 |
Amounts in the income column in the above table include any capital gain distributions from underlying funds, which are presented in the corresponding line-item in the Statement of Operations, if applicable.
Investment Valuation
All investments are categorized as Level 1 under the Fair Value Hierarchy. The inputs or methodology used for valuing securities may not be an indication of the risk associated with investing in those securities. For more information on valuation inputs please refer to the Investment Valuation section in the accompanying Notes to Financial Statements.
See accompanying notes which are an integral part of the financial statements.
Fidelity Flex℠ Freedom 2035 Fund
Financial Statements
Statement of Assets and Liabilities
| | | March 31, 2019 |
| Assets | | |
Investment in securities, at value — See accompanying schedule:
| | |
| Affiliated issuers (cost $115,105) | $112,735 | |
| Total Investment in Securities (cost $115,105) | | $112,735 |
| Receivable for investments sold | | 1,683 |
| Total assets | | 114,418 |
| Liabilities | | |
| Payable for investments purchased | $1,682 | |
| Total liabilities | | 1,682 |
| Net Assets | | $112,736 |
| Net Assets consist of: | | |
| Paid in capital | | $111,059 |
| Total distributable earnings (loss) | | 1,677 |
| Net Assets, for 11,112 shares outstanding | | $112,736 |
| Net Asset Value, offering price and redemption price per share ($112,736 ÷ 11,112 shares) | | $10.15 |
See accompanying notes which are an integral part of the financial statements.
Statement of Operations
| | | Year ended March 31, 2019 |
| Investment Income | | |
| Dividends: | | |
| Affiliated issuers | | $2,380 |
| Expenses | | |
| Independent trustees' fees and expenses | $1 | |
| Total expenses | | 1 |
| Net investment income (loss) | | 2,379 |
| Realized and Unrealized Gain (Loss) | | |
| Net realized gain (loss) on: | | |
| Investment securities: | | |
| Affiliated issuers | (70) | |
| Capital gain distributions from underlying funds: | | |
| Affiliated issuers | 6,239 | |
| Total net realized gain (loss) | | 6,169 |
| Change in net unrealized appreciation (depreciation) on: | | |
| Investment securities: | | |
| Affiliated issuers | (5,564) | |
| Total change in net unrealized appreciation (depreciation) | | (5,564) |
| Net gain (loss) | | 605 |
| Net increase (decrease) in net assets resulting from operations | | $2,984 |
See accompanying notes which are an integral part of the financial statements.
Statement of Changes in Net Assets
| | Year ended March 31, 2019 | For the period
June 8, 2017 (commencement of operations) to March 31, 2018 |
| Increase (Decrease) in Net Assets | | |
| Operations | | |
| Net investment income (loss) | $2,379 | $1,753 |
| Net realized gain (loss) | 6,169 | 4,805 |
| Change in net unrealized appreciation (depreciation) | (5,564) | 3,194 |
| Net increase (decrease) in net assets resulting from operations | 2,984 | 9,752 |
| Distributions to shareholders | (7,779) | – |
| Distributions to shareholders from net investment income | – | (1,640) |
| Distributions to shareholders from net realized gain | – | (1,640) |
| Total distributions | (7,779) | (3,280) |
| Share transactions | | |
| Proceeds from sales of shares | – | 100,000 |
| Reinvestment of distributions | 7,779 | 3,280 |
| Net increase (decrease) in net assets resulting from share transactions | 7,779 | 103,280 |
| Total increase (decrease) in net assets | 2,984 | 109,752 |
| Net Assets | | |
| Beginning of period | 109,752 | – |
| End of period | $112,736 | $109,752 |
| Other Information | | |
| Undistributed net investment income end of period | | $113 |
| Shares | | |
| Sold | – | 10,000 |
| Issued in reinvestment of distributions | 805 | 307 |
| Net increase (decrease) | 805 | 10,307 |
See accompanying notes which are an integral part of the financial statements.
Financial Highlights
Fidelity Flex Freedom 2035 Fund
| | | |
| Years ended March 31, | 2019 | 2018 A |
| Selected Per–Share Data | | |
| Net asset value, beginning of period | $10.65 | $10.00 |
| Income from Investment Operations | | |
| Net investment income (loss)B | .22 | .17 |
| Net realized and unrealized gain (loss) | .02 | .81 |
| Total from investment operations | .24 | .98 |
| Distributions from net investment income | (.22) | (.16) |
| Distributions from net realized gain | (.52) | (.16) |
| Total distributions | (.74) | (.33)C |
| Net asset value, end of period | $10.15 | $10.65 |
| Total ReturnD | 2.75% | 9.77% |
| Ratios to Average Net AssetsE,F | | |
| Expenses before reductions | - %G | - %H |
| Expenses net of fee waivers, if any | - %G | - %H |
| Expenses net of all reductions | - %G | - %H |
| Net investment income (loss) | 2.16% | 2.02%H |
| Supplemental Data | | |
| Net assets, end of period (000 omitted) | $113 | $110 |
| Portfolio turnover rateF | 20% | 14%H |
A For the period June 8, 2017 (commencement of operations) to March 31, 2018.
B Calculated based on average shares outstanding during the period.
C Total distributions of $.33 per share is comprised of distributions from net investment income of $.164 and distributions from net realized gain of $.164 per share.
D Total returns for periods of less than one year are not annualized.
E Expense ratios reflect operating expenses of the Fund. Expenses before reductions do not reflect amounts reimbursed by the investment adviser or reductions from expense offset arrangements and do not represent the amount paid by the Fund during periods when reimbursements or reductions occur. Expenses net of fee waivers reflect expenses after reimbursement by the investment adviser but prior to reductions from expense offset arrangements. Expenses net of all reductions represent the net expenses paid by the Fund but do not include expenses of the underlying funds in which the Fund invests.
F Amounts do not include the activity of the Underlying Funds.
G Amount represents less than .005%.
H Annualized
See accompanying notes which are an integral part of the financial statements.
Fidelity Flex℠ Freedom 2040 Fund
Investment Summary (Unaudited)
The information in the following tables is based on the direct investments of the Fund.
Top Holdings as of March 31, 2019
| | % of fund's net assets |
| Fidelity Series Intrinsic Opportunities Fund | 10.4 |
| Fidelity Series Large Cap Stock Fund | 9.0 |
| Fidelity Series International Growth Fund | 9.0 |
| Fidelity Series International Value Fund | 9.0 |
| Fidelity Series Emerging Markets Opportunities Fund | 8.8 |
| Fidelity Series Growth Company Fund | 8.5 |
| Fidelity Series Stock Selector Large Cap Value Fund | 6.9 |
| Fidelity Series Value Discovery Fund | 4.9 |
| Fidelity Series Opportunistic Insights Fund | 4.6 |
| Fidelity Series Blue Chip Growth Fund | 4.2 |
| | 75.3 |
Asset Allocation (% of fund's net assets)
| Period end |
| | Domestic Equity Funds | 61.3% |
| | International Equity Funds | 31.0% |
| | Bond Funds | 6.8% |
| | Short-Term Funds | 0.9% |

Domestic Equity Funds category includes Fidelity Series Commodity Strategy Fund which invests in commodity-related investments.
Fidelity Flex℠ Freedom 2040 Fund
Schedule of Investments March 31, 2019
Showing Percentage of Net Assets
| Domestic Equity Funds - 61.3% | | | |
| | | Shares | Value |
| Fidelity Series All-Sector Equity Fund (a) | | 272 | $2,621 |
| Fidelity Series Blue Chip Growth Fund (a) | | 320 | 4,723 |
| Fidelity Series Commodity Strategy Fund (a) | | 704 | 3,356 |
| Fidelity Series Growth Company Fund (a) | | 566 | 9,575 |
| Fidelity Series Intrinsic Opportunities Fund (a) | | 715 | 11,763 |
| Fidelity Series Large Cap Stock Fund (a) | | 696 | 10,196 |
| Fidelity Series Large Cap Value Index Fund (a) | | 229 | 2,844 |
| Fidelity Series Opportunistic Insights Fund (a) | | 295 | 5,149 |
| Fidelity Series Small Cap Discovery Fund (a) | | 124 | 1,377 |
| Fidelity Series Small Cap Opportunities Fund (a) | | 314 | 4,226 |
| Fidelity Series Stock Selector Large Cap Value Fund (a) | | 658 | 7,766 |
| Fidelity Series Value Discovery Fund (a) | | 440 | 5,500 |
| TOTAL DOMESTIC EQUITY FUNDS | | | |
| (Cost $70,486) | | | 69,096 |
|
| International Equity Funds - 31.0% | | | |
| Fidelity Series Canada Fund (a) | | 106 | 1,094 |
| Fidelity Series Emerging Markets Fund (a) | | 113 | 1,103 |
| Fidelity Series Emerging Markets Opportunities Fund (a) | | 538 | 9,972 |
| Fidelity Series International Growth Fund (a) | | 671 | 10,196 |
| Fidelity Series International Small Cap Fund (a) | | 157 | 2,446 |
| Fidelity Series International Value Fund (a) | | 1,089 | 10,129 |
| TOTAL INTERNATIONAL EQUITY FUNDS | | | |
| (Cost $36,361) | | | 34,940 |
|
| Bond Funds - 6.8% | | | |
| Fidelity Series Emerging Markets Debt Fund (a) | | 82 | 789 |
| Fidelity Series Floating Rate High Income Fund (a) | | 18 | 169 |
| Fidelity Series High Income Fund (a) | | 90 | 847 |
| Fidelity Series Inflation-Protected Bond Index Fund (a) | | 35 | 337 |
| Fidelity Series International Credit Fund (a) | | 5 | 48 |
| Fidelity Series Investment Grade Bond Fund (a) | | 86 | 957 |
| Fidelity Series Long-Term Treasury Bond Index Fund (a) | | 449 | 3,984 |
| Fidelity Series Real Estate Income Fund (a) | | 48 | 528 |
| TOTAL BOND FUNDS | | | |
| (Cost $7,617) | | | 7,659 |
|
| Short-Term Funds - 0.9% | | | |
| Fidelity Series Government Money Market Fund 2.50% (a)(b) | | 783 | 783 |
| Fidelity Series Short-Term Credit Fund (a) | | 20 | 196 |
| TOTAL SHORT-TERM FUNDS | | | |
| (Cost $977) | | | 979 |
| TOTAL INVESTMENT IN SECURITIES - 100.0% | | | |
| (Cost $115,441) | | | 112,674 |
| NET OTHER ASSETS (LIABILITIES) - 0.0% | | | 0 |
| NET ASSETS - 100% | | | $112,674 |
Legend
(a) Affiliated Fund
(b) The rate quoted is the annualized seven-day yield of the fund at period end.
Affiliated Underlying Funds
Fiscal year to date information regarding the Fund's investments in affiliated Underlying Funds, excluding any Money Market Central Funds, is presented below. Exchanges between classes of the same affiliated Underlying Funds may occur.
| Affiliate | Value, beginning of period | Purchases | Sales Proceeds | Dividend Income | Realized Gain (loss) | Change in Unrealized appreciation (depreciation) | Value, end of period |
| Fidelity Series 100 Index Fund | $2,185 | $-- | $2,280 | $-- | $246 | $(151) | $-- |
| Fidelity Series All-Sector Equity Fund | 4,191 | 781 | 2,089 | 636 | 75 | (337) | 2,621 |
| Fidelity Series Blue Chip Growth Fund | 4,332 | 1,054 | 810 | 609 | (8) | 155 | 4,723 |
| Fidelity Series Canada Fund | 964 | 262 | 147 | 22 | (4) | 19 | 1,094 |
| Fidelity Series Commodity Strategy Fund | 2,285 | 1,802 | 421 | 164 | (35) | (275) | 3,356 |
| Fidelity Series Emerging Markets Debt Fund | 710 | 166 | 53 | 42 | (4) | (30) | 789 |
| Fidelity Series Emerging Markets Fund | -- | 1,136 | 42 | 4 | (3) | 12 | 1,103 |
| Fidelity Series Emerging Markets Opportunities Fund | 9,958 | 3,624 | 2,081 | 786 | (66) | (1,463) | 9,972 |
| Fidelity Series Floating Rate High Income Fund | 239 | 17 | 82 | 14 | (1) | (4) | 169 |
| Fidelity Series Government Money Market Fund 2.50% | 1,770 | 2,073 | 3,060 | 27 | -- | -- | 783 |
| Fidelity Series Growth Company Fund | 8,882 | 2,167 | 1,324 | 1,003 | (13) | (137) | 9,575 |
| Fidelity Series High Income Fund | 1,530 | 96 | 759 | 97 | (24) | 4 | 847 |
| Fidelity Series Inflation-Protected Bond Index Fund | 906 | 112 | 686 | 6 | (12) | 17 | 337 |
| Fidelity Series International Credit Fund | 34 | 14 | -- | 2 | -- | -- | 48 |
| Fidelity Series International Growth Fund | 9,706 | 1,865 | 808 | 650 | (28) | (539) | 10,196 |
| Fidelity Series International Small Cap Fund | 2,422 | 548 | 115 | 220 | (3) | (406) | 2,446 |
| Fidelity Series International Value Fund | 9,825 | 1,934 | 419 | 353 | (2) | (1,209) | 10,129 |
| Fidelity Series Intrinsic Opportunities Fund | 10,607 | 2,730 | 518 | 904 | (20) | (1,036) | 11,763 |
| Fidelity Series Investment Grade Bond Fund | 523 | 615 | 201 | 20 | (3) | 23 | 957 |
| Fidelity Series Large Cap Stock Fund | 9,473 | 1,871 | 834 | 1,015 | (12) | (302) | 10,196 |
| Fidelity Series Large Cap Value Index Fund | 2,707 | 330 | 223 | 130 | (1) | 31 | 2,844 |
| Fidelity Series Long-Term Treasury Bond Index Fund | 2,486 | 2,997 | 1,650 | 108 | (40) | 191 | 3,984 |
| Fidelity Series Opportunistic Insights Fund | 4,882 | 806 | 567 | 430 | (1) | 29 | 5,149 |
| Fidelity Series Real Estate Equity Fund | 801 | 83 | 920 | 13 | (42) | 78 | -- |
| Fidelity Series Real Estate Income Fund | 465 | 61 | 7 | 37 | -- | 9 | 528 |
| Fidelity Series Short-Term Credit Fund | 349 | 566 | 722 | 8 | (3) | 6 | 196 |
| Fidelity Series Small Cap Discovery Fund | 1,292 | 313 | 98 | 167 | (9) | (121) | 1,377 |
| Fidelity Series Small Cap Opportunities Fund | 3,899 | 1,000 | 449 | 472 | (24) | (200) | 4,226 |
| Fidelity Series Stock Selector Large Cap Value Fund | 7,276 | 1,328 | 555 | 641 | (9) | (274) | 7,766 |
| Fidelity Series Value Discovery Fund | 5,185 | 870 | 401 | 321 | (8) | (146) | 5,500 |
| Total | $109,884 | $31,221 | $22,321 | $8,901 | $(54) | $(6,056) | $112,674 |
Amounts in the income column in the above table include any capital gain distributions from underlying funds, which are presented in the corresponding line-item in the Statement of Operations, if applicable.
Investment Valuation
All investments are categorized as Level 1 under the Fair Value Hierarchy. The inputs or methodology used for valuing securities may not be an indication of the risk associated with investing in those securities. For more information on valuation inputs please refer to the Investment Valuation section in the accompanying Notes to Financial Statements.
See accompanying notes which are an integral part of the financial statements.
Fidelity Flex℠ Freedom 2040 Fund
Financial Statements
Statement of Assets and Liabilities
| | | March 31, 2019 |
| Assets | | |
Investment in securities, at value — See accompanying schedule:
| | |
| Affiliated issuers (cost $115,441) | $112,674 | |
| Total Investment in Securities (cost $115,441) | | $112,674 |
| Receivable for investments sold | | 1,861 |
| Total assets | | 114,535 |
| Liabilities | | |
| Payable for investments purchased | $1,861 | |
| Total liabilities | | 1,861 |
| Net Assets | | $112,674 |
| Net Assets consist of: | | |
| Paid in capital | | $111,176 |
| Total distributable earnings (loss) | | 1,498 |
| Net Assets, for 11,127 shares outstanding | | $112,674 |
| Net Asset Value, offering price and redemption price per share ($112,674 ÷ 11,127 shares) | | $10.13 |
See accompanying notes which are an integral part of the financial statements.
Statement of Operations
| | | Year ended March 31, 2019 |
| Investment Income | | |
| Dividends: | | |
| Affiliated issuers | | $2,346 |
| Expenses | | |
| Independent trustees' fees and expenses | $1 | |
| Total expenses | | 1 |
| Net investment income (loss) | | 2,345 |
| Realized and Unrealized Gain (Loss) | | |
| Net realized gain (loss) on: | | |
| Investment securities: | | |
| Affiliated issuers | (54) | |
| Capital gain distributions from underlying funds: | | |
| Affiliated issuers | 6,555 | |
| Total net realized gain (loss) | | 6,501 |
| Change in net unrealized appreciation (depreciation) on: | | |
| Investment securities: | | |
| Affiliated issuers | (6,056) | |
| Total change in net unrealized appreciation (depreciation) | | (6,056) |
| Net gain (loss) | | 445 |
| Net increase (decrease) in net assets resulting from operations | | $2,790 |
See accompanying notes which are an integral part of the financial statements.
Statement of Changes in Net Assets
| | Year ended March 31, 2019 | For the period
June 8, 2017 (commencement of operations) to March 31, 2018 |
| Increase (Decrease) in Net Assets | | |
| Operations | | |
| Net investment income (loss) | $2,345 | $1,742 |
| Net realized gain (loss) | 6,501 | 4,853 |
| Change in net unrealized appreciation (depreciation) | (6,056) | 3,289 |
| Net increase (decrease) in net assets resulting from operations | 2,790 | 9,884 |
| Distributions to shareholders | (7,876) | – |
| Distributions to shareholders from net investment income | – | (1,650) |
| Distributions to shareholders from net realized gain | – | (1,650) |
| Total distributions | (7,876) | (3,300) |
| Share transactions | | |
| Proceeds from sales of shares | – | 100,000 |
| Reinvestment of distributions | 7,876 | 3,300 |
| Net increase (decrease) in net assets resulting from share transactions | 7,876 | 103,300 |
| Total increase (decrease) in net assets | 2,790 | 109,884 |
| Net Assets | | |
| Beginning of period | 109,884 | – |
| End of period | $112,674 | $109,884 |
| Other Information | | |
| Undistributed net investment income end of period | | $92 |
| Shares | | |
| Sold | – | 10,000 |
| Issued in reinvestment of distributions | 818 | 309 |
| Net increase (decrease) | 818 | 10,309 |
See accompanying notes which are an integral part of the financial statements.
Financial Highlights
Fidelity Flex Freedom 2040 Fund
| | | |
| Years ended March 31, | 2019 | 2018 A |
| Selected Per–Share Data | | |
| Net asset value, beginning of period | $10.66 | $10.00 |
| Income from Investment Operations | | |
| Net investment income (loss)B | .22 | .17 |
| Net realized and unrealized gain (loss) | –C | .82 |
| Total from investment operations | .22 | .99 |
| Distributions from net investment income | (.22) | (.17) |
| Distributions from net realized gain | (.53) | (.17) |
| Total distributions | (.75) | (.33)D |
| Net asset value, end of period | $10.13 | $10.66 |
| Total ReturnE | 2.57% | 9.89% |
| Ratios to Average Net AssetsF,G | | |
| Expenses before reductions | - %H | - %I |
| Expenses net of fee waivers, if any | - %H | - %I |
| Expenses net of all reductions | - %H | - %I |
| Net investment income (loss) | 2.13% | 2.01%I |
| Supplemental Data | | |
| Net assets, end of period (000 omitted) | $113 | $110 |
| Portfolio turnover rateG | 20% | 13%I |
A For the period June 8, 2017 (commencement of operations) to March 31, 2018.
B Calculated based on average shares outstanding during the period.
C Amount represents less than $.005 per share.
D Total distributions of $.33 per share is comprised of distributions from net investment income of $.165 and distributions from net realized gain of $.165 per share.
E Total returns for periods of less than one year are not annualized.
F Expense ratios reflect operating expenses of the Fund. Expenses before reductions do not reflect amounts reimbursed by the investment adviser or reductions from expense offset arrangements and do not represent the amount paid by the Fund during periods when reimbursements or reductions occur. Expenses net of fee waivers reflect expenses after reimbursement by the investment adviser but prior to reductions from expense offset arrangements. Expenses net of all reductions represent the net expenses paid by the Fund but do not include expenses of the underlying funds in which the Fund invests.
G Amounts do not include the activity of the Underlying Funds.
H Amount represents less than .005%.
I Annualized
See accompanying notes which are an integral part of the financial statements.
Fidelity Flex℠ Freedom 2045 Fund
Investment Summary (Unaudited)
The information in the following tables is based on the direct investments of the Fund.
Top Holdings as of March 31, 2019
| | % of fund's net assets |
| Fidelity Series Intrinsic Opportunities Fund | 10.4 |
| Fidelity Series Large Cap Stock Fund | 9.0 |
| Fidelity Series International Growth Fund | 9.0 |
| Fidelity Series International Value Fund | 9.0 |
| Fidelity Series Emerging Markets Opportunities Fund | 8.8 |
| Fidelity Series Growth Company Fund | 8.5 |
| Fidelity Series Stock Selector Large Cap Value Fund | 6.9 |
| Fidelity Series Value Discovery Fund | 4.9 |
| Fidelity Series Opportunistic Insights Fund | 4.6 |
| Fidelity Series Blue Chip Growth Fund | 4.2 |
| | 75.3 |
Asset Allocation (% of fund's net assets)
| Period end |
| | Domestic Equity Funds | 61.3% |
| | International Equity Funds | 31.0% |
| | Bond Funds | 6.8% |
| | Short-Term Funds | 0.9% |

Domestic Equity Funds category includes Fidelity Series Commodity Strategy Fund which invests in commodity-related investments.
Fidelity Flex℠ Freedom 2045 Fund
Schedule of Investments March 31, 2019
Showing Percentage of Net Assets
| Domestic Equity Funds - 61.3% | | | |
| | | Shares | Value |
| Fidelity Series All-Sector Equity Fund (a) | | 272 | $2,621 |
| Fidelity Series Blue Chip Growth Fund (a) | | 321 | 4,733 |
| Fidelity Series Commodity Strategy Fund (a) | | 704 | 3,356 |
| Fidelity Series Growth Company Fund (a) | | 566 | 9,575 |
| Fidelity Series Intrinsic Opportunities Fund (a) | | 715 | 11,764 |
| Fidelity Series Large Cap Stock Fund (a) | | 696 | 10,197 |
| Fidelity Series Large Cap Value Index Fund (a) | | 229 | 2,845 |
| Fidelity Series Opportunistic Insights Fund (a) | | 295 | 5,159 |
| Fidelity Series Small Cap Discovery Fund (a) | | 124 | 1,379 |
| Fidelity Series Small Cap Opportunities Fund (a) | | 314 | 4,227 |
| Fidelity Series Stock Selector Large Cap Value Fund (a) | | 657 | 7,748 |
| Fidelity Series Value Discovery Fund (a) | | 440 | 5,501 |
| TOTAL DOMESTIC EQUITY FUNDS | | | |
| (Cost $70,481) | | | 69,105 |
|
| International Equity Funds - 31.0% | | | |
| Fidelity Series Canada Fund (a) | | 106 | 1,094 |
| Fidelity Series Emerging Markets Fund (a) | | 113 | 1,103 |
| Fidelity Series Emerging Markets Opportunities Fund (a) | | 538 | 9,973 |
| Fidelity Series International Growth Fund (a) | | 671 | 10,197 |
| Fidelity Series International Small Cap Fund (a) | | 157 | 2,446 |
| Fidelity Series International Value Fund (a) | | 1,089 | 10,131 |
| TOTAL INTERNATIONAL EQUITY FUNDS | | | |
| (Cost $36,367) | | | 34,944 |
|
| Bond Funds - 6.8% | | | |
| Fidelity Series Emerging Markets Debt Fund (a) | | 82 | 789 |
| Fidelity Series Floating Rate High Income Fund (a) | | 18 | 169 |
| Fidelity Series High Income Fund (a) | | 90 | 848 |
| Fidelity Series Inflation-Protected Bond Index Fund (a) | | 35 | 337 |
| Fidelity Series International Credit Fund (a) | | 5 | 48 |
| Fidelity Series Investment Grade Bond Fund (a) | | 86 | 957 |
| Fidelity Series Long-Term Treasury Bond Index Fund (a) | | 449 | 3,985 |
| Fidelity Series Real Estate Income Fund (a) | | 48 | 528 |
| TOTAL BOND FUNDS | | | |
| (Cost $7,618) | | | 7,661 |
|
| Short-Term Funds - 0.9% | | | |
| Fidelity Series Government Money Market Fund 2.50% (a)(b) | | 783 | 783 |
| Fidelity Series Short-Term Credit Fund (a) | | 20 | 196 |
| TOTAL SHORT-TERM FUNDS | | | |
| (Cost $977) | | | 979 |
| TOTAL INVESTMENT IN SECURITIES - 100.0% | | | |
| (Cost $115,443) | | | 112,689 |
| NET OTHER ASSETS (LIABILITIES) - 0.0% | | | 2 |
| NET ASSETS - 100% | | | $112,691 |
Legend
(a) Affiliated Fund
(b) The rate quoted is the annualized seven-day yield of the fund at period end.
Affiliated Underlying Funds
Fiscal year to date information regarding the Fund's investments in affiliated Underlying Funds, excluding any Money Market Central Funds, is presented below. Exchanges between classes of the same affiliated Underlying Funds may occur.
| Affiliate | Value, beginning of period | Purchases | Sales Proceeds | Dividend Income | Realized Gain (loss) | Change in Unrealized appreciation (depreciation) | Value, end of period |
| Fidelity Series 100 Index Fund | $2,185 | $-- | $2,282 | $-- | $248 | $(151) | $-- |
| Fidelity Series All-Sector Equity Fund | 4,192 | 776 | 2,084 | 635 | 76 | (339) | 2,621 |
| Fidelity Series Blue Chip Growth Fund | 4,333 | 975 | 726 | 607 | (10) | 161 | 4,733 |
| Fidelity Series Canada Fund | 964 | 261 | 145 | 22 | (4) | 18 | 1,094 |
| Fidelity Series Commodity Strategy Fund | 2,288 | 1,794 | 419 | 164 | (35) | (272) | 3,356 |
| Fidelity Series Emerging Markets Debt Fund | 700 | 164 | 42 | 41 | (3) | (30) | 789 |
| Fidelity Series Emerging Markets Fund | -- | 1,136 | 42 | 4 | (3) | 12 | 1,103 |
| Fidelity Series Emerging Markets Opportunities Fund | 9,968 | 3,614 | 2,080 | 786 | (64) | (1,465) | 9,973 |
| Fidelity Series Floating Rate High Income Fund | 250 | 16 | 92 | 15 | (1) | (4) | 169 |
| Fidelity Series Government Money Market Fund 2.50% | 1,767 | 2,114 | 3,098 | 27 | -- | -- | 783 |
| Fidelity Series Growth Company Fund | 9,195 | 2,165 | 1,634 | 1,004 | 4 | (155) | 9,575 |
| Fidelity Series High Income Fund | 1,519 | 98 | 749 | 97 | (24) | 4 | 848 |
| Fidelity Series Inflation-Protected Bond Index Fund | 907 | 106 | 681 | 6 | (12) | 17 | 337 |
| Fidelity Series International Credit Fund | 34 | 14 | -- | 2 | -- | -- | 48 |
| Fidelity Series International Growth Fund | 9,708 | 1,873 | 818 | 650 | (27) | (539) | 10,197 |
| Fidelity Series International Small Cap Fund | 2,422 | 556 | 122 | 221 | (3) | (407) | 2,446 |
| Fidelity Series International Value Fund | 9,827 | 1,946 | 431 | 353 | (2) | (1,209) | 10,131 |
| Fidelity Series Intrinsic Opportunities Fund | 10,448 | 2,894 | 517 | 904 | (20) | (1,041) | 11,764 |
| Fidelity Series Investment Grade Bond Fund | 524 | 611 | 198 | 20 | (3) | 23 | 957 |
| Fidelity Series Large Cap Stock Fund | 9,478 | 1,849 | 819 | 1,015 | (10) | (301) | 10,197 |
| Fidelity Series Large Cap Value Index Fund | 2,717 | 334 | 236 | 130 | (2) | 32 | 2,845 |
| Fidelity Series Long-Term Treasury Bond Index Fund | 2,487 | 2,985 | 1,637 | 108 | (42) | 192 | 3,985 |
| Fidelity Series Opportunistic Insights Fund | 4,748 | 887 | 489 | 436 | (9) | 22 | 5,159 |
| Fidelity Series Real Estate Equity Fund | 783 | 100 | 920 | 13 | (39) | 76 | -- |
| Fidelity Series Real Estate Income Fund | 465 | 60 | 7 | 36 | -- | 10 | 528 |
| Fidelity Series Short-Term Credit Fund | 349 | 574 | 730 | 9 | (3) | 6 | 196 |
| Fidelity Series Small Cap Discovery Fund | 1,267 | 364 | 127 | 166 | (9) | (116) | 1,379 |
| Fidelity Series Small Cap Opportunities Fund | 3,900 | 991 | 438 | 472 | (24) | (202) | 4,227 |
| Fidelity Series Stock Selector Large Cap Value Fund | 7,305 | 1,277 | 551 | 641 | (13) | (270) | 7,748 |
| Fidelity Series Value Discovery Fund | 5,174 | 890 | 408 | 321 | (8) | (147) | 5,501 |
| Total | $109,904 | $31,424 | $22,522 | $8,905 | $(42) | $(6,075) | $112,689 |
Amounts in the income column in the above table include any capital gain distributions from underlying funds, which are presented in the corresponding line-item in the Statement of Operations, if applicable.
Investment Valuation
All investments are categorized as Level 1 under the Fair Value Hierarchy. The inputs or methodology used for valuing securities may not be an indication of the risk associated with investing in those securities. For more information on valuation inputs please refer to the Investment Valuation section in the accompanying Notes to Financial Statements.
See accompanying notes which are an integral part of the financial statements.
Fidelity Flex℠ Freedom 2045 Fund
Financial Statements
Statement of Assets and Liabilities
| | | March 31, 2019 |
| Assets | | |
Investment in securities, at value — See accompanying schedule:
| | |
| Affiliated issuers (cost $115,443) | $112,689 | |
| Total Investment in Securities (cost $115,443) | | $112,689 |
| Receivable for investments sold | | 1,808 |
| Total assets | | 114,497 |
| Liabilities | | |
| Payable for investments purchased | $1,806 | |
| Total liabilities | | 1,806 |
| Net Assets | | $112,691 |
| Net Assets consist of: | | |
| Paid in capital | | $111,176 |
| Total distributable earnings (loss) | | 1,515 |
| Net Assets, for 11,127 shares outstanding | | $112,691 |
| Net Asset Value, offering price and redemption price per share ($112,691 ÷ 11,127 shares) | | $10.13 |
See accompanying notes which are an integral part of the financial statements.
Statement of Operations
| | | Year ended March 31, 2019 |
| Investment Income | | |
| Dividends: | | |
| Affiliated issuers | | $2,346 |
| Expenses | | |
| Independent trustees' fees and expenses | $1 | |
| Total expenses | | 1 |
| Net investment income (loss) | | 2,345 |
| Realized and Unrealized Gain (Loss) | | |
| Net realized gain (loss) on: | | |
| Investment securities: | | |
| Affiliated issuers | (42) | |
| Capital gain distributions from underlying funds: | | |
| Affiliated issuers | 6,559 | |
| Total net realized gain (loss) | | 6,517 |
| Change in net unrealized appreciation (depreciation) on: | | |
| Investment securities: | | |
| Affiliated issuers | (6,075) | |
| Total change in net unrealized appreciation (depreciation) | | (6,075) |
| Net gain (loss) | | 442 |
| Net increase (decrease) in net assets resulting from operations | | $2,787 |
See accompanying notes which are an integral part of the financial statements.
Statement of Changes in Net Assets
| | Year ended March 31, 2019 | For the period
June 8, 2017 (commencement of operations) to March 31, 2018 |
| Increase (Decrease) in Net Assets | | |
| Operations | | |
| Net investment income (loss) | $2,345 | $1,740 |
| Net realized gain (loss) | 6,517 | 4,843 |
| Change in net unrealized appreciation (depreciation) | (6,075) | 3,321 |
| Net increase (decrease) in net assets resulting from operations | 2,787 | 9,904 |
| Distributions to shareholders | (7,856) | – |
| Distributions to shareholders from net investment income | – | (1,660) |
| Distributions to shareholders from net realized gain | – | (1,660) |
| Total distributions | (7,856) | (3,320) |
| Share transactions | | |
| Proceeds from sales of shares | – | 100,000 |
| Reinvestment of distributions | 7,856 | 3,320 |
| Net increase (decrease) in net assets resulting from share transactions | 7,856 | 103,320 |
| Total increase (decrease) in net assets | 2,787 | 109,904 |
| Net Assets | | |
| Beginning of period | 109,904 | – |
| End of period | $112,691 | $109,904 |
| Other Information | | |
| Undistributed net investment income end of period | | $80 |
| Shares | | |
| Sold | – | 10,000 |
| Issued in reinvestment of distributions | 816 | 311 |
| Net increase (decrease) | 816 | 10,311 |
See accompanying notes which are an integral part of the financial statements.
Financial Highlights
Fidelity Flex Freedom 2045 Fund
| | | |
| Years ended March 31, | 2019 | 2018 A |
| Selected Per–Share Data | | |
| Net asset value, beginning of period | $10.66 | $10.00 |
| Income from Investment Operations | | |
| Net investment income (loss)B | .22 | .17 |
| Net realized and unrealized gain (loss) | –C | .82 |
| Total from investment operations | .22 | .99 |
| Distributions from net investment income | (.22) | (.17) |
| Distributions from net realized gain | (.53) | (.17) |
| Total distributions | (.75) | (.33)D |
| Net asset value, end of period | $10.13 | $10.66 |
| Total ReturnE | 2.55% | 9.91% |
| Ratios to Average Net AssetsF,G | | |
| Expenses before reductions | - %H | - %I |
| Expenses net of fee waivers, if any | - %H | - %I |
| Expenses net of all reductions | - %H | - %I |
| Net investment income (loss) | 2.13% | 2.00%I |
| Supplemental Data | | |
| Net assets, end of period (000 omitted) | $113 | $110 |
| Portfolio turnover rateG | 20% | 13%I |
A For the period June 8, 2017 (commencement of operations) to March 31, 2018.
B Calculated based on average shares outstanding during the period.
C Amount represents less than $.005 per share.
D Total distributions of $.33 per share is comprised of distributions from net investment income of $.166 and distributions from net realized gain of $.166 per share.
E Total returns for periods of less than one year are not annualized.
F Expense ratios reflect operating expenses of the Fund. Expenses before reductions do not reflect amounts reimbursed by the investment adviser or reductions from expense offset arrangements and do not represent the amount paid by the Fund during periods when reimbursements or reductions occur. Expenses net of fee waivers reflect expenses after reimbursement by the investment adviser but prior to reductions from expense offset arrangements. Expenses net of all reductions represent the net expenses paid by the Fund but do not include expenses of the underlying funds in which the Fund invests.
G Amounts do not include the activity of the Underlying Funds.
H Amount represents less than .005%.
I Annualized
See accompanying notes which are an integral part of the financial statements.
Fidelity Flex℠ Freedom 2050 Fund
Investment Summary (Unaudited)
The information in the following tables is based on the direct investments of the Fund.
Top Holdings as of March 31, 2019
| | % of fund's net assets |
| Fidelity Series Intrinsic Opportunities Fund | 10.4 |
| Fidelity Series Large Cap Stock Fund | 9.0 |
| Fidelity Series International Growth Fund | 9.0 |
| Fidelity Series International Value Fund | 9.0 |
| Fidelity Series Emerging Markets Opportunities Fund | 8.8 |
| Fidelity Series Growth Company Fund | 8.5 |
| Fidelity Series Stock Selector Large Cap Value Fund | 6.9 |
| Fidelity Series Value Discovery Fund | 4.9 |
| Fidelity Series Opportunistic Insights Fund | 4.6 |
| Fidelity Series Blue Chip Growth Fund | 4.2 |
| | 75.3 |
Asset Allocation (% of fund's net assets)
| Period end |
| | Domestic Equity Funds | 61.3% |
| | International Equity Funds | 31.0% |
| | Bond Funds | 6.8% |
| | Short-Term Funds | 0.9% |

Domestic Equity Funds category includes Fidelity Series Commodity Strategy Fund which invests in commodity-related investments.
Fidelity Flex℠ Freedom 2050 Fund
Schedule of Investments March 31, 2019
Showing Percentage of Net Assets
| Domestic Equity Funds - 61.3% | | | |
| | | Shares | Value |
| Fidelity Series All-Sector Equity Fund (a) | | 272 | $2,621 |
| Fidelity Series Blue Chip Growth Fund (a) | | 320 | 4,724 |
| Fidelity Series Commodity Strategy Fund (a) | | 704 | 3,356 |
| Fidelity Series Growth Company Fund (a) | | 566 | 9,575 |
| Fidelity Series Intrinsic Opportunities Fund (a) | | 715 | 11,762 |
| Fidelity Series Large Cap Stock Fund (a) | | 696 | 10,196 |
| Fidelity Series Large Cap Value Index Fund (a) | | 229 | 2,845 |
| Fidelity Series Opportunistic Insights Fund (a) | | 295 | 5,149 |
| Fidelity Series Small Cap Discovery Fund (a) | | 124 | 1,377 |
| Fidelity Series Small Cap Opportunities Fund (a) | | 314 | 4,226 |
| Fidelity Series Stock Selector Large Cap Value Fund (a) | | 658 | 7,766 |
| Fidelity Series Value Discovery Fund (a) | | 440 | 5,500 |
| TOTAL DOMESTIC EQUITY FUNDS | | | |
| (Cost $70,468) | | | 69,097 |
|
| International Equity Funds - 31.0% | | | |
| Fidelity Series Canada Fund (a) | | 106 | 1,094 |
| Fidelity Series Emerging Markets Fund (a) | | 113 | 1,103 |
| Fidelity Series Emerging Markets Opportunities Fund (a) | | 538 | 9,972 |
| Fidelity Series International Growth Fund (a) | | 671 | 10,196 |
| Fidelity Series International Small Cap Fund (a) | | 157 | 2,446 |
| Fidelity Series International Value Fund (a) | | 1,089 | 10,130 |
| TOTAL INTERNATIONAL EQUITY FUNDS | | | |
| (Cost $36,369) | | | 34,941 |
|
| Bond Funds - 6.8% | | | |
| Fidelity Series Emerging Markets Debt Fund (a) | | 82 | 789 |
| Fidelity Series Floating Rate High Income Fund (a) | | 18 | 169 |
| Fidelity Series High Income Fund (a) | | 90 | 847 |
| Fidelity Series Inflation-Protected Bond Index Fund (a) | | 35 | 337 |
| Fidelity Series International Credit Fund (a) | | 5 | 48 |
| Fidelity Series Investment Grade Bond Fund (a) | | 86 | 957 |
| Fidelity Series Long-Term Treasury Bond Index Fund (a) | | 449 | 3,984 |
| Fidelity Series Real Estate Income Fund (a) | | 48 | 528 |
| TOTAL BOND FUNDS | | | |
| (Cost $7,620) | | | 7,659 |
|
| Short-Term Funds - 0.9% | | | |
| Fidelity Series Government Money Market Fund 2.50% (a)(b) | | 783 | 783 |
| Fidelity Series Short-Term Credit Fund (a) | | 20 | 196 |
| TOTAL SHORT-TERM FUNDS | | | |
| (Cost $977) | | | 979 |
| TOTAL INVESTMENT IN SECURITIES - 100.0% | | | |
| (Cost $115,434) | | | 112,676 |
| NET OTHER ASSETS (LIABILITIES) - 0.0% | | | 0 |
| NET ASSETS - 100% | | | $112,676 |
Legend
(a) Affiliated Fund
(b) The rate quoted is the annualized seven-day yield of the fund at period end.
Affiliated Underlying Funds
Fiscal year to date information regarding the Fund's investments in affiliated Underlying Funds, excluding any Money Market Central Funds, is presented below. Exchanges between classes of the same affiliated Underlying Funds may occur.
| Affiliate | Value, beginning of period | Purchases | Sales Proceeds | Dividend Income | Realized Gain (loss) | Change in Unrealized appreciation (depreciation) | Value, end of period |
| Fidelity Series 100 Index Fund | $2,186 | $-- | $2,281 | $-- | $244 | $(149) | $-- |
| Fidelity Series All-Sector Equity Fund | 4,192 | 777 | 2,082 | 636 | 72 | (338) | 2,621 |
| Fidelity Series Blue Chip Growth Fund | 4,332 | 1,054 | 809 | 609 | (7) | 154 | 4,724 |
| Fidelity Series Canada Fund | 947 | 246 | 113 | 22 | (3) | 17 | 1,094 |
| Fidelity Series Commodity Strategy Fund | 2,285 | 1,799 | 418 | 164 | (35) | (275) | 3,356 |
| Fidelity Series Emerging Markets Debt Fund | 700 | 164 | 42 | 41 | (3) | (30) | 789 |
| Fidelity Series Emerging Markets Fund | -- | 1,136 | 42 | 4 | (3) | 12 | 1,103 |
| Fidelity Series Emerging Markets Opportunities Fund | 9,967 | 3,594 | 2,060 | 786 | (63) | (1,466) | 9,972 |
| Fidelity Series Floating Rate High Income Fund | 250 | 16 | 92 | 15 | (1) | (4) | 169 |
| Fidelity Series Government Money Market Fund 2.50% | 1,761 | 2,129 | 3,107 | 27 | -- | -- | 783 |
| Fidelity Series Growth Company Fund | 9,024 | 2,166 | 1,457 | 1,003 | (15) | (143) | 9,575 |
| Fidelity Series High Income Fund | 1,519 | 97 | 749 | 97 | (24) | 4 | 847 |
| Fidelity Series Inflation-Protected Bond Index Fund | 907 | 110 | 686 | 6 | (11) | 17 | 337 |
| Fidelity Series International Credit Fund | 34 | 14 | -- | 2 | -- | -- | 48 |
| Fidelity Series International Growth Fund | 9,706 | 1,891 | 836 | 649 | (26) | (539) | 10,196 |
| Fidelity Series International Small Cap Fund | 2,422 | 522 | 88 | 220 | (1) | (409) | 2,446 |
| Fidelity Series International Value Fund | 9,852 | 1,943 | 453 | 354 | (2) | (1,210) | 10,130 |
| Fidelity Series Intrinsic Opportunities Fund | 10,562 | 2,775 | 517 | 904 | (20) | (1,038) | 11,762 |
| Fidelity Series Investment Grade Bond Fund | 524 | 606 | 193 | 20 | (3) | 23 | 957 |
| Fidelity Series Large Cap Stock Fund | 9,477 | 1,899 | 869 | 1,015 | (9) | (302) | 10,196 |
| Fidelity Series Large Cap Value Index Fund | 2,699 | 351 | 235 | 130 | (1) | 31 | 2,845 |
| Fidelity Series Long-Term Treasury Bond Index Fund | 2,486 | 2,977 | 1,629 | 108 | (39) | 189 | 3,984 |
| Fidelity Series Opportunistic Insights Fund | 4,748 | 814 | 439 | 429 | (5) | 31 | 5,149 |
| Fidelity Series Real Estate Equity Fund | 801 | 75 | 912 | 13 | (42) | 78 | -- |
| Fidelity Series Real Estate Income Fund | 465 | 60 | 7 | 36 | -- | 10 | 528 |
| Fidelity Series Short-Term Credit Fund | 349 | 581 | 737 | 8 | (3) | 6 | 196 |
| Fidelity Series Small Cap Discovery Fund | 1,292 | 310 | 96 | 167 | (9) | (120) | 1,377 |
| Fidelity Series Small Cap Opportunities Fund | 3,947 | 976 | 478 | 472 | (19) | (200) | 4,226 |
| Fidelity Series Stock Selector Large Cap Value Fund | 7,400 | 1,188 | 542 | 641 | (16) | (264) | 7,766 |
| Fidelity Series Value Discovery Fund | 5,060 | 1,003 | 406 | 322 | (7) | (150) | 5,500 |
| Total | $109,894 | $31,273 | $22,375 | $8,900 | $(51) | $(6,065) | $112,676 |
Amounts in the income column in the above table include any capital gain distributions from underlying funds, which are presented in the corresponding line-item in the Statement of Operations, if applicable.
Investment Valuation
All investments are categorized as Level 1 under the Fair Value Hierarchy. The inputs or methodology used for valuing securities may not be an indication of the risk associated with investing in those securities. For more information on valuation inputs please refer to the Investment Valuation section in the accompanying Notes to Financial Statements.
See accompanying notes which are an integral part of the financial statements.
Fidelity Flex℠ Freedom 2050 Fund
Financial Statements
Statement of Assets and Liabilities
| | | March 31, 2019 |
| Assets | | |
Investment in securities, at value — See accompanying schedule:
| | |
| Affiliated issuers (cost $115,434) | $112,676 | |
| Total Investment in Securities (cost $115,434) | | $112,676 |
| Receivable for investments sold | | 1,814 |
| Total assets | | 114,490 |
| Liabilities | | |
| Payable for investments purchased | $1,814 | |
| Total liabilities | | 1,814 |
| Net Assets | | $112,676 |
| Net Assets consist of: | | |
| Paid in capital | | $111,156 |
| Total distributable earnings (loss) | | 1,520 |
| Net Assets, for 11,125 shares outstanding | | $112,676 |
| Net Asset Value, offering price and redemption price per share ($112,676 ÷ 11,125 shares) | | $10.13 |
See accompanying notes which are an integral part of the financial statements.
Statement of Operations
| | | Year ended March 31, 2019 |
| Investment Income | | |
| Dividends: | | |
| Affiliated issuers | | $2,345 |
| Expenses | | |
| Independent trustees' fees and expenses | $1 | |
| Total expenses | | 1 |
| Net investment income (loss) | | 2,344 |
| Realized and Unrealized Gain (Loss) | | |
| Net realized gain (loss) on: | | |
| Investment securities: | | |
| Affiliated issuers | (51) | |
| Capital gain distributions from underlying funds: | | |
| Affiliated issuers | 6,555 | |
| Total net realized gain (loss) | | 6,504 |
| Change in net unrealized appreciation (depreciation) on: | | |
| Investment securities: | | |
| Affiliated issuers | (6,065) | |
| Total change in net unrealized appreciation (depreciation) | | (6,065) |
| Net gain (loss) | | 439 |
| Net increase (decrease) in net assets resulting from operations | | $2,783 |
See accompanying notes which are an integral part of the financial statements.
Statement of Changes in Net Assets
| | Year ended March 31, 2019 | For the period
June 8, 2017 (commencement of operations) to March 31, 2018 |
| Increase (Decrease) in Net Assets | | |
| Operations | | |
| Net investment income (loss) | $2,344 | $1,740 |
| Net realized gain (loss) | 6,504 | 4,846 |
| Change in net unrealized appreciation (depreciation) | (6,065) | 3,307 |
| Net increase (decrease) in net assets resulting from operations | 2,783 | 9,893 |
| Distributions to shareholders | (7,855) | – |
| Distributions to shareholders from net investment income | – | (1,660) |
| Distributions to shareholders from net realized gain | – | (1,640) |
| Total distributions | (7,855) | (3,300) |
| Share transactions | | |
| Proceeds from sales of shares | – | 100,000 |
| Reinvestment of distributions | 7,855 | 3,300 |
| Net increase (decrease) in net assets resulting from share transactions | 7,855 | 103,300 |
| Total increase (decrease) in net assets | 2,783 | 109,893 |
| Net Assets | | |
| Beginning of period | 109,893 | – |
| End of period | $112,676 | $109,893 |
| Other Information | | |
| Undistributed net investment income end of period | | $80 |
| Shares | | |
| Sold | – | 10,000 |
| Issued in reinvestment of distributions | 816 | 309 |
| Net increase (decrease) | 816 | 10,309 |
See accompanying notes which are an integral part of the financial statements.
Financial Highlights
Fidelity Flex Freedom 2050 Fund
| | | |
| Years ended March 31, | 2019 | 2018 A |
| Selected Per–Share Data | | |
| Net asset value, beginning of period | $10.66 | $10.00 |
| Income from Investment Operations | | |
| Net investment income (loss)B | .22 | .17 |
| Net realized and unrealized gain (loss) | –C | .82 |
| Total from investment operations | .22 | .99 |
| Distributions from net investment income | (.22) | (.17) |
| Distributions from net realized gain | (.53) | (.16) |
| Total distributions | (.75) | (.33) |
| Net asset value, end of period | $10.13 | $10.66 |
| Total ReturnD | 2.55% | 9.89% |
| Ratios to Average Net AssetsE,F | | |
| Expenses before reductions | - %G | - %H |
| Expenses net of fee waivers, if any | - %G | - %H |
| Expenses net of all reductions | - %G | - %H |
| Net investment income (loss) | 2.13% | 2.00%H |
| Supplemental Data | | |
| Net assets, end of period (000 omitted) | $113 | $110 |
| Portfolio turnover rateE | 20% | 13%H |
A For the period June 8, 2017 (commencement of operations) to March 31, 2018.
B Calculated based on average shares outstanding during the period.
C Amount represents less than $.005 per share.
D Total returns for periods of less than one year are not annualized.
E Amounts do not include the activity of the Underlying Funds.
F Expense ratios reflect operating expenses of the Fund. Expenses before reductions do not reflect amounts reimbursed by the investment adviser or reductions from expense offset arrangements and do not represent the amount paid by the Fund during periods when reimbursements or reductions occur. Expenses net of fee waivers reflect expenses after reimbursement by the investment adviser but prior to reductions from expense offset arrangements. Expenses net of all reductions represent the net expenses paid by the Fund but do not include expenses of the underlying funds in which the Fund invests.
G Amount represents less than .005%.
H Annualized
See accompanying notes which are an integral part of the financial statements.
Fidelity Flex℠ Freedom 2055 Fund
Investment Summary (Unaudited)
The information in the following tables is based on the direct investments of the Fund.
Top Holdings as of March 31, 2019
| | % of fund's net assets |
| Fidelity Series Intrinsic Opportunities Fund | 10.4 |
| Fidelity Series Large Cap Stock Fund | 9.0 |
| Fidelity Series International Growth Fund | 9.0 |
| Fidelity Series International Value Fund | 9.0 |
| Fidelity Series Emerging Markets Opportunities Fund | 8.8 |
| Fidelity Series Growth Company Fund | 8.5 |
| Fidelity Series Stock Selector Large Cap Value Fund | 6.9 |
| Fidelity Series Value Discovery Fund | 4.9 |
| Fidelity Series Opportunistic Insights Fund | 4.6 |
| Fidelity Series Blue Chip Growth Fund | 4.2 |
| | 75.3 |
Asset Allocation (% of fund's net assets)
| Period end |
| | Domestic Equity Funds | 61.3% |
| | International Equity Funds | 31.0% |
| | Bond Funds | 6.8% |
| | Short-Term Funds | 0.9% |

Domestic Equity Funds category includes Fidelity Series Commodity Strategy Fund which invests in commodity-related investments.
Fidelity Flex℠ Freedom 2055 Fund
Schedule of Investments March 31, 2019
Showing Percentage of Net Assets
| Domestic Equity Funds - 61.3% | | | |
| | | Shares | Value |
| Fidelity Series All-Sector Equity Fund (a) | | 272 | $2,621 |
| Fidelity Series Blue Chip Growth Fund (a) | | 320 | 4,724 |
| Fidelity Series Commodity Strategy Fund (a) | | 704 | 3,356 |
| Fidelity Series Growth Company Fund (a) | | 566 | 9,575 |
| Fidelity Series Intrinsic Opportunities Fund (a) | | 715 | 11,763 |
| Fidelity Series Large Cap Stock Fund (a) | | 697 | 10,208 |
| Fidelity Series Large Cap Value Index Fund (a) | | 229 | 2,845 |
| Fidelity Series Opportunistic Insights Fund (a) | | 295 | 5,160 |
| Fidelity Series Small Cap Discovery Fund (a) | | 124 | 1,377 |
| Fidelity Series Small Cap Opportunities Fund (a) | | 315 | 4,238 |
| Fidelity Series Stock Selector Large Cap Value Fund (a) | | 656 | 7,736 |
| Fidelity Series Value Discovery Fund (a) | | 440 | 5,501 |
| TOTAL DOMESTIC EQUITY FUNDS | | | |
| (Cost $70,489) | | | 69,104 |
|
| International Equity Funds - 31.0% | | | |
| Fidelity Series Canada Fund (a) | | 106 | 1,094 |
| Fidelity Series Emerging Markets Fund (a) | | 113 | 1,103 |
| Fidelity Series Emerging Markets Opportunities Fund (a) | | 538 | 9,975 |
| Fidelity Series International Growth Fund (a) | | 671 | 10,198 |
| Fidelity Series International Small Cap Fund (a) | | 157 | 2,446 |
| Fidelity Series International Value Fund (a) | | 1,089 | 10,131 |
| TOTAL INTERNATIONAL EQUITY FUNDS | | | |
| (Cost $36,371) | | | 34,947 |
|
| Bond Funds - 6.8% | | | |
| Fidelity Series Emerging Markets Debt Fund (a) | | 82 | 789 |
| Fidelity Series Floating Rate High Income Fund (a) | | 18 | 169 |
| Fidelity Series High Income Fund (a) | | 90 | 849 |
| Fidelity Series Inflation-Protected Bond Index Fund (a) | | 35 | 339 |
| Fidelity Series International Credit Fund (a) | | 4 | 36 |
| Fidelity Series Investment Grade Bond Fund (a) | | 86 | 958 |
| Fidelity Series Long-Term Treasury Bond Index Fund (a) | | 449 | 3,987 |
| Fidelity Series Real Estate Income Fund (a) | | 49 | 530 |
| TOTAL BOND FUNDS | | | |
| (Cost $7,617) | | | 7,657 |
|
| Short-Term Funds - 0.9% | | | |
| Fidelity Series Government Money Market Fund 2.50% (a)(b) | | 784 | 784 |
| Fidelity Series Short-Term Credit Fund (a) | | 20 | 197 |
| TOTAL SHORT-TERM FUNDS | | | |
| (Cost $979) | | | 981 |
| TOTAL INVESTMENT IN SECURITIES - 100.0% | | | |
| (Cost $115,456) | | | 112,689 |
| NET OTHER ASSETS (LIABILITIES) - 0.0% | | | 2 |
| NET ASSETS - 100% | | | $112,691 |
Legend
(a) Affiliated Fund
(b) The rate quoted is the annualized seven-day yield of the fund at period end.
Affiliated Underlying Funds
Fiscal year to date information regarding the Fund's investments in affiliated Underlying Funds, excluding any Money Market Central Funds, is presented below. Exchanges between classes of the same affiliated Underlying Funds may occur.
| Affiliate | Value, beginning of period | Purchases | Sales Proceeds | Dividend Income | Realized Gain (loss) | Change in Unrealized appreciation (depreciation) | Value, end of period |
| Fidelity Series 100 Index Fund | $2,186 | $-- | $2,282 | $-- | $245 | $(149) | $-- |
| Fidelity Series All-Sector Equity Fund | 4,192 | 781 | 2,090 | 633 | 75 | (337) | 2,621 |
| Fidelity Series Blue Chip Growth Fund | 4,332 | 990 | 750 | 606 | (6) | 158 | 4,724 |
| Fidelity Series Canada Fund | 964 | 246 | 131 | 22 | (4) | 19 | 1,094 |
| Fidelity Series Commodity Strategy Fund | 2,289 | 1,795 | 418 | 164 | (35) | (275) | 3,356 |
| Fidelity Series Emerging Markets Debt Fund | 690 | 162 | 30 | 41 | (2) | (31) | 789 |
| Fidelity Series Emerging Markets Fund | -- | 1,135 | 43 | 4 | (3) | 14 | 1,103 |
| Fidelity Series Emerging Markets Opportunities Fund | 9,972 | 3,581 | 2,049 | 786 | (62) | (1,467) | 9,975 |
| Fidelity Series Floating Rate High Income Fund | 250 | 15 | 91 | 15 | (1) | (4) | 169 |
| Fidelity Series Government Money Market Fund 2.50% | 1,759 | 2,200 | 3,175 | 28 | -- | -- | 784 |
| Fidelity Series Growth Company Fund | 9,180 | 2,195 | 1,648 | 1,004 | 1 | (153) | 9,575 |
| Fidelity Series High Income Fund | 1,519 | 97 | 747 | 97 | (24) | 4 | 849 |
| Fidelity Series Inflation-Protected Bond Index Fund | 910 | 120 | 697 | 6 | (11) | 17 | 339 |
| Fidelity Series International Credit Fund | 34 | 2 | -- | 2 | -- | -- | 36 |
| Fidelity Series International Growth Fund | 9,708 | 1,885 | 830 | 650 | (26) | (539) | 10,198 |
| Fidelity Series International Small Cap Fund | 2,422 | 536 | 102 | 221 | (2) | (408) | 2,446 |
| Fidelity Series International Value Fund | 9,834 | 1,958 | 449 | 354 | (3) | (1,209) | 10,131 |
| Fidelity Series Intrinsic Opportunities Fund | 10,472 | 2,906 | 553 | 904 | (21) | (1,041) | 11,763 |
| Fidelity Series Investment Grade Bond Fund | 524 | 609 | 195 | 20 | (3) | 23 | 958 |
| Fidelity Series Large Cap Stock Fund | 9,478 | 1,913 | 862 | 1,018 | (8) | (313) | 10,208 |
| Fidelity Series Large Cap Value Index Fund | 2,717 | 337 | 239 | 130 | (2) | 32 | 2,845 |
| Fidelity Series Long-Term Treasury Bond Index Fund | 2,489 | 2,904 | 1,556 | 108 | (39) | 189 | 3,987 |
| Fidelity Series Opportunistic Insights Fund | 4,749 | 829 | 441 | 430 | (6) | 29 | 5,160 |
| Fidelity Series Real Estate Equity Fund | 783 | 100 | 920 | 13 | (39) | 76 | -- |
| Fidelity Series Real Estate Income Fund | 465 | 64 | 8 | 37 | -- | 9 | 530 |
| Fidelity Series Short-Term Credit Fund | 350 | 595 | 751 | 8 | (3) | 6 | 197 |
| Fidelity Series Small Cap Discovery Fund | 1,267 | 339 | 100 | 165 | (9) | (120) | 1,377 |
| Fidelity Series Small Cap Opportunities Fund | 3,900 | 1,006 | 449 | 472 | (17) | (202) | 4,238 |
| Fidelity Series Stock Selector Large Cap Value Fund | 7,305 | 1,276 | 562 | 641 | (14) | (269) | 7,736 |
| Fidelity Series Value Discovery Fund | 5,166 | 903 | 412 | 322 | (8) | (148) | 5,501 |
| Total | $109,906 | $31,479 | $22,580 | $8,901 | $(27) | $(6,089) | $112,689 |
Amounts in the income column in the above table include any capital gain distributions from underlying funds, which are presented in the corresponding line-item in the Statement of Operations, if applicable.
Investment Valuation
All investments are categorized as Level 1 under the Fair Value Hierarchy. The inputs or methodology used for valuing securities may not be an indication of the risk associated with investing in those securities. For more information on valuation inputs please refer to the Investment Valuation section in the accompanying Notes to Financial Statements.
See accompanying notes which are an integral part of the financial statements.
Fidelity Flex℠ Freedom 2055 Fund
Financial Statements
Statement of Assets and Liabilities
| | | March 31, 2019 |
| Assets | | |
Investment in securities, at value — See accompanying schedule:
| | |
| Affiliated issuers (cost $115,456) | $112,689 | |
| Total Investment in Securities (cost $115,456) | | $112,689 |
| Receivable for investments sold | | 1,829 |
| Total assets | | 114,518 |
| Liabilities | | |
| Payable for investments purchased | $1,827 | |
| Total liabilities | | 1,827 |
| Net Assets | | $112,691 |
| Net Assets consist of: | | |
| Paid in capital | | $111,177 |
| Total distributable earnings (loss) | | 1,514 |
| Net Assets, for 11,127 shares outstanding | | $112,691 |
| Net Asset Value, offering price and redemption price per share ($112,691 ÷ 11,127 shares) | | $10.13 |
See accompanying notes which are an integral part of the financial statements.
Statement of Operations
| | | Year ended March 31, 2019 |
| Investment Income | | |
| Dividends: | | |
| Affiliated issuers | | $2,347 |
| Expenses | | |
| Independent trustees' fees and expenses | $1 | |
| Total expenses | | 1 |
| Net investment income (loss) | | 2,346 |
| Realized and Unrealized Gain (Loss) | | |
| Net realized gain (loss) on: | | |
| Investment securities: | | |
| Affiliated issuers | (27) | |
| Capital gain distributions from underlying funds: | | |
| Affiliated issuers | 6,554 | |
| Total net realized gain (loss) | | 6,527 |
| Change in net unrealized appreciation (depreciation) on: | | |
| Investment securities: | | |
| Affiliated issuers | (6,089) | |
| Total change in net unrealized appreciation (depreciation) | | (6,089) |
| Net gain (loss) | | 438 |
| Net increase (decrease) in net assets resulting from operations | | $2,784 |
See accompanying notes which are an integral part of the financial statements.
Statement of Changes in Net Assets
| | Year ended March 31, 2019 | For the period
June 8, 2017 (commencement of operations) to March 31, 2018 |
| Increase (Decrease) in Net Assets | | |
| Operations | | |
| Net investment income (loss) | $2,346 | $1,740 |
| Net realized gain (loss) | 6,527 | 4,845 |
| Change in net unrealized appreciation (depreciation) | (6,089) | 3,322 |
| Net increase (decrease) in net assets resulting from operations | 2,784 | 9,907 |
| Distributions to shareholders | (7,866) | – |
| Distributions to shareholders from net investment income | – | (1,660) |
| Distributions to shareholders from net realized gain | – | (1,650) |
| Total distributions | (7,866) | (3,310) |
| Share transactions | | |
| Proceeds from sales of shares | – | 100,000 |
| Reinvestment of distributions | 7,866 | 3,310 |
| Net increase (decrease) in net assets resulting from share transactions | 7,866 | 103,310 |
| Total increase (decrease) in net assets | 2,784 | 109,907 |
| Net Assets | | |
| Beginning of period | 109,907 | – |
| End of period | $112,691 | $109,907 |
| Other Information | | |
| Undistributed net investment income end of period | | $80 |
| Shares | | |
| Sold | – | 10,000 |
| Issued in reinvestment of distributions | 817 | 310 |
| Net increase (decrease) | 817 | 10,310 |
See accompanying notes which are an integral part of the financial statements.
Financial Highlights
Fidelity Flex Freedom 2055 Fund
| | | |
| Years ended March 31, | 2019 | 2018 A |
| Selected Per–Share Data | | |
| Net asset value, beginning of period | $10.66 | $10.00 |
| Income from Investment Operations | | |
| Net investment income (loss)B | .22 | .17 |
| Net realized and unrealized gain (loss) | –C | .82 |
| Total from investment operations | .22 | .99 |
| Distributions from net investment income | (.22) | (.17) |
| Distributions from net realized gain | (.53) | (.17) |
| Total distributions | (.75) | (.33)D |
| Net asset value, end of period | $10.13 | $10.66 |
| Total ReturnE | 2.56% | 9.90% |
| Ratios to Average Net AssetsF,G | | |
| Expenses before reductions | - %H | - %I |
| Expenses net of fee waivers, if any | - %H | - %I |
| Expenses net of all reductions | - %H | - %I |
| Net investment income (loss) | 2.13% | 2.00%I |
| Supplemental Data | | |
| Net assets, end of period (000 omitted) | $113 | $110 |
| Portfolio turnover rateF | 20% | 13%I |
A For the period June 8, 2017 (commencement of operations) to March 31, 2018.
B Calculated based on average shares outstanding during the period.
C Amount represents less than $.005 per share.
D Total distributions of $.33 per share is comprised of distributions from net investment income of $.166 and distributions from net realized gain of $.165 per share.
E Total returns for periods of less than one year are not annualized.
F Amounts do not include the activity of the Underlying Funds.
G Expense ratios reflect operating expenses of the Fund. Expenses before reductions do not reflect amounts reimbursed by the investment adviser or reductions from expense offset arrangements and do not represent the amount paid by the Fund during periods when reimbursements or reductions occur. Expenses net of fee waivers reflect expenses after reimbursement by the investment adviser but prior to reductions from expense offset arrangements. Expenses net of all reductions represent the net expenses paid by the Fund but do not include expenses of the underlying funds in which the Fund invests.
H Amount represents less than .005%.
I Annualized
See accompanying notes which are an integral part of the financial statements.
Fidelity Flex℠ Freedom 2060 Fund
Investment Summary (Unaudited)
The information in the following tables is based on the direct investments of the Fund.
Top Holdings as of March 31, 2019
| | % of fund's net assets |
| Fidelity Series Intrinsic Opportunities Fund | 10.4 |
| Fidelity Series Large Cap Stock Fund | 9.0 |
| Fidelity Series International Growth Fund | 9.0 |
| Fidelity Series International Value Fund | 9.0 |
| Fidelity Series Emerging Markets Opportunities Fund | 8.8 |
| Fidelity Series Growth Company Fund | 8.5 |
| Fidelity Series Stock Selector Large Cap Value Fund | 6.9 |
| Fidelity Series Value Discovery Fund | 4.9 |
| Fidelity Series Opportunistic Insights Fund | 4.6 |
| Fidelity Series Blue Chip Growth Fund | 4.2 |
| | 75.3 |
Asset Allocation (% of fund's net assets)
| Period end |
| | Domestic Equity Funds | 61.3% |
| | International Equity Funds | 31.0% |
| | Bond Funds | 6.8% |
| | Short-Term Funds | 0.9% |

Domestic Equity Funds category includes Fidelity Series Commodity Strategy Fund which invests in commodity-related investments.
Fidelity Flex℠ Freedom 2060 Fund
Schedule of Investments March 31, 2019
Showing Percentage of Net Assets
| Domestic Equity Funds - 61.3% | | | |
| | | Shares | Value |
| Fidelity Series All-Sector Equity Fund (a) | | 272 | $2,621 |
| Fidelity Series Blue Chip Growth Fund (a) | | 321 | 4,733 |
| Fidelity Series Commodity Strategy Fund (a) | | 704 | 3,356 |
| Fidelity Series Growth Company Fund (a) | | 566 | 9,574 |
| Fidelity Series Intrinsic Opportunities Fund (a) | | 715 | 11,763 |
| Fidelity Series Large Cap Stock Fund (a) | | 696 | 10,197 |
| Fidelity Series Large Cap Value Index Fund (a) | | 229 | 2,845 |
| Fidelity Series Opportunistic Insights Fund (a) | | 295 | 5,159 |
| Fidelity Series Small Cap Discovery Fund (a) | | 124 | 1,379 |
| Fidelity Series Small Cap Opportunities Fund (a) | | 314 | 4,226 |
| Fidelity Series Stock Selector Large Cap Value Fund (a) | | 657 | 7,748 |
| Fidelity Series Value Discovery Fund (a) | | 440 | 5,501 |
| TOTAL DOMESTIC EQUITY FUNDS | | | |
| (Cost $70,470) | | | 69,102 |
|
| International Equity Funds - 31.0% | | | |
| Fidelity Series Canada Fund (a) | | 106 | 1,092 |
| Fidelity Series Emerging Markets Fund (a) | | 113 | 1,103 |
| Fidelity Series Emerging Markets Opportunities Fund (a) | | 538 | 9,975 |
| Fidelity Series International Growth Fund (a) | | 671 | 10,197 |
| Fidelity Series International Small Cap Fund (a) | | 158 | 2,451 |
| Fidelity Series International Value Fund (a) | | 1,089 | 10,128 |
| TOTAL INTERNATIONAL EQUITY FUNDS | | | |
| (Cost $36,372) | | | 34,946 |
|
| Bond Funds - 6.8% | | | |
| Fidelity Series Emerging Markets Debt Fund (a) | | 82 | 789 |
| Fidelity Series Floating Rate High Income Fund (a) | | 18 | 169 |
| Fidelity Series High Income Fund (a) | | 90 | 849 |
| Fidelity Series Inflation-Protected Bond Index Fund (a) | | 35 | 339 |
| Fidelity Series International Credit Fund (a) | | 4 | 36 |
| Fidelity Series Investment Grade Bond Fund (a) | | 86 | 958 |
| Fidelity Series Long-Term Treasury Bond Index Fund (a) | | 449 | 3,986 |
| Fidelity Series Real Estate Income Fund (a) | | 49 | 530 |
| TOTAL BOND FUNDS | | | |
| (Cost $7,617) | | | 7,656 |
|
| Short-Term Funds - 0.9% | | | |
| Fidelity Series Government Money Market Fund 2.50% (a)(b) | | 784 | 784 |
| Fidelity Series Short-Term Credit Fund (a) | | 20 | 197 |
| TOTAL SHORT-TERM FUNDS | | | |
| (Cost $979) | | | 981 |
| TOTAL INVESTMENT IN SECURITIES - 100.0% | | | |
| (Cost $115,438) | | | 112,685 |
| NET OTHER ASSETS (LIABILITIES) - 0.0% | | | (1) |
| NET ASSETS - 100% | | | $112,684 |
Legend
(a) Affiliated Fund
(b) The rate quoted is the annualized seven-day yield of the fund at period end.
Affiliated Underlying Funds
Fiscal year to date information regarding the Fund's investments in affiliated Underlying Funds, excluding any Money Market Central Funds, is presented below. Exchanges between classes of the same affiliated Underlying Funds may occur.
| Affiliate | Value, beginning of period | Purchases | Sales Proceeds | Dividend Income | Realized Gain (loss) | Change in Unrealized appreciation (depreciation) | Value, end of period |
| Fidelity Series 100 Index Fund | $2,207 | $-- | $2,303 | $-- | $245 | $(149) | $-- |
| Fidelity Series All-Sector Equity Fund | 4,192 | 792 | 2,089 | 639 | 70 | (344) | 2,621 |
| Fidelity Series Blue Chip Growth Fund | 4,333 | 963 | 715 | 609 | (7) | 159 | 4,733 |
| Fidelity Series Canada Fund | 964 | 250 | 135 | 23 | (3) | 16 | 1,092 |
| Fidelity Series Commodity Strategy Fund | 2,301 | 1,782 | 417 | 164 | (35) | (275) | 3,356 |
| Fidelity Series Emerging Markets Debt Fund | 648 | 189 | 16 | 40 | (1) | (31) | 789 |
| Fidelity Series Emerging Markets Fund | -- | 1,137 | 43 | 4 | (3) | 12 | 1,103 |
| Fidelity Series Emerging Markets Opportunities Fund | 9,996 | 3,560 | 2,056 | 786 | (56) | (1,469) | 9,975 |
| Fidelity Series Floating Rate High Income Fund | 239 | 37 | 102 | 14 | (1) | (4) | 169 |
| Fidelity Series Government Money Market Fund 2.50% | 1,758 | 2,016 | 2,990 | 28 | -- | -- | 784 |
| Fidelity Series Growth Company Fund | 9,193 | 2,206 | 1,668 | 1,004 | (7) | (150) | 9,574 |
| Fidelity Series High Income Fund | 1,519 | 97 | 747 | 97 | (24) | 4 | 849 |
| Fidelity Series Inflation-Protected Bond Index Fund | 914 | 115 | 696 | 6 | (11) | 17 | 339 |
| Fidelity Series International Credit Fund | 49 | 2 | 15 | 2 | -- | -- | 36 |
| Fidelity Series International Growth Fund | 9,708 | 1,863 | 813 | 648 | (29) | (532) | 10,197 |
| Fidelity Series International Small Cap Fund | 2,422 | 507 | 67 | 221 | 3 | (414) | 2,451 |
| Fidelity Series International Value Fund | 9,827 | 1,943 | 431 | 353 | (1) | (1,210) | 10,128 |
| Fidelity Series Intrinsic Opportunities Fund | 10,528 | 2,853 | 558 | 905 | (20) | (1,040) | 11,763 |
| Fidelity Series Investment Grade Bond Fund | 524 | 604 | 190 | 20 | (3) | 23 | 958 |
| Fidelity Series Large Cap Stock Fund | 9,478 | 1,891 | 863 | 1,015 | (8) | (301) | 10,197 |
| Fidelity Series Large Cap Value Index Fund | 2,699 | 347 | 231 | 130 | (1) | 31 | 2,845 |
| Fidelity Series Long-Term Treasury Bond Index Fund | 2,493 | 2,754 | 1,410 | 108 | (39) | 188 | 3,986 |
| Fidelity Series Opportunistic Insights Fund | 4,749 | 910 | 513 | 436 | (9) | 22 | 5,159 |
| Fidelity Series Real Estate Equity Fund | 805 | 78 | 920 | 13 | (41) | 78 | -- |
| Fidelity Series Real Estate Income Fund | 465 | 71 | 15 | 37 | -- | 9 | 530 |
| Fidelity Series Short-Term Credit Fund | 350 | 546 | 702 | 8 | (3) | 6 | 197 |
| Fidelity Series Small Cap Discovery Fund | 1,267 | 349 | 108 | 166 | (8) | (121) | 1,379 |
| Fidelity Series Small Cap Opportunities Fund | 3,900 | 983 | 434 | 472 | (24) | (199) | 4,226 |
| Fidelity Series Stock Selector Large Cap Value Fund | 7,305 | 1,261 | 535 | 641 | (14) | (269) | 7,748 |
| Fidelity Series Value Discovery Fund | 5,072 | 981 | 395 | 322 | (8) | (149) | 5,501 |
| Total | $109,905 | $31,087 | $22,177 | $8,911 | $(38) | $(6,092) | $112,685 |
Amounts in the income column in the above table include any capital gain distributions from underlying funds, which are presented in the corresponding line-item in the Statement of Operations, if applicable.
Investment Valuation
All investments are categorized as Level 1 under the Fair Value Hierarchy. The inputs or methodology used for valuing securities may not be an indication of the risk associated with investing in those securities. For more information on valuation inputs please refer to the Investment Valuation section in the accompanying Notes to Financial Statements.
See accompanying notes which are an integral part of the financial statements.
Fidelity Flex℠ Freedom 2060 Fund
Financial Statements
Statement of Assets and Liabilities
| | | March 31, 2019 |
| Assets | | |
Investment in securities, at value — See accompanying schedule:
| | |
| Affiliated issuers (cost $115,438) | $112,685 | |
| Total Investment in Securities (cost $115,438) | | $112,685 |
| Receivable for investments sold | | 1,800 |
| Total assets | | 114,485 |
| Liabilities | | |
| Payable for investments purchased | $1,801 | |
| Total liabilities | | 1,801 |
| Net Assets | | $112,684 |
| Net Assets consist of: | | |
| Paid in capital | | $111,154 |
| Total distributable earnings (loss) | | 1,530 |
| Net Assets, for 11,125 shares outstanding | | $112,684 |
| Net Asset Value, offering price and redemption price per share ($112,684 ÷ 11,125 shares) | | $10.13 |
See accompanying notes which are an integral part of the financial statements.
Statement of Operations
| | | Year ended March 31, 2019 |
| Investment Income | | |
| Dividends: | | |
| Affiliated issuers | | $2,346 |
| Expenses | | |
| Independent trustees' fees and expenses | $1 | |
| Total expenses | | 1 |
| Net investment income (loss) | | 2,345 |
| Realized and Unrealized Gain (Loss) | | |
| Net realized gain (loss) on: | | |
| Investment securities: | | |
| Affiliated issuers | (38) | |
| Capital gain distributions from underlying funds: | | |
| Affiliated issuers | 6,565 | |
| Total net realized gain (loss) | | 6,527 |
| Change in net unrealized appreciation (depreciation) on: | | |
| Investment securities: | | |
| Affiliated issuers | (6,092) | |
| Total change in net unrealized appreciation (depreciation) | | (6,092) |
| Net gain (loss) | | 435 |
| Net increase (decrease) in net assets resulting from operations | | $2,780 |
See accompanying notes which are an integral part of the financial statements.
Statement of Changes in Net Assets
| | Year ended March 31, 2019 | For the period
June 8, 2017 (commencement of operations) to March 31, 2018 |
| Increase (Decrease) in Net Assets | | |
| Operations | | |
| Net investment income (loss) | $2,345 | $1,740 |
| Net realized gain (loss) | 6,527 | 4,826 |
| Change in net unrealized appreciation (depreciation) | (6,092) | 3,339 |
| Net increase (decrease) in net assets resulting from operations | 2,780 | 9,905 |
| Distributions to shareholders | (7,855) | – |
| Distributions to shareholders from net investment income | – | (1,650) |
| Distributions to shareholders from net realized gain | – | (1,650) |
| Total distributions | (7,855) | (3,300) |
| Share transactions | | |
| Proceeds from sales of shares | – | 100,000 |
| Reinvestment of distributions | 7,854 | 3,300 |
| Net increase (decrease) in net assets resulting from share transactions | 7,854 | 103,300 |
| Total increase (decrease) in net assets | 2,779 | 109,905 |
| Net Assets | | |
| Beginning of period | 109,905 | – |
| End of period | $112,684 | $109,905 |
| Other Information | | |
| Undistributed net investment income end of period | | $90 |
| Shares | | |
| Sold | – | 10,000 |
| Issued in reinvestment of distributions | 816 | 309 |
| Net increase (decrease) | 816 | 10,309 |
See accompanying notes which are an integral part of the financial statements.
Financial Highlights
Fidelity Flex Freedom 2060 Fund
| | | |
| Years ended March 31, | 2019 | 2018 A |
| Selected Per–Share Data | | |
| Net asset value, beginning of period | $10.66 | $10.00 |
| Income from Investment Operations | | |
| Net investment income (loss)B | .22 | .17 |
| Net realized and unrealized gain (loss) | –C | .82 |
| Total from investment operations | .22 | .99 |
| Distributions from net investment income | (.22) | (.17) |
| Distributions from net realized gain | (.53) | (.17) |
| Total distributions | (.75) | (.33)D |
| Net asset value, end of period | $10.13 | $10.66 |
| Total ReturnE | 2.55% | 9.89% |
| Ratios to Average Net AssetsF,G | | |
| Expenses before reductions | - %H | - %I |
| Expenses net of fee waivers, if any | - %H | - %I |
| Expenses net of all reductions | - %H | - %I |
| Net investment income (loss) | 2.13% | 2.00%I |
| Supplemental Data | | |
| Net assets, end of period (000 omitted) | $113 | $110 |
| Portfolio turnover rateG | 20% | 13%I |
A For the period June 8, 2017 (commencement of operations) to March 31, 2018.
B Calculated based on average shares outstanding during the period.
C Amount represents less than $.005 per share.
D Total distributions of $.33 per share is comprised of distributions from net investment income of $.165 and distributions from net realized gain of $.165 per share.
E Total returns for periods of less than one year are not annualized.
F Expense ratios reflect operating expenses of the Fund. Expenses before reductions do not reflect amounts reimbursed by the investment adviser or reductions from expense offset arrangements and do not represent the amount paid by the Fund during periods when reimbursements or reductions occur. Expenses net of fee waivers reflect expenses after reimbursement by the investment adviser but prior to reductions from expense offset arrangements. Expenses net of all reductions represent the net expenses paid by the Fund but do not include expenses of the underlying funds in which the Fund invests.
G Amounts do not include the activity of the Underlying Funds.
H Amount represents less than .005%.
I Annualized
See accompanying notes which are an integral part of the financial statements.
Notes to Financial Statements
For the period ended March 31, 2019
1. Organization.
Fidelity Flex Freedom Income Fund, Fidelity Flex Freedom 2005 Fund, Fidelity Flex Freedom 2010 Fund, Fidelity Flex Freedom 2015 Fund, Fidelity Flex Freedom 2020 Fund, Fidelity Flex Freedom 2025 Fund, Fidelity Flex Freedom 2030 Fund, Fidelity Flex Freedom 2035 Fund, Fidelity Flex Freedom 2040 Fund, Fidelity Freedom Flex 2045 Fund, Fidelity Freedom Flex 2050 Fund, Fidelity Freedom Flex 2055 Fund and Fidelity Freedom Flex 2060 Fund (the Funds) are funds of Fidelity Aberdeen Street Trust (the Trust). The Trust is registered under the Investment Company Act of 1940, as amended (the 1940 Act), as an open-end management investment company organized as a Delaware statutory trust. Each Fund is authorized to issue an unlimited number of shares. The Funds are available only to certain fee-based accounts offered by Fidelity. Share transactions on the Statement of Changes in Net Assets may contain exchanges between affiliated funds. The Funds invest primarily in a combination of other Fidelity equity, bond, and short-term funds (the Underlying Funds) managed by Fidelity Management & Research Company (FMR). Certain Underlying Funds incurred name changes since their most recent shareholder report. The names of the Underlying Funds are those in effect at period end.
2. Significant Accounting Policies.
Each Fund is an investment company and applies the accounting and reporting guidance of the Financial Accounting Standards Board (FASB) Accounting Standards Codification Topic 946 Financial Services – Investments Companies. The financial statements have been prepared in conformity with accounting principles generally accepted in the United States of America (GAAP), which require management to make certain estimates and assumptions at the date of the financial statements. Actual results could differ from those estimates. Subsequent events, if any, through the date that the financial statements were issued have been evaluated in the preparation of the financial statements. The following summarizes the significant accounting policies of the Funds:
Investment Valuation. Investments are valued as of 4:00 p.m. Eastern time on the last calendar day of the period. Each Fund categorizes the inputs to valuation techniques used to value its investments into a disclosure hierarchy consisting of three levels as shown below:
- Level 1 – quoted prices in active markets for identical investments
- Level 2 – other significant observable inputs (including quoted prices for similar investments, interest rates, prepayment speeds, etc.)
- Level 3 – unobservable inputs (including the Fund's own assumptions based on the best information available)
Valuation techniques used to value each Fund's investments by major category are as follows. Investments in the Underlying Funds are valued at their closing net asset value (NAV) each business day and are categorized as Level 1 in the hierarchy.
Investment Transactions and Income. For financial reporting purposes, the Funds' investment holdings and NAV include trades executed through the end of the last business day of the period. The NAV per share for processing shareholder transactions is calculated as of the close of business of the New York Stock Exchange (NYSE), normally 4:00 p.m. Eastern time and includes trades executed through the end of the prior business day. Gains and losses on securities sold are determined on the basis of identified cost. Income and capital gain distributions from the Underlying Funds, if any, are recorded on the ex-dividend date.
Expenses. Expenses directly attributable to a fund are charged to that fund. Expenses attributable to more than one fund are allocated among the respective funds on the basis of relative net assets or other appropriate methods. Expenses included in the accompanying financial statements reflect the expenses of each Fund and do not include any expenses associated with the Underlying Funds. Although not included in each Fund's expenses, each Fund indirectly bears its proportionate share of the Underlying Funds' expenses through the impact of these expenses on each Underlying Fund's NAV. Expense estimates are accrued in the period to which they relate and adjustments are made when actual amounts are known.
Income Tax Information and Distributions to Shareholders. Each year, each Fund intends to qualify as a regulated investment company under Subchapter M of the Internal Revenue Code, including distributing substantially all of its taxable income and realized gains. As a result, no provision for U.S. Federal income taxes is required. As of March 31, 2019, each Fund did not have any unrecognized tax benefits in the financial statements; nor is each Fund aware of any tax positions for which it is reasonably possible that the total amounts of unrecognized tax benefits will significantly change in the next twelve months. Each Fund files a U.S. federal tax return, in addition to state and local tax returns as required. Each Fund's federal income tax returns are subject to examination by the Internal Revenue Service (IRS) for a period of three fiscal years after they are filed. State and local tax returns may be subject to examination for an additional fiscal year depending on the jurisdiction.
Distributions are declared and recorded on the ex-dividend date. Income and capital gain distributions are determined in accordance with income tax regulations, which may differ from GAAP.
Capital accounts within the financial statements are adjusted for permanent book-tax differences. These adjustments have no impact on net assets or the results of operations. Capital accounts are not adjusted for temporary book-tax differences which will reverse in a subsequent period.
Book-tax differences are primarily due to the short-term gain distributions from the Underlying Funds and losses deferred due to wash sales and excise tax regulations.
As of period end, the cost and unrealized appreciation (depreciation) in securities, and derivatives if applicable, for federal income tax purposes were as follows for each Fund:
| | Tax cost | Gross unrealized appreciation | Gross unrealized depreciation | Net unrealized appreciation (depreciation) |
| Fidelity Flex Freedom Income Fund | $107,611 | $532 | $(1,302) | $(770) |
| Fidelity Flex Freedom 2005 Fund | 108,798 | 692 | (1,617) | (925) |
| Fidelity Flex Freedom 2010 Fund | 109,854 | 870 | (1,960) | (1,090) |
| Fidelity Flex Freedom 2015 Fund | 110,924 | 1,034 | (2,337) | (1,303) |
| Fidelity Flex Freedom 2020 Fund | 111,688 | 1,151 | (2,631) | (1,480) |
| Fidelity Flex Freedom 2025 Fund | 112,433 | 1,273 | (2,946) | (1,673) |
| Fidelity Flex Freedom 2030 Fund | 113,982 | 1,436 | (3,449) | (2,013) |
| Fidelity Flex Freedom 2035 Fund | 115,234 | 1,601 | (4,100) | (2,499) |
| Fidelity Flex Freedom 2040 Fund | 115,604 | 1,507 | (4,437) | (2,930) |
| Fidelity Flex Freedom 2045 Fund | 115,616 | 1,501 | (4,428) | (2,927) |
| Fidelity Flex Freedom 2050 Fund | 115,583 | 1,514 | (4,421) | (2,907) |
| Fidelity Flex Freedom 2055 Fund | 115,617 | 1,498 | (4,426) | (2,928) |
| Fidelity Flex Freedom 2060 Fund | 115,602 | 1,498 | (4,415) | (2,917) |
The tax-based components of distributable earnings as of period end were as follows for each Fund:
| | Undistributed ordinary income | Undistributed long-term capital gain | Net unrealized appreciation (depreciation) on securities and other investments |
| Fidelity Flex Freedom Income Fund | $212 | $674 | $(770) |
| Fidelity Flex Freedom 2005 Fund | 488 | 1,070 | (925) |
| Fidelity Flex Freedom 2010 Fund | 446 | 1,487 | (1,090) |
| Fidelity Flex Freedom 2015 Fund | 385 | 1,943 | (1,303) |
| Fidelity Flex Freedom 2020 Fund | 344 | 2,306 | (1,480) |
| Fidelity Flex Freedom 2025 Fund | 291 | 2,683 | (1,673) |
| Fidelity Flex Freedom 2030 Fund | 224 | 3,466 | (2,013) |
| Fidelity Flex Freedom 2035 Fund | 117 | 4,225 | (2,499) |
| Fidelity Flex Freedom 2040 Fund | 82 | 4,467 | (2,930) |
| Fidelity Flex Freedom 2045 Fund | 80 | 4,458 | (2,927) |
| Fidelity Flex Freedom 2050 Fund | 79 | 4,471 | (2,907) |
| Fidelity Flex Freedom 2055 Fund | 82 | 4,463 | (2,928) |
| Fidelity Flex Freedom 2060 Fund | 81 | 4,470 | (2,917) |
Certain of the Funds intend to elect to defer to the next fiscal year capital losses recognized during the period November 1, 2018 to March 31, 2019. Loss deferrals were as follows:
| | Capital losses |
| Fidelity Flex Freedom 2030 Fund | $(173) |
| Fidelity Flex Freedom 2035 Fund | (166) |
| Fidelity Flex Freedom 2040 Fund | (121) |
| Fidelity Flex Freedom 2045 Fund | (97) |
| Fidelity Flex Freedom 2050 Fund | (122) |
| Fidelity Flex Freedom 2055 Fund | (103) |
| Fidelity Flex Freedom 2060 Fund | (103) |
The tax character of distributions paid was as follows:
| March 31, 2019 | | | |
| | Ordinary Income | Long-term Capital Gains | Total |
| Fidelity Flex Freedom Income Fund | $3,186 | $1,282 | $4,468 |
| Fidelity Flex Freedom 2005 Fund | 3,260 | 1,780 | 5,040 |
| Fidelity Flex Freedom 2010 Fund | 3,283 | 2,228 | 5,511 |
| Fidelity Flex Freedom 2015 Fund | 3,306 | 2,688 | 5,994 |
| Fidelity Flex Freedom 2020 Fund | 3,294 | 3,013 | 6,307 |
| Fidelity Flex Freedom 2025 Fund | 3,291 | 3,318 | 6,609 |
| Fidelity Flex Freedom 2030 Fund | 3,363 | 3,963 | 7,326 |
| Fidelity Flex Freedom 2035 Fund | 3,218 | 4,561 | 7,779 |
| Fidelity Flex Freedom 2040 Fund | 3,199 | 4,677 | 7,876 |
| Fidelity Flex Freedom 2045 Fund | 3,147 | 4,709 | 7,856 |
| Fidelity Flex Freedom 2050 Fund | 3,189 | 4,666 | 7,855 |
| Fidelity Flex Freedom 2055 Fund | 3,168 | 4,698 | 7,866 |
| Fidelity Flex Freedom 2060 Fund | 3,168 | 4,687 | 7,855 |
| March 31, 2018(a) | | | |
| | Ordinary Income | Long-term Capital Gains | Total |
| Fidelity Flex Freedom Income Fund | $1,973 | $282 | $2,255 |
| Fidelity Flex Freedom 2005 Fund | 1,800 | 400 | 2,200 |
| Fidelity Flex Freedom 2010 Fund | 1,900 | 510 | 2,410 |
| Fidelity Flex Freedom 2015 Fund | 1,980 | 620 | 2,600 |
| Fidelity Flex Freedom 2020 Fund | 2,030 | 700 | 2,730 |
| Fidelity Flex Freedom 2025 Fund | 2,080 | 770 | 2,850 |
| Fidelity Flex Freedom 2030 Fund | 2,200 | 940 | 3,140 |
| Fidelity Flex Freedom 2035 Fund | 2,210 | 1,070 | 3,280 |
| Fidelity Flex Freedom 2040 Fund | 2,210 | 1,090 | 3,300 |
| Fidelity Flex Freedom 2045 Fund | 2,230 | 1,090 | 3,320 |
| Fidelity Flex Freedom 2050 Fund | 2,210 | 1,090 | 3,300 |
| Fidelity Flex Freedom 2055 Fund | 2,220 | 1,090 | 3,310 |
| Fidelity Flex Freedom 2060 Fund | 2,210 | 1,090 | 3,300 |
(a) For the period June 8, 2017 (commencement of operations) to March 31, 2018.
New Rule Issuance. During August 2018, the U.S. Securities and Exchange Commission issued Final Rule Release No. 33-10532, Disclosure Update and Simplification. This Final Rule includes amendments specific to registered investment companies that are intended to eliminate overlap in disclosure requirements between Regulation S-X and GAAP. In accordance with these amendments, certain line-items in the Funds' financial statements have been combined or removed for the current period as outlined in the table below.
| Financial Statement | Current Line-Item Presentation (As Applicable) | Prior Line-Item Presentation (As Applicable) |
| Statement of Assets and Liabilities | Total distributable earnings (loss) | Undistributed/Distributions in excess of/Accumulated net investment income (loss)
Accumulated/Undistributed net realized gain (loss)
Net unrealized appreciation (depreciation) |
| Statement of Changes in Net Assets | N/A - removed | Undistributed/Distributions in excess of/Accumulated net investment income (loss) end of period |
| Statement of Changes in Net Assets | Distributions to shareholders | Distributions to shareholders from net investment income
Distributions to shareholders from net realized gain |
3. Purchases and Sales of Investments.
Purchases and sales of securities, other than short-term securities, are noted in the table below.
| | Purchases ($) | Sales ($) |
| Fidelity Flex Freedom Income Fund | 28,289 | 24,253 |
| Fidelity Flex Freedom 2005 Fund | 28,695 | 24,057 |
| Fidelity Flex Freedom 2010 Fund | 29,350 | 24,089 |
| Fidelity Flex Freedom 2015 Fund | 30,215 | 24,310 |
| Fidelity Flex Freedom 2020 Fund | 30,256 | 23,838 |
| Fidelity Flex Freedom 2025 Fund | 30,224 | 23,328 |
| Fidelity Flex Freedom 2030 Fund | 29,553 | 21,809 |
| Fidelity Flex Freedom 2035 Fund | 31,044 | 22,426 |
| Fidelity Flex Freedom 2040 Fund | 31,221 | 22,321 |
| Fidelity Flex Freedom 2045 Fund | 31,424 | 22,522 |
| Fidelity Flex Freedom 2050 Fund | 31,273 | 22,375 |
| Fidelity Flex Freedom 2055 Fund | 31,479 | 22,580 |
| Fidelity Flex Freedom 2060 Fund | 31,087 | 22,177 |
4. Fees and Other Transactions with Affiliates.
Management Fee. FMR Co., Inc. (the investment adviser), an affiliate of FMR, and its affiliates provide the Funds with investment management related services and the Funds do not pay any fees for these services. Under the management contract, the investment adviser or an affiliate pays all other expenses of the Funds, excluding fees and expenses of the independent Trustees, and certain miscellaneous expenses such as proxy and shareholder meeting expenses.
Interfund Trades. The Funds may purchase from or sell securities to other Fidelity Funds under procedures adopted by the Board. The procedures have been designed to ensure these interfund trades are executed in accordance with Rule 17a-7 of the 1940 Act. Interfund trades are included within the respective purchases and sales amounts shown in the Purchases and Sales of Investments note.
5. Other.
The Funds' organizational documents provide former and current trustees and officers with a limited indemnification against liabilities arising in connection with the performance of their duties to the Funds. In the normal course of business, the Funds may also enter into contracts that provide general indemnifications. The Funds' maximum exposure under these arrangements is unknown as this would be dependent on future claims that may be made against the Funds. The risk of material loss from such claims is considered remote.
At the end of the period, the investment adviser or its affiliates were owners of record of more than 10% of the outstanding shares of the following Funds:
| | Affiliated % |
| Fidelity Flex Freedom Income Fund | 100 |
| Fidelity Flex Freedom 2005 Fund | 100 |
| Fidelity Flex Freedom 2010 Fund | 100 |
| Fidelity Flex Freedom 2015 Fund | 100 |
| Fidelity Flex Freedom 2020 Fund | 100 |
| Fidelity Flex Freedom 2025 Fund | 100 |
| Fidelity Flex Freedom 2030 Fund | 100 |
| Fidelity Flex Freedom 2035 Fund | 100 |
| Fidelity Flex Freedom 2040 Fund | 100 |
| Fidelity Flex Freedom 2045 Fund | 100 |
| Fidelity Flex Freedom 2050 Fund | 100 |
| Fidelity Flex Freedom 2055 Fund | 100 |
| Fidelity Flex Freedom 2060 Fund | 100 |
Report of Independent Registered Public Accounting Firm
To the Board of Trustees of Fidelity Aberdeen Street Trust and Shareholders of Fidelity Flex Freedom Income Fund, Fidelity Flex Freedom 2005 Fund, Fidelity Flex Freedom 2010 Fund, Fidelity Flex Freedom 2015 Fund, Fidelity Flex Freedom 2020 Fund, Fidelity Flex Freedom 2025 Fund, Fidelity Flex Freedom 2030 Fund, Fidelity Flex Freedom 2035 Fund, Fidelity Flex Freedom 2040 Fund, Fidelity Flex Freedom 2045 Fund, Fidelity Flex Freedom 2050 Fund, Fidelity Flex Freedom 2055 Fund and Fidelity Flex Freedom 2060 Fund:
Opinions on the Financial Statements
We have audited the accompanying statements of assets and liabilities, including the schedules of investments, of Fidelity Flex Freedom Income Fund, Fidelity Flex Freedom 2005 Fund, Fidelity Flex Freedom 2010 Fund, Fidelity Flex Freedom 2015 Fund, Fidelity Flex Freedom 2020 Fund, Fidelity Flex Freedom 2025 Fund, Fidelity Flex Freedom 2030 Fund, Fidelity Flex Freedom 2035 Fund, Fidelity Flex Freedom 2040 Fund, Fidelity Flex Freedom 2045 Fund, Fidelity Flex Freedom 2050 Fund, Fidelity Flex Freedom 2055 Fund and Fidelity Flex Freedom 2060 Fund (thirteen of the funds constituting Fidelity Aberdeen Street Trust, hereafter collectively referred to as the “Funds”) as of March 31, 2019, the related statements of operations for the year ended March 31, 2019 and the statements of changes in net assets and the financial highlights for the year ended March 31, 2019 and for the period June 8, 2017 (commencement of operations) through March 31, 2018, including the related notes (collectively referred to as the “financial statements”). In our opinion, the financial statements present fairly, in all material respects, the financial position of each of the Funds as of March 31, 2019, the results of each of their operations for the year ended March 31, 2019, and the changes in their net assets and each of the financial highlights for the year ended March 31, 2019 and for the period June 8, 2017 (commencement of operations) through March 31, 2018 in conformity with accounting principles generally accepted in the United States of America.
Basis for Opinions
These financial statements are the responsibility of the Funds' management. Our responsibility is to express an opinion on the Funds' financial statements based on our audits. We are a public accounting firm registered with the Public Company Accounting Oversight Board (United States) (PCAOB) and are required to be independent with respect to the Funds in accordance with the U.S. federal securities laws and the applicable rules and regulations of the Securities and Exchange Commission and the PCAOB.
We conducted our audits of these financial statements in accordance with the standards of the PCAOB. Those standards require that we plan and perform the audit to obtain reasonable assurance about whether the financial statements are free of material misstatement, whether due to error or fraud.
Our audits included performing procedures to assess the risks of material misstatement of the financial statements, whether due to error or fraud, and performing procedures that respond to those risks. Such procedures included examining, on a test basis, evidence regarding the amounts and disclosures in the financial statements. Our audits also included evaluating the accounting principles used and significant estimates made by management, as well as evaluating the overall presentation of the financial statements. Our procedures included confirmation of securities owned as of March 31, 2019 by correspondence with the custodian. We believe that our audits provide a reasonable basis for our opinions.
PricewaterhouseCoopers LLP
Boston, Massachusetts
May 17, 2019
We have served as the auditor of one or more investment companies in the Fidelity group of funds since 1932.
Trustees and Officers
The Trustees, Members of the Advisory Board (if any), and officers of the trust and funds, as applicable, are listed below. The Board of Trustees governs each fund and is responsible for protecting the interests of shareholders. The Trustees are experienced executives who meet periodically throughout the year to oversee each fund's activities, review contractual arrangements with companies that provide services to each fund, oversee management of the risks associated with such activities and contractual arrangements, and review each fund's performance. If the interests of a fund and an underlying Fidelity® fund were to diverge, a conflict of interest could arise and affect how the Trustees and Members of the Advisory Board fulfill their fiduciary duties to the affected funds. FMRC has structured the funds to avoid these potential conflicts, although there may be situations where a conflict of interest is unavoidable. In such instances, FMRC, the Trustees, and Members of the Advisory Board would take reasonable steps to minimize and, if possible, eliminate the conflict. Each of the Trustees oversees 264 funds.
The Trustees hold office without limit in time except that (a) any Trustee may resign; (b) any Trustee may be removed by written instrument, signed by at least two-thirds of the number of Trustees prior to such removal; (c) any Trustee who requests to be retired or who has become incapacitated by illness or injury may be retired by written instrument signed by a majority of the other Trustees; and (d) any Trustee may be removed at any special meeting of shareholders by a two-thirds vote of the outstanding voting securities of the trust. Each Trustee who is not an interested person (as defined in the 1940 Act) of the trust and the funds is referred to herein as an Independent Trustee. Each Independent Trustee shall retire not later than the last day of the calendar year in which his or her 75th birthday occurs. The Independent Trustees may waive this mandatory retirement age policy with respect to individual Trustees. Officers and Advisory Board Members hold office without limit in time, except that any officer or Advisory Board Member may resign or may be removed by a vote of a majority of the Trustees at any regular meeting or any special meeting of the Trustees. Except as indicated, each individual has held the office shown or other offices in the same company for the past five years.
Each fund’s Statement of Additional Information (SAI) includes more information about the Trustees. To request a free copy, call Fidelity at 1-800-835-5092.
Experience, Skills, Attributes, and Qualifications of the Trustees. The Governance and Nominating Committee has adopted a statement of policy that describes the experience, qualifications, attributes, and skills that are necessary and desirable for potential Independent Trustee candidates (Statement of Policy). The Board believes that each Trustee satisfied at the time he or she was initially elected or appointed a Trustee, and continues to satisfy, the standards contemplated by the Statement of Policy. The Governance and Nominating Committee also engages professional search firms to help identify potential Independent Trustee candidates who have the experience, qualifications, attributes, and skills consistent with the Statement of Policy. From time to time, additional criteria based on the composition and skills of the current Independent Trustees, as well as experience or skills that may be appropriate in light of future changes to board composition, business conditions, and regulatory or other developments, have also been considered by the professional search firms and the Governance and Nominating Committee. In addition, the Board takes into account the Trustees' commitment and participation in Board and committee meetings, as well as their leadership of standing and ad hoc committees throughout their tenure.
In determining that a particular Trustee was and continues to be qualified to serve as a Trustee, the Board has considered a variety of criteria, none of which, in isolation, was controlling. The Board believes that, collectively, the Trustees have balanced and diverse experience, qualifications, attributes, and skills, which allow the Board to operate effectively in governing each fund and protecting the interests of shareholders. Information about the specific experience, skills, attributes, and qualifications of each Trustee, which in each case led to the Board's conclusion that the Trustee should serve (or continue to serve) as a trustee of the funds, is provided below.
Board Structure and Oversight Function. Abigail P. Johnson is an interested person and currently serves as Chairman. The Trustees have determined that an interested Chairman is appropriate and benefits shareholders because an interested Chairman has a personal and professional stake in the quality and continuity of services provided to the funds. Independent Trustees exercise their informed business judgment to appoint an individual of their choosing to serve as Chairman, regardless of whether the Trustee happens to be independent or a member of management. The Independent Trustees have determined that they can act independently and effectively without having an Independent Trustee serve as Chairman and that a key structural component for assuring that they are in a position to do so is for the Independent Trustees to constitute a substantial majority for the Board. The Independent Trustees also regularly meet in executive session. Arthur E. Johnson serves as Chairman of the Independent Trustees and as such (i) acts as a liaison between the Independent Trustees and management with respect to matters important to the Independent Trustees and (ii) with management prepares agendas for Board meetings.
Fidelity® funds are overseen by different Boards of Trustees. The funds' Board oversees Fidelity's investment-grade bond, money market, asset allocation and certain equity funds, and other Boards oversee Fidelity's high income and other equity funds. The asset allocation funds may invest in Fidelity® funds that are overseen by such other Boards. The use of separate Boards, each with its own committee structure, allows the Trustees of each group of Fidelity® funds to focus on the unique issues of the funds they oversee, including common research, investment, and operational issues. On occasion, the separate Boards establish joint committees to address issues of overlapping consequences for the Fidelity® funds overseen by each Board.
The Trustees operate using a system of committees to facilitate the timely and efficient consideration of all matters of importance to the Trustees, each fund, and fund shareholders and to facilitate compliance with legal and regulatory requirements and oversight of the funds' activities and associated risks. The Board, acting through its committees, has charged FMR and its affiliates with (i) identifying events or circumstances the occurrence of which could have demonstrably adverse effects on the funds' business and/or reputation; (ii) implementing processes and controls to lessen the possibility that such events or circumstances occur or to mitigate the effects of such events or circumstances if they do occur; and (iii) creating and maintaining a system designed to evaluate continuously business and market conditions in order to facilitate the identification and implementation processes described in (i) and (ii) above. Because the day-to-day operations and activities of the funds are carried out by or through FMR, its affiliates, and other service providers, the funds' exposure to risks is mitigated but not eliminated by the processes overseen by the Trustees. While each of the Board's committees has responsibility for overseeing different aspects of the funds' activities, oversight is exercised primarily through the Operations and Audit Committees. In addition, an ad hoc Board committee of Independent Trustees has worked with FMR to enhance the Board's oversight of investment and financial risks, legal and regulatory risks, technology risks, and operational risks, including the development of additional risk reporting to the Board. Appropriate personnel, including but not limited to the funds' Chief Compliance Officer (CCO), FMR's internal auditor, the independent accountants, the funds' Treasurer and portfolio management personnel, make periodic reports to the Board's committees, as appropriate, including an annual review of Fidelity's risk management program for the Fidelity® funds. The responsibilities of each standing committee, including their oversight responsibilities, are described further under "Standing Committees of the Trustees."
Interested Trustees*:
Correspondence intended for a Trustee who is an interested person may be sent to Fidelity Investments, 245 Summer Street, Boston, Massachusetts 02210.
Name, Year of Birth; Principal Occupations and Other Relevant Experience+
Abigail P. Johnson (1961)
Year of Election or Appointment: 2009
Trustee
Chairman of the Board of Trustees
Ms. Johnson also serves as Trustee of other Fidelity® funds. Ms. Johnson serves as Chairman (2016-present), Chief Executive Officer (2014-present), and Director (2007-present) of FMR LLC (diversified financial services company), President of Fidelity Financial Services (2012-present) and President of Personal, Workplace and Institutional Services (2005-present). Ms. Johnson is Chairman and Director of FMR Co., Inc. (investment adviser firm, 2011-present) and Chairman and Director of FMR (investment adviser firm, 2011-present). Previously, Ms. Johnson served as Vice Chairman (2007-2016) and President (2013-2016) of FMR LLC, President and a Director of FMR (2001-2005), a Trustee of other investment companies advised by FMR, Fidelity Investments Money Management, Inc. (investment adviser firm), and FMR Co., Inc. (2001-2005), Senior Vice President of the Fidelity® funds (2001-2005), and managed a number of Fidelity® funds. Ms. Abigail P. Johnson and Mr. Arthur E. Johnson are not related.
Jennifer Toolin McAuliffe (1959)
Year of Election or Appointment: 2016
Trustee
Ms. McAuliffe also serves as Trustee of other Fidelity® funds. Ms. McAuliffe previously served as a Member of the Advisory Board of certain Fidelity® funds (2016) and as Co-Head of Fixed Income of Fidelity Investments Limited (now known as FIL Limited (FIL)) (diversified financial services company). Earlier roles at FIL included Director of Research for FIL’s credit and quantitative teams in London, Hong Kong and Tokyo. Ms. McAuliffe also was the Director of Research for taxable and municipal bonds at Fidelity Investments Money Management, Inc. Ms. McAuliffe is also a director or trustee of several not-for-profit entities.
* Determined to be an “Interested Trustee” by virtue of, among other things, his or her affiliation with the trust or various entities under common control with FMR.
+ The information includes the Trustee's principal occupation during the last five years and other information relating to the experience, attributes, and skills relevant to the Trustee's qualifications to serve as a Trustee, which led to the conclusion that the Trustee should serve as a Trustee for each fund.
Independent Trustees:
Correspondence intended for an Independent Trustee may be sent to Fidelity Investments, P.O. Box 55235, Boston, Massachusetts 02205-5235.
Name, Year of Birth; Principal Occupations and Other Relevant Experience+
Elizabeth S. Acton (1951)
Year of Election or Appointment: 2013
Trustee
Ms. Acton also serves as Trustee of other Fidelity® funds. Prior to her retirement in April 2012, Ms. Acton was Executive Vice President, Finance (2011-2012), Executive Vice President, Chief Financial Officer (2002-2011), and Treasurer (2004-2005) of Comerica Incorporated (financial services). Prior to joining Comerica, Ms. Acton held a variety of positions at Ford Motor Company (1983-2002), including Vice President and Treasurer (2000-2002) and Executive Vice President and Chief Financial Officer of Ford Motor Credit Company (1998-2000). Ms. Acton currently serves as a member of the Board of Directors and Audit and Finance Committees of Beazer Homes USA, Inc. (homebuilding, 2012-present). Previously, Ms. Acton served as a Member of the Advisory Board of certain Fidelity® funds (2013-2016).
Ann E. Dunwoody (1953)
Year of Election or Appointment: 2018
Trustee
General Dunwoody also serves as Trustee of other Fidelity® funds. General Dunwoody (United States Army, Retired) was the first woman in U.S. military history to achieve the rank of four-star general and prior to her retirement in 2012 held a variety of positions within the U.S. Army, including Commanding General, U.S. Army Material Command (2008-2012). She is the President of First to Four LLC (leadership and mentoring services, 2012-present). She also serves as a member of the Board of Directors and Nominating and Corporate Governance Committee of L3 Technologies, Inc. (communication, electronic, sensor, and aerospace systems, 2013-present), Board of Directors and Nomination and Corporate Governance Committees of Kforce Inc. (professional staffing services, 2016-present) and Board of Directors of Automattic Inc. (software engineering, 2018-present). Previously, General Dunwoody served as a Member of the Advisory Board of certain Fidelity® funds (2018), a member of the Board of Directors and Audit and Sustainability and Corporate Responsibility Committees of Republic Services, Inc. (waste collection, disposal and recycling, 2013-2016). Ms. Dunwoody also serves on several boards for non-profit organizations, including as a member of the Board of Directors, Chair of the Nomination and Governance Committee and member of the Audit Committee of Logistics Management Institute (consulting non-profit, 2012-present), a member of the Board of Directors of the Army Historical Foundation (2015-present), a member of the Council of Trustees for the Association of the United States Army (advocacy non-profit, 2013-present) and a member of the Board of Trustees of Florida Institute of Technology (2015-present) and ThanksUSA (military family education non-profit, 2014-present).
John Engler (1948)
Year of Election or Appointment: 2014
Trustee
Mr. Engler also serves as Trustee of other Fidelity® funds. He serves on the board of directors for Universal Forest Products (manufacturer and distributor of wood and wood-alternative products, 2003-present) and K12 Inc. (technology-based education company, 2012-present). Previously, Mr. Engler served as interim president of Michigan State University (2018-2019), a Member of the Advisory Board of certain Fidelity® funds (2014-2016), president of the Business Roundtable (2011-2017), a trustee of The Munder Funds (2003-2014), president and CEO of the National Association of Manufacturers (2004-2011), member of the Board of Trustees of the Annie E. Casey Foundation (2004-2015), and as governor of Michigan (1991-2003). He is a past chairman of the National Governors Association.
Robert F. Gartland (1951)
Year of Election or Appointment: 2010
Trustee
Mr. Gartland also serves as Trustee of other Fidelity® funds. Mr. Gartland is Chairman and an investor in Gartland & Mellina Group Corp. (consulting, 2009-present). Previously, Mr. Gartland served as a partner and investor of Vietnam Partners LLC (investments and consulting, 2008-2011). Prior to his retirement, Mr. Gartland held a variety of positions at Morgan Stanley (financial services, 1979-2007), including Managing Director (1987-2007), and Chase Manhattan Bank (1975-1978).
Arthur E. Johnson (1947)
Year of Election or Appointment: 2008
Trustee
Chairman of the Independent Trustees
Mr. Johnson also serves as Trustee of other Fidelity® funds. Mr. Johnson serves as a member of the Board of Directors of Eaton Corporation plc (diversified power management, 2009-present) and Booz Allen Hamilton (management consulting, 2011-present). Prior to his retirement, Mr. Johnson served as Senior Vice President of Corporate Strategic Development of Lockheed Martin Corporation (defense contractor, 1999-2009). Mr. Johnson previously served as Vice Chairman (2015-2018) of the Independent Trustees of certain Fidelity® funds and on the Board of Directors of IKON Office Solutions, Inc. (1999-2008), AGL Resources, Inc. (holding company, 2002-2016), and Delta Airlines (2005-2007). Mr. Arthur E. Johnson is not related to Ms. Abigail P. Johnson.
Michael E. Kenneally (1954)
Year of Election or Appointment: 2009
Trustee
Vice Chairman of the Independent Trustees
Mr. Kenneally also serves as Trustee of other Fidelity® funds. Prior to his retirement, Mr. Kenneally served as Chairman and Global Chief Executive Officer of Credit Suisse Asset Management. Before joining Credit Suisse, he was an Executive Vice President and Chief Investment Officer for Bank of America Corporation. Earlier roles at Bank of America included Director of Research, Senior Portfolio Manager and Research Analyst, and Mr. Kenneally was awarded the Chartered Financial Analyst (CFA) designation in 1991.
Marie L. Knowles (1946)
Year of Election or Appointment: 2001
Trustee
Ms. Knowles also serves as Trustee of other Fidelity® funds. Prior to Ms. Knowles' retirement in June 2000, she served as Executive Vice President and Chief Financial Officer of Atlantic Richfield Company (ARCO) (diversified energy, 1996-2000). From 1993 to 1996, she was a Senior Vice President of ARCO and President of ARCO Transportation Company (pipeline and tanker operations). Ms. Knowles currently serves as a Director and Chairman of the Audit Committee of McKesson Corporation (healthcare service, since 2002). Ms. Knowles is a member of the Board of the Santa Catalina Island Company (real estate, 2009-present). Ms. Knowles is a Member of the Investment Company Institute Board of Governors and a Member of the Governing Council of the Independent Directors Council (2014-present). She also serves as a member of the Advisory Board for the School of Engineering of the University of Southern California. Previously, Ms. Knowles served as a Director of Phelps Dodge Corporation (copper mining and manufacturing, 1994-2007), URS Corporation (engineering and construction, 2000-2003) and America West (airline, 1999-2002). Ms. Knowles previously served as Chairman (2015-2018) and Vice Chairman (2012-2015) of the Independent Trustees of certain Fidelity® funds.
Mark A. Murray (1954)
Year of Election or Appointment: 2016
Trustee
Mr. Murray also serves as Trustee of other Fidelity® funds. Mr. Murray is Vice Chairman (2013-present) of Meijer, Inc. (regional retail chain). Previously, Mr. Murray served as a Member of the Advisory Board of certain Fidelity® funds (2016) and as Co-Chief Executive Officer (2013-2016) and President (2006-2013) of Meijer, Inc. Mr. Murray serves as a member of the Board of Directors and Nuclear Review and Public Policy and Responsibility Committees of DTE Energy Company (diversified energy company, 2009-present). Mr. Murray also serves as a member of the Board of Directors of Spectrum Health (not-for-profit health system, 2015-present). Mr. Murray previously served as President of Grand Valley State University (2001-2006), Treasurer for the State of Michigan (1999-2001), Vice President of Finance and Administration for Michigan State University (1998-1999), and a member of the Board of Directors and Audit Committee and Chairman of the Nominating and Corporate Governance Committee of Universal Forest Products, Inc. (manufacturer and distributor of wood and wood-alternative products, 2004-2016). Mr. Murray is also a director or trustee of many community and professional organizations.
+ The information includes the Trustee's principal occupation during the last five years and other information relating to the experience, attributes, and skills relevant to the Trustee's qualifications to serve as a Trustee, which led to the conclusion that the Trustee should serve as a Trustee for each fund.
Advisory Board Members and Officers:
Correspondence intended for an officer may be sent to Fidelity Investments, 245 Summer Street, Boston, Massachusetts 02210. Officers appear below in alphabetical order.
Name, Year of Birth; Principal Occupation
Elizabeth Paige Baumann (1968)
Year of Election or Appointment: 2017
Anti-Money Laundering (AML) Officer
Ms. Baumann also serves as AML Officer of other funds. She is Chief AML Officer (2012-present) and Senior Vice President (2014-present) of FMR LLC (diversified financial services company) and is an employee of Fidelity Investments. Previously, Ms. Baumann served as AML Officer of the funds (2012-2016), and Vice President (2007-2014) and Deputy Anti-Money Laundering Officer (2007-2012) of FMR LLC.
Craig S. Brown (1977)
Year of Election or Appointment: 2019
Assistant Treasurer
Mr. Brown also serves as Assistant Treasurer of other funds. Mr. Brown is an employee of Fidelity Investments (2013-present).
John J. Burke III (1964)
Year of Election or Appointment: 2018
Chief Financial Officer
Mr. Burke also serves as Chief Financial Officer of other funds. Mr. Burke serves as Head of Investment Operations for Fidelity Fund and Investment Operations (2018-present) and is an employee of Fidelity Investments (1998-present). Previously Mr. Burke served as head of Asset Management Investment Operations (2012-2018).
William C. Coffey (1969)
Year of Election or Appointment: 2018
Secretary and Chief Legal Officer (CLO)
Mr. Coffey also serves as Secretary and CLO of other funds. Mr. Coffey serves as CLO, Secretary, and Senior Vice President of Fidelity Management & Research Company and FMR Co., Inc. (investment adviser firms, 2018-present); Secretary of Fidelity SelectCo, LLC and Fidelity Investments Money Management, Inc. (investment adviser firms, 2018-present); and CLO of Fidelity Management & Research (Hong Kong) Limited, FMR Investment Management (UK) Limited, and Fidelity Management & Research (Japan) Limited (investment adviser firms, 2018-present). He is Senior Vice President and Deputy General Counsel of FMR LLC (diversified financial services company, 2010-present), and is an employee of Fidelity Investments. Previously, Mr. Coffey served as Assistant Secretary of certain funds (2009-2018) and as Vice President and Associate General Counsel of FMR LLC (2005-2009).
Jonathan Davis (1968)
Year of Election or Appointment: 2010
Assistant Treasurer
Mr. Davis also serves as Assistant Treasurer of other funds. Mr. Davis serves as Assistant Treasurer of FMR Capital, Inc. (2017-present) and is an employee of Fidelity Investments. Previously, Mr. Davis served as Vice President and Associate General Counsel of FMR LLC (diversified financial services company, 2003-2010).
Adrien E. Deberghes (1967)
Year of Election or Appointment: 2010
Assistant Treasurer
Mr. Deberghes also serves as an officer of other funds. He serves as Assistant Treasurer of FMR Capital, Inc. (2017-present), Executive Vice President of Fidelity Investments Money Management, Inc. (FIMM) (investment adviser firm, 2016-present), and is an employee of Fidelity Investments (2008-present). Previously, Mr. Deberghes served as President and Treasurer of certain Fidelity® funds (2013-2018). Prior to joining Fidelity Investments, Mr. Deberghes was Senior Vice President of Mutual Fund Administration at State Street Corporation (2007-2008), Senior Director of Mutual Fund Administration at Investors Bank & Trust (2005-2007), and Director of Finance for Dunkin' Brands (2000-2005). Previously, Mr. Deberghes served in other fund officer roles.
Laura M. Del Prato (1964)
Year of Election or Appointment: 2018
President and Treasurer
Ms. Del Prato also serves as an officer of other funds. Ms. Del Prato is an employee of Fidelity Investments (2017-present). Prior to joining Fidelity Investments, Ms. Del Prato served as a Managing Director and Treasurer of the JPMorgan Mutual Funds (2014-2017). Prior to JPMorgan, Ms. Del Prato served as a partner at Cohen Fund Audit Services (accounting firm, 2012-2013) and KPMG LLP (accounting firm, 2004-2012).
Colm A. Hogan (1973)
Year of Election or Appointment: 2016
Assistant Treasurer
Mr. Hogan also serves as an officer of other funds. Mr. Hogan serves as Assistant Treasurer of FMR Capital, Inc. (2017-present) and is an employee of Fidelity Investments (2005-present). Previously, Mr. Hogan served as Assistant Treasurer of certain Fidelity® funds (2016-2018).
Chris Maher (1972)
Year of Election or Appointment: 2013
Assistant Treasurer
Mr. Maher serves as Assistant Treasurer of other funds. Mr. Maher is Vice President of Valuation Oversight, serves as Assistant Treasurer of FMR Capital, Inc. (2017-present), and is an employee of Fidelity Investments. Previously, Mr. Maher served as Vice President of Asset Management Compliance (2013), Vice President of the Program Management Group of FMR (investment adviser firm, 2010-2013), and Vice President of Valuation Oversight (2008-2010).
John B. McGinty, Jr. (1962)
Year of Election or Appointment: 2016
Chief Compliance Officer
Mr. McGinty also serves as Chief Compliance Officer of other funds. Mr. McGinty is Senior Vice President of Asset Management Compliance for Fidelity Investments and is an employee of Fidelity Investments (2016-present). Mr. McGinty previously served as Vice President, Senior Attorney at Eaton Vance Management (investment management firm, 2015-2016), and prior to Eaton Vance as global CCO for all firm operations and registered investment companies at GMO LLC (investment management firm, 2009-2015). Before joining GMO LLC, Mr. McGinty served as Senior Vice President, Deputy General Counsel for Fidelity Investments (2007-2009).
Jason P. Pogorelec (1975)
Year of Election or Appointment: 2015
Assistant Secretary
Mr. Pogorelec also serves as Assistant Secretary of other funds. Mr. Pogorelec serves as Vice President, Associate General Counsel (2010-present) and is an employee of Fidelity Investments (2006-present).
Nancy D. Prior (1967)
Year of Election or Appointment: 2014
Vice President
Ms. Prior also serves as Vice President of other funds. Ms. Prior serves as President Fixed Income, High Income/Emerging Market Debt and Multi Asset Class Strategies of FIAM LLC (2018-present), President (2016-present) and Director (2014-present) of Fidelity Investments Money Management, Inc. (FIMM) (investment adviser firm), President, Fixed Income (2014-present), and is an employee of Fidelity Investments (2002-present). Previously, Ms. Prior served as Vice Chairman of FIAM LLC (investment adviser firm, 2014-2018), a Director of FMR Investment Management (UK) Limited (investment adviser firm, 2015-2018), President Multi-Asset Class Strategies of FMR's Global Asset Allocation Division (2017-2018), Vice President of Fidelity's Money Market Funds (2012-2014), President, Money Market and Short Duration Bond Group of Fidelity Management & Research (FMR) (investment adviser firm, 2013-2014), President, Money Market Group of FMR (2011-2013), Managing Director of Research (2009-2011), Senior Vice President and Deputy General Counsel (2007-2009), and Assistant Secretary of certain Fidelity® funds (2008-2009).
Stacie M. Smith (1974)
Year of Election or Appointment: 2013
Assistant Treasurer
Ms. Smith also serves as an officer of other funds. Ms. Smith serves as Assistant Treasurer of FMR Capital, Inc. (2017-present), is an employee of Fidelity Investments (2009-present), and has served in other fund officer roles. Prior to joining Fidelity Investments, Ms. Smith served as Senior Audit Manager of Ernst & Young LLP (accounting firm, 1996-2009). Previously, Ms. Smith served as Assistant Treasurer (2013-2018) and Deputy Treasurer (2013-2016) of certain Fidelity® funds.
Marc L. Spector (1972)
Year of Election or Appointment: 2016
Deputy Treasurer
Mr. Spector also serves as an officer of other funds. Mr. Spector serves as Assistant Treasurer of FMR Capital, Inc. (2017-present) and is an employee of Fidelity Investments (2016-present). Prior to joining Fidelity Investments, Mr. Spector served as Director at the Siegfried Group (accounting firm, 2013-2016), and prior to Siegfried Group as audit senior manager at Deloitte & Touche (accounting firm, 2005-2013).
Jim Wegmann (1979)
Year of Election or Appointment: 2019
Assistant Treasurer
Mr. Wegmann also serves as Assistant Treasurer of other funds. Mr. Wegmann is an employee of Fidelity Investments (2011-present).
Shareholder Expense Example
As a shareholder of a Fund, you incur two types of costs: (1) transaction costs and (2) ongoing costs and other Fund expenses. This Example is intended to help you understand your ongoing costs (in dollars) of investing in the Funds and to compare these costs with the ongoing costs of investing in other mutual funds.
The Example is based on an investment of $1,000 invested at the beginning of the period and held for the entire period (October 1, 2018 to March 31, 2019).
Actual Expenses
The first line of the accompanying table for each fund provides information about actual account values and actual expenses. You may use the information in this line, together with the amount you invested, to estimate the expenses that you paid over the period. Simply divide your account value by $1,000.00 (for example, an $8,600 account value divided by $1,000.00 = 8.6), then multiply the result by the number in the first line for a fund under the heading entitled "Expenses Paid During Period" to estimate the expenses you paid on your account during this period.
Hypothetical Example for Comparison Purposes
The second line of the accompanying table for each fund provides information about hypothetical account values and hypothetical expenses based on a fund's actual expense ratio and an assumed rate of return of 5% per year before expenses, which is not the Fund's actual return. The hypothetical account values and expenses may not be used to estimate the actual ending account balance or expenses you paid for the period. You may use this information to compare the ongoing costs of investing in the Fund and other funds. To do so, compare this 5% hypothetical example with the 5% hypothetical examples that appear in the shareholder reports of the other funds.
Please note that the expenses shown in the table are meant to highlight your ongoing costs only and do not reflect any transaction costs. Therefore, the second line of the table is useful in comparing ongoing costs only, and will not help you determine the relative total costs of owning different funds.
| | Annualized Expense Ratio-A,B | Beginning
Account Value
October 1, 2018 | Ending
Account Value
March 31, 2019 | Expenses Paid
During Period-
October 1, 2018
to March 31, 2019C,D |
| Fidelity Flex Freedom Income Fund | - % | | | |
| Actual | | $1,000.00 | $1,025.50 | $- |
| Hypothetical-E | | $1,000.00 | $1,024.93 | $- |
| Fidelity Flex Freedom 2005 Fund | - % | | | |
| Actual | | $1,000.00 | $1,019.70 | $- |
| Hypothetical-E | | $1,000.00 | $1,024.93 | $- |
| Fidelity Flex Freedom 2010 Fund | - % | | | |
| Actual | | $1,000.00 | $1,014.80 | $- |
| Hypothetical-E | | $1,000.00 | $1,024.93 | $- |
| Fidelity Flex Freedom 2015 Fund | - % | | | |
| Actual | | $1,000.00 | $1,009.20 | $- |
| Hypothetical-E | | $1,000.00 | $1,024.93 | $- |
| Fidelity Flex Freedom 2020 Fund | - % | | | |
| Actual | | $1,000.00 | $1,004.10 | $- |
| Hypothetical-E | | $1,000.00 | $1,024.93 | $- |
| Fidelity Flex Freedom 2025 Fund | - % | | | |
| Actual | | $1,000.00 | $999.80 | $- |
| Hypothetical-E | | $1,000.00 | $1,024.93 | $- |
| Fidelity Flex Freedom 2030 Fund | - % | | | |
| Actual | | $1,000.00 | $992.20 | $- |
| Hypothetical-E | | $1,000.00 | $1,024.93 | $- |
| Fidelity Flex Freedom 2035 Fund | - % | | | |
| Actual | | $1,000.00 | 981.70 | $- |
| Hypothetical-E | | $1,000.00 | $1,024.93 | $- |
| Fidelity Flex Freedom 2040 Fund | - % | | | |
| Actual | | $1,000.00 | $977.10 | $- |
| Hypothetical-E | | $1,000.00 | $1,024.93 | $- |
| Fidelity Flex Freedom 2045 Fund | - % | | | |
| Actual | | $1,000.00 | $977.40 | $- |
| Hypothetical-E | | $1,000.00 | $1,024.93 | $- |
| Fidelity Flex Freedom 2050 Fund | - % | | | |
| Actual | | $1,000.00 | $977.00 | $- |
| Hypothetical-E | | $1,000.00 | $1,024.93 | $- |
| Fidelity Flex Freedom 2055 Fund | - % | | | |
| Actual | | $1,000.00 | $977.40 | $- |
| Hypothetical-E | | $1,000.00 | $1,024.93 | $- |
| Fidelity Flex Freedom 2060 Fund | - % | | | |
| Actual | | $1,000.00 | $977.20 | $- |
| Hypothetical-E | | $1,000.00 | $1,024.93 | $- |
A Annualized expense ratio reflects expenses net of applicable fee waivers.
B Amounts represent less than .005%.
C Expenses are equal to each Fund's annualized expense ratio, multiplied by the average account value over the period, multiplied by 182/365 (to reflect the one-half year period).
D Amount represents less than $.005.
E 5% return per year before expenses
Distributions (Unaudited)
The Board of Trustees of each fund voted to pay to shareholders of record at the opening of business on record date, the following distributions per share derived from capital gains realized from sales of portfolio securities, and dividends derived from net investment income:
| | Pay Date | Record Date | Dividends | Capital Gains |
| Fidelity Flex Freedom Income Fund | 05/06/19 | 05/03/19 | $0.018 | $0.065 |
| Fidelity Flex Freedom 2005 Fund | 05/13/19 | 05/10/19 | $0.046 | $0.101 |
| Fidelity Flex Freedom 2010 Fund | 05/13/19 | 05/10/19 | $0.042 | $0.138 |
| Fidelity Flex Freedom 2015 Fund | 05/13/19 | 05/10/19 | $0.036 | $0.180 |
| Fidelity Flex Freedom 2020 Fund | 05/13/19 | 05/10/19 | $0.032 | $0.212 |
| Fidelity Flex Freedom 2025 Fund | 05/13/19 | 05/10/19 | $0.027 | $0.246 |
| Fidelity Flex Freedom 2030 Fund | 05/13/19 | 05/10/19 | $0.021 | $0.314 |
| Fidelity Flex Freedom 2035 Fund | 05/13/19 | 05/10/19 | $0.011 | $0.381 |
| Fidelity Flex Freedom 2040 Fund | 05/13/19 | 05/10/19 | $0.008 | $0.402 |
| Fidelity Flex Freedom 2045 Fund | 05/13/19 | 05/10/19 | $0.008 | $0.401 |
| Fidelity Flex Freedom 2050 Fund | 05/13/19 | 05/10/19 | $0.008 | $0.403 |
| Fidelity Flex Freedom 2055 Fund | 05/13/19 | 05/10/19 | $0.008 | $0.402 |
| Fidelity Flex Freedom 2060 Fund | 05/13/19 | 05/10/19 | $0.008 | $0.403 |
The funds hereby designate as capital gain dividend the amounts noted below for the taxable year ended March 31, 2019, or, if subsequently determined to be different, the net capital gain of such year.
| Fidelity Flex Freedom Income Fund | $1,276 |
| Fidelity Flex Freedom 2005 Fund | $1,839 |
| Fidelity Flex Freedom 2010 Fund | $2,405 |
| Fidelity Flex Freedom 2015 Fund | $3,010 |
| Fidelity Flex Freedom 2020 Fund | $3,471 |
| Fidelity Flex Freedom 2025 Fund | $3,927 |
| Fidelity Flex Freedom 2030 Fund | $4,909 |
| Fidelity Flex Freedom 2035 Fund | $5,828 |
| Fidelity Flex Freedom 2040 Fund | $6,121 |
| Fidelity Flex Freedom 2045 Fund | $6,128 |
| Fidelity Flex Freedom 2050 Fund | $6,114 |
| Fidelity Flex Freedom 2055 Fund | $6,129 |
| Fidelity Flex Freedom 2060 Fund | $6,123 |
A percentage of the dividends distributed during the fiscal year for the following funds were derived from interest on U.S. Government securities which is generally exempt from state income tax:
| Fidelity Flex Freedom Income Fund | 17.63% |
| Fidelity Flex Freedom 2005 Fund | 14.29% |
| Fidelity Flex Freedom 2010 Fund | 11.52% |
| Fidelity Flex Freedom 2015 Fund | 9.23% |
| Fidelity Flex Freedom 2020 Fund | 7.62% |
| Fidelity Flex Freedom 2025 Fund | 6.61% |
| Fidelity Flex Freedom 2030 Fund | 4.63% |
| Fidelity Flex Freedom 2035 Fund | 2.82% |
| Fidelity Flex Freedom 2040 Fund | 2.04% |
| Fidelity Flex Freedom 2045 Fund | 2.04% |
| Fidelity Flex Freedom 2050 Fund | 2.04% |
| Fidelity Flex Freedom 2055 Fund | 2.04% |
| Fidelity Flex Freedom 2060 Fund | 2.04% |
A percentage of the dividends distributed during the fiscal year for the following funds qualify for the dividends–received deduction for corporate shareholders:
| Fidelity Flex Freedom Income Fund | |
| April 2018 | 0% |
| May 2018 | 2% |
| June 2018 | 5% |
| July 2018 | 5% |
| August 2018 | 5% |
| September 2018 | 5% |
| October 2018 | 5% |
| November 2018 | 5% |
| December 2018 | 5% |
| February 2019 | 1% |
| March 2019 | 1% |
| Fidelity Flex Freedom 2005 Fund | |
| May 2018 | 1% |
| December 2018 | 8% |
| Fidelity Flex Freedom 2010 Fund | |
| May 2018 | 1% |
| December 2018 | 11% |
| Fidelity Flex Freedom 2015 Fund | |
| May 2018 | 1% |
| December 2018 | 14% |
| Fidelity Flex Freedom 2020 Fund | |
| May 2018 | 1% |
| December 2018 | 17% |
| Fidelity Flex Freedom 2025 Fund | |
| May 2018 | 2% |
| December 2018 | 19% |
| Fidelity Flex Freedom 2030 Fund | |
| May 2018 | 2% |
| December 2018 | 22% |
| Fidelity Flex Freedom 2035 Fund | |
| May 2018 | 4% |
| December 2018 | 26% |
| Fidelity Flex Freedom 2040 Fund | |
| May 2018 | 5% |
| December 2018 | 27% |
| Fidelity Flex Freedom 2045 Fund | |
| May 2018 | 6% |
| December 2018 | 27% |
| Fidelity Flex Freedom 2050 Fund | |
| May 2018 | 5% |
| December 2018 | 27% |
| Fidelity Flex Freedom 2055 Fund | |
| May 2018 | 5% |
| December 2018 | 27% |
| Fidelity Flex Freedom 2060 Fund | |
| May 2018 | 5% |
| December 2018 | 27% |
A percentage of the dividends distributed during the fiscal year for the following funds may be taken into account as a dividend for purposes of the maximum rate under section 1(h)(11) of the Internal Revenue Code.
| Fidelity Flex Freedom Income Fund | |
| April 2018 | 0% |
| May 2018 | 5% |
| June 2018 | 13% |
| July 2018 | 13% |
| August 2018 | 13% |
| September 2018 | 13% |
| October 2018 | 13% |
| November 2018 | 13% |
| December 2018 | 13% |
| February 2019 | 1% |
| March 2019 | 1% |
| Fidelity Flex Freedom 2005 Fund | |
| May 2018 | 1% |
| December 2018 | 19% |
| Fidelity Flex Freedom 2010 Fund | |
| May 2018 | 1% |
| December 2018 | 25% |
| Fidelity Flex Freedom 2015 Fund | |
| May 2018 | 2% |
| December 2018 | 31% |
| Fidelity Flex Freedom 2020 Fund | |
| May 2018 | 2% |
| December 2018 | 36% |
| Fidelity Flex Freedom 2025 Fund | |
| May 2018 | 3% |
| December 2018 | 40% |
| Fidelity Flex Freedom 2030 Fund | |
| May 2018 | 4% |
| December 2018 | 45% |
| Fidelity Flex Freedom 2035 Fund | |
| May 2018 | 6% |
| December 2018 | 53% |
| Fidelity Flex Freedom 2040 Fund | |
| May 2018 | 6% |
| December 2018 | 55% |
| Fidelity Flex Freedom 2045 Fund | |
| May 2018 | 9% |
| December 2018 | 55% |
| Fidelity Flex Freedom 2050 Fund | |
| May 2018 | 4% |
| December 2018 | 55% |
| Fidelity Flex Freedom 2055 Fund | |
| May 2018 | 6% |
| December 2018 | 55% |
| Fidelity Flex Freedom 2060 Fund | |
| May 2018 | 6% |
| December 2018 | 55% |
The funds will notify shareholders in January 2020 of amounts for use in preparing 2019 income tax returns.
XFC-ANN-0519
1.9884226.101
Fidelity Freedom® Blend Funds - Income, 2005, 2010, 2015, 2020, 2025, 2030, 2035, 2040, 2045, 2050, 2055, 2060
Annual Report March 31, 2019 Includes Fidelity and Fidelity Advisor share classes |
|
Beginning on January 1, 2021, as permitted by regulations adopted by the Securities and Exchange Commission, paper copies of a fund’s shareholder reports will no longer be sent by mail, unless you specifically request paper copies of the reports from the fund or from your financial intermediary, such as a financial advisor, broker-dealer or bank. Instead, the reports will be made available on a website, and you will be notified by mail each time a report is posted and provided with a website link to access the report.
If you already elected to receive shareholder reports electronically, you will not be affected by this change and you need not take any action. You may elect to receive shareholder reports and other communications from a fund electronically, by contacting your financial intermediary. For Fidelity customers, visit Fidelity's web site or call Fidelity using the contact information listed below.
You may elect to receive all future reports in paper free of charge. If you wish to continue receiving paper copies of your shareholder reports, you may contact your financial intermediary or, if you are a Fidelity customer, visit Fidelity’s website, or call Fidelity at the applicable toll-free number listed below. Your election to receive reports in paper will apply to all funds held with the fund complex/your financial intermediary.
| Account Type | Website | Phone Number |
| Brokerage, Mutual Fund, or Annuity Contracts: | fidelity.com/mailpreferences | 1-800-343-3548 |
| Employer Provided Retirement Accounts: | netbenefits.fidelity.com/preferences (choose 'no' under Required Disclosures to continue to print) | 1-800-343-0860 |
| Advisor Sold Accounts Serviced Through Your Financial Intermediary: | Contact Your Financial Intermediary | Your Financial Intermediary's phone number |
| Advisor Sold Accounts Serviced by Fidelity: | institutional.fidelity.com | 1-877-208-0098 |
Contents
To view a fund's proxy voting guidelines and proxy voting record for the 12-month period ended June 30, visit http://www.fidelity.com/proxyvotingresults or visit the Securities and Exchange Commission's (SEC) web site at http://www.sec.gov.
You may also call 1-800-544-8544 if you’re an individual investing directly with Fidelity, call 1-800-835-5092 if you’re a plan sponsor or participant with Fidelity as your recordkeeper or call 1-877-208-0098 on institutional accounts or if you’re an advisor or invest through one to request a free copy of the proxy voting guidelines.
Standard & Poor's, S&P and S&P 500 are registered service marks of The McGraw-Hill Companies, Inc. and have been licensed for use by Fidelity Distributors Corporation.
Other third-party marks appearing herein are the property of their respective owners.
All other marks appearing herein are registered or unregistered trademarks or service marks of FMR LLC or an affiliated company. © 2019 FMR LLC. All rights reserved.
This report and the financial statements contained herein are submitted for the general information of the shareholders of the Funds. This report is not authorized for distribution to prospective investors in the Funds unless preceded or accompanied by an effective prospectus.
A fund files its complete schedule of portfolio holdings with the SEC for the first and third quarters of each fiscal year on Form N-PORT. Forms N-PORT are available on the SEC’s web site at http://www.sec.gov. A fund's Forms N-PORT may be reviewed and copied at the SEC’s Public Reference Room in Washington, DC. Information regarding the operation of the SEC's Public Reference Room may be obtained by calling 1-800-SEC-0330.
For a complete list of a fund's portfolio holdings, view the most recent holdings listing, semiannual report, or annual report on Fidelity's web site at http://www.fidelity.com, http://www.institutional.fidelity.com, or http://www.401k.com, as applicable.
NOT FDIC INSURED •MAY LOSE VALUE •NO BANK GUARANTEE
Neither the Funds nor Fidelity Distributors Corporation is a bank.
Fidelity Freedom® Blend Income Fund
Performance: The Bottom Line
Average annual total return reflects the change in the value of an investment, assuming reinvestment of distributions from dividend income and capital gains (the profits earned upon the sale of securities that have grown in value, if any) and assuming a constant rate of performance each year. The hypothetical investment and the average annual total returns do not reflect the deduction of taxes that a shareholder would pay on fund distributions or the redemption of fund shares. During periods of reimbursement by Fidelity, a fund’s total return will be greater than it would be had the reimbursement not occurred. How a fund did yesterday is no guarantee of how it will do tomorrow.
Average annual total returns for Fidelity Freedom® Blend Income Fund will be reported once the fund is a year old.
$10,000 Over Life of Fund
Let's say hypothetically that $10,000 was invested in Fidelity Freedom® Blend Income Fund, a class of the fund, on August 31, 2018, when the fund started.
The chart shows how the value of your investment would have changed, and also shows how the Bloomberg Barclays U.S. Aggregate Bond Index performed over the same period.

| Period Ending Values |
| $10,204 | Fidelity Freedom® Blend Income Fund |
| $10,395 | Bloomberg Barclays U.S. Aggregate Bond Index |
Fidelity Freedom® Blend 2005 Fund
Performance: The Bottom Line
Average annual total return reflects the change in the value of an investment, assuming reinvestment of distributions from dividend income and capital gains (the profits earned upon the sale of securities that have grown in value, if any) and assuming a constant rate of performance each year. The hypothetical investment and the average annual total returns do not reflect the deduction of taxes that a shareholder would pay on fund distributions or the redemption of fund shares. During periods of reimbursement by Fidelity, a fund’s total return will be greater than it would be had the reimbursement not occurred. How a fund did yesterday is no guarantee of how it will do tomorrow.
Average annual total returns for Fidelity Freedom® Blend 2005 Fund will be reported once the fund is a year old.
$10,000 Over Life of Fund
Let's say hypothetically that $10,000 was invested in Fidelity Freedom® Blend 2005 Fund, a class of the fund, on August 31, 2018, when the fund started.
The chart shows how the value of your investment would have changed, and also shows how the Bloomberg Barclays U.S. Aggregate Bond Index performed over the same period.
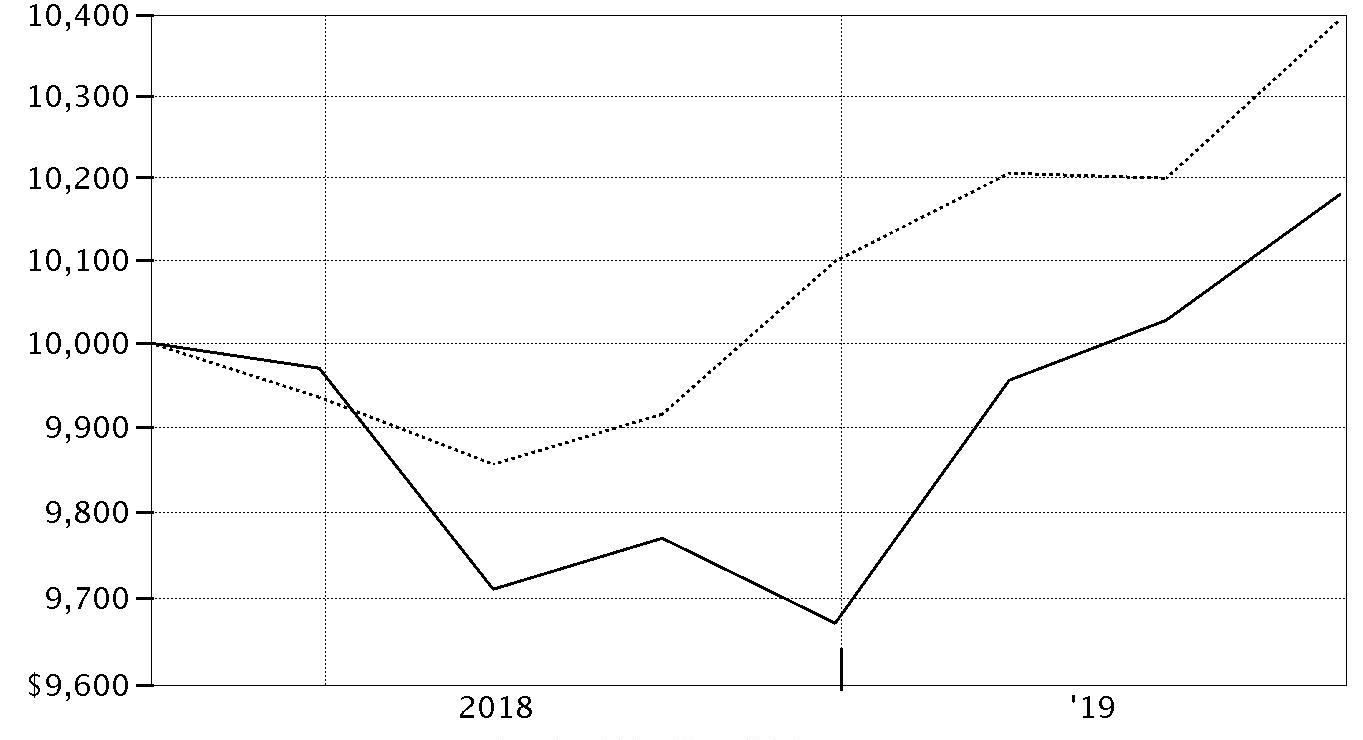
| Period Ending Values |
| $10,180 | Fidelity Freedom® Blend 2005 Fund |
| $10,395 | Bloomberg Barclays U.S. Aggregate Bond Index |
Fidelity Freedom® Blend 2010 Fund
Performance: The Bottom Line
Average annual total return reflects the change in the value of an investment, assuming reinvestment of distributions from dividend income and capital gains (the profits earned upon the sale of securities that have grown in value, if any) and assuming a constant rate of performance each year. The hypothetical investment and the average annual total returns do not reflect the deduction of taxes that a shareholder would pay on fund distributions or the redemption of fund shares. During periods of reimbursement by Fidelity, a fund’s total return will be greater than it would be had the reimbursement not occurred. How a fund did yesterday is no guarantee of how it will do tomorrow.
Average annual total returns for Fidelity Freedom® Blend 2010 Fund will be reported once the fund is a year old.
$10,000 Over Life of Fund
Let's say hypothetically that $10,000 was invested in Fidelity Freedom® Blend 2010 Fund, a class of the fund, on August 31, 2018, when the fund started.
The chart shows how the value of your investment would have changed, and also shows how the Bloomberg Barclays U.S. Aggregate Bond Index performed over the same period.
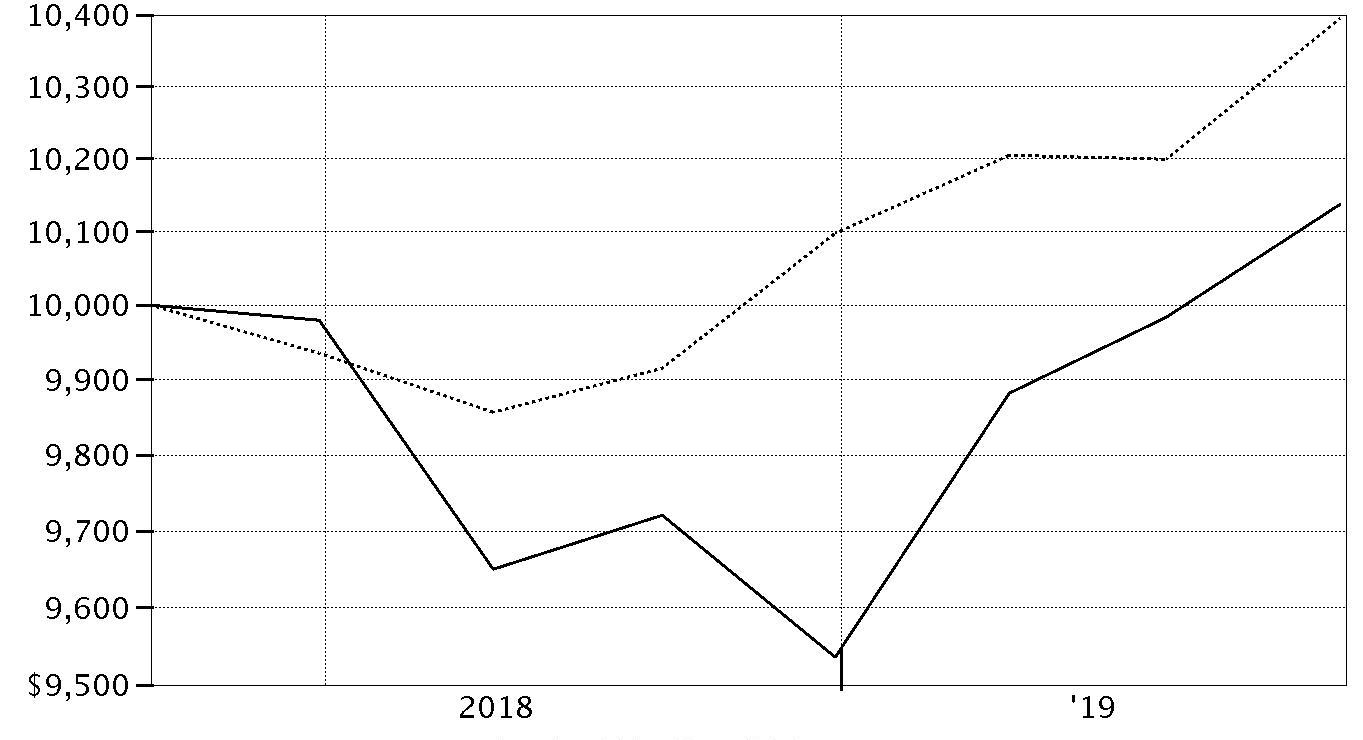
| Period Ending Values |
| $10,137 | Fidelity Freedom® Blend 2010 Fund |
| $10,395 | Bloomberg Barclays U.S. Aggregate Bond Index |
Fidelity Freedom® Blend 2015 Fund
Performance: The Bottom Line
Average annual total return reflects the change in the value of an investment, assuming reinvestment of distributions from dividend income and capital gains (the profits earned upon the sale of securities that have grown in value, if any) and assuming a constant rate of performance each year. The hypothetical investment and the average annual total returns do not reflect the deduction of taxes that a shareholder would pay on fund distributions or the redemption of fund shares. During periods of reimbursement by Fidelity, a fund’s total return will be greater than it would be had the reimbursement not occurred. How a fund did yesterday is no guarantee of how it will do tomorrow.
Average annual total returns for Fidelity Freedom® Blend 2015 Fund will be reported once the fund is a year old.
$10,000 Over Life of Fund
Let's say hypothetically that $10,000 was invested in Fidelity Freedom® Blend 2015 Fund, a class of the fund, on August 31, 2018, when the fund started.
The chart shows how the value of your investment would have changed, and also shows how the Bloomberg Barclays U.S. Aggregate Bond Index performed over the same period.

| Period Ending Values |
| $10,102 | Fidelity Freedom® Blend 2015 Fund |
| $10,395 | Bloomberg Barclays U.S. Aggregate Bond Index |
Fidelity Freedom® Blend 2020 Fund
Performance: The Bottom Line
Average annual total return reflects the change in the value of an investment, assuming reinvestment of distributions from dividend income and capital gains (the profits earned upon the sale of securities that have grown in value, if any) and assuming a constant rate of performance each year. The hypothetical investment and the average annual total returns do not reflect the deduction of taxes that a shareholder would pay on fund distributions or the redemption of fund shares. During periods of reimbursement by Fidelity, a fund’s total return will be greater than it would be had the reimbursement not occurred. How a fund did yesterday is no guarantee of how it will do tomorrow.
Average annual total returns for Fidelity Freedom® Blend 2020 Fund will be reported once the fund is a year old.
$10,000 Over Life of Fund
Let's say hypothetically that $10,000 was invested in Fidelity Freedom® Blend 2020 Fund, a class of the fund, on August 31, 2018, when the fund started.
The chart shows how the value of your investment would have changed, and also shows how the S&P 500® Index performed over the same period.
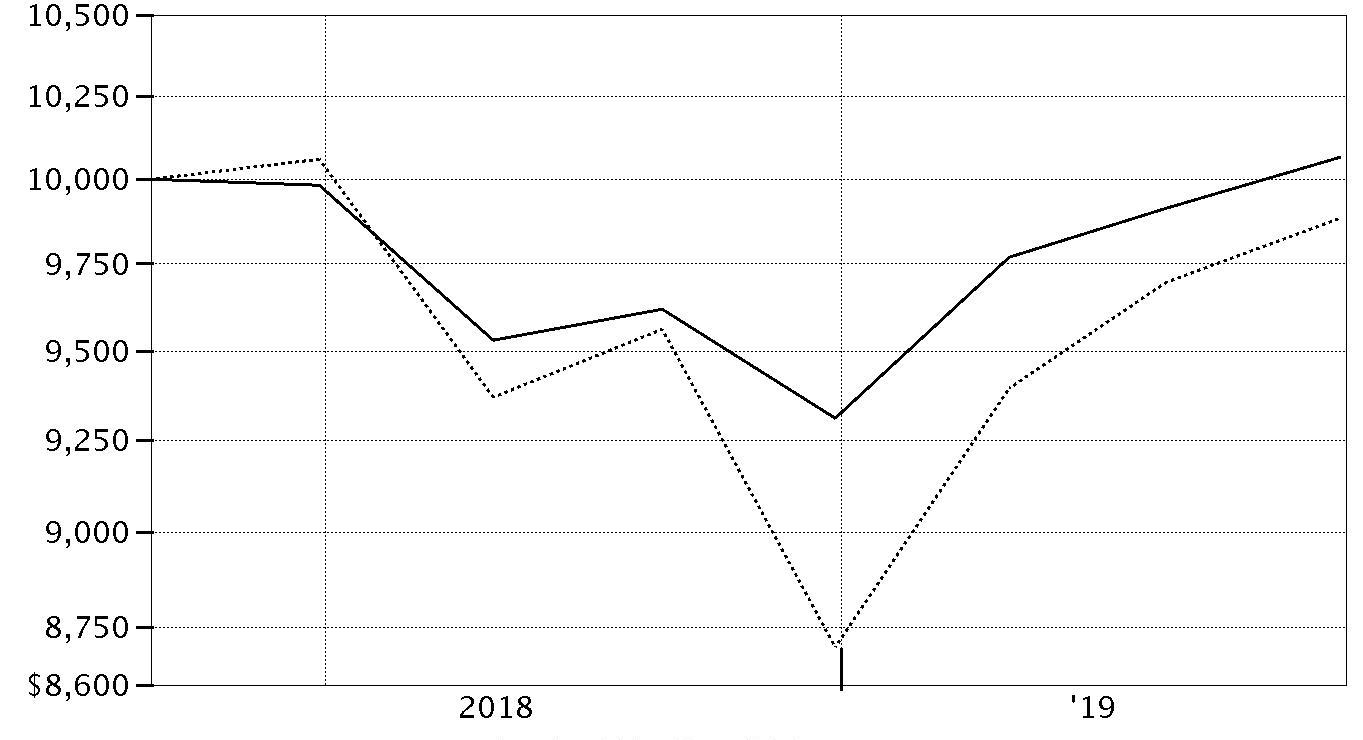
| Period Ending Values |
| $10,063 | Fidelity Freedom® Blend 2020 Fund |
| $9,884 | S&P 500® Index |
Fidelity Freedom® Blend 2025 Fund
Performance: The Bottom Line
Average annual total return reflects the change in the value of an investment, assuming reinvestment of distributions from dividend income and capital gains (the profits earned upon the sale of securities that have grown in value, if any) and assuming a constant rate of performance each year. The hypothetical investment and the average annual total returns do not reflect the deduction of taxes that a shareholder would pay on fund distributions or the redemption of fund shares. During periods of reimbursement by Fidelity, a fund’s total return will be greater than it would be had the reimbursement not occurred. How a fund did yesterday is no guarantee of how it will do tomorrow.
Average annual total returns for Fidelity Freedom® Blend 2025 Fund will be reported once the fund is a year old.
$10,000 Over Life of Fund
Let's say hypothetically that $10,000 was invested in Fidelity Freedom® Blend 2025 Fund, a class of the fund, on August 31, 2018, when the fund started.
The chart shows how the value of your investment would have changed, and also shows how the S&P 500® Index performed over the same period.
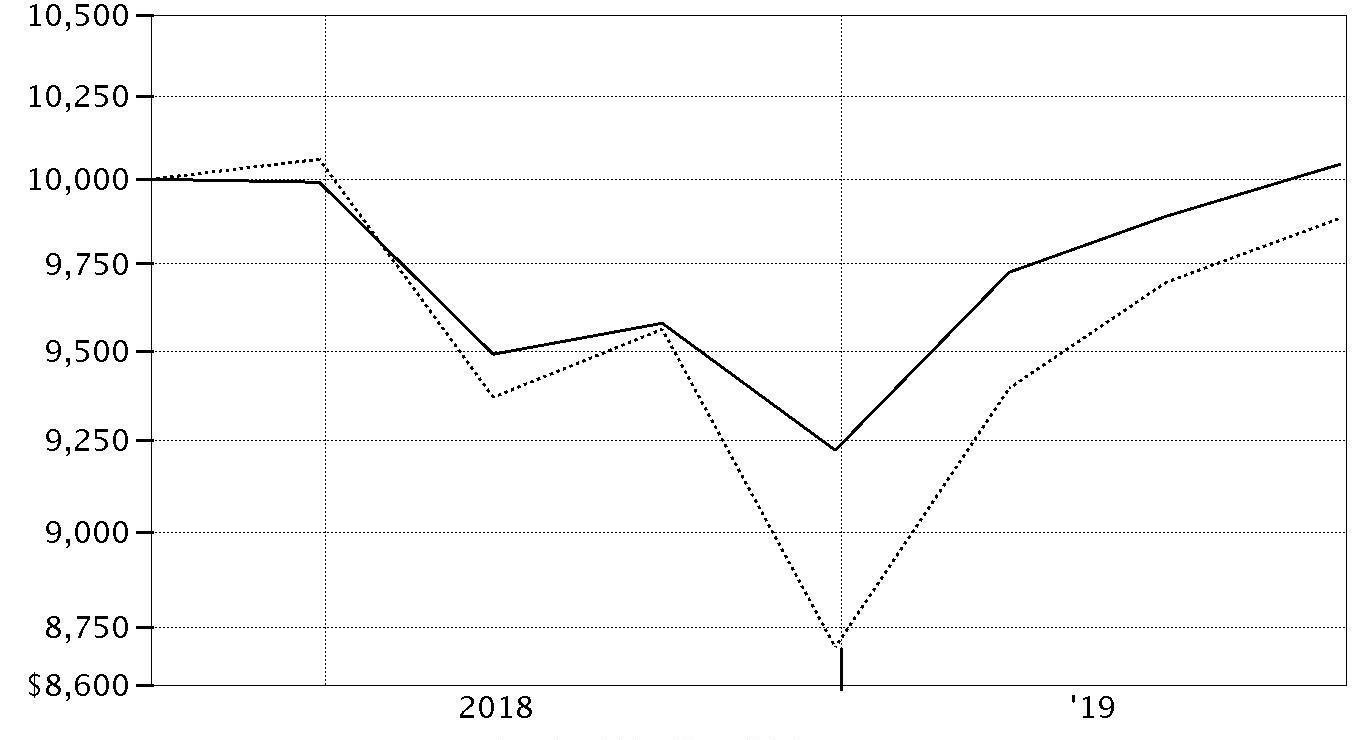
| Period Ending Values |
| $10,042 | Fidelity Freedom® Blend 2025 Fund |
| $9,884 | S&P 500® Index |
Fidelity Freedom® Blend 2030 Fund
Performance: The Bottom Line
Average annual total return reflects the change in the value of an investment, assuming reinvestment of distributions from dividend income and capital gains (the profits earned upon the sale of securities that have grown in value, if any) and assuming a constant rate of performance each year. The hypothetical investment and the average annual total returns do not reflect the deduction of taxes that a shareholder would pay on fund distributions or the redemption of fund shares. During periods of reimbursement by Fidelity, a fund’s total return will be greater than it would be had the reimbursement not occurred. How a fund did yesterday is no guarantee of how it will do tomorrow.
Average annual total returns for Fidelity Freedom® Blend 2030 Fund will be reported once the fund is a year old.
$10,000 Over Life of Fund
Let's say hypothetically that $10,000 was invested in Fidelity Freedom® Blend 2030 Fund, a class of the fund, on August 31, 2018, when the fund started.
The chart shows how the value of your investment would have changed, and also shows how the S&P 500® Index performed over the same period.
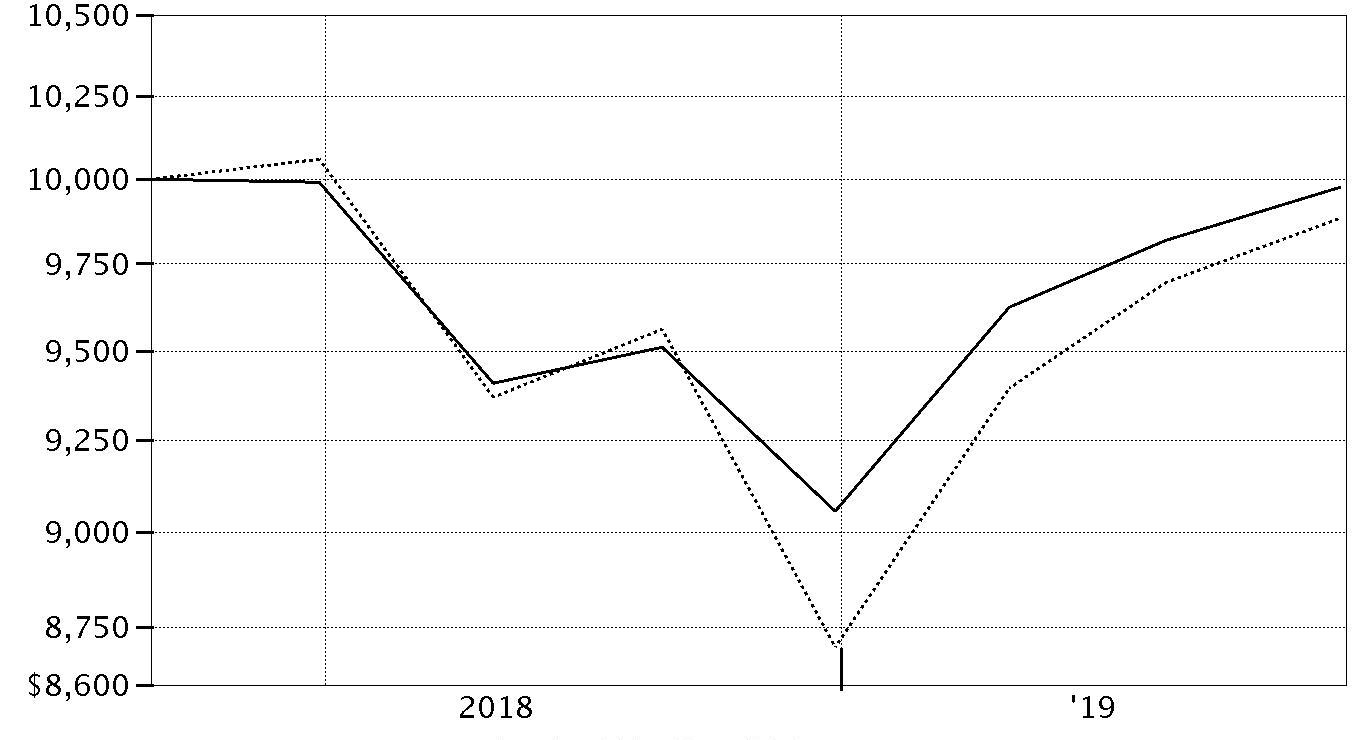
| Period Ending Values |
| $9,974 | Fidelity Freedom® Blend 2030 Fund |
| $9,884 | S&P 500® Index |
Fidelity Freedom® Blend 2035 Fund
Performance: The Bottom Line
Average annual total return reflects the change in the value of an investment, assuming reinvestment of distributions from dividend income and capital gains (the profits earned upon the sale of securities that have grown in value, if any) and assuming a constant rate of performance each year. The hypothetical investment and the average annual total returns do not reflect the deduction of taxes that a shareholder would pay on fund distributions or the redemption of fund shares. During periods of reimbursement by Fidelity, a fund’s total return will be greater than it would be had the reimbursement not occurred. How a fund did yesterday is no guarantee of how it will do tomorrow.
Average annual total returns for Fidelity Freedom® Blend 2035 Fund will be reported once the fund is a year old.
$10,000 Over Life of Fund
Let's say hypothetically that $10,000 was invested in Fidelity Freedom® Blend 2035 Fund, a class of the fund, on August 31, 2018, when the fund started.
The chart shows how the value of your investment would have changed, and also shows how the S&P 500® Index performed over the same period.
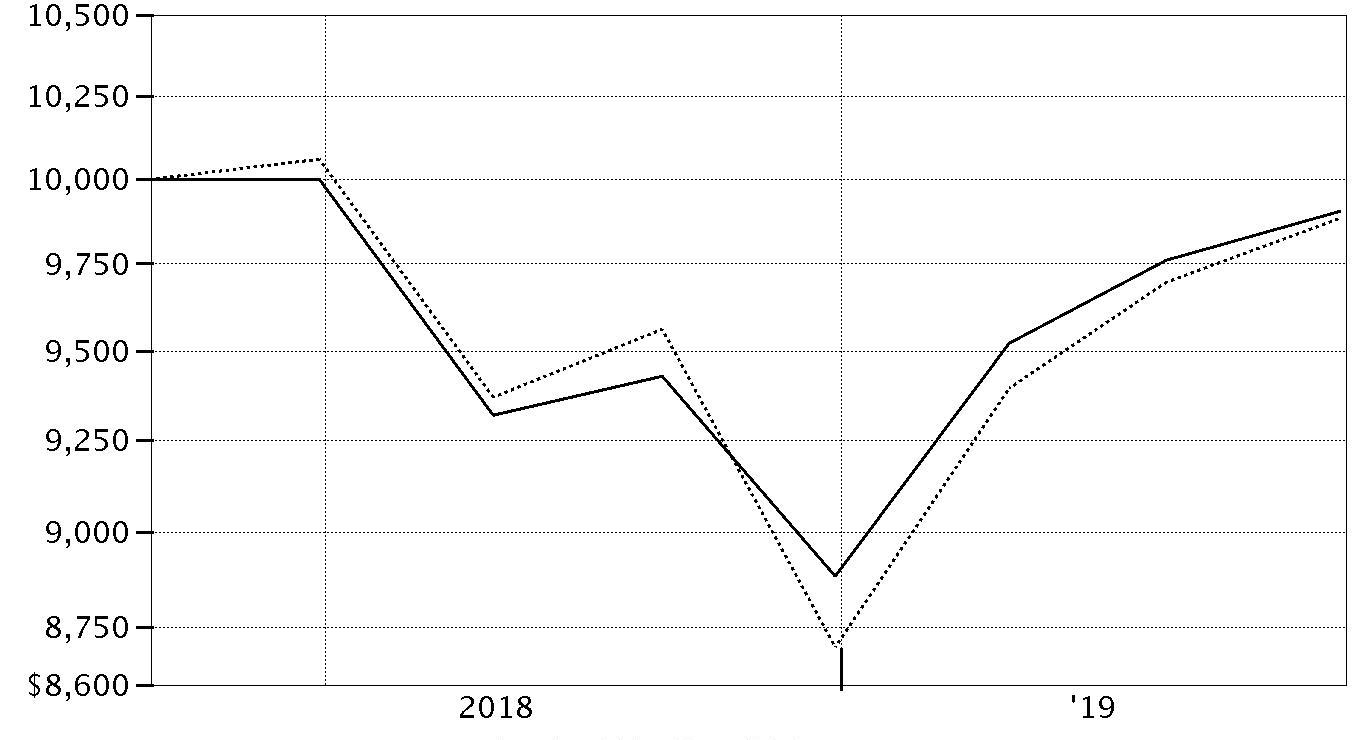
| Period Ending Values |
| $9,904 | Fidelity Freedom® Blend 2035 Fund |
| $9,884 | S&P 500® Index |
Fidelity Freedom® Blend 2040 Fund
Performance: The Bottom Line
Average annual total return reflects the change in the value of an investment, assuming reinvestment of distributions from dividend income and capital gains (the profits earned upon the sale of securities that have grown in value, if any) and assuming a constant rate of performance each year. The hypothetical investment and the average annual total returns do not reflect the deduction of taxes that a shareholder would pay on fund distributions or the redemption of fund shares. During periods of reimbursement by Fidelity, a fund’s total return will be greater than it would be had the reimbursement not occurred. How a fund did yesterday is no guarantee of how it will do tomorrow.
Average annual total returns for Fidelity Freedom® Blend 2040 Fund will be reported once the fund is a year old.
$10,000 Over Life of Fund
Let's say hypothetically that $10,000 was invested in Fidelity Freedom® Blend 2040 Fund, a class of the fund, on August 31, 2018, when the fund started.
The chart shows how the value of your investment would have changed, and also shows how the S&P 500® Index performed over the same period.

| Period Ending Values |
| $9,865 | Fidelity Freedom® Blend 2040 Fund |
| $9,884 | S&P 500® Index |
Fidelity Freedom® Blend 2045 Fund
Performance: The Bottom Line
Average annual total return reflects the change in the value of an investment, assuming reinvestment of distributions from dividend income and capital gains (the profits earned upon the sale of securities that have grown in value, if any) and assuming a constant rate of performance each year. The hypothetical investment and the average annual total returns do not reflect the deduction of taxes that a shareholder would pay on fund distributions or the redemption of fund shares. During periods of reimbursement by Fidelity, a fund’s total return will be greater than it would be had the reimbursement not occurred. How a fund did yesterday is no guarantee of how it will do tomorrow.
Average annual total returns for Fidelity Freedom® Blend 2045 Fund will be reported once the fund is a year old.
$10,000 Over Life of Fund
Let's say hypothetically that $10,000 was invested in Fidelity Freedom® Blend 2045 Fund, a class of the fund, on August 31, 2018, when the fund started.
The chart shows how the value of your investment would have changed, and also shows how the S&P 500® Index performed over the same period.

| Period Ending Values |
| $9,869 | Fidelity Freedom® Blend 2045 Fund |
| $9,884 | S&P 500® Index |
Fidelity Freedom® Blend 2050 Fund
Performance: The Bottom Line
Average annual total return reflects the change in the value of an investment, assuming reinvestment of distributions from dividend income and capital gains (the profits earned upon the sale of securities that have grown in value, if any) and assuming a constant rate of performance each year. The hypothetical investment and the average annual total returns do not reflect the deduction of taxes that a shareholder would pay on fund distributions or the redemption of fund shares. During periods of reimbursement by Fidelity, a fund’s total return will be greater than it would be had the reimbursement not occurred. How a fund did yesterday is no guarantee of how it will do tomorrow.
Average annual total returns for Fidelity Freedom® Blend 2050 Fund will be reported once the fund is a year old.
$10,000 Over Life of Fund
Let's say hypothetically that $10,000 was invested in Fidelity Freedom® Blend 2050 Fund, a class of the fund, on August 31, 2018, when the fund started.
The chart shows how the value of your investment would have changed, and also shows how the S&P 500® Index performed over the same period.
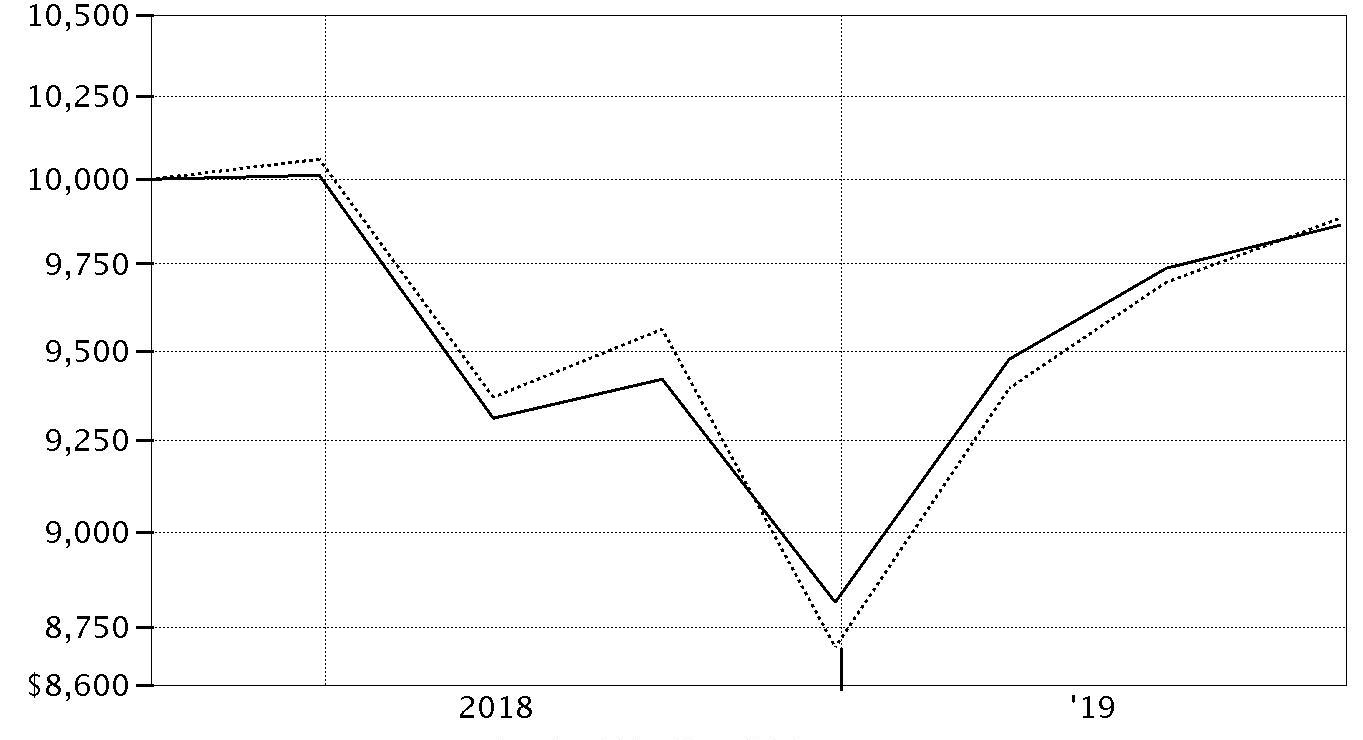
| Period Ending Values |
| $9,861 | Fidelity Freedom® Blend 2050 Fund |
| $9,884 | S&P 500® Index |
Fidelity Freedom® Blend 2055 Fund
Performance: The Bottom Line
Average annual total return reflects the change in the value of an investment, assuming reinvestment of distributions from dividend income and capital gains (the profits earned upon the sale of securities that have grown in value, if any) and assuming a constant rate of performance each year. The hypothetical investment and the average annual total returns do not reflect the deduction of taxes that a shareholder would pay on fund distributions or the redemption of fund shares. During periods of reimbursement by Fidelity, a fund’s total return will be greater than it would be had the reimbursement not occurred. How a fund did yesterday is no guarantee of how it will do tomorrow.
Average annual total returns for Fidelity Freedom® Blend 2055 Fund will be reported once the fund is a year old.
$10,000 Over Life of Fund
Let's say hypothetically that $10,000 was invested in Fidelity Freedom® Blend 2055 Fund, a class of the fund, on August 31, 2018, when the fund started.
The chart shows how the value of your investment would have changed, and also shows how the S&P 500® Index performed over the same period.

| Period Ending Values |
| $9,865 | Fidelity Freedom® Blend 2055 Fund |
| $9,884 | S&P 500® Index |
Fidelity Freedom® Blend 2060 Fund
Performance: The Bottom Line
Average annual total return reflects the change in the value of an investment, assuming reinvestment of distributions from dividend income and capital gains (the profits earned upon the sale of securities that have grown in value, if any) and assuming a constant rate of performance each year. The hypothetical investment and the average annual total returns do not reflect the deduction of taxes that a shareholder would pay on fund distributions or the redemption of fund shares. During periods of reimbursement by Fidelity, a fund’s total return will be greater than it would be had the reimbursement not occurred. How a fund did yesterday is no guarantee of how it will do tomorrow.
Average annual total returns for Fidelity Freedom® Blend 2060 Fund will be reported once the fund is a year old.
$10,000 Over Life of Fund
Let's say hypothetically that $10,000 was invested in Fidelity Freedom® Blend 2060 Fund, a class of the fund, on August 31, 2018, when the fund started.
The chart shows how the value of your investment would have changed, and also shows how the S&P 500® Index performed over the same period.
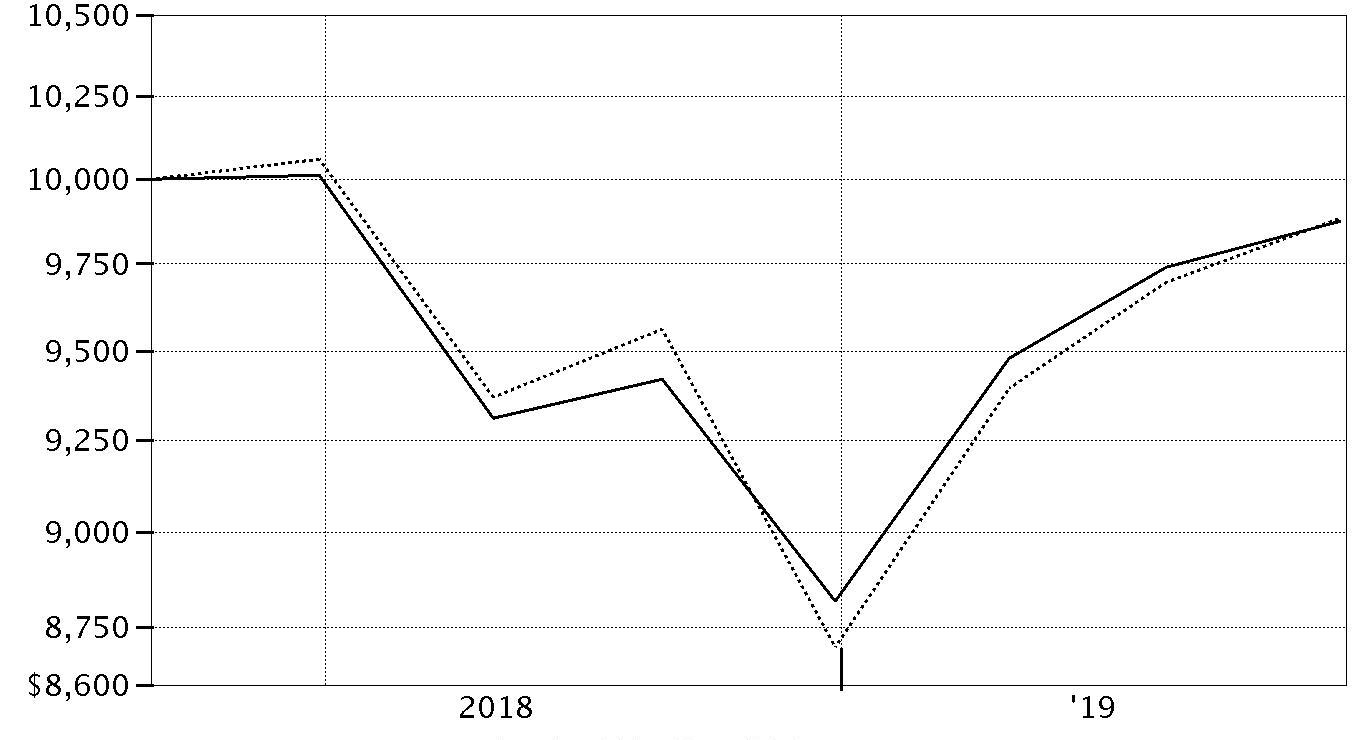
| Period Ending Values |
| $9,873 | Fidelity Freedom® Blend 2060 Fund |
| $9,884 | S&P 500® Index |
Management's Discussion of Fund Performance
Market Recap: The global economy remained in expansion for the 12 months ending March 31, 2019, but growth was less synchronous and uneven. Many major economies progressed toward more-advanced stages of the business cycle. Financial markets responded favorably to the U.S. Federal Reserve’s shift away from its monetary tightening bias in the first quarter of 2019. Most economic indicators remained tepid, although China displayed some initial signs of stabilizing activity, and stepped up the pace of fiscal and monetary stimulus in the first quarter. Against this backdrop, the MSCI World ex USA Index of non-U.S. equity markets returned -2.91% for the year. Much of the negative impact came in the volatile fourth quarter of 2018, when the index returned -13%, followed by a sharp rebound to begin 2019. Among regions in the index, stocks in resource-rich Canada gained 4%, benefiting from rising crude-oil prices early and late in the period, while Asia Pacific ex Japan (+4%) was aided by stabilizing returns in Hong Kong, which rose 8%. Conversely, stocks in Japan (-8%), emerging markets (0%) and Europe ex U.K. (-4%) lagged. Results at home were markedly better. The U.S. equity bellwether S&P 500
® index rose 9.50%. Nine of 11 sectors in the S&P 500
® had a positive return. Three defensive sectors stood out: real estate (+21%), utilities (+19%) and health care (+15%). Conversely, some economically sensitive sectors struggled, with financials (-5%) faring worst. The small-cap-oriented Russell 2000
® Index gained 2.05% for the 12 months. Commodities also lagged, as evidenced by the -5.25% result of the Bloomberg Barclays Commodity Index Total Return. U.S. investment-grade bonds gained 4.48%, according to the Bloomberg Barclays U.S. Aggregate Bond Index, largely driven by surging returns for credit-sensitive sectors. U.S. corporate bonds increased 4.89%, according to the Bloomberg Barclays Credit Bond Index. Elsewhere, securitized sectors fared well, led by commercial mortgage-backed securities (+5.43%). Agency bonds and Treasury Inflation-Protected Securities (TIPS) lagged, as measured by the 3.73% return of the Bloomberg Barclays U.S. Agency Bond Index and the 2.70% advance of the Bloomberg Barclays U.S. Treasury Inflation-Protected Securities Index (Series-L), respectively.
Comments from Co-Portfolio Managers Andrew Dierdorf and Brett Sumsion: From inception on August 31, 2018, through March 31, 2019, returns for the Funds' share classes (excluding sales charges, if applicable) ranged from roughly 2% for the more-income-oriented Freedom Blend Funds – earmarked for investors with a shorter retirement-savings horizon – to about -1% for the more-equity-oriented Funds, suited to investors with a longer retirement-savings horizon. All of the Funds performed roughly in line with their respective Composite indexes for the 12 months. Underlying investment performance contributed most to the Funds' performance versus Composites. Specifically, returns in emerging-markets equities outperformed. Most notably was the strong outperformance of an investment in Fidelity
® Series Emerging Markets Opportunities Fund, which outperformed the MSCI Emerging Markets Index. The Funds' overall U.S. equity exposure also outperformed Composites, led by strong relative results for Fidelity
® Series Small Cap Opportunities Fund and Fidelity
® Series Blue Chip Growth Fund. Conversely, investments in underlying non-U.S. developed-market equities lagged. Active asset allocation had a slightly negative influence on the Funds' relative performance overall. In particular, the Funds' underweighting in U.S. investment-grade bonds detracted, as the benchmark Bloomberg Barclays U.S. Aggregate Bond Index advanced 3.95% for the period. A non-Composite allocation to weak-performing commodities also held back the Funds' relative results; here, an investment in Fidelity
® Series Commodity Strategy Fund trailed its benchmark. Intra-asset allocation decisions – investments made within the major asset classes (equities and fixed-income) – had a modestly negative influence on the Funds’ relative results, particularly among non-U.S. equities, where an allocation to Fidelity
® Series International Small Cap Fund lagged the returns for other international asset categories.
The views expressed above reflect those of the portfolio manager(s) only through the end of the period as stated on the cover of this report and do not necessarily represent the views of Fidelity or any other person in the Fidelity organization. Any such views are subject to change at any time based upon market or other conditions and Fidelity disclaims any responsibility to update such views. These views may not be relied on as investment advice and, because investment decisions for a Fidelity fund are based on numerous factors, may not be relied on as an indication of trading intent on behalf of any Fidelity fund.
Note to Shareholders: At its May 2019 meeting, the Board of Trustees approved adjusting the equity composition of the strategic asset allocation of Freedom Blend Funds from 70%/30% to 60%/40% for U.S./non-U.S. equities.
Fidelity Freedom® Blend Income Fund
Investment Summary (Unaudited)
The information in the following tables is based on the direct investments of the Fund.
Top Holdings as of March 31, 2019
| | % of fund's net assets |
| Fidelity Series Treasury Bill Index Fund | 13.5 |
| Fidelity Series Inflation-Protected Bond Index Fund | 13.3 |
| Fidelity Series Investment Grade Bond Fund | 11.2 |
| Fidelity Series Government Bond Index Fund | 10.6 |
| Fidelity Series Investment Grade Securitized Fund | 7.9 |
| Fidelity Series Corporate Bond Fund | 7.7 |
| Fidelity Series Long-Term Treasury Bond Index Fund | 4.7 |
| Fidelity Series Government Money Market Fund 2.5% | 4.5 |
| Fidelity Series Short-Term Credit Fund | 4.5 |
| Fidelity Series Emerging Markets Opportunities Fund | 3.2 |
| | 81.1 |
Asset Allocation (% of fund's net assets)
| Period end |
| | Domestic Equity Funds | 10.8% |
| | International Equity Funds | 8.9% |
| | Bond Funds | 57.8% |
| | Short-Term Funds | 22.5% |

Domestic Equity Funds category includes Fidelity Series Commodity Strategy Fund which invests in commodity-related investments.
Fidelity Freedom® Blend Income Fund
Schedule of Investments March 31, 2019
Showing Percentage of Net Assets
| Domestic Equity Funds - 10.8% | | | |
| | | Shares | Value |
| Fidelity Series Blue Chip Growth Fund (a) | | 3,223 | $47,541 |
| Fidelity Series Commodity Strategy Fund (a) | | 14,259 | 68,015 |
| Fidelity Series Large Cap Growth Index Fund (a) | | 3,692 | 37,212 |
| Fidelity Series Large Cap Stock Fund (a) | | 2,530 | 37,058 |
| Fidelity Series Large Cap Value Index Fund (a) | | 5,588 | 69,344 |
| Fidelity Series Small Cap Opportunities Fund (a) | | 1,372 | 18,461 |
| Fidelity Series Value Discovery Fund (a) | | 1,758 | 21,956 |
| TOTAL DOMESTIC EQUITY FUNDS | | | |
| (Cost $285,214) | | | 299,587 |
|
| International Equity Funds - 8.9% | | | |
| Fidelity Series Canada Fund (a) | | 664 | 6,848 |
| Fidelity Series Emerging Markets Fund (a) | | 997 | 9,756 |
| Fidelity Series Emerging Markets Opportunities Fund (a) | | 4,771 | 88,405 |
| Fidelity Series International Growth Fund (a) | | 3,757 | 57,069 |
| Fidelity Series International Index Fund (a) | | 1,523 | 14,959 |
| Fidelity Series International Small Cap Fund (a) | | 964 | 14,971 |
| Fidelity Series International Value Fund (a) | | 6,072 | 56,471 |
| TOTAL INTERNATIONAL EQUITY FUNDS | | | |
| (Cost $234,945) | | | 248,479 |
|
| Bond Funds - 57.8% | | | |
| Fidelity Series Corporate Bond Fund (a) | | 21,017 | 213,324 |
| Fidelity Series Emerging Markets Debt Fund (a) | | 2,033 | 19,496 |
| Fidelity Series Floating Rate High Income Fund (a) | | 445 | 4,126 |
| Fidelity Series Government Bond Index Fund (a) | | 28,695 | 293,262 |
| Fidelity Series High Income Fund (a) | | 3,251 | 30,561 |
| Fidelity Series Inflation-Protected Bond Index Fund (a) | | 37,828 | 369,954 |
| Fidelity Series Investment Grade Bond Fund (a) | | 27,881 | 311,706 |
| Fidelity Series Investment Grade Securitized Fund (a) | | 21,588 | 219,982 |
| Fidelity Series Long-Term Treasury Bond Index Fund (a) | | 14,598 | 129,480 |
| Fidelity Series Real Estate Income Fund (a) | | 1,201 | 13,102 |
| TOTAL BOND FUNDS | | | |
| (Cost $1,564,747) | | | 1,604,993 |
|
| Short-Term Funds - 22.5% | | | |
| Fidelity Cash Central Fund, 2.48% (b) | | 49 | 49 |
| Fidelity Series Government Money Market Fund 2.5% (a)(c) | | 125,285 | 125,285 |
| Fidelity Series Short-Term Credit Fund (a) | | 12,426 | 123,884 |
| Fidelity Series Treasury Bill Index Fund (a) | | 37,557 | 375,199 |
| TOTAL SHORT-TERM FUNDS | | | |
| (Cost $623,418) | | | 624,417 |
| TOTAL INVESTMENT IN SECURITIES - 100.0% | | | |
| (Cost $2,708,324) | | | 2,777,476 |
| NET OTHER ASSETS (LIABILITIES) - 0.0% | | | (838) |
| NET ASSETS - 100% | | | $2,776,638 |
Legend
(a) Affiliated Fund
(b) Affiliated fund that is generally available only to investment companies and other accounts managed by Fidelity Investments. The rate quoted is the annualized seven-day yield of the fund at period end. A complete unaudited listing of the fund's holdings as of its most recent quarter end is available upon request. In addition, each Fidelity Central Fund's financial statements, which are not covered by the Fund's Report of Independent Registered Public Accounting Firm, are available on the SEC's website or upon request.
(c) The rate quoted is the annualized seven-day yield of the fund at period end.
Affiliated Central Funds
Information regarding fiscal year to date income earned by the Fund from investments in Fidelity Central Funds is as follows:
| Fund | Income earned |
| Fidelity Cash Central Fund | $195 |
| Total | $195 |
Amounts in the income column in the above table include any capital gain distributions from underlying funds, which are presented in the corresponding line-item in the Statement of Operations, if applicable.
Affiliated Underlying Funds
Fiscal year to date information regarding the Fund's investments in affiliated Underlying Funds, excluding any Money Market Central Funds, is presented below. Exchanges between classes of the same affiliated Underlying Funds may occur.
| Affiliate | Value, beginning of period | Purchases | Sales Proceeds | Dividend Income | Realized Gain (loss) | Change in Unrealized appreciation (depreciation) | Value, end of period |
| Fidelity Series Blue Chip Growth Fund | $-- | $59,139 | $13,888 | $2,358 | $(1,470) | $3,760 | $47,541 |
| Fidelity Series Canada Fund | -- | 8,139 | 1,724 | 71 | (73) | 506 | 6,848 |
| Fidelity Series Commodity Strategy Fund | -- | 79,342 | 10,840 | 1,304 | (494) | 7 | 68,015 |
| Fidelity Series Corporate Bond Fund | -- | 243,386 | 37,345 | 3,320 | (110) | 7,393 | 213,324 |
| Fidelity Series Emerging Markets Debt Fund | -- | 21,918 | 2,966 | 393 | 9 | 535 | 19,496 |
| Fidelity Series Emerging Markets Fund | -- | 11,221 | 1,982 | 19 | (50) | 567 | 9,756 |
| Fidelity Series Emerging Markets Opportunities Fund | -- | 104,615 | 21,972 | 3,408 | (932) | 6,694 | 88,405 |
| Fidelity Series Floating Rate High Income Fund | -- | 6,004 | 1,851 | 153 | (40) | 13 | 4,126 |
| Fidelity Series Government Bond Index Fund | -- | 337,666 | 50,385 | 2,954 | 11 | 5,970 | 293,262 |
| Fidelity Series Government Money Market Fund 2.5% | -- | 146,394 | 21,109 | 1,128 | -- | -- | 125,285 |
| Fidelity Series High Income Fund | -- | 41,289 | 11,530 | 913 | (200) | 1,002 | 30,561 |
| Fidelity Series Inflation-Protected Bond Index Fund | -- | 424,761 | 60,134 | 3,348 | (570) | 5,897 | 369,954 |
| Fidelity Series International Growth Fund | -- | 68,756 | 14,553 | 1,770 | (688) | 3,554 | 57,069 |
| Fidelity Series International Index Fund | -- | 17,703 | 3,468 | 41 | (99) | 823 | 14,959 |
| Fidelity Series International Small Cap Fund | -- | 18,569 | 3,685 | 660 | (281) | 368 | 14,971 |
| Fidelity Series International Value Fund | -- | 67,040 | 10,898 | 973 | (693) | 1,022 | 56,471 |
| Fidelity Series Investment Grade Bond Fund | -- | 356,357 | 52,856 | 4,147 | (51) | 8,256 | 311,706 |
| Fidelity Series Investment Grade Securitized Fund | -- | 257,747 | 42,117 | 2,783 | 79 | 4,273 | 219,982 |
| Fidelity Series Large Cap Growth Index Fund | -- | 44,764 | 10,656 | 94 | (457) | 3,561 | 37,212 |
| Fidelity Series Large Cap Stock Fund | -- | 46,042 | 10,494 | 721 | (470) | 1,980 | 37,058 |
| Fidelity Series Large Cap Value Index Fund | -- | 86,145 | 19,475 | 1,826 | (683) | 3,357 | 69,344 |
| Fidelity Series Long-Term Treasury Bond Index Fund | -- | 143,918 | 20,914 | 1,409 | 1 | 6,475 | 129,480 |
| Fidelity Series Real Estate Income Fund | -- | 14,944 | 2,228 | 340 | (46) | 432 | 13,102 |
| Fidelity Series Short-Term Credit Fund | -- | 145,648 | 23,103 | 1,330 | 28 | 1,311 | 123,884 |
| Fidelity Series Small Cap Opportunities Fund | -- | 23,628 | 5,639 | 826 | (623) | 1,095 | 18,461 |
| Fidelity Series Treasury Bill Index Fund | -- | 439,299 | 63,774 | 3,883 | (14) | (312) | 375,199 |
| Fidelity Series Value Discovery Fund | -- | 27,285 | 5,650 | 655 | (292) | 613 | 21,956 |
| | $-- | $3,241,719 | $525,236 | $40,827 | $(8,208) | $69,152 | $2,777,427 |
Amounts in the income column in the above table include any capital gain distributions from underlying funds, which are presented in the corresponding line-item in the Statement of Operations, if applicable.
Investment Valuation
All investments are categorized as Level 1 under the Fair Value Hierarchy. The inputs or methodology used for valuing securities may not be an indication of the risk associated with investing in those securities. For more information on valuation inputs please refer to the Investment Valuation section in the accompanying Notes to Financial Statements.
See accompanying notes which are an integral part of the financial statements.
Fidelity Freedom® Blend Income Fund
Financial Statements
Statement of Assets and Liabilities
| | | March 31, 2019 |
| Assets | | |
Investment in securities, at value — See accompanying schedule:
| | |
| Fidelity Central Funds (cost $49) | $49 | |
| Other affiliated issuers (cost $2,708,275) | 2,777,427 | |
| Total Investment in Securities (cost $2,708,324) | | $2,777,476 |
| Cash | | 147 |
| Receivable for investments sold | | 11,271 |
| Receivable for fund shares sold | | 698 |
| Total assets | | 2,789,592 |
| Liabilities | | |
| Payable for investments purchased | $11,957 | |
| Accrued management fee | 776 | |
| Distribution and service plan fees payable | 221 | |
| Total liabilities | | 12,954 |
| Net Assets | | $2,776,638 |
| Net Assets consist of: | | |
| Paid in capital | | $2,704,345 |
| Total distributable earnings (loss) | | 72,293 |
| Net Assets | | $2,776,638 |
| Net Asset Value and Maximum Offering Price | | |
| Class A: | | |
| Net Asset Value and redemption price per share ($107,003 ÷ 10,664 shares) | | $10.03 |
| Maximum offering price per share (100/94.25 of $10.03) | | $10.64 |
| Class M: | | |
| Net Asset Value and redemption price per share ($101,796 ÷ 10,146 shares) | | $10.03 |
| Maximum offering price per share (100/96.50 of $10.03) | | $10.39 |
| Class C: | | |
| Net Asset Value and offering price per share ($123,194 ÷ 12,302 shares)(a) | | $10.01 |
| Fidelity Freedom Blend Income Fund: | | |
| Net Asset Value, offering price and redemption price per share ($378,362 ÷ 37,707 shares) | | $10.03 |
| Class K: | | |
| Net Asset Value, offering price and redemption price per share ($102,155 ÷ 10,179 shares) | | $10.04 |
| Class K6: | | |
| Net Asset Value, offering price and redemption price per share ($1,657,663 ÷ 165,179 shares) | | $10.04 |
| Class I: | | |
| Net Asset Value, offering price and redemption price per share ($102,095 ÷ 10,173 shares) | | $10.04 |
| Class Z: | | |
| Net Asset Value, offering price and redemption price per share ($102,155 ÷ 10,179 shares) | | $10.04 |
| Class Z6: | | |
| Net Asset Value, offering price and redemption price per share ($102,215 ÷ 10,182 shares) | | $10.04 |
(a) Redemption price per share is equal to net asset value less any applicable contingent deferred sales charge.
See accompanying notes which are an integral part of the financial statements.
Statement of Operations
| | | For the period
August 31, 2018 (commencement of operations) to
March 31, 2019 |
| Investment Income | | |
| Dividends: | | |
| Affiliated issuers | | $27,877 |
| Income from Fidelity Central Funds | | 195 |
| Total income | | 28,072 |
| Expenses | | |
| Management fee | $3,812 | |
| Distribution and service plan fees | 1,263 | |
| Independent trustees' fees and expenses | 4 | |
| Total expenses | | 5,079 |
| Net investment income (loss) | | 22,993 |
| Realized and Unrealized Gain (Loss) | | |
| Net realized gain (loss) on: | | |
| Investment securities: | | |
| Affiliated issuers | (8,208) | |
| Capital gain distributions from underlying funds: | | |
| Affiliated issuers | 12,950 | |
| Total net realized gain (loss) | | 4,742 |
| Change in net unrealized appreciation (depreciation) on: | | |
| Investment securities: | | |
| Affiliated issuers | 69,152 | |
| Total change in net unrealized appreciation (depreciation) | | 69,152 |
| Net gain (loss) | | 73,894 |
| Net increase (decrease) in net assets resulting from operations | | $96,887 |
See accompanying notes which are an integral part of the financial statements.
Statement of Changes in Net Assets
| | For the period
August 31, 2018 (commencement of operations) to
March 31, 2019 |
| Increase (Decrease) in Net Assets | |
| Operations | |
| Net investment income (loss) | $22,993 |
| Net realized gain (loss) | 4,742 |
| Change in net unrealized appreciation (depreciation) | 69,152 |
| Net increase (decrease) in net assets resulting from operations | 96,887 |
| Distributions to shareholders | (24,594) |
| Total distributions | (24,594) |
| Share transactions - net increase (decrease) | 2,704,345 |
| Total increase (decrease) in net assets | 2,776,638 |
| Net Assets | |
| Beginning of period | – |
| End of period | $2,776,638 |
See accompanying notes which are an integral part of the financial statements.
Financial Highlights
Fidelity Freedom Blend Income Fund Class A
| Year ended March 31, | 2019 A |
| Selected Per–Share Data | |
| Net asset value, beginning of period | $10.00 |
| Income from Investment Operations | |
| Net investment income (loss)B | .11 |
| Net realized and unrealized gain (loss) | .08 |
| Total from investment operations | .19 |
| Distributions from net investment income | (.11) |
| Distributions from net realized gain | (.05) |
| Total distributions | (.16) |
| Net asset value, end of period | $10.03 |
| Total ReturnC,D | 1.91% |
| Ratios to Average Net AssetsE,F | |
| Expenses before reductions | .71%G |
| Expenses net of fee waivers, if any | .71%G |
| Expenses net of all reductions | .71%G |
| Net investment income (loss) | 1.95%G |
| Supplemental Data | |
| Net assets, end of period (000 omitted) | $107 |
| Portfolio turnover rateF | 48%G |
A For the period August 31, 2018 (commencement of operations) to March 31, 2019.
B Calculated based on average shares outstanding during the period.
C Total returns for periods of less than one year are not annualized.
D Total returns do not include the effect of the sales charges.
E Expense ratios reflect operating expenses of the class. Expenses before reductions do not reflect amounts reimbursed by the investment adviser or reductions from expense offset arrangements and do not represent the amount paid by the class during periods when reimbursements or reductions occur. Expense ratios before reductions for start-up periods may not be representative of longer-term operating periods. Expenses net of fee waivers reflect expenses after reimbursement by the investment adviser but prior to reductions from expense offset arrangements. Expenses net of all reductions represent the net expenses paid by the class but do not include expenses of the underlying funds in which the Fund invests.
F Amounts do not include the activity of the Underlying Funds.
G Annualized
See accompanying notes which are an integral part of the financial statements.
Fidelity Freedom Blend Income Fund Class M
| Year ended March 31, | 2019 A |
| Selected Per–Share Data | |
| Net asset value, beginning of period | $10.00 |
| Income from Investment Operations | |
| Net investment income (loss)B | .10 |
| Net realized and unrealized gain (loss) | .07 |
| Total from investment operations | .17 |
| Distributions from net investment income | (.09) |
| Distributions from net realized gain | (.05) |
| Total distributions | (.14) |
| Net asset value, end of period | $10.03 |
| Total ReturnC,D | 1.76% |
| Ratios to Average Net AssetsE,F | |
| Expenses before reductions | .96%G |
| Expenses net of fee waivers, if any | .96%G |
| Expenses net of all reductions | .96%G |
| Net investment income (loss) | 1.70%G |
| Supplemental Data | |
| Net assets, end of period (000 omitted) | $102 |
| Portfolio turnover rateF | 48%G |
A For the period August 31, 2018 (commencement of operations) to March 31, 2019.
B Calculated based on average shares outstanding during the period.
C Total returns for periods of less than one year are not annualized.
D Total returns do not include the effect of the sales charges.
E Expense ratios reflect operating expenses of the class. Expenses before reductions do not reflect amounts reimbursed by the investment adviser or reductions from expense offset arrangements and do not represent the amount paid by the class during periods when reimbursements or reductions occur. Expense ratios before reductions for start-up periods may not be representative of longer-term operating periods. Expenses net of fee waivers reflect expenses after reimbursement by the investment adviser but prior to reductions from expense offset arrangements. Expenses net of all reductions represent the net expenses paid by the class but do not include expenses of the underlying funds in which the Fund invests.
F Amounts do not include the activity of the Underlying Funds.
G Annualized
See accompanying notes which are an integral part of the financial statements.
Fidelity Freedom Blend Income Fund Class C
| Year ended March 31, | 2019 A |
| Selected Per–Share Data | |
| Net asset value, beginning of period | $10.00 |
| Income from Investment Operations | |
| Net investment income (loss)B | .07 |
| Net realized and unrealized gain (loss) | .07 |
| Total from investment operations | .14 |
| Distributions from net investment income | (.08) |
| Distributions from net realized gain | (.05) |
| Total distributions | (.13) |
| Net asset value, end of period | $10.01 |
| Total ReturnC,D | 1.45% |
| Ratios to Average Net AssetsE,F | |
| Expenses before reductions | 1.47%G,H |
| Expenses net of fee waivers, if any | 1.47%G,H |
| Expenses net of all reductions | 1.47%G,H |
| Net investment income (loss) | 1.19%G |
| Supplemental Data | |
| Net assets, end of period (000 omitted) | $123 |
| Portfolio turnover rateF | 48%G |
A For the period August 31, 2018 (commencement of operations) to March 31, 2019.
B Calculated based on average shares outstanding during the period.
C Total returns for periods of less than one year are not annualized.
D Total returns do not include the effect of the contingent deferred sales charge.
E Expense ratios reflect operating expenses of the class. Expenses before reductions do not reflect amounts reimbursed by the investment adviser or reductions from expense offset arrangements and do not represent the amount paid by the class during periods when reimbursements or reductions occur. Expense ratios before reductions for start-up periods may not be representative of longer-term operating periods. Expenses net of fee waivers reflect expenses after reimbursement by the investment adviser but prior to reductions from expense offset arrangements. Expenses net of all reductions represent the net expenses paid by the class but do not include expenses of the underlying funds in which the Fund invests.
F Amounts do not include the activity of the Underlying Funds.
G Annualized
H On certain classes, the size and fluctuation of net assets and expense amounts may cause ratios to differ from contractual rates.
See accompanying notes which are an integral part of the financial statements.
Fidelity Freedom Blend Income Fund
| Year ended March 31, | 2019 A |
| Selected Per–Share Data | |
| Net asset value, beginning of period | $10.00 |
| Income from Investment Operations | |
| Net investment income (loss)B | .13 |
| Net realized and unrealized gain (loss) | .07 |
| Total from investment operations | .20 |
| Distributions from net investment income | (.12) |
| Distributions from net realized gain | (.05) |
| Total distributions | (.17) |
| Net asset value, end of period | $10.03 |
| Total ReturnC | 2.04% |
| Ratios to Average Net AssetsD,E | |
| Expenses before reductions | .46%F |
| Expenses net of fee waivers, if any | .46%F |
| Expenses net of all reductions | .46%F |
| Net investment income (loss) | 2.20%F |
| Supplemental Data | |
| Net assets, end of period (000 omitted) | $378 |
| Portfolio turnover rateE | 48%F |
A For the period August 31, 2018 (commencement of operations) to March 31, 2019.
B Calculated based on average shares outstanding during the period.
C Total returns for periods of less than one year are not annualized.
D Expense ratios reflect operating expenses of the class. Expenses before reductions do not reflect amounts reimbursed by the investment adviser or reductions from expense offset arrangements and do not represent the amount paid by the class during periods when reimbursements or reductions occur. Expense ratios before reductions for start-up periods may not be representative of longer-term operating periods. Expenses net of fee waivers reflect expenses after reimbursement by the investment adviser but prior to reductions from expense offset arrangements. Expenses net of all reductions represent the net expenses paid by the class but do not include expenses of the underlying funds in which the Fund invests.
E Amounts do not include the activity of the Underlying Funds.
F Annualized
See accompanying notes which are an integral part of the financial statements.
Fidelity Freedom Blend Income Fund Class K
| Year ended March 31, | 2019 A |
| Selected Per–Share Data | |
| Net asset value, beginning of period | $10.00 |
| Income from Investment Operations | |
| Net investment income (loss)B | .13 |
| Net realized and unrealized gain (loss) | .08 |
| Total from investment operations | .21 |
| Distributions from net investment income | (.12) |
| Distributions from net realized gain | (.05) |
| Total distributions | (.17) |
| Net asset value, end of period | $10.04 |
| Total ReturnC | 2.20% |
| Ratios to Average Net AssetsD,E | |
| Expenses before reductions | .36%F |
| Expenses net of fee waivers, if any | .36%F |
| Expenses net of all reductions | .36%F |
| Net investment income (loss) | 2.30%F |
| Supplemental Data | |
| Net assets, end of period (000 omitted) | $102 |
| Portfolio turnover rateE | 48%F |
A For the period August 31, 2018 (commencement of operations) to March 31, 2019.
B Calculated based on average shares outstanding during the period.
C Total returns for periods of less than one year are not annualized.
D Expense ratios reflect operating expenses of the class. Expenses before reductions do not reflect amounts reimbursed by the investment adviser or reductions from expense offset arrangements and do not represent the amount paid by the class during periods when reimbursements or reductions occur. Expense ratios before reductions for start-up periods may not be representative of longer-term operating periods. Expenses net of fee waivers reflect expenses after reimbursement by the investment adviser but prior to reductions from expense offset arrangements. Expenses net of all reductions represent the net expenses paid by the class but do not include expenses of the underlying funds in which the Fund invests.
E Amounts do not include the activity of the Underlying Funds.
F Annualized
See accompanying notes which are an integral part of the financial statements.
Fidelity Freedom Blend Income Fund Class K6
| Year ended March 31, | 2019 A |
| Selected Per–Share Data | |
| Net asset value, beginning of period | $10.00 |
| Income from Investment Operations | |
| Net investment income (loss)B | .14 |
| Net realized and unrealized gain (loss) | .08 |
| Total from investment operations | .22 |
| Distributions from net investment income | (.13) |
| Distributions from net realized gain | (.05) |
| Total distributions | (.18) |
| Net asset value, end of period | $10.04 |
| Total ReturnC | 2.24% |
| Ratios to Average Net AssetsD,E | |
| Expenses before reductions | .26%F |
| Expenses net of fee waivers, if any | .26%F |
| Expenses net of all reductions | .26%F |
| Net investment income (loss) | 2.39%F |
| Supplemental Data | |
| Net assets, end of period (000 omitted) | $1,658 |
| Portfolio turnover rateE | 48%F |
A For the period August 31, 2018 (commencement of operations) to March 31, 2019.
B Calculated based on average shares outstanding during the period.
C Total returns for periods of less than one year are not annualized.
D Expense ratios reflect operating expenses of the class. Expenses before reductions do not reflect amounts reimbursed by the investment adviser or reductions from expense offset arrangements and do not represent the amount paid by the class during periods when reimbursements or reductions occur. Expenses net of fee waivers reflect expenses after reimbursement by the investment adviser but prior to reductions from expense offset arrangements. Expenses net of all reductions represent the net expenses paid by the class but do not include expenses of the underlying funds in which the Fund invests.
E Amounts do not include the activity of the Underlying Funds.
F Annualized
See accompanying notes which are an integral part of the financial statements.
Fidelity Freedom Blend Income Fund Class I
| Year ended March 31, | 2019 A |
| Selected Per–Share Data | |
| Net asset value, beginning of period | $10.00 |
| Income from Investment Operations | |
| Net investment income (loss)B | .13 |
| Net realized and unrealized gain (loss) | .08 |
| Total from investment operations | .21 |
| Distributions from net investment income | (.12) |
| Distributions from net realized gain | (.05) |
| Total distributions | (.17) |
| Net asset value, end of period | $10.04 |
| Total ReturnC | 2.14% |
| Ratios to Average Net AssetsD,E | |
| Expenses before reductions | .46%F |
| Expenses net of fee waivers, if any | .46%F |
| Expenses net of all reductions | .46%F |
| Net investment income (loss) | 2.20%F |
| Supplemental Data | |
| Net assets, end of period (000 omitted) | $102 |
| Portfolio turnover rateE | 48%F |
A For the period August 31, 2018 (commencement of operations) to March 31, 2019.
B Calculated based on average shares outstanding during the period.
C Total returns for periods of less than one year are not annualized.
D Expense ratios reflect operating expenses of the class. Expenses before reductions do not reflect amounts reimbursed by the investment adviser or reductions from expense offset arrangements and do not represent the amount paid by the class during periods when reimbursements or reductions occur. Expense ratios before reductions for start-up periods may not be representative of longer-term operating periods. Expenses net of fee waivers reflect expenses after reimbursement by the investment adviser but prior to reductions from expense offset arrangements. Expenses net of all reductions represent the net expenses paid by the class but do not include expenses of the underlying funds in which the Fund invests.
E Amounts do not include the activity of the Underlying Funds.
F Annualized
See accompanying notes which are an integral part of the financial statements.
Fidelity Freedom Blend Income Fund Class Z
| Year ended March 31, | 2019 A |
| Selected Per–Share Data | |
| Net asset value, beginning of period | $10.00 |
| Income from Investment Operations | |
| Net investment income (loss)B | .13 |
| Net realized and unrealized gain (loss) | .08 |
| Total from investment operations | .21 |
| Distributions from net investment income | (.12) |
| Distributions from net realized gain | (.05) |
| Total distributions | (.17) |
| Net asset value, end of period | $10.04 |
| Total ReturnC | 2.20% |
| Ratios to Average Net AssetsD,E | |
| Expenses before reductions | .36%F |
| Expenses net of fee waivers, if any | .36%F |
| Expenses net of all reductions | .36%F |
| Net investment income (loss) | 2.30%F |
| Supplemental Data | |
| Net assets, end of period (000 omitted) | $102 |
| Portfolio turnover rateE | 48%F |
A For the period August 31, 2018 (commencement of operations) to March 31, 2019.
B Calculated based on average shares outstanding during the period.
C Total returns for periods of less than one year are not annualized.
D Expense ratios reflect operating expenses of the class. Expenses before reductions do not reflect amounts reimbursed by the investment adviser or reductions from expense offset arrangements and do not represent the amount paid by the class during periods when reimbursements or reductions occur. Expense ratios before reductions for start-up periods may not be representative of longer-term operating periods. Expenses net of fee waivers reflect expenses after reimbursement by the investment adviser but prior to reductions from expense offset arrangements. Expenses net of all reductions represent the net expenses paid by the class but do not include expenses of the underlying funds in which the Fund invests.
E Amounts do not include the activity of the Underlying Funds.
F Annualized
See accompanying notes which are an integral part of the financial statements.
Fidelity Freedom Blend Income Fund Class Z6
| Year ended March 31, | 2019 A |
| Selected Per–Share Data | |
| Net asset value, beginning of period | $10.00 |
| Income from Investment Operations | |
| Net investment income (loss)B | .14 |
| Net realized and unrealized gain (loss) | .08 |
| Total from investment operations | .22 |
| Distributions from net investment income | (.13) |
| Distributions from net realized gain | (.05) |
| Total distributions | (.18) |
| Net asset value, end of period | $10.04 |
| Total ReturnC | 2.23% |
| Ratios to Average Net AssetsD,E | |
| Expenses before reductions | .26%F |
| Expenses net of fee waivers, if any | .26%F |
| Expenses net of all reductions | .26%F |
| Net investment income (loss) | 2.40%F |
| Supplemental Data | |
| Net assets, end of period (000 omitted) | $102 |
| Portfolio turnover rateE | 48%F |
A For the period August 31, 2018 (commencement of operations) to March 31, 2019.
B Calculated based on average shares outstanding during the period.
C Total returns for periods of less than one year are not annualized.
D Expense ratios reflect operating expenses of the class. Expenses before reductions do not reflect amounts reimbursed by the investment adviser or reductions from expense offset arrangements and do not represent the amount paid by the class during periods when reimbursements or reductions occur. Expenses net of fee waivers reflect expenses after reimbursement by the investment adviser but prior to reductions from expense offset arrangements. Expenses net of all reductions represent the net expenses paid by the class but do not include expenses of the underlying funds in which the Fund invests.
E Amounts do not include the activity of the Underlying Funds.
F Annualized
See accompanying notes which are an integral part of the financial statements.
Fidelity Freedom® Blend 2005 Fund
Investment Summary (Unaudited)
The information in the following tables is based on the direct investments of the Fund.
Top Holdings as of March 31, 2019
| | % of fund's net assets |
| Fidelity Series Inflation-Protected Bond Index Fund | 11.5 |
| Fidelity Series Treasury Bill Index Fund | 11.2 |
| Fidelity Series Investment Grade Bond Fund | 10.4 |
| Fidelity Series Government Bond Index Fund | 9.8 |
| Fidelity Series Investment Grade Securitized Fund | 7.3 |
| Fidelity Series Corporate Bond Fund | 7.1 |
| Fidelity Series Long-Term Treasury Bond Index Fund | 4.8 |
| Fidelity Series Large Cap Value Index Fund | 4.2 |
| Fidelity Series Emerging Markets Opportunities Fund | 4.0 |
| Fidelity Series Short-Term Credit Fund | 3.8 |
| | 74.1 |
Asset Allocation (% of fund's net assets)
| Period end |
| | Domestic Equity Funds | 16.3% |
| | International Equity Funds | 11.6% |
| | Bond Funds | 53.3% |
| | Short-Term Funds | 18.8% |

Domestic Equity Funds category includes Fidelity Series Commodity Strategy Fund which invests in commodity-related investments.
Fidelity Freedom® Blend 2005 Fund
Schedule of Investments March 31, 2019
Showing Percentage of Net Assets
| Domestic Equity Funds - 16.3% | | | |
| | | Shares | Value |
| Fidelity Series Blue Chip Growth Fund (a) | | 4,046 | $59,683 |
| Fidelity Series Commodity Strategy Fund (a) | | 10,228 | 48,785 |
| Fidelity Series Large Cap Growth Index Fund (a) | | 4,637 | 46,743 |
| Fidelity Series Large Cap Stock Fund (a) | | 3,166 | 46,379 |
| Fidelity Series Large Cap Value Index Fund (a) | | 6,998 | 86,849 |
| Fidelity Series Small Cap Opportunities Fund (a) | | 1,721 | 23,168 |
| Fidelity Series Value Discovery Fund (a) | | 2,200 | 27,479 |
| TOTAL DOMESTIC EQUITY FUNDS | | | |
| (Cost $327,126) | | | 339,086 |
|
| International Equity Funds - 11.6% | | | |
| Fidelity Series Canada Fund (a) | | 670 | 6,903 |
| Fidelity Series Emerging Markets Fund (a) | | 933 | 9,131 |
| Fidelity Series Emerging Markets Opportunities Fund (a) | | 4,466 | 82,753 |
| Fidelity Series International Growth Fund (a) | | 3,749 | 56,952 |
| Fidelity Series International Index Fund (a) | | 1,530 | 15,023 |
| Fidelity Series International Small Cap Fund (a) | | 968 | 15,035 |
| Fidelity Series International Value Fund (a) | | 6,084 | 56,584 |
| TOTAL INTERNATIONAL EQUITY FUNDS | | | |
| (Cost $233,553) | | | 242,381 |
|
| Bond Funds - 53.3% | | | |
| Fidelity Series Corporate Bond Fund (a) | | 14,592 | 148,104 |
| Fidelity Series Emerging Markets Debt Fund (a) | | 1,526 | 14,638 |
| Fidelity Series Floating Rate High Income Fund (a) | | 334 | 3,100 |
| Fidelity Series Government Bond Index Fund (a) | | 19,906 | 203,437 |
| Fidelity Series High Income Fund (a) | | 2,440 | 22,938 |
| Fidelity Series Inflation-Protected Bond Index Fund (a) | | 24,532 | 239,920 |
| Fidelity Series Investment Grade Bond Fund (a) | | 19,365 | 216,506 |
| Fidelity Series Investment Grade Securitized Fund (a) | | 14,990 | 152,751 |
| Fidelity Series Long-Term Treasury Bond Index Fund (a) | | 11,406 | 101,171 |
| Fidelity Series Real Estate Income Fund (a) | | 902 | 9,842 |
| TOTAL BOND FUNDS | | | |
| (Cost $1,088,064) | | | 1,112,407 |
|
| Short-Term Funds - 18.8% | | | |
| Fidelity Cash Central Fund, 2.48% (b) | | 49 | 49 |
| Fidelity Series Government Money Market Fund 2.5% (a)(c) | | 78,685 | 78,685 |
| Fidelity Series Short-Term Credit Fund (a) | | 7,935 | 79,112 |
| Fidelity Series Treasury Bill Index Fund (a) | | 23,479 | 234,552 |
| TOTAL SHORT-TERM FUNDS | | | |
| (Cost $391,838) | | | 392,398 |
| TOTAL INVESTMENT IN SECURITIES - 100.0% | | | |
| (Cost $2,040,581) | | | 2,086,272 |
| NET OTHER ASSETS (LIABILITIES) - 0.0% | | | (580) |
| NET ASSETS - 100% | | | $2,085,692 |
Legend
(a) Affiliated Fund
(b) Affiliated fund that is generally available only to investment companies and other accounts managed by Fidelity Investments. The rate quoted is the annualized seven-day yield of the fund at period end. A complete unaudited listing of the fund's holdings as of its most recent quarter end is available upon request. In addition, each Fidelity Central Fund's financial statements, which are not covered by the Fund's Report of Independent Registered Public Accounting Firm, are available on the SEC's website or upon request.
(c) The rate quoted is the annualized seven-day yield of the fund at period end.
Affiliated Central Funds
Information regarding fiscal year to date income earned by the Fund from investments in Fidelity Central Funds is as follows:
| Fund | Income earned |
| Fidelity Cash Central Fund | $195 |
| Total | $195 |
Amounts in the income column in the above table include any capital gain distributions from underlying funds, which are presented in the corresponding line-item in the Statement of Operations, if applicable.
Affiliated Underlying Funds
Fiscal year to date information regarding the Fund's investments in affiliated Underlying Funds, excluding any Money Market Central Funds, is presented below. Exchanges between classes of the same affiliated Underlying Funds may occur.
| Affiliate | Value, beginning of period | Purchases | Sales Proceeds | Dividend Income | Realized Gain (loss) | Change in Unrealized appreciation (depreciation) | Value, end of period |
| Fidelity Series Blue Chip Growth Fund | $-- | $66,521 | $7,976 | $3,550 | $(1,296) | $2,434 | $59,683 |
| Fidelity Series Canada Fund | -- | 7,159 | 593 | 65 | (43) | 380 | 6,903 |
| Fidelity Series Commodity Strategy Fund | -- | 51,099 | 1,662 | 1,241 | (87) | (565) | 48,785 |
| Fidelity Series Corporate Bond Fund | -- | 147,265 | 3,573 | 2,272 | (15) | 4,427 | 148,104 |
| Fidelity Series Emerging Markets Debt Fund | -- | 14,589 | 327 | 294 | 2 | 374 | 14,638 |
| Fidelity Series Emerging Markets Fund | -- | 9,193 | 416 | 16 | (15) | 369 | 9,131 |
| Fidelity Series Emerging Markets Opportunities Fund | -- | 85,613 | 7,053 | 2,901 | (429) | 4,622 | 82,753 |
| Fidelity Series Floating Rate High Income Fund | -- | 4,045 | 925 | 114 | (26) | 6 | 3,100 |
| Fidelity Series Government Bond Index Fund | -- | 204,708 | 4,916 | 2,020 | (57) | 3,702 | 203,437 |
| Fidelity Series Government Money Market Fund 2.5% | -- | 79,828 | 1,143 | 693 | -- | -- | 78,685 |
| Fidelity Series High Income Fund | -- | 26,909 | 4,481 | 674 | (89) | 599 | 22,938 |
| Fidelity Series Inflation-Protected Bond Index Fund | -- | 239,551 | 2,600 | 2,020 | (34) | 3,003 | 239,920 |
| Fidelity Series International Growth Fund | -- | 60,473 | 5,590 | 1,622 | (561) | 2,630 | 56,952 |
| Fidelity Series International Index Fund | -- | 15,520 | 1,035 | 38 | (59) | 597 | 15,023 |
| Fidelity Series International Small Cap Fund | -- | 16,318 | 1,221 | 609 | (189) | 127 | 15,035 |
| Fidelity Series International Value Fund | -- | 58,969 | 2,279 | 888 | (209) | 103 | 56,584 |
| Fidelity Series Investment Grade Bond Fund | -- | 215,267 | 3,763 | 2,804 | (20) | 5,022 | 216,506 |
| Fidelity Series Investment Grade Securitized Fund | -- | 156,280 | 6,159 | 1,893 | (16) | 2,646 | 152,751 |
| Fidelity Series Large Cap Growth Index Fund | -- | 49,786 | 6,295 | 108 | (398) | 3,650 | 46,743 |
| Fidelity Series Large Cap Stock Fund | -- | 50,954 | 6,113 | 848 | (477) | 2,015 | 46,379 |
| Fidelity Series Large Cap Value Index Fund | -- | 95,130 | 11,049 | 2,115 | (601) | 3,369 | 86,849 |
| Fidelity Series Long-Term Treasury Bond Index Fund | -- | 97,919 | 1,039 | 1,086 | (42) | 4,333 | 101,171 |
| Fidelity Series Real Estate Income Fund | -- | 9,759 | 143 | 271 | (5) | 231 | 9,842 |
| Fidelity Series Short-Term Credit Fund | -- | 79,429 | 1,083 | 815 | (3) | 769 | 79,112 |
| Fidelity Series Small Cap Opportunities Fund | -- | 26,350 | 3,134 | 1,212 | (606) | 558 | 23,168 |
| Fidelity Series Treasury Bill Index Fund | -- | 239,855 | 5,092 | 2,382 | (2) | (209) | 234,552 |
| Fidelity Series Value Discovery Fund | -- | 30,098 | 2,886 | 745 | (232) | 499 | 27,479 |
| | $-- | $2,138,587 | $92,546 | $33,296 | $(5,509) | $45,691 | $2,086,223 |
Amounts in the income column in the above table include any capital gain distributions from underlying funds, which are presented in the corresponding line-item in the Statement of Operations, if applicable.
Investment Valuation
All investments are categorized as Level 1 under the Fair Value Hierarchy. The inputs or methodology used for valuing securities may not be an indication of the risk associated with investing in those securities. For more information on valuation inputs please refer to the Investment Valuation section in the accompanying Notes to Financial Statements.
See accompanying notes which are an integral part of the financial statements.
Fidelity Freedom® Blend 2005 Fund
Financial Statements
Statement of Assets and Liabilities
| | | March 31, 2019 |
| Assets | | |
Investment in securities, at value — See accompanying schedule:
| | |
| Fidelity Central Funds (cost $49) | $49 | |
| Other affiliated issuers (cost $2,040,532) | 2,086,223 | |
| Total Investment in Securities (cost $2,040,581) | | $2,086,272 |
| Cash | | 147 |
| Receivable for investments sold | | 7,401 |
| Receivable for fund shares sold | | 471 |
| Total assets | | 2,094,291 |
| Liabilities | | |
| Payable for investments purchased | $7,872 | |
| Accrued management fee | 562 | |
| Distribution and service plan fees payable | 165 | |
| Total liabilities | | 8,599 |
| Net Assets | | $2,085,692 |
| Net Assets consist of: | | |
| Paid in capital | | $2,031,524 |
| Total distributable earnings (loss) | | 54,168 |
| Net Assets | | $2,085,692 |
| Net Asset Value and Maximum Offering Price | | |
| Class A: | | |
| Net Asset Value and redemption price per share ($187,159 ÷ 18,735 shares) | | $9.99 |
| Maximum offering price per share (100/94.25 of $9.99) | | $10.60 |
| Class M: | | |
| Net Asset Value and redemption price per share ($101,468 ÷ 10,153 shares) | | $9.99 |
| Maximum offering price per share (100/96.50 of $9.99) | | $10.35 |
| Class C: | | |
| Net Asset Value and offering price per share ($101,172 ÷ 10,135 shares)(a) | | $9.98 |
| Fidelity Freedom Blend 2005 Fund: | | |
| Net Asset Value, offering price and redemption price per share ($111,173 ÷ 11,110 shares) | | $10.01 |
| Class K: | | |
| Net Asset Value, offering price and redemption price per share ($101,826 ÷ 10,173 shares) | | $10.01 |
| Class K6: | | |
| Net Asset Value, offering price and redemption price per share ($1,177,415 ÷ 117,613 shares) | | $10.01 |
| Class I: | | |
| Net Asset Value, offering price and redemption price per share ($101,767 ÷ 10,170 shares) | | $10.01 |
| Class Z: | | |
| Net Asset Value, offering price and redemption price per share ($101,826 ÷ 10,173 shares) | | $10.01 |
| Class Z6: | | |
| Net Asset Value, offering price and redemption price per share ($101,886 ÷ 10,176 shares) | | $10.01 |
(a) Redemption price per share is equal to net asset value less any applicable contingent deferred sales charge.
See accompanying notes which are an integral part of the financial statements.
Statement of Operations
| | | For the period
August 31, 2018 (commencement of operations) to
March 31, 2019 |
| Investment Income | | |
| Dividends: | | |
| Affiliated issuers | | $20,228 |
| Income from Fidelity Central Funds | | 195 |
| Total income | | 20,423 |
| Expenses | | |
| Management fee | $2,807 | |
| Distribution and service plan fees | 1,068 | |
| Independent trustees' fees and expenses | 3 | |
| Total expenses | | 3,878 |
| Net investment income (loss) | | 16,545 |
| Realized and Unrealized Gain (Loss) | | |
| Net realized gain (loss) on: | | |
| Investment securities: | | |
| Affiliated issuers | (5,509) | |
| Capital gain distributions from underlying funds: | | |
| Affiliated issuers | 13,068 | |
| Total net realized gain (loss) | | 7,559 |
| Change in net unrealized appreciation (depreciation) on: | | |
| Investment securities: | | |
| Affiliated issuers | 45,691 | |
| Total change in net unrealized appreciation (depreciation) | | 45,691 |
| Net gain (loss) | | 53,250 |
| Net increase (decrease) in net assets resulting from operations | | $69,795 |
See accompanying notes which are an integral part of the financial statements.
Statement of Changes in Net Assets
| | For the period
August 31, 2018 (commencement of operations) to
March 31, 2019 |
| Increase (Decrease) in Net Assets | |
| Operations | |
| Net investment income (loss) | $16,545 |
| Net realized gain (loss) | 7,559 |
| Change in net unrealized appreciation (depreciation) | 45,691 |
| Net increase (decrease) in net assets resulting from operations | 69,795 |
| Distributions to shareholders | (15,628) |
| Total distributions | (15,628) |
| Share transactions - net increase (decrease) | 2,031,525 |
| Total increase (decrease) in net assets | 2,085,692 |
| Net Assets | |
| Beginning of period | – |
| End of period | $2,085,692 |
See accompanying notes which are an integral part of the financial statements.
Financial Highlights
Fidelity Freedom Blend 2005 Fund Class A
| Year ended March 31, | 2019 A |
| Selected Per–Share Data | |
| Net asset value, beginning of period | $10.00 |
| Income from Investment Operations | |
| Net investment income (loss)B | .11 |
| Net realized and unrealized gain (loss) | .04 |
| Total from investment operations | .15 |
| Distributions from net investment income | (.10) |
| Distributions from net realized gain | (.07) |
| Total distributions | (.16)C |
| Net asset value, end of period | $9.99 |
| Total ReturnD,E | 1.62% |
| Ratios to Average Net AssetsF,G | |
| Expenses before reductions | .71%H |
| Expenses net of fee waivers, if any | .71%H |
| Expenses net of all reductions | .71%H |
| Net investment income (loss) | 1.88%H |
| Supplemental Data | |
| Net assets, end of period (000 omitted) | $187 |
| Portfolio turnover rateG | 11%H |
A For the period August 31, 2018 (commencement of operations) to March 31, 2019.
B Calculated based on average shares outstanding during the period.
C Total distributions of $.16 per share is comprised of distributions from net investment income of $.097 and distributions from net realized gain of $.066 per share.
D Total returns for periods of less than one year are not annualized.
E Total returns do not include the effect of the sales charges.
F Expense ratios reflect operating expenses of the class. Expenses before reductions do not reflect amounts reimbursed by the investment adviser or reductions from expense offset arrangements and do not represent the amount paid by the class during periods when reimbursements or reductions occur. Expense ratios before reductions for start-up periods may not be representative of longer-term operating periods. Expenses net of fee waivers reflect expenses after reimbursement by the investment adviser but prior to reductions from expense offset arrangements. Expenses net of all reductions represent the net expenses paid by the class but do not include expenses of the underlying funds in which the Fund invests.
G Amounts do not include the activity of the Underlying Funds.
H Annualized
See accompanying notes which are an integral part of the financial statements.
Fidelity Freedom Blend 2005 Fund Class M
| Year ended March 31, | 2019 A |
| Selected Per–Share Data | |
| Net asset value, beginning of period | $10.00 |
| Income from Investment Operations | |
| Net investment income (loss)B | .09 |
| Net realized and unrealized gain (loss) | .05 |
| Total from investment operations | .14 |
| Distributions from net investment income | (.08) |
| Distributions from net realized gain | (.07) |
| Total distributions | (.15) |
| Net asset value, end of period | $9.99 |
| Total ReturnC,D | 1.43% |
| Ratios to Average Net AssetsE,F | |
| Expenses before reductions | .96%G |
| Expenses net of fee waivers, if any | .96%G |
| Expenses net of all reductions | .96%G |
| Net investment income (loss) | 1.63%G |
| Supplemental Data | |
| Net assets, end of period (000 omitted) | $101 |
| Portfolio turnover rateF | 11%G |
A For the period August 31, 2018 (commencement of operations) to March 31, 2019.
B Calculated based on average shares outstanding during the period.
C Total returns for periods of less than one year are not annualized.
D Total returns do not include the effect of the sales charges.
E Expense ratios reflect operating expenses of the class. Expenses before reductions do not reflect amounts reimbursed by the investment adviser or reductions from expense offset arrangements and do not represent the amount paid by the class during periods when reimbursements or reductions occur. Expense ratios before reductions for start-up periods may not be representative of longer-term operating periods. Expenses net of fee waivers reflect expenses after reimbursement by the investment adviser but prior to reductions from expense offset arrangements. Expenses net of all reductions represent the net expenses paid by the class but do not include expenses of the underlying funds in which the Fund invests.
F Amounts do not include the activity of the Underlying Funds.
G Annualized
See accompanying notes which are an integral part of the financial statements.
Fidelity Freedom Blend 2005 Fund Class C
| | |
| Year ended March 31, | 2019 A |
| Selected Per–Share Data | |
| Net asset value, beginning of period | $10.00 |
| Income from Investment Operations | |
| Net investment income (loss)B | .06 |
| Net realized and unrealized gain (loss) | .05 |
| Total from investment operations | .11 |
| Distributions from net investment income | (.06) |
| Distributions from net realized gain | (.07) |
| Total distributions | (.13) |
| Net asset value, end of period | $9.98 |
| Total ReturnC,D | 1.15% |
| Ratios to Average Net AssetsE,F | |
| Expenses before reductions | 1.46%G |
| Expenses net of fee waivers, if any | 1.46%G |
| Expenses net of all reductions | 1.46%G |
| Net investment income (loss) | 1.13%G |
| Supplemental Data | |
| Net assets, end of period (000 omitted) | $101 |
| Portfolio turnover rateF | 11%G |
A For the period August 31, 2018 (commencement of operations) to March 31, 2019.
B Calculated based on average shares outstanding during the period.
C Total returns for periods of less than one year are not annualized.
D Total returns do not include the effect of the contingent deferred sales charge.
E Expense ratios reflect operating expenses of the class. Expenses before reductions do not reflect amounts reimbursed by the investment adviser or reductions from expense offset arrangements and do not represent the amount paid by the class during periods when reimbursements or reductions occur. Expense ratios before reductions for start-up periods may not be representative of longer-term operating periods. Expenses net of fee waivers reflect expenses after reimbursement by the investment adviser but prior to reductions from expense offset arrangements. Expenses net of all reductions represent the net expenses paid by the class but do not include expenses of the underlying funds in which the Fund invests.
F Amounts do not include the activity of the Underlying Funds.
G Annualized
See accompanying notes which are an integral part of the financial statements.
Fidelity Freedom Blend 2005 Fund
| | |
| Year ended March 31, | 2019 A |
| Selected Per–Share Data | |
| Net asset value, beginning of period | $10.00 |
| Income from Investment Operations | |
| Net investment income (loss)B | .12 |
| Net realized and unrealized gain (loss) | .05 |
| Total from investment operations | .17 |
| Distributions from net investment income | (.10) |
| Distributions from net realized gain | (.07) |
| Total distributions | (.16)C |
| Net asset value, end of period | $10.01 |
| Total ReturnD | 1.80% |
| Ratios to Average Net AssetsE,F | |
| Expenses before reductions | .46%G |
| Expenses net of fee waivers, if any | .46%G |
| Expenses net of all reductions | .46%G |
| Net investment income (loss) | 2.13%G |
| Supplemental Data | |
| Net assets, end of period (000 omitted) | $111 |
| Portfolio turnover rateF | 11%G |
A For the period August 31, 2018 (commencement of operations) to March 31, 2019.
B Calculated based on average shares outstanding during the period.
C Total distributions of $.16 per share is comprised of distributions from net investment income of $.095 and distributions from net realized gain of $.066 per share.
D Total returns for periods of less than one year are not annualized.
E Expense ratios reflect operating expenses of the class. Expenses before reductions do not reflect amounts reimbursed by the investment adviser or reductions from expense offset arrangements and do not represent the amount paid by the class during periods when reimbursements or reductions occur. Expense ratios before reductions for start-up periods may not be representative of longer-term operating periods. Expenses net of fee waivers reflect expenses after reimbursement by the investment adviser but prior to reductions from expense offset arrangements. Expenses net of all reductions represent the net expenses paid by the class but do not include expenses of the underlying funds in which the Fund invests.
F Amounts do not include the activity of the Underlying Funds.
G Annualized
See accompanying notes which are an integral part of the financial statements.
Fidelity Freedom Blend 2005 Fund Class K
| Year ended March 31, | 2019 A |
| Selected Per–Share Data | |
| Net asset value, beginning of period | $10.00 |
| Income from Investment Operations | |
| Net investment income (loss)B | .13 |
| Net realized and unrealized gain (loss) | .04 |
| Total from investment operations | .17 |
| Distributions from net investment income | (.10) |
| Distributions from net realized gain | (.07) |
| Total distributions | (.16)C |
| Net asset value, end of period | $10.01 |
| Total ReturnD | 1.83% |
| Ratios to Average Net AssetsE,F | |
| Expenses before reductions | .36%G |
| Expenses net of fee waivers, if any | .36%G |
| Expenses net of all reductions | .36%G |
| Net investment income (loss) | 2.23%G |
| Supplemental Data | |
| Net assets, end of period (000 omitted) | $102 |
| Portfolio turnover rateF | 11%G |
A For the period August 31, 2018 (commencement of operations) to March 31, 2019.
B Calculated based on average shares outstanding during the period.
C Total distributions of $.16 per share is comprised of distributions from net investment income of $.098 and distributions from net realized gain of $.066 per share.
D Total returns for periods of less than one year are not annualized.
E Expense ratios reflect operating expenses of the class. Expenses before reductions do not reflect amounts reimbursed by the investment adviser or reductions from expense offset arrangements and do not represent the amount paid by the class during periods when reimbursements or reductions occur. Expense ratios before reductions for start-up periods may not be representative of longer-term operating periods. Expenses net of fee waivers reflect expenses after reimbursement by the investment adviser but prior to reductions from expense offset arrangements. Expenses net of all reductions represent the net expenses paid by the class but do not include expenses of the underlying funds in which the Fund invests.
F Amounts do not include the activity of the Underlying Funds.
G Annualized
See accompanying notes which are an integral part of the financial statements.
Fidelity Freedom Blend 2005 Fund Class K6
| Year ended March 31, | 2019 A |
| Selected Per–Share Data | |
| Net asset value, beginning of period | $10.00 |
| Income from Investment Operations | |
| Net investment income (loss)B | .13 |
| Net realized and unrealized gain (loss) | .05 |
| Total from investment operations | .18 |
| Distributions from net investment income | (.10) |
| Distributions from net realized gain | (.07) |
| Total distributions | (.17) |
| Net asset value, end of period | $10.01 |
| Total ReturnC | 1.86% |
| Ratios to Average Net AssetsD,E | |
| Expenses before reductions | .26%F |
| Expenses net of fee waivers, if any | .26%F |
| Expenses net of all reductions | .26%F |
| Net investment income (loss) | 2.32%F |
| Supplemental Data | |
| Net assets, end of period (000 omitted) | $1,177 |
| Portfolio turnover rateE | 11%F |
A For the period August 31, 2018 (commencement of operations) to March 31, 2019.
B Calculated based on average shares outstanding during the period.
C Total returns for periods of less than one year are not annualized.
D Expense ratios reflect operating expenses of the class. Expenses before reductions do not reflect amounts reimbursed by the investment adviser or reductions from expense offset arrangements and do not represent the amount paid by the class during periods when reimbursements or reductions occur. Expenses net of fee waivers reflect expenses after reimbursement by the investment adviser but prior to reductions from expense offset arrangements. Expenses net of all reductions represent the net expenses paid by the class but do not include expenses of the underlying funds in which the Fund invests.
E Amounts do not include the activity of the Underlying Funds.
F Annualized
See accompanying notes which are an integral part of the financial statements.
Fidelity Freedom Blend 2005 Fund Class I
| | |
| Year ended March 31, | 2019 A |
| Selected Per–Share Data | |
| Net asset value, beginning of period | $10.00 |
| Income from Investment Operations | |
| Net investment income (loss)B | .12 |
| Net realized and unrealized gain (loss) | .05 |
| Total from investment operations | .17 |
| Distributions from net investment income | (.10) |
| Distributions from net realized gain | (.07) |
| Total distributions | (.16)C |
| Net asset value, end of period | $10.01 |
| Total ReturnD | 1.80% |
| Ratios to Average Net AssetsE,F | |
| Expenses before reductions | .46%G |
| Expenses net of fee waivers, if any | .46%G |
| Expenses net of all reductions | .46%G |
| Net investment income (loss) | 2.13%G |
| Supplemental Data | |
| Net assets, end of period (000 omitted) | $102 |
| Portfolio turnover rateF | 11%G |
A For the period August 31, 2018 (commencement of operations) to March 31, 2019.
B Calculated based on average shares outstanding during the period.
C Total distributions of $.16 per share is comprised of distributions from net investment income of $.095 and distributions from net realized gain of $.066 per share.
D Total returns for periods of less than one year are not annualized.
E Expense ratios reflect operating expenses of the class. Expenses before reductions do not reflect amounts reimbursed by the investment adviser or reductions from expense offset arrangements and do not represent the amount paid by the class during periods when reimbursements or reductions occur. Expense ratios before reductions for start-up periods may not be representative of longer-term operating periods. Expenses net of fee waivers reflect expenses after reimbursement by the investment adviser but prior to reductions from expense offset arrangements. Expenses net of all reductions represent the net expenses paid by the class but do not include expenses of the underlying funds in which the Fund invests.
F Amounts do not include the activity of the Underlying Funds.
G Annualized
See accompanying notes which are an integral part of the financial statements.
Fidelity Freedom Blend 2005 Fund Class Z
| Year ended March 31, | 2019 A |
| Selected Per–Share Data | |
| Net asset value, beginning of period | $10.00 |
| Income from Investment Operations | |
| Net investment income (loss)B | .13 |
| Net realized and unrealized gain (loss) | .04 |
| Total from investment operations | .17 |
| Distributions from net investment income | (.10) |
| Distributions from net realized gain | (.07) |
| Total distributions | (.16)C |
| Net asset value, end of period | $10.01 |
| Total ReturnD | 1.83% |
| Ratios to Average Net AssetsE,F | |
| Expenses before reductions | .36%G |
| Expenses net of fee waivers, if any | .36%G |
| Expenses net of all reductions | .36%G |
| Net investment income (loss) | 2.23%G |
| Supplemental Data | |
| Net assets, end of period (000 omitted) | $102 |
| Portfolio turnover rateF | 11%G |
A For the period August 31, 2018 (commencement of operations) to March 31, 2019.
B Calculated based on average shares outstanding during the period.
C Total distributions of $.16 per share is comprised of distributions from net investment income of $.098 and distributions from net realized gain of $.066 per share.
D Total returns for periods of less than one year are not annualized.
E Expense ratios reflect operating expenses of the class. Expenses before reductions do not reflect amounts reimbursed by the investment adviser or reductions from expense offset arrangements and do not represent the amount paid by the class during periods when reimbursements or reductions occur. Expense ratios before reductions for start-up periods may not be representative of longer-term operating periods. Expenses net of fee waivers reflect expenses after reimbursement by the investment adviser but prior to reductions from expense offset arrangements. Expenses net of all reductions represent the net expenses paid by the class but do not include expenses of the underlying funds in which the Fund invests.
F Amounts do not include the activity of the Underlying Funds.
G Annualized
See accompanying notes which are an integral part of the financial statements.
Fidelity Freedom Blend 2005 Fund Class Z6
| Year ended March 31, | 2019 A |
| Selected Per–Share Data | |
| Net asset value, beginning of period | $10.00 |
| Income from Investment Operations | |
| Net investment income (loss)B | .13 |
| Net realized and unrealized gain (loss) | .05 |
| Total from investment operations | .18 |
| Distributions from net investment income | (.10) |
| Distributions from net realized gain | (.07) |
| Total distributions | (.17) |
| Net asset value, end of period | $10.01 |
| Total ReturnC | 1.86% |
| Ratios to Average Net AssetsD,E | |
| Expenses before reductions | .26%F |
| Expenses net of fee waivers, if any | .26%F |
| Expenses net of all reductions | .26%F |
| Net investment income (loss) | 2.33%F |
| Supplemental Data | |
| Net assets, end of period (000 omitted) | $102 |
| Portfolio turnover rateE | 11%F |
A For the period August 31, 2018 (commencement of operations) to March 31, 2019.
B Calculated based on average shares outstanding during the period.
C Total returns for periods of less than one year are not annualized.
D Expense ratios reflect operating expenses of the class. Expenses before reductions do not reflect amounts reimbursed by the investment adviser or reductions from expense offset arrangements and do not represent the amount paid by the class during periods when reimbursements or reductions occur. Expenses net of fee waivers reflect expenses after reimbursement by the investment adviser but prior to reductions from expense offset arrangements. Expenses net of all reductions represent the net expenses paid by the class but do not include expenses of the underlying funds in which the Fund invests.
E Amounts do not include the activity of the Underlying Funds.
F Annualized
See accompanying notes which are an integral part of the financial statements.
Fidelity Freedom® Blend 2010 Fund
Investment Summary (Unaudited)
The information in the following tables is based on the direct investments of the Fund.
Top Holdings as of March 31, 2019
| | % of fund's net assets |
| Fidelity Series Inflation-Protected Bond Index Fund | 9.4 |
| Fidelity Series Investment Grade Bond Fund | 9.3 |
| Fidelity Series Treasury Bill Index Fund | 8.9 |
| Fidelity Series Government Bond Index Fund | 8.7 |
| Fidelity Series Investment Grade Securitized Fund | 6.6 |
| Fidelity Series Corporate Bond Fund | 6.4 |
| Fidelity Series Large Cap Value Index Fund | 6.1 |
| Fidelity Series Long-Term Treasury Bond Index Fund | 5.0 |
| Fidelity Series Emerging Markets Opportunities Fund | 4.9 |
| Fidelity Series Blue Chip Growth Fund | 4.2 |
| | 69.5 |
Asset Allocation (% of fund's net assets)
| Period end |
| | Domestic Equity Funds | 22.7% |
| | International Equity Funds | 14.6% |
| | Bond Funds | 47.8% |
| | Short-Term Funds | 14.9% |

Domestic Equity Funds category includes Fidelity Series Commodity Strategy Fund which invests in commodity-related investments.
Fidelity Freedom® Blend 2010 Fund
Schedule of Investments March 31, 2019
Showing Percentage of Net Assets
| Domestic Equity Funds - 22.7% | | | |
| | | Shares | Value |
| Fidelity Series Blue Chip Growth Fund (a) | | 7,479 | $110,318 |
| Fidelity Series Commodity Strategy Fund (a) | | 13,067 | 62,328 |
| Fidelity Series Large Cap Growth Index Fund (a) | | 8,568 | 86,369 |
| Fidelity Series Large Cap Stock Fund (a) | | 5,869 | 85,985 |
| Fidelity Series Large Cap Value Index Fund (a) | | 12,975 | 161,014 |
| Fidelity Series Small Cap Opportunities Fund (a) | | 3,191 | 42,953 |
| Fidelity Series Value Discovery Fund (a) | | 4,079 | 50,945 |
| TOTAL DOMESTIC EQUITY FUNDS | | | |
| (Cost $558,467) | | | 599,912 |
|
| International Equity Funds - 14.6% | | | |
| Fidelity Series Canada Fund (a) | | 1,067 | 11,003 |
| Fidelity Series Emerging Markets Fund (a) | | 1,442 | 14,121 |
| Fidelity Series Emerging Markets Opportunities Fund (a) | | 6,906 | 127,972 |
| Fidelity Series International Growth Fund (a) | | 6,089 | 92,485 |
| Fidelity Series International Index Fund (a) | | 2,465 | 24,205 |
| Fidelity Series International Small Cap Fund (a) | | 1,554 | 24,137 |
| Fidelity Series International Value Fund (a) | | 9,811 | 91,246 |
| TOTAL INTERNATIONAL EQUITY FUNDS | | | |
| (Cost $360,091) | | | 385,169 |
|
| Bond Funds - 47.8% | | | |
| Fidelity Series Corporate Bond Fund (a) | | 16,588 | 168,370 |
| Fidelity Series Emerging Markets Debt Fund (a) | | 1,934 | 18,543 |
| Fidelity Series Floating Rate High Income Fund (a) | | 424 | 3,929 |
| Fidelity Series Government Bond Index Fund (a) | | 22,618 | 231,155 |
| Fidelity Series High Income Fund (a) | | 3,037 | 28,548 |
| Fidelity Series Inflation-Protected Bond Index Fund (a) | | 25,443 | 248,837 |
| Fidelity Series Investment Grade Bond Fund (a) | | 22,015 | 246,122 |
| Fidelity Series Investment Grade Securitized Fund (a) | | 17,041 | 173,652 |
| Fidelity Series Long-Term Treasury Bond Index Fund (a) | | 15,046 | 133,456 |
| Fidelity Series Real Estate Income Fund (a) | | 1,143 | 12,475 |
| TOTAL BOND FUNDS | | | |
| (Cost $1,233,242) | | | 1,265,087 |
|
| Short-Term Funds - 14.9% | | | |
| Fidelity Cash Central Fund, 2.48% (b) | | 49 | 49 |
| Fidelity Series Government Money Market Fund 2.5% (a)(c) | | 79,094 | 79,094 |
| Fidelity Series Short-Term Credit Fund (a) | | 7,976 | 79,524 |
| Fidelity Series Treasury Bill Index Fund (a) | | 23,532 | 235,082 |
| TOTAL SHORT-TERM FUNDS | | | |
| (Cost $393,155) | | | 393,749 |
| TOTAL INVESTMENT IN SECURITIES - 100.0% | | | |
| (Cost $2,544,955) | | | 2,643,917 |
| NET OTHER ASSETS (LIABILITIES) - 0.0% | | | (734) |
| NET ASSETS - 100% | | | $2,643,183 |
Legend
(a) Affiliated Fund
(b) Affiliated fund that is generally available only to investment companies and other accounts managed by Fidelity Investments. The rate quoted is the annualized seven-day yield of the fund at period end. A complete unaudited listing of the fund's holdings as of its most recent quarter end is available upon request. In addition, each Fidelity Central Fund's financial statements, which are not covered by the Fund's Report of Independent Registered Public Accounting Firm, are available on the SEC's website or upon request.
(c) The rate quoted is the annualized seven-day yield of the fund at period end.
Affiliated Central Funds
Information regarding fiscal year to date income earned by the Fund from investments in Fidelity Central Funds is as follows:
| Fund | Income earned |
| Fidelity Cash Central Fund | $195 |
| Total | $195 |
Amounts in the income column in the above table include any capital gain distributions from underlying funds, which are presented in the corresponding line-item in the Statement of Operations, if applicable.
Affiliated Underlying Funds
Fiscal year to date information regarding the Fund's investments in affiliated Underlying Funds, excluding any Money Market Central Funds, is presented below. Exchanges between classes of the same affiliated Underlying Funds may occur.
| Affiliate | Value, beginning of period | Purchases | Sales Proceeds | Dividend Income | Realized Gain (loss) | Change in Unrealized appreciation (depreciation) | Value, end of period |
| Fidelity Series Blue Chip Growth Fund | $-- | $153,447 | $47,296 | $5,148 | $(6,353) | $10,520 | $110,318 |
| Fidelity Series Canada Fund | -- | 14,765 | 4,264 | 92 | (175) | 677 | 11,003 |
| Fidelity Series Commodity Strategy Fund | -- | 81,183 | 18,288 | 1,241 | (1,515) | 948 | 62,328 |
| Fidelity Series Corporate Bond Fund | -- | 219,946 | 56,954 | 2,323 | (242) | 5,620 | 168,370 |
| Fidelity Series Emerging Markets Debt Fund | -- | 23,460 | 5,345 | 337 | 55 | 373 | 18,543 |
| Fidelity Series Emerging Markets Fund | -- | 18,526 | 5,059 | 22 | (155) | 809 | 14,121 |
| Fidelity Series Emerging Markets Opportunities Fund | -- | 170,161 | 49,495 | 3,983 | (2,693) | 9,999 | 127,972 |
| Fidelity Series Floating Rate High Income Fund | -- | 6,146 | 2,189 | 127 | (57) | 29 | 3,929 |
| Fidelity Series Government Bond Index Fund | -- | 305,197 | 78,318 | 2,068 | (108) | 4,384 | 231,155 |
| Fidelity Series Government Money Market Fund 2.5% | -- | 105,480 | 26,386 | 631 | -- | -- | 79,094 |
| Fidelity Series High Income Fund | -- | 44,845 | 16,905 | 771 | (290) | 898 | 28,548 |
| Fidelity Series Inflation-Protected Bond Index Fund | -- | 326,880 | 81,723 | 1,738 | (1,248) | 4,928 | 248,837 |
| Fidelity Series International Growth Fund | -- | 125,949 | 37,225 | 2,343 | (3,453) | 7,214 | 92,485 |
| Fidelity Series International Index Fund | -- | 32,546 | 9,269 | 53 | (455) | 1,383 | 24,205 |
| Fidelity Series International Small Cap Fund | -- | 33,611 | 9,601 | 880 | (1,234) | 1,361 | 24,137 |
| Fidelity Series International Value Fund | -- | 123,715 | 32,615 | 1,289 | (3,489) | 3,635 | 91,246 |
| Fidelity Series Investment Grade Bond Fund | -- | 322,415 | 82,245 | 2,880 | (5) | 5,957 | 246,122 |
| Fidelity Series Investment Grade Securitized Fund | -- | 232,629 | 62,086 | 1,940 | 132 | 2,977 | 173,652 |
| Fidelity Series Large Cap Growth Index Fund | -- | 116,626 | 36,831 | 171 | (2,007) | 8,581 | 86,369 |
| Fidelity Series Large Cap Stock Fund | -- | 118,694 | 35,842 | 1,356 | (2,967) | 6,100 | 85,985 |
| Fidelity Series Large Cap Value Index Fund | -- | 222,334 | 66,529 | 3,560 | (4,113) | 9,322 | 161,014 |
| Fidelity Series Long-Term Treasury Bond Index Fund | -- | 170,498 | 43,012 | 1,295 | (216) | 6,186 | 133,456 |
| Fidelity Series Real Estate Income Fund | -- | 16,257 | 4,110 | 300 | (165) | 493 | 12,475 |
| Fidelity Series Short-Term Credit Fund | -- | 105,053 | 26,333 | 740 | 29 | 775 | 79,524 |
| Fidelity Series Small Cap Opportunities Fund | -- | 60,851 | 18,531 | 1,768 | (2,933) | 3,566 | 42,953 |
| Fidelity Series Treasury Bill Index Fund | -- | 316,711 | 81,434 | 2,173 | (14) | (181) | 235,082 |
| Fidelity Series Value Discovery Fund | -- | 70,368 | 19,978 | 1,210 | (1,853) | 2,408 | 50,945 |
| | $-- | $3,538,293 | $957,863 | $40,439 | $(35,524) | $98,962 | $2,643,868 |
Amounts in the income column in the above table include any capital gain distributions from underlying funds, which are presented in the corresponding line-item in the Statement of Operations, if applicable.
Investment Valuation
All investments are categorized as Level 1 under the Fair Value Hierarchy. The inputs or methodology used for valuing securities may not be an indication of the risk associated with investing in those securities. For more information on valuation inputs please refer to the Investment Valuation section in the accompanying Notes to Financial Statements.
See accompanying notes which are an integral part of the financial statements.
Fidelity Freedom® Blend 2010 Fund
Financial Statements
Statement of Assets and Liabilities
| | | March 31, 2019 |
| Assets | | |
Investment in securities, at value — See accompanying schedule:
| | |
| Fidelity Central Funds (cost $49) | $49 | |
| Other affiliated issuers (cost $2,544,906) | 2,643,868 | |
| Total Investment in Securities (cost $2,544,955) | | $2,643,917 |
| Cash | | 147 |
| Receivable for investments sold | | 9,914 |
| Receivable for fund shares sold | | 25 |
| Total assets | | 2,654,003 |
| Liabilities | | |
| Payable for investments purchased | $9,940 | |
| Accrued management fee | 710 | |
| Distribution and service plan fees payable | 170 | |
| Total liabilities | | 10,820 |
| Net Assets | | $2,643,183 |
| Net Assets consist of: | | |
| Paid in capital | | $2,562,028 |
| Total distributable earnings (loss) | | 81,155 |
| Net Assets | | $2,643,183 |
| Net Asset Value and Maximum Offering Price | | |
| Class A: | | |
| Net Asset Value and redemption price per share ($165,881 ÷ 16,711 shares) | | $9.93 |
| Maximum offering price per share (100/94.25 of $9.93) | | $10.54 |
| Class M: | | |
| Net Asset Value and redemption price per share ($126,040 ÷ 12,702 shares) | | $9.92 |
| Maximum offering price per share (100/96.50 of $9.92) | | $10.28 |
| Class C: | | |
| Net Asset Value and offering price per share ($100,766 ÷ 10,162 shares)(a) | | $9.92 |
| Fidelity Freedom Blend 2010 Fund: | | |
| Net Asset Value, offering price and redemption price per share ($147,912 ÷ 14,883 shares) | | $9.94 |
| Class K: | | |
| Net Asset Value, offering price and redemption price per share ($101,419 ÷ 10,199 shares) | | $9.94 |
| Class K6: | | |
| Net Asset Value, offering price and redemption price per share ($1,696,909 ÷ 170,627 shares) | | $9.95 |
| Class I: | | |
| Net Asset Value, offering price and redemption price per share ($101,359 ÷ 10,196 shares) | | $9.94 |
| Class Z: | | |
| Net Asset Value, offering price and redemption price per share ($101,419 ÷ 10,199 shares) | | $9.94 |
| Class Z6: | | |
| Net Asset Value, offering price and redemption price per share ($101,478 ÷ 10,203 shares) | | $9.95 |
(a) Redemption price per share is equal to net asset value less any applicable contingent deferred sales charge.
See accompanying notes which are an integral part of the financial statements.
Statement of Operations
| | | For the period
August 31, 2018 (commencement of operations) to
March 31, 2019 |
| Investment Income | | |
| Dividends: | | |
| Affiliated issuers | | $22,661 |
| Income from Fidelity Central Funds | | 195 |
| Total income | | 22,856 |
| Expenses | | |
| Management fee | $3,243 | |
| Distribution and service plan fees | 1,094 | |
| Independent trustees' fees and expenses | 3 | |
| Total expenses | | 4,340 |
| Net investment income (loss) | | 18,516 |
| Realized and Unrealized Gain (Loss) | | |
| Net realized gain (loss) on: | | |
| Investment securities: | | |
| Affiliated issuers | (35,524) | |
| Capital gain distributions from underlying funds: | | |
| Affiliated issuers | 17,778 | |
| Total net realized gain (loss) | | (17,746) |
| Change in net unrealized appreciation (depreciation) on: | | |
| Investment securities: | | |
| Affiliated issuers | 98,962 | |
| Total change in net unrealized appreciation (depreciation) | | 98,962 |
| Net gain (loss) | | 81,216 |
| Net increase (decrease) in net assets resulting from operations | | $99,732 |
See accompanying notes which are an integral part of the financial statements.
Statement of Changes in Net Assets
| | For the period
August 31, 2018 (commencement of operations) to
March 31, 2019 |
| Increase (Decrease) in Net Assets | |
| Operations | |
| Net investment income (loss) | $18,516 |
| Net realized gain (loss) | (17,746) |
| Change in net unrealized appreciation (depreciation) | 98,962 |
| Net increase (decrease) in net assets resulting from operations | 99,732 |
| Distributions to shareholders | (18,577) |
| Total distributions | (18,577) |
| Share transactions - net increase (decrease) | 2,562,028 |
| Total increase (decrease) in net assets | 2,643,183 |
| Net Assets | |
| Beginning of period | – |
| End of period | $2,643,183 |
See accompanying notes which are an integral part of the financial statements.
Financial Highlights
Fidelity Freedom Blend 2010 Fund Class A
| Year ended March 31, | 2019 A |
| Selected Per–Share Data | |
| Net asset value, beginning of period | $10.00 |
| Income from Investment Operations | |
| Net investment income (loss)B | .10 |
| Net realized and unrealized gain (loss) | .01 |
| Total from investment operations | .11 |
| Distributions from net investment income | (.11) |
| Distributions from net realized gain | (.08) |
| Total distributions | (.18)C |
| Net asset value, end of period | $9.93 |
| Total ReturnD,E | 1.24% |
| Ratios to Average Net AssetsF,G | |
| Expenses before reductions | .72%H |
| Expenses net of fee waivers, if any | .72%H |
| Expenses net of all reductions | .72%H |
| Net investment income (loss) | 1.81%H |
| Supplemental Data | |
| Net assets, end of period (000 omitted) | $166 |
| Portfolio turnover rateG | 98%H |
A For the period August 31, 2018 (commencement of operations) to March 31, 2019.
B Calculated based on average shares outstanding during the period.
C Total distributions of $.18 per share is comprised of distributions from net investment income of $.106 and distributions from net realized gain of $.076 per share.
D Total returns for periods of less than one year are not annualized.
E Total returns do not include the effect of the sales charges.
F Expense ratios reflect operating expenses of the class. Expenses before reductions do not reflect amounts reimbursed by the investment adviser or reductions from expense offset arrangements and do not represent the amount paid by the class during periods when reimbursements or reductions occur. Expense ratios before reductions for start-up periods may not be representative of longer-term operating periods. Expenses net of fee waivers reflect expenses after reimbursement by the investment adviser but prior to reductions from expense offset arrangements. Expenses net of all reductions represent the net expenses paid by the class but do not include expenses of the underlying funds in which the Fund invests.
G Amounts do not include the activity of the Underlying Funds.
H Annualized
See accompanying notes which are an integral part of the financial statements.
Fidelity Freedom Blend 2010 Fund Class M
| Year ended March 31, | 2019 A |
| Selected Per–Share Data | |
| Net asset value, beginning of period | $10.00 |
| Income from Investment Operations | |
| Net investment income (loss)B | .09 |
| Net realized and unrealized gain (loss) | –C |
| Total from investment operations | .09 |
| Distributions from net investment income | (.10) |
| Distributions from net realized gain | (.08) |
| Total distributions | (.17)D |
| Net asset value, end of period | $9.92 |
| Total ReturnE,F | 1.03% |
| Ratios to Average Net AssetsG,H | |
| Expenses before reductions | .97%I |
| Expenses net of fee waivers, if any | .97%I |
| Expenses net of all reductions | .97%I |
| Net investment income (loss) | 1.56%I |
| Supplemental Data | |
| Net assets, end of period (000 omitted) | $126 |
| Portfolio turnover rateH | 98%I |
A For the period August 31, 2018 (commencement of operations) to March 31, 2019.
B Calculated based on average shares outstanding during the period.
C Amount represents less than $.005 per share.
D Total distributions of $.17 per share is comprised of distributions from net investment income of $.096 and distributions from net realized gain of $.076 per share.
E Total returns for periods of less than one year are not annualized.
F Total returns do not include the effect of the sales charges.
G Expense ratios reflect operating expenses of the class. Expenses before reductions do not reflect amounts reimbursed by the investment adviser or reductions from expense offset arrangements and do not represent the amount paid by the class during periods when reimbursements or reductions occur. Expense ratios before reductions for start-up periods may not be representative of longer-term operating periods. Expenses net of fee waivers reflect expenses after reimbursement by the investment adviser but prior to reductions from expense offset arrangements. Expenses net of all reductions represent the net expenses paid by the class but do not include expenses of the underlying funds in which the Fund invests.
H Amounts do not include the activity of the Underlying Funds.
I Annualized
See accompanying notes which are an integral part of the financial statements.
Fidelity Freedom Blend 2010 Fund Class C
| Year ended March 31, | 2019 A |
| Selected Per–Share Data | |
| Net asset value, beginning of period | $10.00 |
| Income from Investment Operations | |
| Net investment income (loss)B | .06 |
| Net realized and unrealized gain (loss) | .01 |
| Total from investment operations | .07 |
| Distributions from net investment income | (.08) |
| Distributions from net realized gain | (.08) |
| Total distributions | (.15)C |
| Net asset value, end of period | $9.92 |
| Total ReturnD,E | .81% |
| Ratios to Average Net AssetsF,G | |
| Expenses before reductions | 1.47%H |
| Expenses net of fee waivers, if any | 1.47%H |
| Expenses net of all reductions | 1.47%H |
| Net investment income (loss) | 1.06%H |
| Supplemental Data | |
| Net assets, end of period (000 omitted) | $101 |
| Portfolio turnover rateG | 98%H |
A For the period August 31, 2018 (commencement of operations) to March 31, 2019.
B Calculated based on average shares outstanding during the period.
C Total distributions of $.15 per share is comprised of distributions from net investment income of $.075 and distributions from net realized gain of $.076 per share.
D Total returns for periods of less than one year are not annualized.
E Total returns do not include the effect of the contingent deferred sales charge.
F Expense ratios reflect operating expenses of the class. Expenses before reductions do not reflect amounts reimbursed by the investment adviser or reductions from expense offset arrangements and do not represent the amount paid by the class during periods when reimbursements or reductions occur. Expense ratios before reductions for start-up periods may not be representative of longer-term operating periods. Expenses net of fee waivers reflect expenses after reimbursement by the investment adviser but prior to reductions from expense offset arrangements. Expenses net of all reductions represent the net expenses paid by the class but do not include expenses of the underlying funds in which the Fund invests.
G Amounts do not include the activity of the Underlying Funds.
H Annualized
See accompanying notes which are an integral part of the financial statements.
Fidelity Freedom Blend 2010 Fund
| Year ended March 31, | 2019 A |
| Selected Per–Share Data | |
| Net asset value, beginning of period | $10.00 |
| Income from Investment Operations | |
| Net investment income (loss)B | .12 |
| Net realized and unrealized gain (loss) | .01 |
| Total from investment operations | .13 |
| Distributions from net investment income | (.11) |
| Distributions from net realized gain | (.08) |
| Total distributions | (.19) |
| Net asset value, end of period | $9.94 |
| Total ReturnC | 1.37% |
| Ratios to Average Net AssetsD,E | |
| Expenses before reductions | .47%F |
| Expenses net of fee waivers, if any | .47%F |
| Expenses net of all reductions | .47%F |
| Net investment income (loss) | 2.06%F |
| Supplemental Data | |
| Net assets, end of period (000 omitted) | $148 |
| Portfolio turnover rateE | 98%F |
A For the period August 31, 2018 (commencement of operations) to March 31, 2019.
B Calculated based on average shares outstanding during the period.
C Total returns for periods of less than one year are not annualized.
D Expense ratios reflect operating expenses of the class. Expenses before reductions do not reflect amounts reimbursed by the investment adviser or reductions from expense offset arrangements and do not represent the amount paid by the class during periods when reimbursements or reductions occur. Expense ratios before reductions for start-up periods may not be representative of longer-term operating periods. Expenses net of fee waivers reflect expenses after reimbursement by the investment adviser but prior to reductions from expense offset arrangements. Expenses net of all reductions represent the net expenses paid by the class but do not include expenses of the underlying funds in which the Fund invests.
E Amounts do not include the activity of the Underlying Funds.
F Annualized
See accompanying notes which are an integral part of the financial statements.
Fidelity Freedom Blend 2010 Fund Class K
| Year ended March 31, | 2019 A |
| Selected Per–Share Data | |
| Net asset value, beginning of period | $10.00 |
| Income from Investment Operations | |
| Net investment income (loss)B | .12 |
| Net realized and unrealized gain (loss) | .01 |
| Total from investment operations | .13 |
| Distributions from net investment income | (.11) |
| Distributions from net realized gain | (.08) |
| Total distributions | (.19) |
| Net asset value, end of period | $9.94 |
| Total ReturnC | 1.38% |
| Ratios to Average Net AssetsD,E | |
| Expenses before reductions | .37%F |
| Expenses net of fee waivers, if any | .37%F |
| Expenses net of all reductions | .37%F |
| Net investment income (loss) | 2.16%F |
| Supplemental Data | |
| Net assets, end of period (000 omitted) | $101 |
| Portfolio turnover rateE | 98%F |
A For the period August 31, 2018 (commencement of operations) to March 31, 2019.
B Calculated based on average shares outstanding during the period.
C Total returns for periods of less than one year are not annualized.
D Expense ratios reflect operating expenses of the class. Expenses before reductions do not reflect amounts reimbursed by the investment adviser or reductions from expense offset arrangements and do not represent the amount paid by the class during periods when reimbursements or reductions occur. Expense ratios before reductions for start-up periods may not be representative of longer-term operating periods. Expenses net of fee waivers reflect expenses after reimbursement by the investment adviser but prior to reductions from expense offset arrangements. Expenses net of all reductions represent the net expenses paid by the class but do not include expenses of the underlying funds in which the Fund invests.
E Amounts do not include the activity of the Underlying Funds.
F Annualized
See accompanying notes which are an integral part of the financial statements.
Fidelity Freedom Blend 2010 Fund Class K6
| Year ended March 31, | 2019 A |
| Selected Per–Share Data | |
| Net asset value, beginning of period | $10.00 |
| Income from Investment Operations | |
| Net investment income (loss)B | .13 |
| Net realized and unrealized gain (loss) | .01 |
| Total from investment operations | .14 |
| Distributions from net investment income | (.11) |
| Distributions from net realized gain | (.08) |
| Total distributions | (.19) |
| Net asset value, end of period | $9.95 |
| Total ReturnC | 1.52% |
| Ratios to Average Net AssetsD,E | |
| Expenses before reductions | .28%F,G |
| Expenses net of fee waivers, if any | .28%F,G |
| Expenses net of all reductions | .28%F,G |
| Net investment income (loss) | 2.26%F |
| Supplemental Data | |
| Net assets, end of period (000 omitted) | $1,697 |
| Portfolio turnover rateE | 98%F |
A For the period August 31, 2018 (commencement of operations) to March 31, 2019.
B Calculated based on average shares outstanding during the period.
C Total returns for periods of less than one year are not annualized.
D Expense ratios reflect operating expenses of the class. Expenses before reductions do not reflect amounts reimbursed by the investment adviser or reductions from expense offset arrangements and do not represent the amount paid by the class during periods when reimbursements or reductions occur. Expenses net of fee waivers reflect expenses after reimbursement by the investment adviser but prior to reductions from expense offset arrangements. Expenses net of all reductions represent the net expenses paid by the class but do not include expenses of the underlying funds in which the Fund invests.
E Amounts do not include the activity of the Underlying Funds.
F Annualized
G On certain classes, the size and fluctuation of net assets and expense amounts may cause ratios to differ from contractual rates.
See accompanying notes which are an integral part of the financial statements.
Fidelity Freedom Blend 2010 Fund Class I
| Year ended March 31, | 2019 A |
| Selected Per–Share Data | |
| Net asset value, beginning of period | $10.00 |
| Income from Investment Operations | |
| Net investment income (loss)B | .12 |
| Net realized and unrealized gain (loss) | –C |
| Total from investment operations | .12 |
| Distributions from net investment income | (.11) |
| Distributions from net realized gain | (.08) |
| Total distributions | (.18)D |
| Net asset value, end of period | $9.94 |
| Total ReturnE | 1.35% |
| Ratios to Average Net AssetsF,G | |
| Expenses before reductions | .47%H |
| Expenses net of fee waivers, if any | .47%H |
| Expenses net of all reductions | .47%H |
| Net investment income (loss) | 2.06%H |
| Supplemental Data | |
| Net assets, end of period (000 omitted) | $101 |
| Portfolio turnover rateG | 98%H |
A For the period August 31, 2018 (commencement of operations) to March 31, 2019.
B Calculated based on average shares outstanding during the period.
C Amount represents less than $.005 per share.
D Total distributions of $.18 per share is comprised of distributions from net investment income of $.107 and distributions from net realized gain of $.076 per share.
E Total returns for periods of less than one year are not annualized.
F Expense ratios reflect operating expenses of the class. Expenses before reductions do not reflect amounts reimbursed by the investment adviser or reductions from expense offset arrangements and do not represent the amount paid by the class during periods when reimbursements or reductions occur. Expense ratios before reductions for start-up periods may not be representative of longer-term operating periods. Expenses net of fee waivers reflect expenses after reimbursement by the investment adviser but prior to reductions from expense offset arrangements. Expenses net of all reductions represent the net expenses paid by the class but do not include expenses of the underlying funds in which the Fund invests.
G Amounts do not include the activity of the Underlying Funds.
H Annualized
See accompanying notes which are an integral part of the financial statements.
Fidelity Freedom Blend 2010 Fund Class Z
| Year ended March 31, | 2019 A |
| Selected Per–Share Data | |
| Net asset value, beginning of period | $10.00 |
| Income from Investment Operations | |
| Net investment income (loss)B | .12 |
| Net realized and unrealized gain (loss) | .01 |
| Total from investment operations | .13 |
| Distributions from net investment income | (.11) |
| Distributions from net realized gain | (.08) |
| Total distributions | (.19) |
| Net asset value, end of period | $9.94 |
| Total ReturnC | 1.38% |
| Ratios to Average Net AssetsD,E | |
| Expenses before reductions | .37%F |
| Expenses net of fee waivers, if any | .37%F |
| Expenses net of all reductions | .37%F |
| Net investment income (loss) | 2.16%F |
| Supplemental Data | |
| Net assets, end of period (000 omitted) | $101 |
| Portfolio turnover rateE | 98%F |
A For the period August 31, 2018 (commencement of operations) to March 31, 2019.
B Calculated based on average shares outstanding during the period.
C Total returns for periods of less than one year are not annualized.
D Expense ratios reflect operating expenses of the class. Expenses before reductions do not reflect amounts reimbursed by the investment adviser or reductions from expense offset arrangements and do not represent the amount paid by the class during periods when reimbursements or reductions occur. Expense ratios before reductions for start-up periods may not be representative of longer-term operating periods. Expenses net of fee waivers reflect expenses after reimbursement by the investment adviser but prior to reductions from expense offset arrangements. Expenses net of all reductions represent the net expenses paid by the class but do not include expenses of the underlying funds in which the Fund invests.
E Amounts do not include the activity of the Underlying Funds.
F Annualized
See accompanying notes which are an integral part of the financial statements.
Fidelity Freedom Blend 2010 Fund Class Z6
| Year ended March 31, | 2019 A |
| Selected Per–Share Data | |
| Net asset value, beginning of period | $10.00 |
| Income from Investment Operations | |
| Net investment income (loss)B | .13 |
| Net realized and unrealized gain (loss) | .01 |
| Total from investment operations | .14 |
| Distributions from net investment income | (.11) |
| Distributions from net realized gain | (.08) |
| Total distributions | (.19) |
| Net asset value, end of period | $9.95 |
| Total ReturnC | 1.52% |
| Ratios to Average Net AssetsD,E | |
| Expenses before reductions | .27%F |
| Expenses net of fee waivers, if any | .27%F |
| Expenses net of all reductions | .27%F |
| Net investment income (loss) | 2.26%F |
| Supplemental Data | |
| Net assets, end of period (000 omitted) | $101 |
| Portfolio turnover rateE | 98%F |
A For the period August 31, 2018 (commencement of operations) to March 31, 2019.
B Calculated based on average shares outstanding during the period.
C Total returns for periods of less than one year are not annualized.
D Expense ratios reflect operating expenses of the class. Expenses before reductions do not reflect amounts reimbursed by the investment adviser or reductions from expense offset arrangements and do not represent the amount paid by the class during periods when reimbursements or reductions occur. Expenses net of fee waivers reflect expenses after reimbursement by the investment adviser but prior to reductions from expense offset arrangements. Expenses net of all reductions represent the net expenses paid by the class but do not include expenses of the underlying funds in which the Fund invests.
E Amounts do not include the activity of the Underlying Funds.
F Annualized
See accompanying notes which are an integral part of the financial statements.
Fidelity Freedom® Blend 2015 Fund
Investment Summary (Unaudited)
The information in the following tables is based on the direct investments of the Fund.
Top Holdings as of March 31, 2019
| | % of fund's net assets |
| Fidelity Series Investment Grade Bond Fund | 8.2 |
| Fidelity Series Large Cap Value Index Fund | 8.0 |
| Fidelity Series Government Bond Index Fund | 7.7 |
| Fidelity Series Inflation-Protected Bond Index Fund | 7.4 |
| Fidelity Series Treasury Bill Index Fund | 6.8 |
| Fidelity Series Investment Grade Securitized Fund | 5.7 |
| Fidelity Series Corporate Bond Fund | 5.6 |
| Fidelity Series Emerging Markets Opportunities Fund | 5.5 |
| Fidelity Series Blue Chip Growth Fund | 5.5 |
| Fidelity Series Long-Term Treasury Bond Index Fund | 5.1 |
| | 65.5 |
Asset Allocation (% of fund's net assets)
| Period end |
| | Domestic Equity Funds | 29.2% |
| | International Equity Funds | 17.3% |
| | Bond Funds | 42.1% |
| | Short-Term Funds | 11.4% |

Domestic Equity Funds category includes Fidelity Series Commodity Strategy Fund which invests in commodity-related investments.
Fidelity Freedom® Blend 2015 Fund
Schedule of Investments March 31, 2019
Showing Percentage of Net Assets
| Domestic Equity Funds - 29.2% | | | |
| | | Shares | Value |
| Fidelity Series Blue Chip Growth Fund (a) | | 35,272 | $520,264 |
| Fidelity Series Commodity Strategy Fund (a) | | 47,032 | 224,343 |
| Fidelity Series Large Cap Growth Index Fund (a) | | 40,400 | 407,232 |
| Fidelity Series Large Cap Stock Fund (a) | | 27,715 | 406,025 |
| Fidelity Series Large Cap Value Index Fund (a) | | 61,266 | 760,313 |
| Fidelity Series Small Cap Opportunities Fund (a) | | 15,069 | 202,824 |
| Fidelity Series Value Discovery Fund (a) | | 19,260 | 240,563 |
| TOTAL DOMESTIC EQUITY FUNDS | | | |
| (Cost $2,551,487) | | | 2,761,564 |
|
| International Equity Funds - 17.3% | | | |
| Fidelity Series Canada Fund (a) | | 4,651 | 47,956 |
| Fidelity Series Emerging Markets Fund (a) | | 5,898 | 57,738 |
| Fidelity Series Emerging Markets Opportunities Fund (a) | | 28,244 | 523,357 |
| Fidelity Series International Growth Fund (a) | | 26,641 | 404,676 |
| Fidelity Series International Index Fund (a) | | 10,796 | 106,013 |
| Fidelity Series International Small Cap Fund (a) | | 6,795 | 105,521 |
| Fidelity Series International Value Fund (a) | | 42,756 | 397,626 |
| TOTAL INTERNATIONAL EQUITY FUNDS | | | |
| (Cost $1,529,941) | | | 1,642,887 |
|
| Bond Funds - 42.1% | | | |
| Fidelity Series Corporate Bond Fund (a) | | 52,191 | 529,736 |
| Fidelity Series Emerging Markets Debt Fund (a) | | 6,930 | 66,460 |
| Fidelity Series Floating Rate High Income Fund (a) | | 1,520 | 14,094 |
| Fidelity Series Government Bond Index Fund (a) | | 71,119 | 726,831 |
| Fidelity Series High Income Fund (a) | | 10,966 | 103,077 |
| Fidelity Series Inflation-Protected Bond Index Fund (a) | | 71,376 | 698,054 |
| Fidelity Series Investment Grade Bond Fund (a) | | 69,250 | 774,219 |
| Fidelity Series Investment Grade Securitized Fund (a) | | 53,616 | 546,344 |
| Fidelity Series Long-Term Treasury Bond Index Fund (a) | | 54,861 | 486,619 |
| Fidelity Series Real Estate Income Fund (a) | | 4,098 | 44,713 |
| TOTAL BOND FUNDS | | | |
| (Cost $3,889,458) | | | 3,990,147 |
|
| Short-Term Funds - 11.4% | | | |
| Fidelity Cash Central Fund, 2.48% (b) | | 49 | 49 |
| Fidelity Series Government Money Market Fund 2.5% (a)(c) | | 218,048 | 218,048 |
| Fidelity Series Short-Term Credit Fund (a) | | 21,985 | 219,186 |
| Fidelity Series Treasury Bill Index Fund (a) | | 64,680 | 646,150 |
| TOTAL SHORT-TERM FUNDS | | | |
| (Cost $1,081,733) | | | 1,083,433 |
| TOTAL INVESTMENT IN SECURITIES - 100.0% | | | |
| (Cost $9,052,619) | | | 9,478,031 |
| NET OTHER ASSETS (LIABILITIES) - 0.0% | | | (2,457) |
| NET ASSETS - 100% | | | $9,475,574 |
Legend
(a) Affiliated Fund
(b) Affiliated fund that is generally available only to investment companies and other accounts managed by Fidelity Investments. The rate quoted is the annualized seven-day yield of the fund at period end. A complete unaudited listing of the fund's holdings as of its most recent quarter end is available upon request. In addition, each Fidelity Central Fund's financial statements, which are not covered by the Fund's Report of Independent Registered Public Accounting Firm, are available on the SEC's website or upon request.
(c) The rate quoted is the annualized seven-day yield of the fund at period end.
Affiliated Central Funds
Information regarding fiscal year to date income earned by the Fund from investments in Fidelity Central Funds is as follows:
| Fund | Income earned |
| Fidelity Cash Central Fund | $195 |
| Total | $195 |
Amounts in the income column in the above table include any capital gain distributions from underlying funds, which are presented in the corresponding line-item in the Statement of Operations, if applicable.
Affiliated Underlying Funds
Fiscal year to date information regarding the Fund's investments in affiliated Underlying Funds, excluding any Money Market Central Funds, is presented below. Exchanges between classes of the same affiliated Underlying Funds may occur.
| Affiliate | Value, beginning of period | Purchases | Sales Proceeds | Dividend Income | Realized Gain (loss) | Change in Unrealized appreciation (depreciation) | Value, end of period |
| Fidelity Series Blue Chip Growth Fund | $-- | $571,144 | $97,591 | $7,096 | $(5,829) | $52,540 | $520,264 |
| Fidelity Series Canada Fund | -- | 52,570 | 7,743 | 139 | (204) | 3,333 | 47,956 |
| Fidelity Series Commodity Strategy Fund | -- | 243,629 | 22,065 | 1,287 | (1,436) | 4,215 | 224,343 |
| Fidelity Series Corporate Bond Fund | -- | 578,153 | 66,008 | 5,171 | (98) | 17,689 | 529,736 |
| Fidelity Series Emerging Markets Debt Fund | -- | 71,540 | 6,296 | 854 | 22 | 1,194 | 66,460 |
| Fidelity Series Emerging Markets Fund | -- | 61,617 | 7,222 | 30 | (75) | 3,418 | 57,738 |
| Fidelity Series Emerging Markets Opportunities Fund | -- | 559,935 | 77,238 | 5,489 | (1,181) | 41,841 | 523,357 |
| Fidelity Series Floating Rate High Income Fund | -- | 16,686 | 2,680 | 265 | (56) | 144 | 14,094 |
| Fidelity Series Government Bond Index Fund | -- | 799,928 | 85,536 | 4,633 | (20) | 12,459 | 726,831 |
| Fidelity Series Government Money Market Fund 2.5% | -- | 243,423 | 25,375 | 1,273 | -- | -- | 218,048 |
| Fidelity Series High Income Fund | -- | 132,646 | 33,022 | 1,873 | (127) | 3,580 | 103,077 |
| Fidelity Series Inflation-Protected Bond Index Fund | -- | 763,960 | 79,455 | 2,087 | (664) | 14,213 | 698,054 |
| Fidelity Series International Growth Fund | -- | 442,124 | 68,427 | 3,458 | (2,881) | 33,860 | 404,676 |
| Fidelity Series International Index Fund | -- | 115,683 | 15,825 | 80 | (324) | 6,479 | 106,013 |
| Fidelity Series International Small Cap Fund | -- | 117,156 | 17,106 | 1,298 | (1,144) | 6,615 | 105,521 |
| Fidelity Series International Value Fund | -- | 438,761 | 55,365 | 1,899 | (3,170) | 17,400 | 397,626 |
| Fidelity Series Investment Grade Bond Fund | -- | 849,541 | 94,116 | 6,349 | 103 | 18,691 | 774,219 |
| Fidelity Series Investment Grade Securitized Fund | -- | 610,743 | 73,602 | 4,404 | 90 | 9,113 | 546,344 |
| Fidelity Series Large Cap Growth Index Fund | -- | 441,317 | 74,610 | 277 | (1,276) | 41,801 | 407,232 |
| Fidelity Series Large Cap Stock Fund | -- | 446,990 | 68,811 | 2,095 | (3,629) | 31,475 | 406,025 |
| Fidelity Series Large Cap Value Index Fund | -- | 839,578 | 122,427 | 8,766 | (5,828) | 48,990 | 760,313 |
| Fidelity Series Long-Term Treasury Bond Index Fund | -- | 522,050 | 57,073 | 3,363 | (100) | 21,742 | 486,619 |
| Fidelity Series Real Estate Income Fund | -- | 48,096 | 5,092 | 494 | (155) | 1,864 | 44,713 |
| Fidelity Series Short-Term Credit Fund | -- | 242,392 | 25,358 | 1,447 | 15 | 2,137 | 219,186 |
| Fidelity Series Small Cap Opportunities Fund | -- | 224,955 | 37,969 | 2,471 | (3,033) | 18,871 | 202,824 |
| Fidelity Series Treasury Bill Index Fund | -- | 731,378 | 84,750 | 4,536 | (41) | (437) | 646,150 |
| Fidelity Series Value Discovery Fund | -- | 265,258 | 34,725 | 1,910 | (2,155) | 12,185 | 240,563 |
| | $-- | $10,431,253 | $1,345,487 | $73,044 | $(33,196) | $425,412 | $9,477,982 |
Amounts in the income column in the above table include any capital gain distributions from underlying funds, which are presented in the corresponding line-item in the Statement of Operations, if applicable.
Investment Valuation
All investments are categorized as Level 1 under the Fair Value Hierarchy. The inputs or methodology used for valuing securities may not be an indication of the risk associated with investing in those securities. For more information on valuation inputs please refer to the Investment Valuation section in the accompanying Notes to Financial Statements.
See accompanying notes which are an integral part of the financial statements.
Fidelity Freedom® Blend 2015 Fund
Financial Statements
Statement of Assets and Liabilities
| | | March 31, 2019 |
| Assets | | |
Investment in securities, at value — See accompanying schedule:
| | |
| Fidelity Central Funds (cost $49) | $49 | |
| Other affiliated issuers (cost $9,052,570) | 9,477,982 | |
| Total Investment in Securities (cost $9,052,619) | | $9,478,031 |
| Cash | | 147 |
| Receivable for investments sold | | 45,251 |
| Receivable for fund shares sold | | 1,525 |
| Total assets | | 9,524,954 |
| Liabilities | | |
| Payable for investments purchased | $33,369 | |
| Payable for fund shares redeemed | 13,353 | |
| Accrued management fee | 2,423 | |
| Distribution and service plan fees payable | 235 | |
| Total liabilities | | 49,380 |
| Net Assets | | $9,475,574 |
| Net Assets consist of: | | |
| Paid in capital | | $9,042,296 |
| Total distributable earnings (loss) | | 433,278 |
| Net Assets | | $9,475,574 |
| Net Asset Value and Maximum Offering Price | | |
| Class A: | | |
| Net Asset Value and redemption price per share ($194,646 ÷ 19,644 shares) | | $9.91 |
| Maximum offering price per share (100/94.25 of $9.91) | | $10.51 |
| Class M: | | |
| Net Asset Value and redemption price per share ($100,701 ÷ 10,168 shares) | | $9.90 |
| Maximum offering price per share (100/96.50 of $9.90) | | $10.26 |
| Class C: | | |
| Net Asset Value and offering price per share ($144,357 ÷ 14,629 shares)(a) | | $9.87 |
| Fidelity Freedom Blend 2015 Fund: | | |
| Net Asset Value, offering price and redemption price per share ($467,636 ÷ 47,200 shares) | | $9.91 |
| Class K: | | |
| Net Asset Value, offering price and redemption price per share ($101,055 ÷ 10,189 shares) | | $9.92 |
| Class K6: | | |
| Net Asset Value, offering price and redemption price per share ($8,164,014 ÷ 823,147 shares) | | $9.92 |
| Class I: | | |
| Net Asset Value, offering price and redemption price per share ($100,996 ÷ 10,186 shares) | | $9.92 |
| Class Z: | | |
| Net Asset Value, offering price and redemption price per share ($101,055 ÷ 10,189 shares) | | $9.92 |
| Class Z6: | | |
| Net Asset Value, offering price and redemption price per share ($101,114 ÷ 10,193 shares) | | $9.92 |
(a) Redemption price per share is equal to net asset value less any applicable contingent deferred sales charge.
See accompanying notes which are an integral part of the financial statements.
Statement of Operations
| | | For the period
August 31, 2018 (commencement of operations) to
March 31, 2019 |
| Investment Income | | |
| Dividends: | | |
| Affiliated issuers | | $45,588 |
| Income from Fidelity Central Funds | | 195 |
| Total income | | 45,783 |
| Expenses | | |
| Management fee | $7,867 | |
| Distribution and service plan fees | 1,350 | |
| Independent trustees' fees and expenses | 6 | |
| Total expenses | | 9,223 |
| Net investment income (loss) | | 36,560 |
| Realized and Unrealized Gain (Loss) | | |
| Net realized gain (loss) on: | | |
| Investment securities: | | |
| Affiliated issuers | (33,196) | |
| Capital gain distributions from underlying funds: | | |
| Affiliated issuers | 27,456 | |
| Total net realized gain (loss) | | (5,740) |
| Change in net unrealized appreciation (depreciation) on: | | |
| Investment securities: | | |
| Affiliated issuers | 425,412 | |
| Total change in net unrealized appreciation (depreciation) | | 425,412 |
| Net gain (loss) | | 419,672 |
| Net increase (decrease) in net assets resulting from operations | | $456,232 |
See accompanying notes which are an integral part of the financial statements.
Statement of Changes in Net Assets
| | For the period
August 31, 2018 (commencement of operations) to
March 31, 2019 |
| Increase (Decrease) in Net Assets | |
| Operations | |
| Net investment income (loss) | $36,560 |
| Net realized gain (loss) | (5,740) |
| Change in net unrealized appreciation (depreciation) | 425,412 |
| Net increase (decrease) in net assets resulting from operations | 456,232 |
| Distributions to shareholders | (22,954) |
| Total distributions | (22,954) |
| Share transactions - net increase (decrease) | 9,042,296 |
| Total increase (decrease) in net assets | 9,475,574 |
| Net Assets | |
| Beginning of period | – |
| End of period | $9,475,574 |
See accompanying notes which are an integral part of the financial statements.
Financial Highlights
Fidelity Freedom Blend 2015 Fund Class A
| Year ended March 31, | 2019 A |
| Selected Per–Share Data | |
| Net asset value, beginning of period | $10.00 |
| Income from Investment Operations | |
| Net investment income (loss)B | .07 |
| Net realized and unrealized gain (loss) | –C |
| Total from investment operations | .07 |
| Distributions from net investment income | (.09) |
| Distributions from net realized gain | (.07) |
| Total distributions | (.16) |
| Net asset value, end of period | $9.91 |
| Total ReturnD,E | .85% |
| Ratios to Average Net AssetsF,G | |
| Expenses before reductions | .74%H |
| Expenses net of fee waivers, if any | .74%H |
| Expenses net of all reductions | .74%H |
| Net investment income (loss) | 1.24%H |
| Supplemental Data | |
| Net assets, end of period (000 omitted) | $195 |
| Portfolio turnover rateG | 52%H |
A For the period August 31, 2018 (commencement of operations) to March 31, 2019.
B Calculated based on average shares outstanding during the period.
C Amount represents less than $.005 per share.
D Total returns for periods of less than one year are not annualized.
E Total returns do not include the effect of the sales charges.
F Expense ratios reflect operating expenses of the class. Expenses before reductions do not reflect amounts reimbursed by the investment adviser or reductions from expense offset arrangements and do not represent the amount paid by the class during periods when reimbursements or reductions occur. Expense ratios before reductions for start-up periods may not be representative of longer-term operating periods. Expenses net of fee waivers reflect expenses after reimbursement by the investment adviser but prior to reductions from expense offset arrangements. Expenses net of all reductions represent the net expenses paid by the class but do not include expenses of the underlying funds in which the Fund invests.
G Amounts do not include the activity of the Underlying Funds.
H Annualized
See accompanying notes which are an integral part of the financial statements.
Fidelity Freedom Blend 2015 Fund Class M
| Year ended March 31, | 2019 A |
| Selected Per–Share Data | |
| Net asset value, beginning of period | $10.00 |
| Income from Investment Operations | |
| Net investment income (loss)B | .06 |
| Net realized and unrealized gain (loss) | –C |
| Total from investment operations | .06 |
| Distributions from net investment income | (.09) |
| Distributions from net realized gain | (.07) |
| Total distributions | (.16) |
| Net asset value, end of period | $9.90 |
| Total ReturnD,E | .67% |
| Ratios to Average Net AssetsF,G | |
| Expenses before reductions | .99%H |
| Expenses net of fee waivers, if any | .99%H |
| Expenses net of all reductions | .99%H |
| Net investment income (loss) | .99%H |
| Supplemental Data | |
| Net assets, end of period (000 omitted) | $101 |
| Portfolio turnover rateG | 52%H |
A For the period August 31, 2018 (commencement of operations) to March 31, 2019.
B Calculated based on average shares outstanding during the period.
C Amount represents less than $.005 per share.
D Total returns for periods of less than one year are not annualized.
E Total returns do not include the effect of the sales charges.
F Expense ratios reflect operating expenses of the class. Expenses before reductions do not reflect amounts reimbursed by the investment adviser or reductions from expense offset arrangements and do not represent the amount paid by the class during periods when reimbursements or reductions occur. Expense ratios before reductions for start-up periods may not be representative of longer-term operating periods. Expenses net of fee waivers reflect expenses after reimbursement by the investment adviser but prior to reductions from expense offset arrangements. Expenses net of all reductions represent the net expenses paid by the class but do not include expenses of the underlying funds in which the Fund invests.
G Amounts do not include the activity of the Underlying Funds.
H Annualized
See accompanying notes which are an integral part of the financial statements.
Fidelity Freedom Blend 2015 Fund Class C
| Year ended March 31, | 2019 A |
| Selected Per–Share Data | |
| Net asset value, beginning of period | $10.00 |
| Income from Investment Operations | |
| Net investment income (loss)B | .03 |
| Net realized and unrealized gain (loss) | –C |
| Total from investment operations | .03 |
| Distributions from net investment income | (.09) |
| Distributions from net realized gain | (.07) |
| Total distributions | (.16) |
| Net asset value, end of period | $9.87 |
| Total ReturnD,E | .43% |
| Ratios to Average Net AssetsF,G | |
| Expenses before reductions | 1.50%H,I |
| Expenses net of fee waivers, if any | 1.50%H,I |
| Expenses net of all reductions | 1.50%H,I |
| Net investment income (loss) | .48%H |
| Supplemental Data | |
| Net assets, end of period (000 omitted) | $144 |
| Portfolio turnover rateG | 52%H |
A For the period August 31, 2018 (commencement of operations) to March 31, 2019.
B Calculated based on average shares outstanding during the period.
C Amount represents less than $.005 per share.
D Total returns for periods of less than one year are not annualized.
E Total returns do not include the effect of the contingent deferred sales charge.
F Expense ratios reflect operating expenses of the class. Expenses before reductions do not reflect amounts reimbursed by the investment adviser or reductions from expense offset arrangements and do not represent the amount paid by the class during periods when reimbursements or reductions occur. Expense ratios before reductions for start-up periods may not be representative of longer-term operating periods. Expenses net of fee waivers reflect expenses after reimbursement by the investment adviser but prior to reductions from expense offset arrangements. Expenses net of all reductions represent the net expenses paid by the class but do not include expenses of the underlying funds in which the Fund invests.
G Amounts do not include the activity of the Underlying Funds.
H Annualized
I On certain classes, the size and fluctuation of net assets and expense amounts may cause ratios to differ from contractual rates.
See accompanying notes which are an integral part of the financial statements.
Fidelity Freedom Blend 2015 Fund
| Year ended March 31, | 2019 A |
| Selected Per–Share Data | |
| Net asset value, beginning of period | $10.00 |
| Income from Investment Operations | |
| Net investment income (loss)B | .08 |
| Net realized and unrealized gain (loss) | .01 |
| Total from investment operations | .09 |
| Distributions from net investment income | (.11) |
| Distributions from net realized gain | (.07) |
| Total distributions | (.18) |
| Net asset value, end of period | $9.91 |
| Total ReturnC | 1.02% |
| Ratios to Average Net AssetsD,E | |
| Expenses before reductions | .49%F |
| Expenses net of fee waivers, if any | .49%F |
| Expenses net of all reductions | .49%F |
| Net investment income (loss) | 1.49%F |
| Supplemental Data | |
| Net assets, end of period (000 omitted) | $468 |
| Portfolio turnover rateE | 52%F |
A For the period August 31, 2018 (commencement of operations) to March 31, 2019.
B Calculated based on average shares outstanding during the period.
C Total returns for periods of less than one year are not annualized.
D Expense ratios reflect operating expenses of the class. Expenses before reductions do not reflect amounts reimbursed by the investment adviser or reductions from expense offset arrangements and do not represent the amount paid by the class during periods when reimbursements or reductions occur. Expense ratios before reductions for start-up periods may not be representative of longer-term operating periods. Expenses net of fee waivers reflect expenses after reimbursement by the investment adviser but prior to reductions from expense offset arrangements. Expenses net of all reductions represent the net expenses paid by the class but do not include expenses of the underlying funds in which the Fund invests.
E Amounts do not include the activity of the Underlying Funds.
F Annualized
See accompanying notes which are an integral part of the financial statements.
Fidelity Freedom Blend 2015 Fund Class K
| Year ended March 31, | 2019 A |
| Selected Per–Share Data | |
| Net asset value, beginning of period | $10.00 |
| Income from Investment Operations | |
| Net investment income (loss)B | .09 |
| Net realized and unrealized gain (loss) | –C |
| Total from investment operations | .09 |
| Distributions from net investment income | (.11) |
| Distributions from net realized gain | (.07) |
| Total distributions | (.17)D |
| Net asset value, end of period | $9.92 |
| Total ReturnE | 1.07% |
| Ratios to Average Net AssetsF,G | |
| Expenses before reductions | .39%H |
| Expenses net of fee waivers, if any | .39%H |
| Expenses net of all reductions | .39%H |
| Net investment income (loss) | 1.59%H |
| Supplemental Data | |
| Net assets, end of period (000 omitted) | $101 |
| Portfolio turnover rateG | 52%H |
A For the period August 31, 2018 (commencement of operations) to March 31, 2019.
B Calculated based on average shares outstanding during the period.
C Amount represents less than $.005 per share.
D Total distributions of $.17 per share is comprised of distributions from net investment income of $.105 and distributions from net realized gain of $.069 per share.
E Total returns for periods of less than one year are not annualized.
F Expense ratios reflect operating expenses of the class. Expenses before reductions do not reflect amounts reimbursed by the investment adviser or reductions from expense offset arrangements and do not represent the amount paid by the class during periods when reimbursements or reductions occur. Expense ratios before reductions for start-up periods may not be representative of longer-term operating periods. Expenses net of fee waivers reflect expenses after reimbursement by the investment adviser but prior to reductions from expense offset arrangements. Expenses net of all reductions represent the net expenses paid by the class but do not include expenses of the underlying funds in which the Fund invests.
G Amounts do not include the activity of the Underlying Funds.
H Annualized
See accompanying notes which are an integral part of the financial statements.
Fidelity Freedom Blend 2015 Fund Class K6
| Year ended March 31, | 2019 A |
| Selected Per–Share Data | |
| Net asset value, beginning of period | $10.00 |
| Income from Investment Operations | |
| Net investment income (loss)B | .09 |
| Net realized and unrealized gain (loss) | .01 |
| Total from investment operations | .10 |
| Distributions from net investment income | (.11) |
| Distributions from net realized gain | (.07) |
| Total distributions | (.18) |
| Net asset value, end of period | $9.92 |
| Total ReturnC | 1.12% |
| Ratios to Average Net AssetsD,E | |
| Expenses before reductions | .30%F,G |
| Expenses net of fee waivers, if any | .30%F,G |
| Expenses net of all reductions | .30%F,G |
| Net investment income (loss) | 1.68%F |
| Supplemental Data | |
| Net assets, end of period (000 omitted) | $8,164 |
| Portfolio turnover rateE | 52%F |
A For the period August 31, 2018 (commencement of operations) to March 31, 2019.
B Calculated based on average shares outstanding during the period.
C Total returns for periods of less than one year are not annualized.
D Expense ratios reflect operating expenses of the class. Expenses before reductions do not reflect amounts reimbursed by the investment adviser or reductions from expense offset arrangements and do not represent the amount paid by the class during periods when reimbursements or reductions occur. Expenses net of fee waivers reflect expenses after reimbursement by the investment adviser but prior to reductions from expense offset arrangements. Expenses net of all reductions represent the net expenses paid by the class but do not include expenses of the underlying funds in which the Fund invests.
E Amounts do not include the activity of the Underlying Funds.
F Annualized
G On certain classes, the size and fluctuation of net assets and expense amounts may cause ratios to differ from contractual rates.
See accompanying notes which are an integral part of the financial statements.
Fidelity Freedom Blend 2015 Fund Class I
| Year ended March 31, | 2019 A |
| Selected Per–Share Data | |
| Net asset value, beginning of period | $10.00 |
| Income from Investment Operations | |
| Net investment income (loss)B | .08 |
| Net realized and unrealized gain (loss) | .01 |
| Total from investment operations | .09 |
| Distributions from net investment income | (.10) |
| Distributions from net realized gain | (.07) |
| Total distributions | (.17) |
| Net asset value, end of period | $9.92 |
| Total ReturnC | 1.04% |
| Ratios to Average Net AssetsD,E | |
| Expenses before reductions | .49%F |
| Expenses net of fee waivers, if any | .49%F |
| Expenses net of all reductions | .49%F |
| Net investment income (loss) | 1.49%F |
| Supplemental Data | |
| Net assets, end of period (000 omitted) | $101 |
| Portfolio turnover rateE | 52%F |
A For the period August 31, 2018 (commencement of operations) to March 31, 2019.
B Calculated based on average shares outstanding during the period.
C Total returns for periods of less than one year are not annualized.
D Expense ratios reflect operating expenses of the class. Expenses before reductions do not reflect amounts reimbursed by the investment adviser or reductions from expense offset arrangements and do not represent the amount paid by the class during periods when reimbursements or reductions occur. Expense ratios before reductions for start-up periods may not be representative of longer-term operating periods. Expenses net of fee waivers reflect expenses after reimbursement by the investment adviser but prior to reductions from expense offset arrangements. Expenses net of all reductions represent the net expenses paid by the class but do not include expenses of the underlying funds in which the Fund invests.
E Amounts do not include the activity of the Underlying Funds.
F Annualized
See accompanying notes which are an integral part of the financial statements.
Fidelity Freedom Blend 2015 Fund Class Z
| Year ended March 31, | 2019 A |
| Selected Per–Share Data | |
| Net asset value, beginning of period | $10.00 |
| Income from Investment Operations | |
| Net investment income (loss)B | .09 |
| Net realized and unrealized gain (loss) | –C |
| Total from investment operations | .09 |
| Distributions from net investment income | (.11) |
| Distributions from net realized gain | (.07) |
| Total distributions | (.17)D |
| Net asset value, end of period | $9.92 |
| Total ReturnE | 1.07% |
| Ratios to Average Net AssetsF,G | |
| Expenses before reductions | .39%H |
| Expenses net of fee waivers, if any | .39%H |
| Expenses net of all reductions | .39%H |
| Net investment income (loss) | 1.59%H |
| Supplemental Data | |
| Net assets, end of period (000 omitted) | $101 |
| Portfolio turnover rateG | 52%H |
A For the period August 31, 2018 (commencement of operations) to March 31, 2019.
B Calculated based on average shares outstanding during the period.
C Amount represents less than $.005 per share.
D Total distributions of $.17 per share is comprised of distributions from net investment income of $.105 and distributions from net realized gain of $.069 per share.
E Total returns for periods of less than one year are not annualized.
F Expense ratios reflect operating expenses of the class. Expenses before reductions do not reflect amounts reimbursed by the investment adviser or reductions from expense offset arrangements and do not represent the amount paid by the class during periods when reimbursements or reductions occur. Expense ratios before reductions for start-up periods may not be representative of longer-term operating periods. Expenses net of fee waivers reflect expenses after reimbursement by the investment adviser but prior to reductions from expense offset arrangements. Expenses net of all reductions represent the net expenses paid by the class but do not include expenses of the underlying funds in which the Fund invests.
G Amounts do not include the activity of the Underlying Funds.
H Annualized
See accompanying notes which are an integral part of the financial statements.
Fidelity Freedom Blend 2015 Fund Class Z6
| Year ended March 31, | 2019 A |
| Selected Per–Share Data | |
| Net asset value, beginning of period | $10.00 |
| Income from Investment Operations | |
| Net investment income (loss)B | .10 |
| Net realized and unrealized gain (loss) | –C |
| Total from investment operations | .10 |
| Distributions from net investment income | (.11) |
| Distributions from net realized gain | (.07) |
| Total distributions | (.18) |
| Net asset value, end of period | $9.92 |
| Total ReturnD | 1.12% |
| Ratios to Average Net AssetsE,F | |
| Expenses before reductions | .29%G |
| Expenses net of fee waivers, if any | .29%G |
| Expenses net of all reductions | .29%G |
| Net investment income (loss) | 1.69%G |
| Supplemental Data | |
| Net assets, end of period (000 omitted) | $101 |
| Portfolio turnover rateF | 52%G |
A For the period August 31, 2018 (commencement of operations) to March 31, 2019.
B Calculated based on average shares outstanding during the period.
C Amount represents less than $.005 per share.
D Total returns for periods of less than one year are not annualized.
E Expense ratios reflect operating expenses of the class. Expenses before reductions do not reflect amounts reimbursed by the investment adviser or reductions from expense offset arrangements and do not represent the amount paid by the class during periods when reimbursements or reductions occur. Expenses net of fee waivers reflect expenses after reimbursement by the investment adviser but prior to reductions from expense offset arrangements. Expenses net of all reductions represent the net expenses paid by the class but do not include expenses of the underlying funds in which the Fund invests.
F Amounts do not include the activity of the Underlying Funds.
G Annualized
See accompanying notes which are an integral part of the financial statements.
Fidelity Freedom® Blend 2020 Fund
Investment Summary (Unaudited)
The information in the following tables is based on the direct investments of the Fund.
Top Holdings as of March 31, 2019
| | % of fund's net assets |
| Fidelity Series Large Cap Value Index Fund | 9.7 |
| Fidelity Series Investment Grade Bond Fund | 7.2 |
| Fidelity Series Government Bond Index Fund | 6.8 |
| Fidelity Series Blue Chip Growth Fund | 6.6 |
| Fidelity Series Emerging Markets Opportunities Fund | 6.1 |
| Fidelity Series Inflation-Protected Bond Index Fund | 5.4 |
| Fidelity Series Long-Term Treasury Bond Index Fund | 5.3 |
| Fidelity Series Large Cap Growth Index Fund | 5.2 |
| Fidelity Series Large Cap Stock Fund | 5.1 |
| Fidelity Series Treasury Bill Index Fund | 5.1 |
| | 62.5 |
Asset Allocation (% of fund's net assets)
| Period end |
| | Domestic Equity Funds | 34.6% |
| | International Equity Funds | 19.7% |
| | Bond Funds | 37.1% |
| | Short-Term Funds | 8.6% |

Domestic Equity Funds category includes Fidelity Series Commodity Strategy Fund which invests in commodity-related investments.
Fidelity Freedom® Blend 2020 Fund
Schedule of Investments March 31, 2019
Showing Percentage of Net Assets
| Domestic Equity Funds - 34.6% | | | |
| | | Shares | Value |
| Fidelity Series Blue Chip Growth Fund (a) | | 107,954 | $1,592,321 |
| Fidelity Series Commodity Strategy Fund (a) | | 119,763 | 571,268 |
| Fidelity Series Large Cap Growth Index Fund (a) | | 123,646 | 1,246,354 |
| Fidelity Series Large Cap Stock Fund (a) | | 84,557 | 1,238,767 |
| Fidelity Series Large Cap Value Index Fund (a) | | 187,107 | 2,321,999 |
| Fidelity Series Small Cap Opportunities Fund (a) | | 45,829 | 616,858 |
| Fidelity Series Value Discovery Fund (a) | | 58,636 | 732,368 |
| TOTAL DOMESTIC EQUITY FUNDS | | | |
| (Cost $7,572,746) | | | 8,319,935 |
|
| International Equity Funds - 19.7% | | | |
| Fidelity Series Canada Fund (a) | | 13,604 | 140,253 |
| Fidelity Series Emerging Markets Fund (a) | | 16,541 | 161,941 |
| Fidelity Series Emerging Markets Opportunities Fund (a) | | 79,187 | 1,467,329 |
| Fidelity Series International Growth Fund (a) | | 77,938 | 1,183,883 |
| Fidelity Series International Index Fund (a) | | 31,564 | 309,955 |
| Fidelity Series International Small Cap Fund (a) | | 19,862 | 308,451 |
| Fidelity Series International Value Fund (a) | | 124,976 | 1,162,276 |
| TOTAL INTERNATIONAL EQUITY FUNDS | | | |
| (Cost $4,352,137) | | | 4,734,088 |
|
| Bond Funds - 37.1% | | | |
| Fidelity Series Corporate Bond Fund (a) | | 116,473 | 1,182,202 |
| Fidelity Series Emerging Markets Debt Fund (a) | | 17,573 | 168,522 |
| Fidelity Series Floating Rate High Income Fund (a) | | 3,899 | 36,143 |
| Fidelity Series Government Bond Index Fund (a) | | 159,414 | 1,629,215 |
| Fidelity Series High Income Fund (a) | | 28,515 | 268,041 |
| Fidelity Series Inflation-Protected Bond Index Fund (a) | | 133,762 | 1,308,189 |
| Fidelity Series Investment Grade Bond Fund (a) | | 154,542 | 1,727,776 |
| Fidelity Series Investment Grade Securitized Fund (a) | | 119,654 | 1,219,272 |
| Fidelity Series Long-Term Treasury Bond Index Fund (a) | | 142,314 | 1,262,323 |
| Fidelity Series Real Estate Income Fund (a) | | 10,403 | 113,494 |
| TOTAL BOND FUNDS | | | |
| (Cost $8,677,341) | | | 8,915,177 |
|
| Short-Term Funds - 8.6% | | | |
| Fidelity Cash Central Fund, 2.48% (b) | | 49 | 49 |
| Fidelity Series Government Money Market Fund 2.5% (a)(c) | | 420,634 | 420,634 |
| Fidelity Series Short-Term Credit Fund (a) | | 42,414 | 422,871 |
| Fidelity Series Treasury Bill Index Fund (a) | | 123,715 | 1,235,916 |
| TOTAL SHORT-TERM FUNDS | | | |
| (Cost $2,076,040) | | | 2,079,470 |
| TOTAL INVESTMENT IN SECURITIES - 100.0% | | | |
| (Cost $22,678,264) | | | 24,048,670 |
| NET OTHER ASSETS (LIABILITIES) - 0.0% | | | (6,650) |
| NET ASSETS - 100% | | | $24,042,020 |
Legend
(a) Affiliated Fund
(b) Affiliated fund that is generally available only to investment companies and other accounts managed by Fidelity Investments. The rate quoted is the annualized seven-day yield of the fund at period end. A complete unaudited listing of the fund's holdings as of its most recent quarter end is available upon request. In addition, each Fidelity Central Fund's financial statements, which are not covered by the Fund's Report of Independent Registered Public Accounting Firm, are available on the SEC's website or upon request.
(c) The rate quoted is the annualized seven-day yield of the fund at period end.
Affiliated Central Funds
Information regarding fiscal year to date income earned by the Fund from investments in Fidelity Central Funds is as follows:
| Fund | Income earned |
| Fidelity Cash Central Fund | $195 |
| Total | $195 |
Amounts in the income column in the above table include any capital gain distributions from underlying funds, which are presented in the corresponding line-item in the Statement of Operations, if applicable.
Affiliated Underlying Funds
Fiscal year to date information regarding the Fund's investments in affiliated Underlying Funds, excluding any Money Market Central Funds, is presented below. Exchanges between classes of the same affiliated Underlying Funds may occur.
| Affiliate | Value, beginning of period | Purchases | Sales Proceeds | Dividend Income | Realized Gain (loss) | Change in Unrealized appreciation (depreciation) | Value, end of period |
| Fidelity Series Blue Chip Growth Fund | $-- | $1,800,164 | $398,318 | $8,801 | $5,614 | $184,861 | $1,592,321 |
| Fidelity Series Canada Fund | -- | 160,221 | 32,578 | 181 | 773 | 11,837 | 140,253 |
| Fidelity Series Commodity Strategy Fund | -- | 648,799 | 91,137 | 1,294 | (448) | 14,054 | 571,268 |
| Fidelity Series Corporate Bond Fund | -- | 1,358,492 | 219,468 | 11,166 | 847 | 42,331 | 1,182,202 |
| Fidelity Series Emerging Markets Debt Fund | -- | 190,503 | 25,761 | 2,091 | 101 | 3,679 | 168,522 |
| Fidelity Series Emerging Markets Fund | -- | 180,704 | 29,721 | 38 | 616 | 10,342 | 161,941 |
| Fidelity Series Emerging Markets Opportunities Fund | -- | 1,645,663 | 319,927 | 6,890 | 5,344 | 136,249 | 1,467,329 |
| Fidelity Series Floating Rate High Income Fund | -- | 43,048 | 7,410 | 569 | (10) | 515 | 36,143 |
| Fidelity Series Government Bond Index Fund | -- | 1,861,315 | 258,902 | 10,029 | (252) | 27,054 | 1,629,215 |
| Fidelity Series Government Money Market Fund 2.5% | -- | 487,341 | 66,707 | 2,399 | -- | -- | 420,634 |
| Fidelity Series High Income Fund | -- | 355,080 | 99,245 | 4,471 | 1,075 | 11,131 | 268,041 |
| Fidelity Series Inflation-Protected Bond Index Fund | -- | 1,494,403 | 214,852 | 2,320 | 159 | 28,479 | 1,308,189 |
| Fidelity Series International Growth Fund | -- | 1,344,398 | 279,152 | 4,529 | 4,458 | 114,179 | 1,183,883 |
| Fidelity Series International Index Fund | -- | 353,281 | 66,481 | 105 | 1,114 | 22,041 | 309,955 |
| Fidelity Series International Small Cap Fund | -- | 355,206 | 70,463 | 1,701 | 280 | 23,428 | 308,451 |
| Fidelity Series International Value Fund | -- | 1,344,062 | 245,784 | 2,492 | 123 | 63,875 | 1,162,276 |
| Fidelity Series Investment Grade Bond Fund | -- | 1,983,397 | 300,263 | 13,541 | 747 | 43,895 | 1,727,776 |
| Fidelity Series Investment Grade Securitized Fund | -- | 1,418,649 | 219,976 | 9,559 | 369 | 20,230 | 1,219,272 |
| Fidelity Series Large Cap Growth Index Fund | -- | 1,399,748 | 307,146 | 375 | 8,350 | 145,402 | 1,246,354 |
| Fidelity Series Large Cap Stock Fund | -- | 1,415,448 | 293,008 | 2,824 | 5,406 | 110,921 | 1,238,767 |
| Fidelity Series Large Cap Value Index Fund | -- | 2,662,014 | 525,158 | 19,447 | 9,326 | 175,817 | 2,321,999 |
| Fidelity Series Long-Term Treasury Bond Index Fund | -- | 1,408,713 | 200,649 | 8,402 | (865) | 55,124 | 1,262,323 |
| Fidelity Series Real Estate Income Fund | -- | 128,726 | 20,744 | 853 | 114 | 5,398 | 113,494 |
| Fidelity Series Short-Term Credit Fund | -- | 485,157 | 66,672 | 2,678 | 95 | 4,291 | 422,871 |
| Fidelity Series Small Cap Opportunities Fund | -- | 705,911 | 161,437 | 3,089 | 2,634 | 69,750 | 616,858 |
| Fidelity Series Treasury Bill Index Fund | -- | 1,464,735 | 227,768 | 8,626 | (190) | (861) | 1,235,916 |
| Fidelity Series Value Discovery Fund | -- | 838,575 | 153,326 | 2,598 | 735 | 46,384 | 732,368 |
| | $-- | $27,533,753 | $4,902,053 | $131,068 | $46,515 | $1,370,406 | $24,048,621 |
Amounts in the income column in the above table include any capital gain distributions from underlying funds, which are presented in the corresponding line-item in the Statement of Operations, if applicable.
Investment Valuation
All investments are categorized as Level 1 under the Fair Value Hierarchy. The inputs or methodology used for valuing securities may not be an indication of the risk associated with investing in those securities. For more information on valuation inputs please refer to the Investment Valuation section in the accompanying Notes to Financial Statements.
See accompanying notes which are an integral part of the financial statements.
Fidelity Freedom® Blend 2020 Fund
Financial Statements
Statement of Assets and Liabilities
| | | March 31, 2019 |
| Assets | | |
Investment in securities, at value — See accompanying schedule:
| | |
| Fidelity Central Funds (cost $49) | $49 | |
| Other affiliated issuers (cost $22,678,215) | 24,048,621 | |
| Total Investment in Securities (cost $22,678,264) | | $24,048,670 |
| Cash | | 147 |
| Receivable for investments sold | | 93,032 |
| Receivable for fund shares sold | | 14,318 |
| Total assets | | 24,156,167 |
| Liabilities | | |
| Payable for investments purchased | $107,355 | |
| Accrued management fee | 6,246 | |
| Distribution and service plan fees payable | 546 | |
| Total liabilities | | 114,147 |
| Net Assets | | $24,042,020 |
| Net Assets consist of: | | |
| Paid in capital | | $22,542,143 |
| Total distributable earnings (loss) | | 1,499,877 |
| Net Assets | | $24,042,020 |
| Net Asset Value and Maximum Offering Price | | |
| Class A: | | |
| Net Asset Value and redemption price per share ($894,033 ÷ 90,165 shares) | | $9.92 |
| Maximum offering price per share (100/94.25 of $9.92) | | $10.53 |
| Class M: | | |
| Net Asset Value and redemption price per share ($106,521 ÷ 10,733 shares) | | $9.92 |
| Maximum offering price per share (100/96.50 of $9.92) | | $10.28 |
| Class C: | | |
| Net Asset Value and offering price per share ($385,194 ÷ 38,919 shares)(a) | | $9.90 |
| Fidelity Freedom Blend 2020 Fund: | | |
| Net Asset Value, offering price and redemption price per share ($1,168,454 ÷ 117,754 shares) | | $9.92 |
| Class K: | | |
| Net Asset Value, offering price and redemption price per share ($100,724 ÷ 10,134 shares) | | $9.94 |
| Class K6: | | |
| Net Asset Value, offering price and redemption price per share ($21,064,810 ÷ 2,119,219 shares) | | $9.94 |
| Class I: | | |
| Net Asset Value, offering price and redemption price per share ($120,777 ÷ 12,154 shares) | | $9.94 |
| Class Z: | | |
| Net Asset Value, offering price and redemption price per share ($100,724 ÷ 10,134 shares) | | $9.94 |
| Class Z6: | | |
| Net Asset Value, offering price and redemption price per share ($100,783 ÷ 10,138 shares) | | $9.94 |
(a) Redemption price per share is equal to net asset value less any applicable contingent deferred sales charge.
See accompanying notes which are an integral part of the financial statements.
Statement of Operations
| | | For the period
August 31, 2018 (commencement of operations) to
March 31, 2019 |
| Investment Income | | |
| Dividends: | | |
| Affiliated issuers | | $89,633 |
| Income from Fidelity Central Funds | | 195 |
| Total income | | 89,828 |
| Expenses | | |
| Management fee | $19,197 | |
| Distribution and service plan fees | 1,806 | |
| Independent trustees' fees and expenses | 14 | |
| Total expenses | | 21,017 |
| Net investment income (loss) | | 68,811 |
| Realized and Unrealized Gain (Loss) | | |
| Net realized gain (loss) on: | | |
| Investment securities: | | |
| Affiliated issuers | 46,515 | |
| Capital gain distributions from underlying funds: | | |
| Affiliated issuers | 41,435 | |
| Total net realized gain (loss) | | 87,950 |
| Change in net unrealized appreciation (depreciation) on: | | |
| Investment securities: | | |
| Affiliated issuers | 1,370,406 | |
| Total change in net unrealized appreciation (depreciation) | | 1,370,406 |
| Net gain (loss) | | 1,458,356 |
| Net increase (decrease) in net assets resulting from operations | | $1,527,167 |
See accompanying notes which are an integral part of the financial statements.
Statement of Changes in Net Assets
| | For the period
August 31, 2018 (commencement of operations) to
March 31, 2019 |
| Increase (Decrease) in Net Assets | |
| Operations | |
| Net investment income (loss) | $68,811 |
| Net realized gain (loss) | 87,950 |
| Change in net unrealized appreciation (depreciation) | 1,370,406 |
| Net increase (decrease) in net assets resulting from operations | 1,527,167 |
| Distributions to shareholders | (27,290) |
| Total distributions | (27,290) |
| Share transactions - net increase (decrease) | 22,542,143 |
| Total increase (decrease) in net assets | 24,042,020 |
| Net Assets | |
| Beginning of period | – |
| End of period | $24,042,020 |
See accompanying notes which are an integral part of the financial statements.
Financial Highlights
Fidelity Freedom Blend 2020 Fund Class A
| Year ended March 31, | 2019 A |
| Selected Per–Share Data | |
| Net asset value, beginning of period | $10.00 |
| Income from Investment Operations | |
| Net investment income (loss)B | .05 |
| Net realized and unrealized gain (loss) | (.01)C |
| Total from investment operations | .04 |
| Distributions from net investment income | (.07) |
| Distributions from net realized gain | (.05) |
| Total distributions | (.12) |
| Net asset value, end of period | $9.92 |
| Total ReturnD,E | .55% |
| Ratios to Average Net AssetsF,G | |
| Expenses before reductions | .77%H,I |
| Expenses net of fee waivers, if any | .77%H,I |
| Expenses net of all reductions | .77%H,I |
| Net investment income (loss) | .81%H |
| Supplemental Data | |
| Net assets, end of period (000 omitted) | $894 |
| Portfolio turnover rateG | 78%H |
A For the period August 31, 2018 (commencement of operations) to March 31, 2019.
B Calculated based on average shares outstanding during the period.
C The amount shown for a share outstanding does not correspond with the aggregate net gain (loss) on investments for the period due to the timing of sales and repurchases of shares in relation to fluctuating market values of the investments of the Fund.
D Total returns for periods of less than one year are not annualized.
E Total returns do not include the effect of the sales charges.
F Expense ratios reflect operating expenses of the class. Expenses before reductions do not reflect amounts reimbursed by the investment adviser or reductions from expense offset arrangements and do not represent the amount paid by the class during periods when reimbursements or reductions occur. Expense ratios before reductions for start-up periods may not be representative of longer-term operating periods. Expenses net of fee waivers reflect expenses after reimbursement by the investment adviser but prior to reductions from expense offset arrangements. Expenses net of all reductions represent the net expenses paid by the class but do not include expenses of the underlying funds in which the Fund invests.
G Amounts do not include the activity of the Underlying Funds.
H Annualized
I On certain classes, the size and fluctuation of net assets and expense amounts may cause ratios to differ from contractual rates.
See accompanying notes which are an integral part of the financial statements.
Fidelity Freedom Blend 2020 Fund Class M
| Year ended March 31, | 2019 A |
| Selected Per–Share Data | |
| Net asset value, beginning of period | $10.00 |
| Income from Investment Operations | |
| Net investment income (loss)B | .03 |
| Net realized and unrealized gain (loss) | (.01)C |
| Total from investment operations | .02 |
| Distributions from net investment income | (.05) |
| Distributions from net realized gain | (.05) |
| Total distributions | (.10) |
| Net asset value, end of period | $9.92 |
| Total ReturnD,E | .33% |
| Ratios to Average Net AssetsF,G | |
| Expenses before reductions | 1.00%H |
| Expenses net of fee waivers, if any | 1.00%H |
| Expenses net of all reductions | 1.00%H |
| Net investment income (loss) | .58%H |
| Supplemental Data | |
| Net assets, end of period (000 omitted) | $107 |
| Portfolio turnover rateG | 78%H |
A For the period August 31, 2018 (commencement of operations) to March 31, 2019.
B Calculated based on average shares outstanding during the period.
C The amount shown for a share outstanding does not correspond with the aggregate net gain (loss) on investments for the period due to the timing of sales and repurchases of shares in relation to fluctuating market values of the investments of the Fund.
D Total returns for periods of less than one year are not annualized.
E Total returns do not include the effect of the sales charges.
F Expense ratios reflect operating expenses of the class. Expenses before reductions do not reflect amounts reimbursed by the investment adviser or reductions from expense offset arrangements and do not represent the amount paid by the class during periods when reimbursements or reductions occur. Expense ratios before reductions for start-up periods may not be representative of longer-term operating periods. Expenses net of fee waivers reflect expenses after reimbursement by the investment adviser but prior to reductions from expense offset arrangements. Expenses net of all reductions represent the net expenses paid by the class but do not include expenses of the underlying funds in which the Fund invests.
G Amounts do not include the activity of the Underlying Funds.
H Annualized
See accompanying notes which are an integral part of the financial statements.
Fidelity Freedom Blend 2020 Fund Class C
| Year ended March 31, | 2019 A |
| Selected Per–Share Data | |
| Net asset value, beginning of period | $10.00 |
| Income from Investment Operations | |
| Net investment income (loss)B | –C |
| Net realized and unrealized gain (loss) | –C |
| Total from investment operations | –C |
| Distributions from net investment income | (.05) |
| Distributions from net realized gain | (.05) |
| Total distributions | (.10) |
| Net asset value, end of period | $9.90 |
| Total ReturnD,E | .08% |
| Ratios to Average Net AssetsF,G | |
| Expenses before reductions | 1.52%H,I |
| Expenses net of fee waivers, if any | 1.52%H,I |
| Expenses net of all reductions | 1.52%H,I |
| Net investment income (loss) | .06%H |
| Supplemental Data | |
| Net assets, end of period (000 omitted) | $385 |
| Portfolio turnover rateG | 78%H |
A For the period August 31, 2018 (commencement of operations) to March 31, 2019.
B Calculated based on average shares outstanding during the period.
C Amount represents less than $.005 per share.
D Total returns for periods of less than one year are not annualized.
E Total returns do not include the effect of the contingent deferred sales charge.
F Expense ratios reflect operating expenses of the class. Expenses before reductions do not reflect amounts reimbursed by the investment adviser or reductions from expense offset arrangements and do not represent the amount paid by the class during periods when reimbursements or reductions occur. Expense ratios before reductions for start-up periods may not be representative of longer-term operating periods. Expenses net of fee waivers reflect expenses after reimbursement by the investment adviser but prior to reductions from expense offset arrangements. Expenses net of all reductions represent the net expenses paid by the class but do not include expenses of the underlying funds in which the Fund invests.
G Amounts do not include the activity of the Underlying Funds.
H Annualized
I On certain classes, the size and fluctuation of net assets and expense amounts may cause ratios to differ from contractual rates.
See accompanying notes which are an integral part of the financial statements.
Fidelity Freedom Blend 2020 Fund
| Year ended March 31, | 2019 A |
| Selected Per–Share Data | |
| Net asset value, beginning of period | $10.00 |
| Income from Investment Operations | |
| Net investment income (loss)B | .06 |
| Net realized and unrealized gain (loss) | (.01)C |
| Total from investment operations | .05 |
| Distributions from net investment income | (.08) |
| Distributions from net realized gain | (.05) |
| Total distributions | (.13) |
| Net asset value, end of period | $9.92 |
| Total ReturnD | .63% |
| Ratios to Average Net AssetsE,F | |
| Expenses before reductions | .50%G |
| Expenses net of fee waivers, if any | .50%G |
| Expenses net of all reductions | .50%G |
| Net investment income (loss) | 1.08%G |
| Supplemental Data | |
| Net assets, end of period (000 omitted) | $1,168 |
| Portfolio turnover rateF | 78%G |
A For the period August 31, 2018 (commencement of operations) to March 31, 2019.
B Calculated based on average shares outstanding during the period.
C The amount shown for a share outstanding does not correspond with the aggregate net gain (loss) on investments for the period due to the timing of sales and repurchases of shares in relation to fluctuating market values of the investments of the Fund.
D Total returns for periods of less than one year are not annualized.
E Expense ratios reflect operating expenses of the class. Expenses before reductions do not reflect amounts reimbursed by the investment adviser or reductions from expense offset arrangements and do not represent the amount paid by the class during periods when reimbursements or reductions occur. Expense ratios before reductions for start-up periods may not be representative of longer-term operating periods. Expenses net of fee waivers reflect expenses after reimbursement by the investment adviser but prior to reductions from expense offset arrangements. Expenses net of all reductions represent the net expenses paid by the class but do not include expenses of the underlying funds in which the Fund invests.
F Amounts do not include the activity of the Underlying Funds.
G Annualized
See accompanying notes which are an integral part of the financial statements.
Fidelity Freedom Blend 2020 Fund Class K
| Year ended March 31, | 2019 A |
| Selected Per–Share Data | |
| Net asset value, beginning of period | $10.00 |
| Income from Investment Operations | |
| Net investment income (loss)B | .07 |
| Net realized and unrealized gain (loss) | (.01)C |
| Total from investment operations | .06 |
| Distributions from net investment income | (.07) |
| Distributions from net realized gain | (.05) |
| Total distributions | (.12) |
| Net asset value, end of period | $9.94 |
| Total ReturnD | .73% |
| Ratios to Average Net AssetsE,F | |
| Expenses before reductions | .40%G |
| Expenses net of fee waivers, if any | .40%G |
| Expenses net of all reductions | .40%G |
| Net investment income (loss) | 1.18%G |
| Supplemental Data | |
| Net assets, end of period (000 omitted) | $101 |
| Portfolio turnover rateF | 78%G |
A For the period August 31, 2018 (commencement of operations) to March 31, 2019.
B Calculated based on average shares outstanding during the period.
C The amount shown for a share outstanding does not correspond with the aggregate net gain (loss) on investments for the period due to the timing of sales and repurchases of shares in relation to fluctuating market values of the investments of the Fund.
D Total returns for periods of less than one year are not annualized.
E Expense ratios reflect operating expenses of the class. Expenses before reductions do not reflect amounts reimbursed by the investment adviser or reductions from expense offset arrangements and do not represent the amount paid by the class during periods when reimbursements or reductions occur. Expense ratios before reductions for start-up periods may not be representative of longer-term operating periods. Expenses net of fee waivers reflect expenses after reimbursement by the investment adviser but prior to reductions from expense offset arrangements. Expenses net of all reductions represent the net expenses paid by the class but do not include expenses of the underlying funds in which the Fund invests.
F Amounts do not include the activity of the Underlying Funds.
G Annualized
See accompanying notes which are an integral part of the financial statements.
Fidelity Freedom Blend 2020 Fund Class K6
| Year ended March 31, | 2019 A |
| Selected Per–Share Data | |
| Net asset value, beginning of period | $10.00 |
| Income from Investment Operations | |
| Net investment income (loss)B | .07 |
| Net realized and unrealized gain (loss) | –C |
| Total from investment operations | .07 |
| Distributions from net investment income | (.08) |
| Distributions from net realized gain | (.05) |
| Total distributions | (.13) |
| Net asset value, end of period | $9.94 |
| Total ReturnD | .77% |
| Ratios to Average Net AssetsE,F | |
| Expenses before reductions | .31%G,H |
| Expenses net of fee waivers, if any | .31%G,H |
| Expenses net of all reductions | .31%G,H |
| Net investment income (loss) | 1.27%G |
| Supplemental Data | |
| Net assets, end of period (000 omitted) | $21,065 |
| Portfolio turnover rateF | 78%G |
A For the period August 31, 2018 (commencement of operations) to March 31, 2019.
B Calculated based on average shares outstanding during the period.
C Amount represents less than $.005 per share.
D Total returns for periods of less than one year are not annualized.
E Expense ratios reflect operating expenses of the class. Expenses before reductions do not reflect amounts reimbursed by the investment adviser or reductions from expense offset arrangements and do not represent the amount paid by the class during periods when reimbursements or reductions occur. Expenses net of fee waivers reflect expenses after reimbursement by the investment adviser but prior to reductions from expense offset arrangements. Expenses net of all reductions represent the net expenses paid by the class but do not include expenses of the underlying funds in which the Fund invests.
F Amounts do not include the activity of the Underlying Funds.
G Annualized
H On certain classes, the size and fluctuation of net assets and expense amounts may cause ratios to differ from contractual rates.
See accompanying notes which are an integral part of the financial statements.
Fidelity Freedom Blend 2020 Fund Class I
| Year ended March 31, | 2019 A |
| Selected Per–Share Data | |
| Net asset value, beginning of period | $10.00 |
| Income from Investment Operations | |
| Net investment income (loss)B | .06 |
| Net realized and unrealized gain (loss) | –C |
| Total from investment operations | .06 |
| Distributions from net investment income | (.07) |
| Distributions from net realized gain | (.05) |
| Total distributions | (.12) |
| Net asset value, end of period | $9.94 |
| Total ReturnD | .69% |
| Ratios to Average Net AssetsE,F | |
| Expenses before reductions | .50%G |
| Expenses net of fee waivers, if any | .50%G |
| Expenses net of all reductions | .50%G |
| Net investment income (loss) | 1.08%G |
| Supplemental Data | |
| Net assets, end of period (000 omitted) | $121 |
| Portfolio turnover rateF | 78%G |
A For the period August 31, 2018 (commencement of operations) to March 31, 2019.
B Calculated based on average shares outstanding during the period.
C Amount represents less than $.005 per share.
D Total returns for periods of less than one year are not annualized.
E Expense ratios reflect operating expenses of the class. Expenses before reductions do not reflect amounts reimbursed by the investment adviser or reductions from expense offset arrangements and do not represent the amount paid by the class during periods when reimbursements or reductions occur. Expense ratios before reductions for start-up periods may not be representative of longer-term operating periods. Expenses net of fee waivers reflect expenses after reimbursement by the investment adviser but prior to reductions from expense offset arrangements. Expenses net of all reductions represent the net expenses paid by the class but do not include expenses of the underlying funds in which the Fund invests.
F Amounts do not include the activity of the Underlying Funds.
G Annualized
See accompanying notes which are an integral part of the financial statements.
Fidelity Freedom Blend 2020 Fund Class Z
| Year ended March 31, | 2019 A |
| Selected Per–Share Data | |
| Net asset value, beginning of period | $10.00 |
| Income from Investment Operations | |
| Net investment income (loss)B | .07 |
| Net realized and unrealized gain (loss) | (.01)C |
| Total from investment operations | .06 |
| Distributions from net investment income | (.07) |
| Distributions from net realized gain | (.05) |
| Total distributions | (.12) |
| Net asset value, end of period | $9.94 |
| Total ReturnD | .73% |
| Ratios to Average Net AssetsE,F | |
| Expenses before reductions | .40%G |
| Expenses net of fee waivers, if any | .40%G |
| Expenses net of all reductions | .40%G |
| Net investment income (loss) | 1.18%G |
| Supplemental Data | |
| Net assets, end of period (000 omitted) | $101 |
| Portfolio turnover rateF | 78%G |
A For the period August 31, 2018 (commencement of operations) to March 31, 2019.
B Calculated based on average shares outstanding during the period.
C The amount shown for a share outstanding does not correspond with the aggregate net gain (loss) on investments for the period due to the timing of sales and repurchases of shares in relation to fluctuating market values of the investments of the Fund.
D Total returns for periods of less than one year are not annualized.
E Expense ratios reflect operating expenses of the class. Expenses before reductions do not reflect amounts reimbursed by the investment adviser or reductions from expense offset arrangements and do not represent the amount paid by the class during periods when reimbursements or reductions occur. Expense ratios before reductions for start-up periods may not be representative of longer-term operating periods. Expenses net of fee waivers reflect expenses after reimbursement by the investment adviser but prior to reductions from expense offset arrangements. Expenses net of all reductions represent the net expenses paid by the class but do not include expenses of the underlying funds in which the Fund invests.
F Amounts do not include the activity of the Underlying Funds.
G Annualized
See accompanying notes which are an integral part of the financial statements.
Fidelity Freedom Blend 2020 Fund Class Z6
| | |
| Year ended March 31, | 2019 A |
| Selected Per–Share Data | |
| Net asset value, beginning of period | $10.00 |
| Income from Investment Operations | |
| Net investment income (loss)B | .07 |
| Net realized and unrealized gain (loss) | –C |
| Total from investment operations | .07 |
| Distributions from net investment income | (.08) |
| Distributions from net realized gain | (.05) |
| Total distributions | (.13) |
| Net asset value, end of period | $9.94 |
| Total ReturnD | .77% |
| Ratios to Average Net AssetsE,F | |
| Expenses before reductions | .30%G |
| Expenses net of fee waivers, if any | .30%G |
| Expenses net of all reductions | .30%G |
| Net investment income (loss) | 1.28%G |
| Supplemental Data | |
| Net assets, end of period (000 omitted) | $101 |
| Portfolio turnover rateF | 78%G |
A For the period August 31, 2018 (commencement of operations) to March 31, 2019.
B Calculated based on average shares outstanding during the period.
C Amount represents less than $.005 per share.
D Total returns for periods of less than one year are not annualized.
E Expense ratios reflect operating expenses of the class. Expenses before reductions do not reflect amounts reimbursed by the investment adviser or reductions from expense offset arrangements and do not represent the amount paid by the class during periods when reimbursements or reductions occur. Expenses net of fee waivers reflect expenses after reimbursement by the investment adviser but prior to reductions from expense offset arrangements. Expenses net of all reductions represent the net expenses paid by the class but do not include expenses of the underlying funds in which the Fund invests.
F Amounts do not include the activity of the Underlying Funds.
G Annualized
See accompanying notes which are an integral part of the financial statements.
Fidelity Freedom® Blend 2025 Fund
Investment Summary (Unaudited)
The information in the following tables is based on the direct investments of the Fund.
Top Holdings as of March 31, 2019
| | % of fund's net assets |
| Fidelity Series Large Cap Value Index Fund | 11.1 |
| Fidelity Series Blue Chip Growth Fund | 7.6 |
| Fidelity Series Emerging Markets Opportunities Fund | 6.6 |
| Fidelity Series Investment Grade Bond Fund | 6.1 |
| Fidelity Series Large Cap Growth Index Fund | 6.0 |
| Fidelity Series Large Cap Stock Fund | 5.9 |
| Fidelity Series Government Bond Index Fund | 5.8 |
| Fidelity Series Long-Term Treasury Bond Index Fund | 5.7 |
| Fidelity Series International Growth Fund | 5.5 |
| Fidelity Series International Value Fund | 5.4 |
| | 65.7 |
Asset Allocation (% of fund's net assets)
| Period end |
| | Domestic Equity Funds | 39.4% |
| | International Equity Funds | 21.7% |
| | Bond Funds | 32.9% |
| | Short-Term Funds | 6.0% |

Domestic Equity Funds category includes Fidelity Series Commodity Strategy Fund which invests in commodity-related investments.
Fidelity Freedom® Blend 2025 Fund
Schedule of Investments March 31, 2019
Showing Percentage of Net Assets
| Domestic Equity Funds - 39.4% | | | |
| | | Shares | Value |
| Fidelity Series Blue Chip Growth Fund (a) | | 227,151 | $3,350,480 |
| Fidelity Series Commodity Strategy Fund (a) | | 218,537 | 1,042,420 |
| Fidelity Series Large Cap Growth Index Fund (a) | | 260,171 | 2,622,519 |
| Fidelity Series Large Cap Stock Fund (a) | | 178,064 | 2,608,633 |
| Fidelity Series Large Cap Value Index Fund (a) | | 393,917 | 4,888,512 |
| Fidelity Series Small Cap Opportunities Fund (a) | | 96,586 | 1,300,048 |
| Fidelity Series Value Discovery Fund (a) | | 123,546 | 1,543,092 |
| TOTAL DOMESTIC EQUITY FUNDS | | | |
| (Cost $15,957,362) | | | 17,355,704 |
|
| International Equity Funds - 21.7% | | | |
| Fidelity Series Canada Fund (a) | | 27,726 | 285,856 |
| Fidelity Series Emerging Markets Fund (a) | | 32,781 | 320,929 |
| Fidelity Series Emerging Markets Opportunities Fund (a) | | 156,971 | 2,908,667 |
| Fidelity Series International Growth Fund (a) | | 158,818 | 2,412,440 |
| Fidelity Series International Index Fund (a) | | 64,322 | 631,642 |
| Fidelity Series International Small Cap Fund (a) | | 40,478 | 628,628 |
| Fidelity Series International Value Fund (a) | | 254,378 | 2,365,715 |
| TOTAL INTERNATIONAL EQUITY FUNDS | | | |
| (Cost $8,871,815) | | | 9,553,877 |
|
| Bond Funds - 32.9% | | | |
| Fidelity Series Corporate Bond Fund (a) | | 181,967 | 1,846,960 |
| Fidelity Series Emerging Markets Debt Fund (a) | | 32,200 | 308,801 |
| Fidelity Series Floating Rate High Income Fund (a) | | 7,144 | 66,227 |
| Fidelity Series Government Bond Index Fund (a) | | 248,773 | 2,542,458 |
| Fidelity Series High Income Fund (a) | | 53,911 | 506,764 |
| Fidelity Series Inflation-Protected Bond Index Fund (a) | | 195,722 | 1,914,163 |
| Fidelity Series Investment Grade Bond Fund (a) | | 241,383 | 2,698,664 |
| Fidelity Series Investment Grade Securitized Fund (a) | | 186,933 | 1,904,845 |
| Fidelity Series Long-Term Treasury Bond Index Fund (a) | | 283,845 | 2,517,705 |
| Fidelity Series Real Estate Income Fund (a) | | 19,070 | 208,057 |
| TOTAL BOND FUNDS | | | |
| (Cost $14,145,856) | | | 14,514,644 |
|
| Short-Term Funds - 6.0% | | | |
| Fidelity Cash Central Fund, 2.48% (b) | | 49 | 49 |
| Fidelity Series Government Money Market Fund 2.5% (a)(c) | | 541,049 | 541,049 |
| Fidelity Series Short-Term Credit Fund (a) | | 54,553 | 543,898 |
| Fidelity Series Treasury Bill Index Fund (a) | | 157,110 | 1,569,529 |
| TOTAL SHORT-TERM FUNDS | | | |
| (Cost $2,650,478) | | | 2,654,525 |
| TOTAL INVESTMENT IN SECURITIES - 100.0% | | | |
| (Cost $41,625,511) | | | 44,078,750 |
| NET OTHER ASSETS (LIABILITIES) - 0.0% | | | (11,891) |
| NET ASSETS - 100% | | | $44,066,859 |
Legend
(a) Affiliated Fund
(b) Affiliated fund that is generally available only to investment companies and other accounts managed by Fidelity Investments. The rate quoted is the annualized seven-day yield of the fund at period end. A complete unaudited listing of the fund's holdings as of its most recent quarter end is available upon request. In addition, each Fidelity Central Fund's financial statements, which are not covered by the Fund's Report of Independent Registered Public Accounting Firm, are available on the SEC's website or upon request.
(c) The rate quoted is the annualized seven-day yield of the fund at period end.
Affiliated Central Funds
Information regarding fiscal year to date income earned by the Fund from investments in Fidelity Central Funds is as follows:
| Fund | Income earned |
| Fidelity Cash Central Fund | $195 |
| Total | $195 |
Amounts in the income column in the above table include any capital gain distributions from underlying funds, which are presented in the corresponding line-item in the Statement of Operations, if applicable.
Affiliated Underlying Funds
Fiscal year to date information regarding the Fund's investments in affiliated Underlying Funds, excluding any Money Market Central Funds, is presented below. Exchanges between classes of the same affiliated Underlying Funds may occur.
| Affiliate | Value, beginning of period | Purchases | Sales Proceeds | Dividend Income | Realized Gain (loss) | Change in Unrealized appreciation (depreciation) | Value, end of period |
| Fidelity Series Blue Chip Growth Fund | $-- | $3,254,148 | $248,692 | $10,088 | $(3,233) | $348,257 | $3,350,480 |
| Fidelity Series Canada Fund | -- | 285,566 | 20,202 | 204 | (143) | 20,635 | 285,856 |
| Fidelity Series Commodity Strategy Fund | -- | 1,046,735 | 24,830 | 1,288 | (1,549) | 22,064 | 1,042,420 |
| Fidelity Series Corporate Bond Fund | -- | 1,866,109 | 79,971 | 14,969 | (130) | 60,952 | 1,846,960 |
| Fidelity Series Emerging Markets Debt Fund | -- | 311,625 | 8,309 | 3,294 | (4) | 5,489 | 308,801 |
| Fidelity Series Emerging Markets Fund | -- | 313,120 | 10,106 | 42 | (262) | 18,177 | 320,929 |
| Fidelity Series Emerging Markets Opportunities Fund | -- | 2,827,407 | 152,711 | 7,693 | (3,797) | 237,768 | 2,908,667 |
| Fidelity Series Floating Rate High Income Fund | -- | 67,746 | 2,293 | 859 | (52) | 826 | 66,227 |
| Fidelity Series Government Bond Index Fund | -- | 2,584,316 | 81,210 | 13,456 | 24 | 39,328 | 2,542,458 |
| Fidelity Series Government Money Market Fund 2.5% | -- | 558,140 | 17,091 | 2,661 | -- | -- | 541,049 |
| Fidelity Series High Income Fund | -- | 568,139 | 79,942 | 6,975 | (235) | 18,802 | 506,764 |
| Fidelity Series Inflation-Protected Bond Index Fund | -- | 1,936,702 | 60,155 | 2,437 | (394) | 38,010 | 1,914,163 |
| Fidelity Series International Growth Fund | -- | 2,352,475 | 147,866 | 5,218 | (1,825) | 209,656 | 2,412,440 |
| Fidelity Series International Index Fund | -- | 621,649 | 29,577 | 118 | (590) | 40,160 | 631,642 |
| Fidelity Series International Small Cap Fund | -- | 622,946 | 35,286 | 1,958 | (1,455) | 42,423 | 628,628 |
| Fidelity Series International Value Fund | -- | 2,364,549 | 107,990 | 2,879 | (4,087) | 113,243 | 2,365,715 |
| Fidelity Series Investment Grade Bond Fund | -- | 2,745,425 | 109,980 | 18,099 | (14) | 63,233 | 2,698,664 |
| Fidelity Series Investment Grade Securitized Fund | -- | 1,972,613 | 96,723 | 12,846 | (21) | 28,976 | 1,904,845 |
| Fidelity Series Large Cap Growth Index Fund | -- | 2,534,764 | 188,196 | 434 | (3,482) | 279,433 | 2,622,519 |
| Fidelity Series Large Cap Stock Fund | -- | 2,563,790 | 158,596 | 3,339 | (3,110) | 206,549 | 2,608,633 |
| Fidelity Series Large Cap Value Index Fund | -- | 4,816,274 | 244,860 | 35,917 | (10,540) | 327,638 | 4,888,512 |
| Fidelity Series Long-Term Treasury Bond Index Fund | -- | 2,529,431 | 116,428 | 14,553 | 342 | 104,360 | 2,517,705 |
| Fidelity Series Real Estate Income Fund | -- | 205,887 | 6,508 | 1,337 | (134) | 8,812 | 208,057 |
| Fidelity Series Short-Term Credit Fund | -- | 555,908 | 17,091 | 2,957 | 7 | 5,074 | 543,898 |
| Fidelity Series Small Cap Opportunities Fund | -- | 1,275,480 | 101,675 | 3,543 | (1,922) | 128,165 | 1,300,048 |
| Fidelity Series Treasury Bill Index Fund | -- | 1,676,535 | 105,909 | 9,501 | (70) | (1,027) | 1,569,529 |
| Fidelity Series Value Discovery Fund | -- | 1,523,705 | 63,083 | 3,081 | (3,766) | 86,236 | 1,543,092 |
| | $-- | $43,981,184 | $2,315,280 | $179,746 | $(40,442) | $2,453,239 | $44,078,701 |
Amounts in the income column in the above table include any capital gain distributions from underlying funds, which are presented in the corresponding line-item in the Statement of Operations, if applicable.
Investment Valuation
All investments are categorized as Level 1 under the Fair Value Hierarchy. The inputs or methodology used for valuing securities may not be an indication of the risk associated with investing in those securities. For more information on valuation inputs please refer to the Investment Valuation section in the accompanying Notes to Financial Statements.
See accompanying notes which are an integral part of the financial statements.
Fidelity Freedom® Blend 2025 Fund
Financial Statements
Statement of Assets and Liabilities
| | | March 31, 2019 |
| Assets | | |
Investment in securities, at value — See accompanying schedule:
| | |
| Fidelity Central Funds (cost $49) | $49 | |
| Other affiliated issuers (cost $41,625,462) | 44,078,701 | |
| Total Investment in Securities (cost $41,625,511) | | $44,078,750 |
| Cash | | 147 |
| Receivable for investments sold | | 174,237 |
| Receivable for fund shares sold | | 17,172 |
| Total assets | | 44,270,306 |
| Liabilities | | |
| Payable for investments purchased | $191,409 | |
| Payable for fund shares redeemed | 1 | |
| Accrued management fee | 11,461 | |
| Distribution and service plan fees payable | 576 | |
| Total liabilities | | 203,447 |
| Net Assets | | $44,066,859 |
| Net Assets consist of: | | |
| Paid in capital | | $41,535,170 |
| Total distributable earnings (loss) | | 2,531,689 |
| Net Assets | | $44,066,859 |
| Net Asset Value and Maximum Offering Price | | |
| Class A: | | |
| Net Asset Value and redemption price per share ($168,492 ÷ 17,156 shares) | | $9.82 |
| Maximum offering price per share (100/94.25 of $9.82) | | $10.42 |
| Class M: | | |
| Net Asset Value and redemption price per share ($746,071 ÷ 75,989 shares) | | $9.82 |
| Maximum offering price per share (100/96.50 of $9.82) | | $10.18 |
| Class C: | | |
| Net Asset Value and offering price per share ($298,211 ÷ 30,407 shares)(a) | | $9.81 |
| Fidelity Freedom Blend 2025 Fund: | | |
| Net Asset Value, offering price and redemption price per share ($1,621,125 ÷ 165,059 shares) | | $9.82 |
| Class K: | | |
| Net Asset Value, offering price and redemption price per share ($100,509 ÷ 10,220 shares) | | $9.83 |
| Class K6: | | |
| Net Asset Value, offering price and redemption price per share ($40,827,895 ÷ 4,151,179 shares) | | $9.84 |
| Class I: | | |
| Net Asset Value, offering price and redemption price per share ($100,450 ÷ 10,217 shares) | | $9.83 |
| Class Z: | | |
| Net Asset Value, offering price and redemption price per share ($100,509 ÷ 10,220 shares) | | $9.83 |
| Class Z6: | | |
| Net Asset Value, offering price and redemption price per share ($103,597 ÷ 10,531 shares) | | $9.84 |
(a) Redemption price per share is equal to net asset value less any applicable contingent deferred sales charge.
See accompanying notes which are an integral part of the financial statements.
Statement of Operations
| | | For the period
August 31, 2018 (commencement of operations) to
March 31, 2019 |
| Investment Income | | |
| Dividends: | | |
| Affiliated issuers | | $120,280 |
| Income from Fidelity Central Funds | | 195 |
| Total income | | 120,475 |
| Expenses | | |
| Management fee | $30,012 | |
| Distribution and service plan fees | 1,497 | |
| Independent trustees' fees and expenses | 20 | |
| Total expenses | | 31,529 |
| Net investment income (loss) | | 88,946 |
| Realized and Unrealized Gain (Loss) | | |
| Net realized gain (loss) on: | | |
| Investment securities: | | |
| Affiliated issuers | (40,442) | |
| Capital gain distributions from underlying funds: | | |
| Affiliated issuers | 59,466 | |
| Total net realized gain (loss) | | 19,024 |
| Change in net unrealized appreciation (depreciation) on: | | |
| Investment securities: | | |
| Affiliated issuers | 2,453,239 | |
| Total change in net unrealized appreciation (depreciation) | | 2,453,239 |
| Net gain (loss) | | 2,472,263 |
| Net increase (decrease) in net assets resulting from operations | | $2,561,209 |
See accompanying notes which are an integral part of the financial statements.
Statement of Changes in Net Assets
| | For the period
August 31, 2018 (commencement of operations) to
March 31, 2019 |
| Increase (Decrease) in Net Assets | |
| Operations | |
| Net investment income (loss) | $88,946 |
| Net realized gain (loss) | 19,024 |
| Change in net unrealized appreciation (depreciation) | 2,453,239 |
| Net increase (decrease) in net assets resulting from operations | 2,561,209 |
| Distributions to shareholders | (29,520) |
| Total distributions | (29,520) |
| Share transactions - net increase (decrease) | 41,535,170 |
| Total increase (decrease) in net assets | 44,066,859 |
| Net Assets | |
| Beginning of period | – |
| End of period | $44,066,859 |
See accompanying notes which are an integral part of the financial statements.
Financial Highlights
Fidelity Freedom Blend 2025 Fund Class A
| Year ended March 31, | 2019 A |
| Selected Per–Share Data | |
| Net asset value, beginning of period | $10.00 |
| Income from Investment Operations | |
| Net investment income (loss)B | .03 |
| Net realized and unrealized gain (loss) | (.02)C |
| Total from investment operations | .01 |
| Distributions from net investment income | (.11) |
| Distributions from net realized gain | (.08) |
| Total distributions | (.19) |
| Net asset value, end of period | $9.82 |
| Total ReturnD,E | .29% |
| Ratios to Average Net AssetsF,G | |
| Expenses before reductions | .76%H |
| Expenses net of fee waivers, if any | .76%H |
| Expenses net of all reductions | .76%H |
| Net investment income (loss) | .58%H |
| Supplemental Data | |
| Net assets, end of period (000 omitted) | $168 |
| Portfolio turnover rateG | 23%H |
A For the period August 31, 2018 (commencement of operations) to March 31, 2019.
B Calculated based on average shares outstanding during the period.
C The amount shown for a share outstanding does not correspond with the aggregate net gain (loss) on investments for the period due to the timing of sales and repurchases of shares in relation to fluctuating market values of the investments of the Fund.
D Total returns for periods of less than one year are not annualized.
E Total returns do not include the effect of the sales charges.
F Expense ratios reflect operating expenses of the class. Expenses before reductions do not reflect amounts reimbursed by the investment adviser or reductions from expense offset arrangements and do not represent the amount paid by the class during periods when reimbursements or reductions occur. Expense ratios before reductions for start-up periods may not be representative of longer-term operating periods. Expenses net of fee waivers reflect expenses after reimbursement by the investment adviser but prior to reductions from expense offset arrangements. Expenses net of all reductions represent the net expenses paid by the class but do not include expenses of the underlying funds in which the Fund invests.
G Amounts do not include the activity of the Underlying Funds.
H Annualized
See accompanying notes which are an integral part of the financial statements.
Fidelity Freedom Blend 2025 Fund Class M
| Year ended March 31, | 2019 A |
| Selected Per–Share Data | |
| Net asset value, beginning of period | $10.00 |
| Income from Investment Operations | |
| Net investment income (loss)B | .02 |
| Net realized and unrealized gain (loss) | (.02)C |
| Total from investment operations | – |
| Distributions from net investment income | (.10) |
| Distributions from net realized gain | (.08) |
| Total distributions | (.18) |
| Net asset value, end of period | $9.82 |
| Total ReturnD,E | .16% |
| Ratios to Average Net AssetsF,G | |
| Expenses before reductions | 1.02%H,I |
| Expenses net of fee waivers, if any | 1.02%H,I |
| Expenses net of all reductions | 1.02%H,I |
| Net investment income (loss) | .32%H |
| Supplemental Data | |
| Net assets, end of period (000 omitted) | $746 |
| Portfolio turnover rateG | 23%H |
A For the period August 31, 2018 (commencement of operations) to March 31, 2019.
B Calculated based on average shares outstanding during the period.
C The amount shown for a share outstanding does not correspond with the aggregate net gain (loss) on investments for the period due to the timing of sales and repurchases of shares in relation to fluctuating market values of the investments of the Fund.
D Total returns for periods of less than one year are not annualized.
E Total returns do not include the effect of the sales charges.
F Expense ratios reflect operating expenses of the class. Expenses before reductions do not reflect amounts reimbursed by the investment adviser or reductions from expense offset arrangements and do not represent the amount paid by the class during periods when reimbursements or reductions occur. Expense ratios before reductions for start-up periods may not be representative of longer-term operating periods. Expenses net of fee waivers reflect expenses after reimbursement by the investment adviser but prior to reductions from expense offset arrangements. Expenses net of all reductions represent the net expenses paid by the class but do not include expenses of the underlying funds in which the Fund invests.
G Amounts do not include the activity of the Underlying Funds.
H Annualized
I On certain classes, the size and fluctuation of net assets and expense amounts may cause ratios to differ from contractual rates.
See accompanying notes which are an integral part of the financial statements.
Fidelity Freedom Blend 2025 Fund Class C
| Year ended March 31, | 2019 A |
| Selected Per–Share Data | |
| Net asset value, beginning of period | $10.00 |
| Income from Investment Operations | |
| Net investment income (loss)B | (.01) |
| Net realized and unrealized gain (loss) | (.02)C |
| Total from investment operations | (.03) |
| Distributions from net investment income | (.09) |
| Distributions from net realized gain | (.08) |
| Total distributions | (.16)D |
| Net asset value, end of period | $9.81 |
| Total ReturnE,F | (.12)% |
| Ratios to Average Net AssetsG,H | |
| Expenses before reductions | 1.51%I |
| Expenses net of fee waivers, if any | 1.51%I |
| Expenses net of all reductions | 1.51%I |
| Net investment income (loss) | (.17)%I |
| Supplemental Data | |
| Net assets, end of period (000 omitted) | $298 |
| Portfolio turnover rateH | 23%I |
A For the period August 31, 2018 (commencement of operations) to March 31, 2019.
B Calculated based on average shares outstanding during the period.
C The amount shown for a share outstanding does not correspond with the aggregate net gain (loss) on investments for the period due to the timing of sales and repurchases of shares in relation to fluctuating market values of the investments of the Fund.
D Total distributions of $.16 per share is comprised of distributions from net investment income of $.085 and distributions from net realized gain of $.078 per share.
E Total returns for periods of less than one year are not annualized.
F Total returns do not include the effect of the contingent deferred sales charge.
G Expense ratios reflect operating expenses of the class. Expenses before reductions do not reflect amounts reimbursed by the investment adviser or reductions from expense offset arrangements and do not represent the amount paid by the class during periods when reimbursements or reductions occur. Expense ratios before reductions for start-up periods may not be representative of longer-term operating periods. Expenses net of fee waivers reflect expenses after reimbursement by the investment adviser but prior to reductions from expense offset arrangements. Expenses net of all reductions represent the net expenses paid by the class but do not include expenses of the underlying funds in which the Fund invests.
H Amounts do not include the activity of the Underlying Funds.
I Annualized
See accompanying notes which are an integral part of the financial statements.
Fidelity Freedom Blend 2025 Fund
| Year ended March 31, | 2019 A |
| Selected Per–Share Data | |
| Net asset value, beginning of period | $10.00 |
| Income from Investment Operations | |
| Net investment income (loss)B | .05 |
| Net realized and unrealized gain (loss) | (.03)C |
| Total from investment operations | .02 |
| Distributions from net investment income | (.13) |
| Distributions from net realized gain | (.08) |
| Total distributions | (.20)D |
| Net asset value, end of period | $9.82 |
| Total ReturnE | .42% |
| Ratios to Average Net AssetsF,G | |
| Expenses before reductions | .52%H,I |
| Expenses net of fee waivers, if any | .52%H,I |
| Expenses net of all reductions | .52%H,I |
| Net investment income (loss) | .83%H |
| Supplemental Data | |
| Net assets, end of period (000 omitted) | $1,621 |
| Portfolio turnover rateG | 23%H |
A For the period August 31, 2018 (commencement of operations) to March 31, 2019.
B Calculated based on average shares outstanding during the period.
C The amount shown for a share outstanding does not correspond with the aggregate net gain (loss) on investments for the period due to the timing of sales and repurchases of shares in relation to fluctuating market values of the investments of the Fund.
D Total distributions of $.20 per share is comprised of distributions from net investment income of $.125 and distributions from net realized gain of $.078 per share.
E Total returns for periods of less than one year are not annualized.
F Expense ratios reflect operating expenses of the class. Expenses before reductions do not reflect amounts reimbursed by the investment adviser or reductions from expense offset arrangements and do not represent the amount paid by the class during periods when reimbursements or reductions occur. Expense ratios before reductions for start-up periods may not be representative of longer-term operating periods. Expenses net of fee waivers reflect expenses after reimbursement by the investment adviser but prior to reductions from expense offset arrangements. Expenses net of all reductions represent the net expenses paid by the class but do not include expenses of the underlying funds in which the Fund invests.
G Amounts do not include the activity of the Underlying Funds.
H Annualized
I On certain classes, the size and fluctuation of net assets and expense amounts may cause ratios to differ from contractual rates.
See accompanying notes which are an integral part of the financial statements.
Fidelity Freedom Blend 2025 Fund Class K
| Year ended March 31, | 2019 A |
| Selected Per–Share Data | |
| Net asset value, beginning of period | $10.00 |
| Income from Investment Operations | |
| Net investment income (loss)B | .05 |
| Net realized and unrealized gain (loss) | (.02)C |
| Total from investment operations | .03 |
| Distributions from net investment income | (.12) |
| Distributions from net realized gain | (.08) |
| Total distributions | (.20) |
| Net asset value, end of period | $9.83 |
| Total ReturnD | .47% |
| Ratios to Average Net AssetsE,F | |
| Expenses before reductions | .41%G |
| Expenses net of fee waivers, if any | .41%G |
| Expenses net of all reductions | .41%G |
| Net investment income (loss) | .93%G |
| Supplemental Data | |
| Net assets, end of period (000 omitted) | $101 |
| Portfolio turnover rateF | 23%G |
A For the period August 31, 2018 (commencement of operations) to March 31, 2019.
B Calculated based on average shares outstanding during the period.
C The amount shown for a share outstanding does not correspond with the aggregate net gain (loss) on investments for the period due to the timing of sales and repurchases of shares in relation to fluctuating market values of the investments of the Fund.
D Total returns for periods of less than one year are not annualized.
E Expense ratios reflect operating expenses of the class. Expenses before reductions do not reflect amounts reimbursed by the investment adviser or reductions from expense offset arrangements and do not represent the amount paid by the class during periods when reimbursements or reductions occur. Expense ratios before reductions for start-up periods may not be representative of longer-term operating periods. Expenses net of fee waivers reflect expenses after reimbursement by the investment adviser but prior to reductions from expense offset arrangements. Expenses net of all reductions represent the net expenses paid by the class but do not include expenses of the underlying funds in which the Fund invests.
F Amounts do not include the activity of the Underlying Funds.
G Annualized
See accompanying notes which are an integral part of the financial statements.
Fidelity Freedom Blend 2025 Fund Class K6
| Year ended March 31, | 2019 A |
| Selected Per–Share Data | |
| Net asset value, beginning of period | $10.00 |
| Income from Investment Operations | |
| Net investment income (loss)B | .06 |
| Net realized and unrealized gain (loss) | (.02)C |
| Total from investment operations | .04 |
| Distributions from net investment income | (.12) |
| Distributions from net realized gain | (.08) |
| Total distributions | (.20) |
| Net asset value, end of period | $9.84 |
| Total ReturnD | .60% |
| Ratios to Average Net AssetsE,F | |
| Expenses before reductions | .32%G,H |
| Expenses net of fee waivers, if any | .32%G,H |
| Expenses net of all reductions | .32%G,H |
| Net investment income (loss) | 1.02%G |
| Supplemental Data | |
| Net assets, end of period (000 omitted) | $40,828 |
| Portfolio turnover rateF | 23%G |
A For the period August 31, 2018 (commencement of operations) to March 31, 2019.
B Calculated based on average shares outstanding during the period.
C The amount shown for a share outstanding does not correspond with the aggregate net gain (loss) on investments for the period due to the timing of sales and repurchases of shares in relation to fluctuating market values of the investments of the Fund.
D Total returns for periods of less than one year are not annualized.
E Expense ratios reflect operating expenses of the class. Expenses before reductions do not reflect amounts reimbursed by the investment adviser or reductions from expense offset arrangements and do not represent the amount paid by the class during periods when reimbursements or reductions occur. Expenses net of fee waivers reflect expenses after reimbursement by the investment adviser but prior to reductions from expense offset arrangements. Expenses net of all reductions represent the net expenses paid by the class but do not include expenses of the underlying funds in which the Fund invests.
F Amounts do not include the activity of the Underlying Funds.
G Annualized
H On certain classes, the size and fluctuation of net assets and expense amounts may cause ratios to differ from contractual rates.
See accompanying notes which are an integral part of the financial statements.
Fidelity Freedom Blend 2025 Fund Class I
| Year ended March 31, | 2019 A |
| Selected Per–Share Data | |
| Net asset value, beginning of period | $10.00 |
| Income from Investment Operations | |
| Net investment income (loss)B | .05 |
| Net realized and unrealized gain (loss) | (.02)C |
| Total from investment operations | .03 |
| Distributions from net investment income | (.12) |
| Distributions from net realized gain | (.08) |
| Total distributions | (.20) |
| Net asset value, end of period | $9.83 |
| Total ReturnD | .43% |
| Ratios to Average Net AssetsE,F | |
| Expenses before reductions | .51%G |
| Expenses net of fee waivers, if any | .51%G |
| Expenses net of all reductions | .51%G |
| Net investment income (loss) | .83%G |
| Supplemental Data | |
| Net assets, end of period (000 omitted) | $100 |
| Portfolio turnover rateF | 23%G |
A For the period August 31, 2018 (commencement of operations) to March 31, 2019.
B Calculated based on average shares outstanding during the period.
C The amount shown for a share outstanding does not correspond with the aggregate net gain (loss) on investments for the period due to the timing of sales and repurchases of shares in relation to fluctuating market values of the investments of the Fund.
D Total returns for periods of less than one year are not annualized.
E Expense ratios reflect operating expenses of the class. Expenses before reductions do not reflect amounts reimbursed by the investment adviser or reductions from expense offset arrangements and do not represent the amount paid by the class during periods when reimbursements or reductions occur. Expense ratios before reductions for start-up periods may not be representative of longer-term operating periods. Expenses net of fee waivers reflect expenses after reimbursement by the investment adviser but prior to reductions from expense offset arrangements. Expenses net of all reductions represent the net expenses paid by the class but do not include expenses of the underlying funds in which the Fund invests.
F Amounts do not include the activity of the Underlying Funds.
G Annualized
See accompanying notes which are an integral part of the financial statements.
Fidelity Freedom Blend 2025 Fund Class Z
| Year ended March 31, | 2019 A |
| Selected Per–Share Data | |
| Net asset value, beginning of period | $10.00 |
| Income from Investment Operations | |
| Net investment income (loss)B | .05 |
| Net realized and unrealized gain (loss) | (.02)C |
| Total from investment operations | .03 |
| Distributions from net investment income | (.12) |
| Distributions from net realized gain | (.08) |
| Total distributions | (.20) |
| Net asset value, end of period | $9.83 |
| Total ReturnD | .47% |
| Ratios to Average Net AssetsE,F | |
| Expenses before reductions | .41%G |
| Expenses net of fee waivers, if any | .41%G |
| Expenses net of all reductions | .41%G |
| Net investment income (loss) | .93%G |
| Supplemental Data | |
| Net assets, end of period (000 omitted) | $101 |
| Portfolio turnover rateF | 23%G |
A For the period August 31, 2018 (commencement of operations) to March 31, 2019.
B Calculated based on average shares outstanding during the period.
C The amount shown for a share outstanding does not correspond with the aggregate net gain (loss) on investments for the period due to the timing of sales and repurchases of shares in relation to fluctuating market values of the investments of the Fund.
D Total returns for periods of less than one year are not annualized.
E Expense ratios reflect operating expenses of the class. Expenses before reductions do not reflect amounts reimbursed by the investment adviser or reductions from expense offset arrangements and do not represent the amount paid by the class during periods when reimbursements or reductions occur. Expense ratios before reductions for start-up periods may not be representative of longer-term operating periods. Expenses net of fee waivers reflect expenses after reimbursement by the investment adviser but prior to reductions from expense offset arrangements. Expenses net of all reductions represent the net expenses paid by the class but do not include expenses of the underlying funds in which the Fund invests.
F Amounts do not include the activity of the Underlying Funds.
G Annualized
See accompanying notes which are an integral part of the financial statements.
Fidelity Freedom Blend 2025 Fund Class Z6
| Year ended March 31, | 2019 A |
| Selected Per–Share Data | |
| Net asset value, beginning of period | $10.00 |
| Income from Investment Operations | |
| Net investment income (loss)B | .06 |
| Net realized and unrealized gain (loss) | (.02)C |
| Total from investment operations | .04 |
| Distributions from net investment income | (.12) |
| Distributions from net realized gain | (.08) |
| Total distributions | (.20) |
| Net asset value, end of period | $9.84 |
| Total ReturnD | .60% |
| Ratios to Average Net AssetsE,F | |
| Expenses before reductions | .31%G |
| Expenses net of fee waivers, if any | .31%G |
| Expenses net of all reductions | .31%G |
| Net investment income (loss) | 1.03%G |
| Supplemental Data | |
| Net assets, end of period (000 omitted) | $104 |
| Portfolio turnover rateF | 23%G |
A For the period August 31, 2018 (commencement of operations) to March 31, 2019.
B Calculated based on average shares outstanding during the period.
C The amount shown for a share outstanding does not correspond with the aggregate net gain (loss) on investments for the period due to the timing of sales and repurchases of shares in relation to fluctuating market values of the investments of the Fund.
D Total returns for periods of less than one year are not annualized.
E Expense ratios reflect operating expenses of the class. Expenses before reductions do not reflect amounts reimbursed by the investment adviser or reductions from expense offset arrangements and do not represent the amount paid by the class during periods when reimbursements or reductions occur. Expenses net of fee waivers reflect expenses after reimbursement by the investment adviser but prior to reductions from expense offset arrangements. Expenses net of all reductions represent the net expenses paid by the class but do not include expenses of the underlying funds in which the Fund invests.
F Amounts do not include the activity of the Underlying Funds.
G Annualized
See accompanying notes which are an integral part of the financial statements.
Fidelity Freedom® Blend 2030 Fund
Investment Summary (Unaudited)
The information in the following tables is based on the direct investments of the Fund.
Top Holdings as of March 31, 2019
| | % of fund's net assets |
| Fidelity Series Large Cap Value Index Fund | 13.5 |
| Fidelity Series Blue Chip Growth Fund | 9.2 |
| Fidelity Series Emerging Markets Opportunities Fund | 7.5 |
| Fidelity Series Large Cap Growth Index Fund | 7.2 |
| Fidelity Series Large Cap Stock Fund | 7.2 |
| Fidelity Series International Growth Fund | 6.4 |
| Fidelity Series International Value Fund | 6.3 |
| Fidelity Series Long-Term Treasury Bond Index Fund | 5.9 |
| Fidelity Series Investment Grade Bond Fund | 4.7 |
| Fidelity Series Government Bond Index Fund | 4.5 |
| | 72.4 |
Asset Allocation (% of fund's net assets)
| Period end |
| | Domestic Equity Funds | 47.2% |
| | International Equity Funds | 25.1% |
| | Bond Funds | 25.8% |
| | Short-Term Funds | 1.9% |

Domestic Equity Funds category includes Fidelity Series Commodity Strategy Fund which invests in commodity-related investments.
Fidelity Freedom® Blend 2030 Fund
Schedule of Investments March 31, 2019
Showing Percentage of Net Assets
| Domestic Equity Funds - 47.2% | | | |
| | | Shares | Value |
| Fidelity Series Blue Chip Growth Fund (a) | | 150,197 | $2,215,402 |
| Fidelity Series Commodity Strategy Fund (a) | | 113,060 | 539,298 |
| Fidelity Series Large Cap Growth Index Fund (a) | | 172,196 | 1,735,738 |
| Fidelity Series Large Cap Stock Fund (a) | | 117,610 | 1,722,980 |
| Fidelity Series Large Cap Value Index Fund (a) | | 259,986 | 3,226,419 |
| Fidelity Series Small Cap Opportunities Fund (a) | | 63,945 | 860,698 |
| Fidelity Series Value Discovery Fund (a) | | 81,733 | 1,020,845 |
| TOTAL DOMESTIC EQUITY FUNDS | | | |
| (Cost $10,369,643) | | | 11,321,380 |
|
| International Equity Funds - 25.1% | | | |
| Fidelity Series Canada Fund (a) | | 17,755 | 183,055 |
| Fidelity Series Emerging Markets Fund (a) | | 20,199 | 197,749 |
| Fidelity Series Emerging Markets Opportunities Fund (a) | | 96,687 | 1,791,612 |
| Fidelity Series International Growth Fund (a) | | 101,089 | 1,535,541 |
| Fidelity Series International Index Fund (a) | | 41,084 | 403,447 |
| Fidelity Series International Small Cap Fund (a) | | 25,878 | 401,884 |
| Fidelity Series International Value Fund (a) | | 163,121 | 1,517,027 |
| TOTAL INTERNATIONAL EQUITY FUNDS | | | |
| (Cost $5,588,154) | | | 6,030,315 |
|
| Bond Funds - 25.8% | | | |
| Fidelity Series Corporate Bond Fund (a) | | 77,233 | 783,911 |
| Fidelity Series Emerging Markets Debt Fund (a) | | 17,518 | 167,998 |
| Fidelity Series Floating Rate High Income Fund (a) | | 3,887 | 36,030 |
| Fidelity Series Government Bond Index Fund (a) | | 105,084 | 1,073,956 |
| Fidelity Series High Income Fund (a) | | 29,802 | 280,135 |
| Fidelity Series Inflation-Protected Bond Index Fund (a) | | 36,883 | 360,714 |
| Fidelity Series Investment Grade Bond Fund (a) | | 102,154 | 1,142,086 |
| Fidelity Series Investment Grade Securitized Fund (a) | | 79,317 | 808,243 |
| Fidelity Series Long-Term Treasury Bond Index Fund (a) | | 159,470 | 1,414,497 |
| Fidelity Series Real Estate Income Fund (a) | | 10,383 | 113,275 |
| TOTAL BOND FUNDS | | | |
| (Cost $6,018,079) | | | 6,180,845 |
|
| Short-Term Funds - 1.9% | | | |
| Fidelity Cash Central Fund, 2.48% (b) | | 49 | 49 |
| Fidelity Series Government Money Market Fund 2.5% (a)(c) | | 99,943 | 99,943 |
| Fidelity Series Short-Term Credit Fund (a) | | 10,075 | 100,451 |
| Fidelity Series Treasury Bill Index Fund (a) | | 26,245 | 262,183 |
| TOTAL SHORT-TERM FUNDS | | | |
| (Cost $461,819) | | | 462,626 |
| TOTAL INVESTMENT IN SECURITIES - 100.0% | | | |
| (Cost $22,437,695) | | | 23,995,166 |
| NET OTHER ASSETS (LIABILITIES) - 0.0% | | | (6,465) |
| NET ASSETS - 100% | | | $23,988,701 |
Legend
(a) Affiliated Fund
(b) Affiliated fund that is generally available only to investment companies and other accounts managed by Fidelity Investments. The rate quoted is the annualized seven-day yield of the fund at period end. A complete unaudited listing of the fund's holdings as of its most recent quarter end is available upon request. In addition, each Fidelity Central Fund's financial statements, which are not covered by the Fund's Report of Independent Registered Public Accounting Firm, are available on the SEC's website or upon request.
(c) The rate quoted is the annualized seven-day yield of the fund at period end.
Affiliated Central Funds
Information regarding fiscal year to date income earned by the Fund from investments in Fidelity Central Funds is as follows:
| Fund | Income earned |
| Fidelity Cash Central Fund | $195 |
| Total | $195 |
Amounts in the income column in the above table include any capital gain distributions from underlying funds, which are presented in the corresponding line-item in the Statement of Operations, if applicable.
Affiliated Underlying Funds
Fiscal year to date information regarding the Fund's investments in affiliated Underlying Funds, excluding any Money Market Central Funds, is presented below. Exchanges between classes of the same affiliated Underlying Funds may occur.
| Affiliate | Value, beginning of period | Purchases | Sales Proceeds | Dividend Income | Realized Gain (loss) | Change in Unrealized appreciation (depreciation) | Value, end of period |
| Fidelity Series Blue Chip Growth Fund | $-- | $2,176,859 | $187,082 | $11,358 | $(9,398) | $235,023 | $2,215,402 |
| Fidelity Series Canada Fund | -- | 186,440 | 17,075 | 179 | (421) | 14,111 | 183,055 |
| Fidelity Series Commodity Strategy Fund | -- | 553,697 | 25,860 | 1,278 | (1,578) | 13,039 | 539,298 |
| Fidelity Series Corporate Bond Fund | -- | 808,110 | 49,561 | 6,507 | 71 | 25,291 | 783,911 |
| Fidelity Series Emerging Markets Debt Fund | -- | 172,834 | 8,029 | 1,862 | (16) | 3,209 | 167,998 |
| Fidelity Series Emerging Markets Fund | -- | 197,938 | 11,105 | 34 | (127) | 11,043 | 197,749 |
| Fidelity Series Emerging Markets Opportunities Fund | -- | 1,778,879 | 134,856 | 6,312 | (2,617) | 150,206 | 1,791,612 |
| Fidelity Series Floating Rate High Income Fund | -- | 37,990 | 2,399 | 499 | (44) | 483 | 36,030 |
| Fidelity Series Government Bond Index Fund | -- | 1,119,489 | 61,692 | 5,846 | (99) | 16,258 | 1,073,956 |
| Fidelity Series Government Money Market Fund 2.5% | -- | 105,627 | 5,684 | 511 | -- | -- | 99,943 |
| Fidelity Series High Income Fund | -- | 315,712 | 45,942 | 3,960 | (182) | 10,547 | 280,135 |
| Fidelity Series Inflation-Protected Bond Index Fund | -- | 373,684 | 19,410 | 410 | (15) | 6,455 | 360,714 |
| Fidelity Series International Growth Fund | -- | 1,507,154 | 104,335 | 4,417 | (5,370) | 138,092 | 1,535,541 |
| Fidelity Series International Index Fund | -- | 406,179 | 28,179 | 103 | (542) | 25,989 | 403,447 |
| Fidelity Series International Small Cap Fund | -- | 401,611 | 25,496 | 1,659 | (2,149) | 27,918 | 401,884 |
| Fidelity Series International Value Fund | -- | 1,550,824 | 103,511 | 2,438 | (5,088) | 74,802 | 1,517,027 |
| Fidelity Series Investment Grade Bond Fund | -- | 1,188,645 | 72,818 | 7,868 | 58 | 26,201 | 1,142,086 |
| Fidelity Series Investment Grade Securitized Fund | -- | 853,824 | 57,511 | 5,569 | (45) | 11,975 | 808,243 |
| Fidelity Series Large Cap Growth Index Fund | -- | 1,691,442 | 139,367 | 391 | (3,577) | 187,240 | 1,735,738 |
| Fidelity Series Large Cap Stock Fund | -- | 1,710,217 | 124,971 | 3,033 | (5,693) | 143,427 | 1,722,980 |
| Fidelity Series Large Cap Value Index Fund | -- | 3,232,096 | 222,103 | 24,548 | (8,386) | 224,812 | 3,226,419 |
| Fidelity Series Long-Term Treasury Bond Index Fund | -- | 1,444,472 | 87,114 | 8,400 | (321) | 57,460 | 1,414,497 |
| Fidelity Series Real Estate Income Fund | -- | 114,802 | 6,289 | 794 | (125) | 4,887 | 113,275 |
| Fidelity Series Short-Term Credit Fund | -- | 105,320 | 5,800 | 570 | 3 | 928 | 100,451 |
| Fidelity Series Small Cap Opportunities Fund | -- | 847,415 | 70,130 | 3,909 | (4,759) | 88,172 | 860,698 |
| Fidelity Series Treasury Bill Index Fund | -- | 317,461 | 55,114 | 1,799 | (43) | (121) | 262,183 |
| Fidelity Series Value Discovery Fund | -- | 1,030,634 | 65,931 | 2,705 | (3,882) | 60,024 | 1,020,845 |
| | $-- | $24,229,355 | $1,737,364 | $106,959 | $(54,345) | $1,557,471 | $23,995,117 |
Amounts in the income column in the above table include any capital gain distributions from underlying funds, which are presented in the corresponding line-item in the Statement of Operations, if applicable.
Investment Valuation
All investments are categorized as Level 1 under the Fair Value Hierarchy. The inputs or methodology used for valuing securities may not be an indication of the risk associated with investing in those securities. For more information on valuation inputs please refer to the Investment Valuation section in the accompanying Notes to Financial Statements.
See accompanying notes which are an integral part of the financial statements.
Fidelity Freedom® Blend 2030 Fund
Financial Statements
Statement of Assets and Liabilities
| | | March 31, 2019 |
| Assets | | |
Investment in securities, at value — See accompanying schedule:
| | |
| Fidelity Central Funds (cost $49) | $49 | |
| Other affiliated issuers (cost $22,437,646) | 23,995,117 | |
| Total Investment in Securities (cost $22,437,695) | | $23,995,166 |
| Cash | | 146 |
| Receivable for investments sold | | 69,443 |
| Receivable for fund shares sold | | 16,177 |
| Total assets | | 24,080,932 |
| Liabilities | | |
| Payable for investments purchased | $84,502 | |
| Payable for fund shares redeemed | 1,113 | |
| Accrued management fee | 6,282 | |
| Distribution and service plan fees payable | 334 | |
| Total liabilities | | 92,231 |
| Net Assets | | $23,988,701 |
| Net Assets consist of: | | |
| Paid in capital | | $22,424,829 |
| Total distributable earnings (loss) | | 1,563,872 |
| Net Assets | | $23,988,701 |
| Net Asset Value and Maximum Offering Price | | |
| Class A: | | |
| Net Asset Value and redemption price per share ($347,805 ÷ 35,918 shares) | | $9.68 |
| Maximum offering price per share (100/94.25 of $9.68) | | $10.27 |
| Class M: | | |
| Net Asset Value and redemption price per share ($170,098 ÷ 17,572 shares) | | $9.68 |
| Maximum offering price per share (100/96.50 of $9.68) | | $10.03 |
| Class C: | | |
| Net Asset Value and offering price per share ($259,470 ÷ 26,871 shares)(a) | | $9.66 |
| Fidelity Freedom Blend 2030 Fund: | | |
| Net Asset Value, offering price and redemption price per share ($762,319 ÷ 78,679 shares) | | $9.69 |
| Class K: | | |
| Net Asset Value, offering price and redemption price per share ($99,804 ÷ 10,293 shares) | | $9.70 |
| Class K6: | | |
| Net Asset Value, offering price and redemption price per share ($21,781,426 ÷ 2,246,423 shares) | | $9.70 |
| Class I: | | |
| Net Asset Value, offering price and redemption price per share ($99,745 ÷ 10,290 shares) | | $9.69 |
| Class Z: | | |
| Net Asset Value, offering price and redemption price per share ($99,804 ÷ 10,293 shares) | | $9.70 |
| Class Z6: | | |
| Net Asset Value, offering price and redemption price per share ($368,230 ÷ 37,977 shares) | | $9.70 |
(a) Redemption price per share is equal to net asset value less any applicable contingent deferred sales charge.
See accompanying notes which are an integral part of the financial statements.
Statement of Operations
| | | For the period
August 31, 2018 (commencement of operations) to
March 31, 2019 |
| Investment Income | | |
| Dividends: | | |
| Affiliated issuers | | $59,106 |
| Income from Fidelity Central Funds | | 195 |
| Total income | | 59,301 |
| Expenses | | |
| Management fee | $17,639 | |
| Distribution and service plan fees | 1,546 | |
| Independent trustees' fees and expenses | 12 | |
| Total expenses | | 19,197 |
| Net investment income (loss) | | 40,104 |
| Realized and Unrealized Gain (Loss) | | |
| Net realized gain (loss) on: | | |
| Investment securities: | | |
| Affiliated issuers | (54,345) | |
| Capital gain distributions from underlying funds: | | |
| Affiliated issuers | 47,853 | |
| Total net realized gain (loss) | | (6,492) |
| Change in net unrealized appreciation (depreciation) on: | | |
| Investment securities: | | |
| Affiliated issuers | 1,557,471 | |
| Total change in net unrealized appreciation (depreciation) | | 1,557,471 |
| Net gain (loss) | | 1,550,979 |
| Net increase (decrease) in net assets resulting from operations | | $1,591,083 |
See accompanying notes which are an integral part of the financial statements.
Statement of Changes in Net Assets
| | For the period
August 31, 2018 (commencement of operations) to
March 31, 2019 |
| Increase (Decrease) in Net Assets | |
| Operations | |
| Net investment income (loss) | $40,104 |
| Net realized gain (loss) | (6,492) |
| Change in net unrealized appreciation (depreciation) | 1,557,471 |
| Net increase (decrease) in net assets resulting from operations | 1,591,083 |
| Distributions to shareholders | (27,211) |
| Total distributions | (27,211) |
| Share transactions - net increase (decrease) | 22,424,829 |
| Total increase (decrease) in net assets | 23,988,701 |
| Net Assets | |
| Beginning of period | – |
| End of period | $23,988,701 |
See accompanying notes which are an integral part of the financial statements.
Financial Highlights
Fidelity Freedom Blend 2030 Fund Class A
| Year ended March 31, | 2019 A |
| Selected Per–Share Data | |
| Net asset value, beginning of period | $10.00 |
| Income from Investment Operations | |
| Net investment income (loss)B | .02 |
| Net realized and unrealized gain (loss) | (.09)C |
| Total from investment operations | (.07) |
| Distributions from net investment income | (.13) |
| Distributions from net realized gain | (.12) |
| Total distributions | (.25) |
| Net asset value, end of period | $9.68 |
| Total ReturnD,E | (.45)% |
| Ratios to Average Net AssetsF,G | |
| Expenses before reductions | .78%H,I |
| Expenses net of fee waivers, if any | .78%H,I |
| Expenses net of all reductions | .78%H,I |
| Net investment income (loss) | .39%H |
| Supplemental Data | |
| Net assets, end of period (000 omitted) | $348 |
| Portfolio turnover rateG | 29%H |
A For the period August 31, 2018 (commencement of operations) to March 31, 2019.
B Calculated based on average shares outstanding during the period.
C The amount shown for a share outstanding does not correspond with the aggregate net gain (loss) on investments for the period due to the timing of sales and repurchases of shares in relation to fluctuating market values of the investments of the Fund.
D Total returns for periods of less than one year are not annualized.
E Total returns do not include the effect of the sales charges.
F Expense ratios reflect operating expenses of the class. Expenses before reductions do not reflect amounts reimbursed by the investment adviser or reductions from expense offset arrangements and do not represent the amount paid by the class during periods when reimbursements or reductions occur. Expense ratios before reductions for start-up periods may not be representative of longer-term operating periods. Expenses net of fee waivers reflect expenses after reimbursement by the investment adviser but prior to reductions from expense offset arrangements. Expenses net of all reductions represent the net expenses paid by the class but do not include expenses of the underlying funds in which the Fund invests.
G Amounts do not include the activity of the Underlying Funds.
H Annualized
I On certain classes, the size and fluctuation of net assets and expense amounts may cause ratios to differ from contractual rates.
See accompanying notes which are an integral part of the financial statements.
Fidelity Freedom Blend 2030 Fund Class M
| Year ended March 31, | 2019 A |
| Selected Per–Share Data | |
| Net asset value, beginning of period | $10.00 |
| Income from Investment Operations | |
| Net investment income (loss)B | .01 |
| Net realized and unrealized gain (loss) | (.09)C |
| Total from investment operations | (.08) |
| Distributions from net investment income | (.12) |
| Distributions from net realized gain | (.12) |
| Total distributions | (.24) |
| Net asset value, end of period | $9.68 |
| Total ReturnD,E | (.56)% |
| Ratios to Average Net AssetsF,G | |
| Expenses before reductions | 1.02%H |
| Expenses net of fee waivers, if any | 1.02%H |
| Expenses net of all reductions | 1.02%H |
| Net investment income (loss) | .15%H |
| Supplemental Data | |
| Net assets, end of period (000 omitted) | $170 |
| Portfolio turnover rateG | 29%H |
A For the period August 31, 2018 (commencement of operations) to March 31, 2019.
B Calculated based on average shares outstanding during the period.
C The amount shown for a share outstanding does not correspond with the aggregate net gain (loss) on investments for the period due to the timing of sales and repurchases of shares in relation to fluctuating market values of the investments of the Fund.
D Total returns for periods of less than one year are not annualized.
E Total returns do not include the effect of the sales charges.
F Expense ratios reflect operating expenses of the class. Expenses before reductions do not reflect amounts reimbursed by the investment adviser or reductions from expense offset arrangements and do not represent the amount paid by the class during periods when reimbursements or reductions occur. Expense ratios before reductions for start-up periods may not be representative of longer-term operating periods. Expenses net of fee waivers reflect expenses after reimbursement by the investment adviser but prior to reductions from expense offset arrangements. Expenses net of all reductions represent the net expenses paid by the class but do not include expenses of the underlying funds in which the Fund invests.
G Amounts do not include the activity of the Underlying Funds.
H Annualized
See accompanying notes which are an integral part of the financial statements.
Fidelity Freedom Blend 2030 Fund Class C
| Year ended March 31, | 2019 A |
| Selected Per–Share Data | |
| Net asset value, beginning of period | $10.00 |
| Income from Investment Operations | |
| Net investment income (loss)B | (.02) |
| Net realized and unrealized gain (loss) | (.08)C |
| Total from investment operations | (.10) |
| Distributions from net investment income | (.12) |
| Distributions from net realized gain | (.12) |
| Total distributions | (.24) |
| Net asset value, end of period | $9.66 |
| Total ReturnD,E | (.81)% |
| Ratios to Average Net AssetsF,G | |
| Expenses before reductions | 1.52%H |
| Expenses net of fee waivers, if any | 1.52%H |
| Expenses net of all reductions | 1.52%H |
| Net investment income (loss) | (.35)%H |
| Supplemental Data | |
| Net assets, end of period (000 omitted) | $259 |
| Portfolio turnover rateG | 29%H |
A For the period August 31, 2018 (commencement of operations) to March 31, 2019.
B Calculated based on average shares outstanding during the period.
C The amount shown for a share outstanding does not correspond with the aggregate net gain (loss) on investments for the period due to the timing of sales and repurchases of shares in relation to fluctuating market values of the investments of the Fund.
D Total returns for periods of less than one year are not annualized.
E Total returns do not include the effect of the contingent deferred sales charge.
F Expense ratios reflect operating expenses of the class. Expenses before reductions do not reflect amounts reimbursed by the investment adviser or reductions from expense offset arrangements and do not represent the amount paid by the class during periods when reimbursements or reductions occur. Expense ratios before reductions for start-up periods may not be representative of longer-term operating periods. Expenses net of fee waivers reflect expenses after reimbursement by the investment adviser but prior to reductions from expense offset arrangements. Expenses net of all reductions represent the net expenses paid by the class but do not include expenses of the underlying funds in which the Fund invests.
G Amounts do not include the activity of the Underlying Funds.
H Annualized
See accompanying notes which are an integral part of the financial statements.
Fidelity Freedom Blend 2030 Fund
| Year ended March 31, | 2019 A |
| Selected Per–Share Data | |
| Net asset value, beginning of period | $10.00 |
| Income from Investment Operations | |
| Net investment income (loss)B | .04 |
| Net realized and unrealized gain (loss) | (.09)C |
| Total from investment operations | (.05) |
| Distributions from net investment income | (.14) |
| Distributions from net realized gain | (.12) |
| Total distributions | (.26) |
| Net asset value, end of period | $9.69 |
| Total ReturnD | (.26)% |
| Ratios to Average Net AssetsE,F | |
| Expenses before reductions | .52%G |
| Expenses net of fee waivers, if any | .52%G |
| Expenses net of all reductions | .52%G |
| Net investment income (loss) | .65%G |
| Supplemental Data | |
| Net assets, end of period (000 omitted) | $762 |
| Portfolio turnover rateF | 29%G |
A For the period August 31, 2018 (commencement of operations) to March 31, 2019.
B Calculated based on average shares outstanding during the period.
C The amount shown for a share outstanding does not correspond with the aggregate net gain (loss) on investments for the period due to the timing of sales and repurchases of shares in relation to fluctuating market values of the investments of the Fund.
D Total returns for periods of less than one year are not annualized.
E Expense ratios reflect operating expenses of the class. Expenses before reductions do not reflect amounts reimbursed by the investment adviser or reductions from expense offset arrangements and do not represent the amount paid by the class during periods when reimbursements or reductions occur. Expense ratios before reductions for start-up periods may not be representative of longer-term operating periods. Expenses net of fee waivers reflect expenses after reimbursement by the investment adviser but prior to reductions from expense offset arrangements. Expenses net of all reductions represent the net expenses paid by the class but do not include expenses of the underlying funds in which the Fund invests.
F Amounts do not include the activity of the Underlying Funds.
G Annualized
See accompanying notes which are an integral part of the financial statements.
Fidelity Freedom Blend 2030 Fund Class K
| Year ended March 31, | 2019 A |
| Selected Per–Share Data | |
| Net asset value, beginning of period | $10.00 |
| Income from Investment Operations | |
| Net investment income (loss)B | .04 |
| Net realized and unrealized gain (loss) | (.08)C |
| Total from investment operations | (.04) |
| Distributions from net investment income | (.14) |
| Distributions from net realized gain | (.12) |
| Total distributions | (.26) |
| Net asset value, end of period | $9.70 |
| Total ReturnD | (.15)% |
| Ratios to Average Net AssetsE,F | |
| Expenses before reductions | .42%G |
| Expenses net of fee waivers, if any | .42%G |
| Expenses net of all reductions | .42%G |
| Net investment income (loss) | .75%G |
| Supplemental Data | |
| Net assets, end of period (000 omitted) | $100 |
| Portfolio turnover rateF | 29%G |
A For the period August 31, 2018 (commencement of operations) to March 31, 2019.
B Calculated based on average shares outstanding during the period.
C The amount shown for a share outstanding does not correspond with the aggregate net gain (loss) on investments for the period due to the timing of sales and repurchases of shares in relation to fluctuating market values of the investments of the Fund.
D Total returns for periods of less than one year are not annualized.
E Expense ratios reflect operating expenses of the class. Expenses before reductions do not reflect amounts reimbursed by the investment adviser or reductions from expense offset arrangements and do not represent the amount paid by the class during periods when reimbursements or reductions occur. Expense ratios before reductions for start-up periods may not be representative of longer-term operating periods. Expenses net of fee waivers reflect expenses after reimbursement by the investment adviser but prior to reductions from expense offset arrangements. Expenses net of all reductions represent the net expenses paid by the class but do not include expenses of the underlying funds in which the Fund invests.
F Amounts do not include the activity of the Underlying Funds.
G Annualized
See accompanying notes which are an integral part of the financial statements.
Fidelity Freedom Blend 2030 Fund Class K6
| Year ended March 31, | 2019 A |
| Selected Per–Share Data | |
| Net asset value, beginning of period | $10.00 |
| Income from Investment Operations | |
| Net investment income (loss)B | .05 |
| Net realized and unrealized gain (loss) | (.09)C |
| Total from investment operations | (.04) |
| Distributions from net investment income | (.14) |
| Distributions from net realized gain | (.12) |
| Total distributions | (.26) |
| Net asset value, end of period | $9.70 |
| Total ReturnD | (.11)% |
| Ratios to Average Net AssetsE,F | |
| Expenses before reductions | .33%G,H |
| Expenses net of fee waivers, if any | .33%G,H |
| Expenses net of all reductions | .33%G,H |
| Net investment income (loss) | .84%G |
| Supplemental Data | |
| Net assets, end of period (000 omitted) | $21,781 |
| Portfolio turnover rateF | 29%G |
A For the period August 31, 2018 (commencement of operations) to March 31, 2019.
B Calculated based on average shares outstanding during the period.
C The amount shown for a share outstanding does not correspond with the aggregate net gain (loss) on investments for the period due to the timing of sales and repurchases of shares in relation to fluctuating market values of the investments of the Fund.
D Total returns for periods of less than one year are not annualized.
E Expense ratios reflect operating expenses of the class. Expenses before reductions do not reflect amounts reimbursed by the investment adviser or reductions from expense offset arrangements and do not represent the amount paid by the class during periods when reimbursements or reductions occur. Expenses net of fee waivers reflect expenses after reimbursement by the investment adviser but prior to reductions from expense offset arrangements. Expenses net of all reductions represent the net expenses paid by the class but do not include expenses of the underlying funds in which the Fund invests.
F Amounts do not include the activity of the Underlying Funds.
G Annualized
H On certain classes, the size and fluctuation of net assets and expense amounts may cause ratios to differ from contractual rates.
See accompanying notes which are an integral part of the financial statements.
Fidelity Freedom Blend 2030 Fund Class I
| Year ended March 31, | 2019 A |
| Selected Per–Share Data | |
| Net asset value, beginning of period | $10.00 |
| Income from Investment Operations | |
| Net investment income (loss)B | .04 |
| Net realized and unrealized gain (loss) | (.10)C |
| Total from investment operations | (.06) |
| Distributions from net investment income | (.14) |
| Distributions from net realized gain | (.12) |
| Total distributions | (.25)D |
| Net asset value, end of period | $9.69 |
| Total ReturnE | (.29)% |
| Ratios to Average Net AssetsF,G | |
| Expenses before reductions | .52%H |
| Expenses net of fee waivers, if any | .52%H |
| Expenses net of all reductions | .52%H |
| Net investment income (loss) | .65%H |
| Supplemental Data | |
| Net assets, end of period (000 omitted) | $100 |
| Portfolio turnover rateG | 29%H |
A For the period August 31, 2018 (commencement of operations) to March 31, 2019.
B Calculated based on average shares outstanding during the period.
C The amount shown for a share outstanding does not correspond with the aggregate net gain (loss) on investments for the period due to the timing of sales and repurchases of shares in relation to fluctuating market values of the investments of the Fund.
D Total distributions of $.25 per share is comprised of distributions from net investment income of $.137 and distributions from net realized gain of $.117 per share.
E Total returns for periods of less than one year are not annualized.
F Expense ratios reflect operating expenses of the class. Expenses before reductions do not reflect amounts reimbursed by the investment adviser or reductions from expense offset arrangements and do not represent the amount paid by the class during periods when reimbursements or reductions occur. Expense ratios before reductions for start-up periods may not be representative of longer-term operating periods. Expenses net of fee waivers reflect expenses after reimbursement by the investment adviser but prior to reductions from expense offset arrangements. Expenses net of all reductions represent the net expenses paid by the class but do not include expenses of the underlying funds in which the Fund invests.
G Amounts do not include the activity of the Underlying Funds.
H Annualized
See accompanying notes which are an integral part of the financial statements.
Fidelity Freedom Blend 2030 Fund Class Z
| Year ended March 31, | 2019 A |
| Selected Per–Share Data | |
| Net asset value, beginning of period | $10.00 |
| Income from Investment Operations | |
| Net investment income (loss)B | .04 |
| Net realized and unrealized gain (loss) | (.08)C |
| Total from investment operations | (.04) |
| Distributions from net investment income | (.14) |
| Distributions from net realized gain | (.12) |
| Total distributions | (.26) |
| Net asset value, end of period | $9.70 |
| Total ReturnD | (.15)% |
| Ratios to Average Net AssetsE,F | |
| Expenses before reductions | .42%G |
| Expenses net of fee waivers, if any | .42%G |
| Expenses net of all reductions | .42%G |
| Net investment income (loss) | .75%G |
| Supplemental Data | |
| Net assets, end of period (000 omitted) | $100 |
| Portfolio turnover rateF | 29%G |
A For the period August 31, 2018 (commencement of operations) to March 31, 2019.
B Calculated based on average shares outstanding during the period.
C The amount shown for a share outstanding does not correspond with the aggregate net gain (loss) on investments for the period due to the timing of sales and repurchases of shares in relation to fluctuating market values of the investments of the Fund.
D Total returns for periods of less than one year are not annualized.
E Expense ratios reflect operating expenses of the class. Expenses before reductions do not reflect amounts reimbursed by the investment adviser or reductions from expense offset arrangements and do not represent the amount paid by the class during periods when reimbursements or reductions occur. Expense ratios before reductions for start-up periods may not be representative of longer-term operating periods. Expenses net of fee waivers reflect expenses after reimbursement by the investment adviser but prior to reductions from expense offset arrangements. Expenses net of all reductions represent the net expenses paid by the class but do not include expenses of the underlying funds in which the Fund invests.
F Amounts do not include the activity of the Underlying Funds.
G Annualized
See accompanying notes which are an integral part of the financial statements.
Fidelity Freedom Blend 2030 Fund Class Z6
| Year ended March 31, | 2019 A |
| Selected Per–Share Data | |
| Net asset value, beginning of period | $10.00 |
| Income from Investment Operations | |
| Net investment income (loss)B | .05 |
| Net realized and unrealized gain (loss) | (.09)C |
| Total from investment operations | (.04) |
| Distributions from net investment income | (.14) |
| Distributions from net realized gain | (.12) |
| Total distributions | (.26) |
| Net asset value, end of period | $9.70 |
| Total ReturnD | (.11)% |
| Ratios to Average Net AssetsE,F | |
| Expenses before reductions | .32%G |
| Expenses net of fee waivers, if any | .32%G |
| Expenses net of all reductions | .32%G |
| Net investment income (loss) | .85%G |
| Supplemental Data | |
| Net assets, end of period (000 omitted) | $368 |
| Portfolio turnover rateF | 29%G |
A For the period August 31, 2018 (commencement of operations) to March 31, 2019.
B Calculated based on average shares outstanding during the period.
C The amount shown for a share outstanding does not correspond with the aggregate net gain (loss) on investments for the period due to the timing of sales and repurchases of shares in relation to fluctuating market values of the investments of the Fund.
D Total returns for periods of less than one year are not annualized.
E Expense ratios reflect operating expenses of the class. Expenses before reductions do not reflect amounts reimbursed by the investment adviser or reductions from expense offset arrangements and do not represent the amount paid by the class during periods when reimbursements or reductions occur. Expenses net of fee waivers reflect expenses after reimbursement by the investment adviser but prior to reductions from expense offset arrangements. Expenses net of all reductions represent the net expenses paid by the class but do not include expenses of the underlying funds in which the Fund invests.
F Amounts do not include the activity of the Underlying Funds.
G Annualized
See accompanying notes which are an integral part of the financial statements.
Fidelity Freedom® Blend 2035 Fund
Investment Summary (Unaudited)
The information in the following tables is based on the direct investments of the Fund.
Top Holdings as of March 31, 2019
| | % of fund's net assets |
| Fidelity Series Large Cap Value Index Fund | 16.4 |
| Fidelity Series Blue Chip Growth Fund | 11.2 |
| Fidelity Series Large Cap Growth Index Fund | 8.8 |
| Fidelity Series Large Cap Stock Fund | 8.7 |
| Fidelity Series Emerging Markets Opportunities Fund | 8.4 |
| Fidelity Series International Growth Fund | 7.6 |
| Fidelity Series International Value Fund | 7.5 |
| Fidelity Series Long-Term Treasury Bond Index Fund | 5.7 |
| Fidelity Series Value Discovery Fund | 5.2 |
| Fidelity Series Small Cap Opportunities Fund | 4.4 |
| | 83.9 |
Asset Allocation (% of fund's net assets)
| Period end |
| | Domestic Equity Funds | 57.0% |
| | International Equity Funds | 29.3% |
| | Bond Funds | 11.8% |
| | Short-Term Funds | 1.9% |

Domestic Equity Funds category includes Fidelity Series Commodity Strategy Fund which invests in commodity-related investments.
Fidelity Freedom® Blend 2035 Fund
Schedule of Investments March 31, 2019
Showing Percentage of Net Assets
| Domestic Equity Funds - 57.0% | | | |
| | | Shares | Value |
| Fidelity Series Blue Chip Growth Fund (a) | | 190,633 | $2,811,838 |
| Fidelity Series Commodity Strategy Fund (a) | | 121,523 | 579,664 |
| Fidelity Series Large Cap Growth Index Fund (a) | | 218,466 | 2,202,137 |
| Fidelity Series Large Cap Stock Fund (a) | | 149,499 | 2,190,163 |
| Fidelity Series Large Cap Value Index Fund (a) | | 330,479 | 4,101,247 |
| Fidelity Series Small Cap Opportunities Fund (a) | | 81,283 | 1,094,072 |
| Fidelity Series Value Discovery Fund (a) | | 103,894 | 1,297,630 |
| TOTAL DOMESTIC EQUITY FUNDS | | | |
| (Cost $13,185,643) | | | 14,276,751 |
|
| International Equity Funds - 29.3% | | | |
| Fidelity Series Canada Fund (a) | | 22,007 | 226,889 |
| Fidelity Series Emerging Markets Fund (a) | | 23,856 | 233,552 |
| Fidelity Series Emerging Markets Opportunities Fund (a) | | 114,306 | 2,118,088 |
| Fidelity Series International Growth Fund (a) | | 124,820 | 1,896,017 |
| Fidelity Series International Index Fund (a) | | 50,691 | 497,781 |
| Fidelity Series International Small Cap Fund (a) | | 32,000 | 496,953 |
| Fidelity Series International Value Fund (a) | | 201,613 | 1,875,003 |
| TOTAL INTERNATIONAL EQUITY FUNDS | | | |
| (Cost $6,861,387) | | | 7,344,283 |
|
| Bond Funds - 11.8% | | | |
| Fidelity Series Corporate Bond Fund (a) | | 16,311 | 165,558 |
| Fidelity Series Emerging Markets Debt Fund (a) | | 18,285 | 175,349 |
| Fidelity Series Floating Rate High Income Fund (a) | | 4,054 | 37,584 |
| Fidelity Series Government Bond Index Fund (a) | | 22,454 | 229,478 |
| Fidelity Series High Income Fund (a) | | 30,941 | 290,850 |
| Fidelity Series Inflation-Protected Bond Index Fund (a) | | 7,677 | 75,084 |
| Fidelity Series Investment Grade Bond Fund (a) | | 21,713 | 242,753 |
| Fidelity Series Investment Grade Securitized Fund (a) | | 16,763 | 170,816 |
| Fidelity Series Long-Term Treasury Bond Index Fund (a) | | 162,255 | 1,439,204 |
| Fidelity Series Real Estate Income Fund (a) | | 10,845 | 118,319 |
| TOTAL BOND FUNDS | | | |
| (Cost $2,853,860) | | | 2,944,995 |
|
| Short-Term Funds - 1.9% | | | |
| Fidelity Cash Central Fund, 2.48% (b) | | 49 | 49 |
| Fidelity Series Government Money Market Fund 2.5% (a)(c) | | 104,467 | 104,467 |
| Fidelity Series Short-Term Credit Fund (a) | | 10,528 | 104,961 |
| Fidelity Series Treasury Bill Index Fund (a) | | 27,694 | 276,660 |
| TOTAL SHORT-TERM FUNDS | | | |
| (Cost $485,377) | | | 486,137 |
| TOTAL INVESTMENT IN SECURITIES - 100.0% | | | |
| (Cost $23,386,267) | | | 25,052,166 |
| NET OTHER ASSETS (LIABILITIES) - 0.0% | | | (6,507) |
| NET ASSETS - 100% | | | $25,045,659 |
Legend
(a) Affiliated Fund
(b) Affiliated fund that is generally available only to investment companies and other accounts managed by Fidelity Investments. The rate quoted is the annualized seven-day yield of the fund at period end. A complete unaudited listing of the fund's holdings as of its most recent quarter end is available upon request. In addition, each Fidelity Central Fund's financial statements, which are not covered by the Fund's Report of Independent Registered Public Accounting Firm, are available on the SEC's website or upon request.
(c) The rate quoted is the annualized seven-day yield of the fund at period end.
Affiliated Central Funds
Information regarding fiscal year to date income earned by the Fund from investments in Fidelity Central Funds is as follows:
| Fund | Income earned |
| Fidelity Cash Central Fund | $195 |
| Total | $195 |
Amounts in the income column in the above table include any capital gain distributions from underlying funds, which are presented in the corresponding line-item in the Statement of Operations, if applicable.
Affiliated Underlying Funds
Fiscal year to date information regarding the Fund's investments in affiliated Underlying Funds, excluding any Money Market Central Funds, is presented below. Exchanges between classes of the same affiliated Underlying Funds may occur.
| Affiliate | Value, beginning of period | Purchases | Sales Proceeds | Dividend Income | Realized Gain (loss) | Change in Unrealized appreciation (depreciation) | Value, end of period |
| Fidelity Series Blue Chip Growth Fund | $-- | $2,700,841 | $150,196 | $14,448 | $(13,758) | $274,951 | $2,811,838 |
| Fidelity Series Canada Fund | -- | 220,991 | 9,344 | 251 | (582) | 15,824 | 226,889 |
| Fidelity Series Commodity Strategy Fund | -- | 579,958 | 10,038 | 1,308 | (554) | 10,298 | 579,664 |
| Fidelity Series Corporate Bond Fund | -- | 163,408 | 2,549 | 1,165 | 2 | 4,697 | 165,558 |
| Fidelity Series Emerging Markets Debt Fund | -- | 174,890 | 2,562 | 1,824 | (1) | 3,022 | 175,349 |
| Fidelity Series Emerging Markets Fund | -- | 226,570 | 4,749 | 47 | (68) | 11,799 | 233,552 |
| Fidelity Series Emerging Markets Opportunities Fund | -- | 2,025,385 | 65,943 | 8,573 | (3,701) | 162,347 | 2,118,088 |
| Fidelity Series Floating Rate High Income Fund | -- | 38,361 | 1,168 | 500 | (17) | 408 | 37,584 |
| Fidelity Series Government Bond Index Fund | -- | 229,822 | 3,465 | 1,048 | 8 | 3,113 | 229,478 |
| Fidelity Series Government Money Market Fund 2.5% | -- | 106,985 | 2,518 | 500 | -- | -- | 104,467 |
| Fidelity Series High Income Fund | -- | 318,416 | 37,295 | 3,889 | (299) | 10,028 | 290,850 |
| Fidelity Series Inflation-Protected Bond Index Fund | -- | 75,500 | 1,755 | 113 | (7) | 1,346 | 75,084 |
| Fidelity Series International Growth Fund | -- | 1,826,450 | 78,741 | 6,271 | (6,814) | 155,122 | 1,896,017 |
| Fidelity Series International Index Fund | -- | 483,181 | 13,580 | 146 | (576) | 28,756 | 497,781 |
| Fidelity Series International Small Cap Fund | -- | 484,473 | 15,615 | 2,355 | (2,034) | 30,129 | 496,953 |
| Fidelity Series International Value Fund | -- | 1,840,229 | 40,844 | 3,457 | (3,301) | 78,919 | 1,875,003 |
| Fidelity Series Investment Grade Bond Fund | -- | 241,532 | 3,691 | 1,410 | 5 | 4,907 | 242,753 |
| Fidelity Series Investment Grade Securitized Fund | -- | 171,492 | 2,904 | 1,002 | 3 | 2,225 | 170,816 |
| Fidelity Series Large Cap Growth Index Fund | -- | 2,097,532 | 108,686 | 569 | (4,689) | 217,980 | 2,202,137 |
| Fidelity Series Large Cap Stock Fund | -- | 2,110,475 | 78,033 | 4,400 | (6,957) | 164,678 | 2,190,163 |
| Fidelity Series Large Cap Value Index Fund | -- | 3,962,901 | 109,994 | 30,372 | (6,090) | 254,430 | 4,101,247 |
| Fidelity Series Long-Term Treasury Bond Index Fund | -- | 1,461,761 | 79,818 | 8,212 | 466 | 56,795 | 1,439,204 |
| Fidelity Series Real Estate Income Fund | -- | 116,191 | 2,401 | 801 | (65) | 4,594 | 118,319 |
| Fidelity Series Short-Term Credit Fund | -- | 106,571 | 2,506 | 559 | -- | 896 | 104,961 |
| Fidelity Series Small Cap Opportunities Fund | -- | 1,056,077 | 57,970 | 5,030 | (7,387) | 103,352 | 1,094,072 |
| Fidelity Series Treasury Bill Index Fund | -- | 321,371 | 44,537 | 1,751 | (38) | (136) | 276,660 |
| Fidelity Series Value Discovery Fund | -- | 1,259,179 | 25,409 | 3,940 | (1,559) | 65,419 | 1,297,630 |
| | $-- | $24,400,542 | $956,311 | $103,941 | $(58,013) | $1,665,899 | $25,052,117 |
Amounts in the income column in the above table include any capital gain distributions from underlying funds, which are presented in the corresponding line-item in the Statement of Operations, if applicable.
Investment Valuation
All investments are categorized as Level 1 under the Fair Value Hierarchy. The inputs or methodology used for valuing securities may not be an indication of the risk associated with investing in those securities. For more information on valuation inputs please refer to the Investment Valuation section in the accompanying Notes to Financial Statements.
See accompanying notes which are an integral part of the financial statements.
Fidelity Freedom® Blend 2035 Fund
Financial Statements
Statement of Assets and Liabilities
| | | March 31, 2019 |
| Assets | | |
Investment in securities, at value — See accompanying schedule:
| | |
| Fidelity Central Funds (cost $49) | $49 | |
| Other affiliated issuers (cost $23,386,218) | 25,052,117 | |
| Total Investment in Securities (cost $23,386,267) | | $25,052,166 |
| Cash | | 147 |
| Receivable for investments sold | | 148,898 |
| Receivable for fund shares sold | | 21,670 |
| Total assets | | 25,222,881 |
| Liabilities | | |
| Payable for investments purchased | $64,988 | |
| Payable for fund shares redeemed | 105,577 | |
| Accrued management fee | 6,345 | |
| Distribution and service plan fees payable | 312 | |
| Total liabilities | | 177,222 |
| Net Assets | | $25,045,659 |
| Net Assets consist of: | | |
| Paid in capital | | $23,386,607 |
| Total distributable earnings (loss) | | 1,659,052 |
| Net Assets | | $25,045,659 |
| Net Asset Value and Maximum Offering Price | | |
| Class A: | | |
| Net Asset Value and redemption price per share ($357,498 ÷ 37,225 shares) | | $9.60 |
| Maximum offering price per share (100/94.25 of $9.60) | | $10.19 |
| Class M: | | |
| Net Asset Value and redemption price per share ($177,465 ÷ 18,501 shares) | | $9.59 |
| Maximum offering price per share (100/96.50 of $9.59) | | $9.94 |
| Class C: | | |
| Net Asset Value and offering price per share ($206,967 ÷ 21,584 shares)(a) | | $9.59 |
| Fidelity Freedom Blend 2035 Fund: | | |
| Net Asset Value, offering price and redemption price per share ($984,394 ÷ 102,469 shares) | | $9.61 |
| Class K: | | |
| Net Asset Value, offering price and redemption price per share ($99,068 ÷ 10,305 shares) | | $9.61 |
| Class K6: | | |
| Net Asset Value, offering price and redemption price per share ($22,910,303 ÷ 2,382,806 shares) | | $9.61 |
| Class I: | | |
| Net Asset Value, offering price and redemption price per share ($107,541 ÷ 11,189 shares) | | $9.61 |
| Class Z: | | |
| Net Asset Value, offering price and redemption price per share ($103,297 ÷ 10,745 shares) | | $9.61 |
| Class Z6: | | |
| Net Asset Value, offering price and redemption price per share ($99,126 ÷ 10,309 shares) | | $9.62 |
(a) Redemption price per share is equal to net asset value less any applicable contingent deferred sales charge.
See accompanying notes which are an integral part of the financial statements.
Statement of Operations
| | | For the period
August 31, 2018 (commencement of operations) to
March 31, 2019 |
| Investment Income | | |
| Dividends: | | |
| Affiliated issuers | | $43,097 |
| Income from Fidelity Central Funds | | 195 |
| Total income | | 43,292 |
| Expenses | | |
| Management fee | $17,932 | |
| Distribution and service plan fees | 1,313 | |
| Independent trustees' fees and expenses | 12 | |
| Total expenses | | 19,257 |
| Net investment income (loss) | | 24,035 |
| Realized and Unrealized Gain (Loss) | | |
| Net realized gain (loss) on: | | |
| Investment securities: | | |
| Affiliated issuers | (58,013) | |
| Capital gain distributions from underlying funds: | | |
| Affiliated issuers | 60,844 | |
| Total net realized gain (loss) | | 2,831 |
| Change in net unrealized appreciation (depreciation) on: | | |
| Investment securities: | | |
| Affiliated issuers | 1,665,899 | |
| Total change in net unrealized appreciation (depreciation) | | 1,665,899 |
| Net gain (loss) | | 1,668,730 |
| Net increase (decrease) in net assets resulting from operations | | $1,692,765 |
See accompanying notes which are an integral part of the financial statements.
Statement of Changes in Net Assets
| | For the period
August 31, 2018 (commencement of operations) to
March 31, 2019 |
| Increase (Decrease) in Net Assets | |
| Operations | |
| Net investment income (loss) | $24,035 |
| Net realized gain (loss) | 2,831 |
| Change in net unrealized appreciation (depreciation) | 1,665,899 |
| Net increase (decrease) in net assets resulting from operations | 1,692,765 |
| Distributions to shareholders | (33,713) |
| Total distributions | (33,713) |
| Share transactions - net increase (decrease) | 23,386,607 |
| Total increase (decrease) in net assets | 25,045,659 |
| Net Assets | |
| Beginning of period | – |
| End of period | $25,045,659 |
See accompanying notes which are an integral part of the financial statements.
Financial Highlights
Fidelity Freedom Blend 2035 Fund Class A
| Year ended March 31, | 2019 A |
| Selected Per–Share Data | |
| Net asset value, beginning of period | $10.00 |
| Income from Investment Operations | |
| Net investment income (loss)B | –C |
| Net realized and unrealized gain (loss) | (.15)D |
| Total from investment operations | (.15) |
| Distributions from net investment income | (.14) |
| Distributions from net realized gain | (.12) |
| Total distributions | (.25)E |
| Net asset value, end of period | $9.60 |
| Total ReturnF,G | (1.18)% |
| Ratios to Average Net AssetsH,I | |
| Expenses before reductions | .79%J,K |
| Expenses net of fee waivers, if any | .79%J,K |
| Expenses net of all reductions | .79%J,K |
| Net investment income (loss) | .09%J |
| Supplemental Data | |
| Net assets, end of period (000 omitted) | $357 |
| Portfolio turnover rateI | 16%J |
A For the period August 31, 2018 (commencement of operations) to March 31, 2019.
B Calculated based on average shares outstanding during the period.
C Amount represents less than $.005 per share.
D The amount shown for a share outstanding does not correspond with the aggregate net gain (loss) on investments for the period due to the timing of sales and repurchases of shares in relation to fluctuating market values of the investments of the Fund.
E Total distributions of $.25 per share is comprised of distributions from net investment income of $.136 and distributions from net realized gain of $.116 per share.
F Total returns for periods of less than one year are not annualized.
G Total returns do not include the effect of the sales charges.
H Expense ratios reflect operating expenses of the class. Expenses before reductions do not reflect amounts reimbursed by the investment adviser or reductions from expense offset arrangements and do not represent the amount paid by the class during periods when reimbursements or reductions occur. Expense ratios before reductions for start-up periods may not be representative of longer-term operating periods. Expenses net of fee waivers reflect expenses after reimbursement by the investment adviser but prior to reductions from expense offset arrangements. Expenses net of all reductions represent the net expenses paid by the class but do not include expenses of the underlying funds in which the Fund invests.
I Amounts do not include the activity of the Underlying Funds.
J Annualized
K On certain classes, the size and fluctuation of net assets and expense amounts may cause ratios to differ from contractual rates.
See accompanying notes which are an integral part of the financial statements.
Fidelity Freedom Blend 2035 Fund Class M
| Year ended March 31, | 2019 A |
| Selected Per–Share Data | |
| Net asset value, beginning of period | $10.00 |
| Income from Investment Operations | |
| Net investment income (loss)B | (.01) |
| Net realized and unrealized gain (loss) | (.15)C |
| Total from investment operations | (.16) |
| Distributions from net investment income | (.13) |
| Distributions from net realized gain | (.12) |
| Total distributions | (.25) |
| Net asset value, end of period | $9.59 |
| Total ReturnD,E | (1.30)% |
| Ratios to Average Net AssetsF,G | |
| Expenses before reductions | 1.03%H |
| Expenses net of fee waivers, if any | 1.03%H |
| Expenses net of all reductions | 1.03%H |
| Net investment income (loss) | (.16)%H |
| Supplemental Data | |
| Net assets, end of period (000 omitted) | $177 |
| Portfolio turnover rateG | 16%H |
A For the period August 31, 2018 (commencement of operations) to March 31, 2019.
B Calculated based on average shares outstanding during the period.
C The amount shown for a share outstanding does not correspond with the aggregate net gain (loss) on investments for the period due to the timing of sales and repurchases of shares in relation to fluctuating market values of the investments of the Fund.
D Total returns for periods of less than one year are not annualized.
E Total returns do not include the effect of the sales charges.
F Expense ratios reflect operating expenses of the class. Expenses before reductions do not reflect amounts reimbursed by the investment adviser or reductions from expense offset arrangements and do not represent the amount paid by the class during periods when reimbursements or reductions occur. Expense ratios before reductions for start-up periods may not be representative of longer-term operating periods. Expenses net of fee waivers reflect expenses after reimbursement by the investment adviser but prior to reductions from expense offset arrangements. Expenses net of all reductions represent the net expenses paid by the class but do not include expenses of the underlying funds in which the Fund invests.
G Amounts do not include the activity of the Underlying Funds.
H Annualized
See accompanying notes which are an integral part of the financial statements.
Fidelity Freedom Blend 2035 Fund Class C
| Year ended March 31, | 2019 A |
| Selected Per–Share Data | |
| Net asset value, beginning of period | $10.00 |
| Income from Investment Operations | |
| Net investment income (loss)B | (.04) |
| Net realized and unrealized gain (loss) | (.14)C |
| Total from investment operations | (.18) |
| Distributions from net investment income | (.11) |
| Distributions from net realized gain | (.12) |
| Total distributions | (.23) |
| Net asset value, end of period | $9.59 |
| Total ReturnD,E | (1.56)% |
| Ratios to Average Net AssetsF,G | |
| Expenses before reductions | 1.54%H,I |
| Expenses net of fee waivers, if any | 1.54%H,I |
| Expenses net of all reductions | 1.54%H,I |
| Net investment income (loss) | (.67)%H |
| Supplemental Data | |
| Net assets, end of period (000 omitted) | $207 |
| Portfolio turnover rateG | 16%H |
A For the period August 31, 2018 (commencement of operations) to March 31, 2019.
B Calculated based on average shares outstanding during the period.
C The amount shown for a share outstanding does not correspond with the aggregate net gain (loss) on investments for the period due to the timing of sales and repurchases of shares in relation to fluctuating market values of the investments of the Fund.
D Total returns for periods of less than one year are not annualized.
E Total returns do not include the effect of the contingent deferred sales charge.
F Expense ratios reflect operating expenses of the class. Expenses before reductions do not reflect amounts reimbursed by the investment adviser or reductions from expense offset arrangements and do not represent the amount paid by the class during periods when reimbursements or reductions occur. Expense ratios before reductions for start-up periods may not be representative of longer-term operating periods. Expenses net of fee waivers reflect expenses after reimbursement by the investment adviser but prior to reductions from expense offset arrangements. Expenses net of all reductions represent the net expenses paid by the class but do not include expenses of the underlying funds in which the Fund invests.
G Amounts do not include the activity of the Underlying Funds.
H Annualized
I On certain classes, the size and fluctuation of net assets and expense amounts may cause ratios to differ from contractual rates.
See accompanying notes which are an integral part of the financial statements.
Fidelity Freedom Blend 2035 Fund
| Year ended March 31, | 2019 A |
| Selected Per–Share Data | |
| Net asset value, beginning of period | $10.00 |
| Income from Investment Operations | |
| Net investment income (loss)B | .02 |
| Net realized and unrealized gain (loss) | (.15)C |
| Total from investment operations | (.13) |
| Distributions from net investment income | (.15) |
| Distributions from net realized gain | (.12) |
| Total distributions | (.26)D |
| Net asset value, end of period | $9.61 |
| Total ReturnE | (.96)% |
| Ratios to Average Net AssetsF,G | |
| Expenses before reductions | .53%H |
| Expenses net of fee waivers, if any | .53%H |
| Expenses net of all reductions | .53%H |
| Net investment income (loss) | .34%H |
| Supplemental Data | |
| Net assets, end of period (000 omitted) | $984 |
| Portfolio turnover rateG | 16%H |
A For the period August 31, 2018 (commencement of operations) to March 31, 2019.
B Calculated based on average shares outstanding during the period.
C The amount shown for a share outstanding does not correspond with the aggregate net gain (loss) on investments for the period due to the timing of sales and repurchases of shares in relation to fluctuating market values of the investments of the Fund.
D Total distributions of $.26 per share is comprised of distributions from net investment income of $.146 and distributions from net realized gain of $.116 per share.
E Total returns for periods of less than one year are not annualized.
F Expense ratios reflect operating expenses of the class. Expenses before reductions do not reflect amounts reimbursed by the investment adviser or reductions from expense offset arrangements and do not represent the amount paid by the class during periods when reimbursements or reductions occur. Expense ratios before reductions for start-up periods may not be representative of longer-term operating periods. Expenses net of fee waivers reflect expenses after reimbursement by the investment adviser but prior to reductions from expense offset arrangements. Expenses net of all reductions represent the net expenses paid by the class but do not include expenses of the underlying funds in which the Fund invests.
G Amounts do not include the activity of the Underlying Funds.
H Annualized
See accompanying notes which are an integral part of the financial statements.
Fidelity Freedom Blend 2035 Fund Class K
| Year ended March 31, | 2019 A |
| Selected Per–Share Data | |
| Net asset value, beginning of period | $10.00 |
| Income from Investment Operations | |
| Net investment income (loss)B | .02 |
| Net realized and unrealized gain (loss) | (.15)C |
| Total from investment operations | (.13) |
| Distributions from net investment income | (.15) |
| Distributions from net realized gain | (.12) |
| Total distributions | (.26)D |
| Net asset value, end of period | $9.61 |
| Total ReturnE | (.97)% |
| Ratios to Average Net AssetsF,G | |
| Expenses before reductions | .43%H |
| Expenses net of fee waivers, if any | .43%H |
| Expenses net of all reductions | .43%H |
| Net investment income (loss) | .44%H |
| Supplemental Data | |
| Net assets, end of period (000 omitted) | $99 |
| Portfolio turnover rateG | 16%H |
A For the period August 31, 2018 (commencement of operations) to March 31, 2019.
B Calculated based on average shares outstanding during the period.
C The amount shown for a share outstanding does not correspond with the aggregate net gain (loss) on investments for the period due to the timing of sales and repurchases of shares in relation to fluctuating market values of the investments of the Fund.
D Total distributions of $.26 per share is comprised of distributions from net investment income of $.145 and distributions from net realized gain of $.116 per share.
E Total returns for periods of less than one year are not annualized.
F Expense ratios reflect operating expenses of the class. Expenses before reductions do not reflect amounts reimbursed by the investment adviser or reductions from expense offset arrangements and do not represent the amount paid by the class during periods when reimbursements or reductions occur. Expense ratios before reductions for start-up periods may not be representative of longer-term operating periods. Expenses net of fee waivers reflect expenses after reimbursement by the investment adviser but prior to reductions from expense offset arrangements. Expenses net of all reductions represent the net expenses paid by the class but do not include expenses of the underlying funds in which the Fund invests.
G Amounts do not include the activity of the Underlying Funds.
H Annualized
See accompanying notes which are an integral part of the financial statements.
Fidelity Freedom Blend 2035 Fund Class K6
| Year ended March 31, | 2019 A |
| Selected Per–Share Data | |
| Net asset value, beginning of period | $10.00 |
| Income from Investment Operations | |
| Net investment income (loss)B | .03 |
| Net realized and unrealized gain (loss) | (.15)C |
| Total from investment operations | (.12) |
| Distributions from net investment income | (.15) |
| Distributions from net realized gain | (.12) |
| Total distributions | (.27) |
| Net asset value, end of period | $9.61 |
| Total ReturnD | (.93)% |
| Ratios to Average Net AssetsE,F | |
| Expenses before reductions | .34%G,H |
| Expenses net of fee waivers, if any | .34%G,H |
| Expenses net of all reductions | .34%G,H |
| Net investment income (loss) | .54%G |
| Supplemental Data | |
| Net assets, end of period (000 omitted) | $22,910 |
| Portfolio turnover rateF | 16%G |
A For the period August 31, 2018 (commencement of operations) to March 31, 2019.
B Calculated based on average shares outstanding during the period.
C The amount shown for a share outstanding does not correspond with the aggregate net gain (loss) on investments for the period due to the timing of sales and repurchases of shares in relation to fluctuating market values of the investments of the Fund.
D Total returns for periods of less than one year are not annualized.
E Expense ratios reflect operating expenses of the class. Expenses before reductions do not reflect amounts reimbursed by the investment adviser or reductions from expense offset arrangements and do not represent the amount paid by the class during periods when reimbursements or reductions occur. Expenses net of fee waivers reflect expenses after reimbursement by the investment adviser but prior to reductions from expense offset arrangements. Expenses net of all reductions represent the net expenses paid by the class but do not include expenses of the underlying funds in which the Fund invests.
F Amounts do not include the activity of the Underlying Funds.
G Annualized
H On certain classes, the size and fluctuation of net assets and expense amounts may cause ratios to differ from contractual rates.
See accompanying notes which are an integral part of the financial statements.
Fidelity Freedom Blend 2035 Fund Class I
| Year ended March 31, | 2019 A |
| Selected Per–Share Data | |
| Net asset value, beginning of period | $10.00 |
| Income from Investment Operations | |
| Net investment income (loss)B | .02 |
| Net realized and unrealized gain (loss) | (.15)C |
| Total from investment operations | (.13) |
| Distributions from net investment income | (.14) |
| Distributions from net realized gain | (.12) |
| Total distributions | (.26) |
| Net asset value, end of period | $9.61 |
| Total ReturnD | (1.01)% |
| Ratios to Average Net AssetsE,F | |
| Expenses before reductions | .53%G |
| Expenses net of fee waivers, if any | .53%G |
| Expenses net of all reductions | .53%G |
| Net investment income (loss) | .34%G |
| Supplemental Data | |
| Net assets, end of period (000 omitted) | $108 |
| Portfolio turnover rateF | 16%G |
A For the period August 31, 2018 (commencement of operations) to March 31, 2019.
B Calculated based on average shares outstanding during the period.
C The amount shown for a share outstanding does not correspond with the aggregate net gain (loss) on investments for the period due to the timing of sales and repurchases of shares in relation to fluctuating market values of the investments of the Fund.
D Total returns for periods of less than one year are not annualized.
E Expense ratios reflect operating expenses of the class. Expenses before reductions do not reflect amounts reimbursed by the investment adviser or reductions from expense offset arrangements and do not represent the amount paid by the class during periods when reimbursements or reductions occur. Expense ratios before reductions for start-up periods may not be representative of longer-term operating periods. Expenses net of fee waivers reflect expenses after reimbursement by the investment adviser but prior to reductions from expense offset arrangements. Expenses net of all reductions represent the net expenses paid by the class but do not include expenses of the underlying funds in which the Fund invests.
F Amounts do not include the activity of the Underlying Funds.
G Annualized
See accompanying notes which are an integral part of the financial statements.
Fidelity Freedom Blend 2035 Fund Class Z
| Year ended March 31, | 2019 A |
| Selected Per–Share Data | |
| Net asset value, beginning of period | $10.00 |
| Income from Investment Operations | |
| Net investment income (loss)B | .02 |
| Net realized and unrealized gain (loss) | (.15)C |
| Total from investment operations | (.13) |
| Distributions from net investment income | (.15) |
| Distributions from net realized gain | (.12) |
| Total distributions | (.26)D |
| Net asset value, end of period | $9.61 |
| Total ReturnE | (.97)% |
| Ratios to Average Net AssetsF,G | |
| Expenses before reductions | .43%H |
| Expenses net of fee waivers, if any | .43%H |
| Expenses net of all reductions | .43%H |
| Net investment income (loss) | .44%H |
| Supplemental Data | |
| Net assets, end of period (000 omitted) | $103 |
| Portfolio turnover rateG | 16%H |
A For the period August 31, 2018 (commencement of operations) to March 31, 2019.
B Calculated based on average shares outstanding during the period.
C The amount shown for a share outstanding does not correspond with the aggregate net gain (loss) on investments for the period due to the timing of sales and repurchases of shares in relation to fluctuating market values of the investments of the Fund.
D Total distributions of $.26 per share is comprised of distributions from net investment income of $.145 and distributions from net realized gain of $.116 per share.
E Total returns for periods of less than one year are not annualized.
F Expense ratios reflect operating expenses of the class. Expenses before reductions do not reflect amounts reimbursed by the investment adviser or reductions from expense offset arrangements and do not represent the amount paid by the class during periods when reimbursements or reductions occur. Expense ratios before reductions for start-up periods may not be representative of longer-term operating periods. Expenses net of fee waivers reflect expenses after reimbursement by the investment adviser but prior to reductions from expense offset arrangements. Expenses net of all reductions represent the net expenses paid by the class but do not include expenses of the underlying funds in which the Fund invests.
G Amounts do not include the activity of the Underlying Funds.
H Annualized
See accompanying notes which are an integral part of the financial statements.
Fidelity Freedom Blend 2035 Fund Class Z6
| Year ended March 31, | 2019 A |
| Selected Per–Share Data | |
| Net asset value, beginning of period | $10.00 |
| Income from Investment Operations | |
| Net investment income (loss)B | .03 |
| Net realized and unrealized gain (loss) | (.14)C |
| Total from investment operations | (.11) |
| Distributions from net investment income | (.15) |
| Distributions from net realized gain | (.12) |
| Total distributions | (.27) |
| Net asset value, end of period | $9.62 |
| Total ReturnD | (.83)% |
| Ratios to Average Net AssetsE,F | |
| Expenses before reductions | .33%G |
| Expenses net of fee waivers, if any | .33%G |
| Expenses net of all reductions | .33%G |
| Net investment income (loss) | .54%G |
| Supplemental Data | |
| Net assets, end of period (000 omitted) | $99 |
| Portfolio turnover rateF | 16%G |
A For the period August 31, 2018 (commencement of operations) to March 31, 2019.
B Calculated based on average shares outstanding during the period.
C The amount shown for a share outstanding does not correspond with the aggregate net gain (loss) on investments for the period due to the timing of sales and repurchases of shares in relation to fluctuating market values of the investments of the Fund.
D Total returns for periods of less than one year are not annualized.
E Expense ratios reflect operating expenses of the class. Expenses before reductions do not reflect amounts reimbursed by the investment adviser or reductions from expense offset arrangements and do not represent the amount paid by the class during periods when reimbursements or reductions occur. Expenses net of fee waivers reflect expenses after reimbursement by the investment adviser but prior to reductions from expense offset arrangements. Expenses net of all reductions represent the net expenses paid by the class but do not include expenses of the underlying funds in which the Fund invests.
F Amounts do not include the activity of the Underlying Funds.
G Annualized
See accompanying notes which are an integral part of the financial statements.
Fidelity Freedom® Blend 2040 Fund
Investment Summary (Unaudited)
The information in the following tables is based on the direct investments of the Fund.
Top Holdings as of March 31, 2019
| | % of fund's net assets |
| Fidelity Series Large Cap Value Index Fund | 17.5 |
| Fidelity Series Blue Chip Growth Fund | 12.0 |
| Fidelity Series Large Cap Growth Index Fund | 9.4 |
| Fidelity Series Large Cap Stock Fund | 9.3 |
| Fidelity Series Emerging Markets Opportunities Fund | 8.8 |
| Fidelity Series International Growth Fund | 8.0 |
| Fidelity Series International Value Fund | 7.9 |
| Fidelity Series Value Discovery Fund | 5.5 |
| Fidelity Series Small Cap Opportunities Fund | 4.7 |
| Fidelity Series Long-Term Treasury Bond Index Fund | 3.5 |
| | 86.6 |
Asset Allocation (% of fund's net assets)
| Period end |
| | Domestic Equity Funds | 60.9% |
| | International Equity Funds | 30.9% |
| | Bond Funds | 7.1% |
| | Short-Term Funds | 1.1% |

Domestic Equity Funds category includes Fidelity Series Commodity Strategy Fund which invests in commodity-related investments.
Fidelity Freedom® Blend 2040 Fund
Schedule of Investments March 31, 2019
Showing Percentage of Net Assets
| Domestic Equity Funds - 60.9% | | | |
| | | Shares | Value |
| Fidelity Series Blue Chip Growth Fund (a) | | 135,464 | $1,998,090 |
| Fidelity Series Commodity Strategy Fund (a) | | 87,161 | 415,759 |
| Fidelity Series Large Cap Growth Index Fund (a) | | 155,156 | 1,563,974 |
| Fidelity Series Large Cap Stock Fund (a) | | 106,441 | 1,559,358 |
| Fidelity Series Large Cap Value Index Fund (a) | | 235,297 | 2,920,032 |
| Fidelity Series Small Cap Opportunities Fund (a) | | 57,873 | 778,965 |
| Fidelity Series Value Discovery Fund (a) | | 73,971 | 923,901 |
| TOTAL DOMESTIC EQUITY FUNDS | | | |
| (Cost $9,317,379) | | | 10,160,079 |
|
| International Equity Funds - 30.9% | | | |
| Fidelity Series Canada Fund (a) | | 15,443 | 159,217 |
| Fidelity Series Emerging Markets Fund (a) | | 16,612 | 162,633 |
| Fidelity Series Emerging Markets Opportunities Fund (a) | | 79,519 | 1,473,485 |
| Fidelity Series International Growth Fund (a) | | 88,077 | 1,337,893 |
| Fidelity Series International Index Fund (a) | | 35,743 | 350,998 |
| Fidelity Series International Small Cap Fund (a) | | 22,566 | 350,456 |
| Fidelity Series International Value Fund (a) | | 141,758 | 1,318,353 |
| TOTAL INTERNATIONAL EQUITY FUNDS | | | |
| (Cost $4,788,449) | | | 5,153,035 |
|
| Bond Funds - 7.1% | | | |
| Fidelity Series Corporate Bond Fund (a) | | 3,021 | 30,666 |
| Fidelity Series Emerging Markets Debt Fund (a) | | 11,473 | 110,026 |
| Fidelity Series Floating Rate High Income Fund (a) | | 2,685 | 24,892 |
| Fidelity Series Government Bond Index Fund (a) | | 4,158 | 42,493 |
| Fidelity Series High Income Fund (a) | | 20,221 | 190,074 |
| Fidelity Series Inflation-Protected Bond Index Fund (a) | | 5,123 | 50,098 |
| Fidelity Series Investment Grade Bond Fund (a) | | 4,022 | 44,963 |
| Fidelity Series Investment Grade Securitized Fund (a) | | 3,105 | 31,635 |
| Fidelity Series Long-Term Treasury Bond Index Fund (a) | | 66,527 | 590,091 |
| Fidelity Series Real Estate Income Fund (a) | | 7,160 | 78,110 |
| TOTAL BOND FUNDS | | | |
| (Cost $1,151,753) | | | 1,193,048 |
|
| Short-Term Funds - 1.1% | | | |
| Fidelity Cash Central Fund, 2.48% (b) | | 49 | 49 |
| Fidelity Series Government Money Market Fund 2.5% (a)(c) | | 43,149 | 43,149 |
| Fidelity Series Short-Term Credit Fund (a) | | 4,329 | 43,158 |
| Fidelity Series Treasury Bill Index Fund (a) | | 10,519 | 105,090 |
| TOTAL SHORT-TERM FUNDS | | | |
| (Cost $191,092) | | | 191,446 |
| TOTAL INVESTMENT IN SECURITIES - 100.0% | | | |
| (Cost $15,448,673) | | | 16,697,608 |
| NET OTHER ASSETS (LIABILITIES) - 0.0% | | | (4,537) |
| NET ASSETS - 100% | | | $16,693,071 |
Legend
(a) Affiliated Fund
(b) Affiliated fund that is generally available only to investment companies and other accounts managed by Fidelity Investments. The rate quoted is the annualized seven-day yield of the fund at period end. A complete unaudited listing of the fund's holdings as of its most recent quarter end is available upon request. In addition, each Fidelity Central Fund's financial statements, which are not covered by the Fund's Report of Independent Registered Public Accounting Firm, are available on the SEC's website or upon request.
(c) The rate quoted is the annualized seven-day yield of the fund at period end.
Affiliated Central Funds
Information regarding fiscal year to date income earned by the Fund from investments in Fidelity Central Funds is as follows:
| Fund | Income earned |
| Fidelity Cash Central Fund | $195 |
| Total | $195 |
Amounts in the income column in the above table include any capital gain distributions from underlying funds, which are presented in the corresponding line-item in the Statement of Operations, if applicable.
Affiliated Underlying Funds
Fiscal year to date information regarding the Fund's investments in affiliated Underlying Funds, excluding any Money Market Central Funds, is presented below. Exchanges between classes of the same affiliated Underlying Funds may occur.
| Affiliate | Value, beginning of period | Purchases | Sales Proceeds | Dividend Income | Realized Gain (loss) | Change in Unrealized appreciation (depreciation) | Value, end of period |
| Fidelity Series Blue Chip Growth Fund | $-- | $1,902,833 | $98,971 | $13,837 | $(18,517) | $212,745 | $1,998,090 |
| Fidelity Series Canada Fund | -- | 156,352 | 9,086 | 188 | (541) | 12,492 | 159,217 |
| Fidelity Series Commodity Strategy Fund | -- | 419,304 | 11,160 | 1,257 | (676) | 8,291 | 415,759 |
| Fidelity Series Corporate Bond Fund | -- | 34,757 | 5,175 | 275 | 16 | 1,068 | 30,666 |
| Fidelity Series Emerging Markets Debt Fund | -- | 110,625 | 2,935 | 1,304 | 1 | 2,335 | 110,026 |
| Fidelity Series Emerging Markets Fund | -- | 159,053 | 4,770 | 40 | (209) | 8,559 | 162,633 |
| Fidelity Series Emerging Markets Opportunities Fund | -- | 1,412,847 | 54,694 | 7,400 | (4,486) | 119,818 | 1,473,485 |
| Fidelity Series Floating Rate High Income Fund | -- | 25,816 | 1,237 | 354 | (22) | 335 | 24,892 |
| Fidelity Series Government Bond Index Fund | -- | 47,954 | 6,134 | 248 | 7 | 666 | 42,493 |
| Fidelity Series Government Money Market Fund 2.5% | -- | 45,110 | 1,961 | 225 | -- | -- | 43,149 |
| Fidelity Series High Income Fund | -- | 212,243 | 29,377 | 2,799 | (276) | 7,484 | 190,074 |
| Fidelity Series Inflation-Protected Bond Index Fund | -- | 50,830 | 1,650 | 90 | (20) | 938 | 50,098 |
| Fidelity Series International Growth Fund | -- | 1,277,821 | 50,000 | 5,498 | (6,398) | 116,470 | 1,337,893 |
| Fidelity Series International Index Fund | -- | 340,451 | 10,760 | 110 | (750) | 22,057 | 350,998 |
| Fidelity Series International Small Cap Fund | -- | 340,277 | 10,475 | 2,066 | (1,949) | 22,603 | 350,456 |
| Fidelity Series International Value Fund | -- | 1,301,960 | 41,201 | 3,033 | (4,993) | 62,587 | 1,318,353 |
| Fidelity Series Investment Grade Bond Fund | -- | 51,006 | 7,167 | 332 | 12 | 1,112 | 44,963 |
| Fidelity Series Investment Grade Securitized Fund | -- | 36,555 | 5,415 | 235 | 6 | 489 | 31,635 |
| Fidelity Series Large Cap Growth Index Fund | -- | 1,474,947 | 71,172 | 434 | (5,354) | 165,553 | 1,563,974 |
| Fidelity Series Large Cap Stock Fund | -- | 1,495,244 | 56,098 | 3,879 | (6,447) | 126,659 | 1,559,358 |
| Fidelity Series Large Cap Value Index Fund | -- | 2,829,607 | 99,330 | 23,594 | (6,646) | 196,401 | 2,920,032 |
| Fidelity Series Long-Term Treasury Bond Index Fund | -- | 605,408 | 38,962 | 3,613 | 81 | 23,564 | 590,091 |
| Fidelity Series Real Estate Income Fund | -- | 77,990 | 3,069 | 610 | (115) | 3,304 | 78,110 |
| Fidelity Series Short-Term Credit Fund | -- | 44,933 | 2,165 | 252 | (1) | 391 | 43,158 |
| Fidelity Series Small Cap Opportunities Fund | -- | 748,823 | 41,891 | 4,728 | (8,938) | 80,971 | 778,965 |
| Fidelity Series Treasury Bill Index Fund | -- | 135,945 | 30,791 | 776 | (27) | (37) | 105,090 |
| Fidelity Series Value Discovery Fund | -- | 904,079 | 29,224 | 3,473 | (3,034) | 52,080 | 923,901 |
| | $-- | $16,242,770 | $724,870 | $80,650 | $(69,276) | $1,248,935 | $16,697,559 |
Amounts in the income column in the above table include any capital gain distributions from underlying funds, which are presented in the corresponding line-item in the Statement of Operations, if applicable.
Investment Valuation
All investments are categorized as Level 1 under the Fair Value Hierarchy. The inputs or methodology used for valuing securities may not be an indication of the risk associated with investing in those securities. For more information on valuation inputs please refer to the Investment Valuation section in the accompanying Notes to Financial Statements.
See accompanying notes which are an integral part of the financial statements.
Fidelity Freedom® Blend 2040 Fund
Financial Statements
Statement of Assets and Liabilities
| | | March 31, 2019 |
| Assets | | |
Investment in securities, at value — See accompanying schedule:
| | |
| Fidelity Central Funds (cost $49) | $49 | |
| Other affiliated issuers (cost $15,448,624) | 16,697,559 | |
| Total Investment in Securities (cost $15,448,673) | | $16,697,608 |
| Cash | | 147 |
| Receivable for investments sold | | 85,234 |
| Receivable for fund shares sold | | 19,356 |
| Total assets | | 16,802,345 |
| Liabilities | | |
| Payable for investments purchased | $101,443 | |
| Payable for fund shares redeemed | 3,079 | |
| Accrued management fee | 4,482 | |
| Distribution and service plan fees payable | 270 | |
| Total liabilities | | 109,274 |
| Net Assets | | $16,693,071 |
| Net Assets consist of: | | |
| Paid in capital | | $15,478,287 |
| Total distributable earnings (loss) | | 1,214,784 |
| Net Assets | | $16,693,071 |
| Net Asset Value and Maximum Offering Price | | |
| Class A: | | |
| Net Asset Value and redemption price per share ($254,835 ÷ 26,698 shares) | | $9.55 |
| Maximum offering price per share (100/94.25 of $9.55) | | $10.13 |
| Class M: | | |
| Net Asset Value and redemption price per share ($130,959 ÷ 13,713 shares) | | $9.55 |
| Maximum offering price per share (100/96.50 of $9.55) | | $9.90 |
| Class C: | | |
| Net Asset Value and offering price per share ($207,966 ÷ 21,799 shares)(a) | | $9.54 |
| Fidelity Freedom Blend 2040 Fund: | | |
| Net Asset Value, offering price and redemption price per share ($589,905 ÷ 61,740 shares) | | $9.55 |
| Class K: | | |
| Net Asset Value, offering price and redemption price per share ($98,762 ÷ 10,325 shares) | | $9.57 |
| Class K6: | | |
| Net Asset Value, offering price and redemption price per share ($14,955,612 ÷ 1,563,382 shares) | | $9.57 |
| Class I: | | |
| Net Asset Value, offering price and redemption price per share ($99,892 ÷ 10,446 shares) | | $9.56 |
| Class Z: | | |
| Net Asset Value, offering price and redemption price per share ($98,762 ÷ 10,325 shares) | | $9.57 |
| Class Z6: | | |
| Net Asset Value, offering price and redemption price per share ($256,378 ÷ 26,801 shares) | | $9.57 |
(a) Redemption price per share is equal to net asset value less any applicable contingent deferred sales charge.
See accompanying notes which are an integral part of the financial statements.
Statement of Operations
| | | For the period
August 31, 2018 (commencement of operations) to
March 31, 2019 |
| Investment Income | | |
| Dividends: | | |
| Affiliated issuers | | $28,605 |
| Income from Fidelity Central Funds | | 195 |
| Total income | | 28,800 |
| Expenses | | |
| Management fee | $13,208 | |
| Distribution and service plan fees | 1,192 | |
| Independent trustees' fees and expenses | 9 | |
| Total expenses | | 14,409 |
| Net investment income (loss) | | 14,391 |
| Realized and Unrealized Gain (Loss) | | |
| Net realized gain (loss) on: | | |
| Investment securities: | | |
| Affiliated issuers | (69,276) | |
| Capital gain distributions from underlying funds: | | |
| Affiliated issuers | 52,045 | |
| Total net realized gain (loss) | | (17,231) |
| Change in net unrealized appreciation (depreciation) on: | | |
| Investment securities: | | |
| Affiliated issuers | 1,248,935 | |
| Total change in net unrealized appreciation (depreciation) | | 1,248,935 |
| Net gain (loss) | | 1,231,704 |
| Net increase (decrease) in net assets resulting from operations | | $1,246,095 |
See accompanying notes which are an integral part of the financial statements.
Statement of Changes in Net Assets
| | For the period
August 31, 2018 (commencement of operations) to
March 31, 2019 |
| Increase (Decrease) in Net Assets | |
| Operations | |
| Net investment income (loss) | $14,391 |
| Net realized gain (loss) | (17,231) |
| Change in net unrealized appreciation (depreciation) | 1,248,935 |
| Net increase (decrease) in net assets resulting from operations | 1,246,095 |
| Distributions to shareholders | (31,311) |
| Total distributions | (31,311) |
| Share transactions - net increase (decrease) | 15,478,287 |
| Total increase (decrease) in net assets | 16,693,071 |
| Net Assets | |
| Beginning of period | – |
| End of period | $16,693,071 |
See accompanying notes which are an integral part of the financial statements.
Financial Highlights
Fidelity Freedom Blend 2040 Fund Class A
| Year ended March 31, | 2019 A |
| Selected Per–Share Data | |
| Net asset value, beginning of period | $10.00 |
| Income from Investment Operations | |
| Net investment income (loss)B | –C |
| Net realized and unrealized gain (loss) | (.17)D |
| Total from investment operations | (.17) |
| Distributions from net investment income | (.14) |
| Distributions from net realized gain | (.14) |
| Total distributions | (.28) |
| Net asset value, end of period | $9.55 |
| Total ReturnE,F | (1.39)% |
| Ratios to Average Net AssetsG,H | |
| Expenses before reductions | .80%I,J |
| Expenses net of fee waivers, if any | .80%I,J |
| Expenses net of all reductions | .80%I,J |
| Net investment income (loss) | .01%I |
| Supplemental Data | |
| Net assets, end of period (000 omitted) | $255 |
| Portfolio turnover rateH | 17%I |
A For the period August 31, 2018 (commencement of operations) to March 31, 2019.
B Calculated based on average shares outstanding during the period.
C Amount represents less than $.005 per share.
D The amount shown for a share outstanding does not correspond with the aggregate net gain (loss) on investments for the period due to the timing of sales and repurchases of shares in relation to fluctuating market values of the investments of the Fund.
E Total returns for periods of less than one year are not annualized.
F Total returns do not include the effect of the sales charges.
G Expense ratios reflect operating expenses of the class. Expenses before reductions do not reflect amounts reimbursed by the investment adviser or reductions from expense offset arrangements and do not represent the amount paid by the class during periods when reimbursements or reductions occur. Expense ratios before reductions for start-up periods may not be representative of longer-term operating periods. Expenses net of fee waivers reflect expenses after reimbursement by the investment adviser but prior to reductions from expense offset arrangements. Expenses net of all reductions represent the net expenses paid by the class but do not include expenses of the underlying funds in which the Fund invests.
H Amounts do not include the activity of the Underlying Funds.
I Annualized
J On certain classes, the size and fluctuation of net assets and expense amounts may cause ratios to differ from contractual rates.
See accompanying notes which are an integral part of the financial statements.
Fidelity Freedom Blend 2040 Fund Class M
| Year ended March 31, | 2019 A |
| Selected Per–Share Data | |
| Net asset value, beginning of period | $10.00 |
| Income from Investment Operations | |
| Net investment income (loss)B | (.01) |
| Net realized and unrealized gain (loss) | (.18)C |
| Total from investment operations | (.19) |
| Distributions from net investment income | (.12) |
| Distributions from net realized gain | (.14) |
| Total distributions | (.26) |
| Net asset value, end of period | $9.55 |
| Total ReturnD,E | (1.59)% |
| Ratios to Average Net AssetsF,G | |
| Expenses before reductions | 1.04%H |
| Expenses net of fee waivers, if any | 1.04%H |
| Expenses net of all reductions | 1.04%H |
| Net investment income (loss) | (.23)%H |
| Supplemental Data | |
| Net assets, end of period (000 omitted) | $131 |
| Portfolio turnover rateG | 17%H |
A For the period August 31, 2018 (commencement of operations) to March 31, 2019.
B Calculated based on average shares outstanding during the period.
C The amount shown for a share outstanding does not correspond with the aggregate net gain (loss) on investments for the period due to the timing of sales and repurchases of shares in relation to fluctuating market values of the investments of the Fund.
D Total returns for periods of less than one year are not annualized.
E Total returns do not include the effect of the sales charges.
F Expense ratios reflect operating expenses of the class. Expenses before reductions do not reflect amounts reimbursed by the investment adviser or reductions from expense offset arrangements and do not represent the amount paid by the class during periods when reimbursements or reductions occur. Expense ratios before reductions for start-up periods may not be representative of longer-term operating periods. Expenses net of fee waivers reflect expenses after reimbursement by the investment adviser but prior to reductions from expense offset arrangements. Expenses net of all reductions represent the net expenses paid by the class but do not include expenses of the underlying funds in which the Fund invests.
G Amounts do not include the activity of the Underlying Funds.
H Annualized
See accompanying notes which are an integral part of the financial statements.
Fidelity Freedom Blend 2040 Fund Class C
| Year ended March 31, | 2019 A |
| Selected Per–Share Data | |
| Net asset value, beginning of period | $10.00 |
| Income from Investment Operations | |
| Net investment income (loss)B | (.04) |
| Net realized and unrealized gain (loss) | (.18)C |
| Total from investment operations | (.22) |
| Distributions from net investment income | (.11) |
| Distributions from net realized gain | (.14) |
| Total distributions | (.24)D |
| Net asset value, end of period | $9.54 |
| Total ReturnE,F | (1.88)% |
| Ratios to Average Net AssetsG,H | |
| Expenses before reductions | 1.55%I,J |
| Expenses net of fee waivers, if any | 1.55%I,J |
| Expenses net of all reductions | 1.55%I,J |
| Net investment income (loss) | (.74)%I |
| Supplemental Data | |
| Net assets, end of period (000 omitted) | $208 |
| Portfolio turnover rateH | 17%I |
A For the period August 31, 2018 (commencement of operations) to March 31, 2019.
B Calculated based on average shares outstanding during the period.
C The amount shown for a share outstanding does not correspond with the aggregate net gain (loss) on investments for the period due to the timing of sales and repurchases of shares in relation to fluctuating market values of the investments of the Fund.
D Total distributions of $.24 per share is comprised of distributions from net investment income of $.106 and distributions from net realized gain of $.136 per share.
E Total returns for periods of less than one year are not annualized.
F Total returns do not include the effect of the contingent deferred sales charge.
G Expense ratios reflect operating expenses of the class. Expenses before reductions do not reflect amounts reimbursed by the investment adviser or reductions from expense offset arrangements and do not represent the amount paid by the class during periods when reimbursements or reductions occur. Expense ratios before reductions for start-up periods may not be representative of longer-term operating periods. Expenses net of fee waivers reflect expenses after reimbursement by the investment adviser but prior to reductions from expense offset arrangements. Expenses net of all reductions represent the net expenses paid by the class but do not include expenses of the underlying funds in which the Fund invests.
H Amounts do not include the activity of the Underlying Funds.
I Annualized
J On certain classes, the size and fluctuation of net assets and expense amounts may cause ratios to differ from contractual rates.
See accompanying notes which are an integral part of the financial statements.
Fidelity Freedom Blend 2040 Fund
| Year ended March 31, | 2019 A |
| Selected Per–Share Data | |
| Net asset value, beginning of period | $10.00 |
| Income from Investment Operations | |
| Net investment income (loss)B | .01 |
| Net realized and unrealized gain (loss) | (.18)C |
| Total from investment operations | (.17) |
| Distributions from net investment income | (.14) |
| Distributions from net realized gain | (.14)�� |
| Total distributions | (.28) |
| Net asset value, end of period | $9.55 |
| Total ReturnD | (1.35)% |
| Ratios to Average Net AssetsE,F | |
| Expenses before reductions | .54%G |
| Expenses net of fee waivers, if any | .54%G |
| Expenses net of all reductions | .54%G |
| Net investment income (loss) | .27%G |
| Supplemental Data | |
| Net assets, end of period (000 omitted) | $590 |
| Portfolio turnover rateF | 17%G |
A For the period August 31, 2018 (commencement of operations) to March 31, 2019.
B Calculated based on average shares outstanding during the period.
C The amount shown for a share outstanding does not correspond with the aggregate net gain (loss) on investments for the period due to the timing of sales and repurchases of shares in relation to fluctuating market values of the investments of the Fund.
D Total returns for periods of less than one year are not annualized.
E Expense ratios reflect operating expenses of the class. Expenses before reductions do not reflect amounts reimbursed by the investment adviser or reductions from expense offset arrangements and do not represent the amount paid by the class during periods when reimbursements or reductions occur. Expense ratios before reductions for start-up periods may not be representative of longer-term operating periods. Expenses net of fee waivers reflect expenses after reimbursement by the investment adviser but prior to reductions from expense offset arrangements. Expenses net of all reductions represent the net expenses paid by the class but do not include expenses of the underlying funds in which the Fund invests.
F Amounts do not include the activity of the Underlying Funds.
G Annualized
See accompanying notes which are an integral part of the financial statements.
Fidelity Freedom Blend 2040 Fund Class K
| Year ended March 31, | 2019 A |
| Selected Per–Share Data | |
| Net asset value, beginning of period | $10.00 |
| Income from Investment Operations | |
| Net investment income (loss)B | .02 |
| Net realized and unrealized gain (loss) | (.17)C |
| Total from investment operations | (.15) |
| Distributions from net investment income | (.14) |
| Distributions from net realized gain | (.14) |
| Total distributions | (.28) |
| Net asset value, end of period | $9.57 |
| Total ReturnD | (1.19)% |
| Ratios to Average Net AssetsE,F | |
| Expenses before reductions | .44%G |
| Expenses net of fee waivers, if any | .44%G |
| Expenses net of all reductions | .44%G |
| Net investment income (loss) | .37%G |
| Supplemental Data | |
| Net assets, end of period (000 omitted) | $99 |
| Portfolio turnover rateF | 17%G |
A For the period August 31, 2018 (commencement of operations) to March 31, 2019.
B Calculated based on average shares outstanding during the period.
C The amount shown for a share outstanding does not correspond with the aggregate net gain (loss) on investments for the period due to the timing of sales and repurchases of shares in relation to fluctuating market values of the investments of the Fund.
D Total returns for periods of less than one year are not annualized.
E Expense ratios reflect operating expenses of the class. Expenses before reductions do not reflect amounts reimbursed by the investment adviser or reductions from expense offset arrangements and do not represent the amount paid by the class during periods when reimbursements or reductions occur. Expense ratios before reductions for start-up periods may not be representative of longer-term operating periods. Expenses net of fee waivers reflect expenses after reimbursement by the investment adviser but prior to reductions from expense offset arrangements. Expenses net of all reductions represent the net expenses paid by the class but do not include expenses of the underlying funds in which the Fund invests.
F Amounts do not include the activity of the Underlying Funds.
G Annualized
See accompanying notes which are an integral part of the financial statements.
Fidelity Freedom Blend 2040 Fund Class K6
| Year ended March 31, | 2019 A |
| Selected Per–Share Data | |
| Net asset value, beginning of period | $10.00 |
| Income from Investment Operations | |
| Net investment income (loss)B | .02 |
| Net realized and unrealized gain (loss) | (.17)C |
| Total from investment operations | (.15) |
| Distributions from net investment income | (.14) |
| Distributions from net realized gain | (.14) |
| Total distributions | (.28) |
| Net asset value, end of period | $9.57 |
| Total ReturnD | (1.14)% |
| Ratios to Average Net AssetsE,F | |
| Expenses before reductions | .35%G,H |
| Expenses net of fee waivers, if any | .35%G,H |
| Expenses net of all reductions | .35%G,H |
| Net investment income (loss) | .46%G |
| Supplemental Data | |
| Net assets, end of period (000 omitted) | $14,956 |
| Portfolio turnover rateF | 17%G |
A For the period August 31, 2018 (commencement of operations) to March 31, 2019.
B Calculated based on average shares outstanding during the period.
C The amount shown for a share outstanding does not correspond with the aggregate net gain (loss) on investments for the period due to the timing of sales and repurchases of shares in relation to fluctuating market values of the investments of the Fund.
D Total returns for periods of less than one year are not annualized.
E Expense ratios reflect operating expenses of the class. Expenses before reductions do not reflect amounts reimbursed by the investment adviser or reductions from expense offset arrangements and do not represent the amount paid by the class during periods when reimbursements or reductions occur. Expenses net of fee waivers reflect expenses after reimbursement by the investment adviser but prior to reductions from expense offset arrangements. Expenses net of all reductions represent the net expenses paid by the class but do not include expenses of the underlying funds in which the Fund invests.
F Amounts do not include the activity of the Underlying Funds.
G Annualized
H On certain classes, the size and fluctuation of net assets and expense amounts may cause ratios to differ from contractual rates.
See accompanying notes which are an integral part of the financial statements.
Fidelity Freedom Blend 2040 Fund Class I
| Year ended March 31, | 2019 A |
| Selected Per–Share Data | |
| Net asset value, beginning of period | $10.00 |
| Income from Investment Operations | |
| Net investment income (loss)B | .01 |
| Net realized and unrealized gain (loss) | (.18)C |
| Total from investment operations | (.17) |
| Distributions from net investment income | (.14) |
| Distributions from net realized gain | (.14) |
| Total distributions | (.27)D |
| Net asset value, end of period | $9.56 |
| Total ReturnE | (1.33)% |
| Ratios to Average Net AssetsF,G | |
| Expenses before reductions | .54%H |
| Expenses net of fee waivers, if any | .54%H |
| Expenses net of all reductions | .54%H |
| Net investment income (loss) | .27%H |
| Supplemental Data | |
| Net assets, end of period (000 omitted) | $100 |
| Portfolio turnover rateG | 17%H |
A For the period August 31, 2018 (commencement of operations) to March 31, 2019.
B Calculated based on average shares outstanding during the period.
C The amount shown for a share outstanding does not correspond with the aggregate net gain (loss) on investments for the period due to the timing of sales and repurchases of shares in relation to fluctuating market values of the investments of the Fund.
D Total distributions of $.27 per share is comprised of distributions from net investment income of $.137 and distributions from net realized gain of $.136 per share.
E Total returns for periods of less than one year are not annualized.
F Expense ratios reflect operating expenses of the class. Expenses before reductions do not reflect amounts reimbursed by the investment adviser or reductions from expense offset arrangements and do not represent the amount paid by the class during periods when reimbursements or reductions occur. Expense ratios before reductions for start-up periods may not be representative of longer-term operating periods. Expenses net of fee waivers reflect expenses after reimbursement by the investment adviser but prior to reductions from expense offset arrangements. Expenses net of all reductions represent the net expenses paid by the class but do not include expenses of the underlying funds in which the Fund invests.
G Amounts do not include the activity of the Underlying Funds.
H Annualized
See accompanying notes which are an integral part of the financial statements.
Fidelity Freedom Blend 2040 Fund Class Z
| Year ended March 31, | 2019 A |
| Selected Per–Share Data | |
| Net asset value, beginning of period | $10.00 |
| Income from Investment Operations | |
| Net investment income (loss)B | .02 |
| Net realized and unrealized gain (loss) | (.17)C |
| Total from investment operations | (.15) |
| Distributions from net investment income | (.14) |
| Distributions from net realized gain | (.14) |
| Total distributions | (.28) |
| Net asset value, end of period | $9.57 |
| Total ReturnD | (1.19)% |
| Ratios to Average Net AssetsE,F | |
| Expenses before reductions | .44%G |
| Expenses net of fee waivers, if any | .44%G |
| Expenses net of all reductions | .44%G |
| Net investment income (loss) | .37%G |
| Supplemental Data | |
| Net assets, end of period (000 omitted) | $99 |
| Portfolio turnover rateF | 17%G |
A For the period August 31, 2018 (commencement of operations) to March 31, 2019.
B Calculated based on average shares outstanding during the period.
C The amount shown for a share outstanding does not correspond with the aggregate net gain (loss) on investments for the period due to the timing of sales and repurchases of shares in relation to fluctuating market values of the investments of the Fund.
D Total returns for periods of less than one year are not annualized.
E Expense ratios reflect operating expenses of the class. Expenses before reductions do not reflect amounts reimbursed by the investment adviser or reductions from expense offset arrangements and do not represent the amount paid by the class during periods when reimbursements or reductions occur. Expense ratios before reductions for start-up periods may not be representative of longer-term operating periods. Expenses net of fee waivers reflect expenses after reimbursement by the investment adviser but prior to reductions from expense offset arrangements. Expenses net of all reductions represent the net expenses paid by the class but do not include expenses of the underlying funds in which the Fund invests.
F Amounts do not include the activity of the Underlying Funds.
G Annualized
See accompanying notes which are an integral part of the financial statements.
Fidelity Freedom Blend 2040 Fund Class Z6
| Year ended March 31, | 2019 A |
| Selected Per–Share Data | |
| Net asset value, beginning of period | $10.00 |
| Income from Investment Operations | |
| Net investment income (loss)B | .03 |
| Net realized and unrealized gain (loss) | (.18)C |
| Total from investment operations | (.15) |
| Distributions from net investment income | (.14) |
| Distributions from net realized gain | (.14) |
| Total distributions | (.28) |
| Net asset value, end of period | $9.57 |
| Total ReturnD | (1.14)% |
| Ratios to Average Net AssetsE,F | |
| Expenses before reductions | .34%G |
| Expenses net of fee waivers, if any | .34%G |
| Expenses net of all reductions | .34%G |
| Net investment income (loss) | .47%G |
| Supplemental Data | |
| Net assets, end of period (000 omitted) | $256 |
| Portfolio turnover rateF | 17%G |
A For the period August 31, 2018 (commencement of operations) to March 31, 2019.
B Calculated based on average shares outstanding during the period.
C The amount shown for a share outstanding does not correspond with the aggregate net gain (loss) on investments for the period due to the timing of sales and repurchases of shares in relation to fluctuating market values of the investments of the Fund.
D Total returns for periods of less than one year are not annualized.
E Expense ratios reflect operating expenses of the class. Expenses before reductions do not reflect amounts reimbursed by the investment adviser or reductions from expense offset arrangements and do not represent the amount paid by the class during periods when reimbursements or reductions occur. Expenses net of fee waivers reflect expenses after reimbursement by the investment adviser but prior to reductions from expense offset arrangements. Expenses net of all reductions represent the net expenses paid by the class but do not include expenses of the underlying funds in which the Fund invests.
F Amounts do not include the activity of the Underlying Funds.
G Annualized
See accompanying notes which are an integral part of the financial statements.
Fidelity Freedom® Blend 2045 Fund
Investment Summary (Unaudited)
The information in the following tables is based on the direct investments of the Fund.
Top Holdings as of March 31, 2019
| | % of fund's net assets |
| Fidelity Series Large Cap Value Index Fund | 17.5 |
| Fidelity Series Blue Chip Growth Fund | 12.0 |
| Fidelity Series Large Cap Growth Index Fund | 9.4 |
| Fidelity Series Large Cap Stock Fund | 9.3 |
| Fidelity Series Emerging Markets Opportunities Fund | 8.8 |
| Fidelity Series International Growth Fund | 8.0 |
| Fidelity Series International Value Fund | 7.9 |
| Fidelity Series Value Discovery Fund | 5.5 |
| Fidelity Series Small Cap Opportunities Fund | 4.7 |
| Fidelity Series Long-Term Treasury Bond Index Fund | 3.5 |
| | 86.6 |
Asset Allocation (% of fund's net assets)
| Period end |
| | Domestic Equity Funds | 60.9% |
| | International Equity Funds | 30.9% |
| | Bond Funds | 7.1% |
| | Short-Term Funds | 1.1% |

Domestic Equity Funds category includes Fidelity Series Commodity Strategy Fund which invests in commodity-related investments.
Fidelity Freedom® Blend 2045 Fund
Schedule of Investments March 31, 2019
Showing Percentage of Net Assets
| Domestic Equity Funds - 60.9% | | | |
| | | Shares | Value |
| Fidelity Series Blue Chip Growth Fund (a) | | 81,300 | $1,199,178 |
| Fidelity Series Commodity Strategy Fund (a) | | 52,302 | 249,482 |
| Fidelity Series Large Cap Growth Index Fund (a) | | 93,118 | 938,629 |
| Fidelity Series Large Cap Stock Fund (a) | | 63,882 | 935,872 |
| Fidelity Series Large Cap Value Index Fund (a) | | 141,218 | 1,752,511 |
| Fidelity Series Small Cap Opportunities Fund (a) | | 34,733 | 467,510 |
| Fidelity Series Value Discovery Fund (a) | | 44,395 | 554,496 |
| TOTAL DOMESTIC EQUITY FUNDS | | | |
| (Cost $5,721,136) | | | 6,097,678 |
|
| International Equity Funds - 30.9% | | | |
| Fidelity Series Canada Fund (a) | | 9,281 | 95,692 |
| Fidelity Series Emerging Markets Fund (a) | | 9,971 | 97,619 |
| Fidelity Series Emerging Markets Opportunities Fund (a) | | 47,725 | 884,347 |
| Fidelity Series International Growth Fund (a) | | 52,861 | 802,954 |
| Fidelity Series International Index Fund (a) | | 21,457 | 210,707 |
| Fidelity Series International Small Cap Fund (a) | | 13,547 | 210,381 |
| Fidelity Series International Value Fund (a) | | 85,139 | 791,791 |
| TOTAL INTERNATIONAL EQUITY FUNDS | | | |
| (Cost $2,929,948) | | | 3,093,491 |
|
| Bond Funds - 7.1% | | | |
| Fidelity Series Corporate Bond Fund (a) | | 1,814 | 18,407 |
| Fidelity Series Emerging Markets Debt Fund (a) | | 6,890 | 66,074 |
| Fidelity Series Floating Rate High Income Fund (a) | | 1,620 | 15,020 |
| Fidelity Series Government Bond Index Fund (a) | | 2,496 | 25,506 |
| Fidelity Series High Income Fund (a) | | 12,137 | 114,085 |
| Fidelity Series Inflation-Protected Bond Index Fund (a) | | 3,073 | 30,053 |
| Fidelity Series Investment Grade Bond Fund (a) | | 2,414 | 26,988 |
| Fidelity Series Investment Grade Securitized Fund (a) | | 1,863 | 18,989 |
| Fidelity Series Long-Term Treasury Bond Index Fund (a) | | 39,923 | 354,119 |
| Fidelity Series Real Estate Income Fund (a) | | 4,297 | 46,880 |
| TOTAL BOND FUNDS | | | |
| (Cost $692,725) | | | 716,121 |
|
| Short-Term Funds - 1.1% | | | |
| Fidelity Cash Central Fund, 2.48% (b) | | 49 | 49 |
| Fidelity Series Government Money Market Fund 2.5% (a)(c) | | 24,914 | 24,914 |
| Fidelity Series Short-Term Credit Fund (a) | | 2,499 | 24,919 |
| Fidelity Series Treasury Bill Index Fund (a) | | 6,413 | 64,069 |
| TOTAL SHORT-TERM FUNDS | | | |
| (Cost $113,756) | | | 113,951 |
| TOTAL INVESTMENT IN SECURITIES - 100.0% | | | |
| (Cost $9,457,565) | | | 10,021,241 |
| NET OTHER ASSETS (LIABILITIES) - 0.0% | | | (2,679) |
| NET ASSETS - 100% | | | $10,018,562 |
Legend
(a) Affiliated Fund
(b) Affiliated fund that is generally available only to investment companies and other accounts managed by Fidelity Investments. The rate quoted is the annualized seven-day yield of the fund at period end. A complete unaudited listing of the fund's holdings as of its most recent quarter end is available upon request. In addition, each Fidelity Central Fund's financial statements, which are not covered by the Fund's Report of Independent Registered Public Accounting Firm, are available on the SEC's website or upon request.
(c) The rate quoted is the annualized seven-day yield of the fund at period end.
Affiliated Central Funds
Information regarding fiscal year to date income earned by the Fund from investments in Fidelity Central Funds is as follows:
| Fund | Income earned |
| Fidelity Cash Central Fund | $195 |
| Total | $195 |
Amounts in the income column in the above table include any capital gain distributions from underlying funds, which are presented in the corresponding line-item in the Statement of Operations, if applicable.
Affiliated Underlying Funds
Fiscal year to date information regarding the Fund's investments in affiliated Underlying Funds, excluding any Money Market Central Funds, is presented below. Exchanges between classes of the same affiliated Underlying Funds may occur.
| Affiliate | Value, beginning of period | Purchases | Sales Proceeds | Dividend Income | Realized Gain (loss) | Change in Unrealized appreciation (depreciation) | Value, end of period |
| Fidelity Series Blue Chip Growth Fund | $-- | $1,177,425 | $68,265 | $16,034 | $(7,508) | $97,526 | $1,199,178 |
| Fidelity Series Canada Fund | -- | 95,645 | 5,401 | 287 | (324) | 5,772 | 95,692 |
| Fidelity Series Commodity Strategy Fund | -- | 255,576 | 8,116 | 1,366 | (433) | 2,455 | 249,482 |
| Fidelity Series Corporate Bond Fund | -- | 20,865 | 3,060 | 165 | 3 | 599 | 18,407 |
| Fidelity Series Emerging Markets Debt Fund | -- | 66,732 | 1,898 | 826 | (15) | 1,255 | 66,074 |
| Fidelity Series Emerging Markets Fund | -- | 96,178 | 3,042 | 60 | (59) | 4,542 | 97,619 |
| Fidelity Series Emerging Markets Opportunities Fund | -- | 863,847 | 35,463 | 11,004 | (1,731) | 57,694 | 884,347 |
| Fidelity Series Floating Rate High Income Fund | -- | 16,140 | 1,209 | 254 | (19) | 108 | 15,020 |
| Fidelity Series Government Bond Index Fund | -- | 28,699 | 3,592 | 149 | (3) | 402 | 25,506 |
| Fidelity Series Government Money Market Fund 2.5% | -- | 27,144 | 2,230 | 140 | -- | -- | 24,914 |
| Fidelity Series High Income Fund | -- | 128,991 | 18,145 | 1,832 | (245) | 3,484 | 114,085 |
| Fidelity Series Inflation-Protected Bond Index Fund | -- | 30,738 | 1,166 | 89 | (12) | 493 | 30,053 |
| Fidelity Series International Growth Fund | -- | 790,568 | 37,969 | 8,178 | (2,369) | 52,724 | 802,954 |
| Fidelity Series International Index Fund | -- | 207,610 | 7,008 | 167 | (297) | 10,402 | 210,707 |
| Fidelity Series International Small Cap Fund | -- | 211,160 | 8,594 | 3,074 | (913) | 8,728 | 210,381 |
| Fidelity Series International Value Fund | -- | 797,313 | 26,839 | 4,513 | (2,364) | 23,681 | 791,791 |
| Fidelity Series Investment Grade Bond Fund | -- | 30,564 | 4,209 | 203 | (1) | 634 | 26,988 |
| Fidelity Series Investment Grade Securitized Fund | -- | 21,883 | 3,182 | 141 | (4) | 292 | 18,989 |
| Fidelity Series Large Cap Growth Index Fund | -- | 908,675 | 49,058 | 657 | (868) | 79,880 | 938,629 |
| Fidelity Series Large Cap Stock Fund | -- | 926,157 | 42,793 | 5,633 | (2,717) | 55,225 | 935,872 |
| Fidelity Series Large Cap Value Index Fund | -- | 1,739,549 | 69,554 | 20,128 | (4,877) | 87,393 | 1,752,511 |
| Fidelity Series Long-Term Treasury Bond Index Fund | -- | 363,443 | 23,867 | 2,284 | 6 | 14,537 | 354,119 |
| Fidelity Series Real Estate Income Fund | -- | 47,144 | 1,809 | 511 | (47) | 1,592 | 46,880 |
| Fidelity Series Short-Term Credit Fund | -- | 27,040 | 2,343 | 160 | (2) | 224 | 24,919 |
| Fidelity Series Small Cap Opportunities Fund | -- | 466,183 | 28,991 | 5,598 | (3,147) | 33,465 | 467,510 |
| Fidelity Series Treasury Bill Index Fund | -- | 82,082 | 17,968 | 483 | (16) | (29) | 64,069 |
| Fidelity Series Value Discovery Fund | -- | 555,830 | 20,057 | 5,170 | (1,875) | 20,598 | 554,496 |
| | $-- | $9,983,181 | $495,828 | $89,106 | $(29,837) | $563,676 | $10,021,192 |
Amounts in the income column in the above table include any capital gain distributions from underlying funds, which are presented in the corresponding line-item in the Statement of Operations, if applicable.
Investment Valuation
All investments are categorized as Level 1 under the Fair Value Hierarchy. The inputs or methodology used for valuing securities may not be an indication of the risk associated with investing in those securities. For more information on valuation inputs please refer to the Investment Valuation section in the accompanying Notes to Financial Statements.
See accompanying notes which are an integral part of the financial statements.
Fidelity Freedom® Blend 2045 Fund
Financial Statements
Statement of Assets and Liabilities
| | | March 31, 2019 |
| Assets | | |
Investment in securities, at value — See accompanying schedule:
| | |
| Fidelity Central Funds (cost $49) | $49 | |
| Other affiliated issuers (cost $9,457,516) | 10,021,192 | |
| Total Investment in Securities (cost $9,457,565) | | $10,021,241 |
| Cash | | 147 |
| Receivable for investments sold | | 42,465 |
| Receivable for fund shares sold | | 32,362 |
| Total assets | | 10,096,215 |
| Liabilities | | |
| Payable for investments purchased | $74,732 | |
| Accrued management fee | 2,680 | |
| Distribution and service plan fees payable | 241 | |
| Total liabilities | | 77,653 |
| Net Assets | | $10,018,562 |
| Net Assets consist of: | | |
| Paid in capital | | $9,445,448 |
| Total distributable earnings (loss) | | 573,114 |
| Net Assets | | $10,018,562 |
| Net Asset Value and Maximum Offering Price | | |
| Class A: | | |
| Net Asset Value and redemption price per share ($252,838 ÷ 26,465 shares) | | $9.55 |
| Maximum offering price per share (100/94.25 of $9.55) | | $10.13 |
| Class M: | | |
| Net Asset Value and redemption price per share ($160,268 ÷ 16,796 shares) | | $9.54 |
| Maximum offering price per share (100/96.50 of $9.54) | | $9.89 |
| Class C: | | |
| Net Asset Value and offering price per share ($156,579 ÷ 16,417 shares)(a) | | $9.54 |
| Fidelity Freedom Blend 2045 Fund: | | |
| Net Asset Value, offering price and redemption price per share ($748,052 ÷ 78,289 shares) | | $9.56 |
| Class K: | | |
| Net Asset Value, offering price and redemption price per share ($98,697 ÷ 10,319 shares) | | $9.56 |
| Class K6: | | |
| Net Asset Value, offering price and redemption price per share ($8,306,037 ÷ 868,239 shares) | | $9.57 |
| Class I: | | |
| Net Asset Value, offering price and redemption price per share ($98,639 ÷ 10,316 shares) | | $9.56 |
| Class Z: | | |
| Net Asset Value, offering price and redemption price per share ($98,697 ÷ 10,319 shares) | | $9.56 |
| Class Z6: | | |
| Net Asset Value, offering price and redemption price per share ($98,755 ÷ 10,323 shares) | | $9.57 |
(a) Redemption price per share is equal to net asset value less any applicable contingent deferred sales charge.
See accompanying notes which are an integral part of the financial statements.
Statement of Operations
| | | For the period
August 31, 2018 (commencement of operations) to
March 31, 2019 |
| Investment Income | | |
| Dividends: | | |
| Affiliated issuers | | $31,654 |
| Income from Fidelity Central Funds | | 195 |
| Total income | | 31,849 |
| Expenses | | |
| Management fee | $8,926 | |
| Distribution and service plan fees | 1,216 | |
| Independent trustees' fees and expenses | 6 | |
| Total expenses | | 10,148 |
| Net investment income (loss) | | 21,701 |
| Realized and Unrealized Gain (Loss) | | |
| Net realized gain (loss) on: | | |
| Investment securities: | | �� |
| Affiliated issuers | (29,837) | |
| Capital gain distributions from underlying funds: | | |
| Affiliated issuers | 57,452 | |
| Total net realized gain (loss) | | 27,615 |
| Change in net unrealized appreciation (depreciation) on: | | |
| Investment securities: | | |
| Affiliated issuers | 563,676 | |
| Total change in net unrealized appreciation (depreciation) | | 563,676 |
| Net gain (loss) | | 591,291 |
| Net increase (decrease) in net assets resulting from operations | | $612,992 |
See accompanying notes which are an integral part of the financial statements.
Statement of Changes in Net Assets
| | For the period
August 31, 2018 (commencement of operations) to
March 31, 2019 |
| Increase (Decrease) in Net Assets | |
| Operations | |
| Net investment income (loss) | $21,701 |
| Net realized gain (loss) | 27,615 |
| Change in net unrealized appreciation (depreciation) | 563,676 |
| Net increase (decrease) in net assets resulting from operations | 612,992 |
| Distributions to shareholders | (39,877) |
| Total distributions | (39,877) |
| Share transactions - net increase (decrease) | 9,445,447 |
| Total increase (decrease) in net assets | 10,018,562 |
| Net Assets | |
| Beginning of period | – |
| End of period | $10,018,562 |
See accompanying notes which are an integral part of the financial statements.
Financial Highlights
Fidelity Freedom Blend 2045 Fund Class A
| Year ended March 31, | 2019 A |
| Selected Per–Share Data | |
| Net asset value, beginning of period | $10.00 |
| Income from Investment Operations | |
| Net investment income (loss)B | .03 |
| Net realized and unrealized gain (loss) | (.22)C |
| Total from investment operations | (.19) |
| Distributions from net investment income | (.15) |
| Distributions from net realized gain | (.11) |
| Total distributions | (.26) |
| Net asset value, end of period | $9.55 |
| Total ReturnD,E | (1.56)% |
| Ratios to Average Net AssetsF,G | |
| Expenses before reductions | .79%H |
| Expenses net of fee waivers, if any | .79%H |
| Expenses net of all reductions | .79%H |
| Net investment income (loss) | .64%H |
| Supplemental Data | |
| Net assets, end of period (000 omitted) | $253 |
| Portfolio turnover rateG | 19%H |
A For the period August 31, 2018 (commencement of operations) to March 31, 2019.
B Calculated based on average shares outstanding during the period.
C The amount shown for a share outstanding does not correspond with the aggregate net gain (loss) on investments for the period due to the timing of sales and repurchases of shares in relation to fluctuating market values of the investments of the Fund.
D Total returns for periods of less than one year are not annualized.
E Total returns do not include the effect of the sales charges.
F Expense ratios reflect operating expenses of the class. Expenses before reductions do not reflect amounts reimbursed by the investment adviser or reductions from expense offset arrangements and do not represent the amount paid by the class during periods when reimbursements or reductions occur. Expense ratios before reductions for start-up periods may not be representative of longer-term operating periods. Expenses net of fee waivers reflect expenses after reimbursement by the investment adviser but prior to reductions from expense offset arrangements. Expenses net of all reductions represent the net expenses paid by the class but do not include expenses of the underlying funds in which the Fund invests.
G Amounts do not include the activity of the Underlying Funds.
H Annualized
See accompanying notes which are an integral part of the financial statements.
Fidelity Freedom Blend 2045 Fund Class M
| Year ended March 31, | 2019 A |
| Selected Per–Share Data | |
| Net asset value, beginning of period | $10.00 |
| Income from Investment Operations | |
| Net investment income (loss)B | .02 |
| Net realized and unrealized gain (loss) | (.22)C |
| Total from investment operations | (.20) |
| Distributions from net investment income | (.15) |
| Distributions from net realized gain | (.11) |
| Total distributions | (.26) |
| Net asset value, end of period | $9.54 |
| Total ReturnD,E | (1.68)% |
| Ratios to Average Net AssetsF,G | |
| Expenses before reductions | 1.04%H |
| Expenses net of fee waivers, if any | 1.04%H |
| Expenses net of all reductions | 1.04%H |
| Net investment income (loss) | .39%H |
| Supplemental Data | |
| Net assets, end of period (000 omitted) | $160 |
| Portfolio turnover rateG | 19%H |
A For the period August 31, 2018 (commencement of operations) to March 31, 2019.
B Calculated based on average shares outstanding during the period.
C The amount shown for a share outstanding does not correspond with the aggregate net gain (loss) on investments for the period due to the timing of sales and repurchases of shares in relation to fluctuating market values of the investments of the Fund.
D Total returns for periods of less than one year are not annualized.
E Total returns do not include the effect of the sales charges.
F Expense ratios reflect operating expenses of the class. Expenses before reductions do not reflect amounts reimbursed by the investment adviser or reductions from expense offset arrangements and do not represent the amount paid by the class during periods when reimbursements or reductions occur. Expense ratios before reductions for start-up periods may not be representative of longer-term operating periods. Expenses net of fee waivers reflect expenses after reimbursement by the investment adviser but prior to reductions from expense offset arrangements. Expenses net of all reductions represent the net expenses paid by the class but do not include expenses of the underlying funds in which the Fund invests.
G Amounts do not include the activity of the Underlying Funds.
H Annualized
See accompanying notes which are an integral part of the financial statements.
Fidelity Freedom Blend 2045 Fund Class C
| Year ended March 31, | 2019 A |
| Selected Per–Share Data | |
| Net asset value, beginning of period | $10.00 |
| Income from Investment Operations | |
| Net investment income (loss)B | (.01) |
| Net realized and unrealized gain (loss) | (.21)C |
| Total from investment operations | (.22) |
| Distributions from net investment income | (.13) |
| Distributions from net realized gain | (.11) |
| Total distributions | (.24) |
| Net asset value, end of period | $9.54 |
| Total ReturnD,E | (1.91)% |
| Ratios to Average Net AssetsF,G | |
| Expenses before reductions | 1.55%H,I |
| Expenses net of fee waivers, if any | 1.55%H,I |
| Expenses net of all reductions | 1.55%H,I |
| Net investment income (loss) | (.12)%H |
| Supplemental Data | |
| Net assets, end of period (000 omitted) | $157 |
| Portfolio turnover rateG | 19%H |
A For the period August 31, 2018 (commencement of operations) to March 31, 2019.
B Calculated based on average shares outstanding during the period.
C The amount shown for a share outstanding does not correspond with the aggregate net gain (loss) on investments for the period due to the timing of sales and repurchases of shares in relation to fluctuating market values of the investments of the Fund.
D Total returns for periods of less than one year are not annualized.
E Total returns do not include the effect of the contingent deferred sales charge.
F Expense ratios reflect operating expenses of the class. Expenses before reductions do not reflect amounts reimbursed by the investment adviser or reductions from expense offset arrangements and do not represent the amount paid by the class during periods when reimbursements or reductions occur. Expense ratios before reductions for start-up periods may not be representative of longer-term operating periods. Expenses net of fee waivers reflect expenses after reimbursement by the investment adviser but prior to reductions from expense offset arrangements. Expenses net of all reductions represent the net expenses paid by the class but do not include expenses of the underlying funds in which the Fund invests.
G Amounts do not include the activity of the Underlying Funds.
H Annualized
I On certain classes, the size and fluctuation of net assets and expense amounts may cause ratios to differ from contractual rates.
See accompanying notes which are an integral part of the financial statements.
Fidelity Freedom Blend 2045 Fund
| Year ended March 31, | 2019 A |
| Selected Per–Share Data | |
| Net asset value, beginning of period | $10.00 |
| Income from Investment Operations | |
| Net investment income (loss)B | .05 |
| Net realized and unrealized gain (loss) | (.22)C |
| Total from investment operations | (.17) |
| Distributions from net investment income | (.16) |
| Distributions from net realized gain | (.11) |
| Total distributions | (.27) |
| Net asset value, end of period | $9.56 |
| Total ReturnD | (1.31)% |
| Ratios to Average Net AssetsE,F | |
| Expenses before reductions | .55%G,H |
| Expenses net of fee waivers, if any | .55%G,H |
| Expenses net of all reductions | .55%G,H |
| Net investment income (loss) | .88%G |
| Supplemental Data | |
| Net assets, end of period (000 omitted) | $748 |
| Portfolio turnover rateF | 19%G |
A For the period August 31, 2018 (commencement of operations) to March 31, 2019.
B Calculated based on average shares outstanding during the period.
C The amount shown for a share outstanding does not correspond with the aggregate net gain (loss) on investments for the period due to the timing of sales and repurchases of shares in relation to fluctuating market values of the investments of the Fund.
D Total returns for periods of less than one year are not annualized.
E Expense ratios reflect operating expenses of the class. Expenses before reductions do not reflect amounts reimbursed by the investment adviser or reductions from expense offset arrangements and do not represent the amount paid by the class during periods when reimbursements or reductions occur. Expense ratios before reductions for start-up periods may not be representative of longer-term operating periods. Expenses net of fee waivers reflect expenses after reimbursement by the investment adviser but prior to reductions from expense offset arrangements. Expenses net of all reductions represent the net expenses paid by the class but do not include expenses of the underlying funds in which the Fund invests.
F Amounts do not include the activity of the Underlying Funds.
G Annualized
H On certain classes, the size and fluctuation of net assets and expense amounts may cause ratios to differ from contractual rates.
See accompanying notes which are an integral part of the financial statements.
Fidelity Freedom Blend 2045 Fund Class K
| Year ended March 31, | 2019 A |
| Selected Per–Share Data | |
| Net asset value, beginning of period | $10.00 |
| Income from Investment Operations | |
| Net investment income (loss)B | .05 |
| Net realized and unrealized gain (loss) | (.22)C |
| Total from investment operations | (.17) |
| Distributions from net investment income | (.16) |
| Distributions from net realized gain | (.11) |
| Total distributions | (.27) |
| Net asset value, end of period | $9.56 |
| Total ReturnD | (1.35)% |
| Ratios to Average Net AssetsE,F | |
| Expenses before reductions | .44%G |
| Expenses net of fee waivers, if any | .44%G |
| Expenses net of all reductions | .44%G |
| Net investment income (loss) | .99%G |
| Supplemental Data | |
| Net assets, end of period (000 omitted) | $99 |
| Portfolio turnover rateF | 19%G |
A For the period August 31, 2018 (commencement of operations) to March 31, 2019.
B Calculated based on average shares outstanding during the period.
C The amount shown for a share outstanding does not correspond with the aggregate net gain (loss) on investments for the period due to the timing of sales and repurchases of shares in relation to fluctuating market values of the investments of the Fund.
D Total returns for periods of less than one year are not annualized.
E Expense ratios reflect operating expenses of the class. Expenses before reductions do not reflect amounts reimbursed by the investment adviser or reductions from expense offset arrangements and do not represent the amount paid by the class during periods when reimbursements or reductions occur. Expense ratios before reductions for start-up periods may not be representative of longer-term operating periods. Expenses net of fee waivers reflect expenses after reimbursement by the investment adviser but prior to reductions from expense offset arrangements. Expenses net of all reductions represent the net expenses paid by the class but do not include expenses of the underlying funds in which the Fund invests.
F Amounts do not include the activity of the Underlying Funds.
G Annualized
See accompanying notes which are an integral part of the financial statements.
Fidelity Freedom Blend 2045 Fund Class K6
| Year ended March 31, | 2019 A |
| Selected Per–Share Data | |
| Net asset value, beginning of period | $10.00 |
| Income from Investment Operations | |
| Net investment income (loss)B | .06 |
| Net realized and unrealized gain (loss) | (.22)C |
| Total from investment operations | (.16) |
| Distributions from net investment income | (.16) |
| Distributions from net realized gain | (.11) |
| Total distributions | (.27) |
| Net asset value, end of period | $9.57 |
| Total ReturnD | (1.21)% |
| Ratios to Average Net AssetsE,F | |
| Expenses before reductions | .35%G,H |
| Expenses net of fee waivers, if any | .35%G,H |
| Expenses net of all reductions | .35%G,H |
| Net investment income (loss) | 1.08%G |
| Supplemental Data | |
| Net assets, end of period (000 omitted) | $8,306 |
| Portfolio turnover rateF | 19%G |
A For the period August 31, 2018 (commencement of operations) to March 31, 2019.
B Calculated based on average shares outstanding during the period.
C The amount shown for a share outstanding does not correspond with the aggregate net gain (loss) on investments for the period due to the timing of sales and repurchases of shares in relation to fluctuating market values of the investments of the Fund.
D Total returns for periods of less than one year are not annualized.
E Expense ratios reflect operating expenses of the class. Expenses before reductions do not reflect amounts reimbursed by the investment adviser or reductions from expense offset arrangements and do not represent the amount paid by the class during periods when reimbursements or reductions occur. Expenses net of fee waivers reflect expenses after reimbursement by the investment adviser but prior to reductions from expense offset arrangements. Expenses net of all reductions represent the net expenses paid by the class but do not include expenses of the underlying funds in which the Fund invests.
F Amounts do not include the activity of the Underlying Funds.
G Annualized
H On certain classes, the size and fluctuation of net assets and expense amounts may cause ratios to differ from contractual rates.
See accompanying notes which are an integral part of the financial statements.
Fidelity Freedom Blend 2045 Fund Class I
| Year ended March 31, | 2019 A |
| Selected Per–Share Data | |
| Net asset value, beginning of period | $10.00 |
| Income from Investment Operations | |
| Net investment income (loss)B | .05 |
| Net realized and unrealized gain (loss) | (.22)C |
| Total from investment operations | (.17) |
| Distributions from net investment income | (.16) |
| Distributions from net realized gain | (.11) |
| Total distributions | (.27) |
| Net asset value, end of period | $9.56 |
| Total ReturnD | (1.38)% |
| Ratios to Average Net AssetsE,F | |
| Expenses before reductions | .54%G |
| Expenses net of fee waivers, if any | .54%G |
| Expenses net of all reductions | .54%G |
| Net investment income (loss) | .89%G |
| Supplemental Data | |
| Net assets, end of period (000 omitted) | $99 |
| Portfolio turnover rateF | 19%G |
A For the period August 31, 2018 (commencement of operations) to March 31, 2019.
B Calculated based on average shares outstanding during the period.
C The amount shown for a share outstanding does not correspond with the aggregate net gain (loss) on investments for the period due to the timing of sales and repurchases of shares in relation to fluctuating market values of the investments of the Fund.
D Total returns for periods of less than one year are not annualized.
E Expense ratios reflect operating expenses of the class. Expenses before reductions do not reflect amounts reimbursed by the investment adviser or reductions from expense offset arrangements and do not represent the amount paid by the class during periods when reimbursements or reductions occur. Expense ratios before reductions for start-up periods may not be representative of longer-term operating periods. Expenses net of fee waivers reflect expenses after reimbursement by the investment adviser but prior to reductions from expense offset arrangements. Expenses net of all reductions represent the net expenses paid by the class but do not include expenses of the underlying funds in which the Fund invests.
F Amounts do not include the activity of the Underlying Funds.
G Annualized
See accompanying notes which are an integral part of the financial statements.
Fidelity Freedom Blend 2045 Fund Class Z
| Year ended March 31, | 2019 A |
| Selected Per–Share Data | |
| Net asset value, beginning of period | $10.00 |
| Income from Investment Operations | |
| Net investment income (loss)B | .05 |
| Net realized and unrealized gain (loss) | (.22)C |
| Total from investment operations | (.17) |
| Distributions from net investment income | (.16) |
| Distributions from net realized gain | (.11) |
| Total distributions | (.27) |
| Net asset value, end of period | $9.56 |
| Total ReturnD | (1.35)% |
| Ratios to Average Net AssetsE,F | |
| Expenses before reductions | .44%G |
| Expenses net of fee waivers, if any | .44%G |
| Expenses net of all reductions | .44%G |
| Net investment income (loss) | .99%G |
| Supplemental Data | |
| Net assets, end of period (000 omitted) | $99 |
| Portfolio turnover rateF | 19%G |
A For the period August 31, 2018 (commencement of operations) to March 31, 2019.
B Calculated based on average shares outstanding during the period.
��C The amount shown for a share outstanding does not correspond with the aggregate net gain (loss) on investments for the period due to the timing of sales and repurchases of shares in relation to fluctuating market values of the investments of the Fund.
D Total returns for periods of less than one year are not annualized.
E Expense ratios reflect operating expenses of the class. Expenses before reductions do not reflect amounts reimbursed by the investment adviser or reductions from expense offset arrangements and do not represent the amount paid by the class during periods when reimbursements or reductions occur. Expense ratios before reductions for start-up periods may not be representative of longer-term operating periods. Expenses net of fee waivers reflect expenses after reimbursement by the investment adviser but prior to reductions from expense offset arrangements. Expenses net of all reductions represent the net expenses paid by the class but do not include expenses of the underlying funds in which the Fund invests.
F Amounts do not include the activity of the Underlying Funds.
G Annualized
See accompanying notes which are an integral part of the financial statements.
Fidelity Freedom Blend 2045 Fund Class Z6
| Year ended March 31, | 2019 A |
| Selected Per–Share Data | |
| Net asset value, beginning of period | $10.00 |
| Income from Investment Operations | |
| Net investment income (loss)B | .06 |
| Net realized and unrealized gain (loss) | (.22)C |
| Total from investment operations | (.16) |
| Distributions from net investment income | (.16) |
| Distributions from net realized gain | (.11) |
| Total distributions | (.27) |
| Net asset value, end of period | $9.57 |
| Total ReturnD | (1.21)% |
| Ratios to Average Net AssetsE,F | |
| Expenses before reductions | .34%G |
| Expenses net of fee waivers, if any | .34%G |
| Expenses net of all reductions | .34%G |
| Net investment income (loss) | 1.09%G |
| Supplemental Data | |
| Net assets, end of period (000 omitted) | $99 |
| Portfolio turnover rateF | 19%G |
A For the period August 31, 2018 (commencement of operations) to March 31, 2019.
B Calculated based on average shares outstanding during the period.
C The amount shown for a share outstanding does not correspond with the aggregate net gain (loss) on investments for the period due to the timing of sales and repurchases of shares in relation to fluctuating market values of the investments of the Fund.
D Total returns for periods of less than one year are not annualized.
E Expense ratios reflect operating expenses of the class. Expenses before reductions do not reflect amounts reimbursed by the investment adviser or reductions from expense offset arrangements and do not represent the amount paid by the class during periods when reimbursements or reductions occur. Expenses net of fee waivers reflect expenses after reimbursement by the investment adviser but prior to reductions from expense offset arrangements. Expenses net of all reductions represent the net expenses paid by the class but do not include expenses of the underlying funds in which the Fund invests.
F Amounts do not include the activity of the Underlying Funds.
G Annualized
See accompanying notes which are an integral part of the financial statements.
Fidelity Freedom® Blend 2050 Fund
Investment Summary (Unaudited)
The information in the following tables is based on the direct investments of the Fund.
Top Holdings as of March 31, 2019
| | % of fund's net assets |
| Fidelity Series Large Cap Value Index Fund | 17.5 |
| Fidelity Series Blue Chip Growth Fund | 12.0 |
| Fidelity Series Large Cap Growth Index Fund | 9.4 |
| Fidelity Series Large Cap Stock Fund | 9.3 |
| Fidelity Series Emerging Markets Opportunities Fund | 8.8 |
| Fidelity Series International Growth Fund | 8.0 |
| Fidelity Series International Value Fund | 7.9 |
| Fidelity Series Value Discovery Fund | 5.5 |
| Fidelity Series Small Cap Opportunities Fund | 4.7 |
| Fidelity Series Long-Term Treasury Bond Index Fund | 3.5 |
| | 86.6 |
Asset Allocation (% of fund's net assets)
| Period end |
| | Domestic Equity Funds | 60.9% |
| | International Equity Funds | 30.9% |
| | Bond Funds | 7.1% |
| | Short-Term Funds | 1.1% |

Domestic Equity Funds category includes Fidelity Series Commodity Strategy Fund which invests in commodity-related investments.
Fidelity Freedom® Blend 2050 Fund
Schedule of Investments March 31, 2019
Showing Percentage of Net Assets
| Domestic Equity Funds - 60.9% | | | |
| | | Shares | Value |
| Fidelity Series Blue Chip Growth Fund (a) | | 71,561 | $1,055,521 |
| Fidelity Series Commodity Strategy Fund (a) | | 46,141 | 220,094 |
| Fidelity Series Large Cap Growth Index Fund (a) | | 81,963 | 826,189 |
| Fidelity Series Large Cap Stock Fund (a) | | 56,229 | 823,755 |
| Fidelity Series Large Cap Value Index Fund (a) | | 124,299 | 1,542,556 |
| Fidelity Series Small Cap Opportunities Fund (a) | | 30,572 | 411,502 |
| Fidelity Series Value Discovery Fund (a) | | 39,077 | 488,066 |
| TOTAL DOMESTIC EQUITY FUNDS | | | |
| (Cost $5,018,114) | | | 5,367,683 |
|
| International Equity Funds - 30.9% | | | |
| Fidelity Series Canada Fund (a) | | 8,162 | 84,153 |
| Fidelity Series Emerging Markets Fund (a) | | 8,779 | 85,942 |
| Fidelity Series Emerging Markets Opportunities Fund (a) | | 42,023 | 778,683 |
| Fidelity Series International Growth Fund (a) | | 46,528 | 706,766 |
| Fidelity Series International Index Fund (a) | | 18,887 | 185,466 |
| Fidelity Series International Small Cap Fund (a) | | 11,901 | 184,820 |
| Fidelity Series International Value Fund (a) | | 74,961 | 697,133 |
| TOTAL INTERNATIONAL EQUITY FUNDS | | | |
| (Cost $2,570,408) | | | 2,722,963 |
|
| Bond Funds - 7.1% | | | |
| Fidelity Series Corporate Bond Fund (a) | | 1,596 | 16,200 |
| Fidelity Series Emerging Markets Debt Fund (a) | | 6,020 | 57,727 |
| Fidelity Series Floating Rate High Income Fund (a) | | 1,418 | 13,148 |
| Fidelity Series Government Bond Index Fund (a) | | 2,196 | 22,448 |
| Fidelity Series High Income Fund (a) | | 10,681 | 100,406 |
| Fidelity Series Inflation-Protected Bond Index Fund (a) | | 2,705 | 26,459 |
| Fidelity Series Investment Grade Bond Fund (a) | | 2,125 | 23,752 |
| Fidelity Series Investment Grade Securitized Fund (a) | | 1,640 | 16,712 |
| Fidelity Series Long-Term Treasury Bond Index Fund (a) | | 35,142 | 311,708 |
| Fidelity Series Real Estate Income Fund (a) | | 3,782 | 41,263 |
| TOTAL BOND FUNDS | | | |
| (Cost $609,354) | | | 629,823 |
|
| Short-Term Funds - 1.1% | | | |
| Fidelity Cash Central Fund, 2.48% (b) | | 49 | 49 |
| Fidelity Series Government Money Market Fund 2.5% (a)(c) | | 22,152 | 22,152 |
| Fidelity Series Short-Term Credit Fund (a) | | 2,222 | 22,157 |
| Fidelity Series Treasury Bill Index Fund (a) | | 5,598 | 55,928 |
| TOTAL SHORT-TERM FUNDS | | | |
| (Cost $100,112) | | | 100,286 |
| TOTAL INVESTMENT IN SECURITIES - 100.0% | | | |
| (Cost $8,297,988) | | | 8,820,755 |
| NET OTHER ASSETS (LIABILITIES) - 0.0% | | | (2,401) |
| NET ASSETS - 100% | | | $8,818,354 |
Legend
(a) Affiliated Fund
(b) Affiliated fund that is generally available only to investment companies and other accounts managed by Fidelity Investments. The rate quoted is the annualized seven-day yield of the fund at period end. A complete unaudited listing of the fund's holdings as of its most recent quarter end is available upon request. In addition, each Fidelity Central Fund's financial statements, which are not covered by the Fund's Report of Independent Registered Public Accounting Firm, are available on the SEC's website or upon request.
(c) The rate quoted is the annualized seven-day yield of the fund at period end.
Affiliated Central Funds
Information regarding fiscal year to date income earned by the Fund from investments in Fidelity Central Funds is as follows:
| Fund | Income earned |
| Fidelity Cash Central Fund | $195 |
| Total | $195 |
Amounts in the income column in the above table include any capital gain distributions from underlying funds, which are presented in the corresponding line-item in the Statement of Operations, if applicable.
Affiliated Underlying Funds
Fiscal year to date information regarding the Fund's investments in affiliated Underlying Funds, excluding any Money Market Central Funds, is presented below. Exchanges between classes of the same affiliated Underlying Funds may occur.
| Affiliate | Value, beginning of period | Purchases | Sales Proceeds | Dividend Income | Realized Gain (loss) | Change in Unrealized appreciation (depreciation) | Value, end of period |
| Fidelity Series Blue Chip Growth Fund | $-- | $1,013,487 | $38,304 | $13,612 | $(6,844) | $87,182 | $1,055,521 |
| Fidelity Series Canada Fund | -- | 82,774 | 3,574 | 187 | (249) | 5,202 | 84,153 |
| Fidelity Series Commodity Strategy Fund | -- | 221,747 | 3,963 | 1,235 | (214) | 2,524 | 220,094 |
| Fidelity Series Corporate Bond Fund | -- | 18,233 | 2,569 | 144 | 3 | 533 | 16,200 |
| Fidelity Series Emerging Markets Debt Fund | -- | 57,499 | 852 | 706 | -- | 1,080 | 57,727 |
| Fidelity Series Emerging Markets Fund | -- | 83,438 | 1,387 | 35 | (30) | 3,921 | 85,942 |
| Fidelity Series Emerging Markets Opportunities Fund | -- | 747,587 | 20,911 | 6,352 | (1,333) | 53,340 | 778,683 |
| Fidelity Series Floating Rate High Income Fund | -- | 13,982 | 937 | 205 | (12) | 115 | 13,148 |
| Fidelity Series Government Bond Index Fund | -- | 25,072 | 2,976 | 129 | (1) | 353 | 22,448 |
| Fidelity Series Government Money Market Fund 2.5% | -- | 23,566 | 1,414 | 120 | -- | -- | 22,152 |
| Fidelity Series High Income Fund | -- | 111,706 | 14,304 | 1,535 | (250) | 3,254 | 100,406 |
| Fidelity Series Inflation-Protected Bond Index Fund | -- | 26,627 | 605 | 62 | (7) | 444 | 26,459 |
| Fidelity Series International Growth Fund | -- | 673,045 | 13,892 | 4,696 | (1,495) | 49,108 | 706,766 |
| Fidelity Series International Index Fund | -- | 179,904 | 3,620 | 109 | (195) | 9,377 | 185,466 |
| Fidelity Series International Small Cap Fund | -- | 179,781 | 3,051 | 1,764 | (528) | 8,618 | 184,820 |
| Fidelity Series International Value Fund | -- | 689,343 | 13,705 | 2,587 | (1,494) | 22,989 | 697,133 |
| Fidelity Series Investment Grade Bond Fund | -- | 26,697 | 3,506 | 175 | -- | 561 | 23,752 |
| Fidelity Series Investment Grade Securitized Fund | -- | 19,112 | 2,653 | 123 | (4) | 257 | 16,712 |
| Fidelity Series Large Cap Growth Index Fund | -- | 780,620 | 26,523 | 428 | (1,536) | 73,628 | 826,189 |
| Fidelity Series Large Cap Stock Fund | -- | 793,563 | 20,232 | 3,365 | (1,885) | 52,309 | 823,755 |
| Fidelity Series Large Cap Value Index Fund | -- | 1,499,674 | 37,059 | 14,562 | (2,436) | 82,377 | 1,542,556 |
| Fidelity Series Long-Term Treasury Bond Index Fund | -- | 316,166 | 16,869 | 1,951 | (13) | 12,424 | 311,708 |
| Fidelity Series Real Estate Income Fund | -- | 40,874 | 1,028 | 412 | (31) | 1,448 | 41,263 |
| Fidelity Series Short-Term Credit Fund | -- | 23,476 | 1,515 | 136 | -- | 196 | 22,157 |
| Fidelity Series Small Cap Opportunities Fund | -- | 396,620 | 13,116 | 4,656 | (3,385) | 31,383 | 411,502 |
| Fidelity Series Treasury Bill Index Fund | -- | 71,145 | 15,181 | 413 | (14) | (22) | 55,928 |
| Fidelity Series Value Discovery Fund | -- | 478,738 | 9,956 | 2,972 | (882) | 20,166 | 488,066 |
| | $-- | $8,594,476 | $273,702 | $62,671 | $(22,835) | $522,767 | $8,820,706 |
Amounts in the income column in the above table include any capital gain distributions from underlying funds, which are presented in the corresponding line-item in the Statement of Operations, if applicable.
Investment Valuation
All investments are categorized as Level 1 under the Fair Value Hierarchy. The inputs or methodology used for valuing securities may not be an indication of the risk associated with investing in those securities. For more information on valuation inputs please refer to the Investment Valuation section in the accompanying Notes to Financial Statements.
See accompanying notes which are an integral part of the financial statements.
Fidelity Freedom® Blend 2050 Fund
Financial Statements
Statement of Assets and Liabilities
| | | March 31, 2019 |
| Assets | | |
Investment in securities, at value — See accompanying schedule:
| | |
| Fidelity Central Funds (cost $49) | $49 | |
| Other affiliated issuers (cost $8,297,939) | 8,820,706 | |
| Total Investment in Securities (cost $8,297,988) | | $8,820,755 |
| Cash | | 146 |
| Receivable for investments sold | | 43,716 |
| Receivable for fund shares sold | | 14,339 |
| Total assets | | 8,878,956 |
| Liabilities | | |
| Payable for investments purchased | $58,058 | |
| Accrued management fee | 2,362 | |
| Distribution and service plan fees payable | 182 | |
| Total liabilities | | 60,602 |
| Net Assets | | $8,818,354 |
| Net Assets consist of: | | |
| Paid in capital | | $8,292,839 |
| Total distributable earnings (loss) | | 525,515 |
| Net Assets | | $8,818,354 |
| Net Asset Value and Maximum Offering Price | | |
| Class A: | | |
| Net Asset Value and redemption price per share ($239,329 ÷ 25,162 shares) | | $9.51 |
| Maximum offering price per share (100/94.25 of $9.51) | | $10.09 |
| Class M: | | |
| Net Asset Value and redemption price per share ($98,742 ÷ 10,386 shares) | | $9.51 |
| Maximum offering price per share (100/96.50 of $9.51) | | $9.85 |
| Class C: | | |
| Net Asset Value and offering price per share ($137,201 ÷ 14,446 shares)(a) | | $9.50 |
| Fidelity Freedom Blend 2050 Fund: | | |
| Net Asset Value, offering price and redemption price per share ($465,826 ÷ 48,960 shares) | | $9.51 |
| Class K: | | |
| Net Asset Value, offering price and redemption price per share ($98,718 ÷ 10,369 shares) | | $9.52 |
| Class K6: | | |
| Net Asset Value, offering price and redemption price per share ($7,479,606 ÷ 785,476 shares) | | $9.52 |
| Class I: | | |
| Net Asset Value, offering price and redemption price per share ($101,438 ÷ 10,658 shares) | | $9.52 |
| Class Z: | | |
| Net Asset Value, offering price and redemption price per share ($98,718 ÷ 10,369 shares) | | $9.52 |
| Class Z6: | | |
| Net Asset Value, offering price and redemption price per share ($98,776 ÷ 10,373 shares) | | $9.52 |
(a) Redemption price per share is equal to net asset value less any applicable contingent deferred sales charge.
See accompanying notes which are an integral part of the financial statements.
Statement of Operations
| | | For the period
August 31, 2018 (commencement of operations) to
March 31, 2019 |
| Investment Income | | |
| Dividends: | | |
| Affiliated issuers | | $20,986 |
| Income from Fidelity Central Funds | | 195 |
| Total income | | 21,181 |
| Expenses | | |
| Management fee | $7,415 | |
| Distribution and service plan fees | 1,069 | |
| Independent trustees' fees and expenses | 5 | |
| Total expenses | | 8,489 |
| Net investment income (loss) | | 12,692 |
| Realized and Unrealized Gain (Loss) | | |
| Net realized gain (loss) on: | | |
| Investment securities: | | |
| Affiliated issuers | (22,835) | |
| Capital gain distributions from underlying funds: | | |
| Affiliated issuers | 41,685 | |
| Total net realized gain (loss) | | 18,850 |
| Change in net unrealized appreciation (depreciation) on: | | |
| Investment securities: | | |
| Affiliated issuers | 522,767 | |
| Total change in net unrealized appreciation (depreciation) | | 522,767 |
| Net gain (loss) | | 541,617 |
| Net increase (decrease) in net assets resulting from operations | | $554,309 |
See accompanying notes which are an integral part of the financial statements.
Statement of Changes in Net Assets
| | For the period
August 31, 2018 (commencement of operations) to
March 31, 2019 |
| Increase (Decrease) in Net Assets | |
| Operations | |
| Net investment income (loss) | $12,692 |
| Net realized gain (loss) | 18,850 |
| Change in net unrealized appreciation (depreciation) | 522,767 |
| Net increase (decrease) in net assets resulting from operations | 554,309 |
| Distributions to shareholders | (28,794) |
| Total distributions | (28,794) |
| Share transactions - net increase (decrease) | 8,292,839 |
| Total increase (decrease) in net assets | 8,818,354 |
| Net Assets | |
| Beginning of period | – |
| End of period | $8,818,354 |
See accompanying notes which are an integral part of the financial statements.
Financial Highlights
Fidelity Freedom Blend 2050 Fund Class A
| Year ended March 31, | 2019 A |
| Selected Per–Share Data | |
| Net asset value, beginning of period | $10.00 |
| Income from Investment Operations | |
| Net investment income (loss)B | .02 |
| Net realized and unrealized gain (loss) | (.21)C |
| Total from investment operations | (.19) |
| Distributions from net investment income | (.14) |
| Distributions from net realized gain | (.16) |
| Total distributions | (.30) |
| Net asset value, end of period | $9.51 |
| Total ReturnD,E | (1.50)% |
| Ratios to Average Net AssetsF,G | |
| Expenses before reductions | .79%H |
| Expenses net of fee waivers, if any | .79%H |
| Expenses net of all reductions | .79%H |
| Net investment income (loss) | .31%H |
| Supplemental Data | |
| Net assets, end of period (000 omitted) | $239 |
| Portfolio turnover rateG | 12%H |
A For the period August 31, 2018 (commencement of operations) to March 31, 2019.
B Calculated based on average shares outstanding during the period.
C The amount shown for a share outstanding does not correspond with the aggregate net gain (loss) on investments for the period due to the timing of sales and repurchases of shares in relation to fluctuating market values of the investments of the Fund.
D Total returns for periods of less than one year are not annualized.
E Total returns do not include the effect of the sales charges.
F Expense ratios reflect operating expenses of the class. Expenses before reductions do not reflect amounts reimbursed by the investment adviser or reductions from expense offset arrangements and do not represent the amount paid by the class during periods when reimbursements or reductions occur. Expense ratios before reductions for start-up periods may not be representative of longer-term operating periods. Expenses net of fee waivers reflect expenses after reimbursement by the investment adviser but prior to reductions from expense offset arrangements. Expenses net of all reductions represent the net expenses paid by the class but do not include expenses of the underlying funds in which the Fund invests.
G Amounts do not include the activity of the Underlying Funds.
H Annualized
See accompanying notes which are an integral part of the financial statements.
Fidelity Freedom Blend 2050 Fund Class M
| Year ended March 31, | 2019 A |
| Selected Per–Share Data | |
| Net asset value, beginning of period | $10.00 |
| Income from Investment Operations | |
| Net investment income (loss)B | –C |
| Net realized and unrealized gain (loss) | (.20)D |
| Total from investment operations | (.20) |
| Distributions from net investment income | (.13) |
| Distributions from net realized gain | (.16) |
| Total distributions | (.29) |
| Net asset value, end of period | $9.51 |
| Total ReturnE,F | (1.60)% |
| Ratios to Average Net AssetsG,H | |
| Expenses before reductions | 1.04%I |
| Expenses net of fee waivers, if any | 1.04%I |
| Expenses net of all reductions | 1.04%I |
| Net investment income (loss) | .07%I |
| Supplemental Data | |
| Net assets, end of period (000 omitted) | $99 |
| Portfolio turnover rateH | 12%I |
A For the period August 31, 2018 (commencement of operations) to March 31, 2019.
B Calculated based on average shares outstanding during the period.
C Amount represents less than $.005 per share.
D The amount shown for a share outstanding does not correspond with the aggregate net gain (loss) on investments for the period due to the timing of sales and repurchases of shares in relation to fluctuating market values of the investments of the Fund.
E Total returns for periods of less than one year are not annualized.
F Total returns do not include the effect of the sales charges.
G Expense ratios reflect operating expenses of the class. Expenses before reductions do not reflect amounts reimbursed by the investment adviser or reductions from expense offset arrangements and do not represent the amount paid by the class during periods when reimbursements or reductions occur. Expense ratios before reductions for start-up periods may not be representative of longer-term operating periods. Expenses net of fee waivers reflect expenses after reimbursement by the investment adviser but prior to reductions from expense offset arrangements. Expenses net of all reductions represent the net expenses paid by the class but do not include expenses of the underlying funds in which the Fund invests.
H Amounts do not include the activity of the Underlying Funds.
I Annualized
See accompanying notes which are an integral part of the financial statements.
Fidelity Freedom Blend 2050 Fund Class C
| Year ended March 31, | 2019 A |
| Selected Per–Share Data | |
| Net asset value, beginning of period | $10.00 |
| Income from Investment Operations | |
| Net investment income (loss)B | (.02) |
| Net realized and unrealized gain (loss) | (.20)C |
| Total from investment operations | (.22) |
| Distributions from net investment income | (.12) |
| Distributions from net realized gain | (.16) |
| Total distributions | (.28) |
| Net asset value, end of period | $9.50 |
| Total ReturnD,E | (1.89)% |
| Ratios to Average Net AssetsF,G | |
| Expenses before reductions | 1.54%H |
| Expenses net of fee waivers, if any | 1.54%H |
| Expenses net of all reductions | 1.54%H |
| Net investment income (loss) | (.43)%H |
| Supplemental Data | |
| Net assets, end of period (000 omitted) | $137 |
| Portfolio turnover rateG | 12%H |
A For the period August 31, 2018 (commencement of operations) to March 31, 2019.
B Calculated based on average shares outstanding during the period.
C The amount shown for a share outstanding does not correspond with the aggregate net gain (loss) on investments for the period due to the timing of sales and repurchases of shares in relation to fluctuating market values of the investments of the Fund.
D Total returns for periods of less than one year are not annualized.
E Total returns do not include the effect of the contingent deferred sales charge.
F Expense ratios reflect operating expenses of the class. Expenses before reductions do not reflect amounts reimbursed by the investment adviser or reductions from expense offset arrangements and do not represent the amount paid by the class during periods when reimbursements or reductions occur. Expense ratios before reductions for start-up periods may not be representative of longer-term operating periods. Expenses net of fee waivers reflect expenses after reimbursement by the investment adviser but prior to reductions from expense offset arrangements. Expenses net of all reductions represent the net expenses paid by the class but do not include expenses of the underlying funds in which the Fund invests.
G Amounts do not include the activity of the Underlying Funds.
H Annualized
See accompanying notes which are an integral part of the financial statements.
Fidelity Freedom Blend 2050 Fund
| Year ended March 31, | 2019 A |
| Selected Per–Share Data | |
| Net asset value, beginning of period | $10.00 |
| Income from Investment Operations | |
| Net investment income (loss)B | .03 |
| Net realized and unrealized gain (loss) | (.21)C |
| Total from investment operations | (.18) |
| Distributions from net investment income | (.15) |
| Distributions from net realized gain | (.16) |
| Total distributions | (.31) |
| Net asset value, end of period | $9.51 |
| Total ReturnD | (1.39)% |
| Ratios to Average Net AssetsE,F | |
| Expenses before reductions | .54%G |
| Expenses net of fee waivers, if any | .54%G |
| Expenses net of all reductions | .54%G |
| Net investment income (loss) | .57%G |
| Supplemental Data | |
| Net assets, end of period (000 omitted) | $466 |
| Portfolio turnover rateF | 12%G |
A For the period August 31, 2018 (commencement of operations) to March 31, 2019.
B Calculated based on average shares outstanding during the period.
C The amount shown for a share outstanding does not correspond with the aggregate net gain (loss) on investments for the period due to the timing of sales and repurchases of shares in relation to fluctuating market values of the investments of the Fund.
D Total returns for periods of less than one year are not annualized.
E Expense ratios reflect operating expenses of the class. Expenses before reductions do not reflect amounts reimbursed by the investment adviser or reductions from expense offset arrangements and do not represent the amount paid by the class during periods when reimbursements or reductions occur. Expense ratios before reductions for start-up periods may not be representative of longer-term operating periods. Expenses net of fee waivers reflect expenses after reimbursement by the investment adviser but prior to reductions from expense offset arrangements. Expenses net of all reductions represent the net expenses paid by the class but do not include expenses of the underlying funds in which the Fund invests.
F Amounts do not include the activity of the Underlying Funds.
G Annualized
See accompanying notes which are an integral part of the financial statements.
Fidelity Freedom Blend 2050 Fund Class K
| Year ended March 31, | 2019 A |
| Selected Per–Share Data | |
| Net asset value, beginning of period | $10.00 |
| Income from Investment Operations | |
| Net investment income (loss)B | .04 |
| Net realized and unrealized gain (loss) | (.21)C |
| Total from investment operations | (.17) |
| Distributions from net investment income | (.15) |
| Distributions from net realized gain | (.16) |
| Total distributions | (.31) |
| Net asset value, end of period | $9.52 |
| Total ReturnD | (1.28)% |
| Ratios to Average Net AssetsE,F | |
| Expenses before reductions | .44%G |
| Expenses net of fee waivers, if any | .44%G |
| Expenses net of all reductions | .44%G |
| Net investment income (loss) | .67%G |
| Supplemental Data | |
| Net assets, end of period (000 omitted) | $99 |
| Portfolio turnover rateF | 12%G |
A For the period August 31, 2018 (commencement of operations) to March 31, 2019.
B Calculated based on average shares outstanding during the period.
C The amount shown for a share outstanding does not correspond with the aggregate net gain (loss) on investments for the period due to the timing of sales and repurchases of shares in relation to fluctuating market values of the investments of the Fund.
D Total returns for periods of less than one year are not annualized.
E Expense ratios reflect operating expenses of the class. Expenses before reductions do not reflect amounts reimbursed by the investment adviser or reductions from expense offset arrangements and do not represent the amount paid by the class during periods when reimbursements or reductions occur. Expense ratios before reductions for start-up periods may not be representative of longer-term operating periods. Expenses net of fee waivers reflect expenses after reimbursement by the investment adviser but prior to reductions from expense offset arrangements. Expenses net of all reductions represent the net expenses paid by the class but do not include expenses of the underlying funds in which the Fund invests.
F Amounts do not include the activity of the Underlying Funds.
G Annualized
See accompanying notes which are an integral part of the financial statements.
Fidelity Freedom Blend 2050 Fund Class K6
| Year ended March 31, | 2019 A |
| Selected Per–Share Data | |
| Net asset value, beginning of period | $10.00 |
| Income from Investment Operations | |
| Net investment income (loss)B | .04 |
| Net realized and unrealized gain (loss) | (.20)C |
| Total from investment operations | (.16) |
| Distributions from net investment income | (.16) |
| Distributions from net realized gain | (.16) |
| Total distributions | (.32) |
| Net asset value, end of period | $9.52 |
| Total ReturnD | (1.25)% |
| Ratios to Average Net AssetsE,F | |
| Expenses before reductions | .35%G,H |
| Expenses net of fee waivers, if any | .35%G,H |
| Expenses net of all reductions | .35%G,H |
| Net investment income (loss) | .76%G |
| Supplemental Data | |
| Net assets, end of period (000 omitted) | $7,480 |
| Portfolio turnover rateF | 12%G |
A For the period August 31, 2018 (commencement of operations) to March 31, 2019.
B Calculated based on average shares outstanding during the period.
C The amount shown for a share outstanding does not correspond with the aggregate net gain (loss) on investments for the period due to the timing of sales and repurchases of shares in relation to fluctuating market values of the investments of the Fund.
D Total returns for periods of less than one year are not annualized.
E Expense ratios reflect operating expenses of the class. Expenses before reductions do not reflect amounts reimbursed by the investment adviser or reductions from expense offset arrangements and do not represent the amount paid by the class during periods when reimbursements or reductions occur. Expenses net of fee waivers reflect expenses after reimbursement by the investment adviser but prior to reductions from expense offset arrangements. Expenses net of all reductions represent the net expenses paid by the class but do not include expenses of the underlying funds in which the Fund invests.
F Amounts do not include the activity of the Underlying Funds.
G Annualized
H On certain classes, the size and fluctuation of net assets and expense amounts may cause ratios to differ from contractual rates.
See accompanying notes which are an integral part of the financial statements.
Fidelity Freedom Blend 2050 Fund Class I
| Year ended March 31, | 2019 A |
| Selected Per–Share Data | |
| Net asset value, beginning of period | $10.00 |
| Income from Investment Operations | |
| Net investment income (loss)B | .03 |
| Net realized and unrealized gain (loss) | (.20)C |
| Total from investment operations | (.17) |
| Distributions from net investment income | (.15) |
| Distributions from net realized gain | (.16) |
| Total distributions | (.31) |
| Net asset value, end of period | $9.52 |
| Total ReturnD | (1.32)% |
| Ratios to Average Net AssetsE,F | |
| Expenses before reductions | .54%G |
| Expenses net of fee waivers, if any | .54%G |
| Expenses net of all reductions | .54%G |
| Net investment income (loss) | .57%G |
| Supplemental Data | |
| Net assets, end of period (000 omitted) | $101 |
| Portfolio turnover rateF | 12%G |
A For the period August 31, 2018 (commencement of operations) to March 31, 2019.
B Calculated based on average shares outstanding during the period.
C The amount shown for a share outstanding does not correspond with the aggregate net gain (loss) on investments for the period due to the timing of sales and repurchases of shares in relation to fluctuating market values of the investments of the Fund.
D Total returns for periods of less than one year are not annualized.
E Expense ratios reflect operating expenses of the class. Expenses before reductions do not reflect amounts reimbursed by the investment adviser or reductions from expense offset arrangements and do not represent the amount paid by the class during periods when reimbursements or reductions occur. Expense ratios before reductions for start-up periods may not be representative of longer-term operating periods. Expenses net of fee waivers reflect expenses after reimbursement by the investment adviser but prior to reductions from expense offset arrangements. Expenses net of all reductions represent the net expenses paid by the class but do not include expenses of the underlying funds in which the Fund invests.
F Amounts do not include the activity of the Underlying Funds.
G Annualized
See accompanying notes which are an integral part of the financial statements.
Fidelity Freedom Blend 2050 Fund Class Z
| Year ended March 31, | 2019 A |
| Selected Per–Share Data | |
| Net asset value, beginning of period | $10.00 |
| Income from Investment Operations | |
| Net investment income (loss)B | .04 |
| Net realized and unrealized gain (loss) | (.21)C |
| Total from investment operations | (.17) |
| Distributions from net investment income | (.15) |
| Distributions from net realized gain | (.16) |
| Total distributions | (.31) |
| Net asset value, end of period | $9.52 |
| Total ReturnD | (1.28)% |
| Ratios to Average Net AssetsE,F | |
| Expenses before reductions | .44%G |
| Expenses net of fee waivers, if any | .44%G |
| Expenses net of all reductions | .44%G |
| Net investment income (loss) | .67%G |
| Supplemental Data | |
| Net assets, end of period (000 omitted) | $99 |
| Portfolio turnover rateF | 12%G |
A For the period August 31, 2018 (commencement of operations) to March 31, 2019.
B Calculated based on average shares outstanding during the period.
C The amount shown for a share outstanding does not correspond with the aggregate net gain (loss) on investments for the period due to the timing of sales and repurchases of shares in relation to fluctuating market values of the investments of the Fund.
D Total returns for periods of less than one year are not annualized.
E Expense ratios reflect operating expenses of the class. Expenses before reductions do not reflect amounts reimbursed by the investment adviser or reductions from expense offset arrangements and do not represent the amount paid by the class during periods when reimbursements or reductions occur. Expense ratios before reductions for start-up periods may not be representative of longer-term operating periods. Expenses net of fee waivers reflect expenses after reimbursement by the investment adviser but prior to reductions from expense offset arrangements. Expenses net of all reductions represent the net expenses paid by the class but do not include expenses of the underlying funds in which the Fund invests.
F Amounts do not include the activity of the Underlying Funds.
G Annualized
See accompanying notes which are an integral part of the financial statements.
Fidelity Freedom Blend 2050 Fund Class Z6
| Year ended March 31, | 2019 A |
| Selected Per–Share Data | |
| Net asset value, beginning of period | $10.00 |
| Income from Investment Operations | |
| Net investment income (loss)B | .04 |
| Net realized and unrealized gain (loss) | (.20)C |
| Total from investment operations | (.16) |
| Distributions from net investment income | (.16) |
| Distributions from net realized gain | (.16) |
| Total distributions | (.32) |
| Net asset value, end of period | $9.52 |
| Total ReturnD | (1.25)% |
| Ratios to Average Net AssetsE,F | |
| Expenses before reductions | .34%G |
| Expenses net of fee waivers, if any | .34%G |
| Expenses net of all reductions | .34%G |
| Net investment income (loss) | .77%G |
| Supplemental Data | |
| Net assets, end of period (000 omitted) | $99 |
| Portfolio turnover rateF | 12%G |
A For the period August 31, 2018 (commencement of operations) to March 31, 2019.
B Calculated based on average shares outstanding during the period.
C The amount shown for a share outstanding does not correspond with the aggregate net gain (loss) on investments for the period due to the timing of sales and repurchases of shares in relation to fluctuating market values of the investments of the Fund.
D Total returns for periods of less than one year are not annualized.
E Expense ratios reflect operating expenses of the class. Expenses before reductions do not reflect amounts reimbursed by the investment adviser or reductions from expense offset arrangements and do not represent the amount paid by the class during periods when reimbursements or reductions occur. Expenses net of fee waivers reflect expenses after reimbursement by the investment adviser but prior to reductions from expense offset arrangements. Expenses net of all reductions represent the net expenses paid by the class but do not include expenses of the underlying funds in which the Fund invests.
F Amounts do not include the activity of the Underlying Funds.
G Annualized
See accompanying notes which are an integral part of the financial statements.
Fidelity Freedom® Blend 2055 Fund
Investment Summary (Unaudited)
The information in the following tables is based on the direct investments of the Fund.
Top Holdings as of March 31, 2019
| | % of fund's net assets |
| Fidelity Series Large Cap Value Index Fund | 17.5 |
| Fidelity Series Blue Chip Growth Fund | 12.0 |
| Fidelity Series Large Cap Growth Index Fund | 9.4 |
| Fidelity Series Large Cap Stock Fund | 9.3 |
| Fidelity Series Emerging Markets Opportunities Fund | 8.8 |
| Fidelity Series International Growth Fund | 8.0 |
| Fidelity Series International Value Fund | 7.9 |
| Fidelity Series Value Discovery Fund | 5.5 |
| Fidelity Series Small Cap Opportunities Fund | 4.7 |
| Fidelity Series Long-Term Treasury Bond Index Fund | 3.5 |
| | 86.6 |
Asset Allocation (% of fund's net assets)
| Period end |
| | Domestic Equity Funds | 60.9% |
| | International Equity Funds | 30.9% |
| | Bond Funds | 7.1% |
| | Short-Term Funds | 1.1% |

Domestic Equity Funds category includes Fidelity Series Commodity Strategy Fund which invests in commodity-related investments.
Fidelity Freedom® Blend 2055 Fund
Schedule of Investments March 31, 2019
Showing Percentage of Net Assets
| Domestic Equity Funds - 60.9% | | | |
| | | Shares | Value |
| Fidelity Series Blue Chip Growth Fund (a) | | 41,353 | $609,952 |
| Fidelity Series Commodity Strategy Fund (a) | | 26,594 | 126,853 |
| Fidelity Series Large Cap Growth Index Fund (a) | | 47,364 | 477,427 |
| Fidelity Series Large Cap Stock Fund (a) | | 32,493 | 476,023 |
| Fidelity Series Large Cap Value Index Fund (a) | | 71,829 | 891,399 |
| Fidelity Series Small Cap Opportunities Fund (a) | | 17,667 | 237,795 |
| Fidelity Series Value Discovery Fund (a) | | 22,581 | 282,039 |
| TOTAL DOMESTIC EQUITY FUNDS | | | |
| (Cost $2,927,057) | | | 3,101,488 |
|
| International Equity Funds - 30.9% | | | |
| Fidelity Series Canada Fund (a) | | 4,721 | 48,676 |
| Fidelity Series Emerging Markets Fund (a) | | 5,072 | 49,653 |
| Fidelity Series Emerging Markets Opportunities Fund (a) | | 24,273 | 449,771 |
| Fidelity Series International Growth Fund (a) | | 26,887 | 408,416 |
| Fidelity Series International Index Fund (a) | | 10,913 | 107,171 |
| Fidelity Series International Small Cap Fund (a) | | 6,890 | 107,001 |
| Fidelity Series International Value Fund (a) | | 43,301 | 402,701 |
| TOTAL INTERNATIONAL EQUITY FUNDS | | | |
| (Cost $1,497,945) | | | 1,573,389 |
|
| Bond Funds - 7.1% | | | |
| Fidelity Series Corporate Bond Fund (a) | | 922 | 9,362 |
| Fidelity Series Emerging Markets Debt Fund (a) | | 3,551 | 34,052 |
| Fidelity Series Floating Rate High Income Fund (a) | | 820 | 7,600 |
| Fidelity Series Government Bond Index Fund (a) | | 1,269 | 12,972 |
| Fidelity Series High Income Fund (a) | | 6,173 | 58,022 |
| Fidelity Series Inflation-Protected Bond Index Fund (a) | | 1,563 | 15,290 |
| Fidelity Series Investment Grade Bond Fund (a) | | 1,228 | 13,726 |
| Fidelity Series Investment Grade Securitized Fund (a) | | 948 | 9,657 |
| Fidelity Series Long-Term Treasury Bond Index Fund (a) | | 20,306 | 180,119 |
| Fidelity Series Real Estate Income Fund (a) | | 2,208 | 24,092 |
| TOTAL BOND FUNDS | | | |
| (Cost $353,537) | | | 364,892 |
|
| Short-Term Funds - 1.1% | | | |
| Fidelity Cash Central Fund, 2.48% (b) | | 49 | 49 |
| Fidelity Series Government Money Market Fund 2.5% (a)(c) | | 12,441 | 12,441 |
| Fidelity Series Short-Term Credit Fund (a) | | 1,248 | 12,443 |
| Fidelity Series Treasury Bill Index Fund (a) | | 3,257 | 32,538 |
| TOTAL SHORT-TERM FUNDS | | | |
| (Cost $57,374) | | | 57,471 |
| TOTAL INVESTMENT IN SECURITIES - 100.0% | | | |
| (Cost $4,835,913) | | | 5,097,240 |
| NET OTHER ASSETS (LIABILITIES) - 0.0% | | | (1,392) |
| NET ASSETS - 100% | | | $5,095,848 |
Legend
(a) Affiliated Fund
(b) Affiliated fund that is generally available only to investment companies and other accounts managed by Fidelity Investments. The rate quoted is the annualized seven-day yield of the fund at period end. A complete unaudited listing of the fund's holdings as of its most recent quarter end is available upon request. In addition, each Fidelity Central Fund's financial statements, which are not covered by the Fund's Report of Independent Registered Public Accounting Firm, are available on the SEC's website or upon request.
(c) The rate quoted is the annualized seven-day yield of the fund at period end.
Affiliated Central Funds
Information regarding fiscal year to date income earned by the Fund from investments in Fidelity Central Funds is as follows:
| Fund | Income earned |
| Fidelity Cash Central Fund | $195 |
| Total | $195 |
Amounts in the income column in the above table include any capital gain distributions from underlying funds, which are presented in the corresponding line-item in the Statement of Operations, if applicable.
Affiliated Underlying Funds
Fiscal year to date information regarding the Fund's investments in affiliated Underlying Funds, excluding any Money Market Central Funds, is presented below. Exchanges between classes of the same affiliated Underlying Funds may occur.
| Affiliate | Value, beginning of period | Purchases | Sales Proceeds | Dividend Income | Realized Gain (loss) | Change in Unrealized appreciation (depreciation) | Value, end of period |
| Fidelity Series Blue Chip Growth Fund | $-- | $601,150 | $27,912 | $13,533 | $(5,008) | $41,722 | $609,952 |
| Fidelity Series Canada Fund | -- | 48,183 | 2,162 | 183 | (156) | 2,811 | 48,676 |
| Fidelity Series Commodity Strategy Fund | -- | 129,501 | 3,287 | 1,232 | (204) | 843 | 126,853 |
| Fidelity Series Corporate Bond Fund | -- | 10,607 | 1,544 | 89 | -- | 299 | 9,362 |
| Fidelity Series Emerging Markets Debt Fund | -- | 33,904 | 532 | 463 | (1) | 681 | 34,052 |
| Fidelity Series Emerging Markets Fund | -- | 48,520 | 867 | 34 | (34) | 2,034 | 49,653 |
| Fidelity Series Emerging Markets Opportunities Fund | -- | 435,302 | 12,498 | 6,196 | (862) | 27,829 | 449,771 |
| Fidelity Series Floating Rate High Income Fund | -- | 8,516 | 957 | 146 | (15) | 56 | 7,600 |
| Fidelity Series Government Bond Index Fund | -- | 14,581 | 1,805 | 80 | (3) | 199 | 12,972 |
| Fidelity Series Government Money Market Fund 2.5% | -- | 13,695 | 1,254 | 77 | -- | -- | 12,441 |
| Fidelity Series High Income Fund | -- | 64,673 | 8,218 | 1,027 | (159) | 1,726 | 58,022 |
| Fidelity Series Inflation-Protected Bond Index Fund | -- | 15,510 | 444 | 53 | (7) | 231 | 15,290 |
| Fidelity Series International Growth Fund | -- | 399,714 | 14,427 | 4,581 | (1,590) | 24,719 | 408,416 |
| Fidelity Series International Index Fund | -- | 104,409 | 1,909 | 106 | (120) | 4,791 | 107,171 |
| Fidelity Series International Small Cap Fund | -- | 106,788 | 2,948 | 1,720 | (505) | 3,666 | 107,001 |
| Fidelity Series International Value Fund | -- | 401,455 | 7,606 | 2,524 | (742) | 9,594 | 402,701 |
| Fidelity Series Investment Grade Bond Fund | -- | 15,531 | 2,120 | 109 | -- | 315 | 13,726 |
| Fidelity Series Investment Grade Securitized Fund | -- | 11,121 | 1,605 | 76 | (4) | 145 | 9,657 |
| Fidelity Series Large Cap Growth Index Fund | -- | 458,975 | 19,328 | 418 | (1,230) | 39,010 | 477,427 |
| Fidelity Series Large Cap Stock Fund | -- | 468,012 | 16,915 | 3,291 | (1,612) | 26,538 | 476,023 |
| Fidelity Series Large Cap Value Index Fund | -- | 878,194 | 27,115 | 10,820 | (1,624) | 41,944 | 891,399 |
| Fidelity Series Long-Term Treasury Bond Index Fund | -- | 183,698 | 10,470 | 1,272 | (69) | 6,960 | 180,119 |
| Fidelity Series Real Estate Income Fund | -- | 23,784 | 417 | 328 | (18) | 743 | 24,092 |
| Fidelity Series Short-Term Credit Fund | -- | 13,642 | 1,309 | 89 | -- | 110 | 12,443 |
| Fidelity Series Small Cap Opportunities Fund | -- | 237,825 | 11,974 | 4,624 | (2,936) | 14,880 | 237,795 |
| Fidelity Series Treasury Bill Index Fund | -- | 41,404 | 8,845 | 264 | (8) | (13) | 32,538 |
| Fidelity Series Value Discovery Fund | -- | 280,149 | 6,994 | 2,899 | (610) | 9,494 | 282,039 |
| | $-- | $5,048,843 | $195,462 | $56,234 | $(17,517) | $261,327 | $5,097,191 |
Amounts in the income column in the above table include any capital gain distributions from underlying funds, which are presented in the corresponding line-item in the Statement of Operations, if applicable.
Investment Valuation
All investments are categorized as Level 1 under the Fair Value Hierarchy. The inputs or methodology used for valuing securities may not be an indication of the risk associated with investing in those securities. For more information on valuation inputs please refer to the Investment Valuation section in the accompanying Notes to Financial Statements.
See accompanying notes which are an integral part of the financial statements.
Fidelity Freedom® Blend 2055 Fund
Financial Statements
Statement of Assets and Liabilities
| | | March 31, 2019 |
| Assets | | |
Investment in securities, at value — See accompanying schedule:
| | |
| Fidelity Central Funds (cost $49) | $49 | |
| Other affiliated issuers (cost $4,835,864) | 5,097,191 | |
| Total Investment in Securities (cost $4,835,913) | | $5,097,240 |
| Cash | | 146 |
| Receivable for investments sold | | 23,570 |
| Receivable for fund shares sold | | 12,136 |
| Total assets | | 5,133,092 |
| Liabilities | | |
| Payable for investments purchased | $35,708 | |
| Accrued management fee | 1,378 | |
| Distribution and service plan fees payable | 158 | |
| Total liabilities | | 37,244 |
| Net Assets | | $5,095,848 |
| Net Assets consist of: | | |
| Paid in capital | | $4,830,061 |
| Total distributable earnings (loss) | | 265,787 |
| Net Assets | | $5,095,848 |
| Net Asset Value and Maximum Offering Price | | |
| Class A: | | |
| Net Asset Value and redemption price per share ($151,032 ÷ 15,881 shares) | | $9.51 |
| Maximum offering price per share (100/94.25 of $9.51) | | $10.09 |
| Class M: | | |
| Net Asset Value and redemption price per share ($101,276 ÷ 10,655 shares) | | $9.51 |
| Maximum offering price per share (100/96.50 of $9.51) | | $9.85 |
| Class C: | | |
| Net Asset Value and offering price per share ($107,493 ÷ 11,322 shares)(a) | | $9.49 |
| Fidelity Freedom Blend 2055 Fund: | | |
| Net Asset Value, offering price and redemption price per share ($320,021 ÷ 33,635 shares) | | $9.51 |
| Class K: | | |
| Net Asset Value, offering price and redemption price per share ($98,752 ÷ 10,375 shares) | | $9.52 |
| Class K6: | | |
| Net Asset Value, offering price and redemption price per share ($4,021,017 ÷ 422,363 shares) | | $9.52 |
| Class I: | | |
| Net Asset Value, offering price and redemption price per share ($98,695 ÷ 10,370 shares) | | $9.52 |
| Class Z: | | |
| Net Asset Value, offering price and redemption price per share ($98,752 ÷ 10,375 shares) | | $9.52 |
| Class Z6: | | |
| Net Asset Value, offering price and redemption price per share ($98,810 ÷ 10,379 shares) | | $9.52 |
(a) Redemption price per share is equal to net asset value less any applicable contingent deferred sales charge.
See accompanying notes which are an integral part of the financial statements.
Statement of Operations
| | | For the period
August 31, 2018 (commencement of operations) to
March 31, 2019 |
| Investment Income | | |
| Dividends: | | |
| Affiliated issuers | | $18,351 |
| Income from Fidelity Central Funds | | 195 |
| Total income | | 18,546 |
| Expenses | | |
| Management fee | $4,998 | |
| Distribution and service plan fees | 996 | |
| Independent trustees' fees and expenses | 4 | |
| Total expenses | | 5,998 |
| Net investment income (loss) | | 12,548 |
| Realized and Unrealized Gain (Loss) | | |
| Net realized gain (loss) on: | | |
| Investment securities: | | |
| Affiliated issuers | (17,517) | |
| Capital gain distributions from underlying funds: | | |
| Affiliated issuers | 37,883 | |
| Total net realized gain (loss) | | 20,366 |
| Change in net unrealized appreciation (depreciation) on: | | |
| Investment securities: | | |
| Affiliated issuers | 261,327 | |
| Total change in net unrealized appreciation (depreciation) | | 261,327 |
| Net gain (loss) | | 281,693 |
| Net increase (decrease) in net assets resulting from operations | | $294,241 |
See accompanying notes which are an integral part of the financial statements.
Statement of Changes in Net Assets
| | For the period
August 31, 2018 (commencement of operations) to
March 31, 2019 |
| Increase (Decrease) in Net Assets | |
| Operations | |
| Net investment income (loss) | $12,548 |
| Net realized gain (loss) | 20,366 |
| Change in net unrealized appreciation (depreciation) | 261,327 |
| Net increase (decrease) in net assets resulting from operations | 294,241 |
| Distributions to shareholders | (28,454) |
| Total distributions | (28,454) |
| Share transactions - net increase (decrease) | 4,830,061 |
| Total increase (decrease) in net assets | 5,095,848 |
| Net Assets | |
| Beginning of period | – |
| End of period | $5,095,848 |
See accompanying notes which are an integral part of the financial statements.
Financial Highlights
Fidelity Freedom Blend 2055 Fund Class A
| Year ended March 31, | 2019 A |
| Selected Per–Share Data | |
| Net asset value, beginning of period | $10.00 |
| Income from Investment Operations | |
| Net investment income (loss)B | .04 |
| Net realized and unrealized gain (loss) | (.22)C |
| Total from investment operations | (.18) |
| Distributions from net investment income | (.14) |
| Distributions from net realized gain | (.16) |
| Total distributions | (.31)D |
| Net asset value, end of period | $9.51 |
| Total ReturnE,F | (1.46)% |
| Ratios to Average Net AssetsG,H | |
| Expenses before reductions | .79%I |
| Expenses net of fee waivers, if any | .79%I |
| Expenses net of all reductions | .79%I |
| Net investment income (loss) | .70%I |
| Supplemental Data | |
| Net assets, end of period (000 omitted) | $151 |
| Portfolio turnover rateH | 14%I |
A For the period August 31, 2018 (commencement of operations) to March 31, 2019.
B Calculated based on average shares outstanding during the period.
C The amount shown for a share outstanding does not correspond with the aggregate net gain (loss) on investments for the period due to the timing of sales and repurchases of shares in relation to fluctuating market values of the investments of the Fund.
D Total distributions of $.31 per share is comprised of distributions from net investment income of $.142 and distributions from net realized gain of $.164 per share.
E Total returns for periods of less than one year are not annualized.
F Total returns do not include the effect of the sales charges.
G Expense ratios reflect operating expenses of the class. Expenses before reductions do not reflect amounts reimbursed by the investment adviser or reductions from expense offset arrangements and do not represent the amount paid by the class during periods when reimbursements or reductions occur. Expense ratios before reductions for start-up periods may not be representative of longer-term operating periods. Expenses net of fee waivers reflect expenses after reimbursement by the investment adviser but prior to reductions from expense offset arrangements. Expenses net of all reductions represent the net expenses paid by the class but do not include expenses of the underlying funds in which the Fund invests.
H Amounts do not include the activity of the Underlying Funds.
I Annualized
See accompanying notes which are an integral part of the financial statements.
Fidelity Freedom Blend 2055 Fund Class M
| Year ended March 31, | 2019 A |
| Selected Per–Share Data | |
| Net asset value, beginning of period | $10.00 |
| Income from Investment Operations | |
| Net investment income (loss)B | .02 |
| Net realized and unrealized gain (loss) | (.21)C |
| Total from investment operations | (.19) |
| Distributions from net investment income | (.13) |
| Distributions from net realized gain | (.16) |
| Total distributions | (.30)D |
| Net asset value, end of period | $9.51 |
| Total ReturnE,F | (1.55)% |
| Ratios to Average Net AssetsG,H | |
| Expenses before reductions | 1.04%I |
| Expenses net of fee waivers, if any | 1.04%I |
| Expenses net of all reductions | 1.04%I |
| Net investment income (loss) | .45%I |
| Supplemental Data | |
| Net assets, end of period (000 omitted) | $101 |
| Portfolio turnover rateH | 14%I |
A For the period August 31, 2018 (commencement of operations) to March 31, 2019.
B Calculated based on average shares outstanding during the period.
C The amount shown for a share outstanding does not correspond with the aggregate net gain (loss) on investments for the period due to the timing of sales and repurchases of shares in relation to fluctuating market values of the investments of the Fund.
D Total distributions of $.30 per share is comprised of distributions from net investment income of $.134 and distributions from net realized gain of $.164 per share.
E Total returns for periods of less than one year are not annualized.
F Total returns do not include the effect of the sales charges.
G Expense ratios reflect operating expenses of the class. Expenses before reductions do not reflect amounts reimbursed by the investment adviser or reductions from expense offset arrangements and do not represent the amount paid by the class during periods when reimbursements or reductions occur. Expense ratios before reductions for start-up periods may not be representative of longer-term operating periods. Expenses net of fee waivers reflect expenses after reimbursement by the investment adviser but prior to reductions from expense offset arrangements. Expenses net of all reductions represent the net expenses paid by the class but do not include expenses of the underlying funds in which the Fund invests.
H Amounts do not include the activity of the Underlying Funds.
I Annualized
See accompanying notes which are an integral part of the financial statements.
Fidelity Freedom Blend 2055 Fund Class C
| Year ended March 31, | 2019 A |
| Selected Per–Share Data | |
| Net asset value, beginning of period | $10.00 |
| Income from Investment Operations | |
| Net investment income (loss)B | –C |
| Net realized and unrealized gain (loss) | (.23)D |
| Total from investment operations | (.23) |
| Distributions from net investment income | (.12) |
| Distributions from net realized gain | (.16) |
| Total distributions | (.28) |
| Net asset value, end of period | $9.49 |
| Total ReturnE,F | (1.93)% |
| Ratios to Average Net AssetsG,H | |
| Expenses before reductions | 1.54%I |
| Expenses net of fee waivers, if any | 1.54%I |
| Expenses net of all reductions | 1.54%I |
| Net investment income (loss) | (.05)%I |
| Supplemental Data | |
| Net assets, end of period (000 omitted) | $107 |
| Portfolio turnover rateH | 14%I |
A For the period August 31, 2018 (commencement of operations) to March 31, 2019.
B Calculated based on average shares outstanding during the period.
C Amount represents less than $.005 per share.
D The amount shown for a share outstanding does not correspond with the aggregate net gain (loss) on investments for the period due to the timing of sales and repurchases of shares in relation to fluctuating market values of the investments of the Fund.
E Total returns for periods of less than one year are not annualized.
F Total returns do not include the effect of the contingent deferred sales charge.
G Expense ratios reflect operating expenses of the class. Expenses before reductions do not reflect amounts reimbursed by the investment adviser or reductions from expense offset arrangements and do not represent the amount paid by the class during periods when reimbursements or reductions occur. Expense ratios before reductions for start-up periods may not be representative of longer-term operating periods. Expenses net of fee waivers reflect expenses after reimbursement by the investment adviser but prior to reductions from expense offset arrangements. Expenses net of all reductions represent the net expenses paid by the class but do not include expenses of the underlying funds in which the Fund invests.
H Amounts do not include the activity of the Underlying Funds.
I Annualized
See accompanying notes which are an integral part of the financial statements.
Fidelity Freedom Blend 2055 Fund
| Year ended March 31, | 2019 A |
| Selected Per–Share Data | |
| Net asset value, beginning of period | $10.00 |
| Income from Investment Operations | |
| Net investment income (loss)B | .05 |
| Net realized and unrealized gain (loss) | (.22)C |
| Total from investment operations | (.17) |
| Distributions from net investment income | (.15) |
| Distributions from net realized gain | (.16) |
| Total distributions | (.32)D |
| Net asset value, end of period | $9.51 |
| Total ReturnE | (1.35)% |
| Ratios to Average Net AssetsF,G | |
| Expenses before reductions | .54%H |
| Expenses net of fee waivers, if any | .54%H |
| Expenses net of all reductions | .54%H |
| Net investment income (loss) | .95%H |
| Supplemental Data | |
| Net assets, end of period (000 omitted) | $320 |
| Portfolio turnover rateG | 14%H |
A For the period August 31, 2018 (commencement of operations) to March 31, 2019.
B Calculated based on average shares outstanding during the period.
C The amount shown for a share outstanding does not correspond with the aggregate net gain (loss) on investments for the period due to the timing of sales and repurchases of shares in relation to fluctuating market values of the investments of the Fund.
D Total distributions of $.32 per share is comprised of distributions from net investment income of $.151 and distributions from net realized gain of $.164 per share.
E Total returns for periods of less than one year are not annualized.
F Expense ratios reflect operating expenses of the class. Expenses before reductions do not reflect amounts reimbursed by the investment adviser or reductions from expense offset arrangements and do not represent the amount paid by the class during periods when reimbursements or reductions occur. Expense ratios before reductions for start-up periods may not be representative of longer-term operating periods. Expenses net of fee waivers reflect expenses after reimbursement by the investment adviser but prior to reductions from expense offset arrangements. Expenses net of all reductions represent the net expenses paid by the class but do not include expenses of the underlying funds in which the Fund invests.
G Amounts do not include the activity of the Underlying Funds.
H Annualized
See accompanying notes which are an integral part of the financial statements.
Fidelity Freedom Blend 2055 Fund Class K
| Year ended March 31, | 2019 A |
| Selected Per–Share Data | |
| Net asset value, beginning of period | $10.00 |
| Income from Investment Operations | |
| Net investment income (loss)B | .06 |
| Net realized and unrealized gain (loss) | (.22)C |
| Total from investment operations | (.16) |
| Distributions from net investment income | (.15) |
| Distributions from net realized gain | (.16) |
| Total distributions | (.32)D |
| Net asset value, end of period | $9.52 |
| Total ReturnE | (1.23)% |
| Ratios to Average Net AssetsF,G | |
| Expenses before reductions | .44%H |
| Expenses net of fee waivers, if any | .44%H |
| Expenses net of all reductions | .44%H |
| Net investment income (loss) | 1.05%H |
| Supplemental Data | |
| Net assets, end of period (000 omitted) | $99 |
| Portfolio turnover rateG | 14%H |
A For the period August 31, 2018 (commencement of operations) to March 31, 2019.
B Calculated based on average shares outstanding during the period.
C The amount shown for a share outstanding does not correspond with the aggregate net gain (loss) on investments for the period due to the timing of sales and repurchases of shares in relation to fluctuating market values of the investments of the Fund.
D Total distributions of $.32 per share is comprised of distributions from net investment income of $.153 and distributions from net realized gain of $.164 per share.
E Total returns for periods of less than one year are not annualized.
F Expense ratios reflect operating expenses of the class. Expenses before reductions do not reflect amounts reimbursed by the investment adviser or reductions from expense offset arrangements and do not represent the amount paid by the class during periods when reimbursements or reductions occur. Expense ratios before reductions for start-up periods may not be representative of longer-term operating periods. Expenses net of fee waivers reflect expenses after reimbursement by the investment adviser but prior to reductions from expense offset arrangements. Expenses net of all reductions represent the net expenses paid by the class but do not include expenses of the underlying funds in which the Fund invests.
G Amounts do not include the activity of the Underlying Funds.
H Annualized
See accompanying notes which are an integral part of the financial statements.
Fidelity Freedom Blend 2055 Fund Class K6
| Year ended March 31, | 2019 A |
| Selected Per–Share Data | |
| Net asset value, beginning of period | $10.00 |
| Income from Investment Operations | |
| Net investment income (loss)B | .06 |
| Net realized and unrealized gain (loss) | (.22)C |
| Total from investment operations | (.16) |
| Distributions from net investment income | (.16) |
| Distributions from net realized gain | (.16) |
| Total distributions | (.32) |
| Net asset value, end of period | $9.52 |
| Total ReturnD | (1.19)% |
| Ratios to Average Net AssetsE,F | |
| Expenses before reductions | .35%G,H |
| Expenses net of fee waivers, if any | .35%G,H |
| Expenses net of all reductions | .35%G,H |
| Net investment income (loss) | 1.15%G |
| Supplemental Data | |
| Net assets, end of period (000 omitted) | $4,021 |
| Portfolio turnover rateF | 14%G |
A For the period August 31, 2018 (commencement of operations) to March 31, 2019.
B Calculated based on average shares outstanding during the period.
C The amount shown for a share outstanding does not correspond with the aggregate net gain (loss) on investments for the period due to the timing of sales and repurchases of shares in relation to fluctuating market values of the investments of the Fund.
D Total returns for periods of less than one year are not annualized.
E Expense ratios reflect operating expenses of the class. Expenses before reductions do not reflect amounts reimbursed by the investment adviser or reductions from expense offset arrangements and do not represent the amount paid by the class during periods when reimbursements or reductions occur. Expenses net of fee waivers reflect expenses after reimbursement by the investment adviser but prior to reductions from expense offset arrangements. Expenses net of all reductions represent the net expenses paid by the class but do not include expenses of the underlying funds in which the Fund invests.
F Amounts do not include the activity of the Underlying Funds.
G Annualized
H On certain classes, the size and fluctuation of net assets and expense amounts may cause ratios to differ from contractual rates.
See accompanying notes which are an integral part of the financial statements.
Fidelity Freedom Blend 2055 Fund Class I
| Year ended March 31, | 2019 A |
| Selected Per–Share Data | |
| Net asset value, beginning of period | $10.00 |
| Income from Investment Operations | |
| Net investment income (loss)B | .05 |
| Net realized and unrealized gain (loss) | (.22)C |
| Total from investment operations | (.17) |
| Distributions from net investment income | (.15) |
| Distributions from net realized gain | (.16) |
| Total distributions | (.31) |
| Net asset value, end of period | $9.52 |
| Total ReturnD | (1.27)% |
| Ratios to Average Net AssetsE,F | |
| Expenses before reductions | .54%G |
| Expenses net of fee waivers, if any | .54%G |
| Expenses net of all reductions | .54%G |
| Net investment income (loss) | .95%G |
| Supplemental Data | |
| Net assets, end of period (000 omitted) | $99 |
| Portfolio turnover rateF | 14%G |
A For the period August 31, 2018 (commencement of operations) to March 31, 2019.
B Calculated based on average shares outstanding during the period.
C The amount shown for a share outstanding does not correspond with the aggregate net gain (loss) on investments for the period due to the timing of sales and repurchases of shares in relation to fluctuating market values of the investments of the Fund.
D Total returns for periods of less than one year are not annualized.
E Expense ratios reflect operating expenses of the class. Expenses before reductions do not reflect amounts reimbursed by the investment adviser or reductions from expense offset arrangements and do not represent the amount paid by the class during periods when reimbursements or reductions occur. Expense ratios before reductions for start-up periods may not be representative of longer-term operating periods. Expenses net of fee waivers reflect expenses after reimbursement by the investment adviser but prior to reductions from expense offset arrangements. Expenses net of all reductions represent the net expenses paid by the class but do not include expenses of the underlying funds in which the Fund invests.
F Amounts do not include the activity of the Underlying Funds.
G Annualized
See accompanying notes which are an integral part of the financial statements.
Fidelity Freedom Blend 2055 Fund Class Z
| Year ended March 31, | 2019 A |
| Selected Per–Share Data | |
| Net asset value, beginning of period | $10.00 |
| Income from Investment Operations | |
| Net investment income (loss)B | .06 |
| Net realized and unrealized gain (loss) | (.22)C |
| Total from investment operations | (.16) |
| Distributions from net investment income | (.15) |
| Distributions from net realized gain | (.16) |
| Total distributions | (.32)D |
| Net asset value, end of period | $9.52 |
| Total ReturnE | (1.23)% |
| Ratios to Average Net AssetsF,G | |
| Expenses before reductions | .44%H |
| Expenses net of fee waivers, if any | .44%H |
| Expenses net of all reductions | .44%H |
| Net investment income (loss) | 1.05%H |
| Supplemental Data | |
| Net assets, end of period (000 omitted) | $99 |
| Portfolio turnover rateG | 14%H |
A For the period August 31, 2018 (commencement of operations) to March 31, 2019.
B Calculated based on average shares outstanding during the period.
C The amount shown for a share outstanding does not correspond with the aggregate net gain (loss) on investments for the period due to the timing of sales and repurchases of shares in relation to fluctuating market values of the investments of the Fund.
D Total distributions of $.32 per share is comprised of distributions from net investment income of $.153 and distributions from net realized gain of $.164 per share.
E Total returns for periods of less than one year are not annualized.
F Expense ratios reflect operating expenses of the class. Expenses before reductions do not reflect amounts reimbursed by the investment adviser or reductions from expense offset arrangements and do not represent the amount paid by the class during periods when reimbursements or reductions occur. Expense ratios before reductions for start-up periods may not be representative of longer-term operating periods. Expenses net of fee waivers reflect expenses after reimbursement by the investment adviser but prior to reductions from expense offset arrangements. Expenses net of all reductions represent the net expenses paid by the class but do not include expenses of the underlying funds in which the Fund invests.
G Amounts do not include the activity of the Underlying Funds.
H Annualized
See accompanying notes which are an integral part of the financial statements.
Fidelity Freedom Blend 2055 Fund Class Z6
| Year ended March 31, | 2019 A |
| Selected Per–Share Data | |
| Net asset value, beginning of period | $10.00 |
| Income from Investment Operations | |
| Net investment income (loss)B | .06 |
| Net realized and unrealized gain (loss) | (.22)C |
| Total from investment operations | (.16) |
| Distributions from net investment income | (.16) |
| Distributions from net realized gain | (.16) |
| Total distributions | (.32) |
| Net asset value, end of period | $9.52 |
| Total ReturnD | (1.19)% |
| Ratios to Average Net AssetsE,F | |
| Expenses before reductions | .34%G |
| Expenses net of fee waivers, if any | .34%G |
| Expenses net of all reductions | .34%G |
| Net investment income (loss) | 1.15%G |
| Supplemental Data | |
| Net assets, end of period (000 omitted) | $99 |
| Portfolio turnover rateF | 14%G |
A For the period August 31, 2018 (commencement of operations) to March 31, 2019.
B Calculated based on average shares outstanding during the period.
C The amount shown for a share outstanding does not correspond with the aggregate net gain (loss) on investments for the period due to the timing of sales and repurchases of shares in relation to fluctuating market values of the investments of the Fund.
D Total returns for periods of less than one year are not annualized.
E Expense ratios reflect operating expenses of the class. Expenses before reductions do not reflect amounts reimbursed by the investment adviser or reductions from expense offset arrangements and do not represent the amount paid by the class during periods when reimbursements or reductions occur. Expenses net of fee waivers reflect expenses after reimbursement by the investment adviser but prior to reductions from expense offset arrangements. Expenses net of all reductions represent the net expenses paid by the class but do not include expenses of the underlying funds in which the Fund invests.
F Amounts do not include the activity of the Underlying Funds.
G Annualized
See accompanying notes which are an integral part of the financial statements.
Fidelity Freedom® Blend 2060 Fund
Investment Summary (Unaudited)
The information in the following tables is based on the direct investments of the Fund.
Top Holdings as of March 31, 2019
| | % of fund's net assets |
| Fidelity Series Large Cap Value Index Fund | 17.5 |
| Fidelity Series Blue Chip Growth Fund | 12.0 |
| Fidelity Series Large Cap Growth Index Fund | 9.4 |
| Fidelity Series Large Cap Stock Fund | 9.3 |
| Fidelity Series Emerging Markets Opportunities Fund | 8.8 |
| Fidelity Series International Growth Fund | 8.0 |
| Fidelity Series International Value Fund | 7.9 |
| Fidelity Series Value Discovery Fund | 5.5 |
| Fidelity Series Small Cap Opportunities Fund | 4.7 |
| Fidelity Series Long-Term Treasury Bond Index Fund | 3.5 |
| | 86.6 |
Asset Allocation (% of fund's net assets)
| Period end |
| | Domestic Equity Funds | 60.9% |
| | International Equity Funds | 30.9% |
| | Bond Funds | 7.1% |
| | Short-Term Funds | 1.1% |

Domestic Equity Funds category includes Fidelity Series Commodity Strategy Fund which invests in commodity-related investments.
Fidelity Freedom® Blend 2060 Fund
Schedule of Investments March 31, 2019
Showing Percentage of Net Assets
| Domestic Equity Funds - 60.9% | | | |
| | | Shares | Value |
| Fidelity Series Blue Chip Growth Fund (a) | | 21,200 | $312,706 |
| Fidelity Series Commodity Strategy Fund (a) | | 13,547 | 64,618 |
| Fidelity Series Large Cap Growth Index Fund (a) | | 24,286 | 244,799 |
| Fidelity Series Large Cap Stock Fund (a) | | 16,644 | 243,833 |
| Fidelity Series Large Cap Value Index Fund (a) | | 36,793 | 456,600 |
| Fidelity Series Small Cap Opportunities Fund (a) | | 9,049 | 121,805 |
| Fidelity Series Value Discovery Fund (a) | | 11,567 | 144,469 |
| TOTAL DOMESTIC EQUITY FUNDS | | | |
| (Cost $1,555,251) | | | 1,588,830 |
|
| International Equity Funds - 30.9% | | | |
| Fidelity Series Canada Fund (a) | | 2,417 | 24,916 |
| Fidelity Series Emerging Markets Fund (a) | | 2,598 | 25,432 |
| Fidelity Series Emerging Markets Opportunities Fund (a) | | 12,434 | 230,401 |
| Fidelity Series International Growth Fund (a) | | 13,772 | 209,203 |
| Fidelity Series International Index Fund (a) | | 5,590 | 54,893 |
| Fidelity Series International Small Cap Fund (a) | | 3,522 | 54,693 |
| Fidelity Series International Value Fund (a) | | 22,186 | 206,332 |
| TOTAL INTERNATIONAL EQUITY FUNDS | | | |
| (Cost $791,076) | | | 805,870 |
|
| Bond Funds - 7.1% | | | |
| Fidelity Series Corporate Bond Fund (a) | | 473 | 4,796 |
| Fidelity Series Emerging Markets Debt Fund (a) | | 1,809 | 17,348 |
| Fidelity Series Floating Rate High Income Fund (a) | | 420 | 3,892 |
| Fidelity Series Government Bond Index Fund (a) | | 650 | 6,645 |
| Fidelity Series High Income Fund (a) | | 3,162 | 29,725 |
| Fidelity Series Inflation-Protected Bond Index Fund (a) | | 801 | 7,831 |
| Fidelity Series Investment Grade Bond Fund (a) | | 629 | 7,032 |
| Fidelity Series Investment Grade Securitized Fund (a) | | 486 | 4,947 |
| Fidelity Series Long-Term Treasury Bond Index Fund (a) | | 10,402 | 92,266 |
| Fidelity Series Real Estate Income Fund (a) | | 1,131 | 12,341 |
| TOTAL BOND FUNDS | | | |
| (Cost $181,282) | | | 186,823 |
|
| Short-Term Funds - 1.1% | | | |
| Fidelity Cash Central Fund, 2.48% (b) | | 49 | 49 |
| Fidelity Series Government Money Market Fund 2.5% (a)(c) | | 6,419 | 6,419 |
| Fidelity Series Short-Term Credit Fund (a) | | 644 | 6,420 |
| Fidelity Series Treasury Bill Index Fund (a) | | 1,659 | 16,578 |
| TOTAL SHORT-TERM FUNDS | | | |
| (Cost $29,418) | | | 29,466 |
| TOTAL INVESTMENT IN SECURITIES - 100.0% | | | |
| (Cost $2,557,027) | | | 2,610,989 |
| NET OTHER ASSETS (LIABILITIES) - 0.0% | | | (882) |
| NET ASSETS - 100% | | | $2,610,107 |
Legend
(a) Affiliated Fund
(b) Affiliated fund that is generally available only to investment companies and other accounts managed by Fidelity Investments. The rate quoted is the annualized seven-day yield of the fund at period end. A complete unaudited listing of the fund's holdings as of its most recent quarter end is available upon request. In addition, each Fidelity Central Fund's financial statements, which are not covered by the Fund's Report of Independent Registered Public Accounting Firm, are available on the SEC's website or upon request.
(c) The rate quoted is the annualized seven-day yield of the fund at period end.
Affiliated Central Funds
Information regarding fiscal year to date income earned by the Fund from investments in Fidelity Central Funds is as follows:
| Fund | Income earned |
| Fidelity Cash Central Fund | $195 |
| Total | $195 |
Amounts in the income column in the above table include any capital gain distributions from underlying funds, which are presented in the corresponding line-item in the Statement of Operations, if applicable.
Affiliated Underlying Funds
Fiscal year to date information regarding the Fund's investments in affiliated Underlying Funds, excluding any Money Market Central Funds, is presented below. Exchanges between classes of the same affiliated Underlying Funds may occur.
| Affiliate | Value, beginning of period | Purchases | Sales Proceeds | Dividend Income | Realized Gain (loss) | Change in Unrealized appreciation (depreciation) | Value, end of period |
| Fidelity Series Blue Chip Growth Fund | $-- | $319,604 | $11,493 | $14,041 | $(1,806) | $6,401 | $312,706 |
| Fidelity Series Canada Fund | -- | 25,247 | 1,083 | 208 | (68) | 820 | 24,916 |
| Fidelity Series Commodity Strategy Fund | -- | 67,529 | 2,035 | 1,253 | (82) | (794) | 64,618 |
| Fidelity Series Corporate Bond Fund | -- | 5,496 | 846 | 55 | (2) | 148 | 4,796 |
| Fidelity Series Emerging Markets Debt Fund | -- | 17,561 | 582 | 315 | 1 | 368 | 17,348 |
| Fidelity Series Emerging Markets Fund | -- | 25,029 | 337 | 39 | (3) | 743 | 25,432 |
| Fidelity Series Emerging Markets Opportunities Fund | -- | 228,553 | 6,477 | 7,112 | (326) | 8,651 | 230,401 |
| Fidelity Series Floating Rate High Income Fund | -- | 5,000 | 1,088 | 112 | (18) | (2) | 3,892 |
| Fidelity Series Government Bond Index Fund | -- | 7,535 | 997 | 49 | (3) | 110 | 6,645 |
| Fidelity Series Government Money Market Fund 2.5% | -- | 7,072 | 653 | 51 | -- | -- | 6,419 |
| Fidelity Series High Income Fund | -- | 33,501 | 4,191 | 727 | (75) | 490 | 29,725 |
| Fidelity Series Inflation-Protected Bond Index Fund | -- | 8,048 | 299 | 54 | (3) | 85 | 7,831 |
| Fidelity Series International Growth Fund | -- | 210,351 | 6,045 | 5,260 | (475) | 5,372 | 209,203 |
| Fidelity Series International Index Fund | -- | 54,364 | 762 | 121 | (33) | 1,324 | 54,893 |
| Fidelity Series International Small Cap Fund | -- | 56,549 | 1,145 | 1,975 | (158) | (553) | 54,693 |
| Fidelity Series International Value Fund | -- | 211,273 | 3,069 | 2,898 | (309) | (1,563) | 206,332 |
| Fidelity Series Investment Grade Bond Fund | -- | 8,039 | 1,167 | 68 | (3) | 163 | 7,032 |
| Fidelity Series Investment Grade Securitized Fund | -- | 5,760 | 888 | 46 | (3) | 78 | 4,947 |
| Fidelity Series Large Cap Growth Index Fund | -- | 239,369 | 7,233 | 477 | (298) | 12,961 | 244,799 |
| Fidelity Series Large Cap Stock Fund | -- | 246,830 | 7,706 | 3,744 | (418) | 5,127 | 243,833 |
| Fidelity Series Large Cap Value Index Fund | -- | 462,478 | 14,471 | 9,515 | (439) | 9,032 | 456,600 |
| Fidelity Series Long-Term Treasury Bond Index Fund | -- | 94,475 | 6,004 | 860 | (71) | 3,866 | 92,266 |
| Fidelity Series Real Estate Income Fund | -- | 12,445 | 328 | 294 | (11) | 235 | 12,341 |
| Fidelity Series Short-Term Credit Fund | -- | 7,043 | 679 | 60 | (1) | 57 | 6,420 |
| Fidelity Series Small Cap Opportunities Fund | -- | 127,731 | 5,312 | 4,828 | (1,207) | 593 | 121,805 |
| Fidelity Series Treasury Bill Index Fund | -- | 21,441 | 4,850 | 172 | (4) | (9) | 16,578 |
| Fidelity Series Value Discovery Fund | -- | 148,513 | 4,167 | 3,329 | (136) | 259 | 144,469 |
| | $-- | $2,656,836 | $93,907 | $57,663 | $(5,951) | $53,962 | $2,610,940 |
Amounts in the income column in the above table include any capital gain distributions from underlying funds, which are presented in the corresponding line-item in the Statement of Operations, if applicable.
Investment Valuation
All investments are categorized as Level 1 under the Fair Value Hierarchy. The inputs or methodology used for valuing securities may not be an indication of the risk associated with investing in those securities. For more information on valuation inputs please refer to the Investment Valuation section in the accompanying Notes to Financial Statements.
See accompanying notes which are an integral part of the financial statements.
Fidelity Freedom® Blend 2060 Fund
Financial Statements
Statement of Assets and Liabilities
| | | March 31, 2019 |
| Assets | | |
Investment in securities, at value — See accompanying schedule:
| | |
| Fidelity Central Funds (cost $49) | $49 | |
| Other affiliated issuers (cost $2,556,978) | 2,610,940 | |
| Total Investment in Securities (cost $2,557,027) | | $2,610,989 |
| Cash | | 147 |
| Receivable for investments sold | | 11,317 |
| Receivable for fund shares sold | | 7,292 |
| Total assets | | 2,629,745 |
| Liabilities | | |
| Payable for investments purchased | $18,609 | |
| Accrued management fee | 835 | |
| Distribution and service plan fees payable | 194 | |
| Total liabilities | | 19,638 |
| Net Assets | | $2,610,107 |
| Net Assets consist of: | | |
| Paid in capital | | $2,539,636 |
| Total distributable earnings (loss) | | 70,471 |
| Net Assets | | $2,610,107 |
| Net Asset Value and Maximum Offering Price | | |
| Class A: | | |
| Net Asset Value and redemption price per share ($242,936 ÷ 25,482 shares) | | $9.53 |
| Maximum offering price per share (100/94.25 of $9.53) | | $10.11 |
| Class M: | | |
| Net Asset Value and redemption price per share ($143,234 ÷ 15,031 shares) | | $9.53 |
| Maximum offering price per share (100/96.50 of $9.53) | | $9.88 |
| Class C: | | |
| Net Asset Value and offering price per share ($107,077 ÷ 11,250 shares)(a) | | $9.52 |
| Fidelity Freedom Blend 2060 Fund: | | |
| Net Asset Value, offering price and redemption price per share ($452,949 ÷ 47,503 shares) | | $9.54 |
| Class K: | | |
| Net Asset Value, offering price and redemption price per share ($98,743 ÷ 10,348 shares) | | $9.54 |
| Class K6: | | |
| Net Asset Value, offering price and redemption price per share ($1,260,982 ÷ 132,120 shares) | | $9.54 |
| Class I: | | |
| Net Asset Value, offering price and redemption price per share ($102,373 ÷ 10,731 shares) | | $9.54 |
| Class Z: | | |
| Net Asset Value, offering price and redemption price per share ($98,852 ÷ 10,359 shares) | | $9.54 |
| Class Z6: | | |
| Net Asset Value, offering price and redemption price per share ($102,961 ÷ 10,788 shares) | | $9.54 |
(a) Redemption price per share is equal to net asset value less any applicable contingent deferred sales charge.
See accompanying notes which are an integral part of the financial statements.
Statement of Operations
| | | For the period
August 31, 2018 (commencement of operations) to
March 31, 2019 |
| Investment Income | | |
| Dividends: | | |
| Affiliated issuers | | $18,875 |
| Income from Fidelity Central Funds | | 195 |
| Total income | | 19,070 |
| Expenses | | |
| Management fee | $3,764 | |
| Distribution and service plan fees | 1,069 | |
| Independent trustees' fees and expenses | 3 | |
| Total expenses | | 4,836 |
| Net investment income (loss) | | 14,234 |
| Realized and Unrealized Gain (Loss) | | |
| Net realized gain (loss) on: | | |
| Investment securities: | | |
| Affiliated issuers | (5,951) | |
| Capital gain distributions from underlying funds: | | |
| Affiliated issuers | 38,788 | |
| Total net realized gain (loss) | | 32,837 |
| Change in net unrealized appreciation (depreciation) on: | | |
| Investment securities: | | |
| Affiliated issuers | 53,962 | |
| Total change in net unrealized appreciation (depreciation) | | 53,962 |
| Net gain (loss) | | 86,799 |
| Net increase (decrease) in net assets resulting from operations | | $101,033 |
See accompanying notes which are an integral part of the financial statements.
Statement of Changes in Net Assets
| | For the period
August 31, 2018 (commencement of operations) to
March 31, 2019 |
| Increase (Decrease) in Net Assets | |
| Operations | |
| Net investment income (loss) | $14,234 |
| Net realized gain (loss) | 32,837 |
| Change in net unrealized appreciation (depreciation) | 53,962 |
| Net increase (decrease) in net assets resulting from operations | 101,033 |
| Distributions to shareholders | (30,562) |
| Total distributions | (30,562) |
| Share transactions - net increase (decrease) | 2,539,636 |
| Total increase (decrease) in net assets | 2,610,107 |
| Net Assets | |
| Beginning of period | – |
| End of period | $2,610,107 |
See accompanying notes which are an integral part of the financial statements.
Financial Highlights
Fidelity Freedom Blend 2060 Fund Class A
| Year ended March 31, | 2019 A |
| Selected Per–Share Data | |
| Net asset value, beginning of period | $10.00 |
| Income from Investment Operations | |
| Net investment income (loss)B | .08 |
| Net realized and unrealized gain (loss) | (.27)C |
| Total from investment operations | (.19) |
| Distributions from net investment income | (.14) |
| Distributions from net realized gain | (.15) |
| Total distributions | (.28)D |
| Net asset value, end of period | $9.53 |
| Total ReturnE,F | (1.50)% |
| Ratios to Average Net AssetsG,H | |
| Expenses before reductions | .80%I,J |
| Expenses net of fee waivers, if any | .80%I,J |
| Expenses net of all reductions | .80%I,J |
| Net investment income (loss) | 1.50%I |
| Supplemental Data | |
| Net assets, end of period (000 omitted) | $243 |
| Portfolio turnover rateH | 11%I |
A For the period August 31, 2018 (commencement of operations) to March 31, 2019.
B Calculated based on average shares outstanding during the period.
C The amount shown for a share outstanding does not correspond with the aggregate net gain (loss) on investments for the period due to the timing of sales and repurchases of shares in relation to fluctuating market values of the investments of the Fund.
D Total distributions of $.28 per share is comprised of distributions from net investment income of $.139 and distributions from net realized gain of $.145 per share.
E Total returns for periods of less than one year are not annualized.
F Total returns do not include the effect of the sales charges.
G Expense ratios reflect operating expenses of the class. Expenses before reductions do not reflect amounts reimbursed by the investment adviser or reductions from expense offset arrangements and do not represent the amount paid by the class during periods when reimbursements or reductions occur. Expense ratios before reductions for start-up periods may not be representative of longer-term operating periods. Expenses net of fee waivers reflect expenses after reimbursement by the investment adviser but prior to reductions from expense offset arrangements. Expenses net of all reductions represent the net expenses paid by the class but do not include expenses of the underlying funds in which the Fund invests.
H Amounts do not include the activity of the Underlying Funds.
I Annualized
J On certain classes, the size and fluctuation of net assets and expense amounts may cause ratios to differ from contractual rates.
See accompanying notes which are an integral part of the financial statements.
Fidelity Freedom Blend 2060 Fund Class M
| Year ended March 31, | 2019 A |
| Selected Per–Share Data | |
| Net asset value, beginning of period | $10.00 |
| Income from Investment Operations | |
| Net investment income (loss)B | .07 |
| Net realized and unrealized gain (loss) | (.26)C |
| Total from investment operations | (.19) |
| Distributions from net investment income | (.13) |
| Distributions from net realized gain | (.15) |
| Total distributions | (.28) |
| Net asset value, end of period | $9.53 |
| Total ReturnD,E | (1.59)% |
| Ratios to Average Net AssetsF,G | |
| Expenses before reductions | 1.04%H |
| Expenses net of fee waivers, if any | 1.04%H |
| Expenses net of all reductions | 1.04%H |
| Net investment income (loss) | 1.25%H |
| Supplemental Data | |
| Net assets, end of period (000 omitted) | $143 |
| Portfolio turnover rateG | 11%H |
A For the period August 31, 2018 (commencement of operations) to March 31, 2019.
B Calculated based on average shares outstanding during the period.
C The amount shown for a share outstanding does not correspond with the aggregate net gain (loss) on investments for the period due to the timing of sales and repurchases of shares in relation to fluctuating market values of the investments of the Fund.
D Total returns for periods of less than one year are not annualized.
E Total returns do not include the effect of the sales charges.
F Expense ratios reflect operating expenses of the class. Expenses before reductions do not reflect amounts reimbursed by the investment adviser or reductions from expense offset arrangements and do not represent the amount paid by the class during periods when reimbursements or reductions occur. Expense ratios before reductions for start-up periods may not be representative of longer-term operating periods. Expenses net of fee waivers reflect expenses after reimbursement by the investment adviser but prior to reductions from expense offset arrangements. Expenses net of all reductions represent the net expenses paid by the class but do not include expenses of the underlying funds in which the Fund invests.
G Amounts do not include the activity of the Underlying Funds.
H Annualized
See accompanying notes which are an integral part of the financial statements.
Fidelity Freedom Blend 2060 Fund Class C
| Year ended March 31, | 2019 A |
| Selected Per–Share Data | |
| Net asset value, beginning of period | $10.00 |
| Income from Investment Operations | |
| Net investment income (loss)B | .04 |
| Net realized and unrealized gain (loss) | (.26)C |
| Total from investment operations | (.22) |
| Distributions from net investment income | (.12) |
| Distributions from net realized gain | (.15) |
| Total distributions | (.26)D |
| Net asset value, end of period | $9.52 |
| Total ReturnE,F | (1.87)% |
| Ratios to Average Net AssetsG,H | |
| Expenses before reductions | 1.54%I |
| Expenses net of fee waivers, if any | 1.54%I |
| Expenses net of all reductions | 1.54%I |
| Net investment income (loss) | .76%I |
| Supplemental Data | |
| Net assets, end of period (000 omitted) | $107 |
| Portfolio turnover rateH | 11%I |
A For the period August 31, 2018 (commencement of operations) to March 31, 2019.
B Calculated based on average shares outstanding during the period.
C The amount shown for a share outstanding does not correspond with the aggregate net gain (loss) on investments for the period due to the timing of sales and repurchases of shares in relation to fluctuating market values of the investments of the Fund.
D Total distributions of $.26 per share is comprised of distributions from net investment income of $.116 and distributions from net realized gain of $.145 per share.
E Total returns for periods of less than one year are not annualized.
F Total returns do not include the effect of the contingent deferred sales charge.
G Expense ratios reflect operating expenses of the class. Expenses before reductions do not reflect amounts reimbursed by the investment adviser or reductions from expense offset arrangements and do not represent the amount paid by the class during periods when reimbursements or reductions occur. Expense ratios before reductions for start-up periods may not be representative of longer-term operating periods. Expenses net of fee waivers reflect expenses after reimbursement by the investment adviser but prior to reductions from expense offset arrangements. Expenses net of all reductions represent the net expenses paid by the class but do not include expenses of the underlying funds in which the Fund invests.
H Amounts do not include the activity of the Underlying Funds.
I Annualized
See accompanying notes which are an integral part of the financial statements.
Fidelity Freedom Blend 2060 Fund
| Year ended March 31, | 2019 A |
| Selected Per–Share Data | |
| Net asset value, beginning of period | $10.00 |
| Income from Investment Operations | |
| Net investment income (loss)B | .09 |
| Net realized and unrealized gain (loss) | (.25)C |
| Total from investment operations | (.16) |
| Distributions from net investment income | (.15) |
| Distributions from net realized gain | (.15) |
| Total distributions | (.30) |
| Net asset value, end of period | $9.54 |
| Total ReturnD | (1.27)% |
| Ratios to Average Net AssetsE,F | |
| Expenses before reductions | .54%G |
| Expenses net of fee waivers, if any | .54%G |
| Expenses net of all reductions | .54%G |
| Net investment income (loss) | 1.75%G |
| Supplemental Data | |
| Net assets, end of period (000 omitted) | $453 |
| Portfolio turnover rateF | 11%G |
A For the period August 31, 2018 (commencement of operations) to March 31, 2019.
B Calculated based on average shares outstanding during the period.
C The amount shown for a share outstanding does not correspond with the aggregate net gain (loss) on investments for the period due to the timing of sales and repurchases of shares in relation to fluctuating market values of the investments of the Fund.
D Total returns for periods of less than one year are not annualized.
E Expense ratios reflect operating expenses of the class. Expenses before reductions do not reflect amounts reimbursed by the investment adviser or reductions from expense offset arrangements and do not represent the amount paid by the class during periods when reimbursements or reductions occur. Expense ratios before reductions for start-up periods may not be representative of longer-term operating periods. Expenses net of fee waivers reflect expenses after reimbursement by the investment adviser but prior to reductions from expense offset arrangements. Expenses net of all reductions represent the net expenses paid by the class but do not include expenses of the underlying funds in which the Fund invests.
F Amounts do not include the activity of the Underlying Funds.
G Annualized
See accompanying notes which are an integral part of the financial statements.
Fidelity Freedom Blend 2060 Fund Class K
| Year ended March 31, | 2019 A |
| Selected Per–Share Data | |
| Net asset value, beginning of period | $10.00 |
| Income from Investment Operations | |
| Net investment income (loss)B | .10 |
| Net realized and unrealized gain (loss) | (.26)C |
| Total from investment operations | (.16) |
| Distributions from net investment income | (.15) |
| Distributions from net realized gain | (.15) |
| Total distributions | (.30) |
| Net asset value, end of period | $9.54 |
| Total ReturnD | (1.28)% |
| Ratios to Average Net AssetsE,F | |
| Expenses before reductions | .44%G |
| Expenses net of fee waivers, if any | .44%G |
| Expenses net of all reductions | .44%G |
| Net investment income (loss) | 1.85%G |
| Supplemental Data | |
| Net assets, end of period (000 omitted) | $99 |
| Portfolio turnover rateE | 11%G |
A For the period August 31, 2018 (commencement of operations) to March 31, 2019.
B Calculated based on average shares outstanding during the period.
C The amount shown for a share outstanding does not correspond with the aggregate net gain (loss) on investments for the period due to the timing of sales and repurchases of shares in relation to fluctuating market values of the investments of the Fund.
D Total returns for periods of less than one year are not annualized.
E Amounts do not include the activity of the Underlying Funds.
F Expense ratios reflect operating expenses of the class. Expenses before reductions do not reflect amounts reimbursed by the investment adviser or reductions from expense offset arrangements and do not represent the amount paid by the class during periods when reimbursements or reductions occur. Expense ratios before reductions for start-up periods may not be representative of longer-term operating periods. Expenses net of fee waivers reflect expenses after reimbursement by the investment adviser but prior to reductions from expense offset arrangements. Expenses net of all reductions represent the net expenses paid by the class but do not include expenses of the underlying funds in which the Fund invests.
G Annualized
See accompanying notes which are an integral part of the financial statements.
Fidelity Freedom Blend 2060 Fund Class K6
| Year ended March 31, | 2019 A |
| Selected Per–Share Data | |
| Net asset value, beginning of period | $10.00 |
| Income from Investment Operations | |
| Net investment income (loss)B | .10 |
| Net realized and unrealized gain (loss) | (.26)C |
| Total from investment operations | (.16) |
| Distributions from net investment income | (.15) |
| Distributions from net realized gain | (.15) |
| Total distributions | (.30) |
| Net asset value, end of period | $9.54 |
| Total ReturnD | (1.24)% |
| Ratios to Average Net AssetsE,F | |
| Expenses before reductions | .34%G |
| Expenses net of fee waivers, if any | .34%G |
| Expenses net of all reductions | .34%G |
| Net investment income (loss) | 1.95%G |
| Supplemental Data | |
| Net assets, end of period (000 omitted) | $1,261 |
| Portfolio turnover rateF | 11%G |
A For the period August 31, 2018 (commencement of operations) to March 31, 2019.
B Calculated based on average shares outstanding during the period.
C The amount shown for a share outstanding does not correspond with the aggregate net gain (loss) on investments for the period due to the timing of sales and repurchases of shares in relation to fluctuating market values of the investments of the Fund.
D Total returns for periods of less than one year are not annualized.
E Expense ratios reflect operating expenses of the class. Expenses before reductions do not reflect amounts reimbursed by the investment adviser or reductions from expense offset arrangements and do not represent the amount paid by the class during periods when reimbursements or reductions occur. Expenses net of fee waivers reflect expenses after reimbursement by the investment adviser but prior to reductions from expense offset arrangements. Expenses net of all reductions represent the net expenses paid by the class but do not include expenses of the underlying funds in which the Fund invests.
F Amounts do not include the activity of the Underlying Funds.
G Annualized
See accompanying notes which are an integral part of the financial statements.
Fidelity Freedom Blend 2060 Fund Class I
| Year ended March 31, | 2019 A |
| Selected Per–Share Data | |
| Net asset value, beginning of period | $10.00 |
| Income from Investment Operations | |
| Net investment income (loss)B | .10 |
| Net realized and unrealized gain (loss) | (.27)C |
| Total from investment operations | (.17) |
| Distributions from net investment income | (.15) |
| Distributions from net realized gain | (.15) |
| Total distributions | (.29)D |
| Net asset value, end of period | $9.54 |
| Total ReturnE | (1.31)% |
| Ratios to Average Net AssetsF,G | |
| Expenses before reductions | .54%H |
| Expenses net of fee waivers, if any | .54%H |
| Expenses net of all reductions | .54%H |
| Net investment income (loss) | 1.75%H |
| Supplemental Data | |
| Net assets, end of period (000 omitted) | $102 |
| Portfolio turnover rateG | 11%H |
A For the period August 31, 2018 (commencement of operations) to March 31, 2019.
B Calculated based on average shares outstanding during the period.
C The amount shown for a share outstanding does not correspond with the aggregate net gain (loss) on investments for the period due to the timing of sales and repurchases of shares in relation to fluctuating market values of the investments of the Fund.
D Total distributions of $.29 per share is comprised of distributions from net investment income of $.147 and distributions from net realized gain of $.145 per share.
E Total returns for periods of less than one year are not annualized.
F Expense ratios reflect operating expenses of the class. Expenses before reductions do not reflect amounts reimbursed by the investment adviser or reductions from expense offset arrangements and do not represent the amount paid by the class during periods when reimbursements or reductions occur. Expense ratios before reductions for start-up periods may not be representative of longer-term operating periods. Expenses net of fee waivers reflect expenses after reimbursement by the investment adviser but prior to reductions from expense offset arrangements. Expenses net of all reductions represent the net expenses paid by the class but do not include expenses of the underlying funds in which the Fund invests.
G Amounts do not include the activity of the Underlying Funds.
H Annualized
See accompanying notes which are an integral part of the financial statements.
Fidelity Freedom Blend 2060 Fund Class Z
| Year ended March 31, | 2019 A |
| Selected Per–Share Data | |
| Net asset value, beginning of period | $10.00 |
| Income from Investment Operations | |
| Net investment income (loss)B | .10 |
| Net realized and unrealized gain (loss) | (.26)C |
| Total from investment operations | (.16) |
| Distributions from net investment income | (.15) |
| Distributions from net realized gain | (.15) |
| Total distributions | (.30) |
| Net asset value, end of period | $9.54 |
| Total ReturnD | (1.28)% |
| Ratios to Average Net AssetsE,F | |
| Expenses before reductions | .44%G |
| Expenses net of fee waivers, if any | .44%G |
| Expenses net of all reductions | .44%G |
| Net investment income (loss) | 1.86%G |
| Supplemental Data | |
| Net assets, end of period (000 omitted) | $99 |
| Portfolio turnover rateF | 11%G |
A For the period August 31, 2018 (commencement of operations) to March 31, 2019.
B Calculated based on average shares outstanding during the period.
C The amount shown for a share outstanding does not correspond with the aggregate net gain (loss) on investments for the period due to the timing of sales and repurchases of shares in relation to fluctuating market values of the investments of the Fund.
D Total returns for periods of less than one year are not annualized.
E Expense ratios reflect operating expenses of the class. Expenses before reductions do not reflect amounts reimbursed by the investment adviser or reductions from expense offset arrangements and do not represent the amount paid by the class during periods when reimbursements or reductions occur. Expense ratios before reductions for start-up periods may not be representative of longer-term operating periods. Expenses net of fee waivers reflect expenses after reimbursement by the investment adviser but prior to reductions from expense offset arrangements. Expenses net of all reductions represent the net expenses paid by the class but do not include expenses of the underlying funds in which the Fund invests.
F Amounts do not include the activity of the Underlying Funds.
G Annualized
See accompanying notes which are an integral part of the financial statements.
Fidelity Freedom Blend 2060 Fund Class Z6
| Year ended March 31, | 2019 A |
| Selected Per–Share Data | |
| Net asset value, beginning of period | $10.00 |
| Income from Investment Operations | |
| Net investment income (loss)B | .11 |
| Net realized and unrealized gain (loss) | (.27)C |
| Total from investment operations | (.16) |
| Distributions from net investment income | (.15) |
| Distributions from net realized gain | (.15) |
| Total distributions | (.30) |
| Net asset value, end of period | $9.54 |
| Total ReturnD | (1.24)% |
| Ratios to Average Net AssetsE,F | |
| Expenses before reductions | .34%G |
| Expenses net of fee waivers, if any | .34%G |
| Expenses net of all reductions | .34%G |
| Net investment income (loss) | 1.96%G |
| Supplemental Data | |
| Net assets, end of period (000 omitted) | $103 |
| Portfolio turnover rateF | 11%G |
A For the period August 31, 2018 (commencement of operations) to March 31, 2019.
B Calculated based on average shares outstanding during the period.
C The amount shown for a share outstanding does not correspond with the aggregate net gain (loss) on investments for the period due to the timing of sales and repurchases of shares in relation to fluctuating market values of the investments of the Fund.
D Total returns for periods of less than one year are not annualized.
E Expense ratios reflect operating expenses of the class. Expenses before reductions do not reflect amounts reimbursed by the investment adviser or reductions from expense offset arrangements and do not represent the amount paid by the class during periods when reimbursements or reductions occur. Expenses net of fee waivers reflect expenses after reimbursement by the investment adviser but prior to reductions from expense offset arrangements. Expenses net of all reductions represent the net expenses paid by the class but do not include expenses of the underlying funds in which the Fund invests.
F Amounts do not include the activity of the Underlying Funds.
G Annualized
See accompanying notes which are an integral part of the financial statements.
Notes to Financial Statements
For the period ended March 31, 2019
1. Organization.
Fidelity Freedom Blend Income Fund, Fidelity Freedom Blend 2005 Fund, Fidelity Freedom Blend 2010 Fund, Fidelity Freedom Blend 2015 Fund, Fidelity Freedom Blend 2020 Fund, Fidelity Freedom Blend 2025 Fund, Fidelity Freedom Blend 2030 Fund, Fidelity Freedom Blend 2035 Fund, Fidelity Freedom Blend 2040 Fund, Fidelity Freedom Blend 2045 Fund, Fidelity Freedom Blend 2050 Fund, Fidelity Freedom Blend 2055 Fund and Fidelity Freedom Blend 2060 Fund (the Funds) are funds of Fidelity Aberdeen Street Trust (the Trust). The Trust is registered under the Investment Company Act of 1940, as amended (the 1940 Act), as an open-end management investment company organized as a Delaware statutory trust. Each Fund is authorized to issue an unlimited number of shares. Each Fund offers Class A, Class M, Class C, Fidelity Freedom Blend, Class K, Class K6, Class I, Class Z and Class Z6 shares, each of which has equal rights as to assets and voting privileges. Each class has exclusive voting rights with respect to matters that affect that class. Effective March 1, 2019, Class C shares will automatically convert to Class A shares after a holding period of ten years from the initial date of purchase, with certain exceptions. The Funds invest primarily in a combination of other Fidelity equity, bond, and short-term funds (the Underlying Funds) managed by Fidelity Management & Research Company (FMR). Certain Underlying Funds incurred name changes since their most recent shareholder report. The names of the Underlying Funds are those in effect at period end.
2. Investments in Fidelity Central Funds.
The Funds invest in Fidelity Central Funds, which are open-end investment companies generally available only to other investment companies and accounts managed by the investment adviser and its affiliates. The Funds' Schedules of Investments list each of the Fidelity Central Funds held as of period end, if any, as an investment of each Fund, but do not include the underlying holdings of each Fidelity Central Fund. As an Investing Fund, each Fund indirectly bears its proportionate share of the expenses of the underlying Fidelity Central Funds.
The Money Market Central Funds seek preservation of capital and current income and are managed by Fidelity Investments Money Management, Inc. (FIMM), an affiliate of the investment adviser. Annualized expenses of the Money Market Central Funds as of their most recent shareholder report date are less than .005%.
A complete unaudited list of holdings for each Fidelity Central Fund is available upon request or at the Securities and Exchange Commission (the SEC) website at www.sec.gov. In addition, the financial statements of the Fidelity Central Funds, which are not covered by the Funds' Report of Independent Registered Public Accounting Firm, are available on the SEC website or upon request.
3. Significant Accounting Policies.
Each Fund is an investment company and applies the accounting and reporting guidance of the Financial Accounting Standards Board (FASB) Accounting Standards Codification Topic 946 Financial Services – Investments Companies. The financial statements have been prepared in conformity with accounting principles generally accepted in the United States of America (GAAP), which require management to make certain estimates and assumptions at the date of the financial statements. Actual results could differ from those estimates. Subsequent events, if any, through the date that the financial statements were issued have been evaluated in the preparation of the financial statements. The following summarizes the significant accounting policies of the Funds:
Investment Valuation. Investments are valued as of 4:00 p.m. Eastern time on the last calendar day of the period. Each Fund categorizes the inputs to valuation techniques used to value its investments into a disclosure hierarchy consisting of three levels as shown below:
- Level 1 – quoted prices in active markets for identical investments
- Level 2 – other significant observable inputs (including quoted prices for similar investments, interest rates, prepayment speeds, etc.)
- Level 3 – unobservable inputs (including the Fund's own assumptions based on the best information available)
Valuation techniques used to value each Fund's investments by major category are as follows. Investments in the Underlying Funds are valued at their closing net asset value (NAV) each business day and are categorized as Level 1 in the hierarchy.
Investment Transactions and Income. For financial reporting purposes, the Funds' investment holdings and NAV include trades executed through the end of the last business day of the period. The NAV per share for processing shareholder transactions is calculated as of the close of business of the New York Stock Exchange (NYSE), normally 4:00 p.m. Eastern time and includes trades executed through the end of the prior business day. Gains and losses on securities sold are determined on the basis of identified cost. Income and capital gain distributions from the Underlying Funds, if any, are recorded on the ex-dividend date.
Class Allocations and Expenses. Investment income, realized and unrealized capital gains and losses, common expenses of each Fund, and certain fund-level expense reductions, if any, are allocated daily on a pro-rata basis to each class based on the relative net assets of each class to the total net assets of each Fund. Each class differs with respect to distribution and service plan fees incurred. Certain expense reductions may also differ by class. For the reporting period, the allocated portion of income and expenses to each class as a percent of its average net assets may vary due to the timing of recording these transactions in relation to fluctuating net assets of the classes. Expenses directly attributable to a fund are charged to that fund. Expenses attributable to more than one fund are allocated among the respective funds on the basis of relative net assets or other appropriate methods. Expenses included in the accompanying financial statements reflect the expenses of each Fund and do not include any expenses associated with the Underlying Funds. Although not included in each Fund's expenses, each Fund indirectly bears its proportionate share of the Underlying Funds' expenses through the impact of these expenses on each Underlying Fund's NAV. Expense estimates are accrued in the period to which they relate and adjustments are made when actual amounts are known.
Income Tax Information and Distributions to Shareholders. Each year, each Fund intends to qualify as a regulated investment company under Subchapter M of the Internal Revenue Code, including distributing substantially all of its taxable income and realized gains. As a result, no provision for U.S. Federal income taxes is required. As of March 31, 2019, each Fund did not have any unrecognized tax benefits in the financial statements; nor is each Fund aware of any tax positions for which it is reasonably possible that the total amounts of unrecognized tax benefits will significantly change in the next twelve months. Each Fund files a U.S. federal tax return, in addition to state and local tax returns as required. Each Fund's federal income tax returns are subject to examination by the Internal Revenue Service (IRS) for a period of three fiscal years after they are filed. State and local tax returns may be subject to examination for an additional fiscal year depending on the jurisdiction.
Distributions are declared and recorded on the ex-dividend date. Income and capital gain distributions are declared separately for each class. Income and capital gain distributions are determined in accordance with income tax regulations, which may differ from GAAP.
Capital accounts within the financial statements are adjusted for permanent book-tax differences. These adjustments have no impact on net assets or the results of operations. Capital accounts are not adjusted for temporary book-tax differences which will reverse in a subsequent period.
Book-tax differences are primarily due to the short-term gain distributions from the Underlying Funds and losses deferred due to wash sales and excise tax regulations.
As of period end, the cost and unrealized appreciation (depreciation) in securities, and derivatives if applicable, for federal income tax purposes were as follows for each Fund:
| | Tax cost | Gross unrealized appreciation | Gross unrealized depreciation | Net unrealized appreciation (depreciation) |
| Fidelity Freedom Blend Income Fund | $2,716,953 | $73,628 | $(13,105) | $60,523 |
| Fidelity Freedom Blend 2005 Fund | 2,046,039 | 59,176 | (18,943) | 40,233 |
| Fidelity Freedom Blend 2010 Fund | 2,580,751 | 80,139 | (16,973) | 63,166 |
| Fidelity Freedom Blend 2015 Fund | 9,087,056 | 413,146 | (22,171) | 390,975 |
| Fidelity Freedom Blend 2020 Fund | 22,687,218 | 1,364,682 | (3,230) | 1,361,452 |
| Fidelity Freedom Blend 2025 Fund | 41,667,757 | 2,423,577 | (12,584) | 2,410,993 |
| Fidelity Freedom Blend 2030 Fund | 22,492,561 | 1,532,077 | (29,472) | 1,502,605 |
| Fidelity Freedom Blend 2035 Fund | 23,444,909 | 1,660,768 | (53,511) | 1,607,257 |
| Fidelity Freedom Blend 2040 Fund | 15,518,253 | 1,222,840 | (43,485) | 1,179,355 |
| Fidelity Freedom Blend 2045 Fund | 9,487,508 | 616,466 | (82,733) | 533,733 |
| Fidelity Freedom Blend 2050 Fund | 8,320,957 | 558,885 | (59,087) | 499,798 |
| Fidelity Freedom Blend 2055 Fund | 4,853,462 | 303,142 | (59,364) | 243,778 |
| Fidelity Freedom Blend 2060 Fund | 2,562,999 | 115,699 | (67,709) | 47,990 |
The tax-based components of distributable earnings as of period end were as follows for each Fund:
| | Undistributed ordinary income | Undistributed long-term capital gain | Net unrealized appreciation (depreciation) on securities and other investments |
| Fidelity Freedom Blend Income Fund | $7,721 | $4,049 | $60,523 |
| Fidelity Freedom Blend 2005 Fund | 9,310 | 4,624 | 40,233 |
| Fidelity Freedom Blend 2010 Fund | 20,261 | – | 63,166 |
| Fidelity Freedom Blend 2015 Fund | 40,724 | 1,579 | 390,975 |
| Fidelity Freedom Blend 2020 Fund | 134,250 | 4,175 | 1,361,452 |
| Fidelity Freedom Blend 2025 Fund | 107,533 | 13,163 | 2,410,993 |
| Fidelity Freedom Blend 2030 Fund | 53,138 | 8,130 | 1,502,605 |
| Fidelity Freedom Blend 2035 Fund | 32,824 | 18,971 | 1,607,257 |
| Fidelity Freedom Blend 2040 Fund | 24,562 | 10,867 | 1,179,355 |
| Fidelity Freedom Blend 2045 Fund | 9,817 | 29,565 | 533,733 |
| Fidelity Freedom Blend 2050 Fund | 6,820 | 18,898 | 499,798 |
| Fidelity Freedom Blend 2055 Fund | 6,286 | 15,723 | 243,778 |
| Fidelity Freedom Blend 2060 Fund | 1,250 | 21,231 | 47,990 |
Certain of the Funds intend to elect to defer to the next fiscal year capital losses recognized during the period November 1, 2018 to March 31, 2019. Loss deferrals were as follows:
| | Capital losses |
| Fidelity Freedom Blend 2010 Fund | $(2,272) |
The tax character of distributions paid was as follows:
| March 31, 2019(a) | | | |
| | Ordinary Income | Long-term Capital Gains | Total |
| Fidelity Freedom Blend Income Fund | $22,760 | $1,834 | $24,594 |
| Fidelity Freedom Blend 2005 Fund | 12,566 | 3,062 | 15,628 |
| Fidelity Freedom Blend 2010 Fund | 14,253 | 4,324 | 18,577 |
| Fidelity Freedom Blend 2015 Fund | 17,733 | 5,221 | 22,954 |
| Fidelity Freedom Blend 2020 Fund | 20,764 | 6,526 | 27,290 |
| Fidelity Freedom Blend 2025 Fund | 22,001 | 7,519 | 29,520 |
| Fidelity Freedom Blend 2030 Fund | 17,786 | 9,425 | 27,211 |
| Fidelity Freedom Blend 2035 Fund | 23,081 | 10,632 | 33,713 |
| Fidelity Freedom Blend 2040 Fund | 19,601 | 11,710 | 31,311 |
| Fidelity Freedom Blend 2045 Fund | 27,675 | 12,202 | 39,877 |
| Fidelity Freedom Blend 2050 Fund | 17,198 | 11,596 | 28,794 |
| Fidelity Freedom Blend 2055 Fund | 16,884 | 11,570 | 28,454 |
| Fidelity Freedom Blend 2060 Fund | 18,947 | 11,615 | 30,562 |
(a) For the period August 31, 2018 (commencement of operations) to March 31, 2019.
4. Purchases and Sales of Investments.
Purchases and sales of securities (including the Underlying Fund shares), other than short-term securities, are noted in the table below.
| | Purchases ($) | Sales ($) |
| Fidelity Freedom Blend Income Fund | 3,241,719 | 525,236 |
| Fidelity Freedom Blend 2005 Fund | 2,138,587 | 92,546 |
| Fidelity Freedom Blend 2010 Fund | 3,538,293 | 957,863 |
| Fidelity Freedom Blend 2015 Fund | 10,431,253 | 1,345,487 |
| Fidelity Freedom Blend 2020 Fund | 27,533,753 | 4,902,053 |
| Fidelity Freedom Blend 2025 Fund | 43,981,184 | 2,315,280 |
| Fidelity Freedom Blend 2030 Fund | 24,229,355 | 1,737,364 |
| Fidelity Freedom Blend 2035 Fund | 24,400,542 | 956,311 |
| Fidelity Freedom Blend 2040 Fund | 16,242,770 | 724,870 |
| Fidelity Freedom Blend 2045 Fund | 9,983,181 | 495,828 |
| Fidelity Freedom Blend 2050 Fund | 8,594,476 | 273,702 |
| Fidelity Freedom Blend 2055 Fund | 5,048,843 | 195,462 |
| Fidelity Freedom Blend 2060 Fund | 2,656,836 | 93,907 |
5. Fees and Other Transactions with Affiliates.
Management Fee and Expense Contract. FMR Co., Inc. (the investment adviser), an affiliate of FMR, and its affiliates provide the Funds with investment management related services. Under the management contract, each Class of each Fund pays a monthly management fee that is set at an annual rate by referring to each Fund's target date, indicated by its name, such that the management fee rate applicable to each Class of each Fund is reduced as the fund approaches, and then passes, its target date. In addition, under the management contract, the investment adviser pays all ordinary operating expenses of each Fund, except distribution and service plan fees, fees and expenses of the independent Trustees, and certain miscellaneous expenses such as proxy and shareholder meeting expenses. For the reporting period, the total annual management fee rate for each Class of each Fund was as follows:
| | Annual % of Class-Level Average Net Assets (Classes A, M, C, I, Fidelity Freedom Blend Class) | Annual % of Class-Level Average Net Assets
(Classes K, K6, Z, Z6) |
| Fidelity Freedom Blend Income Fund | .46% | .36% |
| Fidelity Freedom Blend 2005 Fund | .46% | .36% |
| Fidelity Freedom Blend 2010 Fund | .47% | .37% |
| Fidelity Freedom Blend 2015 Fund | .49% | .39% |
| Fidelity Freedom Blend 2020 Fund | .50% | .40% |
| Fidelity Freedom Blend 2025 Fund | .51% | .41% |
| Fidelity Freedom Blend 2030 Fund | .52% | .42% |
| Fidelity Freedom Blend 2035 Fund | .53% | .43% |
| Fidelity Freedom Blend 2040 Fund | .54% | .44% |
| Fidelity Freedom Blend 2045 Fund | .54% | .44% |
| Fidelity Freedom Blend 2050 Fund | .54% | .44% |
| Fidelity Freedom Blend 2055 Fund | .54% | .44% |
| Fidelity Freedom Blend 2060 Fund | .54% | .44% |
Under the expense contract, the investment adviser pays class-level expenses for Class K6 and Class Z6 of each Fund as necessary so that Class K6 and Class Z6 total expenses do not exceed certain amounts of Class K6 and Class Z6 average net assets, respectively, on an annual basis with certain exceptions, as noted in the following table:
| | Annual % of Class-Level Average Net Assets (Class K6, Z6) |
| Fidelity Freedom Blend Income Fund | .26% |
| Fidelity Freedom Blend 2005 Fund | .26% |
| Fidelity Freedom Blend 2010 Fund | .27% |
| Fidelity Freedom Blend 2015 Fund | .29% |
| Fidelity Freedom Blend 2020 Fund | .30% |
| Fidelity Freedom Blend 2025 Fund | .31% |
| Fidelity Freedom Blend 2030 Fund | .32% |
| Fidelity Freedom Blend 2035 Fund | .33% |
| Fidelity Freedom Blend 2040 Fund | .34% |
| Fidelity Freedom Blend 2045 Fund | .34% |
| Fidelity Freedom Blend 2050 Fund | .34% |
| Fidelity Freedom Blend 2055 Fund | .34% |
| Fidelity Freedom Blend 2060 Fund | .34% |
Distribution and Service Plan Fees. In accordance with Rule 12b-1 of the 1940 Act, each Fund has adopted separate Distribution and Service Plans for each class of shares. Certain classes pay Fidelity Distributors Corporation (FDC), an affiliate of the investment adviser, separate Distribution and Service Fees, each of which is based on an annual percentage of each class' average net assets. In addition, FDC may pay financial intermediaries for selling shares of each Fund and providing shareholder support services. For the period, the Distribution and Service Fee rates, total fees and amounts retained by FDC were as follows:
| | Distribution Fee | Service Fee | Total Fees | Retained by FDC |
| Fidelity Freedom Blend Income Fund | | | | |
| Class A | -% | .25% | $154 | $96 |
| Class M | .25% | .25% | 290 | 290 |
| Class C | .75% | .25% | 819 | 572 |
| | | | $1,263 | $958 |
| Fidelity Freedom Blend 2005 Fund | | | | |
| Class A | -% | .25% | $202 | $144 |
| Class M | .25% | .25% | 290 | 290 |
| Class C | .75% | .25% | 576 | 576 |
| | | | $1,068 | $1,010 |
| Fidelity Freedom Blend 2010 Fund | | | | |
| Class A | -% | .25% | $195 | $119 |
| Class M | .25% | .25% | 326 | 238 |
| Class C | .75% | .25% | 573 | 573 |
| | | | $1,094 | $930 |
| Fidelity Freedom Blend 2015 Fund | | | | |
| Class A | -% | .25% | $151 | $142 |
| Class M | .25% | .25% | 286 | 286 |
| Class C | .75% | .25% | 913 | 648 |
| | | | $1,350 | $1,076 |
| Fidelity Freedom Blend 2020 Fund | | | | |
| Class A | -% | .25% | $553 | $126 |
| Class M | .25% | .25% | 286 | 181 |
| Class C | .75% | .25% | 967 | 628 |
| | | | $1,806 | $935 |
| Fidelity Freedom Blend 2025 Fund | | | | |
| Class A | -% | .25% | $168 | $91 |
| Class M | .25% | .25% | 582 | 221 |
| Class C | .75% | .25% | 747 | 591 |
| | | | $1,497 | $903 |
| Fidelity Freedom Blend 2030 Fund | | | | |
| Class A | -% | .25% | $261 | $139 |
| Class M | .25% | .25% | 298 | 184 |
| Class C | .75% | .25% | 987 | 607 |
| | | | $1,546 | $930 |
| Fidelity Freedom Blend 2035 Fund | | | | |
| Class A | -% | .25% | $216 | $18 |
| Class M | .25% | .25% | 435 | 129 |
| Class C | .75% | .25% | 662 | 581 |
| | | | $1,313 | $728 |
| Fidelity Freedom Blend 2040 Fund | | | | |
| Class A | -% | .25% | $232 | $89 |
| Class M | .25% | .25% | 296 | 176 |
| Class C | .75% | .25% | 664 | 567 |
| | | | $1,192 | $832 |
| Fidelity Freedom Blend 2045 Fund | | | | |
| Class A | -% | .25% | $202 | $139 |
| Class M | .25% | .25% | 382 | 178 |
| Class C | .75% | .25% | 632 | 379 |
| | | | $1,216 | $696 |
| Fidelity Freedom Blend 2050 Fund | | | | |
| Class A | -% | .25% | $211 | $89 |
| Class M | .25% | .25% | 278 | 278 |
| Class C | .75% | .25% | 580 | 580 |
| | | | $1,069 | $947 |
| Fidelity Freedom Blend 2055 Fund | | | | |
| Class A | -% | .25% | $156 | $124 |
| Class M | .25% | .25% | 279 | 228 |
| Class C | .75% | .25% | 561 | 561 |
| | | | $996 | $913 |
| Fidelity Freedom Blend 2060 Fund | | | | |
| Class A | -% | .25% | $192 | $75 |
| Class M | .25% | .25% | 316 | 226 |
| Class C | .75% | .25% | 561 | 561 |
| | | | $1,069 | $862 |
Sales Load. FDC may receive a front-end sales charge of up to 5.75% for selling Class A shares and 3.50% for selling Class M shares, some of which is paid to financial intermediaries for selling shares of each Fund. Depending on the holding period, FDC may receive contingent deferred sales charges levied on Class A, Class M and Class C redemptions. The deferred sales charges are 1.00% for Class C shares, 1.00% for certain purchases of Class A shares and .25% for certain purchases of Class M shares.
For the period, sales charge amounts retained by FDC were as follows:
| | Retained by FDC |
| Fidelity Freedom Blend Income Fund | |
| Class A | $346 |
| | $346 |
| Fidelity Freedom Blend 2005 Fund | |
| Class A | $2 |
| | $2 |
| Fidelity Freedom Blend 2015 Fund | |
| Class C(a) | $9 |
| | $9 |
| Fidelity Freedom Blend 2020 Fund | |
| Class A | $12 |
| Class M | 46 |
| | $58 |
| Fidelity Freedom Blend 2025 Fund | |
| Class A | $61 |
| Class M | 57 |
| | $118 |
| Fidelity Freedom Blend 2030 Fund | |
| Class A | $213 |
| Class M | 6 |
| | $219 |
| Fidelity Freedom Blend 2035 Fund | |
| Class A | $113 |
| Class M | 28 |
| | $141 |
| Fidelity Freedom Blend 2040 Fund | |
| Class A | $346 |
| Class M | 196 |
| | $542 |
| Fidelity Freedom Blend 2045 Fund | |
| Class A | $1,013 |
| Class M | 1,769 |
| | $2,782 |
| Fidelity Freedom Blend 2050 Fund | |
| Class A | $923 |
| Class M | 2 |
| | $925 |
| Fidelity Freedom Blend 2055 Fund | |
| Class A | $50 |
| Class M | 16 |
| | $66 |
| Fidelity Freedom Blend 2060 Fund | |
| Class A | $182 |
| Class M | 51 |
| | $233 |
(a) When Class C shares are initially sold, FDC pays commissions from its own resources to financial intermediaries through which the sales are made.
Interfund Trades. The Funds may purchase from or sell securities to other Fidelity Funds under procedures adopted by the Board. The procedures have been designed to ensure these interfund trades are executed in accordance with Rule 17a-7 of the 1940 Act. Interfund trades are included within the respective purchases and sales amounts shown in the Purchases and Sales of Investments note.
6. Distributions to Shareholders.
Distributions to shareholders of each class were as follows:
| | Year ended
March 31, 2019(a) |
| Fidelity Freedom Blend Income Fund | |
| Distributions to shareholders | |
| Class A | $1,681 |
| Class M | 1,415 |
| Class C | 2,260 |
| Fidelity Freedom Blend Income Fund | 6,229 |
| Class K | 1,739 |
| Class K6 | 6,084 |
| Class I | 1,678 |
| Class Z | 1,739 |
| Class Z6 | 1,769 |
| Total | $24,594 |
| Fidelity Freedom Blend 2005 Fund | |
| Distributions to shareholders | |
| Class A | $3,022 |
| Class M | 1,450 |
| Class C | 1,280 |
| Fidelity Freedom Blend 2005 Fund | 1,646 |
| Class K | 1,640 |
| Class K6 | 1,670 |
| Class I | 1,610 |
| Class Z | 1,640 |
| Class Z6 | 1,670 |
| Total | $15,628 |
| Fidelity Freedom Blend 2010 Fund | |
| Distributions to shareholders | |
| Class A | $2,983 |
| Class M | 2,145 |
| Class C | 1,510 |
| Fidelity Freedom Blend 2010 Fund | 2,609 |
| Class K | 1,860 |
| Class K6 | 1,890 |
| Class I | 1,830 |
| Class Z | 1,860 |
| Class Z6 | 1,890 |
| Total | $18,577 |
| Fidelity Freedom Blend 2015 Fund | |
| Distributions to shareholders | |
| Class A | $1,630 |
| Class M | 1,550 |
| Class C | 3,292 |
| Fidelity Freedom Blend 2015 Fund | 7,732 |
| Class K | 1,740 |
| Class K6 | 1,780 |
| Class I | 1,710 |
| Class Z | 1,740 |
| Class Z6 | 1,780 |
| Total | $22,954 |
| Fidelity Freedom Blend 2020 Fund | |
| Distributions to shareholders | |
| Class A | $3,550 |
| Class M | 1,044 |
| Class C | 1,516 |
| Fidelity Freedom Blend 2020 Fund | 15,010 |
| Class K | 1,230 |
| Class K6 | 1,260 |
| Class I | 1,190 |
| Class Z | 1,230 |
| Class Z6 | 1,260 |
| Total | $27,290 |
| Fidelity Freedom Blend 2025 Fund | |
| Distributions to shareholders | |
| Class A | $2,341 |
| Class M | 1,801 |
| Class C | 1,630 |
| Fidelity Freedom Blend 2025 Fund | 13,758 |
| Class K | 1,980 |
| Class K6 | 2,010 |
| Class I | 1,950 |
| Class Z | 1,980 |
| Class Z6 | 2,070 |
| Total | $29,520 |
| Fidelity Freedom Blend 2030 Fund | |
| Distributions to shareholders | |
| Class A | $3,141 |
| Class M | 2,398 |
| Class C | 4,285 |
| Fidelity Freedom Blend 2030 Fund | 4,487 |
| Class K | 2,570 |
| Class K6 | 2,610 |
| Class I | 2,540 |
| Class Z | 2,570 |
| Class Z6 | 2,610 |
| Total | $27,211 |
| Fidelity Freedom Blend 2035 Fund | |
| Distributions to shareholders | |
| Class A | $2,922 |
| Class M | 4,429 |
| Class C | 2,270 |
| Fidelity Freedom Blend 2035 Fund | 10,992 |
| Class K | 2,610 |
| Class K6 | 2,650 |
| Class I | 2,580 |
| Class Z | 2,610 |
| Class Z6 | 2,650 |
| Total | $33,713 |
| Fidelity Freedom Blend 2040 Fund | |
| Distributions to shareholders | |
| Class A | $5,605 |
| Class M | 2,729 |
| Class C | 2,427 |
| Fidelity Freedom Blend 2040 Fund | 6,700 |
| Class K | 2,760 |
| Class K6 | 2,800 |
| Class I | 2,730 |
| Class Z | 2,760 |
| Class Z6 | 2,800 |
| Total | $31,311 |
| Fidelity Freedom Blend 2045 Fund | |
| Distributions to shareholders | |
| Class A | $3,446 |
| Class M | 4,165 |
| Class C | 2,591 |
| Fidelity Freedom Blend 2045 Fund | 16,095 |
| Class K | 2,710 |
| Class K6 | 2,740 |
| Class I | 2,680 |
| Class Z | 2,710 |
| Class Z6 | 2,740 |
| Total | $39,877 |
| Fidelity Freedom Blend 2050 Fund | |
| Distributions to shareholders | |
| Class A | $3,316 |
| Class M | 2,930 |
| Class C | 2,770 |
| Fidelity Freedom Blend 2050 Fund | 4,148 |
| Class K | 3,120 |
| Class K6 | 3,150 |
| Class I | 3,090 |
| Class Z | 3,120 |
| Class Z6 | 3,150 |
| Total | $28,794 |
| Fidelity Freedom Blend 2055 Fund | |
| Distributions to shareholders | |
| Class A | $3,064 |
| Class M | 2,982 |
| Class C | 2,820 |
| Fidelity Freedom Blend 2055 Fund | 3,718 |
| Class K | 3,170 |
| Class K6 | 3,200 |
| Class I | 3,130 |
| Class Z | 3,170 |
| Class Z6 | 3,200 |
| Total | $28,454 |
| Fidelity Freedom Blend 2060 Fund | |
| Distributions to shareholders | |
| Class A | $2,862 |
| Class M | 2,764 |
| Class C | 2,612 |
| Fidelity Freedom Blend 2060 Fund | 7,540 |
| Class K | 2,950 |
| Class K6 | 2,980 |
| Class I | 2,924 |
| Class Z | 2,950 |
| Class Z6 | 2,980 |
| Total | $30,562 |
(a) For the period August 31, 2018 (commencement of operations) to March 31, 2019.
7. Share Transactions.
Share transactions for each class were as follows and may contain automatic conversions between classes or exchanges between affiliated funds:
| | Shares | Dollars |
| | Year ended March 31, 2019 (a) | Year ended March 31, 2019 (a) |
| Fidelity Freedom Blend Income Fund | | |
| Class A | | |
| Shares sold | 10,990 | $109,675 |
| Reinvestment of distributions | 173 | 1,681 |
| Shares redeemed | (499) | (5,000) |
| Net increase (decrease) | 10,664 | $106,356 |
| Class M | | |
| Shares sold | 10,000 | $100,000 |
| Reinvestment of distributions | 146 | 1,415 |
| Net increase (decrease) | 10,146 | $101,415 |
| Class C | | |
| Shares sold | 18,568 | $183,283 |
| Reinvestment of distributions | 234 | 2,260 |
| Shares redeemed | (6,500) | (65,000) |
| Net increase (decrease) | 12,302 | $120,543 |
| Fidelity Freedom Blend Income Fund | | |
| Shares sold | 70,586 | $691,454 |
| Reinvestment of distributions | 608 | 5,886 |
| Shares redeemed | (33,487) | (327,744) |
| Net increase (decrease) | 37,707 | $369,596 |
| Class K | | |
| Shares sold | 10,000 | $100,000 |
| Reinvestment of distributions | 179 | 1,739 |
| Net increase (decrease) | 10,179 | $101,739 |
| Class K6 | | |
| Shares sold | 168,319 | $1,629,815 |
| Reinvestment of distributions | 620 | 6,084 |
| Shares redeemed | (3,760) | (36,389) |
| Net increase (decrease) | 165,179 | $1,599,510 |
| Class I | | |
| Shares sold | 10,000 | $100,000 |
| Reinvestment of distributions | 173 | 1,678 |
| Net increase (decrease) | 10,173 | $101,678 |
| Class Z | | |
| Shares sold | 10,000 | $100,000 |
| Reinvestment of distributions | 179 | 1,739 |
| Net increase (decrease) | 10,179 | $101,739 |
| Class Z6 | | |
| Shares sold | 10,000 | $100,000 |
| Reinvestment of distributions | 182 | 1,769 |
| Net increase (decrease) | 10,182 | $101,769 |
| Fidelity Freedom Blend 2005 Fund | | |
| Class A | | |
| Shares sold | 18,563 | $182,296 |
| Reinvestment of distributions | 319 | 3,022 |
| Shares redeemed | (147) | (1,392) |
| Net increase (decrease) | 18,735 | $183,926 |
| Class M | | |
| Shares sold | 10,000 | $100,000 |
| Reinvestment of distributions | 153 | 1,450 |
| Net increase (decrease) | 10,153 | $101,450 |
| Class C | | |
| Shares sold | 10,000 | $100,000 |
| Reinvestment of distributions | 135 | 1,280 |
| Net increase (decrease) | 10,135 | $101,280 |
| Fidelity Freedom Blend 2005 Fund | | |
| Shares sold | 11,014 | $110,028 |
| Reinvestment of distributions | 173 | 1,646 |
| Shares redeemed | (77) | (750) |
| Net increase (decrease) | 11,110 | $110,924 |
| Class K | | |
| Shares sold | 10,000 | $100,000 |
| Reinvestment of distributions | 173 | 1,640 |
| Net increase (decrease) | 10,173 | $101,640 |
| Class K6 | | |
| Shares sold | 117,462 | $1,125,955 |
| Reinvestment of distributions | 176 | 1,670 |
| Shares redeemed | (25) | (241) |
| Net increase (decrease) | 117,613 | $1,127,384 |
| Class I | | |
| Shares sold | 10,051 | $100,500 |
| Reinvestment of distributions | 170 | 1,610 |
| Shares redeemed | (51) | (499) |
| Net increase (decrease) | 10,170 | $101,611 |
| Class Z | | |
| Shares sold | 10,000 | $100,000 |
| Reinvestment of distributions | 173 | 1,640 |
| Net increase (decrease) | 10,173 | $101,640 |
| Class Z6 | | |
| Shares sold | 10,000 | $100,000 |
| Reinvestment of distributions | 176 | 1,670 |
| Net increase (decrease) | 10,176 | $101,670 |
| Fidelity Freedom Blend 2010 Fund | | |
| Class A | | |
| Shares sold | 16,826 | $166,073 |
| Reinvestment of distributions | 320 | 2,983 |
| Shares redeemed | (435) | (4,175) |
| Net increase (decrease) | 16,711 | $164,881 |
| Class M | | |
| Shares sold | 12,472 | $123,732 |
| Reinvestment of distributions | 230 | 2,145 |
| Net increase (decrease) | 12,702 | $125,877 |
| Class C | | |
| Shares sold | 10,000 | $100,000 |
| Reinvestment of distributions | 162 | 1,510 |
| Net increase (decrease) | 10,162 | $101,510 |
| Fidelity Freedom Blend 2010 Fund | | |
| Shares sold | 14,603 | $145,000 |
| Reinvestment of distributions | 280 | 2,609 |
| Net increase (decrease) | 14,883 | $147,609 |
| Class K | | |
| Shares sold | 10,000 | $100,000 |
| Reinvestment of distributions | 199 | 1,860 |
| Net increase (decrease) | 10,199 | $101,860 |
| Class K6 | | |
| Shares sold | 313,573 | $3,001,673 |
| Reinvestment of distributions | 203 | 1,890 |
| Shares redeemed | (143,149) | (1,388,852) |
| Net increase (decrease) | 170,627 | $1,614,711 |
| Class I | | |
| Shares sold | 10,000 | $100,000 |
| Reinvestment of distributions | 196 | 1,830 |
| Net increase (decrease) | 10,196 | $101,830 |
| Class Z | | |
| Shares sold | 10,000 | $100,000 |
| Reinvestment of distributions | 199 | 1,860 |
| Net increase (decrease) | 10,199 | $101,860 |
| Class Z6 | | |
| Shares sold | 10,000 | $100,000 |
| Reinvestment of distributions | 203 | 1,890 |
| Net increase (decrease) | 10,203 | $101,890 |
| Fidelity Freedom Blend 2015 Fund | | |
| Class A | | |
| Shares sold | 19,467 | $193,535 |
| Reinvestment of distributions | 177 | 1,630 |
| Net increase (decrease) | 19,644 | $195,165 |
| Class M | | |
| Shares sold | 10,000 | $100,000 |
| Reinvestment of distributions | 168 | 1,550 |
| Net increase (decrease) | 10,168 | $101,550 |
| Class C | | |
| Shares sold | 23,897 | $230,277 |
| Reinvestment of distributions | 358 | 3,292 |
| Shares redeemed | (9,626) | (94,714) |
| Net increase (decrease) | 14,629 | $138,855 |
| Fidelity Freedom Blend 2015 Fund | | |
| Shares sold | 46,537 | $453,571 |
| Reinvestment of distributions | 839 | 7,732 |
| Shares redeemed | (176) | (1,698) |
| Net increase (decrease) | 47,200 | $459,605 |
| Class K | | |
| Shares sold | 10,000 | $100,000 |
| Reinvestment of distributions | 189 | 1,740 |
| Net increase (decrease) | 10,189 | $101,740 |
| Class K6 | | |
| Shares sold | 935,723 | $8,831,932 |
| Reinvestment of distributions | 193 | 1,780 |
| Shares redeemed | (112,769) | (1,093,561) |
| Net increase (decrease) | 823,147 | $7,740,151 |
| Class I | | |
| Shares sold | 10,000 | $100,000 |
| Reinvestment of distributions | 186 | 1,710 |
| Net increase (decrease) | 10,186 | $101,710 |
| Class Z | | |
| Shares sold | 10,000 | $100,000 |
| Reinvestment of distributions | 189 | 1,740 |
| Net increase (decrease) | 10,189 | $101,740 |
| Class Z6 | | |
| Shares sold | 10,000 | $100,000 |
| Reinvestment of distributions | 193 | 1,780 |
| Net increase (decrease) | 10,193 | $101,780 |
| Fidelity Freedom Blend 2020 Fund | | |
| Class A | | |
| Shares sold | 90,623 | $866,540 |
| Reinvestment of distributions | 388 | 3,550 |
| Shares redeemed | (846) | (8,100) |
| Net increase (decrease) | 90,165 | $861,990 |
| Class M | | |
| Shares sold | 10,649 | $106,358 |
| Reinvestment of distributions | 114 | 1,044 |
| Shares redeemed | (30) | (281) |
| Net increase (decrease) | 10,733 | $107,121 |
| Class C | | |
| Shares sold | 38,753 | $379,766 |
| Reinvestment of distributions | 166 | 1,516 |
| Net increase (decrease) | 38,919 | $381,282 |
| Fidelity Freedom Blend 2020 Fund | | |
| Shares sold | 202,319 | $1,911,655 |
| Reinvestment of distributions | 1,642 | 15,010 |
| Shares redeemed | (86,207) | (829,813) |
| Net increase (decrease) | 117,754 | $1,096,852 |
| Class K | | |
| Shares sold | 10,000 | $100,000 |
| Reinvestment of distributions | 134 | 1,230 |
| Net increase (decrease) | 10,134 | $101,230 |
| Class K6 | | |
| Shares sold | 2,552,418 | $23,902,190 |
| Reinvestment of distributions | 138 | 1,260 |
| Shares redeemed | (433,337) | (4,233,776) |
| Net increase (decrease) | 2,119,219 | $19,669,674 |
| Class I | | |
| Shares sold | 12,024 | $120,000 |
| Reinvestment of distributions | 130 | 1,190 |
| Net increase (decrease) | 12,154 | $121,190 |
| Class Z | | |
| Shares sold | 10,000 | $100,000 |
| Reinvestment of distributions | 134 | 1,230 |
| Net increase (decrease) | 10,134 | $101,230 |
| Class Z6 | | |
| Shares sold | 16,287 | $161,553 |
| Reinvestment of distributions | 138 | 1,260 |
| Shares redeemed | (6,287) | (61,239) |
| Net increase (decrease) | 10,138 | $101,574 |
| Fidelity Freedom Blend 2025 Fund | | |
| Class A | | |
| Shares sold | 18,014 | $175,792 |
| Reinvestment of distributions | 261 | 2,341 |
| Shares redeemed | (1,119) | (10,301) |
| Net increase (decrease) | 17,156 | $167,832 |
| Class M | | |
| Shares sold | 75,789 | $737,334 |
| Reinvestment of distributions | 200 | 1,801 |
| Net increase (decrease) | 75,989 | $739,135 |
| Class C | | |
| Shares sold | 31,302 | $305,603 |
| Reinvestment of distributions | 181 | 1,630 |
| Shares redeemed | (1,076) | (10,218) |
| Net increase (decrease) | 30,407 | $297,015 |
| Fidelity Freedom Blend 2025 Fund | | |
| Shares sold | 195,169 | $1,876,769 |
| Reinvestment of distributions | 1,532 | 13,758 |
| Shares redeemed | (31,642) | (307,029) |
| Net increase (decrease) | 165,059 | $1,583,498 |
| Class K | | |
| Shares sold | 10,000 | $100,000 |
| Reinvestment of distributions | 220 | 1,980 |
| Net increase (decrease) | 10,220 | $101,980 |
| Class K6 | | |
| Shares sold | 4,331,747 | $40,063,466 |
| Reinvestment of distributions | 224 | 2,010 |
| Shares redeemed | (180,792) | (1,728,766) |
| Net increase (decrease) | 4,151,179 | $38,336,710 |
| Class I | | |
| Shares sold | 10,000 | $100,000 |
| Reinvestment of distributions | 217 | 1,950 |
| Net increase (decrease) | 10,217 | $101,950 |
| Class Z | | |
| Shares sold | 10,000 | $100,000 |
| Reinvestment of distributions | 220 | 1,980 |
| Net increase (decrease) | 10,220 | $101,980 |
| Class Z6 | | |
| Shares sold | 10,301 | $103,000 |
| Reinvestment of distributions | 230 | 2,070 |
| Net increase (decrease) | 10,531 | $105,070 |
| Fidelity Freedom Blend 2030 Fund | | |
| Class A | | |
| Shares sold | 35,559 | $338,052 |
| Reinvestment of distributions | 359 | 3,141 |
| Net increase (decrease) | 35,918 | $341,193 |
| Class M | | |
| Shares sold | 19,237 | $188,421 |
| Reinvestment of distributions | 274 | 2,398 |
| Shares redeemed | (1,939) | (18,770) |
| Net increase (decrease) | 17,572 | $172,049 |
| Class C | | |
| Shares sold | 26,381 | $252,448 |
| Reinvestment of distributions | 490 | 4,285 |
| Net increase (decrease) | 26,871 | $256,733 |
| Fidelity Freedom Blend 2030 Fund | | |
| Shares sold | 88,686 | $846,378 |
| Reinvestment of distributions | 512 | 4,487 |
| Shares redeemed | (10,519) | (100,972) |
| Net increase (decrease) | 78,679 | $749,893 |
| Class K | | |
| Shares sold | 10,000 | $100,000 |
| Reinvestment of distributions | 293 | 2,570 |
| Net increase (decrease) | 10,293 | $102,570 |
| Class K6 | | |
| Shares sold | 2,344,828 | $21,161,628 |
| Reinvestment of distributions | 298 | 2,610 |
| Shares redeemed | (98,703) | (935,205) |
| Net increase (decrease) | 2,246,423 | $20,229,033 |
| Class I | | |
| Shares sold | 10,000 | $100,000 |
| Reinvestment of distributions | 290 | 2,540 |
| Net increase (decrease) | 10,290 | $102,540 |
| Class Z | | |
| Shares sold | 10,000 | $100,000 |
| Reinvestment of distributions | 293 | 2,570 |
| Net increase (decrease) | 10,293 | $102,570 |
| Class Z6 | | |
| Shares sold | 103,038 | $988,511 |
| Reinvestment of distributions | 298 | 2,610 |
| Shares redeemed | (65,359) | (622,873) |
| Net increase (decrease) | 37,977 | $368,248 |
| Fidelity Freedom Blend 2035 Fund | | |
| Class A | | |
| Shares sold | 36,896 | $353,952 |
| Reinvestment of distributions | 341 | 2,922 |
| Shares redeemed | (12) | (103) |
| Net increase (decrease) | 37,225 | $356,771 |
| Class M | | |
| Shares sold | 17,984 | $173,296 |
| Reinvestment of distributions | 517 | 4,429 |
| Net increase (decrease) | 18,501 | $177,725 |
| Class C | | |
| Shares sold | 21,319 | $207,251 |
| Reinvestment of distributions | 265 | 2,270 |
| Net increase (decrease) | 21,584 | $209,521 |
| Fidelity Freedom Blend 2035 Fund | | |
| Shares sold | 122,967 | $1,168,626 |
| Reinvestment of distributions | 1,284 | 10,992 |
| Shares redeemed | (21,782) | (206,991) |
| Net increase (decrease) | 102,469 | $972,627 |
| Class K | | |
| Shares sold | 10,000 | $100,000 |
| Reinvestment of distributions | 305 | 2,610 |
| Net increase (decrease) | 10,305 | $102,610 |
| Class K6 | | |
| Shares sold | 2,453,196 | $21,896,411 |
| Reinvestment of distributions | 309 | 2,650 |
| Shares redeemed | (70,699) | (651,805) |
| Net increase (decrease) | 2,382,806 | $21,247,256 |
| Class I | | |
| Shares sold | 10,888 | $108,315 |
| Reinvestment of distributions | 301 | 2,580 |
| Net increase (decrease) | 11,189 | $110,895 |
| Class Z | | |
| Shares sold | 10,440 | $103,942 |
| Reinvestment of distributions | 305 | 2,610 |
| Net increase (decrease) | 10,745 | $106,552 |
| Class Z6 | | |
| Shares sold | 10,000 | $100,000 |
| Reinvestment of distributions | 309 | 2,650 |
| Net increase (decrease) | 10,309 | $102,650 |
| Fidelity Freedom Blend 2040 Fund | | |
| Class A | | |
| Shares sold | 26,037 | $245,967 |
| Reinvestment of distributions | 661 | 5,605 |
| Net increase (decrease) | 26,698 | $251,572 |
| Class M | | |
| Shares sold | 13,392 | $131,419 |
| Reinvestment of distributions | 321 | 2,729 |
| Net increase (decrease) | 13,713 | $134,148 |
| Class C | | |
| Shares sold | 21,513 | $208,602 |
| Reinvestment of distributions | 286 | 2,427 |
| Net increase (decrease) | 21,799 | $211,029 |
| Fidelity Freedom Blend 2040 Fund | | |
| Shares sold | 61,771 | $580,805 |
| Reinvestment of distributions | 790 | 6,700 |
| Shares redeemed | (821) | (7,718) |
| Net increase (decrease) | 61,740 | $579,787 |
| Class K | | |
| Shares sold | 10,000 | $100,000 |
| Reinvestment of distributions | 325 | 2,760 |
| Net increase (decrease) | 10,325 | $102,760 |
| Class K6 | | |
| Shares sold | 1,662,001 | $14,644,554 |
| Reinvestment of distributions | 330 | 2,800 |
| Shares redeemed | (98,949) | (913,258) |
| Net increase (decrease) | 1,563,382 | $13,734,096 |
| Class I | | |
| Shares sold | 10,124 | $101,151 |
| Reinvestment of distributions | 322 | 2,730 |
| Net increase (decrease) | 10,446 | $103,881 |
| Class Z | | |
| Shares sold | 10,000 | $100,000 |
| Reinvestment of distributions | 325 | 2,760 |
| Net increase (decrease) | 10,325 | $102,760 |
| Class Z6 | | |
| Shares sold | 26,471 | $255,454 |
| Reinvestment of distributions | 330 | 2,800 |
| Net increase (decrease) | 26,801 | $258,254 |
| Fidelity Freedom Blend 2045 Fund | | |
| Class A | | |
| Shares sold | 26,122 | $253,005 |
| Reinvestment of distributions | 406 | 3,446 |
| Shares redeemed | (63) | (600) |
| Net increase (decrease) | 26,465 | $255,851 |
| Class M | | |
| Shares sold | 16,576 | $160,743 |
| Reinvestment of distributions | 491 | 4,165 |
| Shares redeemed | (271) | (2,560) |
| Net increase (decrease) | 16,796 | $162,348 |
| Class C | | |
| Shares sold | 16,112 | $157,390 |
| Reinvestment of distributions | 305 | 2,591 |
| Net increase (decrease) | 16,417 | $159,981 |
| Fidelity Freedom Blend 2045 Fund | | |
| Shares sold | 93,536 | $873,152 |
| Reinvestment of distributions | 1,896 | 16,095 |
| Shares redeemed | (17,143) | (148,361) |
| Net increase (decrease) | 78,289 | $740,886 |
| Class K | | |
| Shares sold | 10,000 | $100,000 |
| Reinvestment of distributions | 319 | 2,710 |
| Net increase (decrease) | 10,319 | $102,710 |
| Class K6 | | |
| Shares sold | 905,331 | $8,061,254 |
| Reinvestment of distributions | 323 | 2,740 |
| Shares redeemed | (37,415) | (348,453) |
| Net increase (decrease) | 868,239 | $7,715,541 |
| Class I | | |
| Shares sold | 10,000 | $100,000 |
| Reinvestment of distributions | 316 | 2,680 |
| Net increase (decrease) | 10,316 | $102,680 |
| Class Z | | |
| Shares sold | 10,000 | $100,000 |
| Reinvestment of distributions | 319 | 2,710 |
| Net increase (decrease) | 10,319 | $102,710 |
| Class Z6 | | |
| Shares sold | 10,000 | $100,000 |
| Reinvestment of distributions | 323 | 2,740 |
| Net increase (decrease) | 10,323 | $102,740 |
| Fidelity Freedom Blend 2050 Fund | | |
| Class A | | |
| Shares sold | 26,016 | $241,577 |
| Reinvestment of distributions | 392 | 3,316 |
| Shares redeemed | (1,246) | (11,291) |
| Net increase (decrease) | 25,162 | $233,602 |
| Class M | | |
| Shares sold | 10,039 | $100,365 |
| Reinvestment of distributions | 347 | 2,930 |
| Net increase (decrease) | 10,386 | $103,295 |
| Class C | | |
| Shares sold | 14,119 | $138,357 |
| Reinvestment of distributions | 327 | 2,770 |
| Net increase (decrease) | 14,446 | $141,127 |
| Fidelity Freedom Blend 2050 Fund | | |
| Shares sold | 49,174 | $463,866 |
| Reinvestment of distributions | 491 | 4,148 |
| Shares redeemed | (705) | (6,683) |
| Net increase (decrease) | 48,960 | $461,331 |
| Class K | | |
| Shares sold | 10,000 | $100,000 |
| Reinvestment of distributions | 369 | 3,120 |
| Net increase (decrease) | 10,369 | $103,120 |
| Class K6 | | |
| Shares sold | 812,830 | $7,194,569 |
| Reinvestment of distributions | 373 | 3,150 |
| Shares redeemed | (27,727) | (259,318) |
| Net increase (decrease) | 785,476 | $6,938,401 |
| Class I | | |
| Shares sold | 10,292 | $102,603 |
| Reinvestment of distributions | 366 | 3,090 |
| Net increase (decrease) | 10,658 | $105,693 |
| Class Z | | |
| Shares sold | 10,000 | $100,000 |
| Reinvestment of distributions | 369 | 3,120 |
| Net increase (decrease) | 10,369 | $103,120 |
| Class Z6 | | |
| Shares sold | 10,000 | $100,000 |
| Reinvestment of distributions | 373 | 3,150 |
| Net increase (decrease) | 10,373 | $103,150 |
| Fidelity Freedom Blend 2055 Fund | | |
| Class A | | |
| Shares sold | 15,518 | $150,503 |
| Reinvestment of distributions | 363 | 3,064 |
| Net increase (decrease) | 15,881 | $153,567 |
| Class M | | |
| Shares sold | 10,302 | $102,820 |
| Reinvestment of distributions | 353 | 2,982 |
| Net increase (decrease) | 10,655 | $105,802 |
| Class C | | |
| Shares sold | 10,988 | $109,225 |
| Reinvestment of distributions | 334 | 2,820 |
| Net increase (decrease) | 11,322 | $112,045 |
| Fidelity Freedom Blend 2055 Fund | | |
| Shares sold | 33,559 | $320,437 |
| Reinvestment of distributions | 440 | 3,718 |
| Shares redeemed | (364) | (3,396) |
| Net increase (decrease) | 33,635 | $320,759 |
| Class K | | |
| Shares sold | 10,000 | $100,000 |
| Reinvestment of distributions | 375 | 3,170 |
| Net increase (decrease) | 10,375 | $103,170 |
| Class K6 | | |
| Shares sold | 439,603 | $3,882,496 |
| Reinvestment of distributions | 379 | 3,200 |
| Shares redeemed | (17,619) | (160,478) |
| Net increase (decrease) | 422,363 | $3,725,218 |
| Class I | | |
| Shares sold | 10,000 | $100,000 |
| Reinvestment of distributions | 370 | 3,130 |
| Net increase (decrease) | 10,370 | $103,130 |
| Class Z | | |
| Shares sold | 10,000 | $100,000 |
| Reinvestment of distributions | 375 | 3,170 |
| Net increase (decrease) | 10,375 | $103,170 |
| Class Z6 | | |
| Shares sold | 10,000 | $100,000 |
| Reinvestment of distributions | 379 | 3,200 |
| Net increase (decrease) | 10,379 | $103,200 |
| Fidelity Freedom Blend 2060 Fund | | |
| Class A | | |
| Shares sold | 25,144 | $239,656 |
| Reinvestment of distributions | 338 | 2,862 |
| Net increase (decrease) | 25,482 | $242,518 |
| Class M | | |
| Shares sold | 14,705 | $142,596 |
| Reinvestment of distributions | 326 | 2,764 |
| Net increase (decrease) | 15,031 | $145,360 |
| Class C | | |
| Shares sold | 10,942 | $108,820 |
| Reinvestment of distributions | 308 | 2,612 |
| Net increase (decrease) | 11,250 | $111,432 |
| Fidelity Freedom Blend 2060 Fund | | |
| Shares sold | 47,789 | $448,564 |
| Reinvestment of distributions | 890 | 7,540 |
| Shares redeemed | (1,176) | (11,123) |
| Net increase (decrease) | 47,503 | $444,981 |
| Class K | | |
| Shares sold | 10,000 | $100,000 |
| Reinvestment of distributions | 348 | 2,950 |
| Net increase (decrease) | 10,348 | $102,950 |
| Class K6 | | |
| Shares sold | 137,069 | $1,222,903 |
| Reinvestment of distributions | 352 | 2,980 |
| Shares redeemed | (5,301) | (50,065) |
| Net increase (decrease) | 132,120 | $1,175,818 |
| Class I | | |
| Shares sold | 10,397 | $103,616 |
| Reinvestment of distributions | 345 | 2,924 |
| Shares redeemed | (11) | (99) |
| Net increase (decrease) | 10,731 | $106,441 |
| Class Z | | |
| Shares sold | 10,011 | $100,100 |
| Reinvestment of distributions | 348 | 2,950 |
| Net increase (decrease) | 10,359 | $103,050 |
| Class Z6 | | |
| Shares sold | 10,436 | $104,106 |
| Reinvestment of distributions | 352 | 2,980 |
| Net increase (decrease) | 10,788 | $107,086 |
(a) For the period August 31, 2018 (commencement of operations) to March 31, 2019.
8. Other.
The Funds' organizational documents provide former and current trustees and officers with a limited indemnification against liabilities arising in connection with the performance of their duties to the Funds. In the normal course of business, the Funds may also enter into contracts that provide general indemnifications. The Funds' maximum exposure under these arrangements is unknown as this would be dependent on future claims that may be made against the Funds. The risk of material loss from such claims is considered remote.
The Funds do not invest in the Underlying Funds for the purpose of exercising management or control; however, investments by the Funds within their principal investment strategies may represent a significant portion of the Underlying Fund's net assets. At the end of the period, the following Funds were the owners of record of 10% or more of the total outstanding shares of the Underlying Funds.
| Fund | Fidelity Freedom Blend 2020 Fund | Fidelity Freedom Blend 2025 Fund | Fidelity Freedom Blend 2035 Fund |
| Fidelity Series Corporate Bond Fund | –% | 10% | –% |
| Fidelity Series Government Bond Index Fund | 14% | 21% | –% |
| Fidelity Large Cap Growth Index Fund | –% | 15% | 13% |
| Fidelity Investment Grade Securitized Fund | –% | 10% | –% |
The Funds, in aggregate, were the owners of record of more than 20% of the total outstanding shares of the following Underlying Funds.
| Fund | % of shares held |
| Fidelity Series Corporate Bond Fund | 28% |
| Fidelity Series Government Bond Index Fund | 59% |
| Fidelity Large Cap Growth Index Fund | 71% |
| Fidelity Investment Grade Securitized Fund | 28% |
| Fidelity International Index Fund | 23% |
At the end of the period, the investment adviser or its affiliates were owners of record of more than 10% of the outstanding shares of the following Funds:
| | Affiliated % |
| Fidelity Freedom Blend Income Fund | 33% |
| Fidelity Freedom Blend 2005 Fund | 44% |
| Fidelity Freedom Blend 2010 Fund | 35% |
| Fidelity Freedom Blend 2055 Fund | 17% |
| Fidelity Freedom Blend 2060 Fund | 34% |
Report of Independent Registered Public Accounting Firm
To the Board of Trustees of Fidelity Aberdeen Street Trust and Shareholders of Fidelity Freedom Blend Income Fund, Fidelity Freedom Blend 2005 Fund, Fidelity Freedom Blend 2010 Fund, Fidelity Freedom Blend 2015 Fund , Fidelity Freedom Blend 2020 Fund , Fidelity Freedom Blend 2025 Fund , Fidelity Freedom Blend 2030 Fund, Fidelity Freedom Blend 2035 Fund, Fidelity Freedom Blend 2040 Fund , Fidelity Freedom Blend 2045 Fund, Fidelity Freedom Blend 2050 Fund, Fidelity Freedom Blend 2055 Fund and Fidelity Freedom Blend 2060 Fund:
Opinions on the Financial Statements
We have audited the accompanying statements of assets and liabilities, including the schedules of investments, of Fidelity Freedom Blend Income Fund, Fidelity Freedom Blend 2005 Fund, Fidelity Freedom Blend 2010 Fund, Fidelity Freedom Blend 2015 Fund , Fidelity Freedom Blend 2020 Fund , Fidelity Freedom Blend 2025 Fund , Fidelity Freedom Blend 2030 Fund, Fidelity Freedom Blend 2035 Fund, Fidelity Freedom Blend 2040 Fund , Fidelity Freedom Blend 2045 Fund, Fidelity Freedom Blend 2050 Fund, Fidelity Freedom Blend 2055 Fund and Fidelity Freedom Blend 2060 Fund (thirteen of the funds constituting Fidelity Aberdeen Street Trust, hereafter collectively referred to as the “Funds”) as of March 31, 2019, the related statements of operations and changes in net assets, including the related notes, and the financial highlights for the period August 31, 2018 (commencement of operations) through March 31, 2019 (collectively referred to as the “financial statements”). In our opinion, the financial statements present fairly, in all material respects, the financial position of each of the Funds as of March 31, 2019, and the results of each of their operations, changes in each of their net assets, and each of the financial highlights for the period August 31, 2018 (commencement of operations) through March 31, 2019 in conformity with accounting principles generally accepted in the United States of America.
Basis for Opinions
These financial statements are the responsibility of the Funds' management. Our responsibility is to express an opinion on the Funds' financial statements based on our audits. We are a public accounting firm registered with the Public Company Accounting Oversight Board (United States) (PCAOB) and are required to be independent with respect to the Funds in accordance with the U.S. federal securities laws and the applicable rules and regulations of the Securities and Exchange Commission and the PCAOB.
We conducted our audits of these financial statements in accordance with the standards of the PCAOB. Those standards require that we plan and perform the audit to obtain reasonable assurance about whether the financial statements are free of material misstatement, whether due to error or fraud.
Our audits included performing procedures to assess the risks of material misstatement of the financial statements, whether due to error or fraud, and performing procedures that respond to those risks. Such procedures included examining, on a test basis, evidence regarding the amounts and disclosures in the financial statements. Our audits also included evaluating the accounting principles used and significant estimates made by management, as well as evaluating the overall presentation of the financial statements. Our procedures included confirmation of securities owned as of March 31, 2019 by correspondence with the custodian. We believe that our audits provide a reasonable basis for our opinions.
PricewaterhouseCoopers LLP
Boston, Massachusetts
May 17, 2019
We have served as the auditor of one or more investment companies in the Fidelity group of funds since 1932.
Trustees and Officers
The Trustees, Members of the Advisory Board (if any), and officers of the trust and funds, as applicable, are listed below. The Board of Trustees governs each fund and is responsible for protecting the interests of shareholders. The Trustees are experienced executives who meet periodically throughout the year to oversee each fund's activities, review contractual arrangements with companies that provide services to each fund, oversee management of the risks associated with such activities and contractual arrangements, and review each fund's performance. If the interests of a fund and an underlying Fidelity® fund were to diverge, a conflict of interest could arise and affect how the Trustees and Members of the Advisory Board fulfill their fiduciary duties to the affected funds. FMRC has structured the funds to avoid these potential conflicts, although there may be situations where a conflict of interest is unavoidable. In such instances, FMRC, the Trustees, and Members of the Advisory Board would take reasonable steps to minimize and, if possible, eliminate the conflict. Each of the Trustees oversees 264 funds.
The Trustees hold office without limit in time except that (a) any Trustee may resign; (b) any Trustee may be removed by written instrument, signed by at least two-thirds of the number of Trustees prior to such removal; (c) any Trustee who requests to be retired or who has become incapacitated by illness or injury may be retired by written instrument signed by a majority of the other Trustees; and (d) any Trustee may be removed at any special meeting of shareholders by a two-thirds vote of the outstanding voting securities of the trust. Each Trustee who is not an interested person (as defined in the 1940 Act) of the trust and the funds is referred to herein as an Independent Trustee. Each Independent Trustee shall retire not later than the last day of the calendar year in which his or her 75th birthday occurs. The Independent Trustees may waive this mandatory retirement age policy with respect to individual Trustees. Officers and Advisory Board Members hold office without limit in time, except that any officer or Advisory Board Member may resign or may be removed by a vote of a majority of the Trustees at any regular meeting or any special meeting of the Trustees. Except as indicated, each individual has held the office shown or other offices in the same company for the past five years.
Each fund's Statement of Additional Information (SAI) includes more information about the Trustees. To request a free copy, call Fidelity at 1-800-544-8544 if you’re an individual investing directly with Fidelity, call 1-800-835-5092 if you’re a plan sponsor or participant with Fidelity as your recordkeeper or call 1-877-208-0098 on institutional accounts or if you’re an advisor or invest through one.
Experience, Skills, Attributes, and Qualifications of the Trustees. The Governance and Nominating Committee has adopted a statement of policy that describes the experience, qualifications, attributes, and skills that are necessary and desirable for potential Independent Trustee candidates (Statement of Policy). The Board believes that each Trustee satisfied at the time he or she was initially elected or appointed a Trustee, and continues to satisfy, the standards contemplated by the Statement of Policy. The Governance and Nominating Committee also engages professional search firms to help identify potential Independent Trustee candidates who have the experience, qualifications, attributes, and skills consistent with the Statement of Policy. From time to time, additional criteria based on the composition and skills of the current Independent Trustees, as well as experience or skills that may be appropriate in light of future changes to board composition, business conditions, and regulatory or other developments, have also been considered by the professional search firms and the Governance and Nominating Committee. In addition, the Board takes into account the Trustees' commitment and participation in Board and committee meetings, as well as their leadership of standing and ad hoc committees throughout their tenure.
In determining that a particular Trustee was and continues to be qualified to serve as a Trustee, the Board has considered a variety of criteria, none of which, in isolation, was controlling. The Board believes that, collectively, the Trustees have balanced and diverse experience, qualifications, attributes, and skills, which allow the Board to operate effectively in governing each fund and protecting the interests of shareholders. Information about the specific experience, skills, attributes, and qualifications of each Trustee, which in each case led to the Board's conclusion that the Trustee should serve (or continue to serve) as a trustee of the funds, is provided below.
Board Structure and Oversight Function. Abigail P. Johnson is an interested person and currently serves as Chairman. The Trustees have determined that an interested Chairman is appropriate and benefits shareholders because an interested Chairman has a personal and professional stake in the quality and continuity of services provided to the funds. Independent Trustees exercise their informed business judgment to appoint an individual of their choosing to serve as Chairman, regardless of whether the Trustee happens to be independent or a member of management. The Independent Trustees have determined that they can act independently and effectively without having an Independent Trustee serve as Chairman and that a key structural component for assuring that they are in a position to do so is for the Independent Trustees to constitute a substantial majority for the Board. The Independent Trustees also regularly meet in executive session. Arthur E. Johnson serves as Chairman of the Independent Trustees and as such (i) acts as a liaison between the Independent Trustees and management with respect to matters important to the Independent Trustees and (ii) with management prepares agendas for Board meetings.
Fidelity® funds are overseen by different Boards of Trustees. The funds' Board oversees Fidelity's investment-grade bond, money market, asset allocation and certain equity funds, and other Boards oversee Fidelity's high income and other equity funds. The asset allocation funds may invest in Fidelity® funds that are overseen by such other Boards. The use of separate Boards, each with its own committee structure, allows the Trustees of each group of Fidelity® funds to focus on the unique issues of the funds they oversee, including common research, investment, and operational issues. On occasion, the separate Boards establish joint committees to address issues of overlapping consequences for the Fidelity® funds overseen by each Board.
The Trustees operate using a system of committees to facilitate the timely and efficient consideration of all matters of importance to the Trustees, each fund, and fund shareholders and to facilitate compliance with legal and regulatory requirements and oversight of the funds' activities and associated risks. The Board, acting through its committees, has charged FMR and its affiliates with (i) identifying events or circumstances the occurrence of which could have demonstrably adverse effects on the funds' business and/or reputation; (ii) implementing processes and controls to lessen the possibility that such events or circumstances occur or to mitigate the effects of such events or circumstances if they do occur; and (iii) creating and maintaining a system designed to evaluate continuously business and market conditions in order to facilitate the identification and implementation processes described in (i) and (ii) above. Because the day-to-day operations and activities of the funds are carried out by or through FMR, its affiliates, and other service providers, the funds' exposure to risks is mitigated but not eliminated by the processes overseen by the Trustees. While each of the Board's committees has responsibility for overseeing different aspects of the funds' activities, oversight is exercised primarily through the Operations and Audit Committees. In addition, an ad hoc Board committee of Independent Trustees has worked with FMR to enhance the Board's oversight of investment and financial risks, legal and regulatory risks, technology risks, and operational risks, including the development of additional risk reporting to the Board. Appropriate personnel, including but not limited to the funds' Chief Compliance Officer (CCO), FMR's internal auditor, the independent accountants, the funds' Treasurer and portfolio management personnel, make periodic reports to the Board's committees, as appropriate, including an annual review of Fidelity's risk management program for the Fidelity® funds. The responsibilities of each standing committee, including their oversight responsibilities, are described further under "Standing Committees of the Trustees."
Interested Trustees*:
Correspondence intended for a Trustee who is an interested person may be sent to Fidelity Investments, 245 Summer Street, Boston, Massachusetts 02210.
Name, Year of Birth; Principal Occupations and Other Relevant Experience+
Abigail P. Johnson (1961)
Year of Election or Appointment: 2009
Trustee
Chairman of the Board of Trustees
Ms. Johnson also serves as Trustee of other Fidelity® funds. Ms. Johnson serves as Chairman (2016-present), Chief Executive Officer (2014-present), and Director (2007-present) of FMR LLC (diversified financial services company), President of Fidelity Financial Services (2012-present) and President of Personal, Workplace and Institutional Services (2005-present). Ms. Johnson is Chairman and Director of FMR Co., Inc. (investment adviser firm, 2011-present) and Chairman and Director of FMR (investment adviser firm, 2011-present). Previously, Ms. Johnson served as Vice Chairman (2007-2016) and President (2013-2016) of FMR LLC, President and a Director of FMR (2001-2005), a Trustee of other investment companies advised by FMR, Fidelity Investments Money Management, Inc. (investment adviser firm), and FMR Co., Inc. (2001-2005), Senior Vice President of the Fidelity® funds (2001-2005), and managed a number of Fidelity® funds. Ms. Abigail P. Johnson and Mr. Arthur E. Johnson are not related.
Jennifer Toolin McAuliffe (1959)
Year of Election or Appointment: 2016
Trustee
Ms. McAuliffe also serves as Trustee of other Fidelity® funds. Ms. McAuliffe previously served as a Member of the Advisory Board of certain Fidelity® funds (2016) and as Co-Head of Fixed Income of Fidelity Investments Limited (now known as FIL Limited (FIL)) (diversified financial services company). Earlier roles at FIL included Director of Research for FIL’s credit and quantitative teams in London, Hong Kong and Tokyo. Ms. McAuliffe also was the Director of Research for taxable and municipal bonds at Fidelity Investments Money Management, Inc. Ms. McAuliffe is also a director or trustee of several not-for-profit entities.
* Determined to be an “Interested Trustee” by virtue of, among other things, his or her affiliation with the trust or various entities under common control with FMR.
+ The information includes the Trustee's principal occupation during the last five years and other information relating to the experience, attributes, and skills relevant to the Trustee's qualifications to serve as a Trustee, which led to the conclusion that the Trustee should serve as a Trustee for each fund.
Independent Trustees:
Correspondence intended for an Independent Trustee may be sent to Fidelity Investments, P.O. Box 55235, Boston, Massachusetts 02205-5235.
Name, Year of Birth; Principal Occupations and Other Relevant Experience+
Elizabeth S. Acton (1951)
Year of Election or Appointment: 2013
Trustee
Ms. Acton also serves as Trustee of other Fidelity® funds. Prior to her retirement in April 2012, Ms. Acton was Executive Vice President, Finance (2011-2012), Executive Vice President, Chief Financial Officer (2002-2011), and Treasurer (2004-2005) of Comerica Incorporated (financial services). Prior to joining Comerica, Ms. Acton held a variety of positions at Ford Motor Company (1983-2002), including Vice President and Treasurer (2000-2002) and Executive Vice President and Chief Financial Officer of Ford Motor Credit Company (1998-2000). Ms. Acton currently serves as a member of the Board of Directors and Audit and Finance Committees of Beazer Homes USA, Inc. (homebuilding, 2012-present). Previously, Ms. Acton served as a Member of the Advisory Board of certain Fidelity® funds (2013-2016).
Ann E. Dunwoody (1953)
Year of Election or Appointment: 2018
Trustee
General Dunwoody also serves as Trustee of other Fidelity® funds. General Dunwoody (United States Army, Retired) was the first woman in U.S. military history to achieve the rank of four-star general and prior to her retirement in 2012 held a variety of positions within the U.S. Army, including Commanding General, U.S. Army Material Command (2008-2012). She is the President of First to Four LLC (leadership and mentoring services, 2012-present). She also serves as a member of the Board of Directors and Nominating and Corporate Governance Committee of L3 Technologies, Inc. (communication, electronic, sensor, and aerospace systems, 2013-present), Board of Directors and Nomination and Corporate Governance Committees of Kforce Inc. (professional staffing services, 2016-present) and Board of Directors of Automattic Inc. (software engineering, 2018-present). Previously, General Dunwoody served as a Member of the Advisory Board of certain Fidelity® funds (2018), a member of the Board of Directors and Audit and Sustainability and Corporate Responsibility Committees of Republic Services, Inc. (waste collection, disposal and recycling, 2013-2016). Ms. Dunwoody also serves on several boards for non-profit organizations, including as a member of the Board of Directors, Chair of the Nomination and Governance Committee and member of the Audit Committee of Logistics Management Institute (consulting non-profit, 2012-present), a member of the Board of Directors of the Army Historical Foundation (2015-present), a member of the Council of Trustees for the Association of the United States Army (advocacy non-profit, 2013-present) and a member of the Board of Trustees of Florida Institute of Technology (2015-present) and ThanksUSA (military family education non-profit, 2014-present).
John Engler (1948)
Year of Election or Appointment: 2014
Trustee
Mr. Engler also serves as Trustee of other Fidelity® funds. He serves on the board of directors for Universal Forest Products (manufacturer and distributor of wood and wood-alternative products, 2003-present) and K12 Inc. (technology-based education company, 2012-present). Previously, Mr. Engler served as interim president of Michigan State University (2018-2019), a Member of the Advisory Board of certain Fidelity® funds (2014-2016), president of the Business Roundtable (2011-2017), a trustee of The Munder Funds (2003-2014), president and CEO of the National Association of Manufacturers (2004-2011), member of the Board of Trustees of the Annie E. Casey Foundation (2004-2015), and as governor of Michigan (1991-2003). He is a past chairman of the National Governors Association.
Robert F. Gartland (1951)
Year of Election or Appointment: 2010
Trustee
Mr. Gartland also serves as Trustee of other Fidelity® funds. Mr. Gartland is Chairman and an investor in Gartland & Mellina Group Corp. (consulting, 2009-present). Previously, Mr. Gartland served as a partner and investor of Vietnam Partners LLC (investments and consulting, 2008-2011). Prior to his retirement, Mr. Gartland held a variety of positions at Morgan Stanley (financial services, 1979-2007), including Managing Director (1987-2007), and Chase Manhattan Bank (1975-1978).
Arthur E. Johnson (1947)
Year of Election or Appointment: 2008
Trustee
Chairman of the Independent Trustees
Mr. Johnson also serves as Trustee of other Fidelity® funds. Mr. Johnson serves as a member of the Board of Directors of Eaton Corporation plc (diversified power management, 2009-present) and Booz Allen Hamilton (management consulting, 2011-present). Prior to his retirement, Mr. Johnson served as Senior Vice President of Corporate Strategic Development of Lockheed Martin Corporation (defense contractor, 1999-2009). Mr. Johnson previously served as Vice Chairman (2015-2018) of the Independent Trustees of certain Fidelity® funds and on the Board of Directors of IKON Office Solutions, Inc. (1999-2008), AGL Resources, Inc. (holding company, 2002-2016), and Delta Airlines (2005-2007). Mr. Arthur E. Johnson is not related to Ms. Abigail P. Johnson.
Michael E. Kenneally (1954)
Year of Election or Appointment: 2009
Trustee
Vice Chairman of the Independent Trustees
Mr. Kenneally also serves as Trustee of other Fidelity® funds. Prior to his retirement, Mr. Kenneally served as Chairman and Global Chief Executive Officer of Credit Suisse Asset Management. Before joining Credit Suisse, he was an Executive Vice President and Chief Investment Officer for Bank of America Corporation. Earlier roles at Bank of America included Director of Research, Senior Portfolio Manager and Research Analyst, and Mr. Kenneally was awarded the Chartered Financial Analyst (CFA) designation in 1991.
Marie L. Knowles (1946)
Year of Election or Appointment: 2001
Trustee
Ms. Knowles also serves as Trustee of other Fidelity® funds. Prior to Ms. Knowles' retirement in June 2000, she served as Executive Vice President and Chief Financial Officer of Atlantic Richfield Company (ARCO) (diversified energy, 1996-2000). From 1993 to 1996, she was a Senior Vice President of ARCO and President of ARCO Transportation Company (pipeline and tanker operations). Ms. Knowles currently serves as a Director and Chairman of the Audit Committee of McKesson Corporation (healthcare service, since 2002). Ms. Knowles is a member of the Board of the Santa Catalina Island Company (real estate, 2009-present). Ms. Knowles is a Member of the Investment Company Institute Board of Governors and a Member of the Governing Council of the Independent Directors Council (2014-present). She also serves as a member of the Advisory Board for the School of Engineering of the University of Southern California. Previously, Ms. Knowles served as a Director of Phelps Dodge Corporation (copper mining and manufacturing, 1994-2007), URS Corporation (engineering and construction, 2000-2003) and America West (airline, 1999-2002). Ms. Knowles previously served as Chairman (2015-2018) and Vice Chairman (2012-2015) of the Independent Trustees of certain Fidelity® funds.
Mark A. Murray (1954)
Year of Election or Appointment: 2016
Trustee
Mr. Murray also serves as Trustee of other Fidelity® funds. Mr. Murray is Vice Chairman (2013-present) of Meijer, Inc. (regional retail chain). Previously, Mr. Murray served as a Member of the Advisory Board of certain Fidelity® funds (2016) and as Co-Chief Executive Officer (2013-2016) and President (2006-2013) of Meijer, Inc. Mr. Murray serves as a member of the Board of Directors and Nuclear Review and Public Policy and Responsibility Committees of DTE Energy Company (diversified energy company, 2009-present). Mr. Murray also serves as a member of the Board of Directors of Spectrum Health (not-for-profit health system, 2015-present). Mr. Murray previously served as President of Grand Valley State University (2001-2006), Treasurer for the State of Michigan (1999-2001), Vice President of Finance and Administration for Michigan State University (1998-1999), and a member of the Board of Directors and Audit Committee and Chairman of the Nominating and Corporate Governance Committee of Universal Forest Products, Inc. (manufacturer and distributor of wood and wood-alternative products, 2004-2016). Mr. Murray is also a director or trustee of many community and professional organizations.
+ The information includes the Trustee's principal occupation during the last five years and other information relating to the experience, attributes, and skills relevant to the Trustee's qualifications to serve as a Trustee, which led to the conclusion that the Trustee should serve as a Trustee for each fund.
Advisory Board Members and Officers:
Correspondence intended for an officer may be sent to Fidelity Investments, 245 Summer Street, Boston, Massachusetts 02210. Officers appear below in alphabetical order.
Name, Year of Birth; Principal Occupation
Elizabeth Paige Baumann (1968)
Year of Election or Appointment: 2017
Anti-Money Laundering (AML) Officer
Ms. Baumann also serves as AML Officer of other funds. She is Chief AML Officer (2012-present) and Senior Vice President (2014-present) of FMR LLC (diversified financial services company) and is an employee of Fidelity Investments. Previously, Ms. Baumann served as AML Officer of the funds (2012-2016), and Vice President (2007-2014) and Deputy Anti-Money Laundering Officer (2007-2012) of FMR LLC.
Craig S. Brown (1977)
Year of Election or Appointment: 2019
Assistant Treasurer
Mr. Brown also serves as Assistant Treasurer of other funds. Mr. Brown is an employee of Fidelity Investments (2013-present).
John J. Burke III (1964)
Year of Election or Appointment: 2018
Chief Financial Officer
Mr. Burke also serves as Chief Financial Officer of other funds. Mr. Burke serves as Head of Investment Operations for Fidelity Fund and Investment Operations (2018-present) and is an employee of Fidelity Investments (1998-present). Previously Mr. Burke served as head of Asset Management Investment Operations (2012-2018).
William C. Coffey (1969)
Year of Election or Appointment: 2018
Secretary and Chief Legal Officer (CLO)
Mr. Coffey also serves as Secretary and CLO of other funds. Mr. Coffey serves as CLO, Secretary, and Senior Vice President of Fidelity Management & Research Company and FMR Co., Inc. (investment adviser firms, 2018-present); Secretary of Fidelity SelectCo, LLC and Fidelity Investments Money Management, Inc. (investment adviser firms, 2018-present); and CLO of Fidelity Management & Research (Hong Kong) Limited, FMR Investment Management (UK) Limited, and Fidelity Management & Research (Japan) Limited (investment adviser firms, 2018-present). He is Senior Vice President and Deputy General Counsel of FMR LLC (diversified financial services company, 2010-present), and is an employee of Fidelity Investments. Previously, Mr. Coffey served as Assistant Secretary of certain funds (2009-2018) and as Vice President and Associate General Counsel of FMR LLC (2005-2009).
Jonathan Davis (1968)
Year of Election or Appointment: 2010
Assistant Treasurer
Mr. Davis also serves as Assistant Treasurer of other funds. Mr. Davis serves as Assistant Treasurer of FMR Capital, Inc. (2017-present) and is an employee of Fidelity Investments. Previously, Mr. Davis served as Vice President and Associate General Counsel of FMR LLC (diversified financial services company, 2003-2010).
Adrien E. Deberghes (1967)
Year of Election or Appointment: 2010
Assistant Treasurer
Mr. Deberghes also serves as an officer of other funds. He serves as Assistant Treasurer of FMR Capital, Inc. (2017-present), Executive Vice President of Fidelity Investments Money Management, Inc. (FIMM) (investment adviser firm, 2016-present), and is an employee of Fidelity Investments (2008-present). Previously, Mr. Deberghes served as President and Treasurer of certain Fidelity® funds (2013-2018). Prior to joining Fidelity Investments, Mr. Deberghes was Senior Vice President of Mutual Fund Administration at State Street Corporation (2007-2008), Senior Director of Mutual Fund Administration at Investors Bank & Trust (2005-2007), and Director of Finance for Dunkin' Brands (2000-2005). Previously, Mr. Deberghes served in other fund officer roles.
Laura M. Del Prato (1964)
Year of Election or Appointment: 2018
President and Treasurer
Ms. Del Prato also serves as an officer of other funds. Ms. Del Prato is an employee of Fidelity Investments (2017-present). Prior to joining Fidelity Investments, Ms. Del Prato served as a Managing Director and Treasurer of the JPMorgan Mutual Funds (2014-2017). Prior to JPMorgan, Ms. Del Prato served as a partner at Cohen Fund Audit Services (accounting firm, 2012-2013) and KPMG LLP (accounting firm, 2004-2012).
Colm A. Hogan (1973)
Year of Election or Appointment: 2016
Assistant Treasurer
Mr. Hogan also serves as an officer of other funds. Mr. Hogan serves as Assistant Treasurer of FMR Capital, Inc. (2017-present) and is an employee of Fidelity Investments (2005-present). Previously, Mr. Hogan served as Assistant Treasurer of certain Fidelity® funds (2016-2018).
Chris Maher (1972)
Year of Election or Appointment: 2013
Assistant Treasurer
Mr. Maher serves as Assistant Treasurer of other funds. Mr. Maher is Vice President of Valuation Oversight, serves as Assistant Treasurer of FMR Capital, Inc. (2017-present), and is an employee of Fidelity Investments. Previously, Mr. Maher served as Vice President of Asset Management Compliance (2013), Vice President of the Program Management Group of FMR (investment adviser firm, 2010-2013), and Vice President of Valuation Oversight (2008-2010).
John B. McGinty, Jr. (1962)
Year of Election or Appointment: 2016
Chief Compliance Officer
Mr. McGinty also serves as Chief Compliance Officer of other funds. Mr. McGinty is Senior Vice President of Asset Management Compliance for Fidelity Investments and is an employee of Fidelity Investments (2016-present). Mr. McGinty previously served as Vice President, Senior Attorney at Eaton Vance Management (investment management firm, 2015-2016), and prior to Eaton Vance as global CCO for all firm operations and registered investment companies at GMO LLC (investment management firm, 2009-2015). Before joining GMO LLC, Mr. McGinty served as Senior Vice President, Deputy General Counsel for Fidelity Investments (2007-2009).
Jason P. Pogorelec (1975)
Year of Election or Appointment: 2015
Assistant Secretary
Mr. Pogorelec also serves as Assistant Secretary of other funds. Mr. Pogorelec serves as Vice President, Associate General Counsel (2010-present) and is an employee of Fidelity Investments (2006-present).
Nancy D. Prior (1967)
Year of Election or Appointment: 2014
Vice President
Ms. Prior also serves as Vice President of other funds. Ms. Prior serves as President Fixed Income, High Income/Emerging Market Debt and Multi Asset Class Strategies of FIAM LLC (2018-present), President (2016-present) and Director (2014-present) of Fidelity Investments Money Management, Inc. (FIMM) (investment adviser firm), President, Fixed Income (2014-present), and is an employee of Fidelity Investments (2002-present). Previously, Ms. Prior served as Vice Chairman of FIAM LLC (investment adviser firm, 2014-2018), a Director of FMR Investment Management (UK) Limited (investment adviser firm, 2015-2018), President Multi-Asset Class Strategies of FMR's Global Asset Allocation Division (2017-2018), Vice President of Fidelity's Money Market Funds (2012-2014), President, Money Market and Short Duration Bond Group of Fidelity Management & Research (FMR) (investment adviser firm, 2013-2014), President, Money Market Group of FMR (2011-2013), Managing Director of Research (2009-2011), Senior Vice President and Deputy General Counsel (2007-2009), and Assistant Secretary of certain Fidelity® funds (2008-2009).
Stacie M. Smith (1974)
Year of Election or Appointment: 2013
Assistant Treasurer
Ms. Smith also serves as an officer of other funds. Ms. Smith serves as Assistant Treasurer of FMR Capital, Inc. (2017-present), is an employee of Fidelity Investments (2009-present), and has served in other fund officer roles. Prior to joining Fidelity Investments, Ms. Smith served as Senior Audit Manager of Ernst & Young LLP (accounting firm, 1996-2009). Previously, Ms. Smith served as Assistant Treasurer (2013-2018) and Deputy Treasurer (2013-2016) of certain Fidelity® funds.
Marc L. Spector (1972)
Year of Election or Appointment: 2016
Deputy Treasurer
Mr. Spector also serves as an officer of other funds. Mr. Spector serves as Assistant Treasurer of FMR Capital, Inc. (2017-present) and is an employee of Fidelity Investments (2016-present). Prior to joining Fidelity Investments, Mr. Spector served as Director at the Siegfried Group (accounting firm, 2013-2016), and prior to Siegfried Group as audit senior manager at Deloitte & Touche (accounting firm, 2005-2013).
Jim Wegmann (1979)
Year of Election or Appointment: 2019
Assistant Treasurer
Mr. Wegmann also serves as Assistant Treasurer of other funds. Mr. Wegmann is an employee of Fidelity Investments (2011-present).
Shareholder Expense Example
As a shareholder of a Fund, you incur two types of costs: (1) transaction costs, including sales charges (loads) on purchase payments or redemption proceeds, and (2) ongoing costs, including management fees, distribution and/or service (12b-1) fees and other Fund expenses. This Example is intended to help you understand your ongoing costs (in dollars) of investing in the Funds and to compare these costs with the ongoing costs of investing in other mutual funds.
The Example is based on an investment of $1,000 invested at the beginning of the period and held for the entire period (October 1, 2018 to March 31, 2019).
Actual Expenses
The first line of the accompanying table for each Class of each fund provides information about actual account values and actual expenses. You may use the information in this line, together with the amount you invested, to estimate the expenses that you paid over the period. Simply divide your account value by $1,000.00 (for example, an $8,600 account value divided by $1,000.00 = 8.6), then multiply the result by the number in the first line for a Class of the fund under the heading entitled "Expenses Paid During Period" to estimate the expenses you paid on your account during this period. In addition, each Fund, as a shareholder in underlying Fidelity Funds, will indirectly bear its pro-rata share of the fees and expenses incurred by the underlying Fidelity Funds. These fees and expenses are not included in each Fund's annualized expense ratio used to calculate the expense estimates in the table below.
Hypothetical Example for Comparison Purposes
The second line of the accompanying table for each Class of each fund provides information about hypothetical account values and hypothetical expenses based on a Class' actual expense ratio and an assumed rate of return of 5% per year before expenses, which is not the Class' actual return. The hypothetical account values and expenses may not be used to estimate the actual ending account balance or expenses you paid for the period. You may use this information to compare the ongoing costs of investing in the Fund and other funds. To do so, compare this 5% hypothetical example with the 5% hypothetical examples that appear in the shareholder reports of the other funds. In addition, each Fund, as a shareholder in underlying Fidelity Funds, will indirectly bear its pro-rata share of the fees and expenses incurred by the underlying Fidelity Funds. These fees and expenses are not included in each Fund's annualized expense ratio used to calculate the expense estimates in the table below.
Please note that the expenses shown in the table are meant to highlight your ongoing costs only and do not reflect any transaction costs. Therefore, the second line of the table is useful in comparing ongoing costs only, and will not help you determine the relative total costs of owning different funds. In addition, if these transactional costs were included, your costs would have been higher.
| | Annualized Expense Ratio-A | Beginning
Account Value
October 1, 2018 | Ending
Account Value
March 31, 2019 | Expenses Paid
During Period-B
October 1, 2018
to March 31, 2019 |
| Fidelity Freedom Blend Income Fund | | | | |
| Class A | .71% | | | |
| Actual | | $1,000.00 | $1,022.20 | $3.58 |
| Hypothetical-C | | $1,000.00 | $1,021.39 | $3.58 |
| Class M | .96% | | | |
| Actual | | $1,000.00 | $1,021.70 | $4.84 |
| Hypothetical-C | | $1,000.00 | $1,020.14 | $4.84 |
| Class C | 1.47% | | | |
| Actual | | $1,000.00 | $1,018.60 | $7.40 |
| Hypothetical-C | | $1,000.00 | $1,017.60 | $7.39 |
| Fidelity Freedom Blend Income Fund | .46% | | | |
| Actual | | $1,000.00 | $1,023.50 | $2.32 |
| Hypothetical-C | | $1,000.00 | $1,022.64 | $2.32 |
| Class K | .36% | | | |
| Actual | | $1,000.00 | $1,025.10 | $1.82 |
| Hypothetical-C | | $1,000.00 | $1,023.14 | $1.82 |
| Class K6 | .27% | | | |
| Actual | | $1,000.00 | $1,025.50 | $1.36 |
| Hypothetical-C | | $1,000.00 | $1,023.59 | $1.36 |
| Class I | .46% | | | |
| Actual | | $1,000.00 | $1,024.40 | $2.32 |
| Hypothetical-C | | $1,000.00 | $1,022.64 | $2.32 |
| Class Z | .36% | | | |
| Actual | | $1,000.00 | $1,025.10 | $1.82 |
| Hypothetical-C | | $1,000.00 | $1,023.14 | $1.82 |
| Class Z6 | .26% | | | |
| Actual | | $1,000.00 | $1,025.40 | $1.31 |
| Hypothetical-C | | $1,000.00 | $1,023.64 | $1.31 |
| Fidelity Freedom Blend 2005 Fund | | | | |
| Class A | .71% | | | |
| Actual | | $1,000.00 | $1,019.20 | $3.57 |
| Hypothetical-C | | $1,000.00 | $1,021.39 | $3.58 |
| Class M | .96% | | | |
| Actual | | $1,000.00 | $1,017.30 | $4.83 |
| Hypothetical-C | | $1,000.00 | $1,020.14 | $4.84 |
| Class C | 1.46% | | | |
| Actual | | $1,000.00 | $1,015.50 | $7.34 |
| Hypothetical-C | | $1,000.00 | $1,017.65 | $7.34 |
| Fidelity Freedom Blend 2005 Fund | .46% | | | |
| Actual | | $1,000.00 | $1,021.00 | $2.32 |
| Hypothetical-C | | $1,000.00 | $1,022.64 | $2.32 |
| Class K | .36% | | | |
| Actual | | $1,000.00 | $1,021.40 | $1.81 |
| Hypothetical-C | | $1,000.00 | $1,023.14 | $1.82 |
| Class K6 | .27% | | | |
| Actual | | $1,000.00 | $1,021.70 | $1.36 |
| Hypothetical-C | | $1,000.00 | $1,023.59 | $1.36 |
| Class I | .46% | | | |
| Actual | | $1,000.00 | $1,021.00 | $2.32 |
| Hypothetical-C | | $1,000.00 | $1,022.64 | $2.32 |
| Class Z | .36% | | | |
| Actual | | $1,000.00 | $1,021.40 | $1.81 |
| Hypothetical-C | | $1,000.00 | $1,023.14 | $1.82 |
| Class Z6 | .26% | | | |
| Actual | | $1,000.00 | $1,021.70 | $1.31 |
| Hypothetical-C | | $1,000.00 | $1,023.64 | $1.31 |
| Fidelity Freedom Blend 2010 Fund | | | | |
| Class A | .72% | | | |
| Actual | | $1,000.00 | $1,015.40 | $3.62 |
| Hypothetical-C | | $1,000.00 | $1,021.34 | $3.63 |
| Class M | .97% | | | |
| Actual | | $1,000.00 | $1,013.30 | $4.87 |
| Hypothetical-C | | $1,000.00 | $1,020.09 | $4.89 |
| Class C | 1.47% | | | |
| Actual | | $1,000.00 | $1,011.10 | $7.37 |
| Hypothetical-C | | $1,000.00 | $1,017.60 | $7.39 |
| Fidelity Freedom Blend 2010 Fund | .47% | | | |
| Actual | | $1,000.00 | $1,015.70 | $2.36 |
| Hypothetical-C | | $1,000.00 | $1,022.59 | $2.37 |
| Class K | .37% | | | |
| Actual | | $1,000.00 | $1,015.80 | $1.86 |
| Hypothetical-C | | $1,000.00 | $1,023.09 | $1.87 |
| Class K6 | .28% | | | |
| Actual | | $1,000.00 | $1,017.20 | $1.41 |
| Hypothetical-C | | $1,000.00 | $1,023.54 | $1.41 |
| Class I | .47% | | | |
| Actual | | $1,000.00 | $1,015.50 | $2.36 |
| Hypothetical-C | | $1,000.00 | $1,022.59 | $2.37 |
| Class Z | .37% | | | |
| Actual | | $1,000.00 | $1,015.80 | $1.86 |
| Hypothetical-C | | $1,000.00 | $1,023.09 | $1.87 |
| Class Z6 | .27% | | | |
| Actual | | $1,000.00 | $1,017.20 | $1.36 |
| Hypothetical-C | | $1,000.00 | $1,023.59 | $1.36 |
| Fidelity Freedom Blend 2015 Fund | | | | |
| Class A | .74% | | | |
| Actual | | $1,000.00 | $1,010.60 | $3.71 |
| Hypothetical-C | | $1,000.00 | $1,021.24 | $3.73 |
| Class M | .99% | | | |
| Actual | | $1,000.00 | $1,008.70 | $4.96 |
| Hypothetical-C | | $1,000.00 | $1,020.00 | $4.99 |
| Class C | 1.50% | | | |
| Actual | | $1,000.00 | $1,007.30 | $7.51 |
| Hypothetical-C | | $1,000.00 | $1,017.45 | $7.54 |
| Fidelity Freedom Blend 2015 Fund | .49% | | | |
| Actual | | $1,000.00 | $1,012.20 | $2.46 |
| Hypothetical-C | | $1,000.00 | $1,022.49 | $2.47 |
| Class K | .39% | | | |
| Actual | | $1,000.00 | $1,012.80 | $1.96 |
| Hypothetical-C | | $1,000.00 | $1,022.99 | $1.97 |
| Class K6 | .30% | | | |
| Actual | | $1,000.00 | $1,013.20 | $1.51 |
| Hypothetical-C | | $1,000.00 | $1,023.44 | $1.51 |
| Class I | .49% | | | |
| Actual | | $1,000.00 | $1,012.40 | $2.46 |
| Hypothetical-C | | $1,000.00 | $1,022.49 | $2.47 |
| Class Z | .39% | | | |
| Actual | | $1,000.00 | $1,012.80 | $1.96 |
| Hypothetical-C | | $1,000.00 | $1,022.99 | $1.97 |
| Class Z6 | .29% | | | |
| Actual | | $1,000.00 | $1,013.20 | $1.46 |
| Hypothetical-C | | $1,000.00 | $1,023.49 | $1.46 |
| Fidelity Freedom Blend 2020 Fund | | | | |
| Class A | .77% | | | |
| Actual | | $1,000.00 | $1,007.50 | $3.85 |
| Hypothetical-C | | $1,000.00 | $1,021.09 | $3.88 |
| Class M | 1.00% | | | |
| Actual | | $1,000.00 | $1,005.30 | $5.00 |
| Hypothetical-C | | $1,000.00 | $1,019.95 | $5.04 |
| Class C | 1.52% | | | |
| Actual | | $1,000.00 | $1,002.80 | $7.59 |
| Hypothetical-C | | $1,000.00 | $1,017.35 | $7.64 |
| Fidelity Freedom Blend 2020 Fund | .50% | | | |
| Actual | | $1,000.00 | $1,008.30 | $2.50 |
| Hypothetical-C | | $1,000.00 | $1,022.44 | $2.52 |
| Class K | .40% | | | |
| Actual | | $1,000.00 | $1,008.40 | $2.00 |
| Hypothetical-C | | $1,000.00 | $1,022.94 | $2.02 |
| Class K6 | .31% | | | |
| Actual | | $1,000.00 | $1,008.70 | $1.55 |
| Hypothetical-C | | $1,000.00 | $1,023.39 | $1.56 |
| Class I | .50% | | | |
| Actual | | $1,000.00 | $1,008.90 | $2.50 |
| Hypothetical-C | | $1,000.00 | $1,022.44 | $2.52 |
| Class Z | .40% | | | |
| Actual | | $1,000.00 | $1,008.40 | $2.00 |
| Hypothetical-C | | $1,000.00 | $1,022.94 | $2.02 |
| Class Z6 | .30% | | | |
| Actual | | $1,000.00 | $1,008.70 | $1.50 |
| Hypothetical-C | | $1,000.00 | $1,023.44 | $1.51 |
| Fidelity Freedom Blend 2025 Fund | | | | |
| Class A | .76% | | | |
| Actual | | $1,000.00 | $1,004.90 | $3.80 |
| Hypothetical-C | | $1,000.00 | $1,021.14 | $3.83 |
| Class M | 1.02% | | | |
| Actual | | $1,000.00 | $1,003.60 | $5.10 |
| Hypothetical-C | | $1,000.00 | $1,019.85 | $5.14 |
| Class C | 1.51% | | | |
| Actual | | $1,000.00 | $1,000.80 | $7.53 |
| Hypothetical-C | | $1,000.00 | $1,017.40 | $7.59 |
| Fidelity Freedom Blend 2025 Fund | .52% | | | |
| Actual | | $1,000.00 | $1,005.20 | $2.60 |
| Hypothetical-C | | $1,000.00 | $1,022.34 | $2.62�� |
| Class K | .41% | | | |
| Actual | | $1,000.00 | $1,005.70 | $2.05 |
| Hypothetical-C | | $1,000.00 | $1,022.89 | $2.07 |
| Class K6 | .32% | | | |
| Actual | | $1,000.00 | $1,007.00 | $1.60 |
| Hypothetical-C | | $1,000.00 | $1,023.34 | $1.61 |
| Class I | .51% | | | |
| Actual | | $1,000.00 | $1,005.30 | $2.55 |
| Hypothetical-C | | $1,000.00 | $1,022.39 | $2.57 |
| Class Z | .41% | | | |
| Actual | | $1,000.00 | $1,005.70 | $2.05 |
| Hypothetical-C | | $1,000.00 | $1,022.89 | $2.07 |
| Class Z6 | .31% | | | |
| Actual | | $1,000.00 | $1,007.00 | $1.55 |
| Hypothetical-C | | $1,000.00 | $1,023.39 | $1.56 |
| Fidelity Freedom Blend 2030 Fund | | | | |
| Class A | .78% | | | |
| Actual | | $1,000.00 | $996.50 | $3.88 |
| Hypothetical-C | | $1,000.00 | $1,021.04 | $3.93 |
| Class M | 1.02% | | | |
| Actual | | $1,000.00 | $995.40 | $5.07 |
| Hypothetical-C | | $1,000.00 | $1,019.85 | $5.14 |
| Class C | 1.52% | | | |
| Actual | | $1,000.00 | $993.90 | $7.56 |
| Hypothetical-C | | $1,000.00 | $1,017.35 | $7.64 |
| Fidelity Freedom Blend 2030 Fund | .53% | | | |
| Actual | | $1,000.00 | $998.40 | $2.64 |
| Hypothetical-C | | $1,000.00 | $1,022.29 | $2.67 |
| Class K | .42% | | | |
| Actual | | $1,000.00 | $999.50 | $2.09 |
| Hypothetical-C | | $1,000.00 | $1,022.84 | $2.12 |
| Class K6 | .33% | | | |
| Actual | | $1,000.00 | $998.90 | $1.64 |
| Hypothetical-C | | $1,000.00 | $1,023.29 | $1.66 |
| Class I | .52% | | | |
| Actual | | $1,000.00 | $998.10 | $2.59 |
| Hypothetical-C | | $1,000.00 | $1,022.34 | $2.62 |
| Class Z | .42% | | | |
| Actual | | $1,000.00 | $999.50 | $2.09 |
| Hypothetical-C | | $1,000.00 | $1,022.84 | $2.12 |
| Class Z6 | .32% | | | |
| Actual | | $1,000.00 | $998.90 | $1.59 |
| Hypothetical-C | | $1,000.00 | $1,023.34 | $1.61 |
| Fidelity Freedom Blend 2035 Fund | | | | |
| Class A | .79% | | | |
| Actual | | $1,000.00 | $988.20 | $3.92 |
| Hypothetical-C | | $1,000.00 | $1,020.99 | $3.98 |
| Class M | 1.04% | | | |
| Actual | | $1,000.00 | $987.00 | $5.15 |
| Hypothetical-C | | $1,000.00 | $1,019.75 | $5.24 |
| Class C | 1.54% | | | |
| Actual | | $1,000.00 | $985.40 | $7.62 |
| Hypothetical-C | | $1,000.00 | $1,017.25 | $7.75 |
| Fidelity Freedom Blend 2035 Fund | .53% | | | |
| Actual | | $1,000.00 | $990.40 | $2.63 |
| Hypothetical-C | | $1,000.00 | $1,022.29 | $2.67 |
| Class K | .43% | | | |
| Actual | | $1,000.00 | $990.30 | $2.13 |
| Hypothetical-C | | $1,000.00 | $1,022.79 | $2.17 |
| Class K6 | .34% | | | |
| Actual | | $1,000.00 | $990.70 | $1.69 |
| Hypothetical-C | | $1,000.00 | $1,023.24 | $1.72 |
| Class I | .53% | | | |
| Actual | | $1,000.00 | $989.90 | $2.63 |
| Hypothetical-C | | $1,000.00 | $1,022.29 | $2.67 |
| Class Z | .43% | | | |
| Actual | | $1,000.00 | $990.30 | $2.13 |
| Hypothetical-C | | $1,000.00 | $1,022.79 | $2.17 |
| Class Z6 | .33% | | | |
| Actual | | $1,000.00 | $991.70 | $1.64 |
| Hypothetical-C | | $1,000.00 | $1,023.29 | $1.66 |
| Fidelity Freedom Blend 2040 Fund | | | | |
| Class A | .80% | | | |
| Actual | | $1,000.00 | $985.10 | $3.96 |
| Hypothetical-C | | $1,000.00 | $1,020.94 | $4.03 |
| Class M | 1.04% | | | |
| Actual | | $1,000.00 | $983.20 | $5.14 |
| Hypothetical-C | | $1,000.00 | $1,019.75 | $5.24 |
| Class C | 1.55% | | | |
| Actual | | $1,000.00 | $981.20 | $7.66 |
| Hypothetical-C | | $1,000.00 | $1,017.20 | $7.80 |
| Fidelity Freedom Blend 2040 Fund | .54% | | | |
| Actual | | $1,000.00 | $985.50 | $2.67 |
| Hypothetical-C | | $1,000.00 | $1,022.24 | $2.72 |
| Class K | .44% | | | |
| Actual | | $1,000.00 | $987.10 | $2.18 |
| Hypothetical-C | | $1,000.00 | $1,022.74 | $2.22 |
| Class K6 | .35% | | | |
| Actual | | $1,000.00 | $987.60 | $1.73 |
| Hypothetical-C | | $1,000.00 | $1,023.19 | $1.77 |
| Class I | .54% | | | |
| Actual | | $1,000.00 | $985.80 | $2.67 |
| Hypothetical-C | | $1,000.00 | $1,022.24 | $2.72 |
| Class Z | .44% | | | |
| Actual | | $1,000.00 | $987.10 | $2.18 |
| Hypothetical-C | | $1,000.00 | $1,022.74 | $2.22 |
| Class Z6 | .34% | | | |
| Actual | | $1,000.00 | $987.60 | $1.68 |
| Hypothetical-C | | $1,000.00 | $1,023.24 | $1.72 |
| Fidelity Freedom Blend 2045 Fund | | | | |
| Class A | .79% | | | |
| Actual | | $1,000.00 | $983.40 | $3.91 |
| Hypothetical-C | | $1,000.00 | $1,020.99 | $3.98 |
| Class M | 1.04% | | | |
| Actual | | $1,000.00 | $982.20 | $5.14 |
| Hypothetical-C | | $1,000.00 | $1,019.75 | $5.24 |
| Class C | 1.55% | | | |
| Actual | | $1,000.00 | $980.90 | $7.65 |
| Hypothetical-C | | $1,000.00 | $1,017.20 | $7.80 |
| Fidelity Freedom Blend 2045 Fund | .55% | | | |
| Actual | | $1,000.00 | $985.90 | $2.72 |
| Hypothetical-C | | $1,000.00 | $1,022.19 | $2.77 |
| Class K | .44% | | | |
| Actual | | $1,000.00 | $985.50 | $2.18 |
| Hypothetical-C | | $1,000.00 | $1,022.74 | $2.22 |
| Class K6 | .35% | | | |
| Actual | | $1,000.00 | $986.90 | $1.73 |
| Hypothetical-C | | $1,000.00 | $1,023.19 | $1.77 |
| Class I | .54% | | | |
| Actual | | $1,000.00 | $985.20 | $2.67 |
| Hypothetical-C | | $1,000.00 | $1,022.24 | $2.72 |
| Class Z | .44% | | | |
| Actual | | $1,000.00 | $985.50 | $2.18 |
| Hypothetical-C | | $1,000.00 | $1,022.74 | $2.22 |
| Class Z6 | .34% | | | |
| Actual | | $1,000.00 | $986.90 | $1.68 |
| Hypothetical-C | | $1,000.00 | $1,023.24 | $1.72 |
| Fidelity Freedom Blend 2050 Fund | | | | |
| Class A | .80% | | | |
| Actual | | $1,000.00 | $984.00 | $3.96 |
| Hypothetical-C | | $1,000.00 | $1,020.94 | $4.03 |
| Class M | 1.04% | | | |
| Actual | | $1,000.00 | $983.00 | $5.14 |
| Hypothetical-C | | $1,000.00 | $1,019.75 | $5.24 |
| Class C | 1.53% | | | |
| Actual | | $1,000.00 | $981.10 | $7.56 |
| Hypothetical-C | | $1,000.00 | $1,017.30 | $7.70 |
| Fidelity Freedom Blend 2050 Fund | .54% | | | |
| Actual | | $1,000.00 | $985.10 | $2.67 |
| Hypothetical-C | | $1,000.00 | $1,022.24 | $2.72 |
| Class K | .44% | | | |
| Actual | | $1,000.00 | $986.20 | $2.18 |
| Hypothetical-C | | $1,000.00 | $1,022.74 | $2.22 |
| Class K6 | .35% | | | |
| Actual | | $1,000.00 | $986.50 | $1.73 |
| Hypothetical-C | | $1,000.00 | $1,023.19 | $1.77 |
| Class I | .54% | | | |
| Actual | | $1,000.00 | $985.80 | $2.67 |
| Hypothetical-C | | $1,000.00 | $1,022.24 | $2.72 |
| Class Z | .44% | | | |
| Actual | | $1,000.00 | $986.20 | $2.18 |
| Hypothetical-C | | $1,000.00 | $1,022.74 | $2.22 |
| Class Z6 | .34% | | | |
| Actual | | $1,000.00 | $986.50 | $1.68 |
| Hypothetical-C | | $1,000.00 | $1,023.24 | $1.72 |
| Fidelity Freedom Blend 2055 Fund | | | | |
| Class A | .79% | | | |
| Actual | | $1,000.00 | $984.50 | $3.91 |
| Hypothetical-C | | $1,000.00 | $1,020.99 | $3.98 |
| Class M | 1.04% | | | |
| Actual | | $1,000.00 | $983.60 | $5.14 |
| Hypothetical-C | | $1,000.00 | $1,019.75 | $5.24 |
| Class C | 1.54% | | | |
| Actual | | $1,000.00 | $980.70 | $7.60 |
| Hypothetical-C | | $1,000.00 | $1,017.25 | $7.75 |
| Fidelity Freedom Blend 2055 Fund | .54% | | | |
| Actual | | $1,000.00 | $985.50 | $2.67 |
| Hypothetical-C | | $1,000.00 | $1,022.24 | $2.72 |
| Class K | .44% | | | |
| Actual | | $1,000.00 | $986.70 | $2.18 |
| Hypothetical-C | | $1,000.00 | $1,022.74 | $2.22 |
| Class K6 | .35% | | | |
| Actual | | $1,000.00 | $987.10 | $1.73 |
| Hypothetical-C | | $1,000.00 | $1,023.19 | $1.77 |
| Class I | .54% | | | |
| Actual | | $1,000.00 | $986.30 | $2.67 |
| Hypothetical-C | | $1,000.00 | $1,022.24 | $2.72 |
| Class Z | .44% | | | |
| Actual | | $1,000.00 | $986.70 | $2.18 |
| Hypothetical-C | | $1,000.00 | $1,022.74 | $2.22 |
| Class Z6 | .34% | | | |
| Actual | | $1,000.00 | $987.10 | $1.68 |
| Hypothetical-C | | $1,000.00 | $1,023.24 | $1.72 |
| Fidelity Freedom Blend 2060 Fund | | | | |
| Class A | .80% | | | |
| Actual | | $1,000.00 | $984.00 | $3.96 |
| Hypothetical-C | | $1,000.00 | $1,020.94 | $4.03 |
| Class M | 1.04% | | | |
| Actual | | $1,000.00 | $983.10 | $5.14 |
| Hypothetical-C | | $1,000.00 | $1,019.75 | $5.24 |
| Class C | 1.54% | | | |
| Actual | | $1,000.00 | $981.30 | $7.61 |
| Hypothetical-C | | $1,000.00 | $1,017.25 | $7.75 |
| Fidelity Freedom Blend 2060 Fund | .55% | | | |
| Actual | | $1,000.00 | $986.40 | $2.72 |
| Hypothetical-C | | $1,000.00 | $1,022.19 | $2.77 |
| Class K | .44% | | | |
| Actual | | $1,000.00 | $986.20 | $2.18 |
| Hypothetical-C | | $1,000.00 | $1,022.74 | $2.22 |
| Class K6 | .34% | | | |
| Actual | | $1,000.00 | $986.60 | $1.68 |
| Hypothetical-C | | $1,000.00 | $1,023.24 | $1.72 |
| Class I | .54% | | | |
| Actual | | $1,000.00 | $985.90 | $2.67 |
| Hypothetical-C | | $1,000.00 | $1,022.24 | $2.72 |
| Class Z | .44% | | | |
| Actual | | $1,000.00 | $986.20 | $2.18 |
| Hypothetical-C | | $1,000.00 | $1,022.74 | $2.22 |
| Class Z6 | .34% | | | |
| Actual | | $1,000.00 | $986.60 | $1.68 |
| Hypothetical-C | | $1,000.00 | $1,023.24 | $1.72 |
A Annualized expense ratio reflects expenses net of applicable fee waivers.
B Expenses are equal to each Class' annualized expense ratio, multiplied by the average account value over the period, multiplied by 182/ 365 (to reflect the one-half year period).
C 5% return per year before expenses
Distributions (Unaudited)
The Board of Trustees of each fund voted to pay to shareholders of record at the opening of business on record date, the following distributions per share derived from capital gains realized from sales of portfolio securities and dividends derived from net investment income:
| | Pay Date | Record Date | Dividends | Capital Gains |
| Fidelity Freedom Blend Income Fund | | | | |
| Class A | 05/06/19 | 05/03/19 | $0.005 | $0.004 |
| Class M | 05/06/19 | 05/03/19 | $0.003 | $0.004 |
| Class C | 05/06/19 | 05/03/19 | $0.000 | $0.004 |
| Fidelity Freedom Blend Income Fund | 05/06/19 | 05/03/19 | $0.007 | $0.004 |
| Class K | 05/06/19 | 05/03/19 | $0.008 | $0.004 |
| Class K6 | 05/06/19 | 05/03/19 | $0.009 | $0.004 |
| Class I | 05/06/19 | 05/03/19 | $0.007 | $0.004 |
| Class Z | 05/06/19 | 05/03/19 | $0.008 | $0.004 |
| Class Z6 | 05/06/19 | 05/03/19 | $0.008 | $0.004 |
| Fidelity Freedom Blend 2005 Fund | | | | |
| Class A | 05/13/19 | 05/10/19 | $0.000 | $0.004 |
| Class M | 05/13/19 | 05/10/19 | $0.000 | $0.004 |
| Class C | 05/13/19 | 05/10/19 | $0.000 | $0.004 |
| Fidelity Freedom Blend 2005 Fund | 05/13/19 | 05/10/19 | $0.007 | $0.008 |
| Class K | 05/13/19 | 05/10/19 | $0.000 | $0.007 |
| Class K6 | 05/13/19 | 05/10/18 | $0.007 | $0.008 |
| Class I | 05/13/19 | 05/10/18 | $0.000 | $0.004 |
| Class Z | 05/13/19 | 05/10/18 | $0.000 | $0.007 |
| Class Z6 | 05/13/19 | 05/10/18 | $0.001 | $0.008 |
| Fidelity Freedom Blend 2010 Fund | | | | |
| Class A | 05/13/19 | 05/10/19 | $0.000 | $0.000 |
| Class M | 05/13/19 | 05/10/19 | $0.000 | $0.000 |
| Class C | 05/13/19 | 05/10/19 | $0.000 | $0.000 |
| Fidelity Freedom Blend 2010 Fund | 05/13/19 | 05/10/19 | $0.000 | $0.004 |
| Class K | 05/13/19 | 05/10/19 | $0.000 | $0.000 |
| Class K6 | 05/13/19 | 05/10/18 | $0.002 | $0.005 |
| Class I | 05/13/19 | 05/10/18 | $0.000 | $0.000 |
| Class Z | 05/13/19 | 05/10/18 | $0.000 | $0.000 |
| Class Z6 | 05/13/19 | 05/10/18 | $0.000 | $0.000 |
| Fidelity Freedom Blend 2015 Fund | | | | |
| Class A | 05/13/19 | 05/10/19 | $0.000 | $0.000 |
| Class M | 05/13/19 | 05/10/19 | $0.000 | $0.000 |
| Class C | 05/13/19 | 05/10/19 | $0.000 | $0.000 |
| Fidelity Freedom Blend 2015 Fund | 05/13/19 | 05/10/19 | $0.000 | $0.000 |
| Class K | 05/13/19 | 05/10/19 | $0.000 | $0.000 |
| Class K6 | 05/13/19 | 05/10/18 | $0.002 | $0.003 |
| Class I | 05/13/19 | 05/10/18 | $0.000 | $0.000 |
| Class Z | 05/13/19 | 05/10/18 | $0.000 | $0.000 |
| Class Z6 | 05/13/19 | 05/10/18 | $0.000 | $0.000 |
| Fidelity Freedom Blend 2020 Fund | | | | |
| Class A | 05/13/19 | 05/10/19 | $0.000 | $0.000 |
| Class M | 05/13/19 | 05/10/19 | $0.000 | $0.000 |
| Class C | 05/13/19 | 05/10/19 | $0.000 | $0.000 |
| Fidelity Freedom Blend 2020 Fund | 05/13/19 | 05/10/19 | $0.000 | $0.000 |
| Class K | 05/13/19 | 05/10/19 | $0.000 | $0.000 |
| Class K6 | 05/13/19 | 05/10/18 | $0.001 | $0.004 |
| Class I | 05/13/19 | 05/10/18 | $0.000 | $0.000 |
| Class Z | 05/13/19 | 05/10/18 | $0.000 | $0.000 |
| Class Z6 | 05/13/19 | 05/10/18 | $0.000 | $0.000 |
| Fidelity Freedom Blend 2025 Fund | | | | |
| Class A | 05/13/19 | 05/10/19 | $0.000 | $0.000 |
| Class M | 05/13/19 | 05/10/19 | $0.000 | $0.000 |
| Class C | 05/13/19 | 05/10/19 | $0.000 | $0.000 |
| Fidelity Freedom Blend 2025 Fund | 05/13/19 | 05/10/19 | $0.000 | $0.000 |
| Class K | 05/13/19 | 05/10/19 | $0.000 | $0.000 |
| Class K6 | 05/13/19 | 05/10/18 | $0.001 | $0.003 |
| Class I | 05/13/19 | 05/10/18 | $0.000 | $0.000 |
| Class Z | 05/13/19 | 05/10/18 | $0.000 | $0.000 |
| Class Z6 | 05/13/19 | 05/10/18 | $0.000 | $0.000 |
| Fidelity Freedom Blend 2030 Fund | | | | |
| Class A | 05/13/19 | 05/10/19 | $0.000 | $0.000 |
| Class M | 05/13/19 | 05/10/19 | $0.000 | $0.000 |
| Class C | 05/13/19 | 05/10/19 | $0.000 | $0.000 |
| Fidelity Freedom Blend 2030 Fund | 05/13/19 | 05/10/19 | $0.000 | $0.000 |
| Class K | 05/13/19 | 05/10/19 | $0.000 | $0.000 |
| Class K6 | 05/13/19 | 05/10/18 | $0.000 | $0.003 |
| Class I | 05/13/19 | 05/10/18 | $0.000 | $0.000 |
| Class Z | 05/13/19 | 05/10/18 | $0.000 | $0.000 |
| Class Z6 | 05/13/19 | 05/10/18 | $0.000 | $0.000 |
| Fidelity Freedom Blend 2035 Fund | | | | |
| Class A | 05/13/19 | 05/10/19 | $0.000 | $0.000 |
| Class M | 05/13/19 | 05/10/19 | $0.000 | $0.000 |
| Class C | 05/13/19 | 05/10/19 | $0.000 | $0.000 |
| Fidelity Freedom Blend 2035 Fund | 05/13/19 | 05/10/19 | $0.000 | $0.000 |
| Class K | 05/13/19 | 05/10/19 | $0.000 | $0.000 |
| Class K6 | 05/13/19 | 05/10/18 | $0.000 | $0.003 |
| Class I | 05/13/19 | 05/10/18 | $0.000 | $0.000 |
| Class Z | 05/13/19 | 05/10/18 | $0.000 | $0.000 |
| Class Z6 | 05/13/19 | 05/10/18 | $0.000 | $0.000 |
| Fidelity Freedom Blend 2040 Fund | | | | |
| Class A | 05/13/19 | 05/10/19 | $0.000 | $0.000 |
| Class M | 05/13/19 | 05/10/19 | $0.000 | $0.000 |
| Class C | 05/13/19 | 05/10/19 | $0.000 | $0.000 |
| Fidelity Freedom Blend 2040 Fund | 05/13/19 | 05/10/19 | $0.000 | $0.000 |
| Class K | 05/13/19 | 05/10/19 | $0.000 | $0.000 |
| Class K6 | 05/13/19 | 05/10/18 | $0.000 | $0.003 |
| Class I | 05/13/19 | 05/10/18 | $0.000 | $0.000 |
| Class Z | 05/13/19 | 05/10/18 | $0.000 | $0.000 |
| Class Z6 | 05/13/19 | 05/10/18 | $0.000 | $0.000 |
| Fidelity Freedom Blend 2045 Fund | | | | |
| Class A | 05/13/19 | 05/10/19 | $0.000 | $0.001 |
| Class M | 05/13/19 | 05/10/19 | $0.000 | $0.001 |
| Class C | 05/13/19 | 05/10/19 | $0.000 | $0.001 |
| Fidelity Freedom Blend 2045 Fund | 05/13/19 | 05/10/19 | $0.000 | $0.001 |
| Class K | 05/13/19 | 05/10/19 | $0.000 | $0.001 |
| Class K6 | 05/13/19 | 05/10/18 | $0.000 | $0.003 |
| Class I | 05/13/19 | 05/10/18 | $0.000 | $0.001 |
| Class Z | 05/13/19 | 05/10/18 | $0.000 | $0.001 |
| Class Z6 | 05/13/19 | 05/10/18 | $0.000 | $0.001 |
| Fidelity Freedom Blend 2050 Fund | | | | |
| Class A | 05/13/19 | 05/10/19 | $0.000 | $0.001 |
| Class M | 05/13/19 | 05/10/19 | $0.000 | $0.001 |
| Class C | 05/13/19 | 05/10/19 | $0.000 | $0.001 |
| Fidelity Freedom Blend 2050 Fund | 05/13/19 | 05/10/19 | $0.000 | $0.001 |
| Class K | 05/13/19 | 05/10/19 | $0.000 | $0.001 |
| Class K6 | 05/13/19 | 05/10/18 | $0.000 | $0.003 |
| Class I | 05/13/19 | 05/10/18 | $0.000 | $0.001 |
| Class Z | 05/13/19 | 05/10/18 | $0.000 | $0.001 |
| Class Z6 | 05/13/19 | 05/10/18 | $0.000 | $0.001 |
| Fidelity Freedom Blend 2055 Fund | | | | |
| Class A | 05/13/19 | 05/10/19 | $0.000 | $0.002 |
| Class M | 05/13/19 | 05/10/19 | $0.000 | $0.002 |
| Class C | 05/13/19 | 05/10/19 | $0.000 | $0.002 |
| Fidelity Freedom Blend 2055 Fund | 05/13/19 | 05/10/19 | $0.000 | $0.002 |
| Class K | 05/13/19 | 05/10/19 | $0.000 | $0.002 |
| Class K6 | 05/13/19 | 05/10/18 | $0.000 | $0.004 |
| Class I | 05/13/19 | 05/10/18 | $0.000 | $0.002 |
| Class Z | 05/13/19 | 05/10/18 | $0.000 | $0.002 |
| Class Z6 | 05/13/19 | 05/10/18 | $0.000 | $0.002 |
| Fidelity Freedom Blend 2060 Fund | | | | |
| Class A | 05/13/19 | 05/10/19 | $0.000 | $0.011 |
| Class M | 05/13/19 | 05/10/19 | $0.000 | $0.011 |
| Class C | 05/13/19 | 05/10/19 | $0.000 | $0.011 |
| Fidelity Freedom Blend 2060 Fund | 05/13/19 | 05/10/19 | $0.000 | $0.011 |
| Class K | 05/13/19 | 05/10/19 | $0.000 | $0.011 |
| Class K6 | 05/13/19 | 05/10/18 | $0.000 | $0.014 |
| Class I | 05/13/19 | 05/10/18 | $0.000 | $0.011 |
| Class Z | 05/13/19 | 05/10/18 | $0.000 | $0.011 |
| Class Z6 | 05/13/19 | 05/10/18 | $0.000 | $0.011 |
|
The funds hereby designate as capital gain dividend the amounts noted below for the taxable year ended March 31, 2019, or, if subsequently determined to be different, the net capital gain of such year.
| Fidelity Freedom Blend Income Fund | $5,883 |
| Fidelity Freedom Blend 2005 Fund | $7,686 |
| Fidelity Freedom Blend 2010 Fund | $4,296 |
| Fidelity Freedom Blend 2015 Fund | $6,801 |
| Fidelity Freedom Blend 2020 Fund | $10,701 |
| Fidelity Freedom Blend 2025 Fund | $20,683 |
| Fidelity Freedom Blend 2030 Fund | $17,555 |
| Fidelity Freedom Blend 2035 Fund | $29,604 |
| Fidelity Freedom Blend 2040 Fund | $22,577 |
| Fidelity Freedom Blend 2045 Fund | $41,767 |
| Fidelity Freedom Blend 2050 Fund | $30,493 |
| Fidelity Freedom Blend 2055 Fund | $27,293 |
| Fidelity Freedom Blend 2060 Fund | $32,846 |
|
A percentage of the dividends distributed during the fiscal year for the following funds were derived from interest on U.S. Government securities which is generally exempt from state income tax:
| | |
| Fidelity Freedom Blend Income Fund | 32.55% |
| Fidelity Freedom Blend 2005 Fund | 26.37% |
| Fidelity Freedom Blend 2010 Fund | 21.22% |
| Fidelity Freedom Blend 2015 Fund | 23.28% |
| Fidelity Freedom Blend 2020 Fund | 25.91% |
| Fidelity Freedom Blend 2025 Fund | 25.54% |
| Fidelity Freedom Blend 2030 Fund | 18.03% |
| Fidelity Freedom Blend 2035 Fund | 11.67% |
| Fidelity Freedom Blend 2040 Fund | 6.67% |
| Fidelity Freedom Blend 2045 Fund | 4.11% |
| Fidelity Freedom Blend 2050 Fund | 4.98% |
| Fidelity Freedom Blend 2055 Fund | 3.93% |
| Fidelity Freedom Blend 2060 Fund | 2.90% |
|
A percentage of the dividends distributed during the fiscal year for the following funds qualify for the dividends–received deduction for corporate shareholders:
| | Class A | Class M | Class C | Fidelity Freedom Blend Class | Class K | Class K6 | Class I | Class Z | Class Z6 |
| Fidelity Freedom Blend Income Fund | | | | | | | | | |
| October 2018 | 9% | 10% | 12% | 9% | 9% | 9% | 9% | 9% | 9% |
| November 2018 | 13% | 19% | 0% | 8% | 8% | 8% | 8% | 8% | 8% |
| December 2018 | 10% | 10% | 10% | 9% | 9% | 9% | 9% | 9% | 9% |
| February 2019 | 2% | 3% | 7% | 2% | 2% | 2% | 2% | 2% | 2% |
| March 2019 | 2% | 3% | 5% | 2% | 2% | 2% | 2% | 2% | 2% |
| Fidelity Freedom Blend 2005 Fund | | | | | | | | | |
| December 2018 | 13% | 15% | 18% | 13% | 13% | 13% | 13% | 13% | 13% |
| Fidelity Freedom Blend 2010 Fund | | | | | | | | | |
| December 2018 | 19% | 20% | 24% | 18% | 18% | 18% | 18% | 18% | 18% |
| Fidelity Freedom Blend 2015 Fund | | | | | | | | | |
| December 2018 | 25% | 27% | 25% | 22% | 23% | 22% | 23% | 23% | 22% |
| Fidelity Freedom Blend 2020 Fund | | | | | | | | | |
| December 2018 | 27% | 35% | 37% | 25% | 28% | 27% | 29% | 28% | 27% |
| Fidelity Freedom Blend 2025 Fund | | | | | | | | | |
| December 2018 | 31% | 34% | 39% | 29% | 30% | 29% | 30% | 30% | 29% |
| Fidelity Freedom Blend 2030 Fund | | | | | | | | | |
| December 2018 | 34% | 36% | 37% | 32% | 32% | 32% | 33% | 32% | 32% |
| Fidelity Freedom Blend 2035 Fund | | | | | | | | | |
| December 2018 | 38% | 39% | 45% | 36% | 36% | 35% | 37% | 36% | 35% |
| Fidelity Freedom Blend 2040 Fund | | | | | | | | | |
| December 2018 | 38% | 42% | 47% | 37% | 38% | 37% | 38% | 38% | 37% |
| Fidelity Freedom Blend 2045 Fund | | | | | | | | | |
| December 2018 | 41% | 41% | 47% | 38% | 39% | 38% | 39% | 39% | 38% |
| Fidelity Freedom Blend 2050 Fund | | | | | | | | | |
| December 2018 | 39% | 41% | 46% | 37% | 37% | 37% | 38% | 37% | 37% |
| Fidelity Freedom Blend 2055 Fund | | | | | | | | | |
| December 2018 | 39% | 41% | 45% | 37% | 37% | 36% | 38% | 37% | 36% |
| Fidelity Freedom Blend 2060 Fund | | | | | | | | | |
| December 2018 | 40% | 42% | 46% | 37% | 38% | 37% | 38% | 38% | 37% |
|
A percentage of the dividends distributed during the fiscal year for the following funds may be taken into account as a dividend for purposes of the maximum rate under section 1(h)(11) of the Internal Revenue Code.
| | Class A | Class M | Class C | Fidelity Freedom Blend Class | Class K | Class K6 | Class I | Class Z | Class Z6 |
| Fidelity Freedom Blend Income Fund | | | | | | | | | |
| October 2018 | 29% | 32% | 37% | 27% | 27% | 27% | 27% | 27% | 27% |
| November 2018 | 39% | 59% | 0% | 26% | 26% | 26% | 26% | 26% | 26% |
| December 2018 | 30% | 32% | 30% | 28% | 28% | 27% | 29% | 28% | 27% |
| February 2019 | 3% | 3% | 7% | 3% | 2% | 2% | 2% | 2% | 2% |
| March 2019 | 3% | 3% | 5% | 2% | 2% | 2% | 2% | 2% | 2% |
| Fidelity Freedom Blend 2005 Fund | | | | | | | | | |
| December 2018 | 34% | 40% | 46% | 35% | 34% | 33% | 35% | 34% | 33% |
| Fidelity Freedom Blend 2010 Fund | | | | | | | | | |
| December 2018 | 47% | 50% | 60% | 46% | 45% | 44% | 46% | 45% | 44% |
| Fidelity Freedom Blend 2015 Fund | | | | | | | | | |
| December 2018 | 54% | 58% | 55% | 49% | 50% | 49% | 51% | 50% | 49% |
| Fidelity Freedom Blend 2020 Fund | | | | | | | | | |
| December 2018 | 57% | 73% | 77% | 53% | 58% | 56% | 61% | 58% | 56% |
| Fidelity Freedom Blend 2025 Fund | | | | | | | | | |
| December 2018 | 65% | 71% | 81% | 60% | 62% | 61% | 63% | 62% | 61% |
| Fidelity Freedom Blend 2030 Fund | | | | | | | | | |
| December 2018 | 66% | 70% | 72% | 63% | 63% | 61% | 64% | 63% | 61% |
| Fidelity Freedom Blend 2035 Fund | | | | | | | | | |
| December 2018 | 71% | 72% | 83% | 67% | 68% | 66% | 69% | 68% | 66% |
| Fidelity Freedom Blend 2040 Fund | | | | | | | | | |
| December 2018 | 69% | 77% | 86% | 68% | 69% | 68% | 71% | 69% | 68% |
| Fidelity Freedom Blend 2045 Fund | | | | | | | | | |
| December 2018 | 76% | 76% | 87% | 71% | 72% | 71% | 73% | 72% | 71% |
| Fidelity Freedom Blend 2050 Fund | | | | | | | | | |
| December 2018 | 72% | 76% | 84% | 68% | 68% | 67% | 70% | 68% | 67% |
| Fidelity Freedom Blend 2055 Fund | | | | | | | | | |
| December 2018 | 72% | 75% | 83% | 69% | 68% | 67% | 69% | 68% | 67% |
| Fidelity Freedom Blend 2060 Fund | | | | | | | | | |
| December 2018 | 73% | 77% | 85% | 69% | 69% | 68% | 70% | 69% | 68% |
|
The funds will notify shareholders in January 2020 of amounts for use in preparing 2019 income tax returns.
FBF-ANN-0519
1.9890344.100
Item 2.
Code of Ethics
As of the end of the period, March 31, 2019, Fidelity Aberdeen Street Trust (the trust) has adopted a code of ethics, as defined in Item 2 of Form N-CSR, that applies to its President and Treasurer and its Chief Financial Officer. A copy of the code of ethics is filed as an exhibit to this Form N-CSR.
Item 3.
Audit Committee Financial Expert
The Board of Trustees of the trust has determined that Elizabeth S. Acton is an audit committee financial expert, as defined in Item 3 of Form N-CSR. Ms. Acton is independent for purposes of Item 3 of Form N-CSR.
Item 4.
Principal Accountant Fees and Services
Fees and Services
The following table presents fees billed by Deloitte & Touche LLP, the member firms of Deloitte Touche Tohmatsu, and their respective affiliates (collectively, “Deloitte Entities”) in each of the last two fiscal years for services rendered to Fidelity Advisor Freedom Income Fund, Fidelity Advisor Freedom 2005 Fund, Fidelity Advisor Freedom 2010 Fund, Fidelity Advisor Freedom 2015 Fund, Fidelity Advisor Freedom 2020 Fund, Fidelity Advisor Freedom 2025 Fund, Fidelity Advisor Freedom 2030 Fund, Fidelity Advisor Freedom 2035 Fund, Fidelity Advisor Freedom 2040 Fund, Fidelity Advisor Freedom 2045 Fund, Fidelity Advisor Freedom 2050 Fund, Fidelity Advisor Freedom 2055 Fund, Fidelity Advisor Freedom 2060 Fund, Fidelity Freedom Index Income Fund, Fidelity Freedom Index 2005 Fund, Fidelity Freedom Index 2010 Fund, Fidelity Freedom Index 2015 Fund, Fidelity Freedom Index 2020 Fund, Fidelity Freedom Index 2025 Fund, Fidelity Freedom Index 2030 Fund, Fidelity Freedom Index 2035 Fund, Fidelity Freedom Index 2040 Fund, Fidelity Freedom Index 2045 Fund, Fidelity Freedom Index 2050 Fund, Fidelity Freedom Index 2055 Fund and Fidelity Freedom Index 2060 Fund (the “Funds”):
Services Billed by Deloitte Entities
March 31, 2019 FeesA
| | | | |
| Audit Fees | Audit-Related Fees | Tax Fees | All Other Fees |
Fidelity Advisor Freedom Income Fund | $27,000 | $- | $5,000 | $800 |
Fidelity Advisor Freedom 2005 Fund | $26,000 | $- |
$5,000 | $700 |
Fidelity Advisor Freedom 2010 Fund | $26,000 | $- | $5,000 | $700 |
Fidelity Advisor Freedom 2015 Fund | $26,000 | $- | $5,000 | $700 |
Fidelity Advisor Freedom 2020 Fund | $26,000 | $- | $5,000 | $700 |
Fidelity Advisor Freedom 2025 Fund | $26,000 | $- | $5,000 | $700 |
Fidelity Advisor Freedom 2030 Fund | $26,000 | $- | $5,000 | $700 |
Fidelity Advisor Freedom 2035 Fund | $26,000 | $- | $5,000 | $700 |
Fidelity Advisor Freedom 2040 Fund | $26,000 | $- | $5,000 | $700 |
Fidelity Advisor Freedom 2045 Fund | $27,000 | $- | $5,000 | $800 |
Fidelity Advisor Freedom 2050 Fund | $26,000 | $- | $5,000 | $700 |
Fidelity Advisor Freedom 2055 Fund | $27,000 | $- | $5,000 | $800 |
Fidelity Advisor Freedom 2060 Fund | $27,000 | $- | $5,000 | $800 |
Fidelity Freedom Index Income Fund | $20,000 | $- | $4,800 | $600 |
Fidelity Freedom Index 2005 Fund | $20,000 | $- | $4,800 | $600 |
Fidelity Freedom Index 2010 Fund | $20,000 | $- | $4,800 | $600 |
Fidelity Freedom Index 2015 Fund | $20,000 | $- | $4,800 | $600 |
Fidelity Freedom Index 2020 Fund | $20,000 | $- | $4,800 | $600 |
Fidelity Freedom Index 2025 Fund | $20,000 | $- | $4,800 | $600 |
Fidelity Freedom Index 2030 Fund | $20,000 | $- | $4,800 | $600 |
Fidelity Freedom Index 2035 Fund | $20,000 | $- | $4,800 | $600 |
Fidelity Freedom Index 2040 Fund | $20,000 | $- | $4,800 | $600 |
Fidelity Freedom Index 2045 Fund | $20,000 | $- | $4,800 | $600 |
Fidelity Freedom Index 2050 Fund | $20,000 | $- | $4,800 | $600 |
Fidelity Freedom Index 2055 Fund | $20,000 | $- | $4,800 | $600 |
Fidelity Freedom Index 2060 Fund | $20,000 | $- | $4,800 | $600 |
| | | | |
| Audit Fees | Audit-Related Fees | Tax Fees | All Other Fees |
Fidelity Advisor Freedom Income Fund | $25,000 | $- | $5,000 | $600 |
Fidelity Advisor Freedom 2005 Fund | $25,000 | $- |
$5,000 | $600 |
Fidelity Advisor Freedom 2010 Fund | $25,000 | $- | $5,000 | $600 |
Fidelity Advisor Freedom 2015 Fund | $25,000 | $- | $5,000 | $600 |
Fidelity Advisor Freedom 2020 Fund | $25,000 | $- | $5,000 | $600 |
Fidelity Advisor Freedom 2025 Fund | $25,000 | $- | $5,000 | $600 |
Fidelity Advisor Freedom 2030 Fund | $25,000 | $- | $5,000 | $600 |
Fidelity Advisor Freedom 2035 Fund | $25,000 | $- | $5,000 | $600 |
Fidelity Advisor Freedom 2040 Fund | $25,000 | $- | $5,000 | $600 |
Fidelity Advisor Freedom 2045 Fund | $25,000 | $- | $5,000 | $600 |
Fidelity Advisor Freedom 2050 Fund | $25,000 | $- | $5,000 | $600 |
Fidelity Advisor Freedom 2055 Fund | $25,000 | $- | $5,000 | $600 |
Fidelity Advisor Freedom 2060 Fund | $25,000 | $- | $5,000 | $600 |
Fidelity Freedom Index Income Fund | $20,000 | $- | $4,800 | $600 |
Fidelity Freedom Index 2005 Fund | $20,000 | $- | $4,800 | $600 |
Fidelity Freedom Index 2010 Fund | $20,000 | $- | $4,800 | $600 |
Fidelity Freedom Index 2015 Fund | $20,000 | $- | $4,800 | $600 |
Fidelity Freedom Index 2020 Fund | $20,000 | $- | $4,800 | $600 |
Fidelity Freedom Index 2025 Fund | $20,000 | $- | $4,800 | $600 |
Fidelity Freedom Index 2030 Fund | $20,000 | $- | $4,800 | $600 |
Fidelity Freedom Index 2035 Fund | $20,000 | $- | $4,800 | $600 |
Fidelity Freedom Index 2040 Fund | $20,000 | $- | $4,800 | $600 |
Fidelity Freedom Index 2045 Fund | $20,000 | $- | $4,800 | $600 |
Fidelity Freedom Index 2050 Fund | $20,000 | $- | $4,800 | $600 |
Fidelity Freedom Index 2055 Fund | $20,000 | $- | $4,800 | $600 |
Fidelity Freedom Index 2060 Fund | $20,000 | $- | $4,800 | $600 |
AAmounts may reflect rounding.
The following table presents fees billed by PricewaterhouseCoopers LLP (“PwC”) in each of the last two fiscal years for services rendered to Fidelity Flex Freedom Income Fund, Fidelity Flex Freedom 2005 Fund, Fidelity Flex Freedom 2010 Fund, Fidelity Flex Freedom 2015 Fund, Fidelity Flex Freedom 2020 Fund, Fidelity Flex Freedom 2025 Fund, Fidelity Flex Freedom 2030 Fund, Fidelity Flex Freedom 2035 Fund, Fidelity Flex Freedom 2040 Fund, Fidelity Flex Freedom 2045 Fund, Fidelity Flex Freedom 2050 Fund, Fidelity Flex Freedom 2055 Fund, Fidelity Flex Freedom 2060 Fund, Fidelity Freedom Income Fund, Fidelity Freedom 2005 Fund, Fidelity Freedom 2010 Fund, Fidelity Freedom 2015 Fund, Fidelity Freedom 2020 Fund, Fidelity Freedom 2025 Fund, Fidelity Freedom 2030 Fund, Fidelity Freedom 2035 Fund, Fidelity Freedom 2040 Fund, Fidelity Freedom 2045 Fund, Fidelity Freedom 2050 Fund, Fidelity Freedom 2055 Fund, Fidelity Freedom 2060 Fund, Fidelity Freedom Blend Income Fund, Fidelity Freedom Blend 2005 Fund, Fidelity Freedom Blend 2010 Fund, Fidelity Freedom Blend 2015 Fund, Fidelity Freedom Blend 2020 Fund, Fidelity Freedom Blend 2025 Fund, Fidelity Freedom Blend 2030 Fund, Fidelity Freedom Blend 2035 Fund, Fidelity Freedom Blend 2040 Fund, Fidelity Freedom Blend 2045 Fund, Fidelity Freedom Blend 2050 Fund, Fidelity Freedom Blend 2055 Fund and Fidelity Freedom Blend 2060 Fund (the “Funds”):
Services Billed by PwC
March 31, 2019 FeesA,B
| | | | |
| Audit Fees | Audit-Related Fees | Tax Fees | All Other Fees |
Fidelity Flex Freedom Income Fund | $19,000 | $1,500 | $3,000 | $900 |
Fidelity Flex Freedom 2005 Fund | $21,000 | $1,700 | $3,000 | $1,000 |
Fidelity Flex Freedom 2010 Fund | $21,000 | $1,700 | $3,000 | $1,000 |
Fidelity Flex Freedom 2015 Fund | $21,000 | $1,700 | $3,000 | $1,000 |
Fidelity Flex Freedom 2020 Fund | $21,000 | $1,700 | $3,000 | $1,000 |
Fidelity Flex Freedom 2025 Fund | $21,000 | $1,700 | $3,000 | $1,000 |
Fidelity Flex Freedom 2030 Fund | $21,000 | $1,700 | $3,000 | $1,000 |
Fidelity Flex Freedom 2035 Fund | $21,000 | $1,700 | $3,000 | $1,000 |
Fidelity Flex Freedom 2040 Fund | $21,000 | $1,700 | $3,000 | $1,000 |
Fidelity Flex Freedom 2045 Fund | $21,000 | $1,700 | $3,000 | $1,000 |
Fidelity Flex Freedom 2050 Fund | $21,000 | $1,700 | $3,000 | $1,000 |
Fidelity Flex Freedom 2055 Fund | $21,000 | $1,700 | $3,000 | $1,000 |
Fidelity Flex Freedom 2060 Fund | $21,000 | $1,700 | $3,000 | $1,000 |
Fidelity Freedom Income Fund | $26,000 | $2,000 | $2,400 | $1,200 |
Fidelity Freedom 2005 Fund | $27,000 | $2,000 |
$2,400 | $1,200 |
Fidelity Freedom 2010 Fund | $28,000 | $2,000 | $2,400 | $1,200 |
Fidelity Freedom 2015 Fund | $28,000 | $2,000 | $2,400 | $1,200 |
Fidelity Freedom 2020 Fund | $28,000 | $2,000 | $2,400 | $1,200 |
Fidelity Freedom 2025 Fund | $28,000 | $2,000 | $2,400 | $1,200 |
Fidelity Freedom 2030 Fund | $28,000 | $2,000 | $2,400 | $1,200 |
Fidelity Freedom 2035 Fund | $29,000 | $2,000 | $2,400 | $1,200 |
Fidelity Freedom 2040 Fund | $29,000 | $2,000 | $2,400 | $1,200 |
Fidelity Freedom 2045 Fund | $29,000 | $2,000 | $2,400 | $1,200 |
Fidelity Freedom 2050 Fund | $29,000 | $2,000 | $2,400 | $1,200 |
Fidelity Freedom 2055 Fund | $26,000 | $2,000 | $2,400 | $1,200 |
Fidelity Freedom 2060 Fund | $27,000 | $2,000 | $2,400 | $1,200 |
Fidelity Freedom Blend Income Fund | $20,000 | $900 | $2,400 | $500 |
Fidelity Freedom Blend 2005 Fund | $20,000 | $900 |
$2,400 | $500 |
Fidelity Freedom Blend 2010 Fund | $20,000 | $900 | $2,400 | $500 |
Fidelity Freedom Blend 2015 Fund | $20,000 | $900 | $2,400 | $500 |
Fidelity Freedom Blend 2020 Fund | $20,000 | $900 | $2,400 | $500 |
Fidelity Freedom Blend 2025 Fund | $20,000 | $900 | $2,400 | $500 |
Fidelity Freedom Blend 2030 Fund | $20,000 | $900 | $2,400 | $500 |
Fidelity Freedom Blend 2035 Fund | $20,000 | $900 | $2,400 | $500 |
Fidelity Freedom Blend 2040 Fund | $20,000 | $900 | $2,400 | $500 |
Fidelity Freedom Blend 2045 Fund | $20,000 | $900 | $2,400 | $500 |
Fidelity Freedom Blend 2050 Fund | $20,000 | $900 | $2,400 | $500 |
Fidelity Freedom Blend 2055 Fund | $20,000 | $900 | $2,400 | $500 |
Fidelity Freedom Blend 2060 Fund | $20,000 | $900 | $2,400 | $500 |
| | | | |
| Audit Fees | Audit-Related Fees | Tax Fees | All Other Fees |
Fidelity Flex Freedom Income Fund | $16,000 | $1,200 | $2,400 | $600 |
Fidelity Flex Freedom 2005 Fund | $18,000 | $1,300 | $2,400 | $700 |
Fidelity Flex Freedom 2010 Fund | $18,000 | $1,300 | $2,400 | $700 |
Fidelity Flex Freedom 2015 Fund | $18,000 | $1,300 | $2,400 | $700 |
Fidelity Flex Freedom 2020 Fund | $18,000 | $1,300 | $2,400 | $700 |
Fidelity Flex Freedom 2025 Fund | $18,000 | $1,300 | $2,400 | $700 |
Fidelity Flex Freedom 2030 Fund | $18,000 | $1,300 | $2,400 | $700 |
Fidelity Flex Freedom 2035 Fund | $18,000 | $1,300 | $2,400 | $700 |
Fidelity Flex Freedom 2040 Fund | $18,000 | $1,300 | $2,400 | $700 |
Fidelity Flex Freedom 2045 Fund | $18,000 | $1,300 | $2,400 | $700 |
Fidelity Flex Freedom 2050 Fund | $18,000 | $1,300 | $2,400 | $700 |
Fidelity Flex Freedom 2055 Fund | $18,000 | $1,300 | $2,400 | $700 |
Fidelity Flex Freedom 2060 Fund | $18,000 | $1,300 | $2,400 | $700 |
Fidelity Freedom Income Fund | $24,000 | $1,900 | $2,400 | $1,000 |
Fidelity Freedom2005 Fund | $23,000 | $1,900 | $2,400 | $1,000 |
Fidelity Freedom2010 Fund | $23,000 | $1,900 | $2,400 | $1,000 |
Fidelity Freedom2015 Fund | $23,000 | $1,900 | $2,400 | $1,000 |
Fidelity Freedom2020 Fund | $23,000 | $1,900 | $2,400 | $1,000 |
Fidelity Freedom 2025 Fund | $23,000 | $1,900 | $2,400 | $1,000 |
Fidelity Freedom 2030 Fund | $23,000 | $1,900 | $2,400 | $1,000 |
Fidelity Freedom 2035 Fund | $23,000 | $1,900 | $2,400 | $1,000 |
Fidelity Freedom 2040 Fund | $23,000 | $1,900 | $2,400 | $1,000 |
Fidelity Freedom 2045 Fund | $23,000 | $1,900 | $2,400 | $1,000 |
Fidelity Freedom 2050 Fund | $23,000 | $1,900 | $2,400 | $1,000 |
Fidelity Freedom 2055 Fund | $23,000 | $1,900 | $2,400 | $1,000 |
Fidelity Freedom 2060 Fund | $23,000 | $1,900 | $2,400 | $1,000 |
Fidelity Freedom Blend Income Fund | $- | $- | $- | $- |
Fidelity Freedom Blend2005 Fund | $- | $- | $- | $- |
Fidelity Freedom Blend2010 Fund | $- | $- | $- | $- |
Fidelity Freedom Blend2015 Fund | $- | $- | $- | $- |
Fidelity Freedom Blend2020 Fund | $- | $- | $- | $- |
Fidelity Freedom Blend 2025 Fund | $- | $- | $- | $- |
Fidelity Freedom Blend 2030 Fund | $- | $- | $- | $- |
Fidelity Freedom Blend 2035 Fund | $- | $- | $- | $- |
Fidelity Freedom Blend 2040 Fund | $- | $- | $- | $- |
Fidelity Freedom Blend 2045 Fund | $- | $- | $- | $- |
Fidelity Freedom Blend 2050 Fund | $- | $- | $- | $- |
Fidelity Freedom Blend 2055 Fund | $- | $- | $- | $- |
Fidelity Freedom Blend 2060 Fund | $- | $- | $- | $- |
AAmounts may reflect rounding.
BFidelity Freedom Blend Income Fund, Fidelity Freedom Blend 2005 Fund, Fidelity Freedom Blend 2010 Fund, Fidelity Freedom Blend 2015 Fund, Fidelity Freedom Blend 2020 Fund, Fidelity Freedom Blend 2025 Fund, Fidelity Freedom Blend 2030 Fund, Fidelity Freedom Blend 2035 Fund, Fidelity Freedom Blend 2040 Fund, Fidelity Freedom Blend 2045 Fund, Fidelity Freedom Blend 2050 Fund, Fidelity Freedom Blend 2055 Fund and Fidelity Freedom Blend 2060 Fund commenced operations on August 31, 2018.
CFidelity Flex Freedom Income Fund, Fidelity Flex Freedom 2005 Fund, Fidelity Flex Freedom 2010 Fund, Fidelity Flex Freedom 2015 Fund, Fidelity Flex Freedom 2020 Fund, Fidelity Flex Freedom 2025 Fund, Fidelity Flex Freedom 2030 Fund, Fidelity Flex Freedom 2035 Fund, Fidelity Flex Freedom 2040 Fund, Fidelity Flex Freedom 2045 Fund, Fidelity Flex Freedom 2050 Fund, Fidelity Flex Freedom 2055 Fund and Fidelity Flex Freedom 2060 Fund commenced operations on June 8, 2017.
The following table presents fees billed by PwC and Deloitte Entities that were required to be approved by the Audit Committee for services that relate directly to the operations and financial reporting of the Funds and that are rendered on behalf of Fidelity Management & Research Company (“FMR”) and entities controlling, controlled by, or under common control with FMR (not including any sub-adviser whose role is primarily portfolio management and is subcontracted with or overseen by another investment adviser) that provide ongoing services to the Funds (“Fund Service Providers”):
Services Billed by Deloitte Entities
| | |
| March 31, 2019A | March 31, 2018A |
Audit-Related Fees | $290,000 | $5,000 |
Tax Fees | $5,000 | $20,000 |
All Other Fees | $- | $- |
A Amounts may reflect rounding.
Services Billed by PwC
| | |
| March 31, 2019A,B | March 31, 2018A,B,C |
Audit-Related Fees | $7,775,000 | $7,745,000 |
Tax Fees | $15,000 | $15,000 |
All Other Fees | $- | $- |
A Amounts may reflect rounding.
BMay include amounts billed prior to the Fidelity Freedom Blend Income Fund, Fidelity Freedom Blend 2005 Fund, Fidelity Freedom Blend 2010 Fund, Fidelity Freedom Blend 2015 Fund, Fidelity Freedom Blend 2020 Fund, Fidelity Freedom Blend 2025 Fund, Fidelity Freedom Blend 2030 Fund, Fidelity Freedom Blend 2035 Fund, Fidelity Freedom Blend 2040 Fund, Fidelity Freedom Blend 2045 Fund, Fidelity Freedom Blend 2050 Fund, Fidelity Freedom Blend 2055 Fund and Fidelity Freedom Blend 2060 Fund’s commencement of operations.
CMay include amounts billed prior to the Fidelity Flex Freedom Income Fund, Fidelity Flex Freedom 2005 Fund, Fidelity Flex Freedom 2010 Fund, Fidelity Flex Freedom 2015 Fund, Fidelity Flex Freedom 2020 Fund, Fidelity Flex Freedom 2025 Fund, Fidelity Flex Freedom 2030 Fund, Fidelity Flex Freedom 2035 Fund, Fidelity Flex Freedom 2040 Fund, Fidelity Flex Freedom 2045 Fund, Fidelity Flex Freedom 2050 Fund, Fidelity Flex Freedom 2055 Fund and Fidelity Flex Freedom 2060 Fund’s commencement of operations.
“Audit-Related Fees” represent fees billed for assurance and related services that are reasonably related to the performance of the fund audit or the review of the fund's financial statements and that are not reported under Audit Fees.
“Tax Fees” represent fees billed for tax compliance, tax advice or tax planning that relate directly to the operations and financial reporting of the fund.
“All Other Fees” represent fees billed for services provided to the fund or Fund Service Provider, a significant portion of which are assurance related, that relate directly to the operations and financial reporting of the fund, excluding those services that are reported under Audit Fees, Audit-Related Fees or Tax Fees.
Assurance services must be performed by an independent public accountant.
* * *
The aggregate non-audit fees billed by PwC and Deloitte Entities for services rendered to the Funds, FMR (not including any sub-adviser whose role is primarily portfolio management and is subcontracted with or overseen by another investment adviser), and any Fund Service Provider for each of the last two fiscal years of the Funds are as follows:
| | |
Billed By | March 31, 2019A,B | March 31, 2018A,B,C |
Deloitte Entities | $890,000 | $470,000 |
PwC | $10,350,000 | $11,020,000 |
A Amounts may reflect rounding.
BMay include amounts billed prior to the Fidelity Freedom Blend Income Fund, Fidelity Freedom Blend 2005 Fund, Fidelity Freedom Blend 2010 Fund, Fidelity Freedom Blend 2015 Fund, Fidelity Freedom Blend 2020 Fund, Fidelity Freedom Blend 2025 Fund, Fidelity Freedom Blend 2030 Fund, Fidelity Freedom Blend 2035 Fund, Fidelity Freedom Blend 2040 Fund, Fidelity Freedom Blend 2045 Fund, Fidelity Freedom Blend 2050 Fund, Fidelity Freedom Blend 2055 Fund and Fidelity Freedom Blend 2060 Fund’s commencement of operations.
CMay include amounts billed prior to the Fidelity Flex Freedom Income Fund, Fidelity Flex Freedom 2005 Fund, Fidelity Flex Freedom 2010 Fund, Fidelity Flex Freedom 2015 Fund, Fidelity Flex Freedom 2020 Fund, Fidelity Flex Freedom 2025 Fund, Fidelity Flex Freedom 2030 Fund, Fidelity Flex Freedom 2035 Fund, Fidelity Flex Freedom 2040 Fund, Fidelity Flex Freedom 2045 Fund, Fidelity Flex Freedom 2050 Fund, Fidelity Flex Freedom 2055 Fund and Fidelity Flex Freedom 2060 Fund’s commencement of operations.
The trust's Audit Committee has considered non-audit services that were not pre-approved that were provided by PwC and Deloitte Entities to Fund Service Providers to be compatible with maintaining the independence of PwC and Deloitte Entities in their audits of the Funds, taking into account representations from PwC and Deloitte Entities, in accordance with Public Company Accounting Oversight Board rules, regarding their independence from the Funds and their related entities and FMR’s review of the appropriateness and permissibility under applicable law of such non-audit services prior to their provision to the Fund Service Providers.
Audit Committee Pre-Approval Policies and Procedures
The trust’s Audit Committee must pre-approve all audit and non-audit services provided by a fund’s independent registered public accounting firm relating to the operations or financial reporting of the fund. Prior to the commencement of any audit or non-audit services to a fund, the Audit Committee reviews the services to determine whether they are appropriate and permissible under applicable law.
The Audit Committee has adopted policies and procedures to, among other purposes, provide a framework for the Committee’s consideration of non-audit services by the audit firms that audit the Fidelity funds. The policies and procedures require that any non-audit service provided by a fund audit firm to a Fidelity fund and any non-audit service provided by a fund auditor to a Fund Service Provider that relates directly to the operations and financial reporting of a Fidelity fund (“Covered Service”) are subject to approval by the Audit Committee before such service is provided.
All Covered Services must be approved in advance of provision of the service either: (i) by formal resolution of the Audit Committee, or (ii) by oral or written approval of the service by the Chair of the Audit Committee (or if the Chair is unavailable, such other member of the Audit Committee as may be designated by the Chair to act in the Chair’s absence). The approval contemplated by (ii) above is permitted where the Treasurer determines that action on such an engagement is necessary before the next meeting of the Audit Committee.
Non-audit services provided by a fund audit firm to a Fund Service Provider that do not relate directly to the operations and financial reporting of a Fidelity fund are reported to the Audit Committee periodically.
Non-Audit Services Approved Pursuant to Rule 2-01(c)(7)(i)(C) and (ii) of Regulation S-X (“De Minimis Exception”)
There were no non-audit services approved or required to be approved by the Audit Committee pursuant to the De Minimis Exception during the Funds’ last two fiscal years relating to services provided to (i) the Funds or (ii) any Fund Service Provider that relate directly to the operations and financial reporting of the Funds.
Item 5.
Audit Committee of Listed Registrants
Not applicable.
Item 6.
Investments
(a)
Not applicable.
(b)
Not applicable
Item 7.
Disclosure of Proxy Voting Policies and Procedures for Closed-End Management Investment Companies
Not applicable.
Item 8.
Portfolio Managers of Closed-End Management Investment Companies
Not applicable.
Item 9.
Purchase of Equity Securities by Closed-End Management Investment Company and Affiliated Purchasers
Not applicable.
Item 10.
Submission of Matters to a Vote of Security Holders
There were no material changes to the procedures by which shareholders may recommend nominees to the trust’s Board of Trustees.
Item 11.
Controls and Procedures
(a)(i) The President and Treasurer and the Chief Financial Officer have concluded that the trust’s disclosure controls and procedures (as defined in Rule 30a-3(c) under the Investment Company Act) provide reasonable assurances that material information relating to the trust is made known to them by the appropriate persons, based on their evaluation of these controls and procedures as of a date within 90 days of the filing date of this report.
(a)(ii) There was no change in the trust’s internal control over financial reporting (as defined in Rule 30a-3(d) under the Investment Company Act) that occurred during the period covered by this report that has materially affected, or is reasonably likely to materially affect, the trust’s internal control over financial reporting.
Item 12.
Disclosure of Securities Lending Activities for Closed-End Management
Investment Companies
Not applicable.
Item 13.
Exhibits
| | |
(a) | (1) | Code of Ethics pursuant to Item 2 of Form N-CSR is filed and attached hereto as EX-99.CODE ETH. |
(a) | (2) | Certification pursuant to Rule 30a-2(a) under the Investment Company Act of 1940 (17 CFR 270.30a-2(a)) is filed and attached hereto as Exhibit 99.CERT. |
(a) | (3) | Not applicable. |
(b) | | Certification pursuant to Rule 30a-2(b) under the Investment Company Act of 1940 (17 CFR 270.30a-2(b)) is furnished and attached hereto as Exhibit 99.906CERT. |
SIGNATURES
Pursuant to the requirements of the Securities Exchange Act of 1934 and the Investment Company Act of 1940, the registrant has duly caused this report to be signed on its behalf by the undersigned, thereunto duly authorized.
Fidelity Aberdeen Street Trust
| |
By: | /s/Laura M. Del Prato |
| Laura M. Del Prato |
| President and Treasurer |
| |
Date: | May 24, 2019 |
Pursuant to the requirements of the Securities Exchange Act of 1934 and the Investment Company Act of 1940, this report has been signed below by the following persons on behalf of the registrant and in the capacities and on the dates indicated.
| |
By: | /s/Laura M. Del Prato |
| Laura M. Del Prato |
| President and Treasurer |
| |
Date: | May 24, 2019 |
| |
By: | /s/John J. Burke III |
| John J. Burke III |
| Chief Financial Officer |
| |
Date: | May 24, 2019 |