UNITED STATES
SECURITIES AND EXCHANGE COMMISSION
Washington, D.C. 20549
FORM N-CSR
CERTIFIED SHAREHOLDER REPORT OF REGISTERED
MANAGEMENT INVESTMENT COMPANIES
Investment Company Act file number 811-06440
Fidelity Aberdeen Street Trust
(Exact name of registrant as specified in charter)
245 Summer St., Boston, MA 02210
(Address of principal executive offices) (Zip code)
Cynthia Lo Bessette, Secretary
245 Summer St.
Boston, Massachusetts 02210
(Name and address of agent for service)
Registrant's telephone number, including area code:
617-563-7000
| |
Date of fiscal year end: | March 31 |
|
|
Date of reporting period: | September 30, 2020 |
Item 1.
Reports to Stockholders
Fidelity Freedom® Index Funds - Income, 2005, 2010, 2015, 2020, 2025, 2030, 2035, 2040, 2045, 2050, 2055, 2060, 2065
Semi-Annual Report
September 30, 2020

See the inside front cover for important information about access to your fund’s shareholder reports.

Beginning on January 1, 2021, as permitted by regulations adopted by the Securities and Exchange Commission, paper copies of a fund’s shareholder reports will no longer be sent by mail, unless you specifically request paper copies of the reports from the fund or from your financial intermediary, such as a financial advisor, broker-dealer or bank. Instead, the reports will be made available on a website, and you will be notified by mail each time a report is posted and provided with a website link to access the report.
If you already elected to receive shareholder reports electronically, you will not be affected by this change and you need not take any action. You may elect to receive shareholder reports and other communications from a fund electronically, by contacting your financial intermediary. For Fidelity customers, visit Fidelity's web site or call Fidelity using the contact information listed below.
You may elect to receive all future reports in paper free of charge. If you wish to continue receiving paper copies of your shareholder reports, you may contact your financial intermediary or, if you are a Fidelity customer, visit Fidelity’s website, or call Fidelity at the applicable toll-free number listed below. Your election to receive reports in paper will apply to all funds held with the fund complex/your financial intermediary.
| Account Type | Website | Phone Number |
| Brokerage, Mutual Fund, or Annuity Contracts: | fidelity.com/mailpreferences | 1-800-343-3548 |
| Employer Provided Retirement Accounts: | netbenefits.fidelity.com/preferences (choose 'no' under Required Disclosures to continue to print) | 1-800-343-0860 |
| Advisor Sold Accounts Serviced Through Your Financial Intermediary: | Contact Your Financial Intermediary | Your Financial Intermediary's phone number |
| Advisor Sold Accounts Serviced by Fidelity: | institutional.fidelity.com | 1-877-208-0098 |
Contents
To view a fund's proxy voting guidelines and proxy voting record for the 12-month period ended June 30, visit http://www.fidelity.com/proxyvotingresults or visit the Securities and Exchange Commission's (SEC) web site at http://www.sec.gov.
You may also call 1-800-835-5092 (plan accounts and Institutional Premium Class) or 1-800-544-8544 (all other accounts) to request a free copy of the proxy voting guidelines.
Standard & Poor's, S&P and S&P 500 are registered service marks of The McGraw-Hill Companies, Inc. and have been licensed for use by Fidelity Distributors Corporation.
Other third-party marks appearing herein are the property of their respective owners.
All other marks appearing herein are registered or unregistered trademarks or service marks of FMR LLC or an affiliated company. © 2020 FMR LLC. All rights reserved.
This report and the financial statements contained herein are submitted for the general information of the shareholders of the Funds. This report is not authorized for distribution to prospective investors in the Funds unless preceded or accompanied by an effective prospectus.
A fund files its complete schedule of portfolio holdings with the SEC for the first and third quarters of each fiscal year on Form N-PORT. Forms N-PORT are available on the SEC’s web site at http://www.sec.gov. A fund's Forms N-PORT may be reviewed and copied at the SEC’s Public Reference Room in Washington, DC. Information regarding the operation of the SEC's Public Reference Room may be obtained by calling 1-800-SEC-0330.
For a complete list of a fund's portfolio holdings, view the most recent holdings listing, semiannual report, or annual report on Fidelity's web site at http://www.fidelity.com, http://www.institutional.fidelity.com, or http://www.401k.com, as applicable.
NOT FDIC INSURED •MAY LOSE VALUE •NO BANK GUARANTEE
Neither the Funds nor Fidelity Distributors Corporation is a bank.
Note to Shareholders:
Early in 2020, the outbreak and spread of a new coronavirus emerged as a public health emergency that had a major influence on financial markets, primarily based on its impact on the global economy and the outlook for corporate earnings. The virus causes a respiratory disease known as COVID-19. On March 11, the World Health Organization declared the COVID-19 outbreak a pandemic, citing sustained risk of further global spread.
In the weeks following, as the crisis worsened, we witnessed an escalating human tragedy with wide-scale social and economic consequences from coronavirus-containment measures. The outbreak of COVID-19 prompted a number of measures to limit the spread, including travel and border restrictions, quarantines, and restrictions on large gatherings. In turn, these resulted in lower consumer activity, diminished demand for a wide range of products and services, disruption in manufacturing and supply chains, and – given the wide variability in outcomes regarding the outbreak – significant market uncertainty and volatility. Amid the turmoil, the U.S. government took unprecedented action – in concert with the U.S. Federal Reserve and central banks around the world – to help support consumers, businesses, and the broader economy, and to limit disruption to the financial system.
The situation continues to unfold, and the extent and duration of its impact on financial markets and the economy remain highly uncertain. Extreme events such as the coronavirus crisis are “exogenous shocks” that can have significant adverse effects on mutual funds and their investments. Although multiple asset classes may be affected by market disruption, the duration and impact may not be the same for all types of assets.
Fidelity is committed to helping you stay informed amid news about COVID-19 and during increased market volatility, and we’re taking extra steps to be responsive to customer needs. We encourage you to visit our websites, where we offer ongoing updates, commentary, and analysis on the markets and our funds.
Fidelity Freedom® Index Income Fund
Investment Summary (Unaudited)
The information in the following tables is based on the direct investments of the Fund.
Top Holdings as of September 30, 2020
| | % of fund's net assets |
| Fidelity Series Bond Index Fund | 45.6 |
| Fidelity Series Treasury Bill Index Fund | 22.5 |
| Fidelity Series Total Market Index Fund | 11.3 |
| Fidelity Series Inflation-Protected Bond Index Fund | 10.0 |
| Fidelity Series Global ex U.S. Index Fund | 7.6 |
| Fidelity Series Long-Term Treasury Bond Index Fund | 3.0 |
| Fidelity Cash Central Fund 0.10% | 0.0 |
| | 100.0 |
Asset Allocation (% of fund's net assets)
| Period end |
| | Domestic Equity Funds | 11.3% |
| | International Equity Funds | 7.6% |
| | Bond Funds | 48.6% |
| | Inflation-Protected Bond Funds | 10.0% |
| | Short-Term Funds | 22.5% |

Percentages shown as 0.0% may reflect amounts less than 0.05%.
Fidelity Freedom® Index Income Fund
Schedule of Investments September 30, 2020 (Unaudited)
Showing Percentage of Net Assets
| Domestic Equity Funds - 11.3% | | | |
| | | Shares | Value |
| Fidelity Series Total Market Index Fund (a) | | | |
| (Cost $69,886,274) | | 7,111,799 | 81,216,741 |
|
| International Equity Funds - 7.6% | | | |
| Fidelity Series Global ex U.S. Index Fund (a) | | | |
| (Cost $48,837,237) | | 4,344,984 | 54,399,199 |
|
| Bond Funds - 48.6% | | | |
| Fidelity Series Bond Index Fund (a) | | 30,190,711 | 328,474,941 |
| Fidelity Series Long-Term Treasury Bond Index Fund (a) | | 2,085,596 | 21,544,205 |
| TOTAL BOND FUNDS | | | |
| (Cost $328,705,439) | | | 350,019,146 |
|
| Inflation-Protected Bond Funds - 10.0% | | | |
| Fidelity Series Inflation-Protected Bond Index Fund (a) | | | |
| (Cost $68,157,249) | | 6,753,827 | 72,265,950 |
|
| Short-Term Funds - 22.5% | | | |
| Fidelity Cash Central Fund 0.10% (b) | | 27,247 | 27,253 |
| Fidelity Series Treasury Bill Index Fund (a) | | 16,217,078 | 162,332,954 |
| TOTAL SHORT-TERM FUNDS | | | |
| (Cost $162,239,708) | | | 162,360,207 |
| TOTAL INVESTMENT IN SECURITIES - 100.0% | | | |
| (Cost $677,825,907) | | | 720,261,243 |
| NET OTHER ASSETS (LIABILITIES) - 0.0% | | | (57,710) |
| NET ASSETS - 100% | | | $720,203,533 |
Legend
(a) Affiliated Fund
(b) Affiliated fund that is generally available only to investment companies and other accounts managed by Fidelity Investments. The rate quoted is the annualized seven-day yield of the fund at period end. A complete unaudited listing of the fund's holdings as of its most recent quarter end is available upon request. In addition, each Fidelity Central Fund's financial statements are available on the SEC's website or upon request.
Affiliated Central Funds
Information regarding fiscal year to date income earned by the Fund from investments in Fidelity Central Funds is as follows:
| Fund | Income earned |
| Fidelity Cash Central Fund | $10 |
| Total | $10 |
Amounts in the income column in the above table include any capital gain distributions from underlying funds, which are presented in the corresponding line-item in the Statement of Operations, if applicable.
Affiliated Underlying Funds
Fiscal year to date information regarding the Fund's investments in affiliated Underlying Funds, excluding any Money Market Central Funds, is presented below. Exchanges between classes of the same affiliated Underlying Funds may occur.
| Affiliate | Value, beginning of period | Purchases | Sales Proceeds | Dividend Income | Realized Gain (loss) | Change in Unrealized appreciation (depreciation) | Value, end of period |
| Fidelity Series Bond Index Fund | $255,629,952 | $77,704,759 | $10,639,008 | $3,045,278 | $(2,995) | $5,782,233 | $328,474,941 |
| Fidelity Series Global ex U.S. Index Fund | 41,926,680 | 10,301,597 | 8,115,377 | -- | (269,963) | 10,556,262 | 54,399,199 |
| Fidelity Series Inflation-Protected Bond Index Fund | 55,922,222 | 14,898,403 | 2,295,601 | 51,266 | 59,394 | 3,681,532 | 72,265,950 |
| Fidelity Series Long-Term Treasury Bond Index Fund | 16,874,437 | 5,967,459 | 678,204 | 488,432 | (14,167) | (605,320) | 21,544,205 |
| Fidelity Series Total Market Index Fund | 62,405,580 | 17,034,150 | 18,779,069 | 340,391 | 314,828 | 20,241,252 | 81,216,741 |
| Fidelity Series Treasury Bill Index Fund | 126,104,162 | 41,938,652 | 5,305,993 | 548,775 | (4,389) | (399,478) | 162,332,954 |
| Total | $558,863,033 | $167,845,020 | $45,813,252 | $4,474,142 | $82,708 | $39,256,481 | $720,233,990 |
Amounts in the income column in the above table include any capital gain distributions from underlying funds, which are presented in the corresponding line-item in the Statement of Operations, if applicable.
Investment Valuation
The following is a summary of the inputs used, as of September 30, 2020, involving the Fund's assets and liabilities carried at fair value. The inputs or methodology used for valuing securities may not be an indication of the risk associated with investing in those securities. For more information on valuation inputs, and their aggregation into the levels used below, please refer to the Investment Valuation section in the accompanying Notes to Financial Statements.
| | Valuation Inputs at Reporting Date: |
| Description | Total | Level 1 | Level 2 | Level 3 |
| Investments in Securities: | | | | |
| Domestic Equity Funds | $81,216,741 | $81,216,741 | $-- | $-- |
| International Equity Funds | 54,399,199 | 54,399,199 | -- | -- |
| Bond Funds | 422,285,096 | 422,285,096 | -- | -- |
| Short-Term Funds | 162,360,207 | 162,360,207 | -- | -- |
| Total Investments in Securities: | $720,261,243 | $720,261,243 | $-- | $-- |
See accompanying notes which are an integral part of the financial statements.
Fidelity Freedom® Index Income Fund
Financial Statements
Statement of Assets and Liabilities
| | | September 30, 2020 (Unaudited) |
| Assets | | |
Investment in securities, at value — See accompanying schedule:
| | |
| Fidelity Central Funds (cost $27,253) | $27,253 | |
| Other affiliated issuers (cost $677,798,654) | 720,233,990 | |
| Total Investment in Securities (cost $677,825,907) | | $720,261,243 |
| Cash | | 8 |
| Receivable for investments sold | | 458,401 |
| Receivable for fund shares sold | | 2,559,310 |
| Distributions receivable from Fidelity Central Funds | | 3 |
| Total assets | | 723,278,965 |
| Liabilities | | |
| Payable for investments purchased | $1,705,259 | |
| Payable for fund shares redeemed | 1,312,452 | |
| Accrued management fee | 57,721 | |
| Total liabilities | | 3,075,432 |
| Net Assets | | $720,203,533 |
| Net Assets consist of: | | |
| Paid in capital | | $677,503,890 |
| Total accumulated earnings (loss) | | 42,699,643 |
| Net Assets | | $720,203,533 |
| Net Asset Value and Maximum Offering Price | | |
| Investor Class: | | |
| Net Asset Value, offering price and redemption price per share ($381,004,763 ÷ 30,835,009 shares) | | $12.36 |
| Institutional Premium Class: | | |
| Net Asset Value, offering price and redemption price per share ($339,081,517 ÷ 27,478,673 shares) | | $12.34 |
| Premier Class: | | |
| Net Asset Value, offering price and redemption price per share ($117,253 ÷ 9,507 shares) | | $12.33 |
See accompanying notes which are an integral part of the financial statements.
Statement of Operations
| | | Six months ended September 30, 2020 (Unaudited) |
| Investment Income | | |
| Dividends: | | |
| Affiliated issuers | | $3,722,149 |
| Income from Fidelity Central Funds | | 10 |
| Total income | | 3,722,159 |
| Expenses | | |
| Management fee | $323,226 | |
| Independent trustees' fees and expenses | 859 | |
| Total expenses | | 324,085 |
| Net investment income (loss) | | 3,398,074 |
| Realized and Unrealized Gain (Loss) | | |
| Net realized gain (loss) on: | | |
| Investment securities: | | |
| Affiliated issuers | 109,794 | |
| Capital gain distributions from underlying funds: | | |
| Affiliated issuers | 751,993 | |
| Total net realized gain (loss) | | 861,787 |
| Change in net unrealized appreciation (depreciation) on: | | |
| Investment securities: | | |
| Affiliated issuers | 39,256,481 | |
| Total change in net unrealized appreciation (depreciation) | | 39,256,481 |
| Net gain (loss) | | 40,118,268 |
| Net increase (decrease) in net assets resulting from operations | | $43,516,342 |
See accompanying notes which are an integral part of the financial statements.
Statement of Changes in Net Assets
| | Six months ended September 30, 2020 (Unaudited) | Year ended March 31, 2020 |
| Increase (Decrease) in Net Assets | | |
| Operations | | |
| Net investment income (loss) | $3,398,074 | $9,278,014 |
| Net realized gain (loss) | 861,787 | 27,218,832 |
| Change in net unrealized appreciation (depreciation) | 39,256,481 | (23,086,943) |
| Net increase (decrease) in net assets resulting from operations | 43,516,342 | 13,409,903 |
| Distributions to shareholders | (5,017,241) | (35,256,615) |
| Share transactions - net increase (decrease) | 122,885,898 | 227,317,964 |
| Total increase (decrease) in net assets | 161,384,999 | 205,471,252 |
| Net Assets | | |
| Beginning of period | 558,818,534 | 353,347,282 |
| End of period | $720,203,533 | $558,818,534 |
See accompanying notes which are an integral part of the financial statements.
Financial Highlights
Fidelity Freedom Index Income Fund Investor Class
| | Six months ended (Unaudited) September 30, | Years endedMarch 31, | | | | |
| | 2020 | 2020 | 2019 | 2018 | 2017 | 2016 |
| Selected Per–Share Data | | | | | | |
| Net asset value, beginning of period | $11.60 | $11.98 | $11.86 | $11.63 | $11.36 | $11.52 |
| Income from Investment Operations | | | | | | |
| Net investment income (loss)A | .06 | .24 | .25 | .20 | .17 | .16 |
| Net realized and unrealized gain (loss) | .80 | .23 | .22 | .27 | .28 | (.15) |
| Total from investment operations | .86 | .47 | .47 | .47 | .45 | .01 |
| Distributions from net investment income | (.07) | (.24) | (.25) | (.19) | (.17) | (.16) |
| Distributions from net realized gain | (.03) | (.62) | (.10) | (.04) | (.01) | (.01) |
| Total distributions | (.10) | (.85) | (.35) | (.24)B | (.18) | (.17) |
| Net asset value, end of period | $12.36 | $11.60 | $11.98 | $11.86 | $11.63 | $11.36 |
| Total ReturnC,D | 7.42% | 3.83% | 4.09% | 4.02% | 4.02% | .10% |
| Ratios to Average Net AssetsE,F | | | | | | |
| Expenses before reductions | .12%G | .12% | .15% | .15% | .15% | .15% |
| Expenses net of fee waivers, if any | .12%G | .12% | .12% | .12% | .08% | .07% |
| Expenses net of all reductions | .12%G | .12% | .12% | .12% | .08% | .07% |
| Net investment income (loss) | 1.03%G | 1.96% | 2.15% | 1.69% | 1.48% | 1.39% |
| Supplemental Data | | | | | | |
| Net assets, end of period (000 omitted) | $381,005 | $282,522 | $167,641 | $126,634 | $118,421 | $140,481 |
| Portfolio turnover rateH | 14%G | 67% | 51% | 17% | 52% | 22% |
A Calculated based on average shares outstanding during the period.
B Total distributions per share do not sum due to rounding.
C Total returns for periods of less than one year are not annualized.
D Total returns would have been lower if certain expenses had not been reduced during the applicable periods shown.
E Fees and expenses of any underlying mutual funds or exchange-traded funds (ETFs) are not included in the Fund's expense ratio. The Fund indirectly bears its proportionate share of these expenses. For additional expense information related to investments in Fidelity Central Funds, please refer to the "Investments in Fidelity Central Funds" note found in the Notes to Financial Statements section of the most recent Annual or Semi-Annual report.
F Expense ratios reflect operating expenses of the class. Expenses before reductions do not reflect amounts reimbursed, waived, or reduced through arrangements with the investment adviser, brokerage services, or other offset arrangements, if applicable, and do not represent the amount paid by the class during periods when reimbursements, waivers or reductions occur.
G Annualized
H Amount does not include the portfolio activity of any underlying mutual funds or exchange-traded funds (ETFs).
See accompanying notes which are an integral part of the financial statements.
Fidelity Freedom Index Income Fund Institutional Premium Class
| | Six months ended (Unaudited) September 30, | Years endedMarch 31, | | | | |
| | 2020 | 2020 | 2019 | 2018 | 2017 | 2016 A |
| Selected Per–Share Data | | | | | | |
| Net asset value, beginning of period | $11.59 | $11.96 | $11.84 | $11.61 | $11.35 | $11.48 |
| Income from Investment Operations | | | | | | |
| Net investment income (loss)B | .06 | .24 | .26 | .21 | .18 | .18 |
| Net realized and unrealized gain (loss) | .79 | .25 | .22 | .26 | .27 | (.15) |
| Total from investment operations | .85 | .49 | .48 | .47 | .45 | .03 |
| Distributions from net investment income | (.07) | (.24) | (.26) | (.20) | (.18) | (.15) |
| Distributions from net realized gain | (.03) | (.62) | (.10) | (.04) | (.01) | (.01) |
| Total distributions | (.10) | (.86) | (.36) | (.24) | (.19) | (.16) |
| Net asset value, end of period | $12.34 | $11.59 | $11.96 | $11.84 | $11.61 | $11.35 |
| Total ReturnC,D | 7.36% | 3.98% | 4.16% | 4.07% | 4.00% | .26% |
| Ratios to Average Net AssetsE,F | | | | | | |
| Expenses before reductions | .08%G | .08% | .10% | .10% | .09% | .05%G |
| Expenses net of fee waivers, if any | .08%G | .08% | .06% | .07% | .03% | .01%G |
| Expenses net of all reductions | .08%G | .08% | .06% | .07% | .03% | .01%G |
| Net investment income (loss) | 1.07%G | 2.00% | 2.21% | 1.74% | 1.54% | 2.12%G |
| Supplemental Data | | | | | | |
| Net assets, end of period (000 omitted) | $339,082 | $276,297 | $185,706 | $163,733 | $145,993 | $108,865 |
| Portfolio turnover rateH | 14%G | 67% | 51% | 17% | 52% | 22% |
A For the period June 24, 2015 (commencement of sale of shares) to March 31, 2016.
B Calculated based on average shares outstanding during the period.
C Total returns for periods of less than one year are not annualized.
D Total returns would have been lower if certain expenses had not been reduced during the applicable periods shown.
E Fees and expenses of any underlying mutual funds or exchange-traded funds (ETFs) are not included in the Fund's expense ratio. The Fund indirectly bears its proportionate share of these expenses. For additional expense information related to investments in Fidelity Central Funds, please refer to the "Investments in Fidelity Central Funds" note found in the Notes to Financial Statements section of the most recent Annual or Semi-Annual report.
F Expense ratios reflect operating expenses of the class. Expenses before reductions do not reflect amounts reimbursed, waived, or reduced through arrangements with the investment adviser, brokerage services, or other offset arrangements, if applicable, and do not represent the amount paid by the class during periods when reimbursements, waivers or reductions occur.
G Annualized
H Amount does not include the portfolio activity of any underlying mutual funds or exchange-traded funds (ETFs).
See accompanying notes which are an integral part of the financial statements.
Fidelity Freedom Index Income Fund Premier Class
| | Six months ended (Unaudited) September 30, |
| | 2020 A |
| Selected Per–Share Data | |
| Net asset value, beginning of period | $12.07 |
| Income from Investment Operations | |
| Net investment income (loss)B | .03 |
| Net realized and unrealized gain (loss) | .26 |
| Total from investment operations | .29 |
| Distributions from net investment income | (.03) |
| Distributions from net realized gain | – |
| Total distributions | (.03) |
| Net asset value, end of period | $12.33 |
| Total ReturnC | 2.37% |
| Ratios to Average Net AssetsD,E | |
| Expenses before reductions | .06%F |
| Expenses net of fee waivers, if any | .06%F |
| Expenses net of all reductions | .06%F |
| Net investment income (loss) | .91%F |
| Supplemental Data | |
| Net assets, end of period (000 omitted) | $117 |
| Portfolio turnover rateG | 14%F |
A For the period June 24, 2020 (commencement of sale of shares) to September 30, 2020.
B Calculated based on average shares outstanding during the period.
C Total returns for periods of less than one year are not annualized.
D Fees and expenses of any underlying mutual funds or exchange-traded funds (ETFs) are not included in the Fund's expense ratio. The Fund indirectly bears its proportionate share of these expenses. For additional expense information related to investments in Fidelity Central Funds, please refer to the "Investments in Fidelity Central Funds" note found in the Notes to Financial Statements section of the most recent Annual or Semi-Annual report.
E Expense ratios reflect operating expenses of the class. Expenses before reductions do not reflect amounts reimbursed, waived, or reduced through arrangements with the investment adviser, brokerage services, or other offset arrangements, if applicable, and do not represent the amount paid by the class during periods when reimbursements, waivers or reductions occur.
F Annualized
G Amount does not include the portfolio activity of any underlying mutual funds or exchange-traded funds (ETFs).
See accompanying notes which are an integral part of the financial statements.
Fidelity Freedom® Index 2005 Fund
Investment Summary (Unaudited)
The information in the following tables is based on the direct investments of the Fund.
Top Holdings as of September 30, 2020
| | % of fund's net assets |
| Fidelity Series Bond Index Fund | 43.8 |
| Fidelity Series Treasury Bill Index Fund | 20.0 |
| Fidelity Series Total Market Index Fund | 14.4 |
| Fidelity Series Global ex U.S. Index Fund | 9.7 |
| Fidelity Series Inflation-Protected Bond Index Fund | 9.1 |
| Fidelity Series Long-Term Treasury Bond Index Fund | 3.0 |
| Fidelity Cash Central Fund 0.10% | 0.0 |
| | 100.0 |
Asset Allocation (% of fund's net assets)
| Period end |
| | Domestic Equity Funds | 14.4% |
| | International Equity Funds | 9.7% |
| | Bond Funds | 46.8% |
| | Inflation-Protected Bond Funds | 9.1% |
| | Short-Term Funds | 20.0% |

Percentages shown as 0.0% may reflect amounts less than 0.05%.
Fidelity Freedom® Index 2005 Fund
Schedule of Investments September 30, 2020 (Unaudited)
Showing Percentage of Net Assets
| Domestic Equity Funds - 14.4% | | | |
| | | Shares | Value |
| Fidelity Series Total Market Index Fund (a) | | | |
| (Cost $26,919,738) | | 2,767,440 | 31,604,161 |
|
| International Equity Funds - 9.7% | | | |
| Fidelity Series Global ex U.S. Index Fund (a) | | | |
| (Cost $18,689,072) | | 1,700,159 | 21,285,996 |
|
| Bond Funds - 46.8% | | | |
| Fidelity Series Bond Index Fund (a) | | 8,855,614 | 96,349,085 |
| Fidelity Series Long-Term Treasury Bond Index Fund (a) | | 641,697 | 6,628,734 |
| TOTAL BOND FUNDS | | | |
| (Cost $96,296,229) | | | 102,977,819 |
|
| Inflation-Protected Bond Funds - 9.1% | | | |
| Fidelity Series Inflation-Protected Bond Index Fund (a) | | | |
| (Cost $18,756,340) | | 1,865,869 | 19,964,798 |
|
| Short-Term Funds - 20.0% | | | |
| Fidelity Cash Central Fund 0.10% (b) | | 10,386 | 10,388 |
| Fidelity Series Treasury Bill Index Fund (a) | | 4,406,066 | 44,104,717 |
| TOTAL SHORT-TERM FUNDS | | | |
| (Cost $44,079,641) | | | 44,115,105 |
| TOTAL INVESTMENT IN SECURITIES - 100.0% | | | |
| (Cost $204,741,020) | | | 219,947,879 |
| NET OTHER ASSETS (LIABILITIES) - 0.0% | | | (18,093) |
| NET ASSETS - 100% | | | $219,929,786 |
Legend
(a) Affiliated Fund
(b) Affiliated fund that is generally available only to investment companies and other accounts managed by Fidelity Investments. The rate quoted is the annualized seven-day yield of the fund at period end. A complete unaudited listing of the fund's holdings as of its most recent quarter end is available upon request. In addition, each Fidelity Central Fund's financial statements are available on the SEC's website or upon request.
Affiliated Central Funds
Information regarding fiscal year to date income earned by the Fund from investments in Fidelity Central Funds is as follows:
| Fund | Income earned |
| Fidelity Cash Central Fund | $4 |
| Total | $4 |
Amounts in the income column in the above table include any capital gain distributions from underlying funds, which are presented in the corresponding line-item in the Statement of Operations, if applicable.
Affiliated Underlying Funds
Fiscal year to date information regarding the Fund's investments in affiliated Underlying Funds, excluding any Money Market Central Funds, is presented below. Exchanges between classes of the same affiliated Underlying Funds may occur
| Affiliate | Value, beginning of period | Purchases | Sales Proceeds | Dividend Income | Realized Gain (loss) | Change in Unrealized appreciation (depreciation) | Value, end of period |
| Fidelity Series Bond Index Fund | $77,126,302 | $28,283,047 | $10,798,422 | $927,317 | $4,458 | $1,733,700 | $96,349,085 |
| Fidelity Series Global ex U.S. Index Fund | 17,560,895 | 4,821,508 | 5,408,030 | -- | (110,183) | 4,421,806 | 21,285,996 |
| Fidelity Series Inflation-Protected Bond Index Fund | 15,832,193 | 5,156,526 | 2,096,049 | 14,655 | 48,563 | 1,023,565 | 19,964,798 |
| Fidelity Series Long-Term Treasury Bond Index Fund | 5,342,082 | 2,175,413 | 695,978 | 153,500 | 2,997 | (195,780) | 6,628,734 |
| Fidelity Series Total Market Index Fund | 26,103,926 | 7,593,883 | 10,628,400 | 139,950 | 376,427 | 8,158,325 | 31,604,161 |
| Fidelity Series Treasury Bill Index Fund | 34,800,814 | 14,169,057 | 4,753,926 | 152,889 | (5,354) | (105,874) | 44,104,717 |
| | $176,766,212 | $62,199,434 | $34,380,805 | $1,388,311 | $316,908 | $15,035,742 | $219,937,491 |
Amounts in the income column in the above table include any capital gain distributions from underlying funds, which are presented in the corresponding line-item in the Statement of Operations, if applicable.
Investment Valuation
The following is a summary of the inputs used, as of September 30, 2020, involving the Fund's assets and liabilities carried at fair value. The inputs or methodology used for valuing securities may not be an indication of the risk associated with investing in those securities. For more information on valuation inputs, and their aggregation into the levels used below, please refer to the Investment Valuation section in the accompanying Notes to Financial Statements.
| | Valuation Inputs at Reporting Date: |
| Description | Total | Level 1 | Level 2 | Level 3 |
| Investments in Securities: | | | | |
| Domestic Equity Funds | $31,604,161 | $31,604,161 | $-- | $-- |
| International Equity Funds | 21,285,996 | 21,285,996 | -- | -- |
| Bond Funds | 122,942,617 | 122,942,617 | -- | -- |
| Short-Term Funds | 44,115,105 | 44,115,105 | -- | -- |
| Total Investments in Securities: | $219,947,879 | $219,947,879 | $-- | $-- |
See accompanying notes which are an integral part of the financial statements.
Fidelity Freedom® Index 2005 Fund
Financial Statements
Statement of Assets and Liabilities
| | | September 30, 2020 (Unaudited) |
| Assets | | |
Investment in securities, at value — See accompanying schedule:
| | |
| Fidelity Central Funds (cost $10,388) | $10,388 | |
| Other affiliated issuers (cost $204,730,632) | 219,937,491 | |
| Total Investment in Securities (cost $204,741,020) | | $219,947,879 |
| Cash | | 3 |
| Receivable for investments sold | | 301,060 |
| Receivable for fund shares sold | | 321,260 |
| Distributions receivable from Fidelity Central Funds | | 1 |
| Total assets | | 220,570,203 |
| Liabilities | | |
| Payable for investments purchased | $370,718 | |
| Payable for fund shares redeemed | 251,603 | |
| Accrued management fee | 18,096 | |
| Total liabilities | | 640,417 |
| Net Assets | | $219,929,786 |
| Net Assets consist of: | | |
| Paid in capital | | $203,672,129 |
| Total accumulated earnings (loss) | | 16,257,657 |
| Net Assets | | $219,929,786 |
| Net Asset Value and Maximum Offering Price | | |
| Investor Class: | | |
| Net Asset Value, offering price and redemption price per share ($125,842,093 ÷ 9,242,338 shares) | | $13.62 |
| Institutional Premium Class: | | |
| Net Asset Value, offering price and redemption price per share ($93,979,235 ÷ 6,899,893 shares) | | $13.62 |
| Premier Class: | | |
| Net Asset Value, offering price and redemption price per share ($108,458 ÷ 7,962 shares) | | $13.62 |
See accompanying notes which are an integral part of the financial statements.
Statement of Operations
| | | Six months ended September 30, 2020 (Unaudited) |
| Investment Income | | |
| Dividends: | | |
| Affiliated issuers | | $1,154,981 |
| Income from Fidelity Central Funds | | 4 |
| Total income | | 1,154,985 |
| Expenses | | |
| Management fee | $103,971 | |
| Independent trustees' fees and expenses | 273 | |
| Total expenses before reductions | 104,244 | |
| Expense reductions | (91) | |
| Total expenses after reductions | | 104,153 |
| Net investment income (loss) | | 1,050,832 |
| Realized and Unrealized Gain (Loss) | | |
| Net realized gain (loss) on: | | |
| Investment securities: | | |
| Affiliated issuers | 327,214 | |
| Capital gain distributions from underlying funds: | | |
| Affiliated issuers | 233,330 | |
| Total net realized gain (loss) | | 560,544 |
| Change in net unrealized appreciation (depreciation) on: | | |
| Investment securities: | | |
| Affiliated issuers | 15,035,742 | |
| Total change in net unrealized appreciation (depreciation) | | 15,035,742 |
| Net gain (loss) | | 15,596,286 |
| Net increase (decrease) in net assets resulting from operations | | $16,647,118 |
See accompanying notes which are an integral part of the financial statements.
Statement of Changes in Net Assets
| | Six months ended September 30, 2020 (Unaudited) | Year ended March 31, 2020 |
| Increase (Decrease) in Net Assets | | |
| Operations | | |
| Net investment income (loss) | $1,050,832 | $3,080,525 |
| Net realized gain (loss) | 560,544 | 13,724,282 |
| Change in net unrealized appreciation (depreciation) | 15,035,742 | (13,330,553) |
| Net increase (decrease) in net assets resulting from operations | 16,647,118 | 3,474,254 |
| Distributions to shareholders | (1,188,121) | (16,376,341) |
| Share transactions - net increase (decrease) | 27,718,362 | 58,822,728 |
| Total increase (decrease) in net assets | 43,177,359 | 45,920,641 |
| Net Assets | | |
| Beginning of period | 176,752,427 | 130,831,786 |
| End of period | $219,929,786 | $176,752,427 |
See accompanying notes which are an integral part of the financial statements.
Financial Highlights
Fidelity Freedom Index 2005 Fund Investor Class
| | Six months ended (Unaudited) September 30, | Years endedMarch 31, | | | | |
| | 2020 | 2020 | 2019 | 2018 | 2017 | 2016 |
| Selected Per–Share Data | | | | | | |
| Net asset value, beginning of period | $12.58 | $13.50 | $13.36 | $12.94 | $12.45 | $12.71 |
| Income from Investment Operations | | | | | | |
| Net investment income (loss)A | .07 | .27 | .29 | .23 | .20 | .20 |
| Net realized and unrealized gain (loss) | 1.05 | .17 | .26 | .47 | .52 | (.25) |
| Total from investment operations | 1.12 | .44 | .55 | .70 | .72 | (.05) |
| Distributions from net investment income | (.04) | (.26) | (.26) | (.21) | (.20) | (.20) |
| Distributions from net realized gain | (.04) | (1.10) | (.14) | (.07) | (.03) | –B |
| Total distributions | (.08) | (1.36) | (.41)C | (.28) | (.23) | (.21)C |
| Net asset value, end of period | $13.62 | $12.58 | $13.50 | $13.36 | $12.94 | $12.45 |
| Total ReturnD,E | 8.94% | 2.91% | 4.25% | 5.41% | 5.84% | (.40)% |
| Ratios to Average Net AssetsF,G | | | | | | |
| Expenses before reductions | .12%H | .12% | .15% | .15% | .15% | .15% |
| Expenses net of fee waivers, if any | .12%H | .12% | .12% | .12% | .09% | .07% |
| Expenses net of all reductions | .12%H | .12% | .12% | .12% | .09% | .07% |
| Net investment income (loss) | 1.00%H | 1.96% | 2.16% | 1.74% | 1.60% | 1.58% |
| Supplemental Data | | | | | | |
| Net assets, end of period (000 omitted) | $125,842 | $93,765 | $66,875 | $60,299 | $43,767 | $50,790 |
| Portfolio turnover rateI | 33%H | 83% | 52% | 26% | 52% | 28% |
A Calculated based on average shares outstanding during the period.
B Amount represents less than $.005 per share.
C Total distributions per share do not sum due to rounding.
D Total returns for periods of less than one year are not annualized.
E Total returns would have been lower if certain expenses had not been reduced during the applicable periods shown.
F Fees and expenses of any underlying mutual funds or exchange-traded funds (ETFs) are not included in the Fund's expense ratio. The Fund indirectly bears its proportionate share of these expenses. For additional expense information related to investments in Fidelity Central Funds, please refer to the "Investments in Fidelity Central Funds" note found in the Notes to Financial Statements section of the most recent Annual or Semi-Annual report.
G Expense ratios reflect operating expenses of the class. Expenses before reductions do not reflect amounts reimbursed, waived, or reduced through arrangements with the investment adviser, brokerage services, or other offset arrangements, if applicable, and do not represent the amount paid by the class during periods when reimbursements, waivers or reductions occur.
H Annualized
I Amount does not include the portfolio activity of any underlying mutual funds or exchange-traded funds (ETFs).
See accompanying notes which are an integral part of the financial statements.
Fidelity Freedom Index 2005 Fund Institutional Premium Class
| | Six months ended (Unaudited) September 30, | Years endedMarch 31, | | | | |
| | 2020 | 2020 | 2019 | 2018 | 2017 | 2016 A |
| Selected Per–Share Data | | | | | | |
| Net asset value, beginning of period | $12.58 | $13.50 | $13.36 | $12.94 | $12.45 | $12.73 |
| Income from Investment Operations | | | | | | |
| Net investment income (loss)B | .07 | .27 | .30 | .24 | .21 | .21 |
| Net realized and unrealized gain (loss) | 1.05 | .17 | .25 | .46 | .52 | (.30) |
| Total from investment operations | 1.12 | .44 | .55 | .70 | .73 | (.09) |
| Distributions from net investment income | (.04) | (.27) | (.27) | (.22) | (.21) | (.18) |
| Distributions from net realized gain | (.04) | (1.10) | (.14) | (.07) | (.03) | –C |
| Total distributions | (.08) | (1.36)D | (.41) | (.28)D | (.24) | (.19)D |
| Net asset value, end of period | $13.62 | $12.58 | $13.50 | $13.36 | $12.94 | $12.45 |
| Total ReturnE,F | 8.95% | 2.95% | 4.31% | 5.45% | 5.90% | (.73)% |
| Ratios to Average Net AssetsG,H | | | | | | |
| Expenses before reductions | .08%I | .08% | .10% | .10% | .09% | .05%I |
| Expenses net of fee waivers, if any | .08%I | .08% | .06% | .07% | .03% | .01%I |
| Expenses net of all reductions | .08%I | .08% | .06% | .07% | .03% | .01%I |
| Net investment income (loss) | 1.04%I | 2.00% | 2.22% | 1.79% | 1.66% | 2.28%I |
| Supplemental Data | | | | | | |
| Net assets, end of period (000 omitted) | $93,979 | $82,988 | $63,956 | $52,913 | $46,992 | $28,910 |
| Portfolio turnover rateJ | 33%I | 83% | 52% | 26% | 52% | 28% |
A For the period June 24, 2015 (commencement of sale of shares) to March 31, 2016.
B Calculated based on average shares outstanding during the period.
C Amount represents less than $.005 per share.
D Total distributions per share do not sum due to rounding.
E Total returns for periods of less than one year are not annualized.
F Total returns would have been lower if certain expenses had not been reduced during the applicable periods shown.
G Fees and expenses of any underlying mutual funds or exchange-traded funds (ETFs) are not included in the Fund's expense ratio. The Fund indirectly bears its proportionate share of these expenses. For additional expense information related to investments in Fidelity Central Funds, please refer to the "Investments in Fidelity Central Funds" note found in the Notes to Financial Statements section of the most recent Annual or Semi-Annual report.
H Expense ratios reflect operating expenses of the class. Expenses before reductions do not reflect amounts reimbursed, waived, or reduced through arrangements with the investment adviser, brokerage services, or other offset arrangements, if applicable, and do not represent the amount paid by the class during periods when reimbursements, waivers or reductions occur.
I Annualized
J Amount does not include the portfolio activity of any underlying mutual funds or exchange-traded funds (ETFs).
See accompanying notes which are an integral part of the financial statements.
Fidelity Freedom Index 2005 Fund Premier Class
| | Six months ended (Unaudited) September 30, |
| | 2020 A |
| Selected Per–Share Data | |
| Net asset value, beginning of period | $13.24 |
| Income from Investment Operations | |
| Net investment income (loss)B | .03 |
| Net realized and unrealized gain (loss) | .35 |
| Total from investment operations | .38 |
| Net asset value, end of period | $13.62 |
| Total ReturnC,D | 2.87% |
| Ratios to Average Net AssetsE,F | |
| Expenses before reductions | .06%G |
| Expenses net of fee waivers, if any | .06%G |
| Expenses net of all reductions | .06%G |
| Net investment income (loss) | .88%G |
| Supplemental Data | |
| Net assets, end of period (000 omitted) | $108 |
| Portfolio turnover rateH | 33%G |
A For the period June 24, 2020 (commencement of sale of shares) to September 30, 2020.
B Calculated based on average shares outstanding during the period.
C Total returns for periods of less than one year are not annualized.
D Total returns would have been lower if certain expenses had not been reduced during the applicable periods shown.
E Fees and expenses of any underlying mutual funds or exchange-traded funds (ETFs) are not included in the Fund's expense ratio. The Fund indirectly bears its proportionate share of these expenses. For additional expense information related to investments in Fidelity Central Funds, please refer to the "Investments in Fidelity Central Funds" note found in the Notes to Financial Statements section of the most recent Annual or Semi-Annual report.
F Expense ratios reflect operating expenses of the class. Expenses before reductions do not reflect amounts reimbursed, waived, or reduced through arrangements with the investment adviser, brokerage services, or other offset arrangements, if applicable, and do not represent the amount paid by the class during periods when reimbursements, waivers or reductions occur.
G Annualized
H Amount does not include the portfolio activity of any underlying mutual funds or exchange-traded funds (ETFs).
See accompanying notes which are an integral part of the financial statements.
Fidelity Freedom® Index 2010 Fund
Investment Summary (Unaudited)
The information in the following tables is based on the direct investments of the Fund.
Top Holdings as of September 30, 2020
| | % of fund's net assets |
| Fidelity Series Bond Index Fund | 40.4 |
| Fidelity Series Total Market Index Fund | 19.8 |
| Fidelity Series Treasury Bill Index Fund | 15.9 |
| Fidelity Series Global ex U.S. Index Fund | 13.3 |
| Fidelity Series Inflation-Protected Bond Index Fund | 7.6 |
| Fidelity Series Long-Term Treasury Bond Index Fund | 3.0 |
| Fidelity Cash Central Fund 0.10% | 0.0 |
| | 100.0 |
Asset Allocation (% of fund's net assets)
| Period end |
| | Domestic Equity Funds | 19.8% |
| | International Equity Funds | 13.3% |
| | Bond Funds | 43.4% |
| | Inflation-Protected Bond Funds | 7.6% |
| | Short-Term Funds | 15.9% |

Percentages shown as 0.0% may reflect amounts less than 0.05%.
Fidelity Freedom® Index 2010 Fund
Schedule of Investments September 30, 2020 (Unaudited)
Showing Percentage of Net Assets
| Domestic Equity Funds - 19.8% | | | |
| | | Shares | Value |
| Fidelity Series Total Market Index Fund (a) | | | |
| (Cost $133,086,814) | | 13,550,973 | 154,752,114 |
|
| International Equity Funds - 13.3% | | | |
| Fidelity Series Global ex U.S. Index Fund (a) | | | |
| (Cost $89,192,107) | | 8,279,083 | 103,654,119 |
|
| Bond Funds - 43.4% | | | |
| Fidelity Series Bond Index Fund (a) | | 28,916,350 | 314,609,887 |
| Fidelity Series Long-Term Treasury Bond Index Fund (a) | | 2,284,641 | 23,600,346 |
| TOTAL BOND FUNDS | | | |
| (Cost $313,283,006) | | | 338,210,233 |
|
| Inflation-Protected Bond Funds - 7.6% | | | |
| Fidelity Series Inflation-Protected Bond Index Fund (a) | | | |
| (Cost $55,346,607) | | 5,528,577 | 59,155,770 |
|
| Short-Term Funds - 15.9% | | | |
| Fidelity Cash Central Fund 0.10% (b) | | 6,376 | 6,378 |
| Fidelity Series Treasury Bill Index Fund (a) | | 12,426,369 | 124,387,951 |
| TOTAL SHORT-TERM FUNDS | | | |
| (Cost $124,290,416) | | | 124,394,329 |
| TOTAL INVESTMENT IN SECURITIES - 100.0% | | | |
| (Cost $715,198,950) | | | 780,166,565 |
| NET OTHER ASSETS (LIABILITIES) - 0.0% | | | (61,237) |
| NET ASSETS - 100% | | | $780,105,328 |
Legend
(a) Affiliated Fund
(b) Affiliated fund that is generally available only to investment companies and other accounts managed by Fidelity Investments. The rate quoted is the annualized seven-day yield of the fund at period end. A complete unaudited listing of the fund's holdings as of its most recent quarter end is available upon request. In addition, each Fidelity Central Fund's financial statements are available on the SEC's website or upon request.
Affiliated Central Funds
Information regarding fiscal year to date income earned by the Fund from investments in Fidelity Central Funds is as follows:
| Fund | Income earned |
| Fidelity Cash Central Fund | $3 |
| Total | $3 |
Amounts in the income column in the above table include any capital gain distributions from underlying funds, which are presented in the corresponding line-item in the Statement of Operations, if applicable.
Affiliated Underlying Funds
Fiscal year to date information regarding the Fund's investments in affiliated Underlying Funds, excluding any Money Market Central Funds, is presented below. Exchanges between classes of the same affiliated Underlying Funds may occur.
| Affiliate | Value, beginning of period | Purchases | Sales Proceeds | Dividend Income | Realized Gain (loss) | Change in Unrealized appreciation (depreciation) | Value, end of period |
| Fidelity Series Bond Index Fund | $271,732,748 | $59,912,963 | $23,198,118 | $3,101,347 | $36,942 | $6,125,352 | $314,609,887 |
| Fidelity Series Global ex U.S. Index Fund | 92,008,968 | 10,319,464 | 20,459,536 | -- | (854,550) | 22,639,773 | 103,654,119 |
| Fidelity Series Inflation-Protected Bond Index Fund | 50,554,600 | 8,974,179 | 3,646,289 | 44,929 | 67,338 | 3,205,942 | 59,155,770 |
| Fidelity Series Long-Term Treasury Bond Index Fund | 20,486,851 | 5,357,986 | 1,542,748 | 580,426 | 4,364 | (706,107) | 23,600,346 |
| Fidelity Series Total Market Index Fund | 136,780,743 | 17,417,049 | 42,799,277 | 743,082 | 1,780,656 | 41,572,943 | 154,752,114 |
| Fidelity Series Treasury Bill Index Fund | 105,390,371 | 27,500,353 | 8,169,636 | 448,559 | (7,278) | (325,859) | 124,387,951 |
| | $676,954,281 | $129,481,994 | $99,815,604 | $4,918,343 | $1,027,472 | $72,512,044 | $780,160,187 |
Amounts in the income column in the above table include any capital gain distributions from underlying funds, which are presented in the corresponding line-item in the Statement of Operations, if applicable.
Investment Valuation
The following is a summary of the inputs used, as of September 30, 2020, involving the Fund's assets and liabilities carried at fair value. The inputs or methodology used for valuing securities may not be an indication of the risk associated with investing in those securities. For more information on valuation inputs, and their aggregation into the levels used below, please refer to the Investment Valuation section in the accompanying Notes to Financial Statements.
| | Valuation Inputs at Reporting Date: |
| Description | Total | Level 1 | Level 2 | Level 3 |
| Investments in Securities: | | | | |
| Domestic Equity Funds | $154,752,114 | $154,752,114 | $-- | $-- |
| International Equity Funds | 103,654,119 | 103,654,119 | -- | -- |
| Bond Funds | 397,366,003 | 397,366,003 | -- | -- |
| Short-Term Funds | 124,394,329 | 124,394,329 | -- | -- |
| Total Investments in Securities: | $780,166,565 | $780,166,565 | $-- | $-- |
See accompanying notes which are an integral part of the financial statements.
Fidelity Freedom® Index 2010 Fund
Financial Statements
Statement of Assets and Liabilities
| | | September 30, 2020 (Unaudited) |
| Assets | | |
Investment in securities, at value — See accompanying schedule:
| | |
| Fidelity Central Funds (cost $6,378) | $6,378 | |
| Other affiliated issuers (cost $715,192,572) | 780,160,187 | |
| Total Investment in Securities (cost $715,198,950) | | $780,166,565 |
| Receivable for investments sold | | 2,034,392 |
| Receivable for fund shares sold | | 705,259 |
| Distributions receivable from Fidelity Central Funds | | 1 |
| Total assets | | 782,906,217 |
| Liabilities | | |
| Payable for investments purchased | $1,803,108 | |
| Payable for fund shares redeemed | 936,543 | |
| Accrued management fee | 61,238 | |
| Total liabilities | | 2,800,889 |
| Net Assets | | $780,105,328 |
| Net Assets consist of: | | |
| Paid in capital | | $711,609,000 |
| Total accumulated earnings (loss) | | 68,496,328 |
| Net Assets | | $780,105,328 |
| Net Asset Value and Maximum Offering Price | | |
| Investor Class: | | |
| Net Asset Value, offering price and redemption price per share ($417,992,884 ÷ 30,682,238 shares) | | $13.62 |
| Institutional Premium Class: | | |
| Net Asset Value, offering price and redemption price per share ($362,004,323 ÷ 26,563,964 shares) | | $13.63 |
| Premier Class: | | |
| Net Asset Value, offering price and redemption price per share ($108,121 ÷ 7,931 shares) | | $13.63 |
See accompanying notes which are an integral part of the financial statements.
Statement of Operations
| | | Six months ended September 30, 2020 (Unaudited) |
| Investment Income | | |
| Dividends: | | |
| Affiliated issuers | | $4,045,586 |
| Income from Fidelity Central Funds | | 3 |
| Total income | | 4,045,589 |
| Expenses | | |
| Management fee | $374,145 | |
| Independent trustees' fees and expenses | 1,021 | |
| Total expenses | | 375,166 |
| Net investment income (loss) | | 3,670,423 |
| Realized and Unrealized Gain (Loss) | | |
| Net realized gain (loss) on: | | |
| Investment securities: | | |
| Affiliated issuers | 1,033,300 | |
| Capital gain distributions from underlying funds: | | |
| Affiliated issuers | 872,757 | |
| Total net realized gain (loss) | | 1,906,057 |
| Change in net unrealized appreciation (depreciation) on: | | |
| Investment securities: | | |
| Affiliated issuers | 72,512,044 | |
| Total change in net unrealized appreciation (depreciation) | | 72,512,044 |
| Net gain (loss) | | 74,418,101 |
| Net increase (decrease) in net assets resulting from operations | | $78,088,524 |
See accompanying notes which are an integral part of the financial statements.
Statement of Changes in Net Assets
| | Six months ended September 30, 2020 (Unaudited) | Year ended March 31, 2020 |
| Increase (Decrease) in Net Assets | | |
| Operations | | |
| Net investment income (loss) | $3,670,423 | $12,560,351 |
| Net realized gain (loss) | 1,906,057 | 88,993,318 |
| Change in net unrealized appreciation (depreciation) | 72,512,044 | (98,136,014) |
| Net increase (decrease) in net assets resulting from operations | 78,088,524 | 3,417,655 |
| Distributions to shareholders | (5,508,624) | (99,261,191) |
| Share transactions - net increase (decrease) | 30,623,800 | 208,593,558 |
| Total increase (decrease) in net assets | 103,203,700 | 112,750,022 |
| Net Assets | | |
| Beginning of period | 676,901,628 | 564,151,606 |
| End of period | $780,105,328 | $676,901,628 |
See accompanying notes which are an integral part of the financial statements.
Financial Highlights
Fidelity Freedom Index 2010 Fund Investor Class
| | Six months ended (Unaudited) September 30, | Years endedMarch 31, | | | | |
| | 2020 | 2020 | 2019 | 2018 | 2017 | 2016 |
| Selected Per–Share Data | | | | | | |
| Net asset value, beginning of period | $12.33 | $14.17 | $14.25 | $13.72 | $13.03 | $13.36 |
| Income from Investment Operations | | | | | | |
| Net investment income (loss)A | .06 | .27 | .30 | .25 | .23 | .20 |
| Net realized and unrealized gain (loss) | 1.33 | .04B | .29 | .65 | .71 | (.30) |
| Total from investment operations | 1.39 | .31 | .59 | .90 | .94 | (.10) |
| Distributions from net investment income | (.04) | (.27) | (.30) | (.24) | (.22) | (.23) |
| Distributions from net realized gain | (.06) | (1.88) | (.37) | (.14) | (.02) | –C |
| Total distributions | (.10) | (2.15) | (.67) | (.37)D | (.25)D | (.23) |
| Net asset value, end of period | $13.62 | $12.33 | $14.17 | $14.25 | $13.72 | $13.03 |
| Total ReturnE,F | 11.32% | 1.34% | 4.43% | 6.62% | 7.24% | (.72)% |
| Ratios to Average Net AssetsG,H | | | | | | |
| Expenses before reductions | .12%I | .12% | .15% | .15% | .15% | .15% |
| Expenses net of fee waivers, if any | .12%I | .12% | .12% | .12% | .09% | .08% |
| Expenses net of all reductions | .12%I | .12% | .12% | .12% | .09% | .08% |
| Net investment income (loss) | .96%I | 1.93% | 2.13% | 1.77% | 1.70% | 1.52% |
| Supplemental Data | | | | | | |
| Net assets, end of period (000 omitted) | $417,993 | $353,955 | $254,371 | $239,660 | $205,267 | $232,187 |
| Portfolio turnover rateJ | 27%I | 83% | 45% | 22% | 36% | 22% |
A Calculated based on average shares outstanding during the period.
B The amount shown for a share outstanding does not correspond with the aggregate net gain (loss) on investments for the period due to the timing of sales and repurchases of shares in relation to fluctuating market values of the investments of the Fund.
C Amount represents less than $.005 per share.
D Total distributions per share do not sum due to rounding.
E Total returns for periods of less than one year are not annualized.
F Total returns would have been lower if certain expenses had not been reduced during the applicable periods shown.
G Fees and expenses of any underlying mutual funds or exchange-traded funds (ETFs) are not included in the Fund's expense ratio. The Fund indirectly bears its proportionate share of these expenses. For additional expense information related to investments in Fidelity Central Funds, please refer to the "Investments in Fidelity Central Funds" note found in the Notes to Financial Statements section of the most recent Annual or Semi-Annual report.
H Expense ratios reflect operating expenses of the class. Expenses before reductions do not reflect amounts reimbursed, waived, or reduced through arrangements with the investment adviser, brokerage services, or other offset arrangements, if applicable, and do not represent the amount paid by the class during periods when reimbursements, waivers or reductions occur.
I Annualized
J Amount does not include the portfolio activity of any underlying mutual funds or exchange-traded funds (ETFs).
See accompanying notes which are an integral part of the financial statements.
Fidelity Freedom Index 2010 Fund Institutional Premium Class
| | Six months ended (Unaudited) September 30, | Years endedMarch 31, | | | | |
| | 2020 | 2020 | 2019 | 2018 | 2017 | 2016 A |
| Selected Per–Share Data | | | | | | |
| Net asset value, beginning of period | $12.33 | $14.17 | $14.25 | $13.73 | $13.03 | $13.43 |
| Income from Investment Operations | | | | | | |
| Net investment income (loss)B | .07 | .28 | .31 | .26 | .24 | .27 |
| Net realized and unrealized gain (loss) | 1.33 | .04C | .29 | .64 | .71 | (.46) |
| Total from investment operations | 1.40 | .32 | .60 | .90 | .95 | (.19) |
| Distributions from net investment income | (.04) | (.28) | (.31) | (.24) | (.23) | (.21) |
| Distributions from net realized gain | (.06) | (1.88) | (.37) | (.14) | (.02) | –D |
| Total distributions | (.10) | (2.16) | (.68) | (.38) | (.25) | (.21) |
| Net asset value, end of period | $13.63 | $12.33 | $14.17 | $14.25 | $13.73 | $13.03 |
| Total ReturnE,F | 11.41% | 1.37% | 4.49% | 6.59% | 7.39% | (1.39)% |
| Ratios to Average Net AssetsG,H | | | | | | |
| Expenses before reductions | .08%I | .08% | .10% | .10% | .09% | .05%I |
| Expenses net of fee waivers, if any | .08%I | .08% | .06% | .07% | .04% | .02%I |
| Expenses net of all reductions | .08%I | .08% | .06% | .07% | .04% | .02%I |
| Net investment income (loss) | 1.00%I | 1.98% | 2.19% | 1.82% | 1.75% | 2.81%I |
| Supplemental Data | | | | | | |
| Net assets, end of period (000 omitted) | $362,004 | $322,946 | $309,781 | $319,248 | $286,173 | $215,392 |
| Portfolio turnover rateJ | 27%I | 83% | 45% | 22% | 36% | 22% |
A For the period June 24, 2015 (commencement of sale of shares) to March 31, 2016.
B Calculated based on average shares outstanding during the period.
C The amount shown for a share outstanding does not correspond with the aggregate net gain (loss) on investments for the period due to the timing of sales and repurchases of shares in relation to fluctuating market values of the investments of the Fund.
D Amount represents less than $.005 per share.
E Total returns for periods of less than one year are not annualized.
F Total returns would have been lower if certain expenses had not been reduced during the applicable periods shown.
G Fees and expenses of any underlying mutual funds or exchange-traded funds (ETFs) are not included in the Fund's expense ratio. The Fund indirectly bears its proportionate share of these expenses. For additional expense information related to investments in Fidelity Central Funds, please refer to the "Investments in Fidelity Central Funds" note found in the Notes to Financial Statements section of the most recent Annual or Semi-Annual report.
H Expense ratios reflect operating expenses of the class. Expenses before reductions do not reflect amounts reimbursed, waived, or reduced through arrangements with the investment adviser, brokerage services, or other offset arrangements, if applicable, and do not represent the amount paid by the class during periods when reimbursements, waivers or reductions occur.
I Annualized
J Amount does not include the portfolio activity of any underlying mutual funds or exchange-traded funds (ETFs).
See accompanying notes which are an integral part of the financial statements.
Fidelity Freedom Index 2010 Fund Premier Class
| | Six months ended (Unaudited) September 30, |
| | 2020 A |
| Selected Per–Share Data | |
| Net asset value, beginning of period | $13.15 |
| Income from Investment Operations | |
| Net investment income (loss)B | .03 |
| Net realized and unrealized gain (loss) | .45 |
| Total from investment operations | .48 |
| Net asset value, end of period | $13.63 |
| Total ReturnC | 3.65% |
| Ratios to Average Net AssetsD,E | |
| Expenses before reductions | .06%F |
| Expenses net of fee waivers, if any | .06%F |
| Expenses net of all reductions | .06%F |
| Net investment income (loss) | .80%F |
| Supplemental Data | |
| Net assets, end of period (000 omitted) | $108 |
| Portfolio turnover rateG | 27%F |
A For the period June 24, 2020 (commencement of sale of shares) to September 30, 2020.
B Calculated based on average shares outstanding during the period.
C Total returns for periods of less than one year are not annualized.
D Fees and expenses of any underlying mutual funds or exchange-traded funds (ETFs) are not included in the Fund's expense ratio. The Fund indirectly bears its proportionate share of these expenses. For additional expense information related to investments in Fidelity Central Funds, please refer to the "Investments in Fidelity Central Funds" note found in the Notes to Financial Statements section of the most recent Annual or Semi-Annual report.
E Expense ratios reflect operating expenses of the class. Expenses before reductions do not reflect amounts reimbursed, waived, or reduced through arrangements with the investment adviser, brokerage services, or other offset arrangements, if applicable, and do not represent the amount paid by the class during periods when reimbursements, waivers or reductions occur.
F Annualized
G Amount does not include the portfolio activity of any underlying mutual funds or exchange-traded funds (ETFs).
See accompanying notes which are an integral part of the financial statements.
Fidelity Freedom® Index 2015 Fund
Investment Summary (Unaudited)
The information in the following tables is based on the direct investments of the Fund.
Top Holdings as of September 30, 2020
| | % of fund's net assets |
| Fidelity Series Bond Index Fund | 36.6 |
| Fidelity Series Total Market Index Fund | 25.3 |
| Fidelity Series Global ex U.S. Index Fund | 17.0 |
| Fidelity Series Treasury Bill Index Fund | 11.8 |
| Fidelity Series Inflation-Protected Bond Index Fund | 6.3 |
| Fidelity Series Long-Term Treasury Bond Index Fund | 3.0 |
| Fidelity Cash Central Fund 0.10% | 0.0 |
| | 100.0 |
Asset Allocation (% of fund's net assets)
| Period end |
| | Domestic Equity Funds | 25.3% |
| | International Equity Funds | 17.0% |
| | Bond Funds | 39.6% |
| | Inflation-Protected Bond Funds | 6.3% |
| | Short-Term Funds | 11.8% |

Percentages shown as 0.0% may reflect amounts less than 0.05%.
Fidelity Freedom® Index 2015 Fund
Schedule of Investments September 30, 2020 (Unaudited)
Showing Percentage of Net Assets
| Domestic Equity Funds - 25.3% | | | |
| | | Shares | Value |
| Fidelity Series Total Market Index Fund (a) | | | |
| (Cost $392,346,721) | | 39,800,129 | 454,517,478 |
|
| International Equity Funds - 17.0% | | | |
| Fidelity Series Global ex U.S. Index Fund (a) | | | |
| (Cost $268,976,685) | | 24,322,773 | 304,521,112 |
|
| Bond Funds - 39.6% | | | |
| Fidelity Series Bond Index Fund (a) | | 60,358,718 | 656,702,854 |
| Fidelity Series Long-Term Treasury Bond Index Fund (a) | | 5,263,183 | 54,368,683 |
| TOTAL BOND FUNDS | | | |
| (Cost $658,395,146) | | | 711,071,537 |
|
| Inflation-Protected Bond Funds - 6.3% | | | |
| Fidelity Series Inflation-Protected Bond Index Fund (a) | | | |
| (Cost $106,403,431) | | 10,621,091 | 113,645,675 |
|
| Short-Term Funds - 11.8% | | | |
| Fidelity Cash Central Fund 0.10% (b) | | 1,828 | 1,828 |
| Fidelity Series Treasury Bill Index Fund (a) | | 21,125,248 | 211,463,731 |
| TOTAL SHORT-TERM FUNDS | | | |
| (Cost $211,294,172) | | | 211,465,559 |
| TOTAL INVESTMENT IN SECURITIES - 100.0% | | | |
| (Cost $1,637,416,155) | | | 1,795,221,361 |
| NET OTHER ASSETS (LIABILITIES) - 0.0% | | | (141,423) |
| NET ASSETS - 100% | | | $1,795,079,938 |
Legend
(a) Affiliated Fund
(b) Affiliated fund that is generally available only to investment companies and other accounts managed by Fidelity Investments. The rate quoted is the annualized seven-day yield of the fund at period end. A complete unaudited listing of the fund's holdings as of its most recent quarter end is available upon request. In addition, each Fidelity Central Fund's financial statements are available on the SEC's website or upon request.
Affiliated Central Funds
Information regarding fiscal year to date income earned by the Fund from investments in Fidelity Central Funds is as follows:
| Fund | Income earned |
| Fidelity Cash Central Fund | $8 |
| Total | $8 |
Amounts in the income column in the above table include any capital gain distributions from underlying funds, which are presented in the corresponding line-item in the Statement of Operations, if applicable.
Affiliated Underlying Funds
Fiscal year to date information regarding the Fund's investments in affiliated Underlying Funds, excluding any Money Market Central Funds, is presented below. Exchanges between classes of the same affiliated Underlying Funds may occur.
| Affiliate | Value, beginning of period | Purchases | Sales Proceeds | Dividend Income | Realized Gain (loss) | Change in Unrealized appreciation (depreciation) | Value, end of period |
| Fidelity Series Bond Index Fund | $569,779,591 | $125,739,155 | $51,613,964 | $6,491,269 | $97,018 | $12,701,054 | $656,702,854 |
| Fidelity Series Global ex U.S. Index Fund | 270,265,990 | 21,158,926 | 50,907,312 | -- | (1,631,026) | 65,634,534 | 304,521,112 |
| Fidelity Series Inflation-Protected Bond Index Fund | 97,440,517 | 17,400,266 | 7,489,472 | 86,291 | 129,977 | 6,164,387 | 113,645,675 |
| Fidelity Series Long-Term Treasury Bond Index Fund | 47,428,737 | 12,322,339 | 3,745,092 | 1,336,023 | 42,344 | (1,679,645) | 54,368,683 |
| Fidelity Series Total Market Index Fund | 401,548,581 | 40,725,570 | 114,838,629 | 2,167,747 | 5,933,270 | 121,148,686 | 454,517,478 |
| Fidelity Series Treasury Bill Index Fund | 178,532,622 | 48,438,715 | 14,945,621 | 757,725 | (8,106) | (553,879) | 211,463,731 |
| Total | $1,564,996,038 | $265,784,971 | $243,540,090 | $10,839,055 | $4,563,477 | $203,415,137 | $1,795,219,533 |
Amounts in the income column in the above table include any capital gain distributions from underlying funds, which are presented in the corresponding line-item in the Statement of Operations, if applicable.
Investment Valuation
The following is a summary of the inputs used, as of September 30, 2020, involving the Fund's assets and liabilities carried at fair value. The inputs or methodology used for valuing securities may not be an indication of the risk associated with investing in those securities. For more information on valuation inputs, and their aggregation into the levels used below, please refer to the Investment Valuation section in the accompanying Notes to Financial Statements.
| | Valuation Inputs at Reporting Date: |
| Description | Total | Level 1 | Level 2 | Level 3 |
| Investments in Securities: | | | | |
| Domestic Equity Funds | $454,517,478 | $454,517,478 | $-- | $-- |
| International Equity Funds | 304,521,112 | 304,521,112 | -- | -- |
| Bond Funds | 824,717,212 | 824,717,212 | -- | -- |
| Short-Term Funds | 211,465,559 | 211,465,559 | -- | -- |
| Total Investments in Securities: | $1,795,221,361 | $1,795,221,361 | $-- | $-- |
See accompanying notes which are an integral part of the financial statements.
Fidelity Freedom® Index 2015 Fund
Financial Statements
Statement of Assets and Liabilities
| | | September 30, 2020 (Unaudited) |
| Assets | | |
Investment in securities, at value — See accompanying schedule:
| | |
| Fidelity Central Funds (cost $1,828) | $1,828 | |
| Other affiliated issuers (cost $1,637,414,327) | 1,795,219,533 | |
| Total Investment in Securities (cost $1,637,416,155) | | $1,795,221,361 |
| Receivable for investments sold | | 4,992,436 |
| Receivable for fund shares sold | | 4,668,906 |
| Distributions receivable from Fidelity Central Funds | | 7 |
| Total assets | | 1,804,882,710 |
| Liabilities | | |
| Payable for investments purchased | $6,268,023 | |
| Payable for fund shares redeemed | 3,393,320 | |
| Accrued management fee | 141,429 | |
| Total liabilities | | 9,802,772 |
| Net Assets | | $1,795,079,938 |
| Net Assets consist of: | | |
| Paid in capital | | $1,629,115,782 |
| Total accumulated earnings (loss) | | 165,964,156 |
| Net Assets | | $1,795,079,938 |
| Net Asset Value and Maximum Offering Price | | |
| Investor Class: | | |
| Net Asset Value, offering price and redemption price per share ($1,055,973,206 ÷ 73,402,885 shares) | | $14.39 |
| Institutional Premium Class: | | |
| Net Asset Value, offering price and redemption price per share ($737,547,308 ÷ 51,290,228 shares) | | $14.38 |
| Premier Class: | | |
| Net Asset Value, offering price and redemption price per share ($1,559,424 ÷ 108,414 shares) | | $14.38 |
See accompanying notes which are an integral part of the financial statements.
Statement of Operations
| | | Six months ended September 30, 2020 (Unaudited) |
| Investment Income | | |
| Dividends: | | |
| Affiliated issuers | | $8,867,889 |
| Income from Fidelity Central Funds | | 8 |
| Total income | | 8,867,897 |
| Expenses | | |
| Management fee | $879,799 | |
| Independent trustees' fees and expenses | 2,366 | |
| Total expenses before reductions | 882,165 | |
| Expense reductions | (1) | |
| Total expenses after reductions | | 882,164 |
| Net investment income (loss) | | 7,985,733 |
| Realized and Unrealized Gain (Loss) | | |
| Net realized gain (loss) on: | | |
| Investment securities: | | |
| Affiliated issuers | 4,563,477 | |
| Capital gain distributions from underlying funds: | | |
| Affiliated issuers | 1,971,166 | |
| Total net realized gain (loss) | | 6,534,643 |
| Change in net unrealized appreciation (depreciation) on: | | |
| Investment securities: | | |
| Affiliated issuers | 203,415,137 | |
| Total change in net unrealized appreciation (depreciation) | | 203,415,137 |
| Net gain (loss) | | 209,949,780 |
| Net increase (decrease) in net assets resulting from operations | | $217,935,513 |
See accompanying notes which are an integral part of the financial statements.
Statement of Changes in Net Assets
| | Six months ended September 30, 2020 (Unaudited) | Year ended March 31, 2020 |
| Increase (Decrease) in Net Assets | | |
| Operations | | |
| Net investment income (loss) | $7,985,733 | $29,557,836 |
| Net realized gain (loss) | 6,534,643 | 236,214,993 |
| Change in net unrealized appreciation (depreciation) | 203,415,137 | (283,049,557) |
| Net increase (decrease) in net assets resulting from operations | 217,935,513 | (17,276,728) |
| Distributions to shareholders | (12,301,042) | (261,095,790) |
| Share transactions - net increase (decrease) | 24,570,120 | 523,987,798 |
| Total increase (decrease) in net assets | 230,204,591 | 245,615,280 |
| Net Assets | | |
| Beginning of period | 1,564,875,347 | 1,319,260,067 |
| End of period | $1,795,079,938 | $1,564,875,347 |
See accompanying notes which are an integral part of the financial statements.
Financial Highlights
Fidelity Freedom Index 2015 Fund Investor Class
| | Six months ended (Unaudited) September 30, | Years endedMarch 31, | | | | |
| | 2020 | 2020 | 2019 | 2018 | 2017 | 2016 |
| Selected Per–Share Data | | | | | | |
| Net asset value, beginning of period | $12.74 | $15.09 | $14.92 | $14.11 | $13.22 | $13.62 |
| Income from Investment Operations | | | | | | |
| Net investment income (loss)A | .06 | .29 | .32 | .27 | .25 | .23 |
| Net realized and unrealized gain (loss) | 1.69 | (.12) | .33 | .83 | .89 | (.38) |
| Total from investment operations | 1.75 | .17 | .65 | 1.10 | 1.14 | (.15) |
| Distributions from net investment income | (.04) | (.29) | (.31) | (.25) | (.24) | (.25) |
| Distributions from net realized gain | (.06) | (2.23) | (.17) | (.04) | (.01) | –B |
| Total distributions | (.10) | (2.52) | (.48) | (.29) | (.25) | (.25) |
| Net asset value, end of period | $14.39 | $12.74 | $15.09 | $14.92 | $14.11 | $13.22 |
| Total ReturnC,D | 13.79% | (.17)% | 4.55% | 7.82% | 8.71% | (1.10)% |
| Ratios to Average Net AssetsE,F | | | | | | |
| Expenses before reductions | .12%G | .12% | .15% | .15% | .15% | .15% |
| Expenses net of fee waivers, if any | .12%G | .12% | .12% | .12% | .10% | .08% |
| Expenses net of all reductions | .12%G | .12% | .12% | .12% | .10% | .08% |
| Net investment income (loss) | .90%G | 1.93% | 2.12% | 1.81% | 1.80% | 1.70% |
| Supplemental Data | | | | | | |
| Net assets, end of period (000 omitted) | $1,055,973 | $887,110 | $721,922 | $637,221 | $516,456 | $577,905 |
| Portfolio turnover rateH | 28%G | 87% | 36% | 17% | 29% | 22% |
A Calculated based on average shares outstanding during the period.
B Amount represents less than $.005 per share.
C Total returns for periods of less than one year are not annualized.
D Total returns would have been lower if certain expenses had not been reduced during the applicable periods shown.
E Fees and expenses of any underlying mutual funds or exchange-traded funds (ETFs) are not included in the Fund's expense ratio. The Fund indirectly bears its proportionate share of these expenses. For additional expense information related to investments in Fidelity Central Funds, please refer to the "Investments in Fidelity Central Funds" note found in the Notes to Financial Statements section of the most recent Annual or Semi-Annual report.
F Expense ratios reflect operating expenses of the class. Expenses before reductions do not reflect amounts reimbursed, waived, or reduced through arrangements with the investment adviser, brokerage services, or other offset arrangements, if applicable, and do not represent the amount paid by the class during periods when reimbursements, waivers or reductions occur.
G Annualized
H Amount does not include the portfolio activity of any underlying mutual funds or exchange-traded funds (ETFs).
See accompanying notes which are an integral part of the financial statements.
Fidelity Freedom Index 2015 Fund Institutional Premium Class
| | Six months ended (Unaudited) September 30, | Years endedMarch 31, | | | | |
| | 2020 | 2020 | 2019 | 2018 | 2017 | 2016 A |
| Selected Per–Share Data | | | | | | |
| Net asset value, beginning of period | $12.73 | $15.08 | $14.92 | $14.10 | $13.21 | $13.72 |
| Income from Investment Operations | | | | | | |
| Net investment income (loss)B | .07 | .30 | .33 | .27 | .25 | .28 |
| Net realized and unrealized gain (loss) | 1.68 | (.12) | .31 | .85 | .90 | (.56) |
| Total from investment operations | 1.75 | .18 | .64 | 1.12 | 1.15 | (.28) |
| Distributions from net investment income | (.04) | (.29) | (.32) | (.26) | (.25) | (.23) |
| Distributions from net realized gain | (.06) | (2.23) | (.17) | (.04) | (.01) | –C |
| Total distributions | (.10) | (2.53) | (.48)D | (.30) | (.26) | (.23) |
| Net asset value, end of period | $14.38 | $12.73 | $15.08 | $14.92 | $14.10 | $13.21 |
| Total ReturnE,F | 13.82% | (.15)% | 4.55% | 7.94% | 8.79% | (2.03)% |
| Ratios to Average Net AssetsG,H | | | | | | |
| Expenses before reductions | .08%I | .08% | .10% | .10% | .09% | .05%I |
| Expenses net of fee waivers, if any | .08%I | .08% | .06% | .07% | .04% | .02%I |
| Expenses net of all reductions | .08%I | .08% | .06% | .07% | .04% | .02%I |
| Net investment income (loss) | .94%I | 1.97% | 2.18% | 1.86% | 1.85% | 2.84%I |
| Supplemental Data | | | | | | |
| Net assets, end of period (000 omitted) | $737,547 | $677,766 | $597,338 | $560,428 | $520,752 | $330,221 |
| Portfolio turnover rateJ | 28%I | 87% | 36% | 17% | 29% | 22% |
A For the period June 24, 2015 (commencement of sale of shares) to March 31, 2016.
B Calculated based on average shares outstanding during the period.
C Amount represents less than $.005 per share.
D Total distributions per share do not sum due to rounding.
E Total returns for periods of less than one year are not annualized.
F Total returns would have been lower if certain expenses had not been reduced during the applicable periods shown.
G Fees and expenses of any underlying mutual funds or exchange-traded funds (ETFs) are not included in the Fund's expense ratio. The Fund indirectly bears its proportionate share of these expenses. For additional expense information related to investments in Fidelity Central Funds, please refer to the "Investments in Fidelity Central Funds" note found in the Notes to Financial Statements section of the most recent Annual or Semi-Annual report.
H Expense ratios reflect operating expenses of the class. Expenses before reductions do not reflect amounts reimbursed, waived, or reduced through arrangements with the investment adviser, brokerage services, or other offset arrangements, if applicable, and do not represent the amount paid by the class during periods when reimbursements, waivers or reductions occur.
I Annualized
J Amount does not include the portfolio activity of any underlying mutual funds or exchange-traded funds (ETFs).
See accompanying notes which are an integral part of the financial statements.
Fidelity Freedom Index 2015 Fund Premier Class
| | Six months ended (Unaudited) September 30, |
| | 2020 A |
| Selected Per–Share Data | |
| Net asset value, beginning of period | $13.77 |
| Income from Investment Operations | |
| Net investment income (loss)B | .03 |
| Net realized and unrealized gain (loss) | .58 |
| Total from investment operations | .61 |
| Net asset value, end of period | $14.38 |
| Total ReturnC,D | 4.43% |
| Ratios to Average Net AssetsE,F | |
| Expenses before reductions | .06%G |
| Expenses net of fee waivers, if any | .06%G |
| Expenses net of all reductions | .06%G |
| Net investment income (loss) | .73%G |
| Supplemental Data | |
| Net assets, end of period (000 omitted) | $1,559 |
| Portfolio turnover rateH | 28%G |
A For the period June 24, 2020 (commencement of sale of shares) to September 30, 2020.
B Calculated based on average shares outstanding during the period.
C Total returns for periods of less than one year are not annualized.
D Total returns would have been lower if certain expenses had not been reduced during the applicable periods shown.
E Fees and expenses of any underlying mutual funds or exchange-traded funds (ETFs) are not included in the Fund's expense ratio. The Fund indirectly bears its proportionate share of these expenses. For additional expense information related to investments in Fidelity Central Funds, please refer to the "Investments in Fidelity Central Funds" note found in the Notes to Financial Statements section of the most recent Annual or Semi-Annual report.
F Expense ratios reflect operating expenses of the class. Expenses before reductions do not reflect amounts reimbursed, waived, or reduced through arrangements with the investment adviser, brokerage services, or other offset arrangements, if applicable, and do not represent the amount paid by the class during periods when reimbursements, waivers or reductions occur.
G Annualized
H Amount does not include the portfolio activity of any underlying mutual funds or exchange-traded funds (ETFs).
See accompanying notes which are an integral part of the financial statements.
Fidelity Freedom® Index 2020 Fund
Investment Summary (Unaudited)
The information in the following tables is based on the direct investments of the Fund.
Top Holdings as of September 30, 2020
| | % of fund's net assets |
| Fidelity Series Bond Index Fund | 33.0 |
| Fidelity Series Total Market Index Fund | 30.5 |
| Fidelity Series Global ex U.S. Index Fund | 20.4 |
| Fidelity Series Treasury Bill Index Fund | 8.0 |
| Fidelity Series Inflation-Protected Bond Index Fund | 5.1 |
| Fidelity Series Long-Term Treasury Bond Index Fund | 3.0 |
| Fidelity Cash Central Fund 0.10% | 0.0 |
| | 100.0 |
Asset Allocation (% of fund's net assets)
| Period end |
| | Domestic Equity Funds | 30.5% |
| | International Equity Funds | 20.4% |
| | Bond Funds | 36.0% |
| | Inflation-Protected Bond Funds | 5.1% |
| | Short-Term Funds | 8.0% |

Percentages shown as 0.0% may reflect amounts less than 0.05%.
Fidelity Freedom® Index 2020 Fund
Schedule of Investments September 30, 2020 (Unaudited)
Showing Percentage of Net Assets
| Domestic Equity Funds - 30.5% | | | |
| | | Shares | Value |
| Fidelity Series Total Market Index Fund (a) | | | |
| (Cost $1,641,898,471) | | 166,048,573 | 1,896,274,707 |
|
| International Equity Funds - 20.4% | | | |
| Fidelity Series Global ex U.S. Index Fund (a) | | | |
| (Cost $1,156,469,630) | | 101,459,667 | 1,270,275,036 |
|
| Bond Funds - 36.0% | | | |
| Fidelity Series Bond Index Fund (a) | | 188,503,533 | 2,050,918,443 |
| Fidelity Series Long-Term Treasury Bond Index Fund (a) | | 18,226,145 | 188,276,080 |
| TOTAL BOND FUNDS | | | |
| (Cost $2,075,531,833) | | | 2,239,194,523 |
|
| Inflation-Protected Bond Funds - 5.1% | | | |
| Fidelity Series Inflation-Protected Bond Index Fund (a) | | | |
| (Cost $294,203,555) | | 29,570,520 | 316,404,562 |
|
| Short-Term Funds - 8.0% | | | |
| Fidelity Cash Central Fund 0.10% (b) | | 8,004 | 8,006 |
| Fidelity Series Treasury Bill Index Fund (a) | | 49,733,290 | 497,830,236 |
| TOTAL SHORT-TERM FUNDS | | | |
| (Cost $497,454,437) | | | 497,838,242 |
| TOTAL INVESTMENT IN SECURITIES - 100.0% | | | |
| (Cost $5,665,557,926) | | | 6,219,987,070 |
| NET OTHER ASSETS (LIABILITIES) - 0.0% | | | (459,199) |
| NET ASSETS - 100% | | | $6,219,527,871 |
Legend
(a) Affiliated Fund
(b) Affiliated fund that is generally available only to investment companies and other accounts managed by Fidelity Investments. The rate quoted is the annualized seven-day yield of the fund at period end. A complete unaudited listing of the fund's holdings as of its most recent quarter end is available upon request. In addition, each Fidelity Central Fund's financial statements are available on the SEC's website or upon request.
Affiliated Central Funds
Information regarding fiscal year to date income earned by the Fund from investments in Fidelity Central Funds is as follows:
| Fund | Income earned |
| Fidelity Cash Central Fund | $3 |
| Total | $3 |
Amounts in the income column in the above table include any capital gain distributions from underlying funds, which are presented in the corresponding line-item in the Statement of Operations, if applicable.
Affiliated Underlying Funds
Fiscal year to date information regarding the Fund's investments in affiliated Underlying Funds, excluding any Money Market Central Funds, is presented below. Exchanges between classes of the same affiliated Underlying Funds may occur.
| Affiliate | Value, beginning of period | Purchases | Sales Proceeds | Dividend Income | Realized Gain (loss) | Change in Unrealized appreciation (depreciation) | Value, end of period |
| Fidelity Series Bond Index Fund | $1,732,759,702 | $410,599,613 | $131,300,968 | $19,891,739 | $213,638 | $38,646,458 | $2,050,918,443 |
| Fidelity Series Global ex U.S. Index Fund | 1,084,026,871 | 77,771,411 | 148,467,644 | -- | (4,986,494) | 261,930,892 | 1,270,275,036 |
| Fidelity Series Inflation-Protected Bond Index Fund | 262,939,106 | 52,574,868 | 16,146,057 | 233,971 | 191,095 | 16,845,550 | 316,404,562 |
| Fidelity Series Long-Term Treasury Bond Index Fund | 159,563,920 | 45,349,506 | 11,163,035 | 4,511,506 | 178,618 | (5,652,929) | 188,276,080 |
| Fidelity Series Total Market Index Fund | 1,610,508,398 | 151,664,211 | 376,703,274 | 8,705,383 | 15,106,225 | 495,699,147 | 1,896,274,707 |
| Fidelity Series Treasury Bill Index Fund | 408,468,808 | 118,961,071 | 28,302,122 | 1,748,482 | (12,770) | (1,284,751) | 497,830,236 |
| | $5,258,266,805 | $856,920,680 | $712,083,100 | $35,091,081 | $10,690,312 | $806,184,367 | $6,219,979,064 |
Amounts in the income column in the above table include any capital gain distributions from underlying funds, which are presented in the corresponding line-item in the Statement of Operations, if applicable.
Investment Valuation
The following is a summary of the inputs used, as of September 30, 2020, involving the Fund's assets and liabilities carried at fair value. The inputs or methodology used for valuing securities may not be an indication of the risk associated with investing in those securities. For more information on valuation inputs, and their aggregation into the levels used below, please refer to the Investment Valuation section in the accompanying Notes to Financial Statements.
| | Valuation Inputs at Reporting Date: |
| Description | Total | Level 1 | Level 2 | Level 3 |
| Investments in Securities: | | | | |
| Domestic Equity Funds | $1,896,274,707 | $1,896,274,707 | $-- | $-- |
| International Equity Funds | 1,270,275,036 | 1,270,275,036 | -- | -- |
| Bond Funds | 2,555,599,085 | 2,555,599,085 | -- | -- |
| Short-Term Funds | 497,838,242 | 497,838,242 | -- | -- |
| Total Investments in Securities: | $6,219,987,070 | $6,219,987,070 | $-- | $-- |
See accompanying notes which are an integral part of the financial statements.
Fidelity Freedom® Index 2020 Fund
Financial Statements
Statement of Assets and Liabilities
| | | September 30, 2020 (Unaudited) |
| Assets | | |
Investment in securities, at value — See accompanying schedule:
| | |
| Fidelity Central Funds (cost $8,006) | $8,006 | |
| Other affiliated issuers (cost $5,665,549,920) | 6,219,979,064 | |
| Total Investment in Securities (cost $5,665,557,926) | | $6,219,987,070 |
| Cash | | 2 |
| Receivable for investments sold | | 22,977,398 |
| Receivable for fund shares sold | | 13,757,983 |
| Distributions receivable from Fidelity Central Funds | | 1 |
| Total assets | | 6,256,722,454 |
| Liabilities | | |
| Payable for investments purchased | $25,488,014 | |
| Payable for fund shares redeemed | 11,247,368 | |
| Accrued management fee | 459,201 | |
| Total liabilities | | 37,194,583 |
| Net Assets | | $6,219,527,871 |
| Net Assets consist of: | | |
| Paid in capital | | $5,648,567,669 |
| Total accumulated earnings (loss) | | 570,960,202 |
| Net Assets | | $6,219,527,871 |
| Net Asset Value and Maximum Offering Price | | |
| Investor Class: | | |
| Net Asset Value, offering price and redemption price per share ($3,080,045,686 ÷ 199,311,423 shares) | | $15.45 |
| Institutional Premium Class: | | |
| Net Asset Value, offering price and redemption price per share ($3,137,899,676 ÷ 203,102,217 shares) | | $15.45 |
| Premier Class: | | |
| Net Asset Value, offering price and redemption price per share ($1,582,509 ÷ 102,416 shares) | | $15.45 |
See accompanying notes which are an integral part of the financial statements.
Statement of Operations
| | | Six months ended September 30, 2020 (Unaudited) |
| Investment Income | | |
| Dividends: | | |
| Affiliated issuers | | $28,537,647 |
| Income from Fidelity Central Funds | | 3 |
| Total income | | 28,537,650 |
| Expenses | | |
| Management fee | $2,879,498 | |
| Independent trustees' fees and expenses | 8,022 | |
| Total expenses before reductions | 2,887,520 | |
| Expense reductions | (2) | |
| Total expenses after reductions | | 2,887,518 |
| Net investment income (loss) | | 25,650,132 |
| Realized and Unrealized Gain (Loss) | | |
| Net realized gain (loss) on: | | |
| Investment securities: | | |
| Affiliated issuers | 10,690,312 | |
| Capital gain distributions from underlying funds: | | |
| Affiliated issuers | 6,553,434 | |
| Total net realized gain (loss) | | 17,243,746 |
| Change in net unrealized appreciation (depreciation) on: | | |
| Investment securities: | | |
| Affiliated issuers | 806,184,367 | |
| Total change in net unrealized appreciation (depreciation) | | 806,184,367 |
| Net gain (loss) | | 823,428,113 |
| Net increase (decrease) in net assets resulting from operations | | $849,078,245 |
See accompanying notes which are an integral part of the financial statements.
Statement of Changes in Net Assets
| | Six months ended September 30, 2020 (Unaudited) | Year ended March 31, 2020 |
| Increase (Decrease) in Net Assets | | |
| Operations | | |
| Net investment income (loss) | $25,650,132 | $100,716,061 |
| Net realized gain (loss) | 17,243,746 | 774,216,027 |
| Change in net unrealized appreciation (depreciation) | 806,184,367 | (1,021,004,486) |
| Net increase (decrease) in net assets resulting from operations | 849,078,245 | (146,072,398) |
| Distributions to shareholders | (40,358,702) | (862,509,646) |
| Share transactions - net increase (decrease) | 152,924,308 | 1,766,341,135 |
| Total increase (decrease) in net assets | 961,643,851 | 757,759,091 |
| Net Assets | | |
| Beginning of period | 5,257,884,020 | 4,500,124,929 |
| End of period | $6,219,527,871 | $5,257,884,020 |
See accompanying notes which are an integral part of the financial statements.
Financial Highlights
Fidelity Freedom Index 2020 Fund Investor Class
| | Six months ended (Unaudited) September 30, | Years endedMarch 31, | | | | |
| | 2020 | 2020 | 2019 | 2018 | 2017 | 2016 |
| Selected Per–Share Data | | | | | | |
| Net asset value, beginning of period | $13.41 | $16.01 | $15.69 | $14.70 | $13.65 | $14.10 |
| Income from Investment Operations | | | | | | |
| Net investment income (loss)A | .06 | .31 | .33 | .29 | .27 | .23 |
| Net realized and unrealized gain (loss) | 2.08 | (.31) | .36 | .99 | 1.04 | (.42) |
| Total from investment operations | 2.14 | –B | .69 | 1.28 | 1.31 | (.19) |
| Distributions from net investment income | (.03) | (.30) | (.32) | (.27) | (.25) | (.26) |
| Distributions from net realized gain | (.07) | (2.30) | (.05) | (.02) | (.01) | –B |
| Total distributions | (.10) | (2.60) | (.37) | (.29) | (.26) | (.26) |
| Net asset value, end of period | $15.45 | $13.41 | $16.01 | $15.69 | $14.70 | $13.65 |
| Total ReturnC,D | 16.04% | (1.62)% | 4.59% | 8.72% | 9.68% | (1.34)% |
| Ratios to Average Net AssetsE,F | | | | | | |
| Expenses before reductions | .12%G | .12% | .15% | .15% | .15% | .15% |
| Expenses net of fee waivers, if any | .12%G | .12% | .11% | .12% | .10% | .08% |
| Expenses net of all reductions | .12%G | .12% | .11% | .12% | .10% | .08% |
| Net investment income (loss) | .85%G | 1.92% | 2.12% | 1.86% | 1.88% | 1.69% |
| Supplemental Data | | | | | | |
| Net assets, end of period (000 omitted) | $3,080,046 | $2,544,746 | $1,971,676 | $1,638,441 | $1,295,896 | $1,410,489 |
| Portfolio turnover rateH | 24%G | 87% | 26% | 11% | 20% | 16% |
A Calculated based on average shares outstanding during the period.
B Amount represents less than $.005 per share.
C Total returns for periods of less than one year are not annualized.
D Total returns would have been lower if certain expenses had not been reduced during the applicable periods shown.
E Fees and expenses of any underlying mutual funds or exchange-traded funds (ETFs) are not included in the Fund's expense ratio. The Fund indirectly bears its proportionate share of these expenses. For additional expense information related to investments in Fidelity Central Funds, please refer to the "Investments in Fidelity Central Funds" note found in the Notes to Financial Statements section of the most recent Annual or Semi-Annual report.
F Expense ratios reflect operating expenses of the class. Expenses before reductions do not reflect amounts reimbursed, waived, or reduced through arrangements with the investment adviser, brokerage services, or other offset arrangements, if applicable, and do not represent the amount paid by the class during periods when reimbursements, waivers or reductions occur.
G Annualized
H Amount does not include the portfolio activity of any underlying mutual funds or exchange-traded funds (ETFs).
See accompanying notes which are an integral part of the financial statements.
Fidelity Freedom Index 2020 Fund Institutional Premium Class
| | Six months ended (Unaudited) September 30, | Years endedMarch 31, | | | | |
| | 2020 | 2020 | 2019 | 2018 | 2017 | 2016 A |
| Selected Per–Share Data | | | | | | |
| Net asset value, beginning of period | $13.41 | $16.01 | $15.69 | $14.70 | $13.65 | $14.24 |
| Income from Investment Operations | | | | | | |
| Net investment income (loss)B | .07 | .31 | .34 | .30 | .27 | .32 |
| Net realized and unrealized gain (loss) | 2.07 | (.31) | .36 | .99 | 1.05 | (.67) |
| Total from investment operations | 2.14 | –C | .70 | 1.29 | 1.32 | (.35) |
| Distributions from net investment income | (.04) | (.31) | (.33) | (.28) | (.26) | (.24) |
| Distributions from net realized gain | (.07) | (2.30) | (.05) | (.02) | (.01) | –C |
| Total distributions | (.10)D | (2.60)D | (.38) | (.30) | (.27) | (.24) |
| Net asset value, end of period | $15.45 | $13.41 | $16.01 | $15.69 | $14.70 | $13.65 |
| Total ReturnE,F | 16.06% | (1.57)% | 4.65% | 8.77% | 9.75% | (2.42)% |
| Ratios to Average Net AssetsG,H | | | | | | |
| Expenses before reductions | .08%I | .08% | .10% | .10% | .09% | .05%I |
| Expenses net of fee waivers, if any | .08%I | .08% | .06% | .07% | .05% | .02%I |
| Expenses net of all reductions | .08%I | .08% | .06% | .07% | .05% | .02%I |
| Net investment income (loss) | .89%I | 1.96% | 2.18% | 1.91% | 1.93% | 3.12%I |
| Supplemental Data | | | | | | |
| Net assets, end of period (000 omitted) | $3,137,900 | $2,713,138 | $2,528,449 | $2,304,112 | $1,994,180 | $1,249,900 |
| Portfolio turnover rateJ | 24%I | 87% | 26% | 11% | 20% | 16% |
A For the period June 24, 2015 (commencement of sale of shares) to March 31, 2016.
B Calculated based on average shares outstanding during the period.
C Amount represents less than $.005 per share.
D Total distributions per share do not sum due to rounding.
E Total returns for periods of less than one year are not annualized.
F Total returns would have been lower if certain expenses had not been reduced during the applicable periods shown.
G Fees and expenses of any underlying mutual funds or exchange-traded funds (ETFs) are not included in the Fund's expense ratio. The Fund indirectly bears its proportionate share of these expenses. For additional expense information related to investments in Fidelity Central Funds, please refer to the "Investments in Fidelity Central Funds" note found in the Notes to Financial Statements section of the most recent Annual or Semi-Annual report.
H Expense ratios reflect operating expenses of the class. Expenses before reductions do not reflect amounts reimbursed, waived, or reduced through arrangements with the investment adviser, brokerage services, or other offset arrangements, if applicable, and do not represent the amount paid by the class during periods when reimbursements, waivers or reductions occur.
I Annualized
J Amount does not include the portfolio activity of any underlying mutual funds or exchange-traded funds (ETFs).
See accompanying notes which are an integral part of the financial statements.
Fidelity Freedom Index 2020 Fund Premier Class
| | Six months ended (Unaudited) September 30, |
| | 2020 A |
| Selected Per–Share Data | |
| Net asset value, beginning of period | $14.69 |
| Income from Investment Operations | |
| Net investment income (loss)B | .02 |
| Net realized and unrealized gain (loss) | .74 |
| Total from investment operations | .76 |
| Net asset value, end of period | $15.45 |
| Total ReturnC,D | 5.17% |
| Ratios to Average Net AssetsE,F | |
| Expenses before reductions | .06%G |
| Expenses net of fee waivers, if any | .06%G |
| Expenses net of all reductions | .06%G |
| Net investment income (loss) | .63%G |
| Supplemental Data | |
| Net assets, end of period (000 omitted) | $1,583 |
| Portfolio turnover rateH | 24%G |
A For the period June 24, 2020 (commencement of sale of shares) to September 30, 2020.
B Calculated based on average shares outstanding during the period.
C Total returns for periods of less than one year are not annualized.
D Total returns would have been lower if certain expenses had not been reduced during the applicable periods shown.
E Fees and expenses of any underlying mutual funds or exchange-traded funds (ETFs) are not included in the Fund's expense ratio. The Fund indirectly bears its proportionate share of these expenses. For additional expense information related to investments in Fidelity Central Funds, please refer to the "Investments in Fidelity Central Funds" note found in the Notes to Financial Statements section of the most recent Annual or Semi-Annual report.
F Expense ratios reflect operating expenses of the class. Expenses before reductions do not reflect amounts reimbursed, waived, or reduced through arrangements with the investment adviser, brokerage services, or other offset arrangements, if applicable, and do not represent the amount paid by the class during periods when reimbursements, waivers or reductions occur.
G Annualized
H Amount does not include the portfolio activity of any underlying mutual funds or exchange-traded funds (ETFs).
See accompanying notes which are an integral part of the financial statements.
Fidelity Freedom® Index 2025 Fund
Investment Summary (Unaudited)
The information in the following tables is based on the direct investments of the Fund.
Top Holdings as of September 30, 2020
| | % of fund's net assets |
| Fidelity Series Total Market Index Fund | 34.4 |
| Fidelity Series Bond Index Fund | 30.4 |
| Fidelity Series Global ex U.S. Index Fund | 23.1 |
| Fidelity Series Treasury Bill Index Fund | 4.8 |
| Fidelity Series Inflation-Protected Bond Index Fund | 4.3 |
| Fidelity Series Long-Term Treasury Bond Index Fund | 3.0 |
| Fidelity Cash Central Fund 0.10% | 0.0 |
| | 100.0 |
Asset Allocation (% of fund's net assets)
| Period end |
| | Domestic Equity Funds | 34.4% |
| | International Equity Funds | 23.1% |
| | Bond Funds | 33.4% |
| | Inflation-Protected Bond Funds | 4.3% |
| | Short-Term Funds | 4.8% |

Percentages shown as 0.0% may reflect amounts less than 0.05%.
Fidelity Freedom® Index 2025 Fund
Schedule of Investments September 30, 2020 (Unaudited)
Showing Percentage of Net Assets
| Domestic Equity Funds - 34.4% | | | |
| | | Shares | Value |
| Fidelity Series Total Market Index Fund (a) | | | |
| (Cost $2,428,412,253) | | 244,861,317 | 2,796,316,241 |
|
| International Equity Funds - 23.1% | | | |
| Fidelity Series Global ex U.S. Index Fund (a) | | | |
| (Cost $1,761,052,521) | | 149,824,319 | 1,875,800,478 |
|
| Bond Funds - 33.4% | | | |
| Fidelity Series Bond Index Fund (a) | | 227,424,942 | 2,474,383,374 |
| Fidelity Series Long-Term Treasury Bond Index Fund (a) | | 23,825,410 | 246,116,484 |
| TOTAL BOND FUNDS | | | |
| (Cost $2,540,630,383) | | | 2,720,499,858 |
|
| Inflation-Protected Bond Funds - 4.3% | | | |
| Fidelity Series Inflation-Protected Bond Index Fund (a) | | | |
| (Cost $327,119,565) | | 32,797,639 | 350,934,735 |
|
| Short-Term Funds - 4.8% | | | |
| Fidelity Cash Central Fund 0.10% (b) | | 11,080 | 11,083 |
| Fidelity Series Treasury Bill Index Fund (a) | | 38,921,000 | 389,599,212 |
| TOTAL SHORT-TERM FUNDS | | | |
| (Cost $389,350,883) | | | 389,610,295 |
| TOTAL INVESTMENT IN SECURITIES - 100.0% | | | |
| (Cost $7,446,565,605) | | | 8,133,161,607 |
| NET OTHER ASSETS (LIABILITIES) - 0.0% | | | (602,819) |
| NET ASSETS - 100% | | | $8,132,558,788 |
Legend
(a) Affiliated Fund
(b) Affiliated fund that is generally available only to investment companies and other accounts managed by Fidelity Investments. The rate quoted is the annualized seven-day yield of the fund at period end. A complete unaudited listing of the fund's holdings as of its most recent quarter end is available upon request. In addition, each Fidelity Central Fund's financial statements are available on the SEC's website or upon request.
Affiliated Central Funds
Information regarding fiscal year to date income earned by the Fund from investments in Fidelity Central Funds is as follows:
| Fund | Income earned |
| Fidelity Cash Central Fund | $4 |
| Total | $4 |
Amounts in the income column in the above table include any capital gain distributions from underlying funds, which are presented in the corresponding line-item in the Statement of Operations, if applicable.
Affiliated Underlying Funds
Fiscal year to date information regarding the Fund's investments in affiliated Underlying Funds, excluding any Money Market Central Funds, is presented below. Exchanges between classes of the same affiliated Underlying Funds may occur.
| Affiliate | Value, beginning of period | Purchases | Sales Proceeds | Dividend Income | Realized Gain (loss) | Change in Unrealized appreciation (depreciation) | Value, end of period |
| Fidelity Series Bond Index Fund | $1,948,277,810 | $614,892,971 | $132,582,686 | $23,204,212 | $(65,349) | $43,860,628 | $2,474,383,374 |
| Fidelity Series Global ex U.S. Index Fund | 1,490,810,954 | 187,779,530 | 164,207,463 | -- | (2,800,309) | 364,217,766 | 1,875,800,478 |
| Fidelity Series Inflation-Protected Bond Index Fund | 272,628,331 | 75,247,077 | 15,113,350 | 249,575 | 310,398 | 17,862,279 | 350,934,735 |
| Fidelity Series Long-Term Treasury Bond Index Fund | 194,739,531 | 70,525,943 | 12,298,109 | 5,593,800 | 88,704 | (6,939,585) | 246,116,484 |
| Fidelity Series Total Market Index Fund | 2,215,132,125 | 331,776,518 | 468,804,378 | 11,998,812 | 6,294,053 | 711,917,923 | 2,796,316,241 |
| Fidelity Series Treasury Bill Index Fund | 289,167,151 | 117,992,376 | 16,622,594 | 1,276,309 | (8,240) | (929,481) | 389,599,212 |
| | $6,410,755,902 | $1,398,214,415 | $809,628,580 | $42,322,708 | $3,819,257 | $1,129,989,530 | $8,133,150,524 |
Amounts in the income column in the above table include any capital gain distributions from underlying funds, which are presented in the corresponding line-item in the Statement of Operations, if applicable.
Investment Valuation
The following is a summary of the inputs used, as of September 30, 2020, involving the Fund's assets and liabilities carried at fair value. The inputs or methodology used for valuing securities may not be an indication of the risk associated with investing in those securities. For more information on valuation inputs, and their aggregation into the levels used below, please refer to the Investment Valuation section in the accompanying Notes to Financial Statements.
| | Valuation Inputs at Reporting Date: |
| Description | Total | Level 1 | Level 2 | Level 3 |
| Investments in Securities: | | | | |
| Domestic Equity Funds | $2,796,316,241 | $2,796,316,241 | $-- | $-- |
| International Equity Funds | 1,875,800,478 | 1,875,800,478 | -- | -- |
| Bond Funds | 3,071,434,593 | 3,071,434,593 | -- | -- |
| Short-Term Funds | 389,610,295 | 389,610,295 | -- | -- |
| Total Investments in Securities: | $8,133,161,607 | $8,133,161,607 | $-- | $-- |
See accompanying notes which are an integral part of the financial statements.
Fidelity Freedom® Index 2025 Fund
Financial Statements
Statement of Assets and Liabilities
| | | September 30, 2020 (Unaudited) |
| Assets | | |
Investment in securities, at value — See accompanying schedule:
| | |
| Fidelity Central Funds (cost $11,083) | $11,083 | |
| Other affiliated issuers (cost $7,446,554,522) | 8,133,150,524 | |
| Total Investment in Securities (cost $7,446,565,605) | | $8,133,161,607 |
| Cash | | 3 |
| Receivable for investments sold | | 26,396,526 |
| Receivable for fund shares sold | | 24,399,646 |
| Distributions receivable from Fidelity Central Funds | | 1 |
| Total assets | | 8,183,957,783 |
| Liabilities | | |
| Payable for investments purchased | $40,043,218 | |
| Payable for fund shares redeemed | 10,752,952 | |
| Accrued management fee | 602,825 | |
| Total liabilities | | 51,398,995 |
| Net Assets | | $8,132,558,788 |
| Net Assets consist of: | | |
| Paid in capital | | $7,432,633,788 |
| Total accumulated earnings (loss) | | 699,925,000 |
| Net Assets | | $8,132,558,788 |
| Net Asset Value and Maximum Offering Price | | |
| Investor Class: | | |
| Net Asset Value, offering price and redemption price per share ($4,389,893,282 ÷ 257,254,602 shares) | | $17.06 |
| Institutional Premium Class: | | |
| Net Asset Value, offering price and redemption price per share ($3,741,825,574 ÷ 219,189,807 shares) | | $17.07 |
| Premier Class: | | |
| Net Asset Value, offering price and redemption price per share ($839,932 ÷ 49,206 shares) | | $17.07 |
See accompanying notes which are an integral part of the financial statements.
Statement of Operations
| | | Six months ended September 30, 2020 (Unaudited) |
| Investment Income | | |
| Dividends: | | |
| Affiliated issuers | | $34,446,559 |
| Income from Fidelity Central Funds | | 4 |
| Total income | | 34,446,563 |
| Expenses | | |
| Management fee | $3,717,924 | |
| Independent trustees' fees and expenses | 10,016 | |
| Total expenses before reductions | 3,727,940 | |
| Expense reductions | (1) | |
| Total expenses after reductions | | 3,727,939 |
| Net investment income (loss) | | 30,718,624 |
| Realized and Unrealized Gain (Loss) | | |
| Net realized gain (loss) on: | | |
| Investment securities: | | |
| Affiliated issuers | 3,819,257 | |
| Capital gain distributions from underlying funds: | | |
| Affiliated issuers | 7,876,149 | |
| Total net realized gain (loss) | | 11,695,406 |
| Change in net unrealized appreciation (depreciation) on: | | |
| Investment securities: | | |
| Affiliated issuers | 1,129,989,530 | |
| Total change in net unrealized appreciation (depreciation) | | 1,129,989,530 |
| Net gain (loss) | | 1,141,684,936 |
| Net increase (decrease) in net assets resulting from operations | | $1,172,403,560 |
See accompanying notes which are an integral part of the financial statements.
Statement of Changes in Net Assets
| | Six months ended September 30, 2020 (Unaudited) | Year ended March 31, 2020 |
| Increase (Decrease) in Net Assets | | |
| Operations | | |
| Net investment income (loss) | $30,718,624 | $114,917,394 |
| Net realized gain (loss) | 11,695,406 | 731,279,832 |
| Change in net unrealized appreciation (depreciation) | 1,129,989,530 | (1,147,151,072) |
| Net increase (decrease) in net assets resulting from operations | 1,172,403,560 | (300,953,846) |
| Distributions to shareholders | (42,984,503) | (827,608,471) |
| Share transactions - net increase (decrease) | 592,851,799 | 2,775,845,410 |
| Total increase (decrease) in net assets | 1,722,270,856 | 1,647,283,093 |
| Net Assets | | |
| Beginning of period | 6,410,287,932 | 4,763,004,839 |
| End of period | $8,132,558,788 | $6,410,287,932 |
See accompanying notes which are an integral part of the financial statements.
Financial Highlights
Fidelity Freedom Index 2025 Fund Investor Class
| | Six months ended (Unaudited) September 30, | Years endedMarch 31, | | | | |
| | 2020 | 2020 | 2019 | 2018 | 2017 | 2016 |
| Selected Per–Share Data | | | | | | |
| Net asset value, beginning of period | $14.57 | $17.05 | $16.67 | $15.50 | $14.27 | $14.80 |
| Income from Investment Operations | | | | | | |
| Net investment income (loss)A | .07 | .33 | .36 | .31 | .29 | .27 |
| Net realized and unrealized gain (loss) | 2.52 | (.54) | .38 | 1.17 | 1.22 | (.52) |
| Total from investment operations | 2.59 | (.21) | .74 | 1.48 | 1.51 | (.25) |
| Distributions from net investment income | (.03) | (.31) | (.34) | (.29) | (.27) | (.27) |
| Distributions from net realized gain | (.07) | (1.96) | (.03) | (.02) | (.01) | –B |
| Total distributions | (.10) | (2.27) | (.36)C | (.31) | (.28) | (.28)C |
| Net asset value, end of period | $17.06 | $14.57 | $17.05 | $16.67 | $15.50 | $14.27 |
| Total ReturnD,E | 17.81% | (2.75)% | 4.64% | 9.53% | 10.67% | (1.72)% |
| Ratios to Average Net AssetsF,G | | | | | | |
| Expenses before reductions | .12%H | .12% | .15% | .15% | .15% | .15% |
| Expenses net of fee waivers, if any | .12%H | .12% | .11% | .12% | .10% | .08% |
| Expenses net of all reductions | .12%H | .12% | .11% | .12% | .10% | .08% |
| Net investment income (loss) | .80%H | 1.93% | 2.13% | 1.91% | 1.97% | 1.84% |
| Supplemental Data | | | | | | |
| Net assets, end of period (000 omitted) | $4,389,893 | $3,443,936 | $2,382,206 | $1,761,022 | $1,227,802 | $1,179,785 |
| Portfolio turnover rateI | 22%H | 82% | 19% | 9% | 18% | 17% |
A Calculated based on average shares outstanding during the period.
B Amount represents less than $.005 per share.
C Total distributions per share do not sum due to rounding.
D Total returns for periods of less than one year are not annualized.
E Total returns would have been lower if certain expenses had not been reduced during the applicable periods shown.
F Fees and expenses of any underlying mutual funds or exchange-traded funds (ETFs) are not included in the Fund's expense ratio. The Fund indirectly bears its proportionate share of these expenses. For additional expense information related to investments in Fidelity Central Funds, please refer to the "Investments in Fidelity Central Funds" note found in the Notes to Financial Statements section of the most recent Annual or Semi-Annual report.
G Expense ratios reflect operating expenses of the class. Expenses before reductions do not reflect amounts reimbursed, waived, or reduced through arrangements with the investment adviser, brokerage services, or other offset arrangements, if applicable, and do not represent the amount paid by the class during periods when reimbursements, waivers or reductions occur.
H Annualized
I Amount does not include the portfolio activity of any underlying mutual funds or exchange-traded funds (ETFs).
See accompanying notes which are an integral part of the financial statements.
Fidelity Freedom Index 2025 Fund Institutional Premium Class
| | Six months ended (Unaudited) September 30, | Years endedMarch 31, | | | | |
| | 2020 | 2020 | 2019 | 2018 | 2017 | 2016 A |
| Selected Per–Share Data | | | | | | |
| Net asset value, beginning of period | $14.57 | $17.05 | $16.67 | $15.50 | $14.27 | $15.00 |
| Income from Investment Operations | | | | | | |
| Net investment income (loss)B | .07 | .34 | .37 | .32 | .30 | .33 |
| Net realized and unrealized gain (loss) | 2.53 | (.54) | .38 | 1.17 | 1.22 | (.79) |
| Total from investment operations | 2.60 | (.20) | .75 | 1.49 | 1.52 | (.46) |
| Distributions from net investment income | (.03) | (.32) | (.34) | (.30) | (.28) | (.27) |
| Distributions from net realized gain | (.07) | (1.96) | (.03) | (.02) | (.01) | –C |
| Total distributions | (.10) | (2.28) | (.37) | (.32) | (.29) | (.27) |
| Net asset value, end of period | $17.07 | $14.57 | $17.05 | $16.67 | $15.50 | $14.27 |
| Total ReturnD,E | 17.89% | (2.71)% | 4.70% | 9.58% | 10.74% | (3.07)% |
| Ratios to Average Net AssetsF,G | | | | | | |
| Expenses before reductions | .08%H | .08% | .10% | .10% | .09% | .05%H |
| Expenses net of fee waivers, if any | .08%H | .08% | .05% | .07% | .05% | .02%H |
| Expenses net of all reductions | .08%H | .08% | .05% | .07% | .05% | .02%H |
| Net investment income (loss) | .84%H | 1.97% | 2.19% | 1.96% | 2.02% | 3.08%H |
| Supplemental Data | | | | | | |
| Net assets, end of period (000 omitted) | $3,741,826 | $2,966,352 | $2,380,799 | $1,856,410 | $1,456,538 | $792,922 |
| Portfolio turnover rateI | 22%H | 82% | 19% | 9% | 18% | 17% |
A For the period June 24, 2015 (commencement of sale of shares) to March 31, 2016.
B Calculated based on average shares outstanding during the period.
C Amount represents less than $.005 per share.
D Total returns for periods of less than one year are not annualized.
E Total returns would have been lower if certain expenses had not been reduced during the applicable periods shown.
F Fees and expenses of any underlying mutual funds or exchange-traded funds (ETFs) are not included in the Fund's expense ratio. The Fund indirectly bears its proportionate share of these expenses. For additional expense information related to investments in Fidelity Central Funds, please refer to the "Investments in Fidelity Central Funds" note found in the Notes to Financial Statements section of the most recent Annual or Semi-Annual report.
G Expense ratios reflect operating expenses of the class. Expenses before reductions do not reflect amounts reimbursed, waived, or reduced through arrangements with the investment adviser, brokerage services, or other offset arrangements, if applicable, and do not represent the amount paid by the class during periods when reimbursements, waivers or reductions occur.
H Annualized
I Amount does not include the portfolio activity of any underlying mutual funds or exchange-traded funds (ETFs).
See accompanying notes which are an integral part of the financial statements.
Fidelity Freedom Index 2025 Fund Premier Class
| | Six months ended (Unaudited) September 30, |
| | 2020 A |
| Selected Per–Share Data | |
| Net asset value, beginning of period | $16.14 |
| Income from Investment Operations | |
| Net investment income (loss)B | .03 |
| Net realized and unrealized gain (loss) | .90 |
| Total from investment operations | .93 |
| Net asset value, end of period | $17.07 |
| Total ReturnC,D | 5.76% |
| Ratios to Average Net AssetsE,F | |
| Expenses before reductions | .06%G |
| Expenses net of fee waivers, if any | .06%G |
| Expenses net of all reductions | .06%G |
| Net investment income (loss) | .59%G |
| Supplemental Data | |
| Net assets, end of period (000 omitted) | $840 |
| Portfolio turnover rateH | 22%G |
A For the period June 24, 2020 (commencement of sale of shares) to September 30, 2020.
B Calculated based on average shares outstanding during the period.
C Total returns for periods of less than one year are not annualized.
D Total returns would have been lower if certain expenses had not been reduced during the applicable periods shown.
E Fees and expenses of any underlying mutual funds or exchange-traded funds (ETFs) are not included in the Fund's expense ratio. The Fund indirectly bears its proportionate share of these expenses. For additional expense information related to investments in Fidelity Central Funds, please refer to the "Investments in Fidelity Central Funds" note found in the Notes to Financial Statements section of the most recent Annual or Semi-Annual report.
F Expense ratios reflect operating expenses of the class. Expenses before reductions do not reflect amounts reimbursed, waived, or reduced through arrangements with the investment adviser, brokerage services, or other offset arrangements, if applicable, and do not represent the amount paid by the class during periods when reimbursements, waivers or reductions occur.
G Annualized
H Amount does not include the portfolio activity of any underlying mutual funds or exchange-traded funds (ETFs).
See accompanying notes which are an integral part of the financial statements.
Fidelity Freedom® Index 2030 Fund
Investment Summary (Unaudited)
The information in the following tables is based on the direct investments of the Fund.
Top Holdings as of September 30, 2020
| | % of fund's net assets |
| Fidelity Series Total Market Index Fund | 39.4 |
| Fidelity Series Bond Index Fund | 27.1 |
| Fidelity Series Global ex U.S. Index Fund | 26.4 |
| Fidelity Series Inflation-Protected Bond Index Fund | 3.6 |
| Fidelity Series Long-Term Treasury Bond Index Fund | 3.1 |
| Fidelity Series Treasury Bill Index Fund | 0.4 |
| Fidelity Cash Central Fund 0.10% | 0.0 |
| | 100.0 |
Asset Allocation (% of fund's net assets)
| Period end |
| | Domestic Equity Funds | 39.4% |
| | International Equity Funds | 26.4% |
| | Bond Funds | 30.2% |
| | Inflation-Protected Bond Funds | 3.6% |
| | Short-Term Funds | 0.4% |
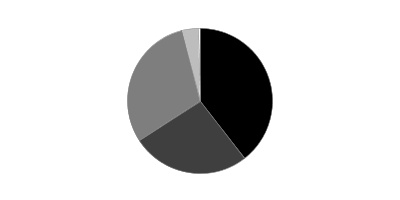
Percentages shown as 0.0% may reflect amounts less than 0.05%.
Fidelity Freedom® Index 2030 Fund
Schedule of Investments September 30, 2020 (Unaudited)
Showing Percentage of Net Assets
| Domestic Equity Funds - 39.4% | | | |
| | | Shares | Value |
| Fidelity Series Total Market Index Fund (a) | | | |
| (Cost $3,297,872,223) | | 331,861,149 | 3,789,854,320 |
|
| International Equity Funds - 26.4% | | | |
| Fidelity Series Global ex U.S. Index Fund (a) | | | |
| (Cost $2,394,275,811) | | 202,985,587 | 2,541,379,552 |
|
| Bond Funds - 30.2% | | | |
| Fidelity Series Bond Index Fund (a) | | 239,727,877 | 2,608,239,304 |
| Fidelity Series Long-Term Treasury Bond Index Fund (a) | | 28,296,423 | 292,302,054 |
| TOTAL BOND FUNDS | | | |
| (Cost $2,710,580,841) | | | 2,900,541,358 |
|
| Inflation-Protected Bond Funds - 3.6% | | | |
| Fidelity Series Inflation-Protected Bond Index Fund (a) | | | |
| (Cost $323,671,013) | | 32,146,552 | 343,968,103 |
|
| Short-Term Funds - 0.4% | | | |
| Fidelity Cash Central Fund 0.10% (b) | | 16,096 | 16,099 |
| Fidelity Series Treasury Bill Index Fund (a) | | 4,338,313 | 43,426,509 |
| TOTAL SHORT-TERM FUNDS | | | |
| (Cost $43,442,608) | | | 43,442,608 |
| TOTAL INVESTMENT IN SECURITIES - 100.0% | | | |
| (Cost $8,769,842,496) | | | 9,619,185,941 |
| NET OTHER ASSETS (LIABILITIES) - 0.0% | | | (680,344) |
| NET ASSETS - 100% | | | $9,618,505,597 |
Legend
(a) Affiliated Fund
(b) Affiliated fund that is generally available only to investment companies and other accounts managed by Fidelity Investments. The rate quoted is the annualized seven-day yield of the fund at period end. A complete unaudited listing of the fund's holdings as of its most recent quarter end is available upon request. In addition, each Fidelity Central Fund's financial statements are available on the SEC's website or upon request.
Affiliated Central Funds
Information regarding fiscal year to date income earned by the Fund from investments in Fidelity Central Funds is as follows:
| Fund | Income earned |
| Fidelity Cash Central Fund | $6 |
| Total | $6 |
Amounts in the income column in the above table include any capital gain distributions from underlying funds, which are presented in the corresponding line-item in the Statement of Operations, if applicable.
Affiliated Underlying Funds
Fiscal year to date information regarding the Fund's investments in affiliated Underlying Funds, excluding any Money Market Central Funds, is presented below. Exchanges between classes of the same affiliated Underlying Funds may occur.
| Affiliate | Value, beginning of period | Purchases | Sales Proceeds | Dividend Income | Realized Gain (loss) | Change in Unrealized appreciation (depreciation) | Value, end of period |
| Fidelity Series Bond Index Fund | $2,006,678,546 | $694,091,207 | $137,547,717 | $24,189,209 | $(62,344) | $45,079,612 | $2,608,239,304 |
| Fidelity Series Global ex U.S. Index Fund | 2,022,394,320 | 241,522,119 | 213,874,102 | -- | (5,784,625) | 497,121,840 | 2,541,379,552 |
| Fidelity Series Inflation-Protected Bond Index Fund | 233,219,272 | 108,158,231 | 14,176,127 | 229,086 | (6,121) | 16,772,848 | 343,968,103 |
| Fidelity Series Long-Term Treasury Bond Index Fund | 228,669,467 | 86,314,098 | 14,652,101 | 6,561,248 | 337,605 | (8,367,015) | 292,302,054 |
| Fidelity Series Total Market Index Fund | 3,004,594,636 | 391,881,594 | 581,654,522 | 16,253,809 | 8,964,331 | 966,068,281 | 3,789,854,320 |
| Fidelity Series Treasury Bill Index Fund | -- | 44,273,210 | 846,701 | 5,660 | -- | -- | 43,426,509 |
| | $7,495,556,241 | $1,566,240,459 | $962,751,270 | $47,239,012 | $3,448,846 | $1,516,675,566 | $9,619,169,842 |
Amounts in the income column in the above table include any capital gain distributions from underlying funds, which are presented in the corresponding line-item in the Statement of Operations, if applicable.
Investment Valuation
The following is a summary of the inputs used, as of September 30, 2020, involving the Fund's assets and liabilities carried at fair value. The inputs or methodology used for valuing securities may not be an indication of the risk associated with investing in those securities. For more information on valuation inputs, and their aggregation into the levels used below, please refer to the Investment Valuation section in the accompanying Notes to Financial Statements.
| | Valuation Inputs at Reporting Date: |
| Description | Total | Level 1 | Level 2 | Level 3 |
| Investments in Securities: | | | | |
| Domestic Equity Funds | $3,789,854,320 | $3,789,854,320 | $-- | $-- |
| International Equity Funds | 2,541,379,552 | 2,541,379,552 | -- | -- |
| Bond Funds | 3,244,509,461 | 3,244,509,461 | -- | -- |
| Short-Term Funds | 43,442,608 | 43,442,608 | -- | -- |
| Total Investments in Securities: | $9,619,185,941 | $9,619,185,941 | $-- | $-- |
See accompanying notes which are an integral part of the financial statements.
Fidelity Freedom® Index 2030 Fund
Financial Statements
Statement of Assets and Liabilities
| | | September 30, 2020 (Unaudited) |
| Assets | | |
Investment in securities, at value — See accompanying schedule:
| | |
| Fidelity Central Funds (cost $16,099) | $16,099 | |
| Other affiliated issuers (cost $8,769,826,397) | 9,619,169,842 | |
| Total Investment in Securities (cost $8,769,842,496) | | $9,619,185,941 |
| Cash | | 4 |
| Receivable for investments sold | | 32,327,393 |
| Receivable for fund shares sold | | 25,653,445 |
| Distributions receivable from Fidelity Central Funds | | 1 |
| Total assets | | 9,677,166,784 |
| Liabilities | | |
| Payable for investments purchased | $46,024,312 | |
| Payable for fund shares redeemed | 11,956,524 | |
| Accrued management fee | 680,351 | |
| Total liabilities | | 58,661,187 |
| Net Assets | | $9,618,505,597 |
| Net Assets consist of: | | |
| Paid in capital | | $8,749,774,152 |
| Total accumulated earnings (loss) | | 868,731,445 |
| Net Assets | | $9,618,505,597 |
| Net Asset Value and Maximum Offering Price | | |
| Investor Class: | | |
| Net Asset Value, offering price and redemption price per share ($4,646,104,691 ÷ 263,461,654 shares) | | $17.63 |
| Institutional Premium Class: | | |
| Net Asset Value, offering price and redemption price per share ($4,971,145,921 ÷ 281,825,270 shares) | | $17.64 |
| Premier Class: | | |
| Net Asset Value, offering price and redemption price per share ($1,254,985 ÷ 71,141 shares) | | $17.64 |
See accompanying notes which are an integral part of the financial statements.
Statement of Operations
| | | Six months ended September 30, 2020 (Unaudited) |
| Investment Income | | |
| Dividends: | | |
| Affiliated issuers | | $38,312,347 |
| Income from Fidelity Central Funds | | 6 |
| Total income | | 38,312,353 |
| Expenses | | |
| Management fee | $4,279,586 | |
| Independent trustees' fees and expenses | 11,801 | |
| Total expenses before reductions | 4,291,387 | |
| Expense reductions | (3) | |
| Total expenses after reductions | | 4,291,384 |
| Net investment income (loss) | | 34,020,969 |
| Realized and Unrealized Gain (Loss) | | |
| Net realized gain (loss) on: | | |
| Investment securities: | | |
| Affiliated issuers | 3,448,846 | |
| Capital gain distributions from underlying funds: | | |
| Affiliated issuers | 8,926,665 | |
| Total net realized gain (loss) | | 12,375,511 |
| Change in net unrealized appreciation (depreciation) on: | | |
| Investment securities: | | |
| Affiliated issuers | 1,516,675,566 | |
| Total change in net unrealized appreciation (depreciation) | | 1,516,675,566 |
| Net gain (loss) | | 1,529,051,077 |
| Net increase (decrease) in net assets resulting from operations | | $1,563,072,046 |
See accompanying notes which are an integral part of the financial statements.
Statement of Changes in Net Assets
| | Six months ended September 30, 2020 (Unaudited) | Year ended March 31, 2020 |
| Increase (Decrease) in Net Assets | | |
| Operations | | |
| Net investment income (loss) | $34,020,969 | $137,012,879 |
| Net realized gain (loss) | 12,375,511 | 1,056,140,498 |
| Change in net unrealized appreciation (depreciation) | 1,516,675,566 | (1,674,382,215) |
| Net increase (decrease) in net assets resulting from operations | 1,563,072,046 | (481,228,838) |
| Distributions to shareholders | (48,328,958) | (1,169,499,813) |
| Share transactions - net increase (decrease) | 608,719,504 | 3,375,705,070 |
| Total increase (decrease) in net assets | 2,123,462,592 | 1,724,976,419 |
| Net Assets | | |
| Beginning of period | 7,495,043,005 | 5,770,066,586 |
| End of period | $9,618,505,597 | $7,495,043,005 |
See accompanying notes which are an integral part of the financial statements.
Financial Highlights
Fidelity Freedom Index 2030 Fund Investor Class
| | Six months ended (Unaudited) September 30, | Years endedMarch 31, | | | | |
| | 2020 | 2020 | 2019 | 2018 | 2017 | 2016 |
| Selected Per–Share Data | | | | | | |
| Net asset value, beginning of period | $14.73 | $17.99 | $17.57 | $16.07 | $14.49 | $15.15 |
| Income from Investment Operations | | | | | | |
| Net investment income (loss)A | .06 | .34 | .38 | .33 | .31 | .26 |
| Net realized and unrealized gain (loss) | 2.93 | (.74) | .41 | 1.50 | 1.57 | (.63) |
| Total from investment operations | 2.99 | (.40) | .79 | 1.83 | 1.88 | (.37) |
| Distributions from net investment income | (.03) | (.33) | (.36) | (.31) | (.29) | (.29) |
| Distributions from net realized gain | (.07) | (2.53) | (.01) | (.01) | (.01) | –B |
| Total distributions | (.09)C | (2.86) | (.37) | (.33)C | (.30) | (.29) |
| Net asset value, end of period | $17.63 | $14.73 | $17.99 | $17.57 | $16.07 | $14.49 |
| Total ReturnD,E | 20.39% | (4.38)% | 4.71% | 11.35% | 13.07% | (2.44)% |
| Ratios to Average Net AssetsF,G | | | | | | |
| Expenses before reductions | .12%H | .12% | .15% | .15% | .15% | .15% |
| Expenses net of fee waivers, if any | .12%H | .12% | .11% | .12% | .10% | .08% |
| Expenses net of all reductions | .12%H | .12% | .11% | .12% | .10% | .08% |
| Net investment income (loss) | .74%H | 1.92% | 2.14% | 1.92% | 2.03% | 1.75% |
| Supplemental Data | | | | | | |
| Net assets, end of period (000 omitted) | $4,646,105 | $3,610,892 | $2,500,479 | $1,856,566 | $1,333,880 | $1,315,200 |
| Portfolio turnover rateI | 22%H | 85% | 14% | 9% | 13% | 13% |
A Calculated based on average shares outstanding during the period.
B Amount represents less than $.005 per share.
C Total distributions per share do not sum due to rounding.
D Total returns for periods of less than one year are not annualized.
E Total returns would have been lower if certain expenses had not been reduced during the applicable periods shown.
F Fees and expenses of any underlying mutual funds or exchange-traded funds (ETFs) are not included in the Fund's expense ratio. The Fund indirectly bears its proportionate share of these expenses. For additional expense information related to investments in Fidelity Central Funds, please refer to the "Investments in Fidelity Central Funds" note found in the Notes to Financial Statements section of the most recent Annual or Semi-Annual report.
G Expense ratios reflect operating expenses of the class. Expenses before reductions do not reflect amounts reimbursed, waived, or reduced through arrangements with the investment adviser, brokerage services, or other offset arrangements, if applicable, and do not represent the amount paid by the class during periods when reimbursements, waivers or reductions occur.
H Annualized
I Amount does not include the portfolio activity of any underlying mutual funds or exchange-traded funds (ETFs).
See accompanying notes which are an integral part of the financial statements.
Fidelity Freedom Index 2030 Fund Institutional Premium Class
| | Six months ended (Unaudited) September 30, | Years endedMarch 31, | | | | |
| | 2020 | 2020 | 2019 | 2018 | 2017 | 2016 A |
| Selected Per–Share Data | | | | | | |
| Net asset value, beginning of period | $14.73 | $18.00 | $17.57 | $16.07 | $14.49 | $15.44 |
| Income from Investment Operations | | | | | | |
| Net investment income (loss)B | .07 | .35 | .39 | .34 | .32 | .38 |
| Net realized and unrealized gain (loss) | 2.94 | (.75) | .42 | 1.49 | 1.57 | (1.04) |
| Total from investment operations | 3.01 | (.40) | .81 | 1.83 | 1.89 | (.66) |
| Distributions from net investment income | (.03) | (.34) | (.37) | (.32) | (.30) | (.29) |
| Distributions from net realized gain | (.07) | (2.53) | (.01) | (.01) | (.01) | –C |
| Total distributions | (.10) | (2.87) | (.38) | (.33) | (.31) | (.29) |
| Net asset value, end of period | $17.64 | $14.73 | $18.00 | $17.57 | $16.07 | $14.49 |
| Total ReturnD,E | 20.47% | (4.40)% | 4.82% | 11.39% | 13.13% | (4.28)% |
| Ratios to Average Net AssetsF,G | | | | | | |
| Expenses before reductions | .08%H | .08% | .10% | .10% | .09% | .05%H |
| Expenses net of fee waivers, if any | .08%H | .08% | .05% | .07% | .05% | .02%H |
| Expenses net of all reductions | .08%H | .08% | .05% | .07% | .05% | .02%H |
| Net investment income (loss) | .78%H | 1.96% | 2.20% | 1.97% | 2.08% | 3.54%H |
| Supplemental Data | | | | | | |
| Net assets, end of period (000 omitted) | $4,971,146 | $3,884,151 | $3,269,588 | $2,642,936 | $2,025,502 | $1,165,165 |
| Portfolio turnover rateI | 22%H | 85% | 14% | 9% | 13% | 13% |
A For the period June 24, 2015 (commencement of sale of shares) to March 31, 2016.
B Calculated based on average shares outstanding during the period.
C Amount represents less than $.005 per share.
D Total returns for periods of less than one year are not annualized.
E Total returns would have been lower if certain expenses had not been reduced during the applicable periods shown.
F Fees and expenses of any underlying mutual funds or exchange-traded funds (ETFs) are not included in the Fund's expense ratio. The Fund indirectly bears its proportionate share of these expenses. For additional expense information related to investments in Fidelity Central Funds, please refer to the "Investments in Fidelity Central Funds" note found in the Notes to Financial Statements section of the most recent Annual or Semi-Annual report.
G Expense ratios reflect operating expenses of the class. Expenses before reductions do not reflect amounts reimbursed, waived, or reduced through arrangements with the investment adviser, brokerage services, or other offset arrangements, if applicable, and do not represent the amount paid by the class during periods when reimbursements, waivers or reductions occur.
H Annualized
I Amount does not include the portfolio activity of any underlying mutual funds or exchange-traded funds (ETFs).
See accompanying notes which are an integral part of the financial statements.
Fidelity Freedom Index 2030 Fund Premier Class
| | Six months ended (Unaudited) September 30, |
| | 2020 A |
| Selected Per–Share Data | |
| Net asset value, beginning of period | $16.56 |
| Income from Investment Operations | |
| Net investment income (loss)B | .02 |
| Net realized and unrealized gain (loss) | 1.06 |
| Total from investment operations | 1.08 |
| Net asset value, end of period | $17.64 |
| Total ReturnC,D | 6.52% |
| Ratios to Average Net AssetsE,F | |
| Expenses before reductions | .06%G |
| Expenses net of fee waivers, if any | .06%G |
| Expenses net of all reductions | .06%G |
| Net investment income (loss) | .53%G |
| Supplemental Data | |
| Net assets, end of period (000 omitted) | $1,255 |
| Portfolio turnover rateH | 22%G |
A For the period June 24, 2020 (commencement of sale of shares) to September 30, 2020.
B Calculated based on average shares outstanding during the period.
C Total returns for periods of less than one year are not annualized.
D Total returns would have been lower if certain expenses had not been reduced during the applicable periods shown.
E Fees and expenses of any underlying mutual funds or exchange-traded funds (ETFs) are not included in the Fund's expense ratio. The Fund indirectly bears its proportionate share of these expenses. For additional expense information related to investments in Fidelity Central Funds, please refer to the "Investments in Fidelity Central Funds" note found in the Notes to Financial Statements section of the most recent Annual or Semi-Annual report.
F Expense ratios reflect operating expenses of the class. Expenses before reductions do not reflect amounts reimbursed, waived, or reduced through arrangements with the investment adviser, brokerage services, or other offset arrangements, if applicable, and do not represent the amount paid by the class during periods when reimbursements, waivers or reductions occur.
G Annualized
H Amount does not include the portfolio activity of any underlying mutual funds or exchange-traded funds (ETFs).
See accompanying notes which are an integral part of the financial statements.
Fidelity Freedom® Index 2035 Fund
Investment Summary (Unaudited)
The information in the following tables is based on the direct investments of the Fund.
Top Holdings as of September 30, 2020
| | % of fund's net assets |
| Fidelity Series Total Market Index Fund | 48.4 |
| Fidelity Series Global ex U.S. Index Fund | 32.5 |
| Fidelity Series Bond Index Fund | 16.1 |
| Fidelity Series Long-Term Treasury Bond Index Fund | 3.0 |
| Fidelity Cash Central Fund 0.10% | 0.0 |
| | 100.0 |
Asset Allocation (% of fund's net assets)
| Period end |
| | Domestic Equity Funds | 48.4% |
| | International Equity Funds | 32.5% |
| | Bond Funds | 19.1% |

Percentages shown as 0.0% may reflect amounts less than 0.05%.
Fidelity Freedom® Index 2035 Fund
Schedule of Investments September 30, 2020 (Unaudited)
Showing Percentage of Net Assets
| Domestic Equity Funds - 48.4% | | | |
| | | Shares | Value |
| Fidelity Series Total Market Index Fund (a) | | | |
| (Cost $3,043,435,575) | | 305,272,216 | 3,486,208,708 |
|
| International Equity Funds - 32.5% | | | |
| Fidelity Series Global ex U.S. Index Fund (a) | | | |
| (Cost $2,229,726,632) | | 186,630,941 | 2,336,619,378 |
|
| Bond Funds - 19.1% | | | |
| Fidelity Series Bond Index Fund (a) | | 106,097,462 | 1,154,340,388 |
| Fidelity Series Long-Term Treasury Bond Index Fund (a) | | 21,128,570 | 218,258,131 |
| TOTAL BOND FUNDS | | | |
| (Cost $1,287,450,173) | | | 1,372,598,519 |
|
| Short-Term Funds - 0.0% | | | |
| Fidelity Cash Central Fund 0.10% (b) | | | |
| (Cost $13,410) | | 13,408 | 13,410 |
| TOTAL INVESTMENT IN SECURITIES - 100.0% | | | |
| (Cost $6,560,625,790) | | | 7,195,440,015 |
| NET OTHER ASSETS (LIABILITIES) - 0.0% | | | (499,437) |
| NET ASSETS - 100% | | | $7,194,940,578 |
Legend
(a) Affiliated Fund
(b) Affiliated fund that is generally available only to investment companies and other accounts managed by Fidelity Investments. The rate quoted is the annualized seven-day yield of the fund at period end. A complete unaudited listing of the fund's holdings as of its most recent quarter end is available upon request. In addition, each Fidelity Central Fund's financial statements are available on the SEC's website or upon request.
Affiliated Central Funds
Information regarding fiscal year to date income earned by the Fund from investments in Fidelity Central Funds is as follows:
| Fund | Income earned |
| Fidelity Cash Central Fund | $5 |
| Total | $5 |
Amounts in the income column in the above table include any capital gain distributions from underlying funds, which are presented in the corresponding line-item in the Statement of Operations, if applicable.
Affiliated Underlying Funds
Fiscal year to date information regarding the Fund's investments in affiliated Underlying Funds, excluding any Money Market Central Funds, is presented below. Exchanges between classes of the same affiliated Underlying Funds may occur.
| Affiliate | Value, beginning of period | Purchases | Sales Proceeds | Dividend Income | Realized Gain (loss) | Change in Unrealized appreciation (depreciation) | Value, end of period |
| Fidelity Series Bond Index Fund | $804,682,448 | $383,061,040 | $51,338,378 | $10,143,866 | $(829) | $17,936,107 | $1,154,340,388 |
| Fidelity Series Global ex U.S. Index Fund | 1,766,350,334 | 271,563,133 | 137,182,617 | -- | (3,034,404) | 438,922,932 | 2,336,619,378 |
| Fidelity Series Long-Term Treasury Bond Index Fund | 164,771,244 | 71,827,760 | 12,522,069 | 4,748,491 | 357,485 | (6,176,289) | 218,258,131 |
| Fidelity Series Total Market Index Fund | 2,621,604,249 | 401,097,215 | 399,670,418 | 14,182,125 | (2,974,217) | 866,151,879 | 3,486,208,708 |
| | $5,357,408,275 | $1,127,549,148 | $600,713,482 | $29,074,482 | $(5,651,965) | $1,316,834,629 | $7,195,426,605 |
Amounts in the income column in the above table include any capital gain distributions from underlying funds, which are presented in the corresponding line-item in the Statement of Operations, if applicable.
Investment Valuation
The following is a summary of the inputs used, as of September 30, 2020, involving the Fund's assets and liabilities carried at fair value. The inputs or methodology used for valuing securities may not be an indication of the risk associated with investing in those securities. For more information on valuation inputs, and their aggregation into the levels used below, please refer to the Investment Valuation section in the accompanying Notes to Financial Statements.
| | Valuation Inputs at Reporting Date: |
| Description | Total | Level 1 | Level 2 | Level 3 |
| Investments in Securities: | | | | |
| Domestic Equity Funds | $3,486,208,708 | $3,486,208,708 | $-- | $-- |
| International Equity Funds | 2,336,619,378 | 2,336,619,378 | -- | -- |
| Bond Funds | 1,372,598,519 | 1,372,598,519 | -- | -- |
| Short-Term Funds | 13,410 | 13,410 | -- | -- |
| Total Investments in Securities: | $7,195,440,015 | $7,195,440,015 | $-- | $-- |
See accompanying notes which are an integral part of the financial statements.
Fidelity Freedom® Index 2035 Fund
Financial Statements
Statement of Assets and Liabilities
| | | September 30, 2020 (Unaudited) |
| Assets | | |
Investment in securities, at value — See accompanying schedule:
| | |
| Fidelity Central Funds (cost $13,410) | $13,410 | |
| Other affiliated issuers (cost $6,560,612,380) | 7,195,426,605 | |
| Total Investment in Securities (cost $6,560,625,790) | | $7,195,440,015 |
| Cash | | 3 |
| Receivable for investments sold | | 15,438,388 |
| Receivable for fund shares sold | | 21,823,011 |
| Distributions receivable from Fidelity Central Funds | | 1 |
| Total assets | | 7,232,701,418 |
| Liabilities | | |
| Payable for investments purchased | $29,589,500 | |
| Payable for fund shares redeemed | 7,671,898 | |
| Accrued management fee | 499,442 | |
| Total liabilities | | 37,760,840 |
| Net Assets | | $7,194,940,578 |
| Net Assets consist of: | | |
| Paid in capital | | $6,560,697,354 |
| Total accumulated earnings (loss) | | 634,243,224 |
| Net Assets | | $7,194,940,578 |
| Net Asset Value and Maximum Offering Price | | |
| Investor Class: | | |
| Net Asset Value, offering price and redemption price per share ($3,762,560,702 ÷ 199,916,401 shares) | | $18.82 |
| Institutional Premium Class: | | |
| Net Asset Value, offering price and redemption price per share ($3,431,399,058 ÷ 182,234,102 shares) | | $18.83 |
| Premier Class: | | |
| Net Asset Value, offering price and redemption price per share ($980,818 ÷ 52,080 shares) | | $18.83 |
See accompanying notes which are an integral part of the financial statements.
Statement of Operations
| | | Six months ended September 30, 2020 (Unaudited) |
| Investment Income | | |
| Dividends: | | |
| Affiliated issuers | | $21,902,658 |
| Income from Fidelity Central Funds | | 5 |
| Total income | | 21,902,663 |
| Expenses | | |
| Management fee | $3,188,505 | |
| Independent trustees' fees and expenses | 8,606 | |
| Total expenses before reductions | 3,197,111 | |
| Expense reductions | (1) | |
| Total expenses after reductions | | 3,197,110 |
| Net investment income (loss) | | 18,705,553 |
| Realized and Unrealized Gain (Loss) | | |
| Net realized gain (loss) on: | | |
| Investment securities: | | |
| Affiliated issuers | (5,651,965) | |
| Capital gain distributions from underlying funds: | | |
| Affiliated issuers | 7,171,824 | |
| Total net realized gain (loss) | | 1,519,859 |
| Change in net unrealized appreciation (depreciation) on: | | |
| Investment securities: | | |
| Affiliated issuers | 1,316,834,629 | |
| Total change in net unrealized appreciation (depreciation) | | 1,316,834,629 |
| Net gain (loss) | | 1,318,354,488 |
| Net increase (decrease) in net assets resulting from operations | | $1,337,060,041 |
See accompanying notes which are an integral part of the financial statements.
Statement of Changes in Net Assets
| | Six months ended September 30, 2020 (Unaudited) | Year ended March 31, 2020 |
| Increase (Decrease) in Net Assets | | |
| Operations | | |
| Net investment income (loss) | $18,705,553 | $95,902,909 |
| Net realized gain (loss) | 1,519,859 | 746,932,782 |
| Change in net unrealized appreciation (depreciation) | 1,316,834,629 | (1,379,836,593) |
| Net increase (decrease) in net assets resulting from operations | 1,337,060,041 | (537,000,902) |
| Distributions to shareholders | (26,122,526) | (832,182,362) |
| Share transactions - net increase (decrease) | 526,952,479 | 2,708,059,203 |
| Total increase (decrease) in net assets | 1,837,889,994 | 1,338,875,939 |
| Net Assets | | |
| Beginning of period | 5,357,050,584 | 4,018,174,645 |
| End of period | $7,194,940,578 | $5,357,050,584 |
See accompanying notes which are an integral part of the financial statements.
Financial Highlights
Fidelity Freedom Index 2035 Fund Investor Class
| | Six months ended (Unaudited) September 30, | Years endedMarch 31, | | | | |
| | 2020 | 2020 | 2019 | 2018 | 2017 | 2016 |
| Selected Per–Share Data | | | | | | |
| Net asset value, beginning of period | $15.20 | $19.07 | $18.63 | $16.79 | $14.91 | $15.67 |
| Income from Investment Operations | | | | | | |
| Net investment income (loss)A | .05 | .36 | .39 | .34 | .32 | .27 |
| Net realized and unrealized gain (loss) | 3.64 | (1.26) | .43 | 1.84 | 1.87 | (.73) |
| Total from investment operations | 3.69 | (.90) | .82 | 2.18 | 2.19 | (.46) |
| Distributions from net investment income | (.01) | (.33) | (.37) | (.32) | (.30) | (.30) |
| Distributions from net realized gain | (.06) | (2.64) | (.01) | (.02) | (.01) | –B |
| Total distributions | (.07) | (2.97) | (.38) | (.34) | (.31) | (.30) |
| Net asset value, end of period | $18.82 | $15.20 | $19.07 | $18.63 | $16.79 | $14.91 |
| Total ReturnC,D | 24.35% | (7.39)% | 4.63% | 12.96% | 14.81% | (2.93)% |
| Ratios to Average Net AssetsE,F | | | | | | |
| Expenses before reductions | .12%G | .12% | .15% | .15% | .15% | .15% |
| Expenses net of fee waivers, if any | .12%G | .12% | .11% | .12% | .10% | .08% |
| Expenses net of all reductions | .12%G | .12% | .11% | .12% | .10% | .08% |
| Net investment income (loss) | .55%G | 1.87% | 2.08% | 1.89% | 2.02% | 1.79% |
| Supplemental Data | | | | | | |
| Net assets, end of period (000 omitted) | $3,762,561 | $2,844,302 | $2,003,135 | $1,390,826 | $936,458 | $880,845 |
| Portfolio turnover rateH | 19%G | 80% | 10% | 7% | 13% | 11% |
A Calculated based on average shares outstanding during the period.
B Amount represents less than $.005 per share.
C Total returns for periods of less than one year are not annualized.
D Total returns would have been lower if certain expenses had not been reduced during the applicable periods shown.
E Fees and expenses of any underlying mutual funds or exchange-traded funds (ETFs) are not included in the Fund's expense ratio. The Fund indirectly bears its proportionate share of these expenses. For additional expense information related to investments in Fidelity Central Funds, please refer to the "Investments in Fidelity Central Funds" note found in the Notes to Financial Statements section of the most recent Annual or Semi-Annual report.
F Expense ratios reflect operating expenses of the class. Expenses before reductions do not reflect amounts reimbursed, waived, or reduced through arrangements with the investment adviser, brokerage services, or other offset arrangements, if applicable, and do not represent the amount paid by the class during periods when reimbursements, waivers or reductions occur.
G Annualized
H Amount does not include the portfolio activity of any underlying mutual funds or exchange-traded funds (ETFs).
See accompanying notes which are an integral part of the financial statements.
Fidelity Freedom Index 2035 Fund Institutional Premium Class
| | Six months ended (Unaudited) September 30, | Years endedMarch 31, | | | | |
| | 2020 | 2020 | 2019 | 2018 | 2017 | 2016 A |
| Selected Per–Share Data | | | | | | |
| Net asset value, beginning of period | $15.21 | $19.08 | $18.64 | $16.80 | $14.92 | $16.03 |
| Income from Investment Operations | | | | | | |
| Net investment income (loss)B | .05 | .37 | .40 | .35 | .33 | .39 |
| Net realized and unrealized gain (loss) | 3.64 | (1.26) | .43 | 1.84 | 1.87 | (1.20) |
| Total from investment operations | 3.69 | (.89) | .83 | 2.19 | 2.20 | (.81) |
| Distributions from net investment income | (.02) | (.34) | (.38) | (.33) | (.31) | (.30) |
| Distributions from net realized gain | (.06) | (2.64) | (.01) | (.02) | (.01) | –C |
| Total distributions | (.07)D | (2.98) | (.39) | (.35) | (.32) | (.30) |
| Net asset value, end of period | $18.83 | $15.21 | $19.08 | $18.64 | $16.80 | $14.92 |
| Total ReturnE,F | 24.35% | (7.33)% | 4.69% | 13.00% | 14.87% | (5.04)% |
| Ratios to Average Net AssetsG,H | | | | | | |
| Expenses before reductions | .08%I | .08% | .10% | .10% | .09% | .05%I |
| Expenses net of fee waivers, if any | .08%I | .08% | .05% | .07% | .05% | .01%I |
| Expenses net of all reductions | .08%I | .08% | .05% | .07% | .05% | .01%I |
| Net investment income (loss) | .59%I | 1.92% | 2.14% | 1.94% | 2.07% | 3.53%I |
| Supplemental Data | | | | | | |
| Net assets, end of period (000 omitted) | $3,431,399 | $2,512,748 | $2,015,039 | $1,522,603 | $1,130,096 | $581,231 |
| Portfolio turnover rateJ | 19%I | 80% | 10% | 7% | 13% | 11% |
A For the period June 24, 2015 (commencement of sale of shares) to March 31, 2016.
B Calculated based on average shares outstanding during the period.
C Amount represents less than $.005 per share.
D Total distributions per share do not sum due to rounding.
E Total returns for periods of less than one year are not annualized.
F Total returns would have been lower if certain expenses had not been reduced during the applicable periods shown.
G Fees and expenses of any underlying mutual funds or exchange-traded funds (ETFs) are not included in the Fund's expense ratio. The Fund indirectly bears its proportionate share of these expenses. For additional expense information related to investments in Fidelity Central Funds, please refer to the "Investments in Fidelity Central Funds" note found in the Notes to Financial Statements section of the most recent Annual or Semi-Annual report.
H Expense ratios reflect operating expenses of the class. Expenses before reductions do not reflect amounts reimbursed, waived, or reduced through arrangements with the investment adviser, brokerage services, or other offset arrangements, if applicable, and do not represent the amount paid by the class during periods when reimbursements, waivers or reductions occur.
I Annualized
J Amount does not include the portfolio activity of any underlying mutual funds or exchange-traded funds (ETFs).
See accompanying notes which are an integral part of the financial statements.
Fidelity Freedom Index 2035 Fund Premier Class
| | Six months ended (Unaudited) September 30, |
| | 2020 A |
| Selected Per–Share Data | |
| Net asset value, beginning of period | $17.48 |
| Income from Investment Operations | |
| Net investment income (loss)B | .01 |
| Net realized and unrealized gain (loss) | 1.34 |
| Total from investment operations | 1.35 |
| Net asset value, end of period | $18.83 |
| Total ReturnC,D | 7.72% |
| Ratios to Average Net AssetsE,F | |
| Expenses before reductions | .06%G |
| Expenses net of fee waivers, if any | .06%G |
| Expenses net of all reductions | .06%G |
| Net investment income (loss) | .30%G |
| Supplemental Data | |
| Net assets, end of period (000 omitted) | $981 |
| Portfolio turnover rateH | 19%G |
A For the period June 24, 2020 (commencement of sale of shares) to September 30, 2020.
B Calculated based on average shares outstanding during the period.
C Total returns for periods of less than one year are not annualized.
D Total returns would have been lower if certain expenses had not been reduced during the applicable periods shown.
E Fees and expenses of any underlying mutual funds or exchange-traded funds (ETFs) are not included in the Fund's expense ratio. The Fund indirectly bears its proportionate share of these expenses. For additional expense information related to investments in Fidelity Central Funds, please refer to the "Investments in Fidelity Central Funds" note found in the Notes to Financial Statements section of the most recent Annual or Semi-Annual report.
F Expense ratios reflect operating expenses of the class. Expenses before reductions do not reflect amounts reimbursed, waived, or reduced through arrangements with the investment adviser, brokerage services, or other offset arrangements, if applicable, and do not represent the amount paid by the class during periods when reimbursements, waivers or reductions occur.
G Annualized
H Amount does not include the portfolio activity of any underlying mutual funds or exchange-traded funds (ETFs).
See accompanying notes which are an integral part of the financial statements.
Fidelity Freedom® Index 2040 Fund
Investment Summary (Unaudited)
The information in the following tables is based on the direct investments of the Fund.
Top Holdings as of September 30, 2020
| | % of fund's net assets |
| Fidelity Series Total Market Index Fund | 53.8 |
| Fidelity Series Global ex U.S. Index Fund | 36.1 |
| Fidelity Series Bond Index Fund | 7.1 |
| Fidelity Series Long-Term Treasury Bond Index Fund | 3.0 |
| Fidelity Cash Central Fund 0.10% | 0.0 |
| | 100.0 |
Asset Allocation (% of fund's net assets)
| Period end |
| | Domestic Equity Funds | 53.8% |
| | International Equity Funds | 36.1% |
| | Bond Funds | 10.1% |

Percentages shown as 0.0% may reflect amounts less than 0.05%.
Fidelity Freedom® Index 2040 Fund
Schedule of Investments September 30, 2020 (Unaudited)
Showing Percentage of Net Assets
| Domestic Equity Funds - 53.8% | | | |
| | | Shares | Value |
| Fidelity Series Total Market Index Fund (a) | | | |
| (Cost $3,392,582,941) | | 339,352,120 | 3,875,401,209 |
|
| International Equity Funds - 36.1% | | | |
| Fidelity Series Global ex U.S. Index Fund (a) | | | |
| (Cost $2,478,218,380) | | 207,475,749 | 2,597,596,380 |
|
| Bond Funds - 10.1% | | | |
| Fidelity Series Bond Index Fund (a) | | 46,710,464 | 508,209,845 |
| Fidelity Series Long-Term Treasury Bond Index Fund (a) | | 21,153,621 | 218,516,901 |
| TOTAL BOND FUNDS | | | |
| (Cost $671,321,815) | | | 726,726,746 |
|
| Short-Term Funds - 0.0% | | | |
| Fidelity Cash Central Fund 0.10% (b) | | | |
| (Cost $14,315) | | 14,312 | 14,315 |
| TOTAL INVESTMENT IN SECURITIES - 100.0% | | | |
| (Cost $6,542,137,451) | | | 7,199,738,650 |
| NET OTHER ASSETS (LIABILITIES) - 0.0% | | | (472,270) |
| NET ASSETS - 100% | | | $7,199,266,380 |
Legend
(a) Affiliated Fund
(b) Affiliated fund that is generally available only to investment companies and other accounts managed by Fidelity Investments. The rate quoted is the annualized seven-day yield of the fund at period end. A complete unaudited listing of the fund's holdings as of its most recent quarter end is available upon request. In addition, each Fidelity Central Fund's financial statements are available on the SEC's website or upon request.
Affiliated Central Funds
Information regarding fiscal year to date income earned by the Fund from investments in Fidelity Central Funds is as follows:
| Fund | Income earned |
| Fidelity Cash Central Fund | $5 |
| Total | $5 |
Amounts in the income column in the above table include any capital gain distributions from underlying funds, which are presented in the corresponding line-item in the Statement of Operations, if applicable.
Affiliated Underlying Funds
Fiscal year to date information regarding the Fund's investments in affiliated Underlying Funds, excluding any Money Market Central Funds, is presented below. Exchanges between classes of the same affiliated Underlying Funds may occur.
| Affiliate | Value, beginning of period | Purchases | Sales Proceeds | Dividend Income | Realized Gain (loss) | Change in Unrealized appreciation (depreciation) | Value, end of period |
| Fidelity Series Bond Index Fund | $377,706,341 | $150,970,293 | $28,860,355 | $4,608,954 | $39,263 | $8,354,303 | $508,209,845 |
| Fidelity Series Global ex U.S. Index Fund | 1,902,639,827 | 355,183,516 | 132,095,769 | -- | (3,511,216) | 475,380,022 | 2,597,596,380 |
| Fidelity Series Long-Term Treasury Bond Index Fund | 162,230,894 | 74,321,206 | 12,243,643 | 4,682,659 | 402,771 | (6,194,327) | 218,516,901 |
| Fidelity Series Total Market Index Fund | 2,824,362,277 | 443,780,877 | 326,572,929 | 15,255,487 | (9,887,958) | 943,718,942 | 3,875,401,209 |
| Total | $5,266,939,339 | $1,024,255,892 | $499,772,696 | $24,547,100 | $(12,957,140) | $1,421,258,940 | $7,199,724,335 |
Amounts in the income column in the above table include any capital gain distributions from underlying funds, which are presented in the corresponding line-item in the Statement of Operations, if applicable.
Investment Valuation
The following is a summary of the inputs used, as of September 30, 2020, involving the Fund's assets and liabilities carried at fair value. The inputs or methodology used for valuing securities may not be an indication of the risk associated with investing in those securities. For more information on valuation inputs, and their aggregation into the levels used below, please refer to the Investment Valuation section in the accompanying Notes to Financial Statements.
| | Valuation Inputs at Reporting Date: |
| Description | Total | Level 1 | Level 2 | Level 3 |
| Investments in Securities: | | | | |
| Domestic Equity Funds | $3,875,401,209 | $3,875,401,209 | $-- | $-- |
| International Equity Funds | 2,597,596,380 | 2,597,596,380 | -- | -- |
| Bond Funds | 726,726,746 | 726,726,746 | -- | -- |
| Short-Term Funds | 14,315 | 14,315 | -- | -- |
| Total Investments in Securities: | $7,199,738,650 | $7,199,738,650 | $-- | $-- |
See accompanying notes which are an integral part of the financial statements.
Fidelity Freedom® Index 2040 Fund
Financial Statements
Statement of Assets and Liabilities
| | | September 30, 2020 (Unaudited) |
| Assets | | |
Investment in securities, at value — See accompanying schedule:
| | |
| Fidelity Central Funds (cost $14,315) | $14,315 | |
| Other affiliated issuers (cost $6,542,123,136) | 7,199,724,335 | |
| Total Investment in Securities (cost $6,542,137,451) | | $7,199,738,650 |
| Cash | | 4 |
| Receivable for investments sold | | 19,393,131 |
| Receivable for fund shares sold | | 23,366,621 |
| Distributions receivable from Fidelity Central Funds | | 1 |
| Total assets | | 7,242,498,407 |
| Liabilities | | |
| Payable for investments purchased | $36,766,408 | |
| Payable for fund shares redeemed | 5,993,343 | |
| Accrued management fee | 472,276 | |
| Total liabilities | | 43,232,027 |
| Net Assets | | $7,199,266,380 |
| Net Assets consist of: | | |
| Paid in capital | | $6,551,616,518 |
| Total accumulated earnings (loss) | | 647,649,862 |
| Net Assets | | $7,199,266,380 |
| Net Asset Value and Maximum Offering Price | | |
| Investor Class: | | |
| Net Asset Value, offering price and redemption price per share ($3,256,745,354 ÷ 174,949,516 shares) | | $18.62 |
| Institutional Premium Class: | | |
| Net Asset Value, offering price and redemption price per share ($3,939,403,494 ÷ 211,638,387 shares) | | $18.61 |
| Premier Class: | | |
| Net Asset Value, offering price and redemption price per share ($3,117,532 ÷ 167,506 shares) | | $18.61 |
See accompanying notes which are an integral part of the financial statements.
Statement of Operations
| | | Six months ended September 30, 2020 (Unaudited) |
| Investment Income | | |
| Dividends: | | |
| Affiliated issuers | | $17,096,913 |
| Income from Fidelity Central Funds | | 5 |
| Total income | | 17,096,918 |
| Expenses | | |
| Management fee | $3,060,720 | |
| Independent trustees' fees and expenses | 8,509 | |
| Total expenses before reductions | 3,069,229 | |
| Expense reductions | (1) | |
| Total expenses after reductions | | 3,069,228 |
| Net investment income (loss) | | 14,027,690 |
| Realized and Unrealized Gain (Loss) | | |
| Net realized gain (loss) on: | | |
| Investment securities: | | |
| Affiliated issuers | (12,957,140) | |
| Capital gain distributions from underlying funds: | | |
| Affiliated issuers | 7,450,187 | |
| Total net realized gain (loss) | | (5,506,953) |
| Change in net unrealized appreciation (depreciation) on: | | |
| Investment securities: | | |
| Affiliated issuers | 1,421,258,940 | |
| Total change in net unrealized appreciation (depreciation) | | 1,421,258,940 |
| Net gain (loss) | | 1,415,751,987 |
| Net increase (decrease) in net assets resulting from operations | | $1,429,779,677 |
See accompanying notes which are an integral part of the financial statements.
Statement of Changes in Net Assets
| | Six months ended September 30, 2020 (Unaudited) | Year ended March 31, 2020 |
| Increase (Decrease) in Net Assets | | |
| Operations | | |
| Net investment income (loss) | $14,027,690 | $94,224,108 |
| Net realized gain (loss) | (5,506,953) | 847,119,448 |
| Change in net unrealized appreciation (depreciation) | 1,421,258,940 | (1,557,654,334) |
| Net increase (decrease) in net assets resulting from operations | 1,429,779,677 | (616,310,778) |
| Distributions to shareholders | (23,356,311) | (928,689,470) |
| Share transactions - net increase (decrease) | 526,230,899 | 2,675,344,924 |
| Total increase (decrease) in net assets | 1,932,654,265 | 1,130,344,676 |
| Net Assets | | |
| Beginning of period | 5,266,612,115 | 4,136,267,439 |
| End of period | $7,199,266,380 | $5,266,612,115 |
See accompanying notes which are an integral part of the financial statements.
Financial Highlights
Fidelity Freedom Index 2040 Fund Investor Class
| | Six months ended (Unaudited) September 30, | Years endedMarch 31, | | | | |
| | 2020 | 2020 | 2019 | 2018 | 2017 | 2016 |
| Selected Per–Share Data | | | | | | |
| Net asset value, beginning of period | $14.77 | $19.19 | $18.77 | $16.90 | $15.00 | $15.76 |
| Income from Investment Operations | | | | | | |
| Net investment income (loss)A | .04 | .35 | .39 | .34 | .32 | .26 |
| Net realized and unrealized gain (loss) | 3.87 | (1.43) | .42 | 1.87 | 1.90 | (.72) |
| Total from investment operations | 3.91 | (1.08) | .81 | 2.21 | 2.22 | (.46) |
| Distributions from net investment income | (.01) | (.33) | (.38) | (.33) | (.31) | (.30) |
| Distributions from net realized gain | (.06) | (3.00) | (.01) | (.02) | (.01) | –B |
| Total distributions | (.06)C | (3.34) | (.39) | (.34)C | (.32) | (.30) |
| Net asset value, end of period | $18.62 | $14.77 | $19.19 | $18.77 | $16.90 | $15.00 |
| Total ReturnD,E | 26.56% | (8.93)% | 4.56% | 13.08% | 14.90% | (2.91)% |
| Ratios to Average Net AssetsF,G | | | | | | |
| Expenses before reductions | .12%H | .12% | .15% | .15% | .15% | .15% |
| Expenses net of fee waivers, if any | .12%H | .12% | .11% | .12% | .10% | .08% |
| Expenses net of all reductions | .12%H | .12% | .11% | .12% | .10% | .08% |
| Net investment income (loss) | .41%H | 1.82% | 2.06% | 1.87% | 2.02% | 1.70% |
| Supplemental Data | | | | | | |
| Net assets, end of period (000 omitted) | $3,256,745 | $2,405,077 | $1,731,927 | $1,281,722 | $900,067 | $910,880 |
| Portfolio turnover rateI | 16%H | 78% | 10% | 6% | 13% | 9% |
A Calculated based on average shares outstanding during the period.
B Amount represents less than $.005 per share.
C Total distributions per share do not sum due to rounding.
D Total returns for periods of less than one year are not annualized.
E Total returns would have been lower if certain expenses had not been reduced during the applicable periods shown.
F Fees and expenses of any underlying mutual funds or exchange-traded funds (ETFs) are not included in the Fund's expense ratio. The Fund indirectly bears its proportionate share of these expenses. For additional expense information related to investments in Fidelity Central Funds, please refer to the "Investments in Fidelity Central Funds" note found in the Notes to Financial Statements section of the most recent Annual or Semi-Annual report.
G Expense ratios reflect operating expenses of the class. Expenses before reductions do not reflect amounts reimbursed, waived, or reduced through arrangements with the investment adviser, brokerage services, or other offset arrangements, if applicable, and do not represent the amount paid by the class during periods when reimbursements, waivers or reductions occur.
H Annualized
I Amount does not include the portfolio activity of any underlying mutual funds or exchange-traded funds (ETFs).
See accompanying notes which are an integral part of the financial statements.
Fidelity Freedom Index 2040 Fund Institutional Premium Class
| | Six months ended (Unaudited) September 30, | Years endedMarch 31, | | | | |
| | 2020 | 2020 | 2019 | 2018 | 2017 | 2016 A |
| Selected Per–Share Data | | | | | | |
| Net asset value, beginning of period | $14.77 | $19.19 | $18.77 | $16.89 | $15.00 | $16.12 |
| Income from Investment Operations | | | | | | |
| Net investment income (loss)B | .04 | .36 | .40 | .35 | .33 | .41 |
| Net realized and unrealized gain (loss) | 3.87 | (1.43) | .42 | 1.88 | 1.89 | (1.22) |
| Total from investment operations | 3.91 | (1.07) | .82 | 2.23 | 2.22 | (.81) |
| Distributions from net investment income | (.01) | (.34) | (.39) | (.34) | (.32) | (.30) |
| Distributions from net realized gain | (.06) | (3.00) | (.01) | (.02) | (.01) | –C |
| Total distributions | (.07) | (3.35) | (.40) | (.35)D | (.33) | (.31)D |
| Net asset value, end of period | $18.61 | $14.77 | $19.19 | $18.77 | $16.89 | $15.00 |
| Total ReturnE,F | 26.50% | (8.89)% | 4.61% | 13.20% | 14.90% | (5.06)% |
| Ratios to Average Net AssetsG,H | | | | | | |
| Expenses before reductions | .08%I | .08% | .10% | .10% | .09% | .05%I |
| Expenses net of fee waivers, if any | .08%I | .08% | .05% | .07% | .05% | .01%I |
| Expenses net of all reductions | .08%I | .08% | .05% | .07% | .05% | .01%I |
| Net investment income (loss) | .45%I | 1.86% | 2.12% | 1.92% | 2.07% | 3.69%I |
| Supplemental Data | | | | | | |
| Net assets, end of period (000 omitted) | $3,939,403 | $2,861,535 | $2,404,340 | $1,929,498 | $1,438,010 | $830,093 |
| Portfolio turnover rateJ | 16%I | 78% | 10% | 6% | 13% | 9% |
A For the period June 24, 2015 (commencement of sale of shares) to March 31, 2016.
B Calculated based on average shares outstanding during the period.
C Amount represents less than $.005 per share.
D Total distributions per share do not sum due to rounding.
E Total returns for periods of less than one year are not annualized.
F Total returns would have been lower if certain expenses had not been reduced during the applicable periods shown.
G Fees and expenses of any underlying mutual funds or exchange-traded funds (ETFs) are not included in the Fund's expense ratio. The Fund indirectly bears its proportionate share of these expenses. For additional expense information related to investments in Fidelity Central Funds, please refer to the "Investments in Fidelity Central Funds" note found in the Notes to Financial Statements section of the most recent Annual or Semi-Annual report.
H Expense ratios reflect operating expenses of the class. Expenses before reductions do not reflect amounts reimbursed, waived, or reduced through arrangements with the investment adviser, brokerage services, or other offset arrangements, if applicable, and do not represent the amount paid by the class during periods when reimbursements, waivers or reductions occur.
I Annualized
J Amount does not include the portfolio activity of any underlying mutual funds or exchange-traded funds (ETFs).
See accompanying notes which are an integral part of the financial statements.
Fidelity Freedom Index 2040 Fund Premier Class
| | Six months ended (Unaudited) September 30, |
| | 2020 A |
| Selected Per–Share Data | |
| Net asset value, beginning of period | $17.16 |
| Income from Investment Operations | |
| Net investment income (loss)B | .01 |
| Net realized and unrealized gain (loss) | 1.44 |
| Total from investment operations | 1.45 |
| Net asset value, end of period | $18.61 |
| Total ReturnC,D | 8.45% |
| Ratios to Average Net AssetsE,F | |
| Expenses before reductions | .06%G |
| Expenses net of fee waivers, if any | .06%G |
| Expenses net of all reductions | .06%G |
| Net investment income (loss) | .14%G |
| Supplemental Data | |
| Net assets, end of period (000 omitted) | $3,118 |
| Portfolio turnover rateH | 16%G |
A For the period June 24, 2020 (commencement of sale of shares) to September 30, 2020.
B Calculated based on average shares outstanding during the period.
C Total returns for periods of less than one year are not annualized.
D Total returns would have been lower if certain expenses had not been reduced during the applicable periods shown.
E Fees and expenses of any underlying mutual funds or exchange-traded funds (ETFs) are not included in the Fund's expense ratio. The Fund indirectly bears its proportionate share of these expenses. For additional expense information related to investments in Fidelity Central Funds, please refer to the "Investments in Fidelity Central Funds" note found in the Notes to Financial Statements section of the most recent Annual or Semi-Annual report.
F Expense ratios reflect operating expenses of the class. Expenses before reductions do not reflect amounts reimbursed, waived, or reduced through arrangements with the investment adviser, brokerage services, or other offset arrangements, if applicable, and do not represent the amount paid by the class during periods when reimbursements, waivers or reductions occur.
G Annualized
H Amount does not include the portfolio activity of any underlying mutual funds or exchange-traded funds (ETFs).
See accompanying notes which are an integral part of the financial statements.
Fidelity Freedom® Index 2045 Fund
Investment Summary (Unaudited)
The information in the following tables is based on the direct investments of the Fund.
Top Holdings as of September 30, 2020
| | % of fund's net assets |
| Fidelity Series Total Market Index Fund | 53.8 |
| Fidelity Series Global ex U.S. Index Fund | 36.1 |
| Fidelity Series Bond Index Fund | 7.1 |
| Fidelity Series Long-Term Treasury Bond Index Fund | 3.0 |
| Fidelity Cash Central Fund 0.10% | 0.0 |
| | 100.0 |
Asset Allocation (% of fund's net assets)
| Period end |
| | Domestic Equity Funds | 53.8% |
| | International Equity Funds | 36.1% |
| | Bond Funds | 10.1% |

Percentages shown as 0.0% may reflect amounts less than 0.05%.
Fidelity Freedom® Index 2045 Fund
Schedule of Investments September 30, 2020 (Unaudited)
Showing Percentage of Net Assets
| Domestic Equity Funds - 53.8% | | | |
| | | Shares | Value |
| Fidelity Series Total Market Index Fund (a) | | | |
| (Cost $2,465,175,777) | | 246,212,518 | 2,811,746,951 |
|
| International Equity Funds - 36.1% | | | |
| Fidelity Series Global ex U.S. Index Fund (a) | | | |
| (Cost $1,806,715,861) | | 150,530,760 | 1,884,645,119 |
|
| Bond Funds - 10.1% | | | |
| Fidelity Series Bond Index Fund (a) | | 33,889,729 | 368,720,254 |
| Fidelity Series Long-Term Treasury Bond Index Fund (a) | | 15,347,498 | 158,539,652 |
| TOTAL BOND FUNDS | | | |
| (Cost $488,970,213) | | | 527,259,906 |
|
| Short-Term Funds - 0.0% | | | |
| Fidelity Cash Central Fund 0.10% (b) | | | |
| (Cost $6,762) | | 6,761 | 6,762 |
| TOTAL INVESTMENT IN SECURITIES - 100.0% | | | |
| (Cost $4,760,868,613) | | | 5,223,658,738 |
| NET OTHER ASSETS (LIABILITIES) - 0.0% | | | (344,308) |
| NET ASSETS - 100% | | | $5,223,314,430 |
Legend
(a) Affiliated Fund
(b) Affiliated fund that is generally available only to investment companies and other accounts managed by Fidelity Investments. The rate quoted is the annualized seven-day yield of the fund at period end. A complete unaudited listing of the fund's holdings as of its most recent quarter end is available upon request. In addition, each Fidelity Central Fund's financial statements are available on the SEC's website or upon request.
Affiliated Central Funds
Information regarding fiscal year to date income earned by the Fund from investments in Fidelity Central Funds is as follows:
| Fund | Income earned |
| Fidelity Cash Central Fund | $3 |
| Total | $3 |
Amounts in the income column in the above table include any capital gain distributions from underlying funds, which are presented in the corresponding line-item in the Statement of Operations, if applicable.
Affiliated Underlying Funds
Fiscal year to date information regarding the Fund's investments in affiliated Underlying Funds, excluding any Money Market Central Funds, is presented below. Exchanges between classes of the same affiliated Underlying Funds may occur.
| Affiliate | Value, beginning of period | Purchases | Sales Proceeds | Dividend Income | Realized Gain (loss) | Change in Unrealized appreciation (depreciation) | Value, end of period |
| Fidelity Series Bond Index Fund | $265,381,678 | $115,601,536 | $18,150,054 | $3,281,799 | $16,238 | $5,870,856 | $368,720,254 |
| Fidelity Series Global ex U.S. Index Fund | 1,336,844,056 | 295,358,791 | 81,177,454 | -- | (2,581,986) | 336,201,712 | 1,884,645,119 |
| Fidelity Series Long-Term Treasury Bond Index Fund | 113,985,596 | 56,361,439 | 7,686,766 | 3,312,207 | 242,808 | (4,363,425) | 158,539,652 |
| Fidelity Series Total Market Index Fund | 1,984,476,206 | 382,360,309 | 215,894,838 | 10,739,787 | (9,590,047) | 670,395,321 | 2,811,746,951 |
| Total | $3,700,687,536 | $849,682,075 | $322,909,112 | $17,333,793 | $(11,912,987) | $1,008,104,464 | $5,223,651,976 |
Amounts in the income column in the above table include any capital gain distributions from underlying funds, which are presented in the corresponding line-item in the Statement of Operations, if applicable.
Investment Valuation
The following is a summary of the inputs used, as of September 30, 2020, involving the Fund's assets and liabilities carried at fair value. The inputs or methodology used for valuing securities may not be an indication of the risk associated with investing in those securities. For more information on valuation inputs, and their aggregation into the levels used below, please refer to the Investment Valuation section in the accompanying Notes to Financial Statements.
| | Valuation Inputs at Reporting Date: |
| Description | Total | Level 1 | Level 2 | Level 3 |
| Investments in Securities: | | | | |
| Domestic Equity Funds | $2,811,746,951 | $2,811,746,951 | $-- | $-- |
| International Equity Funds | 1,884,645,119 | 1,884,645,119 | -- | -- |
| Bond Funds | 527,259,906 | 527,259,906 | -- | -- |
| Short-Term Funds | 6,762 | 6,762 | -- | -- |
| Total Investments in Securities: | $5,223,658,738 | $5,223,658,738 | $-- | $-- |
See accompanying notes which are an integral part of the financial statements.
Fidelity Freedom® Index 2045 Fund
Financial Statements
Statement of Assets and Liabilities
| | | September 30, 2020 (Unaudited) |
| Assets | | |
Investment in securities, at value — See accompanying schedule:
| | |
| Fidelity Central Funds (cost $6,762) | $6,762 | |
| Other affiliated issuers (cost $4,760,861,851) | 5,223,651,976 | |
| Total Investment in Securities (cost $4,760,868,613) | | $5,223,658,738 |
| Cash | | 3,113 |
| Receivable for investments sold | | 12,282,235 |
| Receivable for fund shares sold | | 20,709,478 |
| Distributions receivable from Fidelity Central Funds | | 1 |
| Total assets | | 5,256,653,565 |
| Liabilities | | |
| Payable for investments purchased | $28,581,407 | |
| Payable for fund shares redeemed | 4,410,305 | |
| Accrued management fee | 347,423 | |
| Total liabilities | | 33,339,135 |
| Net Assets | | $5,223,314,430 |
| Net Assets consist of: | | |
| Paid in capital | | $4,767,204,118 |
| Total accumulated earnings (loss) | | 456,110,312 |
| Net Assets | | $5,223,314,430 |
| Net Asset Value and Maximum Offering Price | | |
| Investor Class: | | |
| Net Asset Value, offering price and redemption price per share ($2,503,430,240 ÷ 129,676,374 shares) | | $19.31 |
| Institutional Premium Class: | | |
| Net Asset Value, offering price and redemption price per share ($2,718,129,915 ÷ 140,732,154 shares) | | $19.31 |
| Premier Class: | | |
| Net Asset Value, offering price and redemption price per share ($1,754,275 ÷ 90,816 shares) | | $19.32 |
See accompanying notes which are an integral part of the financial statements.
Statement of Operations
| | | Six months ended September 30, 2020 (Unaudited) |
| Investment Income | | |
| Dividends: | | |
| Affiliated issuers | | $12,088,873 |
| Income from Fidelity Central Funds | | 3 |
| Total income | | 12,088,876 |
| Expenses | | |
| Management fee | $2,209,987 | |
| Independent trustees' fees and expenses | 6,017 | |
| Total expenses | | 2,216,004 |
| Net investment income (loss) | | 9,872,872 |
| Realized and Unrealized Gain (Loss) | | |
| Net realized gain (loss) on: | | |
| Investment securities: | | |
| Affiliated issuers | (11,912,987) | |
| Capital gain distributions from underlying funds: | | |
| Affiliated issuers | 5,244,920 | |
| Total net realized gain (loss) | | (6,668,067) |
| Change in net unrealized appreciation (depreciation) on: | | |
| Investment securities: | | |
| Affiliated issuers | 1,008,104,464 | |
| Total change in net unrealized appreciation (depreciation) | | 1,008,104,464 |
| Net gain (loss) | | 1,001,436,397 |
| Net increase (decrease) in net assets resulting from operations | | $1,011,309,269 |
See accompanying notes which are an integral part of the financial statements.
Statement of Changes in Net Assets
| | Six months ended September 30, 2020 (Unaudited) | Year ended March 31, 2020 |
| Increase (Decrease) in Net Assets | | |
| Operations | | |
| Net investment income (loss) | $9,872,872 | $64,532,418 |
| Net realized gain (loss) | (6,668,067) | 484,430,417 |
| Change in net unrealized appreciation (depreciation) | 1,008,104,464 | (986,442,740) |
| Net increase (decrease) in net assets resulting from operations | 1,011,309,269 | (437,479,905) |
| Distributions to shareholders | (15,178,439) | (537,813,779) |
| Share transactions - net increase (decrease) | 526,729,546 | 1,985,672,707 |
| Total increase (decrease) in net assets | 1,522,860,376 | 1,010,379,023 |
| Net Assets | | |
| Beginning of period | 3,700,454,054 | 2,690,075,031 |
| End of period | $5,223,314,430 | $3,700,454,054 |
See accompanying notes which are an integral part of the financial statements.
Financial Highlights
Fidelity Freedom Index 2045 Fund Investor Class
| | Six months ended (Unaudited) September 30, | Years endedMarch 31, | | | | |
| | 2020 | 2020 | 2019 | 2018 | 2017 | 2016 |
| Selected Per–Share Data | | | | | | |
| Net asset value, beginning of period | $15.31 | $19.33 | $18.91 | $17.04 | $15.13 | $15.89 |
| Income from Investment Operations | | | | | | |
| Net investment income (loss)A | .04 | .36 | .39 | .35 | .33 | .28 |
| Net realized and unrealized gain (loss) | 4.02 | (1.56) | .43 | 1.88 | 1.90 | (.74) |
| Total from investment operations | 4.06 | (1.20) | .82 | 2.23 | 2.23 | (.46) |
| Distributions from net investment income | (.01) | (.33) | (.38) | (.33) | (.31) | (.30) |
| Distributions from net realized gain | (.06) | (2.49) | (.02) | (.03) | (.01) | –B |
| Total distributions | (.06)C | (2.82) | (.40) | (.36) | (.32) | (.30) |
| Net asset value, end of period | $19.31 | $15.31 | $19.33 | $18.91 | $17.04 | $15.13 |
| Total ReturnD,E | 26.58% | (8.96)% | 4.58% | 13.08% | 14.87% | (2.88)% |
| Ratios to Average Net AssetsF,G | | | | | | |
| Expenses before reductions | .12%H | .12% | .15% | .15% | .15% | .15% |
| Expenses net of fee waivers, if any | .12%H | .12% | .11% | .12% | .10% | .08% |
| Expenses net of all reductions | .12%H | .12% | .11% | .12% | .10% | .08% |
| Net investment income (loss) | .41%H | 1.85% | 2.06% | 1.89% | 2.04% | 1.79% |
| Supplemental Data | | | | | | |
| Net assets, end of period (000 omitted) | $2,503,430 | $1,810,294 | $1,244,020 | $872,779 | $583,893 | $542,581 |
| Portfolio turnover rateI | 14%H | 77% | 10% | 6% | 15% | 8% |
A Calculated based on average shares outstanding during the period.
B Amount represents less than $.005 per share.
C Total distributions per share do not sum due to rounding.
D Total returns for periods of less than one year are not annualized.
E Total returns would have been lower if certain expenses had not been reduced during the applicable periods shown.
F Fees and expenses of any underlying mutual funds or exchange-traded funds (ETFs) are not included in the Fund's expense ratio. The Fund indirectly bears its proportionate share of these expenses. For additional expense information related to investments in Fidelity Central Funds, please refer to the "Investments in Fidelity Central Funds" note found in the Notes to Financial Statements section of the most recent Annual or Semi-Annual report.
G Expense ratios reflect operating expenses of the class. Expenses before reductions do not reflect amounts reimbursed, waived, or reduced through arrangements with the investment adviser, brokerage services, or other offset arrangements, if applicable, and do not represent the amount paid by the class during periods when reimbursements, waivers or reductions occur.
H Annualized
I Amount does not include the portfolio activity of any underlying mutual funds or exchange-traded funds (ETFs).
See accompanying notes which are an integral part of the financial statements.
Fidelity Freedom Index 2045 Fund Institutional Premium Class
| | Six months ended (Unaudited) September 30, | Years endedMarch 31, | | | | |
| | 2020 | 2020 | 2019 | 2018 | 2017 | 2016 A |
| Selected Per–Share Data | | | | | | |
| Net asset value, beginning of period | $15.32 | $19.33 | $18.92 | $17.04 | $15.13 | $16.26 |
| Income from Investment Operations | | | | | | |
| Net investment income (loss)B | .04 | .37 | .40 | .36 | .34 | .40 |
| Net realized and unrealized gain (loss) | 4.01 | (1.55) | .42 | 1.89 | 1.90 | (1.22) |
| Total from investment operations | 4.05 | (1.18) | .82 | 2.25�� | 2.24 | (.82) |
| Distributions from net investment income | (.01) | (.34) | (.39) | (.34) | (.32) | (.30) |
| Distributions from net realized gain | (.06) | (2.49) | (.02) | (.03) | (.01) | –C |
| Total distributions | (.06)D | (2.83) | (.41) | (.37) | (.33) | (.31)D |
| Net asset value, end of period | $19.31 | $15.32 | $19.33 | $18.92 | $17.04 | $15.13 |
| Total ReturnE,F | 26.51% | (8.88)% | 4.58% | 13.20% | 14.94% | (5.08)% |
| Ratios to Average Net AssetsG,H | | | | | | |
| Expenses before reductions | .08%I | .08% | .10% | .10% | .09% | .05%I |
| Expenses net of fee waivers, if any | .08%I | .08% | .05% | .07% | .05% | .01%I |
| Expenses net of all reductions | .08%I | .08% | .05% | .07% | .05% | .01%I |
| Net investment income (loss) | .45%I | 1.89% | 2.11% | 1.94% | 2.09% | 3.56%I |
| Supplemental Data | | | | | | |
| Net assets, end of period (000 omitted) | $2,718,130 | $1,890,160 | $1,446,055 | $1,062,443 | $743,645 | $386,977 |
| Portfolio turnover rateJ | 14%I | 77% | 10% | 6% | 15% | 8% |
A For the period June 24, 2015 (commencement of sale of shares) to March 31, 2016.
B Calculated based on average shares outstanding during the period.
C Amount represents less than $.005 per share.
D Total distributions per share do not sum due to rounding.
E Total returns for periods of less than one year are not annualized.
F Total returns would have been lower if certain expenses had not been reduced during the applicable periods shown.
G Fees and expenses of any underlying mutual funds or exchange-traded funds (ETFs) are not included in the Fund's expense ratio. The Fund indirectly bears its proportionate share of these expenses. For additional expense information related to investments in Fidelity Central Funds, please refer to the "Investments in Fidelity Central Funds" note found in the Notes to Financial Statements section of the most recent Annual or Semi-Annual report.
H Expense ratios reflect operating expenses of the class. Expenses before reductions do not reflect amounts reimbursed, waived, or reduced through arrangements with the investment adviser, brokerage services, or other offset arrangements, if applicable, and do not represent the amount paid by the class during periods when reimbursements, waivers or reductions occur.
I Annualized
J Amount does not include the portfolio activity of any underlying mutual funds or exchange-traded funds (ETFs).
See accompanying notes which are an integral part of the financial statements.
Fidelity Freedom Index 2045 Fund Premier Class
| | Six months ended (Unaudited) September 30, |
| | 2020 A |
| Selected Per–Share Data | |
| Net asset value, beginning of period | $17.81 |
| Income from Investment Operations | |
| Net investment income (loss)B | .01 |
| Net realized and unrealized gain (loss) | 1.50 |
| Total from investment operations | 1.51 |
| Net asset value, end of period | $19.32 |
| Total ReturnC | 8.48% |
| Ratios to Average Net AssetsD,E | |
| Expenses before reductions | .06%F |
| Expenses net of fee waivers, if any | .06%F |
| Expenses net of all reductions | .06%F |
| Net investment income (loss) | .14%F |
| Supplemental Data | |
| Net assets, end of period (000 omitted) | $1,754 |
| Portfolio turnover rateG | 14%F |
A For the period June 24, 2020 (commencement of sale of shares) to September 30, 2020.
B Calculated based on average shares outstanding during the period.
C Total returns for periods of less than one year are not annualized.
D Fees and expenses of any underlying mutual funds or exchange-traded funds (ETFs) are not included in the Fund's expense ratio. The Fund indirectly bears its proportionate share of these expenses. For additional expense information related to investments in Fidelity Central Funds, please refer to the "Investments in Fidelity Central Funds" note found in the Notes to Financial Statements section of the most recent Annual or Semi-Annual report.
E Expense ratios reflect operating expenses of the class. Expenses before reductions do not reflect amounts reimbursed, waived, or reduced through arrangements with the investment adviser, brokerage services, or other offset arrangements, if applicable, and do not represent the amount paid by the class during periods when reimbursements, waivers or reductions occur.
F Annualized
G Amount does not include the portfolio activity of any underlying mutual funds or exchange-traded funds (ETFs).
See accompanying notes which are an integral part of the financial statements.
Fidelity Freedom® Index 2050 Fund
Investment Summary (Unaudited)
The information in the following tables is based on the direct investments of the Fund.
Top Holdings as of September 30, 2020
| | % of fund's net assets |
| Fidelity Series Total Market Index Fund | 53.8 |
| Fidelity Series Global ex U.S. Index Fund | 36.1 |
| Fidelity Series Bond Index Fund | 7.1 |
| Fidelity Series Long-Term Treasury Bond Index Fund | 3.0 |
| Fidelity Cash Central Fund 0.10% | 0.0 |
| | 100.0 |
Asset Allocation (% of fund's net assets)
| Period end |
| | Domestic Equity Funds | 53.8% |
| | International Equity Funds | 36.1% |
| | Bond Funds | 10.1% |

Percentages shown as 0.0% may reflect amounts less than 0.05%.
Fidelity Freedom® Index 2050 Fund
Schedule of Investments September 30, 2020 (Unaudited)
Showing Percentage of Net Assets
| Domestic Equity Funds - 53.8% | | | |
| | | Shares | Value |
| Fidelity Series Total Market Index Fund (a) | | | |
| (Cost $2,237,868,437) | | 223,565,173 | 2,553,114,280 |
|
| International Equity Funds - 36.1% | | | |
| Fidelity Series Global ex U.S. Index Fund (a) | | | |
| (Cost $1,637,348,982) | | 136,684,539 | 1,711,290,428 |
|
| Bond Funds - 10.1% | | | |
| Fidelity Series Bond Index Fund (a) | | 30,772,418 | 334,803,913 |
| Fidelity Series Long-Term Treasury Bond Index Fund (a) | | 13,935,776 | 143,956,565 |
| TOTAL BOND FUNDS | | | |
| (Cost $444,241,731) | | | 478,760,478 |
|
| Short-Term Funds - 0.0% | | | |
| Fidelity Cash Central Fund 0.10% (b) | | | |
| (Cost $7,655) | | 7,653 | 7,655 |
| TOTAL INVESTMENT IN SECURITIES - 100.0% | | | |
| (Cost $4,319,466,805) | | | 4,743,172,841 |
| NET OTHER ASSETS (LIABILITIES) - 0.0% | | | (310,359) |
| NET ASSETS - 100% | | | $4,742,862,482 |
Legend
(a) Affiliated Fund
(b) Affiliated fund that is generally available only to investment companies and other accounts managed by Fidelity Investments. The rate quoted is the annualized seven-day yield of the fund at period end. A complete unaudited listing of the fund's holdings as of its most recent quarter end is available upon request. In addition, each Fidelity Central Fund's financial statements are available on the SEC's website or upon request.
Affiliated Central Funds
Information regarding fiscal year to date income earned by the Fund from investments in Fidelity Central Funds is as follows:
| Fund | Income earned |
| Fidelity Cash Central Fund | $4 |
| Total | $4 |
Amounts in the income column in the above table include any capital gain distributions from underlying funds, which are presented in the corresponding line-item in the Statement of Operations, if applicable.
Affiliated Underlying Funds
Fiscal year to date information regarding the Fund's investments in affiliated Underlying Funds, excluding any Money Market Central Funds, is presented below. Exchanges between classes of the same affiliated Underlying Funds may occur.
| Affiliate | Value, beginning of period | Purchases | Sales Proceeds | Dividend Income | Realized Gain (loss) | Change in Unrealized appreciation (depreciation) | Value, end of period |
| Fidelity Series Bond Index Fund | $239,541,482 | $104,816,737 | $14,892,955 | $2,979,699 | $5,775 | $5,332,874 | $334,803,913 |
| Fidelity Series Global ex U.S. Index Fund | 1,206,691,413 | 267,886,426 | 66,417,233 | -- | (3,537,864) | 306,667,686 | 1,711,290,428 |
| Fidelity Series Long-Term Treasury Bond Index Fund | 102,886,807 | 51,114,292 | 6,295,241 | 3,000,814 | 193,091 | (3,942,384) | 143,956,565 |
| Fidelity Series Total Market Index Fund | 1,791,279,644 | 345,079,855 | 183,192,545 | 9,715,671 | (9,662,147) | 609,609,473 | 2,553,114,280 |
| Total | $3,340,399,346 | $768,897,310 | $270,797,974 | $15,696,184 | $(13,001,145) | $917,667,649 | $4,743,165,186 |
Amounts in the income column in the above table include any capital gain distributions from underlying funds, which are presented in the corresponding line-item in the Statement of Operations, if applicable.
Investment Valuation
The following is a summary of the inputs used, as of September 30, 2020, involving the Fund's assets and liabilities carried at fair value. The inputs or methodology used for valuing securities may not be an indication of the risk associated with investing in those securities. For more information on valuation inputs, and their aggregation into the levels used below, please refer to the Investment Valuation section in the accompanying Notes to Financial Statements.
| | Valuation Inputs at Reporting Date: |
| Description | Total | Level 1 | Level 2 | Level 3 |
| Investments in Securities: | | | | |
| Domestic Equity Funds | $2,553,114,280 | $2,553,114,280 | $-- | $-- |
| International Equity Funds | 1,711,290,428 | 1,711,290,428 | -- | -- |
| Bond Funds | 478,760,478 | 478,760,478 | -- | -- |
| Short-Term Funds | 7,655 | 7,655 | -- | -- |
| Total Investments in Securities: | $4,743,172,841 | $4,743,172,841 | $-- | $-- |
See accompanying notes which are an integral part of the financial statements.
Fidelity Freedom® Index 2050 Fund
Financial Statements
Statement of Assets and Liabilities
| | | September 30, 2020 (Unaudited) |
| Assets | | |
Investment in securities, at value — See accompanying schedule:
| | |
| Fidelity Central Funds (cost $7,655) | $7,655 | |
| Other affiliated issuers (cost $4,319,459,150) | 4,743,165,186 | |
| Total Investment in Securities (cost $4,319,466,805) | | $4,743,172,841 |
| Cash | | 1,134 |
| Receivable for investments sold | | 11,116,296 |
| Receivable for fund shares sold | | 17,869,475 |
| Distributions receivable from Fidelity Central Funds | | 1 |
| Total assets | | 4,772,159,747 |
| Liabilities | | |
| Payable for investments purchased | $25,709,742 | |
| Payable for fund shares redeemed | 3,276,029 | |
| Accrued management fee | 311,494 | |
| Total liabilities | | 29,297,265 |
| Net Assets | | $4,742,862,482 |
| Net Assets consist of: | | |
| Paid in capital | | $4,327,594,074 |
| Total accumulated earnings (loss) | | 415,268,408 |
| Net Assets | | $4,742,862,482 |
| Net Asset Value and Maximum Offering Price | | |
| Investor Class: | | |
| Net Asset Value, offering price and redemption price per share ($2,156,985,226 ÷ 111,497,873 shares) | | $19.35 |
| Institutional Premium Class: | | |
| Net Asset Value, offering price and redemption price per share ($2,584,326,478 ÷ 133,578,783 shares) | | $19.35 |
| Premier Class: | | |
| Net Asset Value, offering price and redemption price per share ($1,550,778 ÷ 80,147 shares) | | $19.35 |
See accompanying notes which are an integral part of the financial statements.
Statement of Operations
| | | Six months ended September 30, 2020 (Unaudited) |
| Investment Income | | |
| Dividends: | | |
| Affiliated issuers | | $10,951,379 |
| Income from Fidelity Central Funds | | 4 |
| Total income | | 10,951,383 |
| Expenses | | |
| Management fee | $1,983,956 | |
| Independent trustees' fees and expenses | 5,455 | |
| Total expenses | | 1,989,411 |
| Net investment income (loss) | | 8,961,972 |
| Realized and Unrealized Gain (Loss) | | |
| Net realized gain (loss) on: | | |
| Investment securities: | | |
| Affiliated issuers | (13,001,145) | |
| Capital gain distributions from underlying funds: | | |
| Affiliated issuers | 4,744,805 | |
| Total net realized gain (loss) | | (8,256,340) |
| Change in net unrealized appreciation (depreciation) on: | | |
| Investment securities: | | |
| Affiliated issuers | 917,667,649 | |
| Total change in net unrealized appreciation (depreciation) | | 917,667,649 |
| Net gain (loss) | | 909,411,309 |
| Net increase (decrease) in net assets resulting from operations | | $918,373,281 |
See accompanying notes which are an integral part of the financial statements.
Statement of Changes in Net Assets
| | Six months ended September 30, 2020 (Unaudited) | Year ended March 31, 2020 |
| Increase (Decrease) in Net Assets | | |
| Operations | | |
| Net investment income (loss) | $8,961,972 | $57,893,231 |
| Net realized gain (loss) | (8,256,340) | 442,865,384 |
| Change in net unrealized appreciation (depreciation) | 917,667,649 | (897,221,134) |
| Net increase (decrease) in net assets resulting from operations | 918,373,281 | (396,462,519) |
| Distributions to shareholders | (13,774,747) | (488,861,326) |
| Share transactions - net increase (decrease) | 498,071,899 | 1,799,394,306 |
| Total increase (decrease) in net assets | 1,402,670,433 | 914,070,461 |
| Net Assets | | |
| Beginning of period | 3,340,192,049 | 2,426,121,588 |
| End of period | $4,742,862,482 | $3,340,192,049 |
See accompanying notes which are an integral part of the financial statements.
Financial Highlights
Fidelity Freedom Index 2050 Fund Investor Class
| | Six months ended (Unaudited) September 30, | Years endedMarch 31, | | | | |
| | 2020 | 2020 | 2019 | 2018 | 2017 | 2016 |
| Selected Per–Share Data | | | | | | |
| Net asset value, beginning of period | $15.34 | $19.41 | $19.00 | $17.14 | $15.24 | $16.01 |
| Income from Investment Operations | | | | | | |
| Net investment income (loss)A | .04 | .36 | .39 | .35 | .33 | .28 |
| Net realized and unrealized gain (loss) | 4.03 | (1.55) | .42 | 1.90 | 1.91 | (.74) |
| Total from investment operations | 4.07 | (1.19) | .81 | 2.25 | 2.24 | (.46) |
| Distributions from net investment income | (.01) | (.34) | (.38) | (.33) | (.33) | (.30) |
| Distributions from net realized gain | (.06) | (2.54) | (.02) | (.06) | (.01) | –B |
| Total distributions | (.06)C | (2.88) | (.40) | (.39) | (.34) | (.31) |
| Net asset value, end of period | $19.35 | $15.34 | $19.41 | $19.00 | $17.14 | $15.24 |
| Total ReturnD,E | 26.60% | (8.95)% | 4.53% | 13.15% | 14.82% | (2.92)% |
| Ratios to Average Net AssetsF,G | | | | | | |
| Expenses before reductions | .12%H | .12% | .15% | .15% | .15% | .15% |
| Expenses net of fee waivers, if any | .12%H | .12% | .11% | .12% | .10% | .08% |
| Expenses net of all reductions | .12%H | .12% | .11% | .12% | .10% | .08% |
| Net investment income (loss) | .40%H | 1.84% | 2.06% | 1.89% | 2.06% | 1.80% |
| Supplemental Data | | | | | | |
| Net assets, end of period (000 omitted) | $2,156,985 | $1,524,955 | $1,049,434 | $739,919 | $513,543 | $486,444 |
| Portfolio turnover rateI | 13%H | 77% | 12% | 6% | 19% | 7% |
A Calculated based on average shares outstanding during the period.
B Amount represents less than $.005 per share.
C Total distributions per share do not sum due to rounding.
D Total returns for periods of less than one year are not annualized.
E Total returns would have been lower if certain expenses had not been reduced during the applicable periods shown.
F Fees and expenses of any underlying mutual funds or exchange-traded funds (ETFs) are not included in the Fund's expense ratio. The Fund indirectly bears its proportionate share of these expenses. For additional expense information related to investments in Fidelity Central Funds, please refer to the "Investments in Fidelity Central Funds" note found in the Notes to Financial Statements section of the most recent Annual or Semi-Annual report.
G Expense ratios reflect operating expenses of the class. Expenses before reductions do not reflect amounts reimbursed, waived, or reduced through arrangements with the investment adviser, brokerage services, or other offset arrangements, if applicable, and do not represent the amount paid by the class during periods when reimbursements, waivers or reductions occur.
H Annualized
I Amount does not include the portfolio activity of any underlying mutual funds or exchange-traded funds (ETFs).
See accompanying notes which are an integral part of the financial statements.
Fidelity Freedom Index 2050 Fund Institutional Premium Class
| | Six months ended (Unaudited) September 30, | Years endedMarch 31, | | | | |
| | 2020 | 2020 | 2019 | 2018 | 2017 | 2016 A |
| Selected Per–Share Data | | | | | | |
| Net asset value, beginning of period | $15.34 | $19.41 | $19.00 | $17.14 | $15.24 | $16.37 |
| Income from Investment Operations | | | | | | |
| Net investment income (loss)B | .04 | .37 | .40 | .36 | .34 | .38 |
| Net realized and unrealized gain (loss) | 4.03 | (1.55) | .42 | 1.90 | 1.91 | (1.20) |
| Total from investment operations | 4.07 | (1.18) | .82 | 2.26 | 2.25 | (.82) |
| Distributions from net investment income | (.01) | (.34) | (.39) | (.34) | (.34) | (.30) |
| Distributions from net realized gain | (.06) | (2.54) | (.02) | (.06) | (.01) | –C |
| Total distributions | (.06)D | (2.89) | (.41) | (.40) | (.35) | (.31)D |
| Net asset value, end of period | $19.35 | $15.34 | $19.41 | $19.00 | $17.14 | $15.24 |
| Total ReturnE,F | 26.60% | (8.91)% | 4.59% | 13.20% | 14.88% | (5.04)% |
| Ratios to Average Net AssetsG,H | | | | | | |
| Expenses before reductions | .08%I | .08% | .10% | .10% | .09% | .05%I |
| Expenses net of fee waivers, if any | .08%I | .08% | .05% | .07% | .05% | .01%I |
| Expenses net of all reductions | .08%I | .08% | .05% | .07% | .05% | .01%I |
| Net investment income (loss) | .44%I | 1.89% | 2.11% | 1.94% | 2.11% | 3.40%I |
| Supplemental Data | | | | | | |
| Net assets, end of period (000 omitted) | $2,584,326 | $1,815,237 | $1,376,687 | $1,063,718 | $722,781 | $434,989 |
| Portfolio turnover rateJ | 13%I | 77% | 12% | 6% | 19% | 7% |
A For the period June 24, 2015 (commencement of sale of shares) to March 31, 2016.
B Calculated based on average shares outstanding during the period.
C Amount represents less than $.005 per share.
D Total distributions per share do not sum due to rounding.
E Total returns for periods of less than one year are not annualized.
F Total returns would have been lower if certain expenses had not been reduced during the applicable periods shown.
G Fees and expenses of any underlying mutual funds or exchange-traded funds (ETFs) are not included in the Fund's expense ratio. The Fund indirectly bears its proportionate share of these expenses. For additional expense information related to investments in Fidelity Central Funds, please refer to the "Investments in Fidelity Central Funds" note found in the Notes to Financial Statements section of the most recent Annual or Semi-Annual report.
H Expense ratios reflect operating expenses of the class. Expenses before reductions do not reflect amounts reimbursed, waived, or reduced through arrangements with the investment adviser, brokerage services, or other offset arrangements, if applicable, and do not represent the amount paid by the class during periods when reimbursements, waivers or reductions occur.
I Annualized
J Amount does not include the portfolio activity of any underlying mutual funds or exchange-traded funds (ETFs).
See accompanying notes which are an integral part of the financial statements.
Fidelity Freedom Index 2050 Fund Premier Class
| | Six months ended (Unaudited) September 30, |
| | 2020 A |
| Selected Per–Share Data | |
| Net asset value, beginning of period | $17.84 |
| Income from Investment Operations | |
| Net investment income (loss)B | .01 |
| Net realized and unrealized gain (loss) | 1.50 |
| Total from investment operations | 1.51 |
| Net asset value, end of period | $19.35 |
| Total ReturnC | 8.46% |
| Ratios to Average Net AssetsD,E | |
| Expenses before reductions | .06%F |
| Expenses net of fee waivers, if any | .06%F |
| Expenses net of all reductions | .06%F |
| Net investment income (loss) | .14%F |
| Supplemental Data | |
| Net assets, end of period (000 omitted) | $1,551 |
| Portfolio turnover rateG | 13%F |
A For the period June 24, 2020 (commencement of sale of shares) to September 30, 2020.
B Calculated based on average shares outstanding during the period.
C Total returns for periods of less than one year are not annualized.
D Fees and expenses of any underlying mutual funds or exchange-traded funds (ETFs) are not included in the Fund's expense ratio. The Fund indirectly bears its proportionate share of these expenses. For additional expense information related to investments in Fidelity Central Funds, please refer to the "Investments in Fidelity Central Funds" note found in the Notes to Financial Statements section of the most recent Annual or Semi-Annual report.
E Expense ratios reflect operating expenses of the class. Expenses before reductions do not reflect amounts reimbursed, waived, or reduced through arrangements with the investment adviser, brokerage services, or other offset arrangements, if applicable, and do not represent the amount paid by the class during periods when reimbursements, waivers or reductions occur.
F Annualized
G Amount does not include the portfolio activity of any underlying mutual funds or exchange-traded funds (ETFs).
See accompanying notes which are an integral part of the financial statements.
Fidelity Freedom® Index 2055 Fund
Investment Summary (Unaudited)
The information in the following tables is based on the direct investments of the Fund.
Top Holdings as of September 30, 2020
| | % of fund's net assets |
| Fidelity Series Total Market Index Fund | 53.8 |
| Fidelity Series Global ex U.S. Index Fund | 36.1 |
| Fidelity Series Bond Index Fund | 7.1 |
| Fidelity Series Long-Term Treasury Bond Index Fund | 3.0 |
| Fidelity Cash Central Fund 0.10% | 0.0 |
| | 100.0 |
Asset Allocation (% of fund's net assets)
| Period end |
| | Domestic Equity Funds | 53.8% |
| | International Equity Funds | 36.1% |
| | Bond Funds | 10.1% |

Percentages shown as 0.0% may reflect amounts less than 0.05%.
Fidelity Freedom® Index 2055 Fund
Schedule of Investments September 30, 2020 (Unaudited)
Showing Percentage of Net Assets
| Domestic Equity Funds - 53.8% | | | |
| | | Shares | Value |
| Fidelity Series Total Market Index Fund (a) | | | |
| (Cost $1,123,053,232) | | 111,889,908 | 1,277,782,751 |
|
| International Equity Funds - 36.1% | | | |
| Fidelity Series Global ex U.S. Index Fund (a) | | | |
| (Cost $822,597,762) | | 68,407,846 | 856,466,229 |
|
| Bond Funds - 10.1% | | | |
| Fidelity Series Bond Index Fund (a) | | 15,400,847 | 167,561,218 |
| Fidelity Series Long-Term Treasury Bond Index Fund (a) | | 6,974,513 | 72,046,721 |
| TOTAL BOND FUNDS | | | |
| (Cost $223,662,622) | | | 239,607,939 |
|
| Short-Term Funds - 0.0% | | | |
| Fidelity Cash Central Fund 0.10% (b) | | | |
| (Cost $3,872) | | 3,872 | 3,872 |
| TOTAL INVESTMENT IN SECURITIES - 100.0% | | | |
| (Cost $2,169,317,488) | | | 2,373,860,791 |
| NET OTHER ASSETS (LIABILITIES) - 0.0% | | | (161,851) |
| NET ASSETS - 100% | | | $2,373,698,940 |
Legend
(a) Affiliated Fund
(b) Affiliated fund that is generally available only to investment companies and other accounts managed by Fidelity Investments. The rate quoted is the annualized seven-day yield of the fund at period end. A complete unaudited listing of the fund's holdings as of its most recent quarter end is available upon request. In addition, each Fidelity Central Fund's financial statements are available on the SEC's website or upon request.
Affiliated Central Funds
Information regarding fiscal year to date income earned by the Fund from investments in Fidelity Central Funds is as follows:
| Fund | Income earned |
| Fidelity Cash Central Fund | $1 |
| Total | $1 |
Amounts in the income column in the above table include any capital gain distributions from underlying funds, which are presented in the corresponding line-item in the Statement of Operations, if applicable.
Affiliated Underlying Funds
Fiscal year to date information regarding the Fund's investments in affiliated Underlying Funds, excluding any Money Market Central Funds, is presented below. Exchanges between classes of the same affiliated Underlying Funds may occur.
| Affiliate | Value, beginning of period | Purchases | Sales Proceeds | Dividend Income | Realized Gain (loss) | Change in Unrealized appreciation (depreciation) | Value, end of period |
| Fidelity Series Bond Index Fund | $113,320,540 | $58,537,311 | $6,838,139 | $1,457,413 | $(6,723) | $2,548,229 | $167,561,218 |
| Fidelity Series Global ex U.S. Index Fund | 570,867,244 | 166,923,861 | 28,118,987 | -- | (2,579,841) | 149,373,952 | 856,466,229 |
| Fidelity Series Long-Term Treasury Bond Index Fund | 48,672,910 | 28,082,018 | 2,888,885 | 1,443,359 | 62,969 | (1,882,291) | 72,046,721 |
| Fidelity Series Total Market Index Fund | 847,430,888 | 224,211,774 | 84,414,380 | 4,617,203 | (5,451,188) | 296,005,657 | 1,277,782,751 |
| Total | $1,580,291,582 | $477,754,964 | $122,260,391 | $7,517,975 | $(7,974,783) | $446,045,547 | $2,373,856,919 |
Amounts in the income column in the above table include any capital gain distributions from underlying funds, which are presented in the corresponding line-item in the Statement of Operations, if applicable.
Investment Valuation
The following is a summary of the inputs used, as of September 30, 2020, involving the Fund's assets and liabilities carried at fair value. The inputs or methodology used for valuing securities may not be an indication of the risk associated with investing in those securities. For more information on valuation inputs, and their aggregation into the levels used below, please refer to the Investment Valuation section in the accompanying Notes to Financial Statements.
| | Valuation Inputs at Reporting Date: |
| Description | Total | Level 1 | Level 2 | Level 3 |
| Investments in Securities: | | | | |
| Domestic Equity Funds | $1,277,782,751 | $1,277,782,751 | $-- | $-- |
| International Equity Funds | 856,466,229 | 856,466,229 | -- | -- |
| Bond Funds | 239,607,939 | 239,607,939 | -- | -- |
| Short-Term Funds | 3,872 | 3,872 | -- | -- |
| Total Investments in Securities: | $2,373,860,791 | $2,373,860,791 | $-- | $-- |
See accompanying notes which are an integral part of the financial statements.
Fidelity Freedom® Index 2055 Fund
Financial Statements
Statement of Assets and Liabilities
| | | September 30, 2020 (Unaudited) |
| Assets | | |
Investment in securities, at value — See accompanying schedule:
| | |
| Fidelity Central Funds (cost $3,872) | $3,872 | |
| Other affiliated issuers (cost $2,169,313,616) | 2,373,856,919 | |
| Total Investment in Securities (cost $2,169,317,488) | | $2,373,860,791 |
| Cash | | 1 |
| Receivable for investments sold | | 5,450,631 |
| Receivable for fund shares sold | | 9,650,358 |
| Total assets | | 2,388,961,781 |
| Liabilities | | |
| Payable for investments purchased | $13,005,224 | |
| Payable for fund shares redeemed | 2,095,764 | |
| Accrued management fee | 161,853 | |
| Total liabilities | | 15,262,841 |
| Net Assets | | $2,373,698,940 |
| Net Assets consist of: | | |
| Paid in capital | | $2,173,871,418 |
| Total accumulated earnings (loss) | | 199,827,522 |
| Net Assets | | $2,373,698,940 |
| Net Asset Value and Maximum Offering Price | | |
| Investor Class: | | |
| Net Asset Value, offering price and redemption price per share ($1,264,297,011 ÷ 79,594,668 shares) | | $15.88 |
| Institutional Premium Class: | | |
| Net Asset Value, offering price and redemption price per share ($1,107,720,905 ÷ 69,659,967 shares) | | $15.90 |
| Premier Class: | | |
| Net Asset Value, offering price and redemption price per share ($1,681,024 ÷ 105,725 shares) | | $15.90 |
See accompanying notes which are an integral part of the financial statements.
Statement of Operations
| | | Six months ended September 30, 2020 (Unaudited) |
| Investment Income | | |
| Dividends: | | |
| Affiliated issuers | | $5,263,079 |
| Income from Fidelity Central Funds | | 1 |
| Total income | | 5,263,080 |
| Expenses | | |
| Management fee | $1,006,181 | |
| Independent trustees' fees and expenses | 2,634 | |
| Total expenses before reductions | 1,008,815 | |
| Expense reductions | (3) | |
| Total expenses after reductions | | 1,008,812 |
| Net investment income (loss) | | 4,254,268 |
| Realized and Unrealized Gain (Loss) | | |
| Net realized gain (loss) on: | | |
| Investment securities: | | |
| Affiliated issuers | (7,974,783) | |
| Capital gain distributions from underlying funds: | | |
| Affiliated issuers | 2,254,896 | |
| Total net realized gain (loss) | | (5,719,887) |
| Change in net unrealized appreciation (depreciation) on: | | |
| Investment securities: | | |
| Affiliated issuers | 446,045,547 | |
| Total change in net unrealized appreciation (depreciation) | | 446,045,547 |
| Net gain (loss) | | 440,325,660 |
| Net increase (decrease) in net assets resulting from operations | | $444,579,928 |
See accompanying notes which are an integral part of the financial statements.
Statement of Changes in Net Assets
| | Six months ended September 30, 2020 (Unaudited) | Year ended March 31, 2020 |
| Increase (Decrease) in Net Assets | | |
| Operations | | |
| Net investment income (loss) | $4,254,268 | $25,497,925 |
| Net realized gain (loss) | (5,719,887) | 140,432,381 |
| Change in net unrealized appreciation (depreciation) | 446,045,547 | (361,589,048) |
| Net increase (decrease) in net assets resulting from operations | 444,579,928 | (195,658,742) |
| Distributions to shareholders | (5,699,580) | (160,934,870) |
| Share transactions - net increase (decrease) | 354,630,468 | 910,128,176 |
| Total increase (decrease) in net assets | 793,510,816 | 553,534,564 |
| Net Assets | | |
| Beginning of period | 1,580,188,124 | 1,026,653,560 |
| End of period | $2,373,698,940 | $1,580,188,124 |
See accompanying notes which are an integral part of the financial statements.
Financial Highlights
Fidelity Freedom Index 2055 Fund Investor Class
| | Six months ended (Unaudited) September 30, | Years endedMarch 31, | | | | |
| | 2020 | 2020 | 2019 | 2018 | 2017 | 2016 |
| Selected Per–Share Data | | | | | | |
| Net asset value, beginning of period | $12.59 | $15.33 | $15.01 | $13.53 | $12.06 | $12.71 |
| Income from Investment Operations | | | | | | |
| Net investment income (loss)A | .03 | .28 | .31 | .28 | .28 | .25 |
| Net realized and unrealized gain (loss) | 3.30 | (1.33) | .34 | 1.49 | 1.50 | (.63) |
| Total from investment operations | 3.33 | (1.05) | .65 | 1.77 | 1.78 | (.38) |
| Distributions from net investment income | –B | (.26) | (.30) | (.26) | (.29) | (.24)C |
| Distributions from net realized gain | (.04) | (1.42) | (.03) | (.04) | (.02) | (.01)C |
| Tax return of capital | – | – | – | – | – | (.02) |
| Total distributions | (.04) | (1.69)D | (.33) | (.29)D | (.31) | (.27) |
| Net asset value, end of period | $15.88 | $12.59 | $15.33 | $15.01 | $13.53 | $12.06 |
| Total ReturnE,F | 26.51% | (8.94)% | 4.57% | 13.09% | 14.90% | (2.96)% |
| Ratios to Average Net AssetsG,H | | | | | | |
| Expenses before reductions | .12%I | .12% | .15% | .15% | .15% | .15% |
| Expenses net of fee waivers, if any | .12%I | .12% | .11% | .12% | .10% | .08% |
| Expenses net of all reductions | .12%I | .12% | .11% | .12% | .10% | .08% |
| Net investment income (loss) | .40%I | 1.83% | 2.06% | 1.90% | 2.18% | 2.03% |
| Supplemental Data | | | | | | |
| Net assets, end of period (000 omitted) | $1,264,297 | $867,162 | $510,460 | $305,192 | $181,697 | $150,332 |
| Portfolio turnover rateJ | 12%I | 74% | 11% | 6% | 33% | 7% |
A Calculated based on average shares outstanding during the period.
B Amount represents less than $.005 per share.
C The amounts shown reflect certain reclassifications related to book to tax differences that were made in the year shown.
D Total distributions per share do not sum due to rounding.
E Total returns for periods of less than one year are not annualized.
F Total returns would have been lower if certain expenses had not been reduced during the applicable periods shown.
G Fees and expenses of any underlying mutual funds or exchange-traded funds (ETFs) are not included in the Fund's expense ratio. The Fund indirectly bears its proportionate share of these expenses. For additional expense information related to investments in Fidelity Central Funds, please refer to the "Investments in Fidelity Central Funds" note found in the Notes to Financial Statements section of the most recent Annual or Semi-Annual report.
H Expense ratios reflect operating expenses of the class. Expenses before reductions do not reflect amounts reimbursed, waived, or reduced through arrangements with the investment adviser, brokerage services, or other offset arrangements, if applicable, and do not represent the amount paid by the class during periods when reimbursements, waivers or reductions occur.
I Annualized
J Amount does not include the portfolio activity of any underlying mutual funds or exchange-traded funds (ETFs).
See accompanying notes which are an integral part of the financial statements.
Fidelity Freedom Index 2055 Fund Institutional Premium Class
| | Six months ended (Unaudited) September 30, | Years endedMarch 31, | | | | |
| | 2020 | 2020 | 2019 | 2018 | 2017 | 2016 A |
| Selected Per–Share Data | | | | | | |
| Net asset value, beginning of period | $12.61 | $15.34 | $15.02 | $13.54 | $12.06 | $13.00 |
| Income from Investment Operations | | | | | | |
| Net investment income (loss)B | .03 | .29 | .32 | .29 | .28 | .23 |
| Net realized and unrealized gain (loss) | 3.31 | (1.33) | .34 | 1.49 | 1.51 | (.89) |
| Total from investment operations | 3.34 | (1.04) | .66 | 1.78 | 1.79 | (.66) |
| Distributions from net investment income | (.01) | (.27) | (.30) | (.26) | (.29) | (.25)C |
| Distributions from net realized gain | (.04) | (1.42) | (.03) | (.04) | (.02) | (.01)C |
| Tax return of capital | – | – | – | – | – | (.02) |
| Total distributions | (.05) | (1.69) | (.34)D | (.30) | (.31) | (.28) |
| Net asset value, end of period | $15.90 | $12.61 | $15.34 | $15.02 | $13.54 | $12.06 |
| Total ReturnE,F | 26.50% | (8.85)% | 4.61% | 13.13% | 14.98% | (5.11)% |
| Ratios to Average Net AssetsG,H | | | | | | |
| Expenses before reductions | .08%I | .08% | .10% | .10% | .09% | .05%I |
| Expenses net of fee waivers, if any | .08%I | .08% | .05% | .07% | .05% | .01%I |
| Expenses net of all reductions | .08%I | .08% | .05% | .07% | .05% | .01%I |
| Net investment income (loss) | .44%I | 1.87% | 2.12% | 1.95% | 2.23% | 2.63%I |
| Supplemental Data | | | | | | |
| Net assets, end of period (000 omitted) | $1,107,721 | $713,027 | $516,194 | $342,884 | $210,752 | $135,214 |
| Portfolio turnover rateJ | 12%I | 74% | 11% | 6% | 33% | 7% |
A For the period June 24, 2015 (commencement of sale of shares) to March 31, 2016.
B Calculated based on average shares outstanding during the period.
C The amounts shown reflect certain reclassifications related to book to tax differences that were made in the year shown.
D Total distributions per share do not sum due to rounding.
E Total returns for periods of less than one year are not annualized.
F Total returns would have been lower if certain expenses had not been reduced during the applicable periods shown.
G Fees and expenses of any underlying mutual funds or exchange-traded funds (ETFs) are not included in the Fund's expense ratio. The Fund indirectly bears its proportionate share of these expenses. For additional expense information related to investments in Fidelity Central Funds, please refer to the "Investments in Fidelity Central Funds" note found in the Notes to Financial Statements section of the most recent Annual or Semi-Annual report.
H Expense ratios reflect operating expenses of the class. Expenses before reductions do not reflect amounts reimbursed, waived, or reduced through arrangements with the investment adviser, brokerage services, or other offset arrangements, if applicable, and do not represent the amount paid by the class during periods when reimbursements, waivers or reductions occur.
I Annualized
J Amount does not include the portfolio activity of any underlying mutual funds or exchange-traded funds (ETFs).
See accompanying notes which are an integral part of the financial statements.
Fidelity Freedom Index 2055 Fund Premier Class
| | Six months ended (Unaudited) September 30, |
| | 2020 A |
| Selected Per–Share Data | |
| Net asset value, beginning of period | $14.66 |
| Income from Investment Operations | |
| Net investment income (loss)B | .01 |
| Net realized and unrealized gain (loss) | 1.23 |
| Total from investment operations | 1.24 |
| Net asset value, end of period | $15.90 |
| Total ReturnC,D | 8.46% |
| Ratios to Average Net AssetsE,F | |
| Expenses before reductions | .06%G |
| Expenses net of fee waivers, if any | .06%G |
| Expenses net of all reductions | .06%G |
| Net investment income (loss) | .14%G |
| Supplemental Data | |
| Net assets, end of period (000 omitted) | $1,681 |
| Portfolio turnover rateH | 12%G |
A For the period June 24, 2020 (commencement of sale of shares) to September 30, 2020.
B Calculated based on average shares outstanding during the period.
C Total returns for periods of less than one year are not annualized.
D Total returns would have been lower if certain expenses had not been reduced during the applicable periods shown.
E Fees and expenses of any underlying mutual funds or exchange-traded funds (ETFs) are not included in the Fund's expense ratio. The Fund indirectly bears its proportionate share of these expenses. For additional expense information related to investments in Fidelity Central Funds, please refer to the "Investments in Fidelity Central Funds" note found in the Notes to Financial Statements section of the most recent Annual or Semi-Annual report.
F Expense ratios reflect operating expenses of the class. Expenses before reductions do not reflect amounts reimbursed, waived, or reduced through arrangements with the investment adviser, brokerage services, or other offset arrangements, if applicable, and do not represent the amount paid by the class during periods when reimbursements, waivers or reductions occur.
G Annualized
H Amount does not include the portfolio activity of any underlying mutual funds or exchange-traded funds (ETFs).
See accompanying notes which are an integral part of the financial statements.
Fidelity Freedom® Index 2060 Fund
Investment Summary (Unaudited)
The information in the following tables is based on the direct investments of the Fund.
Top Holdings as of September 30, 2020
| | % of fund's net assets |
| Fidelity Series Total Market Index Fund | 53.8 |
| Fidelity Series Global ex U.S. Index Fund | 36.1 |
| Fidelity Series Bond Index Fund | 7.1 |
| Fidelity Series Long-Term Treasury Bond Index Fund | 3.0 |
| | 100.0 |
Asset Allocation (% of fund's net assets)
| Period end |
| | Domestic Equity Funds | 53.8% |
| | International Equity Funds | 36.1% |
| | Bond Funds | 10.1% |

Fidelity Freedom® Index 2060 Fund
Schedule of Investments September 30, 2020 (Unaudited)
Showing Percentage of Net Assets
| Domestic Equity Funds - 53.8% | | | |
| | | Shares | Value |
| Fidelity Series Total Market Index Fund (a) | | | |
| (Cost $431,589,441) | | 42,787,436 | 488,632,525 |
|
| International Equity Funds - 36.1% | | | |
| Fidelity Series Global ex U.S. Index Fund (a) | | | |
| (Cost $316,359,171) | | 26,159,500 | 327,516,943 |
|
| Bond Funds - 10.1% | | | |
| Fidelity Series Bond Index Fund (a) | | 5,889,297 | 64,075,550 |
| Fidelity Series Long-Term Treasury Bond Index Fund (a) | | 2,667,053 | 27,550,653 |
| TOTAL BOND FUNDS | | | |
| (Cost $86,215,798) | | | 91,626,203 |
| TOTAL INVESTMENT IN SECURITIES - 100.0% | | | |
| (Cost $834,164,410) | | | 907,775,671 |
| NET OTHER ASSETS (LIABILITIES) - 0.0% | | | (61,159) |
| NET ASSETS - 100% | | | $907,714,512 |
Legend
(a) Affiliated Fund
Affiliated Central Funds
Information regarding fiscal year to date income earned by the Fund from investments in Fidelity Central Funds is as follows:
| Fund | Income earned |
| Fidelity Cash Central Fund | $1 |
| Total | $1 |
Amounts in the income column in the above table include any capital gain distributions from underlying funds, which are presented in the corresponding line-item in the Statement of Operations, if applicable.
Affiliated Underlying Funds
Fiscal year to date information regarding the Fund's investments in affiliated Underlying Funds, excluding any Money Market Central Funds, is presented below. Exchanges between classes of the same affiliated Underlying Funds may occur.
| Affiliate | Value, beginning of period | Purchases | Sales Proceeds | Dividend Income | Realized Gain (loss) | Change in Unrealized appreciation (depreciation) | Value, end of period |
| Fidelity Series Bond Index Fund | $40,467,977 | $24,921,866 | $2,218,676 | $539,164 | $(1,296) | $905,679 | $64,075,550 |
| Fidelity Series Global ex U.S. Index Fund | 203,868,588 | 78,152,634 | 8,076,076 | -- | (861,383) | 54,433,180 | 327,516,943 |
| Fidelity Series Long-Term Treasury Bond Index Fund | 17,381,604 | 11,779,419 | 938,107 | 522,990 | 25,305 | (697,568) | 27,550,653 |
| Fidelity Series Total Market Index Fund | 302,636,903 | 106,993,304 | 27,051,257 | 1,647,289 | (1,993,677) | 108,047,252 | 488,632,525 |
| Total | $564,355,072 | $221,847,223 | $38,284,116 | $2,709,443 | $(2,831,051) | $162,688,543 | $907,775,671 |
Amounts in the income column in the above table include any capital gain distributions from underlying funds, which are presented in the corresponding line-item in the Statement of Operations, if applicable.
Investment Valuation
The following is a summary of the inputs used, as of September 30, 2020, involving the Fund's assets and liabilities carried at fair value. The inputs or methodology used for valuing securities may not be an indication of the risk associated with investing in those securities. For more information on valuation inputs, and their aggregation into the levels used below, please refer to the Investment Valuation section in the accompanying Notes to Financial Statements.
| | Valuation Inputs at Reporting Date: |
| Description | Total | Level 1 | Level 2 | Level 3 |
| Investments in Securities: | | | | |
| Domestic Equity Funds | $488,632,525 | $488,632,525 | $-- | $-- |
| International Equity Funds | 327,516,943 | 327,516,943 | -- | -- |
| Bond Funds | 91,626,203 | 91,626,203 | -- | -- |
| Total Investments in Securities: | $907,775,671 | $907,775,671 | $-- | $-- |
See accompanying notes which are an integral part of the financial statements.
Fidelity Freedom® Index 2060 Fund
Financial Statements
Statement of Assets and Liabilities
| | | September 30, 2020 (Unaudited) |
| Assets | | |
Investment in securities, at value — See accompanying schedule:
| | |
| Affiliated issuers (cost $834,164,410) | $907,775,671 | |
| Total Investment in Securities (cost $834,164,410) | | $907,775,671 |
| Cash | | 1,302 |
| Receivable for investments sold | | 1,796,079 |
| Receivable for fund shares sold | | 4,222,380 |
| Total assets | | 913,795,432 |
| Liabilities | | |
| Payable for investments purchased | $5,390,342 | |
| Payable for fund shares redeemed | 628,116 | |
| Accrued management fee | 62,462 | |
| Total liabilities | | 6,080,920 |
| Net Assets | | $907,714,512 |
| Net Assets consist of: | | |
| Paid in capital | | $835,901,963 |
| Total accumulated earnings (loss) | | 71,812,549 |
| Net Assets | | $907,714,512 |
| Net Asset Value and Maximum Offering Price | | |
| Investor Class: | | |
| Net Asset Value, offering price and redemption price per share ($496,839,705 ÷ 36,957,241 shares) | | $13.44 |
| Institutional Premium Class: | | |
| Net Asset Value, offering price and redemption price per share ($410,570,350 ÷ 30,513,861 shares) | | $13.46 |
| Premier Class: | | |
| Net Asset Value, offering price and redemption price per share ($304,457 ÷ 22,620 shares) | | $13.46 |
See accompanying notes which are an integral part of the financial statements.
Statement of Operations
| | | Six months ended September 30, 2020 (Unaudited) |
| Investment Income | | |
| Dividends: | | |
| Affiliated issuers | | $1,904,960 |
| Income from Fidelity Central Funds | | 1 |
| Total income | | 1,904,961 |
| Expenses | | |
| Management fee | $375,822 | |
| Independent trustees' fees and expenses | 961 | |
| Total expenses | | 376,783 |
| Net investment income (loss) | | 1,528,178 |
| Realized and Unrealized Gain (Loss) | | |
| Net realized gain (loss) on: | | |
| Investment securities: | | |
| Affiliated issuers | (2,831,051) | |
| Capital gain distributions from underlying funds: | | |
| Affiliated issuers | 804,483 | |
| Total net realized gain (loss) | | (2,026,568) |
| Change in net unrealized appreciation (depreciation) on: | | |
| Investment securities: | | |
| Affiliated issuers | 162,688,543 | |
| Total change in net unrealized appreciation (depreciation) | | 162,688,543 |
| Net gain (loss) | | 160,661,975 |
| Net increase (decrease) in net assets resulting from operations | | $162,190,153 |
See accompanying notes which are an integral part of the financial statements.
Statement of Changes in Net Assets
| | Six months ended September 30, 2020 (Unaudited) | Year ended March 31, 2020 |
| Increase (Decrease) in Net Assets | | |
| Operations | | |
| Net investment income (loss) | $1,528,178 | $8,519,881 |
| Net realized gain (loss) | (2,026,568) | 28,558,173 |
| Change in net unrealized appreciation (depreciation) | 162,688,543 | (110,266,776) |
| Net increase (decrease) in net assets resulting from operations | 162,190,153 | (73,188,722) |
| Distributions to shareholders | (1,811,405) | (35,361,701) |
| Share transactions - net increase (decrease) | 183,018,185 | 374,298,933 |
| Total increase (decrease) in net assets | 343,396,933 | 265,748,510 |
| Net Assets | | |
| Beginning of period | 564,317,579 | 298,569,069 |
| End of period | $907,714,512 | $564,317,579 |
See accompanying notes which are an integral part of the financial statements.
Financial Highlights
Fidelity Freedom Index 2060 Fund Investor Class
| | Six months ended (Unaudited) September 30, | Years endedMarch 31, | | | | |
| | 2020 | 2020 | 2019 | 2018 | 2017 | 2016 |
| Selected Per–Share Data | | | | | | |
| Net asset value, beginning of period | $10.65 | $12.49 | $12.23 | $11.04 | $9.85 | $10.33 |
| Income from Investment Operations | | | | | | |
| Net investment income (loss)A | .02 | .24 | .26 | .24 | .25 | .25 |
| Net realized and unrealized gain (loss) | 2.80 | (1.19) | .27 | 1.21 | 1.19 | (.55) |
| Total from investment operations | 2.82 | (.95) | .53 | 1.45 | 1.44 | (.30) |
| Distributions from net investment income | –B | (.21) | (.24) | (.20) | (.22) | (.18) |
| Distributions from net realized gain | (.03) | (.68) | (.03) | (.06) | (.03) | –B |
| Total distributions | (.03) | (.89) | (.27) | (.26) | (.25) | (.18) |
| Net asset value, end of period | $13.44 | $10.65 | $12.49 | $12.23 | $11.04 | $9.85 |
| Total ReturnC,D | 26.53% | (8.95)% | 4.54% | 13.17% | 14.80% | (2.94)% |
| Ratios to Average Net AssetsE,F | | | | | | |
| Expenses before reductions | .12%G | .12% | .15% | .15% | .15% | .15% |
| Expenses net of fee waivers, if any | .12%G | .12% | .11% | .12% | .11% | .08% |
| Expenses net of all reductions | .12%G | .12% | .11% | .12% | .11% | .08% |
| Net investment income (loss) | .38%G | 1.85% | 2.13% | 1.97% | 2.41% | 2.57% |
| Supplemental Data | | | | | | |
| Net assets, end of period (000 omitted) | $496,840 | $323,054 | $160,477 | $82,123 | $38,013 | $16,979 |
| Portfolio turnover rateH | 10%G | 67% | 15% | 7% | 41% | 8% |
A Calculated based on average shares outstanding during the period.
B Amount represents less than $.005 per share.
C Total returns for periods of less than one year are not annualized.
D Total returns would have been lower if certain expenses had not been reduced during the applicable periods shown.
E Fees and expenses of any underlying mutual funds or exchange-traded funds (ETFs) are not included in the Fund's expense ratio. The Fund indirectly bears its proportionate share of these expenses. For additional expense information related to investments in Fidelity Central Funds, please refer to the "Investments in Fidelity Central Funds" note found in the Notes to Financial Statements section of the most recent Annual or Semi-Annual report.
F Expense ratios reflect operating expenses of the class. Expenses before reductions do not reflect amounts reimbursed, waived, or reduced through arrangements with the investment adviser, brokerage services, or other offset arrangements, if applicable, and do not represent the amount paid by the class during periods when reimbursements, waivers or reductions occur.
G Annualized
H Amount does not include the portfolio activity of any underlying mutual funds or exchange-traded funds (ETFs).
See accompanying notes which are an integral part of the financial statements.
Fidelity Freedom Index 2060 Fund Institutional Premium Class
| | Six months ended (Unaudited) September 30, | Years endedMarch 31, | | | | |
| | 2020 | 2020 | 2019 | 2018 | 2017 | 2016 A |
| Selected Per–Share Data | | | | | | |
| Net asset value, beginning of period | $10.66 | $12.50 | $12.23 | $11.05 | $9.85 | $10.56 |
| Income from Investment Operations | | | | | | |
| Net investment income (loss)B | .03 | .24 | .27 | .24 | .26 | .13 |
| Net realized and unrealized gain (loss) | 2.80 | (1.19) | .27 | 1.21 | 1.19 | (.66) |
| Total from investment operations | 2.83 | (.95) | .54 | 1.45 | 1.45 | (.53) |
| Distributions from net investment income | (.01) | (.21) | (.24) | (.21) | (.22) | (.18) |
| Distributions from net realized gain | (.03) | (.68) | (.03) | (.06) | (.03) | –C |
| Total distributions | (.03)D | (.89) | (.27) | (.27) | (.25) | (.18) |
| Net asset value, end of period | $13.46 | $10.66 | $12.50 | $12.23 | $11.05 | $9.85 |
| Total ReturnE,F | 26.63% | (8.93)% | 4.66% | 13.12% | 14.93% | (5.05)% |
| Ratios to Average Net AssetsG,H | | | | | | |
| Expenses before reductions | .08%I | .08% | .10% | .10% | .09% | .05%I |
| Expenses net of fee waivers, if any | .08%I | .08% | .05% | .07% | .06% | .01%I |
| Expenses net of all reductions | .08%I | .08% | .05% | .07% | .06% | .01%I |
| Net investment income (loss) | .42%I | 1.90% | 2.19% | 2.02% | 2.47% | 1.80%I |
| Supplemental Data | | | | | | |
| Net assets, end of period (000 omitted) | $410,570 | $241,263 | $138,092 | $73,658 | $28,478 | $9,543 |
| Portfolio turnover rateJ | 10%I | 67% | 15% | 7% | 41% | 8% |
A For the period June 24, 2015 (commencement of sale of shares) to March 31, 2016.
B Calculated based on average shares outstanding during the period.
C Amount represents less than $.005 per share.
D Total distributions per share do not sum due to rounding.
E Total returns for periods of less than one year are not annualized.
F Total returns would have been lower if certain expenses had not been reduced during the applicable periods shown.
G Fees and expenses of any underlying mutual funds or exchange-traded funds (ETFs) are not included in the Fund's expense ratio. The Fund indirectly bears its proportionate share of these expenses. For additional expense information related to investments in Fidelity Central Funds, please refer to the "Investments in Fidelity Central Funds" note found in the Notes to Financial Statements section of the most recent Annual or Semi-Annual report.
H Expense ratios reflect operating expenses of the class. Expenses before reductions do not reflect amounts reimbursed, waived, or reduced through arrangements with the investment adviser, brokerage services, or other offset arrangements, if applicable, and do not represent the amount paid by the class during periods when reimbursements, waivers or reductions occur.
I Annualized
J Amount does not include the portfolio activity of any underlying mutual funds or exchange-traded funds (ETFs).
See accompanying notes which are an integral part of the financial statements.
Fidelity Freedom Index 2060 Fund Premier Class
| | Six months ended (Unaudited) September 30, |
| | 2020 A |
| Selected Per–Share Data | |
| Net asset value, beginning of period | $12.41 |
| Income from Investment Operations | |
| Net investment income (loss)B | –C |
| Net realized and unrealized gain (loss) | 1.05 |
| Total from investment operations | 1.05 |
| Net asset value, end of period | $13.46 |
| Total ReturnD | 8.46% |
| Ratios to Average Net AssetsE,F | |
| Expenses before reductions | .06%G |
| Expenses net of fee waivers, if any | .06%G |
| Expenses net of all reductions | .06%G |
| Net investment income (loss) | .14%G |
| Supplemental Data | |
| Net assets, end of period (000 omitted) | $304 |
| Portfolio turnover rateH | 10%G |
A For the period June 24, 2020 (commencement of sale of shares) to September 30, 2020.
B Calculated based on average shares outstanding during the period.
C Amount represents less than $.005 per share.
D Total returns for periods of less than one year are not annualized.
E Fees and expenses of any underlying mutual funds or exchange-traded funds (ETFs) are not included in the Fund's expense ratio. The Fund indirectly bears its proportionate share of these expenses. For additional expense information related to investments in Fidelity Central Funds, please refer to the "Investments in Fidelity Central Funds" note found in the Notes to Financial Statements section of the most recent Annual or Semi-Annual report.
F Expense ratios reflect operating expenses of the class. Expenses before reductions do not reflect amounts reimbursed, waived, or reduced through arrangements with the investment adviser, brokerage services, or other offset arrangements, if applicable, and do not represent the amount paid by the class during periods when reimbursements, waivers or reductions occur.
G Annualized
H Amount does not include the portfolio activity of any underlying mutual funds or exchange-traded funds (ETFs).
See accompanying notes which are an integral part of the financial statements.
Fidelity Freedom® Index 2065 Fund
Investment Summary (Unaudited)
The information in the following tables is based on the direct investments of the Fund.
Top Holdings as of September 30, 2020
| | % of fund's net assets |
| Fidelity Series Total Market Index Fund | 53.8 |
| Fidelity Series Global ex U.S. Index Fund | 36.1 |
| Fidelity Series Bond Index Fund | 7.1 |
| Fidelity Series Long-Term Treasury Bond Index Fund | 3.0 |
| Fidelity Cash Central Fund 0.10% | 0.0 |
| | 100.0 |
Asset Allocation (% of fund's net assets)
| Period end |
| | Domestic Equity Funds | 53.8% |
| | International Equity Funds | 36.1% |
| | Bond Funds | 10.1% |

Percentages shown as 0.0% may reflect amounts less than 0.05%.
Fidelity Freedom® Index 2065 Fund
Schedule of Investments September 30, 2020 (Unaudited)
Showing Percentage of Net Assets
| Domestic Equity Funds - 53.8% | | | |
| | | Shares | Value |
| Fidelity Series Total Market Index Fund (a) | | | |
| (Cost $30,018,468) | | 2,910,722 | 33,240,449 |
|
| International Equity Funds - 36.1% | | | |
| Fidelity Series Global ex U.S. Index Fund (a) | | | |
| (Cost $21,257,500) | | 1,779,552 | 22,279,989 |
|
| Bond Funds - 10.1% | | | |
| Fidelity Series Bond Index Fund (a) | | 400,616 | 4,358,704 |
| Fidelity Series Long-Term Treasury Bond Index Fund (a) | | 181,424 | 1,874,107 |
| TOTAL BOND FUNDS | | | |
| (Cost $6,086,962) | | | 6,232,811 |
|
| Short-Term Funds - 0.0% | | | |
| Fidelity Cash Central Fund 0.10% (b) | | | |
| (Cost $226) | | 226 | 226 |
| TOTAL INVESTMENT IN SECURITIES - 100.0% | | | |
| (Cost $57,363,156) | | | 61,753,475 |
| NET OTHER ASSETS (LIABILITIES) - 0.0% | | | (4,260) |
| NET ASSETS - 100% | | | $61,749,215 |
Legend
(a) Affiliated Fund
(b) Affiliated fund that is generally available only to investment companies and other accounts managed by Fidelity Investments. The rate quoted is the annualized seven-day yield of the fund at period end. A complete unaudited listing of the fund's holdings as of its most recent quarter end is available upon request. In addition, each Fidelity Central Fund's financial statements are available on the SEC's website or upon request.
Affiliated Underlying Funds
Fiscal year to date information regarding the Fund's investments in affiliated Underlying Funds, excluding any Money Market Central Funds, is presented below. Exchanges between classes of the same affiliated Underlying Funds may occur.
| Affiliate | Value, beginning of period | Purchases | Sales Proceeds | Dividend Income | Realized Gain (loss) | Change in Unrealized appreciation (depreciation) | Value, end of period |
| Fidelity Series Bond Index Fund | $1,811,096 | $2,787,636 | $280,741 | $31,196 | $(427) | $41,140 | $4,358,704 |
| Fidelity Series Global ex U.S. Index Fund | 9,125,477 | 11,526,825 | 1,232,750 | -- | (98,062) | 2,958,499 | 22,279,989 |
| Fidelity Series Long-Term Treasury Bond Index Fund | 777,901 | 1,253,983 | 118,330 | 26,631 | (1,344) | (38,103) | 1,874,107 |
| Fidelity Series Total Market Index Fund | 13,546,305 | 16,694,284 | 2,638,296 | 75,258 | (138,659) | 5,776,815 | 33,240,449 |
| Total | $25,260,779 | $32,262,728 | $4,270,117 | $133,085 | $(238,492) | $8,738,351 | $61,753,249 |
Amounts in the income column in the above table include any capital gain distributions from underlying funds, which are presented in the corresponding line-item in the Statement of Operations, if applicable.
Investment Valuation
The following is a summary of the inputs used, as of September 30, 2020, involving the Fund's assets and liabilities carried at fair value. The inputs or methodology used for valuing securities may not be an indication of the risk associated with investing in those securities. For more information on valuation inputs, and their aggregation into the levels used below, please refer to the Investment Valuation section in the accompanying Notes to Financial Statements.
| | Valuation Inputs at Reporting Date: |
| Description | Total | Level 1 | Level 2 | Level 3 |
| Investments in Securities: | | | | |
| Domestic Equity Funds | $33,240,449 | $33,240,449 | $-- | $-- |
| International Equity Funds | 22,279,989 | 22,279,989 | -- | -- |
| Bond Funds | 6,232,811 | 6,232,811 | -- | -- |
| Short-Term Funds | 226 | 226 | -- | -- |
| Total Investments in Securities: | $61,753,475 | $61,753,475 | $-- | $-- |
See accompanying notes which are an integral part of the financial statements.
Fidelity Freedom® Index 2065 Fund
Financial Statements
Statement of Assets and Liabilities
| | | September 30, 2020 (Unaudited) |
| Assets | | |
Investment in securities, at value — See accompanying schedule:
| | |
| Fidelity Central Funds (cost $226) | $226 | |
| Other affiliated issuers (cost $57,362,930) | 61,753,249 | |
| Total Investment in Securities (cost $57,363,156) | | $61,753,475 |
| Cash | | 1 |
| Receivable for investments sold | | 67,197 |
| Receivable for fund shares sold | | 369,609 |
| Total assets | | 62,190,282 |
| Liabilities | | |
| Payable for investments purchased | $407,873 | |
| Payable for fund shares redeemed | 28,934 | |
| Accrued management fee | 4,260 | |
| Total liabilities | | 441,067 |
| Net Assets | | $61,749,215 |
| Net Assets consist of: | | |
| Paid in capital | | $57,528,741 |
| Total accumulated earnings (loss) | | 4,220,474 |
| Net Assets | | $61,749,215 |
| Net Asset Value and Maximum Offering Price | | |
| Investor Class: | | |
| Net Asset Value, offering price and redemption price per share ($33,486,707 ÷ 3,091,208 shares) | | $10.83 |
| Institutional Premium Class: | | |
| Net Asset Value, offering price and redemption price per share ($28,086,687 ÷ 2,591,931 shares) | | $10.84 |
| Premier Class: | | |
| Net Asset Value, offering price and redemption price per share ($175,821 ÷ 16,227 shares) | | $10.84 |
See accompanying notes which are an integral part of the financial statements.
Statement of Operations
| | | Six months ended September 30, 2020 (Unaudited) |
| Investment Income | | |
| Dividends: | | |
| Affiliated issuers | | $96,335 |
| Expenses | | |
| Management fee | $21,777 | |
| Independent trustees' fees and expenses | 50 | |
| Total expenses | | 21,827 |
| Net investment income (loss) | | 74,508 |
| Realized and Unrealized Gain (Loss) | | |
| Net realized gain (loss) on: | | |
| Investment securities: | | |
| Affiliated issuers | (238,492) | |
| Capital gain distributions from underlying funds: | | |
| Affiliated issuers | 36,750 | |
| Total net realized gain (loss) | | (201,742) |
| Change in net unrealized appreciation (depreciation) on: | | |
| Investment securities: | | |
| Affiliated issuers | 8,738,351 | |
| Total change in net unrealized appreciation (depreciation) | | 8,738,351 |
| Net gain (loss) | | 8,536,609 |
| Net increase (decrease) in net assets resulting from operations | | $8,611,117 |
See accompanying notes which are an integral part of the financial statements.
Statement of Changes in Net Assets
| | Six months ended September 30, 2020 (Unaudited) | For the period
June 28, 2019 (commencement of operations) to March 31, 2020 |
| Increase (Decrease) in Net Assets | | |
| Operations | | |
| Net investment income (loss) | $74,508 | $260,150 |
| Net realized gain (loss) | (201,742) | 144,613 |
| Change in net unrealized appreciation (depreciation) | 8,738,351 | (4,348,032) |
| Net increase (decrease) in net assets resulting from operations | 8,611,117 | (3,943,269) |
| Distributions to shareholders | (163,300) | (284,073) |
| Share transactions - net increase (decrease) | 28,042,132 | 29,486,608 |
| Total increase (decrease) in net assets | 36,489,949 | 25,259,266 |
| Net Assets | | |
| Beginning of period | 25,259,266 | – |
| End of period | $61,749,215 | $25,259,266 |
See accompanying notes which are an integral part of the financial statements.
Financial Highlights
Fidelity Freedom Index 2065 Fund Investor Class
| | Six months ended (Unaudited) September 30, | Years endedMarch 31, |
| | 2020 | 2020 A |
| Selected Per–Share Data | | |
| Net asset value, beginning of period | $8.60 | $10.00 |
| Income from Investment Operations | | |
| Net investment income (loss)B | .02 | .25 |
| Net realized and unrealized gain (loss) | 2.25 | (1.43) |
| Total from investment operations | 2.27 | (1.18) |
| Distributions from net investment income | –C | (.19) |
| Distributions from net realized gain | (.04) | (.02) |
| Total distributions | (.04) | (.22)D |
| Net asset value, end of period | $10.83 | $8.60 |
| Total ReturnE | 26.52% | (12.24)% |
| Ratios to Average Net AssetsF,G | | |
| Expenses before reductions | .12%H | .12%H |
| Expenses net of fee waivers, if any | .12%H | .12%H |
| Expenses net of all reductions | .12%H | .12%H |
| Net investment income (loss) | .32%H | 3.25%H |
| Supplemental Data | | |
| Net assets, end of period (000 omitted) | $33,487 | $15,363 |
| Portfolio turnover rateI | 19%H | 103%H |
A For the period June 28, 2019 (commencement of operations) to March 31, 2020.
B Calculated based on average shares outstanding during the period.
C Amount represents less than $.005 per share.
D Total distributions per share do not sum due to rounding.
E Total returns for periods of less than one year are not annualized.
F Expense ratios reflect operating expenses of the class. Expenses before reductions do not reflect amounts reimbursed, waived, or reduced through arrangements with the investment adviser, brokerage services, or other offset arrangements, if applicable, and do not represent the amount paid by the class during periods when reimbursements, waivers or reductions occur.
G Fees and expenses of any underlying mutual funds or exchange-traded funds (ETFs) are not included in the Fund's expense ratio. The Fund indirectly bears its proportionate share of these expenses. For additional expense information related to investments in Fidelity Central Funds, please refer to the "Investments in Fidelity Central Funds" note found in the Notes to Financial Statements section of the most recent Annual or Semi-Annual report.
H Annualized
I Amount does not include the portfolio activity of any underlying mutual funds or exchange-traded funds (ETFs).
See accompanying notes which are an integral part of the financial statements.
Fidelity Freedom Index 2065 Fund Institutional Premium Class
| �� | Six months ended (Unaudited) September 30, | Years endedMarch 31, |
| | 2020 | 2020 A |
| Selected Per–Share Data | | |
| Net asset value, beginning of period | $8.60 | $10.00 |
| Income from Investment Operations | | |
| Net investment income (loss)B | .02 | .25 |
| Net realized and unrealized gain (loss) | 2.27 | (1.43) |
| Total from investment operations | 2.29 | (1.18) |
| Distributions from net investment income | –C | (.19) |
| Distributions from net realized gain | (.04) | (.02) |
| Total distributions | (.05)D | (.22)D |
| Net asset value, end of period | $10.84 | $8.60 |
| Total ReturnE | 26.65% | (12.23)% |
| Ratios to Average Net AssetsF,G | | |
| Expenses before reductions | .08%H | .08%H |
| Expenses net of fee waivers, if any | .08%H | .08%H |
| Expenses net of all reductions | .08%H | .08%H |
| Net investment income (loss) | .36%H | 3.29%H |
| Supplemental Data | | |
| Net assets, end of period (000 omitted) | $28,087 | $9,896 |
| Portfolio turnover rateI | 19%H | 103%H |
A For the period June 28, 2019 (commencement of operations) to March 31, 2020.
B Calculated based on average shares outstanding during the period.
C Amount represents less than $.005 per share.
D Total distributions per share do not sum due to rounding.
E Total returns for periods of less than one year are not annualized.
F Expense ratios reflect operating expenses of the class. Expenses before reductions do not reflect amounts reimbursed, waived, or reduced through arrangements with the investment adviser, brokerage services, or other offset arrangements, if applicable, and do not represent the amount paid by the class during periods when reimbursements, waivers or reductions occur.
G Fees and expenses of any underlying mutual funds or exchange-traded funds (ETFs) are not included in the Fund's expense ratio. The Fund indirectly bears its proportionate share of these expenses. For additional expense information related to investments in Fidelity Central Funds, please refer to the "Investments in Fidelity Central Funds" note found in the Notes to Financial Statements section of the most recent Annual or Semi-Annual report.
H Annualized
I Amount does not include the portfolio activity of any underlying mutual funds or exchange-traded funds (ETFs).
See accompanying notes which are an integral part of the financial statements.
Fidelity Freedom Index 2065 Fund Premier Class
| | Six months ended (Unaudited) September 30, |
| | 2020 A |
| Selected Per–Share Data | |
| Net asset value, beginning of period | $9.99 |
| Income from Investment Operations | |
| Net investment income (loss)B | –C |
| Net realized and unrealized gain (loss) | .85 |
| Total from investment operations | .85 |
| Net asset value, end of period | $10.84 |
| Total ReturnD | 8.51% |
| Ratios to Average Net AssetsE,F | |
| Expenses before reductions | .06%G |
| Expenses net of fee waivers, if any | .06%G |
| Expenses net of all reductions | .06%G |
| Net investment income (loss) | .13%G |
| Supplemental Data | |
| Net assets, end of period (000 omitted) | $176 |
| Portfolio turnover rateH | 19%G |
A For the period June 24, 2020 (commencement of sale of shares) to September 30, 2020.
B Calculated based on average shares outstanding during the period.
C Amount represents less than $.005 per share.
D Total returns for periods of less than one year are not annualized.
E Expense ratios reflect operating expenses of the class. Expenses before reductions do not reflect amounts reimbursed, waived, or reduced through arrangements with the investment adviser, brokerage services, or other offset arrangements, if applicable, and do not represent the amount paid by the class during periods when reimbursements, waivers or reductions occur.
F Fees and expenses of any underlying mutual funds or exchange-traded funds (ETFs) are not included in the Fund's expense ratio. The Fund indirectly bears its proportionate share of these expenses. For additional expense information related to investments in Fidelity Central Funds, please refer to the "Investments in Fidelity Central Funds" note found in the Notes to Financial Statements section of the most recent Annual or Semi-Annual report.
G Annualized
H Amount does not include the portfolio activity of any underlying mutual funds or exchange-traded funds (ETFs).
See accompanying notes which are an integral part of the financial statements.
Notes to Financial Statements (Unaudited)
For the period ended September 30, 2020
1. Organization.
Fidelity Freedom Index Income Fund, Fidelity Freedom Index 2005 Fund, Fidelity Freedom Index 2010 Fund, Fidelity Freedom Index 2015 Fund, Fidelity Freedom Index 2020 Fund, Fidelity Freedom Index 2025 Fund, Fidelity Freedom Index 2030 Fund, Fidelity Freedom Index 2035 Fund, Fidelity Freedom Index 2040 Fund, Fidelity Freedom Index 2045 Fund, Fidelity Freedom Index 2050 Fund, Fidelity Freedom Index 2055 Fund, Fidelity Freedom Index 2060 Fund and Fidelity Freedom Index 2065 Fund (the Funds) are funds of Fidelity Aberdeen Street Trust (the Trust). The Trust is registered under the Investment Company Act of 1940, as amended (the 1940 Act), as an open-end management investment company organized as a Delaware statutory trust. Each Fund is authorized to issue an unlimited number of shares. Each Fund offers Investor Class, Institutional Premium Class and Premier Class shares, each of which has equal rights as to assets and voting privileges. Premier Class commenced sale of shares on June 24, 2020. Each class has exclusive voting rights with respect to matters that affect that class.
2. Investments in Fidelity Central Funds.
The Funds may invest in Fidelity Central Funds, which are open-end investment companies generally available only to other investment companies and accounts managed by the investment adviser and its affiliates. The Funds' Schedules of Investments list each of the Fidelity Central Funds held as of period end, if any, as an investment of each Fund, but do not include the underlying holdings of each Fidelity Central Fund. As an Investing Fund, each Fund indirectly bears its proportionate share of the expenses of the underlying Fidelity Central Funds.
The Money Market Central Funds seek preservation of capital and current income and are managed by the investment adviser. Annualized expenses of the Money Market Central Funds as of their most recent shareholder report date ranged from less than .005% to .01%.
A complete unaudited list of holdings for each Fidelity Central Fund is available upon request or at the Securities and Exchange Commission (the SEC) website at www.sec.gov. In addition, the financial statements of the Fidelity Central Funds are available on the SEC website or upon request.
3. Significant Accounting Policies.
Each Fund is an investment company and applies the accounting and reporting guidance of the Financial Accounting Standards Board (FASB) Accounting Standards Codification Topic 946 Financial Services – Investment Companies. The financial statements have been prepared in conformity with accounting principles generally accepted in the United States of America (GAAP), which require management to make certain estimates and assumptions at the date of the financial statements. Actual results could differ from those estimates. Subsequent events, if any, through the date that the financial statements were issued have been evaluated in the preparation of the financial statements. The following summarizes the significant accounting policies of the Funds:
Investment Valuation. Investments are valued as of 4:00 p.m. Eastern time on the last calendar day of the period. Each Fund categorizes the inputs to valuation techniques used to value its investments into a disclosure hierarchy consisting of three levels as shown below:
- Level 1 – quoted prices in active markets for identical investments
- Level 2 – other significant observable inputs (including quoted prices for similar investments, interest rates, prepayment speeds, etc.)
- Level 3 – unobservable inputs (including the Fund's own assumptions based on the best information available)
Valuation techniques used to value each Fund's investments by major category are as follows. Investments in open-end mutual funds are valued at their closing net asset value (NAV) each business day and are categorized as Level 1 in the hierarchy.
Investment Transactions and Income. For financial reporting purposes, the Funds' investment holdings and NAV include trades executed through the end of the last business day of the period. The NAV per share for processing shareholder transactions is calculated as of the close of business of the New York Stock Exchange (NYSE), normally 4:00 p.m. Eastern time and includes trades executed through the end of the prior business day. Gains and losses on securities sold are determined on the basis of identified cost. Income and capital gain distributions from any underlying mutual funds or exchange-traded funds (ETFs) are recorded on the ex-dividend date.
Class Allocations and Expenses. Investment income, realized and unrealized capital gains and losses, common expenses of each Fund, and certain fund-level expense reductions, if any, are allocated daily on a pro-rata basis to each class based on the relative net assets of each class to the total net assets of each Fund. Each class differs with respect to fees incurred. Certain expense reductions may also differ by class. For the reporting period, the allocated portion of income and expenses to each class as a percent of its average net assets may vary due to the timing of recording these transactions in relation to fluctuating net assets of the classes. Expenses directly attributable to a fund are charged to that fund. Expenses attributable to more than one fund are allocated among the respective funds on the basis of relative net assets or other appropriate methods. Expenses included in the accompanying financial statements reflect the expenses of each Fund and do not include any expenses associated with any underlying mutual funds or exchange-traded funds (ETFs). Although not included in each Fund's expenses, each Fund indirectly bears its proportionate share of any underlying mutual funds or exchange-traded funds (ETFs) expenses through the impact of these expenses on each underlying mutual fund's or exchange-traded fund's (ETFs) NAV. Expense estimates are accrued in the period to which they relate and adjustments are made when actual amounts are known.
Income Tax Information and Distributions to Shareholders. Each year, each Fund intends to qualify as a regulated investment company under Subchapter M of the Internal Revenue Code, including distributing substantially all of its taxable income and realized gains. As a result, no provision for U.S. Federal income taxes is required. Each Fund files a U.S. federal tax return, in addition to state and local tax returns as required. Each Fund's federal income tax returns are subject to examination by the Internal Revenue Service (IRS) for a period of three fiscal years after they are filed. State and local tax returns may be subject to examination for an additional fiscal year depending on the jurisdiction.
Distributions are declared and recorded on the ex-dividend date. Income and capital gain distributions are declared separately for each class. Income and capital gain distributions are determined in accordance with income tax regulations, which may differ from GAAP.
Capital accounts within the financial statements are adjusted for permanent book-tax differences. These adjustments have no impact on net assets or the results of operations. Capital accounts are not adjusted for temporary book-tax differences which will reverse in a subsequent period.
Book-tax differences are primarily due to the short-term gain distributions from the underlying mutual funds or exchange-traded funds (ETFs), foreign currency transactions and losses deferred due to wash sales.
As of period end, the cost and unrealized appreciation (depreciation) in securities, and derivatives if applicable, for federal income tax purposes were as follows for each Fund:
| | Tax cost | Gross unrealized appreciation | Gross unrealized depreciation | Net unrealized appreciation (depreciation) |
| Fidelity Freedom Index Income Fund | $679,504,804 | $41,649,298 | $(892,859) | $40,756,439 |
| Fidelity Freedom Index 2005 Fund | 205,248,998 | 14,881,582 | (182,701) | 14,698,881 |
| Fidelity Freedom Index 2010 Fund | 717,257,781 | 63,366,811 | (458,027) | 62,908,784 |
| Fidelity Freedom Index 2015 Fund | 1,642,060,212 | 154,073,926 | (912,777) | 153,161,149 |
| Fidelity Freedom Index 2020 Fund | 5,680,513,254 | 547,135,848 | (7,662,032) | 539,473,816 |
| Fidelity Freedom Index 2025 Fund | 7,485,428,673 | 677,141,673 | (29,408,739) | 647,732,934 |
| Fidelity Freedom Index 2030 Fund | 8,805,545,018 | 840,565,577 | (26,924,654) | 813,640,923 |
| Fidelity Freedom Index 2035 Fund | 6,593,229,411 | 634,274,116 | (32,063,512) | 602,210,604 |
| Fidelity Freedom Index 2040 Fund | 6,572,748,453 | 658,249,891 | (31,259,694) | 626,990,197 |
| Fidelity Freedom Index 2045 Fund | 4,783,283,642 | 463,712,701 | (23,337,605) | 440,375,096 |
| Fidelity Freedom Index 2050 Fund | 4,342,779,869 | 421,474,342 | (21,081,370) | 400,392,972 |
| Fidelity Freedom Index 2055 Fund | 2,181,108,744 | 204,962,519 | (12,210,472) | 192,752,047 |
| Fidelity Freedom Index 2060 Fund | 838,412,651 | 74,341,047 | (4,978,027) | 69,363,020 |
| Fidelity Freedom Index 2065 Fund | 57,639,524 | 4,503,302 | (389,351) | 4,113,951 |
4. Purchases and Sales of Investments.
Purchases and sales of securities, other than short-term securities, are noted in the table below.
| | Purchases ($) | Sales ($) |
| Fidelity Freedom Index Income Fund | 167,845,020 | 45,813,252 |
| Fidelity Freedom Index 2005 Fund | 62,199,434 | 34,380,805 |
| Fidelity Freedom Index 2010 Fund | 129,481,994 | 99,815,604 |
| Fidelity Freedom Index 2015 Fund | 265,784,971 | 243,540,090 |
| Fidelity Freedom Index 2020 Fund | 856,920,680 | 712,083,100 |
| Fidelity Freedom Index 2025 Fund | 1,398,214,415 | 809,628,580 |
| Fidelity Freedom Index 2030 Fund | 1,566,240,459 | 962,751,270 |
| Fidelity Freedom Index 2035 Fund | 1,127,549,148 | 600,713,482 |
| Fidelity Freedom Index 2040 Fund | 1,024,255,892 | 499,772,696 |
| Fidelity Freedom Index 2045 Fund | 849,682,075 | 322,909,112 |
| Fidelity Freedom Index 2050 Fund | 768,897,310 | 270,797,974 |
| Fidelity Freedom Index 2055 Fund | 477,754,964 | 122,260,391 |
| Fidelity Freedom Index 2060 Fund | 221,847,223 | 38,284,116 |
| Fidelity Freedom Index 2065 Fund | 32,262,728 | 4,270,117 |
5. Fees and Other Transactions with Affiliates.
Management Fee and Expense Contract. Fidelity Management & Research Company LLC (the investment adviser) provides the Funds with investment management related services. Under the management contract, Investor Class, Institutional Premium Class and Premier Class of each Fund pays an all-inclusive monthly management fee at an annual rate of .12%, .08% and .06% of class-level average net assets, respectively. Under the management contract, each Fund's investment adviser pays all ordinary operating expenses of the Fund, except fees and expenses of the independent Trustees and certain miscellaneous expenses such as interest expense. In addition, under the expense contract, total expenses, including acquired fund fees and expenses, are limited to an annual rate of .12%, .08% and .06% of class-level average net assets for Investor Class, Institutional Premium Class and Premier Class, respectively, with certain exceptions.
Interfund Trades. Funds may purchase from or sell securities to other Fidelity Funds under procedures adopted by the Board. The procedures have been designed to ensure these interfund trades are executed in accordance with Rule 17a-7 of the 1940 Act. Interfund trades are included within the respective purchases and sales amounts shown in the Purchases and Sales of Investments note.
Prior Fiscal Year Reallocation of Underlying Fund Investments. During the prior period, the investment adviser reallocated investments of the Funds. This involved taxable redemptions of the Funds' interest in Fidelity Total Market Index Fund and Fidelity U.S. Bond Index Fund, ("selected Underlying Funds") for investments and cash and non-taxable exchanges of those investments and cash for shares of Fidelity Series Total Market Index Fund and Fidelity Series Bond Index Fund which are affiliated investment companies managed by FMR.
Details of these transactions with the net related gain (loss) for the Funds are presented in the accompanying table:
| | Value of Investments and Cash reallocated | Net realized Gain (Loss) on redemptions of selected Underlying Funds |
| Fidelity Freedom Index Income Fund | $218,412,508 | $25,101,668 |
| Fidelity Freedom Index 2005 Fund | 81,970,344 | 12,946,773 |
| Fidelity Freedom Index 2010 Fund | 373,843,569 | 85,091,106 |
| Fidelity Freedom Index 2015 Fund | 909,878,073 | 226,937,658 |
| Fidelity Freedom Index 2020 Fund | 3,206,030,369 | 747,888,141 |
| Fidelity Freedom Index 2025 Fund | 3,543,130,352 | 702,315,933 |
| Fidelity Freedom Index 2030 Fund | 4,481,892,247 | 1,012,873,985 |
| Fidelity Freedom Index 2035 Fund | 3,025,684,861 | 718,735,210 |
| Fidelity Freedom Index 2040 Fund | 3,050,323,715 | 814,304,613 |
| Fidelity Freedom Index 2045 Fund | 1,992,194,336 | 460,669,562 |
| Fidelity Freedom Index 2050 Fund | 1,795,538,416 | 419,886,749 |
| Fidelity Freedom Index 2055 Fund | 764,549,977 | 130,909,463 |
| Fidelity Freedom Index 2060 Fund | 228,003,007 | 25,706,405 |
Other. During the period, the investment adviser reimbursed certain Funds for certain losses, which are included in Net Realized Gain (Loss) in each Fund's accompanying Statement of Operations, as follows:
| Fidelity Freedom Index Income Fund | $27,086 |
| Fidelity Freedom Index 2005 Fund | 10,306 |
| Fidelity Freedom Index 2010 Fund | 5,828 |
6. Expense Reductions.
Through arrangements with each applicable Fund's custodian, credits realized as a result of certain uninvested cash balances were used to reduce each applicable Fund's or class' expenses. All of the applicable expense reductions are noted in the table below.
| | Custodian credits |
| Fidelity Freedom Index 2005 Fund | $91 |
| Fidelity Freedom Index 2015 Fund | 1 |
| Fidelity Freedom Index 2020 Fund | 2 |
| Fidelity Freedom Index 2025 Fund | 1 |
| Fidelity Freedom Index 2030 Fund | 3 |
| Fidelity Freedom Index 2035 Fund | 1 |
| Fidelity Freedom Index 2040 Fund | 1 |
| Fidelity Freedom Index 2055 Fund | 3 |
7. Distributions to Shareholders.
Distributions to shareholders of each class were as follows:
| | Six months ended
September 30, 2020(a) | Year ended
March 31, 2020 |
| Fidelity Freedom Index Income Fund | | |
| Distributions to shareholders | | |
| Investor Class | $2,521,592 | $17,666,253 |
| Institutional Premium Class | 2,495,431 | 17,590,362 |
| Premier Class | 218 | – |
| Total | $5,017,241 | $35,256,615 |
| Fidelity Freedom Index 2005 Fund | | |
| Distributions to shareholders | | |
| Investor Class | $637,467 | $8,860,842 |
| Institutional Premium Class | 550,654 | 7,515,499 |
| Total | $1,188,121 | $16,376,341 |
| Fidelity Freedom Index 2010 Fund | | |
| Distributions to shareholders | | |
| Investor Class | $2,893,159 | $50,445,337 |
| Institutional Premium Class | 2,615,465 | 48,815,854 |
| Total | $5,508,624 | $99,261,191 |
| Fidelity Freedom Index 2015 Fund | | |
| Distributions to shareholders | | |
| Investor Class | $6,921,408 | $150,081,688 |
| Institutional Premium Class | 5,379,634 | 111,014,102 |
| Total | $12,301,042 | $261,095,790 |
| Fidelity Freedom Index 2020 Fund | | |
| Distributions to shareholders | | |
| Investor Class | $19,292,717 | $417,629,721 |
| Institutional Premium Class | 21,065,985 | 444,879,925 |
| Total | $40,358,702 | $862,509,646 |
| Fidelity Freedom Index 2025 Fund | | |
| Distributions to shareholders | | |
| Investor Class | $22,916,611 | $444,095,411 |
| Institutional Premium Class | 20,067,892 | 383,513,060 |
| Total | $42,984,503 | $827,608,471 |
| Fidelity Freedom Index 2030 Fund | | |
| Distributions to shareholders | | |
| Investor Class | $22,864,187 | $560,258,274 |
| Institutional Premium Class | 25,464,771 | 609,241,539 |
| Total | $48,328,958 | $1,169,499,813 |
| Fidelity Freedom Index 2035 Fund | | |
| Distributions to shareholders | | |
| Investor Class | $13,636,887 | $439,847,190 |
| Institutional Premium Class | 12,485,639 | 392,335,172 |
| Total | $26,122,526 | $832,182,362 |
| Fidelity Freedom Index 2040 Fund | | |
| Distributions to shareholders | | |
| Investor Class | $10,539,206 | $416,481,373 |
| Institutional Premium Class | 12,817,105 | 512,208,097 |
| Total | $23,356,311 | $928,689,470 |
| Fidelity Freedom Index 2045 Fund | | |
| Distributions to shareholders | | |
| Investor Class | $7,366,508 | $259,811,525 |
| Institutional Premium Class | 7,811,931 | 278,002,254 |
| Total | $15,178,439 | $537,813,779 |
| Fidelity Freedom Index 2050 Fund | | |
| Distributions to shareholders | | |
| Investor Class | $6,279,327 | $219,556,646 |
| Institutional Premium Class | 7,495,420 | 269,304,680 |
| Total | $13,774,747 | $488,861,326 |
| Fidelity Freedom Index 2055 Fund | | |
| Distributions to shareholders | | |
| Investor Class | $3,041,563 | $88,522,571 |
| Institutional Premium Class | 2,658,017 | 72,412,299 |
| Total | $5,699,580 | $160,934,870 |
| Fidelity Freedom Index 2060 Fund | | |
| Distributions to shareholders | | |
| Investor Class | $1,001,083 | $20,175,405 |
| Institutional Premium Class | 810,322 | 15,186,296 |
| Total | $1,811,405 | $35,361,701 |
| Fidelity Freedom Index 2065 Fund | | |
| Distributions to shareholders | | |
| Investor Class | $90,887 | $180,525(b) |
| Institutional Premium Class | 72,413 | 103,548(b) |
| Total | $163,300 | $284,073(b) |
(a) Distributions for Premier Class are for the period June 24, 2020 (commencement of sale of shares) to September 30, 2020.
(b) For the period June 28, 2019 (commencement of operations) to March 31, 2020.
8. Share Transactions.
Share transactions for each class were as follows and may contain automatic conversions between classes or exchanges between affiliated funds:
| | Shares | Shares | Dollars | Dollars |
| | Six months ended September 30, 2020 (a) | Year ended March 31, 2020 | Six months ended September 30, 2020 (a) | Year ended March 31, 2020 |
| Fidelity Freedom Index Income Fund | | | | |
| Investor Class | | | | |
| Shares sold | 11,395,237 | 18,120,724 | $138,447,702 | $219,403,823 |
| Reinvestment of distributions | 208,381 | 1,469,229 | 2,494,220 | 17,534,254 |
| Shares redeemed | (5,121,045) | (9,233,820) | (62,058,936) | (111,322,254) |
| Net increase (decrease) | 6,482,573 | 10,356,133 | $78,882,986 | $125,615,823 |
| Institutional Premium Class | | | | |
| Shares sold | 7,946,180 | 13,649,257 | $96,510,558 | $166,135,867 |
| Reinvestment of distributions | 208,856 | 1,476,450 | 2,495,417 | 17,590,362 |
| Shares redeemed | (4,524,525) | (6,800,570) | (55,118,142) | (82,024,088) |
| Net increase (decrease) | 3,630,511 | 8,325,137 | $43,887,833 | $101,702,141 |
| Premier Class | | | | |
| Shares sold | 9,769 | – | $118,336 | $– |
| Reinvestment of distributions | 18 | – | 218 | – |
| Shares redeemed | (280) | – | (3,475) | – |
| Net increase (decrease) | 9,507 | – | $115,079 | $– |
| Fidelity Freedom Index 2005 Fund | | | | |
| Investor Class | | | | |
| Shares sold | 3,055,268 | 4,924,110 | $40,690,244 | $66,250,577 |
| Reinvestment of distributions | 48,881 | 671,288 | 633,003 | 8,777,977 |
| Shares redeemed | (1,315,702) | (3,094,720) | (17,430,834) | (41,136,366) |
| Net increase (decrease) | 1,788,447 | 2,500,678 | $23,892,413 | $33,892,188 |
| Institutional Premium Class | | | | |
| Shares sold | 2,668,949 | 3,424,758 | $35,565,182 | $46,049,333 |
| Reinvestment of distributions | 42,522 | 574,632 | 550,654 | 7,515,499 |
| Shares redeemed | (2,407,394) | (2,139,680) | (32,395,474) | (28,634,292) |
| Net increase (decrease) | 304,077 | 1,859,710 | $3,720,362 | $24,930,540 |
| Premier Class | | | | |
| Shares sold | 7,962 | – | $105,587 | $– |
| Net increase (decrease) | 7,962 | – | $105,587 | $– |
| Fidelity Freedom Index 2010 Fund | | | | |
| Investor Class | | | | |
| Shares sold | 6,886,691 | 15,052,440 | $91,314,654 | $211,651,492 |
| Reinvestment of distributions | 224,848 | 3,817,404 | 2,875,812 | 50,115,867 |
| Shares redeemed | (5,132,413) | (8,117,951) | (67,894,942) | (111,527,911) |
| Net increase (decrease) | 1,979,126 | 10,751,893 | $26,295,524 | $150,239,448 |
| Institutional Premium Class | | | | |
| Shares sold | 4,781,603 | 8,143,448 | $63,411,341 | $114,584,658 |
| Reinvestment of distributions | 204,332 | 3,716,766 | 2,615,443 | 48,815,854 |
| Shares redeemed | (4,605,320) | (7,536,761) | (61,802,987) | (105,046,402) |
| Net increase (decrease) | 380,615 | 4,323,453 | $4,223,797 | $58,354,110 |
| Premier Class | | | | |
| Shares sold | 7,931 | – | $104,479 | $– |
| Net increase (decrease) | 7,931 | – | $104,479 | $– |
| Fidelity Freedom Index 2015 Fund | | | | |
| Investor Class | | | | |
| Shares sold | 14,735,638 | 32,650,717 | $205,130,203 | $488,524,806 |
| Reinvestment of distributions | 515,634 | 10,761,105 | 6,878,552 | 149,342,418 |
| Shares redeemed | (11,499,747) | (21,601,220) | (159,646,779) | (311,808,556) |
| Net increase (decrease) | 3,751,525 | 21,810,602 | $52,361,976 | $326,058,668 |
| Institutional Premium Class | | | | |
| Shares sold | 8,656,068 | 19,750,349 | $120,723,341 | $295,971,928 |
| Reinvestment of distributions | 403,574 | 7,998,029 | 5,379,634 | 111,014,102 |
| Shares redeemed | (11,009,303) | (14,110,815) | (155,481,699) | (209,056,900) |
| Net increase (decrease) | (1,949,661) | 13,637,563 | $(29,378,724) | $197,929,130 |
| Premier Class | | | | |
| Shares sold | 108,414 | – | $1,586,868 | $– |
| Net increase (decrease) | 108,414 | – | $1,586,868 | $– |
| Fidelity Freedom Index 2020 Fund | | | | |
| Investor Class | | | | |
| Shares sold | 42,410,156 | 102,815,807 | $631,910,920 | $1,641,767,048 |
| Reinvestment of distributions | 1,354,016 | 27,838,228 | 19,186,405 | 415,616,368 |
| Shares redeemed | (34,212,455) | (64,016,969) | (505,614,991) | (984,924,209) |
| Net increase (decrease) | 9,551,717 | 66,637,066 | $145,482,334 | $1,072,459,207 |
| Institutional Premium Class | | | | |
| Shares sold | 36,139,526 | 68,537,330 | $539,765,257 | $1,095,334,629 |
| Reinvestment of distributions | 1,487,711 | 29,811,951 | 21,065,985 | 444,879,925 |
| Shares redeemed | (36,899,998) | (53,905,551) | (554,974,698) | (846,332,626) |
| Net increase (decrease) | 727,239 | 44,443,730 | $5,856,544 | $693,881,928 |
| Premier Class | | | | |
| Shares sold | 102,815 | – | $1,591,595 | $– |
| Shares redeemed | (399) | – | (6,165) | – |
| Net increase (decrease) | 102,416 | – | $1,585,430 | $– |
| Fidelity Freedom Index 2025 Fund | | | | |
| Investor Class | | | | |
| Shares sold | 60,537,109 | 129,762,256 | $990,941,858 | $2,229,728,790 |
| Reinvestment of distributions | 1,470,564 | 26,833,336 | 22,808,438 | 442,284,847 |
| Shares redeemed | (41,198,272) | (59,889,712) | (667,825,267) | (991,693,745) |
| Net increase (decrease) | 20,809,401 | 96,705,880 | $345,925,029 | $1,680,319,892 |
| Institutional Premium Class | | | | |
| Shares sold | 48,519,562 | 79,710,153 | $797,386,312 | $1,368,255,120 |
| Reinvestment of distributions | 1,293,850 | 23,265,479 | 20,067,618 | 383,508,004 |
| Shares redeemed | (34,226,954) | (39,002,808) | (571,362,234) | (656,237,606) |
| Net increase (decrease) | 15,586,458 | 63,972,824 | $246,091,696 | $1,095,525,518 |
| Premier Class | | | | |
| Shares sold | 49,206 | – | $835,074 | $– |
| Net increase (decrease) | 49,206 | – | $835,074 | $– |
| Fidelity Freedom Index 2030 Fund | | | | |
| Investor Class | | | | |
| Shares sold | 57,184,230 | 131,157,768 | $961,450,083 | $2,360,809,797 |
| Reinvestment of distributions | 1,438,667 | 32,671,366 | 22,774,095 | 558,493,424 |
| Shares redeemed | (40,308,068) | (57,645,518) | (670,309,701) | (996,847,484) |
| Net increase (decrease) | 18,314,829 | 106,183,616 | $313,914,477 | $1,922,455,737 |
| Institutional Premium Class | | | | |
| Shares sold | 54,582,234 | 87,060,673 | $920,276,752 | $1,564,921,464 |
| Reinvestment of distributions | 1,607,621 | 35,635,273 | 25,464,710 | 609,241,539 |
| Shares redeemed | (38,018,577) | (40,732,758) | (652,202,099) | (720,913,670) |
| Net increase (decrease) | 18,171,278 | 81,963,188 | $293,539,363 | $1,453,249,333 |
| Premier Class | | | | |
| Shares sold | 71,142 | – | $1,265,683 | $– |
| Shares redeemed | (1) | – | (19) | – |
| Net increase (decrease) | 71,141 | – | $1,265,664 | $– |
| Fidelity Freedom Index 2035 Fund | | | | |
| Investor Class | | | | |
| Shares sold | 42,750,565 | 100,117,537 | $760,768,151 | $1,909,862,090 |
| Reinvestment of distributions | 817,770 | 23,788,624 | 13,566,808 | 437,257,451 |
| Shares redeemed | (30,739,439) | (41,863,894) | (541,291,483) | (767,948,063) |
| Net increase (decrease) | 12,828,896 | 82,042,267 | $233,043,476 | $1,579,171,478 |
| Institutional Premium Class | | | | |
| Shares sold | 40,897,200 | 64,780,160 | $729,992,825 | $1,236,729,019 |
| Reinvestment of distributions | 752,144 | 21,343,218 | 12,485,583 | 392,335,171 |
| Shares redeemed | (24,628,772) | (26,541,395) | (449,540,227) | (500,176,465) |
| Net increase (decrease) | 17,020,572 | 59,581,983 | $292,938,181 | $1,128,887,725 |
| Premier Class | | | | |
| Shares sold | 52,080 | – | $970,822 | $– |
| Net increase (decrease) | 52,080 | – | $970,822 | $– |
| Fidelity Freedom Index 2040 Fund | | | | |
| Investor Class | | | | |
| Shares sold | 38,247,820 | 83,553,714 | $669,256,358 | $1,588,674,345 |
| Reinvestment of distributions | 646,931 | 22,780,078 | 10,506,167 | 415,500,499 |
| Shares redeemed | (26,789,731) | (33,736,635) | (461,647,982) | (621,941,422) |
| Net increase (decrease) | 12,105,020 | 72,597,157 | $218,114,543 | $1,382,233,422 |
| Institutional Premium Class | | | | |
| Shares sold | 41,430,314 | 68,827,317 | $728,428,512 | $1,316,598,156 |
| Reinvestment of distributions | 789,226 | 28,080,522 | 12,817,028 | 512,208,096 |
| Shares redeemed | (24,373,901) | (28,428,229) | (436,279,851) | (535,694,750) |
| Net increase (decrease) | 17,845,639 | 68,479,610 | $304,965,689 | $1,293,111,502 |
| Premier Class | | | | |
| Shares sold | 167,506 | – | $3,150,667 | $– |
| Net increase (decrease) | 167,506 | – | $3,150,667 | $– |
| Fidelity Freedom Index 2045 Fund | | | | |
| Investor Class | | | | |
| Shares sold | 30,370,370 | 63,421,127 | $550,316,718 | $1,226,419,370 |
| Reinvestment of distributions | 436,598 | 13,723,152 | 7,356,685 | 259,452,300 |
| Shares redeemed | (19,359,922) | (23,283,486) | (345,856,036) | (439,883,432) |
| Net increase (decrease) | 11,447,046 | 53,860,793 | $211,817,367 | $1,045,988,238 |
| Institutional Premium Class | | | | |
| Shares sold | 32,055,973 | 53,748,851 | $587,099,372 | $1,045,817,692 |
| Reinvestment of distributions | 463,594 | 14,696,143 | 7,811,555 | 278,002,254 |
| Shares redeemed | (15,192,451) | (19,843,917) | (281,758,768) | (384,135,477) |
| Net increase (decrease) | 17,327,116 | 48,601,077 | $313,152,159 | $939,684,469 |
| Premier Class | | | | |
| Shares sold | 90,816 | – | $1,760,020 | $– |
| Net increase (decrease) | 90,816 | – | $1,760,020 | $– |
| Fidelity Freedom Index 2050 Fund | | | | |
| Investor Class | | | | |
| Shares sold | 27,997,440 | 53,145,751 | $506,074,836 | $1,033,288,905 |
| Reinvestment of distributions | 371,361 | 11,562,991 | 6,268,578 | 219,075,876 |
| Shares redeemed | (16,259,389) | (19,380,962) | (291,204,721) | (370,970,702) |
| Net increase (decrease) | 12,109,412 | 45,327,780 | $221,138,693 | $881,394,079 |
| Institutional Premium Class | | | | |
| Shares sold | 29,389,427 | 52,529,880 | $537,205,587 | $1,026,003,180 |
| Reinvestment of distributions | 444,040 | 14,213,900 | 7,495,390 | 269,304,680 |
| Shares redeemed | (14,570,793) | (19,354,064) | (269,352,036) | (377,307,633) |
| Net increase (decrease) | 15,262,674 | 47,389,716 | $275,348,941 | $918,000,227 |
| Premier Class | | | | |
| Shares sold | 80,786 | – | $1,596,447 | $– |
| Shares redeemed | (639) | – | (12,182) | – |
| Net increase (decrease) | 80,147 | – | $1,584,265 | $– |
| Fidelity Freedom Index 2055 Fund | | | | |
| Investor Class | | | | |
| Shares sold | 22,848,349 | 42,884,949 | $337,311,390 | $666,320,479 |
| Reinvestment of distributions | 218,990 | 5,686,429 | 3,035,197 | 88,362,601 |
| Shares redeemed | (12,344,599) | (12,997,316) | (181,033,538) | (199,707,499) |
| Net increase (decrease) | 10,722,740 | 35,574,062 | $159,313,049 | $554,975,581 |
| Institutional Premium Class | | | | |
| Shares sold | 20,135,329 | 28,059,146 | $301,227,158 | $435,730,475 |
| Reinvestment of distributions | 191,637 | 4,654,087 | 2,658,011 | 72,412,299 |
| Shares redeemed | (7,233,638) | (9,792,532) | (110,292,828) | (152,990,179) |
| Net increase (decrease) | 13,093,328 | 22,920,701 | $193,592,341 | $355,152,595 |
| Premier Class | | | | |
| Shares sold | 105,725 | – | $1,725,078 | $– |
| Net increase (decrease) | 105,725 | – | $1,725,078 | $– |
| Fidelity Freedom Index 2060 Fund | | | | |
| Investor Class | | | | |
| Shares sold | 12,135,420 | 22,506,868 | $152,045,324 | $288,991,465 |
| Reinvestment of distributions | 84,785 | 1,529,667 | 994,532 | 20,098,123 |
| Shares redeemed | (5,590,050) | (6,557,512) | (69,567,644) | (83,505,195) |
| Net increase (decrease) | 6,630,155 | 17,479,023 | $83,472,212 | $225,584,393 |
| Institutional Premium Class | | | | |
| Shares sold | 11,319,288 | 14,972,083 | $143,367,371 | $192,006,294 |
| Reinvestment of distributions | 69,022 | 1,154,934 | 810,322 | 15,184,958 |
| Shares redeemed | (3,502,652) | (4,548,333) | (44,928,116) | (58,476,712) |
| Net increase (decrease) | 7,885,658 | 11,578,684 | $99,249,577 | $148,714,540 |
| Premier Class | | | | |
| Shares sold | 22,620 | – | $296,396 | $– |
| Net increase (decrease) | 22,620 | – | $296,396 | $– |
| Fidelity Freedom Index 2065 Fund | | | | |
| Investor Class | | | | |
| Shares sold | 2,108,604 | 2,682,829(b) | $21,623,755 | $27,307,154(b) |
| Reinvestment of distributions | 9,610 | 16,987(b) | 90,815 | 180,404(b) |
| Shares redeemed | (813,255) | (913,567)(b) | (8,211,186) | (9,606,396)(b) |
| Net increase (decrease) | 1,304,959 | 1,786,249(b) | $13,503,384 | $17,881,162(b) |
| Institutional Premium Class | | | | |
| Shares sold | 1,923,923 | 1,235,896(b) | $19,352,917 | $12,464,580(b) |
| Reinvestment of distributions | 7,659 | 9,750(b) | 72,374 | 103,548(b) |
| Shares redeemed | (490,031) | (95,266)(b) | (5,055,861) | (962,682)(b) |
| Net increase (decrease) | 1,441,551 | 1,150,380(b) | $14,369,430 | $11,605,446(b) |
| Premier Class | | | | |
| Shares sold | 16,227 | – | $169,318 | $– |
| Net increase (decrease) | 16,227 | – | $169,318 | $– |
(a) Share transactions for Premier Class are for the period June 24, 2020 (commencement of sale of shares) to September 30, 2020.
(b) For the period June 28, 2019 (commencement of operations) to March 31, 2020.
9. Other.
The Funds' organizational documents provide former and current trustees and officers with a limited indemnification against liabilities arising in connection with the performance of their duties to the Funds. In the normal course of business, the Funds may also enter into contracts that provide general indemnifications. The Funds' maximum exposure under these arrangements is unknown as this would be dependent on future claims that may be made against the Funds. The risk of material loss from such claims is considered remote.
The Funds do not invest in underlying mutual funds for the purpose of exercising management or control; however, investments by the Funds within their principal investment strategies may represent a significant portion of the underlying mutual fund's net assets. At the end of the period, the following Funds were the owners of record of 10% or more of the total outstanding shares of the following underlying mutual funds.
| Fund | Fidelity Freedom Index 2020 Fund | Fidelity Freedom Index 2025 Fund | Fidelity Freedom Index 2030 Fund | Fidelity Freedom Index 2035 Fund | Fidelity Freedom Index 2040 Fund | Fidelity Freedom Index 2045 Fund | Fidelity Freedom Index 2050 Fund |
| Fidelity Series Bond Index Fund | 16% | 19% | 20% | - | - | - | - |
| Fidelity Series Global ex U.S. Index Fund | - | 11% | 15% | 14% | 15% | 11% | 10% |
| Fidelity Series Treasury Bill Index Fund | 20% | 15% | - | - | - | - | - |
| Fidelity Series Total Market Index Fund | - | 11% | 15% | 14% | 15% | 11% | 10% |
The Funds, in aggregate, were the owners of record of more than 20% of the total outstanding shares of the following underlying mutual funds.
| Fund | % of shares held |
| Fidelity Series Bond Index Fund | 85% |
| Fidelity Series Global ex U.S. Index Fund | 93% |
| Fidelity Series Long-Term Treasury Bond Index Fund | 23% |
| Fidelity Series Treasury Bill Index Fund | 58% |
| Fidelity Series Total Market Index Fund | 93% |
10. Coronavirus (COVID-19) Pandemic.
An outbreak of COVID-19 first detected in China during December 2019 has since spread globally and was declared a pandemic by the World Health Organization during March 2020. Developments that disrupt global economies and financial markets, such as the COVID-19 pandemic, may magnify factors that affect the Funds' performance.
Shareholder Expense Example
As a shareholder, you incur two types of costs: (1) transaction costs, which may include sales charges (loads) on purchase payments or redemption proceeds, as applicable and (2) ongoing costs, which generally include management fees, distribution and/or service (12b-1) fees and other Fund expenses. This Example is intended to help you understand your ongoing costs (in dollars) of investing in a fund and to compare these costs with the ongoing costs of investing in other mutual funds.
The actual expense Example is based on an investment of $1,000 invested at the beginning of the period and held for the entire period (April 1, 2020 to September 30, 2020) for Investor Class and Institutional Premium Class and for the period (June 24, 2020 to September 30, 2020) for Premier Class. The hypothetical expense Example is based on an investment of $1,000 invested for the one-half year period (April 1, 2020 to September 30, 2020).
Actual Expenses
The first line of the accompanying table provides information about actual account values and actual expenses. You may use the information in this line, together with the amount you invested, to estimate the expenses that you paid over the period. Simply divide your account value by $1,000.00 (for example, an $8,600 account value divided by $1,000.00 = 8.6), then multiply the result by the number in the first line for a class/Fund under the heading entitled "Expenses Paid During Period" to estimate the expenses you paid on your account during this period. If any fund is a shareholder of any underlying mutual funds or exchange-traded funds (ETFs) (the Underlying Funds), such fund indirectly bears its proportional share of the expenses of the Underlying Funds in addition to the direct expenses incurred presented in the table. These fees and expenses are not included in the annualized expense ratio used to calculate the expense estimate in the table below.
Hypothetical Example for Comparison Purposes
The second line of the accompanying table provides information about hypothetical account values and hypothetical expenses based on the actual expense ratio and an assumed rate of return of 5% per year before expenses, which is not the actual return. The hypothetical account values and expenses may not be used to estimate the actual ending account balance or expenses you paid for the period. You may use this information to compare the ongoing costs of investing in the Fund and other funds. To do so, compare this 5% hypothetical example with the 5% hypothetical examples that appear in the shareholder reports of the other funds. If any fund is a shareholder of any Underlying Funds, such fund indirectly bears its proportional share of the expenses of the Underlying Funds in addition to the direct expenses as presented in the table. These fees and expenses are not included in the annualized expense ratio used to calculate the expense estimate in the table below.
Please note that the expenses shown in the table are meant to highlight your ongoing costs only and do not reflect any transaction costs. Therefore, the second line of the table is useful in comparing ongoing costs only, and will not help you determine the relative total costs of owning different funds.
| | Annualized Expense Ratio-A | Beginning
Account Value
| Ending
Account Value
September 30, 2020 | Expenses Paid
During Period
|
| Fidelity Freedom Index Income Fund | | | | |
| Investor Class | .12% | | | |
| Actual | | $1,000.00 | $1,074.20 | $.62-B |
| Hypothetical-C | | $1,000.00 | $1,024.47 | $.61-D |
| Institutional Premium Class | .08% | | | |
| Actual | | $1,000.00 | $1,073.60 | $.42-B |
| Hypothetical-C | | $1,000.00 | $1,024.67 | $.41-D |
| Premier Class | .06% | | | |
| Actual | | $1,000.00 | $1,023.70 | $.16-B |
| Hypothetical-C | | $1,000.00 | $1,024.77 | $.30-D |
| Fidelity Freedom Index 2005 Fund | | | | |
| Investor Class | .12% | | | |
| Actual | | $1,000.00 | $1,089.40 | $.63-B |
| Hypothetical-C | | $1,000.00 | $1,024.47 | $.61-D |
| Institutional Premium Class | .08% | | | |
| Actual | | $1,000.00 | $1,089.50 | $.42-B |
| Hypothetical-C | | $1,000.00 | $1,024.67 | $.41-D |
| Premier Class | .06% | | | |
| Actual | | $1,000.00 | $1,028.70 | $.17-B |
| Hypothetical-C | | $1,000.00 | $1,024.77 | $.30-D |
| Fidelity Freedom Index 2010 Fund | | | | |
| Investor Class | .12% | | | |
| Actual | | $1,000.00 | $1,113.20 | $.64-B |
| Hypothetical-C | | $1,000.00 | $1,024.47 | $.61-D |
| Institutional Premium Class | .08% | | | |
| Actual | | $1,000.00 | $1,114.10 | $.42-B |
| Hypothetical-C | | $1,000.00 | $1,024.67 | $.41-D |
| Premier Class | .06% | | | |
| Actual | | $1,000.00 | $1,036.50 | $.17-B |
| Hypothetical-C | | $1,000.00 | $1,024.77 | $.30-D |
| Fidelity Freedom Index 2015 Fund | | | | |
| Investor Class | .12% | | | |
| Actual | | $1,000.00 | $1,137.90 | $.64-B |
| Hypothetical-C | | $1,000.00 | $1,024.47 | $.61-D |
| Institutional Premium Class | .08% | | | |
| Actual | | $1,000.00 | $1,138.20 | $.43-B |
| Hypothetical-C | | $1,000.00 | $1,024.67 | $.41-D |
| Premier Class | .06% | | | |
| Actual | | $1,000.00 | $1,044.30 | $.17-B |
| Hypothetical-C | | $1,000.00 | $1,024.77 | $.30-D |
| Fidelity Freedom Index 2020 Fund | | | | |
| Investor Class | .12% | | | |
| Actual | | $1,000.00 | $1,160.40 | $.65-B |
| Hypothetical-C | | $1,000.00 | $1,024.47 | $.61-D |
| Institutional Premium Class | .08% | | | |
| Actual | | $1,000.00 | $1,160.60 | $.43-B |
| Hypothetical-C | | $1,000.00 | $1,024.67 | $.41-D |
| Premier Class | .06% | | | |
| Actual | | $1,000.00 | $1,051.70 | $.17-B |
| Hypothetical-C | | $1,000.00 | $1,024.77 | $.30-D |
| Fidelity Freedom Index 2025 Fund | | | | |
| Investor Class | .12% | | | |
| Actual | | $1,000.00 | $1,178.10 | $.66-B |
| Hypothetical-C | | $1,000.00 | $1,024.47 | $.61-D |
| Institutional Premium Class | .08% | | | |
| Actual | | $1,000.00 | $1,178.90 | $.44-B |
| Hypothetical-C | | $1,000.00 | $1,024.67 | $.41-D |
| Premier Class | .06% | | | |
| Actual | | $1,000.00 | $1,057.60 | $.17-B |
| Hypothetical-C | | $1,000.00 | $1,024.77 | $.30-D |
| Fidelity Freedom Index 2030 Fund | | | | |
| Investor Class | .12% | | | |
| Actual | | $1,000.00 | $1,203.90 | $.66-B |
| Hypothetical-C | | $1,000.00 | $1,024.47 | $.61-D |
| Institutional Premium Class | .08% | | | |
| Actual | | $1,000.00 | $1,204.70 | $.44-B |
| Hypothetical-C | | $1,000.00 | $1,024.67 | $.41-D |
| Premier Class | .06% | | | |
| Actual | | $1,000.00 | $1,065.20 | $.17-B |
| Hypothetical-C | | $1,000.00 | $1,024.77 | $.30-D |
| Fidelity Freedom Index 2035 Fund | | | | |
| Investor Class | .12% | | | |
| Actual | | $1,000.00 | $1,243.50 | $.67-B |
| Hypothetical-C | | $1,000.00 | $1,024.47 | $.61-D |
| Institutional Premium Class | .08% | | | |
| Actual | | $1,000.00 | $1,243.50 | $.45-B |
| Hypothetical-C | | $1,000.00 | $1,024.67 | $.41-D |
| Premier Class | .06% | | | |
| Actual | | $1,000.00 | $1,077.20 | $.17-B |
| Hypothetical-C | | $1,000.00 | $1,024.77 | $.30-D |
| Fidelity Freedom Index 2040 Fund | | | | |
| Investor Class | .12% | | | |
| Actual | | $1,000.00 | $1,265.60 | $.68-B |
| Hypothetical-C | | $1,000.00 | $1,024.47 | $.61-D |
| Institutional Premium Class | .08% | | | |
| Actual | | $1,000.00 | $1,265.00 | $.45-B |
| Hypothetical-C | | $1,000.00 | $1,024.67 | $.41-D |
| Premier Class | .06% | | | |
| Actual | | $1,000.00 | $1,084.50 | $.17-B |
| Hypothetical-C | | $1,000.00 | $1,024.77 | $.30-D |
| Fidelity Freedom Index 2045 Fund | | | | |
| Investor Class | .12% | | | |
| Actual | | $1,000.00 | $1,265.80 | $.68-B |
| Hypothetical-C | | $1,000.00 | $1,024.47 | $.61-D |
| Institutional Premium Class | .08% | | | |
| Actual | | $1,000.00 | $1,265.10 | $.45-B |
| Hypothetical-C | | $1,000.00 | $1,024.67 | $.41-D |
| Premier Class | .06% | | | |
| Actual | | $1,000.00 | $1,084.80 | $.17-B |
| Hypothetical-C | | $1,000.00 | $1,024.77 | $.30-D |
| Fidelity Freedom Index 2050 Fund | | | | |
| Investor Class | .12% | | | |
| Actual | | $1,000.00 | $1,266.00 | $.68-B |
| Hypothetical-C | | $1,000.00 | $1,024.47 | $.61-D |
| Institutional Premium Class | .08% | | | |
| Actual | | $1,000.00 | $1,266.00 | $.45-B |
| Hypothetical-C | | $1,000.00 | $1,024.67 | $.41-D |
| Premier Class | .06% | | | |
| Actual | | $1,000.00 | $1,084.60 | $.17-B |
| Hypothetical-C | | $1,000.00 | $1,024.77 | $.30-D |
| Fidelity Freedom Index 2055 Fund | | | | |
| Investor Class | .12% | | | |
| Actual | | $1,000.00 | $1,265.10 | $.68-B |
| Hypothetical-C | | $1,000.00 | $1,024.47 | $.61-D |
| Institutional Premium Class | .08% | | | |
| Actual | | $1,000.00 | $1,265.00 | $.45-B |
| Hypothetical-C | | $1,000.00 | $1,024.67 | $.41-D |
| Premier Class | .06% | | | |
| Actual | | $1,000.00 | $1,084.60 | $.17-B |
| Hypothetical-C | | $1,000.00 | $1,024.77 | $.30-D |
| Fidelity Freedom Index 2060 Fund | | | | |
| Investor Class | .12% | | | |
| Actual | | $1,000.00 | $1,265.30 | $.68-B |
| Hypothetical-C | | $1,000.00 | $1,024.47 | $.61-D |
| Institutional Premium Class | .08% | | | |
| Actual | | $1,000.00 | $1,266.30 | $.45-B |
| Hypothetical-C | | $1,000.00 | $1,024.67 | $.41-D |
| Premier Class | .06% | | | |
| Actual | | $1,000.00 | $1,084.60 | $.17-B |
| Hypothetical-C | | $1,000.00 | $1,024.77 | $.30-D |
| Fidelity Freedom Index 2065 Fund | | | | |
| Investor Class | .12% | | | |
| Actual | | $1,000.00 | $1,265.20 | $.68-B |
| Hypothetical-C | | $1,000.00 | $1,024.47 | $.61-D |
| Institutional Premium Class | .08% | | | |
| Actual | | $1,000.00 | $1,266.50 | $.45-B |
| Hypothetical-C | | $1,000.00 | $1,024.67 | $.41-D |
| Premier Class | .06% | | | |
| Actual | | $1,000.00 | $1,085.10 | $.17-B |
| Hypothetical-C | | $1,000.00 | $1,024.77 | $.30-D |
A Annualized expense ratio reflects expenses net of applicable fee waivers.
B Actual Expenses are equal to the annualized expense ratio, multiplied by the average account value over the period, multiplied by 183/ 365 (to reflect the one-half year period) for Investor Class and Institutional Premium Class and multiplied by 99/365 (to reflect the period June 24, 2020 to September 30, 2020) for Premier Class. The fees and expenses of any Underlying Funds are not included in each annualized expense ratio.
C 5% return per year before expenses
D Hypothetical expenses are equal to the annualized expense ratio, multiplied by the average account value over the period, multiplied by 183/365 (to reflect the one-half year period).
Board Approval of Investment Advisory Contracts and Management Fees
Fidelity Freedom Index Funds
At its May 2020 meeting, the Board of Trustees, including the Independent Trustees (together, the Board), voted to approve the amended and restated management contract (the Amended Advisory Contract) with Fidelity Management & Research Company LLC (FMR) for each of the Fidelity Freedom Index funds to add the fee schedule for the new Premier Class of each fund. The Board, assisted by the advice of fund counsel and Independent Trustees' counsel, considered a broad range of information.
Nature, Extent, and Quality of Services Provided. The Board noted that it previously received and considered materials relating to the nature, extent and quality of services provided by FMR, including the resources dedicated to investment management and support services, shareholder and administrative services, the benefits to shareholders of investment in a large fund family, and each fund's performance in connection with the annual renewal of each fund's current management contract (though the Board did not assign significant weight to the Freedom Index 2065 Fund as it had only recently commenced operations). At its September 2019 meeting, the Board concluded that the nature, extent and quality of the services provided to each fund under the existing management contract should benefit the fund's shareholders. The Board further noted that approval of the Amended Advisory Contract would not change each fund's investment processes, the level or nature of services provided, the resources and personnel allocated, trading and compliance operations, or any fees or expenses paid by the funds. The Board concluded that the nature, extent, and quality of services to be provided to each fund under the Amended Contract will continue to benefit the fund's shareholders.
Competitiveness of Management Fee and Total Expense Ratio. The Board considered each fund's management fee and total expense ratio compared to "mapped groups" of competitive funds and classes created for the purpose of facilitating the Trustees' competitive analysis of management fees and total expenses. Fidelity creates "mapped groups" by combining similar Lipper investment objective categories that have comparable investment mandates. Combining Lipper investment objective categories aids the Board's management fee and total expense ratio comparisons by broadening the competitive group used for comparison.
Based on competitive mapped group data provided to the Board, the Board noted that the proposed management fee rate of the new Premier Class for each of the funds would rank below the median of its competitor funds. The Board considered that, under the contractual arrangements for the new Premier Class, the "class-level" management fee covers most expenses of the top-level fund and underlying funds, rather than just management services. For the total expense ratio, based on the same competitive mapped group data referenced above, the Board noted that the proposed total net expenses (including acquired fund fees and expenses for competitor funds) for the new Premier Class of each fund would rank below median as well. The Board further noted that the Amended Advisory Contracts would not result in changes to the nature, extent, and quality of the services provided to each fund.
Based on its review, the Board concluded that the management fee and the projected total expense ratio of the new Premier class for each fund were reasonable in light of the services that the fund and its shareholders will receive and the other factors considered.
Costs of the Services and Profitability. The Board considered that it previously reviewed information regarding the revenues earned, the expenses incurred by Fidelity in providing services to each fund (and the Series Funds in which each fund invests) and the level of Fidelity's profitability. At its September 2019 meeting, the Board concluded that it was satisfied that the profitability of Fidelity in connection with the operation of each fund was not excessive.
Economies of Scale. The Board considered that it previously received and reviewed information regarding whether there have been economies of scale in respect of the management of the Fidelity funds, whether the Fidelity funds (including each fund) have appropriately benefited from any such economies of scale, and whether there is a potential realization of any further economies of scale and that it concluded, at its September 2019 meeting, that economies of scale, if any, are being appropriately shared between fund shareholders and Fidelity. The Board will continue to review economies of scale in connection with future renewals of the Amended Advisory Contract.
Based on its evaluation of all of the conclusions noted above, and after considering all factors it believed relevant, the Board concluded that the Amended Advisory Contract for each of the funds should be approved.
Board Approval of Investment Advisory Contracts and Management Fees
Fidelity Freedom Index Funds
Each year, the Board of Trustees, including the Independent Trustees (together, the Board), votes on the renewal of the management contract with Fidelity Management & Research Company LLC (FMR) (the Advisory Contract) for each fund. The Board, assisted by the advice of fund counsel and Independent Trustees' counsel, requests and considers a broad range of information relevant to the renewal of the Advisory Contracts throughout the year.
The Board meets regularly and, at each of its meetings, covers an extensive agenda of topics and materials and considers factors that are relevant to its annual consideration of the renewal of each fund's Advisory Contract, including the services and support provided to each fund and its shareholders. The Board has established four standing committees (Committees) — Operations, Audit, Fair Valuation, and Governance and Nominating — each composed of and chaired by Independent Trustees with varying backgrounds, to which the Board has assigned specific subject matter responsibilities in order to enhance effective decision-making by the Board. The Operations Committee, of which all of the Independent Trustees are members, meets regularly throughout the year and considers, among other matters, information specifically related to the annual consideration of the renewal of each fund's Advisory Contract. The Board, acting directly and through its Committees, requests and receives information concerning the annual consideration of the renewal of each fund's Advisory Contract. The Board also meets as needed to review matters specifically related to the Board's annual consideration of the renewal of the Advisory Contracts. Members of the Board may also meet with trustees of other Fidelity funds through joint ad hoc committees to discuss certain matters relevant to all of the Fidelity funds.
At its September 2020 meeting, the Board unanimously determined to renew each fund's Advisory Contract. In reaching its determination, the Board considered all factors it believed relevant, including (i) the nature, extent, and quality of the services provided to each fund and its shareholders (including the investment performance of each fund); (ii) the competitiveness of each fund's management fee and total expense ratio relative to peer funds; (iii) the total costs of the services provided by and the profits realized by Fidelity from its relationships with each fund; and (iv) the extent to which, if any, economies of scale exist and are realized as each fund grows, and whether any economies of scale are appropriately shared with fund shareholders. The Board also considered that, effective June 1, 2019, each fund had implemented a new fee structure whereby it pays an all-inclusive management fee that covers all operating expenses of the fund, subject to certain exceptions, and varies by class (unified fee) and the underlying Fidelity funds in which the fund invests (Series Funds) no longer pay expenses, with certain limited exceptions. The Board and the board of other funds that invest their assets in Series Funds and the boards of the Series Funds previously formed a joint ad hoc committee to review the responsibilities of each board related to the consideration of the renewal of the Advisory Contracts for the funds, other funds that invest substantially all of their assets in Series Funds, and the Series Funds. The Board's deliberations were informed by the conclusions of such committee.
In considering whether to renew the Advisory Contract for each fund, the Board reached a determination, with the assistance of fund counsel and Independent Trustees' counsel and through the exercise of its business judgment, that the renewal of the Advisory Contract was in the best interests of each fund and its shareholders and that the compensation payable under the Advisory Contract was fair and reasonable. The Board's decision to renew the Advisory Contracts was not based on any single factor, but rather was based on a comprehensive consideration of all the information provided to the Board at its meetings throughout the year. The Board, in reaching its determination to renew the Advisory Contracts, was aware that shareholders of each fund have a broad range of investment choices available to them, including a wide choice among funds offered by Fidelity's competitors, and that each fund's shareholders, who have the opportunity to review and weigh the disclosure provided by the fund in its prospectus and other public disclosures, have chosen to invest in that fund, which is part of the Fidelity family of funds.
Nature, Extent, and Quality of Services Provided. The Board considered Fidelity's staffing as it relates to the funds, including the backgrounds of investment personnel of FMR, and also considered the funds' investment objectives, strategies, and related investment philosophies. The Independent Trustees also had discussions with senior management of Fidelity's investment operations and investment groups with responsibility for the Series Funds. The Board considered the structure of the investment personnel compensation program and whether this structure provides appropriate incentives to act in the best interests of each fund. Additionally, the Board considered the portfolio managers' investments, if any, in the funds that they manage.
Resources Dedicated to Investment Management and Support Services. The Board reviewed the general qualifications and capabilities of Fidelity's investment staff, including its size, education, experience, and resources, as well as Fidelity's approach to recruiting, managing, and compensating investment personnel. The Board noted that Fidelity has continued to increase the resources devoted to non-U.S. offices, including expansion of Fidelity's global investment organization. The Board also noted that Fidelity's analysts have extensive resources, tools and capabilities that allow them to conduct sophisticated quantitative and fundamental analysis, as well as credit analysis of issuers, counterparties and guarantors. Further, the Board considered that Fidelity's investment professionals have sufficient access to global information and data so as to provide competitive investment results over time, and that those professionals also have access to sophisticated tools that permit them to assess portfolio construction and risk and performance attribution characteristics continuously, as well as to transmit new information and research conclusions rapidly around the world. Additionally, in its deliberations, the Board considered Fidelity's risk management, compliance, and technology and operations capabilities and resources, which are integral parts of the investment management process. The Board also considered Fidelity's investments in business continuity planning, and its success in continuously providing services to the funds notwithstanding the severe disruptions caused by the COVID-19 pandemic.
Shareholder and Administrative Services. The Board considered (i) the nature, extent, quality, and cost of advisory, administrative, and shareholder services performed by Fidelity under the Advisory Contracts and under separate agreements covering transfer agency and pricing and bookkeeping services for each fund; (ii) the nature and extent of the supervision of third party service providers, principally custodians, subcustodians, and pricing vendors; and (iii) the resources devoted to, and the record of compliance with, each fund's compliance policies and procedures.
The Board noted that the growth of fund assets over time across the complex allows Fidelity to reinvest in the development of services designed to enhance the value and convenience of the Fidelity funds as investment vehicles. These services include 24-hour access to account information and market information over the Internet and through telephone representatives, investor education materials and asset allocation tools, and the expanded availability of Fidelity Investor Centers.
Investment in a Large Fund Family. The Board considered the benefits to shareholders of investing in a Fidelity fund, including the benefits of investing in a fund that is part of a large family of funds offering a variety of investment disciplines and providing a large variety of mutual fund investor services. The Board noted that Fidelity had taken, or had made recommendations that resulted in the Fidelity funds taking, a number of actions over the previous year that benefited particular funds, including: (i) continuing to dedicate additional resources to Fidelity's investment research process, which includes meetings with management of issuers of securities in which the funds invest, and to the support of the senior management team that oversees asset management; (ii) continuing efforts to enhance Fidelity's global research capabilities; (iii) launching new funds and ETFs with innovative structures, strategies and pricing and making other enhancements to meet client needs; (iv) launching new share classes of existing funds; (v) eliminating purchase minimums and broadening eligibility requirements for certain funds and share classes; (vi) reducing management fees and total expenses for certain target date funds or classes and index funds; (vii) lowering expenses for certain funds and classes by implementing or lowering expense caps; (viii) rationalizing product lines and gaining increased efficiencies from fund mergers, liquidations, and share class consolidations; (ix) continuing to develop, acquire and implement systems and technology to improve services to the funds and shareholders, strengthen information security, and increase efficiency; and (x) continuing to implement enhancements to further strengthen Fidelity's product line to increase investors' probability of success in achieving their investment goals, including retirement income goals.
Investment Performance (for each fund except Freedom Index® 2065 Fund). The Board considered whether each fund has operated in accordance with its investment objective, as well as its record of compliance with its investment restrictions and its performance history.
The Board took into account discussions that occur at Board meetings throughout the year with representatives of the investment adviser about fund investment performance. In this regard the Board noted that as part of regularly scheduled fund reviews and other reports to the Board on fund performance, the Board considers annualized return information for each fund for different time periods, measured against one or more appropriate securities market indices, including a customized blended index that reflects the respective weights of the fund's asset classes (each a benchmark index). In its evaluation of fund investment performance at meetings throughout the year, the Board gave particular attention to information indicating underperformance of certain Fidelity funds for specific time periods and discussed with the investment adviser the reasons for such underperformance.
In addition to reviewing absolute and relative fund performance, the Independent Trustees periodically consider the appropriateness of fund performance metrics in evaluating the results achieved. In general, the Independent Trustees believe that fund performance should be evaluated based on gross performance (before fees and expenses, including acquired fund fees and expenses, but after transaction costs, if any) compared to appropriate benchmark indices, over appropriate time periods that may include full market cycles, taking into account relevant factors including the following: general market conditions; the extent to which particular underlying funds affected performance; and fund cash flows and other factors. The Independent Trustees generally give greater weight to fund performance over longer time periods than over shorter time periods. Depending on the circumstances, the Independent Trustees may be satisfied with a fund's performance notwithstanding that it lags its benchmark index for certain periods.
The Independent Trustees recognize that shareholders evaluate performance on a net basis over their own holding periods, for which one-, three-, and five-year periods are often used as a proxy. For this reason, the performance information reviewed by the Board also included net cumulative calendar year total return information for each fund and an appropriate benchmark index for the most recent one-, three-, and five-year periods. Due to the characteristics of the funds, no peer group performance information was considered by the Board. The Independent Trustees recognize that shareholders who are not investing through a tax-advantaged retirement account also consider tax consequences in evaluating performance.
Investment Performance (for Freedom Index® 2065 Fund). The Board considered whether the fund has operated in accordance with its investment objective, as well as its record of compliance with its investment restrictions. As the fund recently commenced operations, the Board did not believe that it was appropriate to assign significant weight to its limited investment performance.
Based on its review, the Board concluded that the nature, extent, and quality of services provided to each fund under the Advisory Contracts should continue to benefit the shareholders of each fund.
Competitiveness of Management Fee and Total Expense Ratio. The Board considered each fund's management fee and total expense ratio compared to "mapped groups" of competitive funds and classes created for the purpose of facilitating the Trustees' competitive analysis of management fees and total expenses. Fidelity creates "mapped groups" by combining similar Lipper investment objective categories that have comparable investment mandates. Combining Lipper investment objective categories aids the Board's management fee and total expense ratio comparisons by broadening the competitive group used for comparison.
Management Fee. The Board noted that each fund's Advisory Contract, which imposes a class-level management fee that covers all operating expenses of the top-level fund and underlying funds, subject to certain exceptions, rather than just management services, went into effect on June 1, 2019, after receiving Board approval. The Board noted that the new pricing structure reduced the total expense ratio of Investor Class by 2 basis points and kept the total expense ratio of Institutional Premium Class at 8 basis points. The Board also noted that the new pricing structure provides for less fluctuation in fund expenses. As a result, the Board did not consider competitive management fee comparisons for prior years, when each fund did not pay a top-level management fee.
The Board considered two proprietary management fee comparisons. The group of Lipper funds used by the Board for management fee comparisons is referred to as the "Total Mapped Group." The Total Mapped Group comparison focuses on a fund's standing in terms of gross management fees before expense reimbursements or caps relative to the total universe of funds with comparable investment mandates, regardless of whether their management fee structures also are comparable. Funds with comparable investment mandates offer exposure to similar types of securities. Funds with comparable management fee structures have similar management fee contractual arrangements (e.g., flat rate charged for advisory services, all-inclusive fee rate, etc.). The "Asset-Sized Peer Group" (ASPG) comparison focuses on a fund's standing relative to a subset of non-Fidelity funds within the Total Mapped Group that are similar in size and management fee structure. For example, if a fund is in the first quartile of the ASPG, the fund's management fee ranks in the least expensive or lowest 25% of funds in the ASPG. The ASPG represents at least 15% of the funds in the Total Mapped Group with comparable asset size and management fee structures, subject to a minimum of 50 funds (or all funds in the Total Mapped Group if fewer than 50). Additional information, such as the ASPG quartile in which a fund's management fee rate ranked, also was considered by the Board. The information considered by the Board reflected the funds' fee structure effective June 1, 2019, as if it was in effect for the entire year.
The Board compared each fund's class-level management fee rate for the current fiscal year relative to the median of its competitor funds in the applicable Total Mapped Group based on competitive data for 2019. The Board noted that each fund's class-level management fee rate ranks equal to or below the median of its competitor funds in the applicable Total Mapped Group based on competitive data for 2019. The Board noted that each fund's unified fee arrangement covers all operating expenses of the fund, subject to certain exceptions, and that the fee structures of the majority of peer funds do not include top-level management fees, similar to the fee structure in place for each fund prior to June 1, 2019. The Board also noted that the funds' total expense comparisons, which include the expenses of the Series Funds, facilitate better comparisons with funds and classes that use different expense structures and that, when compared to the total expenses of their load-type competitors, including acquired fund fees and expenses, all classes of the funds rank below their respective load types.
Based on its review, the Board concluded that each fund's management fee is fair and reasonable in light of the services that the fund receives and the other factors considered.
Total Expense Ratio. In its review of the total expense ratio of each class of each fund, the Board considered the fund's class-level management fee rate under the Advisory Contracts. The Board also considered other expenses, such as transfer agent fees, pricing and bookkeeping fees, and custodial, legal, and audit fees, paid by FMR under the unified fee arrangement. The Board also noted that Fidelity may agree to waive fees or reimburse expenses from time to time, and the extent to which, if any, it has done so for each fund. As part of its review, the Board considered the total expense ratio of each class of each fund compared to the median total expenses for competitor funds (including expenses of underlying funds) based on competitive data for 2019. Each class of each fund is compared to those funds and classes in the Total Mapped Group (used by the Board for management fee comparisons) that have a similar sales load structure.
The Board noted that the total expense ratio of each class of each fund ranked below the competitive median for 2019.
The Board considered that current contractual arrangements for the fund oblige FMR to pay all "class-level" expenses of each of Investor Class, Institutional Premium Class, and Premier Class of each fund to the extent necessary to limit total operating expenses, with certain exceptions, as follows: 0.12%, 0.08%, and 0.06%. These contractual arrangements may not be amended to increase the fees or expenses payable except by a vote of a majority of the Board.
Fees Charged to Other Fidelity Clients. The Board also considered Fidelity fee structures and other information with respect to clients of Fidelity, such as other funds advised or subadvised by Fidelity, pension plan clients, and other institutional clients with similar mandates. The Board noted that a joint ad hoc committee created by it and the boards of other Fidelity funds periodically reviews and compares Fidelity's institutional investment advisory business with its business of providing services to the Fidelity funds and also noted the most recent findings of the committee. The Board noted that the committee's review included a consideration of the differences in services provided, fees charged, and costs incurred, as well as competition in the markets serving the different categories of clients.
Based on its review of total expense ratios and fees charged to other Fidelity clients, the Board concluded that the total expense ratio of each class of each fund was reasonable in light of the services that the fund and its shareholders receive and the other factors considered.
Costs of the Services and Profitability. The Board considered the revenues earned and the expenses incurred by Fidelity in conducting the business of developing, marketing, distributing, managing, administering and servicing each fund and the Series Funds in which each fund invests and in servicing each fund's shareholders. The Board also considered the level of Fidelity's profits in respect of all the Fidelity funds.
On an annual basis, Fidelity presents to the Board information about the profitability of its relationships with each fund. Fidelity calculates profitability information for each fund, as well as aggregate profitability information for groups of Fidelity funds and all Fidelity funds, using a series of detailed revenue and cost allocation methodologies which originate with the books and records of Fidelity on which Fidelity's audited financial statements are based. The Audit Committee of the Board reviews any significant changes from the prior year's methodologies and the full Board approves such changes.
A public accounting firm has been engaged annually by the Board as part of the Board's assessment of Fidelity's profitability analysis. The engagement includes the review and assessment of the methodologies used by Fidelity in determining the revenues and expenses attributable to Fidelity's mutual fund business, and completion of agreed-upon procedures in respect of the mathematical accuracy of certain fund profitability information and its conformity to established allocation methodologies. After considering the reports issued under the engagement and information provided by Fidelity, the Board concluded that while other allocation methods may also be reasonable, Fidelity's profitability methodologies are reasonable in all material respects.
The Board also reviewed Fidelity's non-fund businesses and potential indirect benefits such businesses may have received as a result of their association with Fidelity's mutual fund business (i.e., fall-out benefits) as well as cases where Fidelity's affiliates may benefit from the funds' business. The Board considered areas where potential indirect benefits to the Fidelity funds from their relationships with Fidelity may exist. The Board also considered that in 2019 a joint ad hoc committee created by it and the boards of other Fidelity funds evaluated potential fall-out benefits (PFOB Committee). The Board noted that it considered the PFOB Committee's findings in connection with its consideration of the renewal of the Advisory Contracts.
The Board considered the costs of the services provided by and the profits realized by Fidelity in connection with the operation of each fund, including the conclusions of the PFOB Committee, and was satisfied that the profitability was not excessive.
Economies of Scale. The Board considered whether there have been economies of scale in respect of the management of the Fidelity funds, whether the Fidelity funds (including each fund) have appropriately benefited from any such economies of scale, and whether there is potential for realization of any further economies of scale. The Board considered the extent to which each fund will benefit from economies of scale as assets grow through increased services to the fund, through waivers or reimbursements, or through fee or expense ratio reductions. The Board recognized that, due to each fund's current contractual arrangements, its expense ratio will not decline if the fund's operating costs decrease as assets grow, or rise as assets decrease. The Board also noted that a committee (the Economies of Scale Committee) created by it and the boards of other Fidelity funds periodically analyzes whether Fidelity attains economies of scale in respect of the management and servicing of the Fidelity funds, whether the Fidelity funds have appropriately benefited from such economies of scale, and whether there is potential for realization of any further economies of scale.
The Board concluded, taking into account the analysis of the Economies of Scale Committee, that economies of scale, if any, are being appropriately shared between fund shareholders and Fidelity.
Additional Information Requested by the Board. In order to develop fully the factual basis for consideration of the Fidelity funds' advisory contracts, the Board requested and received additional information on certain topics, including: (i) Fidelity's fund profitability methodology, profitability trends for certain funds, the allocation of various costs to different funds, and the impact of certain factors on fund profitability results; (ii) portfolio manager changes that have occurred during the past year and the amount of the investment that each portfolio manager has made in the Fidelity fund(s) that he or she manages; (iii) Fidelity's compensation structure for portfolio managers, research analysts, and other key personnel, including its effects on fund profitability, the rationale for the compensation structure, and the extent to which current market conditions have affected retention and recruitment; (iv) the arrangements with and compensation paid to certain fund sub-advisers on behalf of the Fidelity funds and the treatment of such compensation within Fidelity's fund profitability methodology; (v) the terms of the funds' various management fee structures, including the basic group fee and the terms of Fidelity's voluntary expense limitation agreements; (vi) Fidelity's transfer agent fee, expense, and service structures for different funds and classes relative to competitive trends; (vii) the impact on fund profitability of recent industry trends, such as the growth in passively managed funds and outflows from actively managed equity funds; and (viii) explanations regarding the relative total expense ratios of certain funds and classes, total expense competitive trends and methodologies for total expense competitive comparisons, and actions that might be taken by Fidelity to reduce total expense ratios for certain classes. In addition, the Board considered its discussions with Fidelity regarding Fidelity's efforts to maintain the continuous investment and shareholder services necessary for the funds during the current pandemic and economic circumstances.
Based on its evaluation of all of the conclusions noted above, and after considering all factors it believed relevant, the Board concluded that the advisory fee arrangements are fair and reasonable, and that each fund's Advisory Contract should be renewed.

FRX-SANN-1120
1.899267.110
Fidelity Freedom® Funds - Income, 2005, 2010, 2015, 2020, 2025, 2030, 2035, 2040, 2045, 2050, 2055, 2060, 2065
Semi-Annual Report
September 30, 2020
See the inside front cover for important information about access to your fund’s shareholder reports.
Beginning on January 1, 2021, as permitted by regulations adopted by the Securities and Exchange Commission, paper copies of a fund’s shareholder reports will no longer be sent by mail, unless you specifically request paper copies of the reports from the fund or from your financial intermediary, such as a financial advisor, broker-dealer or bank. Instead, the reports will be made available on a website, and you will be notified by mail each time a report is posted and provided with a website link to access the report.
If you already elected to receive shareholder reports electronically, you will not be affected by this change and you need not take any action. You may elect to receive shareholder reports and other communications from a fund electronically, by contacting your financial intermediary. For Fidelity customers, visit Fidelity's web site or call Fidelity using the contact information listed below.
You may elect to receive all future reports in paper free of charge. If you wish to continue receiving paper copies of your shareholder reports, you may contact your financial intermediary or, if you are a Fidelity customer, visit Fidelity’s website, or call Fidelity at the applicable toll-free number listed below. Your election to receive reports in paper will apply to all funds held with the fund complex/your financial intermediary.
| Account Type | Website | Phone Number |
| Brokerage, Mutual Fund, or Annuity Contracts: | fidelity.com/mailpreferences | 1-800-343-3548 |
| Employer Provided Retirement Accounts: | netbenefits.fidelity.com/preferences (choose 'no' under Required Disclosures to continue to print) | 1-800-343-0860 |
| Advisor Sold Accounts Serviced Through Your Financial Intermediary: | Contact Your Financial Intermediary | Your Financial Intermediary's phone number |
| Advisor Sold Accounts Serviced by Fidelity: | institutional.fidelity.com | 1-877-208-0098 |
Contents
To view a fund's proxy voting guidelines and proxy voting record for the 12-month period ended June 30, visit http://www.fidelity.com/proxyvotingresults or visit the Securities and Exchange Commission's (SEC) web site at http://www.sec.gov.
You may also call 1-800-544-8544 if you’re an individual investing directly with Fidelity, call 1-800-835-5092 if you’re a plan sponsor or participant with Fidelity as your recordkeeper or call 1-877-208-0098 on institutional accounts or if you’re an advisor or invest through one to request a free copy of the proxy voting guidelines.
Standard & Poor's, S&P and S&P 500 are registered service marks of The McGraw-Hill Companies, Inc. and have been licensed for use by Fidelity Distributors Corporation.
Other third-party marks appearing herein are the property of their respective owners.
All other marks appearing herein are registered or unregistered trademarks or service marks of FMR LLC or an affiliated company. © 2020 FMR LLC. All rights reserved.
This report and the financial statements contained herein are submitted for the general information of the shareholders of the Funds. This report is not authorized for distribution to prospective investors in the Funds unless preceded or accompanied by an effective prospectus.
A fund files its complete schedule of portfolio holdings with the SEC for the first and third quarters of each fiscal year on Form N-PORT. Forms N-PORT are available on the SEC’s web site at http://www.sec.gov. A fund's Forms N-PORT may be reviewed and copied at the SEC’s Public Reference Room in Washington, DC. Information regarding the operation of the SEC's Public Reference Room may be obtained by calling 1-800-SEC-0330.
For a complete list of a fund's portfolio holdings, view the most recent holdings listing, semiannual report, or annual report on Fidelity's web site at http://www.fidelity.com, http://www.institutional.fidelity.com, or http://www.401k.com, as applicable.
NOT FDIC INSURED •MAY LOSE VALUE •NO BANK GUARANTEE
Neither the Funds nor Fidelity Distributors Corporation is a bank.
Note to Shareholders:
Early in 2020, the outbreak and spread of a new coronavirus emerged as a public health emergency that had a major influence on financial markets, primarily based on its impact on the global economy and the outlook for corporate earnings. The virus causes a respiratory disease known as COVID-19. On March 11, the World Health Organization declared the COVID-19 outbreak a pandemic, citing sustained risk of further global spread.
In the weeks following, as the crisis worsened, we witnessed an escalating human tragedy with wide-scale social and economic consequences from coronavirus-containment measures. The outbreak of COVID-19 prompted a number of measures to limit the spread, including travel and border restrictions, quarantines, and restrictions on large gatherings. In turn, these resulted in lower consumer activity, diminished demand for a wide range of products and services, disruption in manufacturing and supply chains, and – given the wide variability in outcomes regarding the outbreak – significant market uncertainty and volatility. Amid the turmoil, the U.S. government took unprecedented action – in concert with the U.S. Federal Reserve and central banks around the world – to help support consumers, businesses, and the broader economy, and to limit disruption to the financial system.
The situation continues to unfold, and the extent and duration of its impact on financial markets and the economy remain highly uncertain. Extreme events such as the coronavirus crisis are “exogenous shocks” that can have significant adverse effects on mutual funds and their investments. Although multiple asset classes may be affected by market disruption, the duration and impact may not be the same for all types of assets.
Fidelity is committed to helping you stay informed amid news about COVID-19 and during increased market volatility, and we’re taking extra steps to be responsive to customer needs. We encourage you to visit our websites, where we offer ongoing updates, commentary, and analysis on the markets and our funds.
Fidelity Freedom® Income Fund
Investment Summary (Unaudited)
The information in the following tables is based on the direct investments of the Fund.
Top Holdings as of September 30, 2020
| | % of fund's net assets |
| Fidelity Series Investment Grade Bond Fund | 38.5 |
| Fidelity Series Government Money Market Fund 0.16% | 19.0 |
| Fidelity Series Inflation-Protected Bond Index Fund | 12.0 |
| Fidelity Series Emerging Markets Opportunities Fund | 6.3 |
| Fidelity Series Short-Term Credit Fund | 4.7 |
| Fidelity Series Commodity Strategy Fund | 2.4 |
| Fidelity Series Long-Term Treasury Bond Index Fund | 2.3 |
| Fidelity Series International Growth Fund | 1.5 |
| Fidelity Series Overseas Fund | 1.5 |
| Fidelity Series International Value Fund | 1.4 |
| | 89.6 |
Asset Allocation (% of fund's net assets)
| Period end |
| | Domestic Equity Funds | 8.9% |
| | International Equity Funds | 12.3% |
| | Bond Funds | 54.7% |
| | Short-Term Funds | 24.1% |

Domestic Equity Funds category includes Fidelity Series Commodity Strategy Fund which invests in commodity-related investments.
Fidelity Freedom® Income Fund
Schedule of Investments September 30, 2020 (Unaudited)
Showing Percentage of Net Assets
| U.S. Treasury Obligations - 0.0% | | | |
| | | Principal Amount | Value |
| U.S. Treasury Bills, yield at date of purchase 0.11% to 0.11% 10/22/20 to 12/10/20 (a) | | | |
| (Cost $1,169,794) | | 1,170,000 | 1,169,817 |
| | | Shares | Value |
|
| Domestic Equity Funds - 8.9% | | | |
| Fidelity Series All-Sector Equity Fund (b) | | 802,860 | $8,550,458 |
| Fidelity Series Blue Chip Growth Fund (b) | | 825,860 | 13,634,947 |
| Fidelity Series Commodity Strategy Fund (b) | | 19,200,928 | 79,875,862 |
| Fidelity Series Growth Company Fund (b) | | 1,472,558 | 38,595,748 |
| Fidelity Series Intrinsic Opportunities Fund (b) | | 2,177,668 | 34,450,708 |
| Fidelity Series Large Cap Stock Fund (b) | | 1,739,184 | 24,626,842 |
| Fidelity Series Large Cap Value Index Fund (b) | | 918,543 | 10,655,103 |
| Fidelity Series Opportunistic Insights Fund (b) | | 919,476 | 19,888,275 |
| Fidelity Series Small Cap Discovery Fund (b) | | 340,127 | 3,438,682 |
| Fidelity Series Small Cap Opportunities Fund (b) | | 913,022 | 11,650,155 |
| Fidelity Series Stock Selector Large Cap Value Fund (b) | | 2,282,649 | 25,109,138 |
| Fidelity Series Value Discovery Fund (b) | | 1,552,052 | 19,183,362 |
| TOTAL DOMESTIC EQUITY FUNDS | | | |
| (Cost $232,428,389) | | | 289,659,280 |
|
| International Equity Funds - 12.3% | | | |
| Fidelity Series Canada Fund (b) | | 1,550,966 | 15,866,378 |
| Fidelity Series Emerging Markets Fund (b) | | 2,371,118 | 22,359,646 |
| Fidelity Series Emerging Markets Opportunities Fund (b) | | 9,873,549 | 207,147,051 |
| Fidelity Series International Growth Fund (b) | | 2,536,134 | 47,628,592 |
| Fidelity Series International Small Cap Fund (b) | | 813,691 | 14,483,703 |
| Fidelity Series International Value Fund (b) | | 5,428,377 | 46,792,613 |
| Fidelity Series Overseas Fund (b) | | 4,229,723 | 47,288,301 |
| TOTAL INTERNATIONAL EQUITY FUNDS | | | |
| (Cost $312,605,220) | | | 401,566,284 |
|
| Bond Funds - 54.7% | | | |
| Fidelity Series Emerging Markets Debt Fund (b) | | 2,378,630 | 21,550,384 |
| Fidelity Series Floating Rate High Income Fund (b) | | 438,625 | 3,881,827 |
| Fidelity Series High Income Fund (b) | | 2,470,652 | 22,532,345 |
| Fidelity Series Inflation-Protected Bond Index Fund (b) | | 36,514,429 | 390,704,390 |
| Fidelity Series International Credit Fund (b) | | 212,172 | 2,208,714 |
| Fidelity Series Investment Grade Bond Fund (b) | | 102,548,878 | 1,255,198,264 |
| Fidelity Series Long-Term Treasury Bond Index Fund (b) | | 7,204,468 | 74,422,156 |
| Fidelity Series Real Estate Income Fund (b) | | 1,460,271 | 14,573,506 |
| TOTAL BOND FUNDS | | | |
| (Cost $1,597,778,275) | | | 1,785,071,586 |
|
| Short-Term Funds - 24.1% | | | |
| Fidelity Cash Central Fund 0.10% (c) | | 11,362,607 | 11,364,880 |
| Fidelity Series Government Money Market Fund 0.16% (b)(d) | | 619,914,457 | 619,914,457 |
| Fidelity Series Short-Term Credit Fund (b) | | 15,101,657 | 154,791,983 |
| TOTAL SHORT-TERM FUNDS | | | |
| (Cost $781,779,046) | | | 786,071,320 |
| TOTAL INVESTMENT IN SECURITIES - 100.0% | | | |
| (Cost $2,925,760,724) | | | 3,263,538,287 |
| NET OTHER ASSETS (LIABILITIES) - 0.0% | | | (143,920) |
| NET ASSETS - 100% | | | $3,263,394,367 |
| Futures Contracts | | | | | |
| | Number of contracts | Expiration Date | Notional Amount | Value | Unrealized Appreciation/(Depreciation) |
| Purchased | | | | | |
| Equity Index Contracts | | | | | |
| ICE E-mini MSCI EAFE Index Contracts (United States) | 30 | Dec. 2020 | $2,779,800 | $(14,660) | $(14,659) |
| Sold | | | | | |
| Equity Index Contracts | | | | | |
| CME E-mini S&P 500 Index Contracts (United States) | 12 | Dec. 2020 | 2,011,200 | (13,130) | (13,130) |
| ICE E-mini MSCI Emerging Markets Index Contracts (United States) | 7 | Dec. 2020 | 380,975 | (78) | (78) |
|
| TOTAL SOLD | | | | | (13,208) |
|
| TOTAL FUTURES CONTRACTS | | | | | $(27,867) |
The notional amount of futures purchased as a percentage of Net Assets is 0.1%
The notional amount of futures sold as a percentage of Net Assets is 0.1%
Legend
(a) Security or a portion of the security was pledged to cover margin requirements for futures contracts. At period end, the value of securities pledged amounted to $1,169,817.
(b) Affiliated Fund
(c) Affiliated fund that is generally available only to investment companies and other accounts managed by Fidelity Investments. The rate quoted is the annualized seven-day yield of the fund at period end. A complete unaudited listing of the fund's holdings as of its most recent quarter end is available upon request. In addition, each Fidelity Central Fund's financial statements are available on the SEC's website or upon request.
(d) The rate quoted is the annualized seven-day yield of the fund at period end.
Affiliated Central Funds
Information regarding fiscal year to date income earned by the Fund from investments in Fidelity Central Funds is as follows:
| Fund | Income earned |
| Fidelity Cash Central Fund | $7,206 |
| Total | $7,206 |
Affiliated Underlying Funds
Fiscal year to date information regarding the Fund's investments in affiliated Underlying Funds, excluding any Money Market Central Funds, is presented below. Exchanges between classes of the same affiliated Underlying Funds may occur.
| Affiliate | Value, beginning of period | Purchases | Sales Proceeds | Dividend Income | Realized Gain (loss) | Change in Unrealized appreciation (depreciation) | Value, end of period |
| Fidelity Series All-Sector Equity Fund | $6,494,951 | $102,443 | $343,657 | $-- | $12,627 | $2,284,094 | $8,550,458 |
| Fidelity Series Blue Chip Growth Fund | 11,105,865 | 3,737,467 | 4,437,519 | 3,557,336 | 350,390 | 2,878,744 | 13,634,947 |
| Fidelity Series Canada Fund | 11,827,329 | 2,959,476 | 2,227,557 | -- | (296,427) | 3,603,557 | 15,866,378 |
| Fidelity Series Commodity Strategy Fund | 102,478,570 | 2,264,563 | 35,567,095 | 342,127 | (9,980,786) | 20,680,610 | 79,875,862 |
| Fidelity Series Emerging Markets Debt Fund | 19,329,709 | 819,510 | 968,859 | 561,228 | 35,146 | 2,334,878 | 21,550,384 |
| Fidelity Series Emerging Markets Fund | 12,565,775 | 6,744,053 | 2,137,331 | -- | (18,504) | 5,205,653 | 22,359,646 |
| Fidelity Series Emerging Markets Opportunities Fund | 120,401,548 | 62,866,773 | 27,406,289 | -- | 1,956,128 | 49,328,891 | 207,147,051 |
| Fidelity Series Floating Rate High Income Fund | 3,609,083 | 148,316 | 234,401 | 85,829 | (18,520) | 377,349 | 3,881,827 |
| Fidelity Series Government Money Market Fund 0.16% | 649,056,601 | 52,998,462 | 82,140,606 | 753,619 | -- | -- | 619,914,457 |
| Fidelity Series Growth Company Fund | 24,466,624 | 404,121 | 2,432,906 | -- | 1,170,944 | 14,986,965 | 38,595,748 |
| Fidelity Series High Income Fund | 20,608,019 | 921,023 | 1,172,008 | 608,584 | (29,070) | 2,204,381 | 22,532,345 |
| Fidelity Series Inflation-Protected Bond Index Fund | 376,040,169 | 18,962,118 | 27,035,919 | 311,888 | 287,762 | 22,450,260 | 390,704,390 |
| Fidelity Series International Credit Fund | 1,998,296 | 31,055 | -- | 31,056 | -- | 179,363 | 2,208,714 |
| Fidelity Series International Growth Fund | 62,652,637 | 1,033,776 | 30,529,563 | -- | 11,558,862 | 2,912,880 | 47,628,592 |
| Fidelity Series International Small Cap Fund | 15,102,598 | 176,190 | 4,975,046 | -- | 885,767 | 3,294,194 | 14,483,703 |
| Fidelity Series International Value Fund | 52,704,333 | 1,481,330 | 16,850,247 | -- | (1,686,278) | 11,143,475 | 46,792,613 |
| Fidelity Series Intrinsic Opportunities Fund | 22,167,449 | 7,805,548 | 1,385,637 | 444,451 | 90,351 | 5,772,997 | 34,450,708 |
| Fidelity Series Investment Grade Bond Fund | 1,201,348,763 | 63,248,588 | 81,607,127 | 16,089,202 | 926,399 | 71,281,641 | 1,255,198,264 |
| Fidelity Series Large Cap Stock Fund | 19,031,854 | 3,425,275 | 1,218,948 | 785,077 | 141,981 | 3,246,680 | 24,626,842 |
| Fidelity Series Large Cap Value Index Fund | 5,327,585 | 6,077,890 | 1,563,738 | -- | (58,302) | 871,668 | 10,655,103 |
| Fidelity Series Long-Term Treasury Bond Index Fund | 78,105,731 | 8,956,189 | 10,319,668 | 1,971,461 | 1,442,515 | (3,762,611) | 74,422,156 |
| Fidelity Series Opportunistic Insights Fund | 14,481,203 | 207,828 | 691,204 | -- | 219,763 | 5,670,685 | 19,888,275 |
| Fidelity Series Overseas Fund | 47,455,129 | 6,856,272 | 20,472,786 | -- | (1,107,365) | 14,557,051 | 47,288,301 |
| Fidelity Series Real Estate Income Fund | 12,389,359 | 660,921 | 734,654 | 464,931 | (64,731) | 2,322,611 | 14,573,506 |
| Fidelity Series Short-Term Credit Fund | 148,318,154 | 1,706,496 | 769,580 | 1,683,836 | (9,055) | 5,545,968 | 154,791,983 |
| Fidelity Series Small Cap Discovery Fund | 2,485,329 | 250,787 | 175,090 | 9,289 | (11,454) | 889,110 | 3,438,682 |
| Fidelity Series Small Cap Opportunities Fund | 7,816,087 | 2,343,502 | 703,059 | 70,297 | 63,337 | 2,130,288 | 11,650,155 |
| Fidelity Series Stock Selector Large Cap Value Fund | 14,482,220 | 12,571,618 | 4,954,545 | -- | (217,831) | 3,227,676 | 25,109,138 |
| Fidelity Series Value Discovery Fund | 10,290,283 | 9,669,385 | 3,214,984 | -- | (131,847) | 2,570,525 | 19,183,362 |
| | $3,074,141,253 | $279,430,975 | $366,270,023 | $27,770,211 | $5,511,802 | $258,189,583 | $3,251,003,590 |
Amounts in the income column in the above table include any capital gain distributions from underlying funds, which are presented in the corresponding line-item in the Statement of Operations, if applicable.
Investment Valuation
The following is a summary of the inputs used, as of September 30, 2020, involving the Fund's assets and liabilities carried at fair value. The inputs or methodology used for valuing securities may not be an indication of the risk associated with investing in those securities. For more information on valuation inputs, and their aggregation into the levels used below, please refer to the Investment Valuation section in the accompanying Notes to Financial Statements.
| | Valuation Inputs at Reporting Date: |
| Description | Total | Level 1 | Level 2 | Level 3 |
| Investments in Securities: | | | | |
| Other Short-Term Investments | $1,169,817 | $-- | $1,169,817 | $-- |
| Domestic Equity Funds | 289,659,280 | 289,659,280 | -- | -- |
| International Equity Funds | 401,566,284 | 401,566,284 | -- | -- |
| Bond Funds | 1,785,071,586 | 1,785,071,586 | -- | -- |
| Short-Term Funds | 786,071,320 | 786,071,320 | -- | -- |
| Total Investments in Securities: | $3,263,538,287 | $3,262,368,470 | $1,169,817 | $-- |
| Derivative Instruments: | | | | |
| Liabilities | | | | |
| Futures Contracts | $(27,867) | $(27,867) | $-- | $-- |
| Total Liabilities | $(27,867) | $(27,867) | $-- | $-- |
| Total Derivative Instruments: | $(27,867) | $(27,867) | $-- | $-- |
Value of Derivative Instruments
The following table is a summary of the Fund's value of derivative instruments by primary risk exposure as of September 30, 2020. For additional information on derivative instruments, please refer to the Derivative Instruments section in the accompanying Notes to Financial Statements.
| Primary Risk Exposure / Derivative Type | Value |
| | Asset | Liability |
| Equity Risk | | |
| Futures Contracts(a) | $0 | $(27,867) |
| Total Equity Risk | 0 | (27,867) |
| Total Value of Derivatives | $0 | $(27,867) |
(a) Reflects gross cumulative appreciation (depreciation) on futures contracts as presented in the Schedule of Investments. In the Statement of Assets and Liabilities, the period end daily variation margin is included in receivable or payable for daily variation margin on futures contracts, and the net cumulative appreciation (depreciation) is included in Total accumulated earnings (loss).
See accompanying notes which are an integral part of the financial statements.
Fidelity Freedom® Income Fund
Financial Statements
Statement of Assets and Liabilities
| | | September 30, 2020 (Unaudited) |
| Assets | | |
Investment in securities, at value — See accompanying schedule:
Unaffiliated issuers (cost $1,169,794) | $1,169,817 | |
| Fidelity Central Funds (cost $11,365,369) | 11,364,880 | |
| Other affiliated issuers (cost $2,913,225,561) | 3,251,003,590 | |
| Total Investment in Securities (cost $2,925,760,724) | | $3,263,538,287 |
| Receivable for investments sold | | 27,678,148 |
| Receivable for fund shares sold | | 957,066 |
| Distributions receivable from Fidelity Central Funds | | 1,060 |
| Total assets | | 3,292,174,561 |
| Liabilities | | |
| Payable for investments purchased | $24,486,699 | |
| Payable for fund shares redeemed | 2,997,132 | |
| Accrued management fee | 1,208,976 | |
| Payable for daily variation margin on futures contracts | 87,387 | |
| Total liabilities | | 28,780,194 |
| Net Assets | | $3,263,394,367 |
| Net Assets consist of: | | |
| Paid in capital | | $2,918,135,760 |
| Total accumulated earnings (loss) | | 345,258,607 |
| Net Assets | | $3,263,394,367 |
| Net Asset Value and Maximum Offering Price | | |
| Fidelity Freedom Income Fund: | | |
| Net Asset Value, offering price and redemption price per share ($1,959,363,071 ÷ 163,565,319 shares) | | $11.98 |
| Class K: | | |
| Net Asset Value, offering price and redemption price per share ($1,083,198,407 ÷ 90,580,185 shares) | | $11.96 |
| Class K6: | | |
| Net Asset Value, offering price and redemption price per share ($220,832,889 ÷ 18,472,518 shares) | | $11.95 |
See accompanying notes which are an integral part of the financial statements.
Statement of Operations
| | | Six months ended September 30, 2020 (Unaudited) |
| Investment Income | | |
| Dividends: | | |
| Affiliated issuers | | $22,190,517 |
| Interest | | 2,314 |
| Income from Fidelity Central Funds | | 7,206 |
| Total income | | 22,200,037 |
| Expenses | | |
| Management fee | $7,092,983 | |
| Independent trustees' fees and expenses | 4,478 | |
| Total expenses before reductions | 7,097,461 | |
| Expense reductions | (131) | |
| Total expenses after reductions | | 7,097,330 |
| Net investment income (loss) | | 15,102,707 |
| Realized and Unrealized Gain (Loss) | | |
| Net realized gain (loss) on: | | |
| Investment securities: | | |
| Fidelity Central Funds | (605) | |
| Other affiliated issuers | 5,511,802 | |
| Futures contracts | (750,174) | |
| Capital gain distributions from underlying funds: | | |
| Affiliated issuers | 5,579,694 | |
| Total net realized gain (loss) | | 10,340,717 |
| Change in net unrealized appreciation (depreciation) on: | | |
| Investment securities: | | |
| Unaffiliated issuers | (1,297) | |
| Fidelity Central Funds | (530) | |
| Other affiliated issuers | 258,189,583 | |
| Futures contracts | (27,867) | |
| Total change in net unrealized appreciation (depreciation) | | 258,159,889 |
| Net gain (loss) | | 268,500,606 |
| Net increase (decrease) in net assets resulting from operations | | $283,603,313 |
See accompanying notes which are an integral part of the financial statements.
Statement of Changes in Net Assets
| | Six months ended September 30, 2020 (Unaudited) | Year ended March 31, 2020 |
| Increase (Decrease) in Net Assets | | |
| Operations | | |
| Net investment income (loss) | $15,102,707 | $64,598,171 |
| Net realized gain (loss) | 10,340,717 | 74,358,386 |
| Change in net unrealized appreciation (depreciation) | 258,159,889 | (97,093,752) |
| Net increase (decrease) in net assets resulting from operations | 283,603,313 | 41,862,805 |
| Distributions to shareholders | (56,048,579) | (122,580,496) |
| Share transactions - net increase (decrease) | (51,467,828) | (214,194,891) |
| Total increase (decrease) in net assets | 176,086,906 | (294,912,582) |
| Net Assets | | |
| Beginning of period | 3,087,307,461 | 3,382,220,043 |
| End of period | $3,263,394,367 | $3,087,307,461 |
See accompanying notes which are an integral part of the financial statements.
Financial Highlights
Fidelity Freedom Income Fund
| | Six months ended (Unaudited) September 30, | Years endedMarch 31, | | | | |
| | 2020 | 2020 | 2019 | 2018 | 2017 | 2016 |
| Selected Per–Share Data | | | | | | |
| Net asset value, beginning of period | $11.15 | $11.44 | $11.69 | $11.57 | $11.26 | $11.75 |
| Income from Investment Operations | | | | | | |
| Net investment income (loss)A | .05 | .22 | .23 | .18 | .19 | .21 |
| Net realized and unrealized gain (loss) | .98 | (.09) | .11 | .38 | .49 | (.27) |
| Total from investment operations | 1.03 | .13 | .34 | .56 | .68 | (.06) |
| Distributions from net investment income | (.06) | (.23) | (.23) | (.19) | (.20)B | (.21) |
| Distributions from net realized gain | (.15) | (.20) | (.36) | (.25) | (.17)B | (.22) |
| Total distributions | (.20)C | (.42)C | (.59) | (.44) | (.37) | (.43) |
| Net asset value, end of period | $11.98 | $11.15 | $11.44 | $11.69 | $11.57 | $11.26 |
| Total ReturnD,E | 9.36% | 1.05% | 3.08% | 4.86% | 6.16% | (.45)% |
| Ratios to Average Net AssetsF,G | | | | | | |
| Expenses before reductions | .47%H | .47% | .46%I | .39% | - %J | - %J |
| Expenses net of fee waivers, if any | .47%H | .47% | .46%I | .39% | -% | -% |
| Expenses net of all reductions | .47%H | .47% | .46%I | .39% | -% | -% |
| Net investment income (loss) | .92%H | 1.90% | 2.02% | 1.57% | 1.70% | 1.86% |
| Supplemental Data | | | | | | |
| Net assets, end of period (000 omitted) | $1,959,363 | $1,839,153 | $1,978,263 | $2,111,741 | $2,137,752 | $2,184,994 |
| Portfolio turnover rateK | 17%H | 17% | 22% | 17%L | 31% | 20% |
A Calculated based on average shares outstanding during the period.
B The amounts shown reflect certain reclassifications related to book to tax differences that were made in the year shown.
C Total distributions per share do not sum due to rounding.
D Total returns for periods of less than one year are not annualized.
E Total returns would have been lower if certain expenses had not been reduced during the applicable periods shown.
F Fees and expenses of any underlying mutual funds or exchange-traded funds (ETFs) are not included in the Fund's expense ratio. The Fund indirectly bears its proportionate share of these expenses. For additional expense information related to investments in Fidelity Central Funds, please refer to the "Investments in Fidelity Central Funds" note found in the Notes to Financial Statements section of the most recent Annual or Semi-Annual report.
G Expense ratios reflect operating expenses of the class. Expenses before reductions do not reflect amounts reimbursed, waived, or reduced through arrangements with the investment adviser, brokerage services, or other offset arrangements, if applicable, and do not represent the amount paid by the class during periods when reimbursements, waivers or reductions occur.
H Annualized
I On certain classes, the size and fluctuation of net assets and expense amounts may cause ratios to differ from contractual rates.
J Amount represents less than .005%.
K Amount does not include the portfolio activity of any underlying mutual funds or exchange-traded funds (ETFs).
L The portfolio turnover rate does not include the assets acquired in the merger.
See accompanying notes which are an integral part of the financial statements.
Fidelity Freedom Income Fund Class K
| | Six months ended (Unaudited) September 30, | Years endedMarch 31, | | |
| | 2020 | 2020 | 2019 | 2018 A |
| Selected Per–Share Data | | | | |
| Net asset value, beginning of period | $11.13 | $11.42 | $11.68 | $11.76 |
| Income from Investment Operations | | | | |
| Net investment income (loss)B | .06 | .23 | .24 | .19 |
| Net realized and unrealized gain (loss) | .98 | (.09) | .09 | .05 |
| Total from investment operations | 1.04 | .14 | .33 | .24 |
| Distributions from net investment income | (.06) | (.23) | (.24) | (.16) |
| Distributions from net realized gain | (.15) | (.20) | (.36) | (.17) |
| Total distributions | (.21) | (.43) | (.59)C | (.32)C |
| Net asset value, end of period | $11.96 | $11.13 | $11.42 | $11.68 |
| Total ReturnD,E | 9.42% | 1.12% | 3.04% | 2.06% |
| Ratios to Average Net AssetsF,G | | | | |
| Expenses before reductions | .42%H | .41% | .41%I | .42%H |
| Expenses net of fee waivers, if any | .42%H | .41% | .41%I | .42%H |
| Expenses net of all reductions | .42%H | .41% | .41%I | .42%H |
| Net investment income (loss) | .97%H | 1.95% | 2.07% | 2.32%H |
| Supplemental Data | | | | |
| Net assets, end of period (000 omitted) | $1,083,198 | $1,048,404 | $1,236,535 | $1,568,576 |
| Portfolio turnover rateJ | 17%H | 17% | 22% | 17%K |
A For the period July 20, 2017 (commencement of sale of shares) to March 31, 2018.
B Calculated based on average shares outstanding during the period.
C Total distributions per share do not sum due to rounding.
D Total returns for periods of less than one year are not annualized.
E Total returns would have been lower if certain expenses had not been reduced during the applicable periods shown.
F Fees and expenses of any underlying mutual funds or exchange-traded funds (ETFs) are not included in the Fund's expense ratio. The Fund indirectly bears its proportionate share of these expenses. For additional expense information related to investments in Fidelity Central Funds, please refer to the "Investments in Fidelity Central Funds" note found in the Notes to Financial Statements section of the most recent Annual or Semi-Annual report.
G Expense ratios reflect operating expenses of the class. Expenses before reductions do not reflect amounts reimbursed, waived, or reduced through arrangements with the investment adviser, brokerage services, or other offset arrangements, if applicable, and do not represent the amount paid by the class during periods when reimbursements, waivers or reductions occur.
H Annualized
I On certain classes, the size and fluctuation of net assets and expense amounts may cause ratios to differ from contractual rates.
J Amount does not include the portfolio activity of any underlying mutual funds or exchange-traded funds (ETFs).
K The portfolio turnover rate does not include the assets acquired in the merger.
See accompanying notes which are an integral part of the financial statements.
Fidelity Freedom Income Fund Class K6
| | Six months ended (Unaudited) September 30, | Years endedMarch 31, | | |
| | 2020 | 2020 | 2019 | 2018 A |
| Selected Per–Share Data | | | | |
| Net asset value, beginning of period | $11.13 | $11.42 | $11.68 | $11.68 |
| Income from Investment Operations | | | | |
| Net investment income (loss)B | .06 | .23 | .24 | .18 |
| Net realized and unrealized gain (loss) | .97 | (.08) | .11 | .15 |
| Total from investment operations | 1.03 | .15 | .35 | .33 |
| Distributions from net investment income | (.06) | (.24) | (.25) | (.17) |
| Distributions from net realized gain | (.15) | (.20) | (.36) | (.17) |
| Total distributions | (.21) | (.44) | (.61) | (.33)C |
| Net asset value, end of period | $11.95 | $11.13 | $11.42 | $11.68 |
| Total ReturnD,E | 9.35% | 1.18% | 3.16% | 2.86% |
| Ratios to Average Net AssetsF,G | | | | |
| Expenses before reductions | .37%H | .37% | .37% | .37%H |
| Expenses net of fee waivers, if any | .37%H | .37% | .37% | .37%H |
| Expenses net of all reductions | .37%H | .37% | .37% | .37%H |
| Net investment income (loss) | 1.02%H | 2.00% | 2.12% | 1.91%H |
| Supplemental Data | | | | |
| Net assets, end of period (000 omitted) | $220,833 | $199,750 | $167,422 | $39,253 |
| Portfolio turnover rateI | 17%H | 17% | 22% | 17%J |
A For the period June 7, 2017 (commencement of sale of shares) to March 31, 2018.
B Calculated based on average shares outstanding during the period.
C Total distributions per share do not sum due to rounding.
D Total returns for periods of less than one year are not annualized.
E Total returns would have been lower if certain expenses had not been reduced during the applicable periods shown.
F Fees and expenses of any underlying mutual funds or exchange-traded funds (ETFs) are not included in the Fund's expense ratio. The Fund indirectly bears its proportionate share of these expenses. For additional expense information related to investments in Fidelity Central Funds, please refer to the "Investments in Fidelity Central Funds" note found in the Notes to Financial Statements section of the most recent Annual or Semi-Annual report.
G Expense ratios reflect operating expenses of the class. Expenses before reductions do not reflect amounts reimbursed, waived, or reduced through arrangements with the investment adviser, brokerage services, or other offset arrangements, if applicable, and do not represent the amount paid by the class during periods when reimbursements, waivers or reductions occur.
H Annualized
I Amount does not include the portfolio activity of any underlying mutual funds or exchange-traded funds (ETFs).
J The portfolio turnover rate does not include the assets acquired in the merger.
See accompanying notes which are an integral part of the financial statements.
Fidelity Freedom® 2005 Fund
Investment Summary (Unaudited)
The information in the following tables is based on the direct investments of the Fund.
Top Holdings as of September 30, 2020
| | % of fund's net assets |
| Fidelity Series Investment Grade Bond Fund | 36.7 |
| Fidelity Series Government Money Market Fund 0.16% | 17.2 |
| Fidelity Series Inflation-Protected Bond Index Fund | 11.1 |
| Fidelity Series Emerging Markets Opportunities Fund | 6.9 |
| Fidelity Series Short-Term Credit Fund | 4.0 |
| Fidelity Series Commodity Strategy Fund | 2.4 |
| Fidelity Series Long-Term Treasury Bond Index Fund | 2.3 |
| Fidelity Series International Growth Fund | 1.9 |
| Fidelity Series Overseas Fund | 1.9 |
| Fidelity Series International Value Fund | 1.8 |
| | 86.2 |
Asset Allocation (% of fund's net assets)
| Period end |
| | Domestic Equity Funds | 12.1% |
| | International Equity Funds | 14.4% |
| | Bond Funds | 52.0% |
| | Short-Term Funds | 21.4% |
| | Short-Term Investments | 0.1% |

Domestic Equity Funds category includes Fidelity Series Commodity Strategy Fund which invests in commodity-related investments.
Fidelity Freedom® 2005 Fund
Schedule of Investments September 30, 2020 (Unaudited)
Showing Percentage of Net Assets
| U.S. Treasury Obligations - 0.1% | | | |
| | | Principal Amount | Value |
| U.S. Treasury Bills, yield at date of purchase 0.09% to 0.11% 11/5/20 to 12/3/20 (a) | | | |
| (Cost $1,219,787) | | 1,220,000 | 1,219,790 |
| | | Shares | Value |
|
| Domestic Equity Funds - 12.1% | | | |
| Fidelity Series All-Sector Equity Fund (b) | | 398,816 | $4,247,387 |
| Fidelity Series Blue Chip Growth Fund (b) | | 392,481 | 6,479,862 |
| Fidelity Series Commodity Strategy Fund (b) | | 6,092,288 | 25,343,916 |
| Fidelity Series Growth Company Fund (b) | | 631,002 | 16,538,563 |
| Fidelity Series Intrinsic Opportunities Fund (b) | | 1,046,277 | 16,552,109 |
| Fidelity Series Large Cap Stock Fund (b) | | 969,530 | 13,728,546 |
| Fidelity Series Large Cap Value Index Fund (b) | | 437,154 | 5,070,990 |
| Fidelity Series Opportunistic Insights Fund (b) | | 456,515 | 9,874,414 |
| Fidelity Series Small Cap Discovery Fund (b) | | 176,775 | 1,787,195 |
| Fidelity Series Small Cap Opportunities Fund (b) | | 445,500 | 5,684,585 |
| Fidelity Series Stock Selector Large Cap Value Fund (b) | | 1,086,305 | 11,949,352 |
| Fidelity Series Value Discovery Fund (b) | | 738,590 | 9,128,974 |
| TOTAL DOMESTIC EQUITY FUNDS | | | |
| (Cost $99,731,755) | | | 126,385,893 |
|
| International Equity Funds - 14.4% | | | |
| Fidelity Series Canada Fund (b) | | 638,565 | 6,532,517 |
| Fidelity Series Emerging Markets Fund (b) | | 829,187 | 7,819,234 |
| Fidelity Series Emerging Markets Opportunities Fund (b) | | 3,417,910 | 71,707,762 |
| Fidelity Series International Growth Fund (b) | | 1,043,787 | 19,602,319 |
| Fidelity Series International Small Cap Fund (b) | | 334,843 | 5,960,203 |
| Fidelity Series International Value Fund (b) | | 2,207,116 | 19,025,342 |
| Fidelity Series Overseas Fund (b) | | 1,740,896 | 19,463,217 |
| TOTAL INTERNATIONAL EQUITY FUNDS | | | |
| (Cost $118,729,044) | | | 150,110,594 |
|
| Bond Funds - 52.0% | | | |
| Fidelity Series Emerging Markets Debt Fund (b) | | 749,898 | 6,794,074 |
| Fidelity Series Floating Rate High Income Fund (b) | | 185,073 | 1,637,895 |
| Fidelity Series High Income Fund (b) | | 795,695 | 7,256,738 |
| Fidelity Series Inflation-Protected Bond Index Fund (b) | | 10,809,525 | 115,661,914 |
| Fidelity Series International Credit Fund (b) | | 57,794 | 601,635 |
| Fidelity Series Investment Grade Bond Fund (b) | | 31,312,845 | 383,269,229 |
| Fidelity Series Long-Term Treasury Bond Index Fund (b) | | 2,307,682 | 23,838,357 |
| Fidelity Series Real Estate Income Fund (b) | | 464,539 | 4,636,095 |
| TOTAL BOND FUNDS | | | |
| (Cost $504,564,286) | | | 543,695,937 |
|
| Short-Term Funds - 21.4% | | | |
| Fidelity Cash Central Fund 0.10% (c) | | 2,337,457 | 2,337,925 |
| Fidelity Series Government Money Market Fund 0.16% (b)(d) | | 180,172,130 | 180,172,130 |
| Fidelity Series Short-Term Credit Fund (b) | | 4,063,811 | 41,654,066 |
| TOTAL SHORT-TERM FUNDS | | | |
| (Cost $223,087,039) | | | 224,164,121 |
| TOTAL INVESTMENT IN SECURITIES - 100.0% | | | |
| (Cost $947,331,911) | | | 1,045,576,335 |
| NET OTHER ASSETS (LIABILITIES) - 0.0% | | | (16,733) |
| NET ASSETS - 100% | | | $1,045,559,602 |
| Futures Contracts | | | | | |
| | Number of contracts | Expiration Date | Notional Amount | Value | Unrealized Appreciation/(Depreciation) |
| Purchased | | | | | |
| Equity Index Contracts | | | | | |
| ICE E-mini MSCI EAFE Index Contracts (United States) | 8 | Dec. 2020 | $741,280 | $(7,639) | $(7,638) |
| ICE E-mini MSCI Emerging Markets Index Contracts (United States) | 5 | Dec. 2020 | 272,125 | (112) | (112) |
|
| TOTAL PURCHASED | | | | | (7,750) |
|
| Sold | | | | | |
| Equity Index Contracts | | | | | |
| CME E-mini S&P 500 Index Contracts (United States) | 13 | Dec. 2020 | 2,178,800 | (14,224) | (14,224) |
| TOTAL FUTURES CONTRACTS | | | | | $(21,974) |
The notional amount of futures purchased as a percentage of Net Assets is 0.1%
The notional amount of futures sold as a percentage of Net Assets is 0.2%
Legend
(a) Security or a portion of the security was pledged to cover margin requirements for futures contracts. At period end, the value of securities pledged amounted to $894,847.
(b) Affiliated Fund
(c) Affiliated fund that is generally available only to investment companies and other accounts managed by Fidelity Investments. The rate quoted is the annualized seven-day yield of the fund at period end. A complete unaudited listing of the fund's holdings as of its most recent quarter end is available upon request. In addition, each Fidelity Central Fund's financial statements are available on the SEC's website or upon request.
(d) The rate quoted is the annualized seven-day yield of the fund at period end.
Affiliated Central Funds
Information regarding fiscal year to date income earned by the Fund from investments in Fidelity Central Funds is as follows:
| Fund | Income earned |
| Fidelity Cash Central Fund | $2,042 |
| Total | $2,042 |
Affiliated Underlying Funds
Fiscal year to date information regarding the Fund's investments in affiliated Underlying Funds, excluding any Money Market Central Funds, is presented below. Exchanges between classes of the same affiliated Underlying Funds may occur.
| Affiliate | Value, beginning of period | Purchases | Sales Proceeds | Dividend Income | Realized Gain (loss) | Change in Unrealized appreciation (depreciation) | Value, end of period |
| Fidelity Series All-Sector Equity Fund | $3,341,429 | $167,742 | $409,894 | $-- | $(60,468) | $1,208,578 | $4,247,387 |
| Fidelity Series Blue Chip Growth Fund | 5,848,737 | 1,736,850 | 3,117,652 | 1,443,750 | 1,083,882 | 928,045 | 6,479,862 |
| Fidelity Series Canada Fund | 4,425,852 | 1,461,686 | 659,494 | -- | (55,281) | 1,359,754 | 6,532,517 |
| Fidelity Series Commodity Strategy Fund | 31,075,670 | 1,192,118 | 10,289,160 | 109,015 | (4,630,943) | 7,996,231 | 25,343,916 |
| Fidelity Series Emerging Markets Debt Fund | 5,874,966 | 456,155 | 268,028 | 173,911 | 5,809 | 725,172 | 6,794,074 |
| Fidelity Series Emerging Markets Fund | 4,422,703 | 2,326,076 | 732,419 | -- | (6,763) | 1,809,637 | 7,819,234 |
| Fidelity Series Emerging Markets Opportunities Fund | 41,341,535 | 21,528,169 | 8,935,488 | -- | 470,390 | 17,303,156 | 71,707,762 |
| Fidelity Series Floating Rate High Income Fund | 1,452,141 | 103,718 | 64,845 | 35,433 | (1,185) | 148,066 | 1,637,895 |
| Fidelity Series Government Money Market Fund 0.16% | 175,058,964 | 28,692,010 | 23,578,844 | 208,709 | -- | -- | 180,172,130 |
| Fidelity Series Growth Company Fund | 12,367,976 | 650,497 | 4,750,472 | -- | 2,508,648 | 5,761,914 | 16,538,563 |
| Fidelity Series High Income Fund | 6,364,947 | 533,608 | 324,228 | 192,184 | 1,321 | 681,090 | 7,256,738 |
| Fidelity Series Inflation-Protected Bond Index Fund | 104,045,608 | 11,447,428 | 6,300,850 | 88,698 | 55,873 | 6,413,855 | 115,661,914 |
| Fidelity Series International Credit Fund | 544,319 | 8,459 | -- | 8,459 | -- | 48,857 | 601,635 |
| Fidelity Series International Growth Fund | 24,530,106 | 830,474 | 11,542,246 | -- | 3,681,097 | 2,102,888 | 19,602,319 |
| Fidelity Series International Small Cap Fund | 5,821,515 | 254,806 | 1,793,154 | -- | 249,871 | 1,427,165 | 5,960,203 |
| Fidelity Series International Value Fund | 20,154,683 | 1,100,580 | 6,036,563 | -- | (944,051) | 4,750,693 | 19,025,342 |
| Fidelity Series Intrinsic Opportunities Fund | 12,720,680 | 1,334,287 | 648,255 | 225,635 | 22,828 | 3,122,569 | 16,552,109 |
| Fidelity Series Investment Grade Bond Fund | 347,158,396 | 39,323,101 | 24,304,716 | 4,767,206 | (10,175) | 21,102,623 | 383,269,229 |
| Fidelity Series Large Cap Stock Fund | 11,191,527 | 1,085,910 | 566,086 | 474,629 | 11,149 | 2,006,046 | 13,728,546 |
| Fidelity Series Large Cap Value Index Fund | 3,132,969 | 1,972,430 | 597,959 | -- | (20,189) | 583,739 | 5,070,990 |
| Fidelity Series Long-Term Treasury Bond Index Fund | 23,764,173 | 3,989,730 | 3,191,374 | 607,362 | 425,528 | (1,149,700) | 23,838,357 |
| Fidelity Series Opportunistic Insights Fund | 6,975,934 | 341,979 | 316,619 | -- | 14,439 | 2,858,681 | 9,874,414 |
| Fidelity Series Overseas Fund | 18,649,964 | 2,816,858 | 7,371,486 | -- | (397,245) | 5,765,126 | 19,463,217 |
| Fidelity Series Real Estate Income Fund | 3,778,313 | 359,746 | 203,181 | 145,789 | 1,450 | 699,767 | 4,636,095 |
| Fidelity Series Short-Term Credit Fund | 39,788,012 | 619,584 | 243,800 | 453,096 | (1,721) | 1,491,991 | 41,654,066 |
| Fidelity Series Small Cap Discovery Fund | 1,388,092 | 80,925 | 167,447 | 4,992 | 3,638 | 481,987 | 1,787,195 |
| Fidelity Series Small Cap Opportunities Fund | 4,596,747 | 286,668 | 344,783 | 34,037 | (4,745) | 1,150,698 | 5,684,585 |
| Fidelity Series Stock Selector Large Cap Value Fund | 8,517,312 | 3,641,950 | 1,972,393 | -- | (77,469) | 1,839,952 | 11,949,352 |
| Fidelity Series Value Discovery Fund | 6,051,852 | 2,898,650 | 1,245,092 | -- | (41,432) | 1,464,996 | 9,128,974 |
| | $934,385,122 | $131,242,194 | $119,976,528 | $8,972,905 | $2,284,256 | $94,083,576 | $1,042,018,620 |
Amounts in the income column in the above table include any capital gain distributions from underlying funds, which are presented in the corresponding line-item in the Statement of Operations, if applicable.
Investment Valuation
The following is a summary of the inputs used, as of September 30, 2020, involving the Fund's assets and liabilities carried at fair value. The inputs or methodology used for valuing securities may not be an indication of the risk associated with investing in those securities. For more information on valuation inputs, and their aggregation into the levels used below, please refer to the Investment Valuation section in the accompanying Notes to Financial Statements.
| | Valuation Inputs at Reporting Date: |
| Description | Total | Level 1 | Level 2 | Level 3 |
| Investments in Securities: | | | | |
| Other Short-Term Investments | $1,219,790 | $-- | $1,219,790 | $-- |
| Domestic Equity Funds | 126,385,893 | 126,385,893 | -- | -- |
| International Equity Funds | 150,110,594 | 150,110,594 | -- | -- |
| Bond Funds | 543,695,937 | 543,695,937 | -- | -- |
| Short-Term Funds | 224,164,121 | 224,164,121 | -- | -- |
| Total Investments in Securities: | $1,045,576,335 | $1,044,356,545 | $1,219,790 | $-- |
| Derivative Instruments: | | | | |
| Liabilities | | | | |
| Futures Contracts | $(21,974) | $(21,974) | $-- | $-- |
| Total Liabilities | $(21,974) | $(21,974) | $-- | $-- |
| Total Derivative Instruments: | $(21,974) | $(21,974) | $-- | $-- |
Value of Derivative Instruments
The following table is a summary of the Fund's value of derivative instruments by primary risk exposure as of September 30, 2020. For additional information on derivative instruments, please refer to the Derivative Instruments section in the accompanying Notes to Financial Statements.
| Primary Risk Exposure / Derivative Type | Value |
| | Asset | Liability |
| Equity Risk | | |
| Futures Contracts(a) | $0 | $(21,974) |
| Total Equity Risk | 0 | (21,974) |
| Total Value of Derivatives | $0 | $(21,974) |
(a) Reflects gross cumulative appreciation (depreciation) on futures contracts as presented in the Schedule of Investments. In the Statement of Assets and Liabilities, the period end daily variation margin is included in receivable or payable for daily variation margin on futures contracts, and the net cumulative appreciation (depreciation) is included in Total accumulated earnings (loss).
See accompanying notes which are an integral part of the financial statements.
Fidelity Freedom® 2005 Fund
Financial Statements
Statement of Assets and Liabilities
| | | September 30, 2020 (Unaudited) |
| Assets | | |
Investment in securities, at value — See accompanying schedule:
Unaffiliated issuers (cost $1,219,787) | $1,219,790 | |
| Fidelity Central Funds (cost $2,337,925) | 2,337,925 | |
| Other affiliated issuers (cost $943,774,199) | 1,042,018,620 | |
| Total Investment in Securities (cost $947,331,911) | | $1,045,576,335 |
| Cash | | 35,141 |
| Receivable for investments sold | | 10,151,038 |
| Receivable for fund shares sold | | 1,050,379 |
| Distributions receivable from Fidelity Central Funds | | 218 |
| Total assets | | 1,056,813,111 |
| Liabilities | | |
| Payable for investments purchased | $10,243,560 | |
| Payable for fund shares redeemed | 593,602 | |
| Accrued management fee | 382,470 | |
| Payable for daily variation margin on futures contracts | 33,877 | |
| Total liabilities | | 11,253,509 |
| Net Assets | | $1,045,559,602 |
| Net Assets consist of: | | |
| Paid in capital | | $941,840,486 |
| Total accumulated earnings (loss) | | 103,719,116 |
| Net Assets | | $1,045,559,602 |
| Net Asset Value and Maximum Offering Price | | |
| Fidelity Freedom 2005 Fund: | | |
| Net Asset Value, offering price and redemption price per share ($585,394,043 ÷ 45,916,801 shares) | | $12.75 |
| Class K: | | |
| Net Asset Value, offering price and redemption price per share ($375,915,264 ÷ 29,531,705 shares) | | $12.73 |
| Class K6: | | |
| Net Asset Value, offering price and redemption price per share ($84,250,295 ÷ 6,630,992 shares) | | $12.71 |
See accompanying notes which are an integral part of the financial statements.
Statement of Operations
| | | Six months ended September 30, 2020 (Unaudited) |
| Investment Income | | |
| Dividends: | | |
| Affiliated issuers | | $6,783,228 |
| Interest | | 1,042 |
| Income from Fidelity Central Funds | | 2,042 |
| Total income | | 6,786,312 |
| Expenses | | |
| Management fee | $2,212,601 | |
| Independent trustees' fees and expenses | 1,382 | |
| Total expenses before reductions | 2,213,983 | |
| Expense reductions | (102) | |
| Total expenses after reductions | | 2,213,881 |
| Net investment income (loss) | | 4,572,431 |
| Realized and Unrealized Gain (Loss) | | |
| Net realized gain (loss) on: | | |
| Investment securities: | | |
| Fidelity Central Funds | (272) | |
| Other affiliated issuers | 2,284,256 | |
| Futures contracts | (372,017) | |
| Capital gain distributions from underlying funds: | | |
| Affiliated issuers | 2,189,677 | |
| Total net realized gain (loss) | | 4,101,644 |
| Change in net unrealized appreciation (depreciation) on: | | |
| Investment securities: | | |
| Unaffiliated issuers | (685) | |
| Fidelity Central Funds | (42) | |
| Other affiliated issuers | 94,083,576 | |
| Futures contracts | (21,974) | |
| Total change in net unrealized appreciation (depreciation) | | 94,060,875 |
| Net gain (loss) | | 98,162,519 |
| Net increase (decrease) in net assets resulting from operations | | $102,734,950 |
See accompanying notes which are an integral part of the financial statements.
Statement of Changes in Net Assets
| | Six months ended September 30, 2020 (Unaudited) | Year ended March 31, 2020 |
| Increase (Decrease) in Net Assets | | |
| Operations | | |
| Net investment income (loss) | $4,572,431 | $18,665,641 |
| Net realized gain (loss) | 4,101,644 | 25,639,455 |
| Change in net unrealized appreciation (depreciation) | 94,060,875 | (42,129,928) |
| Net increase (decrease) in net assets resulting from operations | 102,734,950 | 2,175,168 |
| Distributions to shareholders | (15,998,424) | (44,000,478) |
| Share transactions - net increase (decrease) | 20,502,958 | 18,264,976 |
| Total increase (decrease) in net assets | 107,239,484 | (23,560,334) |
| Net Assets | | |
| Beginning of period | 938,320,118 | 961,880,452 |
| End of period | $1,045,559,602 | $938,320,118 |
See accompanying notes which are an integral part of the financial statements.
Financial Highlights
Fidelity Freedom 2005 Fund
| | Six months ended (Unaudited) September 30, | Years endedMarch 31, | | | | |
| | 2020 | 2020 | 2019 | 2018 | 2017 | 2016 |
| Selected Per–Share Data | | | | | | |
| Net asset value, beginning of period | $11.68 | $12.20 | $12.50 | $12.20 | $11.66 | $12.24 |
| Income from Investment Operations | | | | | | |
| Net investment income (loss)A | .05 | .23 | .24 | .19 | .20 | .22 |
| Net realized and unrealized gain (loss) | 1.22 | (.19) | .11 | .59 | .71 | (.34) |
| Total from investment operations | 1.27 | .04 | .35 | .78 | .91 | (.12) |
| Distributions from net investment income | (.03) | (.24) | (.24) | (.18) | (.22)B | (.22) |
| Distributions from net realized gain | (.17) | (.31) | (.41) | (.30) | (.15)B | (.23) |
| Total distributions | (.20) | (.56)C | (.65) | (.48) | (.37) | (.46)C |
| Net asset value, end of period | $12.75 | $11.68 | $12.20 | $12.50 | $12.20 | $11.66 |
| Total ReturnD,E | 10.97% | .12% | 3.03% | 6.43% | 7.91% | (1.01)% |
| Ratios to Average Net AssetsF,G | | | | | | |
| Expenses before reductions | .46%H,I | .47% | .48% | .41% | - %J | - %J |
| Expenses net of fee waivers, if any | .46%H,I | .47% | .48% | .41% | -% | -% |
| Expenses net of all reductions | .46%H,I | .47% | .48% | .41% | -% | -% |
| Net investment income (loss) | .88%H | 1.89% | 1.98% | 1.52% | 1.70% | 1.87% |
| Supplemental Data | | | | | | |
| Net assets, end of period (000 omitted) | $585,394 | $530,872 | $563,036 | $590,056 | $583,754 | $580,726 |
| Portfolio turnover rateK | 24%H | 24% | 26% | 23%L | 31% | 22% |
A Calculated based on average shares outstanding during the period.
B The amounts shown reflect certain reclassifications related to book to tax differences that were made in the year shown.
C Total distributions per share do not sum due to rounding.
D Total returns for periods of less than one year are not annualized.
E Total returns would have been lower if certain expenses had not been reduced during the applicable periods shown.
F Fees and expenses of any underlying mutual funds or exchange-traded funds (ETFs) are not included in the Fund's expense ratio. The Fund indirectly bears its proportionate share of these expenses. For additional expense information related to investments in Fidelity Central Funds, please refer to the "Investments in Fidelity Central Funds" note found in the Notes to Financial Statements section of the most recent Annual or Semi-Annual report.
G Expense ratios reflect operating expenses of the class. Expenses before reductions do not reflect amounts reimbursed, waived, or reduced through arrangements with the investment adviser, brokerage services, or other offset arrangements, if applicable, and do not represent the amount paid by the class during periods when reimbursements, waivers or reductions occur.
H Annualized
I On certain classes, the size and fluctuation of net assets and expense amounts may cause ratios to differ from contractual rates.
J Amount represents less than .005%.
K Amount does not include the portfolio activity of any underlying mutual funds or exchange-traded funds (ETFs).
L The portfolio turnover rate does not include the assets acquired in the merger.
See accompanying notes which are an integral part of the financial statements.
Fidelity Freedom 2005 Fund Class K
| | Six months ended (Unaudited) September 30, | Years endedMarch 31, | | |
| | 2020 | 2020 | 2019 | 2018 A |
| Selected Per–Share Data | | | | |
| Net asset value, beginning of period | $11.66 | $12.18 | $12.49 | $12.48 |
| Income from Investment Operations | | | | |
| Net investment income (loss)B | .06 | .24 | .25 | .21 |
| Net realized and unrealized gain (loss) | 1.21 | (.19) | .10 | .15 |
| Total from investment operations | 1.27 | .05 | .35 | .36 |
| Distributions from net investment income | (.04) | (.25) | (.24) | (.16) |
| Distributions from net realized gain | (.17) | (.31) | (.41) | (.19) |
| Total distributions | (.20)C | (.57)C | (.66)C | (.35) |
| Net asset value, end of period | $12.73 | $11.66 | $12.18 | $12.49 |
| Total ReturnD,E | 11.02% | .18% | 3.00% | 2.89% |
| Ratios to Average Net AssetsF,G | | | | |
| Expenses before reductions | .41%H,I | .42% | .43% | .44%H |
| Expenses net of fee waivers, if any | .41%H,I | .42% | .43% | .44%H |
| Expenses net of all reductions | .41%H,I | .42% | .43% | .44%H |
| Net investment income (loss) | .93%H | 1.94% | 2.03% | 2.37%H |
| Supplemental Data | | | | |
| Net assets, end of period (000 omitted) | $375,915 | $338,902 | $357,174 | $422,622 |
| Portfolio turnover rateJ | 24%H | 24% | 26% | 23%K |
A For the period July 20, 2017 (commencement of sale of shares) to March 31, 2018.
B Calculated based on average shares outstanding during the period.
C Total distributions per share do not sum due to rounding.
D Total returns for periods of less than one year are not annualized.
E Total returns would have been lower if certain expenses had not been reduced during the applicable periods shown.
F Fees and expenses of any underlying mutual funds or exchange-traded funds (ETFs) are not included in the Fund's expense ratio. The Fund indirectly bears its proportionate share of these expenses. For additional expense information related to investments in Fidelity Central Funds, please refer to the "Investments in Fidelity Central Funds" note found in the Notes to Financial Statements section of the most recent Annual or Semi-Annual report.
G Expense ratios reflect operating expenses of the class. Expenses before reductions do not reflect amounts reimbursed, waived, or reduced through arrangements with the investment adviser, brokerage services, or other offset arrangements, if applicable, and do not represent the amount paid by the class during periods when reimbursements, waivers or reductions occur.
H Annualized
I On certain classes, the size and fluctuation of net assets and expense amounts may cause ratios to differ from contractual rates.
J Amount does not include the portfolio activity of any underlying mutual funds or exchange-traded funds (ETFs).
K The portfolio turnover rate does not include the assets acquired in the merger.
See accompanying notes which are an integral part of the financial statements.
Fidelity Freedom 2005 Fund Class K6
| | Six months ended (Unaudited) September 30, | Years endedMarch 31, | | |
| | 2020 | 2020 | 2019 | 2018 A |
| Selected Per–Share Data | | | | |
| Net asset value, beginning of period | $11.64 | $12.17 | $12.49 | $12.36 |
| Income from Investment Operations | | | | |
| Net investment income (loss)B | .06 | .25 | .25 | .20 |
| Net realized and unrealized gain (loss) | 1.21 | (.20) | .11 | .29 |
| Total from investment operations | 1.27 | .05 | .36 | .49 |
| Distributions from net investment income | (.04) | (.27) | (.27) | (.16) |
| Distributions from net realized gain | (.17) | (.31) | (.41) | (.19) |
| Total distributions | (.20)C | (.58) | (.68) | (.36)C |
| Net asset value, end of period | $12.71 | $11.64 | $12.17 | $12.49 |
| Total ReturnD,E | 11.05% | .22% | 3.15% | 3.92% |
| Ratios to Average Net AssetsF,G | | | | |
| Expenses before reductions | .36%H,I | .37% | .38%I | .38%H |
| Expenses net of fee waivers, if any | .36%H,I | .37% | .38%I | .38%H |
| Expenses net of all reductions | .36%H,I | .37% | .38%I | .38%H |
| Net investment income (loss) | .98%H | 1.99% | 2.08% | 1.93%H |
| Supplemental Data | | | | |
| Net assets, end of period (000 omitted) | $84,250 | $68,546 | $41,670 | $9,983 |
| Portfolio turnover rateJ | 24%H | 24% | 26% | 23%K |
A For the period June 7, 2017 (commencement of sale of shares) to March 31, 2018.
B Calculated based on average shares outstanding during the period.
C Total distributions per share do not sum due to rounding.
D Total returns for periods of less than one year are not annualized.
E Total returns would have been lower if certain expenses had not been reduced during the applicable periods shown.
F Fees and expenses of any underlying mutual funds or exchange-traded funds (ETFs) are not included in the Fund's expense ratio. The Fund indirectly bears its proportionate share of these expenses. For additional expense information related to investments in Fidelity Central Funds, please refer to the "Investments in Fidelity Central Funds" note found in the Notes to Financial Statements section of the most recent Annual or Semi-Annual report.
G Expense ratios reflect operating expenses of the class. Expenses before reductions do not reflect amounts reimbursed, waived, or reduced through arrangements with the investment adviser, brokerage services, or other offset arrangements, if applicable, and do not represent the amount paid by the class during periods when reimbursements, waivers or reductions occur.
H Annualized
I On certain classes, the size and fluctuation of net assets and expense amounts may cause ratios to differ from contractual rates.
J Amount does not include the portfolio activity of any underlying mutual funds or exchange-traded funds (ETFs).
K The portfolio turnover rate does not include the assets acquired in the merger.
See accompanying notes which are an integral part of the financial statements.
Fidelity Freedom® 2010 Fund
Investment Summary (Unaudited)
The information in the following tables is based on the direct investments of the Fund.
Top Holdings as of September 30, 2020
| | % of fund's net assets |
| Fidelity Series Investment Grade Bond Fund | 33.1 |
| Fidelity Series Government Money Market Fund 0.16% | 13.5 |
| Fidelity Series Inflation-Protected Bond Index Fund | 9.6 |
| Fidelity Series Emerging Markets Opportunities Fund | 7.7 |
| Fidelity Series Short-Term Credit Fund | 3.3 |
| Fidelity Series Intrinsic Opportunities Fund | 2.6 |
| Fidelity Series International Growth Fund | 2.6 |
| Fidelity Series Overseas Fund | 2.6 |
| Fidelity Series International Value Fund | 2.5 |
| Fidelity Series Commodity Strategy Fund | 2.5 |
| | 80.0 |
Asset Allocation (% of fund's net assets)
| Period end |
| | Domestic Equity Funds | 18.0% |
| | International Equity Funds | 18.0% |
| | Bond Funds | 46.9% |
| | Short-Term Funds | 17.0% |
| | Short-Term Investments | 0.1% |

Domestic Equity Funds category includes Fidelity Series Commodity Strategy Fund which invests in commodity-related investments.
Fidelity Freedom® 2010 Fund
Schedule of Investments September 30, 2020 (Unaudited)
Showing Percentage of Net Assets
| U.S. Treasury Obligations - 0.1% | | | |
| | | Principal Amount | Value |
| U.S. Treasury Bills, yield at date of purchase 0.1% to 0.11% 12/3/20 (a) | | | |
| (Cost $4,979,097) | | 4,980,000 | 4,979,129 |
| | | Shares | Value |
|
| Domestic Equity Funds - 18.0% | | | |
| Fidelity Series All-Sector Equity Fund (b) | | 3,411,827 | $36,335,960 |
| Fidelity Series Blue Chip Growth Fund (b) | | 3,179,777 | 52,498,124 |
| Fidelity Series Commodity Strategy Fund (b) | | 32,661,732 | 135,872,807 |
| Fidelity Series Growth Company Fund (b) | | 5,111,454 | 133,971,216 |
| Fidelity Series Intrinsic Opportunities Fund (b) | | 8,853,039 | 140,055,080 |
| Fidelity Series Large Cap Stock Fund (b) | | 8,205,702 | 116,192,742 |
| Fidelity Series Large Cap Value Index Fund (b) | | 3,543,555 | 41,105,238 |
| Fidelity Series Opportunistic Insights Fund (b) | | 3,600,716 | 77,883,484 |
| Fidelity Series Small Cap Discovery Fund (b) | | 1,432,910 | 14,486,720 |
| Fidelity Series Small Cap Opportunities Fund (b) | | 3,749,260 | 47,840,561 |
| Fidelity Series Stock Selector Large Cap Value Fund (b) | | 8,804,412 | 96,848,527 |
| Fidelity Series Value Discovery Fund (b) | | 5,985,904 | 73,985,774 |
| TOTAL DOMESTIC EQUITY FUNDS | | | |
| (Cost $725,138,277) | | | 967,076,233 |
|
| International Equity Funds - 18.0% | | | |
| Fidelity Series Canada Fund (b) | | 4,587,672 | 46,931,886 |
| Fidelity Series Emerging Markets Fund (b) | | 5,000,478 | 47,154,507 |
| Fidelity Series Emerging Markets Opportunities Fund (b) | | 19,873,722 | 416,950,691 |
| Fidelity Series International Growth Fund (b) | | 7,392,075 | 138,823,176 |
| Fidelity Series International Small Cap Fund (b) | | 2,414,741 | 42,982,387 |
| Fidelity Series International Value Fund (b) | | 15,927,919 | 137,298,661 |
| Fidelity Series Overseas Fund (b) | | 12,399,263 | 138,623,760 |
| TOTAL INTERNATIONAL EQUITY FUNDS | | | |
| (Cost $750,532,480) | | | 968,765,068 |
|
| Bond Funds - 46.9% | | | |
| Fidelity Series Emerging Markets Debt Fund (b) | | 3,777,114 | 34,220,655 |
| Fidelity Series Floating Rate High Income Fund (b) | | 815,665 | 7,218,639 |
| Fidelity Series High Income Fund (b) | | 4,025,981 | 36,716,944 |
| Fidelity Series Inflation-Protected Bond Index Fund (b) | | 48,000,081 | 513,600,866 |
| Fidelity Series International Credit Fund (b) | | 388,912 | 4,048,572 |
| Fidelity Series Investment Grade Bond Fund (b) | | 145,570,272 | 1,781,780,131 |
| Fidelity Series Long-Term Treasury Bond Index Fund (b) | | 11,860,669 | 122,520,711 |
| Fidelity Series Real Estate Income Fund (b) | | 2,330,416 | 23,257,547 |
| TOTAL BOND FUNDS | | | |
| (Cost $2,333,130,209) | | | 2,523,364,065 |
|
| Short-Term Funds - 17.0% | | | |
| Fidelity Cash Central Fund 0.10% (c) | | 10,886,218 | 10,888,395 |
| Fidelity Series Government Money Market Fund 0.16% (b)(d) | | 723,111,016 | 723,111,016 |
| Fidelity Series Short-Term Credit Fund (b) | | 17,444,009 | 178,801,088 |
| TOTAL SHORT-TERM FUNDS | | | |
| (Cost $908,088,242) | | | 912,800,499 |
| TOTAL INVESTMENT IN SECURITIES - 100.0% | | | |
| (Cost $4,721,868,305) | | | 5,376,984,994 |
| NET OTHER ASSETS (LIABILITIES) - 0.0% | | | (451,958) |
| NET ASSETS - 100% | | | $5,376,533,036 |
| Futures Contracts | | | | | |
| | Number of contracts | Expiration Date | Notional Amount | Value | Unrealized Appreciation/(Depreciation) |
| Sold | | | | | |
| Equity Index Contracts | | | | | |
| CME E-mini S&P 500 Index Contracts (United States) | 170 | Dec. 2020 | $28,492,000 | $(186,002) | $(186,002) |
The notional amount of futures sold as a percentage of Net Assets is 0.5%
Legend
(a) Security or a portion of the security was pledged to cover margin requirements for futures contracts. At period end, the value of securities pledged amounted to $4,979,129.
(b) Affiliated Fund
(c) Affiliated fund that is generally available only to investment companies and other accounts managed by Fidelity Investments. The rate quoted is the annualized seven-day yield of the fund at period end. A complete unaudited listing of the fund's holdings as of its most recent quarter end is available upon request. In addition, each Fidelity Central Fund's financial statements are available on the SEC's website or upon request.
(d) The rate quoted is the annualized seven-day yield of the fund at period end.
Affiliated Central Funds
Information regarding fiscal year to date income earned by the Fund from investments in Fidelity Central Funds is as follows:
| Fund | Income earned |
| Fidelity Cash Central Fund | $9,378 |
| Total | $9,378 |
Affiliated Underlying Funds
Fiscal year to date information regarding the Fund's investments in affiliated Underlying Funds, excluding any Money Market Central Funds, is presented below. Exchanges between classes of the same affiliated Underlying Funds may occur.
| Affiliate | Value, beginning of period | Purchases | Sales Proceeds | Dividend Income | Realized Gain (loss) | Change in Unrealized appreciation (depreciation) | Value, end of period |
| Fidelity Series All-Sector Equity Fund | $28,032,741 | $72,553 | $1,646,510 | $-- | $(189,621) | $10,066,797 | $36,335,960 |
| Fidelity Series Blue Chip Growth Fund | 51,035,732 | 10,943,814 | 29,572,510 | 10,809,425 | 14,593,469 | 5,497,619 | 52,498,124 |
| Fidelity Series Canada Fund | 33,241,204 | 9,220,573 | 4,922,894 | -- | (384,219) | 9,777,222 | 46,931,886 |
| Fidelity Series Commodity Strategy Fund | 164,179,523 | 868,187 | 46,597,126 | 589,153 | (17,956,468) | 35,378,691 | 135,872,807 |
| Fidelity Series Emerging Markets Debt Fund | 31,151,273 | 975,378 | 1,734,697 | 900,519 | (13,802) | 3,842,503 | 34,220,655 |
| Fidelity Series Emerging Markets Fund | 27,945,598 | 11,551,802 | 3,372,425 | -- | 1,325 | 11,028,207 | 47,154,507 |
| Fidelity Series Emerging Markets Opportunities Fund | 262,352,741 | 93,780,792 | 47,769,779 | -- | 3,120,960 | 105,465,977 | 416,950,691 |
| Fidelity Series Floating Rate High Income Fund | 6,783,903 | 179,213 | 419,684 | 161,104 | (43,951) | 719,158 | 7,218,639 |
| Fidelity Series Government Money Market Fund 0.16% | 768,710,755 | 92,619,979 | 138,219,718 | 869,124 | -- | -- | 723,111,016 |
| Fidelity Series Growth Company Fund | 106,586,738 | 207,266 | 42,535,363 | -- | 25,554,823 | 44,157,752 | 133,971,216 |
| Fidelity Series High Income Fund | 34,118,548 | 1,093,616 | 2,098,425 | 1,003,060 | (3,604) | 3,606,809 | 36,716,944 |
| Fidelity Series Inflation-Protected Bond Index Fund | 474,487,500 | 44,910,199 | 35,099,386 | 401,462 | 435,251 | 28,867,302 | 513,600,866 |
| Fidelity Series International Credit Fund | 3,662,875 | 56,926 | -- | 56,926 | -- | 328,771 | 4,048,572 |
| Fidelity Series International Growth Fund | 171,093,288 | 1,892,979 | 74,903,053 | -- | 27,918,050 | 12,821,912 | 138,823,176 |
| Fidelity Series International Small Cap Fund | 39,888,556 | 286,333 | 9,034,767 | -- | 1,641,261 | 10,201,004 | 42,982,387 |
| Fidelity Series International Value Fund | 142,840,532 | 3,305,973 | 35,957,715 | -- | (6,188,593) | 33,298,464 | 137,298,661 |
| Fidelity Series Intrinsic Opportunities Fund | 116,681,353 | 2,224,282 | 6,855,524 | 1,924,054 | 1,478,853 | 26,526,116 | 140,055,080 |
| Fidelity Series Investment Grade Bond Fund | 1,671,514,483 | 159,785,747 | 149,822,584 | 22,584,562 | 542,026 | 99,760,459 | 1,781,780,131 |
| Fidelity Series Large Cap Stock Fund | 102,370,926 | 4,453,109 | 8,896,824 | 4,193,149 | 1,120,481 | 17,145,050 | 116,192,742 |
| Fidelity Series Large Cap Value Index Fund | 28,049,838 | 11,016,498 | 3,262,787 | -- | (72,025) | 5,373,714 | 41,105,238 |
| Fidelity Series Long-Term Treasury Bond Index Fund | 123,188,090 | 21,172,164 | 18,051,058 | 3,206,734 | 1,636,656 | (5,425,141) | 122,520,711 |
| Fidelity Series Opportunistic Insights Fund | 57,705,687 | 149,923 | 3,336,238 | -- | 1,526,576 | 21,837,536 | 77,883,484 |
| Fidelity Series Overseas Fund | 134,768,955 | 11,488,279 | 45,631,503 | -- | (2,950,795) | 40,948,824 | 138,623,760 |
| Fidelity Series Real Estate Income Fund | 20,106,049 | 804,394 | 1,315,005 | 747,653 | (64,548) | 3,726,657 | 23,257,547 |
| Fidelity Series Short-Term Credit Fund | 171,248,199 | 1,945,325 | 789,827 | 1,945,097 | (8,270) | 6,405,661 | 178,801,088 |
| Fidelity Series Small Cap Discovery Fund | 11,404,842 | 72,160 | 912,404 | 40,051 | (57,227) | 3,979,349 | 14,486,720 |
| Fidelity Series Small Cap Opportunities Fund | 39,828,055 | 395,869 | 2,471,018 | 288,818 | 237,489 | 9,850,166 | 47,840,561 |
| Fidelity Series Stock Selector Large Cap Value Fund | 74,967,864 | 16,612,803 | 10,653,032 | -- | (425,513) | 16,346,405 | 96,848,527 |
| Fidelity Series Value Discovery Fund | 55,416,843 | 12,277,324 | 6,476,922 | -- | (158,824) | 12,927,353 | 73,985,774 |
| | $4,953,362,691 | $514,363,460 | $732,358,778 | $49,720,891 | $51,289,760 | $574,460,337 | $5,361,117,470 |
Amounts in the income column in the above table include any capital gain distributions from underlying funds, which are presented in the corresponding line-item in the Statement of Operations, if applicable.
Investment Valuation
The following is a summary of the inputs used, as of September 30, 2020, involving the Fund's assets and liabilities carried at fair value. The inputs or methodology used for valuing securities may not be an indication of the risk associated with investing in those securities. For more information on valuation inputs, and their aggregation into the levels used below, please refer to the Investment Valuation section in the accompanying Notes to Financial Statements.
| | Valuation Inputs at Reporting Date: |
| Description | Total | Level 1 | Level 2 | Level 3 |
| Investments in Securities: | | | | |
| Other Short-Term Investments | $4,979,129 | $-- | $4,979,129 | $-- |
| Domestic Equity Funds | 967,076,233 | 967,076,233 | -- | -- |
| International Equity Funds | 968,765,068 | 968,765,068 | -- | -- |
| Bond Funds | 2,523,364,065 | 2,523,364,065 | -- | -- |
| Short-Term Funds | 912,800,499 | 912,800,499 | -- | -- |
| Total Investments in Securities: | $5,376,984,994 | $5,372,005,865 | $4,979,129 | $-- |
| Derivative Instruments: | | | | |
| Liabilities | | | | |
| Futures Contracts | $(186,002) | $(186,002) | $-- | $-- |
| Total Liabilities | $(186,002) | $(186,002) | $-- | $-- |
| Total Derivative Instruments: | $(186,002) | $(186,002) | $-- | $-- |
Value of Derivative Instruments
The following table is a summary of the Fund's value of derivative instruments by primary risk exposure as of September 30, 2020. For additional information on derivative instruments, please refer to the Derivative Instruments section in the accompanying Notes to Financial Statements.
| Primary Risk Exposure / Derivative Type | Value |
| | Asset | Liability |
| Equity Risk | | |
| Futures Contracts(a) | $0 | $(186,002) |
| Total Equity Risk | 0 | (186,002) |
| Total Value of Derivatives | $0 | $(186,002) |
(a) Reflects gross cumulative appreciation (depreciation) on futures contracts as presented in the Schedule of Investments. In the Statement of Assets and Liabilities, the period end daily variation margin is included in receivable or payable for daily variation margin on futures contracts, and the net cumulative appreciation (depreciation) is included in Total accumulated earnings (loss).
See accompanying notes which are an integral part of the financial statements.
Fidelity Freedom® 2010 Fund
Financial Statements
Statement of Assets and Liabilities
| | | September 30, 2020 (Unaudited) |
| Assets | | |
Investment in securities, at value — See accompanying schedule:
Unaffiliated issuers (cost $4,979,097) | $4,979,129 | |
| Fidelity Central Funds (cost $10,888,186) | 10,888,395 | |
| Other affiliated issuers (cost $4,706,001,022) | 5,361,117,470 | |
| Total Investment in Securities (cost $4,721,868,305) | | $5,376,984,994 |
| Receivable for investments sold | | 58,818,591 |
| Receivable for fund shares sold | | 2,054,941 |
| Distributions receivable from Fidelity Central Funds | | 972 |
| Other receivables | | 96,313 |
| Total assets | | 5,437,955,811 |
| Liabilities | | |
| Payable for investments purchased | $53,206,778 | |
| Payable for fund shares redeemed | 5,582,780 | |
| Accrued management fee | 2,187,901 | |
| Payable for daily variation margin on futures contracts | 349,005 | |
| Other payables and accrued expenses | 96,311 | |
| Total liabilities | | 61,422,775 |
| Net Assets | | $5,376,533,036 |
| Net Assets consist of: | | |
| Paid in capital | | $4,646,663,211 |
| Total accumulated earnings (loss) | | 729,869,825 |
| Net Assets | | $5,376,533,036 |
| Net Asset Value and Maximum Offering Price | | |
| Fidelity Freedom 2010 Fund: | | |
| Net Asset Value, offering price and redemption price per share ($3,591,869,985 ÷ 226,876,365 shares) | | $15.83 |
| Class K: | | |
| Net Asset Value, offering price and redemption price per share ($1,499,697,429 ÷ 94,774,531 shares) | | $15.82 |
| Class K6: | | |
| Net Asset Value, offering price and redemption price per share ($284,965,622 ÷ 18,067,028 shares) | | $15.77 |
See accompanying notes which are an integral part of the financial statements.
Statement of Operations
| | | Six months ended September 30, 2020 (Unaudited) |
| Investment Income | | |
| Dividends: | | |
| Affiliated issuers | | $34,069,345 |
| Interest | | 6,574 |
| Income from Fidelity Central Funds | | 9,378 |
| Total income | | 34,085,297 |
| Expenses | | |
| Management fee | $12,806,927 | |
| Independent trustees' fees and expenses | 7,323 | |
| Total expenses before reductions | 12,814,250 | |
| Expense reductions | (69) | |
| Total expenses after reductions | | 12,814,181 |
| Net investment income (loss) | | 21,271,116 |
| Realized and Unrealized Gain (Loss) | | |
| Net realized gain (loss) on: | | |
| Investment securities: | | |
| Fidelity Central Funds | (1,308) | |
| Other affiliated issuers | 51,289,760 | |
| Futures contracts | (4,792,257) | |
| Capital gain distributions from underlying funds: | | |
| Affiliated issuers | 15,651,546 | |
| Total net realized gain (loss) | | 62,147,741 |
| Change in net unrealized appreciation (depreciation) on: | | |
| Investment securities: | | |
| Unaffiliated issuers | (4,087) | |
| Fidelity Central Funds | (297) | |
| Other affiliated issuers | 574,460,337 | |
| Futures contracts | (186,002) | |
| Total change in net unrealized appreciation (depreciation) | | 574,269,951 |
| Net gain (loss) | | 636,417,692 |
| Net increase (decrease) in net assets resulting from operations | | $657,688,808 |
See accompanying notes which are an integral part of the financial statements.
Statement of Changes in Net Assets
| | Six months ended September 30, 2020 (Unaudited) | Year ended March 31, 2020 |
| Increase (Decrease) in Net Assets | | |
| Operations | | |
| Net investment income (loss) | $21,271,116 | $105,841,028 |
| Net realized gain (loss) | 62,147,741 | 239,313,376 |
| Change in net unrealized appreciation (depreciation) | 574,269,951 | (382,969,895) |
| Net increase (decrease) in net assets resulting from operations | 657,688,808 | (37,815,491) |
| Distributions to shareholders | (127,195,274) | (326,178,030) |
| Share transactions - net increase (decrease) | (127,715,069) | (509,728,586) |
| Total increase (decrease) in net assets | 402,778,465 | (873,722,107) |
| Net Assets | | |
| Beginning of period | 4,973,754,571 | 5,847,476,678 |
| End of period | $5,376,533,036 | $4,973,754,571 |
See accompanying notes which are an integral part of the financial statements.
Financial Highlights
Fidelity Freedom 2010 Fund
| | Six months ended (Unaudited) September 30, | Years endedMarch 31, | | | | |
| | 2020 | 2020 | 2019 | 2018 | 2017 | 2016 |
| Selected Per–Share Data | | | | | | |
| Net asset value, beginning of period | $14.31 | $15.35 | $15.98 | $15.56 | $14.75 | $15.75 |
| Income from Investment Operations | | | | | | |
| Net investment income (loss)A | .06 | .29 | .29 | .24 | .26 | .28 |
| Net realized and unrealized gain (loss) | 1.83 | (.43) | .12 | .95 | 1.08 | (.50) |
| Total from investment operations | 1.89 | (.14) | .41 | 1.19 | 1.34 | (.22) |
| Distributions from net investment income | (.03) | (.31) | (.30) | (.23) | (.26) | (.29) |
| Distributions from net realized gain | (.34) | (.60) | (.74) | (.54) | (.26) | (.49) |
| Total distributions | (.37) | (.90)B | (1.04) | (.77) | (.53)B | (.78) |
| Net asset value, end of period | $15.83 | $14.31 | $15.35 | $15.98 | $15.56 | $14.75 |
| Total ReturnC,D | 13.41% | (1.25)% | 2.89% | 7.74% | 9.27% | (1.42)% |
| Ratios to Average Net AssetsE,F | | | | | | |
| Expenses before reductions | .51%G | .52% | .52%H | .44% | - %I | - %I |
| Expenses net of fee waivers, if any | .51%G | .52% | .52%H | .44% | -% | -% |
| Expenses net of all reductions | .51%G | .52% | .52%H | .44% | -% | -% |
| Net investment income (loss) | .78%G | 1.84% | 1.90% | 1.47% | 1.69% | 1.86% |
| Supplemental Data | | | | | | |
| Net assets, end of period (000 omitted) | $3,591,870 | $3,284,758 | $3,724,077 | $4,038,370 | $4,137,360 | $4,271,151 |
| Portfolio turnover rateJ | 20%G | 18% | 20% | 19%K | 23% | 17% |
A Calculated based on average shares outstanding during the period.
B Total distributions per share do not sum due to rounding.
C Total returns for periods of less than one year are not annualized.
D Total returns would have been lower if certain expenses had not been reduced during the applicable periods shown.
E Fees and expenses of any underlying mutual funds or exchange-traded funds (ETFs) are not included in the Fund's expense ratio. The Fund indirectly bears its proportionate share of these expenses. For additional expense information related to investments in Fidelity Central Funds, please refer to the "Investments in Fidelity Central Funds" note found in the Notes to Financial Statements section of the most recent Annual or Semi-Annual report.
F Expense ratios reflect operating expenses of the class. Expenses before reductions do not reflect amounts reimbursed, waived, or reduced through arrangements with the investment adviser, brokerage services, or other offset arrangements, if applicable, and do not represent the amount paid by the class during periods when reimbursements, waivers or reductions occur.
G Annualized
H On certain classes, the size and fluctuation of net assets and expense amounts may cause ratios to differ from contractual rates.
I Amount represents less than .005%.
J Amount does not include the portfolio activity of any underlying mutual funds or exchange-traded funds (ETFs).
K The portfolio turnover rate does not include the assets acquired in the merger.
See accompanying notes which are an integral part of the financial statements.
Fidelity Freedom 2010 Fund Class K
| | Six months ended (Unaudited) September 30, | Years endedMarch 31, | | |
| | 2020 | 2020 | 2019 | 2018 A |
| Selected Per–Share Data | | | | |
| Net asset value, beginning of period | $14.30 | $15.34 | $15.97 | $15.96 |
| Income from Investment Operations | | | | |
| Net investment income (loss)B | .06 | .30 | .30 | .27 |
| Net realized and unrealized gain (loss) | 1.83 | (.43) | .12 | .31 |
| Total from investment operations | 1.89 | (.13) | .42 | .58 |
| Distributions from net investment income | (.04) | (.31) | (.31) | (.22) |
| Distributions from net realized gain | (.34) | (.60) | (.74) | (.35) |
| Total distributions | (.37)C | (.91) | (1.05) | (.57) |
| Net asset value, end of period | $15.82 | $14.30 | $15.34 | $15.97 |
| Total ReturnD,E | 13.44% | (1.21)% | 2.95% | 3.59% |
| Ratios to Average Net AssetsF,G | | | | |
| Expenses before reductions | .45%H | .45% | .46% | .47%H |
| Expenses net of fee waivers, if any | .45%H | .45% | .46% | .47%H |
| Expenses net of all reductions | .45%H | .45% | .46% | .47%H |
| Net investment income (loss) | .84%H | 1.91% | 1.96% | 2.42%H |
| Supplemental Data | | | | |
| Net assets, end of period (000 omitted) | $1,499,697 | $1,431,597 | $1,909,779 | $2,396,182 |
| Portfolio turnover rateI | 20%H | 18% | 20% | 19%J |
A For the period July 20, 2017 (commencement of sale of shares) to March 31, 2018.
B Calculated based on average shares outstanding during the period.
C Total distributions per share do not sum due to rounding.
D Total returns for periods of less than one year are not annualized.
E Total returns would have been lower if certain expenses had not been reduced during the applicable periods shown.
F Fees and expenses of any underlying mutual funds or exchange-traded funds (ETFs) are not included in the Fund's expense ratio. The Fund indirectly bears its proportionate share of these expenses. For additional expense information related to investments in Fidelity Central Funds, please refer to the "Investments in Fidelity Central Funds" note found in the Notes to Financial Statements section of the most recent Annual or Semi-Annual report.
G Expense ratios reflect operating expenses of the class. Expenses before reductions do not reflect amounts reimbursed, waived, or reduced through arrangements with the investment adviser, brokerage services, or other offset arrangements, if applicable, and do not represent the amount paid by the class during periods when reimbursements, waivers or reductions occur.
H Annualized
I Amount does not include the portfolio activity of any underlying mutual funds or exchange-traded funds (ETFs).
J The portfolio turnover rate does not include the assets acquired in the merger.
See accompanying notes which are an integral part of the financial statements.
Fidelity Freedom 2010 Fund Class K6
| | Six months ended (Unaudited) September 30, | Years endedMarch 31, | | |
| | 2020 | 2020 | 2019 | 2018 A |
| Selected Per–Share Data | | | | |
| Net asset value, beginning of period | $14.25 | $15.30 | $15.97 | $15.77 |
| Income from Investment Operations | | | | |
| Net investment income (loss)B | .07 | .30 | .31 | .27 |
| Net realized and unrealized gain (loss) | 1.83 | (.42) | .11 | .50 |
| Total from investment operations | 1.90 | (.12) | .42 | .77 |
| Distributions from net investment income | (.04) | (.34) | (.35) | (.22) |
| Distributions from net realized gain | (.34) | (.60) | (.74) | (.35) |
| Total distributions | (.38) | (.93)C | (1.09) | (.57) |
| Net asset value, end of period | $15.77 | $14.25 | $15.30 | $15.97 |
| Total ReturnD,E | 13.52% | (1.14)% | 2.96% | 4.89% |
| Ratios to Average Net AssetsF,G | | | | |
| Expenses before reductions | .38%H | .39% | .39% | .40%H |
| Expenses net of fee waivers, if any | .38%H | .39% | .39% | .40%H |
| Expenses net of all reductions | .38%H | .39% | .39% | .40%H |
| Net investment income (loss) | .90%H | 1.97% | 2.03% | 2.07%H |
| Supplemental Data | | | | |
| Net assets, end of period (000 omitted) | $284,966 | $257,400 | $213,620 | $59,797 |
| Portfolio turnover rateI | 20%H | 18% | 20% | 19%J |
A For the period June 7, 2017 (commencement of sale of shares) to March 31, 2018.
B Calculated based on average shares outstanding during the period.
C Total distributions per share do not sum due to rounding.
D Total returns for periods of less than one year are not annualized.
E Total returns would have been lower if certain expenses had not been reduced during the applicable periods shown.
F Fees and expenses of any underlying mutual funds or exchange-traded funds (ETFs) are not included in the Fund's expense ratio. The Fund indirectly bears its proportionate share of these expenses. For additional expense information related to investments in Fidelity Central Funds, please refer to the "Investments in Fidelity Central Funds" note found in the Notes to Financial Statements section of the most recent Annual or Semi-Annual report.
G Expense ratios reflect operating expenses of the class. Expenses before reductions do not reflect amounts reimbursed, waived, or reduced through arrangements with the investment adviser, brokerage services, or other offset arrangements, if applicable, and do not represent the amount paid by the class during periods when reimbursements, waivers or reductions occur.
H Annualized
I Amount does not include the portfolio activity of any underlying mutual funds or exchange-traded funds (ETFs).
J The portfolio turnover rate does not include the assets acquired in the merger.
See accompanying notes which are an integral part of the financial statements.
Fidelity Freedom® 2015 Fund
Investment Summary (Unaudited)
The information in the following tables is based on the direct investments of the Fund.
Top Holdings as of September 30, 2020
| | % of fund's net assets |
| Fidelity Series Investment Grade Bond Fund | 29.4 |
| Fidelity Series Government Money Market Fund 0.16% | 10.1 |
| Fidelity Series Emerging Markets Opportunities Fund | 8.8 |
| Fidelity Series Inflation-Protected Bond Index Fund | 8.3 |
| Fidelity Series Intrinsic Opportunities Fund | 3.6 |
| Fidelity Series Growth Company Fund | 3.4 |
| Fidelity Series International Growth Fund | 3.3 |
| Fidelity Series Overseas Fund | 3.3 |
| Fidelity Series International Value Fund | 3.2 |
| Fidelity Series Large Cap Stock Fund | 3.0 |
| | 76.4 |
Asset Allocation (% of fund's net assets)
| Period end |
| | Domestic Equity Funds | 23.6% |
| | International Equity Funds | 21.7% |
| | Bond Funds | 41.9% |
| | Short-Term Funds | 12.7% |
| | Short-Term Investments | 0.1% |

Domestic Equity Funds category includes Fidelity Series Commodity Strategy Fund which invests in commodity-related investments.
Fidelity Freedom® 2015 Fund
Schedule of Investments September 30, 2020 (Unaudited)
Showing Percentage of Net Assets
| U.S. Treasury Obligations - 0.1% | | | |
| | | Principal Amount | Value |
| U.S. Treasury Bills, yield at date of purchase 0.1% to 0.11% 12/3/20 to 12/10/20 (a) | | | |
| (Cost $7,338,672) | | 7,340,000 | 7,338,714 |
| | | Shares | Value |
|
| Domestic Equity Funds - 23.6% | | | |
| Fidelity Series All-Sector Equity Fund (b) | | 6,792,223 | $72,337,178 |
| Fidelity Series Blue Chip Growth Fund (b) | | 6,394,239 | 105,568,887 |
| Fidelity Series Commodity Strategy Fund (b) | | 48,106,227 | 200,121,906 |
| Fidelity Series Growth Company Fund (b) | | 10,180,019 | 266,818,308 |
| Fidelity Series Intrinsic Opportunities Fund (b) | | 17,868,961 | 282,686,955 |
| Fidelity Series Large Cap Stock Fund (b) | | 16,501,487 | 233,661,054 |
| Fidelity Series Large Cap Value Index Fund (b) | | 7,125,225 | 82,652,615 |
| Fidelity Series Opportunistic Insights Fund (b) | | 7,129,596 | 154,213,162 |
| Fidelity Series Small Cap Discovery Fund (b) | | 2,881,288 | 29,129,818 |
| Fidelity Series Small Cap Opportunities Fund (b) | | 7,548,316 | 96,316,513 |
| Fidelity Series Stock Selector Large Cap Value Fund (b) | | 17,701,323 | 194,714,551 |
| Fidelity Series Value Discovery Fund (b) | | 12,035,939 | 148,764,205 |
| TOTAL DOMESTIC EQUITY FUNDS | | | |
| (Cost $1,376,926,328) | | | 1,866,985,152 |
|
| International Equity Funds - 21.7% | | | |
| Fidelity Series Canada Fund (b) | | 8,606,388 | 88,043,352 |
| Fidelity Series Emerging Markets Fund (b) | | 8,238,250 | 77,686,695 |
| Fidelity Series Emerging Markets Opportunities Fund (b) | | 33,116,741 | 694,789,223 |
| Fidelity Series International Growth Fund (b) | | 13,867,299 | 260,427,869 |
| Fidelity Series International Small Cap Fund (b) | | 4,518,509 | 80,429,457 |
| Fidelity Series International Value Fund (b) | | 29,903,008 | 257,763,932 |
| Fidelity Series Overseas Fund (b) | | 23,260,499 | 260,052,378 |
| TOTAL INTERNATIONAL EQUITY FUNDS | | | |
| (Cost $1,335,142,861) | | | 1,719,192,906 |
|
| Bond Funds - 41.9% | | | |
| Fidelity Series Emerging Markets Debt Fund (b) | | 5,439,368 | 49,280,677 |
| Fidelity Series Floating Rate High Income Fund (b) | | 1,122,421 | 9,933,427 |
| Fidelity Series High Income Fund (b) | | 5,886,575 | 53,685,565 |
| Fidelity Series Inflation-Protected Bond Index Fund (b) | | 61,264,353 | 655,528,581 |
| Fidelity Series International Credit Fund (b) | | 591,361 | 6,156,070 |
| Fidelity Series Investment Grade Bond Fund (b) | | 190,056,928 | 2,326,296,801 |
| Fidelity Series Long-Term Treasury Bond Index Fund (b) | | 17,451,461 | 180,273,596 |
| Fidelity Series Real Estate Income Fund (b) | | 3,284,192 | 32,776,238 |
| TOTAL BOND FUNDS | | | |
| (Cost $3,039,086,478) | | | 3,313,930,955 |
|
| Short-Term Funds - 12.7% | | | |
| Fidelity Cash Central Fund 0.10% (c) | | 10,762,766 | 10,764,919 |
| Fidelity Series Government Money Market Fund 0.16% (b)(d) | | 799,151,082 | 799,151,082 |
| Fidelity Series Short-Term Credit Fund (b) | | 19,280,049 | 197,620,504 |
| TOTAL SHORT-TERM FUNDS | | | |
| (Cost $1,002,414,432) | | | 1,007,536,505 |
| TOTAL INVESTMENT IN SECURITIES - 100.0% | | | |
| (Cost $6,760,908,771) | | | 7,914,984,232 |
| NET OTHER ASSETS (LIABILITIES) - 0.0% | | | (630,368) |
| NET ASSETS - 100% | | | $7,914,353,864 |
| Futures Contracts | | | | | |
| | Number of contracts | Expiration Date | Notional Amount | Value | Unrealized Appreciation/(Depreciation) |
| Sold | | | | | |
| Equity Index Contracts | | | | | |
| CME E-mini S&P 500 Index Contracts (United States) | 305 | Dec. 2020 | $51,118,000 | $(333,710) | $(333,710) |
The notional amount of futures sold as a percentage of Net Assets is 0.6%
Legend
(a) Security or a portion of the security was pledged to cover margin requirements for futures contracts. At period end, the value of securities pledged amounted to $7,338,714.
(b) Affiliated Fund
(c) Affiliated fund that is generally available only to investment companies and other accounts managed by Fidelity Investments. The rate quoted is the annualized seven-day yield of the fund at period end. A complete unaudited listing of the fund's holdings as of its most recent quarter end is available upon request. In addition, each Fidelity Central Fund's financial statements are available on the SEC's website or upon request.
(d) The rate quoted is the annualized seven-day yield of the fund at period end.
Affiliated Central Funds
Information regarding fiscal year to date income earned by the Fund from investments in Fidelity Central Funds is as follows:
| Fund | Income earned |
| Fidelity Cash Central Fund | $10,843 |
| Total | $10,843 |
Affiliated Underlying Funds
Fiscal year to date information regarding the Fund's investments in affiliated Underlying Funds, excluding any Money Market Central Funds, is presented below. Exchanges between classes of the same affiliated Underlying Funds may occur.
| Affiliate | Value, beginning of period | Purchases | Sales Proceeds | Dividend Income | Realized Gain (loss) | Change in Unrealized appreciation (depreciation) | Value, end of period |
| Fidelity Series All-Sector Equity Fund | $56,547,292 | $258,427 | $4,284,833 | $-- | $(84,601) | $19,900,893 | $72,337,178 |
| Fidelity Series Blue Chip Growth Fund | 102,390,731 | 22,219,638 | 57,585,470 | 21,751,996 | 27,422,085 | 11,121,903 | 105,568,887 |
| Fidelity Series Canada Fund | 65,763,814 | 13,416,140 | 8,569,722 | -- | (626,734) | 18,059,854 | 88,043,352 |
| Fidelity Series Commodity Strategy Fund | 238,815,009 | 1,659,821 | 65,838,079 | 878,453 | (24,347,164) | 49,832,319 | 200,121,906 |
| Fidelity Series Emerging Markets Debt Fund | 45,488,852 | 1,498,297 | 3,274,562 | 1,304,583 | (10,756) | 5,578,846 | 49,280,677 |
| Fidelity Series Emerging Markets Fund | 47,604,094 | 17,334,582 | 6,233,433 | -- | 100,272 | 18,881,180 | 77,686,695 |
| Fidelity Series Emerging Markets Opportunities Fund | 455,428,436 | 138,298,211 | 80,302,818 | -- | 4,505,243 | 176,860,151 | 694,789,223 |
| Fidelity Series Floating Rate High Income Fund | 9,513,559 | 270,418 | 792,232 | 223,552 | (94,441) | 1,036,123 | 9,933,427 |
| Fidelity Series Government Money Market Fund 0.16% | 889,239,670 | 130,034,208 | 220,122,796 | 967,662 | -- | -- | 799,151,082 |
| Fidelity Series Growth Company Fund | 213,036,213 | 362,508 | 84,497,429 | -- | 50,257,665 | 87,659,351 | 266,818,308 |
| Fidelity Series High Income Fund | 50,612,414 | 1,709,969 | 3,961,169 | 1,475,632 | (225,453) | 5,549,804 | 53,685,565 |
| Fidelity Series Inflation-Protected Bond Index Fund | 607,324,717 | 72,656,174 | 61,815,249 | 510,808 | 521,408 | 36,841,531 | 655,528,581 |
| Fidelity Series International Credit Fund | 5,569,597 | 86,558 | -- | 86,559 | -- | 499,915 | 6,156,070 |
| Fidelity Series International Growth Fund | 308,550,153 | 3,847,044 | 126,707,957 | -- | 46,971,493 | 27,767,136 | 260,427,869 |
| Fidelity Series International Small Cap Fund | 72,749,871 | 916,741 | 15,189,841 | -- | 2,807,189 | 19,145,497 | 80,429,457 |
| Fidelity Series International Value Fund | 263,255,626 | 7,563,162 | 63,399,038 | -- | (5,912,901) | 56,257,083 | 257,763,932 |
| Fidelity Series Intrinsic Opportunities Fund | 238,528,707 | 4,948,427 | 17,795,096 | 3,883,446 | 3,582,673 | 53,422,244 | 282,686,955 |
| Fidelity Series Investment Grade Bond Fund | 2,164,644,980 | 264,812,136 | 233,144,874 | 29,366,256 | 1,377,502 | 128,607,057 | 2,326,296,801 |
| Fidelity Series Large Cap Stock Fund | 205,286,549 | 13,178,092 | 21,768,308 | 8,493,971 | 913,343 | 36,051,378 | 233,661,054 |
| Fidelity Series Large Cap Value Index Fund | 56,345,334 | 22,095,807 | 6,573,253 | -- | (86,277) | 10,871,004 | 82,652,615 |
| Fidelity Series Long-Term Treasury Bond Index Fund | 185,243,180 | 35,283,276 | 34,871,130 | 4,698,654 | 3,787,118 | (9,168,848) | 180,273,596 |
| Fidelity Series Opportunistic Insights Fund | 115,784,325 | 534,535 | 8,705,592 | -- | 3,889,782 | 42,710,112 | 154,213,162 |
| Fidelity Series Overseas Fund | 252,740,831 | 15,628,903 | 78,605,313 | -- | (5,761,418) | 76,049,375 | 260,052,378 |
| Fidelity Series Real Estate Income Fund | 28,831,604 | 1,205,041 | 2,482,808 | 1,057,714 | (122,776) | 5,345,177 | 32,776,238 |
| Fidelity Series Short-Term Credit Fund | 189,382,610 | 2,149,981 | 984,344 | 2,149,975 | (9,582) | 7,081,839 | 197,620,504 |
| Fidelity Series Small Cap Discovery Fund | 22,832,454 | 412,549 | 1,991,645 | 80,304 | (128,115) | 8,004,575 | 29,129,818 |
| Fidelity Series Small Cap Opportunities Fund | 79,771,188 | 3,687,595 | 7,828,218 | 590,164 | 939,337 | 19,746,611 | 96,316,513 |
| Fidelity Series Stock Selector Large Cap Value Fund | 150,151,660 | 29,381,927 | 17,948,169 | -- | (386,163) | 33,515,296 | 194,714,551 |
| Fidelity Series Value Discovery Fund | 112,117,914 | 22,901,778 | 12,474,743 | -- | (130,354) | 26,349,610 | 148,764,205 |
| | $7,233,551,384 | $828,351,945 | $1,247,748,121 | $77,519,729 | $109,148,375 | $973,577,016 | $7,896,880,599 |
Amounts in the income column in the above table include any capital gain distributions from underlying funds, which are presented in the corresponding line-item in the Statement of Operations, if applicable.
Investment Valuation
The following is a summary of the inputs used, as of September 30, 2020, involving the Fund's assets and liabilities carried at fair value. The inputs or methodology used for valuing securities may not be an indication of the risk associated with investing in those securities. For more information on valuation inputs, and their aggregation into the levels used below, please refer to the Investment Valuation section in the accompanying Notes to Financial Statements.
| | Valuation Inputs at Reporting Date: |
| Description | Total | Level 1 | Level 2 | Level 3 |
| Investments in Securities: | | | | |
| Other Short-Term Investments | $7,338,714 | $-- | $7,338,714 | $-- |
| Domestic Equity Funds | 1,866,985,152 | 1,866,985,152 | -- | -- |
| International Equity Funds | 1,719,192,906 | 1,719,192,906 | -- | -- |
| Bond Funds | 3,313,930,955 | 3,313,930,955 | -- | -- |
| Short-Term Funds | 1,007,536,505 | 1,007,536,505 | -- | -- |
| Total Investments in Securities: | $7,914,984,232 | $7,907,645,518 | $7,338,714 | $-- |
| Derivative Instruments: | | | | |
| Liabilities | | | | |
| Futures Contracts | $(333,710) | $(333,710) | $-- | $-- |
| Total Liabilities | $(333,710) | $(333,710) | $-- | $-- |
| Total Derivative Instruments: | $(333,710) | $(333,710) | $-- | $-- |
Value of Derivative Instruments
The following table is a summary of the Fund's value of derivative instruments by primary risk exposure as of September 30, 2020. For additional information on derivative instruments, please refer to the Derivative Instruments section in the accompanying Notes to Financial Statements.
| Primary Risk Exposure / Derivative Type | Value |
| | Asset | Liability |
| Equity Risk | | |
| Futures Contracts(a) | $0 | $(333,710) |
| Total Equity Risk | 0 | (333,710) |
| Total Value of Derivatives | $0 | $(333,710) |
(a) Reflects gross cumulative appreciation (depreciation) on futures contracts as presented in the Schedule of Investments. In the Statement of Assets and Liabilities, the period end daily variation margin is included in receivable or payable for daily variation margin on futures contracts, and the net cumulative appreciation (depreciation) is included in Total accumulated earnings (loss).
See accompanying notes which are an integral part of the financial statements.
Fidelity Freedom® 2015 Fund
Financial Statements
Statement of Assets and Liabilities
| | | September 30, 2020 (Unaudited) |
| Assets | | |
Investment in securities, at value — See accompanying schedule:
Unaffiliated issuers (cost $7,338,672) | $7,338,714 | |
| Fidelity Central Funds (cost $10,764,576) | 10,764,919 | |
| Other affiliated issuers (cost $6,742,805,523) | 7,896,880,599 | |
| Total Investment in Securities (cost $6,760,908,771) | | $7,914,984,232 |
| Receivable for investments sold | | 86,922,982 |
| Receivable for fund shares sold | | 2,794,494 |
| Distributions receivable from Fidelity Central Funds | | 927 |
| Total assets | | 8,004,702,635 |
| Liabilities | | |
| Payable for investments purchased | $82,638,356 | |
| Payable for fund shares redeemed | 3,820,708 | |
| Accrued management fee | 3,421,175 | |
| Payable for daily variation margin on futures contracts | 468,532 | |
| Total liabilities | | 90,348,771 |
| Net Assets | | $7,914,353,864 |
| Net Assets consist of: | | |
| Paid in capital | | $6,620,962,208 |
| Total accumulated earnings (loss) | | 1,293,391,656 |
| Net Assets | | $7,914,353,864 |
| Net Asset Value and Maximum Offering Price | | |
| Fidelity Freedom 2015 Fund: | | |
| Net Asset Value, offering price and redemption price per share ($4,592,547,980 ÷ 354,157,724 shares) | | $12.97 |
| Class K: | | |
| Net Asset Value, offering price and redemption price per share ($2,651,521,442 ÷ 204,714,056 shares) | | $12.95 |
| Class K6: | | |
| Net Asset Value, offering price and redemption price per share ($670,284,442 ÷ 51,876,471 shares) | | $12.92 |
See accompanying notes which are an integral part of the financial statements.
Statement of Operations
| | | Six months ended September 30, 2020 (Unaudited) |
| Investment Income | | |
| Dividends: | | |
| Affiliated issuers | | $47,469,166 |
| Interest | | 10,481 |
| Income from Fidelity Central Funds | | 10,843 |
| Total income | | 47,490,490 |
| Expenses | | |
| Management fee | $20,011,452 | |
| Independent trustees' fees and expenses | 10,767 | |
| Total expenses before reductions | 20,022,219 | |
| Expense reductions | (89) | |
| Total expenses after reductions | | 20,022,130 |
| Net investment income (loss) | | 27,468,360 |
| Realized and Unrealized Gain (Loss) | | |
| Net realized gain (loss) on: | | |
| Investment securities: | | |
| Fidelity Central Funds | (1,585) | |
| Other affiliated issuers | 109,148,375 | |
| Futures contracts | (8,704,835) | |
| Capital gain distributions from underlying funds: | | |
| Affiliated issuers | 30,050,563 | |
| Total net realized gain (loss) | | 130,492,518 |
| Change in net unrealized appreciation (depreciation) on: | | |
| Investment securities: | | |
| Unaffiliated issuers | (6,485) | |
| Fidelity Central Funds | (473) | |
| Other affiliated issuers | 973,577,016 | |
| Futures contracts | (333,710) | |
| Total change in net unrealized appreciation (depreciation) | | 973,236,348 |
| Net gain (loss) | | 1,103,728,866 |
| Net increase (decrease) in net assets resulting from operations | | $1,131,197,226 |
See accompanying notes which are an integral part of the financial statements.
Statement of Changes in Net Assets
| | Six months ended September 30, 2020 (Unaudited) | Year ended March 31, 2020 |
| Increase (Decrease) in Net Assets | | |
| Operations | | |
| Net investment income (loss) | $27,468,360 | $156,027,399 |
| Net realized gain (loss) | 130,492,518 | 432,413,126 |
| Change in net unrealized appreciation (depreciation) | 973,236,348 | (752,576,562) |
| Net increase (decrease) in net assets resulting from operations | 1,131,197,226 | (164,136,037) |
| Distributions to shareholders | (228,684,440) | (571,740,150) |
| Share transactions - net increase (decrease) | (248,225,028) | (910,583,607) |
| Total increase (decrease) in net assets | 654,287,758 | (1,646,459,794) |
| Net Assets | | |
| Beginning of period | 7,260,066,106 | 8,906,525,900 |
| End of period | $7,914,353,864 | $7,260,066,106 |
See accompanying notes which are an integral part of the financial statements.
Financial Highlights
Fidelity Freedom 2015 Fund
| | Six months ended (Unaudited) September 30, | Years endedMarch 31, | | | | |
| | 2020 | 2020 | 2019 | 2018 | 2017 | 2016 |
| Selected Per–Share Data | | | | | | |
| Net asset value, beginning of period | $11.53 | $12.68 | $13.33 | $12.82 | $12.03 | $12.92 |
| Income from Investment Operations | | | | | | |
| Net investment income (loss)A | .04 | .23 | .23 | .19 | .21 | .23 |
| Net realized and unrealized gain (loss) | 1.77 | (.52) | .08 | .97 | 1.04 | (.46) |
| Total from investment operations | 1.81 | (.29) | .31 | 1.16 | 1.25 | (.23) |
| Distributions from net investment income | (.02) | (.24) | (.24) | (.19) | (.21) | (.23) |
| Distributions from net realized gain | (.35) | (.62) | (.73) | (.46) | (.24) | (.43) |
| Total distributions | (.37) | (.86) | (.96)B | (.65) | (.46)B | (.66) |
| Net asset value, end of period | $12.97 | $11.53 | $12.68 | $13.33 | $12.82 | $12.03 |
| Total ReturnC,D | 15.99% | (2.80)% | 2.74% | 9.15% | 10.63% | (1.83)% |
| Ratios to Average Net AssetsE,F | | | | | | |
| Expenses before reductions | .55%G | .56% | .57% | .48% | - %H | - %H |
| Expenses net of fee waivers, if any | .55%G | .56% | .57% | .48% | -% | -% |
| Expenses net of all reductions | .55%G | .56% | .57% | .48% | -% | -% |
| Net investment income (loss) | .67%G | 1.80% | 1.82% | 1.40% | 1.69% | 1.87% |
| Supplemental Data | | | | | | |
| Net assets, end of period (000 omitted) | $4,592,548 | $4,174,065 | $4,946,449 | $5,380,580 | $5,327,313 | $5,354,142 |
| Portfolio turnover rateI | 21%G | 21% | 19% | 23%J | 21% | 17% |
A Calculated based on average shares outstanding during the period.
B Total distributions per share do not sum due to rounding.
C Total returns for periods of less than one year are not annualized.
D Total returns would have been lower if certain expenses had not been reduced during the applicable periods shown.
E Fees and expenses of any underlying mutual funds or exchange-traded funds (ETFs) are not included in the Fund's expense ratio. The Fund indirectly bears its proportionate share of these expenses. For additional expense information related to investments in Fidelity Central Funds, please refer to the "Investments in Fidelity Central Funds" note found in the Notes to Financial Statements section of the most recent Annual or Semi-Annual report.
F Expense ratios reflect operating expenses of the class. Expenses before reductions do not reflect amounts reimbursed, waived, or reduced through arrangements with the investment adviser, brokerage services, or other offset arrangements, if applicable, and do not represent the amount paid by the class during periods when reimbursements, waivers or reductions occur.
G Annualized
H Amount represents less than .005%.
I Amount does not include the portfolio activity of any underlying mutual funds or exchange-traded funds (ETFs).
J The portfolio turnover rate does not include the assets acquired in the merger.
See accompanying notes which are an integral part of the financial statements.
Fidelity Freedom 2015 Fund Class K
| | Six months ended (Unaudited) September 30, | Years endedMarch 31, | | |
| | 2020 | 2020 | 2019 | 2018 A |
| Selected Per–Share Data | | | | |
| Net asset value, beginning of period | $11.52 | $12.66 | $13.31 | $13.21 |
| Income from Investment Operations | | | | |
| Net investment income (loss)B | .05 | .24 | .24 | .22 |
| Net realized and unrealized gain (loss) | 1.75 | (.51) | .08 | .34 |
| Total from investment operations | 1.80 | (.27) | .32 | .56 |
| Distributions from net investment income | (.02) | (.25) | (.25) | (.18) |
| Distributions from net realized gain | (.35) | (.62) | (.73) | (.29) |
| Total distributions | (.37) | (.87) | (.97)C | (.46)C |
| Net asset value, end of period | $12.95 | $11.52 | $12.66 | $13.31 |
| Total ReturnD,E | 15.93% | (2.67)% | 2.80% | 4.25% |
| Ratios to Average Net AssetsF,G | | | | |
| Expenses before reductions | .48%H | .49% | .50% | .51%H,I |
| Expenses net of fee waivers, if any | .48%H | .49% | .50% | .51%H,I |
| Expenses net of all reductions | .48%H | .49% | .50% | .51%H,I |
| Net investment income (loss) | .74%H | 1.87% | 1.89% | 2.39%H |
| Supplemental Data | | | | |
| Net assets, end of period (000 omitted) | $2,651,521 | $2,524,326 | $3,471,921 | $4,624,065 |
| Portfolio turnover rateJ | 21%H | 21% | 19% | 23%K |
A For the period July 20, 2017 (commencement of sale of shares) to March 31, 2018.
B Calculated based on average shares outstanding during the period.
C Total distributions per share do not sum due to rounding.
D Total returns for periods of less than one year are not annualized.
E Total returns would have been lower if certain expenses had not been reduced during the applicable periods shown.
F Fees and expenses of any underlying mutual funds or exchange-traded funds (ETFs) are not included in the Fund's expense ratio. The Fund indirectly bears its proportionate share of these expenses. For additional expense information related to investments in Fidelity Central Funds, please refer to the "Investments in Fidelity Central Funds" note found in the Notes to Financial Statements section of the most recent Annual or Semi-Annual report.
G Expense ratios reflect operating expenses of the class. Expenses before reductions do not reflect amounts reimbursed, waived, or reduced through arrangements with the investment adviser, brokerage services, or other offset arrangements, if applicable, and do not represent the amount paid by the class during periods when reimbursements, waivers or reductions occur.
H Annualized
I On certain classes, the size and fluctuation of net assets and expense amounts may cause ratios to differ from contractual rates.
J Amount does not include the portfolio activity of any underlying mutual funds or exchange-traded funds (ETFs).
K The portfolio turnover rate does not include the assets acquired in the merger.
See accompanying notes which are an integral part of the financial statements.
Fidelity Freedom 2015 Fund Class K6
| | Six months ended (Unaudited) September 30, | Years endedMarch 31, | | |
| | 2020 | 2020 | 2019 | 2018 A |
| Selected Per–Share Data | | | | |
| Net asset value, beginning of period | $11.49 | $12.64 | $13.32 | $13.03 |
| Income from Investment Operations | | | | |
| Net investment income (loss)B | .05 | .25 | .25 | .21 |
| Net realized and unrealized gain (loss) | 1.75 | (.51) | .08 | .55 |
| Total from investment operations | 1.80 | (.26) | .33 | .76 |
| Distributions from net investment income | (.03) | (.27) | (.28) | (.18) |
| Distributions from net realized gain | (.35) | (.62) | (.73) | (.29) |
| Total distributions | (.37)C | (.89) | (1.01) | (.47) |
| Net asset value, end of period | $12.92 | $11.49 | $12.64 | $13.32 |
| Total ReturnD,E | 16.02% | (2.61)% | 2.87% | 5.80% |
| Ratios to Average Net AssetsF,G | | | | |
| Expenses before reductions | .40%H | .41% | .41% | .42%H |
| Expenses net of fee waivers, if any | .40%H | .41% | .41% | .42%H |
| Expenses net of all reductions | .40%H | .41% | .41% | .42%H |
| Net investment income (loss) | .82%H | 1.95% | 1.97% | 1.88%H |
| Supplemental Data | | | | |
| Net assets, end of period (000 omitted) | $670,284 | $561,675 | $488,156 | $114,268 |
| Portfolio turnover rateI | 21%H | 21% | 19% | 23%J |
A For the period June 7, 2017 (commencement of sale of shares) to March 31, 2018.
B Calculated based on average shares outstanding during the period.
C Total distributions per share do not sum due to rounding.
D Total returns for periods of less than one year are not annualized.
E Total returns would have been lower if certain expenses had not been reduced during the applicable periods shown.
F Fees and expenses of any underlying mutual funds or exchange-traded funds (ETFs) are not included in the Fund's expense ratio. The Fund indirectly bears its proportionate share of these expenses. For additional expense information related to investments in Fidelity Central Funds, please refer to the "Investments in Fidelity Central Funds" note found in the Notes to Financial Statements section of the most recent Annual or Semi-Annual report.
G Expense ratios reflect operating expenses of the class. Expenses before reductions do not reflect amounts reimbursed, waived, or reduced through arrangements with the investment adviser, brokerage services, or other offset arrangements, if applicable, and do not represent the amount paid by the class during periods when reimbursements, waivers or reductions occur.
H Annualized
I Amount does not include the portfolio activity of any underlying mutual funds or exchange-traded funds (ETFs).
J The portfolio turnover rate does not include the assets acquired in the merger.
See accompanying notes which are an integral part of the financial statements.
Fidelity Freedom® 2020 Fund
Investment Summary (Unaudited)
The information in the following tables is based on the direct investments of the Fund.
Top Holdings as of September 30, 2020
| | % of fund's net assets |
| Fidelity Series Investment Grade Bond Fund | 25.8 |
| Fidelity Series Emerging Markets Opportunities Fund | 9.6 |
| Fidelity Series Government Money Market Fund 0.16% | 7.2 |
| Fidelity Series Inflation-Protected Bond Index Fund | 7.0 |
| Fidelity Series Intrinsic Opportunities Fund | 4.4 |
| Fidelity Series Growth Company Fund | 4.2 |
| Fidelity Series International Growth Fund | 4.0 |
| Fidelity Series Overseas Fund | 4.0 |
| Fidelity Series International Value Fund | 3.9 |
| Fidelity Series Large Cap Stock Fund | 3.7 |
| | 73.8 |
Asset Allocation (% of fund's net assets)
| Period end |
| | Domestic Equity Funds | 28.7% |
| | International Equity Funds | 25.1% |
| | Bond Funds | 37.0% |
| | Short-Term Funds | 9.1% |
| | Short-Term Investments | 0.1% |

Domestic Equity Funds category includes Fidelity Series Commodity Strategy Fund which invests in commodity-related investments.
Fidelity Freedom® 2020 Fund
Schedule of Investments September 30, 2020 (Unaudited)
Showing Percentage of Net Assets
| U.S. Treasury Obligations - 0.1% | | | |
| | | Principal Amount | Value |
| U.S. Treasury Bills, yield at date of purchase 0.1% to 0.11% 12/3/20 to 12/10/20 (a) | | | |
| (Cost $20,406,144) | | 20,410,000 | 20,406,370 |
| | | Shares | Value |
|
| Domestic Equity Funds - 28.7% | | | |
| Fidelity Series All-Sector Equity Fund (b) | | 26,062,542 | $277,566,071 |
| Fidelity Series Blue Chip Growth Fund (b) | | 25,034,541 | 413,320,265 |
| Fidelity Series Commodity Strategy Fund (b) | | 150,325,193 | 625,352,804 |
| Fidelity Series Growth Company Fund (b) | | 39,886,674 | 1,045,429,731 |
| Fidelity Series Intrinsic Opportunities Fund (b) | | 69,277,861 | 1,095,975,763 |
| Fidelity Series Large Cap Stock Fund (b) | | 64,603,203 | 914,781,354 |
| Fidelity Series Large Cap Value Index Fund (b) | | 27,893,851 | 323,568,675 |
| Fidelity Series Opportunistic Insights Fund (b) | | 27,418,979 | 593,072,507 |
| Fidelity Series Small Cap Discovery Fund (b) | | 10,975,328 | 110,960,570 |
| Fidelity Series Small Cap Opportunities Fund (b) | | 29,127,392 | 371,665,524 |
| Fidelity Series Stock Selector Large Cap Value Fund (b) | | 69,297,124 | 762,268,366 |
| Fidelity Series Value Discovery Fund (b) | | 47,117,505 | 582,372,365 |
| TOTAL DOMESTIC EQUITY FUNDS | | | |
| (Cost $5,297,854,145) | | | 7,116,333,995 |
|
| International Equity Funds - 25.1% | | | |
| Fidelity Series Canada Fund (b) | | 32,362,079 | 331,064,066 |
| Fidelity Series Emerging Markets Fund (b) | | 28,332,922 | 267,179,453 |
| Fidelity Series Emerging Markets Opportunities Fund (b) | | 113,755,622 | 2,386,592,952 |
| Fidelity Series International Growth Fund (b) | | 52,145,745 | 979,297,090 |
| Fidelity Series International Small Cap Fund (b) | | 16,964,272 | 301,964,049 |
| Fidelity Series International Value Fund (b) | | 112,502,706 | 969,773,323 |
| Fidelity Series Overseas Fund (b) | | 87,467,805 | 977,890,061 |
| TOTAL INTERNATIONAL EQUITY FUNDS | | | |
| (Cost $4,902,431,962) | | | 6,213,760,994 |
|
| Bond Funds - 37.0% | | | |
| Fidelity Series Emerging Markets Debt Fund (b) | | 16,660,422 | 150,943,424 |
| Fidelity Series Floating Rate High Income Fund (b) | | 3,225,541 | 28,546,040 |
| Fidelity Series High Income Fund (b) | | 18,317,029 | 167,051,301 |
| Fidelity Series Inflation-Protected Bond Index Fund (b) | | 162,672,754 | 1,740,598,467 |
| Fidelity Series International Credit Fund (b) | | 2,008,279 | 20,906,183 |
| Fidelity Series Investment Grade Bond Fund (b) | | 521,190,842 | 6,379,375,898 |
| Fidelity Series Long-Term Treasury Bond Index Fund (b) | | 54,541,409 | 563,412,758 |
| Fidelity Series Real Estate Income Fund (b) | | 10,350,222 | 103,295,213 |
| TOTAL BOND FUNDS | | | |
| (Cost $8,457,807,653) | | | 9,154,129,284 |
|
| Short-Term Funds - 9.1% | | | |
| Fidelity Cash Central Fund 0.10% (c) | | 33,086,586 | 33,093,203 |
| Fidelity Series Government Money Market Fund 0.16% (b)(d) | | 1,771,613,198 | 1,771,613,198 |
| Fidelity Series Short-Term Credit Fund (b) | | 42,703,585 | 437,711,749 |
| TOTAL SHORT-TERM FUNDS | | | |
| (Cost $2,231,146,258) | | | 2,242,418,150 |
| TOTAL INVESTMENT IN SECURITIES - 100.0% | | | |
| (Cost $20,909,646,162) | | | 24,747,048,793 |
| NET OTHER ASSETS (LIABILITIES) - 0.0% | | | (2,180,000) |
| NET ASSETS - 100% | | | $24,744,868,793 |
| Futures Contracts | | | | | |
| | Number of contracts | Expiration Date | Notional Amount | Value | Unrealized Appreciation/(Depreciation) |
| Purchased | | | | | |
| Equity Index Contracts | | | | | |
| ICE E-mini MSCI EAFE Index Contracts (United States) | 172 | Dec. 2020 | $15,937,520 | $(401) | $(401) |
| Sold | | | | | |
| Equity Index Contracts | | | | | |
| CME E-mini S&P 500 Index Contracts (United States) | 954 | Dec. 2020 | 159,890,400 | (1,043,800) | (1,043,800) |
| TOTAL FUTURES CONTRACTS | | | | | $(1,044,201) |
The notional amount of futures purchased as a percentage of Net Assets is 0.1%
The notional amount of futures sold as a percentage of Net Assets is 0.6%
Legend
(a) Security or a portion of the security was pledged to cover margin requirements for futures contracts. At period end, the value of securities pledged amounted to $20,406,370.
(b) Affiliated Fund
(c) Affiliated fund that is generally available only to investment companies and other accounts managed by Fidelity Investments. The rate quoted is the annualized seven-day yield of the fund at period end. A complete unaudited listing of the fund's holdings as of its most recent quarter end is available upon request. In addition, each Fidelity Central Fund's financial statements are available on the SEC's website or upon request.
(d) The rate quoted is the annualized seven-day yield of the fund at period end.
Affiliated Central Funds
Information regarding fiscal year to date income earned by the Fund from investments in Fidelity Central Funds is as follows:
| Fund | Income earned |
| Fidelity Cash Central Fund | $31,341 |
| Total | $31,341 |
Affiliated Underlying Funds
Fiscal year to date information regarding the Fund's investments in affiliated Underlying Funds, excluding any Money Market Central Funds, is presented below. Exchanges between classes of the same affiliated Underlying Funds may occur.
| Affiliate | Value, beginning of period | Purchases | Sales Proceeds | Dividend Income | Realized Gain (loss) | Change in Unrealized appreciation (depreciation) | Value, end of period |
| Fidelity Series All-Sector Equity Fund | $222,157,681 | $105,608 | $21,832,650 | $-- | $(472,813) | $77,608,245 | $277,566,071 |
| Fidelity Series Blue Chip Growth Fund | 401,275,081 | 85,399,671 | 219,824,554 | 85,342,516 | 102,762,183 | 43,707,884 | 413,320,265 |
| Fidelity Series Canada Fund | 248,557,602 | 40,775,168 | 22,107,628 | -- | (1,814,924) | 65,653,848 | 331,064,066 |
| Fidelity Series Commodity Strategy Fund | 750,476,816 | 4,017,883 | 208,960,112 | 2,715,977 | (75,200,326) | 155,018,543 | 625,352,804 |
| Fidelity Series Emerging Markets Debt Fund | 141,311,043 | 4,093,549 | 11,748,499 | 4,030,480 | (653,351) | 17,940,682 | 150,943,424 |
| Fidelity Series Emerging Markets Fund | 167,501,987 | 56,842,826 | 23,395,006 | -- | 265,764 | 65,963,882 | 267,179,453 |
| Fidelity Series Emerging Markets Opportunities Fund | 1,611,797,769 | 429,438,837 | 282,702,639 | -- | 22,139,334 | 605,919,651 | 2,386,592,952 |
| Fidelity Series Floating Rate High Income Fund | 27,965,717 | 666,319 | 2,842,376 | 651,063 | (365,188) | 3,121,568 | 28,546,040 |
| Fidelity Series Government Money Market Fund 0.16% | 2,093,461,675 | 360,330,445 | 682,178,922 | 2,204,688 | -- | -- | 1,771,613,198 |
| Fidelity Series Growth Company Fund | 832,687,196 | 21,527 | 319,923,027 | -- | 188,448,968 | 344,195,067 | 1,045,429,731 |
| Fidelity Series High Income Fund | 159,771,045 | 4,709,258 | 14,211,901 | 4,632,958 | (684,835) | 17,467,734 | 167,051,301 |
| Fidelity Series Inflation-Protected Bond Index Fund | 1,621,478,041 | 223,742,445 | 203,822,108 | 1,355,118 | 1,586,710 | 97,613,379 | 1,740,598,467 |
| Fidelity Series International Credit Fund | 18,914,504 | 293,955 | -- | 293,956 | -- | 1,697,724 | 20,906,183 |
| Fidelity Series International Growth Fund | 1,133,838,427 | 9,493,431 | 441,312,279 | -- | 151,859,972 | 125,417,539 | 979,297,090 |
| Fidelity Series International Small Cap Fund | 263,405,367 | 403,008 | 43,261,712 | -- | 8,152,469 | 73,264,917 | 301,964,049 |
| Fidelity Series International Value Fund | 968,459,791 | 34,637,230 | 221,327,262 | -- | (31,879,111) | 219,882,675 | 969,773,323 |
| Fidelity Series Intrinsic Opportunities Fund | 946,427,431 | 15,516,834 | 90,484,762 | 15,076,739 | 2,018,006 | 222,498,254 | 1,095,975,763 |
| Fidelity Series Investment Grade Bond Fund | 5,933,297,925 | 828,643,002 | 739,323,690 | 80,705,095 | 1,094,877 | 355,663,784 | 6,379,375,898 |
| Fidelity Series Large Cap Stock Fund | 799,693,788 | 56,036,139 | 87,691,228 | 33,219,092 | 5,239,801 | 141,502,854 | 914,781,354 |
| Fidelity Series Large Cap Value Index Fund | 219,571,867 | 85,618,812 | 24,548,123 | -- | (1,005,446) | 43,931,565 | 323,568,675 |
| Fidelity Series Long-Term Treasury Bond Index Fund | 584,777,693 | 120,403,319 | 125,261,005 | 14,635,602 | 13,836,050 | (30,343,299) | 563,412,758 |
| Fidelity Series Opportunistic Insights Fund | 451,089,896 | 217,225 | 39,174,211 | -- | 18,701,670 | 162,237,927 | 593,072,507 |
| Fidelity Series Overseas Fund | 938,368,150 | 38,357,687 | 259,637,953 | -- | (17,613,188) | 278,415,365 | 977,890,061 |
| Fidelity Series Real Estate Income Fund | 92,134,606 | 3,406,696 | 8,908,442 | 3,356,564 | (738,457) | 17,400,810 | 103,295,213 |
| Fidelity Series Short-Term Credit Fund | 419,604,884 | 4,763,359 | 2,319,078 | 4,761,865 | (6,637) | 15,669,221 | 437,711,749 |
| Fidelity Series Small Cap Discovery Fund | 89,019,997 | 356,591 | 8,845,608 | 309,668 | (608,054) | 31,037,644 | 110,960,570 |
| Fidelity Series Small Cap Opportunities Fund | 311,295,228 | 9,397,737 | 28,818,594 | 2,247,206 | 1,546,746 | 78,244,407 | 371,665,524 |
| Fidelity Series Stock Selector Large Cap Value Fund | 585,596,818 | 113,896,053 | 67,583,835 | -- | (914,149) | 131,273,479 | 762,268,366 |
| Fidelity Series Value Discovery Fund | 436,835,697 | 86,880,696 | 45,615,605 | -- | (616,946) | 104,888,523 | 582,372,365 |
| | $22,470,773,722 | $2,618,465,310 | $4,247,662,809 | $255,538,587 | $385,079,125 | $3,466,893,872 | $24,693,549,220 |
Amounts in the income column in the above table include any capital gain distributions from underlying funds, which are presented in the corresponding line-item in the Statement of Operations, if applicable.
Investment Valuation
The following is a summary of the inputs used, as of September 30, 2020, involving the Fund's assets and liabilities carried at fair value. The inputs or methodology used for valuing securities may not be an indication of the risk associated with investing in those securities. For more information on valuation inputs, and their aggregation into the levels used below, please refer to the Investment Valuation section in the accompanying Notes to Financial Statements.
| | Valuation Inputs at Reporting Date: |
| Description | Total | Level 1 | Level 2 | Level 3 |
| Investments in Securities: | | | | |
| Other Short-Term Investments | $20,406,370 | $-- | $20,406,370 | $-- |
| Domestic Equity Funds | 7,116,333,995 | 7,116,333,995 | -- | -- |
| International Equity Funds | 6,213,760,994 | 6,213,760,994 | -- | -- |
| Bond Funds | 9,154,129,284 | 9,154,129,284 | -- | -- |
| Short-Term Funds | 2,242,418,150 | 2,242,418,150 | -- | -- |
| Total Investments in Securities: | $24,747,048,793 | $24,726,642,423 | $20,406,370 | $-- |
| Derivative Instruments: | | | | |
| Liabilities | | | | |
| Futures Contracts | $(1,044,201) | $(1,044,201) | $-- | $-- |
| Total Liabilities | $(1,044,201) | $(1,044,201) | $-- | $-- |
| Total Derivative Instruments: | $(1,044,201) | $(1,044,201) | $-- | $-- |
Value of Derivative Instruments
The following table is a summary of the Fund's value of derivative instruments by primary risk exposure as of September 30, 2020. For additional information on derivative instruments, please refer to the Derivative Instruments section in the accompanying Notes to Financial Statements.
| Primary Risk Exposure / Derivative Type | Value |
| | Asset | Liability |
| Equity Risk | | |
| Futures Contracts(a) | $0 | $(1,044,201) |
| Total Equity Risk | 0 | (1,044,201) |
| Total Value of Derivatives | $0 | $(1,044,201) |
(a) Reflects gross cumulative appreciation (depreciation) on futures contracts as presented in the Schedule of Investments. In the Statement of Assets and Liabilities, the period end daily variation margin is included in receivable or payable for daily variation margin on futures contracts, and the net cumulative appreciation (depreciation) is included in Total accumulated earnings (loss).
See accompanying notes which are an integral part of the financial statements.
Fidelity Freedom® 2020 Fund
Financial Statements
Statement of Assets and Liabilities
| | | September 30, 2020 (Unaudited) |
| Assets | | |
Investment in securities, at value — See accompanying schedule:
Unaffiliated issuers (cost $20,406,144) | $20,406,370 | |
| Fidelity Central Funds (cost $33,092,342) | 33,093,203 | |
| Other affiliated issuers (cost $20,856,147,676) | 24,693,549,220 | |
| Total Investment in Securities (cost $20,909,646,162) | | $24,747,048,793 |
| Receivable for investments sold | | 254,968,566 |
| Receivable for fund shares sold | | 11,864,982 |
| Distributions receivable from Fidelity Central Funds | | 2,862 |
| Other receivables | | 260,173 |
| Total assets | | 25,014,145,376 |
| Liabilities | | |
| Payable for investments purchased | $235,031,096 | |
| Payable for fund shares redeemed | 21,050,500 | |
| Accrued management fee | 11,321,045 | |
| Payable for daily variation margin on futures contracts | 1,613,775 | |
| Other payables and accrued expenses | 260,167 | |
| Total liabilities | | 269,276,583 |
| Net Assets | | $24,744,868,793 |
| Net Assets consist of: | | |
| Paid in capital | | $20,414,484,142 |
| Total accumulated earnings (loss) | | 4,330,384,651 |
| Net Assets | | $24,744,868,793 |
| Net Asset Value and Maximum Offering Price | | |
| Fidelity Freedom 2020 Fund: | | |
| Net Asset Value, offering price and redemption price per share ($11,817,140,506 ÷ 725,004,643 shares) | | $16.30 |
| Class K: | | |
| Net Asset Value, offering price and redemption price per share ($10,524,080,904 ÷ 646,162,289 shares) | | $16.29 |
| Class K6: | | |
| Net Asset Value, offering price and redemption price per share ($2,403,647,383 ÷ 147,909,659 shares) | | $16.25 |
See accompanying notes which are an integral part of the financial statements.
Statement of Operations
| | | Six months ended September 30, 2020 (Unaudited) |
| Investment Income | | |
| Dividends: | | |
| Affiliated issuers | | $140,861,917 |
| Interest | | 26,159 |
| Income from Fidelity Central Funds | | 31,341 |
| Total income | | 140,919,417 |
| Expenses | | |
| Management fee | $66,228,219 | |
| Independent trustees' fees and expenses | 33,663 | |
| Total expenses before reductions | 66,261,882 | |
| Expense reductions | (131) | |
| Total expenses after reductions | | 66,261,751 |
| Net investment income (loss) | | 74,657,666 |
| Realized and Unrealized Gain (Loss) | | |
| Net realized gain (loss) on: | | |
| Investment securities: | | |
| Fidelity Central Funds | (5,286) | |
| Other affiliated issuers | 385,079,125 | |
| Futures contracts | (25,687,207) | |
| Capital gain distributions from underlying funds: | | |
| Affiliated issuers | 114,676,670 | |
| Total net realized gain (loss) | | 474,063,302 |
| Change in net unrealized appreciation (depreciation) on: | | |
| Investment securities: | | |
| Unaffiliated issuers | (13,436) | |
| Fidelity Central Funds | (1,220) | |
| Other affiliated issuers | 3,466,893,872 | |
| Futures contracts | (1,044,201) | |
| Total change in net unrealized appreciation (depreciation) | | 3,465,835,015 |
| Net gain (loss) | | 3,939,898,317 |
| Net increase (decrease) in net assets resulting from operations | | $4,014,555,983 |
See accompanying notes which are an integral part of the financial statements.
Statement of Changes in Net Assets
| | Six months ended September 30, 2020 (Unaudited) | Year ended March 31, 2020 |
| Increase (Decrease) in Net Assets | | |
| Operations | | |
| Net investment income (loss) | $74,657,666 | $485,104,275 |
| Net realized gain (loss) | 474,063,302 | 1,259,186,387 |
| Change in net unrealized appreciation (depreciation) | 3,465,835,015 | (2,580,993,899) |
| Net increase (decrease) in net assets resulting from operations | 4,014,555,983 | (836,703,237) |
| Distributions to shareholders | (711,013,958) | (1,779,102,780) |
| Share transactions - net increase (decrease) | (1,107,511,259) | (2,571,249,276) |
| Total increase (decrease) in net assets | 2,196,030,766 | (5,187,055,293) |
| Net Assets | | |
| Beginning of period | 22,548,838,027 | 27,735,893,320 |
| End of period | $24,744,868,793 | $22,548,838,027 |
See accompanying notes which are an integral part of the financial statements.
Financial Highlights
Fidelity Freedom 2020 Fund
| | Six months ended (Unaudited) September 30, | Years endedMarch 31, | | | | |
| | 2020 | 2020 | 2019 | 2018 | 2017 | 2016 |
| Selected Per–Share Data | | | | | | |
| Net asset value, beginning of period | $14.21 | $15.83 | $16.51 | $15.70 | $14.63 | $15.76 |
| Income from Investment Operations | | | | | | |
| Net investment income (loss)A | .04 | .28 | .28 | .22 | .25 | .28 |
| Net realized and unrealized gain (loss) | 2.50 | (.84) | .10 | 1.34 | 1.40 | (.60) |
| Total from investment operations | 2.54 | (.56) | .38 | 1.56 | 1.65 | (.32) |
| Distributions from net investment income | (.02) | (.30) | (.28) | (.22) | (.26) | (.28) |
| Distributions from net realized gain | (.44) | (.76) | (.78) | (.52) | (.32) | (.53) |
| Total distributions | (.45)B | (1.06) | (1.06) | (.75)B | (.58) | (.81) |
| Net asset value, end of period | $16.30 | $14.21 | $15.83 | $16.51 | $15.70 | $14.63 |
| Total ReturnC,D | 18.25% | (4.15)% | 2.66% | 10.01% | 11.57% | (2.10)% |
| Ratios to Average Net AssetsE,F | | | | | | |
| Expenses before reductions | .59%G | .60% | .61% | .52% | - %H | - %H |
| Expenses net of fee waivers, if any | .59%G | .60% | .61% | .52% | -% | -% |
| Expenses net of all reductions | .59%G | .60% | .61% | .52% | -% | -% |
| Net investment income (loss) | .56%G | 1.76% | 1.76% | 1.34% | 1.69% | 1.83% |
| Supplemental Data | | | | | | |
| Net assets, end of period (000 omitted) | $11,817,140 | $10,620,621 | $12,395,049 | $12,916,078 | $12,279,240 | $11,732,980 |
| Portfolio turnover rateI | 22%G | 23% | 19% | 21%J | 19% | 17% |
A Calculated based on average shares outstanding during the period.
B Total distributions per share do not sum due to rounding.
C Total returns for periods of less than one year are not annualized.
D Total returns would have been lower if certain expenses had not been reduced during the applicable periods shown.
E Fees and expenses of any underlying mutual funds or exchange-traded funds (ETFs) are not included in the Fund's expense ratio. The Fund indirectly bears its proportionate share of these expenses. For additional expense information related to investments in Fidelity Central Funds, please refer to the "Investments in Fidelity Central Funds" note found in the Notes to Financial Statements section of the most recent Annual or Semi-Annual report.
F Expense ratios reflect operating expenses of the class. Expenses before reductions do not reflect amounts reimbursed, waived, or reduced through arrangements with the investment adviser, brokerage services, or other offset arrangements, if applicable, and do not represent the amount paid by the class during periods when reimbursements, waivers or reductions occur.
G Annualized
H Amount represents less than .005%.
I Amount does not include the portfolio activity of any underlying mutual funds or exchange-traded funds (ETFs).
J The portfolio turnover rate does not include the assets acquired in the merger.
See accompanying notes which are an integral part of the financial statements.
Fidelity Freedom 2020 Fund Class K
| | Six months ended (Unaudited) September 30, | Years endedMarch 31, | | |
| | 2020 | 2020 | 2019 | 2018 A |
| Selected Per–Share Data | | | | |
| Net asset value, beginning of period | $14.20 | $15.81 | $16.49 | $16.24 |
| Income from Investment Operations | | | | |
| Net investment income (loss)B | .05 | .29 | .29 | .27 |
| Net realized and unrealized gain (loss) | 2.50 | (.83) | .10 | .50 |
| Total from investment operations | 2.55 | (.54) | .39 | .77 |
| Distributions from net investment income | (.02) | (.31) | (.29) | (.21) |
| Distributions from net realized gain | (.44) | (.76) | (.78) | (.31) |
| Total distributions | (.46) | (1.07) | (1.07) | (.52) |
| Net asset value, end of period | $16.29 | $14.20 | $15.81 | $16.49 |
| Total ReturnC,D | 18.29% | (4.04)% | 2.73% | 4.73% |
| Ratios to Average Net AssetsE,F | | | | |
| Expenses before reductions | .52%G | .52% | .53% | .54%G |
| Expenses net of fee waivers, if any | .52%G | .52% | .53% | .54%G |
| Expenses net of all reductions | .52%G | .52% | .53% | .54%G |
| Net investment income (loss) | .64%G | 1.84% | 1.84% | 2.34%G |
| Supplemental Data | | | | |
| Net assets, end of period (000 omitted) | $10,524,081 | $9,840,293 | $13,509,101 | $16,611,072 |
| Portfolio turnover rateH | 22%G | 23% | 19% | 21%I |
A For the period July 20, 2017 (commencement of sale of shares) to March 31, 2018.
B Calculated based on average shares outstanding during the period.
C Total returns for periods of less than one year are not annualized.
D Total returns would have been lower if certain expenses had not been reduced during the applicable periods shown.
E Fees and expenses of any underlying mutual funds or exchange-traded funds (ETFs) are not included in the Fund's expense ratio. The Fund indirectly bears its proportionate share of these expenses. For additional expense information related to investments in Fidelity Central Funds, please refer to the "Investments in Fidelity Central Funds" note found in the Notes to Financial Statements section of the most recent Annual or Semi-Annual report.
F Expense ratios reflect operating expenses of the class. Expenses before reductions do not reflect amounts reimbursed, waived, or reduced through arrangements with the investment adviser, brokerage services, or other offset arrangements, if applicable, and do not represent the amount paid by the class during periods when reimbursements, waivers or reductions occur.
G Annualized
H Amount does not include the portfolio activity of any underlying mutual funds or exchange-traded funds (ETFs).
I The portfolio turnover rate does not include the assets acquired in the merger.
See accompanying notes which are an integral part of the financial statements.
Fidelity Freedom 2020 Fund Class K6
| | Six months ended (Unaudited) September 30, | Years endedMarch 31, | | |
| | 2020 | 2020 | 2019 | 2018 A |
| Selected Per–Share Data | | | | |
| Net asset value, beginning of period | $14.16 | $15.78 | $16.50 | $16.00 |
| Income from Investment Operations | | | | |
| Net investment income (loss)B | .06 | .31 | .30 | .24 |
| Net realized and unrealized gain (loss) | 2.49 | (.83) | .10 | .79 |
| Total from investment operations | 2.55 | (.52) | .40 | 1.03 |
| Distributions from net investment income | (.03) | (.34) | (.34) | (.22) |
| Distributions from net realized gain | (.44) | (.76) | (.78) | (.31) |
| Total distributions | (.46)C | (1.10) | (1.12) | (.53) |
| Net asset value, end of period | $16.25 | $14.16 | $15.78 | $16.50 |
| Total ReturnD,E | 18.37% | (3.96)% | 2.80% | 6.40% |
| Ratios to Average Net AssetsF,G | | | | |
| Expenses before reductions | .42%H | .43% | .43% | .44%H |
| Expenses net of fee waivers, if any | .42%H | .43% | .43% | .44%H |
| Expenses net of all reductions | .42%H | .43% | .43% | .44%H |
| Net investment income (loss) | .73%H | 1.93% | 1.94% | 1.79%H |
| Supplemental Data | | | | |
| Net assets, end of period (000 omitted) | $2,403,647 | $2,087,924 | $1,831,743 | $474,981 |
| Portfolio turnover rateI | 22%H | 23% | 19% | 21%J |
A For the period June 7, 2017 (commencement of sale of shares) to March 31, 2018.
B Calculated based on average shares outstanding during the period.
C Total distributions per share do not sum due to rounding.
D Total returns for periods of less than one year are not annualized.
E Total returns would have been lower if certain expenses had not been reduced during the applicable periods shown.
F Fees and expenses of any underlying mutual funds or exchange-traded funds (ETFs) are not included in the Fund's expense ratio. The Fund indirectly bears its proportionate share of these expenses. For additional expense information related to investments in Fidelity Central Funds, please refer to the "Investments in Fidelity Central Funds" note found in the Notes to Financial Statements section of the most recent Annual or Semi-Annual report.
G Expense ratios reflect operating expenses of the class. Expenses before reductions do not reflect amounts reimbursed, waived, or reduced through arrangements with the investment adviser, brokerage services, or other offset arrangements, if applicable, and do not represent the amount paid by the class during periods when reimbursements, waivers or reductions occur.
H Annualized
I Amount does not include the portfolio activity of any underlying mutual funds or exchange-traded funds (ETFs).
J The portfolio turnover rate does not include the assets acquired in the merger.
See accompanying notes which are an integral part of the financial statements.
Fidelity Freedom® 2025 Fund
Investment Summary (Unaudited)
The information in the following tables is based on the direct investments of the Fund.
Top Holdings as of September 30, 2020
| | % of fund's net assets |
| Fidelity Series Investment Grade Bond Fund | 23.2 |
| Fidelity Series Emerging Markets Opportunities Fund | 10.3 |
| Fidelity Series Inflation-Protected Bond Index Fund | 6.3 |
| Fidelity Series Intrinsic Opportunities Fund | 5.1 |
| Fidelity Series Growth Company Fund | 4.9 |
| Fidelity Series Government Money Market Fund 0.16% | 4.8 |
| Fidelity Series International Growth Fund | 4.5 |
| Fidelity Series Overseas Fund | 4.4 |
| Fidelity Series International Value Fund | 4.4 |
| Fidelity Series Large Cap Stock Fund | 4.3 |
| | 72.2 |
Asset Allocation (% of fund's net assets)
| Period end |
| | Domestic Equity Funds | 32.6% |
| | International Equity Funds | 27.7% |
| | Bond Funds | 33.6% |
| | Short-Term Funds | 6.0% |
| | Short-Term Investments | 0.1% |

Domestic Equity Funds category includes Fidelity Series Commodity Strategy Fund which invests in commodity-related investments.
Fidelity Freedom® 2025 Fund
Schedule of Investments September 30, 2020 (Unaudited)
Showing Percentage of Net Assets
| U.S. Treasury Obligations - 0.1% | | | |
| | | Principal Amount | Value |
| U.S. Treasury Bills, yield at date of purchase 0.1% to 0.11% 12/3/20 to 12/10/20 (a) | | | |
| (Cost $27,924,786) | | 27,930,000 | 27,925,036 |
| | | Shares | Value |
|
| Domestic Equity Funds - 32.6% | | | |
| Fidelity Series All-Sector Equity Fund (b) | | 33,849,500 | $360,497,177 |
| Fidelity Series Blue Chip Growth Fund (b) | | 32,658,461 | 539,191,183 |
| Fidelity Series Commodity Strategy Fund (b) | | 166,240,968 | 691,562,425 |
| Fidelity Series Growth Company Fund (b) | | 52,174,744 | 1,367,500,040 |
| Fidelity Series Intrinsic Opportunities Fund (b) | | 89,907,199 | 1,422,331,891 |
| Fidelity Series Large Cap Stock Fund (b) | | 84,272,494 | 1,193,298,512 |
| Fidelity Series Large Cap Value Index Fund (b) | | 36,386,904 | 422,088,086 |
| Fidelity Series Opportunistic Insights Fund (b) | | 35,594,036 | 769,899,007 |
| Fidelity Series Small Cap Discovery Fund (b) | | 14,359,192 | 145,171,429 |
| Fidelity Series Small Cap Opportunities Fund (b) | | 37,805,859 | 482,402,756 |
| Fidelity Series Stock Selector Large Cap Value Fund (b) | | 90,395,414 | 994,349,549 |
| Fidelity Series Value Discovery Fund (b) | | 61,462,967 | 759,682,267 |
| TOTAL DOMESTIC EQUITY FUNDS | | | |
| (Cost $7,064,964,656) | | | 9,147,974,322 |
|
| International Equity Funds - 27.7% | | | |
| Fidelity Series Canada Fund (b) | | 41,040,800 | 419,847,382 |
| Fidelity Series Emerging Markets Fund (b) | | 34,313,253 | 323,573,977 |
| Fidelity Series Emerging Markets Opportunities Fund (b) | | 137,648,346 | 2,887,862,307 |
| Fidelity Series International Growth Fund (b) | | 66,575,443 | 1,250,286,821 |
| Fidelity Series International Small Cap Fund (b) | | 21,516,105 | 382,986,667 |
| Fidelity Series International Value Fund (b) | | 143,420,693 | 1,236,286,374 |
| Fidelity Series Overseas Fund (b) | | 111,672,059 | 1,248,493,622 |
| TOTAL INTERNATIONAL EQUITY FUNDS | | | |
| (Cost $6,300,564,447) | | | 7,749,337,150 |
|
| Bond Funds - 33.6% | | | |
| Fidelity Series Emerging Markets Debt Fund (b) | | 18,577,883 | 168,315,617 |
| Fidelity Series Floating Rate High Income Fund (b) | | 3,521,636 | 31,166,477 |
| Fidelity Series High Income Fund (b) | | 20,837,163 | 190,034,931 |
| Fidelity Series Inflation-Protected Bond Index Fund (b) | | 164,135,669 | 1,756,251,660 |
| Fidelity Series International Credit Fund (b) | | 1,726,089 | 17,968,587 |
| Fidelity Series Investment Grade Bond Fund (b) | | 532,003,470 | 6,511,722,473 |
| Fidelity Series Long-Term Treasury Bond Index Fund (b) | | 61,767,689 | 638,060,228 |
| Fidelity Series Real Estate Income Fund (b) | | 11,562,255 | 115,391,300 |
| TOTAL BOND FUNDS | | | |
| (Cost $8,767,807,899) | | | 9,428,911,273 |
|
| Short-Term Funds - 6.0% | | | |
| Fidelity Cash Central Fund 0.10% (c) | | 31,296,426 | 31,302,686 |
| Fidelity Series Government Money Market Fund 0.16% (b)(d) | | 1,353,693,095 | 1,353,693,095 |
| Fidelity Series Short-Term Credit Fund (b) | | 28,836,441 | 295,573,518 |
| TOTAL SHORT-TERM FUNDS | | | |
| (Cost $1,673,065,797) | | | 1,680,569,299 |
| TOTAL INVESTMENT IN SECURITIES - 100.0% | | | |
| (Cost $23,834,327,585) | | | 28,034,717,080 |
| NET OTHER ASSETS (LIABILITIES) - 0.0% | | | (1,569,735) |
| NET ASSETS - 100% | | | $28,033,147,345 |
| Futures Contracts | | | | | |
| | Number of contracts | Expiration Date | Notional Amount | Value | Unrealized Appreciation/(Depreciation) |
| Purchased | | | | | |
| Equity Index Contracts | | | | | |
| ICE E-mini MSCI EAFE Index Contracts (United States) | 321 | Dec. 2020 | $29,743,860 | $(110,698) | $(110,698) |
| ICE E-mini MSCI Emerging Markets Index Contracts (United States) | 559 | Dec. 2020 | 30,423,575 | (12,482) | (12,482) |
|
| TOTAL PURCHASED | | | | | (123,180) |
|
| Sold | | | | | |
| Equity Index Contracts | | | | | |
| CME E-mini S&P 500 Index Contracts (United States) | 1,151 | Dec. 2020 | 192,907,600 | (1,259,344) | (1,259,344) |
| TOTAL FUTURES CONTRACTS | | | | | $(1,382,524) |
The notional amount of futures purchased as a percentage of Net Assets is 0.2%
The notional amount of futures sold as a percentage of Net Assets is 0.7%
Legend
(a) Security or a portion of the security was pledged to cover margin requirements for futures contracts. At period end, the value of securities pledged amounted to $27,925,036.
(b) Affiliated Fund
(c) Affiliated fund that is generally available only to investment companies and other accounts managed by Fidelity Investments. The rate quoted is the annualized seven-day yield of the fund at period end. A complete unaudited listing of the fund's holdings as of its most recent quarter end is available upon request. In addition, each Fidelity Central Fund's financial statements are available on the SEC's website or upon request.
(d) The rate quoted is the annualized seven-day yield of the fund at period end.
Affiliated Central Funds
Information regarding fiscal year to date income earned by the Fund from investments in Fidelity Central Funds is as follows:
| Fund | Income earned |
| Fidelity Cash Central Fund | $33,275 |
| Total | $33,275 |
Affiliated Underlying Funds
Fiscal year to date information regarding the Fund's investments in affiliated Underlying Funds, excluding any Money Market Central Funds, is presented below. Exchanges between classes of the same affiliated Underlying Funds may occur.
| Affiliate | Value, beginning of period | Purchases | Sales Proceeds | Dividend Income | Realized Gain (loss) | Change in Unrealized appreciation (depreciation) | Value, end of period |
| Fidelity Series All-Sector Equity Fund | $278,497,907 | $1,228,118 | $17,120,939 | $-- | $(1,727,807) | $99,619,898 | $360,497,177 |
| Fidelity Series Blue Chip Growth Fund | 503,166,574 | 112,750,420 | 256,713,189 | 111,134,276 | 118,564,583 | 61,422,795 | 539,191,183 |
| Fidelity Series Canada Fund | 305,536,416 | 48,480,294 | 10,821,492 | -- | (594,575) | 77,246,739 | 419,847,382 |
| Fidelity Series Commodity Strategy Fund | 813,387,775 | 10,917,301 | 221,556,100 | 2,989,561 | (92,298,791) | 181,112,240 | 691,562,425 |
| Fidelity Series Emerging Markets Debt Fund | 152,149,526 | 5,132,825 | 7,718,972 | 4,411,073 | (115,838) | 18,868,076 | 168,315,617 |
| Fidelity Series Emerging Markets Fund | 197,869,090 | 65,931,578 | 18,567,522 | -- | 148,155 | 78,192,676 | 323,573,977 |
| Fidelity Series Emerging Markets Opportunities Fund | 1,907,368,420 | 494,690,591 | 254,943,443 | -- | 9,125,921 | 731,620,818 | 2,887,862,307 |
| Fidelity Series Floating Rate High Income Fund | 29,249,471 | 869,103 | 1,867,492 | 694,488 | (169,614) | 3,085,009 | 31,166,477 |
| Fidelity Series Government Money Market Fund 0.16% | 1,608,157,933 | 387,642,220 | 642,107,058 | 1,654,636 | -- | -- | 1,353,693,095 |
| Fidelity Series Growth Company Fund | 1,045,601,982 | 3,516,579 | 350,527,304 | -- | 202,638,938 | 466,269,845 | 1,367,500,040 |
| Fidelity Series High Income Fund | 174,793,716 | 6,034,786 | 9,337,469 | 5,161,697 | (277,736) | 18,821,634 | 190,034,931 |
| Fidelity Series Inflation-Protected Bond Index Fund | 1,564,983,539 | 258,318,444 | 164,414,253 | 1,329,251 | 922,573 | 96,441,357 | 1,756,251,660 |
| Fidelity Series International Credit Fund | 16,256,765 | 252,651 | -- | 252,651 | -- | 1,459,171 | 17,968,587 |
| Fidelity Series International Growth Fund | 1,366,267,212 | 13,478,211 | 470,939,469 | -- | 131,637,613 | 209,843,254 | 1,250,286,821 |
| Fidelity Series International Small Cap Fund | 317,352,794 | 1,374,427 | 37,084,474 | -- | 4,422,906 | 96,921,014 | 382,986,667 |
| Fidelity Series International Value Fund | 1,172,297,947 | 43,873,597 | 211,648,264 | -- | (36,543,827) | 268,306,921 | 1,236,286,374 |
| Fidelity Series Intrinsic Opportunities Fund | 1,186,447,102 | 24,568,018 | 72,787,263 | 19,481,905 | (3,269,537) | 287,373,571 | 1,422,331,891 |
| Fidelity Series Investment Grade Bond Fund | 5,763,712,548 | 980,098,613 | 581,878,538 | 80,260,959 | (957,209) | 350,747,059 | 6,511,722,473 |
| Fidelity Series Large Cap Stock Fund | 1,006,415,403 | 72,066,714 | 70,460,796 | 42,621,822 | 2,427,547 | 182,849,644 | 1,193,298,512 |
| Fidelity Series Large Cap Value Index Fund | 276,213,383 | 107,834,908 | 17,540,363 | -- | (1,033,400) | 56,613,558 | 422,088,086 |
| Fidelity Series Long-Term Treasury Bond Index Fund | 624,897,761 | 145,694,962 | 114,372,695 | 15,944,723 | 12,756,344 | (30,916,144) | 638,060,228 |
| Fidelity Series Opportunistic Insights Fund | 566,775,854 | 2,776,228 | 29,664,278 | -- | 11,301,217 | 218,709,986 | 769,899,007 |
| Fidelity Series Overseas Fund | 1,139,056,795 | 35,256,365 | 245,750,621 | -- | (16,760,604) | 336,691,687 | 1,248,493,622 |
| Fidelity Series Real Estate Income Fund | 98,916,856 | 4,242,879 | 5,851,487 | 3,695,737 | (697,379) | 18,780,431 | 115,391,300 |
| Fidelity Series Short-Term Credit Fund | 282,038,735 | 3,446,905 | 480,005 | 3,214,882 | (7,009) | 10,574,892 | 295,573,518 |
| Fidelity Series Small Cap Discovery Fund | 112,176,883 | 1,023,455 | 6,732,773 | 395,880 | (463,764) | 39,167,628 | 145,171,429 |
| Fidelity Series Small Cap Opportunities Fund | 391,999,124 | 10,525,695 | 21,023,494 | 2,903,283 | (267,914) | 101,169,345 | 482,402,756 |
| Fidelity Series Stock Selector Large Cap Value Fund | 737,278,105 | 140,283,403 | 50,021,607 | -- | (2,100,887) | 168,910,535 | 994,349,549 |
| Fidelity Series Value Discovery Fund | 549,452,739 | 109,803,419 | 32,606,463 | -- | (427,632) | 133,460,204 | 759,682,267 |
| | $24,188,318,355 | $3,092,112,709 | $3,924,537,823 | $296,146,824 | $336,232,274 | $4,283,363,843 | $27,975,489,358 |
Amounts in the income column in the above table include any capital gain distributions from underlying funds, which are presented in the corresponding line-item in the Statement of Operations, if applicable.
Investment Valuation
The following is a summary of the inputs used, as of September 30, 2020, involving the Fund's assets and liabilities carried at fair value. The inputs or methodology used for valuing securities may not be an indication of the risk associated with investing in those securities. For more information on valuation inputs, and their aggregation into the levels used below, please refer to the Investment Valuation section in the accompanying Notes to Financial Statements.
| | Valuation Inputs at Reporting Date: |
| Description | Total | Level 1 | Level 2 | Level 3 |
| Investments in Securities: | | | | |
| Other Short-Term Investments | $27,925,036 | $-- | $27,925,036 | $-- |
| Domestic Equity Funds | 9,147,974,322 | 9,147,974,322 | -- | -- |
| International Equity Funds | 7,749,337,150 | 7,749,337,150 | -- | -- |
| Bond Funds | 9,428,911,273 | 9,428,911,273 | -- | -- |
| Short-Term Funds | 1,680,569,299 | 1,680,569,299 | -- | -- |
| Total Investments in Securities: | $28,034,717,080 | $28,006,792,044 | $27,925,036 | $-- |
| Derivative Instruments: | | �� | | |
| Liabilities | | | | |
| Futures Contracts | $(1,382,524) | $(1,382,524) | $-- | $-- |
| Total Liabilities | $(1,382,524) | $(1,382,524) | $-- | $-- |
| Total Derivative Instruments: | $(1,382,524) | $(1,382,524) | $-- | $-- |
Value of Derivative Instruments
The following table is a summary of the Fund's value of derivative instruments by primary risk exposure as of September 30, 2020. For additional information on derivative instruments, please refer to the Derivative Instruments section in the accompanying Notes to Financial Statements.
| Primary Risk Exposure / Derivative Type | Value |
| | Asset | Liability |
| Equity Risk | | |
| Futures Contracts(a) | $0 | $(1,382,524) |
| Total Equity Risk | 0 | (1,382,524) |
| Total Value of Derivatives | $0 | $(1,382,524) |
(a) Reflects gross cumulative appreciation (depreciation) on futures contracts as presented in the Schedule of Investments. In the Statement of Assets and Liabilities, the period end daily variation margin is included in receivable or payable for daily variation margin on futures contracts, and the net cumulative appreciation (depreciation) is included in Total accumulated earnings (loss).
See accompanying notes which are an integral part of the financial statements.
Fidelity Freedom® 2025 Fund
Financial Statements
Statement of Assets and Liabilities
| | | September 30, 2020 (Unaudited) |
| Assets | | |
Investment in securities, at value — See accompanying schedule:
Unaffiliated issuers (cost $27,924,786) | $27,925,036 | |
| Fidelity Central Funds (cost $31,301,590) | 31,302,686 | |
| Other affiliated issuers (cost $23,775,101,209) | 27,975,489,358 | |
| Total Investment in Securities (cost $23,834,327,585) | | $28,034,717,080 |
| Receivable for investments sold | | 273,587,740 |
| Receivable for fund shares sold | | 21,051,593 |
| Distributions receivable from Fidelity Central Funds | | 2,747 |
| Total assets | | 28,329,359,160 |
| Liabilities | | |
| Payable for investments purchased | $259,417,395 | |
| Payable for fund shares redeemed | 22,444,330 | |
| Accrued management fee | 13,436,705 | |
| Payable for daily variation margin on futures contracts | 913,385 | |
| Total liabilities | | 296,211,815 |
| Net Assets | | $28,033,147,345 |
| Net Assets consist of: | | |
| Paid in capital | | $23,383,621,856 |
| Total accumulated earnings (loss) | | 4,649,525,489 |
| Net Assets | | $28,033,147,345 |
| Net Asset Value and Maximum Offering Price | | |
| Fidelity Freedom 2025 Fund: | | |
| Net Asset Value, offering price and redemption price per share ($11,498,335,359 ÷ 795,704,665 shares) | | $14.45 |
| Class K: | | |
| Net Asset Value, offering price and redemption price per share ($12,992,122,779 ÷ 900,277,049 shares) | | $14.43 |
| Class K6: | | |
| Net Asset Value, offering price and redemption price per share ($3,542,689,207 ÷ 245,810,712 shares) | | $14.41 |
See accompanying notes which are an integral part of the financial statements.
Statement of Operations
| | | Six months ended September 30, 2020 (Unaudited) |
| Investment Income | | |
| Dividends: | | |
| Affiliated issuers | | $149,857,258 |
| Interest | | 32,190 |
| Income from Fidelity Central Funds | | 33,275 |
| Total income | | 149,922,723 |
| Expenses | | |
| Management fee | $77,180,997 | |
| Independent trustees' fees and expenses | 36,833 | |
| Total expenses before reductions | 77,217,830 | |
| Expense reductions | (21) | |
| Total expenses after reductions | | 77,217,809 |
| Net investment income (loss) | | 72,704,914 |
| Realized and Unrealized Gain (Loss) | | |
| Net realized gain (loss) on: | | |
| Investment securities: | | |
| Fidelity Central Funds | (5,441) | |
| Other affiliated issuers | 336,232,274 | |
| Futures contracts | (25,885,185) | |
| Capital gain distributions from underlying funds: | | |
| Affiliated issuers | 146,289,566 | |
| Total net realized gain (loss) | | 456,631,214 |
| Change in net unrealized appreciation (depreciation) on: | | |
| Investment securities: | | |
| Unaffiliated issuers | (16,982) | |
| Fidelity Central Funds | (1,501) | |
| Other affiliated issuers | 4,283,363,843 | |
| Futures contracts | (1,382,524) | |
| Total change in net unrealized appreciation (depreciation) | | 4,281,962,836 |
| Net gain (loss) | | 4,738,594,050 |
| Net increase (decrease) in net assets resulting from operations | | $4,811,298,964 |
See accompanying notes which are an integral part of the financial statements.
Statement of Changes in Net Assets
| | Six months ended September 30, 2020 (Unaudited) | Year ended March 31, 2020 |
| Increase (Decrease) in Net Assets | | |
| Operations | | |
| Net investment income (loss) | $72,704,914 | $490,730,931 |
| Net realized gain (loss) | 456,631,214 | 1,078,998,161 |
| Change in net unrealized appreciation (depreciation) | 4,281,962,836 | (2,874,172,467) |
| Net increase (decrease) in net assets resulting from operations | 4,811,298,964 | (1,304,443,375) |
| Distributions to shareholders | (644,167,078) | (1,719,438,532) |
| Share transactions - net increase (decrease) | (407,288,453) | 156,027,250 |
| Total increase (decrease) in net assets | 3,759,843,433 | (2,867,854,657) |
| Net Assets | | |
| Beginning of period | 24,273,303,912 | 27,141,158,569 |
| End of period | $28,033,147,345 | $24,273,303,912 |
See accompanying notes which are an integral part of the financial statements.
Financial Highlights
Fidelity Freedom 2025 Fund
| | Six months ended (Unaudited) September 30, | Years endedMarch 31, | | | | |
| | 2020 | 2020 | 2019 | 2018 | 2017 | 2016 |
| Selected Per–Share Data | | | | | | |
| Net asset value, beginning of period | $12.34 | $13.84 | $14.35 | $13.50 | $12.49 | $13.51 |
| Income from Investment Operations | | | | | | |
| Net investment income (loss)A | .03 | .24 | .24 | .18 | .21 | .22 |
| Net realized and unrealized gain (loss) | 2.41 | (.87) | .08 | 1.26 | 1.30 | (.54) |
| Total from investment operations | 2.44 | (.63) | .32 | 1.44 | 1.51 | (.32) |
| Distributions from net investment income | (.01) | (.25) | (.23) | (.18) | (.21) | (.23) |
| Distributions from net realized gain | (.32) | (.63) | (.59) | (.41) | (.29) | (.47) |
| Total distributions | (.33) | (.87)B | (.83)B | (.59) | (.50) | (.70) |
| Net asset value, end of period | $14.45 | $12.34 | $13.84 | $14.35 | $13.50 | $12.49 |
| Total ReturnC,D | 20.07% | (5.17)% | 2.53% | 10.81% | 12.46% | (2.50)% |
| Ratios to Average Net AssetsE,F | | | | | | |
| Expenses before reductions | .63%G | .64% | .65% | .56%H | - %I | - %I |
| Expenses net of fee waivers, if any | .63%G | .64% | .65% | .56%H | -% | -% |
| Expenses net of all reductions | .63%G | .64% | .65% | .56%H | -% | -% |
| Net investment income (loss) | .48%G | 1.72% | 1.70% | 1.28% | 1.66% | 1.75% |
| Supplemental Data | | | | | | |
| Net assets, end of period (000 omitted) | $11,498,335 | $9,905,175 | $10,953,002 | $10,923,217 | $9,764,547 | $8,717,568 |
| Portfolio turnover rateJ | 23%G | 29% | 19% | 18%K | 19% | 17% |
A Calculated based on average shares outstanding during the period.
B Total distributions per share do not sum due to rounding.
C Total returns for periods of less than one year are not annualized.
D Total returns would have been lower if certain expenses had not been reduced during the applicable periods shown.
E Fees and expenses of any underlying mutual funds or exchange-traded funds (ETFs) are not included in the Fund's expense ratio. The Fund indirectly bears its proportionate share of these expenses. For additional expense information related to investments in Fidelity Central Funds, please refer to the "Investments in Fidelity Central Funds" note found in the Notes to Financial Statements section of the most recent Annual or Semi-Annual report.
F Expense ratios reflect operating expenses of the class. Expenses before reductions do not reflect amounts reimbursed, waived, or reduced through arrangements with the investment adviser, brokerage services, or other offset arrangements, if applicable, and do not represent the amount paid by the class during periods when reimbursements, waivers or reductions occur.
G Annualized
H On certain classes, the size and fluctuation of net assets and expense amounts may cause ratios to differ from contractual rates.
I Amount represents less than .005%.
J Amount does not include the portfolio activity of any underlying mutual funds or exchange-traded funds (ETFs).
K The portfolio turnover rate does not include the assets acquired in the merger.
See accompanying notes which are an integral part of the financial statements.
Fidelity Freedom 2025 Fund Class K
| | Six months ended (Unaudited) September 30, | Years endedMarch 31, | | |
| | 2020 | 2020 | 2019 | 2018 A |
| Selected Per–Share Data | | | | |
| Net asset value, beginning of period | $12.32 | $13.82 | $14.33 | $14.02 |
| Income from Investment Operations | | | | |
| Net investment income (loss)B | .04 | .25 | .25 | .23 |
| Net realized and unrealized gain (loss) | 2.40 | (.87) | .08 | .50 |
| Total from investment operations | 2.44 | (.62) | .33 | .73 |
| Distributions from net investment income | (.01) | (.26) | (.24) | (.18) |
| Distributions from net realized gain | (.32) | (.63) | (.59) | (.24) |
| Total distributions | (.33) | (.88)C | (.84)C | (.42) |
| Net asset value, end of period | $14.43 | $12.32 | $13.82 | $14.33 |
| Total ReturnD,E | 20.13% | (5.11)% | 2.61% | 5.18% |
| Ratios to Average Net AssetsF,G | | | | |
| Expenses before reductions | .55%H | .56% | .57% | .58%H,I |
| Expenses net of fee waivers, if any | .55%H | .56% | .57% | .58%H,I |
| Expenses net of all reductions | .55%H | .56% | .57% | .58%H,I |
| Net investment income (loss) | .56%H | 1.81% | 1.79% | 2.28%H |
| Supplemental Data | | | | |
| Net assets, end of period (000 omitted) | $12,992,123 | $11,470,984 | $13,768,298 | $15,743,238 |
| Portfolio turnover rateJ | 23%H | 29% | 19% | 18%K |
A For the period July 20, 2017 (commencement of sale of shares) to March 31, 2018.
B Calculated based on average shares outstanding during the period.
C Total distributions per share do not sum due to rounding.
D Total returns for periods of less than one year are not annualized.
E Total returns would have been lower if certain expenses had not been reduced during the applicable periods shown.
F Fees and expenses of any underlying mutual funds or exchange-traded funds (ETFs) are not included in the Fund's expense ratio. The Fund indirectly bears its proportionate share of these expenses. For additional expense information related to investments in Fidelity Central Funds, please refer to the "Investments in Fidelity Central Funds" note found in the Notes to Financial Statements section of the most recent Annual or Semi-Annual report.
G Expense ratios reflect operating expenses of the class. Expenses before reductions do not reflect amounts reimbursed, waived, or reduced through arrangements with the investment adviser, brokerage services, or other offset arrangements, if applicable, and do not represent the amount paid by the class during periods when reimbursements, waivers or reductions occur.
H Annualized
I On certain classes, the size and fluctuation of net assets and expense amounts may cause ratios to differ from contractual rates.
J Amount does not include the portfolio activity of any underlying mutual funds or exchange-traded funds (ETFs).
K The portfolio turnover rate does not include the assets acquired in the merger.
See accompanying notes which are an integral part of the financial statements.
Fidelity Freedom 2025 Fund Class K6
| | Six months ended (Unaudited) September 30, | Years endedMarch 31, | | |
| | 2020 | 2020 | 2019 | 2018 A |
| Selected Per–Share Data | | | | |
| Net asset value, beginning of period | $12.30 | $13.81 | $14.35 | $13.80 |
| Income from Investment Operations | | | | |
| Net investment income (loss)B | .05 | .27 | .26 | .21 |
| Net realized and unrealized gain (loss) | 2.40 | (.87) | .08 | .76 |
| Total from investment operations | 2.45 | (.60) | .34 | .97 |
| Distributions from net investment income | (.02) | (.28) | (.29) | (.19) |
| Distributions from net realized gain | (.32) | (.63) | (.59) | (.24) |
| Total distributions | (.34) | (.91) | (.88) | (.42)C |
| Net asset value, end of period | $14.41 | $12.30 | $13.81 | $14.35 |
| Total ReturnD,E | 20.21% | (5.02)% | 2.73% | 7.02% |
| Ratios to Average Net AssetsF,G | | | | |
| Expenses before reductions | .44%H | .45% | .45% | .46%H,I |
| Expenses net of fee waivers, if any | .44%H | .45% | .45% | .46%H,I |
| Expenses net of all reductions | .44%H | .45% | .45% | .46%H,I |
| Net investment income (loss) | .67%H | 1.92% | 1.90% | 1.78%H |
| Supplemental Data | | | | |
| Net assets, end of period (000 omitted) | $3,542,689 | $2,897,146 | $2,419,859 | $625,475 |
| Portfolio turnover rateJ | 23%H | 29% | 19% | 18%K |
A For the period June 7, 2017 (commencement of sale of shares) to March 31, 2018.
B Calculated based on average shares outstanding during the period.
C Total distributions per share do not sum due to rounding.
D Total returns for periods of less than one year are not annualized.
E Total returns would have been lower if certain expenses had not been reduced during the applicable periods shown.
F Fees and expenses of any underlying mutual funds or exchange-traded funds (ETFs) are not included in the Fund's expense ratio. The Fund indirectly bears its proportionate share of these expenses. For additional expense information related to investments in Fidelity Central Funds, please refer to the "Investments in Fidelity Central Funds" note found in the Notes to Financial Statements section of the most recent Annual or Semi-Annual report.
G Expense ratios reflect operating expenses of the class. Expenses before reductions do not reflect amounts reimbursed, waived, or reduced through arrangements with the investment adviser, brokerage services, or other offset arrangements, if applicable, and do not represent the amount paid by the class during periods when reimbursements, waivers or reductions occur.
H Annualized
I On certain classes, the size and fluctuation of net assets and expense amounts may cause ratios to differ from contractual rates.
J Amount does not include the portfolio activity of any underlying mutual funds or exchange-traded funds (ETFs).
K The portfolio turnover rate does not include the assets acquired in the merger.
See accompanying notes which are an integral part of the financial statements.
Fidelity Freedom® 2030 Fund
Investment Summary (Unaudited)
The information in the following tables is based on the direct investments of the Fund.
Top Holdings as of September 30, 2020
| | % of fund's net assets |
| Fidelity Series Investment Grade Bond Fund | 19.9 |
| Fidelity Series Emerging Markets Opportunities Fund | 11.2 |
| Fidelity Series Intrinsic Opportunities Fund | 5.9 |
| Fidelity Series Growth Company Fund | 5.7 |
| Fidelity Series Inflation-Protected Bond Index Fund | 5.5 |
| Fidelity Series International Growth Fund | 5.1 |
| Fidelity Series Overseas Fund | 5.1 |
| Fidelity Series International Value Fund | 5.1 |
| Fidelity Series Large Cap Stock Fund | 5.0 |
| Fidelity Series Stock Selector Large Cap Value Fund | 4.1 |
| | 72.6 |
Asset Allocation (% of fund's net assets)
| Period end |
| | Domestic Equity Funds | 37.8% |
| | International Equity Funds | 31.0% |
| | Bond Funds | 29.5% |
| | Short-Term Funds | 1.6% |
| | Short-Term Investments | 0.1% |

Domestic Equity Funds category includes Fidelity Series Commodity Strategy Fund which invests in commodity-related investments.
Fidelity Freedom® 2030 Fund
Schedule of Investments September 30, 2020 (Unaudited)
Showing Percentage of Net Assets
| U.S. Treasury Obligations - 0.1% | | | |
| | | Principal Amount | Value |
| U.S. Treasury Bills, yield at date of purchase 0.1% to 0.11% 12/3/20 to 12/10/20 (a) | | | |
| (Cost $41,582,298) | | 41,590,000 | 41,582,638 |
| | | Shares | Value |
|
| Domestic Equity Funds - 37.8% | | | |
| Fidelity Series All-Sector Equity Fund (b) | | 47,736,069 | $508,389,134 |
| Fidelity Series Blue Chip Growth Fund (b) | | 46,037,154 | 760,073,406 |
| Fidelity Series Commodity Strategy Fund (b) | | 199,504,512 | 829,938,769 |
| Fidelity Series Growth Company Fund (b) | | 73,855,465 | 1,935,751,727 |
| Fidelity Series Intrinsic Opportunities Fund (b) | | 126,558,217 | 2,002,150,996 |
| Fidelity Series Large Cap Stock Fund (b) | | 118,785,045 | 1,681,996,243 |
| Fidelity Series Large Cap Value Index Fund (b) | | 50,838,031 | 589,721,163 |
| Fidelity Series Opportunistic Insights Fund (b) | | 51,087,242 | 1,105,017,037 |
| Fidelity Series Small Cap Discovery Fund (b) | | 20,660,196 | 208,874,585 |
| Fidelity Series Small Cap Opportunities Fund (b) | | 54,110,380 | 690,448,446 |
| Fidelity Series Stock Selector Large Cap Value Fund (b) | | 127,418,174 | 1,401,599,913 |
| Fidelity Series Value Discovery Fund (b) | | 86,634,900 | 1,070,807,364 |
| TOTAL DOMESTIC EQUITY FUNDS | | | |
| (Cost $9,826,181,945) | | | 12,784,768,783 |
|
| International Equity Funds - 31.0% | | | |
| Fidelity Series Canada Fund (b) | | 56,723,798 | 580,284,458 |
| Fidelity Series Emerging Markets Fund (b) | | 44,749,780 | 421,990,422 |
| Fidelity Series Emerging Markets Opportunities Fund (b) | | 180,349,244 | 3,783,727,135 |
| Fidelity Series International Growth Fund (b) | | 91,803,851 | 1,724,076,326 |
| Fidelity Series International Small Cap Fund (b) | | 29,923,930 | 532,645,958 |
| Fidelity Series International Value Fund (b) | | 198,234,372 | 1,708,780,286 |
| Fidelity Series Overseas Fund (b) | | 153,988,460 | 1,721,590,980 |
| TOTAL INTERNATIONAL EQUITY FUNDS | | | |
| (Cost $8,592,493,224) | | | 10,473,095,565 |
|
| Bond Funds - 29.5% | | | |
| Fidelity Series Emerging Markets Debt Fund (b) | | 21,907,659 | 198,483,393 |
| Fidelity Series Floating Rate High Income Fund (b) | | 4,163,915 | 36,850,644 |
| Fidelity Series High Income Fund (b) | | 25,059,876 | 228,546,073 |
| Fidelity Series Inflation-Protected Bond Index Fund (b) | | 174,214,590 | 1,864,096,112 |
| Fidelity Series International Credit Fund (b) | | 1,690,062 | 17,593,550 |
| Fidelity Series Investment Grade Bond Fund (b) | | 549,719,668 | 6,728,568,736 |
| Fidelity Series Long-Term Treasury Bond Index Fund (b) | | 74,455,437 | 769,124,667 |
| Fidelity Series Real Estate Income Fund (b) | | 13,549,505 | 135,224,055 |
| TOTAL BOND FUNDS | | | |
| (Cost $9,304,472,101) | | | 9,978,487,230 |
|
| Short-Term Funds - 1.6% | | | |
| Fidelity Cash Central Fund 0.10% (c) | | 47,126,571 | 47,135,997 |
| Fidelity Series Government Money Market Fund 0.16% (b)(d) | | 416,652,322 | 416,652,322 |
| Fidelity Series Short-Term Credit Fund (b) | | 5,446,378 | 55,825,370 |
| TOTAL SHORT-TERM FUNDS | | | |
| (Cost $517,581,752) | | | 519,613,689 |
| TOTAL INVESTMENT IN SECURITIES - 100.0% | | | |
| (Cost $28,282,311,320) | | | 33,797,547,905 |
| NET OTHER ASSETS (LIABILITIES) - 0.0% | | | (2,232,319) |
| NET ASSETS - 100% | | | $33,795,315,586 |
| Futures Contracts | | | | | |
| | Number of contracts | Expiration Date | Notional Amount | Value | Unrealized Appreciation/(Depreciation) |
| Purchased | | | | | |
| Equity Index Contracts | | | | | |
| ICE E-mini MSCI EAFE Index Contracts (United States) | 418 | Dec. 2020 | $38,731,880 | $(752,979) | $(752,979) |
| ICE E-mini MSCI Emerging Markets Index Contracts (United States) | 583 | Dec. 2020 | 31,729,775 | (13,018) | (13,018) |
|
| TOTAL PURCHASED | | | | | (795,997) |
|
| Sold | | | | | |
| Equity Index Contracts | | | | | |
| CME E-mini S&P 500 Index Contracts (United States) | 1,780 | Dec. 2020 | 298,328,000 | (1,947,552) | (1,947,552) |
| TOTAL FUTURES CONTRACTS | | | | | $(2,713,549) |
The notional amount of futures purchased as a percentage of Net Assets is 0.2%
The notional amount of futures sold as a percentage of Net Assets is 0.9%
Legend
(a) Security or a portion of the security was pledged to cover margin requirements for futures contracts. At period end, the value of securities pledged amounted to $41,582,638.
(b) Affiliated Fund
(c) Affiliated fund that is generally available only to investment companies and other accounts managed by Fidelity Investments. The rate quoted is the annualized seven-day yield of the fund at period end. A complete unaudited listing of the fund's holdings as of its most recent quarter end is available upon request. In addition, each Fidelity Central Fund's financial statements are available on the SEC's website or upon request.
(d) The rate quoted is the annualized seven-day yield of the fund at period end.
Affiliated Central Funds
Information regarding fiscal year to date income earned by the Fund from investments in Fidelity Central Funds is as follows:
| Fund | Income earned |
| Fidelity Cash Central Fund | $48,357 |
| Total | $48,357 |
Affiliated Underlying Funds
Fiscal year to date information regarding the Fund's investments in affiliated Underlying Funds, excluding any Money Market Central Funds, is presented below. Exchanges between classes of the same affiliated Underlying Funds may occur.
| Affiliate | Value, beginning of period | Purchases | Sales Proceeds | Dividend Income | Realized Gain (loss) | Change in Unrealized appreciation (depreciation) | Value, end of period |
| Fidelity Series All-Sector Equity Fund | $393,967,790 | $1,990,159 | $25,591,303 | $-- | $(4,116,146) | $142,138,634 | $508,389,134 |
| Fidelity Series Blue Chip Growth Fund | 716,855,106 | 160,367,096 | 368,629,253 | 157,271,744 | 165,778,194 | 85,702,263 | 760,073,406 |
| Fidelity Series Canada Fund | 411,006,158 | 78,843,765 | 14,832,374 | -- | (1,471,976) | 106,738,885 | 580,284,458 |
| Fidelity Series Commodity Strategy Fund | 967,436,715 | 13,792,044 | 256,881,932 | 3,586,623 | (115,591,728) | 221,183,670 | 829,938,769 |
| Fidelity Series Emerging Markets Debt Fund | 178,867,660 | 6,082,490 | 8,541,495 | 5,195,557 | 117,876 | 21,956,862 | 198,483,393 |
| Fidelity Series Emerging Markets Fund | 262,115,431 | 80,000,401 | 21,477,202 | -- | 60,599 | 101,291,193 | 421,990,422 |
| Fidelity Series Emerging Markets Opportunities Fund | 2,490,261,251 | 603,539,713 | 275,031,152 | -- | 7,528,856 | 957,428,467 | 3,783,727,135 |
| Fidelity Series Floating Rate High Income Fund | 34,443,433 | 1,034,423 | 2,066,490 | 819,843 | (139,449) | 3,578,727 | 36,850,644 |
| Fidelity Series Government Money Market Fund 0.16% | 880,988,473 | 296,692,385 | 761,028,536 | 666,072 | -- | -- | 416,652,322 |
| Fidelity Series Growth Company Fund | 1,488,543,420 | 6,995,500 | 492,991,439 | -- | 276,241,111 | 656,963,135 | 1,935,751,727 |
| Fidelity Series High Income Fund | 209,352,196 | 7,270,476 | 10,332,455 | 6,197,571 | (100,839) | 22,356,695 | 228,546,073 |
| Fidelity Series Inflation-Protected Bond Index Fund | 1,497,526,674 | 398,616,818 | 130,485,984 | 1,337,010 | 688,236 | 97,750,368 | 1,864,096,112 |
| Fidelity Series International Credit Fund | 15,917,457 | 247,378 | -- | 247,378 | -- | 1,428,715 | 17,593,550 |
| Fidelity Series International Growth Fund | 1,838,239,891 | 7,354,391 | 586,863,864 | -- | 165,386,777 | 299,959,131 | 1,724,076,326 |
| Fidelity Series International Small Cap Fund | 427,359,835 | 2,085,982 | 34,503,878 | -- | 2,644,327 | 135,059,692 | 532,645,958 |
| Fidelity Series International Value Fund | 1,593,300,623 | 49,306,251 | 251,978,704 | -- | (50,927,028) | 369,079,144 | 1,708,780,286 |
| Fidelity Series Intrinsic Opportunities Fund | 1,664,194,036 | 35,416,820 | 98,038,992 | 27,593,896 | (9,089,659) | 409,668,791 | 2,002,150,996 |
| Fidelity Series Investment Grade Bond Fund | 5,712,460,309 | 1,208,872,513 | 542,758,514 | 81,204,749 | 271,643 | 349,722,785 | 6,728,568,736 |
| Fidelity Series Large Cap Stock Fund | 1,439,947,985 | 66,631,585 | 83,357,394 | 59,553,451 | (50,119) | 258,824,186 | 1,681,996,243 |
| Fidelity Series Large Cap Value Index Fund | 395,293,959 | 135,203,281 | 22,359,046 | -- | (1,573,637) | 83,156,606 | 589,721,163 |
| Fidelity Series Long-Term Treasury Bond Index Fund | 717,667,010 | 157,826,790 | 84,188,500 | 18,802,380 | 10,918,337 | (33,098,970) | 769,124,667 |
| Fidelity Series Opportunistic Insights Fund | 810,250,181 | 4,045,290 | 38,758,352 | -- | 11,798,148 | 317,681,770 | 1,105,017,037 |
| Fidelity Series Overseas Fund | 1,540,968,330 | 25,810,741 | 280,358,702 | -- | (15,909,368) | 451,079,979 | 1,721,590,980 |
| Fidelity Series Real Estate Income Fund | 115,537,176 | 5,000,569 | 6,475,649 | 4,327,571 | (710,509) | 21,872,468 | 135,224,055 |
| Fidelity Series Short-Term Credit Fund | 53,273,544 | 730,574 | 174,856 | 607,197 | (919) | 1,997,027 | 55,825,370 |
| Fidelity Series Small Cap Discovery Fund | 160,684,589 | 1,482,324 | 8,839,047 | 568,606 | (584,842) | 56,131,561 | 208,874,585 |
| Fidelity Series Small Cap Opportunities Fund | 561,149,981 | 14,230,368 | 28,659,532 | 4,153,802 | (858,410) | 144,586,039 | 690,448,446 |
| Fidelity Series Stock Selector Large Cap Value Fund | 1,055,251,278 | 171,100,642 | 62,927,967 | -- | (3,821,691) | 241,997,651 | 1,401,599,913 |
| Fidelity Series Value Discovery Fund | 786,111,272 | 137,064,846 | 41,973,817 | -- | (3,069,520) | 192,674,583 | 1,070,807,364 |
| | $28,418,971,763 | $3,677,635,615 | $4,540,106,429 | $372,133,450 | $433,418,264 | $5,718,910,057 | $33,708,829,270 |
Amounts in the income column in the above table include any capital gain distributions from underlying funds, which are presented in the corresponding line-item in the Statement of Operations, if applicable.
Investment Valuation
The following is a summary of the inputs used, as of September 30, 2020, involving the Fund's assets and liabilities carried at fair value. The inputs or methodology used for valuing securities may not be an indication of the risk associated with investing in those securities. For more information on valuation inputs, and their aggregation into the levels used below, please refer to the Investment Valuation section in the accompanying Notes to Financial Statements.
| | Valuation Inputs at Reporting Date: |
| Description | Total | Level 1 | Level 2 | Level 3 |
| Investments in Securities: | | | | |
| Other Short-Term Investments | $41,582,638 | $-- | $41,582,638 | $-- |
| Domestic Equity Funds | 12,784,768,783 | 12,784,768,783 | -- | -- |
| International Equity Funds | 10,473,095,565 | 10,473,095,565 | -- | -- |
| Bond Funds | 9,978,487,230 | 9,978,487,230 | -- | -- |
| Short-Term Funds | 519,613,689 | 519,613,689 | -- | -- |
| Total Investments in Securities: | $33,797,547,905 | $33,755,965,267 | $41,582,638 | $-- |
| Derivative Instruments: | | | | |
| Liabilities | | | | |
| Futures Contracts | $(2,713,549) | $(2,713,549) | $-- | $-- |
| Total Liabilities | $(2,713,549) | $(2,713,549) | $-- | $-- |
| Total Derivative Instruments: | $(2,713,549) | $(2,713,549) | $-- | $-- |
Value of Derivative Instruments
The following table is a summary of the Fund's value of derivative instruments by primary risk exposure as of September 30, 2020. For additional information on derivative instruments, please refer to the Derivative Instruments section in the accompanying Notes to Financial Statements.
| Primary Risk Exposure / Derivative Type | Value |
| | Asset | Liability |
| Equity Risk | | |
| Futures Contracts(a) | $0 | $(2,713,549) |
| Total Equity Risk | 0 | (2,713,549) |
| Total Value of Derivatives | $0 | $(2,713,549) |
(a) Reflects gross cumulative appreciation (depreciation) on futures contracts as presented in the Schedule of Investments. In the Statement of Assets and Liabilities, the period end daily variation margin is included in receivable or payable for daily variation margin on futures contracts, and the net cumulative appreciation (depreciation) is included in Total accumulated earnings (loss).
See accompanying notes which are an integral part of the financial statements.
Fidelity Freedom® 2030 Fund
Financial Statements
Statement of Assets and Liabilities
| | | September 30, 2020 (Unaudited) |
| Assets | | |
Investment in securities, at value — See accompanying schedule:
Unaffiliated issuers (cost $41,582,298) | $41,582,638 | |
| Fidelity Central Funds (cost $47,134,891) | 47,135,997 | |
| Other affiliated issuers (cost $28,193,594,131) | 33,708,829,270 | |
| Total Investment in Securities (cost $28,282,311,320) | | $33,797,547,905 |
| Receivable for investments sold | | 223,340,756 |
| Receivable for fund shares sold | | 22,582,700 |
| Distributions receivable from Fidelity Central Funds | | 4,219 |
| Other receivables | | 242,856 |
| Total assets | | 34,043,718,436 |
| Liabilities | | |
| Payable for investments purchased | $209,641,618 | |
| Payable for fund shares redeemed | 19,846,910 | |
| Accrued management fee | 17,260,732 | |
| Payable for daily variation margin on futures contracts | 1,410,735 | |
| Other payables and accrued expenses | 242,855 | |
| Total liabilities | | 248,402,850 |
| Net Assets | | $33,795,315,586 |
| Net Assets consist of: | | |
| Paid in capital | | $27,679,933,198 |
| Total accumulated earnings (loss) | | 6,115,382,388 |
| Net Assets | | $33,795,315,586 |
| Net Asset Value and Maximum Offering Price | | |
| Fidelity Freedom 2030 Fund: | | |
| Net Asset Value, offering price and redemption price per share ($14,016,011,263 ÷ 784,925,782 shares) | | $17.86 |
| Class K: | | |
| Net Asset Value, offering price and redemption price per share ($15,754,243,994 ÷ 882,940,380 shares) | | $17.84 |
| Class K6: | | |
| Net Asset Value, offering price and redemption price per share ($4,025,060,329 ÷ 225,940,836 shares) | | $17.81 |
See accompanying notes which are an integral part of the financial statements.
Statement of Operations
| | | Six months ended September 30, 2020 (Unaudited) |
| Investment Income | | |
| Dividends: | | |
| Affiliated issuers | | $168,747,468 |
| Interest | | 39,004 |
| Income from Fidelity Central Funds | | 48,357 |
| Total income | | 168,834,829 |
| Expenses | | |
| Management fee | $98,404,352 | |
| Independent trustees' fees and expenses | 43,782 | |
| Total expenses before reductions | 98,448,134 | |
| Expense reductions | (25) | |
| Total expenses after reductions | | 98,448,109 |
| Net investment income (loss) | | 70,386,720 |
| Realized and Unrealized Gain (Loss) | | |
| Net realized gain (loss) on: | | |
| Investment securities: | | |
| Fidelity Central Funds | (7,440) | |
| Other affiliated issuers | 433,418,264 | |
| Futures contracts | (25,835,492) | |
| Capital gain distributions from underlying funds: | | |
| Affiliated issuers | 203,385,982 | |
| Total net realized gain (loss) | | 610,961,314 |
| Change in net unrealized appreciation (depreciation) on: | | |
| Investment securities: | | |
| Unaffiliated issuers | (19,340) | |
| Fidelity Central Funds | (2,186) | |
| Other affiliated issuers | 5,718,910,057 | |
| Futures contracts | (2,713,549) | |
| Total change in net unrealized appreciation (depreciation) | | 5,716,174,982 |
| Net gain (loss) | | 6,327,136,296 |
| Net increase (decrease) in net assets resulting from operations | | $6,397,523,016 |
See accompanying notes which are an integral part of the financial statements.
Statement of Changes in Net Assets
| | Six months ended September 30, 2020 (Unaudited) | Year ended March 31, 2020 |
| Increase (Decrease) in Net Assets | | |
| Operations | | |
| Net investment income (loss) | $70,386,720 | $569,540,942 |
| Net realized gain (loss) | 610,961,314 | 1,520,300,325 |
| Change in net unrealized appreciation (depreciation) | 5,716,174,982 | (4,097,996,425) |
| Net increase (decrease) in net assets resulting from operations | 6,397,523,016 | (2,008,155,158) |
| Distributions to shareholders | (879,384,147) | (2,275,634,739) |
| Share transactions - net increase (decrease) | (256,908,719) | 747,107,607 |
| Total increase (decrease) in net assets | 5,261,230,150 | (3,536,682,290) |
| Net Assets | | |
| Beginning of period | 28,534,085,436 | 32,070,767,726 |
| End of period | $33,795,315,586 | $28,534,085,436 |
See accompanying notes which are an integral part of the financial statements.
Financial Highlights
Fidelity Freedom 2030 Fund
| | Six months ended (Unaudited) September 30, | Years endedMarch 31, | | | | |
| | 2020 | 2020 | 2019 | 2018 | 2017 | 2016 |
| Selected Per–Share Data | | | | | | |
| Net asset value, beginning of period | $14.98 | $17.20 | $18.00 | $16.72 | $15.20 | $16.62 |
| Income from Investment Operations | | | | | | |
| Net investment income (loss)A | .03 | .29 | .28 | .21 | .25 | .25 |
| Net realized and unrealized gain (loss) | 3.31 | (1.30) | .07 | 1.90 | 1.90 | (.75) |
| Total from investment operations | 3.34 | (1.01) | .35 | 2.11 | 2.15 | (.50) |
| Distributions from net investment income | –B | (.30) | (.28) | (.22) | (.25) | (.26) |
| Distributions from net realized gain | (.46) | (.92) | (.87) | (.61) | (.38) | (.67) |
| Total distributions | (.46) | (1.21)C | (1.15) | (.83) | (.63) | (.92)C |
| Net asset value, end of period | $17.86 | $14.98 | $17.20 | $18.00 | $16.72 | $15.20 |
| Total ReturnD,E | 22.72% | (6.69)% | 2.32% | 12.78% | 14.58% | (3.17)% |
| Ratios to Average Net AssetsF,G | | | | | | |
| Expenses before reductions | .68%H | .69% | .69%I | .59% | - %J | - %J |
| Expenses net of fee waivers, if any | .68%H | .69% | .69%I | .59% | -% | -% |
| Expenses net of all reductions | .68%H | .69% | .69%I | .59% | -% | -% |
| Net investment income (loss) | .37%H | 1.68% | 1.61% | 1.20% | 1.57% | 1.59% |
| Supplemental Data | | | | | | |
| Net assets, end of period (000 omitted) | $14,016,011 | $11,724,021 | $12,905,055 | $12,684,794 | $11,305,668 | $10,150,137 |
| Portfolio turnover rateK | 23%H | 31% | 18% | 18%L | 17% | 16% |
A Calculated based on average shares outstanding during the period.
B Amount represents less than $.005 per share.
C Total distributions per share do not sum due to rounding.
D Total returns for periods of less than one year are not annualized.
E Total returns would have been lower if certain expenses had not been reduced during the applicable periods shown.
F Fees and expenses of any underlying mutual funds or exchange-traded funds (ETFs) are not included in the Fund's expense ratio. The Fund indirectly bears its proportionate share of these expenses. For additional expense information related to investments in Fidelity Central Funds, please refer to the "Investments in Fidelity Central Funds" note found in the Notes to Financial Statements section of the most recent Annual or Semi-Annual report.
G Expense ratios reflect operating expenses of the class. Expenses before reductions do not reflect amounts reimbursed, waived, or reduced through arrangements with the investment adviser, brokerage services, or other offset arrangements, if applicable, and do not represent the amount paid by the class during periods when reimbursements, waivers or reductions occur.
H Annualized
I On certain classes, the size and fluctuation of net assets and expense amounts may cause ratios to differ from contractual rates.
J Amount represents less than .005%.
K Amount does not include the portfolio activity of any underlying mutual funds or exchange-traded funds (ETFs).
L The portfolio turnover rate does not include the assets acquired in the merger.
See accompanying notes which are an integral part of the financial statements.
Fidelity Freedom 2030 Fund Class K
| | Six months ended (Unaudited) September 30, | Years endedMarch 31, | | |
| | 2020 | 2020 | 2019 | 2018 A |
| Selected Per–Share Data | | | | |
| Net asset value, beginning of period | $14.97 | $17.18 | $17.98 | $17.47 |
| Income from Investment Operations | | | | |
| Net investment income (loss)B | .04 | .30 | .30 | .28 |
| Net realized and unrealized gain (loss) | 3.30 | (1.29) | .06 | .81 |
| Total from investment operations | 3.34 | (.99) | .36 | 1.09 |
| Distributions from net investment income | (.01) | (.31) | (.29) | (.24) |
| Distributions from net realized gain | (.46) | (.92) | (.87) | (.35) |
| Total distributions | (.47) | (1.22)C | (1.16) | (.58)C |
| Net asset value, end of period | $17.84 | $14.97 | $17.18 | $17.98 |
| Total ReturnD,E | 22.70% | (6.57)% | 2.40% | 6.24% |
| Ratios to Average Net AssetsF,G | | | | |
| Expenses before reductions | .59%H | .59% | .60% | .62%H,I |
| Expenses net of fee waivers, if any | .59%H | .59% | .60% | .62%H,I |
| Expenses net of all reductions | .59%H | .59% | .60% | .62%H,I |
| Net investment income (loss) | .46%H | 1.77% | 1.70% | 2.23%H |
| Supplemental Data | | | | |
| Net assets, end of period (000 omitted) | $15,754,244 | $13,601,568 | $16,527,856 | $18,414,961 |
| Portfolio turnover rateJ | 23%H | 31% | 18% | 18%K |
A For the period July 20, 2017 (commencement of sale of shares) to March 31, 2018.
B Calculated based on average shares outstanding during the period.
C Total distributions per share do not sum due to rounding.
D Total returns for periods of less than one year are not annualized.
E Total returns would have been lower if certain expenses had not been reduced during the applicable periods shown.
F Fees and expenses of any underlying mutual funds or exchange-traded funds (ETFs) are not included in the Fund's expense ratio. The Fund indirectly bears its proportionate share of these expenses. For additional expense information related to investments in Fidelity Central Funds, please refer to the "Investments in Fidelity Central Funds" note found in the Notes to Financial Statements section of the most recent Annual or Semi-Annual report.
G Expense ratios reflect operating expenses of the class. Expenses before reductions do not reflect amounts reimbursed, waived, or reduced through arrangements with the investment adviser, brokerage services, or other offset arrangements, if applicable, and do not represent the amount paid by the class during periods when reimbursements, waivers or reductions occur.
H Annualized
I On certain classes, the size and fluctuation of net assets and expense amounts may cause ratios to differ from contractual rates.
J Amount does not include the portfolio activity of any underlying mutual funds or exchange-traded funds (ETFs).
K The portfolio turnover rate does not include the assets acquired in the merger.
See accompanying notes which are an integral part of the financial statements.
Fidelity Freedom 2030 Fund Class K6
| | Six months ended (Unaudited) September 30, | Years endedMarch 31, | | |
| | 2020 | 2020 | 2019 | 2018 A |
| Selected Per–Share Data | | | | |
| Net asset value, beginning of period | $14.94 | $17.17 | $18.00 | $17.15 |
| Income from Investment Operations | | | | |
| Net investment income (loss)B | .05 | .33 | .31 | .26 |
| Net realized and unrealized gain (loss) | 3.29 | (1.30) | .08 | 1.18 |
| Total from investment operations | 3.34 | (.97) | .39 | 1.44 |
| Distributions from net investment income | (.01) | (.34) | (.33) | (.24) |
| Distributions from net realized gain | (.46) | (.92) | (.89) | (.35) |
| Total distributions | (.47) | (1.26) | (1.22) | (.59) |
| Net asset value, end of period | $17.81 | $14.94 | $17.17 | $18.00 |
| Total ReturnC,D | 22.79% | (6.52)% | 2.57% | 8.35% |
| Ratios to Average Net AssetsE,F | | | | |
| Expenses before reductions | .46%G | .47% | .47% | .48%G,H |
| Expenses net of fee waivers, if any | .46%G | .47% | .47% | .48%G,H |
| Expenses net of all reductions | .46%G | .47% | .47% | .48%G,H |
| Net investment income (loss) | .58%G | 1.90% | 1.83% | 1.76%G |
| Supplemental Data | | | | |
| Net assets, end of period (000 omitted) | $4,025,060 | $3,208,497 | $2,637,856 | $821,874 |
| Portfolio turnover rateI | 23%G | 31% | 18% | 18%J |
A For the period June 7, 2017 (commencement of sale of shares) to March 31, 2018.
B Calculated based on average shares outstanding during the period.
C Total returns for periods of less than one year are not annualized.
D Total returns would have been lower if certain expenses had not been reduced during the applicable periods shown.
E Fees and expenses of any underlying mutual funds or exchange-traded funds (ETFs) are not included in the Fund's expense ratio. The Fund indirectly bears its proportionate share of these expenses. For additional expense information related to investments in Fidelity Central Funds, please refer to the "Investments in Fidelity Central Funds" note found in the Notes to Financial Statements section of the most recent Annual or Semi-Annual report.
F Expense ratios reflect operating expenses of the class. Expenses before reductions do not reflect amounts reimbursed, waived, or reduced through arrangements with the investment adviser, brokerage services, or other offset arrangements, if applicable, and do not represent the amount paid by the class during periods when reimbursements, waivers or reductions occur.
G Annualized
H On certain classes, the size and fluctuation of net assets and expense amounts may cause ratios to differ from contractual rates.
I Amount does not include the portfolio activity of any underlying mutual funds or exchange-traded funds (ETFs).
J The portfolio turnover rate does not include the assets acquired in the merger.
See accompanying notes which are an integral part of the financial statements.
Fidelity Freedom® 2035 Fund
Investment Summary (Unaudited)
The information in the following tables is based on the direct investments of the Fund.
Top Holdings as of September 30, 2020
| | % of fund's net assets |
| Fidelity Series Emerging Markets Opportunities Fund | 12.9 |
| Fidelity Series Investment Grade Bond Fund | 8.9 |
| Fidelity Series Intrinsic Opportunities Fund | 7.3 |
| Fidelity Series Growth Company Fund | 7.2 |
| Fidelity Series International Growth Fund | 6.3 |
| Fidelity Series Large Cap Stock Fund | 6.3 |
| Fidelity Series Overseas Fund | 6.3 |
| Fidelity Series International Value Fund | 6.2 |
| Fidelity Series Stock Selector Large Cap Value Fund | 5.1 |
| Fidelity Series Opportunistic Insights Fund | 4.0 |
| | 70.5 |
Asset Allocation (% of fund's net assets)
| Period end |
| | Domestic Equity Funds | 46.4% |
| | International Equity Funds | 37.1% |
| | Bond Funds | 15.0% |
| | Short-Term Funds | 1.4% |
| | Short-Term Investments | 0.1% |

Domestic Equity Funds category includes Fidelity Series Commodity Strategy Fund which invests in commodity-related investments.
Fidelity Freedom® 2035 Fund
Schedule of Investments September 30, 2020 (Unaudited)
Showing Percentage of Net Assets
| U.S. Treasury Obligations - 0.1% | | | |
| | | Principal Amount | Value |
| U.S. Treasury Bills, yield at date of purchase 0.1% to 0.11% 12/3/20 to 12/10/20 (a) | | | |
| (Cost $24,605,368) | | 24,610,000 | 24,605,611 |
| | | Shares | Value |
|
| Domestic Equity Funds - 46.4% | | | |
| Fidelity Series All-Sector Equity Fund (b) | | 42,141,483 | $448,806,791 |
| Fidelity Series Blue Chip Growth Fund (b) | | 41,452,053 | 684,373,395 |
| Fidelity Series Commodity Strategy Fund (b) | | 143,177,340 | 595,617,734 |
| Fidelity Series Growth Company Fund (b) | | 66,614,196 | 1,745,958,069 |
| Fidelity Series Intrinsic Opportunities Fund (b) | | 111,774,514 | 1,768,272,812 |
| Fidelity Series Large Cap Stock Fund (b) | | 106,711,517 | 1,511,035,079 |
| Fidelity Series Large Cap Value Index Fund (b) | | 44,206,354 | 512,793,708 |
| Fidelity Series Opportunistic Insights Fund (b) | | 44,387,944 | 960,111,225 |
| Fidelity Series Small Cap Discovery Fund (b) | | 18,479,152 | 186,824,222 |
| Fidelity Series Small Cap Opportunities Fund (b) | | 48,124,299 | 614,066,052 |
| Fidelity Series Stock Selector Large Cap Value Fund (b) | | 112,615,108 | 1,238,766,192 |
| Fidelity Series Value Discovery Fund (b) | | 76,031,981 | 939,755,280 |
| TOTAL DOMESTIC EQUITY FUNDS | | | |
| (Cost $8,813,742,711) | | | 11,206,380,559 |
|
| International Equity Funds - 37.1% | | | |
| Fidelity Series Canada Fund (b) | | 49,923,622 | 510,718,654 |
| Fidelity Series Emerging Markets Fund (b) | | 36,344,723 | 342,730,735 |
| Fidelity Series Emerging Markets Opportunities Fund (b) | | 148,608,093 | 3,117,797,781 |
| Fidelity Series International Growth Fund (b) | | 80,503,370 | 1,511,853,292 |
| Fidelity Series International Small Cap Fund (b) | | 26,029,514 | 463,325,348 |
| Fidelity Series International Value Fund (b) | | 174,049,381 | 1,500,305,668 |
| Fidelity Series Overseas Fund (b) | | 135,032,732 | 1,509,665,946 |
| TOTAL INTERNATIONAL EQUITY FUNDS | | | |
| (Cost $7,500,089,829) | | | 8,956,397,424 |
|
| Bond Funds - 15.0% | | | |
| Fidelity Series Emerging Markets Debt Fund (b) | | 15,177,614 | 137,509,181 |
| Fidelity Series Floating Rate High Income Fund (b) | | 2,974,295 | 26,322,510 |
| Fidelity Series High Income Fund (b) | | 17,933,383 | 163,552,454 |
| Fidelity Series Inflation-Protected Bond Index Fund (b) | | 44,393,610 | 475,011,626 |
| Fidelity Series International Credit Fund (b) | | 1,125,486 | 11,716,308 |
| Fidelity Series Investment Grade Bond Fund (b) | | 175,556,697 | 2,148,813,976 |
| Fidelity Series Long-Term Treasury Bond Index Fund (b) | | 53,139,917 | 548,935,342 |
| Fidelity Series Real Estate Income Fund (b) | | 9,495,980 | 94,769,881 |
| TOTAL BOND FUNDS | | | |
| (Cost $3,403,085,202) | | | 3,606,631,278 |
|
| Short-Term Funds - 1.4% | | | |
| Fidelity Cash Central Fund 0.10% (c) | | 48,313,649 | 48,323,312 |
| Fidelity Series Government Money Market Fund 0.16% (b)(d) | | 257,081,999 | 257,081,999 |
| Fidelity Series Short-Term Credit Fund (b) | | 3,970,835 | 40,701,062 |
| TOTAL SHORT-TERM FUNDS | | | |
| (Cost $344,694,038) | | | 346,106,373 |
| TOTAL INVESTMENT IN SECURITIES - 100.0% | | | |
| (Cost $20,086,217,148) | | | 24,140,121,245 |
| NET OTHER ASSETS (LIABILITIES) - 0.0% | | | (1,361,976) |
| NET ASSETS - 100% | | | $24,138,759,269 |
| Futures Contracts | | | | | |
| | Number of contracts | Expiration Date | Notional Amount | Value | Unrealized Appreciation/(Depreciation) |
| Purchased | | | | | |
| Equity Index Contracts | | | | | |
| ICE E-mini MSCI EAFE Index Contracts (United States) | 434 | Dec. 2020 | $40,214,440 | $(519,891) | $(519,891) |
| Sold | | | | | |
| Equity Index Contracts | | | | | |
| CME E-mini S&P 500 Index Contracts (United States) | 607 | Dec. 2020 | 101,733,200 | (664,137) | (664,137) |
| TOTAL FUTURES CONTRACTS | | | | | $(1,184,028) |
The notional amount of futures purchased as a percentage of Net Assets is 0.2%
The notional amount of futures sold as a percentage of Net Assets is 0.4%
Legend
(a) Security or a portion of the security was pledged to cover margin requirements for futures contracts. At period end, the value of securities pledged amounted to $24,605,611.
(b) Affiliated Fund
(c) Affiliated fund that is generally available only to investment companies and other accounts managed by Fidelity Investments. The rate quoted is the annualized seven-day yield of the fund at period end. A complete unaudited listing of the fund's holdings as of its most recent quarter end is available upon request. In addition, each Fidelity Central Fund's financial statements are available on the SEC's website or upon request.
(d) The rate quoted is the annualized seven-day yield of the fund at period end.
Affiliated Central Funds
Information regarding fiscal year to date income earned by the Fund from investments in Fidelity Central Funds is as follows:
| Fund | Income earned |
| Fidelity Cash Central Fund | $38,144 |
| Total | $38,144 |
Amounts in the income column in the above table include any capital gain distributions from underlying funds, which are presented in the corresponding line-item in the Statement of Operations, if applicable.
Affiliated Underlying Funds
Fiscal year to date information regarding the Fund's investments in affiliated Underlying Funds, excluding any Money Market Central Funds, is presented below. Exchanges between classes of the same affiliated Underlying Funds may occur.
| Affiliate | Value, beginning of period | Purchases | Sales Proceeds | Dividend Income | Realized Gain (loss) | Change in Unrealized appreciation (depreciation) | Value, end of period |
| Fidelity Series All-Sector Equity Fund | $349,648,749 | $3,230,490 | $26,101,980 | $-- | $(4,958,650) | $126,988,182 | $448,806,791 |
| Fidelity Series Blue Chip Growth Fund | 633,808,007 | 149,069,215 | 315,613,795 | 143,993,463 | 134,015,804 | 83,094,164 | 684,373,395 |
| Fidelity Series Canada Fund | 346,122,519 | 91,211,660 | 15,968,375 | -- | (1,254,493) | 90,607,343 | 510,718,654 |
| Fidelity Series Commodity Strategy Fund | 644,799,085 | 22,054,695 | 145,861,146 | 2,572,153 | (47,910,129) | 122,535,229 | 595,617,734 |
| Fidelity Series Emerging Markets Debt Fund | 123,242,762 | 4,761,276 | 5,730,266 | 3,590,173 | (143,287) | 15,378,696 | 137,509,181 |
| Fidelity Series Emerging Markets Fund | 212,833,728 | 65,349,714 | 16,340,143 | -- | (75,684) | 80,963,120 | 342,730,735 |
| Fidelity Series Emerging Markets Opportunities Fund | 2,000,663,934 | 495,466,391 | 148,407,580 | -- | 9,338,669 | 760,736,367 | 3,117,797,781 |
| Fidelity Series Floating Rate High Income Fund | 24,399,593 | 866,614 | 1,386,354 | 583,284 | (26,051) | 2,468,708 | 26,322,510 |
| Fidelity Series Government Money Market Fund 0.16% | 578,212,175 | 179,573,237 | 500,703,413 | 458,782 | -- | -- | 257,081,999 |
| Fidelity Series Growth Company Fund | 1,320,805,016 | 11,149,639 | 406,161,216 | -- | 211,651,089 | 608,513,541 | 1,745,958,069 |
| Fidelity Series High Income Fund | 148,793,218 | 5,837,345 | 6,931,775 | 4,420,685 | (120,912) | 15,974,578 | 163,552,454 |
| Fidelity Series Inflation-Protected Bond Index Fund | 408,458,648 | 87,439,536 | 46,355,330 | 349,232 | 294,561 | 25,174,211 | 475,011,626 |
| Fidelity Series International Credit Fund | 10,600,125 | 164,739 | -- | 164,740 | -- | 951,444 | 11,716,308 |
| Fidelity Series International Growth Fund | 1,518,337,992 | 11,722,819 | 412,139,380 | -- | 82,748,757 | 311,183,104 | 1,511,853,292 |
| Fidelity Series International Small Cap Fund | 360,973,191 | 5,332,341 | 20,466,937 | -- | (194,199) | 117,680,952 | 463,325,348 |
| Fidelity Series International Value Fund | 1,344,248,001 | 40,028,516 | 155,525,356 | -- | (34,676,029) | 306,230,536 | 1,500,305,668 |
| Fidelity Series Intrinsic Opportunities Fund | 1,447,923,507 | 37,955,440 | 67,355,173 | 24,197,606 | (7,015,990) | 356,765,028 | 1,768,272,812 |
| Fidelity Series Investment Grade Bond Fund | 1,615,012,011 | 612,267,373 | 176,990,783 | 23,832,690 | (880,014) | 99,405,389 | 2,148,813,976 |
| Fidelity Series Large Cap Stock Fund | 1,276,467,283 | 64,801,381 | 59,265,309 | 52,789,410 | (3,065,469) | 232,097,193 | 1,511,035,079 |
| Fidelity Series Large Cap Value Index Fund | 350,723,921 | 108,749,613 | 18,890,726 | -- | (1,262,094) | 73,472,994 | 512,793,708 |
| Fidelity Series Long-Term Treasury Bond Index Fund | 467,880,223 | 134,388,016 | 37,693,498 | 13,077,874 | 1,496,509 | (17,135,908) | 548,935,342 |
| Fidelity Series Opportunistic Insights Fund | 717,817,047 | 6,581,638 | 52,006,054 | -- | 3,385,267 | 284,333,327 | 960,111,225 |
| Fidelity Series Overseas Fund | 1,236,233,166 | 69,525,065 | 161,923,125 | -- | (7,305,940) | 373,136,780 | 1,509,665,946 |
| Fidelity Series Real Estate Income Fund | 80,430,397 | 3,913,418 | 4,343,952 | 3,025,605 | (397,726) | 15,167,744 | 94,769,881 |
| Fidelity Series Short-Term Credit Fund | 38,699,571 | 605,850 | 59,035 | 442,631 | (253) | 1,454,929 | 40,701,062 |
| Fidelity Series Small Cap Discovery Fund | 142,603,303 | 2,023,897 | 7,262,902 | 506,710 | (635,983) | 50,095,907 | 186,824,222 |
| Fidelity Series Small Cap Opportunities Fund | 498,073,814 | 8,859,807 | 20,597,725 | 3,691,715 | (1,116,707) | 128,846,863 | 614,066,052 |
| Fidelity Series Stock Selector Large Cap Value Fund | 936,560,982 | 131,394,322 | 40,640,118 | -- | (1,564,431) | 213,015,437 | 1,238,766,192 |
| Fidelity Series Value Discovery Fund | 697,006,295 | 108,655,277 | 35,216,402 | -- | (2,059,044) | 171,369,154 | 939,755,280 |
| | $19,531,378,263 | $2,462,979,324 | $2,905,937,848 | $277,696,753 | $328,267,571 | $4,650,505,012 | $24,067,192,322 |
Amounts in the income column in the above table include any capital gain distributions from underlying funds, which are presented in the corresponding line-item in the Statement of Operations, if applicable.
Investment Valuation
The following is a summary of the inputs used, as of September 30, 2020, involving the Fund's assets and liabilities carried at fair value. The inputs or methodology used for valuing securities may not be an indication of the risk associated with investing in those securities. For more information on valuation inputs, and their aggregation into the levels used below, please refer to the Investment Valuation section in the accompanying Notes to Financial Statements.
| | Valuation Inputs at Reporting Date: |
| Description | Total | Level 1 | Level 2 | Level 3 |
| Investments in Securities: | | | | |
| Other Short-Term Investments | $24,605,611 | $-- | $24,605,611 | $-- |
| Domestic Equity Funds | 11,206,380,559 | 11,206,380,559 | -- | -- |
| International Equity Funds | 8,956,397,424 | 8,956,397,424 | -- | -- |
| Bond Funds | 3,606,631,278 | 3,606,631,278 | -- | -- |
| Short-Term Funds | 346,106,373 | 346,106,373 | -- | -- |
| Total Investments in Securities: | $24,140,121,245 | $24,115,515,634 | $24,605,611 | $-- |
| Derivative Instruments: | | | | |
| Liabilities | | | | |
| Futures Contracts | $(1,184,028) | $(1,184,028) | $-- | $-- |
| Total Liabilities | $(1,184,028) | $(1,184,028) | $-- | $-- |
| Total Derivative Instruments: | $(1,184,028) | $(1,184,028) | $-- | $-- |
Value of Derivative Instruments
The following table is a summary of the Fund's value of derivative instruments by primary risk exposure as of September 30, 2020. For additional information on derivative instruments, please refer to the Derivative Instruments section in the accompanying Notes to Financial Statements.
| Primary Risk Exposure / Derivative Type | Value |
| | Asset | Liability |
| Equity Risk | | |
| Futures Contracts(a) | $0 | $(1,184,028) |
| Total Equity Risk | 0 | (1,184,028) |
| Total Value of Derivatives | $0 | $(1,184,028) |
(a) Reflects gross cumulative appreciation (depreciation) on futures contracts as presented in the Schedule of Investments. In the Statement of Assets and Liabilities, the period end daily variation margin is included in receivable or payable for daily variation margin on futures contracts, and the net cumulative appreciation (depreciation) is included in Total accumulated earnings (loss).
See accompanying notes which are an integral part of the financial statements.
Fidelity Freedom® 2035 Fund
Financial Statements
Statement of Assets and Liabilities
| | | September 30, 2020 (Unaudited) |
| Assets | | |
Investment in securities, at value — See accompanying schedule:
Unaffiliated issuers (cost $24,605,368) | $24,605,611 | |
| Fidelity Central Funds (cost $48,322,949) | 48,323,312 | |
| Other affiliated issuers (cost $20,013,288,831) | 24,067,192,322 | |
| Total Investment in Securities (cost $20,086,217,148) | | $24,140,121,245 |
| Receivable for investments sold | | 155,800,067 |
| Receivable for fund shares sold | | 21,438,395 |
| Distributions receivable from Fidelity Central Funds | | 4,406 |
| Total assets | | 24,317,364,113 |
| Liabilities | | |
| Payable for investments purchased | $144,330,043 | |
| Payable for fund shares redeemed | 20,615,803 | |
| Accrued management fee | 12,920,066 | |
| Payable for daily variation margin on futures contracts | 738,932 | |
| Total liabilities | | 178,604,844 |
| Net Assets | | $24,138,759,269 |
| Net Assets consist of: | | |
| Paid in capital | | $19,627,026,549 |
| Total accumulated earnings (loss) | | 4,511,732,720 |
| Net Assets | | $24,138,759,269 |
| Net Asset Value and Maximum Offering Price | | |
| Fidelity Freedom 2035 Fund: | | |
| Net Asset Value, offering price and redemption price per share ($9,173,979,491 ÷ 612,007,038 shares) | | $14.99 |
| Class K: | | |
| Net Asset Value, offering price and redemption price per share ($11,601,248,814 ÷ 774,879,912 shares) | | $14.97 |
| Class K6: | | |
| Net Asset Value, offering price and redemption price per share ($3,363,530,964 ÷ 224,901,402 shares) | | $14.96 |
See accompanying notes which are an integral part of the financial statements.
Statement of Operations
| | | Six months ended September 30, 2020 (Unaudited) |
| Investment Income | | |
| Dividends: | | |
| Affiliated issuers | | $95,352,764 |
| Interest | | 41,211 |
| Income from Fidelity Central Funds | | 38,144 |
| Total income | | 95,432,119 |
| Expenses | | |
| Management fee | $72,832,525 | |
| Independent trustees' fees and expenses | 30,641 | |
| Total expenses before reductions | 72,863,166 | |
| Expense reductions | (49) | |
| Total expenses after reductions | | 72,863,117 |
| Net investment income (loss) | | 22,569,002 |
| Realized and Unrealized Gain (Loss) | | |
| Net realized gain (loss) on: | | |
| Investment securities: | | |
| Fidelity Central Funds | (5,842) | |
| Other affiliated issuers | 328,267,571 | |
| Futures contracts | (16,211,655) | |
| Capital gain distributions from underlying funds: | | |
| Affiliated issuers | 182,343,989 | |
| Total net realized gain (loss) | | 494,394,063 |
| Change in net unrealized appreciation (depreciation) on: | | |
| Investment securities: | | |
| Unaffiliated issuers | (25,229) | |
| Fidelity Central Funds | (2,051) | |
| Other affiliated issuers | 4,650,505,012 | |
| Futures contracts | (1,184,028) | |
| Total change in net unrealized appreciation (depreciation) | | 4,649,293,704 |
| Net gain (loss) | | 5,143,687,767 |
| Net increase (decrease) in net assets resulting from operations | | $5,166,256,769 |
See accompanying notes which are an integral part of the financial statements.
Statement of Changes in Net Assets
| | Six months ended September 30, 2020 (Unaudited) | Year ended March 31, 2020 |
| Increase (Decrease) in Net Assets | | |
| Operations | | |
| Net investment income (loss) | $22,569,002 | $374,514,876 |
| Net realized gain (loss) | 494,394,063 | 1,022,450,167 |
| Change in net unrealized appreciation (depreciation) | 4,649,293,704 | (3,404,610,611) |
| Net increase (decrease) in net assets resulting from operations | 5,166,256,769 | (2,007,645,568) |
| Distributions to shareholders | (634,416,236) | (1,589,726,158) |
| Share transactions - net increase (decrease) | (28,188,534) | 1,105,568,240 |
| Total increase (decrease) in net assets | 4,503,651,999 | (2,491,803,486) |
| Net Assets | | |
| Beginning of period | 19,635,107,270 | 22,126,910,756 |
| End of period | $24,138,759,269 | $19,635,107,270 |
See accompanying notes which are an integral part of the financial statements.
Financial Highlights
Fidelity Freedom 2035 Fund
| | Six months ended (Unaudited) September 30, | Years endedMarch 31, | | | | |
| | 2020 | 2020 | 2019 | 2018 | 2017 | 2016 |
| Selected Per–Share Data | | | | | | |
| Net asset value, beginning of period | $12.21 | $14.42 | $15.20 | $13.88 | $12.46 | $13.67 |
| Income from Investment Operations | | | | | | |
| Net investment income (loss)A | .01 | .23 | .21 | .16 | .19 | .19 |
| Net realized and unrealized gain (loss) | 3.16 | (1.42) | .01 | 1.81 | 1.75 | (.65) |
| Total from investment operations | 3.17 | (1.19) | .22 | 1.97 | 1.94 | (.46) |
| Distributions from net investment income | – | (.23) | (.22) | (.17) | (.18) | (.20) |
| Distributions from net realized gain | (.39) | (.79) | (.78) | (.47) | (.34) | (.55) |
| Total distributions | (.39) | (1.02) | (1.00) | (.65)B | (.52) | (.75) |
| Net asset value, end of period | $14.99 | $12.21 | $14.42 | $15.20 | $13.88 | $12.46 |
| Total ReturnC,D | 26.49% | (9.25)% | 1.85% | 14.32% | 16.09% | (3.59)% |
| Ratios to Average Net AssetsE,F | | | | | | |
| Expenses before reductions | .72%G | .73% | .74% | .63%H | - %I | - %I |
| Expenses net of fee waivers, if any | .72%G | .73% | .74% | .63%H | -% | -% |
| Expenses net of all reductions | .72%G | .73% | .74% | .63%H | -% | -% |
| Net investment income (loss) | .12%G | 1.57% | 1.41% | 1.06% | 1.45% | 1.48% |
| Supplemental Data | | | | | | |
| Net assets, end of period (000 omitted) | $9,173,979 | $7,408,043 | $8,247,886 | $8,050,659 | $6,889,828 | $5,961,088 |
| Portfolio turnover rateJ | 22%G | 31% | 18% | 17%K | 16% | 15% |
A Calculated based on average shares outstanding during the period.
B Total distributions per share do not sum due to rounding.
C Total returns for periods of less than one year are not annualized.
D Total returns would have been lower if certain expenses had not been reduced during the applicable periods shown.
E Fees and expenses of any underlying mutual funds or exchange-traded funds (ETFs) are not included in the Fund's expense ratio. The Fund indirectly bears its proportionate share of these expenses. For additional expense information related to investments in Fidelity Central Funds, please refer to the "Investments in Fidelity Central Funds" note found in the Notes to Financial Statements section of the most recent Annual or Semi-Annual report.
F Expense ratios reflect operating expenses of the class. Expenses before reductions do not reflect amounts reimbursed, waived, or reduced through arrangements with the investment adviser, brokerage services, or other offset arrangements, if applicable, and do not represent the amount paid by the class during periods when reimbursements, waivers or reductions occur.
G Annualized
H On certain classes, the size and fluctuation of net assets and expense amounts may cause ratios to differ from contractual rates.
I Amount represents less than .005%.
J Amount does not include the portfolio activity of any underlying mutual funds or exchange-traded funds (ETFs).
K The portfolio turnover rate does not include the assets acquired in the merger.
See accompanying notes which are an integral part of the financial statements.
Fidelity Freedom 2035 Fund Class K
| | Six months ended (Unaudited) September 30, | Years endedMarch 31, | | |
| | 2020 | 2020 | 2019 | 2018 A |
| Selected Per–Share Data | | | | |
| Net asset value, beginning of period | $12.19 | $14.40 | $15.18 | $14.60 |
| Income from Investment Operations | | | | |
| Net investment income (loss)B | .02 | .24 | .22 | .22 |
| Net realized and unrealized gain (loss) | 3.16 | (1.42) | .01 | .82 |
| Total from investment operations | 3.18 | (1.18) | .23 | 1.04 |
| Distributions from net investment income | – | (.24) | (.23) | (.19) |
| Distributions from net realized gain | (.40) | (.79) | (.78) | (.26) |
| Total distributions | (.40) | (1.03) | (1.01) | (.46)C |
| Net asset value, end of period | $14.97 | $12.19 | $14.40 | $15.18 |
| Total ReturnD,E | 26.56% | (9.19)% | 1.95% | 7.09% |
| Ratios to Average Net AssetsF,G | | | | |
| Expenses before reductions | .62%H | .63% | .64% | .65%H,I |
| Expenses net of fee waivers, if any | .62%H | .63% | .64% | .65%H,I |
| Expenses net of all reductions | .62%H | .63% | .64% | .65%H,I |
| Net investment income (loss) | .22%H | 1.67% | 1.51% | 2.07%H |
| Supplemental Data | | | | |
| Net assets, end of period (000 omitted) | $11,601,249 | $9,620,448 | $11,661,819 | $12,979,898 |
| Portfolio turnover rateJ | 22%H | 31% | 18% | 17%K |
A For the period July 20, 2017 (commencement of sale of shares) to March 31, 2018.
B Calculated based on average shares outstanding during the period.
C Total distributions per share do not sum due to rounding.
D Total returns for periods of less than one year are not annualized.
E Total returns would have been lower if certain expenses had not been reduced during the applicable periods shown.
F Fees and expenses of any underlying mutual funds or exchange-traded funds (ETFs) are not included in the Fund's expense ratio. The Fund indirectly bears its proportionate share of these expenses. For additional expense information related to investments in Fidelity Central Funds, please refer to the "Investments in Fidelity Central Funds" note found in the Notes to Financial Statements section of the most recent Annual or Semi-Annual report.
G Expense ratios reflect operating expenses of the class. Expenses before reductions do not reflect amounts reimbursed, waived, or reduced through arrangements with the investment adviser, brokerage services, or other offset arrangements, if applicable, and do not represent the amount paid by the class during periods when reimbursements, waivers or reductions occur.
H Annualized
I On certain classes, the size and fluctuation of net assets and expense amounts may cause ratios to differ from contractual rates.
J Amount does not include the portfolio activity of any underlying mutual funds or exchange-traded funds (ETFs).
K The portfolio turnover rate does not include the assets acquired in the merger.
See accompanying notes which are an integral part of the financial statements.
Fidelity Freedom 2035 Fund Class K6
| | Six months ended (Unaudited) September 30, | Years endedMarch 31, | | |
| | 2020 | 2020 | 2019 | 2018 A |
| Selected Per–Share Data | | | | |
| Net asset value, beginning of period | $12.17 | $14.39 | $15.20 | $14.30 |
| Income from Investment Operations | | | | |
| Net investment income (loss)B | .03 | .26 | .24 | .20 |
| Net realized and unrealized gain (loss) | 3.16 | (1.42) | .01 | 1.16 |
| Total from investment operations | 3.19 | (1.16) | .25 | 1.36 |
| Distributions from net investment income | – | (.26) | (.27) | (.20) |
| Distributions from net realized gain | (.40) | (.80) | (.79) | (.26) |
| Total distributions | (.40) | (1.06) | (1.06) | (.46) |
| Net asset value, end of period | $14.96 | $12.17 | $14.39 | $15.20 |
| Total ReturnC,D | 26.74% | (9.08)% | 2.10% | 9.50% |
| Ratios to Average Net AssetsE,F | | | | |
| Expenses before reductions | .48%G | .49% | .49% | .50%G,H |
| Expenses net of fee waivers, if any | .48%G | .49% | .49% | .50%G,H |
| Expenses net of all reductions | .48%G | .49% | .49% | .50%G,H |
| Net investment income (loss) | .36%G | 1.82% | 1.65% | 1.61%G |
| Supplemental Data | | | | |
| Net assets, end of period (000 omitted) | $3,363,531 | $2,606,617 | $2,217,206 | $712,276 |
| Portfolio turnover rateI | 22%G | 31% | 18% | 17%J |
A For the period June 7, 2017 (commencement of sale of shares) to March 31, 2018.
B Calculated based on average shares outstanding during the period.
C Total returns for periods of less than one year are not annualized.
D Total returns would have been lower if certain expenses had not been reduced during the applicable periods shown.
E Fees and expenses of any underlying mutual funds or exchange-traded funds (ETFs) are not included in the Fund's expense ratio. The Fund indirectly bears its proportionate share of these expenses. For additional expense information related to investments in Fidelity Central Funds, please refer to the "Investments in Fidelity Central Funds" note found in the Notes to Financial Statements section of the most recent Annual or Semi-Annual report.
F Expense ratios reflect operating expenses of the class. Expenses before reductions do not reflect amounts reimbursed, waived, or reduced through arrangements with the investment adviser, brokerage services, or other offset arrangements, if applicable, and do not represent the amount paid by the class during periods when reimbursements, waivers or reductions occur.
G Annualized
H On certain classes, the size and fluctuation of net assets and expense amounts may cause ratios to differ from contractual rates.
I Amount does not include the portfolio activity of any underlying mutual funds or exchange-traded funds (ETFs).
J The portfolio turnover rate does not include the assets acquired in the merger.
See accompanying notes which are an integral part of the financial statements.
Fidelity Freedom® 2040 Fund
Investment Summary (Unaudited)
The information in the following tables is based on the direct investments of the Fund.
Top Holdings as of September 30, 2020
| | % of fund's net assets |
| Fidelity Series Emerging Markets Opportunities Fund | 14.0 |
| Fidelity Series Growth Company Fund | 8.3 |
| Fidelity Series Intrinsic Opportunities Fund | 8.1 |
| Fidelity Series Large Cap Stock Fund | 7.0 |
| Fidelity Series International Growth Fund | 7.0 |
| Fidelity Series Overseas Fund | 6.9 |
| Fidelity Series International Value Fund | 6.9 |
| Fidelity Series Stock Selector Large Cap Value Fund | 5.7 |
| Fidelity Series Opportunistic Insights Fund | 4.4 |
| Fidelity Series Value Discovery Fund | 4.3 |
| | 72.6 |
Asset Allocation (% of fund's net assets)
| Period end |
| | Domestic Equity Funds | 51.6% |
| | International Equity Funds | 40.8% |
| | Bond Funds | 6.0% |
| | Short-Term Funds | 1.5% |
| | Short-Term Investments | 0.1% |

Domestic Equity Funds category includes Fidelity Series Commodity Strategy Fund which invests in commodity-related investments.
Fidelity Freedom® 2040 Fund
Schedule of Investments September 30, 2020 (Unaudited)
Showing Percentage of Net Assets
| U.S. Treasury Obligations - 0.1% | | | |
| | | Principal Amount | Value |
| U.S. Treasury Bills, yield at date of purchase 0.1% to 0.11% 12/3/20 to 12/10/20 (a) | | | |
| (Cost $28,424,502) | | 28,430,000 | 28,424,859 |
| | | Shares | Value |
|
| Domestic Equity Funds - 51.6% | | | |
| Fidelity Series All-Sector Equity Fund (b) | | 46,511,256 | $495,344,881 |
| Fidelity Series Blue Chip Growth Fund (b) | | 47,472,495 | 783,770,900 |
| Fidelity Series Commodity Strategy Fund (b) | | 144,975,021 | 603,096,088 |
| Fidelity Series Growth Company Fund (b) | | 76,726,848 | 2,011,010,691 |
| Fidelity Series Intrinsic Opportunities Fund (b) | | 122,985,508 | 1,945,630,736 |
| Fidelity Series Large Cap Stock Fund (b) | | 118,759,786 | 1,681,638,564 |
| Fidelity Series Large Cap Value Index Fund (b) | | 48,751,388 | 565,516,106 |
| Fidelity Series Opportunistic Insights Fund (b) | | 48,653,578 | 1,052,376,895 |
| Fidelity Series Small Cap Discovery Fund (b) | | 20,816,240 | 210,452,187 |
| Fidelity Series Small Cap Opportunities Fund (b) | | 53,262,298 | 679,626,917 |
| Fidelity Series Stock Selector Large Cap Value Fund (b) | | 125,763,080 | 1,383,393,883 |
| Fidelity Series Value Discovery Fund (b) | | 84,449,221 | 1,043,792,368 |
| TOTAL DOMESTIC EQUITY FUNDS | | | |
| (Cost $9,723,991,796) | | | 12,455,650,216 |
|
| International Equity Funds - 40.8% | | | |
| Fidelity Series Canada Fund (b) | | 55,361,490 | 566,348,044 |
| Fidelity Series Emerging Markets Fund (b) | | 39,456,217 | 372,072,126 |
| Fidelity Series Emerging Markets Opportunities Fund (b) | | 160,479,675 | 3,366,863,590 |
| Fidelity Series International Growth Fund (b) | | 89,377,612 | 1,678,511,562 |
| Fidelity Series International Small Cap Fund (b) | | 28,852,299 | 513,570,919 |
| Fidelity Series International Value Fund (b) | | 193,162,035 | 1,665,056,740 |
| Fidelity Series Overseas Fund (b) | | 149,918,648 | 1,676,090,486 |
| TOTAL INTERNATIONAL EQUITY FUNDS | | | |
| (Cost $8,276,351,321) | | | 9,838,513,467 |
|
| Bond Funds - 6.0% | | | |
| Fidelity Series Emerging Markets Debt Fund (b) | | 14,941,850 | 135,373,162 |
| Fidelity Series Floating Rate High Income Fund (b) | | 2,957,938 | 26,177,754 |
| Fidelity Series High Income Fund (b) | | 17,899,135 | 163,240,108 |
| Fidelity Series Inflation-Protected Bond Index Fund (b) | | 44,406,431 | 475,148,810 |
| Fidelity Series International Credit Fund (b) | | 1,094,112 | 11,389,701 |
| Fidelity Series Long-Term Treasury Bond Index Fund (b) | | 52,585,826 | 543,211,585 |
| Fidelity Series Real Estate Income Fund (b) | | 9,611,043 | 95,918,206 |
| TOTAL BOND FUNDS | | | |
| (Cost $1,376,955,966) | | | 1,450,459,326 |
|
| Short-Term Funds - 1.5% | | | |
| Fidelity Cash Central Fund 0.10% (c) | | 50,824,323 | 50,834,488 |
| Fidelity Series Government Money Market Fund 0.16% (b)(d) | | 279,921,821 | 279,921,821 |
| Fidelity Series Short-Term Credit Fund (b) | | 4,004,212 | 41,043,174 |
| TOTAL SHORT-TERM FUNDS | | | |
| (Cost $370,584,991) | | | 371,799,483 |
| TOTAL INVESTMENT IN SECURITIES - 100.0% | | | |
| (Cost $19,776,308,576) | | | 24,144,847,351 |
| NET OTHER ASSETS (LIABILITIES) - 0.0% | | | (1,620,355) |
| NET ASSETS - 100% | | | $24,143,226,996 |
| Futures Contracts | | | | | |
| | Number of contracts | Expiration Date | Notional Amount | Value | Unrealized Appreciation/(Depreciation) |
| Purchased | | | | | |
| Equity Index Contracts | | | | | |
| ICE E-mini MSCI EAFE Index Contracts (United States) | 560 | Dec. 2020 | $51,889,600 | $(988,975) | $(988,975) |
| Sold | | | | | |
| Equity Index Contracts | | | | | |
| CME E-mini S&P 500 Index Contracts (United States) | 269 | Dec. 2020 | 45,084,400 | (294,321) | (294,321) |
| TOTAL FUTURES CONTRACTS | | | | | $(1,283,296) |
The notional amount of futures purchased as a percentage of Net Assets is 0.2%
The notional amount of futures sold as a percentage of Net Assets is 0.2%
Legend
(a) Security or a portion of the security was pledged to cover margin requirements for futures contracts. At period end, the value of securities pledged amounted to $28,424,859.
(b) Affiliated Fund
(c) Affiliated fund that is generally available only to investment companies and other accounts managed by Fidelity Investments. The rate quoted is the annualized seven-day yield of the fund at period end. A complete unaudited listing of the fund's holdings as of its most recent quarter end is available upon request. In addition, each Fidelity Central Fund's financial statements are available on the SEC's website or upon request.
(d) The rate quoted is the annualized seven-day yield of the fund at period end.
Affiliated Central Funds
Information regarding fiscal year to date income earned by the Fund from investments in Fidelity Central Funds is as follows:
| Fund | Income earned |
| Fidelity Cash Central Fund | $37,340 |
| Total | $37,340 |
Affiliated Underlying Funds
Fiscal year to date information regarding the Fund's investments in affiliated Underlying Funds, excluding any Money Market Central Funds, is presented below. Exchanges between classes of the same affiliated Underlying Funds may occur.
| Affiliate | Value, beginning of period | Purchases | Sales Proceeds | Dividend Income | Realized Gain (loss) | Change in Unrealized appreciation (depreciation) | Value, end of period |
| Fidelity Series All-Sector Equity Fund | $379,844,160 | $3,303,171 | $21,691,255 | $-- | $(1,609,880) | $135,498,685 | $495,344,881 |
| Fidelity Series Blue Chip Growth Fund | 694,320,587 | 183,884,118 | 309,906,004 | 178,298,370 | 94,424,587 | 121,047,612 | 783,770,900 |
| Fidelity Series Canada Fund | 378,931,606 | 101,341,317 | 12,012,269 | -- | (1,228,834) | 99,316,224 | 566,348,044 |
| Fidelity Series Commodity Strategy Fund | 646,206,631 | 28,982,683 | 145,791,042 | 2,580,064 | (51,448,853) | 125,146,669 | 603,096,088 |
| Fidelity Series Emerging Markets Debt Fund | 121,561,538 | 4,609,217 | 5,803,326 | 3,536,323 | (96,537) | 15,102,270 | 135,373,162 |
| Fidelity Series Emerging Markets Fund | 226,559,024 | 75,551,474 | 15,445,300 | -- | (108,177) | 85,515,105 | 372,072,126 |
| Fidelity Series Emerging Markets Opportunities Fund | 2,128,703,375 | 524,516,946 | 101,166,443 | -- | 6,274,396 | 808,535,316 | 3,366,863,590 |
| Fidelity Series Floating Rate High Income Fund | 24,311,225 | 839,911 | 1,404,030 | 580,339 | (34,577) | 2,465,225 | 26,177,754 |
| Fidelity Series Government Money Market Fund 0.16% | 579,793,482 | 190,397,878 | 490,269,539 | 471,130 | -- | -- | 279,921,821 |
| Fidelity Series Growth Company Fund | 1,429,457,131 | 12,357,278 | 324,413,841 | -- | 168,259,143 | 725,350,980 | 2,011,010,691 |
| Fidelity Series High Income Fund | 148,721,571 | 5,711,428 | 7,020,153 | 4,413,573 | (51,146) | 15,878,408 | 163,240,108 |
| Fidelity Series Inflation-Protected Bond Index Fund | 413,241,334 | 94,858,377 | 58,473,159 | 347,208 | 146,546 | 25,375,712 | 475,148,810 |
| Fidelity Series International Credit Fund | 10,304,633 | 160,147 | -- | 160,147 | -- | 924,921 | 11,389,701 |
| Fidelity Series International Growth Fund | 1,620,917,039 | 10,579,503 | 382,208,320 | -- | 81,244,585 | 347,978,755 | 1,678,511,562 |
| Fidelity Series International Small Cap Fund | 387,510,225 | 21,408,641 | 22,936,229 | -- | (391,843) | 127,980,125 | 513,570,919 |
| Fidelity Series International Value Fund | 1,449,691,547 | 48,304,394 | 126,103,976 | -- | (24,953,406) | 318,118,181 | 1,665,056,740 |
| Fidelity Series Intrinsic Opportunities Fund | 1,586,816,675 | 51,395,917 | 76,144,180 | 26,569,886 | (6,715,159) | 390,277,483 | 1,945,630,736 |
| Fidelity Series Large Cap Stock Fund | 1,407,477,972 | 99,922,389 | 75,910,041 | 57,717,804 | (6,719,209) | 256,867,453 | 1,681,638,564 |
| Fidelity Series Large Cap Value Index Fund | 386,286,675 | 121,619,245 | 21,229,826 | -- | (1,478,800) | 80,318,812 | 565,516,106 |
| Fidelity Series Long-Term Treasury Bond Index Fund | 471,792,052 | 133,289,835 | 46,464,694 | 12,756,537 | 5,362,798 | (20,768,406) | 543,211,585 |
| Fidelity Series Opportunistic Insights Fund | 786,510,852 | 6,722,099 | 56,032,929 | -- | 3,906,681 | 311,270,192 | 1,052,376,895 |
| Fidelity Series Overseas Fund | 1,343,371,459 | 80,534,426 | 148,054,672 | -- | (5,673,804) | 405,913,077 | 1,676,090,486 |
| Fidelity Series Real Estate Income Fund | 81,495,734 | 3,874,998 | 4,399,305 | 3,061,665 | (380,885) | 15,327,664 | 95,918,206 |
| Fidelity Series Short-Term Credit Fund | 39,141,971 | 543,844 | 110,741 | 446,448 | 1,081 | 1,467,019 | 41,043,174 |
| Fidelity Series Small Cap Discovery Fund | 157,396,268 | 4,836,111 | 7,185,701 | 570,407 | 4,283 | 55,401,226 | 210,452,187 |
| Fidelity Series Small Cap Opportunities Fund | 548,656,569 | 13,375,793 | 23,436,792 | 4,083,639 | (730,164) | 141,761,511 | 679,626,917 |
| Fidelity Series Stock Selector Large Cap Value Fund | 1,032,007,516 | 164,354,659 | 45,947,713 | -- | (1,038,130) | 234,017,551 | 1,383,393,883 |
| Fidelity Series Value Discovery Fund | 768,337,156 | 134,236,429 | 43,408,833 | -- | (3,481,348) | 188,108,964 | 1,043,792,368 |
| | $19,249,366,007 | $2,121,512,228 | $2,572,970,313 | $295,593,540 | $253,483,348 | $5,014,196,734 | $24,065,588,004 |
Amounts in the income column in the above table include any capital gain distributions from underlying funds, which are presented in the corresponding line-item in the Statement of Operations, if applicable.
Investment Valuation
The following is a summary of the inputs used, as of September 30, 2020, involving the Fund's assets and liabilities carried at fair value. The inputs or methodology used for valuing securities may not be an indication of the risk associated with investing in those securities. For more information on valuation inputs, and their aggregation into the levels used below, please refer to the Investment Valuation section in the accompanying Notes to Financial Statements.
| | Valuation Inputs at Reporting Date: |
| Description | Total | Level 1 | Level 2 | Level 3 |
| Investments in Securities: | | | | |
| Other Short-Term Investments | $28,424,859 | $-- | $28,424,859 | $-- |
| Domestic Equity Funds | 12,455,650,216 | 12,455,650,216 | -- | -- |
| International Equity Funds | 9,838,513,467 | 9,838,513,467 | -- | -- |
| Bond Funds | 1,450,459,326 | 1,450,459,326 | -- | -- |
| Short-Term Funds | 371,799,483 | 371,799,483 | -- | -- |
| Total Investments in Securities: | $24,144,847,351 | $24,116,422,492 | $28,424,859 | $-- |
| Derivative Instruments: | | | | |
| Liabilities | | | | |
| Futures Contracts | $(1,283,296) | $(1,283,296) | $-- | $-- |
| Total Liabilities | $(1,283,296) | $(1,283,296) | $-- | $-- |
| Total Derivative Instruments: | $(1,283,296) | $(1,283,296) | $-- | $-- |
Value of Derivative Instruments
The following table is a summary of the Fund's value of derivative instruments by primary risk exposure as of September 30, 2020. For additional information on derivative instruments, please refer to the Derivative Instruments section in the accompanying Notes to Financial Statements.
| Primary Risk Exposure / Derivative Type | Value |
| | Asset | Liability |
| Equity Risk | | |
| Futures Contracts(a) | $0 | $(1,283,296) |
| Total Equity Risk | 0 | (1,283,296) |
| Total Value of Derivatives | $0 | $(1,283,296) |
(a) Reflects gross cumulative appreciation (depreciation) on futures contracts as presented in the Schedule of Investments. In the Statement of Assets and Liabilities, the period end daily variation margin is included in receivable or payable for daily variation margin on futures contracts, and the net cumulative appreciation (depreciation) is included in Total accumulated earnings (loss).
See accompanying notes which are an integral part of the financial statements.
Fidelity Freedom® 2040 Fund
Financial Statements
Statement of Assets and Liabilities
| | | September 30, 2020 (Unaudited) |
| Assets | | |
Investment in securities, at value — See accompanying schedule:
Unaffiliated issuers (cost $28,424,502) | $28,424,859 | |
| Fidelity Central Funds (cost $50,834,071) | 50,834,488 | |
| Other affiliated issuers (cost $19,697,050,003) | 24,065,588,004 | |
| Total Investment in Securities (cost $19,776,308,576) | | $24,144,847,351 |
| Receivable for investments sold | | 222,549,966 |
| Receivable for fund shares sold | | 19,566,470 |
| Distributions receivable from Fidelity Central Funds | | 4,703 |
| Total assets | | 24,386,968,490 |
| Liabilities | | |
| Payable for investments purchased | $216,495,339 | |
| Payable for fund shares redeemed | 12,862,705 | |
| Accrued management fee | 13,395,973 | |
| Payable for daily variation margin on futures contracts | 987,477 | |
| Total liabilities | | 243,741,494 |
| Net Assets | | $24,143,226,996 |
| Net Assets consist of: | | |
| Paid in capital | | $19,374,652,966 |
| Total accumulated earnings (loss) | | 4,768,574,030 |
| Net Assets | | $24,143,226,996 |
| Net Asset Value and Maximum Offering Price | | |
| Fidelity Freedom 2040 Fund: | | |
| Net Asset Value, offering price and redemption price per share ($9,292,313,419 ÷ 887,417,439 shares) | | $10.47 |
| Class K: | | |
| Net Asset Value, offering price and redemption price per share ($11,707,132,813 ÷ 1,118,346,306 shares) | | $10.47 |
| Class K6: | | |
| Net Asset Value, offering price and redemption price per share ($3,143,780,764 ÷ 301,113,178 shares) | | $10.44 |
See accompanying notes which are an integral part of the financial statements.
Statement of Operations
| | | Six months ended September 30, 2020 (Unaudited) |
| Investment Income | | |
| Dividends: | | |
| Affiliated issuers | | $76,802,743 |
| Interest | | 40,258 |
| Income from Fidelity Central Funds | | 37,340 |
| Total income | | 76,880,341 |
| Expenses | | |
| Management fee | $75,163,132 | |
| Independent trustees' fees and expenses | 30,405 | |
| Total expenses before reductions | 75,193,537 | |
| Expense reductions | (39) | |
| Total expenses after reductions | | 75,193,498 |
| Net investment income (loss) | | 1,686,843 |
| Realized and Unrealized Gain (Loss) | | |
| Net realized gain (loss) on: | | |
| Investment securities: | | |
| Fidelity Central Funds | (5,777) | |
| Other affiliated issuers | 253,483,348 | |
| Futures contracts | (7,313,817) | |
| Capital gain distributions from underlying funds: | | |
| Affiliated issuers | 218,790,797 | |
| Total net realized gain (loss) | | 464,954,551 |
| Change in net unrealized appreciation (depreciation) on: | | |
| Investment securities: | | |
| Unaffiliated issuers | (23,024) | |
| Fidelity Central Funds | (2,428) | |
| Other affiliated issuers | 5,014,196,734 | |
| Futures contracts | (2,625,315) | |
| Total change in net unrealized appreciation (depreciation) | | 5,011,545,967 |
| Net gain (loss) | | 5,476,500,518 |
| Net increase (decrease) in net assets resulting from operations | | $5,478,187,361 |
See accompanying notes which are an integral part of the financial statements.
Statement of Changes in Net Assets
| | Six months ended September 30, 2020 (Unaudited) | Year ended March 31, 2020 |
| Increase (Decrease) in Net Assets | | |
| Operations | | |
| Net investment income (loss) | $1,686,843 | $363,684,658 |
| Net realized gain (loss) | 464,954,551 | 988,510,700 |
| Change in net unrealized appreciation (depreciation) | 5,011,545,967 | (3,657,548,277) |
| Net increase (decrease) in net assets resulting from operations | 5,478,187,361 | (2,305,352,919) |
| Distributions to shareholders | (645,014,091) | (1,587,988,996) |
| Share transactions - net increase (decrease) | (42,901,886) | 811,338,784 |
| Total increase (decrease) in net assets | 4,790,271,384 | (3,082,003,131) |
| Net Assets | | |
| Beginning of period | 19,352,955,612 | 22,434,958,743 |
| End of period | $24,143,226,996 | $19,352,955,612 |
See accompanying notes which are an integral part of the financial statements.
Financial Highlights
Fidelity Freedom 2040 Fund
| | Six months ended (Unaudited) September 30, | Years endedMarch 31, | | | | |
| | 2020 | 2020 | 2019 | 2018 | 2017 | 2016 |
| Selected Per–Share Data | | | | | | |
| Net asset value, beginning of period | $8.40 | $10.09 | $10.67 | $9.74 | $8.75 | $9.63 |
| Income from Investment Operations | | | | | | |
| Net investment income (loss)A | –B | .15 | .14 | .11 | .13 | .13 |
| Net realized and unrealized gain (loss) | 2.35 | (1.13) | –B | 1.29 | 1.24 | (.46) |
| Total from investment operations | 2.35 | (.98) | .14 | 1.40 | 1.37 | (.33) |
| Distributions from net investment income | – | (.16) | (.15) | (.12) | (.13) | (.14) |
| Distributions from net realized gain | (.28) | (.55) | (.57) | (.35) | (.24) | (.41) |
| Total distributions | (.28) | (.71) | (.72) | (.47) | (.38)C | (.55) |
| Net asset value, end of period | $10.47 | $8.40 | $10.09 | $10.67 | $9.74 | $8.75 |
| Total ReturnD,E | 28.52% | (10.80)% | 1.79% | 14.52% | 16.14% | (3.62)% |
| Ratios to Average Net AssetsF,G | | | | | | |
| Expenses before reductions | .75%H | .75% | .75% | .63%I | - %J | - %J |
| Expenses net of fee waivers, if any | .75%H | .75% | .75% | .63%I | -% | -% |
| Expenses net of all reductions | .75%H | .75% | .75% | .63%I | -% | -% |
| Net investment income (loss) | (.07)%H | 1.52% | 1.36% | 1.04% | 1.44% | 1.47% |
| Supplemental Data | | | | | | |
| Net assets, end of period (000 omitted) | $9,292,313 | $7,378,482 | $8,404,848 | $8,285,660 | $7,264,459 | $6,388,566 |
| Portfolio turnover rateK | 19%H | 28% | 17% | 16%L | 15% | 16% |
A Calculated based on average shares outstanding during the period.
B Amount represents less than $.005 per share.
C Total distributions per share do not sum due to rounding.
D Total returns for periods of less than one year are not annualized.
E Total returns would have been lower if certain expenses had not been reduced during the applicable periods shown.
F Fees and expenses of any underlying mutual funds or exchange-traded funds (ETFs) are not included in the Fund's expense ratio. The Fund indirectly bears its proportionate share of these expenses. For additional expense information related to investments in Fidelity Central Funds, please refer to the "Investments in Fidelity Central Funds" note found in the Notes to Financial Statements section of the most recent Annual or Semi-Annual report.
G Expense ratios reflect operating expenses of the class. Expenses before reductions do not reflect amounts reimbursed, waived, or reduced through arrangements with the investment adviser, brokerage services, or other offset arrangements, if applicable, and do not represent the amount paid by the class during periods when reimbursements, waivers or reductions occur.
H Annualized
I On certain classes, the size and fluctuation of net assets and expense amounts may cause ratios to differ from contractual rates.
J Amount represents less than .005%.
K Amount does not include the portfolio activity of any underlying mutual funds or exchange-traded funds (ETFs).
L The portfolio turnover rate does not include the assets acquired in the merger.
See accompanying notes which are an integral part of the financial statements.
Fidelity Freedom 2040 Fund Class K
| | Six months ended (Unaudited) September 30, | Years endedMarch 31, | | |
| | 2020 | 2020 | 2019 | 2018 A |
| Selected Per–Share Data | | | | |
| Net asset value, beginning of period | $8.39 | $10.08 | $10.66 | $10.25 |
| Income from Investment Operations | | | | |
| Net investment income (loss)B | –C | .16 | .15 | .15 |
| Net realized and unrealized gain (loss) | 2.36 | (1.13) | –C | .59 |
| Total from investment operations | 2.36 | (.97) | .15 | .74 |
| Distributions from net investment income | – | (.17) | (.16) | (.14) |
| Distributions from net realized gain | (.28) | (.55) | (.57) | (.19) |
| Total distributions | (.28) | (.72) | (.73) | (.33) |
| Net asset value, end of period | $10.47 | $8.39 | $10.08 | $10.66 |
| Total ReturnD,E | 28.70% | (10.76)% | 1.87% | 7.21% |
| Ratios to Average Net AssetsF,G | | | | |
| Expenses before reductions | .64%H | .64% | .64% | .65%H,I |
| Expenses net of fee waivers, if any | .64%H | .64% | .64% | .65%H,I |
| Expenses net of all reductions | .64%H | .64% | .64% | .65%H,I |
| Net investment income (loss) | .04%H | 1.62% | 1.46% | 2.06%H |
| Supplemental Data | | | | |
| Net assets, end of period (000 omitted) | $11,707,133 | $9,581,184 | $11,994,623 | $13,434,642 |
| Portfolio turnover rateJ | 19%H | 28% | 17% | 16%K |
A For the period July 20, 2017 (commencement of sale of shares) to March 31, 2018.
B Calculated based on average shares outstanding during the period.
C Amount represents less than $.005 per share.
D Total returns for periods of less than one year are not annualized.
E Total returns would have been lower if certain expenses had not been reduced during the applicable periods shown.
F Fees and expenses of any underlying mutual funds or exchange-traded funds (ETFs) are not included in the Fund's expense ratio. The Fund indirectly bears its proportionate share of these expenses. For additional expense information related to investments in Fidelity Central Funds, please refer to the "Investments in Fidelity Central Funds" note found in the Notes to Financial Statements section of the most recent Annual or Semi-Annual report.
G Expense ratios reflect operating expenses of the class. Expenses before reductions do not reflect amounts reimbursed, waived, or reduced through arrangements with the investment adviser, brokerage services, or other offset arrangements, if applicable, and do not represent the amount paid by the class during periods when reimbursements, waivers or reductions occur.
H Annualized
I On certain classes, the size and fluctuation of net assets and expense amounts may cause ratios to differ from contractual rates.
J Amount does not include the portfolio activity of any underlying mutual funds or exchange-traded funds (ETFs).
K The portfolio turnover rate does not include the assets acquired in the merger.
See accompanying notes which are an integral part of the financial statements.
Fidelity Freedom 2040 Fund Class K6
| | Six months ended (Unaudited) September 30, | Years endedMarch 31, | | |
| | 2020 | 2020 | 2019 | 2018 A |
| Selected Per–Share Data | | | | |
| Net asset value, beginning of period | $8.37 | $10.06 | $10.66 | $10.03 |
| Income from Investment Operations | | | | |
| Net investment income (loss)B | .01 | .18 | .16 | .13 |
| Net realized and unrealized gain (loss) | 2.35 | (1.13) | .01 | .83 |
| Total from investment operations | 2.36 | (.95) | .17 | .96 |
| Distributions from net investment income | – | (.18) | (.19) | (.14) |
| Distributions from net realized gain | (.29) | (.56) | (.58) | (.19) |
| Total distributions | (.29) | (.74) | (.77) | (.33) |
| Net asset value, end of period | $10.44 | $8.37 | $10.06 | $10.66 |
| Total ReturnC,D | 28.72% | (10.58)% | 2.06% | 9.60% |
| Ratios to Average Net AssetsE,F | | | | |
| Expenses before reductions | .49%G | .49% | .50%H | .50%G,H |
| Expenses net of fee waivers, if any | .49%G | .49% | .50%H | .50%G,H |
| Expenses net of all reductions | .49%G | .49% | .50%H | .50%G,H |
| Net investment income (loss) | .19%G | 1.77% | 1.61% | 1.55%G |
| Supplemental Data | | | | |
| Net assets, end of period (000 omitted) | $3,143,781 | $2,393,289 | $2,035,487 | $652,451 |
| Portfolio turnover rateI | 19%G | 28% | 17% | 16%J |
A For the period June 7, 2017 (commencement of sale of shares) to March 31, 2018.
B Calculated based on average shares outstanding during the period.
C Total returns for periods of less than one year are not annualized.
D Total returns would have been lower if certain expenses had not been reduced during the applicable periods shown.
E Fees and expenses of any underlying mutual funds or exchange-traded funds (ETFs) are not included in the Fund's expense ratio. The Fund indirectly bears its proportionate share of these expenses. For additional expense information related to investments in Fidelity Central Funds, please refer to the "Investments in Fidelity Central Funds" note found in the Notes to Financial Statements section of the most recent Annual or Semi-Annual report.
F Expense ratios reflect operating expenses of the class. Expenses before reductions do not reflect amounts reimbursed, waived, or reduced through arrangements with the investment adviser, brokerage services, or other offset arrangements, if applicable, and do not represent the amount paid by the class during periods when reimbursements, waivers or reductions occur.
G Annualized
H On certain classes, the size and fluctuation of net assets and expense amounts may cause ratios to differ from contractual rates.
I Amount does not include the portfolio activity of any underlying mutual funds or exchange-traded funds (ETFs).
J The portfolio turnover rate does not include the assets acquired in the merger.
See accompanying notes which are an integral part of the financial statements.
Fidelity Freedom® 2045 Fund
Investment Summary (Unaudited)
The information in the following tables is based on the direct investments of the Fund.
Top Holdings as of September 30, 2020
| | % of fund's net assets |
| Fidelity Series Emerging Markets Opportunities Fund | 14.0 |
| Fidelity Series Growth Company Fund | 8.3 |
| Fidelity Series Intrinsic Opportunities Fund | 8.1 |
| Fidelity Series Large Cap Stock Fund | 7.0 |
| Fidelity Series International Growth Fund | 7.0 |
| Fidelity Series Overseas Fund | 6.9 |
| Fidelity Series International Value Fund | 6.9 |
| Fidelity Series Stock Selector Large Cap Value Fund | 5.7 |
| Fidelity Series Opportunistic Insights Fund | 4.4 |
| Fidelity Series Value Discovery Fund | 4.3 |
| | 72.6 |
Asset Allocation (% of fund's net assets)
| Period end |
| | Domestic Equity Funds | 51.6% |
| | International Equity Funds | 40.8% |
| | Bond Funds | 6.0% |
| | Short-Term Funds | 1.5% |
| | Short-Term Investments | 0.1% |

Domestic Equity Funds category includes Fidelity Series Commodity Strategy Fund which invests in commodity-related investments.
Fidelity Freedom® 2045 Fund
Schedule of Investments September 30, 2020 (Unaudited)
Showing Percentage of Net Assets
| U.S. Treasury Obligations - 0.1% | | | |
| | | Principal Amount | Value |
| U.S. Treasury Bills, yield at date of purchase 0.1% to 0.11% 12/3/20 to 12/10/20 (a) | | | |
| (Cost $18,426,440) | | 18,430,000 | 18,426,668 |
| | | Shares | Value |
|
| Domestic Equity Funds - 51.6% | | | |
| Fidelity Series All-Sector Equity Fund (b) | | 30,245,343 | $322,112,905 |
| Fidelity Series Blue Chip Growth Fund (b) | | 30,898,457 | 510,133,526 |
| Fidelity Series Commodity Strategy Fund (b) | | 94,413,701 | 392,760,997 |
| Fidelity Series Growth Company Fund (b) | | 49,929,515 | 1,308,652,597 |
| Fidelity Series Intrinsic Opportunities Fund (b) | | 80,023,146 | 1,265,966,173 |
| Fidelity Series Large Cap Stock Fund (b) | | 77,285,462 | 1,094,362,142 |
| Fidelity Series Large Cap Value Index Fund (b) | | 31,735,849 | 368,135,851 |
| Fidelity Series Opportunistic Insights Fund (b) | | 31,632,086 | 684,202,030 |
| Fidelity Series Small Cap Discovery Fund (b) | | 13,537,522 | 136,864,346 |
| Fidelity Series Small Cap Opportunities Fund (b) | | 34,669,325 | 442,380,584 |
| Fidelity Series Stock Selector Large Cap Value Fund (b) | | 81,845,870 | 900,304,565 |
| Fidelity Series Value Discovery Fund (b) | | 54,962,576 | 679,337,443 |
| TOTAL DOMESTIC EQUITY FUNDS | | | |
| (Cost $6,508,059,257) | | | 8,105,213,159 |
|
| International Equity Funds - 40.8% | | | |
| Fidelity Series Canada Fund (b) | | 36,029,669 | 368,583,511 |
| Fidelity Series Emerging Markets Fund (b) | | 25,691,273 | 242,268,708 |
| Fidelity Series Emerging Markets Opportunities Fund (b) | | 104,427,419 | 2,190,887,252 |
| Fidelity Series International Growth Fund (b) | | 58,155,476 | 1,092,159,838 |
| Fidelity Series International Small Cap Fund (b) | | 18,773,359 | 334,165,794 |
| Fidelity Series International Value Fund (b) | | 125,694,237 | 1,083,484,323 |
| Fidelity Series Overseas Fund (b) | | 97,547,850 | 1,090,584,967 |
| TOTAL INTERNATIONAL EQUITY FUNDS | | | |
| (Cost $5,448,353,857) | | | 6,402,134,393 |
|
| Bond Funds - 6.0% | | | |
| Fidelity Series Emerging Markets Debt Fund (b) | | 9,731,018 | 88,163,019 |
| Fidelity Series Floating Rate High Income Fund (b) | | 1,953,797 | 17,291,104 |
| Fidelity Series High Income Fund (b) | | 11,657,338 | 106,314,927 |
| Fidelity Series Inflation-Protected Bond Index Fund (b) | | 28,899,275 | 309,222,239 |
| Fidelity Series International Credit Fund (b) | | 650,968 | 6,776,574 |
| Fidelity Series Long-Term Treasury Bond Index Fund (b) | | 34,249,448 | 353,796,800 |
| Fidelity Series Real Estate Income Fund (b) | | 6,188,666 | 61,762,885 |
| TOTAL BOND FUNDS | | | |
| (Cost $895,293,213) | | | 943,327,548 |
|
| Short-Term Funds - 1.5% | | | |
| Fidelity Cash Central Fund 0.10% (c) | | 32,052,583 | 32,058,994 |
| Fidelity Series Government Money Market Fund 0.16% (b)(d) | | 182,304,231 | 182,304,231 |
| Fidelity Series Short-Term Credit Fund (b) | | 2,623,271 | 26,888,530 |
| TOTAL SHORT-TERM FUNDS | | | |
| (Cost $240,449,556) | | | 241,251,755 |
| TOTAL INVESTMENT IN SECURITIES - 100.0% | | | |
| (Cost $13,110,582,323) | | | 15,710,353,523 |
| NET OTHER ASSETS (LIABILITIES) - 0.0% | | | (1,046,614) |
| NET ASSETS - 100% | | | $15,709,306,909 |
| Futures Contracts | | | | | |
| | Number of contracts | Expiration Date | Notional Amount | Value | Unrealized Appreciation/(Depreciation) |
| Purchased | | | | | |
| Equity Index Contracts | | | | | |
| ICE E-mini MSCI EAFE Index Contracts (United States) | 363 | Dec. 2020 | $33,635,580 | $(641,041) | $(641,041) |
| Sold | | | | | |
| Equity Index Contracts | | | | | |
| CME E-mini S&P 500 Index Contracts (United States) | 177 | Dec. 2020 | 29,665,200 | (193,661) | (193,661) |
| TOTAL FUTURES CONTRACTS | | | | | $(834,702) |
The notional amount of futures purchased as a percentage of Net Assets is 0.2%
The notional amount of futures sold as a percentage of Net Assets is 0.2%
Legend
(a) Security or a portion of the security was pledged to cover margin requirements for futures contracts. At period end, the value of securities pledged amounted to $18,426,668.
(b) Affiliated Fund
(c) Affiliated fund that is generally available only to investment companies and other accounts managed by Fidelity Investments. The rate quoted is the annualized seven-day yield of the fund at period end. A complete unaudited listing of the fund's holdings as of its most recent quarter end is available upon request. In addition, each Fidelity Central Fund's financial statements are available on the SEC's website or upon request.
(d) The rate quoted is the annualized seven-day yield of the fund at period end.
Affiliated Central Funds
Information regarding fiscal year to date income earned by the Fund from investments in Fidelity Central Funds is as follows:
| Fund | Income earned |
| Fidelity Cash Central Fund | $23,681 |
| Total | $23,681 |
Amounts in the income column in the above table include any capital gain distributions from underlying funds, which are presented in the corresponding line-item in the Statement of Operations, if applicable.
Affiliated Underlying Funds
Fiscal year to date information regarding the Fund's investments in affiliated Underlying Funds, excluding any Money Market Central Funds, is presented below. Exchanges between classes of the same affiliated Underlying Funds may occur.
| Affiliate | Value, beginning of period | Purchases | Sales Proceeds | Dividend Income | Realized Gain (loss) | Change in Unrealized appreciation (depreciation) | Value, end of period |
| Fidelity Series All-Sector Equity Fund | $243,345,740 | $4,922,066 | $12,349,904 | $-- | $(320,617) | $86,515,620 | $322,112,905 |
| Fidelity Series Blue Chip Growth Fund | 444,840,786 | 123,927,529 | 196,484,250 | 115,803,542 | 52,462,021 | 85,387,440 | 510,133,526 |
| Fidelity Series Canada Fund | 242,577,568 | 69,573,100 | 6,667,136 | -- | (701,304) | 63,801,283 | 368,583,511 |
| Fidelity Series Commodity Strategy Fund | 414,290,973 | 23,054,928 | 92,154,696 | 1,675,953 | (30,674,699) | 78,244,491 | 392,760,997 |
| Fidelity Series Emerging Markets Debt Fund | 77,901,194 | 3,893,149 | 3,278,387 | 2,282,806 | 17,327 | 9,629,736 | 88,163,019 |
| Fidelity Series Emerging Markets Fund | 145,255,562 | 50,539,317 | 8,573,634 | -- | (88,943) | 55,136,406 | 242,268,708 |
| Fidelity Series Emerging Markets Opportunities Fund | 1,364,681,176 | 355,738,631 | 54,411,064 | -- | 1,520,643 | 523,357,866 | 2,190,887,252 |
| Fidelity Series Floating Rate High Income Fund | 15,733,939 | 768,656 | 793,157 | 379,058 | (8,595) | 1,590,261 | 17,291,104 |
| Fidelity Series Government Money Market Fund 0.16% | 371,430,307 | 125,545,212 | 314,671,288 | 303,728 | -- | -- | 182,304,231 |
| Fidelity Series Growth Company Fund | 915,811,783 | 18,215,636 | 201,081,651 | -- | 70,340,476 | 505,366,353 | 1,308,652,597 |
| Fidelity Series High Income Fund | 95,298,373 | 4,797,065 | 3,965,792 | 2,849,068 | 29,450 | 10,155,831 | 106,314,927 |
| Fidelity Series Inflation-Protected Bond Index Fund | 264,863,387 | 64,003,115 | 36,098,934 | 223,847 | 55,389 | 16,399,282 | 309,222,239 |
| Fidelity Series International Credit Fund | 6,130,987 | 95,283 | -- | 95,284 | -- | 550,304 | 6,776,574 |
| Fidelity Series International Growth Fund | 1,038,755,116 | 15,654,116 | 238,852,902 | -- | 37,602,895 | 239,000,613 | 1,092,159,838 |
| Fidelity Series International Small Cap Fund | 248,399,296 | 16,778,595 | 13,278,194 | -- | (68,439) | 82,334,536 | 334,165,794 |
| Fidelity Series International Value Fund | 929,267,144 | 41,519,865 | 75,851,794 | -- | (15,668,975) | 204,218,083 | 1,083,484,323 |
| Fidelity Series Intrinsic Opportunities Fund | 1,016,845,055 | 45,370,072 | 43,038,014 | 17,259,292 | (1,101,173) | 247,890,233 | 1,265,966,173 |
| Fidelity Series Large Cap Stock Fund | 902,062,631 | 74,862,743 | 43,300,036 | 37,373,400 | (2,595,399) | 163,332,203 | 1,094,362,142 |
| Fidelity Series Large Cap Value Index Fund | 247,604,152 | 81,789,727 | 11,983,939 | -- | (763,064) | 51,488,975 | 368,135,851 |
| Fidelity Series Long-Term Treasury Bond Index Fund | 302,380,590 | 89,714,102 | 28,366,916 | 8,203,610 | 3,426,619 | (13,357,595) | 353,796,800 |
| Fidelity Series Opportunistic Insights Fund | 503,882,073 | 10,019,631 | 32,646,586 | -- | 274,949 | 202,671,963 | 684,202,030 |
| Fidelity Series Overseas Fund | 861,115,277 | 61,595,733 | 89,867,986 | -- | (3,563,819) | 261,305,762 | 1,090,584,967 |
| Fidelity Series Real Estate Income Fund | 51,566,409 | 3,179,675 | 2,485,261 | 1,958,899 | (177,423) | 9,679,485 | 61,762,885 |
| Fidelity Series Short-Term Credit Fund | 25,486,982 | 450,704 | 9,955 | 292,395 | 102 | 960,697 | 26,888,530 |
| Fidelity Series Small Cap Discovery Fund | 100,982,202 | 4,103,530 | 3,847,375 | 367,288 | (84,385) | 35,710,374 | 136,864,346 |
| Fidelity Series Small Cap Opportunities Fund | 351,735,840 | 12,449,567 | 12,550,477 | 2,652,821 | 469,759 | 90,275,895 | 442,380,584 |
| Fidelity Series Stock Selector Large Cap Value Fund | 661,521,596 | 113,614,336 | 24,719,452 | -- | (383,546) | 150,271,631 | 900,304,565 |
| Fidelity Series Value Discovery Fund | 492,395,896 | 92,542,883 | 24,494,864 | -- | (1,498,715) | 120,392,243 | 679,337,443 |
| | $12,336,162,034 | $1,508,718,966 | $1,575,823,644 | $191,720,991 | $108,500,534 | $3,282,309,971 | $15,659,867,861 |
Amounts in the income column in the above table include any capital gain distributions from underlying funds, which are presented in the corresponding line-item in the Statement of Operations, if applicable.
Investment Valuation
The following is a summary of the inputs used, as of September 30, 2020, involving the Fund's assets and liabilities carried at fair value. The inputs or methodology used for valuing securities may not be an indication of the risk associated with investing in those securities. For more information on valuation inputs, and their aggregation into the levels used below, please refer to the Investment Valuation section in the accompanying Notes to Financial Statements.
| | Valuation Inputs at Reporting Date: |
| Description | Total | Level 1 | Level 2 | Level 3 |
| Investments in Securities: | | | | |
| Other Short-Term Investments | $18,426,668 | $-- | $18,426,668 | $-- |
| Domestic Equity Funds | 8,105,213,159 | 8,105,213,159 | -- | -- |
| International Equity Funds | 6,402,134,393 | 6,402,134,393 | -- | -- |
| Bond Funds | 943,327,548 | 943,327,548 | -- | -- |
| Short-Term Funds | 241,251,755 | 241,251,755 | -- | -- |
| Total Investments in Securities: | $15,710,353,523 | $15,691,926,855 | $18,426,668 | $-- |
| Derivative Instruments: | | | | |
| Liabilities | | | | |
| Futures Contracts | $(834,702) | $(834,702) | $-- | $-- |
| Total Liabilities | $(834,702) | $(834,702) | $-- | $-- |
| Total Derivative Instruments: | $(834,702) | $(834,702) | $-- | $-- |
Value of Derivative Instruments
The following table is a summary of the Fund's value of derivative instruments by primary risk exposure as of September 30, 2020. For additional information on derivative instruments, please refer to the Derivative Instruments section in the accompanying Notes to Financial Statements.
| Primary Risk Exposure / Derivative Type | Value |
| | Asset | Liability |
| Equity Risk | | |
| Futures Contracts(a) | $0 | $(834,702) |
| Total Equity Risk | 0 | (834,702) |
| Total Value of Derivatives | $0 | $(834,702) |
(a) Reflects gross cumulative appreciation (depreciation) on futures contracts as presented in the Schedule of Investments. In the Statement of Assets and Liabilities, the period end daily variation margin is included in receivable or payable for daily variation margin on futures contracts, and the net cumulative appreciation (depreciation) is included in Total accumulated earnings (loss).
See accompanying notes which are an integral part of the financial statements.
Fidelity Freedom® 2045 Fund
Financial Statements
Statement of Assets and Liabilities
| | | September 30, 2020 (Unaudited) |
| Assets | | |
Investment in securities, at value — See accompanying schedule:
Unaffiliated issuers (cost $18,426,440) | $18,426,668 | |
| Fidelity Central Funds (cost $32,058,715) | 32,058,994 | |
| Other affiliated issuers (cost $13,060,097,168) | 15,659,867,861 | |
| Total Investment in Securities (cost $13,110,582,323) | | $15,710,353,523 |
| Receivable for investments sold | | 142,555,795 |
| Receivable for fund shares sold | | 18,565,450 |
| Distributions receivable from Fidelity Central Funds | | 2,965 |
| Total assets | | 15,871,477,733 |
| Liabilities | | |
| Payable for investments purchased | $143,458,783 | |
| Payable for fund shares redeemed | 9,502,838 | |
| Accrued management fee | 8,571,073 | |
| Payable for daily variation margin on futures contracts | 638,130 | |
| Total liabilities | | 162,170,824 |
| Net Assets | | $15,709,306,909 |
| Net Assets consist of: | | |
| Paid in capital | | $12,921,083,091 |
| Total accumulated earnings (loss) | | 2,788,223,818 |
| Net Assets | | $15,709,306,909 |
| Net Asset Value and Maximum Offering Price | | |
| Fidelity Freedom 2045 Fund: | | |
| Net Asset Value, offering price and redemption price per share ($5,041,600,537 ÷ 422,865,520 shares) | | $11.92 |
| Class K: | | |
| Net Asset Value, offering price and redemption price per share ($8,251,818,590 ÷ 692,833,804 shares) | | $11.91 |
| Class K6: | | |
| Net Asset Value, offering price and redemption price per share ($2,415,887,782 ÷ 203,290,829 shares) | | $11.88 |
See accompanying notes which are an integral part of the financial statements.
Statement of Operations
| | | Six months ended September 30, 2020 (Unaudited) |
| Investment Income | | |
| Dividends: | | |
| Affiliated issuers | | $49,754,561 |
| Interest | | 25,817 |
| Income from Fidelity Central Funds | | 23,681 |
| Total income | | 49,804,059 |
| Expenses | | |
| Management fee | $47,798,618 | |
| Independent trustees' fees and expenses | 19,550 | |
| Total expenses before reductions | 47,818,168 | |
| Expense reductions | (37) | |
| Total expenses after reductions | | 47,818,131 |
| Net investment income (loss) | | 1,985,928 |
| Realized and Unrealized Gain (Loss) | | |
| Net realized gain (loss) on: | | |
| Investment securities: | | |
| Fidelity Central Funds | (3,797) | |
| Other affiliated issuers | 108,500,534 | |
| Futures contracts | (4,770,052) | |
| Capital gain distributions from underlying funds: | | |
| Affiliated issuers | 141,966,430 | |
| Total net realized gain (loss) | | 245,693,115 |
| Change in net unrealized appreciation (depreciation) on: | | |
| Investment securities: | | |
| Unaffiliated issuers | (14,733) | |
| Fidelity Central Funds | (1,518) | |
| Other affiliated issuers | 3,282,309,971 | |
| Futures contracts | (1,719,984) | |
| Total change in net unrealized appreciation (depreciation) | | 3,280,573,736 |
| Net gain (loss) | | 3,526,266,851 |
| Net increase (decrease) in net assets resulting from operations | | $3,528,252,779 |
See accompanying notes which are an integral part of the financial statements.
Statement of Changes in Net Assets
| | Six months ended September 30, 2020 (Unaudited) | Year ended March 31, 2020 |
| Increase (Decrease) in Net Assets | | |
| Operations | | |
| Net investment income (loss) | $1,985,928 | $229,304,423 |
| Net realized gain (loss) | 245,693,115 | 573,467,194 |
| Change in net unrealized appreciation (depreciation) | 3,280,573,736 | (2,298,016,057) |
| Net increase (decrease) in net assets resulting from operations | 3,528,252,779 | (1,495,244,440) |
| Distributions to shareholders | (390,928,748) | (967,465,826) |
| Share transactions - net increase (decrease) | 169,614,320 | 1,051,585,785 |
| Total increase (decrease) in net assets | 3,306,938,351 | (1,411,124,481) |
| Net Assets | | |
| Beginning of period | 12,402,368,558 | 13,813,493,039 |
| End of period | $15,709,306,909 | $12,402,368,558 |
See accompanying notes which are an integral part of the financial statements.
Financial Highlights
Fidelity Freedom 2045 Fund
| | Six months ended (Unaudited) September 30, | Years endedMarch 31, | | | | |
| | 2020 | 2020 | 2019 | 2018 | 2017 | 2016 |
| Selected Per–Share Data | | | | | | |
| Net asset value, beginning of period | $9.54 | $11.44 | $12.09 | $11.00 | $9.89 | $10.84 |
| Income from Investment Operations | | | | | | |
| Net investment income (loss)A | –B | .17 | .16 | .12 | .15 | .15 |
| Net realized and unrealized gain (loss) | 2.68 | (1.29) | (.01) | 1.46 | 1.39 | (.52) |
| Total from investment operations | 2.68 | (1.12) | .15 | 1.58 | 1.54 | (.37) |
| Distributions from net investment income | – | (.18) | (.17) | (.13) | (.15) | (.16) |
| Distributions from net realized gain | (.30) | (.61) | (.63) | (.35) | (.28) | (.43) |
| Total distributions | (.30) | (.78)C | (.80) | (.49)C | (.43) | (.58)C |
| Net asset value, end of period | $11.92 | $9.54 | $11.44 | $12.09 | $11.00 | $9.89 |
| Total ReturnD,E | 28.59% | (10.80)% | 1.72% | 14.48% | 16.08% | (3.59)% |
| Ratios to Average Net AssetsF,G | | | | | | |
| Expenses before reductions | .75%H | .75% | .75% | .63%I | - %J | - %J |
| Expenses net of fee waivers, if any | .75%H | .75% | .75% | .63%I | -% | -% |
| Expenses net of all reductions | .75%H | .75% | .75% | .63%I | -% | -% |
| Net investment income (loss) | (.07)%H | 1.52% | 1.37% | 1.04% | 1.45% | 1.48% |
| Supplemental Data | | | | | | |
| Net assets, end of period (000 omitted) | $5,041,601 | $3,945,874 | $4,345,914 | $4,144,152 | $3,496,184 | $2,912,972 |
| Portfolio turnover rateK | 21%H | 28% | 18% | 17%L | 15% | 17% |
A Calculated based on average shares outstanding during the period.
B Amount represents less than $.005 per share.
C Total distributions per share do not sum due to rounding.
D Total returns for periods of less than one year are not annualized.
E Total returns would have been lower if certain expenses had not been reduced during the applicable periods shown.
F Fees and expenses of any underlying mutual funds or exchange-traded funds (ETFs) are not included in the Fund's expense ratio. The Fund indirectly bears its proportionate share of these expenses. For additional expense information related to investments in Fidelity Central Funds, please refer to the "Investments in Fidelity Central Funds" note found in the Notes to Financial Statements section of the most recent Annual or Semi-Annual report.
G Expense ratios reflect operating expenses of the class. Expenses before reductions do not reflect amounts reimbursed, waived, or reduced through arrangements with the investment adviser, brokerage services, or other offset arrangements, if applicable, and do not represent the amount paid by the class during periods when reimbursements, waivers or reductions occur.
H Annualized
I On certain classes, the size and fluctuation of net assets and expense amounts may cause ratios to differ from contractual rates.
J Amount represents less than .005%.
K Amount does not include the portfolio activity of any underlying mutual funds or exchange-traded funds (ETFs).
L The portfolio turnover rate does not include the assets acquired in the merger.
See accompanying notes which are an integral part of the financial statements.
Fidelity Freedom 2045 Fund Class K
| | Six months ended (Unaudited) September 30, | Years endedMarch 31, | | |
| | 2020 | 2020 | 2019 | 2018 A |
| Selected Per–Share Data | | | | |
| Net asset value, beginning of period | $9.53 | $11.43 | $12.08 | $11.59 |
| Income from Investment Operations | | | | |
| Net investment income (loss)B | –C | .18 | .17 | .17 |
| Net realized and unrealized gain (loss) | 2.68 | (1.29) | (.01) | .67 |
| Total from investment operations | 2.68 | (1.11) | .16 | .84 |
| Distributions from net investment income | – | (.19) | (.18) | (.15) |
| Distributions from net realized gain | (.30) | (.61) | (.63) | (.19) |
| Total distributions | (.30) | (.79)D | (.81) | (.35)D |
| Net asset value, end of period | $11.91 | $9.53 | $11.43 | $12.08 |
| Total ReturnE,F | 28.66% | (10.74)% | 1.83% | 7.21% |
| Ratios to Average Net AssetsG,H | | | | |
| Expenses before reductions | .64%I | .64% | .64% | .65%I,J |
| Expenses net of fee waivers, if any | .64%I | .64% | .64% | .65%I,J |
| Expenses net of all reductions | .64%I | .64% | .64% | .65%I,J |
| Net investment income (loss) | .04%I | 1.62% | 1.47% | 2.05%I |
| Supplemental Data | | | | |
| Net assets, end of period (000 omitted) | $8,251,819 | $6,636,812 | $7,982,073 | $8,748,416 |
| Portfolio turnover rateK | 21%I | 28% | 18% | 17%L |
A For the period July 20, 2017 (commencement of sale of shares) to March 31, 2018.
B Calculated based on average shares outstanding during the period.
C Amount represents less than $.005 per share.
D Total distributions per share do not sum due to rounding.
E Total returns for periods of less than one year are not annualized.
F Total returns would have been lower if certain expenses had not been reduced during the applicable periods shown.
G Fees and expenses of any underlying mutual funds or exchange-traded funds (ETFs) are not included in the Fund's expense ratio. The Fund indirectly bears its proportionate share of these expenses. For additional expense information related to investments in Fidelity Central Funds, please refer to the "Investments in Fidelity Central Funds" note found in the Notes to Financial Statements section of the most recent Annual or Semi-Annual report.
H Expense ratios reflect operating expenses of the class. Expenses before reductions do not reflect amounts reimbursed, waived, or reduced through arrangements with the investment adviser, brokerage services, or other offset arrangements, if applicable, and do not represent the amount paid by the class during periods when reimbursements, waivers or reductions occur.
I Annualized
J On certain classes, the size and fluctuation of net assets and expense amounts may cause ratios to differ from contractual rates.
K Amount does not include the portfolio activity of any underlying mutual funds or exchange-traded funds (ETFs).
L The portfolio turnover rate does not include the assets acquired in the merger.
See accompanying notes which are an integral part of the financial statements.
Fidelity Freedom 2045 Fund Class K6
| | Six months ended (Unaudited) September 30, | Years endedMarch 31, | | |
| | 2020 | 2020 | 2019 | 2018 A |
| Selected Per–Share Data | | | | |
| Net asset value, beginning of period | $9.51 | $11.41 | $12.09 | $11.34 |
| Income from Investment Operations | | | | |
| Net investment income (loss)B | .01 | .20 | .18 | .14 |
| Net realized and unrealized gain (loss) | 2.67 | (1.28) | (.01) | .96 |
| Total from investment operations | 2.68 | (1.08) | .17 | 1.10 |
| Distributions from net investment income | – | (.20) | (.21) | (.16) |
| Distributions from net realized gain | (.31) | (.61) | (.64) | (.19) |
| Total distributions | (.31) | (.82)C | (.85) | (.35) |
| Net asset value, end of period | $11.88 | $9.51 | $11.41 | $12.09 |
| Total ReturnD,E | 28.69% | (10.57)% | 1.95% | 9.70% |
| Ratios to Average Net AssetsF,G | | | | |
| Expenses before reductions | .49%H | .49% | .50%I | .50%H,I |
| Expenses net of fee waivers, if any | .49%H | .49% | .50%I | .50%H,I |
| Expenses net of all reductions | .49%H | .49% | .50%I | .50%H,I |
| Net investment income (loss) | .19%H | 1.77% | 1.62% | 1.45%H |
| Supplemental Data | | | | |
| Net assets, end of period (000 omitted) | $2,415,888 | $1,819,682 | $1,485,505 | $412,758 |
| Portfolio turnover rateJ | 21%H | 28% | 18% | 17%K |
A For the period June 7, 2017 (commencement of sale of shares) to March 31, 2018.
B Calculated based on average shares outstanding during the period.
C Total distributions per share do not sum due to rounding.
D Total returns for periods of less than one year are not annualized.
E Total returns would have been lower if certain expenses had not been reduced during the applicable periods shown.
F Fees and expenses of any underlying mutual funds or exchange-traded funds (ETFs) are not included in the Fund's expense ratio. The Fund indirectly bears its proportionate share of these expenses. For additional expense information related to investments in Fidelity Central Funds, please refer to the "Investments in Fidelity Central Funds" note found in the Notes to Financial Statements section of the most recent Annual or Semi-Annual report.
G Expense ratios reflect operating expenses of the class. Expenses before reductions do not reflect amounts reimbursed, waived, or reduced through arrangements with the investment adviser, brokerage services, or other offset arrangements, if applicable, and do not represent the amount paid by the class during periods when reimbursements, waivers or reductions occur.
H Annualized
I On certain classes, the size and fluctuation of net assets and expense amounts may cause ratios to differ from contractual rates.
J Amount does not include the portfolio activity of any underlying mutual funds or exchange-traded funds (ETFs).
K The portfolio turnover rate does not include the assets acquired in the merger.
See accompanying notes which are an integral part of the financial statements.
Fidelity Freedom® 2050 Fund
Investment Summary (Unaudited)
The information in the following tables is based on the direct investments of the Fund.
Top Holdings as of September 30, 2020
| | % of fund's net assets |
| Fidelity Series Emerging Markets Opportunities Fund | 14.0 |
| Fidelity Series Growth Company Fund | 8.3 |
| Fidelity Series Intrinsic Opportunities Fund | 8.1 |
| Fidelity Series Large Cap Stock Fund | 7.0 |
| Fidelity Series International Growth Fund | 7.0 |
| Fidelity Series Overseas Fund | 6.9 |
| Fidelity Series International Value Fund | 6.9 |
| Fidelity Series Stock Selector Large Cap Value Fund | 5.7 |
| Fidelity Series Opportunistic Insights Fund | 4.4 |
| Fidelity Series Value Discovery Fund | 4.3 |
| | 72.6 |
Asset Allocation (% of fund's net assets)
| Period end |
| | Domestic Equity Funds | 51.6% |
| | International Equity Funds | 40.8% |
| | Bond Funds | 6.0% |
| | Short-Term Funds | 1.5% |
| | Short-Term Investments | 0.1% |

Domestic Equity Funds category includes Fidelity Series Commodity Strategy Fund which invests in commodity-related investments.
Fidelity Freedom® 2050 Fund
Schedule of Investments September 30, 2020 (Unaudited)
Showing Percentage of Net Assets
| U.S. Treasury Obligations - 0.1% | | | |
| | | Principal Amount | Value |
| U.S. Treasury Bills, yield at date of purchase 0.1% to 0.11% 12/3/20 to 12/10/20 (a) | | | |
| (Cost $16,196,871) | | 16,200,000 | 16,197,071 |
| | | Shares | Value |
|
| Domestic Equity Funds - 51.6% | | | |
| Fidelity Series All-Sector Equity Fund (b) | | 26,623,166 | $283,536,715 |
| Fidelity Series Blue Chip Growth Fund (b) | | 27,208,131 | 449,206,248 |
| Fidelity Series Commodity Strategy Fund (b) | | 83,152,060 | 345,912,570 |
| Fidelity Series Growth Company Fund (b) | | 43,963,010 | 1,152,270,502 |
| Fidelity Series Intrinsic Opportunities Fund (b) | | 70,457,472 | 1,114,637,203 |
| Fidelity Series Large Cap Stock Fund (b) | | 68,050,902 | 963,600,769 |
| Fidelity Series Large Cap Value Index Fund (b) | | 27,947,047 | 324,185,750 |
| Fidelity Series Opportunistic Insights Fund (b) | | 27,840,909 | 602,198,869 |
| Fidelity Series Small Cap Discovery Fund (b) | | 11,920,470 | 120,515,949 |
| Fidelity Series Small Cap Opportunities Fund (b) | | 30,529,338 | 389,554,354 |
| Fidelity Series Stock Selector Large Cap Value Fund (b) | | 72,067,352 | 792,740,869 |
| Fidelity Series Value Discovery Fund (b) | | 48,397,070 | 598,187,787 |
| TOTAL DOMESTIC EQUITY FUNDS | | | |
| (Cost $5,778,946,458) | | | 7,136,547,585 |
|
| International Equity Funds - 40.8% | | | |
| Fidelity Series Canada Fund (b) | | 31,724,029 | 324,536,821 |
| Fidelity Series Emerging Markets Fund (b) | | 22,625,594 | 213,359,347 |
| Fidelity Series Emerging Markets Opportunities Fund (b) | | 91,946,945 | 1,929,046,902 |
| Fidelity Series International Growth Fund (b) | | 51,203,748 | 961,606,384 |
| Fidelity Series International Small Cap Fund (b) | | 16,529,585 | 294,226,617 |
| Fidelity Series International Value Fund (b) | | 110,671,057 | 953,984,515 |
| Fidelity Series Overseas Fund (b) | | 85,887,363 | 960,220,714 |
| TOTAL INTERNATIONAL EQUITY FUNDS | | | |
| (Cost $4,812,082,007) | | | 5,636,981,300 |
|
| Bond Funds - 6.0% | | | |
| Fidelity Series Emerging Markets Debt Fund (b) | | 8,571,709 | 77,659,680 |
| Fidelity Series Floating Rate High Income Fund (b) | | 1,730,757 | 15,317,204 |
| Fidelity Series High Income Fund (b) | | 10,268,593 | 93,649,566 |
| Fidelity Series Inflation-Protected Bond Index Fund (b) | | 25,446,153 | 272,273,840 |
| Fidelity Series International Credit Fund (b) | | 550,360 | 5,729,250 |
| Fidelity Series Long-Term Treasury Bond Index Fund (b) | | 30,165,118 | 311,605,669 |
| Fidelity Series Real Estate Income Fund (b) | | 5,462,068 | 54,511,437 |
| TOTAL BOND FUNDS | | | |
| (Cost $788,598,165) | | | 830,746,646 |
|
| Short-Term Funds - 1.5% | | | |
| Fidelity Cash Central Fund 0.10% (c) | | 27,638,166 | 27,643,693 |
| Fidelity Series Government Money Market Fund 0.16% (b)(d) | | 160,556,705 | 160,556,705 |
| Fidelity Series Short-Term Credit Fund (b) | | 2,314,916 | 23,727,891 |
| TOTAL SHORT-TERM FUNDS | | | |
| (Cost $211,216,785) | | | 211,928,289 |
| TOTAL INVESTMENT IN SECURITIES - 100.0% | | | |
| (Cost $11,607,040,286) | | | 13,832,400,891 |
| NET OTHER ASSETS (LIABILITIES) - 0.0% | | | (916,496) |
| NET ASSETS - 100% | | | $13,831,484,395 |
| Futures Contracts | | | | | |
| | Number of contracts | Expiration Date | Notional Amount | Value | Unrealized Appreciation/(Depreciation) |
| Purchased | | | | | |
| Equity Index Contracts | | | | | |
| ICE E-mini MSCI EAFE Index Contracts (United States) | 319 | Dec. 2020 | $29,558,540 | $(563,278) | $(563,278) |
| Sold | | | | | |
| Equity Index Contracts | | | | | |
| CME E-mini S&P 500 Index Contracts (United States) | 157 | Dec. 2020 | 26,313,200 | (171,778) | (171,778) |
| TOTAL FUTURES CONTRACTS | | | | | $(735,056) |
The notional amount of futures purchased as a percentage of Net Assets is 0.2%
The notional amount of futures sold as a percentage of Net Assets is 0.2%
Legend
(a) Security or a portion of the security was pledged to cover margin requirements for futures contracts. At period end, the value of securities pledged amounted to $16,197,071.
(b) Affiliated Fund
(c) Affiliated fund that is generally available only to investment companies and other accounts managed by Fidelity Investments. The rate quoted is the annualized seven-day yield of the fund at period end. A complete unaudited listing of the fund's holdings as of its most recent quarter end is available upon request. In addition, each Fidelity Central Fund's financial statements are available on the SEC's website or upon request.
(d) The rate quoted is the annualized seven-day yield of the fund at period end.
Affiliated Central Funds
Information regarding fiscal year to date income earned by the Fund from investments in Fidelity Central Funds is as follows:
| Fund | Income earned |
| Fidelity Cash Central Fund | $20,471 |
| Total | $20,471 |
Amounts in the income column in the above table include any capital gain distributions from underlying funds, which are presented in the corresponding line-item in the Statement of Operations, if applicable.
Affiliated Underlying Funds
Fiscal year to date information regarding the Fund's investments in affiliated Underlying Funds, excluding any Money Market Central Funds, is presented below. Exchanges between classes of the same affiliated Underlying Funds may occur.
| Affiliate | Value, beginning of period | Purchases | Sales Proceeds | Dividend Income | Realized Gain (loss) | Change in Unrealized appreciation (depreciation) | Value, end of period |
| Fidelity Series All-Sector Equity Fund | $212,103,452 | $6,299,677 | $10,312,800 | $-- | $415,786 | $75,030,600 | $283,536,715 |
| Fidelity Series Blue Chip Growth Fund | 387,768,085 | 112,623,342 | 171,522,755 | 101,779,614 | 40,818,225 | 79,519,351 | 449,206,248 |
| Fidelity Series Canada Fund | 211,216,958 | 63,675,775 | 5,584,112 | -- | (541,314) | 55,769,514 | 324,536,821 |
| Fidelity Series Commodity Strategy Fund | 361,223,795 | 23,149,490 | 80,190,271 | 1,472,681 | (25,187,786) | 66,917,342 | 345,912,570 |
| Fidelity Series Emerging Markets Debt Fund | 67,912,785 | 4,047,566 | 2,738,408 | 2,000,961 | 31,217 | 8,406,520 | 77,659,680 |
| Fidelity Series Emerging Markets Fund | 126,658,976 | 45,667,134 | 7,193,056 | -- | (94,812) | 48,321,105 | 213,359,347 |
| Fidelity Series Emerging Markets Opportunities Fund | 1,189,836,247 | 324,962,352 | 45,456,464 | -- | 1,007,281 | 458,697,486 | 1,929,046,902 |
| Fidelity Series Floating Rate High Income Fund | 13,761,959 | 828,900 | 662,517 | 333,754 | (16,636) | 1,405,498 | 15,317,204 |
| Fidelity Series Government Money Market Fund 0.16% | 323,644,870 | 111,963,717 | 275,051,882 | 265,836 | -- | -- | 160,556,705 |
| Fidelity Series Growth Company Fund | 798,291,591 | 23,940,288 | 174,121,219 | -- | 51,294,501 | 452,865,341 | 1,152,270,502 |
| Fidelity Series High Income Fund | 83,078,313 | 4,973,083 | 3,312,590 | 2,497,352 | 4,471 | 8,906,289 | 93,649,566 |
| Fidelity Series Inflation-Protected Bond Index Fund | 230,909,234 | 58,171,970 | 31,221,196 | 196,051 | 44,620 | 14,369,212 | 272,273,840 |
| Fidelity Series International Credit Fund | 5,183,439 | 80,557 | -- | 80,557 | -- | 465,254 | 5,729,250 |
| Fidelity Series International Growth Fund | 905,643,982 | 20,447,755 | 206,645,978 | -- | 30,378,428 | 211,782,197 | 961,606,384 |
| Fidelity Series International Small Cap Fund | 216,595,635 | 16,486,034 | 11,041,905 | -- | 180,951 | 72,005,902 | 294,226,617 |
| Fidelity Series International Value Fund | 810,228,607 | 43,565,646 | 64,805,880 | -- | (12,668,991) | 177,665,133 | 953,984,515 |
| Fidelity Series Intrinsic Opportunities Fund | 886,446,859 | 48,235,170 | 35,938,277 | 15,164,944 | 115,665 | 215,777,786 | 1,114,637,203 |
| Fidelity Series Large Cap Stock Fund | 786,415,802 | 73,131,807 | 36,466,704 | 32,812,505 | (1,509,327) | 142,029,191 | 963,600,769 |
| Fidelity Series Large Cap Value Index Fund | 215,875,500 | 73,882,089 | 9,941,347 | -- | (526,262) | 44,895,770 | 324,185,750 |
| Fidelity Series Long-Term Treasury Bond Index Fund | 263,615,483 | 81,039,874 | 24,354,080 | 7,168,961 | 2,989,498 | (11,685,106) | 311,605,669 |
| Fidelity Series Opportunistic Insights Fund | 439,233,571 | 12,811,634 | 27,534,841 | -- | (71,842) | 177,760,347 | 602,198,869 |
| Fidelity Series Overseas Fund | 750,810,782 | 60,549,767 | 76,798,811 | -- | (2,909,020) | 228,567,996 | 960,220,714 |
| Fidelity Series Real Estate Income Fund | 44,989,175 | 3,273,139 | 2,075,890 | 1,721,681 | (158,121) | 8,483,134 | 54,511,437 |
| Fidelity Series Short-Term Credit Fund | 22,423,945 | 472,779 | 16,082 | 257,976 | (247) | 847,496 | 23,727,891 |
| Fidelity Series Small Cap Discovery Fund | 88,053,848 | 4,483,707 | 3,187,274 | 321,741 | (21,834) | 31,187,502 | 120,515,949 |
| Fidelity Series Small Cap Opportunities Fund | 306,736,837 | 13,807,785 | 10,400,421 | 2,331,121 | 236,334 | 79,173,819 | 389,554,354 |
| Fidelity Series Stock Selector Large Cap Value Fund | 576,799,170 | 105,095,353 | 20,262,451 | -- | (621,175) | 131,729,972 | 792,740,869 |
| Fidelity Series Value Discovery Fund | 429,258,511 | 85,301,107 | 20,400,258 | -- | (729,024) | 104,757,451 | 598,187,787 |
| | $10,754,717,411 | $1,422,967,497 | $1,357,237,469 | $168,405,735 | $82,460,586 | $2,885,652,102 | $13,788,560,127 |
Amounts in the income column in the above table include any capital gain distributions from underlying funds, which are presented in the corresponding line-item in the Statement of Operations, if applicable.
Investment Valuation
The following is a summary of the inputs used, as of September 30, 2020, involving the Fund's assets and liabilities carried at fair value. The inputs or methodology used for valuing securities may not be an indication of the risk associated with investing in those securities. For more information on valuation inputs, and their aggregation into the levels used below, please refer to the Investment Valuation section in the accompanying Notes to Financial Statements.
| | Valuation Inputs at Reporting Date: |
| Description | Total | Level 1 | Level 2 | Level 3 |
| Investments in Securities: | | | | |
| Other Short-Term Investments | $16,197,071 | $-- | $16,197,071 | $-- |
| Domestic Equity Funds | 7,136,547,585 | 7,136,547,585 | -- | -- |
| International Equity Funds | 5,636,981,300 | 5,636,981,300 | -- | -- |
| Bond Funds | 830,746,646 | 830,746,646 | -- | -- |
| Short-Term Funds | 211,928,289 | 211,928,289 | -- | -- |
| Total Investments in Securities: | $13,832,400,891 | $13,816,203,820 | $16,197,071 | $-- |
| Derivative Instruments: | | | | |
| Liabilities | | | | |
| Futures Contracts | $(735,056) | $(735,056) | $-- | $-- |
| Total Liabilities | $(735,056) | $(735,056) | $-- | $-- |
| Total Derivative Instruments: | $(735,056) | $(735,056) | $-- | $-- |
Value of Derivative Instruments
The following table is a summary of the Fund's value of derivative instruments by primary risk exposure as of September 30, 2020. For additional information on derivative instruments, please refer to the Derivative Instruments section in the accompanying Notes to Financial Statements.
| Primary Risk Exposure / Derivative Type | Value |
| | Asset | Liability |
| Equity Risk | | |
| Futures Contracts(a) | $0 | $(735,056) |
| Total Equity Risk | 0 | (735,056) |
| Total Value of Derivatives | $0 | $(735,056) |
(a) Reflects gross cumulative appreciation (depreciation) on futures contracts as presented in the Consolidated Schedule of Investments. In the Consolidated Statement of Assets and Liabilities, the period end daily variation margin is included in receivable or payable for daily variation margin on futures contracts, and the net cumulative appreciation (depreciation) is included in Total accumulated earnings (loss).
See accompanying notes which are an integral part of the financial statements.
Fidelity Freedom® 2050 Fund
Financial Statements
Statement of Assets and Liabilities
| | | September 30, 2020 (Unaudited) |
| Assets | | |
Investment in securities, at value — See accompanying schedule:
Unaffiliated issuers (cost $16,196,871) | $16,197,071 | |
| Fidelity Central Funds (cost $27,643,451) | 27,643,693 | |
| Other affiliated issuers (cost $11,563,199,964) | 13,788,560,127 | |
| Total Investment in Securities (cost $11,607,040,286) | | $13,832,400,891 |
| Receivable for investments sold | | 124,129,707 |
| Receivable for fund shares sold | | 16,985,552 |
| Distributions receivable from Fidelity Central Funds | | 2,555 |
| Total assets | | 13,973,518,705 |
| Liabilities | | |
| Payable for investments purchased | $125,443,699 | |
| Payable for fund shares redeemed | 8,489,530 | |
| Accrued management fee | 7,541,067 | |
| Payable for daily variation margin on futures contracts | 560,014 | |
| Total liabilities | | 142,034,310 |
| Net Assets | | $13,831,484,395 |
| Net Assets consist of: | | |
| Paid in capital | | $11,458,592,451 |
| Total accumulated earnings (loss) | | 2,372,891,944 |
| Net Assets | | $13,831,484,395 |
| Net Asset Value and Maximum Offering Price | | |
| Fidelity Freedom 2050 Fund: | | |
| Net Asset Value, offering price and redemption price per share ($4,326,857,146 ÷ 360,406,022 shares) | | $12.01 |
| Class K: | | |
| Net Asset Value, offering price and redemption price per share ($7,494,783,917 ÷ 624,866,748 shares) | | $11.99 |
| Class K6: | | |
| Net Asset Value, offering price and redemption price per share ($2,009,843,332 ÷ 167,679,091 shares) | | $11.99 |
See accompanying notes which are an integral part of the financial statements.
Statement of Operations
| | | Six months ended September 30, 2020 (Unaudited) |
| Investment Income | | |
| Dividends: | | |
| Affiliated issuers | | $43,686,931 |
| Interest | | 22,497 |
| Income from Fidelity Central Funds | | 20,471 |
| Total income | | 43,729,899 |
| Expenses | | |
| Management fee | $41,947,135 | |
| Independent trustees' fees and expenses | 17,095 | |
| Total expenses before reductions | 41,964,230 | |
| Expense reductions | (45) | |
| Total expenses after reductions | | 41,964,185 |
| Net investment income (loss) | | 1,765,714 |
| Realized and Unrealized Gain (Loss) | | |
| Net realized gain (loss) on: | | |
| Investment securities: | | |
| Fidelity Central Funds | (3,303) | |
| Other affiliated issuers | 82,460,586 | |
| Futures contracts | (4,126,222) | |
| Capital gain distributions from underlying funds: | | |
| Affiliated issuers | 124,718,804 | |
| Total net realized gain (loss) | | 203,049,865 |
| Change in net unrealized appreciation (depreciation) on: | | |
| Investment securities: | | |
| Unaffiliated issuers | (12,792) | |
| Fidelity Central Funds | (1,317) | |
| Other affiliated issuers | 2,885,652,102 | |
| Futures contracts | (1,513,202) | |
| Total change in net unrealized appreciation (depreciation) | | 2,884,124,791 |
| Net gain (loss) | | 3,087,174,656 |
| Net increase (decrease) in net assets resulting from operations | | $3,088,940,370 |
See accompanying notes which are an integral part of the financial statements.
Statement of Changes in Net Assets
| | Six months ended September 30, 2020 (Unaudited) | Year ended March 31, 2020 |
| Increase (Decrease) in Net Assets | | |
| Operations | | |
| Net investment income (loss) | $1,765,714 | $199,756,859 |
| Net realized gain (loss) | 203,049,865 | 497,850,675 |
| Change in net unrealized appreciation (depreciation) | 2,884,124,791 | (1,997,122,237) |
| Net increase (decrease) in net assets resulting from operations | 3,088,940,370 | (1,299,514,703) |
| Distributions to shareholders | (339,719,710) | (831,785,387) |
| Share transactions - net increase (decrease) | 270,017,992 | 1,096,985,996 |
| Total increase (decrease) in net assets | 3,019,238,652 | (1,034,314,094) |
| Net Assets | | |
| Beginning of period | 10,812,245,743 | 11,846,559,837 |
| End of period | $13,831,484,395 | $10,812,245,743 |
See accompanying notes which are an integral part of the financial statements.
Financial Highlights
Fidelity Freedom 2050 Fund
| | Six months ended (Unaudited) September 30, | Years endedMarch 31, | | | | |
| | 2020 | 2020 | 2019 | 2018 | 2017 | 2016 |
| Selected Per–Share Data | | | | | | |
| Net asset value, beginning of period | $9.61 | $11.52 | $12.16 | $11.05 | $9.93 | $10.90 |
| Income from Investment Operations | | | | | | |
| Net investment income (loss)A | –B | .18 | .16 | .12 | .15 | .15 |
| Net realized and unrealized gain (loss) | 2.70 | (1.30) | –B | 1.48 | 1.40 | (.52) |
| Total from investment operations | 2.70 | (1.12) | .16 | 1.60 | 1.55 | (.37) |
| Distributions from net investment income | – | (.18) | (.17) | (.14) | (.15) | (.16) |
| Distributions from net realized gain | (.30) | (.60) | (.63) | (.35) | (.28) | (.44) |
| Total distributions | (.30) | (.79)C | (.80) | (.49) | (.43) | (.60) |
| Net asset value, end of period | $12.01 | $9.61 | $11.52 | $12.16 | $11.05 | $9.93 |
| Total ReturnD,E | 28.63% | (10.80)% | 1.73% | 14.59% | 16.11% | (3.65)% |
| Ratios to Average Net AssetsF,G | | | | | | |
| Expenses before reductions | .75%H | .75% | .75% | .63%I | - %J | - %J |
| Expenses net of fee waivers, if any | .75%H | .75% | .75% | .63%I | -% | -% |
| Expenses net of all reductions | .75%H | .75% | .75% | .63%I | -% | -% |
| Net investment income (loss) | (.06)%H | 1.53% | 1.37% | 1.04% | 1.45% | 1.49% |
| Supplemental Data | | | | | | |
| Net assets, end of period (000 omitted) | $4,326,857 | $3,373,190 | $3,679,538 | $3,452,997 | $2,884,830 | $2,363,381 |
| Portfolio turnover rateK | 21%H | 27% | 18% | 16%L | 15% | 17% |
A Calculated based on average shares outstanding during the period.
B Amount represents less than $.005 per share.
C Total distributions per share do not sum due to rounding.
D Total returns for periods of less than one year are not annualized.
E Total returns would have been lower if certain expenses had not been reduced during the applicable periods shown.
F Fees and expenses of any underlying mutual funds or exchange-traded funds (ETFs) are not included in the Fund's expense ratio. The Fund indirectly bears its proportionate share of these expenses. For additional expense information related to investments in Fidelity Central Funds, please refer to the "Investments in Fidelity Central Funds" note found in the Notes to Financial Statements section of the most recent Annual or Semi-Annual report.
G Expense ratios reflect operating expenses of the class. Expenses before reductions do not reflect amounts reimbursed, waived, or reduced through arrangements with the investment adviser, brokerage services, or other offset arrangements, if applicable, and do not represent the amount paid by the class during periods when reimbursements, waivers or reductions occur.
H Annualized
I On certain classes, the size and fluctuation of net assets and expense amounts may cause ratios to differ from contractual rates.
J Amount represents less than .005%.
K Amount does not include the portfolio activity of any underlying mutual funds or exchange-traded funds (ETFs).
L The portfolio turnover rate does not include the assets acquired in the merger.
See accompanying notes which are an integral part of the financial statements.
Fidelity Freedom 2050 Fund Class K
| | Six months ended (Unaudited) September 30, | Years endedMarch 31, | | |
| | 2020 | 2020 | 2019 | 2018 A |
| Selected Per–Share Data | | | | |
| Net asset value, beginning of period | $9.60 | $11.50 | $12.14 | $11.65 |
| Income from Investment Operations | | | | |
| Net investment income (loss)B | –C | .19 | .17 | .17 |
| Net realized and unrealized gain (loss) | 2.69 | (1.29) | –C | .67 |
| Total from investment operations | 2.69 | (1.10) | .17 | .84 |
| Distributions from net investment income | – | (.19) | (.18) | (.15) |
| Distributions from net realized gain | (.30) | (.61) | (.63) | (.19) |
| Total distributions | (.30) | (.80) | (.81) | (.35)D |
| Net asset value, end of period | $11.99 | $9.60 | $11.50 | $12.14 |
| Total ReturnE,F | 28.55% | (10.66)% | 1.82% | 7.18% |
| Ratios to Average Net AssetsG,H | | | | |
| Expenses before reductions | .64%I | .64% | .64% | .65%I,J |
| Expenses net of fee waivers, if any | .64%I | .64% | .64% | .65%I,J |
| Expenses net of all reductions | .64%I | .64% | .64% | .65%I,J |
| Net investment income (loss) | .04%I | 1.63% | 1.48% | 2.04%I |
| Supplemental Data | | | | |
| Net assets, end of period (000 omitted) | $7,494,784 | $5,952,708 | $6,982,416 | $7,475,339 |
| Portfolio turnover rateK | 21%I | 27% | 18% | 16%L |
A For the period July 20, 2017 (commencement of sale of shares) to March 31, 2018.
B Calculated based on average shares outstanding during the period.
C Amount represents less than $.005 per share.
D Total distributions per share do not sum due to rounding.
E Total returns for periods of less than one year are not annualized.
F Total returns would have been lower if certain expenses had not been reduced during the applicable periods shown.
G Fees and expenses of any underlying mutual funds or exchange-traded funds (ETFs) are not included in the Fund's expense ratio. The Fund indirectly bears its proportionate share of these expenses. For additional expense information related to investments in Fidelity Central Funds, please refer to the "Investments in Fidelity Central Funds" note found in the Notes to Financial Statements section of the most recent Annual or Semi-Annual report.
H Expense ratios reflect operating expenses of the class. Expenses before reductions do not reflect amounts reimbursed, waived, or reduced through arrangements with the investment adviser, brokerage services, or other offset arrangements, if applicable, and do not represent the amount paid by the class during periods when reimbursements, waivers or reductions occur.
I Annualized
J On certain classes, the size and fluctuation of net assets and expense amounts may cause ratios to differ from contractual rates.
K Amount does not include the portfolio activity of any underlying mutual funds or exchange-traded funds (ETFs).
L The portfolio turnover rate does not include the assets acquired in the merger.
See accompanying notes which are an integral part of the financial statements.
Fidelity Freedom 2050 Fund Class K6
| | Six months ended (Unaudited) September 30, | Years endedMarch 31, | | |
| | 2020 | 2020 | 2019 | 2018 A |
| Selected Per–Share Data | | | | |
| Net asset value, beginning of period | $9.59 | $11.49 | $12.15 | $11.40 |
| Income from Investment Operations | | | | |
| Net investment income (loss)B | .01 | .20 | .19 | .14 |
| Net realized and unrealized gain (loss) | 2.69 | (1.28) | (.01) | .96 |
| Total from investment operations | 2.70 | (1.08) | .18 | 1.10 |
| Distributions from net investment income | – | (.21) | (.21) | (.16) |
| Distributions from net realized gain | (.30) | (.61) | (.63) | (.19) |
| Total distributions | (.30) | (.82) | (.84) | (.35) |
| Net asset value, end of period | $11.99 | $9.59 | $11.49 | $12.15 |
| Total ReturnC,D | 28.72% | (10.49)% | 1.96% | 9.65% |
| Ratios to Average Net AssetsE,F | | | | |
| Expenses before reductions | .49%G | .49% | .50%H | .50%G,H |
| Expenses net of fee waivers, if any | .49%G | .49% | .50%H | .50%G,H |
| Expenses net of all reductions | .49%G | .49% | .50%H | .50%G,H |
| Net investment income (loss) | .19%G | 1.78% | 1.62% | 1.42%G |
| Supplemental Data | | | | |
| Net assets, end of period (000 omitted) | $2,009,843 | $1,486,348 | $1,184,606 | $327,591 |
| Portfolio turnover rateI | 21%G | 27% | 18% | 16%J |
A For the period June 7, 2017 (commencement of sale of shares) to March 31, 2018.
B Calculated based on average shares outstanding during the period.
C Total returns for periods of less than one year are not annualized.
D Total returns would have been lower if certain expenses had not been reduced during the applicable periods shown.
E Fees and expenses of any underlying mutual funds or exchange-traded funds (ETFs) are not included in the Fund's expense ratio. The Fund indirectly bears its proportionate share of these expenses. For additional expense information related to investments in Fidelity Central Funds, please refer to the "Investments in Fidelity Central Funds" note found in the Notes to Financial Statements section of the most recent Annual or Semi-Annual report.
F Expense ratios reflect operating expenses of the class. Expenses before reductions do not reflect amounts reimbursed, waived, or reduced through arrangements with the investment adviser, brokerage services, or other offset arrangements, if applicable, and do not represent the amount paid by the class during periods when reimbursements, waivers or reductions occur.
G Annualized
H On certain classes, the size and fluctuation of net assets and expense amounts may cause ratios to differ from contractual rates.
I Amount does not include the portfolio activity of any underlying mutual funds or exchange-traded funds (ETFs).
J The portfolio turnover rate does not include the assets acquired in the merger.
See accompanying notes which are an integral part of the financial statements.
Fidelity Freedom® 2055 Fund
Investment Summary (Unaudited)
The information in the following tables is based on the direct investments of the Fund.
Top Holdings as of September 30, 2020
| | % of fund's net assets |
| Fidelity Series Emerging Markets Opportunities Fund | 14.0 |
| Fidelity Series Growth Company Fund | 8.3 |
| Fidelity Series Intrinsic Opportunities Fund | 8.1 |
| Fidelity Series Large Cap Stock Fund | 7.0 |
| Fidelity Series International Growth Fund | 7.0 |
| Fidelity Series Overseas Fund | 6.9 |
| Fidelity Series International Value Fund | 6.9 |
| Fidelity Series Stock Selector Large Cap Value Fund | 5.7 |
| Fidelity Series Opportunistic Insights Fund | 4.4 |
| Fidelity Series Value Discovery Fund | 4.3 |
| | 72.6 |
Asset Allocation (% of fund's net assets)
| Period end |
| | Domestic Equity Funds | 51.6% |
| | International Equity Funds | 40.8% |
| | Bond Funds | 6.0% |
| | Short-Term Funds | 1.5% |
| | Short-Term Investments | 0.1% |

Domestic Equity Funds category includes Fidelity Series Commodity Strategy Fund which invests in commodity-related investments.
Fidelity Freedom® 2055 Fund
Schedule of Investments September 30, 2020 (Unaudited)
Showing Percentage of Net Assets
| U.S. Treasury Obligations - 0.1% | | | |
| | | Principal Amount | Value |
| U.S. Treasury Bills, yield at date of purchase 0.1% to 0.11% 12/3/20 to 12/10/20 (a) | | | |
| (Cost $7,968,463) | | 7,970,000 | 7,968,560 |
| | | Shares | Value |
|
| Domestic Equity Funds - 51.6% | | | |
| Fidelity Series All-Sector Equity Fund (b) | | 13,139,793 | $139,938,796 |
| Fidelity Series Blue Chip Growth Fund (b) | | 13,442,485 | 221,935,420 |
| Fidelity Series Commodity Strategy Fund (b) | | 41,101,830 | 170,983,611 |
| Fidelity Series Growth Company Fund (b) | | 21,716,605 | 569,192,221 |
| Fidelity Series Intrinsic Opportunities Fund (b) | | 34,801,037 | 550,552,398 |
| Fidelity Series Large Cap Stock Fund (b) | | 33,617,036 | 476,017,224 |
| Fidelity Series Large Cap Value Index Fund (b) | | 13,809,792 | 160,193,587 |
| Fidelity Series Opportunistic Insights Fund (b) | | 13,738,539 | 297,164,599 |
| Fidelity Series Small Cap Discovery Fund (b) | | 5,894,027 | 59,588,614 |
| Fidelity Series Small Cap Opportunities Fund (b) | | 15,084,512 | 192,478,378 |
| Fidelity Series Stock Selector Large Cap Value Fund (b) | | 35,602,379 | 391,626,173 |
| Fidelity Series Value Discovery Fund (b) | | 23,910,345 | 295,531,870 |
| TOTAL DOMESTIC EQUITY FUNDS | | | |
| (Cost $3,111,149,138) | | | 3,525,202,891 |
|
| International Equity Funds - 40.8% | | | |
| Fidelity Series Canada Fund (b) | | 15,669,846 | 160,302,526 |
| Fidelity Series Emerging Markets Fund (b) | | 11,182,208 | 105,448,217 |
| Fidelity Series Emerging Markets Opportunities Fund (b) | | 45,418,206 | 952,873,956 |
| Fidelity Series International Growth Fund (b) | | 25,291,099 | 474,966,839 |
| Fidelity Series International Small Cap Fund (b) | | 8,164,283 | 145,324,230 |
| Fidelity Series International Value Fund (b) | | 54,664,302 | 471,206,282 |
| Fidelity Series Overseas Fund (b) | | 42,422,385 | 474,282,270 |
| TOTAL INTERNATIONAL EQUITY FUNDS | | | |
| (Cost $2,477,628,767) | | | 2,784,404,320 |
|
| Bond Funds - 6.0% | | | |
| Fidelity Series Emerging Markets Debt Fund (b) | | 4,238,064 | 38,396,856 |
| Fidelity Series Floating Rate High Income Fund (b) | | 881,913 | 7,804,927 |
| Fidelity Series High Income Fund (b) | | 5,077,685 | 46,308,488 |
| Fidelity Series Inflation-Protected Bond Index Fund (b) | | 12,577,939 | 134,583,945 |
| Fidelity Series International Credit Fund (b) | | 185,969 | 1,935,936 |
| Fidelity Series Long-Term Treasury Bond Index Fund (b) | | 14,911,851 | 154,039,417 |
| Fidelity Series Real Estate Income Fund (b) | | 2,758,480 | 27,529,634 |
| TOTAL BOND FUNDS | | | |
| (Cost $389,744,356) | | | 410,599,203 |
|
| Short-Term Funds - 1.5% | | | |
| Fidelity Cash Central Fund 0.10% (c) | | 12,900,750 | 12,903,331 |
| Fidelity Series Government Money Market Fund 0.16% (b)(d) | | 79,248,529 | 79,248,529 |
| Fidelity Series Short-Term Credit Fund (b) | | 1,161,350 | 11,903,838 |
| TOTAL SHORT-TERM FUNDS | | | |
| (Cost $103,687,500) | | | 104,055,698 |
| TOTAL INVESTMENT IN SECURITIES - 100.0% | | | |
| (Cost $6,090,178,224) | | | 6,832,230,672 |
| NET OTHER ASSETS (LIABILITIES) - 0.0% | | | (449,760) |
| NET ASSETS - 100% | | | $6,831,780,912 |
| Futures Contracts | | | | | |
| | Number of contracts | Expiration Date | Notional Amount | Value | Unrealized Appreciation/(Depreciation) |
| Purchased | | | | | |
| Equity Index Contracts | | | | | |
| ICE E-mini MSCI EAFE Index Contracts (United States) | 158 | Dec. 2020 | $14,640,280 | $(279,053) | $(279,053) |
| Sold | | | | | |
| Equity Index Contracts | | | | | |
| CME E-mini S&P 500 Index Contracts (United States) | 78 | Dec. 2020 | 13,072,800 | (85,342) | (85,342) |
| TOTAL FUTURES CONTRACTS | | | | | $(364,395) |
The notional amount of futures purchased as a percentage of Net Assets is 0.2%
The notional amount of futures sold as a percentage of Net Assets is 0.2%
Legend
(a) Security or a portion of the security was pledged to cover margin requirements for futures contracts. At period end, the value of securities pledged amounted to $7,968,560.
(b) Affiliated Fund
(c) Affiliated fund that is generally available only to investment companies and other accounts managed by Fidelity Investments. The rate quoted is the annualized seven-day yield of the fund at period end. A complete unaudited listing of the fund's holdings as of its most recent quarter end is available upon request. In addition, each Fidelity Central Fund's financial statements are available on the SEC's website or upon request.
(d) The rate quoted is the annualized seven-day yield of the fund at period end.
Affiliated Central Funds
Information regarding fiscal year to date income earned by the Fund from investments in Fidelity Central Funds is as follows:
| Fund | Income earned |
| Fidelity Cash Central Fund | $9,659 |
| Total | $9,659 |
Amounts in the income column in the above table include any capital gain distributions from underlying funds, which are presented in the corresponding line-item in the Statement of Operations, if applicable.
Affiliated Underlying Funds
Fiscal year to date information regarding the Fund's investments in affiliated Underlying Funds, excluding any Money Market Central Funds, is presented below. Exchanges between classes of the same affiliated Underlying Funds may occur.
| Affiliate | Value, beginning of period | Purchases | Sales Proceeds | Dividend Income | Realized Gain (loss) | Change in Unrealized appreciation (depreciation) | Value, end of period |
| Fidelity Series All-Sector Equity Fund | $102,538,772 | $5,869,130 | $5,245,090 | $-- | $366,550 | $36,409,434 | $139,938,796 |
| Fidelity Series Blue Chip Growth Fund | 187,507,223 | 60,245,191 | 84,059,268 | 50,119,527 | 12,978,886 | 45,263,388 | 221,935,420 |
| Fidelity Series Canada Fund | 102,272,824 | 34,036,715 | 2,945,459 | -- | (341,048) | 27,279,494 | 160,302,526 |
| Fidelity Series Commodity Strategy Fund | 174,824,429 | 15,340,840 | 39,613,479 | 725,010 | (11,107,027) | 31,538,848 | 170,983,611 |
| Fidelity Series Emerging Markets Debt Fund | 32,851,788 | 2,878,422 | 1,439,150 | 978,423 | 16,478 | 4,089,318 | 38,396,856 |
| Fidelity Series Emerging Markets Fund | 61,312,985 | 24,095,562 | 3,514,036 | -- | (40,818) | 23,594,524 | 105,448,217 |
| Fidelity Series Emerging Markets Opportunities Fund | 575,818,721 | 175,991,944 | 23,305,479 | -- | 775,151 | 223,593,618 | 952,873,956 |
| Fidelity Series Floating Rate High Income Fund | 6,830,635 | 627,485 | 348,181 | 167,809 | (10,240) | 705,228 | 7,804,927 |
| Fidelity Series Government Money Market Fund 0.16% | 156,431,430 | 57,503,690 | 134,686,591 | 129,558 | -- | -- | 79,248,529 |
| Fidelity Series Growth Company Fund | 385,995,184 | 22,313,491 | 85,127,564 | -- | 14,908,976 | 231,102,134 | 569,192,221 |
| Fidelity Series High Income Fund | 40,185,395 | 3,519,625 | 1,740,907 | 1,221,240 | (11,819) | 4,356,194 | 46,308,488 |
| Fidelity Series Inflation-Protected Bond Index Fund | 111,702,784 | 31,347,076 | 15,502,844 | 95,712 | 14,673 | 7,022,256 | 134,583,945 |
| Fidelity Series International Credit Fund | 1,751,504 | 27,221 | -- | 27,221 | -- | 157,211 | 1,935,936 |
| Fidelity Series International Growth Fund | 438,016,794 | 19,324,184 | 100,573,260 | -- | 2,851,119 | 115,348,002 | 474,966,839 |
| Fidelity Series International Small Cap Fund | 104,814,991 | 11,127,353 | 5,808,710 | -- | 208,162 | 34,982,434 | 145,324,230 |
| Fidelity Series International Value Fund | 392,001,352 | 30,933,505 | 32,031,112 | -- | (4,266,990) | 84,569,527 | 471,206,282 |
| Fidelity Series Intrinsic Opportunities Fund | 428,771,865 | 35,538,913 | 18,883,390 | 7,464,864 | (211,483) | 105,336,493 | 550,552,398 |
| Fidelity Series Large Cap Stock Fund | 380,465,209 | 45,989,264 | 18,804,164 | 16,075,463 | (860,984) | 69,227,899 | 476,017,224 |
| Fidelity Series Large Cap Value Index Fund | 104,497,485 | 39,314,142 | 5,238,543 | -- | (395,582) | 22,016,085 | 160,193,587 |
| Fidelity Series Long-Term Treasury Bond Index Fund | 127,521,685 | 42,992,519 | 12,245,275 | 3,486,663 | 1,421,470 | (5,650,982) | 154,039,417 |
| Fidelity Series Opportunistic Insights Fund | 212,381,565 | 11,927,650 | 13,798,861 | -- | (245,024) | 86,899,269 | 297,164,599 |
| Fidelity Series Overseas Fund | 363,239,177 | 37,574,295 | 36,631,166 | -- | (1,243,662) | 111,343,626 | 474,282,270 |
| Fidelity Series Real Estate Income Fund | 22,180,819 | 2,302,472 | 1,090,967 | 862,152 | (124,851) | 4,262,161 | 27,529,634 |
| Fidelity Series Short-Term Credit Fund | 11,112,065 | 370,422 | 2,643 | 129,342 | (44) | 424,038 | 11,903,838 |
| Fidelity Series Small Cap Discovery Fund | 42,663,266 | 3,323,082 | 1,565,949 | 156,900 | (38,501) | 15,206,716 | 59,588,614 |
| Fidelity Series Small Cap Opportunities Fund | 148,454,980 | 10,954,936 | 5,620,408 | 1,147,610 | (147,690) | 38,836,560 | 192,478,378 |
| Fidelity Series Stock Selector Large Cap Value Fund | 279,158,612 | 59,442,909 | 10,823,203 | -- | (527,218) | 64,375,073 | 391,626,173 |
| Fidelity Series Value Discovery Fund | 207,654,815 | 47,667,735 | 10,499,327 | -- | (557,889) | 51,266,536 | 295,531,870 |
| | $5,202,958,354 | $832,579,773 | $671,145,026 | $82,787,494 | $13,410,595 | $1,433,555,084 | $6,811,358,781 |
Amounts in the income column in the above table include any capital gain distributions from underlying funds, which are presented in the corresponding line-item in the Statement of Operations, if applicable.
Investment Valuation
The following is a summary of the inputs used, as of September 30, 2020, involving the Fund's assets and liabilities carried at fair value. The inputs or methodology used for valuing securities may not be an indication of the risk associated with investing in those securities. For more information on valuation inputs, and their aggregation into the levels used below, please refer to the Investment Valuation section in the accompanying Notes to Financial Statements.
| | Valuation Inputs at Reporting Date: |
| Description | Total | Level 1 | Level 2 | Level 3 |
| Investments in Securities: | | | | |
| Other Short-Term Investments | $7,968,560 | $-- | $7,968,560 | $-- |
| Domestic Equity Funds | 3,525,202,891 | 3,525,202,891 | -- | -- |
| International Equity Funds | 2,784,404,320 | 2,784,404,320 | -- | -- |
| Bond Funds | 410,599,203 | 410,599,203 | -- | -- |
| Short-Term Funds | 104,055,698 | 104,055,698 | -- | -- |
| Total Investments in Securities: | $6,832,230,672 | $6,824,262,112 | $7,968,560 | $-- |
| Derivative Instruments: | | | | |
| Liabilities | | | | |
| Futures Contracts | $(364,395) | $(364,395) | $-- | $-- |
| Total Liabilities | $(364,395) | $(364,395) | $-- | $-- |
| Total Derivative Instruments: | $(364,395) | $(364,395) | $-- | $-- |
Value of Derivative Instruments
The following table is a summary of the Fund's value of derivative instruments by primary risk exposure as of September 30, 2020. For additional information on derivative instruments, please refer to the Derivative Instruments section in the accompanying Notes to Financial Statements.
| Primary Risk Exposure / Derivative Type | Value |
| | Asset | Liability |
| Equity Risk | | |
| Futures Contracts(a) | $0 | $(364,395) |
| Total Equity Risk | 0 | (364,395) |
| Total Value of Derivatives | $0 | $(364,395) |
(a) Reflects gross cumulative appreciation (depreciation) on futures contracts as presented in the Consolidated Schedule of Investments. In the Consolidated Statement of Assets and Liabilities, the period end daily variation margin is included in receivable or payable for daily variation margin on futures contracts, and the net cumulative appreciation (depreciation) is included in Total accumulated earnings (loss).
See accompanying notes which are an integral part of the financial statements.
Fidelity Freedom® 2055 Fund
Financial Statements
Statement of Assets and Liabilities
| | | September 30, 2020 (Unaudited) |
| Assets | | |
Investment in securities, at value — See accompanying schedule:
Unaffiliated issuers (cost $7,968,463) | $7,968,560 | |
| Fidelity Central Funds (cost $12,903,211) | 12,903,331 | |
| Other affiliated issuers (cost $6,069,306,550) | 6,811,358,781 | |
| Total Investment in Securities (cost $6,090,178,224) | | $6,832,230,672 |
| Receivable for investments sold | | 60,792,274 |
| Receivable for fund shares sold | | 11,682,975 |
| Distributions receivable from Fidelity Central Funds | | 1,191 |
| Total assets | | 6,904,707,112 |
| Liabilities | | |
| Payable for investments purchased | $64,719,222 | |
| Payable for fund shares redeemed | 4,237,200 | |
| Accrued management fee | 3,695,084 | |
| Payable for daily variation margin on futures contracts | 274,694 | |
| Total liabilities | | 72,926,200 |
| Net Assets | | $6,831,780,912 |
| Net Assets consist of: | | |
| Paid in capital | | $6,060,310,739 |
| Total accumulated earnings (loss) | | 771,470,173 |
| Net Assets | | $6,831,780,912 |
| Net Asset Value and Maximum Offering Price | | |
| Fidelity Freedom 2055 Fund: | | |
| Net Asset Value, offering price and redemption price per share ($1,977,075,293 ÷ 144,139,274 shares) | | $13.72 |
| Class K: | | |
| Net Asset Value, offering price and redemption price per share ($3,810,752,459 ÷ 277,893,074 shares) | | $13.71 |
| Class K6: | | |
| Net Asset Value, offering price and redemption price per share ($1,043,953,160 ÷ 76,181,963 shares) | | $13.70 |
See accompanying notes which are an integral part of the financial statements.
Statement of Operations
| | | Six months ended September 30, 2020 (Unaudited) |
| Investment Income | | |
| Dividends: | | |
| Affiliated issuers | | $21,454,698 |
| Interest | | 10,848 |
| Income from Fidelity Central Funds | | 9,659 |
| Total income | | 21,475,205 |
| Expenses | | |
| Management fee | $20,413,107 | |
| Independent trustees' fees and expenses | 8,313 | |
| Total expenses before reductions | 20,421,420 | |
| Expense reductions | (65) | |
| Total expenses after reductions | | 20,421,355 |
| Net investment income (loss) | | 1,053,850 |
| Realized and Unrealized Gain (Loss) | | |
| Net realized gain (loss) on: | | |
| Investment securities: | | |
| Fidelity Central Funds | (1,601) | |
| Other affiliated issuers | 13,410,595 | |
| Futures contracts | (2,040,178) | |
| Capital gain distributions from underlying funds: | | |
| Affiliated issuers | 61,332,796 | |
| Total net realized gain (loss) | | 72,701,612 |
| Change in net unrealized appreciation (depreciation) on: | | |
| Investment securities: | | |
| Unaffiliated issuers | (6,126) | |
| Fidelity Central Funds | (613) | |
| Other affiliated issuers | 1,433,555,084 | |
| Futures contracts | (747,829) | |
| Total change in net unrealized appreciation (depreciation) | | 1,432,800,516 |
| Net gain (loss) | | 1,505,502,128 |
| Net increase (decrease) in net assets resulting from operations | | $1,506,555,978 |
See accompanying notes which are an integral part of the financial statements.
Statement of Changes in Net Assets
| | Six months ended September 30, 2020 (Unaudited) | Year ended March 31, 2020 |
| Increase (Decrease) in Net Assets | | |
| Operations | | |
| Net investment income (loss) | $1,053,850 | $92,538,767 |
| Net realized gain (loss) | 72,701,612 | 213,853,629 |
| Change in net unrealized appreciation (depreciation) | 1,432,800,516 | (957,737,314) |
| Net increase (decrease) in net assets resulting from operations | 1,506,555,978 | (651,344,918) |
| Distributions to shareholders | (151,874,380) | (364,707,384) |
| Share transactions - net increase (decrease) | 246,581,278 | 1,076,025,735 |
| Total increase (decrease) in net assets | 1,601,262,876 | 59,973,433 |
| Net Assets | | |
| Beginning of period | 5,230,518,036 | 5,170,544,603 |
| End of period | $6,831,780,912 | $5,230,518,036 |
See accompanying notes which are an integral part of the financial statements.
Financial Highlights
Fidelity Freedom 2055 Fund
| | Six months ended (Unaudited) September 30, | Years endedMarch 31, | | | | |
| | 2020 | 2020 | 2019 | 2018 | 2017 | 2016 |
| Selected Per–Share Data | | | | | | |
| Net asset value, beginning of period | $10.95 | $13.10 | $13.70 | $12.41 | $11.08 | $12.06 |
| Income from Investment Operations | | | | | | |
| Net investment income (loss)A | –B | .20 | .19 | .14 | .17 | .17 |
| Net realized and unrealized gain (loss) | 3.09 | (1.49) | –B | 1.64 | 1.57 | (.59) |
| Total from investment operations | 3.09 | (1.29) | .19 | 1.78 | 1.74 | (.42) |
| Distributions from net investment income | – | (.20) | (.19) | (.15) | (.16) | (.17) |
| Distributions from net realized gain | (.32) | (.66) | (.60) | (.34) | (.25) | (.39) |
| Total distributions | (.32) | (.86) | (.79) | (.49) | (.41) | (.56) |
| Net asset value, end of period | $13.72 | $10.95 | $13.10 | $13.70 | $12.41 | $11.08 |
| Total ReturnC,D | 28.66% | (10.85)% | 1.73% | 14.49% | 16.17% | (3.69)% |
| Ratios to Average Net AssetsE,F | | | | | | |
| Expenses before reductions | .75%G | .75% | .75% | .64%H | - %I | - %I |
| Expenses net of fee waivers, if any | .75%G | .75% | .75% | .64%H | -% | -% |
| Expenses net of all reductions | .75%G | .75% | .75% | .64%H | -% | -% |
| Net investment income (loss) | (.06)%G | 1.54% | 1.40% | 1.06% | 1.46% | 1.51% |
| Supplemental Data | | | | | | |
| Net assets, end of period (000 omitted) | $1,977,075 | $1,500,450 | $1,490,393 | $1,265,311 | $922,284 | $649,621 |
| Portfolio turnover rateJ | 22%G | 25% | 18% | 15%K | 18% | 20% |
A Calculated based on average shares outstanding during the period.
B Amount represents less than $.005 per share.
C Total returns for periods of less than one year are not annualized.
D Total returns would have been lower if certain expenses had not been reduced during the applicable periods shown.
E Fees and expenses of any underlying mutual funds or exchange-traded funds (ETFs) are not included in the Fund's expense ratio. The Fund indirectly bears its proportionate share of these expenses. For additional expense information related to investments in Fidelity Central Funds, please refer to the "Investments in Fidelity Central Funds" note found in the Notes to Financial Statements section of the most recent Annual or Semi-Annual report.
F Expense ratios reflect operating expenses of the class. Expenses before reductions do not reflect amounts reimbursed, waived, or reduced through arrangements with the investment adviser, brokerage services, or other offset arrangements, if applicable, and do not represent the amount paid by the class during periods when reimbursements, waivers or reductions occur.
G Annualized
H On certain classes, the size and fluctuation of net assets and expense amounts may cause ratios to differ from contractual rates.
I Amount represents less than .005%.
J Amount does not include the portfolio activity of any underlying mutual funds or exchange-traded funds (ETFs).
K The portfolio turnover rate does not include the assets acquired in the merger.
See accompanying notes which are an integral part of the financial statements.
Fidelity Freedom 2055 Fund Class K
| | Six months ended (Unaudited) September 30, | Years endedMarch 31, | | |
| | 2020 | 2020 | 2019 | 2018 A |
| Selected Per–Share Data | | | | |
| Net asset value, beginning of period | $10.95 | $13.09 | $13.69 | $13.11 |
| Income from Investment Operations | | | | |
| Net investment income (loss)B | –C | .21 | .20 | .19 |
| Net realized and unrealized gain (loss) | 3.08 | (1.48) | –C | .76 |
| Total from investment operations | 3.08 | (1.27) | .20 | .95 |
| Distributions from net investment income | – | (.21) | (.20) | (.17) |
| Distributions from net realized gain | (.32) | (.66) | (.60) | (.20) |
| Total distributions | (.32) | (.87) | (.80) | (.37) |
| Net asset value, end of period | $13.71 | $10.95 | $13.09 | $13.69 |
| Total ReturnD,E | 28.57% | (10.70)% | 1.84% | 7.26% |
| Ratios to Average Net AssetsF,G | | | | |
| Expenses before reductions | .64%H | .64% | .64% | .65%H,I |
| Expenses net of fee waivers, if any | .64%H | .64% | .64% | .65%H,I |
| Expenses net of all reductions | .64%H | .64% | .64% | .65%H,I |
| Net investment income (loss) | .04%H | 1.64% | 1.50% | 2.01%H |
| Supplemental Data | | | | |
| Net assets, end of period (000 omitted) | $3,810,752 | $2,984,272 | $3,138,528 | $2,992,599 |
| Portfolio turnover rateJ | 22%H | 25% | 18% | 15%K |
A For the period July 20, 2017 (commencement of sale of shares) to March 31, 2018.
B Calculated based on average shares outstanding during the period.
C Amount represents less than $.005 per share.
D Total returns for periods of less than one year are not annualized.
E Total returns would have been lower if certain expenses had not been reduced during the applicable periods shown.
F Fees and expenses of any underlying mutual funds or exchange-traded funds (ETFs) are not included in the Fund's expense ratio. The Fund indirectly bears its proportionate share of these expenses. For additional expense information related to investments in Fidelity Central Funds, please refer to the "Investments in Fidelity Central Funds" note found in the Notes to Financial Statements section of the most recent Annual or Semi-Annual report.
G Expense ratios reflect operating expenses of the class. Expenses before reductions do not reflect amounts reimbursed, waived, or reduced through arrangements with the investment adviser, brokerage services, or other offset arrangements, if applicable, and do not represent the amount paid by the class during periods when reimbursements, waivers or reductions occur.
H Annualized
I On certain classes, the size and fluctuation of net assets and expense amounts may cause ratios to differ from contractual rates.
J Amount does not include the portfolio activity of any underlying mutual funds or exchange-traded funds (ETFs).
K The portfolio turnover rate does not include the assets acquired in the merger.
See accompanying notes which are an integral part of the financial statements.
Fidelity Freedom 2055 Fund Class K6
| | Six months ended (Unaudited) September 30, | Years endedMarch 31, | | |
| | 2020 | 2020 | 2019 | 2018 A |
| Selected Per–Share Data | | | | |
| Net asset value, beginning of period | $10.93 | $13.08 | $13.70 | $12.83 |
| Income from Investment Operations | | | | |
| Net investment income (loss)B | .01 | .23 | .21 | .16 |
| Net realized and unrealized gain (loss) | 3.08 | (1.48) | –C | 1.09 |
| Total from investment operations | 3.09 | (1.25) | .21 | 1.25 |
| Distributions from net investment income | – | (.23) | (.23) | (.17) |
| Distributions from net realized gain | (.32) | (.67) | (.60) | (.20) |
| Total distributions | (.32) | (.90) | (.83) | (.38)D |
| Net asset value, end of period | $13.70 | $10.93 | $13.08 | $13.70 |
| Total ReturnE,F | 28.72% | (10.61)% | 1.97% | 9.70% |
| Ratios to Average Net AssetsG,H | | | | |
| Expenses before reductions | .49%I | .49% | .50%J | .50%I,J |
| Expenses net of fee waivers, if any | .49%I | .49% | .50%J | .50%I,J |
| Expenses net of all reductions | .49%I | .49% | .50%J | .50%I,J |
| Net investment income (loss) | .19%I | 1.79% | 1.65% | 1.43%I |
| Supplemental Data | | | | |
| Net assets, end of period (000 omitted) | $1,043,953 | $745,795 | $541,624 | $135,481 |
| Portfolio turnover rateK | 22%I | 25% | 18% | 15%L |
A For the period June 7, 2017 (commencement of sale of shares) to March 31, 2018.
B Calculated based on average shares outstanding during the period.
C Amount represents less than $.005 per share.
D Total distributions per share do not sum due to rounding.
E Total returns for periods of less than one year are not annualized.
F Total returns would have been lower if certain expenses had not been reduced during the applicable periods shown.
G Fees and expenses of any underlying mutual funds or exchange-traded funds (ETFs) are not included in the Fund's expense ratio. The Fund indirectly bears its proportionate share of these expenses. For additional expense information related to investments in Fidelity Central Funds, please refer to the "Investments in Fidelity Central Funds" note found in the Notes to Financial Statements section of the most recent Annual or Semi-Annual report.
H Expense ratios reflect operating expenses of the class. Expenses before reductions do not reflect amounts reimbursed, waived, or reduced through arrangements with the investment adviser, brokerage services, or other offset arrangements, if applicable, and do not represent the amount paid by the class during periods when reimbursements, waivers or reductions occur.
I Annualized
J On certain classes, the size and fluctuation of net assets and expense amounts may cause ratios to differ from contractual rates.
K Amount does not include the portfolio activity of any underlying mutual funds or exchange-traded funds (ETFs).
L The portfolio turnover rate does not include the assets acquired in the merger.
See accompanying notes which are an integral part of the financial statements.
Fidelity Freedom® 2060 Fund
Investment Summary (Unaudited)
The information in the following tables is based on the direct investments of the Fund.
Top Holdings as of September 30, 2020
| | % of fund's net assets |
| Fidelity Series Emerging Markets Opportunities Fund | 14.0 |
| Fidelity Series Growth Company Fund | 8.3 |
| Fidelity Series Intrinsic Opportunities Fund | 8.1 |
| Fidelity Series Large Cap Stock Fund | 7.0 |
| Fidelity Series International Growth Fund | 7.0 |
| Fidelity Series Overseas Fund | 6.9 |
| Fidelity Series International Value Fund | 6.9 |
| Fidelity Series Stock Selector Large Cap Value Fund | 5.7 |
| Fidelity Series Opportunistic Insights Fund | 4.3 |
| Fidelity Series Value Discovery Fund | 4.3 |
| | 72.5 |
Asset Allocation (% of fund's net assets)
| Period end |
| | Domestic Equity Funds | 51.6% |
| | International Equity Funds | 40.8% |
| | Bond Funds | 6.0% |
| | Short-Term Funds | 1.5% |
| | Short-Term Investments | 0.1% |

Domestic Equity Funds category includes Fidelity Series Commodity Strategy Fund which invests in commodity-related investments.
Fidelity Freedom® 2060 Fund
Schedule of Investments September 30, 2020 (Unaudited)
Showing Percentage of Net Assets
| U.S. Treasury Obligations - 0.1% | | | |
| | | Principal Amount | Value |
| U.S. Treasury Bills, yield at date of purchase 0.1% to 0.11% 12/3/20 to 12/10/20 (a) | | | |
| (Cost $2,639,493) | | 2,640,000 | 2,639,523 |
| | | Shares | Value |
|
| Domestic Equity Funds - 51.6% | | | |
| Fidelity Series All-Sector Equity Fund (b) | | 4,402,855 | $46,890,406 |
| Fidelity Series Blue Chip Growth Fund (b) | | 4,518,427 | 74,599,230 |
| Fidelity Series Commodity Strategy Fund (b) | | 13,825,834 | 57,515,471 |
| Fidelity Series Growth Company Fund (b) | | 7,295,656 | 191,219,140 |
| Fidelity Series Intrinsic Opportunities Fund (b) | | 11,687,883 | 184,902,310 |
| Fidelity Series Large Cap Stock Fund (b) | | 11,294,936 | 159,936,289 |
| Fidelity Series Large Cap Value Index Fund (b) | | 4,643,877 | 53,868,976 |
| Fidelity Series Opportunistic Insights Fund (b) | | 4,599,020 | 99,476,797 |
| Fidelity Series Small Cap Discovery Fund (b) | | 1,985,838 | 20,076,820 |
| Fidelity Series Small Cap Opportunities Fund (b) | | 5,071,307 | 64,709,883 |
| Fidelity Series Stock Selector Large Cap Value Fund (b) | | 11,963,185 | 131,595,040 |
| Fidelity Series Value Discovery Fund (b) | | 8,035,820 | 99,322,730 |
| TOTAL DOMESTIC EQUITY FUNDS | | | |
| (Cost $1,101,198,081) | | | 1,184,113,092 |
|
| International Equity Funds - 40.8% | | | |
| Fidelity Series Canada Fund (b) | | 5,264,821 | 53,859,116 |
| Fidelity Series Emerging Markets Fund (b) | | 3,760,366 | 35,460,253 |
| Fidelity Series Emerging Markets Opportunities Fund (b) | | 15,255,713 | 320,064,862 |
| Fidelity Series International Growth Fund (b) | | 8,493,973 | 159,516,808 |
| Fidelity Series International Small Cap Fund (b) | | 2,742,012 | 48,807,816 |
| Fidelity Series International Value Fund (b) | | 18,361,606 | 158,277,043 |
| Fidelity Series Overseas Fund (b) | | 14,247,515 | 159,287,219 |
| TOTAL INTERNATIONAL EQUITY FUNDS | | | |
| (Cost $854,519,239) | | | 935,273,117 |
|
| Bond Funds - 6.0% | | | |
| Fidelity Series Emerging Markets Debt Fund (b) | | 1,430,286 | 12,958,388 |
| Fidelity Series Floating Rate High Income Fund (b) | | 315,633 | 2,793,349 |
| Fidelity Series High Income Fund (b) | | 1,713,245 | 15,624,790 |
| Fidelity Series Inflation-Protected Bond Index Fund (b) | | 4,232,828 | 45,291,260 |
| Fidelity Series International Credit Fund (b) | | 27,278 | 283,965 |
| Fidelity Series Long-Term Treasury Bond Index Fund (b) | | 5,016,941 | 51,824,999 |
| Fidelity Series Real Estate Income Fund (b) | | 951,701 | 9,497,975 |
| TOTAL BOND FUNDS | | | |
| (Cost $131,380,799) | | | 138,274,726 |
|
| Short-Term Funds - 1.5% | | | |
| Fidelity Cash Central Fund 0.10% (c) | | 3,589,339 | 3,590,057 |
| Fidelity Series Government Money Market Fund 0.16% (b)(d) | | 26,745,035 | 26,745,035 |
| Fidelity Series Short-Term Credit Fund (b) | | 386,338 | 3,959,961 |
| TOTAL SHORT-TERM FUNDS | | | |
| (Cost $34,169,181) | | | 34,295,053 |
| TOTAL INVESTMENT IN SECURITIES - 100.0% | | | |
| (Cost $2,123,906,793) | | | 2,294,595,511 |
| NET OTHER ASSETS (LIABILITIES) - 0.0% | | | (147,782) |
| NET ASSETS - 100% | | | $2,294,447,729 |
| Futures Contracts | | | | | |
| | Number of contracts | Expiration Date | Notional Amount | Value | Unrealized Appreciation/(Depreciation) |
| Purchased | | | | | |
| Equity Index Contracts | | | | | |
| ICE E-mini MSCI EAFE Index Contracts (United States) | 53 | Dec. 2020 | $4,910,980 | $(93,618) | $(93,618) |
| Sold | | | | | |
| Equity Index Contracts | | | | | |
| CME E-mini S&P 500 Index Contracts (United States) | 27 | Dec. 2020 | 4,525,200 | (29,542) | (29,542) |
| TOTAL FUTURES CONTRACTS | | | | | $(123,160) |
The notional amount of futures purchased as a percentage of Net Assets is 0.2%
The notional amount of futures sold as a percentage of Net Assets is 0.2%
Legend
(a) Security or a portion of the security was pledged to cover margin requirements for futures contracts. At period end, the value of securities pledged amounted to $2,639,523.
(b) Affiliated Fund
(c) Affiliated fund that is generally available only to investment companies and other accounts managed by Fidelity Investments. The rate quoted is the annualized seven-day yield of the fund at period end. A complete unaudited listing of the fund's holdings as of its most recent quarter end is available upon request. In addition, each Fidelity Central Fund's financial statements are available on the SEC's website or upon request.
(d) The rate quoted is the annualized seven-day yield of the fund at period end.
Affiliated Central Funds
Information regarding fiscal year to date income earned by the Fund from investments in Fidelity Central Funds is as follows:
| Fund | Income earned |
| Fidelity Cash Central Fund | $2,790 |
| Total | $2,790 |
Amounts in the income column in the above table include any capital gain distributions from underlying funds, which are presented in the corresponding line-item in the Statement of Operations, if applicable.
Affiliated Underlying Funds
Fiscal year to date information regarding the Fund's investments in affiliated Underlying Funds, excluding any Money Market Central Funds, is presented below. Exchanges between classes of the same affiliated Underlying Funds may occur.
| Affiliate | Value, beginning of period | Purchases | Sales Proceeds | Dividend Income | Realized Gain (loss) | Change in Unrealized appreciation (depreciation) | Value, end of period |
| Fidelity Series All-Sector Equity Fund | $31,611,245 | $4,751,921 | $1,171,314 | $-- | $72,106 | $11,626,448 | $46,890,406 |
| Fidelity Series Blue Chip Growth Fund | 57,857,745 | 24,750,201 | 25,900,204 | 16,712,995 | 2,120,464 | 15,771,024 | 74,599,230 |
| Fidelity Series Canada Fund | 31,737,865 | 14,256,492 | 715,072 | -- | (85,398) | 8,665,229 | 53,859,116 |
| Fidelity Series Commodity Strategy Fund | 54,009,017 | 8,792,465 | 11,875,822 | 241,577 | (3,092,704) | 9,682,515 | 57,515,471 |
| Fidelity Series Emerging Markets Debt Fund | 10,149,712 | 1,849,248 | 338,125 | 316,373 | (607) | 1,298,160 | 12,958,388 |
| Fidelity Series Emerging Markets Fund | 18,962,022 | 9,887,562 | 924,193 | -- | (22,917) | 7,557,779 | 35,460,253 |
| Fidelity Series Emerging Markets Opportunities Fund | 177,933,485 | 76,409,450 | 5,917,727 | -- | 209,369 | 71,430,285 | 320,064,862 |
| Fidelity Series Floating Rate High Income Fund | 2,214,978 | 428,115 | 81,804 | 57,259 | (4,027) | 236,087 | 2,793,349 |
| Fidelity Series Government Money Market Fund 0.16% | 48,201,151 | 21,042,634 | 42,498,750 | 41,427 | -- | -- | 26,745,035 |
| Fidelity Series Growth Company Fund | 119,069,908 | 18,219,355 | 24,671,657 | -- | 1,095,025 | 77,506,509 | 191,219,140 |
| Fidelity Series High Income Fund | 12,409,675 | 2,249,041 | 409,022 | 394,757 | 11,479 | 1,363,617 | 15,624,790 |
| Fidelity Series Inflation-Protected Bond Index Fund | 34,500,453 | 12,981,566 | 4,446,233 | 30,687 | 2,061 | 2,253,413 | 45,291,260 |
| Fidelity Series International Credit Fund | 256,913 | 3,992 | -- | 3,993 | -- | 23,060 | 283,965 |
| Fidelity Series International Growth Fund | 135,174,776 | 16,183,165 | 29,545,779 | -- | (14,521) | 37,719,167 | 159,516,808 |
| Fidelity Series International Small Cap Fund | 32,381,643 | 6,462,784 | 1,332,205 | -- | 62,164 | 11,233,430 | 48,807,816 |
| Fidelity Series International Value Fund | 121,040,970 | 20,036,252 | 8,232,818 | -- | (136,765) | 25,569,404 | 158,277,043 |
| Fidelity Series Intrinsic Opportunities Fund | 132,374,559 | 23,627,992 | 4,429,783 | 2,487,287 | 238,169 | 33,091,373 | 184,902,310 |
| Fidelity Series Large Cap Stock Fund | 117,522,100 | 25,512,305 | 4,546,895 | 5,281,381 | (119,799) | 21,568,578 | 159,936,289 |
| Fidelity Series Large Cap Value Index Fund | 32,282,005 | 15,999,135 | 1,246,260 | -- | (102,015) | 6,936,111 | 53,868,976 |
| Fidelity Series Long-Term Treasury Bond Index Fund | 39,383,216 | 17,222,258 | 3,417,816 | 1,098,892 | 454,960 | (1,817,619) | 51,824,999 |
| Fidelity Series Opportunistic Insights Fund | 65,527,077 | 9,671,265 | 3,338,113 | -- | (136,748) | 27,753,316 | 99,476,797 |
| Fidelity Series Overseas Fund | 112,154,305 | 22,432,620 | 10,434,164 | -- | (318,116) | 35,452,574 | 159,287,219 |
| Fidelity Series Real Estate Income Fund | 6,964,826 | 1,450,962 | 256,320 | 288,944 | (32,657) | 1,371,164 | 9,497,975 |
| Fidelity Series Short-Term Credit Fund | 3,614,277 | 208,325 | 3,099 | 42,977 | (82) | 140,540 | 3,959,961 |
| Fidelity Series Small Cap Discovery Fund | 13,227,659 | 2,462,572 | 412,015 | 50,122 | (7,170) | 4,805,774 | 20,076,820 |
| Fidelity Series Small Cap Opportunities Fund | 45,909,405 | 7,882,244 | 1,345,495 | 382,523 | (10,209) | 12,273,938 | 64,709,883 |
| Fidelity Series Stock Selector Large Cap Value Fund | 86,302,866 | 27,756,343 | 2,665,588 | -- | (126,431) | 20,327,850 | 131,595,040 |
| Fidelity Series Value Discovery Fund | 64,128,138 | 21,586,262 | 2,490,468 | -- | (87,342) | 16,186,140 | 99,322,730 |
| | $1,606,901,991 | $414,116,526 | $192,646,741 | $27,431,194 | $(31,711) | $460,025,866 | $2,288,365,931 |
Amounts in the income column in the above table include any capital gain distributions from underlying funds, which are presented in the corresponding line-item in the Statement of Operations, if applicable.
Investment Valuation
The following is a summary of the inputs used, as of September 30, 2020, involving the Fund's assets and liabilities carried at fair value. The inputs or methodology used for valuing securities may not be an indication of the risk associated with investing in those securities. For more information on valuation inputs, and their aggregation into the levels used below, please refer to the Investment Valuation section in the accompanying Notes to Financial Statements.
| | Valuation Inputs at Reporting Date: |
| Description | Total | Level 1 | Level 2 | Level 3 |
| Investments in Securities: | | | | |
| Other Short-Term Investments | $2,639,523 | $-- | $2,639,523 | $-- |
| Domestic Equity Funds | 1,184,113,092 | 1,184,113,092 | -- | -- |
| International Equity Funds | 935,273,117 | 935,273,117 | -- | -- |
| Bond Funds | 138,274,726 | 138,274,726 | -- | -- |
| Short-Term Funds | 34,295,053 | 34,295,053 | -- | -- |
| Total Investments in Securities: | $2,294,595,511 | $2,291,955,988 | $2,639,523 | $-- |
| Derivative Instruments: | | | | |
| Liabilities | | | | |
| Futures Contracts | $(123,160) | $(123,160) | $-- | $-- |
| Total Liabilities | $(123,160) | $(123,160) | $-- | $-- |
| Total Derivative Instruments: | $(123,160) | $(123,160) | $-- | $-- |
Value of Derivative Instruments
The following table is a summary of the Fund's value of derivative instruments by primary risk exposure as of September 30, 2020. For additional information on derivative instruments, please refer to the Derivative Instruments section in the accompanying Notes to Financial Statements.
| Primary Risk Exposure / Derivative Type | Value |
| | Asset | Liability |
| Equity Risk | | |
| Futures Contracts(a) | $0 | $(123,160) |
| Total Equity Risk | 0 | (123,160) |
| Total Value of Derivatives | $0 | $(123,160) |
(a) Reflects gross cumulative appreciation (depreciation) on futures contracts as presented in the Consolidated Schedule of Investments. In the Consolidated Statement of Assets and Liabilities, the period end daily variation margin is included in receivable or payable for daily variation margin on futures contracts, and the net cumulative appreciation (depreciation) is included in Total accumulated earnings (loss).
See accompanying notes which are an integral part of the financial statements.
Fidelity Freedom® 2060 Fund
Financial Statements
Statement of Assets and Liabilities
| | | September 30, 2020 (Unaudited) |
| Assets | | |
Investment in securities, at value — See accompanying schedule:
Unaffiliated issuers (cost $2,639,493) | $2,639,523 | |
| Fidelity Central Funds (cost $3,590,019) | 3,590,057 | |
| Other affiliated issuers (cost $2,117,677,281) | 2,288,365,931 | |
| Total Investment in Securities (cost $2,123,906,793) | | $2,294,595,511 |
| Receivable for investments sold | | 19,478,018 |
| Receivable for fund shares sold | | 5,585,019 |
| Distributions receivable from Fidelity Central Funds | | 329 |
| Total assets | | 2,319,658,877 |
| Liabilities | | |
| Payable for investments purchased | $22,242,120 | |
| Payable for fund shares redeemed | 1,647,626 | |
| Accrued management fee | 1,231,984 | |
| Payable for daily variation margin on futures contracts | 89,418 | |
| Total liabilities | | 25,211,148 |
| Net Assets | | $2,294,447,729 |
| Net Assets consist of: | | |
| Paid in capital | | $2,118,300,658 |
| Total accumulated earnings (loss) | | 176,147,071 |
| Net Assets | | $2,294,447,729 |
| Net Asset Value and Maximum Offering Price | | |
| Fidelity Freedom 2060 Fund: | | |
| Net Asset Value, offering price and redemption price per share ($639,512,624 ÷ 51,643,496 shares) | | $12.38 |
| Class K: | | |
| Net Asset Value, offering price and redemption price per share ($1,309,826,668 ÷ 105,841,500 shares) | | $12.38 |
| Class K6: | | |
| Net Asset Value, offering price and redemption price per share ($345,108,437 ÷ 27,888,793 shares) | | $12.37 |
See accompanying notes which are an integral part of the financial statements.
Statement of Operations
| | | Six months ended September 30, 2020 (Unaudited) |
| Investment Income | | |
| Dividends: | | |
| Affiliated issuers | | $7,077,402 |
| Interest | | 3,312 |
| Income from Fidelity Central Funds | | 2,790 |
| Total income | | 7,083,504 |
| Expenses | | |
| Management fee | $6,596,499 | |
| Independent trustees' fees and expenses | 2,634 | |
| Total expenses before reductions | 6,599,133 | |
| Expense reductions | (84) | |
| Total expenses after reductions | | 6,599,049 |
| Net investment income (loss) | | 484,455 |
| Realized and Unrealized Gain (Loss) | | |
| Net realized gain (loss) on: | | |
| Investment securities: | | |
| Fidelity Central Funds | (490) | |
| Other affiliated issuers | (31,711) | |
| Futures contracts | (657,409) | |
| Capital gain distributions from underlying funds: | | |
| Affiliated issuers | 20,353,792 | |
| Total net realized gain (loss) | | 19,664,182 |
| Change in net unrealized appreciation (depreciation) on: | | |
| Investment securities: | | |
| Unaffiliated issuers | (1,830) | |
| Fidelity Central Funds | (176) | |
| Other affiliated issuers | 460,025,866 | |
| Futures contracts | (252,851) | |
| Total change in net unrealized appreciation (depreciation) | | 459,771,009 |
| Net gain (loss) | | 479,435,191 |
| Net increase (decrease) in net assets resulting from operations | | $479,919,646 |
See accompanying notes which are an integral part of the financial statements.
Statement of Changes in Net Assets
| | Six months ended September 30, 2020 (Unaudited) | Year ended March 31, 2020 |
| Increase (Decrease) in Net Assets | | |
| Operations | | |
| Net investment income (loss) | $484,455 | $26,724,215 |
| Net realized gain (loss) | 19,664,182 | 59,495,234 |
| Change in net unrealized appreciation (depreciation) | 459,771,009 | (296,150,113) |
| Net increase (decrease) in net assets resulting from operations | 479,919,646 | (209,930,664) |
| Distributions to shareholders | (44,166,512) | (94,869,567) |
| Share transactions - net increase (decrease) | 243,448,265 | 631,151,652 |
| Total increase (decrease) in net assets | 679,201,399 | 326,351,421 |
| Net Assets | | |
| Beginning of period | 1,615,246,330 | 1,288,894,909 |
| End of period | $2,294,447,729 | $1,615,246,330 |
See accompanying notes which are an integral part of the financial statements.
Financial Highlights
Fidelity Freedom 2060 Fund
| | Six months ended (Unaudited) September 30, | Years endedMarch 31, | | | | |
| | 2020 | 2020 | 2019 | 2018 | 2017 | 2016 |
| Selected Per–Share Data | | | | | | |
| Net asset value, beginning of period | $9.87 | $11.76 | $12.20 | $11.01 | $9.78 | $10.45 |
| Income from Investment Operations | | | | | | |
| Net investment income (loss)A | –B | .19 | .17 | .13 | .16 | .16 |
| Net realized and unrealized gain (loss) | 2.77 | (1.34) | .01 | 1.46 | 1.37 | (.53) |
| Total from investment operations | 2.77 | (1.15) | .18 | 1.59 | 1.53 | (.37) |
| Distributions from net investment income | – | (.19) | (.16) | (.13) | (.13) | (.12) |
| Distributions from net realized gain | (.26) | (.55) | (.45) | (.26) | (.17) | (.17) |
| Total distributions | (.26) | (.74) | (.62)C | (.40)C | (.30) | (.30)C |
| Net asset value, end of period | $12.38 | $9.87 | $11.76 | $12.20 | $11.01 | $9.78 |
| Total ReturnD,E | 28.49% | (10.80)% | 1.78% | 14.50% | 16.01% | (3.67)% |
| Ratios to Average Net AssetsF,G | | | | | | |
| Expenses before reductions | .75%H | .75% | .75% | .66%I | - %J | - %J |
| Expenses net of fee waivers, if any | .75%H | .75% | .75% | .66%I | -% | -% |
| Expenses net of all reductions | .75%H | .75% | .75% | .66%I | -% | -% |
| Net investment income (loss) | (.05)%H | 1.59% | 1.46% | 1.09% | 1.54% | 1.67% |
| Supplemental Data | | | | | | |
| Net assets, end of period (000 omitted) | $639,513 | $451,002 | $367,472 | $241,896 | $116,155 | $47,019 |
| Portfolio turnover rateK | 19%H | 25% | 16% | 11%L | 21% | 31% |
A Calculated based on average shares outstanding during the period.
B Amount represents less than $.005 per share.
C Total distributions per share do not sum due to rounding.
D Total returns for periods of less than one year are not annualized.
E Total returns would have been lower if certain expenses had not been reduced during the applicable periods shown.
F Fees and expenses of any underlying mutual funds or exchange-traded funds (ETFs) are not included in the Fund's expense ratio. The Fund indirectly bears its proportionate share of these expenses. For additional expense information related to investments in Fidelity Central Funds, please refer to the "Investments in Fidelity Central Funds" note found in the Notes to Financial Statements section of the most recent Annual or Semi-Annual report.
G Expense ratios reflect operating expenses of the class. Expenses before reductions do not reflect amounts reimbursed, waived, or reduced through arrangements with the investment adviser, brokerage services, or other offset arrangements, if applicable, and do not represent the amount paid by the class during periods when reimbursements, waivers or reductions occur.
H Annualized
I On certain classes, the size and fluctuation of net assets and expense amounts may cause ratios to differ from contractual rates.
J Amount represents less than .005%.
K Amount does not include the portfolio activity of any underlying mutual funds or exchange-traded funds (ETFs).
L The portfolio turnover rate does not include the assets acquired in the merger.
See accompanying notes which are an integral part of the financial statements.
Fidelity Freedom 2060 Fund Class K
| | Six months ended (Unaudited) September 30, | Years endedMarch 31, | | |
| | 2020 | 2020 | 2019 | 2018 A |
| Selected Per–Share Data | | | | |
| Net asset value, beginning of period | $9.86 | $11.74 | $12.19 | $11.65 |
| Income from Investment Operations | | | | |
| Net investment income (loss)B | –C | .20 | .19 | .16 |
| Net realized and unrealized gain (loss) | 2.78 | (1.34) | (.01) | .68 |
| Total from investment operations | 2.78 | (1.14) | .18 | .84 |
| Distributions from net investment income | – | (.19) | (.17) | (.15) |
| Distributions from net realized gain | (.26) | (.55) | (.45) | (.15) |
| Total distributions | (.26) | (.74) | (.63)D | (.30) |
| Net asset value, end of period | $12.38 | $9.86 | $11.74 | $12.19 |
| Total ReturnE,F | 28.66% | (10.66)% | 1.80% | 7.19% |
| Ratios to Average Net AssetsG,H | | | | |
| Expenses before reductions | .64%I | .64% | .64% | .65%I,J |
| Expenses net of fee waivers, if any | .64%I | .64% | .64% | .65%I,J |
| Expenses net of all reductions | .64%I | .64% | .64% | .65%I,J |
| Net investment income (loss) | .05%I | 1.69% | 1.57% | 1.92%I |
| Supplemental Data | | | | |
| Net assets, end of period (000 omitted) | $1,309,827 | $933,551 | $784,848 | $549,158 |
| Portfolio turnover rateK | 19%I | 25% | 16% | 11%L |
A For the period July 20, 2017 (commencement of sale of shares) to March 31, 2018.
B Calculated based on average shares outstanding during the period.
C Amount represents less than $.005 per share.
D Total distributions per share do not sum due to rounding.
E Total returns for periods of less than one year are not annualized.
F Total returns would have been lower if certain expenses had not been reduced during the applicable periods shown.
G Fees and expenses of any underlying mutual funds or exchange-traded funds (ETFs) are not included in the Fund's expense ratio. The Fund indirectly bears its proportionate share of these expenses. For additional expense information related to investments in Fidelity Central Funds, please refer to the "Investments in Fidelity Central Funds" note found in the Notes to Financial Statements section of the most recent Annual or Semi-Annual report.
H Expense ratios reflect operating expenses of the class. Expenses before reductions do not reflect amounts reimbursed, waived, or reduced through arrangements with the investment adviser, brokerage services, or other offset arrangements, if applicable, and do not represent the amount paid by the class during periods when reimbursements, waivers or reductions occur.
I Annualized
J On certain classes, the size and fluctuation of net assets and expense amounts may cause ratios to differ from contractual rates.
K Amount does not include the portfolio activity of any underlying mutual funds or exchange-traded funds (ETFs).
L The portfolio turnover rate does not include the assets acquired in the merger.
See accompanying notes which are an integral part of the financial statements.
Fidelity Freedom 2060 Fund Class K6
| | Six months ended (Unaudited) September 30, | Years endedMarch 31, | | |
| | 2020 | 2020 | 2019 | 2018 A |
| Selected Per–Share Data | | | | |
| Net asset value, beginning of period | $9.85 | $11.75 | $12.20 | $11.40 |
| Income from Investment Operations | | | | |
| Net investment income (loss)B | .01 | .22 | .20 | .14 |
| Net realized and unrealized gain (loss) | 2.78 | (1.35) | –C | .96 |
| Total from investment operations | 2.79 | (1.13) | .20 | 1.10 |
| Distributions from net investment income | – | (.21) | (.20) | (.15) |
| Distributions from net realized gain | (.27) | (.56) | (.45) | (.15) |
| Total distributions | (.27) | (.77) | (.65) | (.30) |
| Net asset value, end of period | $12.37 | $9.85 | $11.75 | $12.20 |
| Total ReturnD,E | 28.74% | (10.65)% | 2.05% | 9.65% |
| Ratios to Average Net AssetsF,G | | | | |
| Expenses before reductions | .49%H | .49% | .50%I | .50%H,I |
| Expenses net of fee waivers, if any | .49%H | .49% | .50%I | .50%H,I |
| Expenses net of all reductions | .49%H | .49% | .50%I | .50%H,I |
| Net investment income (loss) | .20%H | 1.84% | 1.71% | 1.44%H |
| Supplemental Data | | | | |
| Net assets, end of period (000 omitted) | $345,108 | $230,693 | $136,574 | $26,888 |
| Portfolio turnover rateJ | 19%H | 25% | 16% | 11%K |
A For the period June 7, 2017 (commencement of sale of shares) to March 31, 2018.
B Calculated based on average shares outstanding during the period.
C Amount represents less than $.005 per share.
D Total returns for periods of less than one year are not annualized.
E Total returns would have been lower if certain expenses had not been reduced during the applicable periods shown.
F Fees and expenses of any underlying mutual funds or exchange-traded funds (ETFs) are not included in the Fund's expense ratio. The Fund indirectly bears its proportionate share of these expenses. For additional expense information related to investments in Fidelity Central Funds, please refer to the "Investments in Fidelity Central Funds" note found in the Notes to Financial Statements section of the most recent Annual or Semi-Annual report.
G Expense ratios reflect operating expenses of the class. Expenses before reductions do not reflect amounts reimbursed, waived, or reduced through arrangements with the investment adviser, brokerage services, or other offset arrangements, if applicable, and do not represent the amount paid by the class during periods when reimbursements, waivers or reductions occur.
H Annualized
I On certain classes, the size and fluctuation of net assets and expense amounts may cause ratios to differ from contractual rates.
J Amount does not include the portfolio activity of any underlying mutual funds or exchange-traded funds (ETFs).
K The portfolio turnover rate does not include the assets acquired in the merger.
See accompanying notes which are an integral part of the financial statements.
Fidelity Freedom® 2065 Fund
Investment Summary (Unaudited)
The information in the following tables is based on the direct investments of the Fund.
Top Holdings as of September 30, 2020
| | % of fund's net assets |
| Fidelity Series Emerging Markets Opportunities Fund | 14.0 |
| Fidelity Series Growth Company Fund | 8.4 |
| Fidelity Series Intrinsic Opportunities Fund | 8.0 |
| Fidelity Series Large Cap Stock Fund | 7.0 |
| Fidelity Series International Growth Fund | 7.0 |
| Fidelity Series Overseas Fund | 6.9 |
| Fidelity Series International Value Fund | 6.9 |
| Fidelity Series Stock Selector Large Cap Value Fund | 5.8 |
| Fidelity Series Value Discovery Fund | 4.3 |
| Fidelity Series Opportunistic Insights Fund | 4.1 |
| | 72.4 |
Asset Allocation (% of fund's net assets)
| Period end |
| | Domestic Equity Funds | 51.6% |
| | International Equity Funds | 40.8% |
| | Bond Funds | 6.2% |
| | Short-Term Funds | 1.3% |
| | Short-Term Investments | 0.1% |

Domestic Equity Funds category includes Fidelity Series Commodity Strategy Fund which invests in commodity-related investments.
Fidelity Freedom® 2065 Fund
Schedule of Investments September 30, 2020 (Unaudited)
Showing Percentage of Net Assets
| U.S. Treasury Obligations - 0.1% | | | |
| | | Principal Amount | Value |
| U.S. Treasury Bills, yield at date of purchase 0.1% to 0.11% 12/3/20 to 12/10/20 (a) | | | |
| (Cost $89,983) | | 90,000 | 89,984 |
| | | Shares | Value |
|
| Domestic Equity Funds - 51.6% | | | |
| Fidelity Series All-Sector Equity Fund (b) | | 179,198 | $1,908,461 |
| Fidelity Series Blue Chip Growth Fund (b) | | 189,793 | 3,133,481 |
| Fidelity Series Commodity Strategy Fund (b) | | 577,834 | 2,403,790 |
| Fidelity Series Growth Company Fund (b) | | 304,547 | 7,982,180 |
| Fidelity Series Intrinsic Opportunities Fund (b) | | 486,260 | 7,692,629 |
| Fidelity Series Large Cap Stock Fund (b) | | 472,024 | 6,683,866 |
| Fidelity Series Large Cap Value Index Fund (b) | | 195,799 | 2,271,271 |
| Fidelity Series Opportunistic Insights Fund (b) | | 181,899 | 3,934,484 |
| Fidelity Series Small Cap Discovery Fund (b) | | 85,553 | 864,939 |
| Fidelity Series Small Cap Opportunities Fund (b) | | 214,818 | 2,741,083 |
| Fidelity Series Stock Selector Large Cap Value Fund (b) | | 500,445 | 5,504,894 |
| Fidelity Series Value Discovery Fund (b) | | 336,762 | 4,162,383 |
| TOTAL DOMESTIC EQUITY FUNDS | | | |
| (Cost $45,813,547) | | | 49,283,461 |
|
| International Equity Funds - 40.8% | | | |
| Fidelity Series Canada Fund (b) | | 219,321 | 2,243,653 |
| Fidelity Series Emerging Markets Fund (b) | | 157,035 | 1,480,845 |
| Fidelity Series Emerging Markets Opportunities Fund (b) | | 634,981 | 13,321,894 |
| Fidelity Series International Growth Fund (b) | | 353,404 | 6,636,923 |
| Fidelity Series International Small Cap Fund (b) | | 114,143 | 2,031,750 |
| Fidelity Series International Value Fund (b) | | 764,182 | 6,587,245 |
| Fidelity Series Overseas Fund (b) | | 592,788 | 6,627,373 |
| TOTAL INTERNATIONAL EQUITY FUNDS | | | |
| (Cost $35,964,035) | | | 38,929,683 |
|
| Bond Funds - 6.2% | | | |
| Fidelity Series Emerging Markets Debt Fund (b) | | 61,679 | 558,811 |
| Fidelity Series Floating Rate High Income Fund (b) | | 14,994 | 132,700 |
| Fidelity Series High Income Fund (b) | | 72,897 | 664,824 |
| Fidelity Series Inflation-Protected Bond Index Fund (b) | | 177,130 | 1,895,286 |
| Fidelity Series International Credit Fund (b) | | 4,319 | 44,963 |
| Fidelity Series Long-Term Treasury Bond Index Fund (b) | | 209,817 | 2,167,410 |
| Fidelity Series Real Estate Income Fund (b) | | 41,660 | 415,765 |
| TOTAL BOND FUNDS | | | |
| (Cost $5,728,638) | | | 5,879,759 |
|
| Short-Term Funds - 1.3% | | | |
| Fidelity Series Government Money Market Fund 0.16% (b)(c) | | 1,131,371 | 1,131,371 |
| Fidelity Series Short-Term Credit Fund (b) | | 15,323 | 157,059 |
| TOTAL SHORT-TERM FUNDS | | | |
| (Cost $1,286,369) | | | 1,288,430 |
| TOTAL INVESTMENT IN SECURITIES - 100.0% | | | |
| (Cost $88,882,572) | | | 95,471,317 |
| NET OTHER ASSETS (LIABILITIES) - 0.0% | | | 13,031 |
| NET ASSETS - 100% | | | $95,484,348 |
| Futures Contracts | | | | | |
| | Number of contracts | Expiration Date | Notional Amount | Value | Unrealized Appreciation/(Depreciation) |
| Purchased | | | | | |
| Equity Index Contracts | | | | | |
| ICE E-mini MSCI EAFE Index Contracts (United States) | 2 | Dec. 2020 | $185,320 | $(3,590) | $(3,590) |
| Sold | | | | | |
| Equity Index Contracts | | | | | |
| CME E-mini S&P 500 Index Contracts (United States) | 1 | Dec. 2020 | 167,600 | (1,094) | (1,094) |
| TOTAL FUTURES CONTRACTS | | | | | $(4,684) |
The notional amount of futures purchased as a percentage of Net Assets is 0.2%
The notional amount of futures sold as a percentage of Net Assets is 0.2%
Legend
(a) Security or a portion of the security was pledged to cover margin requirements for futures contracts. At period end, the value of securities pledged amounted to $89,984.
(b) Affiliated Fund
(c) The rate quoted is the annualized seven-day yield of the fund at period end.
Affiliated Underlying Funds
Fiscal year to date information regarding the Fund's investments in affiliated Underlying Funds, excluding any Money Market Central Funds, is presented below. Exchanges between classes of the same affiliated Underlying Funds may occur.
| Affiliate | Value, beginning of period | Purchases | Sales Proceeds | Dividend Income | Realized Gain (loss) | Change in Unrealized appreciation (depreciation) | Value, end of period |
| Fidelity Series All-Sector Equity Fund | $770,740 | $831,537 | $49,304 | $-- | $279 | $355,209 | $1,908,461 |
| Fidelity Series Blue Chip Growth Fund | 1,358,432 | 2,115,958 | 728,981 | 684,220 | (69,419) | 457,491 | 3,133,481 |
| Fidelity Series Canada Fund | 805,631 | 1,230,452 | 56,038 | -- | (5,386) | 268,994 | 2,243,653 |
| Fidelity Series Commodity Strategy Fund | 1,367,541 | 1,182,302 | 364,218 | 9,622 | (37,230) | 255,395 | 2,403,790 |
| Fidelity Series Emerging Markets Debt Fund | 256,863 | 278,152 | 15,112 | 10,928 | (762) | 39,670 | 558,811 |
| Fidelity Series Emerging Markets Fund | 483,010 | 795,325 | 39,323 | -- | (2,420) | 244,253 | 1,480,845 |
| Fidelity Series Emerging Markets Opportunities Fund | 4,457,914 | 6,936,476 | 323,752 | -- | (9,714) | 2,260,970 | 13,321,894 |
| Fidelity Series Floating Rate High Income Fund | 61,682 | 66,829 | 3,656 | 2,179 | (62) | 7,907 | 132,700 |
| Fidelity Series Government Money Market Fund 0.16% | 1,376,575 | 1,244,972 | 1,490,176 | 1,367 | -- | -- | 1,131,371 |
| Fidelity Series Growth Company Fund | 2,774,005 | 3,218,439 | 464,038 | -- | 15,206 | 2,438,568 | 7,982,180 |
| Fidelity Series High Income Fund | 305,753 | 336,639 | 18,281 | 13,384 | (302) | 41,015 | 664,824 |
| Fidelity Series Inflation-Protected Bond Index Fund | 838,992 | 1,056,093 | 72,387 | 995 | 124 | 72,464 | 1,895,286 |
| Fidelity Series International Credit Fund | 21,744 | 21,967 | 1,219 | 416 | (18) | 2,489 | 44,963 |
| Fidelity Series International Growth Fund | 3,291,556 | 2,904,228 | 736,657 | -- | 287 | 1,177,509 | 6,636,923 |
| Fidelity Series International Small Cap Fund | 794,912 | 942,432 | 64,696 | -- | (1,308) | 360,410 | 2,031,750 |
| Fidelity Series International Value Fund | 3,006,424 | 3,048,781 | 216,470 | -- | (12,585) | 761,095 | 6,587,245 |
| Fidelity Series Intrinsic Opportunities Fund | 3,247,083 | 3,649,011 | 197,536 | 99,082 | (5,445) | 999,516 | 7,692,629 |
| Fidelity Series Large Cap Stock Fund | 2,891,456 | 3,381,760 | 183,608 | 191,837 | (9,966) | 604,224 | 6,683,866 |
| Fidelity Series Large Cap Value Index Fund | 788,891 | 1,346,115 | 57,409 | -- | (4,549) | 198,223 | 2,271,271 |
| Fidelity Series Long-Term Treasury Bond Index Fund | 961,232 | 1,337,402 | 84,049 | 32,039 | (1,102) | (46,073) | 2,167,410 |
| Fidelity Series Opportunistic Insights Fund | 1,498,051 | 1,715,462 | 97,733 | -- | 6,418 | 812,286 | 3,934,484 |
| Fidelity Series Overseas Fund | 2,892,263 | 3,013,568 | 386,302 | -- | (2,025) | 1,109,869 | 6,627,373 |
| Fidelity Series Real Estate Income Fund | 172,497 | 213,513 | 11,456 | 10,939 | (998) | 42,209 | 415,765 |
| Fidelity Series Short-Term Credit Fund | 149,735 | 1,708 | -- | 1,699 | -- | 5,616 | 157,059 |
| Fidelity Series Small Cap Discovery Fund | 346,457 | 396,808 | 31,229 | 1,743 | (1,285) | 154,188 | 864,939 |
| Fidelity Series Small Cap Opportunities Fund | 1,161,992 | 1,277,516 | 71,254 | 15,543 | (2,466) | 375,295 | 2,741,083 |
| Fidelity Series Stock Selector Large Cap Value Fund | 2,188,378 | 2,856,795 | 141,431 | -- | (11,141) | 612,293 | 5,504,894 |
| Fidelity Series Value Discovery Fund | 1,544,072 | 2,246,045 | 106,127 | -- | (4,908) | 483,301 | 4,162,383 |
| | $39,813,881 | $47,646,285 | $6,012,442 | $1,075,993 | $(160,777) | $14,094,386 | $95,381,333 |
Amounts in the income column in the above table include any capital gain distributions from underlying funds, which are presented in the corresponding line-item in the Statement of Operations, if applicable.
Investment Valuation
The following is a summary of the inputs used, as of September 30, 2020, involving the Fund's assets and liabilities carried at fair value. The inputs or methodology used for valuing securities may not be an indication of the risk associated with investing in those securities. For more information on valuation inputs, and their aggregation into the levels used below, please refer to the Investment Valuation section in the accompanying Notes to Financial Statements.
| | Valuation Inputs at Reporting Date: |
| Description | Total | Level 1 | Level 2 | Level 3 |
| Investments in Securities: | | | | |
| Other Short-Term Investments | $89,984 | $-- | $89,984 | $-- |
| Domestic Equity Funds | 49,283,461 | 49,283,461 | -- | -- |
| International Equity Funds | 38,929,683 | 38,929,683 | -- | -- |
| Bond Funds | 5,879,759 | 5,879,759 | -- | -- |
| Short-Term Funds | 1,288,430 | 1,288,430 | -- | -- |
| Total Investments in Securities: | $95,471,317 | $95,381,333 | $89,984 | $-- |
| Derivative Instruments: | | | | |
| Liabilities | | | | |
| Futures Contracts | $(4,684) | $(4,684) | $-- | $-- |
| Total Liabilities | $(4,684) | $(4,684) | $-- | $-- |
| Total Derivative Instruments: | $(4,684) | $(4,684) | $-- | $-- |
Value of Derivative Instruments
The following table is a summary of the Fund's value of derivative instruments by primary risk exposure as of September 30, 2020. For additional information on derivative instruments, please refer to the Derivative Instruments section in the accompanying Notes to Financial Statements.
| Primary Risk Exposure / Derivative Type | Value |
| | Asset | Liability |
| Equity Risk | | |
| Futures Contracts(a) | $0 | $(4,684) |
| Total Equity Risk | 0 | (4,684) |
| Total Value of Derivatives | $0 | $(4,684) |
(a) Reflects gross cumulative appreciation (depreciation) on futures contracts as presented in the Consolidated Schedule of Investments. In the Consolidated Statement of Assets and Liabilities, the period end daily variation margin is included in receivable or payable for daily variation margin on futures contracts, and the net cumulative appreciation (depreciation) is included in Total accumulated earnings (loss).
See accompanying notes which are an integral part of the financial statements.
Fidelity Freedom® 2065 Fund
Financial Statements
Statement of Assets and Liabilities
| | | September 30, 2020 (Unaudited) |
| Assets | | |
Investment in securities, at value — See accompanying schedule:
Unaffiliated issuers (cost $89,983) | $89,984 | |
| Affiliated issuers (cost $88,792,589) | 95,381,333 | |
| Total Investment in Securities (cost $88,882,572) | | $95,471,317 |
| Cash | | 16,631 |
| Receivable for investments sold | | 635,236 |
| Receivable for fund shares sold | | 484,201 |
| Total assets | | 96,607,385 |
| Liabilities | | |
| Payable for investments purchased | $1,027,316 | |
| Payable for fund shares redeemed | 44,793 | |
| Accrued management fee | 49,696 | |
| Payable for daily variation margin on futures contracts | 1,232 | |
| Total liabilities | | 1,123,037 |
| Net Assets | | $95,484,348 |
| Net Assets consist of: | | |
| Paid in capital | | $88,432,015 |
| Total accumulated earnings (loss) | | 7,052,333 |
| Net Assets | | $95,484,348 |
| Net Asset Value and Maximum Offering Price | | |
| Fidelity Freedom 2065 Fund: | | |
| Net Asset Value, offering price and redemption price per share ($30,514,623 ÷ 2,806,171 shares) | | $10.87 |
| Class K: | | |
| Net Asset Value, offering price and redemption price per share ($49,059,973 ÷ 4,510,114 shares) | | $10.88 |
| Class K6: | | |
| Net Asset Value, offering price and redemption price per share ($15,909,752 ÷ 1,460,582 shares) | | $10.89 |
See accompanying notes which are an integral part of the financial statements.
Statement of Operations
| | | Six months ended September 30, 2020 (Unaudited) |
| Investment Income | | |
| Dividends: | | |
| Affiliated issuers | | $267,736 |
| Interest | | 36 |
| Total income | | 267,772 |
| Expenses | | |
| Management fee | $225,427 | |
| Independent trustees' fees and expenses | 79 | |
| Total expenses | | 225,506 |
| Net investment income (loss) | | 42,266 |
| Realized and Unrealized Gain (Loss) | | |
| Net realized gain (loss) on: | | |
| Investment securities: | | |
| Affiliated issuers | (160,777) | |
| Futures contracts | 4,676 | |
| Capital gain distributions from underlying funds: | | |
| Affiliated issuers | 808,257 | |
| Total net realized gain (loss) | | 652,156 |
| Change in net unrealized appreciation (depreciation) on: | | |
| Investment securities: | | |
| Unaffiliated issuers | 1 | |
| Affiliated issuers | 14,094,386 | |
| Futures contracts | (4,684) | |
| Total change in net unrealized appreciation (depreciation) | | 14,089,703 |
| Net gain (loss) | | 14,741,859 |
| Net increase (decrease) in net assets resulting from operations | | $14,784,125 |
See accompanying notes which are an integral part of the financial statements.
Statement of Changes in Net Assets
| | Six months ended September 30, 2020 (Unaudited) | For the period
June 28, 2019 (commencement of operations) to March 31, 2020 |
| Increase (Decrease) in Net Assets | | |
| Operations | | |
| Net investment income (loss) | $42,266 | $183,327 |
| Net realized gain (loss) | 652,156 | 229,886 |
| Change in net unrealized appreciation (depreciation) | 14,089,703 | (7,505,642) |
| Net increase (decrease) in net assets resulting from operations | 14,784,125 | (7,092,429) |
| Distributions to shareholders | (376,843) | (262,520) |
| Share transactions - net increase (decrease) | 41,264,054 | 47,167,961 |
| Total increase (decrease) in net assets | 55,671,336 | 39,813,012 |
| Net Assets | | |
| Beginning of period | 39,813,012 | – |
| End of period | $95,484,348 | $39,813,012 |
See accompanying notes which are an integral part of the financial statements.
Financial Highlights
Fidelity Freedom 2065 Fund
| | Six months ended (Unaudited) September 30, | Years endedMarch 31, |
| | 2020 | 2020 A |
| Selected Per–Share Data | | |
| Net asset value, beginning of period | $8.52 | $10.00 |
| Income from Investment Operations | | |
| Net investment income (loss)B | –C | .13 |
| Net realized and unrealized gain (loss) | 2.41 | (1.46) |
| Total from investment operations | 2.41 | (1.33) |
| Distributions from net investment income | – | (.12) |
| Distributions from net realized gain | (.06) | (.03) |
| Total distributions | (.06) | (.15) |
| Net asset value, end of period | $10.87 | $8.52 |
| Total ReturnD | 28.43% | (13.60)% |
| Ratios to Average Net AssetsE,F | | |
| Expenses before reductions | .75%G | .76%G,H |
| Expenses net of fee waivers, if any | .75%G | .76%G,H |
| Expenses net of all reductions | .75%G | .76%G,H |
| Net investment income (loss) | .03%G | 1.71%G |
| Supplemental Data | | |
| Net assets, end of period (000 omitted) | $30,515 | $13,332 |
| Portfolio turnover rateI | 17%G | 33%G |
A For the period June 28, 2019 (commencement of operations) to March 31, 2020.
B Calculated based on average shares outstanding during the period.
C Amount represents less than $.005 per share.
D Total returns for periods of less than one year are not annualized.
E Fees and expenses of any underlying mutual funds or exchange-traded funds (ETFs) are not included in the Fund's expense ratio. The Fund indirectly bears its proportionate share of these expenses. For additional expense information related to investments in Fidelity Central Funds, please refer to the "Investments in Fidelity Central Funds" note found in the Notes to Financial Statements section of the most recent Annual or Semi-Annual report.
F Expense ratios reflect operating expenses of the class. Expenses before reductions do not reflect amounts reimbursed, waived, or reduced through arrangements with the investment adviser, brokerage services, or other offset arrangements, if applicable, and do not represent the amount paid by the class during periods when reimbursements, waivers or reductions occur.
G Annualized
H On certain classes, the size and fluctuation of net assets and expense amounts may cause ratios to differ from contractual rates.
I Amount does not include the portfolio activity of any underlying mutual funds or exchange-traded funds (ETFs).
See accompanying notes which are an integral part of the financial statements.
Fidelity Freedom 2065 Fund Class K
| | Six months ended (Unaudited) September 30, | Years endedMarch 31, |
| | 2020 | 2020 A |
| Selected Per–Share Data | | |
| Net asset value, beginning of period | $8.52 | $10.00 |
| Income from Investment Operations | | |
| Net investment income (loss)B | .01 | .13 |
| Net realized and unrealized gain (loss) | 2.42 | (1.45) |
| Total from investment operations | 2.43 | (1.32) |
| Distributions from net investment income | – | (.13) |
| Distributions from net realized gain | (.07) | (.03) |
| Total distributions | (.07) | (.16) |
| Net asset value, end of period | $10.88 | $8.52 |
| Total ReturnC | 28.59% | (13.55)% |
| Ratios to Average Net AssetsD,E | | |
| Expenses before reductions | .64%F | .65%F,G |
| Expenses net of fee waivers, if any | .64%F | .65%F,G |
| Expenses net of all reductions | .64%F | .65%F,G |
| Net investment income (loss) | .13%F | 1.81%F |
| Supplemental Data | | |
| Net assets, end of period (000 omitted) | $49,060 | $20,387 |
| Portfolio turnover rateH | 17%F | 33%F |
A For the period June 28, 2019 (commencement of operations) to March 31, 2020.
B Calculated based on average shares outstanding during the period.
C Total returns for periods of less than one year are not annualized.
D Fees and expenses of any underlying mutual funds or exchange-traded funds (ETFs) are not included in the Fund's expense ratio. The Fund indirectly bears its proportionate share of these expenses. For additional expense information related to investments in Fidelity Central Funds, please refer to the "Investments in Fidelity Central Funds" note found in the Notes to Financial Statements section of the most recent Annual or Semi-Annual report.
E Expense ratios reflect operating expenses of the class. Expenses before reductions do not reflect amounts reimbursed, waived, or reduced through arrangements with the investment adviser, brokerage services, or other offset arrangements, if applicable, and do not represent the amount paid by the class during periods when reimbursements, waivers or reductions occur.
F Annualized
G On certain classes, the size and fluctuation of net assets and expense amounts may cause ratios to differ from contractual rates.
H Amount does not include the portfolio activity of any underlying mutual funds or exchange-traded funds (ETFs).
See accompanying notes which are an integral part of the financial statements.
See accompanying notes which are an integral part of the financial statements.
Fidelity Freedom 2065 Fund Class K6
| | Six months ended (Unaudited) September 30, | Years endedMarch 31, |
| | 2020 | 2020 A |
| Selected Per–Share Data | | |
| Net asset value, beginning of period | $8.53 | $10.00 |
| Income from Investment Operations | | |
| Net investment income (loss)B | .01 | .15 |
| Net realized and unrealized gain (loss) | 2.42 | (1.46) |
| Total from investment operations | 2.43 | (1.31) |
| Distributions from net investment income | – | (.13) |
| Distributions from net realized gain | (.07) | (.03) |
| Total distributions | (.07) | (.16) |
| Net asset value, end of period | $10.89 | $8.53 |
| Total ReturnC | 28.59% | (13.43)% |
| Ratios to Average Net AssetsD,E | | |
| Expenses before reductions | .49%F | .50%F,G |
| Expenses net of fee waivers, if any | .49%F | .50%F,G |
| Expenses net of all reductions | .49%F | .50%F,G |
| Net investment income (loss) | .28%F | 1.97%F |
| Supplemental Data | | |
| Net assets, end of period (000 omitted) | $15,910 | $6,094 |
| Portfolio turnover rateH | 17%F | 33%F |
A For the period June 28, 2019 (commencement of operations) to March 31, 2020.
B Calculated based on average shares outstanding during the period.
C Total returns for periods of less than one year are not annualized.
D Fees and expenses of any underlying mutual funds or exchange-traded funds (ETFs) are not included in the Fund's expense ratio. The Fund indirectly bears its proportionate share of these expenses. For additional expense information related to investments in Fidelity Central Funds, please refer to the "Investments in Fidelity Central Funds" note found in the Notes to Financial Statements section of the most recent Annual or Semi-Annual report.
E Expense ratios reflect operating expenses of the class. Expenses before reductions do not reflect amounts reimbursed, waived, or reduced through arrangements with the investment adviser, brokerage services, or other offset arrangements, if applicable, and do not represent the amount paid by the class during periods when reimbursements, waivers or reductions occur.
F Annualized
G On certain classes, the size and fluctuation of net assets and expense amounts may cause ratios to differ from contractual rates.
H Amount does not include the portfolio activity of any underlying mutual funds or exchange-traded funds (ETFs).
See accompanying notes which are an integral part of the financial statements.
Notes to Financial Statements (Unaudited)
For the period ended September 30, 2020
1. Organization.
Fidelity Freedom Income Fund, Fidelity Freedom 2005 Fund, Fidelity Freedom 2010 Fund, Fidelity Freedom 2015 Fund, Fidelity Freedom 2020 Fund, Fidelity Freedom 2025 Fund, Fidelity Freedom 2030 Fund, Fidelity Freedom 2035 Fund, Fidelity Freedom 2040 Fund, Fidelity Freedom 2045 Fund, Fidelity Freedom 2050 Fund, Fidelity Freedom 2055 Fund, Fidelity Freedom 2060 Fund and Fidelity Freedom 2065 Fund (the Funds) are funds of Fidelity Aberdeen Street Trust (the Trust). The Trust is registered under the Investment Company Act of 1940, as amended (the 1940 Act), as an open-end management investment company organized as a Delaware statutory trust. Each Fund is authorized to issue an unlimited number of shares. Each Fund offers Fidelity Freedom, Class K and Class K6 shares, each of which has equal rights as to assets and voting privileges. Each class has exclusive voting rights with respect to matters that affect that class.
2. Investments in Fidelity Central Funds.
The Funds invest in Fidelity Central Funds, which are open-end investment companies generally available only to other investment companies and accounts managed by the investment adviser and its affiliates. The Funds' Schedules of Investments list each of the Fidelity Central Funds held as of period end, if any, as an investment of each Fund, but do not include the underlying holdings of each Fidelity Central Fund. As an Investing Fund, each Fund indirectly bears its proportionate share of the expenses of the underlying Fidelity Central Funds.
The Money Market Central Funds seek preservation of capital and current income and are managed by the investment adviser. Annualized expenses of the Money Market Central Funds as of their most recent shareholder report date ranged from less than .005% to .01%.
A complete unaudited list of holdings for each Fidelity Central Fund is available upon request or at the Securities and Exchange Commission (the SEC) website at www.sec.gov. In addition, the financial statements of the Fidelity Central Funds are available on the SEC website or upon request.
3. Significant Accounting Policies.
Each Fund is an investment company and applies the accounting and reporting guidance of the Financial Accounting Standards Board (FASB) Accounting Standards Codification Topic 946 Financial Services – Investment Companies. The financial statements have been prepared in conformity with accounting principles generally accepted in the United States of America (GAAP), which require management to make certain estimates and assumptions at the date of the financial statements. Actual results could differ from those estimates. Subsequent events, if any, through the date that the financial statements were issued have been evaluated in the preparation of the financial statements. The following summarizes the significant accounting policies of the Funds:
Investment Valuation. Investments are valued as of 4:00 p.m. Eastern time on the last calendar day of the period. The Board of Trustees (the Board) has delegated the day to day responsibility for the valuation of each Fund's investments to the Fair Value Committee (the Committee) established by each Fund's investment adviser. In accordance with valuation policies and procedures approved by the Board, each Fund attempts to obtain prices from one or more third party pricing vendors or brokers to value its investments. When current market prices, quotations or currency exchange rates are not readily available or reliable, investments will be fair valued in good faith by the Committee, in accordance with procedures adopted by the Board. Factors used in determining fair value vary by investment type and may include market or investment specific events, changes in interest rates and credit quality. The frequency with which these procedures are used cannot be predicted and they may be utilized to a significant extent. The Committee oversees each Fund's valuation policies and procedures and reports to the Board on the Committee's activities and fair value determinations. The Board monitors the appropriateness of the procedures used in valuing each Fund's investments and ratifies the fair value determinations of the Committee. Each Fund categorizes the inputs to valuation techniques used to value its investments into a disclosure hierarchy consisting of three levels as shown below:
- Level 1 – quoted prices in active markets for identical investments
- Level 2 – other significant observable inputs (including quoted prices for similar investments, interest rates, prepayment speeds, etc.)
- Level 3 – unobservable inputs (including the Fund's own assumptions based on the best information available)
Valuation techniques used to value each Fund's investments by major category are as follows. Investments in open-end mutual funds are valued at their closing net asset value (NAV) each business day and are categorized as Level 1 in the hierarchy. Debt securities, including restricted securities, are valued based on evaluated prices received from third party pricing vendors or from brokers who make markets in such securities. U.S. government and government agency obligations are valued by pricing vendors who utilize matrix pricing which considers yield or price of bonds of comparable quality, coupon, maturity and type or by broker-supplied prices. When independent prices are unavailable or unreliable, debt securities may be valued utilizing pricing methodologies which consider similar factors that would be used by third party pricing vendors. Debt securities are generally categorized as Level 2 in the hierarchy but may be Level 3 depending on the circumstances. The aggregate value of investments by input level as of September 30, 2020 is included at the end of each Fund's Schedule of Investments.
Futures contracts are valued at the settlement price established each day by the board of trade or exchange on which they are traded and are categorized as Level 1 in the hierarchy.
Investment Transactions and Income. For financial reporting purposes, the Funds' investment holdings and NAV include trades executed through the end of the last business day of the period. The NAV per share for processing shareholder transactions is calculated as of the close of business of the New York Stock Exchange (NYSE), normally 4:00 p.m. Eastern time and includes trades executed through the end of the prior business day. Gains and losses on securities sold are determined on the basis of identified cost. Income and capital gain distributions from any underlying mutual funds or exchange-traded funds (ETFs) are recorded on the ex-dividend date. Interest income is accrued as earned. Interest income includes coupon interest and amortization of premium and accretion of discount on debt securities as applicable.
Class Allocations and Expenses. Investment income, realized and unrealized capital gains and losses, common expenses of each Fund, and certain fund-level expense reductions, if any, are allocated daily on a pro-rata basis to each class based on the relative net assets of each class to the total net assets of each Fund. Each class differs with respect to fees incurred. Certain expense reductions may also differ by class. For the reporting period, the allocated portion of income and expenses to each class as a percent of its average net assets may vary due to the timing of recording these transactions in relation to fluctuating net assets of the classes. Expenses directly attributable to a fund are charged to that fund. Expenses attributable to more than one fund are allocated among the respective funds on the basis of relative net assets or other appropriate methods. Expenses included in the accompanying financial statements reflect the expenses of each Fund and do not include any expenses associated with any underlying mutual funds or exchange-traded funds (ETFs). Although not included in each Fund's expenses, each Fund indirectly bears its proportionate share of any underlying mutual funds or exchange-traded funds (ETFs) expenses through the impact of these expenses on each underlying mutual fund's or exchange-traded fund's (ETFs) NAV. Expense estimates are accrued in the period to which they relate and adjustments are made when actual amounts are known.
Deferred Trustee Compensation. Under a Deferred Compensation Plan (the Plan) for certain Funds, certain independent Trustees have elected to defer receipt of a portion of their annual compensation. Deferred amounts are invested in a cross-section of Fidelity funds, are marked-to-market and remain in each Fund until distributed in accordance with the Plan. The investment of deferred amounts and the offsetting payable to the Trustees presented below are included in each accompanying Statement of Assets and Liabilities in other receivables and other payables and accrued expenses, respectively.
| Fidelity Freedom 2010 Fund | $96,313 |
| Fidelity Freedom 2020 Fund | 260,173 |
| Fidelity Freedom 2030 Fund | 242,856 |
Income Tax Information and Distributions to Shareholders. Each year, each Fund intends to qualify as a regulated investment company under Subchapter M of the Internal Revenue Code, including distributing substantially all of its taxable income and realized gains. As a result, no provision for U.S. Federal income taxes is required. Each Fund files a U.S. federal tax return, in addition to state and local tax returns as required. Each Fund's federal income tax returns are subject to examination by the Internal Revenue Service (IRS) for a period of three fiscal years after they are filed. State and local tax returns may be subject to examination for an additional fiscal year depending on the jurisdiction.
Distributions are declared and recorded on the ex-dividend date. Income and capital gain distributions are declared separately for each class. Income and capital gain distributions are determined in accordance with income tax regulations, which may differ from GAAP.
Capital accounts within the financial statements are adjusted for permanent book-tax differences. These adjustments have no impact on net assets or the results of operations. Capital accounts are not adjusted for temporary book-tax differences which will reverse in a subsequent period.
Book-tax differences are primarily due to the short-term gain distributions from the Underlying Funds, futures contracts, market discount, deferred trustees compensation and losses deferred due to wash sales and excise tax regulations.
As of period end, the cost and unrealized appreciation (depreciation) in securities, and derivatives if applicable, for federal income tax purposes were as follows for each Fund:
| | Tax cost | Gross unrealized appreciation | Gross unrealized depreciation | Net unrealized appreciation (depreciation) |
| Fidelity Freedom Income Fund | $2,927,701,104 | $350,882,746 | $(15,073,430) | $335,809,316 |
| Fidelity Freedom 2005 Fund | 949,049,828 | 102,334,547 | (5,830,014) | 96,504,533 |
| Fidelity Freedom 2010 Fund | 4,726,068,847 | 681,512,758 | (30,782,613) | 650,730,145 |
| Fidelity Freedom 2015 Fund | 6,768,985,650 | 1,192,829,091 | (47,164,219) | 1,145,664,872 |
| Fidelity Freedom 2020 Fund | 20,932,952,383 | 3,981,340,457 | (168,288,248) | 3,813,052,209 |
| Fidelity Freedom 2025 Fund | 23,869,221,959 | 4,442,744,506 | (278,631,909) | 4,164,112,597 |
| Fidelity Freedom 2030 Fund | 28,324,195,266 | 5,835,915,699 | (365,276,609) | 5,470,639,090 |
| Fidelity Freedom 2035 Fund | 20,116,566,198 | 4,405,509,842 | (383,138,823) | 4,022,371,019 |
| Fidelity Freedom 2040 Fund | 19,816,962,680 | 4,748,348,472 | (421,747,097) | 4,326,601,375 |
| Fidelity Freedom 2045 Fund | 13,146,672,642 | 2,885,301,854 | (322,455,675) | 2,562,846,179 |
| Fidelity Freedom 2050 Fund | 11,647,646,373 | 2,481,718,602 | (297,699,140) | 2,184,019,462 |
| Fidelity Freedom 2055 Fund | 6,126,778,133 | 926,611,684 | (221,523,540) | 705,088,144 |
| Fidelity Freedom 2060 Fund | 2,137,866,268 | 238,034,790 | (81,428,707) | 156,606,083 |
| Fidelity Freedom 2065 Fund | 89,169,761 | 8,279,749 | (1,982,877) | 6,296,872 |
4. Derivative Instruments.
Risk Exposures and the Use of Derivative Instruments. The Funds' investment objective allows the Funds to enter into various types of derivative contracts, including futures contracts. Derivatives are investments whose value is primarily derived from underlying assets, indices or reference rates and may be transacted on an exchange or over-the-counter (OTC). Derivatives may involve a future commitment to buy or sell a specified asset based on specified terms, to exchange future cash flows at periodic intervals based on a notional principal amount, or for one party to make one or more payments upon the occurrence of specified events in exchange for periodic payments from the other party.
The Funds used derivatives to increase returns and to manage exposure to certain risks as defined below. The success of any strategy involving derivatives depends on analysis of numerous economic factors, and if the strategies for investment do not work as intended, the Funds may not achieve their objectives.
The Funds' use of derivatives increased or decreased their exposure to the following risk:
| Equity Risk | Equity risk relates to the fluctuations in the value of financial instruments as a result of changes in market prices (other than those arising from interest rate risk or foreign exchange risk), whether caused by factors specific to an individual investment, its issuer, or all factors affecting all instruments traded in a market or market segment.
|
The Funds are also exposed to additional risks from investing in derivatives, such as liquidity risk and counterparty credit risk. Liquidity risk is the risk that the Funds will be unable to close out the derivative in the open market in a timely manner. Counterparty credit risk is the risk that the counterparty will not be able to fulfill its obligation to the Funds. Counterparty credit risk related to exchange-traded futures contracts may be mitigated by the protection provided by the exchange on which they trade.
Investing in derivatives may involve greater risks than investing in the underlying assets directly and, to varying degrees, may involve risk of loss in excess of any initial investment and collateral received and amounts recognized in the Statement of Assets and Liabilities. In addition, there may be the risk that the change in value of the derivative contract does not correspond to the change in value of the underlying instrument.
A summary of the value of derivatives by primary risk exposure as of period end is included at the end of the Schedule of Investments.
Futures Contracts. A futures contract is an agreement between two parties to buy or sell a specified underlying instrument for a fixed price at a specified future date. The Funds used futures contracts to manage their exposure to the stock market.
Upon entering into a futures contract, a fund is required to deposit either cash or securities (initial margin) with a clearing broker in an amount equal to a certain percentage of the face value of the contract. Futures contracts are marked-to-market daily and subsequent daily payments (variation margin) are made or received by a fund depending on the daily fluctuations in the value of the futures contracts and are recorded as unrealized appreciation or (depreciation). This receivable and/or payable, if any, is included in daily variation margin on futures contracts in the Statement of Assets and Liabilities. Realized gain or (loss) is recorded upon the expiration or closing of a futures contract. The net realized gain (loss) and change in net unrealized appreciation (depreciation) on futures contracts during the period is presented in the Statement of Operations.
Any open futures contracts at period end are presented in the Schedule of Investments under the caption "Futures Contracts". The notional amount at value reflects each contract's exposure to the underlying instrument or index at period end and is representative of volume of activity during the period. Securities deposited to meet initial margin requirements are identified in the Schedule of Investments.
5. Purchases and Sales of Investments.
Purchases and sales of securities, other than short-term securities, and U.S. government securities, are noted in the table below.
| | Purchases ($) | Sales ($) |
| Fidelity Freedom Income Fund | 279,430,975 | 366,270,023 |
| Fidelity Freedom 2005 Fund | 131,242,194 | 119,976,528 |
| Fidelity Freedom 2010 Fund | 514,363,460 | 732,358,778 |
| Fidelity Freedom 2015 Fund | 828,351,945 | 1,247,748,121 |
| Fidelity Freedom 2020 Fund | 2,618,465,310 | 4,247,662,809 |
| Fidelity Freedom 2025 Fund | 3,092,112,709 | 3,924,537,823 |
| Fidelity Freedom 2030 Fund | 3,677,635,615 | 4,540,106,429 |
| Fidelity Freedom 2035 Fund | 2,462,979,324 | 2,905,937,848 |
| Fidelity Freedom 2040 Fund | 2,121,512,228 | 2,572,970,313 |
| Fidelity Freedom 2045 Fund | 1,508,718,966 | 1,575,823,644 |
| Fidelity Freedom 2050 Fund | 1,422,967,497 | 1,357,237,469 |
| Fidelity Freedom 2055 Fund | 832,579,773 | 671,145,026 |
| Fidelity Freedom 2060 Fund | 414,116,526 | 192,646,741 |
| Fidelity Freedom 2065 Fund | 47,646,285 | 6,012,442 |
6. Fees and Other Transactions with Affiliates.
Management Fee and Expense Contract. Fidelity Management & Research Company LLC (the investment adviser) and its affiliates provide the Funds with investment management related services. Under the management contract, each Class of each Fund pays a monthly management fee that is set at an annual rate by referring to each Fund's target date, indicated by its name, such that the management fee rate applicable to each Class of each Fund is reduced as the fund approaches, and then passes, its target date. In addition, under the management contract, the investment adviser pays all ordinary operating expenses of each Fund, except fees and expenses of the independent Trustees, and certain miscellaneous expenses such as proxy and shareholder meeting expenses. For each Fund, with the exception of Fidelity Freedom 2065 Fund, the management fee is reduced by an amount equal to the fees and expenses paid by each Fund to the independent Trustees. For the reporting period, the total annual management fee rate for each Class of each Fund was as follows:
| | Annual % of Class-Level Average Net Assets (Fidelity Freedom Class) | Annual % of Class-Level Average Net Assets
(Classes K, K6) |
| Fidelity Freedom Income Fund | .465% | .415% |
| Fidelity Freedom 2005 Fund | .465% | .415% |
| Fidelity Freedom 2010 Fund | .508% | .448% |
| Fidelity Freedom 2015 Fund | .550% | .482% |
| Fidelity Freedom 2020 Fund | .593% | .517% |
| Fidelity Freedom 2025 Fund | .635% | .552% |
| Fidelity Freedom 2030 Fund | .678% | .587% |
| Fidelity Freedom 2035 Fund | .720% | .622% |
| Fidelity Freedom 2040 Fund | .746% | .643% |
| Fidelity Freedom 2045 Fund | .746% | .643% |
| Fidelity Freedom 2050 Fund | .746% | .643% |
| Fidelity Freedom 2055 Fund | .746% | .643% |
| Fidelity Freedom 2060 Fund | .746% | .643% |
| Fidelity Freedom 2065 Fund | .746% | .643% |
Under the expense contract, the investment adviser pays class-level expenses for Class K6 of each Fund as necessary so that Class K6 total expenses do not exceed certain amounts of Class K6 average net assets on an annual basis with certain exceptions, as noted in the following table:
| | Annual % of Class-Level Average Net Assets (Class K6) |
| Fidelity Freedom Income Fund | .365% |
| Fidelity Freedom 2005 Fund | .365% |
| Fidelity Freedom 2010 Fund | .384% |
| Fidelity Freedom 2015 Fund | .404% |
| Fidelity Freedom 2020 Fund | .423% |
| Fidelity Freedom 2025 Fund | .443% |
| Fidelity Freedom 2030 Fund | .462% |
| Fidelity Freedom 2035 Fund | .481% |
| Fidelity Freedom 2040 Fund | .493% |
| Fidelity Freedom 2045 Fund | .493% |
| Fidelity Freedom 2050 Fund | .493% |
| Fidelity Freedom 2055 Fund | .493% |
| Fidelity Freedom 2060 Fund | .493% |
| Fidelity Freedom 2065 Fund | .493% |
Interfund Trades. Funds may purchase from or sell securities to other Fidelity Funds under procedures adopted by the Board. The procedures have been designed to ensure these interfund trades are executed in accordance with Rule 17a-7 of the 1940 Act. Interfund trades are included within the respective purchases and sales amounts shown in the Purchases and Sales of Investments note.
7. Expense Reductions.
Through arrangements with each applicable Fund's custodian, credits realized as a result of certain uninvested cash balances were used to reduce each applicable Fund's or class' expenses. All of the applicable expense reductions are noted in the table below.
| | Custodian credits |
| Fidelity Freedom Income Fund | $131 |
| Fidelity Freedom 2005 Fund | 102 |
| Fidelity Freedom 2010 Fund | 69 |
| Fidelity Freedom 2015 Fund | 89 |
| Fidelity Freedom 2020 Fund | 131 |
| Fidelity Freedom 2025 Fund | 21 |
| Fidelity Freedom 2030 Fund | 25 |
| Fidelity Freedom 2035 Fund | 49 |
| Fidelity Freedom 2040 Fund | 39 |
| Fidelity Freedom 2045 Fund | 37 |
| Fidelity Freedom 2050 Fund | 45 |
| Fidelity Freedom 2055 Fund | 65 |
| Fidelity Freedom 2060 Fund | 84 |
8. Distributions to Shareholders.
Distributions to shareholders of each class were as follows:
| | Six months ended
September 30, 2020 | Year ended
March 31, 2020 |
| Fidelity Freedom Income Fund | | |
| Distributions to shareholders | | |
| Fidelity Freedom Income Fund | $33,121,904 | $72,007,586 |
| Class K | 19,132,822 | 43,479,313 |
| Class K6 | 3,793,853 | 7,093,597 |
| Total | $56,048,579 | $122,580,496 |
| Fidelity Freedom 2005 Fund | | |
| Distributions to shareholders | | |
| Fidelity Freedom 2005 Fund | $8,975,746 | $25,491,635 |
| Class K | 5,881,199 | 15,775,254 |
| Class K6 | 1,141,479 | 2,733,589 |
| Total | $15,998,424 | $44,000,478 |
| Fidelity Freedom 2010 Fund | | |
| Distributions to shareholders | | |
| Fidelity Freedom 2010 Fund | $83,871,302 | $211,793,549 |
| Class K | 36,629,504 | 99,095,225 |
| Class K6 | 6,694,468 | 15,289,256 |
| Total | $127,195,274 | $326,178,030 |
| Fidelity Freedom 2015 Fund | | |
| Distributions to shareholders | | |
| Fidelity Freedom 2015 Fund | $131,717,998 | $324,113,832 |
| Class K | 78,933,288 | 207,703,580 |
| Class K6 | 18,033,154 | 39,922,738 |
| Total | $228,684,440 | $571,740,150 |
| Fidelity Freedom 2020 Fund | | |
| Distributions to shareholders | | |
| Fidelity Freedom 2020 Fund | $335,269,246 | $815,401,294 |
| Class K | 308,458,077 | 815,964,865 |
| Class K6 | 67,286,635 | 147,736,621 |
| Total | $711,013,958 | $1,779,102,780 |
| Fidelity Freedom 2025 Fund | | |
| Distributions to shareholders | | |
| Fidelity Freedom 2025 Fund | $262,042,350 | $697,439,181 |
| Class K | 303,300,457 | 836,842,165 |
| Class K6 | 78,824,271 | 185,157,186 |
| Total | $644,167,078 | $1,719,438,532 |
| Fidelity Freedom 2030 Fund | | |
| Distributions to shareholders | | |
| Fidelity Freedom 2030 Fund | $362,047,058 | $923,094,479 |
| Class K | 415,909,316 | 1,123,248,324 |
| Class K6 | 101,427,773 | 229,291,936 |
| Total | $879,384,147 | $2,275,634,739 |
| Fidelity Freedom 2035 Fund | | |
| Distributions to shareholders | | |
| Fidelity Freedom 2035 Fund | $239,069,708 | $596,847,384 |
| Class K | 309,107,127 | 803,187,819 |
| Class K6 | 86,239,401 | 189,690,955 |
| Total | $634,416,236 | $1,589,726,158 |
| Fidelity Freedom 2040 Fund | | |
| Distributions to shareholders | | |
| Fidelity Freedom 2040 Fund | $245,748,506 | $600,503,686 |
| Class K | 317,136,977 | 813,339,526 |
| Class K6 | 82,128,608 | 174,145,784 |
| Total | $645,014,091 | $1,587,988,996 |
| Fidelity Freedom 2045 Fund | | |
| Distributions to shareholders | | |
| Fidelity Freedom 2045 Fund | $124,010,118 | $306,477,247 |
| Class K | 207,935,690 | 534,743,331 |
| Class K6 | 58,982,940 | 126,245,248 |
| Total | $390,928,748 | $967,465,826 |
| Fidelity Freedom 2050 Fund | | |
| Distributions to shareholders | | |
| Fidelity Freedom 2050 Fund | $106,402,996 | $258,697,557 |
| Class K | 186,160,778 | 471,956,025 |
| Class K6 | 47,155,936 | 101,131,805 |
| Total | $339,719,710 | $831,785,387 |
| Fidelity Freedom 2055 Fund | | |
| Distributions to shareholders | | |
| Fidelity Freedom 2055 Fund | $43,959,042 | $104,523,244 |
| Class K | 86,082,879 | 214,235,275 |
| Class K6 | 21,832,459 | 45,948,865 |
| Total | $151,874,380 | $364,707,384 |
| Fidelity Freedom 2060 Fund | | |
| Distributions to shareholders | | |
| Fidelity Freedom 2060 Fund | $12,193,167 | $26,492,028 |
| Class K | 25,545,097 | 56,366,020 |
| Class K6 | 6,428,248 | 12,011,519 |
| Total | $44,166,512 | $94,869,567 |
| Fidelity Freedom 2065 Fund(a) | | |
| Distributions to shareholders | | |
| Fidelity Freedom 2065 Fund | $112,923 | $95,175 |
| Class K | 197,644 | 124,339 |
| Class K6 | 66,276 | 43,006 |
| Total | $376,843 | $262,520 |
(a) For the period June 28, 2019 (commencement of operations) to March 31, 2020.
9. Share Transactions.
Share transactions for each class were as follows and may contain automatic conversions between classes or exchanges between affiliated funds:
| | Shares | Shares | Dollars | Dollars |
| | Six months ended September 30, 2020 | Year endedMarch 31, 2020 | Six months ended September 30, 2020 | Year endedMarch 31, 2020 |
| Fidelity Freedom Income Fund | | | | |
| Fidelity Freedom Income Fund | | | | |
| Shares sold | 12,559,874 | 26,121,699 | $146,962,568 | $303,147,512 |
| Reinvestment of distributions | 2,836,691 | 6,066,578 | 32,368,761 | 70,508,362 |
| Shares redeemed | (16,738,585) | (40,236,864) | (195,245,035) | (463,467,479) |
| Net increase (decrease) | (1,342,020) | (8,048,587) | $(15,913,706) | $(89,811,605) |
| Class K | | | | |
| Shares sold | 11,819,472 | 28,729,451 | $137,909,404 | $331,959,653 |
| Reinvestment of distributions | 1,678,130 | 3,749,746 | 19,131,295 | 43,479,313 |
| Shares redeemed | (17,073,110) | (46,581,593) | (198,593,205) | (538,605,858) |
| Net increase (decrease) | (3,575,508) | (14,102,396) | $(41,552,506) | $(163,166,892) |
| Class K6 | | | | |
| Shares sold | 3,556,475 | 8,831,116 | $41,707,687 | $102,603,019 |
| Reinvestment of distributions | 332,834 | 611,102 | 3,793,853 | 7,093,596 |
| Shares redeemed | (3,362,984) | (6,158,367) | (39,503,156) | (70,913,009) |
| Net increase (decrease) | 526,325 | 3,283,851 | $5,998,384 | $38,783,606 |
| Fidelity Freedom 2005 Fund | | | | |
| Fidelity Freedom 2005 Fund | | | | |
| Shares sold | 3,834,843 | 8,912,259 | $47,426,609 | $109,473,280 |
| Reinvestment of distributions | 742,378 | 2,045,322 | 8,856,559 | 25,171,128 |
| Shares redeemed | (4,103,818) | (11,674,623) | (50,738,661) | (143,427,976) |
| Net increase (decrease) | 473,403 | (717,042) | $5,544,507 | $(8,783,568) |
| Class K | | | | |
| Shares sold | 6,412,858 | 13,255,967 | $78,904,132 | $161,507,060 |
| Reinvestment of distributions | 493,803 | 1,283,723 | 5,881,199 | 15,775,254 |
| Shares redeemed | (6,429,818) | (14,809,527) | (79,087,991) | (180,732,126) |
| Net increase (decrease) | 476,843 | (269,837) | $5,697,340 | $(3,449,812) |
| Class K6 | | | | |
| Shares sold | 1,949,247 | 4,347,669 | $24,033,737 | $53,376,611 |
| Reinvestment of distributions | 96,084 | 222,358 | 1,141,479 | 2,733,589 |
| Shares redeemed | (1,302,663) | (2,107,046) | (15,914,105) | (25,611,844) |
| Net increase (decrease) | 742,668 | 2,462,981 | $9,261,111 | $30,498,356 |
| Fidelity Freedom 2010 Fund | | | | |
| Fidelity Freedom 2010 Fund | | | | |
| Shares sold | 7,826,660 | 20,894,956 | $119,841,634 | $322,067,009 |
| Reinvestment of distributions | 5,605,721 | 13,467,359 | 82,011,710 | 207,961,251 |
| Shares redeemed | (16,140,357) | (47,396,893) | (246,656,948) | (727,176,694) |
| Net increase (decrease) | (2,707,976) | (13,034,578) | $(44,803,604) | $(197,148,434) |
| Class K | | | | |
| Shares sold | 7,337,198 | 17,657,853 | $111,811,360 | $272,197,498 |
| Reinvestment of distributions | 2,507,153 | 6,430,073 | 36,629,504 | 99,095,226 |
| Shares redeemed | (15,195,191) | (48,490,077) | (230,923,457) | (748,211,975) |
| Net increase (decrease) | (5,350,840) | (24,402,151) | $(82,482,593) | $(376,919,251) |
| Class K6 | | | | |
| Shares sold | 2,862,124 | 8,749,864 | $43,986,434 | $135,382,945 |
| Reinvestment of distributions | 459,785 | 992,761 | 6,694,468 | 15,289,256 |
| Shares redeemed | (3,315,108) | (5,642,318) | (51,109,774) | (86,333,102) |
| Net increase (decrease) | 6,801 | 4,100,307 | $(428,872) | $64,339,099 |
| Fidelity Freedom 2015 Fund | | | | |
| Fidelity Freedom 2015 Fund | | | | |
| Shares sold | 16,653,319 | 44,976,552 | $207,090,227 | $571,738,724 |
| Reinvestment of distributions | 10,991,826 | 25,205,665 | 130,033,295 | 320,413,116 |
| Shares redeemed | (35,373,679) | (98,458,775) | (439,904,041) | (1,239,718,173) |
| Net increase (decrease) | (7,728,534) | (28,276,558) | $(102,780,519) | $(347,566,333) |
| Class K | | | | |
| Shares sold | 12,951,415 | 38,083,926 | $160,653,894 | $483,359,504 |
| Reinvestment of distributions | 6,677,943 | 16,367,820 | 78,933,288 | 207,703,581 |
| Shares redeemed | (34,057,333) | (109,548,479) | (421,183,617) | (1,386,895,050) |
| Net increase (decrease) | (14,427,975) | (55,096,733) | $(181,596,435) | $(695,831,965) |
| Class K6 | | | | |
| Shares sold | 8,984,842 | 23,243,423 | $112,067,222 | $296,603,521 |
| Reinvestment of distributions | 1,530,828 | 3,148,572 | 18,033,154 | 39,922,738 |
| Shares redeemed | (7,517,128) | (16,133,607) | (93,948,450) | (203,711,568) |
| Net increase (decrease) | 2,998,542 | 10,258,388 | $36,151,926 | $132,814,691 |
| Fidelity Freedom 2020 Fund | | | | |
| Fidelity Freedom 2020 Fund | | | | |
| Shares sold | 50,527,808 | 139,690,923 | $784,668,765 | $2,216,584,182 |
| Reinvestment of distributions | 22,522,404 | 50,724,965 | 331,079,344 | 806,638,619 |
| Shares redeemed | (95,382,158) | (226,315,748) | (1,485,367,949) | (3,555,625,580) |
| Net increase (decrease) | (22,331,946) | (35,899,860) | $(369,619,840) | $(532,402,779) |
| Class K | | | | |
| Shares sold | 48,133,093 | 132,922,791 | $744,610,860 | $2,101,196,756 |
| Reinvestment of distributions | 20,997,827 | 51,419,484 | 308,458,077 | 815,964,865 |
| Shares redeemed | (116,025,870) | (345,835,663) | (1,795,552,394) | (5,463,952,542) |
| Net increase (decrease) | (46,894,950) | (161,493,388) | $(742,483,457) | $(2,546,790,921) |
| Class K6 | | | | |
| Shares sold | 21,109,962 | 63,944,114 | $329,713,766 | $1,017,603,052 |
| Reinvestment of distributions | 4,592,944 | 9,303,329 | 67,286,635 | 147,736,622 |
| Shares redeemed | (25,193,526) | (41,894,795) | (392,408,363) | (657,395,250) |
| Net increase (decrease) | 509,380 | 31,352,648 | $4,592,038 | $507,944,424 |
| Fidelity Freedom 2025 Fund | | | | |
| Fidelity Freedom 2025 Fund | | | | |
| Shares sold | 64,507,807 | 168,609,148 | $881,900,994 | $2,342,236,834 |
| Reinvestment of distributions | 20,091,576 | 49,663,947 | 259,583,155 | 692,028,162 |
| Shares redeemed | (91,556,564) | (206,991,868) | (1,255,351,633) | (2,840,042,775) |
| Net increase (decrease) | (6,957,181) | 11,281,227 | $(113,867,484) | $194,222,221 |
| Class K | | | | |
| Shares sold | 81,042,627 | 209,650,490 | $1,106,398,423 | $2,907,198,345 |
| Reinvestment of distributions | 23,511,663 | 60,178,720 | 303,300,457 | 836,842,165 |
| Shares redeemed | (135,200,826) | (335,238,445) | (1,839,848,573) | (4,630,919,320) |
| Net increase (decrease) | (30,646,536) | (65,409,235) | $(430,149,693) | $(886,878,810) |
| Class K6 | | | | |
| Shares sold | 35,159,981 | 98,473,970 | $482,950,708 | $1,371,151,544 |
| Reinvestment of distributions | 6,119,897 | 13,293,101 | 78,824,271 | 185,157,186 |
| Shares redeemed | (30,924,242) | (51,551,759) | (425,046,255) | (707,624,891) |
| Net increase (decrease) | 10,355,636 | 60,215,312 | $136,728,724 | $848,683,839 |
| Fidelity Freedom 2030 Fund | | | | |
| Fidelity Freedom 2030 Fund | | | | |
| Shares sold | 55,541,775 | 134,513,465 | $926,727,369 | $2,312,057,494 |
| Reinvestment of distributions | 22,717,378 | 52,952,294 | 358,480,219 | 914,971,406 |
| Shares redeemed | (75,735,355) | (155,274,636) | (1,277,387,601) | (2,638,655,453) |
| Net increase (decrease) | 2,523,798 | 32,191,123 | $7,819,987 | $588,373,447 |
| Class K | | | | |
| Shares sold | 72,215,610 | 176,534,632 | $1,211,740,807 | $3,029,214,168 |
| Reinvestment of distributions | 26,390,186 | 65,114,314 | 415,909,316 | 1,123,248,324 |
| Shares redeemed | (124,271,809) | (294,936,006) | (2,076,188,887) | (5,062,227,218) |
| Net increase (decrease) | (25,666,013) | (53,287,060) | $(448,538,764) | $(909,764,726) |
| Class K6 | | | | |
| Shares sold | 29,272,094 | 84,825,844 | $495,670,002 | $1,468,459,704 |
| Reinvestment of distributions | 6,448,047 | 13,260,008 | 101,427,773 | 229,291,937 |
| Shares redeemed | (24,480,023) | (37,055,380) | (413,287,717) | (629,252,755) |
| Net increase (decrease) | 11,240,118 | 61,030,472 | $183,810,058 | $1,068,498,886 |
| Fidelity Freedom 2035 Fund | | | | |
| Fidelity Freedom 2035 Fund | | | | |
| Shares sold | 47,368,974 | 113,741,577 | $658,462,380 | $1,630,766,349 |
| Reinvestment of distributions | 18,233,461 | 40,976,204 | 237,217,321 | 592,915,749 |
| Shares redeemed | (60,526,163) | (119,576,927) | (847,503,016) | (1,699,632,448) |
| Net increase (decrease) | 5,076,272 | 35,140,854 | $48,176,685 | $524,049,650 |
| Class K | | | | |
| Shares sold | 71,358,465 | 168,867,390 | $992,298,580 | $2,419,916,667 |
| Reinvestment of distributions | 23,795,776 | 55,644,661 | 309,107,127 | 803,187,819 |
| Shares redeemed | (109,601,300) | (244,892,441) | (1,521,673,049) | (3,518,499,555) |
| Net increase (decrease) | (14,447,059) | (20,380,390) | $(220,267,342) | $(295,395,069) |
| Class K6 | | | | |
| Shares sold | 29,447,357 | 83,491,582 | $413,102,617 | $1,205,269,478 |
| Reinvestment of distributions | 6,649,144 | 13,100,559 | 86,239,401 | 189,690,955 |
| Shares redeemed | (25,334,457) | (36,490,371) | (355,439,895) | (518,046,774) |
| Net increase (decrease) | 10,762,044 | 60,101,770 | $143,902,123 | $876,913,659 |
| Fidelity Freedom 2040 Fund | | | | |
| Fidelity Freedom 2040 Fund | | | | |
| Shares sold | 63,081,265 | 148,207,317 | $608,579,459 | $1,480,583,200 |
| Reinvestment of distributions | 26,995,067 | 58,986,229 | 243,225,567 | 594,906,221 |
| Shares redeemed | (81,384,246) | (161,849,253) | (791,678,302) | (1,606,161,212) |
| Net increase (decrease) | 8,692,086 | 45,344,293 | $60,126,724 | $469,328,209 |
| Class K | | | | |
| Shares sold | 94,470,326 | 228,513,475 | $913,358,263 | $2,280,569,001 |
| Reinvestment of distributions | 35,237,442 | 80,764,580 | 317,136,977 | 813,339,526 |
| Shares redeemed | (153,050,759) | (357,963,845) | (1,473,625,705) | (3,601,591,470) |
| Net increase (decrease) | (23,342,991) | (48,685,790) | $(243,130,465) | $(507,682,943) |
| Class K6 | | | | |
| Shares sold | 38,084,159 | 115,285,916 | $372,267,170 | $1,161,910,139 |
| Reinvestment of distributions | 9,155,921 | 17,249,575 | 82,128,608 | 174,145,784 |
| Shares redeemed | (32,098,929) | (48,956,074) | (314,293,923) | (486,362,405) |
| Net increase (decrease) | 15,141,151 | 83,579,417 | $140,101,855 | $849,693,518 |
| Fidelity Freedom 2045 Fund | | | | |
| Fidelity Freedom 2045 Fund | | | | |
| Shares sold | 40,107,965 | 92,834,825 | $442,706,501 | $1,052,711,401 |
| Reinvestment of distributions | 11,976,973 | 26,536,232 | 122,763,971 | 303,790,239 |
| Shares redeemed | (42,706,331) | (85,651,233) | (473,206,864) | (969,131,560) |
| Net increase (decrease) | 9,378,607 | 33,719,824 | $92,263,608 | $387,370,080 |
| Class K | | | | |
| Shares sold | 70,178,516 | 169,535,052 | $771,941,540 | $1,924,827,353 |
| Reinvestment of distributions | 20,306,220 | 46,786,003 | 207,935,690 | 534,743,331 |
| Shares redeemed | (93,966,505) | (218,505,191) | (1,030,670,202) | (2,496,482,111) |
| Net increase (decrease) | (3,481,769) | (2,184,136) | $(50,792,972) | $(36,911,427) |
| Class K6 | | | | |
| Shares sold | 27,824,426 | 83,338,110 | $309,468,604 | $949,921,676 |
| Reinvestment of distributions | 5,776,977 | 11,022,557 | 58,982,940 | 126,245,247 |
| Shares redeemed | (21,668,683) | (33,203,180) | (240,307,860) | (375,039,791) |
| Net increase (decrease) | 11,932,720 | 61,157,487 | $128,143,684 | $701,127,132 |
| Fidelity Freedom 2050 Fund | | | | |
| Fidelity Freedom 2050 Fund | | | | |
| Shares sold | 37,715,340 | 86,803,107 | $418,974,886 | $990,290,176 |
| Reinvestment of distributions | 10,156,990 | 22,134,695 | 104,920,791 | 255,338,403 |
| Shares redeemed | (38,470,003) | (77,352,469) | (429,101,594) | (882,546,280) |
| Net increase (decrease) | 9,402,327 | 31,585,333 | $94,794,083 | $363,082,299 |
| Class K | | | | |
| Shares sold | 70,712,325 | 164,631,759 | $783,227,187 | $1,876,495,556 |
| Reinvestment of distributions | 18,056,332 | 40,989,580 | 186,160,778 | 471,956,025 |
| Shares redeemed | (84,200,172) | (192,383,993) | (933,298,146) | (2,214,961,322) |
| Net increase (decrease) | 4,568,485 | 13,237,346 | $36,089,819 | $133,490,259 |
| Class K6 | | | | |
| Shares sold | 25,619,995 | 69,709,805 | $287,432,646 | $800,271,011 |
| Reinvestment of distributions | 4,578,246 | 8,752,663 | 47,155,936 | 101,131,805 |
| Shares redeemed | (17,587,562) | (26,451,258) | (195,454,492) | (300,989,378) |
| Net increase (decrease) | 12,610,679 | 52,011,210 | $139,134,090 | $600,413,438 |
| Fidelity Freedom 2055 Fund | | | | |
| Fidelity Freedom 2055 Fund | | | | |
| Shares sold | 21,685,907 | 49,395,268 | $274,905,485 | $643,035,222 |
| Reinvestment of distributions | 3,654,676 | 7,798,392 | 43,125,174 | 102,625,840 |
| Shares redeemed | (18,172,750) | (34,001,316) | (231,184,781) | (442,574,631) |
| Net increase (decrease) | 7,167,833 | 23,192,344 | $86,845,878 | $303,086,431 |
| Class K | | | | |
| Shares sold | 42,333,527 | 98,294,050 | $536,263,038 | $1,279,899,187 |
| Reinvestment of distributions | 7,301,347 | 16,294,147 | 86,082,879 | 214,235,276 |
| Shares redeemed | (44,369,548) | (81,781,810) | (563,584,855) | (1,071,944,342) |
| Net increase (decrease) | 5,265,326 | 32,806,387 | $58,761,062 | $422,190,121 |
| Class K6 | | | | |
| Shares sold | 14,814,775 | 35,389,462 | $189,787,659 | $461,897,087 |
| Reinvestment of distributions | 1,854,924 | 3,484,682 | 21,832,459 | 45,948,865 |
| Shares redeemed | (8,716,507) | (12,065,028) | (110,645,780) | (157,096,769) |
| Net increase (decrease) | 7,953,192 | 26,809,116 | $100,974,338 | $350,749,183 |
| Fidelity Freedom 2060 Fund | | | | |
| Fidelity Freedom 2060 Fund | | | | |
| Shares sold | 12,041,804 | 24,715,754 | $138,737,760 | $289,885,103 |
| Reinvestment of distributions | 1,108,939 | 2,154,814 | 11,810,200 | 25,699,575 |
| Shares redeemed | (7,217,694) | (12,415,399) | (82,890,597) | (146,323,853) |
| Net increase (decrease) | 5,933,049 | 14,455,169 | $67,657,363 | $169,260,825 |
| Class K | | | | |
| Shares sold | 25,495,813 | 52,717,569 | $291,577,904 | $617,142,995 |
| Reinvestment of distributions | 2,400,855 | 4,733,025 | 25,545,097 | 56,366,020 |
| Shares redeemed | (16,754,124) | (29,579,858) | (192,639,062) | (350,106,972) |
| Net increase (decrease) | 11,142,544 | 27,870,736 | $124,483,939 | $323,402,043 |
| Class K6 | | | | |
| Shares sold | 7,396,313 | 15,209,903 | $85,529,921 | $178,501,702 |
| Reinvestment of distributions | 604,727 | 1,003,574 | 6,428,248 | 12,011,519 |
| Shares redeemed | (3,523,910) | (4,429,681) | (40,651,206) | (52,024,437) |
| Net increase (decrease) | 4,477,130 | 11,783,796 | $51,306,963 | $138,488,784 |
| Fidelity Freedom 2065 Fund(a) | | | | |
| Fidelity Freedom 2065 Fund | | | | |
| Shares sold | 1,740,003 | 1,748,380 | $17,844,873 | $17,740,722 |
| Reinvestment of distributions | 12,035 | 8,870 | 112,526 | 95,175 |
| Shares redeemed | (510,731) | (192,386) | (5,276,915) | (1,889,544) |
| Net increase (decrease) | 1,241,307 | 1,564,864 | $12,680,484 | $15,946,353 |
| Class K | | | | |
| Shares sold | 3,285,951 | 3,185,241 | $33,082,487 | $31,981,556 |
| Reinvestment of distributions | 21,138 | 11,588 | 197,644 | 124,339 |
| Shares redeemed | (1,189,532) | (804,272) | (12,097,562) | (8,000,885) |
| Net increase (decrease) | 2,117,557 | 2,392,557 | $21,182,569 | $24,105,010 |
| Class K6 | | | | |
| Shares sold | 1,039,153 | 770,120 | $10,372,080 | $7,618,052 |
| Reinvestment of distributions | 7,081 | 4,004 | 66,276 | 43,007 |
| Shares redeemed | (300,177) | (59,599) | (3,037,355) | (544,461) |
| Net increase (decrease) | 746,057 | 714,525 | $7,401,001 | $7,116,598 |
(a) For the period June 28, 2019 (commencement of operations) to March 31, 2020.
10. Other.
The Funds' organizational documents provide former and current trustees and officers with a limited indemnification against liabilities arising in connection with the performance of their duties to the Funds. In the normal course of business, the Funds may also enter into contracts that provide general indemnifications. The Funds' maximum exposure under these arrangements is unknown as this would be dependent on future claims that may be made against the Funds. The risk of material loss from such claims is considered remote.
The Funds do not invest in underlying mutual funds for the purpose of exercising management or control; however, investments by the Funds within their principal investment strategies may represent a significant portion of the underlying mutual funds' net assets. At the end of the period, the following Funds were the owners of record of 10% or more of the total outstanding shares of the following underlying mutual funds.
| | Fidelity Freedom 2020 Fund | Fidelity Freedom 2025 Fund | Fidelity Freedom 2030 Fund | Fidelity Freedom 2035 Fund | Fidelity Freedom 2040 Fund | Fidelity Freedom 2045 Fund |
| Fidelity Series Small Cap Opportunities Fund | – | – | 14% | 12% | 14% | – |
| Fidelity Series Investment Grade Bond Fund | 18% | 19% | 19% | – | – | – |
| Fidelity Series All-Sector Equity Fund | – | 10% | 14% | 13% | 14% | – |
| Fidelity Series Emerging Markets Opportunities Fund | – | 11% | 14% | 12% | 13% | – |
| Fidelity Series Inflation-Protected Bond Index Fund | 13% | 13% | 14% | – | – | – |
| Fidelity Series High Income Fund | 11% | 12% | 14% | 10% | 10% | – |
| Fidelity Series Floating Rate High Income Fund | 11% | 12% | 14% | – | – | – |
| Fidelity Series Real Estate Income Fund | 11% | 12% | 14% | 10% | 10% | – |
| Fidelity Series Commodity Strategy Fund | 11% | 12% | 14% | 10% | 10% | – |
| Fidelity Series International Growth Fund | – | 10% | 14% | 12% | 14% | – |
| Fidelity Series International Value Fund | – | 10% | 14% | 12% | 14% | – |
| Fidelity Series International Small Cap Fund | – | 10% | 14% | 12% | 14% | – |
| Fidelity Series Emerging Markets Debt Fund | 11% | 12% | 14% | – | – | – |
| Fidelity Series Value Discovery Fund | – | – | 14% | 12% | 13% | – |
| Fidelity Series Intrinsic Opportunities Fund | – | 12% | 16% | 14% | 16% | 10% |
| Fidelity Series Large Cap Stock Fund | – | – | 14% | 12% | 14% | – |
| Fidelity Series Opportunistic Insights Fund | – | 10% | 15% | 13% | 14% | – |
| Fidelity Series Stock Selector Large Cap Value Fund | – | 10% | 15% | 13% | 14% | – |
| Fidelity Series Growth Company Fund | – | 11% | 16% | 14% | 17% | 11% |
| Fidelity Series Blue Chip Growth Fund | – | 10% | 14% | 13% | 15% | – |
| Fidelity Series Large Cap Value Index Fund | – | – | 13% | 11% | 13% | – |
| Fidelity Series Small Cap Discovery Fund | – | 11% | 16% | 14% | 16% | 11% |
| Fidelity Series Short-Term Credit Fund | 18% | 12% | – | – | – | – |
| Fidelity Series Government Money Market Fund | 17% | 13% | – | – | – | – |
| Fidelity Series Long-Term Treasury Bond Index Fund | – | – | 11% | – | – | – |
| Fidelity Series International Credit Fund | 18% | 15% | 15% | – | – | – |
| Fidelity Series Canada Fund | – | 10% | 14% | 12% | 14% | – |
| Fidelity Series Emerging Markets Fund | – | 11% | 14% | 12% | 13% | – |
| Fidelity Series Overseas Fund | – | 10% | 14% | 12% | 14% | – |
The Funds, in aggregate, were the owners of record of more than 20% of the total outstanding shares of the following underlying mutual funds.
| Fund | % of shares held |
| Fidelity Series Small Cap Opportunities Fund | 83% |
| Fidelity Series Investment Grade Bond Fund | 78% |
| Fidelity Series All-Sector Equity Fund | 86% |
| Fidelity Series Emerging Markets Opportunities Fund | 84% |
| Fidelity Series Inflation-Protected Bond Index Fund | 67% |
| Fidelity Series High Income Fund | 82% |
| Fidelity Series Floating Rate High Income Fund | 80% |
| Fidelity Series Real Estate Income Fund | 82% |
| Fidelity Series Commodity Strategy Fund | 82% |
| Fidelity Series International Growth Fund | 85% |
| Fidelity Series International Value Fund | 85% |
| Fidelity Series International Small Cap Fund | 85% |
| Fidelity Series Emerging Markets Debt Fund | 81% |
| Fidelity Series Value Discovery Fund | 81% |
| Fidelity Series Intrinsic Opportunities Fund | 97% |
| Fidelity Series Large Cap Stock Fund | 82% |
| Fidelity Series Opportunistic Insights Fund | 86% |
| Fidelity Series Stock Selector Large Cap Value Fund | 87% |
| Fidelity Series Growth Company Fund | 97% |
| Fidelity Series Blue Chip Growth Fund | 87% |
| Fidelity Series Large Cap Value Index Fund | 77% |
| Fidelity Series Small Cap Discovery Fund | 97% |
| Fidelity Series Short-Term Credit Fund | 63% |
| Fidelity Series Government Money Market Fund | 65% |
| Fidelity Series Long-Term Treasury Bond Index Fund | 61% |
| Fidelity Series International Credit Fund | 91% |
| Fidelity Series Canada Fund | 85% |
| Fidelity Series Emerging Markets Fund | 84% |
| Fidelity Series Overseas Fund | 85% |
11. Coronavirus (COVID-19) Pandemic.
An outbreak of COVID-19 first detected in China during December 2019 has since spread globally and was declared a pandemic by the World Health Organization during March 2020. Developments that disrupt global economies and financial markets, such as the COVID-19 pandemic, may magnify factors that affect the Funds' performance.
Shareholder Expense Example
As a shareholder, you incur two types of costs: (1) transaction costs, which may include sales charges (loads) on purchase payments or redemption proceeds, as applicable and (2) ongoing costs, which generally include management fees, distribution and/or service (12b-1) fees and other Fund expenses. This Example is intended to help you understand your ongoing costs (in dollars) of investing in a fund and to compare these costs with the ongoing costs of investing in other mutual funds.
The Example is based on an investment of $1,000 invested at the beginning of the period and held for the entire period (April 1, 2020 to September 30, 2020).
Actual Expenses
The first line of the accompanying table provides information about actual account values and actual expenses. You may use the information in this line, together with the amount you invested, to estimate the expenses that you paid over the period. Simply divide your account value by $1,000.00 (for example, an $8,600 account value divided by $1,000.00 = 8.6), then multiply the result by the number in the first line for a class/Fund under the heading entitled "Expenses Paid During Period" to estimate the expenses you paid on your account during this period. If any fund is a shareholder of any underlying mutual funds or exchange-traded funds (ETFs) (the Underlying Funds), such fund indirectly bears its proportional share of the expenses of the Underlying Funds in addition to the direct expenses incurred presented in the table. These fees and expenses are not included in the annualized expense ratio used to calculate the expense estimate in the table below.
Hypothetical Example for Comparison Purposes
The second line of the accompanying table provides information about hypothetical account values and hypothetical expenses based on the actual expense ratio and an assumed rate of return of 5% per year before expenses, which is not the actual return. The hypothetical account values and expenses may not be used to estimate the actual ending account balance or expenses you paid for the period. You may use this information to compare the ongoing costs of investing in the Fund and other funds. To do so, compare this 5% hypothetical example with the 5% hypothetical examples that appear in the shareholder reports of the other funds. If any fund is a shareholder of any Underlying Funds, such fund indirectly bears its proportional share of the expenses of the Underlying Funds in addition to the direct expenses as presented in the table. These fees and expenses are not included in the annualized expense ratio used to calculate the expense estimate in the table below.
Please note that the expenses shown in the table are meant to highlight your ongoing costs only and do not reflect any transaction costs. Therefore, the second line of the table is useful in comparing ongoing costs only, and will not help you determine the relative total costs of owning different funds.
| | Annualized Expense Ratio-A | Beginning
Account Value
April 1, 2020 | Ending
Account Value
September 30, 2020 | Expenses Paid
During Period-B
April 1, 2020
to September 30, 2020 |
| Fidelity Freedom Income Fund | | | | |
| Fidelity Freedom Income Fund | .47% | | | |
| Actual | | $1,000.00 | $1,093.60 | $2.47 |
| Hypothetical-C | | $1,000.00 | $1,022.71 | $2.38 |
| Class K | .42% | | | |
| Actual | | $1,000.00 | $1,094.20 | $2.20 |
| Hypothetical-C | | $1,000.00 | $1,022.96 | $2.13 |
| Class K6 | .37% | | | |
| Actual | | $1,000.00 | $1,093.50 | $1.94 |
| Hypothetical-C | | $1,000.00 | $1,023.21 | $1.88 |
| Fidelity Freedom 2005 Fund | | | | |
| Fidelity Freedom 2005 Fund | .46% | | | |
| Actual | | $1,000.00 | $1,109.70 | $2.43 |
| Hypothetical-C | | $1,000.00 | $1,022.76 | $2.33 |
| Class K | .41% | | | |
| Actual | | $1,000.00 | $1,110.20 | $2.17 |
| Hypothetical-C | | $1,000.00 | $1,023.01 | $2.08 |
| Class K6 | .36% | | | |
| Actual | | $1,000.00 | $1,110.50 | $1.90 |
| Hypothetical-C | | $1,000.00 | $1,023.26 | $1.83 |
| Fidelity Freedom 2010 Fund | | | | |
| Fidelity Freedom 2010 Fund | .51% | | | |
| Actual | | $1,000.00 | $1,134.10 | $2.73 |
| Hypothetical-C | | $1,000.00 | $1,022.51 | $2.59 |
| Class K | .45% | | | |
| Actual | | $1,000.00 | $1,134.40 | $2.41 |
| Hypothetical-C | | $1,000.00 | $1,022.81 | $2.28 |
| Class K6 | .38% | | | |
| Actual | | $1,000.00 | $1,135.20 | $2.03 |
| Hypothetical-C | | $1,000.00 | $1,023.16 | $1.93 |
| Fidelity Freedom 2015 Fund | | | | |
| Fidelity Freedom 2015 Fund | .55% | | | |
| Actual | | $1,000.00 | $1,159.90 | $2.98 |
| Hypothetical-C | | $1,000.00 | $1,022.31 | $2.79 |
| Class K | .48% | | | |
| Actual | | $1,000.00 | $1,159.30 | $2.60 |
| Hypothetical-C | | $1,000.00 | $1,022.66 | $2.43 |
| Class K6 | .40% | | | |
| Actual | | $1,000.00 | $1,160.20 | $2.17 |
| Hypothetical-C | | $1,000.00 | $1,023.06 | $2.03 |
| Fidelity Freedom 2020 Fund | | | | |
| Fidelity Freedom 2020 Fund | .59% | | | |
| Actual | | $1,000.00 | $1,182.50 | $3.23 |
| Hypothetical-C | | $1,000.00 | $1,022.11 | $2.99 |
| Class K | .52% | | | |
| Actual | | $1,000.00 | $1,182.90 | $2.85 |
| Hypothetical-C | | $1,000.00 | $1,022.46 | $2.64 |
| Class K6 | .42% | | | |
| Actual | | $1,000.00 | $1,183.70 | $2.30 |
| Hypothetical-C | | $1,000.00 | $1,022.96 | $2.13 |
| Fidelity Freedom 2025 Fund | | | | |
| Fidelity Freedom 2025 Fund | .63% | | | |
| Actual | | $1,000.00 | $1,200.70 | $3.48 |
| Hypothetical-C | | $1,000.00 | $1,021.91 | $3.19 |
| Class K | .55% | | | |
| Actual | | $1,000.00 | $1,201.30 | $3.04 |
| Hypothetical-C | | $1,000.00 | $1,022.31 | $2.79 |
| Class K6 | .44% | | | |
| Actual | | $1,000.00 | $1,202.10 | $2.43 |
| Hypothetical-C | | $1,000.00 | $1,022.86 | $2.23 |
| Fidelity Freedom 2030 Fund | | | | |
| Fidelity Freedom 2030 Fund | .68% | | | |
| Actual | | $1,000.00 | $1,227.20 | $3.80 |
| Hypothetical-C | | $1,000.00 | $1,021.66 | $3.45 |
| Class K | .59% | | | |
| Actual | | $1,000.00 | $1,227.00 | $3.29 |
| Hypothetical-C | | $1,000.00 | $1,022.11 | $2.99 |
| Class K6 | .46% | | | |
| Actual | | $1,000.00 | $1,227.90 | $2.57 |
| Hypothetical-C | | $1,000.00 | $1,022.76 | $2.33 |
| Fidelity Freedom 2035 Fund | | | | |
| Fidelity Freedom 2035 Fund | .72% | | | |
| Actual | | $1,000.00 | $1,264.90 | $4.09 |
| Hypothetical-C | | $1,000.00 | $1,021.46 | $3.65 |
| Class K | .62% | | | |
| Actual | | $1,000.00 | $1,265.60 | $3.52 |
| Hypothetical-C | | $1,000.00 | $1,021.96 | $3.14 |
| Class K6 | .48% | | | |
| Actual | | $1,000.00 | $1,267.40 | $2.73 |
| Hypothetical-C | | $1,000.00 | $1,022.66 | $2.43 |
| Fidelity Freedom 2040 Fund | | | | |
| Fidelity Freedom 2040 Fund | .75% | | | |
| Actual | | $1,000.00 | $1,285.20 | $4.30 |
| Hypothetical-C | | $1,000.00 | $1,021.31 | $3.80 |
| Class K | .64% | | | |
| Actual | | $1,000.00 | $1,287.00 | $3.67 |
| Hypothetical-C | | $1,000.00 | $1,021.86 | $3.24 |
| Class K6 | .49% | | | |
| Actual | | $1,000.00 | $1,287.20 | $2.81 |
| Hypothetical-C | | $1,000.00 | $1,022.61 | $2.48 |
| Fidelity Freedom 2045 Fund | | | | |
| Fidelity Freedom 2045 Fund | .75% | | | |
| Actual | | $1,000.00 | $1,285.90 | $4.30 |
| Hypothetical-C | | $1,000.00 | $1,021.31 | $3.80 |
| Class K | .64% | | | |
| Actual | | $1,000.00 | $1,286.60 | $3.67 |
| Hypothetical-C | | $1,000.00 | $1,021.86 | $3.24 |
| Class K6 | .49% | | | |
| Actual | | $1,000.00 | $1,286.90 | $2.81 |
| Hypothetical-C | | $1,000.00 | $1,022.61 | $2.48 |
| Fidelity Freedom 2050 Fund | | | | |
| Fidelity Freedom 2050 Fund | .75% | | | |
| Actual | | $1,000.00 | $1,286.30 | $4.30 |
| Hypothetical-C | | $1,000.00 | $1,021.31 | $3.80 |
| Class K | .64% | | | |
| Actual | | $1,000.00 | $1,285.50 | $3.67 |
| Hypothetical-C | | $1,000.00 | $1,021.86 | $3.24 |
| Class K6 | .49% | | | |
| Actual | | $1,000.00 | $1,287.20 | $2.81 |
| Hypothetical-C | | $1,000.00 | $1,022.61 | $2.48 |
| Fidelity Freedom 2055 Fund | | | | |
| Fidelity Freedom 2055 Fund | .75% | | | |
| Actual | | $1,000.00 | $1,286.60 | $4.30 |
| Hypothetical-C | | $1,000.00 | $1,021.31 | $3.80 |
| Class K | .64% | | | |
| Actual | | $1,000.00 | $1,285.70 | $3.67 |
| Hypothetical-C | | $1,000.00 | $1,021.86 | $3.24 |
| Class K6 | .49% | | | |
| Actual | | $1,000.00 | $1,287.20 | $2.81 |
| Hypothetical-C | | $1,000.00 | $1,022.61 | $2.48 |
| Fidelity Freedom 2060 Fund | | | | |
| Fidelity Freedom 2060 Fund | .75% | | | |
| Actual | | $1,000.00 | $1,284.90 | $4.30 |
| Hypothetical-C | | $1,000.00 | $1,021.31 | $3.80 |
| Class K | .64% | | | |
| Actual | | $1,000.00 | $1,286.60 | $3.67 |
| Hypothetical-C | | $1,000.00 | $1,021.86 | $3.24 |
| Class K6 | .49% | | | |
| Actual | | $1,000.00 | $1,287.40 | $2.81 |
| Hypothetical-C | | $1,000.00 | $1,022.61 | $2.48 |
| Fidelity Freedom 2065 Fund | | | | |
| Fidelity Freedom 2065 Fund | .75% | | | |
| Actual | | $1,000.00 | $1,284.30 | $4.29 |
| Hypothetical-C | | $1,000.00 | $1,021.31 | $3.80 |
| Class K | .64% | | | |
| Actual | | $1,000.00 | $1,285.90 | $3.67 |
| Hypothetical-C | | $1,000.00 | $1,021.86 | $3.24 |
| Class K6 | .49% | | | |
| Actual | | $1,000.00 | $1,285.90 | $2.81 |
| Hypothetical-C | | $1,000.00 | $1,022.61 | $2.48 |
A Annualized expense ratio reflects expenses net of applicable fee waivers.
B Expenses are equal to the annualized expense ratio, multiplied by the average account value over the period, multiplied by 183/ 365 (to reflect the one-half year period). The fees and expenses of any Underlying Funds are not included in each annualized expense ratio.
C 5% return per year before expenses
Board Approval of Investment Advisory Contracts and Management Fees
Fidelity Freedom Funds
Each year, the Board of Trustees, including the Independent Trustees (together, the Board), votes on the renewal of the management contract with Fidelity Management & Research Company LLC (FMR) (the Advisory Contract) for each fund. The Board, assisted by the advice of fund counsel and Independent Trustees' counsel, requests and considers a broad range of information relevant to the renewal of the Advisory Contracts throughout the year.
The Board meets regularly and, at each of its meetings, covers an extensive agenda of topics and materials and considers factors that are relevant to its annual consideration of the renewal of each fund's Advisory Contract, including the services and support provided to each fund and its shareholders. The Board has established four standing committees (Committees) — Operations, Audit, Fair Valuation, and Governance and Nominating — each composed of and chaired by Independent Trustees with varying backgrounds, to which the Board has assigned specific subject matter responsibilities in order to enhance effective decision-making by the Board. The Operations Committee, of which all of the Independent Trustees are members, meets regularly throughout the year and considers, among other matters, information specifically related to the annual consideration of the renewal of each fund's Advisory Contract. The Board, acting directly and through its Committees, requests and receives information concerning the annual consideration of the renewal of each fund's Advisory Contract. The Board also meets as needed to review matters specifically related to the Board's annual consideration of the renewal of the Advisory Contracts. Members of the Board may also meet with trustees of other Fidelity funds through joint ad hoc committees to discuss certain matters relevant to all of the Fidelity funds.
At its September 2020 meeting, the Board unanimously determined to renew each fund's Advisory Contract. In reaching its determination, the Board considered all factors it believed relevant, including (i) the nature, extent, and quality of the services provided to each fund and its shareholders (including the investment performance of each fund); (ii) the competitiveness of each fund's management fee and total expense ratio relative to peer funds; (iii) the total costs of the services provided by and the profits realized by Fidelity from its relationships with each fund; and (iv) the extent to which, if any, economies of scale exist and are realized as each fund grows, and whether any economies of scale are appropriately shared with fund shareholders. The Board also considered that each fund pays an all-inclusive management fee that covers all operating expenses of the fund, subject to certain exceptions, and varies by class (unified fee) and the underlying Fidelity funds in which the fund invests (Series Funds) do not pay expenses, with certain limited exceptions. The Board and the board of other funds that invest their assets in Series Funds and the boards of the Series Funds previously formed a joint ad hoc committee to review the responsibilities of each board related to the consideration of the renewal of the Advisory Contracts for the funds, other funds that invest substantially all of their assets in Series Funds, and the Series Funds. The Board's deliberations were informed by the conclusions of such committee.
In considering whether to renew the Advisory Contract for each fund, the Board reached a determination, with the assistance of fund counsel and Independent Trustees' counsel and through the exercise of its business judgment, that the renewal of the Advisory Contract was in the best interests of each fund and its shareholders and that the compensation payable under the Advisory Contracts was fair and reasonable. The Board's decision to renew the Advisory Contracts was not based on any single factor, but rather was based on a comprehensive consideration of all the information provided to the Board at its meetings throughout the year. The Board, in reaching its determination to renew the Advisory Contracts, was aware that shareholders of each fund have a broad range of investment choices available to them, including a wide choice among funds offered by Fidelity's competitors, and that each fund's shareholders, who have the opportunity to review and weigh the disclosure provided by the fund in its prospectus and other public disclosures, have chosen to invest in that fund, which is part of the Fidelity family of funds.
Nature, Extent, and Quality of Services Provided. The Board considered Fidelity's staffing as it relates to the funds, including the backgrounds of investment personnel of FMR, and also considered the funds' investment objectives, strategies, and related investment philosophies. The Independent Trustees also had discussions with senior management of Fidelity's investment operations and investment groups with responsibility for the Series Funds. The Board considered the structure of the investment personnel compensation program and whether this structure provides appropriate incentives to act in the best interests of each fund. Additionally, the Board considered the portfolio managers' investments, if any, in the funds that they manage.
Resources Dedicated to Investment Management and Support Services. The Board reviewed the general qualifications and capabilities of Fidelity's investment staff, including its size, education, experience, and resources, as well as Fidelity's approach to recruiting, managing, and compensating investment personnel. The Board noted that Fidelity has continued to increase the resources devoted to non-U.S. offices, including expansion of Fidelity's global investment organization. The Board also noted that Fidelity's analysts have extensive resources, tools and capabilities that allow them to conduct sophisticated quantitative and fundamental analysis, as well as credit analysis of issuers, counterparties and guarantors. Further, the Board considered that Fidelity's investment professionals have sufficient access to global information and data so as to provide competitive investment results over time, and that those professionals also have access to sophisticated tools that permit them to assess portfolio construction and risk and performance attribution characteristics continuously, as well as to transmit new information and research conclusions rapidly around the world. Additionally, in its deliberations, the Board considered Fidelity's risk management, compliance, and technology and operations capabilities and resources, which are integral parts of the investment management process. The Board also considered Fidelity's investments in business continuity planning, and its success in continuously providing services to the funds notwithstanding the severe disruptions caused by the COVID-19 pandemic.
Shareholder and Administrative Services. The Board considered (i) the nature, extent, quality, and cost of advisory, administrative, and shareholder services performed by Fidelity under the Advisory Contract and under separate agreements covering transfer agency and pricing and bookkeeping services for each fund; (ii) the nature and extent of the supervision of third party service providers, principally custodians, subcustodians, and pricing vendors; and (iii) the resources devoted to, and the record of compliance with, each fund's compliance policies and procedures.
The Board noted that the growth of fund assets over time across the complex allows Fidelity to reinvest in the development of services designed to enhance the value and convenience of the Fidelity funds as investment vehicles. These services include 24-hour access to account information and market information over the Internet and through telephone representatives, investor education materials and asset allocation tools, and the expanded availability of Fidelity Investor Centers.
Investment in a Large Fund Family. The Board considered the benefits to shareholders of investing in a Fidelity fund, including the benefits of investing in a fund that is part of a large family of funds offering a variety of investment disciplines and providing a large variety of mutual fund investor services. The Board noted that Fidelity had taken, or had made recommendations that resulted in the Fidelity funds taking, a number of actions over the previous year that benefited particular funds, including: (i) continuing to dedicate additional resources to Fidelity's investment research process, which includes meetings with management of issuers of securities in which the funds invest, and to the support of the senior management team that oversees asset management; (ii) continuing efforts to enhance Fidelity's global research capabilities; (iii) launching new funds and ETFs with innovative structures, strategies and pricing and making other enhancements to meet client needs; (iv) launching new share classes of existing funds; (v) eliminating purchase minimums and broadening eligibility requirements for certain funds and share classes; (vi) reducing management fees and total expenses for certain target date funds or classes and index funds; (vii) lowering expenses for certain funds and classes by implementing or lowering expense caps; (viii) rationalizing product lines and gaining increased efficiencies from fund mergers, liquidations, and share class consolidations; (ix) continuing to develop, acquire and implement systems and technology to improve services to the funds and shareholders, strengthen information security, and increase efficiency; and (x) continuing to implement enhancements to further strengthen Fidelity's product line to increase investors' probability of success in achieving their investment goals, including retirement income goals.
Investment Performance (for each fund except Freedom 2065 Fund). The Board considered whether each fund has operated in accordance with its investment objective, as well as its record of compliance with its investment restrictions and its performance history.
The Board took into account discussions that occur at Board meetings throughout the year with representatives of the investment adviser about fund investment performance. In this regard the Board noted that as part of regularly scheduled fund reviews and other reports to the Board on fund performance, the Board considers annualized return information for each fund for different time periods, measured against one or more appropriate securities market indices, including a customized blended index that reflects the respective weights of the fund's asset classes (each a benchmark index). In its evaluation of fund investment performance at meetings throughout the year, the Board gave particular attention to information indicating underperformance of certain Fidelity funds for specific time periods and discussed with the investment adviser the reasons for such underperformance. For Freedom 2005 Fund, Freedom 2025 Fund, Freedom 2035 Fund, Freedom 2040 Fund, Freedom 2045 Fund, Freedom 2055 Fund, and Freedom Income Fund, each fund underperformed its benchmark and peers for the one- and three-year periods ended May 31, 2020, for Freedom 2060 Fund, the fund underperformed its benchmark for the one- and three-year periods ended January 31, 2020, and for Freedom 2050 Fund, the fund underperformed its benchmark for the one- and three-year periods ended September 30, 2019, and as a result, the Board continues to engage in discussions with FMR about the steps it is taking to address the fund's performance.
In addition to reviewing absolute and relative fund performance, the Independent Trustees periodically consider the appropriateness of fund performance metrics in evaluating the results achieved. In general, the Independent Trustees believe that fund performance should be evaluated based on gross performance (before fees and expenses, including acquired fund fees and expenses, but after transaction costs, if any) compared to appropriate benchmark indices, over appropriate time periods that may include full market cycles, taking into account relevant factors including the following: general market conditions; the extent to which particular underlying funds affected performance; and fund cash flows and other factors. The Independent Trustees generally give greater weight to fund performance over longer time periods than over shorter time periods. Depending on the circumstances, the Independent Trustees may be satisfied with a fund's performance notwithstanding that it lags its benchmark index for certain periods.
The Independent Trustees recognize that shareholders evaluate performance on a net basis over their own holding periods, for which one-, three-, and five-year periods are often used as a proxy. For this reason, the performance information reviewed by the Board also included net cumulative calendar year total return information for each fund and an appropriate benchmark index for the most recent one-, three-, and five-year periods. Due to the characteristics of the funds, no peer group performance information was considered by the Board. The Independent Trustees recognize that shareholders who are not investing through a tax-advantaged retirement account also consider tax consequences in evaluating performance.
Investment Performance (for Freedom 2065 Fund). The Board considered whether the fund has operated in accordance with its investment objective, as well as its record of compliance with its investment restrictions. As the fund recently commenced operations, the Board did not believe that it was appropriate to assign significant weight to its limited investment performance.
Based on its review, the Board concluded that the nature, extent, and quality of services provided to each fund under the Advisory Contracts should continue to benefit the shareholders of each fund.
Competitiveness of Management Fee and Total Expense Ratio. The Board considered each fund's management fee and total expense ratio compared to "mapped groups" of competitive funds and classes created for the purpose of facilitating the Trustees' competitive analysis of management fees and total expenses. Fidelity creates "mapped groups" by combining similar Lipper investment objective categories that have comparable investment mandates. Combining Lipper investment objective categories aids the Board's management fee and total expense ratio comparisons by broadening the competitive group used for comparison.
Management Fee. The Board considered two proprietary management fee comparisons. The group of Lipper funds used by the Board for management fee comparisons is referred to as the "Total Mapped Group." The Total Mapped Group comparison focuses on a fund's standing in terms of gross management fees before expense reimbursements or caps relative to the total universe of funds with comparable investment mandates, regardless of whether their management fee structures also are comparable. Funds with comparable investment mandates offer exposure to similar types of securities. Funds with comparable management fee structures have similar management fee contractual arrangements (e.g., flat rate charged for advisory services, all-inclusive fee rate, etc.). The "Asset-Sized Peer Group" (ASPG) comparison focuses on a fund's standing relative to a subset of non-Fidelity funds within the Total Mapped Group that are similar in size and management fee structure. For example, if a fund is in the first quartile of the ASPG, the fund's management fee ranks in the least expensive or lowest 25% of funds in the ASPG. The ASPG represents at least 15% of the funds in the Total Mapped Group with comparable asset size and management fee structures, subject to a minimum of 50 funds (or all funds in the Total Mapped Group if fewer than 50). Additional information, such as the ASPG quartile in which a fund's management fee rate ranked, also was considered by the Board.
The Board compared each fund's class-level management fee rate for the current fiscal year relative to the median of its competitor funds in the applicable Total Mapped Group based on competitive data for 2019. The Board noted that each fund's class-level management fee rate ranks above the median of its competitor funds in the applicable Total Mapped Group based on competitive data for 2019. The Board noted that each fund's unified fee arrangement covers non-management expenses and that the fee structures of the majority of peer funds do not include top-level management fees, similar to the fee structure in place for each fund prior to June 1, 2017. The Board also noted that the primary comparisons for the funds are against active and passive competitor target date funds. The Board also noted that the funds' total expense comparisons, which include the expenses of the Series Funds, facilitate better comparisons with funds and classes that use different expense structures and that, when compared to the total expenses of their load-type competitors, including acquired fund fees and expenses, all classes of the funds rank below their respective load types.
Based on its review, the Board concluded that each fund's management fee is fair and reasonable in light of the services that the fund receives and the other factors considered.
Total Expense Ratio. In its review of the total expense ratio of each class of each fund, the Board considered the fund's class-level management fee rate under the Advisory Contract. The Board also considered other expenses, such as transfer agent fees, pricing and bookkeeping fees, and custodial, legal, and audit fees, paid by FMR under the unified fee arrangement. The Board also noted that Fidelity may agree to waive fees or reimburse expenses from time to time, and the extent to which, if any, it has done so for each fund. As part of its review, the Board considered the total expense ratio of each class of each fund compared to the median total expenses for competitor funds (including expenses of underlying funds) based on competitive data for 2019. Each class of each fund is compared to those funds and classes in the Total Mapped Group (used by the Board for management fee comparisons) that have a similar sales load structure.
The Board noted that each fund offers multiple classes and that the multiple structures are intended to offer pricing options for the intermediary market. The Board also noted that the total expense ratios of the classes of each fund vary primarily due to differences in transfer agent fees. The Board considered that, in general, various factors can affect total expense ratios.
The Board noted that the total expense ratio of the retail class (including expenses of the Series Funds): (i) ranked below the competitive median for 2019 for Freedom 2005 Fund, Freedom 2010 Fund, Freedom 2015 Fund, Freedom 2030 Fund, Freedom 2035 Fund, and Freedom Income Fund; (ii) ranked equal to the competitive median for 2019 for Freedom 2020 Fund; and (iii) ranked above the competitive median for 2019 for Freedom 2025 Fund, Freedom 2040 Fund, Freedom 2045 Fund, Freedom 2050 Fund, Freedom 2055 Fund, Freedom 2060 Fund, and Freedom 2065 Fund. The Board noted that, for each fund for which the total expense ratio of the retail class was above the competitive median, the class was above the competitive median because a number of competitor target date funds are classified by Lipper as active, even though their underlying holdings are primarily passive. The Board considered that, when the Total Mapped Group is adjusted to remove funds that invest primarily in passive products, the total expense ratio of the retail class of each such fund is equal to or below median.
The Board noted that the total expense ratio of Class K (including expenses of the Series Funds): (i) ranked below the competitive median for 2019 for Freedom 2005 Fund, Freedom 2010 Fund, Freedom 2015 Fund, Freedom 2020 Fund, and Freedom Income Fund; and (ii) ranked above the competitive median for 2019 for Freedom 2025 Fund, Freedom 2030 Fund, Freedom 2035 Fund, Freedom 2040 Fund, Freedom 2045 Fund, Freedom 2050 Fund, Freedom 2055 Fund, Freedom 2060 Fund, and Freedom 2065 Fund. The Board noted that, for each fund for which the total expense ratio of Class K was above the competitive median, the class was above the competitive median because a number of competitor target date funds are classified by Lipper as active, even though their underlying holdings are primarily passive. The Board considered that, when the Total Mapped Group is adjusted to remove funds that invest primarily in passive products, the total expense ratio of each such fund is equal to or below median.
The Board noted that the total expense ratio of Class K6 (including expenses of the Series Funds) of each fund ranked below the competitive median for 2019.
The Board considered that current contractual arrangements for the fund oblige FMR to pay all "class-level" expenses of Class K6 of each fund to the extent necessary to limit total operating expenses, with certain exceptions, to an amount specified in the applicable expense contract. These contractual arrangements may not be amended to increase the fees or expenses payable by Class K6 of a fund except by a vote of a majority of the Board of Trustees and by a vote of a majority of the outstanding voting securities of Class K6 of the applicable fund.
In considering the total expense ratio of Class K of Fidelity Freedom 2030 Fund, the Board also considered an alternative ASPG competitive analysis that focused on competitors most similar in size to the class. The Board noted that the alternative analysis excluded performance fees and 12b-1 fees from the competitive comparisons. The Board noted that, under this alternative competitive analysis, the total expense ratio of Class K of Fidelity Freedom 2030 Fund ranked above the competitive median for 2019. The Board noted that direct comparisons of the Fidelity Freedom Funds were difficult given the wide dispersion in strategic and active allocation among competitors and that lower-priced competitors in Class K's ASPG generally have lower fees due to lower equity and/or international allocations.
Fees Charged to Other Fidelity Clients. The Board also considered Fidelity fee structures and other information with respect to clients of Fidelity, such as other funds advised or subadvised by Fidelity, pension plan clients, and other institutional clients with similar mandates. The Board noted that a joint ad hoc committee created by it and the boards of other Fidelity funds periodically reviews and compares Fidelity's institutional investment advisory business with its business of providing services to the Fidelity funds and also noted the most recent findings of the committee. The Board noted that the committee's review included a consideration of the differences in services provided, fees charged, and costs incurred, as well as competition in the markets serving the different categories of clients.
Based on its review of total expense ratios and fees charged to other Fidelity clients, the Board concluded that the total expense ratio of each class of each fund was reasonable in light of the services that the fund and its shareholders receive and the other factors considered.
Costs of the Services and Profitability. The Board considered the revenues earned and the expenses incurred by Fidelity in conducting the business of developing, marketing, distributing, managing, administering and servicing each fund and the Series Funds in which each fund invests and in servicing each fund's shareholders. The Board also considered the level of Fidelity's profits in respect of all the Fidelity funds.
On an annual basis, Fidelity presents to the Board information about the profitability of its relationships with each fund. Fidelity calculates profitability information for each fund, as well as aggregate profitability information for groups of Fidelity funds and all Fidelity funds, using a series of detailed revenue and cost allocation methodologies which originate with the books and records of Fidelity on which Fidelity's audited financial statements are based. The Audit Committee of the Board reviews any significant changes from the prior year's methodologies and the full Board approves such changes.
A public accounting firm has been engaged annually by the Board as part of the Board's assessment of Fidelity's profitability analysis. The engagement includes the review and assessment of the methodologies used by Fidelity in determining the revenues and expenses attributable to Fidelity's mutual fund business, and completion of agreed-upon procedures in respect of the mathematical accuracy of certain fund profitability information and its conformity to established allocation methodologies. After considering the reports issued under the engagement and information provided by Fidelity, the Board concluded that while other allocation methods may also be reasonable, Fidelity's profitability methodologies are reasonable in all material respects.
The Board also reviewed Fidelity's non-fund businesses and potential indirect benefits such businesses may have received as a result of their association with Fidelity's mutual fund business (i.e., fall-out benefits) as well as cases where Fidelity's affiliates may benefit from the funds' business. The Board considered areas where potential indirect benefits to the Fidelity funds from their relationships with Fidelity may exist. The Board also considered that in 2019 a joint ad hoc committee created by it and the boards of other Fidelity funds evaluated potential fall-out benefits (PFOB Committee). The Board noted that it considered the PFOB Committee's findings in connection with its consideration of the renewal of the Advisory Contracts.
The Board considered the costs of the services provided by and the profits realized by Fidelity in connection with the operation of each fund, including the conclusions of the PFOB Committee, and was satisfied that the profitability was not excessive.
Economies of Scale. The Board considered whether there have been economies of scale in respect of the management of the Fidelity funds, whether the Fidelity funds (including each fund) have appropriately benefited from any such economies of scale, and whether there is potential for realization of any further economies of scale. The Board considered the extent to which each fund will benefit from economies of scale as assets grow through increased services to the fund, through waivers or reimbursements, or through fee or expense ratio reductions. The Board recognized that, due to each fund's current contractual arrangements, its expense ratio will not decline if the fund's operating costs decrease as assets grow, or rise as assets decrease. The Board also noted that a committee (the Economies of Scale Committee) created by it and the boards of other Fidelity funds periodically analyzes whether Fidelity attains economies of scale in respect of the management and servicing of the Fidelity funds, whether the Fidelity funds have appropriately benefited from such economies of scale, and whether there is potential for realization of any further economies of scale.
The Board concluded, taking into account the analysis of the Economies of Scale Committee, that economies of scale, if any, are being appropriately shared between fund shareholders and Fidelity.
Additional Information Requested by the Board. In order to develop fully the factual basis for consideration of the Fidelity funds' advisory contracts, the Board requested and received additional information on certain topics, including: (i) Fidelity's fund profitability methodology, profitability trends for certain funds, the allocation of various costs to different funds, and the impact of certain factors on fund profitability results; (ii) portfolio manager changes that have occurred during the past year and the amount of the investment that each portfolio manager has made in the Fidelity fund(s) that he or she manages; (iii) Fidelity's compensation structure for portfolio managers, research analysts, and other key personnel, including its effects on fund profitability, the rationale for the compensation structure, and the extent to which current market conditions have affected retention and recruitment; (iv) the arrangements with and compensation paid to certain fund sub-advisers on behalf of the Fidelity funds and the treatment of such compensation within Fidelity's fund profitability methodology; (v) the terms of the funds' various management fee structures, including the basic group fee and the terms of Fidelity's voluntary expense limitation agreements; (vi) Fidelity's transfer agent fee, expense, and service structures for different funds and classes relative to competitive trends; (vii) the impact on fund profitability of recent industry trends, such as the growth in passively managed funds and outflows from actively managed equity funds; and (viii) explanations regarding the relative total expense ratios of certain funds and classes, total expense competitive trends and methodologies for total expense competitive comparisons, and actions that might be taken by Fidelity to reduce total expense ratios for certain classes. In addition, the Board considered its discussions with Fidelity regarding Fidelity's efforts to maintain the continuous investment and shareholder services necessary for the funds during the current pandemic and economic circumstances.
Based on its evaluation of all of the conclusions noted above, and after considering all factors it believed relevant, the Board concluded that the advisory fee arrangements are fair and reasonable, and that each fund's Advisory Contract should be renewed.
FF-SANN-1120
1.537284.123
Fidelity Advisor Freedom® Funds - Income, 2005, 2010, 2015, 2020, 2025, 2030, 2035, 2040, 2045, 2050, 2055, 2060, 2065
Semi-Annual Report
September 30, 2020
See the inside front cover for important information about access to your fund’s shareholder reports.
Beginning on January 1, 2021, as permitted by regulations adopted by the Securities and Exchange Commission, paper copies of a fund’s shareholder reports will no longer be sent by mail, unless you specifically request paper copies of the reports from the fund or from your financial intermediary, such as a financial advisor, broker-dealer or bank. Instead, the reports will be made available on a website, and you will be notified by mail each time a report is posted and provided with a website link to access the report.
If you already elected to receive shareholder reports electronically, you will not be affected by this change and you need not take any action. You may elect to receive shareholder reports and other communications from a fund electronically, by contacting your financial intermediary. For Fidelity customers, visit Fidelity's web site or call Fidelity using the contact information listed below.
You may elect to receive all future reports in paper free of charge. If you wish to continue receiving paper copies of your shareholder reports, you may contact your financial intermediary or, if you are a Fidelity customer, visit Fidelity’s website, or call Fidelity at the applicable toll-free number listed below. Your election to receive reports in paper will apply to all funds held with the fund complex/your financial intermediary.
| Account Type | Website | Phone Number |
| Brokerage, Mutual Fund, or Annuity Contracts: | fidelity.com/mailpreferences | 1-800-343-3548 |
| Employer Provided Retirement Accounts: | netbenefits.fidelity.com/preferences (choose 'no' under Required Disclosures to continue to print) | 1-800-343-0860 |
| Advisor Sold Accounts Serviced Through Your Financial Intermediary: | Contact Your Financial Intermediary | Your Financial Intermediary's phone number |
| Advisor Sold Accounts Serviced by Fidelity: | institutional.fidelity.com | 1-877-208-0098 |
Contents
To view a fund's proxy voting guidelines and proxy voting record for the 12-month period ended June 30, visit http://www.fidelity.com/proxyvotingresults or visit the Securities and Exchange Commission's (SEC) web site at http://www.sec.gov.
You may also call 1-877-208-0098 to request a free copy of the proxy voting guidelines.
Standard & Poor's, S&P and S&P 500 are registered service marks of The McGraw-Hill Companies, Inc. and have been licensed for use by Fidelity Distributors Corporation.
Other third-party marks appearing herein are the property of their respective owners.
All other marks appearing herein are registered or unregistered trademarks or service marks of FMR LLC or an affiliated company. © 2020 FMR LLC. All rights reserved.
This report and the financial statements contained herein are submitted for the general information of the shareholders of the Funds. This report is not authorized for distribution to prospective investors in the Funds unless preceded or accompanied by an effective prospectus.
A fund files its complete schedule of portfolio holdings with the SEC for the first and third quarters of each fiscal year on Form N-PORT. Forms N-PORT are available on the SEC’s web site at http://www.sec.gov. A fund's Forms N-PORT may be reviewed and copied at the SEC’s Public Reference Room in Washington, DC. Information regarding the operation of the SEC's Public Reference Room may be obtained by calling 1-800-SEC-0330.
For a complete list of a fund's portfolio holdings, view the most recent holdings listing, semiannual report, or annual report on Fidelity's web site at http://www.fidelity.com, http://www.institutional.fidelity.com, or http://www.401k.com, as applicable.
NOT FDIC INSURED •MAY LOSE VALUE •NO BANK GUARANTEE
Neither the Funds nor Fidelity Distributors Corporation is a bank.
Note to Shareholders:
Early in 2020, the outbreak and spread of a new coronavirus emerged as a public health emergency that had a major influence on financial markets, primarily based on its impact on the global economy and the outlook for corporate earnings. The virus causes a respiratory disease known as COVID-19. On March 11, the World Health Organization declared the COVID-19 outbreak a pandemic, citing sustained risk of further global spread.
In the weeks following, as the crisis worsened, we witnessed an escalating human tragedy with wide-scale social and economic consequences from coronavirus-containment measures. The outbreak of COVID-19 prompted a number of measures to limit the spread, including travel and border restrictions, quarantines, and restrictions on large gatherings. In turn, these resulted in lower consumer activity, diminished demand for a wide range of products and services, disruption in manufacturing and supply chains, and – given the wide variability in outcomes regarding the outbreak – significant market uncertainty and volatility. Amid the turmoil, the U.S. government took unprecedented action – in concert with the U.S. Federal Reserve and central banks around the world – to help support consumers, businesses, and the broader economy, and to limit disruption to the financial system.
The situation continues to unfold, and the extent and duration of its impact on financial markets and the economy remain highly uncertain. Extreme events such as the coronavirus crisis are “exogenous shocks” that can have significant adverse effects on mutual funds and their investments. Although multiple asset classes may be affected by market disruption, the duration and impact may not be the same for all types of assets.
Fidelity is committed to helping you stay informed amid news about COVID-19 and during increased market volatility, and we’re taking extra steps to be responsive to customer needs. We encourage you to visit our websites, where we offer ongoing updates, commentary, and analysis on the markets and our funds.
Fidelity Advisor Freedom® Income Fund
Investment Summary (Unaudited)
The information in the following tables is based on the direct investments of the Fund.
Top Holdings as of September 30, 2020
| | % of fund's net assets |
| Fidelity Series Investment Grade Bond Fund | 38.5 |
| Fidelity Series Government Money Market Fund 0.16% | 19.1 |
| Fidelity Series Inflation-Protected Bond Index Fund | 12.0 |
| Fidelity Series Emerging Markets Opportunities Fund | 6.3 |
| Fidelity Series Short-Term Credit Fund | 4.6 |
| Fidelity Series Commodity Strategy Fund | 2.5 |
| Fidelity Series Long-Term Treasury Bond Index Fund | 2.3 |
| Fidelity Series International Growth Fund | 1.5 |
| Fidelity Series Overseas Fund | 1.5 |
| Fidelity Series International Value Fund | 1.4 |
| | 89.7 |
Asset Allocation (% of fund's net assets)
| Period end |
| | Domestic Equity Funds | 8.9% |
| | International Equity Funds | 12.3% |
| | Bond Funds | 54.7% |
| | Short-Term Funds | 24.0% |
| | Short-Term Investments | 0.1% |

Domestic Equity Funds category includes Fidelity Series Commodity Strategy Fund which invests in commodity-related investments.
Fidelity Advisor Freedom® Income Fund
Schedule of Investments September 30, 2020 (Unaudited)
Showing Percentage of Net Assets
| U.S. Treasury Obligations - 0.1% | | | |
| | | Principal Amount | Value |
| U.S. Treasury Bills, yield at date of purchase 0.1% to 0.11% 12/3/20 to 12/10/20 (a) | | | |
| (Cost $189,961) | | 190,000 | 189,964 |
| | | Shares | Value |
|
| Domestic Equity Funds - 8.9% | | | |
| Fidelity Advisor Series Equity Growth Fund (b) | | 105,024 | $1,910,383 |
| Fidelity Advisor Series Growth Opportunities Fund (b) | | 71,637 | 1,317,408 |
| Fidelity Advisor Series Small Cap Fund (b) | | 77,767 | 865,547 |
| Fidelity Series All-Sector Equity Fund (b) | | 77,366 | 823,947 |
| Fidelity Series Commodity Strategy Fund (b) | | 1,404,876 | 5,844,284 |
| Fidelity Series Large Cap Stock Fund (b) | | 213,684 | 3,025,772 |
| Fidelity Series Large Cap Value Index Fund (b) | | 28,166 | 326,730 |
| Fidelity Series Opportunistic Insights Fund (b) | | 82,138 | 1,776,644 |
| Fidelity Series Small Cap Opportunities Fund (b) | | 83,469 | 1,065,070 |
| Fidelity Series Stock Selector Large Cap Value Fund (b) | | 174,780 | 1,922,583 |
| Fidelity Series Value Discovery Fund (b) | | 159,119 | 1,966,708 |
| TOTAL DOMESTIC EQUITY FUNDS | | | |
| (Cost $17,887,939) | | | 20,845,076 |
|
| International Equity Funds - 12.3% | | | |
| Fidelity Series Canada Fund (b) | | 113,505 | 1,161,160 |
| Fidelity Series Emerging Markets Fund (b) | | 174,739 | 1,647,789 |
| Fidelity Series Emerging Markets Opportunities Fund (b) | | 696,511 | 14,612,811 |
| Fidelity Series International Growth Fund (b) | | 182,905 | 3,434,963 |
| Fidelity Series International Small Cap Fund (b) | | 60,016 | 1,068,289 |
| Fidelity Series International Value Fund (b) | | 391,129 | 3,371,536 |
| Fidelity Series Overseas Fund (b) | | 306,640 | 3,428,234 |
| TOTAL INTERNATIONAL EQUITY FUNDS | | | |
| (Cost $22,402,420) | | | 28,724,782 |
|
| Bond Funds - 54.7% | | | |
| Fidelity Series Emerging Markets Debt Fund (b) | | 169,940 | 1,539,658 |
| Fidelity Series Floating Rate High Income Fund (b) | | 40,488 | 358,315 |
| Fidelity Series High Income Fund (b) | | 177,506 | 1,618,852 |
| Fidelity Series Inflation-Protected Bond Index Fund (b) | | 2,609,677 | 27,923,541 |
| Fidelity Series International Credit Fund (b) | | 12,719 | 132,405 |
| Fidelity Series Investment Grade Bond Fund (b) | | 7,329,391 | 89,711,747 |
| Fidelity Series Long-Term Treasury Bond Index Fund (b) | | 514,806 | 5,317,944 |
| Fidelity Series Real Estate Income Fund (b) | | 104,973 | 1,047,631 |
| TOTAL BOND FUNDS | | | |
| (Cost $114,825,927) | | | 127,650,093 |
|
| Short-Term Funds - 24.0% | | | |
| Fidelity Cash Central Fund 0.10% (c) | | 602,573 | 602,693 |
| Fidelity Series Government Money Market Fund 0.16% (b)(d) | | 44,443,914 | 44,443,914 |
| Fidelity Series Short-Term Credit Fund (b) | | 1,051,888 | 10,781,856 |
| TOTAL SHORT-TERM FUNDS | | | |
| (Cost $55,501,825) | | | 55,828,463 |
| TOTAL INVESTMENT IN SECURITIES - 100.0% | | | |
| (Cost $210,808,072) | | | 233,238,378 |
| NET OTHER ASSETS (LIABILITIES) - 0.0% | | | (47,204) |
| NET ASSETS - 100% | | | $233,191,174 |
| Futures Contracts | | | | | |
| | Number of contracts | Expiration Date | Notional Amount | Value | Unrealized Appreciation/(Depreciation) |
| Sold | | | | | |
| Equity Index Contracts | | | | | |
| CME E-mini S&P 500 Index Contracts (United States) | 1 | Dec. 2020 | $167,600 | $(1,094) | $(1,094) |
The notional amount of futures sold as a percentage of Net Assets is 0.1%
Legend
(a) Security or a portion of the security was pledged to cover margin requirements for futures contracts. At period end, the value of securities pledged amounted to $189,964.
(b) Affiliated Fund
(c) Affiliated fund that is generally available only to investment companies and other accounts managed by Fidelity Investments. The rate quoted is the annualized seven-day yield of the fund at period end. A complete unaudited listing of the fund's holdings as of its most recent quarter end is available upon request. In addition, each Fidelity Central Fund's financial statements are available on the SEC's website or upon request.
(d) The rate quoted is the annualized seven-day yield of the fund at period end.
Affiliated Central Funds
Information regarding fiscal year to date income earned by the Fund from investments in Fidelity Central Funds is as follows:
| Fund | Income earned |
| Fidelity Cash Central Fund | $480 |
| Total | $480 |
Amounts in the income column in the above table include any capital gain distributions from underlying funds, which are presented in the corresponding line-item in the Statement of Operations, if applicable.
Affiliated Underlying Funds
Fiscal year to date information regarding the Fund's investments in affiliated Underlying Funds, excluding any Money Market Central Funds, is presented below. Exchanges between classes of the same affiliated Underlying Funds may occur.
| Affiliate | Value, beginning of period | Purchases | Sales Proceeds | Dividend Income | Realized Gain (loss) | Change in Unrealized appreciation (depreciation) | Value, end of period |
| Fidelity Advisor Series Equity Growth Fund | $1,456,870 | $612,817 | $905,958 | $-- | $181,311 | $565,343 | $1,910,383 |
| Fidelity Advisor Series Growth Opportunities Fund | 680,454 | 743,297 | 715,846 | -- | 108,079 | 501,424 | 1,317,408 |
| Fidelity Advisor Series Small Cap Fund | 496,538 | 444,359 | 258,047 | -- | 1,110 | 181,587 | 865,547 |
| Fidelity Series All-Sector Equity Fund | 612,895 | 304,527 | 322,489 | -- | 14,085 | 214,929 | 823,947 |
| Fidelity Series Canada Fund | 807,963 | 301,464 | 182,587 | -- | (19,176) | 253,496 | 1,161,160 |
| Fidelity Series Commodity Strategy Fund | 7,094,346 | 510,072 | 2,517,543 | 25,362 | (1,119,711) | 1,877,120 | 5,844,284 |
| Fidelity Series Emerging Markets Debt Fund | 1,336,326 | 158,520 | 122,598 | 39,847 | 2,569 | 164,841 | 1,539,658 |
| Fidelity Series Emerging Markets Fund | 870,605 | 562,594 | 154,740 | -- | 2,446 | 366,884 | 1,647,789 |
| Fidelity Series Emerging Markets Opportunities Fund | 8,297,125 | 4,998,668 | 2,319,640 | -- | 121,743 | 3,514,915 | 14,612,811 |
| Fidelity Series Floating Rate High Income Fund | 318,977 | 36,551 | 29,661 | 7,840 | 442 | 32,006 | 358,315 |
| Fidelity Series Government Money Market Fund 0.16% | 44,857,683 | 8,797,402 | 9,211,171 | 52,205 | -- | -- | 44,443,914 |
| Fidelity Series High Income Fund | 1,426,045 | 186,974 | 148,304 | 43,419 | 2,803 | 151,334 | 1,618,852 |
| Fidelity Series Inflation-Protected Bond Index Fund | 26,028,896 | 3,045,923 | 2,763,741 | 22,074 | 23,105 | 1,589,358 | 27,923,541 |
| Fidelity Series International Credit Fund | 119,792 | 1,861 | -- | 1,862 | -- | 10,752 | 132,405 |
| Fidelity Series International Growth Fund | 4,340,763 | 317,587 | 2,245,708 | -- | 736,962 | 285,359 | 3,434,963 |
| Fidelity Series International Small Cap Fund | 1,041,709 | 84,140 | 353,840 | -- | 30,297 | 265,983 | 1,068,289 |
| Fidelity Series International Value Fund | 3,622,634 | 336,516 | 1,251,883 | -- | (97,526) | 761,795 | 3,371,536 |
| Fidelity Series Investment Grade Bond Fund | 83,054,476 | 9,616,116 | 8,041,525 | 1,143,008 | 40,394 | 5,042,286 | 89,711,747 |
| Fidelity Series Large Cap Stock Fund | 1,779,891 | 1,747,824 | 724,287 | 123,145 | (38,312) | 260,656 | 3,025,772 |
| Fidelity Series Large Cap Value Index Fund | 189,580 | 136,698 | 44,920 | -- | 1,181 | 44,191 | 326,730 |
| Fidelity Series Long-Term Treasury Bond Index Fund | 5,399,057 | 1,028,266 | 943,757 | 138,558 | 86,909 | (252,531) | 5,317,944 |
| Fidelity Series Opportunistic Insights Fund | 1,409,926 | 511,997 | 782,660 | -- | 162,376 | 475,005 | 1,776,644 |
| Fidelity Series Overseas Fund | 3,280,261 | 701,722 | 1,501,404 | -- | (81,008) | 1,028,663 | 3,428,234 |
| Fidelity Series Real Estate Income Fund | 856,974 | 123,195 | 92,951 | 33,219 | (282) | 160,695 | 1,047,631 |
| Fidelity Series Short-Term Credit Fund | 10,251,480 | 194,581 | 50,076 | 117,288 | 403 | 385,468 | 10,781,856 |
| Fidelity Series Small Cap Opportunities Fund | 620,453 | 575,568 | 304,887 | 7,684 | 3,198 | 170,738 | 1,065,070 |
| Fidelity Series Stock Selector Large Cap Value Fund | 1,140,351 | 741,160 | 257,658 | -- | 2,742 | 295,988 | 1,922,583 |
| Fidelity Series Value Discovery Fund | 1,128,277 | 877,582 | 327,744 | -- | (8,439) | 297,032 | 1,966,708 |
| | $212,520,347 | $37,697,981 | $36,575,625 | $1,755,511 | $157,701 | $18,645,317 | $232,445,721 |
Amounts in the income column in the above table include any capital gain distributions from underlying funds, which are presented in the corresponding line-item in the Statement of Operations, if applicable.
Investment Valuation
The following is a summary of the inputs used, as of September 30, 2020, involving the Fund's assets and liabilities carried at fair value. The inputs or methodology used for valuing securities may not be an indication of the risk associated with investing in those securities. For more information on valuation inputs, and their aggregation into the levels used below, please refer to the Investment Valuation section in the accompanying Notes to Financial Statements.
| | Valuation Inputs at Reporting Date: |
| Description | Total | Level 1 | Level 2 | Level 3 |
| Investments in Securities: | | | | |
| Other Short-Term Investments and Net Other Assets | $189,964 | $-- | $189,964 | $-- |
| Domestic Equity Funds | 20,845,076 | 20,845,076 | -- | -- |
| International Equity Funds | 28,724,782 | 28,724,782 | -- | -- |
| Bond Funds | 127,650,093 | 127,650,093 | --�� | -- |
| Short-Term Funds | 55,828,463 | 55,828,463 | -- | -- |
| Total Investments in Securities: | $233,238,378 | $233,048,414 | $189,964 | $-- |
| Derivative Instruments: | | | | |
| Liabilities | | | | |
| Futures Contracts | $(1,094) | $(1,094) | $-- | $-- |
| Total Liabilities | $(1,094) | $(1,094) | $-- | $-- |
| Total Derivative Instruments: | $(1,094) | $(1,094) | $-- | $-- |
Value of Derivative Instruments
The following table is a summary of the Fund's value of derivative instruments by primary risk exposure as of September 30, 2020. For additional information on derivative instruments, please refer to the Derivative Instruments section in the accompanying Notes to Financial Statements.
| Primary Risk Exposure / Derivative Type | Value |
| | Asset | Liability |
| Equity Risk | | |
| Futures Contracts(a) | $0 | $(1,094) |
| Total Equity Risk | 0 | (1,094) |
| Total Value of Derivatives | $0 | $(1,094) |
(a) Reflects gross cumulative appreciation (depreciation) on futures contracts as presented in the Schedule of Investments. In the Statement of Assets and Liabilities, the period end daily variation margin is included in receivable or payable for daily variation margin on futures contracts, and the net cumulative appreciation (depreciation) is included in Total accumulated earnings (loss).
See accompanying notes which are an integral part of the financial statements.
Fidelity Advisor Freedom® Income Fund
Financial Statements
Statement of Assets and Liabilities
| | | September 30, 2020 (Unaudited) |
| Assets | | |
Investment in securities, at value — See accompanying schedule:
Unaffiliated issuers (cost $189,961) | $189,964 | |
| Fidelity Central Funds (cost $602,709) | 602,693 | |
| Other affiliated issuers (cost $210,015,402) | 232,445,721 | |
| Total Investment in Securities (cost $210,808,072) | | $233,238,378 |
| Cash | | 8,640 |
| Receivable for investments sold | | 3,950,514 |
| Receivable for fund shares sold | | 90,476 |
| Distributions receivable from Fidelity Central Funds | | 54 |
| Total assets | | 237,288,062 |
| Liabilities | | |
| Payable for investments purchased | $3,064,484 | |
| Payable for fund shares redeemed | 891,752 | |
| Accrued management fee | 88,993 | |
| Distribution and service plan fees payable | 36,961 | |
| Payable for daily variation margin on futures contracts | 14,698 | |
| Total liabilities | | 4,096,888 |
| Net Assets | | $233,191,174 |
| Net Assets consist of: | | |
| Paid in capital | | $211,137,298 |
| Total accumulated earnings (loss) | | 22,053,876 |
| Net Assets | | $233,191,174 |
| Net Asset Value and Maximum Offering Price | | |
| Class A: | | |
| Net Asset Value and redemption price per share ($67,195,272 ÷ 5,957,251 shares)(a) | | $11.28 |
| Maximum offering price per share (100/94.25 of $11.28) | | $11.97 |
| Class M: | | |
| Net Asset Value and redemption price per share ($38,955,033 ÷ 3,457,482 shares)(a) | | $11.27 |
| Maximum offering price per share (100/96.50 of $11.27) | | $11.68 |
| Class C: | | |
| Net Asset Value and offering price per share ($8,166,568 ÷ 726,395 shares)(a) | | $11.24 |
| Class I: | | |
| Net Asset Value, offering price and redemption price per share ($89,078,569 ÷ 7,870,065 shares) | | $11.32 |
| Class Z: | | |
| Net Asset Value, offering price and redemption price per share ($8,492,364 ÷ 751,003 shares) | | $11.31 |
| Class Z6: | | |
| Net Asset Value, offering price and redemption price per share ($21,303,368 ÷ 1,883,964 shares) | | $11.31 |
(a) Redemption price per share is equal to net asset value less any applicable contingent deferred sales charge.
See accompanying notes which are an integral part of the financial statements.
Statement of Operations
| | | Six months ended September 30, 2020 (Unaudited) |
| Investment Income | | |
| Dividends: | | |
| Affiliated issuers | | $1,567,183 |
| Interest | | 257 |
| Income from Fidelity Central Funds | | 480 |
| Total income | | 1,567,920 |
| Expenses | | |
| Management fee | $518,976 | |
| Distribution and service plan fees | 217,165 | |
| Independent trustees' fees and expenses | 315 | |
| Total expenses before reductions | 736,456 | |
| Expense reductions | (244) | |
| Total expenses after reductions | | 736,212 |
| Net investment income (loss) | | 831,708 |
| Realized and Unrealized Gain (Loss) | | |
| Net realized gain (loss) on: | | |
| Investment securities: | | |
| Unaffiliated issuers | (2) | |
| Fidelity Central Funds | (56) | |
| Other affiliated issuers | 157,701 | |
| Futures contracts | (193,490) | |
| Capital gain distributions from underlying funds: | | |
| Affiliated issuers | 188,328 | |
| Total net realized gain (loss) | | 152,481 |
| Change in net unrealized appreciation (depreciation) on: | | |
| Investment securities: | | |
| Unaffiliated issuers | (133) | |
| Fidelity Central Funds | (19) | |
| Other affiliated issuers | 18,645,317 | |
| Futures contracts | (1,094) | |
| Total change in net unrealized appreciation (depreciation) | | 18,644,071 |
| Net gain (loss) | | 18,796,552 |
| Net increase (decrease) in net assets resulting from operations | | $19,628,260 |
See accompanying notes which are an integral part of the financial statements.
Statement of Changes in Net Assets
| | Six months ended September 30, 2020 (Unaudited) | Year ended March 31, 2020 |
| Increase (Decrease) in Net Assets | | |
| Operations | | |
| Net investment income (loss) | $831,708 | $3,882,218 |
| Net realized gain (loss) | 152,481 | 4,761,960 |
| Change in net unrealized appreciation (depreciation) | 18,644,071 | (6,103,407) |
| Net increase (decrease) in net assets resulting from operations | 19,628,260 | 2,540,771 |
| Distributions to shareholders | (3,470,965) | (8,121,516) |
| Share transactions - net increase (decrease) | 3,572,189 | (6,510,541) |
| Total increase (decrease) in net assets | 19,729,484 | (12,091,286) |
| Net Assets | | |
| Beginning of period | 213,461,690 | 225,552,976 |
| End of period | $233,191,174 | $213,461,690 |
See accompanying notes which are an integral part of the financial statements.
Financial Highlights
Fidelity Advisor Freedom Income Fund Class A
| | Six months ended (Unaudited) September 30, | Years endedMarch 31, | | | | |
| | 2020 | 2020 | 2019 | 2018 | 2017 | 2016 |
| Selected Per–Share Data | | | | | | |
| Net asset value, beginning of period | $10.50 | $10.76 | $11.01 | $10.94 | $10.64 | $11.07 |
| Income from Investment Operations | | | | | | |
| Net investment income (loss)A | .04 | .18 | .20 | .15 | .16 | .18 |
| Net realized and unrealized gain (loss) | .91 | (.06)B | .12 | .34 | .44 | (.25) |
| Total from investment operations | .95 | .12 | .32 | .49 | .60 | (.07) |
| Distributions from net investment income | (.04) | (.18) | (.19) | (.15) | (.16)C | (.18) |
| Distributions from net realized gain | (.13) | (.20) | (.38) | (.26) | (.14)C | (.19) |
| Total distributions | (.17) | (.38) | (.57) | (.42)D | (.30) | (.36)D |
| Net asset value, end of period | $11.28 | $10.50 | $10.76 | $11.01 | $10.94 | $10.64 |
| Total ReturnE,F,G | 9.09% | 1.04%B | 3.14% | 4.47% | 5.74% | (.59)% |
| Ratios to Average Net AssetsH,I | | | | | | |
| Expenses before reductions | .71%J,K | .72% | .71%K | .63% | .25% | .25% |
| Expenses net of fee waivers, if any | .71%J,K | .72% | .71%K | .63% | .25% | .25% |
| Expenses net of all reductions | .71%J,K | .72% | .71%K | .63% | .25% | .25% |
| Net investment income (loss) | .66%J | 1.64% | 1.84% | 1.38% | 1.47% | 1.63% |
| Supplemental Data | | | | | | |
| Net assets, end of period (000 omitted) | $67,195 | $61,807 | $69,817 | $76,141 | $87,983 | $99,211 |
| Portfolio turnover rateI | 32%J | 25% | 36% | 21% | 38% | 30% |
A Calculated based on average shares outstanding during the period.
B Amount includes a gain realized from an operational error which amounted to $0.01 per share. Excluding this gain, the total return would have been 0.93%.
C The amounts shown reflect certain reclassifications related to book to tax differences that were made in the year shown.
D Total distributions per share do not sum due to rounding.
E Total returns for periods of less than one year are not annualized.
F Total returns would have been lower if certain expenses had not been reduced during the applicable periods shown.
G Total returns do not include the effect of the sales charges.
H Expense ratios reflect operating expenses of the class. Expenses before reductions do not reflect amounts reimbursed, waived, or reduced through arrangements with the investment adviser, brokerage services, or other offset arrangements, if applicable, and do not represent the amount paid by the class during periods when reimbursements, waivers or reductions occur.
I Amount does not include the portfolio activity of any underlying mutual funds or exchange-traded funds (ETFs).
J Annualized
K On certain classes, the size and fluctuation of net assets and expense amounts may cause ratios to differ from contractual rates.
See accompanying notes which are an integral part of the financial statements.
Fidelity Advisor Freedom Income Fund Class M
| | Six months ended (Unaudited) September 30, | Years endedMarch 31, | | | | |
| | 2020 | 2020 | 2019 | 2018 | 2017 | 2016 |
| Selected Per–Share Data | | | | | | |
| Net asset value, beginning of period | $10.49 | $10.74 | $11.00 | $10.93 | $10.62 | $11.06 |
| Income from Investment Operations | | | | | | |
| Net investment income (loss)A | .02 | .15 | .17 | .13 | .13 | .15 |
| Net realized and unrealized gain (loss) | .91 | (.04)B | .12 | .33 | .45 | (.25) |
| Total from investment operations | .93 | .11 | .29 | .46 | .58 | (.10) |
| Distributions from net investment income | (.03) | (.16) | (.17) | (.13) | (.13)C | (.15) |
| Distributions from net realized gain | (.13) | (.20) | (.38) | (.26) | (.14)C | (.19) |
| Total distributions | (.15)D | (.36) | (.55) | (.39) | (.27) | (.34) |
| Net asset value, end of period | $11.27 | $10.49 | $10.74 | $11.00 | $10.93 | $10.62 |
| Total ReturnE,F,G | 8.96% | .90%B | 2.78% | 4.22% | 5.56% | (.93)% |
| Ratios to Average Net AssetsH,I | | | | | | |
| Expenses before reductions | .96%J,K | .97% | .96%K | .89% | .50% | .50% |
| Expenses net of fee waivers, if any | .96%J,K | .97% | .96%K | .89% | .50% | .50% |
| Expenses net of all reductions | .96%J,K | .97% | .96%K | .89% | .50% | .50% |
| Net investment income (loss) | .41%J | 1.39% | 1.59% | 1.13% | 1.22% | 1.38% |
| Supplemental Data | | | | | | |
| Net assets, end of period (000 omitted) | $38,955 | $36,147 | $38,059 | $38,204 | $38,513 | $42,887 |
| Portfolio turnover rateI | 32%J | 25% | 36% | 21% | 38% | 30% |
A Calculated based on average shares outstanding during the period.
B Amount includes a gain realized from an operational error which amounted to $0.01 per share. Excluding this gain, the total return would have been 0.79%.
C The amounts shown reflect certain reclassifications related to book to tax differences that were made in the year shown.
D Total distributions per share do not sum due to rounding.
E Total returns for periods of less than one year are not annualized.
F Total returns would have been lower if certain expenses had not been reduced during the applicable periods shown.
G Total returns do not include the effect of the sales charges.
H Expense ratios reflect operating expenses of the class. Expenses before reductions do not reflect amounts reimbursed, waived, or reduced through arrangements with the investment adviser, brokerage services, or other offset arrangements, if applicable, and do not represent the amount paid by the class during periods when reimbursements, waivers or reductions occur.
I Amount does not include the portfolio activity of any underlying mutual funds or exchange-traded funds (ETFs).
J Annualized
K On certain classes, the size and fluctuation of net assets and expense amounts may cause ratios to differ from contractual rates.
See accompanying notes which are an integral part of the financial statements.
Fidelity Advisor Freedom Income Fund Class C
| | Six months ended (Unaudited) September 30, | Years endedMarch 31, | | | | |
| | 2020 | 2020 | 2019 | 2018 | 2017 | 2016 |
| Selected Per–Share Data | | | | | | |
| Net asset value, beginning of period | $10.47 | $10.73 | $10.98 | $10.91 | $10.61 | $11.04 |
| Income from Investment Operations | | | | | | |
| Net investment income (loss)A | (.01) | .10 | .12 | .07 | .08 | .09 |
| Net realized and unrealized gain (loss) | .91 | (.06)B | .12 | .33 | .44 | (.24) |
| Total from investment operations | .90 | .04 | .24 | .40 | .52 | (.15) |
| Distributions from net investment income | –C | (.10) | (.11) | (.07) | (.08)D | (.10) |
| Distributions from net realized gain | (.13) | (.20) | (.38) | (.26) | (.14)D | (.19) |
| Total distributions | (.13) | (.30) | (.49) | (.33) | (.22) | (.28)E |
| Net asset value, end of period | $11.24 | $10.47 | $10.73 | $10.98 | $10.91 | $10.61 |
| Total ReturnF,G,H | 8.65% | .30%B | 2.35% | 3.69% | 4.99% | (1.35)% |
| Ratios to Average Net AssetsI,J | | | | | | |
| Expenses before reductions | 1.46%K,L | 1.46%L | 1.46%L | 1.39% | 1.00% | 1.00% |
| Expenses net of fee waivers, if any | 1.46%K,L | 1.46%L | 1.46%L | 1.39% | 1.00% | 1.00% |
| Expenses net of all reductions | 1.46%K,L | 1.46%L | 1.46%L | 1.39% | 1.00% | 1.00% |
| Net investment income (loss) | (.09)%K | .89% | 1.09% | .63% | .72% | .88% |
| Supplemental Data | | | | | | |
| Net assets, end of period (000 omitted) | $8,167 | $7,918 | $8,915 | $13,727 | $14,434 | $14,712 |
| Portfolio turnover rateJ | 32%K | 25% | 36% | 21% | 38% | 30% |
A Calculated based on average shares outstanding during the period.
B Amount includes a gain realized from an operational error which amounted to $0.01 per share. Excluding this gain, the total return would have been 0.19%.
C Amount represents less than $.005 per share.
D The amounts shown reflect certain reclassifications related to book to tax differences that were made in the year shown.
E Total distributions per share do not sum due to rounding.
F Total returns for periods of less than one year are not annualized.
G Total returns would have been lower if certain expenses had not been reduced during the applicable periods shown.
H Total returns do not include the effect of the contingent deferred sales charge.
I Expense ratios reflect operating expenses of the class. Expenses before reductions do not reflect amounts reimbursed, waived, or reduced through arrangements with the investment adviser, brokerage services, or other offset arrangements, if applicable, and do not represent the amount paid by the class during periods when reimbursements, waivers or reductions occur.
J Amount does not include the portfolio activity of any underlying mutual funds or exchange-traded funds (ETFs).
K Annualized
L On certain classes, the size and fluctuation of net assets and expense amounts may cause ratios to differ from contractual rates.
See accompanying notes which are an integral part of the financial statements.
Fidelity Advisor Freedom Income Fund Class I
| | Six months ended (Unaudited) September 30, | Years endedMarch 31, | | | | |
| | 2020 | 2020 | 2019 | 2018 | 2017 | 2016 |
| Selected Per–Share Data | | | | | | |
| Net asset value, beginning of period | $10.53 | $10.79 | $11.05 | $10.98 | $10.67 | $11.10 |
| Income from Investment Operations | | | | | | |
| Net investment income (loss)A | .05 | .21 | .23 | .18 | .19 | .20 |
| Net realized and unrealized gain (loss) | .92 | (.06)B | .11 | .33 | .45 | (.24) |
| Total from investment operations | .97 | .15 | .34 | .51 | .64 | (.04) |
| Distributions from net investment income | (.05) | (.21) | (.22) | (.18) | (.19)C | (.20) |
| Distributions from net realized gain | (.13) | (.20) | (.38) | (.26) | (.14)C | (.19) |
| Total distributions | (.18) | (.41) | (.60) | (.44) | (.33) | (.39) |
| Net asset value, end of period | $11.32 | $10.53 | $10.79 | $11.05 | $10.98 | $10.67 |
| Total ReturnD,E | 9.29% | 1.30%B | 3.30% | 4.70% | 6.07% | (.34)% |
| Ratios to Average Net AssetsF,G | | | | | | |
| Expenses before reductions | .46%H,I | .47% | .46%I | .39% | - %J | - %J |
| Expenses net of fee waivers, if any | .46%H,I | .47% | .46%I | .39% | -% | -% |
| Expenses net of all reductions | .46%H,I | .47% | .46%I | .39% | -% | -% |
| Net investment income (loss) | .91%H | 1.89% | 2.09% | 1.63% | 1.72% | 1.88% |
| Supplemental Data | | | | | | |
| Net assets, end of period (000 omitted) | $89,079 | $83,215 | $82,975 | $83,723 | $81,839 | $83,497 |
| Portfolio turnover rateG | 32%H | 25% | 36% | 21% | 38% | 30% |
A Calculated based on average shares outstanding during the period.
B Amount includes a gain realized from an operational error which amounted to $0.01 per share. Excluding this gain, the total return would have been 1.19%.
C The amounts shown reflect certain reclassifications related to book to tax differences that were made in the year shown.
D Total returns for periods of less than one year are not annualized.
E Total returns would have been lower if certain expenses had not been reduced during the applicable periods shown.
F Expense ratios reflect operating expenses of the class. Expenses before reductions do not reflect amounts reimbursed, waived, or reduced through arrangements with the investment adviser, brokerage services, or other offset arrangements, if applicable, and do not represent the amount paid by the class during periods when reimbursements, waivers or reductions occur.
G Amount does not include the portfolio activity of any underlying mutual funds or exchange-traded funds (ETFs).
H Annualized
I On certain classes, the size and fluctuation of net assets and expense amounts may cause ratios to differ from contractual rates.
J Amount represents less than .005%.
See accompanying notes which are an integral part of the financial statements.
Fidelity Advisor Freedom Income Fund Class Z
| | Six months ended (Unaudited) September 30, | Years endedMarch 31, | |
| | 2020 | 2020 | 2019 A |
| Selected Per–Share Data | | | |
| Net asset value, beginning of period | $10.53 | $10.79 | $10.91 |
| Income from Investment Operations | | | |
| Net investment income (loss)B | .05 | .21 | .24 |
| Net realized and unrealized gain (loss) | .92 | (.05)C | .01 |
| Total from investment operations | .97 | .16 | .25 |
| Distributions from net investment income | (.06) | (.22) | (.15) |
| Distributions from net realized gain | (.13) | (.20) | (.22) |
| Total distributions | (.19) | (.42) | (.37) |
| Net asset value, end of period | $11.31 | $10.53 | $10.79 |
| Total ReturnD,E | 9.26% | 1.36%C | 2.47% |
| Ratios to Average Net AssetsF,G | | | |
| Expenses before reductions | .41%H,I | .42% | .42%H |
| Expenses net of fee waivers, if any | .41%H,I | .42% | .42%H |
| Expenses net of all reductions | .41%H,I | .42% | .42%H |
| Net investment income (loss) | .96%H | 1.94% | 4.60%H |
| Supplemental Data | | | |
| Net assets, end of period (000 omitted) | $8,492 | $3,128 | $765 |
| Portfolio turnover rateG | 32%H | 25% | 36% |
A For the period October 2, 2018 (commencement of sale of shares) to March 31, 2019.
B Calculated based on average shares outstanding during the period.
C Amount includes a gain realized from an operational error which amounted to $0.01 per share. Excluding this gain, the total return would have been 1.25%.
D Total returns for periods of less than one year are not annualized.
E Total returns would have been lower if certain expenses had not been reduced during the applicable periods shown.
F Expense ratios reflect operating expenses of the class. Expenses before reductions do not reflect amounts reimbursed, waived, or reduced through arrangements with the investment adviser, brokerage services, or other offset arrangements, if applicable, and do not represent the amount paid by the class during periods when reimbursements, waivers or reductions occur.
G Amount does not include the portfolio activity of any underlying mutual funds or exchange-traded funds (ETFs).
H Annualized
I On certain classes, the size and fluctuation of net assets and expense amounts may cause ratios to differ from contractual rates.
See accompanying notes which are an integral part of the financial statements.
Fidelity Advisor Freedom Income Fund Class Z6
| | Six months ended (Unaudited) September 30, | Years endedMarch 31, | | |
| | 2020 | 2020 | 2019 | 2018 A |
| Selected Per–Share Data | | | | |
| Net asset value, beginning of period | $10.52 | $10.78 | $11.04 | $11.09 |
| Income from Investment Operations | | | | |
| Net investment income (loss)B | .06 | .22 | .23 | .27 |
| Net realized and unrealized gain (loss) | .92 | (.06)C | .13 | .03 |
| Total from investment operations | .98 | .16 | .36 | .30 |
| Distributions from net investment income | (.06) | (.22) | (.24) | (.16) |
| Distributions from net realized gain | (.13) | (.20) | (.38) | (.19) |
| Total distributions | (.19) | (.42) | (.62) | (.35) |
| Net asset value, end of period | $11.31 | $10.52 | $10.78 | $11.04 |
| Total ReturnD,E | 9.36% | 1.38%C | 3.48% | 2.69% |
| Ratios to Average Net AssetsF,G | | | | |
| Expenses before reductions | .37%H | .36%I | .37% | .37%H |
| Expenses net of fee waivers, if any | .37%H | .36%I | .37% | .37%H |
| Expenses net of all reductions | .36%H | .36%I | .37% | .37%H |
| Net investment income (loss) | 1.01%H | 1.99% | 2.19% | 2.92%H |
| Supplemental Data | | | | |
| Net assets, end of period (000 omitted) | $21,303 | $21,248 | $25,022 | $1,693 |
| Portfolio turnover rateG | 32%H | 25% | 36% | 21% |
A For the period June 6, 2017 (commencement of sale of shares) to March 31, 2018.
B Calculated based on average shares outstanding during the period.
C Amount includes a gain realized from an operational error which amounted to $0.01 per share. Excluding this gain, the total return would have been 1.27%.
D Total returns for periods of less than one year are not annualized.
E Total returns would have been lower if certain expenses had not been reduced during the applicable periods shown.
F Expense ratios reflect operating expenses of the class. Expenses before reductions do not reflect amounts reimbursed, waived, or reduced through arrangements with the investment adviser, brokerage services, or other offset arrangements, if applicable, and do not represent the amount paid by the class during periods when reimbursements, waivers or reductions occur.
G Amount does not include the portfolio activity of any underlying mutual funds or exchange-traded funds (ETFs).
H Annualized
I On certain classes, the size and fluctuation of net assets and expense amounts may cause ratios to differ from contractual-rates.
See accompanying notes which are an integral part of the financial statements.
Fidelity Advisor Freedom® 2005 Fund
Investment Summary (Unaudited)
The information in the following tables is based on the direct investments of the Fund.
Top Holdings as of September 30, 2020
| | % of fund's net assets |
| Fidelity Series Investment Grade Bond Fund | 36.7 |
| Fidelity Series Government Money Market Fund 0.16% | 17.1 |
| Fidelity Series Inflation-Protected Bond Index Fund | 11.1 |
| Fidelity Series Emerging Markets Opportunities Fund | 6.9 |
| Fidelity Series Short-Term Credit Fund | 4.1 |
| Fidelity Series Commodity Strategy Fund | 2.4 |
| Fidelity Series Long-Term Treasury Bond Index Fund | 2.3 |
| Fidelity Series Large Cap Stock Fund | 1.9 |
| Fidelity Series International Growth Fund | 1.9 |
| Fidelity Series Overseas Fund | 1.9 |
| | 86.3 |
Asset Allocation (% of fund's net assets)
| Period end |
| | Domestic Equity Funds | 12.0% |
| | International Equity Funds | 14.4% |
| | Bond Funds | 52.0% |
| | Short-Term Funds | 21.5% |
| | Short-Term Investments | 0.1% |

Domestic Equity Funds category includes Fidelity Series Commodity Strategy Fund which invests in commodity-related investments.
Fidelity Advisor Freedom® 2005 Fund
Schedule of Investments September 30, 2020 (Unaudited)
Showing Percentage of Net Assets
| U.S. Treasury Obligations - 0.1% | | | |
| | | Principal Amount | Value |
| U.S. Treasury Bills, yield at date of purchase 0.1% to 0.11% 12/3/20 to 12/10/20 (a) | | | |
| (Cost $159,968) | | 160,000 | 159,970 |
| | | Shares | Value |
|
| Domestic Equity Funds - 12.0% | | | |
| Fidelity Advisor Series Equity Growth Fund (b) | | 108,779 | $1,978,693 |
| Fidelity Advisor Series Growth Opportunities Fund (b) | | 74,194 | 1,364,424 |
| Fidelity Advisor Series Small Cap Fund (b) | | 80,531 | 896,311 |
| Fidelity Series All-Sector Equity Fund (b) | | 80,109 | 853,159 |
| Fidelity Series Commodity Strategy Fund (b) | | 951,913 | 3,959,958 |
| Fidelity Series Large Cap Stock Fund (b) | | 221,273 | 3,133,228 |
| Fidelity Series Large Cap Value Index Fund (b) | | 29,173 | 338,412 |
| Fidelity Series Opportunistic Insights Fund (b) | | 85,053 | 1,839,704 |
| Fidelity Series Small Cap Opportunities Fund (b) | | 86,443 | 1,103,019 |
| Fidelity Series Stock Selector Large Cap Value Fund (b) | | 181,032 | 1,991,351 |
| Fidelity Series Value Discovery Fund (b) | | 164,769 | 2,036,542 |
| TOTAL DOMESTIC EQUITY FUNDS | | | |
| (Cost $15,849,055) | | | 19,494,801 |
|
| International Equity Funds - 14.4% | | | |
| Fidelity Series Canada Fund (b) | | 99,352 | 1,016,374 |
| Fidelity Series Emerging Markets Fund (b) | | 129,870 | 1,224,677 |
| Fidelity Series Emerging Markets Opportunities Fund (b) | | 531,836 | 11,157,923 |
| Fidelity Series International Growth Fund (b) | | 162,365 | 3,049,210 |
| Fidelity Series International Small Cap Fund (b) | | 53,072 | 944,677 |
| Fidelity Series International Value Fund (b) | | 343,337 | 2,959,567 |
| Fidelity Series Overseas Fund (b) | | 270,799 | 3,027,532 |
| TOTAL INTERNATIONAL EQUITY FUNDS | | | |
| (Cost $17,723,288) | | | 23,379,960 |
|
| Bond Funds - 52.0% | | | |
| Fidelity Series Emerging Markets Debt Fund (b) | | 116,959 | 1,059,653 |
| Fidelity Series Floating Rate High Income Fund (b) | | 28,837 | 255,203 |
| Fidelity Series High Income Fund (b) | | 122,804 | 1,119,970 |
| Fidelity Series Inflation-Protected Bond Index Fund (b) | | 1,680,953 | 17,986,201 |
| Fidelity Series International Credit Fund (b) | | 12,088 | 125,836 |
| Fidelity Series Investment Grade Bond Fund (b) | | 4,869,523 | 59,602,962 |
| Fidelity Series Long-Term Treasury Bond Index Fund (b) | | 358,806 | 3,706,466 |
| Fidelity Series Real Estate Income Fund (b) | | 73,292 | 731,453 |
| TOTAL BOND FUNDS | | | |
| (Cost $76,170,573) | | | 84,587,744 |
|
| Short-Term Funds - 21.5% | | | |
| Fidelity Cash Central Fund 0.10% (c) | | 454,090 | 454,181 |
| Fidelity Series Government Money Market Fund 0.16% (b)(d) | | 27,816,639 | 27,816,639 |
| Fidelity Series Short-Term Credit Fund (b) | | 653,235 | 6,695,663 |
| TOTAL SHORT-TERM FUNDS | | | |
| (Cost $34,773,188) | | | 34,966,483 |
| TOTAL INVESTMENT IN SECURITIES - 100.0% | | | |
| (Cost $144,676,072) | | | 162,588,958 |
| NET OTHER ASSETS (LIABILITIES) - 0.0% | | | (36,425) |
| NET ASSETS - 100% | | | $162,552,533 |
| Futures Contracts | | | | | |
| | Number of contracts | Expiration Date | Notional Amount | Value | Unrealized Appreciation/(Depreciation) |
| Purchased | | | | | |
| Equity Index Contracts | | | | | |
| ICE E-mini MSCI EAFE Index Contracts (United States) | 1 | Dec. 2020 | $92,660 | $(2) | $(2) |
| Sold | | | | | |
| Equity Index Contracts | | | | | |
| CME E-mini S&P 500 Index Contracts (United States) | 1 | Dec. 2020 | 167,600 | (1,094) | (1,094) |
| TOTAL FUTURES CONTRACTS | | | | | $(1,096) |
The notional amount of futures purchased as a percentage of Net Assets is 0.1%
The notional amount of futures sold as a percentage of Net Assets is 0.1%
Legend
(a) Security or a portion of the security was pledged to cover margin requirements for futures contracts. At period end, the value of securities pledged amounted to $159,970.
(b) Affiliated Fund
(c) Affiliated fund that is generally available only to investment companies and other accounts managed by Fidelity Investments. The rate quoted is the annualized seven-day yield of the fund at period end. A complete unaudited listing of the fund's holdings as of its most recent quarter end is available upon request. In addition, each Fidelity Central Fund's financial statements are available on the SEC's website or upon request.
(d) The rate quoted is the annualized seven-day yield of the fund at period end.
Affiliated Central Funds
Information regarding fiscal year to date income earned by the Fund from investments in Fidelity Central Funds is as follows:
| Fund | Income earned |
| Fidelity Cash Central Fund | $350 |
| Total | $350 |
Amounts in the income column in the above table include any capital gain distributions from underlying funds, which are presented in the corresponding line-item in the Statement of Operations, if applicable.
Affiliated Underlying Funds
Fiscal year to date information regarding the Fund's investments in affiliated Underlying Funds, excluding any Money Market Central Funds, is presented below. Exchanges between classes of the same affiliated Underlying Funds may occur.
| Affiliate | Value, beginning of period | Purchases | Sales Proceeds | Dividend Income | Realized Gain (loss) | Change in Unrealized appreciation (depreciation) | Value, end of period |
| Fidelity Advisor Series Equity Growth Fund | $1,666,180 | $363,089 | $859,193 | $-- | $256,217 | $552,400 | $1,978,693 |
| Fidelity Advisor Series Growth Opportunities Fund | 923,185 | 444,818 | 671,652 | -- | 129,174 | 538,899 | 1,364,424 |
| Fidelity Advisor Series Small Cap Fund | 678,094 | 249,884 | 249,229 | -- | (2,835) | 220,397 | 896,311 |
| Fidelity Series All-Sector Equity Fund | 722,384 | 180,031 | 310,466 | -- | 11,774 | 249,436 | 853,159 |
| Fidelity Series Canada Fund | 712,048 | 243,974 | 152,190 | -- | (14,342) | 226,884 | 1,016,374 |
| Fidelity Series Commodity Strategy Fund | 4,987,475 | 222,800 | 1,790,494 | 16,954 | (485,782) | 1,025,959 | 3,959,958 |
| Fidelity Series Emerging Markets Debt Fund | 943,028 | 77,444 | 79,027 | 27,740 | (859) | 119,067 | 1,059,653 |
| Fidelity Series Emerging Markets Fund | 707,859 | 380,319 | 153,782 | -- | 74 | 290,207 | 1,224,677 |
| Fidelity Series Emerging Markets Opportunities Fund | 6,640,525 | 3,447,999 | 1,789,286 | -- | 145,872 | 2,712,813 | 11,157,923 |
| Fidelity Series Floating Rate High Income Fund | 233,060 | 17,672 | 19,119 | 5,647 | (436) | 24,026 | 255,203 |
| Fidelity Series Government Money Market Fund 0.16% | 28,109,999 | 6,058,173 | 6,351,533 | 32,486 | -- | -- | 27,816,639 |
| Fidelity Series High Income Fund | 1,015,645 | 90,559 | 95,597 | 30,433 | 1,345 | 108,018 | 1,119,970 |
| Fidelity Series Inflation-Protected Bond Index Fund | 16,675,121 | 1,905,316 | 1,628,879 | 14,181 | 11,309 | 1,023,334 | 17,986,201 |
| Fidelity Series International Credit Fund | 113,848 | 1,769 | -- | 1,769 | -- | 10,219 | 125,836 |
| Fidelity Series International Growth Fund | 3,899,704 | 179,074 | 1,953,983 | -- | 779,828 | 144,587 | 3,049,210 |
| Fidelity Series International Small Cap Fund | 931,403 | 45,583 | 301,042 | -- | 58,909 | 209,824 | 944,677 |
| Fidelity Series International Value Fund | 3,221,518 | 196,256 | 1,072,501 | -- | (49,553) | 663,847 | 2,959,567 |
| Fidelity Series Investment Grade Bond Fund | 55,741,096 | 6,331,738 | 5,862,935 | 760,059 | 38,970 | 3,354,093 | 59,602,962 |
| Fidelity Series Large Cap Stock Fund | 2,430,531 | 992,982 | 680,994 | 125,727 | (34,350) | 425,059 | 3,133,228 |
| Fidelity Series Large Cap Value Index Fund | 258,890 | 75,178 | 52,293 | -- | 2,246 | 54,391 | 338,412 |
| Fidelity Series Long-Term Treasury Bond Index Fund | 3,817,340 | 717,577 | 711,641 | 97,238 | 66,872 | (183,682) | 3,706,466 |
| Fidelity Series Opportunistic Insights Fund | 1,586,370 | 323,846 | 756,317 | -- | 230,270 | 455,535 | 1,839,704 |
| Fidelity Series Overseas Fund | 3,004,872 | 483,002 | 1,323,556 | -- | (55,102) | 918,316 | 3,027,532 |
| Fidelity Series Real Estate Income Fund | 615,792 | 61,003 | 59,924 | 23,308 | 517 | 114,065 | 731,453 |
| Fidelity Series Short-Term Credit Fund | 6,376,386 | 116,219 | 36,343 | 72,822 | 315 | 239,086 | 6,695,663 |
| Fidelity Series Small Cap Opportunities Fund | 847,281 | 339,820 | 292,430 | 7,705 | 6,778 | 201,570 | 1,103,019 |
| Fidelity Series Stock Selector Large Cap Value Fund | 1,557,195 | 389,402 | 305,277 | -- | (7,275) | 357,306 | 1,991,351 |
| Fidelity Series Value Discovery Fund | 1,540,712 | 407,644 | 294,462 | -- | (4,789) | 387,437 | 2,036,542 |
| | $149,957,541 | $24,343,171 | $27,854,145 | $1,216,069 | $1,085,147 | $14,443,093 | $161,974,807 |
Amounts in the income column in the above table include any capital gain distributions from underlying funds, which are presented in the corresponding line-item in the Statement of Operations, if applicable.
Investment Valuation
The following is a summary of the inputs used, as of September 30, 2020, involving the Fund's assets and liabilities carried at fair value. The inputs or methodology used for valuing securities may not be an indication of the risk associated with investing in those securities. For more information on valuation inputs, and their aggregation into the levels used below, please refer to the Investment Valuation section in the accompanying Notes to Financial Statements.
| | Valuation Inputs at Reporting Date: |
| Description | Total | Level 1 | Level 2 | Level 3 |
| Investments in Securities: | | | | |
| Other Short-Term Investments and Net Other Assets | $159,970 | $-- | $159,970 | $-- |
| Domestic Equity Funds | 19,494,801 | 19,494,801 | -- | -- |
| International Equity Funds | 23,379,960 | 23,379,960 | -- | -- |
| Bond Funds | 84,587,744 | 84,587,744 | -- | -- |
| Short-Term Funds | 34,966,483 | 34,966,483 | -- | -- |
| Total Investments in Securities: | $162,588,958 | $162,428,988 | $159,970 | $-- |
| Derivative Instruments: | | | | |
| Liabilities | | | | |
| Futures Contracts | $(1,096) | $(1,096) | $-- | $-- |
| Total Liabilities | $(1,096) | $(1,096) | $-- | $-- |
| Total Derivative Instruments: | $(1,096) | $(1,096) | $-- | $-- |
Value of Derivative Instruments
The following table is a summary of the Fund's value of derivative instruments by primary risk exposure as of September 30, 2020. For additional information on derivative instruments, please refer to the Derivative Instruments section in the accompanying Notes to Financial Statements.
| Primary Risk Exposure / Derivative Type | Value |
| | Asset | Liability |
| Equity Risk | | |
| Futures Contracts(a) | $0 | $(1,096) |
| Total Equity Risk | 0 | (1,096) |
| Total Value of Derivatives | $0 | $(1,096) |
(a) Reflects gross cumulative appreciation (depreciation) on futures contracts as presented in the Schedule of Investments. In the Statement of Assets and Liabilities, the period end daily variation margin is included in receivable or payable for daily variation margin on futures contracts, and the net cumulative appreciation (depreciation) is included in Total accumulated earnings (loss).
See accompanying notes which are an integral part of the financial statements.
Fidelity Advisor Freedom® 2005 Fund
Financial Statements
Statement of Assets and Liabilities
| | | September 30, 2020 (Unaudited) |
| Assets | | |
Investment in securities, at value — See accompanying schedule:
Unaffiliated issuers (cost $159,968) | $159,970 | |
| Fidelity Central Funds (cost $454,187) | 454,181 | |
| Other affiliated issuers (cost $144,061,917) | 161,974,807 | |
| Total Investment in Securities (cost $144,676,072) | | $162,588,958 |
| Cash | | 7,995 |
| Receivable for investments sold | | 2,949,034 |
| Receivable for fund shares sold | | 47,453 |
| Distributions receivable from Fidelity Central Funds | | 41 |
| Total assets | | 165,593,481 |
| Liabilities | | |
| Payable for investments purchased | $2,766,930 | |
| Payable for fund shares redeemed | 172,333 | |
| Accrued management fee | 62,614 | |
| Distribution and service plan fees payable | 27,013 | |
| Payable for daily variation margin on futures contracts | 12,058 | |
| Total liabilities | | 3,040,948 |
| Net Assets | | $162,552,533 |
| Net Assets consist of: | | |
| Paid in capital | | $143,477,774 |
| Total accumulated earnings (loss) | | 19,074,759 |
| Net Assets | | $162,552,533 |
| Net Asset Value and Maximum Offering Price | | |
| Class A: | | |
| Net Asset Value and redemption price per share ($79,650,135 ÷ 6,781,415 shares)(a) | | $11.75 |
| Maximum offering price per share (100/94.25 of $11.75) | | $12.47 |
| Class M: | | |
| Net Asset Value and redemption price per share ($21,702,203 ÷ 1,851,277 shares)(a) | | $11.72 |
| Maximum offering price per share (100/96.50 of $11.72) | | $12.15 |
| Class C: | | |
| Net Asset Value and offering price per share ($1,723,371 ÷ 146,913 shares)(a) | | $11.73 |
| Class I: | | |
| Net Asset Value, offering price and redemption price per share ($52,102,312 ÷ 4,399,104 shares) | | $11.84 |
| Class Z: | | |
| Net Asset Value, offering price and redemption price per share ($3,644,216 ÷ 309,243 shares) | | $11.78 |
| Class Z6: | | |
| Net Asset Value, offering price and redemption price per share ($3,730,296 ÷ 315,801 shares) | | $11.81 |
(a) Redemption price per share is equal to net asset value less any applicable contingent deferred sales charge.
See accompanying notes which are an integral part of the financial statements.
Statement of Operations
| | | Six months ended September 30, 2020 (Unaudited) |
| Investment Income | | |
| Dividends: | | |
| Affiliated issuers | | $1,061,186 |
| Interest | | 236 |
| Income from Fidelity Central Funds | | 350 |
| Total income | | 1,061,772 |
| Expenses | | |
| Management fee | $370,518 | |
| Distribution and service plan fees | 161,995 | |
| Independent trustees' fees and expenses | 222 | |
| Total expenses before reductions | 532,735 | |
| Expense reductions | (239) | |
| Total expenses after reductions | | 532,496 |
| Net investment income (loss) | | 529,276 |
| Realized and Unrealized Gain (Loss) | | |
| Net realized gain (loss) on: | | |
| Investment securities: | | |
| Unaffiliated issuers | 1 | |
| Fidelity Central Funds | (40) | |
| Other affiliated issuers | 1,085,147 | |
| Futures contracts | (99,492) | |
| Capital gain distributions from underlying funds: | | |
| Affiliated issuers | 154,883 | |
| Total net realized gain (loss) | | 1,140,499 |
| Change in net unrealized appreciation (depreciation) on: | | |
| Investment securities: | | |
| Unaffiliated issuers | (138) | |
| Fidelity Central Funds | (13) | |
| Other affiliated issuers | 14,443,093 | |
| Futures contracts | (1,096) | |
| Total change in net unrealized appreciation (depreciation) | | 14,441,846 |
| Net gain (loss) | | 15,582,345 |
| Net increase (decrease) in net assets resulting from operations | | $16,111,621 |
See accompanying notes which are an integral part of the financial statements.
Statement of Changes in Net Assets
| | Six months ended September 30, 2020 (Unaudited) | Year ended March 31, 2020 |
| Increase (Decrease) in Net Assets | | |
| Operations | | |
| Net investment income (loss) | $529,276 | $2,749,654 |
| Net realized gain (loss) | 1,140,499 | 5,537,873 |
| Change in net unrealized appreciation (depreciation) | 14,441,846 | (7,583,822) |
| Net increase (decrease) in net assets resulting from operations | 16,111,621 | 703,705 |
| Distributions to shareholders | (3,413,641) | (7,692,057) |
| Share transactions - net increase (decrease) | (783,292) | (6,776,446) |
| Total increase (decrease) in net assets | 11,914,688 | (13,764,798) |
| Net Assets | | |
| Beginning of period | 150,637,845 | 164,402,643 |
| End of period | $162,552,533 | $150,637,845 |
See accompanying notes which are an integral part of the financial statements.
Financial Highlights
Fidelity Advisor Freedom 2005 Fund Class A
| | Six months ended (Unaudited) September 30, | Years endedMarch 31, | | | | |
| | 2020 | 2020 | 2019 | 2018 | 2017 | 2016 |
| Selected Per–Share Data | | | | | | |
| Net asset value, beginning of period | $10.85 | $11.36 | $11.92 | $11.84 | $11.44 | $12.10 |
| Income from Investment Operations | | | | | | |
| Net investment income (loss)A | .03 | .19 | .21 | .16 | .17 | .19 |
| Net realized and unrealized gain (loss) | 1.11 | (.16) | .14 | .53 | .67 | (.34) |
| Total from investment operations | 1.14 | .03 | .35 | .69 | .84 | (.15) |
| Distributions from net investment income | (.02) | (.20) | (.22) | (.17) | (.19)B | (.20) |
| Distributions from net realized gain | (.22) | (.34) | (.68) | (.44) | (.25)B | (.32) |
| Total distributions | (.24) | (.54) | (.91)C | (.61) | (.44) | (.51)C |
| Net asset value, end of period | $11.75 | $10.85 | $11.36 | $11.92 | $11.84 | $11.44 |
| Total ReturnD,E,F | 10.69% | .04% | 3.24% | 5.87% | 7.55% | (1.23)% |
| Ratios to Average Net AssetsG,H | | | | | | |
| Expenses before reductions | .71%I,J | .72% | .73% | .66% | .25% | .25% |
| Expenses net of fee waivers, if any | .71%I,J | .72% | .73% | .66% | .25% | .25% |
| Expenses net of all reductions | .71%I,J | .72% | .73% | .66% | .25% | .25% |
| Net investment income (loss) | .61%I | 1.62% | 1.80% | 1.34% | 1.46% | 1.62% |
| Supplemental Data | | | | | | |
| Net assets, end of period (000 omitted) | $79,650 | $74,103 | $86,981 | $101,642 | $118,902 | $134,262 |
| Portfolio turnover rateH | 31%I | 28% | 28% | 20% | 32% | 30% |
A Calculated based on average shares outstanding during the period.
B The amounts shown reflect certain reclassifications related to book to tax differences that were made in the year shown.
C Total distributions per share do not sum due to rounding.
D Total returns for periods of less than one year are not annualized.
E Total returns would have been lower if certain expenses had not been reduced during the applicable periods shown.
F Total returns do not include the effect of the sales charges.
G Expense ratios reflect operating expenses of the class. Expenses before reductions do not reflect amounts reimbursed, waived, or reduced through arrangements with the investment adviser, brokerage services, or other offset arrangements, if applicable, and do not represent the amount paid by the class during periods when reimbursements, waivers or reductions occur.
H Amount does not include the portfolio activity of any underlying mutual funds or exchange-traded funds (ETFs).
I Annualized
J On certain classes, the size and fluctuation of net assets and expense amounts may cause ratios to differ from contractual rates.
See accompanying notes which are an integral part of the financial statements.
Fidelity Advisor Freedom 2005 Fund Class M
| | Six months ended (Unaudited) September 30, | Years endedMarch 31, | | | | |
| | 2020 | 2020 | 2019 | 2018 | 2017 | 2016 |
| Selected Per–Share Data | | | | | | |
| Net asset value, beginning of period | $10.83 | $11.35 | $11.91 | $11.83 | $11.43 | $12.09 |
| Income from Investment Operations | | | | | | |
| Net investment income (loss)A | .02 | .16 | .18 | .13 | .14 | .16 |
| Net realized and unrealized gain (loss) | 1.11 | (.17) | .14 | .53 | .67 | (.33) |
| Total from investment operations | 1.13 | (.01) | .32 | .66 | .81 | (.17) |
| Distributions from net investment income | (.02) | (.17) | (.19) | (.14) | (.16)B | (.17) |
| Distributions from net realized gain | (.22) | (.34) | (.68) | (.44) | (.25)B | (.32) |
| Total distributions | (.24) | (.51) | (.88)C | (.58) | (.41) | (.49) |
| Net asset value, end of period | $11.72 | $10.83 | $11.35 | $11.91 | $11.83 | $11.43 |
| Total ReturnD,E,F | 10.54% | (.31)% | 2.98% | 5.64% | 7.29% | (1.45)% |
| Ratios to Average Net AssetsG,H | | | | | | |
| Expenses before reductions | .96%I,J | .97% | .98% | .91% | .50% | .50% |
| Expenses net of fee waivers, if any | .96%I,J | .97% | .98% | .91% | .50% | .50% |
| Expenses net of all reductions | .96%I,J | .97% | .98% | .91% | .50% | .50% |
| Net investment income (loss) | .36%I | 1.37% | 1.55% | 1.08% | 1.21% | 1.37% |
| Supplemental Data | | | | | | |
| Net assets, end of period (000 omitted) | $21,702 | $22,480 | $24,132 | $25,730 | $27,091 | $29,347 |
| Portfolio turnover rateH | 31%I | 28% | 28% | 20% | 32% | 30% |
A Calculated based on average shares outstanding during the period.
B The amounts shown reflect certain reclassifications related to book to tax differences that were made in the year shown.
C Total distributions per share do not sum due to rounding.
D Total returns for periods of less than one year are not annualized.
E Total returns would have been lower if certain expenses had not been reduced during the applicable periods shown.
F Total returns do not include the effect of the sales charges.
G Expense ratios reflect operating expenses of the class. Expenses before reductions do not reflect amounts reimbursed, waived, or reduced through arrangements with the investment adviser, brokerage services, or other offset arrangements, if applicable, and do not represent the amount paid by the class during periods when reimbursements, waivers or reductions occur.
H Amount does not include the portfolio activity of any underlying mutual funds or exchange-traded funds (ETFs).
I Annualized
J On certain classes, the size and fluctuation of net assets and expense amounts may cause ratios to differ from contractual rates.
See accompanying notes which are an integral part of the financial statements.
Fidelity Advisor Freedom 2005 Fund Class C
| | Six months ended (Unaudited) September 30, | Years endedMarch 31, | | | | |
| | 2020 | 2020 | 2019 | 2018 | 2017 | 2016 |
| Selected Per–Share Data | | | | | | |
| Net asset value, beginning of period | $10.85 | $11.35 | $11.91 | $11.81 | $11.41 | $12.06 |
| Income from Investment Operations | | | | | | |
| Net investment income (loss)A | (.01) | .10 | .12 | .07 | .08 | .10 |
| Net realized and unrealized gain (loss) | 1.11 | (.16) | .13 | .54 | .67 | (.33) |
| Total from investment operations | 1.10 | (.06) | .25 | .61 | .75 | (.23) |
| Distributions from net investment income | – | (.10) | (.12) | (.07) | (.10)B | (.10) |
| Distributions from net realized gain | (.22) | (.34) | (.68) | (.44) | (.25)B | (.32) |
| Total distributions | (.22) | (.44) | (.81)C | (.51) | (.35) | (.42) |
| Net asset value, end of period | $11.73 | $10.85 | $11.35 | $11.91 | $11.81 | $11.41 |
| Total ReturnD,E,F | 10.26% | (.70)% | 2.35% | 5.21% | 6.75% | (1.98)% |
| Ratios to Average Net AssetsG,H | | | | | | |
| Expenses before reductions | 1.46%I,J | 1.47% | 1.48% | 1.41% | 1.00% | 1.00% |
| Expenses net of fee waivers, if any | 1.46%I,J | 1.47% | 1.48% | 1.41% | 1.00% | 1.00% |
| Expenses net of all reductions | 1.46%I,J | 1.47% | 1.48% | 1.41% | 1.00% | 1.00% |
| Net investment income (loss) | (.14)%I | .87% | 1.05% | .58% | .71% | .87% |
| Supplemental Data | | | | | | |
| Net assets, end of period (000 omitted) | $1,723 | $1,642 | $2,302 | $5,867 | $5,623 | $6,200 |
| Portfolio turnover rateH | 31%I | 28% | 28% | 20% | 32% | 30% |
A Calculated based on average shares outstanding during the period.
B The amounts shown reflect certain reclassifications related to book to tax differences that were made in the year shown.
C Total distributions per share do not sum due to rounding.
D Total returns for periods of less than one year are not annualized.
E Total returns would have been lower if certain expenses had not been reduced during the applicable periods shown.
F Total returns do not include the effect of the contingent deferred sales charge.
G Expense ratios reflect operating expenses of the class. Expenses before reductions do not reflect amounts reimbursed, waived, or reduced through arrangements with the investment adviser, brokerage services, or other offset arrangements, if applicable, and do not represent the amount paid by the class during periods when reimbursements, waivers or reductions occur.
H Amount does not include the portfolio activity of any underlying mutual funds or exchange-traded funds (ETFs).
I Annualized
J On certain classes, the size and fluctuation of net assets and expense amounts may cause ratios to differ from contractual rates.
See accompanying notes which are an integral part of the financial statements.
Fidelity Advisor Freedom 2005 Fund Class I
| | Six months ended (Unaudited) September 30, | Years endedMarch 31, | | | | |
| | 2020 | 2020 | 2019 | 2018 | 2017 | 2016 |
| Selected Per–Share Data | | | | | | |
| Net asset value, beginning of period | $10.93 | $11.45 | $12.00 | $11.92 | $11.51 | $12.18 |
| Income from Investment Operations | | | | | | |
| Net investment income (loss)A | .05 | .22 | .24 | .19 | .20 | .22 |
| Net realized and unrealized gain (loss) | 1.11 | (.17) | .14 | .54 | .68 | (.34) |
| Total from investment operations | 1.16 | .05 | .38 | .73 | .88 | (.12) |
| Distributions from net investment income | (.03) | (.23) | (.25) | (.20) | (.22)B | (.23) |
| Distributions from net realized gain | (.22) | (.34) | (.68) | (.44) | (.25)B | (.32) |
| Total distributions | (.25) | (.57) | (.93) | (.65)C | (.47) | (.55) |
| Net asset value, end of period | $11.84 | $10.93 | $11.45 | $12.00 | $11.92 | $11.51 |
| Total ReturnD,E | 10.79% | .21% | 3.53% | 6.13% | 7.87% | (1.04)% |
| Ratios to Average Net AssetsF,G | | | | | | |
| Expenses before reductions | .46%H,I | .47% | .48% | .41% | - %J | - %J |
| Expenses net of fee waivers, if any | .46%H,I | .47% | .48% | .41% | -% | -% |
| Expenses net of all reductions | .46%H,I | .47% | .48% | .41% | -% | -% |
| Net investment income (loss) | .86%H | 1.87% | 2.05% | 1.58% | 1.71% | 1.87% |
| Supplemental Data | | | | | | |
| Net assets, end of period (000 omitted) | $52,102 | $46,911 | $49,013 | $59,386 | $58,940 | $61,440 |
| Portfolio turnover rateG | 31%H | 28% | 28% | 20% | 32% | 30% |
A Calculated based on average shares outstanding during the period.
B The amounts shown reflect certain reclassifications related to book to tax differences that were made in the year shown.
C Total distributions per share do not sum due to rounding.
D Total returns for periods of less than one year are not annualized.
E Total returns would have been lower if certain expenses had not been reduced during the applicable periods shown.
F Expense ratios reflect operating expenses of the class. Expenses before reductions do not reflect amounts reimbursed, waived, or reduced through arrangements with the investment adviser, brokerage services, or other offset arrangements, if applicable, and do not represent the amount paid by the class during periods when reimbursements, waivers or reductions occur.
G Amount does not include the portfolio activity of any underlying mutual funds or exchange-traded funds (ETFs).
H Annualized
I On certain classes, the size and fluctuation of net assets and expense amounts may cause ratios to differ from contractual rates.
J Amount represents less than .005%.
See accompanying notes which are an integral part of the financial statements.
Fidelity Advisor Freedom 2005 Fund Class Z
| | Six months ended (Unaudited) September 30, | Years endedMarch 31, | |
| | 2020 | 2020 | 2019 A |
| Selected Per–Share Data | | | |
| Net asset value, beginning of period | $10.88 | $11.41 | $11.84 |
| Income from Investment Operations | | | |
| Net investment income (loss)B | .05 | .22 | .20 |
| Net realized and unrealized gain (loss) | 1.11 | (.16) | .01 |
| Total from investment operations | 1.16 | .06 | .21 |
| Distributions from net investment income | (.03) | (.25) | (.26) |
| Distributions from net realized gain | (.22) | (.34) | (.39) |
| Total distributions | (.26)C | (.59) | (.64)C |
| Net asset value, end of period | $11.78 | $10.88 | $11.41 |
| Total ReturnD,E | 10.78% | .32% | 2.09% |
| Ratios to Average Net AssetsF,G | | | |
| Expenses before reductions | .41%H,I | .42% | .43%H |
| Expenses net of fee waivers, if any | .41%H,I | .42% | .43%H |
| Expenses net of all reductions | .41%H,I | .42% | .43%H |
| Net investment income (loss) | .91%H | 1.92% | 3.58%H |
| Supplemental Data | | | |
| Net assets, end of period (000 omitted) | $3,644 | $2,851 | $126 |
| Portfolio turnover rateG | 31%H | 28% | 28% |
A For the period October 2, 2018 (commencement of sale of shares) to March 31, 2019.
B Calculated based on average shares outstanding during the period.
C Total distributions per share do not sum due to rounding.
D Total returns for periods of less than one year are not annualized.
E Total returns would have been lower if certain expenses had not been reduced during the applicable periods shown.
F Expense ratios reflect operating expenses of the class. Expenses before reductions do not reflect amounts reimbursed, waived, or reduced through arrangements with the investment adviser, brokerage services, or other offset arrangements, if applicable, and do not represent the amount paid by the class during periods when reimbursements, waivers or reductions occur.
G Amount does not include the portfolio activity of any underlying mutual funds or exchange-traded funds (ETFs).
H Annualized
I On certain classes, the size and fluctuation of net assets and expense amounts may cause ratios to differ from contractual rates.
See accompanying notes which are an integral part of the financial statements.
Fidelity Advisor Freedom 2005 Fund Class Z6
| | Six months ended (Unaudited) September 30, | Years endedMarch 31, | | |
| | 2020 | 2020 | 2019 | 2018 A |
| Selected Per–Share Data | | | | |
| Net asset value, beginning of period | $10.90 | $11.42 | $12.00 | $12.04 |
| Income from Investment Operations | | | | |
| Net investment income (loss)B | .06 | .23 | .25 | .13 |
| Net realized and unrealized gain (loss) | 1.11 | (.16) | .13 | .33 |
| Total from investment operations | 1.17 | .07 | .38 | .46 |
| Distributions from net investment income | (.04) | (.25) | (.28) | (.19) |
| Distributions from net realized gain | (.22) | (.34) | (.68) | (.31) |
| Total distributions | (.26) | (.59) | (.96) | (.50) |
| Net asset value, end of period | $11.81 | $10.90 | $11.42 | $12.00 |
| Total ReturnC,D | 10.86% | .35% | 3.53% | 3.78% |
| Ratios to Average Net AssetsE,F | | | | |
| Expenses before reductions | .36%G,H | .37% | .37% | .39%G,H |
| Expenses net of fee waivers, if any | .36%G,H | .37% | .37% | .39%G,H |
| Expenses net of all reductions | .36%G,H | .37% | .37% | .39%G,H |
| Net investment income (loss) | .96%G | 1.97% | 2.16% | 1.30%G |
| Supplemental Data | | | | |
| Net assets, end of period (000 omitted) | $3,730 | $2,652 | $1,849 | $1,408 |
| Portfolio turnover rateF | 31%G | 28% | 28% | 20% |
A For the period June 6, 2017 (commencement of sale of shares) to March 31, 2018.
B Calculated based on average shares outstanding during the period.
C Total returns for periods of less than one year are not annualized.
D Total returns would have been lower if certain expenses had not been reduced during the applicable periods shown.
E Expense ratios reflect operating expenses of the class. Expenses before reductions do not reflect amounts reimbursed, waived, or reduced through arrangements with the investment adviser, brokerage services, or other offset arrangements, if applicable, and do not represent the amount paid by the class during periods when reimbursements, waivers or reductions occur.
F Amount does not include the portfolio activity of any underlying mutual funds or exchange-traded funds (ETFs).
G Annualized
H On certain classes, the size and fluctuation of net assets and expense amounts may cause ratios to differ from contractual rates.
See accompanying notes which are an integral part of the financial statements.
Fidelity Advisor Freedom® 2010 Fund
Investment Summary (Unaudited)
The information in the following tables is based on the direct investments of the Fund.
Top Holdings as of September 30, 2020
| | % of fund's net assets |
| Fidelity Series Investment Grade Bond Fund | 33.1 |
| Fidelity Series Government Money Market Fund 0.16% | 13.7 |
| Fidelity Series Inflation-Protected Bond Index Fund | 9.6 |
| Fidelity Series Emerging Markets Opportunities Fund | 7.9 |
| Fidelity Series Short-Term Credit Fund | 3.4 |
| Fidelity Series Large Cap Stock Fund | 3.0 |
| Fidelity Series International Growth Fund | 2.6 |
| Fidelity Series Overseas Fund | 2.6 |
| Fidelity Series International Value Fund | 2.5 |
| Fidelity Series Commodity Strategy Fund | 2.5 |
| | 80.9 |
Asset Allocation (% of fund's net assets)
| Period end |
| | Domestic Equity Funds | 17.5% |
| | International Equity Funds | 18.1% |
| | Bond Funds | 47.0% |
| | Short-Term Funds | 17.3% |
| | Short-Term Investments | 0.1% |

Domestic Equity Funds category includes Fidelity Series Commodity Strategy Fund which invests in commodity-related investments.
Fidelity Advisor Freedom® 2010 Fund
Schedule of Investments September 30, 2020 (Unaudited)
Showing Percentage of Net Assets
| U.S. Treasury Obligations - 0.1% | | | |
| | | Principal Amount | Value |
| U.S. Treasury Bills, yield at date of purchase 0.1% to 0.13% 10/1/20 to 12/10/20 (a) | | | |
| (Cost $459,917) | | 460,000 | 459,920 |
| | | Shares | Value |
|
| Domestic Equity Funds - 17.5% | | | |
| Fidelity Advisor Series Equity Growth Fund (b) | | 398,089 | $7,241,246 |
| Fidelity Advisor Series Growth Opportunities Fund (b) | | 271,521 | 4,993,269 |
| Fidelity Advisor Series Small Cap Fund (b) | | 294,627 | 3,279,193 |
| Fidelity Series All-Sector Equity Fund (b) | | 293,019 | 3,120,657 |
| Fidelity Series Commodity Strategy Fund (b) | | 2,232,836 | 9,288,596 |
| Fidelity Series Large Cap Stock Fund (b) | | 809,443 | 11,461,719 |
| Fidelity Series Large Cap Value Index Fund (b) | | 106,750 | 1,238,302 |
| Fidelity Series Opportunistic Insights Fund (b) | | 311,124 | 6,729,613 |
| Fidelity Series Small Cap Opportunities Fund (b) | | 316,302 | 4,036,014 |
| Fidelity Series Stock Selector Large Cap Value Fund (b) | | 662,423 | 7,286,654 |
| Fidelity Series Value Discovery Fund (b) | | 602,904 | 7,451,889 |
| TOTAL DOMESTIC EQUITY FUNDS | | | |
| (Cost $52,718,123) | | | 66,127,152 |
|
| International Equity Funds - 18.1% | | | |
| Fidelity Series Canada Fund (b) | | 317,836 | 3,251,458 |
| Fidelity Series Emerging Markets Fund (b) | | 342,984 | 3,234,343 |
| Fidelity Series Emerging Markets Opportunities Fund (b) | | 1,420,576 | 29,803,684 |
| Fidelity Series International Growth Fund (b) | | 518,842 | 9,743,859 |
| Fidelity Series International Small Cap Fund (b) | | 167,494 | 2,981,386 |
| Fidelity Series International Value Fund (b) | | 1,102,465 | 9,503,249 |
| Fidelity Series Overseas Fund (b) | | 866,780 | 9,690,596 |
| TOTAL INTERNATIONAL EQUITY FUNDS | | | |
| (Cost $52,408,592) | | | 68,208,575 |
|
| Bond Funds - 47.0% | | | |
| Fidelity Series Emerging Markets Debt Fund (b) | | 265,691 | 2,407,163 |
| Fidelity Series Floating Rate High Income Fund (b) | | 65,573 | 580,320 |
| Fidelity Series High Income Fund (b) | | 281,775 | 2,569,785 |
| Fidelity Series Inflation-Protected Bond Index Fund (b) | | 3,369,100 | 36,049,369 |
| Fidelity Series International Credit Fund (b) | | 29,050 | 302,414 |
| Fidelity Series Investment Grade Bond Fund (b) | | 10,217,883 | 125,066,885 |
| Fidelity Series Long-Term Treasury Bond Index Fund (b) | | 832,507 | 8,599,794 |
| Fidelity Series Real Estate Income Fund (b) | | 167,948 | 1,676,121 |
| TOTAL BOND FUNDS | | | |
| (Cost $158,743,901) | | | 177,251,851 |
|
| Short-Term Funds - 17.3% | | | |
| Fidelity Cash Central Fund 0.10% (c) | | 630,607 | 630,734 |
| Fidelity Series Government Money Market Fund 0.16% (b)(d) | | 51,844,395 | 51,844,395 |
| Fidelity Series Short-Term Credit Fund (b) | | 1,254,658 | 12,860,247 |
| TOTAL SHORT-TERM FUNDS | | | |
| (Cost $64,971,488) | | | 65,335,376 |
| TOTAL INVESTMENT IN SECURITIES - 100.0% | | | |
| (Cost $329,302,021) | | | 377,382,874 |
| NET OTHER ASSETS (LIABILITIES) - 0.0% | | | (94,836) |
| NET ASSETS - 100% | | | $377,288,038 |
| Futures Contracts | | | | | |
| | Number of contracts | Expiration Date | Notional Amount | Value | Unrealized Appreciation/(Depreciation) |
| Purchased | | | | | |
| Equity Index Contracts | | | | | |
| ICE E-mini MSCI EAFE Index Contracts (United States) | 3 | Dec. 2020 | $277,980 | $(3,592) | $(3,592) |
| Sold | | | | | |
| Equity Index Contracts | | | | | |
| CME E-mini S&P 500 Index Contracts (United States) | 3 | Dec. 2020 | 502,800 | (3,282) | (3,282) |
| ICE E-mini MSCI Emerging Markets Index Contracts (United States) | 3 | Dec. 2020 | 163,275 | (38) | (38) |
|
| TOTAL SOLD FUTURES | | | | | (3,320) |
|
| TOTAL FUTURES CONTRACTS | | | | | $(6,912) |
The notional amount of futures purchased as a percentage of Net Assets is 0.1%
The notional amount of futures sold as a percentage of Net Assets is 0.2%
Legend
(a) Security or a portion of the security was pledged to cover margin requirements for futures contracts. At period end, the value of securities pledged amounted to $459,920.
(b) Affiliated Fund
(c) Affiliated fund that is generally available only to investment companies and other accounts managed by Fidelity Investments. The rate quoted is the annualized seven-day yield of the fund at period end. A complete unaudited listing of the fund's holdings as of its most recent quarter end is available upon request. In addition, each Fidelity Central Fund's financial statements are available on the SEC's website or upon request.
(d) The rate quoted is the annualized seven-day yield of the fund at period end.
Affiliated Central Funds
Information regarding fiscal year to date income earned by the Fund from investments in Fidelity Central Funds is as follows:
| Fund | Income earned |
| Fidelity Cash Central Fund | $614 |
| Total | $614 |
Amounts in the income column in the above table include any capital gain distributions from underlying funds, which are presented in the corresponding line-item in the Statement of Operations, if applicable.
Affiliated Underlying Funds
Fiscal year to date information regarding the Fund's investments in affiliated Underlying Funds, excluding any Money Market Central Funds, is presented below. Exchanges between classes of the same affiliated Underlying Funds may occur.
| Affiliate | Value, beginning of period | Purchases | Sales Proceeds | Dividend Income | Realized Gain (loss) | Change in Unrealized appreciation (depreciation) | Value, end of period |
| Fidelity Advisor Series Equity Growth Fund | $6,264,325 | $764,260 | $2,737,211 | $-- | $934,051 | $2,015,821 | $7,241,246 |
| Fidelity Advisor Series Growth Opportunities Fund | 4,026,665 | 499,417 | 2,157,014 | -- | 607,900 | 2,016,301 | 4,993,269 |
| Fidelity Advisor Series Small Cap Fund | 2,624,666 | 496,469 | 688,278 | -- | 6,014 | 840,322 | 3,279,193 |
| Fidelity Series All-Sector Equity Fund | 2,711,534 | 296,140 | 852,415 | -- | 32,316 | 933,082 | 3,120,657 |
| Fidelity Series Canada Fund | 2,402,013 | 643,290 | 476,245 | -- | (50,137) | 732,537 | 3,251,458 |
| Fidelity Series Commodity Strategy Fund | 11,808,962 | 345,479 | 4,123,829 | 39,990 | (1,378,183) | 2,636,167 | 9,288,596 |
| Fidelity Series Emerging Markets Debt Fund | 2,241,239 | 114,649 | 223,659 | 64,217 | (9,113) | 284,047 | 2,407,163 |
| Fidelity Series Emerging Markets Fund | 2,012,232 | 880,237 | 451,965 | -- | 5,433 | 788,406 | 3,234,343 |
| Fidelity Series Emerging Markets Opportunities Fund | 18,880,425 | 7,822,108 | 4,663,877 | -- | 340,463 | 7,424,565 | 29,803,684 |
| Fidelity Series Floating Rate High Income Fund | 554,048 | 25,286 | 54,110 | 13,085 | (5,047) | 60,143 | 580,320 |
| Fidelity Series Government Money Market Fund 0.16% | 55,390,390 | 9,845,570 | 13,391,565 | 61,351 | -- | -- | 51,844,395 |
| Fidelity Series High Income Fund | 2,450,021 | 132,297 | 270,555 | 71,293 | (12,458) | 270,480 | 2,569,785 |
| Fidelity Series Inflation-Protected Bond Index Fund | 34,161,217 | 3,459,942 | 3,667,093 | 28,694 | 40,063 | 2,055,240 | 36,049,369 |
| Fidelity Series International Credit Fund | 273,603 | 4,253 | -- | 4,252 | -- | 24,558 | 302,414 |
| Fidelity Series International Growth Fund | 12,314,668 | 306,011 | 5,791,863 | -- | 2,300,680 | 614,363 | 9,743,859 |
| Fidelity Series International Small Cap Fund | 2,856,785 | 73,105 | 791,559 | -- | 186,579 | 656,476 | 2,981,386 |
| Fidelity Series International Value Fund | 10,235,775 | 399,735 | 3,079,105 | -- | (225,807) | 2,172,651 | 9,503,249 |
| Fidelity Series Investment Grade Bond Fund | 120,300,564 | 12,106,643 | 14,538,232 | 1,610,095 | 142,690 | 7,055,220 | 125,066,885 |
| Fidelity Series Large Cap Stock Fund | 9,974,978 | 1,742,802 | 1,961,189 | 438,254 | (51,717) | 1,756,845 | 11,461,719 |
| Fidelity Series Large Cap Value Index Fund | 1,034,971 | 165,695 | 181,004 | -- | 9,617 | 209,023 | 1,238,302 |
| Fidelity Series Long-Term Treasury Bond Index Fund | 8,956,676 | 1,575,955 | 1,660,396 | 230,101 | 142,472 | (414,913) | 8,599,794 |
| Fidelity Series Opportunistic Insights Fund | 5,859,080 | 791,616 | 2,371,327 | -- | 832,302 | 1,617,942 | 6,729,613 |
| Fidelity Series Overseas Fund | 9,748,961 | 995,965 | 3,777,652 | -- | (191,877) | 2,915,199 | 9,690,596 |
| Fidelity Series Real Estate Income Fund | 1,483,346 | 92,632 | 169,569 | 54,380 | (5,574) | 275,286 | 1,676,121 |
| Fidelity Series Short-Term Credit Fund | 12,315,697 | 156,113 | 71,917 | 139,915 | (475) | 460,829 | 12,860,247 |
| Fidelity Series Small Cap Opportunities Fund | 3,303,061 | 701,339 | 795,072 | 26,974 | 15,301 | 811,385 | 4,036,014 |
| Fidelity Series Stock Selector Large Cap Value Fund | 6,161,235 | 806,460 | 1,064,430 | -- | (18,442) | 1,401,831 | 7,286,654 |
| Fidelity Series Value Discovery Fund | 6,324,174 | 679,726 | 1,069,332 | -- | 26,728 | 1,490,593 | 7,451,889 |
| | $356,671,311 | $45,923,194 | $71,080,463 | $2,782,601 | $3,673,779 | $41,104,399 | $376,292,220 |
Amounts in the income column in the above table include any capital gain distributions from underlying funds, which are presented in the corresponding line-item in the Statement of Operations, if applicable.
Investment Valuation
The following is a summary of the inputs used, as of September 30, 2020, involving the Fund's assets and liabilities carried at fair value. The inputs or methodology used for valuing securities may not be an indication of the risk associated with investing in those securities. For more information on valuation inputs, and their aggregation into the levels used below, please refer to the Investment Valuation section in the accompanying Notes to Financial Statements.
| | Valuation Inputs at Reporting Date: |
| Description | Total | Level 1 | Level 2 | Level 3 |
| Investments in Securities: | | | | |
| Other Short-Term Investments and Net Other Assets | $459,920 | $-- | $459,920 | $-- |
| Domestic Equity Funds | 66,127,152 | 66,127,152 | -- | -- |
| International Equity Funds | 68,208,575 | 68,208,575 | -- | -- |
| Bond Funds | 177,251,851 | 177,251,851 | -- | -- |
| Short-Term Funds | 65,335,376 | 65,335,376 | -- | -- |
| Total Investments in Securities: | $377,382,874 | $376,922,954 | $459,920 | $-- |
| Derivative Instruments: | | | | |
| Liabilities | | | | |
| Futures Contracts | $(6,912) | $(6,912) | $-- | $-- |
| Total Liabilities | $(6,912) | $(6,912) | $-- | $-- |
| Total Derivative Instruments: | $(6,912) | $(6,912) | $-- | $-- |
Value of Derivative Instruments
The following table is a summary of the Fund's value of derivative instruments by primary risk exposure as of September 30, 2020. For additional information on derivative instruments, please refer to the Derivative Instruments section in the accompanying Notes to Financial Statements.
| Primary Risk Exposure / Derivative Type | Value |
| | Asset | Liability |
| Equity Risk | | |
| Futures Contracts(a) | $0 | $(6,912) |
| Total Equity Risk | 0 | (6,912) |
| Total Value of Derivatives | $0 | $(6,912) |
(a) Reflects gross cumulative appreciation (depreciation) on futures contracts as presented in the Schedule of Investments. In the Statement of Assets and Liabilities, the period end daily variation margin is included in receivable or payable for daily variation margin on futures contracts, and the net cumulative appreciation (depreciation) is included in Total accumulated earnings (loss).
See accompanying notes which are an integral part of the financial statements.
Fidelity Advisor Freedom® 2010 Fund
Financial Statements
Statement of Assets and Liabilities
| | | September 30, 2020 (Unaudited) |
| Assets | | |
Investment in securities, at value — See accompanying schedule:
Unaffiliated issuers (cost $459,917) | $459,920 | |
| Fidelity Central Funds (cost $630,734) | 630,734 | |
| Other affiliated issuers (cost $328,211,370) | 376,292,220 | |
| Total Investment in Securities (cost $329,302,021) | | $377,382,874 |
| Cash | | 22,070 |
| Receivable for investments sold | | 7,522,897 |
| Receivable for fund shares sold | | 60,643 |
| Distributions receivable from Fidelity Central Funds | | 56 |
| Total assets | | 384,988,540 |
| Liabilities | | |
| Payable for investments purchased | $7,025,010 | |
| Payable for fund shares redeemed | 409,528 | |
| Accrued management fee | 160,105 | |
| Distribution and service plan fees payable | 70,921 | |
| Payable for daily variation margin on futures contracts | 34,938 | |
| Total liabilities | | 7,700,502 |
| Net Assets | | $377,288,038 |
| Net Assets consist of: | | |
| Paid in capital | | $325,466,121 |
| Total accumulated earnings (loss) | | 51,821,917 |
| Net Assets | | $377,288,038 |
| Net Asset Value and Maximum Offering Price | | |
| Class A: | | |
| Net Asset Value and redemption price per share ($168,649,102 ÷ 13,976,191 shares)(a) | | $12.07 |
| Maximum offering price per share (100/94.25 of $12.07) | | $12.81 |
| Class M: | | |
| Net Asset Value and redemption price per share ($67,977,637 ÷ 5,665,200 shares)(a) | | $12.00 |
| Maximum offering price per share (100/96.50 of $12.00) | | $12.44 |
| Class C: | | |
| Net Asset Value and offering price per share ($8,164,167 ÷ 684,418 shares)(a) | | $11.93 |
| Class I: | | |
| Net Asset Value, offering price and redemption price per share ($115,330,876 ÷ 9,514,152 shares) | | $12.12 |
| Class Z: | | |
| Net Asset Value, offering price and redemption price per share ($6,927,828 ÷ 574,747 shares) | | $12.05 |
| Class Z6: | | |
| Net Asset Value, offering price and redemption price per share ($10,238,428 ÷ 846,631 shares) | | $12.09 |
(a) Redemption price per share is equal to net asset value less any applicable contingent deferred sales charge.
See accompanying notes which are an integral part of the financial statements.
Statement of Operations
| | | Six months ended September 30, 2020 (Unaudited) |
| Investment Income | | |
| Dividends: | | |
| Affiliated issuers | | $2,334,023 |
| Interest | | 504 |
| Income from Fidelity Central Funds | | 614 |
| Total income | | 2,335,141 |
| Expenses | | |
| Management fee | $948,894 | |
| Distribution and service plan fees | 423,986 | |
| Independent trustees' fees and expenses | 524 | |
| Total expenses before reductions | 1,373,404 | |
| Expense reductions | (212) | |
| Total expenses after reductions | | 1,373,192 |
| Net investment income (loss) | | 961,949 |
| Realized and Unrealized Gain (Loss) | | |
| Net realized gain (loss) on: | | |
| Investment securities: | | |
| Unaffiliated issuers | (3) | |
| Fidelity Central Funds | (77) | |
| Other affiliated issuers | 3,673,779 | |
| Futures contracts | (350,084) | |
| Capital gain distributions from underlying funds: | | |
| Affiliated issuers | 448,578 | |
| Total net realized gain (loss) | | 3,772,193 |
| Change in net unrealized appreciation (depreciation) on: | | |
| Investment securities: | | |
| Unaffiliated issuers | (282) | |
| Fidelity Central Funds | (24) | |
| Other affiliated issuers | 41,104,399 | |
| Futures contracts | (6,912) | |
| Total change in net unrealized appreciation (depreciation) | | 41,097,181 |
| Net gain (loss) | | 44,869,374 |
| Net increase (decrease) in net assets resulting from operations | | $45,831,323 |
See accompanying notes which are an integral part of the financial statements.
Statement of Changes in Net Assets
| | Six months ended September 30, 2020 (Unaudited) | Year ended March 31, 2020 |
| Increase (Decrease) in Net Assets | | |
| Operations | | |
| Net investment income (loss) | $961,949 | $6,470,502 |
| Net realized gain (loss) | 3,772,193 | 17,783,346 |
| Change in net unrealized appreciation (depreciation) | 41,097,181 | (27,373,649) |
| Net increase (decrease) in net assets resulting from operations | 45,831,323 | (3,119,801) |
| Distributions to shareholders | (10,147,427) | (23,327,353) |
| Share transactions - net increase (decrease) | (16,420,209) | (35,324,647) |
| Total increase (decrease) in net assets | 19,263,687 | (61,771,801) |
| Net Assets | | |
| Beginning of period | 358,024,351 | 419,796,152 |
| End of period | $377,288,038 | $358,024,351 |
See accompanying notes which are an integral part of the financial statements.
Financial Highlights
Fidelity Advisor Freedom 2010 Fund Class A
| | Six months ended (Unaudited) September 30, | Years endedMarch 31, | | | | |
| | 2020 | 2020 | 2019 | 2018 | 2017 | 2016 |
| Selected Per–Share Data | | | | | | |
| Net asset value, beginning of period | $10.97 | $11.78 | $12.42 | $12.34 | $11.87 | $12.72 |
| Income from Investment Operations | | | | | | |
| Net investment income (loss)A | .03 | .19 | .21 | .16 | .18 | .20 |
| Net realized and unrealized gain (loss) | 1.39 | (.31) | .15 | .72 | .84 | (.41) |
| Total from investment operations | 1.42 | (.12) | .36 | .88 | 1.02 | (.21) |
| Distributions from net investment income | (.02) | (.20) | (.21) | (.17) | (.19) | (.21) |
| Distributions from net realized gain | (.30) | (.49) | (.79) | (.62) | (.36) | (.44) |
| Total distributions | (.32) | (.69) | (1.00) | (.80)B | (.55) | (.64)B |
| Net asset value, end of period | $12.07 | $10.97 | $11.78 | $12.42 | $12.34 | $11.87 |
| Total ReturnC,D,E | 13.13% | (1.39)% | 3.28% | 7.18% | 8.87% | (1.67)% |
| Ratios to Average Net AssetsF,G | | | | | | |
| Expenses before reductions | .76%H | .77% | .77%I | .69% | .25% | .25% |
| Expenses net of fee waivers, if any | .76%H | .77% | .77%I | .69% | .25% | .25% |
| Expenses net of all reductions | .76%H | .77% | .77%I | .69% | .25% | .25% |
| Net investment income (loss) | .48%H | 1.56% | 1.75% | 1.29% | 1.45% | 1.63% |
| Supplemental Data | | | | | | |
| Net assets, end of period (000 omitted) | $168,649 | $162,920 | $198,633 | $230,553 | $263,496 | $328,232 |
| Portfolio turnover rateG | 25%H | 23% | 24% | 20% | 26% | 21% |
A Calculated based on average shares outstanding during the period.
B Total distributions per share do not sum due to rounding.
C Total returns for periods of less than one year are not annualized.
D Total returns would have been lower if certain expenses had not been reduced during the applicable periods shown.
E Total returns do not include the effect of the sales charges.
F Expense ratios reflect operating expenses of the class. Expenses before reductions do not reflect amounts reimbursed, waived, or reduced through arrangements with the investment adviser, brokerage services, or other offset arrangements, if applicable, and do not represent the amount paid by the class during periods when reimbursements, waivers or reductions occur.
G Amount does not include the portfolio activity of any underlying mutual funds or exchange-traded funds (ETFs).
H Annualized
I On certain classes, the size and fluctuation of net assets and expense amounts may cause ratios to differ from contractual rates.
See accompanying notes which are an integral part of the financial statements.
Fidelity Advisor Freedom 2010 Fund Class M
| | Six months ended (Unaudited) September 30, | Years endedMarch 31, | | | | |
| | 2020 | 2020 | 2019 | 2018 | 2017 | 2016 |
| Selected Per–Share Data | | | | | | |
| Net asset value, beginning of period | $10.92 | $11.73 | $12.37 | $12.30 | $11.83 | $12.68 |
| Income from Investment Operations | | | | | | |
| Net investment income (loss)A | .01 | .15 | .18 | .13 | .14 | .17 |
| Net realized and unrealized gain (loss) | 1.38 | (.30) | .15 | .71 | .85 | (.41) |
| Total from investment operations | 1.39 | (.15) | .33 | .84 | .99 | (.24) |
| Distributions from net investment income | (.01) | (.17) | (.18) | (.15) | (.16) | (.18) |
| Distributions from net realized gain | (.30) | (.49) | (.79) | (.62) | (.36) | (.44) |
| Total distributions | (.31) | (.66) | (.97) | (.77) | (.52) | (.61)B |
| Net asset value, end of period | $12.00 | $10.92 | $11.73 | $12.37 | $12.30 | $11.83 |
| Total ReturnC,D,E | 12.92% | (1.63)% | 3.06% | 6.89% | 8.63% | (1.92)% |
| Ratios to Average Net AssetsF,G | | | | | | |
| Expenses before reductions | 1.01%H | 1.02% | 1.02%I | .94% | .50% | .50% |
| Expenses net of fee waivers, if any | 1.01%H | 1.02% | 1.02%I | .94% | .50% | .50% |
| Expenses net of all reductions | 1.01%H | 1.02% | 1.02%I | .94% | .50% | .50% |
| Net investment income (loss) | .23%H | 1.31% | 1.50% | 1.03% | 1.20% | 1.38% |
| Supplemental Data | | | | | | |
| Net assets, end of period (000 omitted) | $67,978 | $64,750 | $71,679 | $77,068 | $83,881 | $92,543 |
| Portfolio turnover rateG | 25%H | 23% | 24% | 20% | 26% | 21% |
A Calculated based on average shares outstanding during the period.
B Total distributions per share do not sum due to rounding.
C Total returns for periods of less than one year are not annualized.
D Total returns would have been lower if certain expenses had not been reduced during the applicable periods shown.
E Total returns do not include the effect of the sales charges.
F Expense ratios reflect operating expenses of the class. Expenses before reductions do not reflect amounts reimbursed, waived, or reduced through arrangements with the investment adviser, brokerage services, or other offset arrangements, if applicable, and do not represent the amount paid by the class during periods when reimbursements, waivers or reductions occur.
G Amount does not include the portfolio activity of any underlying mutual funds or exchange-traded funds (ETFs).
H Annualized
I On certain classes, the size and fluctuation of net assets and expense amounts may cause ratios to differ from contractual rates.
See accompanying notes which are an integral part of the financial statements.
Fidelity Advisor Freedom 2010 Fund Class C
| | Six months ended (Unaudited) September 30, | Years endedMarch 31, | | | | |
| | 2020 | 2020 | 2019 | 2018 | 2017 | 2016 |
| Selected Per–Share Data | | | | | | |
| Net asset value, beginning of period | $10.87 | $11.66 | $12.29 | $12.22 | $11.76 | $12.60 |
| Income from Investment Operations | | | | | | |
| Net investment income (loss)A | (.02) | .10 | .12 | .07 | .08 | .11 |
| Net realized and unrealized gain (loss) | 1.37 | (.30) | .14 | .70 | .84 | (.40) |
| Total from investment operations | 1.35 | (.20) | .26 | .77 | .92 | (.29) |
| Distributions from net investment income | – | (.10) | (.11) | (.08) | (.10) | (.11) |
| Distributions from net realized gain | (.29) | (.49) | (.78) | (.62) | (.36) | (.44) |
| Total distributions | (.29) | (.59) | (.89) | (.70) | (.46) | (.55) |
| Net asset value, end of period | $11.93 | $10.87 | $11.66 | $12.29 | $12.22 | $11.76 |
| Total ReturnB,C,D | 12.62% | (2.02)% | 2.45% | 6.37% | 8.07% | (2.39)% |
| Ratios to Average Net AssetsE,F | | | | | | |
| Expenses before reductions | 1.51%G | 1.51%H | 1.52%H | 1.44% | 1.00% | 1.00% |
| Expenses net of fee waivers, if any | 1.51%G | 1.51%H | 1.52%H | 1.44% | 1.00% | 1.00% |
| Expenses net of all reductions | 1.51%G | 1.51%H | 1.52%H | 1.44% | 1.00% | 1.00% |
| Net investment income (loss) | (.27)%G | .81% | 1.00% | .54% | .70% | .88% |
| Supplemental Data | | | | | | |
| Net assets, end of period (000 omitted) | $8,164 | $8,343 | $10,765 | $26,227 | $29,290 | $30,150 |
| Portfolio turnover rateF | 25%G | 23% | 24% | 20% | 26% | 21% |
A Calculated based on average shares outstanding during the period.
B Total returns for periods of less than one year are not annualized.
C Total returns would have been lower if certain expenses had not been reduced during the applicable periods shown.
D Total returns do not include the effect of the contingent deferred sales charge.
E Expense ratios reflect operating expenses of the class. Expenses before reductions do not reflect amounts reimbursed, waived, or reduced through arrangements with the investment adviser, brokerage services, or other offset arrangements, if applicable, and do not represent the amount paid by the class during periods when reimbursements, waivers or reductions occur.
F Amount does not include the portfolio activity of any underlying mutual funds or exchange-traded funds (ETFs).
G Annualized
H On certain classes, the size and fluctuation of net assets and expense amounts may cause ratios to differ from contractual rates.
See accompanying notes which are an integral part of the financial statements.
Fidelity Advisor Freedom 2010 Fund Class I
| | Six months ended (Unaudited) September 30, | Years endedMarch 31, | | | | |
| | 2020 | 2020 | 2019 | 2018 | 2017 | 2016 |
| Selected Per–Share Data | | | | | | |
| Net asset value, beginning of period | $11.02 | $11.82 | $12.47 | $12.40 | $11.92 | $12.77 |
| Income from Investment Operations | | | | | | |
| Net investment income (loss)A | .04 | .22 | .24 | .19 | .21 | .23 |
| Net realized and unrealized gain (loss) | 1.38 | (.30) | .14 | .72 | .85 | (.40) |
| Total from investment operations | 1.42 | (.08) | .38 | .91 | 1.06 | (.17) |
| Distributions from net investment income | (.03) | (.23) | (.25) | (.21) | (.22) | (.24) |
| Distributions from net realized gain | (.30) | (.49) | (.79) | (.62) | (.36) | (.44) |
| Total distributions | (.32)B | (.72) | (1.03)B | (.84)B | (.58) | (.68) |
| Net asset value, end of period | $12.12 | $11.02 | $11.82 | $12.47 | $12.40 | $11.92 |
| Total ReturnC,D | 13.15% | (1.04)% | 3.50% | 7.39% | 9.22% | (1.40)% |
| Ratios to Average Net AssetsE,F | | | | | | |
| Expenses before reductions | .51%G | .52% | .52%H | .45% | - %I | - %I |
| Expenses net of fee waivers, if any | .51%G | .52% | .52%H | .45% | -% | -% |
| Expenses net of all reductions | .51%G | .52% | .52%H | .45% | -% | -% |
| Net investment income (loss) | .73%G | 1.81% | 2.00% | 1.53% | 1.70% | 1.88% |
| Supplemental Data | | | | | | |
| Net assets, end of period (000 omitted) | $115,331 | $107,764 | $131,896 | $137,019 | $131,216 | $143,715 |
| Portfolio turnover rateF | 25%G | 23% | 24% | 20% | 26% | 21% |
A Calculated based on average shares outstanding during the period.
B Total distributions per share do not sum due to rounding.
C Total returns for periods of less than one year are not annualized.
D Total returns would have been lower if certain expenses had not been reduced during the applicable periods shown.
E Expense ratios reflect operating expenses of the class. Expenses before reductions do not reflect amounts reimbursed, waived, or reduced through arrangements with the investment adviser, brokerage services, or other offset arrangements, if applicable, and do not represent the amount paid by the class during periods when reimbursements, waivers or reductions occur.
F Amount does not include the portfolio activity of any underlying mutual funds or exchange-traded funds (ETFs).
G Annualized
H On certain classes, the size and fluctuation of net assets and expense amounts may cause ratios to differ from contractual rates.
I Amount represents less than .005%.
See accompanying notes which are an integral part of the financial statements.
Fidelity Advisor Freedom 2010 Fund Class Z
| | Six months ended (Unaudited) September 30, | Years endedMarch 31, | |
| | 2020 | 2020 | 2019 A |
| Selected Per–Share Data | | | |
| Net asset value, beginning of period | $10.95 | $11.78 | $12.30 |
| Income from Investment Operations | | | |
| Net investment income (loss)B | .05 | .22 | .27 |
| Net realized and unrealized gain (loss) | 1.38 | (.30) | (.11)C |
| Total from investment operations | 1.43 | (.08) | .16 |
| Distributions from net investment income | (.03) | (.26) | (.26) |
| Distributions from net realized gain | (.30) | (.49) | (.42) |
| Total distributions | (.33) | (.75) | (.68) |
| Net asset value, end of period | $12.05 | $10.95 | $11.78 |
| Total ReturnD,E | 13.25% | (1.05)% | 1.65% |
| Ratios to Average Net AssetsF,G | | | |
| Expenses before reductions | .45%H | .46%I | .47%H,I |
| Expenses net of fee waivers, if any | .45%H | .46%I | .47%H,I |
| Expenses net of all reductions | .45%H | .46%I | .47%H,I |
| Net investment income (loss) | .79%H | 1.87% | 4.58%H |
| Supplemental Data | | | |
| Net assets, end of period (000 omitted) | $6,928 | $5,895 | $257 |
| Portfolio turnover rateG | 25%H | 23% | 24% |
A For the period October 2, 2018 (commencement of sale of shares) to March 31, 2019.
B Calculated based on average shares outstanding during the period.
C The amount shown for a share outstanding does not correspond with the aggregate net gain (loss) on investments for the period due to the timing of sales and repurchases of shares in relation to fluctuating market values of the investments of the Fund.
D Total returns for periods of less than one year are not annualized.
E Total returns would have been lower if certain expenses had not been reduced during the applicable periods shown.
F Expense ratios reflect operating expenses of the class. Expenses before reductions do not reflect amounts reimbursed, waived, or reduced through arrangements with the investment adviser, brokerage services, or other offset arrangements, if applicable, and do not represent the amount paid by the class during periods when reimbursements, waivers or reductions occur.
G Amount does not include the portfolio activity of any underlying mutual funds or exchange-traded funds (ETFs).
H Annualized
I On certain classes, the size and fluctuation of net assets and expense amounts may cause ratios to differ from contractual rates.
See accompanying notes which are an integral part of the financial statements.
Fidelity Advisor Freedom 2010 Fund Class Z6
| | Six months ended (Unaudited) September 30, | Years endedMarch 31, | | |
| | 2020 | 2020 | 2019 | 2018 A |
| Selected Per–Share Data | | | | |
| Net asset value, beginning of period | $10.99 | $11.81 | $12.47 | $12.50 |
| Income from Investment Operations | | | | |
| Net investment income (loss)B | .05 | .23 | .25 | .05 |
| Net realized and unrealized gain (loss) | 1.38 | (.31) | .15 | .53 |
| Total from investment operations | 1.43 | (.08) | .40 | .58 |
| Distributions from net investment income | (.03) | (.26) | (.27) | (.20) |
| Distributions from net realized gain | (.30) | (.49) | (.79) | (.42) |
| Total distributions | (.33) | (.74)C | (1.06) | (.61)C |
| Net asset value, end of period | $12.09 | $10.99 | $11.81 | $12.47 |
| Total ReturnD,E | 13.24% | (1.01)% | 3.66% | 4.62% |
| Ratios to Average Net AssetsF,G | | | | |
| Expenses before reductions | .38%H | .39% | .39% | .41%H,I |
| Expenses net of fee waivers, if any | .38%H | .39% | .39% | .41%H,I |
| Expenses net of all reductions | .38%H | .39% | .39% | .41%H,I |
| Net investment income (loss) | .86%H | 1.94% | 2.13% | .45%H |
| Supplemental Data | | | | |
| Net assets, end of period (000 omitted) | $10,238 | $8,352 | $6,566 | $4,744 |
| Portfolio turnover rateG | 25%H | 23% | 24% | 20% |
A For the period June 6, 2017 (commencement of sale of shares) to March 31, 2018.
B Calculated based on average shares outstanding during the period.
C Total distributions per share do not sum due to rounding.
D Total returns for periods of less than one year are not annualized.
E Total returns would have been lower if certain expenses had not been reduced during the applicable periods shown.
F Expense ratios reflect operating expenses of the class. Expenses before reductions do not reflect amounts reimbursed, waived, or reduced through arrangements with the investment adviser, brokerage services, or other offset arrangements, if applicable, and do not represent the amount paid by the class during periods when reimbursements, waivers or reductions occur.
G Amount does not include the portfolio activity of any underlying mutual funds or exchange-traded funds (ETFs).
H Annualized
I On certain classes, the size and fluctuation of net assets and expense amounts may cause ratios to differ from contractual rates.
See accompanying notes which are an integral part of the financial statements.
Fidelity Advisor Freedom® 2015 Fund
Investment Summary (Unaudited)
The information in the following tables is based on the direct investments of the Fund.
Top Holdings as of September 30, 2020
| | % of fund's net assets |
| Fidelity Series Investment Grade Bond Fund | 29.4 |
| Fidelity Series Government Money Market Fund 0.16% | 10.5 |
| Fidelity Series Emerging Markets Opportunities Fund | 8.9 |
| Fidelity Series Inflation-Protected Bond Index Fund | 8.3 |
| Fidelity Series Large Cap Stock Fund | 4.2 |
| Fidelity Series International Growth Fund | 3.3 |
| Fidelity Series Overseas Fund | 3.3 |
| Fidelity Series International Value Fund | 3.2 |
| Fidelity Series Value Discovery Fund | 2.7 |
| Fidelity Series Stock Selector Large Cap Value Fund | 2.6 |
| | 76.4 |
Asset Allocation (% of fund's net assets)
| Period end |
| | Domestic Equity Funds | 23.1% |
| | International Equity Funds | 21.8% |
| | Bond Funds | 41.9% |
| | Short-Term Funds | 13.1% |
| | Short-Term Investments | 0.1% |

Domestic Equity Funds category includes Fidelity Series Commodity Strategy Fund which invests in commodity-related investments.
Fidelity Advisor Freedom® 2015 Fund
Schedule of Investments September 30, 2020 (Unaudited)
Showing Percentage of Net Assets
| U.S. Treasury Obligations - 0.1% | | | |
| | | Principal Amount | Value |
| U.S. Treasury Bills, yield at date of purchase 0.1% to 0.11% 12/3/20 to 12/10/20 (a) | | | |
| (Cost $1,059,804) | | 1,060,000 | 1,059,812 |
| | | Shares | Value |
|
| Domestic Equity Funds - 23.1% | | | |
| Fidelity Advisor Series Equity Growth Fund (b) | | 1,192,485 | $21,691,306 |
| Fidelity Advisor Series Growth Opportunities Fund (b) | | 813,349 | 14,957,483 |
| Fidelity Advisor Series Small Cap Fund (b) | | 882,414 | 9,821,264 |
| Fidelity Series All-Sector Equity Fund (b) | | 877,480 | 9,345,161 |
| Fidelity Series Commodity Strategy Fund (b) | | 4,929,483 | 20,506,650 |
| Fidelity Series Large Cap Stock Fund (b) | | 2,424,126 | 34,325,620 |
| Fidelity Series Large Cap Value Index Fund (b) | | 319,749 | 3,709,091 |
| Fidelity Series Opportunistic Insights Fund (b) | | 931,740 | 20,153,528 |
| Fidelity Series Small Cap Opportunities Fund (b) | | 947,404 | 12,088,878 |
| Fidelity Series Stock Selector Large Cap Value Fund (b) | | 1,984,107 | 21,825,175 |
| Fidelity Series Value Discovery Fund (b) | | 1,805,827 | 22,320,017 |
| TOTAL DOMESTIC EQUITY FUNDS | | | |
| (Cost $147,901,410) | | | 190,744,173 |
|
| International Equity Funds - 21.8% | | | |
| Fidelity Series Canada Fund (b) | | 890,681 | 9,111,667 |
| Fidelity Series Emerging Markets Fund (b) | | 848,610 | 8,002,397 |
| Fidelity Series Emerging Markets Opportunities Fund (b) | | 3,504,068 | 73,515,337 |
| Fidelity Series International Growth Fund (b) | | 1,449,894 | 27,229,000 |
| Fidelity Series International Small Cap Fund (b) | | 468,057 | 8,331,419 |
| Fidelity Series International Value Fund (b) | | 3,104,124 | 26,757,546 |
| Fidelity Series Overseas Fund (b) | | 2,428,573 | 27,151,449 |
| TOTAL INTERNATIONAL EQUITY FUNDS | | | |
| (Cost $135,912,839) | | | 180,098,815 |
|
| Bond Funds - 41.9% | | | |
| Fidelity Series Emerging Markets Debt Fund (b) | | 569,813 | 5,162,508 |
| Fidelity Series Floating Rate High Income Fund (b) | | 134,845 | 1,193,378 |
| Fidelity Series High Income Fund (b) | | 612,011 | 5,581,539 |
| Fidelity Series Inflation-Protected Bond Index Fund (b) | | 6,405,554 | 68,539,429 |
| Fidelity Series International Credit Fund (b) | | 69,145 | 719,796 |
| Fidelity Series Investment Grade Bond Fund (b) | | 19,872,083 | 243,234,288 |
| Fidelity Series Long-Term Treasury Bond Index Fund (b) | | 1,824,811 | 18,850,296 |
| Fidelity Series Real Estate Income Fund (b) | | 364,462 | 3,637,329 |
| TOTAL BOND FUNDS | | | |
| (Cost $309,678,234) | | | 346,918,563 |
|
| Short-Term Funds - 13.1% | | | |
| Fidelity Cash Central Fund 0.10% (c) | | 999,357 | 999,557 |
| Fidelity Series Government Money Market Fund 0.16% (b)(d) | | 86,718,344 | 86,718,344 |
| Fidelity Series Short-Term Credit Fund (b) | | 2,048,187 | 20,993,918 |
| TOTAL SHORT-TERM FUNDS | | | |
| (Cost $108,134,276) | | | 108,711,819 |
| TOTAL INVESTMENT IN SECURITIES - 100.0% | | | |
| (Cost $702,686,563) | | | 827,533,182 |
| NET OTHER ASSETS (LIABILITIES) - 0.0% | | | (252,556) |
| NET ASSETS - 100% | | | $827,280,626 |
| Futures Contracts | | | | | |
| | Number of contracts | Expiration Date | Notional Amount | Value | Unrealized Appreciation/(Depreciation) |
| Purchased | | | | | |
| Equity Index Contracts | | | | | |
| ICE E-mini MSCI EAFE Index Contracts (United States) | 8 | Dec. 2020 | $741,280 | $(7,639) | $(7,639) |
| Sold | | | | | |
| Equity Index Contracts | | | | | |
| CME E-mini S&P 500 Index Contracts (United States) | 9 | Dec. 2020 | 1,508,400 | (9,847) | (9,847) |
| ICE E-mini MSCI Emerging Markets Index Contracts (United States) | 11 | Dec. 2020 | 598,675 | (133) | (133) |
|
| TOTAL SOLD FUTURES | | | | | (9,980) |
|
| TOTAL FUTURES CONTRACTS | | | | | $(17,619) |
The notional amount of futures purchased as a percentage of Net Assets is 0.1%
The notional amount of futures sold as a percentage of Net Assets is 0.3%
Legend
(a) Security or a portion of the security was pledged to cover margin requirements for futures contracts. At period end, the value of securities pledged amounted to $1,059,812.
(b) Affiliated Fund
(c) Affiliated fund that is generally available only to investment companies and other accounts managed by Fidelity Investments. The rate quoted is the annualized seven-day yield of the fund at period end. A complete unaudited listing of the fund's holdings as of its most recent quarter end is available upon request. In addition, each Fidelity Central Fund's financial statements are available on the SEC's website or upon request.
(d) The rate quoted is the annualized seven-day yield of the fund at period end.
Affiliated Central Funds
Information regarding fiscal year to date income earned by the Fund from investments in Fidelity Central Funds is as follows:
| Fund | Income earned |
| Fidelity Cash Central Fund | $1,071 |
| Total | $1,071 |
Amounts in the income column in the above table include any capital gain distributions from underlying funds, which are presented in the corresponding line-item in the Statement of Operations, if applicable.
Affiliated Underlying Funds
Fiscal year to date information regarding the Fund's investments in affiliated Underlying Funds, excluding any Money Market Central Funds, is presented below. Exchanges between classes of the same affiliated Underlying Funds may occur.
| Affiliate | Value, beginning of period | Purchases | Sales Proceeds | Dividend Income | Realized Gain (loss) | Change in Unrealized appreciation (depreciation) | Value, end of period |
| Fidelity Advisor Series Equity Growth Fund | $18,613,188 | $1,562,707 | $7,153,831 | $-- | $2,596,238 | $6,073,004 | $21,691,306 |
| Fidelity Advisor Series Growth Opportunities Fund | 11,961,675 | 996,324 | 5,789,040 | -- | 1,750,050 | 6,038,474 | 14,957,483 |
| Fidelity Advisor Series Small Cap Fund | 7,746,259 | 1,181,161 | 1,646,284 | -- | 41,262 | 2,498,866 | 9,821,264 |
| Fidelity Series All-Sector Equity Fund | 8,082,906 | 555,515 | 2,147,072 | -- | 74,831 | 2,778,981 | 9,345,161 |
| Fidelity Series Canada Fund | 7,054,379 | 1,318,950 | 1,135,365 | -- | (114,309) | 1,988,012 | 9,111,667 |
| Fidelity Series Commodity Strategy Fund | 25,490,366 | 570,502 | 8,299,604 | 87,350 | (2,836,609) | 5,581,995 | 20,506,650 |
| Fidelity Series Emerging Markets Debt Fund | 4,845,097 | 189,365 | 466,850 | 138,181 | (5,897) | 600,793 | 5,162,508 |
| Fidelity Series Emerging Markets Fund | 5,076,354 | 1,894,762 | 999,406 | -- | 18,335 | 2,012,352 | 8,002,397 |
| Fidelity Series Emerging Markets Opportunities Fund | 48,639,256 | 16,771,202 | 11,171,715 | -- | 815,356 | 18,461,238 | 73,515,337 |
| Fidelity Series Floating Rate High Income Fund | 1,152,720 | 39,433 | 112,947 | 27,051 | (12,445) | 126,617 | 1,193,378 |
| Fidelity Series Government Money Market Fund 0.16% | 95,067,836 | 17,993,810 | 26,343,302 | 102,345 | -- | -- | 86,718,344 |
| Fidelity Series High Income Fund | 5,365,266 | 217,294 | 564,738 | 155,377 | (19,392) | 583,109 | 5,581,539 |
| Fidelity Series Inflation-Protected Bond Index Fund | 64,845,221 | 7,724,106 | 7,997,372 | 54,238 | 91,165 | 3,876,309 | 68,539,429 |
| Fidelity Series International Credit Fund | 651,223 | 10,121 | -- | 10,121 | -- | 58,452 | 719,796 |
| Fidelity Series International Growth Fund | 32,877,456 | 371,729 | 13,962,687 | -- | 5,883,770 | 2,058,732 | 27,229,000 |
| Fidelity Series International Small Cap Fund | 7,756,858 | 90,019 | 1,837,209 | -- | 453,764 | 1,867,987 | 8,331,419 |
| Fidelity Series International Value Fund | 27,998,648 | 858,042 | 7,487,168 | -- | (419,297) | 5,807,321 | 26,757,546 |
| Fidelity Series Investment Grade Bond Fund | 230,747,222 | 28,782,856 | 30,154,592 | 3,109,979 | 222,385 | 13,636,417 | 243,234,288 |
| Fidelity Series Large Cap Stock Fund | 29,644,912 | 3,932,468 | 4,487,915 | 1,266,348 | (40,934) | 5,277,089 | 34,325,620 |
| Fidelity Series Large Cap Value Index Fund | 3,068,567 | 467,854 | 474,891 | -- | 26,649 | 620,912 | 3,709,091 |
| Fidelity Series Long-Term Treasury Bond Index Fund | 19,818,002 | 3,555,970 | 3,946,771 | 498,223 | 421,588 | (998,493) | 18,850,296 |
| Fidelity Series Opportunistic Insights Fund | 17,410,024 | 1,711,948 | 6,168,657 | -- | 2,311,740 | 4,888,473 | 20,153,528 |
| Fidelity Series Overseas Fund | 27,048,067 | 1,600,567 | 8,988,309 | -- | (547,023) | 8,038,147 | 27,151,449 |
| Fidelity Series Real Estate Income Fund | 3,245,495 | 156,841 | 353,996 | 117,946 | (13,254) | 602,243 | 3,637,329 |
| Fidelity Series Short-Term Credit Fund | 20,155,281 | 229,518 | 142,116 | 228,397 | (605) | 751,840 | 20,993,918 |
| Fidelity Series Small Cap Opportunities Fund | 9,794,269 | 1,665,198 | 1,877,437 | 77,527 | 64,091 | 2,442,757 | 12,088,878 |
| Fidelity Series Stock Selector Large Cap Value Fund | 18,271,386 | 2,145,833 | 2,790,389 | -- | 58,611 | 4,139,734 | 21,825,175 |
| Fidelity Series Value Discovery Fund | 18,974,502 | 1,533,709 | 2,799,417 | -- | 144,390 | 4,466,833 | 22,320,017 |
| | $771,402,435 | $98,127,804 | $159,299,080 | $5,873,083 | $10,964,460 | $104,278,194 | $825,473,813 |
Amounts in the income column in the above table include any capital gain distributions from underlying funds, which are presented in the corresponding line-item in the Statement of Operations, if applicable.
Investment Valuation
The following is a summary of the inputs used, as of September 30, 2020, involving the Fund's assets and liabilities carried at fair value. The inputs or methodology used for valuing securities may not be an indication of the risk associated with investing in those securities. For more information on valuation inputs, and their aggregation into the levels used below, please refer to the Investment Valuation section in the accompanying Notes to Financial Statements.
| | Valuation Inputs at Reporting Date: |
| Description | Total | Level 1 | Level 2 | Level 3 |
| Investments in Securities: | | | | |
| Other Short-Term Investments and Net Other Assets | $1,059,812 | $-- | $1,059,812 | $-- |
| Domestic Equity Funds | 190,744,173 | 190,744,173 | -- | -- |
| International Equity Funds | 180,098,815 | 180,098,815 | -- | -- |
| Bond Funds | 346,918,563 | 346,918,563 | -- | -- |
| Short-Term Funds | 108,711,819 | 108,711,819 | -- | -- |
| Total Investments in Securities: | $827,533,182 | $826,473,370 | $1,059,812 | $-- |
| Derivative Instruments: | | | | |
| Liabilities | | | | |
| Futures Contracts | $(17,619) | $(17,619) | $-- | $-- |
| Total Liabilities | $(17,619) | $(17,619) | $-- | $-- |
| Total Derivative Instruments: | $(17,619) | $(17,619) | $-- | $-- |
Value of Derivative Instruments
The following table is a summary of the Fund's value of derivative instruments by primary risk exposure as of September 30, 2020. For additional information on derivative instruments, please refer to the Derivative Instruments section in the accompanying Notes to Financial Statements.
| Primary Risk Exposure / Derivative Type | Value |
| | Asset | Liability |
| Equity Risk | | |
| Futures Contracts(a) | $0 | $(17,619) |
| Total Equity Risk | 0 | (17,619) |
| Total Value of Derivatives | $0 | $(17,619) |
(a) Reflects gross cumulative appreciation (depreciation) on futures contracts as presented in the Schedule of Investments. In the Statement of Assets and Liabilities, the period end daily variation margin is included in receivable or payable for daily variation margin on futures contracts, and the net cumulative appreciation (depreciation) is included in Total accumulated earnings (loss).
See accompanying notes which are an integral part of the financial statements.
Fidelity Advisor Freedom® 2015 Fund
Financial Statements
Statement of Assets and Liabilities
| | | September 30, 2020 (Unaudited) |
| Assets | | |
Investment in securities, at value — See accompanying schedule:
Unaffiliated issuers (cost $1,059,804) | $1,059,812 | |
| Fidelity Central Funds (cost $999,555) | 999,557 | |
| Other affiliated issuers (cost $700,627,204) | 825,473,813 | |
| Total Investment in Securities (cost $702,686,563) | | $827,533,182 |
| Receivable for investments sold | | 15,923,219 |
| Receivable for fund shares sold | | 451,212 |
| Distributions receivable from Fidelity Central Funds | | 82 |
| Total assets | | 843,907,695 |
| Liabilities | | |
| Payable for investments purchased | $15,610,175 | |
| Payable for fund shares redeemed | 404,446 | |
| Accrued management fee | 377,829 | |
| Distribution and service plan fees payable | 153,858 | |
| Payable for daily variation margin on futures contracts | 80,761 | |
| Total liabilities | | 16,627,069 |
| Net Assets | | $827,280,626 |
| Net Assets consist of: | | |
| Paid in capital | | $691,746,341 |
| Total accumulated earnings (loss) | | 135,534,285 |
| Net Assets | | $827,280,626 |
| Net Asset Value and Maximum Offering Price | | |
| Class A: | | |
| Net Asset Value and redemption price per share ($382,687,034 ÷ 32,128,330 shares)(a) | | $11.91 |
| Maximum offering price per share (100/94.25 of $11.91) | | $12.64 |
| Class M: | | |
| Net Asset Value and redemption price per share ($132,999,461 ÷ 11,205,163 shares)(a) | | $11.87 |
| Maximum offering price per share (100/96.50 of $11.87) | | $12.30 |
| Class C: | | |
| Net Asset Value and offering price per share ($21,326,310 ÷ 1,810,198 shares)(a) | | $11.78 |
| Class I: | | |
| Net Asset Value, offering price and redemption price per share ($251,959,702 ÷ 20,947,438 shares) | | $12.03 |
| Class Z: | | |
| Net Asset Value, offering price and redemption price per share ($17,580,889 ÷ 1,471,342 shares) | | $11.95 |
| Class Z6: | | |
| Net Asset Value, offering price and redemption price per share ($20,727,230 ÷ 1,727,766 shares) | | $12.00 |
(a) Redemption price per share is equal to net asset value less any applicable contingent deferred sales charge.
See accompanying notes which are an integral part of the financial statements.
Statement of Operations
| | | Six months ended September 30, 2020 (Unaudited) |
| Investment Income | | |
| Dividends: | | |
| Affiliated issuers | | $4,719,664 |
| Interest | | 1,130 |
| Income from Fidelity Central Funds | | 1,071 |
| Total income | | 4,721,865 |
| Expenses | | |
| Management fee | $2,242,439 | |
| Distribution and service plan fees | 911,899 | |
| Independent trustees' fees and expenses | 1,145 | |
| Total expenses before reductions | 3,155,483 | |
| Expense reductions | (186) | |
| Total expenses after reductions | | 3,155,297 |
| Net investment income (loss) | | 1,566,568 |
| Realized and Unrealized Gain (Loss) | | |
| Net realized gain (loss) on: | | |
| Investment securities: | | |
| Unaffiliated issuers | 4 | |
| Fidelity Central Funds | (148) | |
| Other affiliated issuers | 10,964,460 | |
| Futures contracts | (710,733) | |
| Capital gain distributions from underlying funds: | | |
| Affiliated issuers | 1,153,419 | |
| Total net realized gain (loss) | | 11,407,002 |
| Change in net unrealized appreciation (depreciation) on: | | |
| Investment securities: | | |
| Unaffiliated issuers | (651) | |
| Fidelity Central Funds | (57) | |
| Other affiliated issuers | 104,278,194 | |
| Futures contracts | (17,619) | |
| Total change in net unrealized appreciation (depreciation) | | 104,259,867 |
| Net gain (loss) | | 115,666,869 |
| Net increase (decrease) in net assets resulting from operations | | $117,233,437 |
See accompanying notes which are an integral part of the financial statements.
Statement of Changes in Net Assets
| | Six months ended September 30, 2020 (Unaudited) | Year ended March 31, 2020 |
| Increase (Decrease) in Net Assets | | |
| Operations | | |
| Net investment income (loss) | $1,566,568 | $14,279,200 |
| Net realized gain (loss) | 11,407,002 | 52,137,476 |
| Change in net unrealized appreciation (depreciation) | 104,259,867 | (82,226,893) |
| Net increase (decrease) in net assets resulting from operations | 117,233,437 | (15,810,217) |
| Distributions to shareholders | (29,804,522) | (63,470,497) |
| Share transactions - net increase (decrease) | (34,088,373) | (129,306,462) |
| Total increase (decrease) in net assets | 53,340,542 | (208,587,176) |
| Net Assets | | |
| Beginning of period | 773,940,084 | 982,527,260 |
| End of period | $827,280,626 | $773,940,084 |
See accompanying notes which are an integral part of the financial statements.
Financial Highlights
Fidelity Advisor Freedom 2015 Fund Class A
| | Six months ended (Unaudited) September 30, | Years endedMarch 31, | | | | |
| | 2020 | 2020 | 2019 | 2018 | 2017 | 2016 |
| Selected Per–Share Data | | | | | | |
| Net asset value, beginning of period | $10.71 | $11.79 | $12.59 | $12.43 | $11.81 | $12.70 |
| Income from Investment Operations | | | | | | |
| Net investment income (loss)A | .02 | .18 | .21 | .16 | .18 | .20 |
| Net realized and unrealized gain (loss) | 1.60 | (.44) | .14 | .87 | .99 | (.45) |
| Total from investment operations | 1.62 | (.26) | .35 | 1.03 | 1.17 | (.25) |
| Distributions from net investment income | (.01) | (.19) | (.21) | (.18) | (.19) | (.21) |
| Distributions from net realized gain | (.41) | (.62) | (.94) | (.70) | (.36) | (.43) |
| Total distributions | (.42) | (.82)B | (1.15) | (.87)B | (.55) | (.64) |
| Net asset value, end of period | $11.91 | $10.71 | $11.79 | $12.59 | $12.43 | $11.81 |
| Total ReturnC,D,E | 15.48% | (2.77)% | 3.26% | 8.42% | 10.23% | (2.07)% |
| Ratios to Average Net AssetsF,G | | | | | | |
| Expenses before reductions | .80%H | .81% | .82% | .72% | .25% | .25% |
| Expenses net of fee waivers, if any | .80%H | .81% | .82% | .72% | .25% | .25% |
| Expenses net of all reductions | .80%H | .81% | .82% | .72% | .25% | .25% |
| Net investment income (loss) | .35%H | 1.50% | 1.71% | 1.22% | 1.46% | 1.64% |
| Supplemental Data | | | | | | |
| Net assets, end of period (000 omitted) | $382,687 | $360,371 | $476,763 | $551,179 | $653,982 | $739,929 |
| Portfolio turnover rateG | 24%H | 22% | 21% | 19% | 22% | 20% |
A Calculated based on average shares outstanding during the period.
B Total distributions per share do not sum due to rounding.
C Total returns for periods of less than one year are not annualized.
D Total returns would have been lower if certain expenses had not been reduced during the applicable periods shown.
E Total returns do not include the effect of the sales charges.
F Expense ratios reflect operating expenses of the class. Expenses before reductions do not reflect amounts reimbursed, waived, or reduced through arrangements with the investment adviser, brokerage services, or other offset arrangements, if applicable, and do not represent the amount paid by the class during periods when reimbursements, waivers or reductions occur.
G Amount does not include the portfolio activity of any underlying mutual funds or exchange-traded funds (ETFs).
H Annualized
See accompanying notes which are an integral part of the financial statements.
Fidelity Advisor Freedom 2015 Fund Class M
| | Six months ended (Unaudited) September 30, | Years endedMarch 31, | | | | |
| | 2020 | 2020 | 2019 | 2018 | 2017 | 2016 |
| Selected Per–Share Data | | | | | | |
| Net asset value, beginning of period | $10.68 | $11.76 | $12.56 | $12.41 | $11.79 | $12.68 |
| Income from Investment Operations | | | | | | |
| Net investment income (loss)A | .01 | .15 | .17 | .12 | .15 | .17 |
| Net realized and unrealized gain (loss) | 1.59 | (.44) | .15 | .87 | .99 | (.45) |
| Total from investment operations | 1.60 | (.29) | .32 | .99 | 1.14 | (.28) |
| Distributions from net investment income | (.01) | (.16) | (.18) | (.15) | (.16) | (.18) |
| Distributions from net realized gain | (.41) | (.62) | (.94) | (.70) | (.36) | (.43) |
| Total distributions | (.41)B | (.79)B | (1.12) | (.84)B | (.52) | (.61) |
| Net asset value, end of period | $11.87 | $10.68 | $11.76 | $12.56 | $12.41 | $11.79 |
| Total ReturnC,D,E | 15.35% | (3.00)% | 3.01% | 8.10% | 9.98% | (2.32)% |
| Ratios to Average Net AssetsF,G | | | | | | |
| Expenses before reductions | 1.05%H | 1.06% | 1.07% | .98% | .50% | .50% |
| Expenses net of fee waivers, if any | 1.05%H | 1.06% | 1.07% | .98% | .50% | .50% |
| Expenses net of all reductions | 1.05%H | 1.06% | 1.07% | .98% | .50% | .50% |
| Net investment income (loss) | .10%H | 1.25% | 1.45% | .96% | 1.21% | 1.39% |
| Supplemental Data | | | | | | |
| Net assets, end of period (000 omitted) | $132,999 | $123,857 | $152,212 | $167,835 | $178,795 | $190,018 |
| Portfolio turnover rateG | 24%H | 22% | 21% | 19% | 22% | 20% |
A Calculated based on average shares outstanding during the period.
B Total distributions per share do not sum due to rounding.
C Total returns for periods of less than one year are not annualized.
D Total returns would have been lower if certain expenses had not been reduced during the applicable periods shown.
E Total returns do not include the effect of the sales charges.
F Expense ratios reflect operating expenses of the class. Expenses before reductions do not reflect amounts reimbursed, waived, or reduced through arrangements with the investment adviser, brokerage services, or other offset arrangements, if applicable, and do not represent the amount paid by the class during periods when reimbursements, waivers or reductions occur.
G Amount does not include the portfolio activity of any underlying mutual funds or exchange-traded funds (ETFs).
H Annualized
See accompanying notes which are an integral part of the financial statements.
Fidelity Advisor Freedom 2015 Fund Class C
| | Six months ended (Unaudited) September 30, | Years endedMarch 31, | | | | |
| | 2020 | 2020 | 2019 | 2018 | 2017 | 2016 |
| Selected Per–Share Data | | | | | | |
| Net asset value, beginning of period | $10.62 | $11.69 | $12.47 | $12.32 | $11.72 | $12.60 |
| Income from Investment Operations | | | | | | |
| Net investment income (loss)A | (.02) | .09 | .11 | .06 | .08 | .11 |
| Net realized and unrealized gain (loss) | 1.58 | (.44) | .16 | .86 | .98 | (.45) |
| Total from investment operations | 1.56 | (.35) | .27 | .92 | 1.06 | (.34) |
| Distributions from net investment income | – | (.09) | (.13) | (.08) | (.10) | (.11) |
| Distributions from net realized gain | (.40) | (.62) | (.93) | (.70) | (.36) | (.43) |
| Total distributions | (.40) | (.72)B | (1.05)B | (.77)B | (.46) | (.54) |
| Net asset value, end of period | $11.78 | $10.62 | $11.69 | $12.47 | $12.32 | $11.72 |
| Total ReturnC,D,E | 14.99% | (3.48)% | 2.60% | 7.57% | 9.33% | (2.76)% |
| Ratios to Average Net AssetsF,G | | | | | | |
| Expenses before reductions | 1.55%H | 1.56% | 1.57% | 1.48% | 1.00% | 1.00% |
| Expenses net of fee waivers, if any | 1.55%H | 1.56% | 1.57% | 1.48% | 1.00% | 1.00% |
| Expenses net of all reductions | 1.55%H | 1.55% | 1.57% | 1.48% | 1.00% | 1.00% |
| Net investment income (loss) | (.40)%H | .76% | .96% | .47% | .71% | .89% |
| Supplemental Data | | | | | | |
| Net assets, end of period (000 omitted) | $21,326 | $20,129 | $31,274 | $54,730 | $61,332 | $63,443 |
| Portfolio turnover rateG | 24%H | 22% | 21% | 19% | 22% | 20% |
A Calculated based on average shares outstanding during the period.
B Total distributions per share do not sum due to rounding.
C Total returns for periods of less than one year are not annualized.
D Total returns would have been lower if certain expenses had not been reduced during the applicable periods shown.
E Total returns do not include the effect of the contingent deferred sales charge.
F Expense ratios reflect operating expenses of the class. Expenses before reductions do not reflect amounts reimbursed, waived, or reduced through arrangements with the investment adviser, brokerage services, or other offset arrangements, if applicable, and do not represent the amount paid by the class during periods when reimbursements, waivers or reductions occur.
G Amount does not include the portfolio activity of any underlying mutual funds or exchange-traded funds (ETFs).
H Annualized
See accompanying notes which are an integral part of the financial statements.
Fidelity Advisor Freedom 2015 Fund Class I
| | Six months ended (Unaudited) September 30, | Years endedMarch 31, | | | | |
| | 2020 | 2020 | 2019 | 2018 | 2017 | 2016 |
| Selected Per–Share Data | | | | | | |
| Net asset value, beginning of period | $10.81 | $11.89 | $12.69 | $12.53 | $11.90 | $12.79 |
| Income from Investment Operations | | | | | | |
| Net investment income (loss)A | .03 | .21 | .24 | .19 | .21 | .23 |
| Net realized and unrealized gain (loss) | 1.62 | (.44) | .14 | .88 | 1.00 | (.45) |
| Total from investment operations | 1.65 | (.23) | .38 | 1.07 | 1.21 | (.22) |
| Distributions from net investment income | (.02) | (.22) | (.24) | (.21) | (.22) | (.24) |
| Distributions from net realized gain | (.41) | (.62) | (.94) | (.70) | (.36) | (.43) |
| Total distributions | (.43) | (.85)B | (1.18) | (.91) | (.58) | (.67) |
| Net asset value, end of period | $12.03 | $10.81 | $11.89 | $12.69 | $12.53 | $11.90 |
| Total ReturnC,D | 15.61% | (2.50)% | 3.55% | 8.66% | 10.53% | (1.80)% |
| Ratios to Average Net AssetsE,F | | | | | | |
| Expenses before reductions | .55%G | .56% | .57% | .48% | - %H | - %H |
| Expenses net of fee waivers, if any | .55%G | .56% | .57% | .48% | -% | -% |
| Expenses net of all reductions | .55%G | .56% | .57% | .48% | -% | -% |
| Net investment income (loss) | .60%G | 1.75% | 1.95% | 1.46% | 1.71% | 1.89% |
| Supplemental Data | | | | | | |
| Net assets, end of period (000 omitted) | $251,960 | $238,048 | $304,221 | $324,189 | $317,539 | $361,722 |
| Portfolio turnover rateF | 24%G | 22% | 21% | 19% | 22% | 20% |
A Calculated based on average shares outstanding during the period.
B Total distributions per share do not sum due to rounding.
C Total returns for periods of less than one year are not annualized.
D Total returns would have been lower if certain expenses had not been reduced during the applicable periods shown.
E Expense ratios reflect operating expenses of the class. Expenses before reductions do not reflect amounts reimbursed, waived, or reduced through arrangements with the investment adviser, brokerage services, or other offset arrangements, if applicable, and do not represent the amount paid by the class during periods when reimbursements, waivers or reductions occur.
F Amount does not include the portfolio activity of any underlying mutual funds or exchange-traded funds (ETFs).
G Annualized
H Amount represents less than .005%.
See accompanying notes which are an integral part of the financial statements.
Fidelity Advisor Freedom 2015 Fund Class Z
| | Six months ended (Unaudited) September 30, | Years endedMarch 31, | |
| | 2020 | 2020 | 2019 A |
| Selected Per–Share Data | | | |
| Net asset value, beginning of period | $10.74 | $11.85 | $12.50 |
| Income from Investment Operations | | | |
| Net investment income (loss)B | .04 | .22 | .27 |
| Net realized and unrealized gain (loss) | 1.60 | (.45) | (.17)C |
| Total from investment operations | 1.64 | (.23) | .10 |
| Distributions from net investment income | (.02) | (.26) | (.27) |
| Distributions from net realized gain | (.41) | (.62) | (.48) |
| Total distributions | (.43) | (.88) | (.75) |
| Net asset value, end of period | $11.95 | $10.74 | $11.85 |
| Total ReturnD,E | 15.64% | (2.48)% | 1.29% |
| Ratios to Average Net AssetsF,G | | | |
| Expenses before reductions | .48%H | .49% | .51%H,I |
| Expenses net of fee waivers, if any | .48%H | .49% | .51%H,I |
| Expenses net of all reductions | .48%H | .49% | .51%H,I |
| Net investment income (loss) | .67%H | 1.82% | 4.73%H |
| Supplemental Data | | | |
| Net assets, end of period (000 omitted) | $17,581 | $16,135 | $1,522 |
| Portfolio turnover rateG | 24%H | 22% | 21% |
A For the period October 2, 2018 (commencement of sale of shares) to March 31, 2019.
B Calculated based on average shares outstanding during the period.
C The amount shown for a share outstanding does not correspond with the aggregate net gain (loss) on investments for the period due to the timing of sales and repurchases of shares in relation to fluctuating market values of the investments of the Fund.
D Total returns for periods of less than one year are not annualized.
E Total returns would have been lower if certain expenses had not been reduced during the applicable periods shown.
F Expense ratios reflect operating expenses of the class. Expenses before reductions do not reflect amounts reimbursed, waived, or reduced through arrangements with the investment adviser, brokerage services, or other offset arrangements, if applicable, and do not represent the amount paid by the class during periods when reimbursements, waivers or reductions occur.
G Amount does not include the portfolio activity of any underlying mutual funds or exchange-traded funds (ETFs).
H Annualized
I On certain classes, the size and fluctuation of net assets and expense amounts may cause ratios to differ from contractual rates.
See accompanying notes which are an integral part of the financial statements.
Fidelity Advisor Freedom 2015 Fund Class Z6
| | Six months ended (Unaudited) September 30, | Years endedMarch 31, | | |
| | 2020 | 2020 | 2019 | 2018 A |
| Selected Per–Share Data | | | | |
| Net asset value, beginning of period | $10.78 | $11.87 | $12.67 | $12.66 |
| Income from Investment Operations | | | | |
| Net investment income (loss)B | .04 | .23 | .25 | .18 |
| Net realized and unrealized gain (loss) | 1.61 | (.45) | .16 | .51 |
| Total from investment operations | 1.65 | (.22) | .41 | .69 |
| Distributions from net investment income | (.02) | (.25) | (.27) | (.21) |
| Distributions from net realized gain | (.41) | (.62) | (.94) | (.47) |
| Total distributions | (.43) | (.87) | (1.21) | (.68) |
| Net asset value, end of period | $12.00 | $10.78 | $11.87 | $12.67 |
| Total ReturnC,D | 15.69% | (2.40)% | 3.81% | 5.42% |
| Ratios to Average Net AssetsE,F | | | | |
| Expenses before reductions | .40%G | .41% | .41% | .43%G,H |
| Expenses net of fee waivers, if any | .40%G | .41% | .41% | .43%G,H |
| Expenses net of all reductions | .40%G | .41% | .41% | .43%G,H |
| Net investment income (loss) | .74%G | 1.90% | 2.11% | 1.75% |
| Supplemental Data | | | | |
| Net assets, end of period (000 omitted) | $20,727 | $15,400 | $16,536 | $12,903 |
| Portfolio turnover rateF | 24%G | 22% | 21% | 19% |
A For the period June 6, 2017 (commencement of sale of shares) to March 31, 2018.
B Calculated based on average shares outstanding during the period.
C Total returns for periods of less than one year are not annualized.
D Total returns would have been lower if certain expenses had not been reduced during the applicable periods shown.
E Expense ratios reflect operating expenses of the class. Expenses before reductions do not reflect amounts reimbursed, waived, or reduced through arrangements with the investment adviser, brokerage services, or other offset arrangements, if applicable, and do not represent the amount paid by the class during periods when reimbursements, waivers or reductions occur.
F Amount does not include the portfolio activity of any underlying mutual funds or exchange-traded funds (ETFs).
G Annualized
H On certain classes, the size and fluctuation of net assets and expense amounts may cause ratios to differ from contractual rates.
See accompanying notes which are an integral part of the financial statements.
Fidelity Advisor Freedom® 2020 Fund
Investment Summary (Unaudited)
The information in the following tables is based on the direct investments of the Fund.
Top Holdings as of September 30, 2020
| | % of fund's net assets |
| Fidelity Series Investment Grade Bond Fund | 25.8 |
| Fidelity Series Emerging Markets Opportunities Fund | 9.8 |
| Fidelity Series Government Money Market Fund 0.16% | 7.5 |
| Fidelity Series Inflation-Protected Bond Index Fund | 7.0 |
| Fidelity Series Large Cap Stock Fund | 5.2 |
| Fidelity Series International Growth Fund | 4.0 |
| Fidelity Series Overseas Fund | 4.0 |
| Fidelity Series International Value Fund | 3.9 |
| Fidelity Series Value Discovery Fund | 3.4 |
| Fidelity Series Stock Selector Large Cap Value Fund | 3.3 |
| | 73.9 |
Asset Allocation (% of fund's net assets)
| Period end |
| | Domestic Equity Funds | 28.3% |
| | International Equity Funds | 25.3% |
| | Bond Funds | 37.0% |
| | Short-Term Funds | 9.3% |
| | Short-Term Investments | 0.1% |

Domestic Equity Funds category includes Fidelity Series Commodity Strategy Fund which invests in commodity-related investments.
Fidelity Advisor Freedom® 2020 Fund
Schedule of Investments September 30, 2020 (Unaudited)
Showing Percentage of Net Assets
| U.S. Treasury Obligations - 0.1% | | | |
| | | Principal Amount | Value |
| U.S. Treasury Bills, yield at date of purchase 0.1% to 0.11% 12/3/20 to 12/10/20 (a) | | | |
| (Cost $2,719,498) | | 2,720,000 | 2,719,516 |
| | | Shares | Value |
|
| Domestic Equity Funds - 28.3% | | | |
| Fidelity Advisor Series Equity Growth Fund (b) | | 3,690,642 | $67,132,786 |
| Fidelity Advisor Series Growth Opportunities Fund (b) | | 2,517,233 | 46,291,920 |
| Fidelity Advisor Series Small Cap Fund (b) | | 2,730,610 | 30,391,687 |
| Fidelity Series All-Sector Equity Fund (b) | | 2,715,097 | 28,915,787 |
| Fidelity Series Commodity Strategy Fund (b) | | 12,305,230 | 51,189,758 |
| Fidelity Series Large Cap Stock Fund (b) | | 7,501,059 | 106,214,991 |
| Fidelity Series Large Cap Value Index Fund (b) | | 989,513 | 11,478,352 |
| Fidelity Series Opportunistic Insights Fund (b) | | 2,883,085 | 62,361,128 |
| Fidelity Series Small Cap Opportunities Fund (b) | | 2,931,905 | 37,411,112 |
| Fidelity Series Stock Selector Large Cap Value Fund (b) | | 6,140,073 | 67,540,806 |
| Fidelity Series Value Discovery Fund (b) | | 5,588,280 | 69,071,146 |
| TOTAL DOMESTIC EQUITY FUNDS | | | |
| (Cost $452,425,016) | | | 577,999,473 |
|
| International Equity Funds - 25.3% | | | |
| Fidelity Series Canada Fund (b) | | 2,651,435 | 27,124,184 |
| Fidelity Series Emerging Markets Fund (b) | | 2,346,228 | 22,124,928 |
| Fidelity Series Emerging Markets Opportunities Fund (b) | | 9,565,825 | 200,691,017 |
| Fidelity Series International Growth Fund (b) | | 4,309,855 | 80,939,078 |
| Fidelity Series International Small Cap Fund (b) | | 1,391,330 | 24,765,672 |
| Fidelity Series International Value Fund (b) | | 9,293,176 | 80,107,173 |
| Fidelity Series Overseas Fund (b) | | 7,229,251 | 80,823,028 |
| TOTAL INTERNATIONAL EQUITY FUNDS | | | |
| (Cost $400,123,295) | | | 516,575,080 |
|
| Bond Funds - 37.0% | | | |
| Fidelity Series Emerging Markets Debt Fund (b) | | 1,379,947 | 12,502,324 |
| Fidelity Series Floating Rate High Income Fund (b) | | 272,460 | 2,411,268 |
| Fidelity Series High Income Fund (b) | | 1,511,072 | 13,780,979 |
| Fidelity Series Inflation-Protected Bond Index Fund (b) | | 13,445,001 | 143,861,515 |
| Fidelity Series International Credit Fund (b) | | 148,616 | 1,547,090 |
| Fidelity Series Investment Grade Bond Fund (b) | | 43,077,956 | 527,274,184 |
| Fidelity Series Long-Term Treasury Bond Index Fund (b) | | 4,508,452 | 46,572,307 |
| Fidelity Series Real Estate Income Fund (b) | | 873,652 | 8,719,049 |
| TOTAL BOND FUNDS | | | |
| (Cost $690,524,935) | | | 756,668,716 |
|
| Short-Term Funds - 9.3% | | | |
| Fidelity Cash Central Fund 0.10% (c) | | 1,656,196 | 1,656,527 |
| Fidelity Series Government Money Market Fund 0.16% (b)(d) | | 153,313,386 | 153,313,386 |
| Fidelity Series Short-Term Credit Fund (b) | | 3,557,062 | 36,459,888 |
| TOTAL SHORT-TERM FUNDS | | | |
| (Cost $190,421,123) | | | 191,429,801 |
| TOTAL INVESTMENT IN SECURITIES - 100.0% | | | |
| (Cost $1,736,213,867) | | | 2,045,392,586 |
| NET OTHER ASSETS (LIABILITIES) - 0.0% | | | (527,436) |
| NET ASSETS - 100% | | | $2,044,865,150 |
| Futures Contracts | | | | | |
| | Number of contracts | Expiration Date | Notional Amount | Value | Unrealized Appreciation/(Depreciation) |
| Purchased | | | | | |
| Equity Index Contracts | | | | | |
| ICE E-mini MSCI EAFE Index Contracts (United States) | 19 | Dec. 2020 | $1,760,540 | $(14,634) | $(14,634) |
| Sold | | | | | |
| Equity Index Contracts | | | | | |
| CME E-mini S&P 500 Index Contracts (United States) | 23 | Dec. 2020 | 3,854,800 | (25,165) | (25,165) |
| TOTAL FUTURES CONTRACTS | | | | | $(39,799) |
The notional amount of futures purchased as a percentage of Net Assets is 0.1%
The notional amount of futures sold as a percentage of Net Assets is 0.2%
Legend
(a) Security or a portion of the security was pledged to cover margin requirements for futures contracts. At period end, the value of securities pledged amounted to $2,719,516.
(b) Affiliated Fund
(c) Affiliated fund that is generally available only to investment companies and other accounts managed by Fidelity Investments. The rate quoted is the annualized seven-day yield of the fund at period end. A complete unaudited listing of the fund's holdings as of its most recent quarter end is available upon request. In addition, each Fidelity Central Fund's financial statements are available on the SEC's website or upon request.
(d) The rate quoted is the annualized seven-day yield of the fund at period end.
Affiliated Central Funds
Information regarding fiscal year to date income earned by the Fund from investments in Fidelity Central Funds is as follows:
| Fund | Income earned |
| Fidelity Cash Central Fund | $2,287 |
| Total | $2,287 |
Amounts in the income column in the above table include any capital gain distributions from underlying funds, which are presented in the corresponding line-item in the Statement of Operations, if applicable.
Affiliated Underlying Funds
Fiscal year to date information regarding the Fund's investments in affiliated Underlying Funds, excluding any Money Market Central Funds, is presented below. Exchanges between classes of the same affiliated Underlying Funds may occur.
| Affiliate | Value, beginning of period | Purchases | Sales Proceeds | Dividend Income | Realized Gain (loss) | Change in Unrealized appreciation (depreciation) | Value, end of period |
| Fidelity Advisor Series Equity Growth Fund | $56,424,775 | $4,775,913 | $20,471,878 | $-- | $7,317,222 | $19,086,754 | $67,132,786 |
| Fidelity Advisor Series Growth Opportunities Fund | 36,258,544 | 2,357,425 | 16,177,744 | -- | 5,161,967 | 18,691,728 | 46,291,920 |
| Fidelity Advisor Series Small Cap Fund | 23,472,121 | 3,181,085 | 4,023,374 | -- | 121,039 | 7,640,816 | 30,391,687 |
| Fidelity Series All-Sector Equity Fund | 24,957,973 | 1,641,502 | 6,405,110 | -- | 92,179 | 8,629,243 | 28,915,787 |
| Fidelity Series Canada Fund | 20,817,784 | 3,168,897 | 2,218,421 | -- | (207,092) | 5,563,016 | 27,124,184 |
| Fidelity Series Commodity Strategy Fund | 62,195,061 | 1,701,692 | 19,467,629 | 217,674 | (6,606,186) | 13,366,820 | 51,189,758 |
| Fidelity Series Emerging Markets Debt Fund | 11,703,842 | 417,563 | 1,068,173 | 336,410 | (42,983) | 1,492,075 | 12,502,324 |
| Fidelity Series Emerging Markets Fund | 13,887,141 | 5,097,322 | 2,405,962 | -- | 21,710 | 5,524,717 | 22,124,928 |
| Fidelity Series Emerging Markets Opportunities Fund | 133,928,919 | 40,989,885 | 26,700,931 | -- | 2,148,492 | 50,324,652 | 200,691,017 |
| Fidelity Series Floating Rate High Income Fund | 2,359,894 | 75,117 | 258,428 | 55,485 | (30,439) | 265,124 | 2,411,268 |
| Fidelity Series Government Money Market Fund 0.16% | 174,487,580 | 37,704,884 | 58,879,078 | 183,648 | -- | -- | 153,313,386 |
| Fidelity Series High Income Fund | 13,191,722 | 483,767 | 1,292,145 | 385,599 | (111,948) | 1,509,583 | 13,780,979 |
| Fidelity Series Inflation-Protected Bond Index Fund | 134,709,885 | 17,885,310 | 17,032,873 | 113,198 | 138,934 | 8,160,259 | 143,861,515 |
| Fidelity Series International Credit Fund | 1,399,702 | 21,754 | -- | 21,753 | -- | 125,634 | 1,547,090 |
| Fidelity Series International Growth Fund | 93,842,946 | 907,625 | 36,962,011 | -- | 14,609,945 | 8,540,573 | 80,939,078 |
| Fidelity Series International Small Cap Fund | 21,811,936 | 156,160 | 3,998,552 | -- | 985,668 | 5,810,460 | 24,765,672 |
| Fidelity Series International Value Fund | 79,959,397 | 3,384,601 | 19,012,073 | -- | (1,534,190) | 17,309,438 | 80,107,173 |
| Fidelity Series Investment Grade Bond Fund | 492,021,965 | 69,219,734 | 63,772,601 | 6,735,221 | 249,751 | 29,555,335 | 527,274,184 |
| Fidelity Series Large Cap Stock Fund | 90,315,569 | 9,602,149 | 10,313,372 | 3,844,590 | 308,584 | 16,302,061 | 106,214,991 |
| Fidelity Series Large Cap Value Index Fund | 9,382,282 | 1,350,216 | 1,244,710 | -- | 72,207 | 1,918,357 | 11,478,352 |
| Fidelity Series Long-Term Treasury Bond Index Fund | 48,519,393 | 9,069,537 | 9,629,139 | 1,216,454 | 1,134,637 | (2,522,121) | 46,572,307 |
| Fidelity Series Opportunistic Insights Fund | 52,779,092 | 4,387,869 | 16,716,715 | -- | 6,439,188 | 15,471,694 | 62,361,128 |
| Fidelity Series Overseas Fund | 78,348,582 | 2,872,244 | 22,186,501 | -- | (1,374,562) | 23,163,265 | 80,823,028 |
| Fidelity Series Real Estate Income Fund | 7,762,552 | 346,254 | 809,844 | 284,635 | (25,939) | 1,446,026 | 8,719,049 |
| Fidelity Series Short-Term Credit Fund | 34,871,879 | 523,356 | 240,227 | 396,634 | (981) | 1,305,861 | 36,459,888 |
| Fidelity Series Small Cap Opportunities Fund | 29,675,940 | 4,542,922 | 4,485,480 | 234,582 | 45,390 | 7,632,340 | 37,411,112 |
| Fidelity Series Stock Selector Large Cap Value Fund | 56,594,104 | 5,288,755 | 7,290,789 | -- | 165,226 | 12,783,510 | 67,540,806 |
| Fidelity Series Value Discovery Fund | 57,853,881 | 4,029,467 | 7,291,486 | -- | 721,098 | 13,758,186 | 69,071,146 |
| | $1,863,534,461 | $235,183,005 | $380,355,246 | $14,025,883 | $29,798,917 | $292,855,406 | $2,041,016,543 |
Amounts in the income column in the above table include any capital gain distributions from underlying funds, which are presented in the corresponding line-item in the Statement of Operations, if applicable.
Investment Valuation
The following is a summary of the inputs used, as of September 30, 2020, involving the Fund's assets and liabilities carried at fair value. The inputs or methodology used for valuing securities may not be an indication of the risk associated with investing in those securities. For more information on valuation inputs, and their aggregation into the levels used below, please refer to the Investment Valuation section in the accompanying Notes to Financial Statements.
| | Valuation Inputs at Reporting Date: |
| Description | Total | Level 1 | Level 2 | Level 3 |
| Investments in Securities: | | | | |
| Other Short-Term Investments and Net Other Assets | $2,719,516 | $-- | $2,719,516 | $-- |
| Domestic Equity Funds | 577,999,473 | 577,999,473 | -- | -- |
| International Equity Funds | 516,575,080 | 516,575,080 | -- | -- |
| Bond Funds | 756,668,716 | 756,668,716 | -- | -- |
| Short-Term Funds | 191,429,801 | 191,429,801 | -- | -- |
| Total Investments in Securities: | $2,045,392,586 | $2,042,673,070 | $2,719,516 | $-- |
| Derivative Instruments: | | | | |
| Liabilities | | | | |
| Futures Contracts | $(39,799) | $(39,799) | $-- | $-- |
| Total Liabilities | $(39,799) | $(39,799) | $-- | $-- |
| Total Derivative Instruments: | $(39,799) | $(39,799) | $-- | $-- |
Value of Derivative Instruments
The following table is a summary of the Fund's value of derivative instruments by primary risk exposure as of September 30, 2020. For additional information on derivative instruments, please refer to the Derivative Instruments section in the accompanying Notes to Financial Statements.
| Primary Risk Exposure / Derivative Type | Value |
| | Asset | Liability |
| Equity Risk | | |
| Futures Contracts(a) | $0 | $(39,799) |
| Total Equity Risk | 0 | (39,799) |
| Total Value of Derivatives | $0 | $(39,799) |
(a) Reflects gross cumulative appreciation (depreciation) on futures contracts as presented in the Schedule of Investments. In the Statement of Assets and Liabilities, the period end daily variation margin is included in receivable or payable for daily variation margin on futures contracts, and the net cumulative appreciation (depreciation) is included in Total accumulated earnings (loss).
See accompanying notes which are an integral part of the financial statements.
Fidelity Advisor Freedom® 2020 Fund
Financial Statements
Statement of Assets and Liabilities
| | | September 30, 2020 (Unaudited) |
| Assets | | |
Investment in securities, at value — See accompanying schedule:
Unaffiliated issuers (cost $2,719,498) | $2,719,516 | |
| Fidelity Central Funds (cost $1,656,527) | 1,656,527 | |
| Other affiliated issuers (cost $1,731,837,842) | 2,041,016,543 | |
| Total Investment in Securities (cost $1,736,213,867) | | $2,045,392,586 |
| Receivable for investments sold | | 38,079,408 |
| Receivable for fund shares sold | | 1,223,564 |
| Distributions receivable from Fidelity Central Funds | | 135 |
| Total assets | | 2,084,695,693 |
| Liabilities | | |
| Payable for investments purchased | $35,021,797 | |
| Payable for fund shares redeemed | 3,329,629 | |
| Accrued management fee | 1,008,281 | |
| Distribution and service plan fees payable | 350,914 | |
| Payable for daily variation margin on futures contracts | 119,922 | |
| Total liabilities | | 39,830,543 |
| Net Assets | | $2,044,865,150 |
| Net Assets consist of: | | |
| Paid in capital | | $1,708,330,035 |
| Total accumulated earnings (loss) | | 336,535,115 |
| Net Assets | | $2,044,865,150 |
| Net Asset Value and Maximum Offering Price | | |
| Class A: | | |
| Net Asset Value and redemption price per share ($865,716,685 ÷ 65,726,714 shares)(a) | | $13.17 |
| Maximum offering price per share (100/94.25 of $13.17) | | $13.97 |
| Class M: | | |
| Net Asset Value and redemption price per share ($301,852,958 ÷ 22,946,396 shares)(a) | | $13.15 |
| Maximum offering price per share (100/96.50 of $13.15) | | $13.63 |
| Class C: | | |
| Net Asset Value and offering price per share ($50,320,592 ÷ 3,867,890 shares)(a) | | $13.01 |
| Class I: | | |
| Net Asset Value, offering price and redemption price per share ($715,864,916 ÷ 53,845,299 shares) | | $13.29 |
| Class Z: | | |
| Net Asset Value, offering price and redemption price per share ($39,921,116 ÷ 3,023,284 shares) | | $13.20 |
| Class Z6: | | |
| Net Asset Value, offering price and redemption price per share ($71,188,883 ÷ 5,372,362 shares) | | $13.25 |
(a) Redemption price per share is equal to net asset value less any applicable contingent deferred sales charge.
See accompanying notes which are an integral part of the financial statements.
Statement of Operations
| | | Six months ended September 30, 2020 (Unaudited) |
| Investment Income | | |
| Dividends: | | |
| Affiliated issuers | | $10,777,009 |
| Interest | | 2,946 |
| Income from Fidelity Central Funds | | 2,287 |
| Total income | | 10,782,242 |
| Expenses | | |
| Management fee | $5,950,257 | |
| Distribution and service plan fees | 2,073,364 | |
| Independent trustees' fees and expenses | 2,812 | |
| Total expenses before reductions | 8,026,433 | |
| Expense reductions | (163) | |
| Total expenses after reductions | | 8,026,270 |
| Net investment income (loss) | | 2,755,972 |
| Realized and Unrealized Gain (Loss) | | |
| Net realized gain (loss) on: | | |
| Investment securities: | | |
| Unaffiliated issuers | 2 | |
| Fidelity Central Funds | (381) | |
| Other affiliated issuers | 29,798,917 | |
| Futures contracts | (2,041,932) | |
| Capital gain distributions from underlying funds: | | |
| Affiliated issuers | 3,248,874 | |
| Total net realized gain (loss) | | 31,005,480 |
| Change in net unrealized appreciation (depreciation) on: | | |
| Investment securities: | | |
| Unaffiliated issuers | (1,697) | |
| Fidelity Central Funds | (101) | |
| Other affiliated issuers | 292,855,406 | |
| Futures contracts | (39,799) | |
| Total change in net unrealized appreciation (depreciation) | | 292,813,809 |
| Net gain (loss) | | 323,819,289 |
| Net increase (decrease) in net assets resulting from operations | | $326,575,261 |
See accompanying notes which are an integral part of the financial statements.
Statement of Changes in Net Assets
| | Six months ended September 30, 2020 (Unaudited) | Year ended March 31, 2020 |
| Increase (Decrease) in Net Assets | | |
| Operations | | |
| Net investment income (loss) | $2,755,972 | $33,685,728 |
| Net realized gain (loss) | 31,005,480 | 119,576,285 |
| Change in net unrealized appreciation (depreciation) | 292,813,809 | (223,185,697) |
| Net increase (decrease) in net assets resulting from operations | 326,575,261 | (69,923,684) |
| Distributions to shareholders | (75,196,423) | (150,473,417) |
| Share transactions - net increase (decrease) | (75,993,401) | (200,998,401) |
| Total increase (decrease) in net assets | 175,385,437 | (421,395,502) |
| Net Assets | | |
| Beginning of period | 1,869,479,713 | 2,290,875,215 |
| End of period | $2,044,865,150 | $1,869,479,713 |
See accompanying notes which are an integral part of the financial statements.
Financial Highlights
Fidelity Advisor Freedom 2020 Fund Class A
| | Six months ended (Unaudited) September 30, | Years endedMarch 31, | | | | |
| | 2020 | 2020 | 2019 | 2018 | 2017 | 2016 |
| Selected Per–Share Data | | | | | | |
| Net asset value, beginning of period | $11.63 | $12.97 | $13.71 | $13.31 | $12.51 | $13.44 |
| Income from Investment Operations | | | | | | |
| Net investment income (loss)A | .01 | .19 | .22 | .16 | .19 | .21 |
| Net realized and unrealized gain (loss) | 2.00 | (.65) | .18 | 1.05 | 1.16 | (.51) |
| Total from investment operations | 2.01 | (.46) | .40 | 1.21 | 1.35 | (.30) |
| Distributions from net investment income | (.01) | (.20) | (.22) | (.18) | (.19) | (.21) |
| Distributions from net realized gain | (.47) | (.68) | (.92) | (.62) | (.36) | (.41) |
| Total distributions | (.47)B | (.88) | (1.14) | (.81)B | (.55) | (.63)B |
| Net asset value, end of period | $13.17 | $11.63 | $12.97 | $13.71 | $13.31 | $12.51 |
| Total ReturnC,D,E | 17.71% | (4.15)% | 3.40% | 9.15% | 11.17% | (2.35)% |
| Ratios to Average Net AssetsF,G | | | | | | |
| Expenses before reductions | .84%H | .85% | .86% | .76% | .25% | .25% |
| Expenses net of fee waivers, if any | .84%H | .85% | .86% | .76% | .25% | .25% |
| Expenses net of all reductions | .84%H | .85% | .86% | .76% | .25% | .25% |
| Net investment income (loss) | .22%H | 1.46% | 1.68% | 1.18% | 1.46% | 1.62% |
| Supplemental Data | | | | | | |
| Net assets, end of period (000 omitted) | $865,717 | $800,330 | $1,038,299 | $1,196,128 | $1,315,261 | $1,442,826 |
| Portfolio turnover rateG | 23%H | 25% | 22% | 20% | 19% | 20% |
A Calculated based on average shares outstanding during the period.
B Total distributions per share do not sum due to rounding.
C Total returns for periods of less than one year are not annualized.
D Total returns would have been lower if certain expenses had not been reduced during the applicable periods shown.
E Total returns do not include the effect of the sales charges.
F Expense ratios reflect operating expenses of the class. Expenses before reductions do not reflect amounts reimbursed, waived, or reduced through arrangements with the investment adviser, brokerage services, or other offset arrangements, if applicable, and do not represent the amount paid by the class during periods when reimbursements, waivers or reductions occur.
G Amount does not include the portfolio activity of any underlying mutual funds or exchange-traded funds (ETFs).
H Annualized
See accompanying notes which are an integral part of the financial statements.
Fidelity Advisor Freedom 2020 Fund Class M
| | Six months ended (Unaudited) September 30, | Years endedMarch 31, | | | | |
| | 2020 | 2020 | 2019 | 2018 | 2017 | 2016 |
| Selected Per–Share Data | | | | | | |
| Net asset value, beginning of period | $11.62 | $12.96 | $13.71 | $13.30 | $12.51 | $13.44 |
| Income from Investment Operations | | | | | | |
| Net investment income (loss)A | – | .16 | .19 | .13 | .15 | .18 |
| Net realized and unrealized gain (loss) | 1.99 | (.65) | .17 | 1.05 | 1.16 | (.52) |
| Total from investment operations | 1.99 | (.49) | .36 | 1.18 | 1.31 | (.34) |
| Distributions from net investment income | – | (.17) | (.19) | (.15) | (.16) | (.18) |
| Distributions from net realized gain | (.46) | (.68) | (.92) | (.62) | (.36) | (.41) |
| Total distributions | (.46) | (.85) | (1.11) | (.77) | (.52) | (.59) |
| Net asset value, end of period | $13.15 | $11.62 | $12.96 | $13.71 | $13.30 | $12.51 |
| Total ReturnB,C,D | 17.55% | (4.38)% | 3.07% | 8.97% | 10.81% | (2.59)% |
| Ratios to Average Net AssetsE,F | | | | | | |
| Expenses before reductions | 1.09%G | 1.10% | 1.11% | 1.01% | .50% | .50% |
| Expenses net of fee waivers, if any | 1.09%G | 1.10% | 1.11% | 1.01% | .50% | .50% |
| Expenses net of all reductions | 1.09%G | 1.10% | 1.11% | 1.01% | .50% | .50% |
| Net investment income (loss) | (.03)%G | 1.21% | 1.43% | .92% | 1.21% | 1.37% |
| Supplemental Data | | | | | | |
| Net assets, end of period (000 omitted) | $301,853 | $277,496 | $345,810 | $374,470 | $396,330 | $394,406 |
| Portfolio turnover rateF | 23%G | 25% | 22% | 20% | 19% | 20% |
A Calculated based on average shares outstanding during the period.
B Total returns for periods of less than one year are not annualized.
C Total returns would have been lower if certain expenses had not been reduced during the applicable periods shown.
D Total returns do not include the effect of the sales charges.
E Expense ratios reflect operating expenses of the class. Expenses before reductions do not reflect amounts reimbursed, waived, or reduced through arrangements with the investment adviser, brokerage services, or other offset arrangements, if applicable, and do not represent the amount paid by the class during periods when reimbursements, waivers or reductions occur.
F Amount does not include the portfolio activity of any underlying mutual funds or exchange-traded funds (ETFs).
G Annualized
See accompanying notes which are an integral part of the financial statements.
Fidelity Advisor Freedom 2020 Fund Class C
| | Six months ended (Unaudited) September 30, | Years endedMarch 31, | | | | |
| | 2020 | 2020 | 2019 | 2018 | 2017 | 2016 |
| Selected Per–Share Data | | | | | | |
| Net asset value, beginning of period | $11.52 | $12.86 | $13.60 | $13.20 | $12.42 | $13.35 |
| Income from Investment Operations | | | | | | |
| Net investment income (loss)A | (.03) | .09 | .12 | .06 | .09 | .11 |
| Net realized and unrealized gain (loss) | 1.97 | (.64) | .17 | 1.05 | 1.15 | (.51) |
| Total from investment operations | 1.94 | (.55) | .29 | 1.11 | 1.24 | (.40) |
| Distributions from net investment income | – | (.11) | (.14) | (.09) | (.10) | (.12) |
| Distributions from net realized gain | (.45) | (.68) | (.90) | (.62) | (.36) | (.41) |
| Total distributions | (.45) | (.79) | (1.03)B | (.71) | (.46) | (.53) |
| Net asset value, end of period | $13.01 | $11.52 | $12.86 | $13.60 | $13.20 | $12.42 |
| Total ReturnC,D,E | 17.25% | (4.81)% | 2.55% | 8.45% | 10.26% | (3.11)% |
| Ratios to Average Net AssetsF,G | | | | | | |
| Expenses before reductions | 1.59%H | 1.60% | 1.61% | 1.52% | 1.00% | 1.00% |
| Expenses net of fee waivers, if any | 1.59%H | 1.60% | 1.61% | 1.52% | 1.00% | 1.00% |
| Expenses net of all reductions | 1.59%H | 1.60% | 1.61% | 1.52% | 1.00% | 1.00% |
| Net investment income (loss) | (.53)%H | .71% | .93% | .42% | .71% | .87% |
| Supplemental Data | | | | | | |
| Net assets, end of period (000 omitted) | $50,321 | $46,563 | $63,123 | $98,878 | $101,268 | $105,128 |
| Portfolio turnover rateG | 23%H | 25% | 22% | 20% | 19% | 20% |
A Calculated based on average shares outstanding during the period.
B Total distributions per share do not sum due to rounding.
C Total returns for periods of less than one year are not annualized.
D Total returns would have been lower if certain expenses had not been reduced during the applicable periods shown.
E Total returns do not include the effect of the contingent deferred sales charge.
F Expense ratios reflect operating expenses of the class. Expenses before reductions do not reflect amounts reimbursed, waived, or reduced through arrangements with the investment adviser, brokerage services, or other offset arrangements, if applicable, and do not represent the amount paid by the class during periods when reimbursements, waivers or reductions occur.
G Amount does not include the portfolio activity of any underlying mutual funds or exchange-traded funds (ETFs).
H Annualized
See accompanying notes which are an integral part of the financial statements.
Fidelity Advisor Freedom 2020 Fund Class I
| | Six months ended (Unaudited) September 30, | Years endedMarch 31, | | | | |
| | 2020 | 2020 | 2019 | 2018 | 2017 | 2016 |
| Selected Per–Share Data | | | | | | |
| Net asset value, beginning of period | $11.73 | $13.07 | $13.82 | $13.41 | $12.61 | $13.54 |
| Income from Investment Operations | | | | | | |
| Net investment income (loss)A | .03 | .22 | .26 | .20 | .22 | .24 |
| Net realized and unrealized gain (loss) | 2.01 | (.65) | .17 | 1.05 | 1.16 | (.51) |
| Total from investment operations | 2.04 | (.43) | .43 | 1.25 | 1.38 | (.27) |
| Distributions from net investment income | (.01) | (.23) | (.26) | (.22) | (.22) | (.25) |
| Distributions from net realized gain | (.47) | (.68) | (.92) | (.62) | (.36) | (.41) |
| Total distributions | (.48) | (.91) | (1.18) | (.84) | (.58) | (.66) |
| Net asset value, end of period | $13.29 | $11.73 | $13.07 | $13.82 | $13.41 | $12.61 |
| Total ReturnB,C | 17.81% | (3.87)% | 3.61% | 9.45% | 11.36% | (2.07)% |
| Ratios to Average Net AssetsD,E | | | | | | |
| Expenses before reductions | .59%F | .60% | .61% | .52% | - %G | - %G |
| Expenses net of fee waivers, if any | .59%F | .60% | .61% | .52% | -% | -% |
| Expenses net of all reductions | .59%F | .60% | .61% | .52% | -% | -% |
| Net investment income (loss) | .47%F | 1.71% | 1.92% | 1.42% | 1.71% | 1.87% |
| Supplemental Data | | | | | | |
| Net assets, end of period (000 omitted) | $715,865 | $654,422 | $795,372 | $803,562 | $743,042 | $767,908 |
| Portfolio turnover rateE | 23%F | 25% | 22% | 20% | 19% | 20% |
A Calculated based on average shares outstanding during the period.
B Total returns for periods of less than one year are not annualized.
C Total returns would have been lower if certain expenses had not been reduced during the applicable periods shown.
D Expense ratios reflect operating expenses of the class. Expenses before reductions do not reflect amounts reimbursed, waived, or reduced through arrangements with the investment adviser, brokerage services, or other offset arrangements, if applicable, and do not represent the amount paid by the class during periods when reimbursements, waivers or reductions occur.
E Amount does not include the portfolio activity of any underlying mutual funds or exchange-traded funds (ETFs).
F Annualized
G Amount represents less than .005%.
See accompanying notes which are an integral part of the financial statements.
Fidelity Advisor Freedom 2020 Fund Class Z
| | Six months ended (Unaudited) September 30, | Years endedMarch 31, | |
| | 2020 | 2020 | 2019 A |
| Selected Per–Share Data | | | |
| Net asset value, beginning of period | $11.65 | $13.02 | $13.69 |
| Income from Investment Operations | | | |
| Net investment income (loss)B | .03 | .23 | .21 |
| Net realized and unrealized gain (loss) | 2.00 | (.64) | (.15)C |
| Total from investment operations | 2.03 | (.41) | .06 |
| Distributions from net investment income | (.02) | (.28) | (.30) |
| Distributions from net realized gain | (.47) | (.68) | (.43) |
| Total distributions | (.48)D | (.96) | (.73) |
| Net asset value, end of period | $13.20 | $11.65 | $13.02 |
| Total ReturnE,F | 17.89% | (3.82)% | .91% |
| Ratios to Average Net AssetsG,H | | | |
| Expenses before reductions | .52%I | .53%J | .54%I,J |
| Expenses net of fee waivers, if any | .52%I | .53%J | .54%I,J |
| Expenses net of all reductions | .52%I | .53%J | .54%I,J |
| Net investment income (loss) | .54%I | 1.78% | 3.41%I |
| Supplemental Data | | | |
| Net assets, end of period (000 omitted) | $39,921 | $33,172 | $2,585 |
| Portfolio turnover rateH | 23%I | 25% | 22% |
A For the period October 2, 2018 (commencement of sale of shares) to March 31, 2019.
B Calculated based on average shares outstanding during the period.
C The amount shown for a share outstanding does not correspond with the aggregate net gain (loss) on investments for the period due to the timing of sales and repurchases of shares in relation to fluctuating market values of the investments of the Fund.
D Total distributions per share do not sum due to rounding.
E Total returns for periods of less than one year are not annualized.
F Total returns would have been lower if certain expenses had not been reduced during the applicable periods shown.
G Expense ratios reflect operating expenses of the class. Expenses before reductions do not reflect amounts reimbursed, waived, or reduced through arrangements with the investment adviser, brokerage services, or other offset arrangements, if applicable, and do not represent the amount paid by the class during periods when reimbursements, waivers or reductions occur.
H Amount does not include the portfolio activity of any underlying mutual funds or exchange-traded funds (ETFs).
I Annualized
J On certain classes, the size and fluctuation of net assets and expense amounts may cause ratios to differ from contractual rates.
See accompanying notes which are an integral part of the financial statements.
Fidelity Advisor Freedom 2020 Fund Class Z6
| | Six months ended (Unaudited) September 30, | Years endedMarch 31, | | |
| | 2020 | 2020 | 2019 | 2018 A |
| Selected Per–Share Data | | | | |
| Net asset value, beginning of period | $11.69 | $13.04 | $13.81 | $13.62 |
| Income from Investment Operations | | | | |
| Net investment income (loss)B | .04 | .25 | .28 | .08 |
| Net realized and unrealized gain (loss) | 2.01 | (.65) | .17 | .75 |
| Total from investment operations | 2.05 | (.40) | .45 | .83 |
| Distributions from net investment income | (.02) | (.27) | (.30) | (.23) |
| Distributions from net realized gain | (.47) | (.68) | (.92) | (.41) |
| Total distributions | (.49) | (.95) | (1.22) | (.64) |
| Net asset value, end of period | $13.25 | $11.69 | $13.04 | $13.81 |
| Total ReturnC,D | 17.95% | (3.72)% | 3.76% | 6.08% |
| Ratios to Average Net AssetsE,F | | | | |
| Expenses before reductions | .42%G | .43% | .43% | .45%G,H |
| Expenses net of fee waivers, if any | .42%G | .43% | .43% | .45%G,H |
| Expenses net of all reductions | .42%G | .43% | .43% | .45%G,H |
| Net investment income (loss) | .64%G | 1.88% | 2.10% | .71%G |
| Supplemental Data | | | | |
| Net assets, end of period (000 omitted) | $71,189 | $57,497 | $45,686 | $29,132 |
| Portfolio turnover rateF | 23%G | 25% | 22% | 20% |
A For the period June 6, 2017 (commencement of sale of shares) to March 31, 2018.
B Calculated based on average shares outstanding during the period.
C Total returns for periods of less than one year are not annualized.
D Total returns would have been lower if certain expenses had not been reduced during the applicable periods shown.
E Expense ratios reflect operating expenses of the class. Expenses before reductions do not reflect amounts reimbursed, waived, or reduced through arrangements with the investment adviser, brokerage services, or other offset arrangements, if applicable, and do not represent the amount paid by the class during periods when reimbursements, waivers or reductions occur.
F Amount does not include the portfolio activity of any underlying mutual funds or exchange-traded funds (ETFs).
G Annualized
H On certain classes, the size and fluctuation of net assets and expense amounts may cause ratios to differ from contractual rates.
See accompanying notes which are an integral part of the financial statements.
Fidelity Advisor Freedom® 2025 Fund
Investment Summary (Unaudited)
The information in the following tables is based on the direct investments of the Fund.
Top Holdings as of September 30, 2020
| | % of fund's net assets |
| Fidelity Series Investment Grade Bond Fund | 23.2 |
| Fidelity Series Emerging Markets Opportunities Fund | 10.5 |
| Fidelity Series Inflation-Protected Bond Index Fund | 6.3 |
| Fidelity Series Large Cap Stock Fund | 6.0 |
| Fidelity Series Government Money Market Fund 0.16% | 5.0 |
| Fidelity Series International Growth Fund | 4.5 |
| Fidelity Series Overseas Fund | 4.4 |
| Fidelity Series International Value Fund | 4.4 |
| Fidelity Series Value Discovery Fund | 3.9 |
| Fidelity Series Stock Selector Large Cap Value Fund | 3.8 |
| | 72.0 |
Asset Allocation (% of fund's net assets)
| Period end |
| | Domestic Equity Funds | 32.2% |
| | International Equity Funds | 27.9% |
| | Bond Funds | 33.6% |
| | Short-Term Funds | 6.2% |
| | Short-Term Investments | 0.1% |

Domestic Equity Funds category includes Fidelity Series Commodity Strategy Fund which invests in commodity-related investments.
Fidelity Advisor Freedom® 2025 Fund
Schedule of Investments September 30, 2020 (Unaudited)
Showing Percentage of Net Assets
| U.S. Treasury Obligations - 0.1% | | | |
| | | Principal Amount | Value |
| U.S. Treasury Bills, yield at date of purchase 0.09% to 0.11% 11/12/20 to 12/10/20 (a) | | | |
| (Cost $3,659,322) | | 3,660,000 | 3,659,352 |
| | | Shares | Value |
|
| Domestic Equity Funds - 32.2% | | | |
| Fidelity Advisor Series Equity Growth Fund (b) | | 5,873,933 | $106,846,833 |
| Fidelity Advisor Series Growth Opportunities Fund (b) | | 4,006,362 | 73,677,006 |
| Fidelity Advisor Series Small Cap Fund (b) | | 4,345,664 | 48,367,235 |
| Fidelity Series All-Sector Equity Fund (b) | | 4,320,754 | 46,016,027 |
| Fidelity Series Commodity Strategy Fund (b) | | 17,044,937 | 70,906,936 |
| Fidelity Series Large Cap Stock Fund (b) | | 11,937,281 | 169,031,904 |
| Fidelity Series Large Cap Value Index Fund (b) | | 1,574,785 | 18,267,504 |
| Fidelity Series Opportunistic Insights Fund (b) | | 4,588,110 | 99,240,815 |
| Fidelity Series Small Cap Opportunities Fund (b) | | 4,666,107 | 59,539,524 |
| Fidelity Series Stock Selector Large Cap Value Fund (b) | | 9,771,847 | 107,490,320 |
| Fidelity Series Value Discovery Fund (b) | | 8,893,664 | 109,925,683 |
| TOTAL DOMESTIC EQUITY FUNDS | | | |
| (Cost $714,349,787) | | | 909,309,787 |
|
| International Equity Funds - 27.9% | | | |
| Fidelity Series Canada Fund (b) | | 4,132,193 | 42,272,331 |
| Fidelity Series Emerging Markets Fund (b) | | 3,484,799 | 32,861,650 |
| Fidelity Series Emerging Markets Opportunities Fund (b) | | 14,165,179 | 297,185,454 |
| Fidelity Series International Growth Fund (b) | | 6,713,246 | 126,074,752 |
| Fidelity Series International Small Cap Fund (b) | | 2,181,688 | 38,834,052 |
| Fidelity Series International Value Fund (b) | | 14,477,880 | 124,799,322 |
| Fidelity Series Overseas Fund (b) | | 11,260,603 | 125,893,540 |
| TOTAL INTERNATIONAL EQUITY FUNDS | | | |
| (Cost $623,407,727) | | | 787,921,101 |
|
| Bond Funds - 33.6% | | | |
| Fidelity Series Emerging Markets Debt Fund (b) | | 1,876,671 | 17,002,643 |
| Fidelity Series Floating Rate High Income Fund (b) | | 380,192 | 3,364,700 |
| Fidelity Series High Income Fund (b) | | 2,092,180 | 19,080,684 |
| Fidelity Series Inflation-Protected Bond Index Fund (b) | | 16,550,930 | 177,094,954 |
| Fidelity Series International Credit Fund (b) | | 172,300 | 1,793,648 |
| Fidelity Series Investment Grade Bond Fund (b) | | 53,647,067 | 656,640,099 |
| Fidelity Series Long-Term Treasury Bond Index Fund (b) | | 6,229,965 | 64,355,535 |
| Fidelity Series Real Estate Income Fund (b) | | 1,174,893 | 11,725,433 |
| TOTAL BOND FUNDS | | | |
| (Cost $877,267,508) | | | 951,057,696 |
|
| Short-Term Funds - 6.2% | | | |
| Fidelity Cash Central Fund 0.10% (c) | | 2,535,088 | 2,535,595 |
| Fidelity Series Government Money Market Fund 0.16% (b)(d) | | 142,294,585 | 142,294,585 |
| Fidelity Series Short-Term Credit Fund (b) | | 2,945,768 | 30,194,119 |
| TOTAL SHORT-TERM FUNDS | | | |
| (Cost $174,197,846) | | | 175,024,299 |
| TOTAL INVESTMENT IN SECURITIES - 100.0% | | | |
| (Cost $2,392,882,190) | | | 2,826,972,235 |
| NET OTHER ASSETS (LIABILITIES) - 0.0% | | | (675,907) |
| NET ASSETS - 100% | | | $2,826,296,328 |
| Futures Contracts | | | | | |
| | Number of contracts | Expiration Date | Notional Amount | Value | Unrealized Appreciation/(Depreciation) |
| Purchased | | | | | |
| Equity Index Contracts | | | | | |
| ICE E-mini MSCI EAFE Index Contracts (United States) | 29 | Dec. 2020 | $2,687,140 | $(18,243) | $(18,243) |
| Sold | | | | | |
| Equity Index Contracts | | | | | |
| CME E-mini S&P 500 Index Contracts (United States) | 33 | Dec. 2020 | 5,530,800 | (36,106) | (36,106) |
| TOTAL FUTURES CONTRACTS | | | | | $(54,349) |
The notional amount of futures purchased as a percentage of Net Assets is 0.1%
The notional amount of futures sold as a percentage of Net Assets is 0.2%
Legend
(a) Security or a portion of the security was pledged to cover margin requirements for futures contracts. At period end, the value of securities pledged amounted to $3,659,352.
(b) Affiliated Fund
(c) Affiliated fund that is generally available only to investment companies and other accounts managed by Fidelity Investments. The rate quoted is the annualized seven-day yield of the fund at period end. A complete unaudited listing of the fund's holdings as of its most recent quarter end is available upon request. In addition, each Fidelity Central Fund's financial statements are available on the SEC's website or upon request.
(d) The rate quoted is the annualized seven-day yield of the fund at period end.
Affiliated Central Funds
Information regarding fiscal year to date income earned by the Fund from investments in Fidelity Central Funds is as follows:
| Fund | Income earned |
| Fidelity Cash Central Fund | $3,269 |
| Total | $3,269 |
Amounts in the income column in the above table include any capital gain distributions from underlying funds, which are presented in the corresponding line-item in the Statement of Operations, if applicable.
Affiliated Underlying Funds
Fiscal year to date information regarding the Fund's investments in affiliated Underlying Funds, excluding any Money Market Central Funds, is presented below. Exchanges between classes of the same affiliated Underlying Funds may occur.
| Affiliate | Value, beginning of period | Purchases | Sales Proceeds | Dividend Income | Realized Gain (loss) | Change in Unrealized appreciation (depreciation) | Value, end of period |
| Fidelity Advisor Series Equity Growth Fund | $87,460,082 | $7,672,634 | $29,335,648 | $-- | $9,582,978 | $31,466,787 | $106,846,833 |
| Fidelity Advisor Series Growth Opportunities Fund | 56,215,023 | 3,554,424 | 23,234,295 | -- | 7,378,843 | 29,763,011 | 73,677,006 |
| Fidelity Advisor Series Small Cap Fund | 36,379,080 | 4,590,134 | 4,749,014 | -- | 177,842 | 11,969,193 | 48,367,235 |
| Fidelity Series All-Sector Equity Fund | 38,592,517 | 2,427,419 | 8,580,837 | -- | 153,666 | 13,423,262 | 46,016,027 |
| Fidelity Series Canada Fund | 31,394,529 | 4,821,652 | 1,919,035 | -- | (185,272) | 8,160,457 | 42,272,331 |
| Fidelity Series Commodity Strategy Fund | 83,246,186 | 2,966,687 | 24,477,105 | 300,654 | (10,532,466) | 19,703,634 | 70,906,936 |
| Fidelity Series Emerging Markets Debt Fund | 15,537,834 | 648,562 | 1,117,708 | 452,093 | (62,417) | 1,996,372 | 17,002,643 |
| Fidelity Series Emerging Markets Fund | 20,237,886 | 7,352,530 | 2,791,819 | -- | 31,046 | 8,032,007 | 32,861,650 |
| Fidelity Series Emerging Markets Opportunities Fund | 195,001,160 | 56,988,210 | 30,934,795 | -- | 2,074,356 | 74,056,523 | 297,185,454 |
| Fidelity Series Floating Rate High Income Fund | 3,191,164 | 123,737 | 270,413 | 76,204 | (24,219) | 344,431 | 3,364,700 |
| Fidelity Series Government Money Market Fund 0.16% | 164,696,706 | 47,761,767 | 70,163,888 | 168,922 | -- | -- | 142,294,585 |
| Fidelity Series High Income Fund | 17,771,699 | 764,317 | 1,352,067 | 526,652 | (64,623) | 1,961,358 | 19,080,684 |
| Fidelity Series Inflation-Protected Bond Index Fund | 160,441,556 | 23,712,332 | 17,075,151 | 136,332 | 174,461 | 9,841,756 | 177,094,954 |
| Fidelity Series International Credit Fund | 1,622,771 | 25,221 | -- | 25,220 | -- | 145,656 | 1,793,648 |
| Fidelity Series International Growth Fund | 139,525,213 | 1,213,155 | 49,704,506 | -- | 18,034,947 | 17,005,943 | 126,074,752 |
| Fidelity Series International Small Cap Fund | 32,315,563 | 377,165 | 4,218,910 | -- | 867,529 | 9,492,705 | 38,834,052 |
| Fidelity Series International Value Fund | 119,395,743 | 5,980,510 | 24,479,678 | -- | (2,941,794) | 26,844,541 | 124,799,322 |
| Fidelity Series Investment Grade Bond Fund | 589,096,992 | 97,477,736 | 65,895,231 | 8,224,022 | (121,439) | 36,082,041 | 656,640,099 |
| Fidelity Series Large Cap Stock Fund | 140,947,103 | 12,954,080 | 10,626,533 | 6,007,909 | 168,018 | 25,589,236 | 169,031,904 |
| Fidelity Series Large Cap Value Index Fund | 14,557,841 | 2,123,779 | 1,521,346 | -- | 87,441 | 3,019,789 | 18,267,504 |
| Fidelity Series Long-Term Treasury Bond Index Fund | 64,449,359 | 12,351,559 | 10,554,489 | 1,628,671 | 1,454,262 | (3,345,156) | 64,355,535 |
| Fidelity Series Opportunistic Insights Fund | 81,798,486 | 6,862,429 | 23,505,378 | -- | 8,771,896 | 25,313,382 | 99,240,815 |
| Fidelity Series Overseas Fund | 116,949,455 | 3,727,297 | 27,702,594 | -- | (1,643,828) | 34,563,210 | 125,893,540 |
| Fidelity Series Real Estate Income Fund | 10,167,652 | 528,741 | 847,378 | 379,721 | (70,303) | 1,946,721 | 11,725,433 |
| Fidelity Series Short-Term Credit Fund | 28,820,302 | 423,357 | 129,650 | 328,432 | (1,823) | 1,081,933 | 30,194,119 |
| Fidelity Series Small Cap Opportunities Fund | 46,096,898 | 6,518,214 | 5,094,236 | 367,546 | 4,368 | 12,014,280 | 59,539,524 |
| Fidelity Series Stock Selector Large Cap Value Fund | 88,686,437 | 7,395,331 | 8,861,964 | -- | 367,731 | 19,902,785 | 107,490,320 |
| Fidelity Series Value Discovery Fund | 89,619,864 | 6,705,583 | 8,874,659 | -- | 676,782 | 21,798,113 | 109,925,683 |
| | $2,474,215,101 | $328,048,562 | $458,018,327 | $18,622,378 | $34,357,982 | $442,173,970 | $2,820,777,288 |
Amounts in the income column in the above table include any capital gain distributions from underlying funds, which are presented in the corresponding line-item in the Statement of Operations, if applicable.
Investment Valuation
The following is a summary of the inputs used, as of September 30, 2020, involving the Fund's assets and liabilities carried at fair value. The inputs or methodology used for valuing securities may not be an indication of the risk associated with investing in those securities. For more information on valuation inputs, and their aggregation into the levels used below, please refer to the Investment Valuation section in the accompanying Notes to Financial Statements.
| | Valuation Inputs at Reporting Date: |
| Description | Total | Level 1 | Level 2 | Level 3 |
| Investments in Securities: | | | | |
| Other Short-Term Investments and Net Other Assets | $3,659,352 | $-- | $3,659,352 | $-- |
| Domestic Equity Funds | 909,309,787 | 909,309,787 | -- | -- |
| International Equity Funds | 787,921,101 | 787,921,101 | -- | -- |
| Bond Funds | 951,057,696 | 951,057,696 | -- | -- |
| Short-Term Funds | 175,024,299 | 175,024,299 | -- | -- |
| Total Investments in Securities: | $2,826,972,235 | $2,823,312,883 | $3,659,352 | $-- |
| Derivative Instruments: | | | | |
| Liabilities | | | | |
| Futures Contracts | $(54,349) | $(54,349) | $-- | $-- |
| Total Liabilities | $(54,349) | $(54,349) | $-- | $-- |
| Total Derivative Instruments: | $(54,349) | $(54,349) | $-- | $-- |
Value of Derivative Instruments
The following table is a summary of the Fund's value of derivative instruments by primary risk exposure as of September 30, 2020. For additional information on derivative instruments, please refer to the Derivative Instruments section in the accompanying Notes to Financial Statements.
| Primary Risk Exposure / Derivative Type | Value |
| | Asset | Liability |
| Equity Risk | | |
| Futures Contracts(a) | $0 | $(54,349) |
| Total Equity Risk | 0 | (54,349) |
| Total Value of Derivatives | $0 | $(54,349) |
(a) Reflects gross cumulative appreciation (depreciation) on futures contracts as presented in the Schedule of Investments. In the Statement of Assets and Liabilities, the period end daily variation margin is included in receivable or payable for daily variation margin on futures contracts, and the net cumulative appreciation (depreciation) is included in Total accumulated earnings (loss).
See accompanying notes which are an integral part of the financial statements.
Fidelity Advisor Freedom® 2025 Fund
Financial Statements
Statement of Assets and Liabilities
| | | September 30, 2020 (Unaudited) |
| Assets | | |
Investment in securities, at value — See accompanying schedule:
Unaffiliated issuers (cost $3,659,322) | $3,659,352 | |
| Fidelity Central Funds (cost $2,535,595) | 2,535,595 | |
| Other affiliated issuers (cost $2,386,687,273) | 2,820,777,288 | |
| Total Investment in Securities (cost $2,392,882,190) | | $2,826,972,235 |
| Receivable for investments sold | | 47,495,280 |
| Receivable for fund shares sold | | 1,396,630 |
| Distributions receivable from Fidelity Central Funds | | 212 |
| Total assets | | 2,875,864,357 |
| Liabilities | | |
| Payable for investments purchased | $43,883,469 | |
| Payable for fund shares redeemed | 3,585,764 | |
| Accrued management fee | 1,488,819 | |
| Distribution and service plan fees payable | 465,754 | |
| Payable for daily variation margin on futures contracts | 144,223 | |
| Total liabilities | | 49,568,029 |
| Net Assets | | $2,826,296,328 |
| Net Assets consist of: | | |
| Paid in capital | | $2,364,299,740 |
| Total accumulated earnings (loss) | | 461,996,588 |
| Net Assets | | $2,826,296,328 |
| Net Asset Value and Maximum Offering Price | | |
| Class A: | | |
| Net Asset Value and redemption price per share ($1,185,457,649 ÷ 89,057,779 shares)(a) | | $13.31 |
| Maximum offering price per share (100/94.25 of $13.31) | | $14.12 |
| Class M: | | |
| Net Asset Value and redemption price per share ($402,392,198 ÷ 30,202,418 shares)(a) | | $13.32 |
| Maximum offering price per share (100/96.50 of $13.32) | | $13.80 |
| Class C: | | |
| Net Asset Value and offering price per share ($57,125,402 ÷ 4,382,822 shares)(a) | | $13.03 |
| Class I: | | |
| Net Asset Value, offering price and redemption price per share ($1,031,916,339 ÷ 76,714,228 shares) | | $13.45 |
| Class Z: | | |
| Net Asset Value, offering price and redemption price per share ($45,393,379 ÷ 3,399,116 shares) | | $13.35 |
| Class Z6: | | |
| Net Asset Value, offering price and redemption price per share ($104,011,361 ÷ 7,757,034 shares) | | $13.41 |
(a) Redemption price per share is equal to net asset value less any applicable contingent deferred sales charge.
See accompanying notes which are an integral part of the financial statements.
Statement of Operations
| | | Six months ended September 30, 2020 (Unaudited) |
| Investment Income | | |
| Dividends: | | |
| Affiliated issuers | | $13,781,874 |
| Interest | | 3,175 |
| Income from Fidelity Central Funds | | 3,269 |
| Total income | | 13,788,318 |
| Expenses | | |
| Management fee | $8,659,546 | |
| Distribution and service plan fees | 2,719,970 | |
| Independent trustees' fees and expenses | 3,786 | |
| Total expenses before reductions | 11,383,302 | |
| Expense reductions | (139) | |
| Total expenses after reductions | | 11,383,163 |
| Net investment income (loss) | | 2,405,155 |
| Realized and Unrealized Gain (Loss) | | |
| Net realized gain (loss) on: | | |
| Investment securities: | | |
| Unaffiliated issuers | 5 | |
| Fidelity Central Funds | (521) | |
| Other affiliated issuers | 34,357,982 | |
| Futures contracts | (2,584,048) | |
| Capital gain distributions from underlying funds: | | |
| Affiliated issuers | 4,840,504 | |
| Total net realized gain (loss) | | 36,613,922 |
| Change in net unrealized appreciation (depreciation) on: | | |
| Investment securities: | | |
| Unaffiliated issuers | (1,478) | |
| Fidelity Central Funds | (187) | |
| Other affiliated issuers | 442,173,970 | |
| Futures contracts | (54,349) | |
| Total change in net unrealized appreciation (depreciation) | | 442,117,956 |
| Net gain (loss) | | 478,731,878 |
| Net increase (decrease) in net assets resulting from operations | | $481,137,033 |
See accompanying notes which are an integral part of the financial statements.
Statement of Changes in Net Assets
| | Six months ended September 30, 2020 (Unaudited) | Year ended March 31, 2020 |
| Increase (Decrease) in Net Assets | | |
| Operations | | |
| Net investment income (loss) | $2,405,155 | $42,568,074 |
| Net realized gain (loss) | 36,613,922 | 137,576,481 |
| Change in net unrealized appreciation (depreciation) | 442,117,956 | (306,768,217) |
| Net increase (decrease) in net assets resulting from operations | 481,137,033 | (126,623,662) |
| Distributions to shareholders | (93,712,140) | (191,668,113) |
| Share transactions - net increase (decrease) | (43,538,472) | (102,512,436) |
| Total increase (decrease) in net assets | 343,886,421 | (420,804,211) |
| Net Assets | | |
| Beginning of period | 2,482,409,907 | 2,903,214,118 |
| End of period | $2,826,296,328 | $2,482,409,907 |
See accompanying notes which are an integral part of the financial statements.
Financial Highlights
Fidelity Advisor Freedom 2025 Fund Class A
| | Six months ended (Unaudited) September 30, | Years endedMarch 31, | | | | |
| | 2020 | 2020 | 2019 | 2018 | 2017 | 2016 |
| Selected Per–Share Data | | | | | | |
| Net asset value, beginning of period | $11.55 | $12.99 | $13.74 | $13.16 | $12.29 | $13.25 |
| Income from Investment Operations | | | | | | |
| Net investment income (loss)A | .01 | .18 | .21 | .15 | .18 | .19 |
| Net realized and unrealized gain (loss) | 2.19 | (.76) | .18 | 1.15 | 1.24 | (.54) |
| Total from investment operations | 2.20 | (.58) | .39 | 1.30 | 1.42 | (.35) |
| Distributions from net investment income | – | (.19) | (.21) | (.17) | (.18) | (.20) |
| Distributions from net realized gain | (.44) | (.67) | (.93) | (.55) | (.37) | (.42) |
| Total distributions | (.44) | (.86) | (1.14) | (.72) | (.55) | (.61)B |
| Net asset value, end of period | $13.31 | $11.55 | $12.99 | $13.74 | $13.16 | $12.29 |
| Total ReturnC,D,E | 19.44% | (5.09)% | 3.34% | 9.96% | 12.00% | (2.72)% |
| Ratios to Average Net AssetsF,G | | | | | | |
| Expenses before reductions | .88%H,I | .89% | .90% | .80% | .25% | .25% |
| Expenses net of fee waivers, if any | .88%H,I | .89% | .90% | .80% | .25% | .25% |
| Expenses net of all reductions | .88%H,I | .89% | .90% | .80% | .25% | .25% |
| Net investment income (loss) | .11%H | 1.40% | 1.62% | 1.11% | 1.43% | 1.53% |
| Supplemental Data | | | | | | |
| Net assets, end of period (000 omitted) | $1,185,458 | $1,043,442 | $1,304,020 | $1,435,987 | $1,503,384 | $1,543,665 |
| Portfolio turnover rateG | 24%H | 29% | 24% | 23% | 20% | 24% |
A Calculated based on average shares outstanding during the period.
B Total distributions per share do not sum due to rounding.
C Total returns for periods of less than one year are not annualized.
D Total returns would have been lower if certain expenses had not been reduced during the applicable periods shown.
E Total returns do not include the effect of the sales charges.
F Expense ratios reflect operating expenses of the class. Expenses before reductions do not reflect amounts reimbursed, waived, or reduced through arrangements with the investment adviser, brokerage services, or other offset arrangements, if applicable, and do not represent the amount paid by the class during periods when reimbursements, waivers or reductions occur.
G Amount does not include the portfolio activity of any underlying mutual funds or exchange-traded funds (ETFs).
H Annualized
I On certain classes, the size and fluctuation of net assets and expense amounts may cause ratios to differ from contractual rates.
See accompanying notes which are an integral part of the financial statements.
Fidelity Advisor Freedom 2025 Fund Class M
| | Six months ended (Unaudited) September 30, | Years endedMarch 31, | | | | |
| | 2020 | 2020 | 2019 | 2018 | 2017 | 2016 |
| Selected Per–Share Data | | | | | | |
| Net asset value, beginning of period | $11.57 | $13.01 | $13.76 | $13.18 | $12.31 | $13.27 |
| Income from Investment Operations | | | | | | |
| Net investment income (loss)A | (.01) | .15 | .18 | .12 | .15 | .16 |
| Net realized and unrealized gain (loss) | 2.19 | (.76) | .18 | 1.15 | 1.24 | (.54) |
| Total from investment operations | 2.18 | (.61) | .36 | 1.27 | 1.39 | (.38) |
| Distributions from net investment income | – | (.16) | (.19) | (.14) | (.15) | (.16) |
| Distributions from net realized gain | (.43) | (.67) | (.92) | (.55) | (.37) | (.42) |
| Total distributions | (.43) | (.83) | (1.11) | (.69) | (.52) | (.58) |
| Net asset value, end of period | $13.32 | $11.57 | $13.01 | $13.76 | $13.18 | $12.31 |
| Total ReturnB,C,D | 19.27% | (5.31)% | 3.09% | 9.69% | 11.70% | (2.95)% |
| Ratios to Average Net AssetsE,F | | | | | | |
| Expenses before reductions | 1.13%G,H | 1.14% | 1.15% | 1.05% | .50% | .50% |
| Expenses net of fee waivers, if any | 1.13%G,H | 1.14% | 1.15% | 1.05% | .50% | .50% |
| Expenses net of all reductions | 1.13%G,H | 1.14% | 1.15% | 1.05% | .50% | .50% |
| Net investment income (loss) | (.14)%G | 1.15% | 1.37% | .86% | 1.18% | 1.28% |
| Supplemental Data | | | | | | |
| Net assets, end of period (000 omitted) | $402,392 | $362,131 | $423,584 | $432,227 | $418,713 | $399,088 |
| Portfolio turnover rateF | 24%G | 29% | 24% | 23% | 20% | 24% |
A Calculated based on average shares outstanding during the period.
B Total returns for periods of less than one year are not annualized.
C Total returns would have been lower if certain expenses had not been reduced during the applicable periods shown.
D Total returns do not include the effect of the sales charges.
E Expense ratios reflect operating expenses of the class. Expenses before reductions do not reflect amounts reimbursed, waived, or reduced through arrangements with the investment adviser, brokerage services, or other offset arrangements, if applicable, and do not represent the amount paid by the class during periods when reimbursements, waivers or reductions occur.
F Amount does not include the portfolio activity of any underlying mutual funds or exchange-traded funds (ETFs).
G Annualized
H On certain classes, the size and fluctuation of net assets and expense amounts may cause ratios to differ from contractual rates.
See accompanying notes which are an integral part of the financial statements.
Fidelity Advisor Freedom 2025 Fund Class C
| | Six months ended (Unaudited) September 30, | Years endedMarch 31, | | | | |
| | 2020 | 2020 | 2019 | 2018 | 2017 | 2016 |
| Selected Per–Share Data | | | | | | |
| Net asset value, beginning of period | $11.35 | $12.80 | $13.54 | $12.98 | $12.14 | $13.09 |
| Income from Investment Operations | | | | | | |
| Net investment income (loss)A | (.04) | .08 | .11 | .05 | .08 | .10 |
| Net realized and unrealized gain (loss) | 2.15 | (.75) | .18 | 1.13 | 1.23 | (.53) |
| Total from investment operations | 2.11 | (.67) | .29 | 1.18 | 1.31 | (.43) |
| Distributions from net investment income | – | (.11) | (.13) | (.08) | (.10) | (.11) |
| Distributions from net realized gain | (.43) | (.66) | (.91) | (.54) | (.37) | (.41) |
| Total distributions | (.43) | (.78)B | (1.03)B | (.62) | (.47) | (.52) |
| Net asset value, end of period | $13.03 | $11.35 | $12.80 | $13.54 | $12.98 | $12.14 |
| Total ReturnC,D,E | 19.02% | (5.85)% | 2.59% | 9.14% | 11.13% | (3.40)% |
| Ratios to Average Net AssetsF,G | | | | | | |
| Expenses before reductions | 1.63%H,I | 1.64% | 1.65% | 1.55% | 1.00% | 1.00% |
| Expenses net of fee waivers, if any | 1.63%H,I | 1.64% | 1.65% | 1.55% | 1.00% | 1.00% |
| Expenses net of all reductions | 1.63%H,I | 1.64% | 1.65% | 1.55% | 1.00% | 1.00% |
| Net investment income (loss) | (.64)%H | .65% | .87% | .36% | .68% | .78% |
| Supplemental Data | | | | | | |
| Net assets, end of period (000 omitted) | $57,125 | $51,559 | $64,691 | $97,691 | $97,994 | $91,941 |
| Portfolio turnover rateG | 24%H | 29% | 24% | 23% | 20% | 24% |
A Calculated based on average shares outstanding during the period.
B Total distributions per share do not sum due to rounding.
C Total returns for periods of less than one year are not annualized.
D Total returns would have been lower if certain expenses had not been reduced during the applicable periods shown.
E Total returns do not include the effect of the contingent deferred sales charge.
F Expense ratios reflect operating expenses of the class. Expenses before reductions do not reflect amounts reimbursed, waived, or reduced through arrangements with the investment adviser, brokerage services, or other offset arrangements, if applicable, and do not represent the amount paid by the class during periods when reimbursements, waivers or reductions occur.
G Amount does not include the portfolio activity of any underlying mutual funds or exchange-traded funds (ETFs).
H Annualized
I On certain classes, the size and fluctuation of net assets and expense amounts may cause ratios to differ from contractual rates.
See accompanying notes which are an integral part of the financial statements.
Fidelity Advisor Freedom 2025 Fund Class I
| | Six months ended (Unaudited) September 30, | Years endedMarch 31, | | | | |
| | 2020 | 2020 | 2019 | 2018 | 2017 | 2016 |
| Selected Per–Share Data | | | | | | |
| Net asset value, beginning of period | $11.66 | $13.11 | $13.86 | $13.27 | $12.39 | $13.35 |
| Income from Investment Operations | | | | | | |
| Net investment income (loss)A | .02 | .22 | .25 | .19 | .21 | .23 |
| Net realized and unrealized gain (loss) | 2.22 | (.77) | .18 | 1.16 | 1.26 | (.54) |
| Total from investment operations | 2.24 | (.55) | .43 | 1.35 | 1.47 | (.31) |
| Distributions from net investment income | (.01) | (.22) | (.25) | (.21) | (.21) | (.23) |
| Distributions from net realized gain | (.44) | (.67) | (.93) | (.55) | (.37) | (.42) |
| Total distributions | (.45) | (.90)B | (1.18) | (.76) | (.59)B | (.65) |
| Net asset value, end of period | $13.45 | $11.66 | $13.11 | $13.86 | $13.27 | $12.39 |
| Total ReturnC,D | 19.61% | (4.89)% | 3.63% | 10.26% | 12.26% | (2.44)% |
| Ratios to Average Net AssetsE,F | | | | | | |
| Expenses before reductions | .63%G,H | .64% | .65% | .56% | - %I | - %I |
| Expenses net of fee waivers, if any | .63%G,H | .64% | .65% | .56% | -% | -% |
| Expenses net of all reductions | .63%G,H | .64% | .65% | .56% | -% | -% |
| Net investment income (loss) | .36%G | 1.65% | 1.87% | 1.35% | 1.68% | 1.78% |
| Supplemental Data | | | | | | |
| Net assets, end of period (000 omitted) | $1,031,916 | $911,020 | $1,051,420 | $1,018,536 | $879,740 | $870,772 |
| Portfolio turnover rateF | 24%G | 29% | 24% | 23% | 20% | 24% |
A Calculated based on average shares outstanding during the period.
B Total distributions per share do not sum due to rounding.
C Total returns for periods of less than one year are not annualized.
D Total returns would have been lower if certain expenses had not been reduced during the applicable periods shown.
E Expense ratios reflect operating expenses of the class. Expenses before reductions do not reflect amounts reimbursed, waived, or reduced through arrangements with the investment adviser, brokerage services, or other offset arrangements, if applicable, and do not represent the amount paid by the class during periods when reimbursements, waivers or reductions occur.
F Amount does not include the portfolio activity of any underlying mutual funds or exchange-traded funds (ETFs).
G Annualized
H On certain classes, the size and fluctuation of net assets and expense amounts may cause ratios to differ from contractual rates.
I Amount represents less than .005%.
See accompanying notes which are an integral part of the financial statements.
Fidelity Advisor Freedom 2025 Fund Class Z
| | Six months ended (Unaudited) September 30, | Years endedMarch 31, | |
| | 2020 | 2020 | 2019 A |
| Selected Per–Share Data | | | |
| Net asset value, beginning of period | $11.58 | $13.05 | $13.78 |
| Income from Investment Operations | | | |
| Net investment income (loss)B | .03 | .23 | .03 |
| Net realized and unrealized gain (loss) | 2.19 | (.76) | (.02)C |
| Total from investment operations | 2.22 | (.53) | .01 |
| Distributions from net investment income | (.01) | (.27) | (.30) |
| Distributions from net realized gain | (.44) | (.67) | (.44) |
| Total distributions | (.45) | (.94) | (.74) |
| Net asset value, end of period | $13.35 | $11.58 | $13.05 |
| Total ReturnD,E | 19.61% | (4.77)% | .56% |
| Ratios to Average Net AssetsF,G | | | |
| Expenses before reductions | .55%H | .56% | .56%H |
| Expenses net of fee waivers, if any | .55%H | .56% | .56%H |
| Expenses net of all reductions | .55%H | .56% | .56%H |
| Net investment income (loss) | .45%H | 1.74% | .43%H |
| Supplemental Data | | | |
| Net assets, end of period (000 omitted) | $45,393 | $36,620 | $3,396 |
| Portfolio turnover rateG | 24%H | 29% | 24% |
A For the period October 2, 2018 (commencement of sale of shares) to March 31, 2019.
B Calculated based on average shares outstanding during the period.
C The amount shown for a share outstanding does not correspond with the aggregate net gain (loss) on investments for the period due to the timing of sales and repurchases of shares in relation to fluctuating market values of the investments of the Fund.
D Total returns for periods of less than one year are not annualized.
E Total returns would have been lower if certain expenses had not been reduced during the applicable periods shown.
F Expense ratios reflect operating expenses of the class. Expenses before reductions do not reflect amounts reimbursed, waived, or reduced through arrangements with the investment adviser, brokerage services, or other offset arrangements, if applicable, and do not represent the amount paid by the class during periods when reimbursements, waivers or reductions occur.
G Amount does not include the portfolio activity of any underlying mutual funds or exchange-traded funds (ETFs).
H Annualized
See accompanying notes which are an integral part of the financial statements.
Fidelity Advisor Freedom 2025 Fund Class Z6
| | Six months ended (Unaudited) September 30, | Years endedMarch 31, | | |
| | 2020 | 2020 | 2019 | 2018 A |
| Selected Per–Share Data | | | | |
| Net asset value, beginning of period | $11.62 | $13.08 | $13.85 | $13.53 |
| Income from Investment Operations | | | | |
| Net investment income (loss)B | .04 | .24 | .27 | .10 |
| Net realized and unrealized gain (loss) | 2.20 | (.77) | .18 | .80 |
| Total from investment operations | 2.24 | (.53) | .45 | .90 |
| Distributions from net investment income | (.01) | (.26) | (.29) | (.22) |
| Distributions from net realized gain | (.44) | (.67) | (.93) | (.36) |
| Total distributions | (.45) | (.93) | (1.22) | (.58) |
| Net asset value, end of period | $13.41 | $11.62 | $13.08 | $13.85 |
| Total ReturnC,D | 19.75% | (4.72)% | 3.85% | 6.61% |
| Ratios to Average Net AssetsE,F | | | | |
| Expenses before reductions | .44%G | .45% | .45% | .47%G,H |
| Expenses net of fee waivers, if any | .44%G | .45% | .45% | .47%G,H |
| Expenses net of all reductions | .44%G | .45% | .45% | .47%G,H |
| Net investment income (loss) | .55%G | 1.85% | 2.07% | .89%G |
| Supplemental Data | | | | |
| Net assets, end of period (000 omitted) | $104,011 | $77,638 | $56,103 | $24,926 |
| Portfolio turnover rateF | 24%G | 29% | 24% | 23% |
A For the period June 6, 2017 (commencement of sale of shares) to March 31, 2018.
B Calculated based on average shares outstanding during the period.
C Total returns for periods of less than one year are not annualized.
D Total returns would have been lower if certain expenses had not been reduced during the applicable periods shown.
E Expense ratios reflect operating expenses of the class. Expenses before reductions do not reflect amounts reimbursed, waived, or reduced through arrangements with the investment adviser, brokerage services, or other offset arrangements, if applicable, and do not represent the amount paid by the class during periods when reimbursements, waivers or reductions occur.
F Amount does not include the portfolio activity of any underlying mutual funds or exchange-traded funds (ETFs).
G Annualized
H On certain classes, the size and fluctuation of net assets and expense amounts may cause ratios to differ from contractual rates.
See accompanying notes which are an integral part of the financial statements.
Fidelity Advisor Freedom® 2030 Fund
Investment Summary (Unaudited)
The information in the following tables is based on the direct investments of the Fund.
Top Holdings as of September 30, 2020
| | % of fund's net assets |
| Fidelity Series Investment Grade Bond Fund | 19.9 |
| Fidelity Series Emerging Markets Opportunities Fund | 11.4 |
| Fidelity Series Large Cap Stock Fund | 7.0 |
| Fidelity Series Inflation-Protected Bond Index Fund | 5.5 |
| Fidelity Series International Growth Fund | 5.1 |
| Fidelity Series Overseas Fund | 5.1 |
| Fidelity Series International Value Fund | 5.0 |
| Fidelity Series Value Discovery Fund | 4.5 |
| Fidelity Series Stock Selector Large Cap Value Fund | 4.4 |
| Fidelity Advisor Series Equity Growth Fund | 4.4 |
| | 72.3 |
Asset Allocation (% of fund's net assets)
| Period end |
| | Domestic Equity Funds | 37.2% |
| | International Equity Funds | 31.2% |
| | Bond Funds | 29.5% |
| | Short-Term Funds | 2.0% |
| | Short-Term Investments | 0.1% |

Domestic Equity Funds category includes Fidelity Series Commodity Strategy Fund which invests in commodity-related investments.
Fidelity Advisor Freedom® 2030 Fund
Schedule of Investments September 30, 2020 (Unaudited)
Showing Percentage of Net Assets
| U.S. Treasury Obligations - 0.1% | | | |
| | | Principal Amount | Value |
| U.S. Treasury Bills, yield at date of purchase 0.1% to 0.11% 12/3/20 to 12/10/20 (a) | | | |
| (Cost $4,039,240) | | 4,040,000 | 4,039,277 |
| | | Shares | Value |
|
| Domestic Equity Funds - 37.2% | | | |
| Fidelity Advisor Series Equity Growth Fund (b) | | 7,401,916 | $134,640,854 |
| Fidelity Advisor Series Growth Opportunities Fund (b) | | 5,048,505 | 92,842,003 |
| Fidelity Advisor Series Small Cap Fund (b) | | 5,475,776 | 60,945,389 |
| Fidelity Series All-Sector Equity Fund (b) | | 5,444,258 | 57,981,352 |
| Fidelity Series Commodity Strategy Fund (b) | | 18,406,317 | 76,570,277 |
| Fidelity Series Large Cap Stock Fund (b) | | 15,041,466 | 212,987,157 |
| Fidelity Series Large Cap Value Index Fund (b) | | 1,984,391 | 23,018,940 |
| Fidelity Series Opportunistic Insights Fund (b) | | 5,781,158 | 125,046,439 |
| Fidelity Series Small Cap Opportunities Fund (b) | | 5,879,609 | 75,023,814 |
| Fidelity Series Stock Selector Large Cap Value Fund (b) | | 12,313,287 | 135,446,156 |
| Fidelity Series Value Discovery Fund (b) | | 11,206,761 | 138,515,563 |
| TOTAL DOMESTIC EQUITY FUNDS | | | |
| (Cost $894,621,843) | | | 1,133,017,944 |
|
| International Equity Funds - 31.2% | | | |
| Fidelity Series Canada Fund (b) | | 5,120,270 | 52,380,367 |
| Fidelity Series Emerging Markets Fund (b) | | 4,084,294 | 38,514,889 |
| Fidelity Series Emerging Markets Opportunities Fund (b) | | 16,558,783 | 347,403,274 |
| Fidelity Series International Growth Fund (b) | | 8,275,250 | 155,409,191 |
| Fidelity Series International Small Cap Fund (b) | | 2,703,076 | 48,114,762 |
| Fidelity Series International Value Fund (b) | | 17,848,096 | 153,850,583 |
| Fidelity Series Overseas Fund (b) | | 13,880,546 | 155,184,509 |
| TOTAL INTERNATIONAL EQUITY FUNDS | | | |
| (Cost $762,265,391) | | | 950,857,575 |
|
| Bond Funds - 29.5% | | | |
| Fidelity Series Emerging Markets Debt Fund (b) | | 1,987,065 | 18,002,807 |
| Fidelity Series Floating Rate High Income Fund (b) | | 392,780 | 3,476,102 |
| Fidelity Series High Income Fund (b) | | 2,252,657 | 20,544,233 |
| Fidelity Series Inflation-Protected Bond Index Fund (b) | | 15,672,561 | 167,696,405 |
| Fidelity Series International Credit Fund (b) | | 168,935 | 1,758,613 |
| Fidelity Series Investment Grade Bond Fund (b) | | 49,553,436 | 606,534,060 |
| Fidelity Series Long-Term Treasury Bond Index Fund (b) | | 6,680,106 | 69,005,495 |
| Fidelity Series Real Estate Income Fund (b) | | 1,225,708 | 12,232,569 |
| TOTAL BOND FUNDS | | | |
| (Cost $833,281,514) | | | 899,250,284 |
|
| Short-Term Funds - 2.0% | | | |
| Fidelity Cash Central Fund 0.10% (c) | | 3,311,452 | 3,312,114 |
| Fidelity Series Government Money Market Fund 0.16% (b)(d) | | 51,116,807 | 51,116,807 |
| Fidelity Series Short-Term Credit Fund (b) | | 486,893 | 4,990,653 |
| TOTAL SHORT-TERM FUNDS | | | |
| (Cost $59,232,461) | | | 59,419,574 |
| TOTAL INVESTMENT IN SECURITIES - 100.0% | | | |
| (Cost $2,553,440,449) | | | 3,046,584,654 |
| NET OTHER ASSETS (LIABILITIES) - 0.0% | | | (733,186) |
| NET ASSETS - 100% | | | $3,045,851,468 |
| Futures Contracts | | | | | |
| | Number of contracts | Expiration Date | Notional Amount | Value | Unrealized Appreciation/(Depreciation) |
| Purchased | | | | | |
| Equity Index Contracts | | | | | |
| ICE E-mini MSCI EAFE Index Contracts (United States) | 38 | Dec. 2020 | $3,521,080 | $(18,264) | $(18,264) |
| Sold | | | | | |
| Equity Index Contracts | | | | | |
| CME E-mini S&P 500 Index Contracts (United States) | 37 | Dec. 2020 | 6,201,200 | (40,483) | (40,483) |
| TOTAL FUTURES CONTRACTS | | | | | $(58,747) |
The notional amount of futures purchased as a percentage of Net Assets is 0.1%
The notional amount of futures sold as a percentage of Net Assets is 0.2%
Legend
(a) Security or a portion of the security was pledged to cover margin requirements for futures contracts. At period end, the value of securities pledged amounted to $4,039,277.
(b) Affiliated Fund
(c) Affiliated fund that is generally available only to investment companies and other accounts managed by Fidelity Investments. The rate quoted is the annualized seven-day yield of the fund at period end. A complete unaudited listing of the fund's holdings as of its most recent quarter end is available upon request. In addition, each Fidelity Central Fund's financial statements are available on the SEC's website or upon request.
(d) The rate quoted is the annualized seven-day yield of the fund at period end.
Affiliated Central Funds
Information regarding fiscal year to date income earned by the Fund from investments in Fidelity Central Funds is as follows:
| Fund | Income earned |
| Fidelity Cash Central Fund | $3,827 |
| Total | $3,827 |
Amounts in the income column in the above table include any capital gain distributions from underlying funds, which are presented in the corresponding line-item in the Statement of Operations, if applicable.
Affiliated Underlying Funds
Fiscal year to date information regarding the Fund's investments in affiliated Underlying Funds, excluding any Money Market Central Funds, is presented below. Exchanges between classes of the same affiliated Underlying Funds may occur.
| Affiliate | Value, beginning of period | Purchases | Sales Proceeds | Dividend Income | Realized Gain (loss) | Change in Unrealized appreciation (depreciation) | Value, end of period |
| Fidelity Advisor Series Equity Growth Fund | $111,240,654 | $8,513,255 | $36,722,051 | $-- | $11,435,371 | $40,173,625 | $134,640,854 |
| Fidelity Advisor Series Growth Opportunities Fund | 71,520,474 | 4,041,672 | 29,306,340 | -- | 8,711,915 | 37,874,282 | 92,842,003 |
| Fidelity Advisor Series Small Cap Fund | 46,344,617 | 4,359,464 | 5,181,106 | -- | 232,112 | 15,190,302 | 60,945,389 |
| Fidelity Series All-Sector Equity Fund | 48,155,332 | 2,114,105 | 9,354,487 | -- | 332,662 | 16,733,740 | 57,981,352 |
| Fidelity Series Canada Fund | 37,606,265 | 7,422,262 | 2,394,035 | -- | (220,660) | 9,966,535 | 52,380,367 |
| Fidelity Series Commodity Strategy Fund | 87,773,356 | 3,399,856 | 24,315,877 | 324,363 | (11,193,050) | 20,905,992 | 76,570,277 |
| Fidelity Series Emerging Markets Debt Fund | 16,302,221 | 699,390 | 1,036,057 | 477,019 | (20,953) | 2,058,206 | 18,002,807 |
| Fidelity Series Emerging Markets Fund | 23,842,722 | 8,047,890 | 2,720,762 | -- | (377) | 9,345,416 | 38,514,889 |
| Fidelity Series Emerging Markets Opportunities Fund | 226,796,283 | 62,269,091 | 30,156,800 | -- | 1,779,138 | 86,715,562 | 347,403,274 |
| Fidelity Series Floating Rate High Income Fund | 3,265,544 | 132,270 | 250,659 | 78,470 | (20,370) | 349,317 | 3,476,102 |
| Fidelity Series Government Money Market Fund 0.16% | 81,086,548 | 43,656,979 | 73,626,720 | 60,049 | -- | -- | 51,116,807 |
| Fidelity Series High Income Fund | 18,933,845 | 833,619 | 1,253,295 | 564,624 | (52,630) | 2,082,694 | 20,544,233 |
| Fidelity Series Inflation-Protected Bond Index Fund | 137,094,285 | 34,724,618 | 13,171,119 | 122,413 | 105,050 | 8,943,571 | 167,696,405 |
| Fidelity Series International Credit Fund | 1,591,074 | 24,728 | -- | 24,727 | -- | 142,811 | 1,758,613 |
| Fidelity Series International Growth Fund | 166,883,436 | 1,868,126 | 55,954,875 | -- | 19,110,480 | 23,502,024 | 155,409,191 |
| Fidelity Series International Small Cap Fund | 38,534,871 | 549,789 | 3,527,371 | -- | 624,462 | 11,933,011 | 48,114,762 |
| Fidelity Series International Value Fund | 144,449,251 | 6,613,529 | 26,458,333 | -- | (3,481,798) | 32,727,934 | 153,850,583 |
| Fidelity Series Investment Grade Bond Fund | 519,669,402 | 107,631,780 | 52,850,620 | 7,424,328 | (93,530) | 32,177,028 | 606,534,060 |
| Fidelity Series Large Cap Stock Fund | 177,471,890 | 14,755,715 | 11,543,959 | 7,509,221 | (1,440) | 32,304,951 | 212,987,157 |
| Fidelity Series Large Cap Value Index Fund | 18,531,443 | 2,250,409 | 1,706,493 | -- | 83,588 | 3,859,993 | 23,018,940 |
| Fidelity Series Long-Term Treasury Bond Index Fund | 66,315,452 | 13,557,801 | 8,839,292 | 1,713,281 | 1,230,771 | (3,259,237) | 69,005,495 |
| Fidelity Series Opportunistic Insights Fund | 104,031,816 | 8,159,041 | 30,030,873 | -- | 11,081,217 | 31,805,238 | 125,046,439 |
| Fidelity Series Overseas Fund | 141,056,710 | 3,589,033 | 29,434,136 | -- | (1,401,635) | 41,374,537 | 155,184,509 |
| Fidelity Series Real Estate Income Fund | 10,506,176 | 563,214 | 785,501 | 394,541 | (51,163) | 1,999,843 | 12,232,569 |
| Fidelity Series Short-Term Credit Fund | 4,719,175 | 130,841 | 37,886 | 54,273 | 85 | 178,438 | 4,990,653 |
| Fidelity Series Small Cap Opportunities Fund | 58,673,187 | 6,634,608 | 5,416,627 | 459,699 | (5,156) | 15,137,802 | 75,023,814 |
| Fidelity Series Stock Selector Large Cap Value Fund | 109,453,601 | 10,684,059 | 9,992,418 | -- | 19,320 | 25,281,594 | 135,446,156 |
| Fidelity Series Value Discovery Fund | 113,582,046 | 6,769,112 | 9,961,189 | -- | 187,442 | 27,938,152 | 138,515,563 |
| | $2,585,431,676 | $363,996,256 | $476,028,881 | $19,207,008 | $38,390,851 | $527,443,361 | $3,039,233,263 |
Amounts in the income column in the above table include any capital gain distributions from underlying funds, which are presented in the corresponding line-item in the Statement of Operations, if applicable.
Investment Valuation
The following is a summary of the inputs used, as of September 30, 2020, involving the Fund's assets and liabilities carried at fair value. The inputs or methodology used for valuing securities may not be an indication of the risk associated with investing in those securities. For more information on valuation inputs, and their aggregation into the levels used below, please refer to the Investment Valuation section in the accompanying Notes to Financial Statements.
| | Valuation Inputs at Reporting Date: |
| Description | Total | Level 1 | Level 2 | Level 3 |
| Investments in Securities: | | | | |
| Other Short-Term Investments and Net Other Assets | $4,039,277 | $-- | $4,039,277 | $-- |
| Domestic Equity Funds | 1,133,017,944 | 1,133,017,944 | -- | -- |
| International Equity Funds | 950,857,575 | 950,857,575 | -- | -- |
| Bond Funds | 899,250,284 | 899,250,284 | -- | -- |
| Short-Term Funds | 59,419,574 | 59,419,574 | -- | -- |
| Total Investments in Securities: | $3,046,584,654 | $3,042,545,377 | $4,039,277 | $-- |
| Derivative Instruments: | | | | |
| Liabilities | | | | |
| Futures Contracts | $(58,747) | $(58,747) | $-- | $-- |
| Total Liabilities | $(58,747) | $(58,747) | $-- | $-- |
| Total Derivative Instruments: | $(58,747) | $(58,747) | $-- | $-- |
Value of Derivative Instruments
The following table is a summary of the Fund's value of derivative instruments by primary risk exposure as of September 30, 2020. For additional information on derivative instruments, please refer to the Derivative Instruments section in the accompanying Notes to Financial Statements.
| Primary Risk Exposure / Derivative Type | Value |
| | Asset | Liability |
| Equity Risk | | |
| Futures Contracts(a) | $0 | $(58,747) |
| Total Equity Risk | 0 | (58,747) |
| Total Value of Derivatives | $0 | $(58,747) |
(a) Reflects gross cumulative appreciation (depreciation) on futures contracts as presented in the Schedule of Investments. In the Statement of Assets and Liabilities, the period end daily variation margin is included in receivable or payable for daily variation margin on futures contracts, and the net cumulative appreciation (depreciation) is included in Total accumulated earnings (loss).
See accompanying notes which are an integral part of the financial statements.
Fidelity Advisor Freedom® 2030 Fund
Financial Statements
Statement of Assets and Liabilities
| | | September 30, 2020 (Unaudited) |
| Assets | | |
Investment in securities, at value — See accompanying schedule:
Unaffiliated issuers (cost $4,039,240) | $4,039,277 | |
| Fidelity Central Funds (cost $3,312,061) | 3,312,114 | |
| Other affiliated issuers (cost $2,546,089,148) | 3,039,233,263 | |
| Total Investment in Securities (cost $2,553,440,449) | | $3,046,584,654 |
| Receivable for investments sold | | 50,082,725 |
| Receivable for fund shares sold | | 1,549,852 |
| Distributions receivable from Fidelity Central Funds | | 281 |
| Total assets | | 3,098,217,512 |
| Liabilities | | |
| Payable for investments purchased | $45,956,719 | |
| Payable for fund shares redeemed | 4,048,211 | |
| Accrued management fee | 1,709,088 | |
| Distribution and service plan fees payable | 497,409 | |
| Payable for daily variation margin on futures contracts | 154,617 | |
| Total liabilities | | 52,366,044 |
| Net Assets | | $3,045,851,468 |
| Net Assets consist of: | | |
| Paid in capital | | $2,522,571,091 |
| Total accumulated earnings (loss) | | 523,280,377 |
| Net Assets | | $3,045,851,468 |
| Net Asset Value and Maximum Offering Price | | |
| Class A: | | |
| Net Asset Value and redemption price per share ($1,209,516,544 ÷ 84,464,163 shares)(a) | | $14.32 |
| Maximum offering price per share (100/94.25 of $14.32) | | $15.19 |
| Class M: | | |
| Net Asset Value and redemption price per share ($454,443,710 ÷ 31,967,279 shares)(a) | | $14.22 |
| Maximum offering price per share (100/96.50 of $14.22) | | $14.74 |
| Class C: | | |
| Net Asset Value and offering price per share ($64,833,682 ÷ 4,644,673 shares)(a) | | $13.96 |
| Class I: | | |
| Net Asset Value, offering price and redemption price per share ($1,151,301,885 ÷ 79,844,818 shares) | | $14.42 |
| Class Z: | | |
| Net Asset Value, offering price and redemption price per share ($50,219,811 ÷ 3,507,297 shares) | | $14.32 |
| Class Z6: | | |
| Net Asset Value, offering price and redemption price per share ($115,535,836 ÷ 8,038,254 shares) | | $14.37 |
(a) Redemption price per share is equal to net asset value less any applicable contingent deferred sales charge.
See accompanying notes which are an integral part of the financial statements.
Statement of Operations
| | | Six months ended September 30, 2020 (Unaudited) |
| Investment Income | | |
| Dividends: | | |
| Affiliated issuers | | $13,433,860 |
| Interest | | 3,082 |
| Income from Fidelity Central Funds | | 3,827 |
| Total income | | 13,440,769 |
| Expenses | | |
| Management fee | $9,861,812 | |
| Distribution and service plan fees | 2,871,923 | |
| Independent trustees' fees and expenses | 4,012 | |
| Total expenses before reductions | 12,737,747 | |
| Expense reductions | (105) | |
| Total expenses after reductions | | 12,737,642 |
| Net investment income (loss) | | 703,127 |
| Realized and Unrealized Gain (Loss) | | |
| Net realized gain (loss) on: | | |
| Investment securities: | | |
| Unaffiliated issuers | 4 | |
| Fidelity Central Funds | (617) | |
| Other affiliated issuers | 38,390,851 | |
| Futures contracts | (2,531,182) | |
| Capital gain distributions from underlying funds: | | |
| Affiliated issuers | 5,773,148 | |
| Total net realized gain (loss) | | 41,632,204 |
| Change in net unrealized appreciation (depreciation) on: | | |
| Investment securities: | | |
| Unaffiliated issuers | (1,191) | |
| Fidelity Central Funds | (208) | |
| Other affiliated issuers | 527,443,361 | |
| Futures contracts | (58,747) | |
| Total change in net unrealized appreciation (depreciation) | | 527,383,215 |
| Net gain (loss) | | 569,015,419 |
| Net increase (decrease) in net assets resulting from operations | | $569,718,546 |
See accompanying notes which are an integral part of the financial statements.
Statement of Changes in Net Assets
| | Six months ended September 30, 2020 (Unaudited) | Year ended March 31, 2020 |
| Increase (Decrease) in Net Assets | | |
| Operations | | |
| Net investment income (loss) | $703,127 | $42,712,126 |
| Net realized gain (loss) | 41,632,204 | 151,887,327 |
| Change in net unrealized appreciation (depreciation) | 527,383,215 | (372,090,482) |
| Net increase (decrease) in net assets resulting from operations | 569,718,546 | (177,491,029) |
| Distributions to shareholders | (108,598,246) | (210,658,751) |
| Share transactions - net increase (decrease) | (9,969,429) | 10,421,348 |
| Total increase (decrease) in net assets | 451,150,871 | (377,728,432) |
| Net Assets | | |
| Beginning of period | 2,594,700,597 | 2,972,429,029 |
| End of period | $3,045,851,468 | $2,594,700,597 |
See accompanying notes which are an integral part of the financial statements.
Financial Highlights
Fidelity Advisor Freedom 2030 Fund Class A
| | Six months ended (Unaudited) September 30, | Years endedMarch 31, | | | | |
| | 2020 | 2020 | 2019 | 2018 | 2017 | 2016 |
| Selected Per–Share Data | | | | | | |
| Net asset value, beginning of period | $12.21 | $14.01 | $14.95 | $14.12 | $12.99 | $14.13 |
| Income from Investment Operations | | | | | | |
| Net investment income (loss)A | –B | .19 | .23 | .15 | .18 | .19 |
| Net realized and unrealized gain (loss) | 2.62 | (1.01) | .19 | 1.50 | 1.57 | (.64) |
| Total from investment operations | 2.62 | (.82) | .42 | 1.65 | 1.75 | (.45) |
| Distributions from net investment income | – | (.19) | (.24) | (.16) | (.18) | (.19) |
| Distributions from net realized gain | (.51) | (.79) | (1.13) | (.66) | (.44) | (.50) |
| Total distributions | (.51) | (.98) | (1.36)C | (.82) | (.62) | (.69) |
| Net asset value, end of period | $14.32 | $12.21 | $14.01 | $14.95 | $14.12 | $12.99 |
| Total ReturnD,E,F | 21.97% | (6.61)% | 3.43% | 11.80% | 14.02% | (3.36)% |
| Ratios to Average Net AssetsG,H | | | | | | |
| Expenses before reductions | .93%I | .94% | .94%J | .84% | .25% | .25% |
| Expenses net of fee waivers, if any | .93%I | .94% | .94%J | .84% | .25% | .25% |
| Expenses net of all reductions | .93%I | .94% | .94%J | .84% | .25% | .25% |
| Net investment income (loss) | (.02)%I | 1.35% | 1.57% | .99% | 1.34% | 1.39% |
| Supplemental Data | | | | | | |
| Net assets, end of period (000 omitted) | $1,209,517 | $1,041,706 | $1,279,896 | $1,374,112 | $1,414,388 | $1,409,909 |
| Portfolio turnover rateH | 25%I | 33% | 22% | 25% | 18% | 22% |
A Calculated based on average shares outstanding during the period.
B Amount represents less than $.005 per share.
C Total distributions per share do not sum due to rounding.
D Total returns for periods of less than one year are not annualized.
E Total returns would have been lower if certain expenses had not been reduced during the applicable periods shown.
F Total returns do not include the effect of the sales charges.
G Expense ratios reflect operating expenses of the class. Expenses before reductions do not reflect amounts reimbursed, waived, or reduced through arrangements with the investment adviser, brokerage services, or other offset arrangements, if applicable, and do not represent the amount paid by the class during periods when reimbursements, waivers or reductions occur.
H Amount does not include the portfolio activity of any underlying mutual funds or exchange-traded funds (ETFs).
I Annualized
J On certain classes, the size and fluctuation of net assets and expense amounts may cause ratios to differ from contractual rates.
See accompanying notes which are an integral part of the financial statements.
Fidelity Advisor Freedom 2030 Fund Class M
| | Six months ended (Unaudited) September 30, | Years endedMarch 31, | | | | |
| | 2020 | 2020 | 2019 | 2018 | 2017 | 2016 |
| Selected Per–Share Data | | | | | | |
| Net asset value, beginning of period | $12.13 | $13.93 | $14.88 | $14.06 | $12.94 | $14.09 |
| Income from Investment Operations | | | | | | |
| Net investment income (loss)A | (.02) | .15 | .19 | .11 | .15 | .15 |
| Net realized and unrealized gain (loss) | 2.61 | (1.00) | .19 | 1.50 | 1.56 | (.64) |
| Total from investment operations | 2.59 | (.85) | .38 | 1.61 | 1.71 | (.49) |
| Distributions from net investment income | – | (.17) | (.21) | (.13) | (.15) | (.16) |
| Distributions from net realized gain | (.50) | (.78) | (1.12) | (.66) | (.44) | (.50) |
| Total distributions | (.50) | (.95) | (1.33) | (.79) | (.59) | (.66) |
| Net asset value, end of period | $14.22 | $12.13 | $13.93 | $14.88 | $14.06 | $12.94 |
| Total ReturnB,C,D | 21.88% | (6.84)% | 3.12% | 11.53% | 13.74% | (3.67)% |
| Ratios to Average Net AssetsE,F | | | | | | |
| Expenses before reductions | 1.18%G | 1.19% | 1.19%H | 1.09% | .50% | .50% |
| Expenses net of fee waivers, if any | 1.18%G | 1.19% | 1.19%H | 1.09% | .50% | .50% |
| Expenses net of all reductions | 1.18%G | 1.19% | 1.19%H | 1.09% | .50% | .50% |
| Net investment income (loss) | (.27)%G | 1.10% | 1.32% | .74% | 1.09% | 1.14% |
| Supplemental Data | | | | | | |
| Net assets, end of period (000 omitted) | $454,444 | $391,371 | $453,917 | $452,750 | $442,505 | $423,312 |
| Portfolio turnover rateF | 25%G | 33% | 22% | 25% | 18% | 22% |
A Calculated based on average shares outstanding during the period.
B Total returns for periods of less than one year are not annualized.
C Total returns would have been lower if certain expenses had not been reduced during the applicable periods shown.
D Total returns do not include the effect of the sales charges.
E Expense ratios reflect operating expenses of the class. Expenses before reductions do not reflect amounts reimbursed, waived, or reduced through arrangements with the investment adviser, brokerage services, or other offset arrangements, if applicable, and do not represent the amount paid by the class during periods when reimbursements, waivers or reductions occur.
F Amount does not include the portfolio activity of any underlying mutual funds or exchange-traded funds (ETFs).
G Annualized
H On certain classes, the size and fluctuation of net assets and expense amounts may cause ratios to differ from contractual rates.
See accompanying notes which are an integral part of the financial statements.
Fidelity Advisor Freedom 2030 Fund Class C
| | Six months ended (Unaudited) September 30, | Years endedMarch 31, | | | | |
| | 2020 | 2020 | 2019 | 2018 | 2017 | 2016 |
| Selected Per–Share Data | | | | | | |
| Net asset value, beginning of period | $11.95 | $13.75 | $14.71 | $13.92 | $12.83 | $13.97 |
| Income from Investment Operations | | | | | | |
| Net investment income (loss)A | (.05) | .08 | .12 | .03 | .08 | .08 |
| Net realized and unrealized gain (loss) | 2.56 | (.98) | .18 | 1.48 | 1.55 | (.63) |
| Total from investment operations | 2.51 | (.90) | .30 | 1.51 | 1.63 | (.55) |
| Distributions from net investment income | – | (.12) | (.15) | (.07) | (.10) | (.11) |
| Distributions from net realized gain | (.50) | (.78) | (1.11) | (.65) | (.44) | (.48) |
| Total distributions | (.50) | (.90) | (1.26) | (.72) | (.54) | (.59) |
| Net asset value, end of period | $13.96 | $11.95 | $13.75 | $14.71 | $13.92 | $12.83 |
| Total ReturnB,C,D | 21.50% | (7.25)% | 2.57% | 10.97% | 13.21% | (4.10)% |
| Ratios to Average Net AssetsE,F | | | | | | |
| Expenses before reductions | 1.68%G | 1.69% | 1.69%H | 1.59% | 1.00% | 1.00% |
| Expenses net of fee waivers, if any | 1.68%G | 1.69% | 1.69%H | 1.59% | 1.00% | 1.00% |
| Expenses net of all reductions | 1.68%G | 1.69% | 1.69%H | 1.59% | 1.00% | 1.00% |
| Net investment income (loss) | (.77)%G | .60% | .82% | .24% | .59% | .64% |
| Supplemental Data | | | | | | |
| Net assets, end of period (000 omitted) | $64,834 | $55,554 | $66,505 | $96,199 | $94,517 | $87,691 |
| Portfolio turnover rateF | 25%G | 33% | 22% | 25% | 18% | 22% |
A Calculated based on average shares outstanding during the period.
B Total returns for periods of less than one year are not annualized.
C Total returns would have been lower if certain expenses had not been reduced during the applicable periods shown.
D Total returns do not include the effect of the contingent deferred sales charge.
E Expense ratios reflect operating expenses of the class. Expenses before reductions do not reflect amounts reimbursed, waived, or reduced through arrangements with the investment adviser, brokerage services, or other offset arrangements, if applicable, and do not represent the amount paid by the class during periods when reimbursements, waivers or reductions occur.
F Amount does not include the portfolio activity of any underlying mutual funds or exchange-traded funds (ETFs).
G Annualized
H On certain classes, the size and fluctuation of net assets and expense amounts may cause ratios to differ from contractual rates.
See accompanying notes which are an integral part of the financial statements.
Fidelity Advisor Freedom 2030 Fund Class I
| | Six months ended (Unaudited) September 30, | Years endedMarch 31, | | | | |
| | 2020 | 2020 | 2019 | 2018 | 2017 | 2016 |
| Selected Per–Share Data | | | | | | |
| Net asset value, beginning of period | $12.29 | $14.09 | $15.04 | $14.21 | $13.06 | $14.21 |
| Income from Investment Operations | | | | | | |
| Net investment income (loss)A | .02 | .23 | .26 | .18 | .21 | .22 |
| Net realized and unrealized gain (loss) | 2.63 | (1.01) | .19 | 1.51 | 1.59 | (.65) |
| Total from investment operations | 2.65 | (.78) | .45 | 1.69 | 1.80 | (.43) |
| Distributions from net investment income | – | (.22) | (.27) | (.21) | (.21) | (.23) |
| Distributions from net realized gain | (.52) | (.80) | (1.14) | (.66) | (.44) | (.50) |
| Total distributions | (.52) | (1.02) | (1.40)B | (.86)B | (.65) | (.72)B |
| Net asset value, end of period | $14.42 | $12.29 | $14.09 | $15.04 | $14.21 | $13.06 |
| Total ReturnC,D | 22.09% | (6.32)% | 3.65% | 12.04% | 14.38% | (3.16)% |
| Ratios to Average Net AssetsE,F | | | | | | |
| Expenses before reductions | .68%G | .69% | .69%H | .60% | - %I | - %I |
| Expenses net of fee waivers, if any | .68%G | .69% | .69%H | .60% | -% | -% |
| Expenses net of all reductions | .68%G | .69% | .69%H | .60% | -% | -% |
| Net investment income (loss) | .23%G | 1.60% | 1.82% | 1.23% | 1.59% | 1.64% |
| Supplemental Data | | | | | | |
| Net assets, end of period (000 omitted) | $1,151,302 | $984,341 | $1,108,684 | $1,043,420 | $871,845 | $861,408 |
| Portfolio turnover rateF | 25%G | 33% | 22% | 25% | 18% | 22% |
A Calculated based on average shares outstanding during the period.
B Total distributions per share do not sum due to rounding.
C Total returns for periods of less than one year are not annualized.
D Total returns would have been lower if certain expenses had not been reduced during the applicable periods shown.
E Expense ratios reflect operating expenses of the class. Expenses before reductions do not reflect amounts reimbursed, waived, or reduced through arrangements with the investment adviser, brokerage services, or other offset arrangements, if applicable, and do not represent the amount paid by the class during periods when reimbursements, waivers or reductions occur.
F Amount does not include the portfolio activity of any underlying mutual funds or exchange-traded funds (ETFs).
G Annualized
H On certain classes, the size and fluctuation of net assets and expense amounts may cause ratios to differ from contractual rates.
I Amount represents less than .005%.
See accompanying notes which are an integral part of the financial statements.
Fidelity Advisor Freedom 2030 Fund Class Z
| | Six months ended (Unaudited) September 30, | Years endedMarch 31, | |
| | 2020 | 2020 | 2019 A |
| Selected Per–Share Data | | | |
| Net asset value, beginning of period | $12.20 | $14.03 | $14.99 |
| Income from Investment Operations | | | |
| Net investment income (loss)B | .02 | .24 | .04 |
| Net realized and unrealized gain (loss) | 2.62 | (1.01) | (.15)C |
| Total from investment operations | 2.64 | (.77) | (.11) |
| Distributions from net investment income | – | (.25) | (.33) |
| Distributions from net realized gain | (.52) | (.82) | (.53) |
| Total distributions | (.52) | (1.06)D | (.85)D |
| Net asset value, end of period | $14.32 | $12.20 | $14.03 |
| Total ReturnE,F | 22.22% | (6.28)% | (.09)% |
| Ratios to Average Net AssetsG,H | | | |
| Expenses before reductions | .59%I | .60%J | .60%I |
| Expenses net of fee waivers, if any | .59%I | .60%J | .60%I |
| Expenses net of all reductions | .59%I | .60%J | .60%I |
| Net investment income (loss) | .32%I | 1.69% | .65%I |
| Supplemental Data | | | |
| Net assets, end of period (000 omitted) | $50,220 | $38,041 | $2,948 |
| Portfolio turnover rateH | 25%I | 33% | 22% |
A For the period October 2, 2018 (commencement of sale of shares) to March 31, 2019.
B Calculated based on average shares outstanding during the period.
C The amount shown for a share outstanding does not correspond with the aggregate net gain (loss) on investments for the period due to the timing of sales and repurchases of shares in relation to fluctuating market values of the investments of the Fund.
D Total distributions per share do not sum due to rounding.
E Total returns for periods of less than one year are not annualized.
F Total returns would have been lower if certain expenses had not been reduced during the applicable periods shown.
G Expense ratios reflect operating expenses of the class. Expenses before reductions do not reflect amounts reimbursed, waived, or reduced through arrangements with the investment adviser, brokerage services, or other offset arrangements, if applicable, and do not represent the amount paid by the class during periods when reimbursements, waivers or reductions occur.
H Amount does not include the portfolio activity of any underlying mutual funds or exchange-traded funds (ETFs).
I Annualized
J On certain classes, the size and fluctuation of net assets and expense amounts may cause ratios to differ from contractual rates.
See accompanying notes which are an integral part of the financial statements.
Fidelity Advisor Freedom 2030 Fund Class Z6
| | Six months ended (Unaudited) September 30, | Years endedMarch 31, | | |
| | 2020 | 2020 | 2019 | 2018 A |
| Selected Per–Share Data | | | | |
| Net asset value, beginning of period | $12.24 | $14.05 | $15.03 | $14.53 |
| Income from Investment Operations | | | | |
| Net investment income (loss)B | .03 | .26 | .29 | .16 |
| Net realized and unrealized gain (loss) | 2.63 | (1.01) | .19 | .99 |
| Total from investment operations | 2.66 | (.75) | .48 | 1.15 |
| Distributions from net investment income | – | (.25) | (.30) | (.23) |
| Distributions from net realized gain | (.53) | (.81) | (1.15) | (.42) |
| Total distributions | (.53) | (1.06) | (1.46)C | (.65) |
| Net asset value, end of period | $14.37 | $12.24 | $14.05 | $15.03 |
| Total ReturnD,E | 22.26% | (6.16)% | 3.84% | 7.90% |
| Ratios to Average Net AssetsF,G | | | | |
| Expenses before reductions | .46%H | .47% | .47% | .49%H,I |
| Expenses net of fee waivers, if any | .46%H | .47% | .47% | .49%H,I |
| Expenses net of all reductions | .46%H | .47% | .47% | .49%H,I |
| Net investment income (loss) | .45%H | 1.82% | 2.05% | 1.29%H |
| Supplemental Data | | | | |
| Net assets, end of period (000 omitted) | $115,536 | $83,686 | $60,480 | $26,854 |
| Portfolio turnover rateG | 25%H | 33% | 22% | 25% |
A For the period June 6, 2017 (commencement of sale of shares) to March 31, 2018.
B Calculated based on average shares outstanding during the period.
C Total distributions per share do not sum due to rounding.
D Total returns for periods of less than one year are not annualized.
E Total returns would have been lower if certain expenses had not been reduced during the applicable periods shown.
F Expense ratios reflect operating expenses of the class. Expenses before reductions do not reflect amounts reimbursed, waived, or reduced through arrangements with the investment adviser, brokerage services, or other offset arrangements, if applicable, and do not represent the amount paid by the class during periods when reimbursements, waivers or reductions occur.
G Amount does not include the portfolio activity of any underlying mutual funds or exchange-traded funds (ETFs).
H Annualized
I On certain classes, the size and fluctuation of net assets and expense amounts may cause ratios to differ from contractual rates.
See accompanying notes which are an integral part of the financial statements.
Fidelity Advisor Freedom® 2035 Fund
Investment Summary (Unaudited)
The information in the following tables is based on the direct investments of the Fund.
Top Holdings as of September 30, 2020
| | % of fund's net assets |
| Fidelity Series Emerging Markets Opportunities Fund | 13.0 |
| Fidelity Series Investment Grade Bond Fund | 8.9 |
| Fidelity Series Large Cap Stock Fund | 8.8 |
| Fidelity Series International Growth Fund | 6.3 |
| Fidelity Series Overseas Fund | 6.3 |
| Fidelity Series International Value Fund | 6.2 |
| Fidelity Series Value Discovery Fund | 5.7 |
| Fidelity Series Stock Selector Large Cap Value Fund | 5.6 |
| Fidelity Advisor Series Equity Growth Fund | 5.6 |
| Fidelity Series Opportunistic Insights Fund | 5.2 |
| | 71.6 |
Asset Allocation (% of fund's net assets)
| Period end |
| | Domestic Equity Funds | 46.2% |
| | International Equity Funds | 37.2% |
| | Bond Funds | 15.0% |
| | Short-Term Funds | 1.5% |
| | Short-Term Investments | 0.1% |

Domestic Equity Funds category includes Fidelity Series Commodity Strategy Fund which invests in commodity-related investments.
Fidelity Advisor Freedom® 2035 Fund
Schedule of Investments September 30, 2020 (Unaudited)
Showing Percentage of Net Assets
| U.S. Treasury Obligations - 0.1% | | | |
| | | Principal Amount | Value |
| U.S. Treasury Bills, yield at date of purchase 0.11% to 0.11% 12/3/20 to 12/10/20 (a) | | | |
| (Cost $2,489,494) | | 2,490,000 | 2,489,538 |
| | | Shares | Value |
|
| Domestic Equity Funds - 46.2% | | | |
| Fidelity Advisor Series Equity Growth Fund (b) | | 7,699,079 | $140,046,246 |
| Fidelity Advisor Series Growth Opportunities Fund (b) | | 5,251,150 | 96,568,651 |
| Fidelity Advisor Series Small Cap Fund (b) | | 5,694,785 | 63,382,961 |
| Fidelity Series All-Sector Equity Fund (b) | | 5,661,496 | 60,294,937 |
| Fidelity Series Commodity Strategy Fund (b) | | 15,154,173 | 63,041,362 |
| Fidelity Series Large Cap Stock Fund (b) | | 15,642,594 | 221,499,128 |
| Fidelity Series Large Cap Value Index Fund (b) | | 2,063,802 | 23,940,102 |
| Fidelity Series Opportunistic Insights Fund (b) | | 6,012,006 | 130,039,699 |
| Fidelity Series Small Cap Opportunities Fund (b) | | 6,115,128 | 78,029,039 |
| Fidelity Series Stock Selector Large Cap Value Fund (b) | | 12,806,026 | 140,866,284 |
| Fidelity Series Value Discovery Fund (b) | | 11,655,070 | 144,056,671 |
| TOTAL DOMESTIC EQUITY FUNDS | | | |
| (Cost $929,137,568) | | | 1,161,765,080 |
|
| International Equity Funds - 37.2% | | | |
| Fidelity Series Canada Fund (b) | | 5,188,241 | 53,075,711 |
| Fidelity Series Emerging Markets Fund (b) | | 3,839,430 | 36,205,829 |
| Fidelity Series Emerging Markets Opportunities Fund (b) | | 15,579,898 | 326,866,259 |
| Fidelity Series International Growth Fund (b) | | 8,383,911 | 157,449,855 |
| Fidelity Series International Small Cap Fund(b) | | 2,733,282 | 48,652,425 |
| Fidelity Series International Value Fund (b) | | 18,092,243 | 155,955,136 |
| Fidelity Series Overseas Fund (b) | | 14,062,747 | 157,221,516 |
| TOTAL INTERNATIONAL EQUITY FUNDS | | | |
| (Cost $763,249,447) | | | 935,426,731 |
|
| Bond Funds - 15.0% | | | |
| Fidelity Series Emerging Markets Debt Fund (b) | | 1,583,266 | 14,344,393 |
| Fidelity Series Floating Rate High Income Fund (b) | | 304,208 | 2,692,245 |
| Fidelity Series High Income Fund (b) | | 1,862,385 | 16,984,953 |
| Fidelity Series Inflation-Protected Bond Index Fund (b) | | 4,675,170 | 50,024,318 |
| Fidelity Series International Credit Fund (b) | | 133,351 | 1,388,183 |
| Fidelity Series Investment Grade Bond Fund (b) | | 18,293,818 | 223,916,337 |
| Fidelity Series Long-Term Treasury Bond Index Fund (b) | | 5,533,487 | 57,160,925 |
| Fidelity Series Real Estate Income Fund (b) | | 988,279 | 9,863,021 |
| TOTAL BOND FUNDS | | | |
| (Cost $354,154,283) | | | 376,374,375 |
|
| Short-Term Funds - 1.5% | | | |
| Fidelity Cash Central Fund 0.10% (c) | | 4,416,248 | 4,417,131 |
| Fidelity Series Government Money Market Fund 0.16% (b)(d) | | 29,487,927 | 29,487,927 |
| Fidelity Series Short-Term Credit Fund (b) | | 406,170 | 4,163,245 |
| TOTAL SHORT-TERM FUNDS | | | |
| (Cost $37,911,087) | | | 38,068,303 |
| TOTAL INVESTMENT IN SECURITIES - 100.0% | | | |
| (Cost $2,086,941,879) | | | 2,514,124,027 |
| NET OTHER ASSETS (LIABILITIES) - 0.0% | | | (558,188) |
| NET ASSETS - 100% | | | $2,513,565,839 |
| Futures Contracts | | | | | |
| | Number of contracts | Expiration Date | Notional Amount | Value | Unrealized Appreciation/(Depreciation) |
| Purchased | | | | | |
| Equity Index Contracts | | | | | |
| ICE E-mini MSCI EAFE Index Contracts (United States) | 46 | Dec. 2020 | $4,262,360 | $(29,287) | $(29,287) |
| Sold | | | | | |
| Equity Index Contracts | | | | | |
| CME E-mini S&P 500 Index Contracts (United States) | 28 | Dec. 2020 | 4,692,800 | (30,636) | (30,636) |
| TOTAL FUTURES CONTRACTS | | | | | $(59,923) |
The notional amount of futures purchased as a percentage of Net Assets is 0.2%
The notional amount of futures sold as a percentage of Net Assets is 0.2%
Legend
(a) Security or a portion of the security was pledged to cover margin requirements for futures contracts. At period end, the value of securities pledged amounted to $2,489,538.
(b) Affiliated Fund
(c) Affiliated fund that is generally available only to investment companies and other accounts managed by Fidelity Investments. The rate quoted is the annualized seven-day yield of the fund at period end. A complete unaudited listing of the fund's holdings as of its most recent quarter end is available upon request. In addition, each Fidelity Central Fund's financial statements are available on the SEC's website or upon request.
(d) The rate quoted is the annualized seven-day yield of the fund at period end.
Affiliated Central Funds
Information regarding fiscal year to date income earned by the Fund from investments in Fidelity Central Funds is as follows:
| Fund | Income earned |
| Fidelity Cash Central Fund | $3,531 |
| Total | $3,531 |
Amounts in the income column in the above table include any capital gain distributions from underlying funds, which are presented in the corresponding line-item in the Statement of Operations, if applicable.
Affiliated Underlying Funds
Fiscal year to date information regarding the Fund's investments in affiliated Underlying Funds, excluding any Money Market Central Funds, is presented below. Exchanges between classes of the same affiliated Underlying Funds may occur.
| Affiliate | Value, beginning of period | Purchases | Sales Proceeds | Dividend Income | Realized Gain (loss) | Change in Unrealized appreciation (depreciation) | Value, end of period |
| Fidelity Advisor Series Equity Growth Fund | $114,522,055 | $9,517,481 | $36,695,356 | $-- | $9,722,091 | $42,979,975 | $140,046,246 |
| Fidelity Advisor Series Growth Opportunities Fund | 73,638,931 | 5,614,763 | 30,201,400 | -- | 7,686,309 | 39,830,048 | 96,568,651 |
| Fidelity Advisor Series Small Cap Fund | 47,751,941 | 3,599,402 | 3,707,248 | -- | 65,409 | 15,673,457 | 63,382,961 |
| Fidelity Series All-Sector Equity Fund | 49,590,654 | 2,818,040 | 9,492,118 | -- | 82,821 | 17,295,540 | 60,294,937 |
| Fidelity Series Canada Fund | 37,024,368 | 8,975,967 | 2,477,390 | -- | (140,059) | 9,692,825 | 53,075,711 |
| Fidelity Series Commodity Strategy Fund | 68,352,483 | 3,548,432 | 16,864,196 | 269,368 | (6,094,819) | 14,099,462 | 63,041,362 |
| Fidelity Series Emerging Markets Debt Fund | 12,981,935 | 589,107 | 854,415 | 380,950 | (5,430) | 1,633,196 | 14,344,393 |
| Fidelity Series Emerging Markets Fund | 22,484,870 | 7,573,896 | 2,485,345 | -- | 87,308 | 8,545,100 | 36,205,829 |
| Fidelity Series Emerging Markets Opportunities Fund | 211,577,730 | 54,872,268 | 21,638,192 | -- | 1,406,290 | 80,648,163 | 326,866,259 |
| Fidelity Series Floating Rate High Income Fund | 2,531,893 | 111,388 | 206,713 | 61,028 | (15,085) | 270,762 | 2,692,245 |
| Fidelity Series Government Money Market Fund 0.16% | 61,123,470 | 26,912,771 | 58,548,314 | 45,874 | -- | -- | 29,487,927 |
| Fidelity Series High Income Fund | 15,619,822 | 719,224 | 1,033,567 | 467,422 | (4,982) | 1,684,456 | 16,984,953 |
| Fidelity Series Inflation-Protected Bond Index Fund | 43,283,139 | 9,837,360 | 5,838,183 | 37,378 | 34,259 | 2,707,743 | 50,024,318 |
| Fidelity Series International Credit Fund | 1,255,935 | 19,518 | -- | 19,519 | -- | 112,730 | 1,388,183 |
| Fidelity Series International Growth Fund | 159,525,947 | 1,999,255 | 45,908,242 | -- | 14,063,093 | 27,769,802 | 157,449,855 |
| Fidelity Series International Small Cap Fund | 37,872,465 | 819,544 | 2,528,536 | -- | 296,062 | 12,192,890 | 48,652,425 |
| Fidelity Series International Value Fund | 141,256,185 | 5,680,975 | 20,006,574 | -- | (2,653,182) | 31,677,732 | 155,955,136 |
| Fidelity Series Investment Grade Bond Fund | 170,446,727 | 64,686,237 | 21,707,326 | 2,532,561 | (118,644) | 10,609,343 | 223,916,337 |
| Fidelity Series Large Cap Stock Fund | 182,782,284 | 17,566,844 | 12,113,308 | 7,684,830 | (283,581) | 33,546,889 | 221,499,128 |
| Fidelity Series Large Cap Value Index Fund | 19,088,826 | 2,209,550 | 1,423,933 | -- | 39,184 | 4,026,475 | 23,940,102 |
| Fidelity Series Long-Term Treasury Bond Index Fund | 49,540,814 | 14,867,910 | 5,594,127 | 1,386,306 | 203,673 | (1,857,345) | 57,160,925 |
| Fidelity Series Opportunistic Insights Fund | 107,095,088 | 9,774,966 | 30,444,848 | -- | 5,795,832 | 37,818,661 | 130,039,699 |
| Fidelity Series Overseas Fund | 131,293,945 | 7,907,145 | 21,036,587 | -- | (593,822) | 39,650,835 | 157,221,516 |
| Fidelity Series Real Estate Income Fund | 8,460,420 | 476,527 | 647,804 | 318,628 | (54,871) | 1,628,749 | 9,863,021 |
| Fidelity Series Short-Term Credit Fund | 3,966,069 | 82,579 | 34,527 | 45,291 | 283 | 148,841 | 4,163,245 |
| Fidelity Series Small Cap Opportunities Fund | 60,434,430 | 6,006,189 | 4,274,754 | 466,357 | 208,704 | 15,654,470 | 78,029,039 |
| Fidelity Series Stock Selector Large Cap Value Fund | 112,755,143 | 10,399,290 | 8,318,320 | -- | (337,246) | 26,367,417 | 140,866,284 |
| Fidelity Series Value Discovery Fund | 116,977,516 | 8,134,152 | 10,222,743 | -- | 107,705 | 29,060,041 | 144,056,671 |
| | $2,063,235,085 | $285,320,780 | $374,304,066 | $13,715,512 | $29,497,302 | $503,468,257 | $2,507,217,358 |
Amounts in the income column in the above table include any capital gain distributions from underlying funds, which are presented in the corresponding line-item in the Statement of Operations, if applicable.
Investment Valuation
The following is a summary of the inputs used, as of September 30, 2020, involving the Fund's assets and liabilities carried at fair value. The inputs or methodology used for valuing securities may not be an indication of the risk associated with investing in those securities. For more information on valuation inputs, and their aggregation into the levels used below, please refer to the Investment Valuation section in the accompanying Notes to Financial Statements.
| | Valuation Inputs at Reporting Date: |
| Description | Total | Level 1 | Level 2 | Level 3 |
| Investments in Securities: | | | | |
| Other Short-Term Investments and Net Other Assets | $2,489,538 | $-- | $2,489,538 | $-- |
| Domestic Equity Funds | 1,161,765,080 | 1,161,765,080 | -- | -- |
| International Equity Funds | 935,426,731 | 935,426,731 | -- | -- |
| Bond Funds | 376,374,375 | 376,374,375 | -- | -- |
| Short-Term Funds | 38,068,303 | 38,068,303 | -- | -- |
| Total Investments in Securities: | $2,514,124,027 | $2,511,634,489 | $2,489,538 | $-- |
| Derivative Instruments: | | | | |
| Liabilities | | | | |
| Futures Contracts | $(59,923) | $(59,923) | $-- | $-- |
| Total Liabilities | $(59,923) | $(59,923) | $-- | $-- |
| Total Derivative Instruments: | $(59,923) | $(59,923) | $-- | $-- |
Value of Derivative Instruments
The following table is a summary of the Fund's value of derivative instruments by primary risk exposure as of September 30, 2020. For additional information on derivative instruments, please refer to the Derivative Instruments section in the accompanying Notes to Financial Statements.
| Primary Risk Exposure / Derivative Type | Value |
| | Asset | Liability |
| Equity Risk | | |
| Futures Contracts(a) | $0 | $(59,923) |
| Total Equity Risk | 0 | (59,923) |
| Total Value of Derivatives | $0 | $(59,923) |
(a) Reflects gross cumulative appreciation (depreciation) on futures contracts as presented in the Schedule of Investments. In the Statement of Assets and Liabilities, the period end daily variation margin is included in receivable or payable for daily variation margin on futures contracts, and the net cumulative appreciation (depreciation) is included in Total accumulated earnings (loss).
See accompanying notes which are an integral part of the financial statements.
Fidelity Advisor Freedom® 2035 Fund
Financial Statements
Statement of Assets and Liabilities
| | | September 30, 2020 (Unaudited) |
| Assets | | |
Investment in securities, at value — See accompanying schedule:
Unaffiliated issuers (cost $2,489,494) | $2,489,538 | |
| Fidelity Central Funds (cost $4,417,085) | 4,417,131 | |
| Other affiliated issuers (cost $2,080,035,300) | 2,507,217,358 | |
| Total Investment in Securities (cost $2,086,941,879) | | $2,514,124,027 |
| Receivable for investments sold | | 31,665,725 |
| Receivable for fund shares sold | | 4,077,568 |
| Distributions receivable from Fidelity Central Funds | | 394 |
| Total assets | | 2,549,867,714 |
| Liabilities | | |
| Payable for investments purchased | $31,580,890 | |
| Payable for fund shares redeemed | 2,736,520 | |
| Accrued management fee | 1,497,161 | |
| Distribution and service plan fees payable | 401,796 | |
| Payable for daily variation margin on futures contracts | 85,508 | |
| Total liabilities | | 36,301,875 |
| Net Assets | | $2,513,565,839 |
| Net Assets consist of: | | |
| Paid in capital | | $2,068,166,770 |
| Total accumulated earnings (loss) | | 445,399,069 |
| Net Assets | | $2,513,565,839 |
| Net Asset Value and Maximum Offering Price | | |
| Class A: | | |
| Net Asset Value and redemption price per share ($988,425,163 ÷ 71,634,627 shares)(a) | | $13.80 |
| Maximum offering price per share (100/94.25 of $13.80) | | $14.64 |
| Class M: | | |
| Net Asset Value and redemption price per share ($372,102,341 ÷ 27,331,856 shares)(a) | | $13.61 |
| Maximum offering price per share (100/96.50 of $13.61) | | $14.10 |
| Class C: | | |
| Net Asset Value and offering price per share ($45,716,551 ÷ 3,441,913 shares)(a) | | $13.28 |
| Class I: | | |
| Net Asset Value, offering price and redemption price per share ($973,188,343 ÷ 69,837,723 shares) | | $13.93 |
| Class Z: | | |
| Net Asset Value, offering price and redemption price per share ($39,398,258 ÷ 2,848,192 shares) | | $13.83 |
| Class Z6: | | |
| Net Asset Value, offering price and redemption price per share ($94,735,183 ÷ 6,804,868 shares) | | $13.92 |
(a) Redemption price per share is equal to net asset value less any applicable contingent deferred sales charge.
See accompanying notes which are an integral part of the financial statements.
Statement of Operations
| | | Six months ended September 30, 2020 (Unaudited) |
| Investment Income | | |
| Dividends: | | |
| Affiliated issuers | | $8,059,961 |
| Interest | | 4,462 |
| Income from Fidelity Central Funds | | 3,531 |
| Total income | | 8,067,954 |
| Expenses | | |
| Management fee | $8,577,265 | |
| Distribution and service plan fees | 2,300,286 | |
| Independent trustees' fees and expenses | 3,262 | |
| Total expenses before reductions | 10,880,813 | |
| Expense reductions | (133) | |
| Total expenses after reductions | | 10,880,680 |
| Net investment income (loss) | | (2,812,726) |
| Realized and Unrealized Gain (Loss) | | |
| Net realized gain (loss) on: | | |
| Investment securities: | | |
| Unaffiliated issuers | 5 | |
| Fidelity Central Funds | (528) | |
| Other affiliated issuers | 29,497,302 | |
| Futures contracts | (2,081,334) | |
| Capital gain distributions from underlying funds: | | |
| Affiliated issuers | 5,655,551 | |
| Total net realized gain (loss) | | 33,070,996 |
| Change in net unrealized appreciation (depreciation) on: | | |
| Investment securities: | | |
| Unaffiliated issuers | (2,515) | |
| Fidelity Central Funds | (270) | |
| Other affiliated issuers | 503,468,257 | |
| Futures contracts | (59,923) | |
| Total change in net unrealized appreciation (depreciation) | | 503,405,549 |
| Net gain (loss) | | 536,476,545 |
| Net increase (decrease) in net assets resulting from operations | | $533,663,819 |
See accompanying notes which are an integral part of the financial statements.
Statement of Changes in Net Assets
| | Six months ended September 30, 2020 (Unaudited) | Year ended March 31, 2020 |
| Increase (Decrease) in Net Assets | | |
| Operations | | |
| Net investment income (loss) | $(2,812,726) | $31,975,045 |
| Net realized gain (loss) | 33,070,996 | 132,014,511 |
| Change in net unrealized appreciation (depreciation) | 503,405,549 | (370,503,771) |
| Net increase (decrease) in net assets resulting from operations | 533,663,819 | (206,514,215) |
| Distributions to shareholders | (95,454,938) | (182,189,273) |
| Share transactions - net increase (decrease) | 2,032,928 | 69,691,167 |
| Total increase (decrease) in net assets | 440,241,809 | (319,012,321) |
| Net Assets | | |
| Beginning of period | 2,073,324,030 | 2,392,336,351 |
| End of period | $2,513,565,839 | $2,073,324,030 |
See accompanying notes which are an integral part of the financial statements.
Financial Highlights
Fidelity Advisor Freedom 2035 Fund Class A
| | Six months ended (Unaudited) September 30, | Years endedMarch 31, | | | | |
| | 2020 | 2020 | 2019 | 2018 | 2017 | 2016 |
| Selected Per–Share Data | | | | | | |
| Net asset value, beginning of period | $11.46 | $13.58 | $14.65 | $13.61 | $12.37 | $13.51 |
| Income from Investment Operations | | | | | | |
| Net investment income (loss)A | (.02) | .17 | .20 | .12 | .16 | .16 |
| Net realized and unrealized gain (loss) | 2.89 | (1.28) | .16 | 1.67 | 1.68 | (.66) |
| Total from investment operations | 2.87 | (1.11) | .36 | 1.79 | 1.84 | (.50) |
| Distributions from net investment income | – | (.17) | (.22) | (.14) | (.16) | (.17) |
| Distributions from net realized gain | (.53) | (.85) | (1.22) | (.61) | (.44) | (.47) |
| Total distributions | (.53) | (1.01)B | (1.43)B | (.75) | (.60) | (.64) |
| Net asset value, end of period | $13.80 | $11.46 | $13.58 | $14.65 | $13.61 | $12.37 |
| Total ReturnC,D,E | 25.70% | (9.15)% | 3.19% | 13.26% | 15.51% | (3.92)% |
| Ratios to Average Net AssetsF,G | | | | | | |
| Expenses before reductions | .97%H | .98% | .99% | .87% | .25% | .25% |
| Expenses net of fee waivers, if any | .97%H | .98% | .99% | .87% | .25% | .25% |
| Expenses net of all reductions | .97%H | .98% | .99% | .87% | .25% | .25% |
| Net investment income (loss) | (.30)%H | 1.23% | 1.40% | .80% | 1.22% | 1.28% |
| Supplemental Data | | | | | | |
| Net assets, end of period (000 omitted) | $988,425 | $824,792 | $1,026,416 | $1,082,982 | $1,117,175 | $1,094,459 |
| Portfolio turnover rateG | 24%H | 33% | 23% | 23% | 18% | 22% |
A Calculated based on average shares outstanding during the period.
B Total distributions per share do not sum due to rounding.
C Total returns for periods of less than one year are not annualized.
D Total returns would have been lower if certain expenses had not been reduced during the applicable periods shown.
E Total returns do not include the effect of the sales charges.
F Expense ratios reflect operating expenses of the class. Expenses before reductions do not reflect amounts reimbursed, waived, or reduced through arrangements with the investment adviser, brokerage services, or other offset arrangements, if applicable, and do not represent the amount paid by the class during periods when reimbursements, waivers or reductions occur.
G Amount does not include the portfolio activity of any underlying mutual funds or exchange-traded funds (ETFs).
H Annualized
See accompanying notes which are an integral part of the financial statements.
Fidelity Advisor Freedom 2035 Fund Class M
| | Six months ended (Unaudited) September 30, | Years endedMarch 31, | | | | |
| | 2020 | 2020 | 2019 | 2018 | 2017 | 2016 |
| Selected Per–Share Data | | | | | | |
| Net asset value, beginning of period | $11.33 | $13.44 | $14.53 | $13.51 | $12.29 | $13.42 |
| Income from Investment Operations | | | | | | |
| Net investment income (loss)A | (.04) | .13 | .16 | .08 | .12 | .13 |
| Net realized and unrealized gain (loss) | 2.85 | (1.26) | .16 | 1.66 | 1.68 | (.65) |
| Total from investment operations | 2.81 | (1.13) | .32 | 1.74 | 1.80 | (.52) |
| Distributions from net investment income | – | (.14) | (.19) | (.12) | (.14) | (.14) |
| Distributions from net realized gain | (.53) | (.84) | (1.22) | (.60) | (.44) | (.46) |
| Total distributions | (.53) | (.98) | (1.41) | (.72) | (.58) | (.61)B |
| Net asset value, end of period | $13.61 | $11.33 | $13.44 | $14.53 | $13.51 | $12.29 |
| Total ReturnC,D,E | 25.46% | (9.36)% | 2.89% | 12.98% | 15.24% | (4.08)% |
| Ratios to Average Net AssetsF,G | | | | | | |
| Expenses before reductions | 1.22%H | 1.23% | 1.24% | 1.13% | .50% | .50% |
| Expenses net of fee waivers, if any | 1.22%H | 1.23% | 1.24% | 1.13% | .50% | .50% |
| Expenses net of all reductions | 1.22%H | 1.23% | 1.24% | 1.13% | .50% | .50% |
| Net investment income (loss) | (.55)%H | .98% | 1.15% | .55% | .97% | 1.03% |
| Supplemental Data | | | | | | |
| Net assets, end of period (000 omitted) | $372,102 | $310,544 | $366,074 | $364,455 | $336,939 | $299,952 |
| Portfolio turnover rateG | 24%H | 33% | 23% | 23% | 18% | 22% |
A Calculated based on average shares outstanding during the period.
B Total distributions per share do not sum due to rounding.
C Total returns for periods of less than one year are not annualized.
D Total returns would have been lower if certain expenses had not been reduced during the applicable periods shown.
E Total returns do not include the effect of the sales charges.
F Expense ratios reflect operating expenses of the class. Expenses before reductions do not reflect amounts reimbursed, waived, or reduced through arrangements with the investment adviser, brokerage services, or other offset arrangements, if applicable, and do not represent the amount paid by the class during periods when reimbursements, waivers or reductions occur.
G Amount does not include the portfolio activity of any underlying mutual funds or exchange-traded funds (ETFs).
H Annualized
See accompanying notes which are an integral part of the financial statements.
Fidelity Advisor Freedom 2035 Fund Class C
| | Six months ended (Unaudited) September 30, | Years endedMarch 31, | | | | |
| | 2020 | 2020 | 2019 | 2018 | 2017 | 2016 |
| Selected Per–Share Data | | | | | | |
| Net asset value, beginning of period | $11.09 | $13.20 | $14.29 | $13.32 | $12.14 | $13.27 |
| Income from Investment Operations | | | | | | |
| Net investment income (loss)A | (.07) | .06 | .09 | .01 | .06 | .07 |
| Net realized and unrealized gain (loss) | 2.79 | (1.23) | .17 | 1.62 | 1.65 | (.65) |
| Total from investment operations | 2.72 | (1.17) | .26 | 1.63 | 1.71 | (.58) |
| Distributions from net investment income | – | (.10) | (.13) | (.07) | (.09) | (.10) |
| Distributions from net realized gain | (.53) | (.84) | (1.22) | (.60) | (.44) | (.45) |
| Total distributions | (.53) | (.94) | (1.35) | (.66)B | (.53) | (.55) |
| Net asset value, end of period | $13.28 | $11.09 | $13.20 | $14.29 | $13.32 | $12.14 |
| Total ReturnC,D,E | 25.19% | (9.84)% | 2.39% | 12.40% | 14.69% | (4.58)% |
| Ratios to Average Net AssetsF,G | | | | | | |
| Expenses before reductions | 1.72%H | 1.73% | 1.73%I | 1.63% | 1.00% | 1.00% |
| Expenses net of fee waivers, if any | 1.72%H | 1.73% | 1.73%I | 1.63% | 1.00% | 1.00% |
| Expenses net of all reductions | 1.72%H | 1.73% | 1.73%I | 1.63% | 1.00% | 1.00% |
| Net investment income (loss) | (1.05)%H | .48% | .65% | .05% | .47% | .53% |
| Supplemental Data | | | | | | |
| Net assets, end of period (000 omitted) | $45,717 | $37,642 | $44,302 | $65,519 | $61,581 | $54,813 |
| Portfolio turnover rateG | 24%H | 33% | 23% | 23% | 18% | 22% |
A Calculated based on average shares outstanding during the period.
B Total distributions per share do not sum due to rounding.
C Total returns for periods of less than one year are not annualized.
D Total returns would have been lower if certain expenses had not been reduced during the applicable periods shown.
E Total returns do not include the effect of the contingent deferred sales charge.
F Expense ratios reflect operating expenses of the class. Expenses before reductions do not reflect amounts reimbursed, waived, or reduced through arrangements with the investment adviser, brokerage services, or other offset arrangements, if applicable, and do not represent the amount paid by the class during periods when reimbursements, waivers or reductions occur.
G Amount does not include the portfolio activity of any underlying mutual funds or exchange-traded funds (ETFs).
H Annualized
I On certain classes, the size and fluctuation of net assets and expense amounts may cause ratios to differ from contractual rates.
See accompanying notes which are an integral part of the financial statements.
Fidelity Advisor Freedom 2035 Fund Class I
| | Six months ended (Unaudited) September 30, | Years endedMarch 31, | | | | |
| | 2020 | 2020 | 2019 | 2018 | 2017 | 2016 |
| Selected Per–Share Data | | | | | | |
| Net asset value, beginning of period | $11.56 | $13.69 | $14.75 | $13.71 | $12.45 | $13.59 |
| Income from Investment Operations | | | | | | |
| Net investment income (loss)A | –B | .20 | .23 | .15 | .19 | .20 |
| Net realized and unrealized gain (loss) | 2.90 | (1.28) | .17 | 1.68 | 1.70 | (.67) |
| Total from investment operations | 2.90 | (1.08) | .40 | 1.83 | 1.89 | (.47) |
| Distributions from net investment income | – | (.20) | (.25) | (.17) | (.19) | (.20) |
| Distributions from net realized gain | (.53) | (.85) | (1.22) | (.62) | (.44) | (.47) |
| Total distributions | (.53) | (1.05) | (1.46)C | (.79) | (.63) | (.67) |
| Net asset value, end of period | $13.93 | $11.56 | $13.69 | $14.75 | $13.71 | $12.45 |
| Total ReturnD,E | 25.74% | (8.91)% | 3.47% | 13.50% | 15.79% | (3.63)% |
| Ratios to Average Net AssetsF,G | | | | | | |
| Expenses before reductions | .72%H | .73% | .74% | .64% | - %I | - %I |
| Expenses net of fee waivers, if any | .72%H | .73% | .74% | .64% | -% | -% |
| Expenses net of all reductions | .72%H | .73% | .74% | .64% | -% | -% |
| Net investment income (loss) | (.05)%H | 1.48% | 1.65% | 1.04% | 1.47% | 1.53% |
| Supplemental Data | | | | | | |
| Net assets, end of period (000 omitted) | $973,188 | $808,586 | $907,369 | $867,707 | $689,261 | $684,976 |
| Portfolio turnover rateG | 24%H | 33% | 23% | 23% | 18% | 22% |
A Calculated based on average shares outstanding during the period.
B Amount represents less than $.005 per share.
C Total distributions per share do not sum due to rounding.
D Total returns for periods of less than one year are not annualized.
E Total returns would have been lower if certain expenses had not been reduced during the applicable periods shown.
F Expense ratios reflect operating expenses of the class. Expenses before reductions do not reflect amounts reimbursed, waived, or reduced through arrangements with the investment adviser, brokerage services, or other offset arrangements, if applicable, and do not represent the amount paid by the class during periods when reimbursements, waivers or reductions occur.
G Amount does not include the portfolio activity of any underlying mutual funds or exchange-traded funds (ETFs).
H Annualized
I Amount represents less than .005%.
See accompanying notes which are an integral part of the financial statements.
Fidelity Advisor Freedom 2035 Fund Class Z
| | Six months ended (Unaudited) September 30, | Years endedMarch 31, | |
| | 2020 | 2020 | 2019 A |
| Selected Per–Share Data | | | |
| Net asset value, beginning of period | $11.47 | $13.63 | $14.78 |
| Income from Investment Operations | | | |
| Net investment income (loss)B | –C | .21 | .07 |
| Net realized and unrealized gain (loss) | 2.89 | (1.27) | (.32)D |
| Total from investment operations | 2.89 | (1.06) | (.25) |
| Distributions from net investment income | – | (.22) | (.31) |
| Distributions from net realized gain | (.53) | (.88) | (.59) |
| Total distributions | (.53) | (1.10) | (.90) |
| Net asset value, end of period | $13.83 | $11.47 | $13.63 |
| Total ReturnE,F | 25.86% | (8.87)% | (.96)% |
| Ratios to Average Net AssetsG,H | | | |
| Expenses before reductions | .62%I | .63% | .63%I,J |
| Expenses net of fee waivers, if any | .62%I | .63% | .63%I,J |
| Expenses net of all reductions | .62%I | .63% | .63%I,J |
| Net investment income (loss) | .05%I | 1.58% | 1.01%I |
| Supplemental Data | | | |
| Net assets, end of period (000 omitted) | $39,398 | $27,968 | $2,821 |
| Portfolio turnover rateH | 24%I | 33% | 23% |
A For the period October 2, 2018 (commencement of sale of shares) to March 31, 2019.
B Calculated based on average shares outstanding during the period.
C Amount represents less than $.005 per share.
D The amount shown for a share outstanding does not correspond with the aggregate net gain (loss) on investments for the period due to the timing of sales and repurchases of shares in relation to fluctuating market values of the investments of the Fund.
E Total returns for periods of less than one year are not annualized.
F Total returns would have been lower if certain expenses had not been reduced during the applicable periods shown.
G Expense ratios reflect operating expenses of the class. Expenses before reductions do not reflect amounts reimbursed, waived, or reduced through arrangements with the investment adviser, brokerage services, or other offset arrangements, if applicable, and do not represent the amount paid by the class during periods when reimbursements, waivers or reductions occur.
H Amount does not include the portfolio activity of any underlying mutual funds or exchange-traded funds (ETFs).
I Annualized
J On certain classes, the size and fluctuation of net assets and expense amounts may cause ratios to differ from contractual rates.
See accompanying notes which are an integral part of the financial statements.
Fidelity Advisor Freedom 2035 Fund Class Z6
| | Six months ended (Unaudited) September 30, | Years endedMarch 31, | | |
| | 2020 | 2020 | 2019 | 2018 A |
| Selected Per–Share Data | | | | |
| Net asset value, beginning of period | $11.53 | $13.67 | $14.75 | $14.07 |
| Income from Investment Operations | | | | |
| Net investment income (loss)B | .01 | .23 | .26 | .12 |
| Net realized and unrealized gain (loss) | 2.91 | (1.28) | .16 | 1.15 |
| Total from investment operations | 2.92 | (1.05) | .42 | 1.27 |
| Distributions from net investment income | – | (.23) | (.29) | (.22) |
| Distributions from net realized gain | (.53) | (.86) | (1.22) | (.38) |
| Total distributions | (.53) | (1.09) | (1.50)C | (.59)C |
| Net asset value, end of period | $13.92 | $11.53 | $13.67 | $14.75 |
| Total ReturnD,E | 25.99% | (8.74)% | 3.65% | 9.03% |
| Ratios to Average Net AssetsF,G | | | | |
| Expenses before reductions | .48%H | .49% | .49% | .51%H,I |
| Expenses net of fee waivers, if any | .48%H | .49% | .49% | .51%H,I |
| Expenses net of all reductions | .48%H | .49% | .49% | .51%H,I |
| Net investment income (loss) | .19%H | 1.73% | 1.90% | .97%H |
| Supplemental Data | | | | |
| Net assets, end of period (000 omitted) | $94,735 | $63,792 | $45,355 | $15,784 |
| Portfolio turnover rateG | 24%H | 33% | 23% | 23% |
A For the period June 6, 2017 (commencement of sale of shares) to March 31, 2018.
B Calculated based on average shares outstanding during the period.
C Total distributions per share do not sum due to rounding.
D Total returns for periods of less than one year are not annualized.
E Total returns would have been lower if certain expenses had not been reduced during the applicable periods shown.
F Expense ratios reflect operating expenses of the class. Expenses before reductions do not reflect amounts reimbursed, waived, or reduced through arrangements with the investment adviser, brokerage services, or other offset arrangements, if applicable, and do not represent the amount paid by the class during periods when reimbursements, waivers or reductions occur.
G Amount does not include the portfolio activity of any underlying mutual funds or exchange-traded funds (ETFs).
H Annualized
I On certain classes, the size and fluctuation of net assets and expense amounts may cause ratios to differ from contractual rates.
See accompanying notes which are an integral part of the financial statements.
Fidelity Advisor Freedom® 2040 Fund
Investment Summary (Unaudited)
The information in the following tables is based on the direct investments of the Fund.
Top Holdings as of September 30, 2020
| | % of fund's net assets |
| Fidelity Series Emerging Markets Opportunities Fund | 13.9 |
| Fidelity Series Large Cap Stock Fund | 9.9 |
| Fidelity Series International Growth Fund | 7.0 |
| Fidelity Series Overseas Fund | 6.9 |
| Fidelity Series International Value Fund | 6.9 |
| Fidelity Series Value Discovery Fund | 6.4 |
| Fidelity Series Stock Selector Large Cap Value Fund | 6.3 |
| Fidelity Advisor Series Equity Growth Fund | 6.2 |
| Fidelity Series Opportunistic Insights Fund | 5.8 |
| Fidelity Advisor Series Growth Opportunities Fund | 4.3 |
| | 73.6 |
Asset Allocation (% of fund's net assets)
| Period end |
| | Domestic Equity Funds | 51.5% |
| | International Equity Funds | 40.8% |
| | Bond Funds | 6.0% |
| | Short-Term Funds | 1.6% |
| | Short-Term Investments | 0.1% |

Domestic Equity Funds category includes Fidelity Series Commodity Strategy Fund which invests in commodity-related investments.
Fidelity Advisor Freedom® 2040 Fund
Schedule of Investments September 30, 2020 (Unaudited)
Showing Percentage of Net Assets
| U.S. Treasury Obligations - 0.1% | | | |
| | | Principal Amount | Value |
| U.S. Treasury Bills, yield at date of purchase 0.11% to 0.11% 12/3/20 to 12/10/20 (a) | | | |
| (Cost $2,039,572) | | 2,040,000 | 2,039,614 |
| | | Shares | Value |
|
| Domestic Equity Funds - 51.5% | | | |
| Fidelity Advisor Series Equity Growth Fund (b) | | 7,716,567 | $140,364,356 |
| Fidelity Advisor Series Growth Opportunities Fund (b) | | 5,263,808 | 96,801,436 |
| Fidelity Advisor Series Small Cap Fund (b) | | 5,706,224 | 63,510,273 |
| Fidelity Series All-Sector Equity Fund (b) | | 5,672,482 | 60,411,930 |
| Fidelity Series Commodity Strategy Fund (b) | | 13,421,077 | 55,831,679 |
| Fidelity Series Large Cap Stock Fund (b) | | 15,673,038 | 221,930,214 |
| Fidelity Series Large Cap Value Index Fund (b) | | 2,067,961 | 23,988,351 |
| Fidelity Series Opportunistic Insights Fund (b) | | 6,023,807 | 130,294,938 |
| Fidelity Series Small Cap Opportunities Fund (b) | | 6,127,613 | 78,188,337 |
| Fidelity Series Stock Selector Large Cap Value Fund (b) | | 12,831,816 | 141,149,973 |
| Fidelity Series Value Discovery Fund (b) | | 11,678,417 | 144,345,229 |
| TOTAL DOMESTIC EQUITY FUNDS | | | |
| (Cost $930,805,249) | | | 1,156,816,716 |
|
| International Equity Funds - 40.8% | | | |
| Fidelity Series Canada Fund (b) | | 5,155,428 | 52,740,024 |
| Fidelity Series Emerging Markets Fund (b) | | 3,655,898 | 34,475,120 |
| Fidelity Series Emerging Markets Opportunities Fund (b) | | 14,915,260 | 312,922,153 |
| Fidelity Series International Growth Fund (b) | | 8,309,084 | 156,044,596 |
| Fidelity Series International Small Cap Fund (b) | | 2,714,726 | 48,322,132 |
| Fidelity Series International Value Fund (b) | | 17,902,398 | 154,318,669 |
| Fidelity Series Overseas Fund (b) | | 13,937,211 | 155,818,019 |
| TOTAL INTERNATIONAL EQUITY FUNDS | | | |
| (Cost $746,924,944) | | | 914,640,713 |
|
| Bond Funds - 6.0% | | | |
| Fidelity Series Emerging Markets Debt Fund (b) | | 1,390,621 | 12,599,022 |
| Fidelity Series Floating Rate High Income Fund (b) | | 269,987 | 2,389,382 |
| Fidelity Series High Income Fund (b) | | 1,664,314 | 15,178,540 |
| Fidelity Series Inflation-Protected Bond Index Fund (b) | | 4,172,462 | 44,645,344 |
| Fidelity Series International Credit Fund (b) | | 121,449 | 1,264,285 |
| Fidelity Series Long-Term Treasury Bond Index Fund (b) | | 4,938,503 | 51,014,731 |
| Fidelity Series Real Estate Income Fund (b) | | 881,529 | 8,797,656 |
| TOTAL BOND FUNDS | | | |
| (Cost $128,837,721) | | | 135,888,960 |
|
| Short-Term Funds - 1.6% | | | |
| Fidelity Cash Central Fund 0.10% (c) | | 5,715,281 | 5,716,424 |
| Fidelity Series Government Money Market Fund 0.16% (b)(d) | | 25,767,167 | 25,767,167 |
| Fidelity Series Short-Term Credit Fund (b) | | 373,875 | 3,832,224 |
| TOTAL SHORT-TERM FUNDS | | | |
| (Cost $35,201,341) | | | 35,315,815 |
| TOTAL INVESTMENT IN SECURITIES - 100.0% | | | |
| (Cost $1,843,808,827) | | | 2,244,701,818 |
| NET OTHER ASSETS (LIABILITIES) - 0.0% | | | (497,148) |
| NET ASSETS - 100% | | | $2,244,204,670 |
| Futures Contracts | | | | | |
| | Number of contracts | Expiration Date | Notional Amount | Value | Unrealized Appreciation/(Depreciation) |
| Purchased | | | | | |
| Equity Index Contracts | | | | | |
| ICE E-mini MSCI EAFE Index Contracts (United States) | 51 | Dec. 2020 | $4,725,660 | $(73,269) | $(73,269) |
| Sold | | | | | |
| Equity Index Contracts | | | | | |
| CME E-mini S&P 500 Index Contracts (United States) | 22 | Dec. 2020 | 3,687,200 | (24,071) | (24,071) |
| TOTAL FUTURES CONTRACTS | | | | | $(97,340) |
The notional amount of futures purchased as a percentage of Net Assets is 0.2%
The notional amount of futures sold as a percentage of Net Assets is 0.2%
Legend
(a) Security or a portion of the security was pledged to cover margin requirements for futures contracts. At period end, the value of securities pledged amounted to $2,039,614.
(b) Affiliated Fund
(c) Affiliated fund that is generally available only to investment companies and other accounts managed by Fidelity Investments. The rate quoted is the annualized seven-day yield of the fund at period end. A complete unaudited listing of the fund's holdings as of its most recent quarter end is available upon request. In addition, each Fidelity Central Fund's financial statements are available on the SEC's website or upon request.
(d) The rate quoted is the annualized seven-day yield of the fund at period end.
Affiliated Central Funds
Information regarding fiscal year to date income earned by the Fund from investments in Fidelity Central Funds is as follows:
| Fund | Income earned |
| Fidelity Cash Central Fund | $3,821 |
| Total | $3,821 |
Amounts in the income column in the above table include any capital gain distributions from underlying funds, which are presented in the corresponding line-item in the Statement of Operations, if applicable.
Affiliated Underlying Funds
Fiscal year to date information regarding the Fund's investments in affiliated Underlying Funds, excluding any Money Market Central Funds, is presented below. Exchanges between classes of the same affiliated Underlying Funds may occur.
| Affiliate | Value, beginning of period | Purchases | Sales Proceeds | Dividend Income | Realized Gain (loss) | Change in Unrealized appreciation (depreciation) | Value, end of period |
| Fidelity Advisor Series Equity Growth Fund | $111,787,301 | $8,478,094 | $31,600,112 | $-- | $7,860,785 | $43,838,288 | $140,364,356 |
| Fidelity Advisor Series Growth Opportunities Fund | 72,165,135 | 5,506,328 | 27,502,262 | -- | 6,763,915 | 39,868,320 | 96,801,436 |
| Fidelity Advisor Series Small Cap Fund | 47,411,627 | 4,446,718 | 4,061,246 | -- | 183,287 | 15,529,887 | 63,510,273 |
| Fidelity Series All-Sector Equity Fund | 49,019,389 | 2,380,910 | 8,219,166 | -- | 91,168 | 17,139,629 | 60,411,930 |
| Fidelity Series Canada Fund | 36,517,491 | 8,602,899 | 1,800,511 | -- | (151,289) | 9,571,434 | 52,740,024 |
| Fidelity Series Commodity Strategy Fund | 61,144,816 | 2,647,250 | 15,050,231 | 241,300 | (4,771,234) | 11,861,078 | 55,831,679 |
| Fidelity Series Emerging Markets Debt Fund | 11,524,764 | 537,973 | 909,269 | 336,968 | (22,969) | 1,468,523 | 12,599,022 |
| Fidelity Series Emerging Markets Fund | 21,546,915 | 7,160,150 | 2,415,523 | -- | 71,835 | 8,111,743 | 34,475,120 |
| Fidelity Series Emerging Markets Opportunities Fund | 201,828,268 | 50,947,853 | 18,033,638 | -- | 1,635,183 | 76,544,487 | 312,922,153 |
| Fidelity Series Floating Rate High Income Fund | 2,276,439 | 103,254 | 219,984 | 54,624 | (19,362) | 249,035 | 2,389,382 |
| Fidelity Series Government Money Market Fund 0.16% | 54,976,567 | 21,563,691 | 50,773,091 | 42,609 | -- | -- | 25,767,167 |
| Fidelity Series High Income Fund | 14,099,100 | 663,553 | 1,099,922 | 420,401 | (4,719) | 1,520,528 | 15,178,540 |
| Fidelity Series Inflation-Protected Bond Index Fund | 39,223,353 | 9,132,715 | 6,151,229 | 33,227 | 28,254 | 2,412,251 | 44,645,344 |
| Fidelity Series International Credit Fund | 1,143,840 | 17,776 | -- | 17,777 | -- | 102,669 | 1,264,285 |
| Fidelity Series International Growth Fund | 153,159,489 | 2,244,859 | 40,338,636 | -- | 12,531,184 | 28,447,700 | 156,044,596 |
| Fidelity Series International Small Cap Fund | 36,561,752 | 2,060,035 | 2,503,455 | -- | 161,190 | 12,042,610 | 48,322,132 |
| Fidelity Series International Value Fund | 136,792,247 | 4,866,760 | 15,596,246 | -- | (1,917,167) | 30,173,075 | 154,318,669 |
| Fidelity Series Large Cap Stock Fund | 181,421,377 | 24,175,593 | 16,296,008 | 7,533,505 | (925,814) | 33,555,066 | 221,930,214 |
| Fidelity Series Large Cap Value Index Fund | 18,950,160 | 2,528,053 | 1,533,301 | -- | (43,741) | 4,087,180 | 23,988,351 |
| Fidelity Series Long-Term Treasury Bond Index Fund | 44,773,408 | 14,222,570 | 6,513,612 | 1,221,234 | 439,261 | (1,906,896) | 51,014,731 |
| Fidelity Series Opportunistic Insights Fund | 105,708,070 | 9,709,066 | 28,211,908 | -- | 4,712,095 | 38,377,615 | 130,294,938 |
| Fidelity Series Overseas Fund | 128,171,335 | 8,518,510 | 19,236,123 | -- | (445,444) | 38,809,741 | 155,818,019 |
| Fidelity Series Real Estate Income Fund | 7,628,885 | 437,842 | 689,335 | 285,416 | (61,388) | 1,481,652 | 8,797,656 |
| Fidelity Series Short-Term Credit Fund | 3,614,913 | 103,985 | 23,798 | 41,674 | 137 | 136,987 | 3,832,224 |
| Fidelity Series Small Cap Opportunities Fund | 59,995,194 | 7,496,104 | 5,040,120 | 457,578 | 71,208 | 15,665,951 | 78,188,337 |
| Fidelity Series Stock Selector Large Cap Value Fund | 111,931,839 | 12,426,132 | 9,064,959 | -- | (475,780) | 26,332,741 | 141,149,973 |
| Fidelity Series Value Discovery Fund | 115,753,339 | 10,742,238 | 10,888,370 | -- | (45,472) | 28,783,494 | 144,345,229 |
| | $1,829,127,013 | $221,720,911 | $323,772,055 | $10,686,313 | $25,665,123 | $484,204,788 | $2,236,945,780 |
Amounts in the income column in the above table include any capital gain distributions from underlying funds, which are presented in the corresponding line-item in the Statement of Operations, if applicable.
Investment Valuation
The following is a summary of the inputs used, as of September 30, 2020, involving the Fund's assets and liabilities carried at fair value. The inputs or methodology used for valuing securities may not be an indication of the risk associated with investing in those securities. For more information on valuation inputs, and their aggregation into the levels used below, please refer to the Investment Valuation section in the accompanying Notes to Financial Statements.
| | Valuation Inputs at Reporting Date: |
| Description | Total | Level 1 | Level 2 | Level 3 |
| Investments in Securities: | | | | |
| Other Short-Term Investments and Net Other Assets | $2,039,614 | $-- | $2,039,614 | $-- |
| Domestic Equity Funds | 1,156,816,716 | 1,156,816,716 | -- | -- |
| International Equity Funds | 914,640,713 | 914,640,713 | -- | -- |
| Bond Funds | 135,888,960 | 135,888,960 | -- | -- |
| Short-Term Funds | 35,315,815 | 35,315,815 | -- | -- |
| Total Investments in Securities: | $2,244,701,818 | $2,242,662,204 | $2,039,614 | $-- |
| Derivative Instruments: | | | | |
| Liabilities | | | | |
| Futures Contracts | $(97,340) | $(97,340) | $-- | $-- |
| Total Liabilities | $(97,340) | $(97,340) | $-- | $-- |
| Total Derivative Instruments: | $(97,340) | $(97,340) | $-- | $-- |
Value of Derivative Instruments
The following table is a summary of the Fund's value of derivative instruments by primary risk exposure as of September 30, 2020. For additional information on derivative instruments, please refer to the Derivative Instruments section in the accompanying Notes to Financial Statements.
| Primary Risk Exposure / Derivative Type | Value |
| | Asset | Liability |
| Equity Risk | | |
| Futures Contracts(a) | $0 | $(97,340) |
| Total Equity Risk | 0 | (97,340) |
| Total Value of Derivatives | $0 | $(97,340) |
(a) Reflects gross cumulative appreciation (depreciation) on futures contracts as presented in the Schedule of Investments. In the Statement of Assets and Liabilities, the period end daily variation margin is included in receivable or payable for daily variation margin on futures contracts, and the net cumulative appreciation (depreciation) is included in Total accumulated earnings (loss).
See accompanying notes which are an integral part of the financial statements.
Fidelity Advisor Freedom® 2040 Fund
Financial Statements
Statement of Assets and Liabilities
| | | September 30, 2020 (Unaudited) |
| Assets | | |
Investment in securities, at value — See accompanying schedule:
Unaffiliated issuers (cost $2,039,572) | $2,039,614 | |
| Fidelity Central Funds (cost $5,716,417) | 5,716,424 | |
| Other affiliated issuers (cost $1,836,052,838) | 2,236,945,780 | |
| Total Investment in Securities (cost $1,843,808,827) | | $2,244,701,818 |
| Receivable for investments sold | | 33,472,976 |
| Receivable for fund shares sold | | 1,789,186 |
| Distributions receivable from Fidelity Central Funds | | 526 |
| Total assets | | 2,279,964,506 |
| Liabilities | | |
| Payable for investments purchased | $29,537,330 | |
| Payable for fund shares redeemed | 4,403,378 | |
| Accrued management fee | 1,387,250 | |
| Distribution and service plan fees payable | 371,213 | |
| Payable for daily variation margin on futures contracts | 60,665 | |
| Total liabilities | | 35,759,836 |
| Net Assets | | $2,244,204,670 |
| Net Assets consist of: | | |
| Paid in capital | | $1,830,619,729 |
| Total accumulated earnings (loss) | | 413,584,941 |
| Net Assets | | $2,244,204,670 |
| Net Asset Value and Maximum Offering Price | | |
| Class A: | | |
| Net Asset Value and redemption price per share ($880,952,629 ÷ 59,742,041 shares)(a) | | $14.75 |
| Maximum offering price per share (100/94.25 of $14.75) | | $15.65 |
| Class M: | | |
| Net Asset Value and redemption price per share ($343,424,172 ÷ 23,478,229 shares)(a) | | $14.63 |
| Maximum offering price per share (100/96.50 of $14.63) | | $15.16 |
| Class C: | | |
| Net Asset Value and offering price per share ($50,184,247 ÷ 3,528,762 shares)(a) | | $14.22 |
| Class I: | | |
| Net Asset Value, offering price and redemption price per share ($856,425,826 ÷ 57,562,271 shares) | | $14.88 |
| Class Z: | | |
| Net Asset Value, offering price and redemption price per share ($30,528,566 ÷ 2,067,015 shares) | | $14.77 |
| Class Z6: | | |
| Net Asset Value, offering price and redemption price per share ($82,689,230 ÷ 5,566,332 shares) | | $14.86 |
(a) Redemption price per share is equal to net asset value less any applicable contingent deferred sales charge.
See accompanying notes which are an integral part of the financial statements.
Statement of Operations
| | | Six months ended September 30, 2020 (Unaudited) |
| Investment Income | | |
| Dividends: | | |
| Affiliated issuers | | $5,235,155 |
| Interest | | 4,008 |
| Income from Fidelity Central Funds | | 3,821 |
| Total income | | 5,242,984 |
| Expenses | | |
| Management fee | $7,942,746 | |
| Distribution and service plan fees | 2,120,684 | |
| Independent trustees' fees and expenses | 2,909 | |
| Total expenses before reductions | 10,066,339 | |
| Expense reductions | (135) | |
| Total expenses after reductions | | 10,066,204 |
| Net investment income (loss) | | (4,823,220) |
| Realized and Unrealized Gain (Loss) | | |
| Net realized gain (loss) on: | | |
| Investment securities: | | |
| Unaffiliated issuers | 166,501 | |
| Fidelity Central Funds | (554) | |
| Other affiliated issuers | 25,665,123 | |
| Futures contracts | (1,134,396) | |
| Capital gain distributions from underlying funds: | | |
| Affiliated issuers | 5,451,158 | |
| Total net realized gain (loss) | | 30,147,832 |
| Change in net unrealized appreciation (depreciation) on: | | |
| Investment securities: | | |
| Unaffiliated issuers | (2,199) | |
| Fidelity Central Funds | (244) | |
| Other affiliated issuers | 484,204,788 | |
| Futures contracts | (286,850) | |
| Total change in net unrealized appreciation (depreciation) | | 483,915,495 |
| Net gain (loss) | | 514,063,327 |
| Net increase (decrease) in net assets resulting from operations | | $509,240,107 |
See accompanying notes which are an integral part of the financial statements.
Statement of Changes in Net Assets
| | Six months ended September 30, 2020 (Unaudited) | Year ended March 31, 2020 |
| Increase (Decrease) in Net Assets | | |
| Operations | | |
| Net investment income (loss) | $(4,823,220) | $27,110,497 |
| Net realized gain (loss) | 30,147,832 | 113,009,419 |
| Change in net unrealized appreciation (depreciation) | 483,915,495 | (355,921,145) |
| Net increase (decrease) in net assets resulting from operations | 509,240,107 | (215,801,229) |
| Distributions to shareholders | (88,386,127) | (160,006,087) |
| Share transactions - net increase (decrease) | (15,849,364) | 41,090,450 |
| Total increase (decrease) in net assets | 405,004,616 | (334,716,866) |
| Net Assets | | |
| Beginning of period | 1,839,200,054 | 2,173,916,920 |
| End of period | $2,244,204,670 | $1,839,200,054 |
See accompanying notes which are an integral part of the financial statements.
Financial Highlights
Fidelity Advisor Freedom 2040 Fund Class A
| | Six months ended (Unaudited) September 30, | Years endedMarch 31, | | | | |
| | 2020 | 2020 | 2019 | 2018 | 2017 | 2016 |
| Selected Per–Share Data | | | | | | |
| Net asset value, beginning of period | $12.08 | $14.52 | $15.69 | $14.57 | $13.25 | $14.49 |
| Income from Investment Operations | | | | | | |
| Net investment income (loss)A | (.04) | .17 | .21 | .12 | .17 | .17 |
| Net realized and unrealized gain (loss) | 3.29 | (1.55) | .15 | 1.81 | 1.80 | (.69) |
| Total from investment operations | 3.25 | (1.38) | .36 | 1.93 | 1.97 | (.52) |
| Distributions from net investment income | – | (.17) | (.23) | (.15) | (.17) | (.18) |
| Distributions from net realized gain | (.58) | (.88) | (1.31) | (.66) | (.48) | (.54) |
| Total distributions | (.58) | (1.06)B | (1.53)B | (.81) | (.65) | (.72) |
| Net asset value, end of period | $14.75 | $12.08 | $14.52 | $15.69 | $14.57 | $13.25 |
| Total ReturnC,D,E | 27.66% | (10.59)% | 3.04% | 13.42% | 15.53% | (3.82)% |
| Ratios to Average Net AssetsF,G | | | | | | |
| Expenses before reductions | 1.00%H | 1.00% | .99%I | .87% | .25% | .25% |
| Expenses net of fee waivers, if any | 1.00%H | 1.00% | .99%I | .87% | .25% | .25% |
| Expenses net of all reductions | 1.00%H | 1.00% | .99%I | .87% | .25% | .25% |
| Net investment income (loss) | (.51)%H | 1.17% | 1.37% | .78% | 1.22% | 1.27% |
| Supplemental Data | | | | | | |
| Net assets, end of period (000 omitted) | $880,953 | $729,343 | $916,426 | $948,970 | $965,401 | $950,816 |
| Portfolio turnover rateG | 21%H | 31% | 21% | 23% | 18% | 21% |
A Calculated based on average shares outstanding during the period.
B Total distributions per share do not sum due to rounding.
C Total returns for periods of less than one year are not annualized.
D Total returns would have been lower if certain expenses had not been reduced during the applicable periods shown.
E Total returns do not include the effect of the sales charges.
F Expense ratios reflect operating expenses of the class. Expenses before reductions do not reflect amounts reimbursed, waived, or reduced through arrangements with the investment adviser, brokerage services, or other offset arrangements, if applicable, and do not represent the amount paid by the class during periods when reimbursements, waivers or reductions occur.
G Amount does not include the portfolio activity of any underlying mutual funds or exchange-traded funds (ETFs).
H Annualized
I On certain classes, the size and fluctuation of net assets and expense amounts may cause ratios to differ from contractual rates.
See accompanying notes which are an integral part of the financial statements.
Fidelity Advisor Freedom 2040 Fund Class M
| | Six months ended (Unaudited) September 30, | Years endedMarch 31, | | | | |
| | 2020 | 2020 | 2019 | 2018 | 2017 | 2016 |
| Selected Per–Share Data | | | | | | |
| Net asset value, beginning of period | $12.00 | $14.44 | $15.62 | $14.52 | $13.21 | $14.45 |
| Income from Investment Operations | | | | | | |
| Net investment income (loss)A | (.05) | .13 | .17 | .08 | .13 | .14 |
| Net realized and unrealized gain (loss) | 3.26 | (1.55) | .16 | 1.80 | 1.81 | (.70) |
| Total from investment operations | 3.21 | (1.42) | .33 | 1.88 | 1.94 | (.56) |
| Distributions from net investment income | – | (.15) | (.20) | (.12) | (.15) | (.15) |
| Distributions from net realized gain | (.58) | (.88) | (1.31) | (.66) | (.48) | (.53) |
| Total distributions | (.58) | (1.02)B | (1.51) | (.78) | (.63) | (.68) |
| Net asset value, end of period | $14.63 | $12.00 | $14.44 | $15.62 | $14.52 | $13.21 |
| Total ReturnC,D,E | 27.51% | (10.84)% | 2.82% | 13.11% | 15.26% | (4.07)% |
| Ratios to Average Net AssetsF,G | | | | | | |
| Expenses before reductions | 1.25%H | 1.25% | 1.25% | 1.13% | .50% | .50% |
| Expenses net of fee waivers, if any | 1.25%H | 1.25% | 1.25% | 1.13% | .50% | .50% |
| Expenses net of all reductions | 1.25%H | 1.25% | 1.25% | 1.13% | .50% | .50% |
| Net investment income (loss) | (.76)%H | .92% | 1.12% | .53% | .97% | 1.02% |
| Supplemental Data | | | | | | |
| Net assets, end of period (000 omitted) | $343,424 | $286,126 | $356,107 | $343,164 | $324,990 | $310,107 |
| Portfolio turnover rateG | 21%H | 31% | 21% | 23% | 18% | 21% |
A Calculated based on average shares outstanding during the period.
B Total distributions per share do not sum due to rounding.
C Total returns for periods of less than one year are not annualized.
D Total returns would have been lower if certain expenses had not been reduced during the applicable periods shown.
E Total returns do not include the effect of the sales charges.
F Expense ratios reflect operating expenses of the class. Expenses before reductions do not reflect amounts reimbursed, waived, or reduced through arrangements with the investment adviser, brokerage services, or other offset arrangements, if applicable, and do not represent the amount paid by the class during periods when reimbursements, waivers or reductions occur.
G Amount does not include the portfolio activity of any underlying mutual funds or exchange-traded funds (ETFs).
H Annualized
See accompanying notes which are an integral part of the financial statements.
Fidelity Advisor Freedom 2040 Fund Class C
| | Six months ended (Unaudited) September 30, | Years endedMarch 31, | | | | |
| | 2020 | 2020 | 2019 | 2018 | 2017 | 2016 |
| Selected Per–Share Data | | | | | | |
| Net asset value, beginning of period | $11.71 | $14.14 | $15.32 | $14.28 | $13.02 | $14.27 |
| Income from Investment Operations | | | | | | |
| Net investment income (loss)A | (.08) | .06 | .09 | –B | .06 | .07 |
| Net realized and unrealized gain (loss) | 3.17 | (1.52) | .18 | 1.77 | 1.78 | (.70) |
| Total from investment operations | 3.09 | (1.46) | .27 | 1.77 | 1.84 | (.63) |
| Distributions from net investment income | – | (.09) | (.14) | (.07) | (.10) | (.10) |
| Distributions from net realized gain | (.58) | (.88) | (1.31) | (.66) | (.48) | (.52) |
| Total distributions | (.58) | (.97) | (1.45) | (.73) | (.58) | (.62) |
| Net asset value, end of period | $14.22 | $11.71 | $14.14 | $15.32 | $14.28 | $13.02 |
| Total ReturnC,D,E | 27.15% | (11.31)% | 2.37% | 12.52% | 14.70% | (4.63)% |
| Ratios to Average Net AssetsF,G | | | | | | |
| Expenses before reductions | 1.74%H,I | 1.75% | 1.74%I | 1.63% | 1.00% | 1.00% |
| Expenses net of fee waivers, if any | 1.74%H,I | 1.75% | 1.74%I | 1.63% | 1.00% | 1.00% |
| Expenses net of all reductions | 1.74%H,I | 1.75% | 1.74%I | 1.63% | 1.00% | 1.00% |
| Net investment income (loss) | (1.26)%H | .42% | .62% | .03% | .48% | .52% |
| Supplemental Data | | | | | | |
| Net assets, end of period (000 omitted) | $50,184 | $41,153 | $53,715 | $84,365 | $79,480 | $73,036 |
| Portfolio turnover rateG | 21%H | 31% | 21% | 23% | 18% | 21% |
A Calculated based on average shares outstanding during the period.
B Amount represents less than $.005 per share.
C Total returns for periods of less than one year are not annualized.
D Total returns would have been lower if certain expenses had not been reduced during the applicable periods shown.
E Total returns do not include the effect of the contingent deferred sales charge.
F Expense ratios reflect operating expenses of the class. Expenses before reductions do not reflect amounts reimbursed, waived, or reduced through arrangements with the investment adviser, brokerage services, or other offset arrangements, if applicable, and do not represent the amount paid by the class during periods when reimbursements, waivers or reductions occur.
G Amount does not include the portfolio activity of any underlying mutual funds or exchange-traded funds (ETFs).
H Annualized
I On certain classes, the size and fluctuation of net assets and expense amounts may cause ratios to differ from contractual rates.
See accompanying notes which are an integral part of the financial statements.
Fidelity Advisor Freedom 2040 Fund Class I
| | Six months ended (Unaudited) September 30, | Years endedMarch 31, | | | | |
| | 2020 | 2020 | 2019 | 2018 | 2017 | 2016 |
| Selected Per–Share Data | | | | | | |
| Net asset value, beginning of period | $12.17 | $14.62 | $15.78 | $14.65 | $13.32 | $14.57 |
| Income from Investment Operations | | | | | | |
| Net investment income (loss)A | (.02) | .21 | .24 | .16 | .20 | .21 |
| Net realized and unrealized gain (loss) | 3.31 | (1.57) | .16 | 1.83 | 1.82 | (.71) |
| Total from investment operations | 3.29 | (1.36) | .40 | 1.99 | 2.02 | (.50) |
| Distributions from net investment income | – | (.20) | (.26) | (.19) | (.20) | (.22) |
| Distributions from net realized gain | (.58) | (.89) | (1.31) | (.67) | (.49) | (.54) |
| Total distributions | (.58) | (1.09) | (1.56)B | (.86) | (.69) | (.75)B |
| Net asset value, end of period | $14.88 | $12.17 | $14.62 | $15.78 | $14.65 | $13.32 |
| Total ReturnC,D | 27.79% | (10.35)% | 3.31% | 13.74% | 15.82% | (3.62)% |
| Ratios to Average Net AssetsE,F | | | | | | |
| Expenses before reductions | .75%G | .75% | .75% | .63% | - %H | - %H |
| Expenses net of fee waivers, if any | .75%G | .75% | .75% | .63% | -% | -% |
| Expenses net of all reductions | .75%G | .75% | .75% | .63% | -% | -% |
| Net investment income (loss) | (.26)%G | 1.42% | 1.62% | 1.02% | 1.47% | 1.52% |
| Supplemental Data | | | | | | |
| Net assets, end of period (000 omitted) | $856,426 | $705,362 | $805,102 | $790,667 | $649,934 | $629,599 |
| Portfolio turnover rateF | 21%G | 31% | 21% | 23% | 18% | 21% |
A Calculated based on average shares outstanding during the period.
B Total distributions per share do not sum due to rounding.
C Total returns for periods of less than one year are not annualized.
D Total returns would have been lower if certain expenses had not been reduced during the applicable periods shown.
E Expense ratios reflect operating expenses of the class. Expenses before reductions do not reflect amounts reimbursed, waived, or reduced through arrangements with the investment adviser, brokerage services, or other offset arrangements, if applicable, and do not represent the amount paid by the class during periods when reimbursements, waivers or reductions occur.
F Amount does not include the portfolio activity of any underlying mutual funds or exchange-traded funds (ETFs).
G Annualized
H Amount represents less than .005%.
See accompanying notes which are an integral part of the financial statements.
Fidelity Advisor Freedom 2040 Fund Class Z
| | Six months ended (Unaudited) September 30, | Years endedMarch 31, | |
| | 2020 | 2020 | 2019 A |
| Selected Per–Share Data | | | |
| Net asset value, beginning of period | $12.08 | $14.56 | $15.85 |
| Income from Investment Operations | | | |
| Net investment income (loss)B | (.01) | .22 | .36 |
| Net realized and unrealized gain (loss) | 3.28 | (1.55) | (.69)C |
| Total from investment operations | 3.27 | (1.33) | (.33) |
| Distributions from net investment income | – | (.23) | (.33) |
| Distributions from net realized gain | (.58) | (.91) | (.63) |
| Total distributions | (.58) | (1.15)D | (.96) |
| Net asset value, end of period | $14.77 | $12.08 | $14.56 |
| Total ReturnE,F | 27.83% | (10.31)% | (1.30)% |
| Ratios to Average Net AssetsG,H | | | |
| Expenses before reductions | .64%I | .65%J | .65%I,J |
| Expenses net of fee waivers, if any | .64%I | .65%J | .65%I,J |
| Expenses net of all reductions | .64%I | .65%J | .65%I,J |
| Net investment income (loss) | (.16)%I | 1.52% | 5.06%I |
| Supplemental Data | | | |
| Net assets, end of period (000 omitted) | $30,529 | $20,000 | $1,501 |
| Portfolio turnover rateH | 21%I | 31% | 21% |
A For the period October 2, 2018 (commencement of sale of shares) to March 31, 2019.
B Calculated based on average shares outstanding during the period.
C The amount shown for a share outstanding does not correspond with the aggregate net gain (loss) on investments for the period due to the timing of sales and repurchases of shares in relation to fluctuating market values of the investments of the Fund.
D Total distributions per share do not sum due to rounding.
E Total returns for periods of less than one year are not annualized.
F Total returns would have been lower if certain expenses had not been reduced during the applicable periods shown.
G Expense ratios reflect operating expenses of the class. Expenses before reductions do not reflect amounts reimbursed, waived, or reduced through arrangements with the investment adviser, brokerage services, or other offset arrangements, if applicable, and do not represent the amount paid by the class during periods when reimbursements, waivers or reductions occur.
H Amount does not include the portfolio activity of any underlying mutual funds or exchange-traded funds (ETFs).
I Annualized
J On certain classes, the size and fluctuation of net assets and expense amounts may cause ratios to differ from contractual rates.
See accompanying notes which are an integral part of the financial statements.
Fidelity Advisor Freedom 2040 Fund Class Z6
| | Six months ended (Unaudited) September 30, | Years endedMarch 31, | | |
| | 2020 | 2020 | 2019 | 2018 A |
| Selected Per–Share Data | | | | |
| Net asset value, beginning of period | $12.13 | $14.60 | $15.76 | $15.04 |
| Income from Investment Operations | | | | |
| Net investment income (loss)B | –C | .24 | .28 | .18 |
| Net realized and unrealized gain (loss) | 3.31 | (1.57) | .17 | 1.20 |
| Total from investment operations | 3.31 | (1.33) | .45 | 1.38 |
| Distributions from net investment income | – | (.24) | (.30) | (.23) |
| Distributions from net realized gain | (.58) | (.90) | (1.31) | (.42) |
| Total distributions | (.58) | (1.14) | (1.61) | (.66)D |
| Net asset value, end of period | $14.86 | $12.13 | $14.60 | $15.76 |
| Total ReturnE,F | 28.05% | (10.24)% | 3.64% | 9.12% |
| Ratios to Average Net AssetsG,H | | | | |
| Expenses before reductions | .49%I | .49% | .49% | .51%I,J |
| Expenses net of fee waivers, if any | .49%I | .49% | .49% | .51%I,J |
| Expenses net of all reductions | .49%I | .49% | .49% | .51%I,J |
| Net investment income (loss) | (.01)%I | 1.67% | 1.87% | 1.39%I |
| Supplemental Data | | | | |
| Net assets, end of period (000 omitted) | $82,689 | $57,216 | $41,066 | $11,861 |
| Portfolio turnover rateH | 21%I | 31% | 21% | 23% |
A For the period June 6, 2017 (commencement of sale of shares) to March 31, 2018.
B Calculated based on average shares outstanding during the period.
C Amount represents less than $.005 per share.
D Total distributions per share do not sum due to rounding.
E Total returns for periods of less than one year are not annualized.
F Total returns would have been lower if certain expenses had not been reduced during the applicable periods shown.
G Expense ratios reflect operating expenses of the class. Expenses before reductions do not reflect amounts reimbursed, waived, or reduced through arrangements with the investment adviser, brokerage services, or other offset arrangements, if applicable, and do not represent the amount paid by the class during periods when reimbursements, waivers or reductions occur.
H Amount does not include the portfolio activity of any underlying mutual funds or exchange-traded funds (ETFs).
I Annualized
J On certain classes, the size and fluctuation of net assets and expense amounts may cause ratios to differ from contractual rates.
See accompanying notes which are an integral part of the financial statements.
Fidelity Advisor Freedom® 2045 Fund
Investment Summary (Unaudited)
The information in the following tables is based on the direct investments of the Fund.
Top Holdings as of September 30, 2020
| | % of fund's net assets |
| Fidelity Series Emerging Markets Opportunities Fund | 13.9 |
| Fidelity Series Large Cap Stock Fund | 9.9 |
| Fidelity Series International Growth Fund | 7.0 |
| Fidelity Series Overseas Fund | 6.9 |
| Fidelity Series International Value Fund | 6.9 |
| Fidelity Series Value Discovery Fund | 6.4 |
| Fidelity Series Stock Selector Large Cap Value Fund | 6.3 |
| Fidelity Advisor Series Equity Growth Fund | 6.2 |
| Fidelity Series Opportunistic Insights Fund | 5.8 |
| Fidelity Advisor Series Growth Opportunities Fund | 4.3 |
| | 73.6 |
Asset Allocation (% of fund's net assets)
| Period end |
| | Domestic Equity Funds | 51.5% |
| | International Equity Funds | 40.8% |
| | Bond Funds | 6.0% |
| | Short-Term Funds | 1.6% |
| | Short-Term Investments | 0.1% |

Domestic Equity Funds category includes Fidelity Series Commodity Strategy Fund which invests in commodity-related investments.
Fidelity Advisor Freedom® 2045 Fund
Schedule of Investments September 30, 2020 (Unaudited)
Showing Percentage of Net Assets
| U.S. Treasury Obligations - 0.1% | | | |
| | | Principal Amount | Value |
| U.S. Treasury Bills, yield at date of purchase 0.11% to 0.11% 12/3/20 to 12/10/20 (a) | | | |
| (Cost $1,409,705) | | 1,410,000 | 1,409,734 |
| | | Shares | Value |
|
| Domestic Equity Funds - 51.5% | | | |
| Fidelity Advisor Series Equity Growth Fund (b) | | 5,264,813 | $95,766,942 |
| Fidelity Advisor Series Growth Opportunities Fund (b) | | 3,591,361 | 66,045,122 |
| Fidelity Advisor Series Small Cap Fund (b) | | 3,893,201 | 43,331,330 |
| Fidelity Series All-Sector Equity Fund (b) | | 3,870,183 | 41,217,452 |
| Fidelity Series Commodity Strategy Fund (b) | | 9,166,098 | 38,130,966 |
| Fidelity Series Large Cap Stock Fund (b) | | 10,693,288 | 151,416,953 |
| Fidelity Series Large Cap Value Index Fund (b) | | 1,410,913 | 16,366,596 |
| Fidelity Series Opportunistic Insights Fund (b) | | 4,109,887 | 88,896,862 |
| Fidelity Series Small Cap Opportunities Fund (b) | | 4,180,699 | 53,345,723 |
| Fidelity Series Stock Selector Large Cap Value Fund (b) | | 8,754,800 | 96,302,801 |
| Fidelity Series Value Discovery Fund (b) | | 7,967,867 | 98,482,834 |
| TOTAL DOMESTIC EQUITY FUNDS | | | |
| (Cost $653,560,484) | | | 789,303,581 |
|
| International Equity Funds - 40.8% | | | |
| Fidelity Series Canada Fund (b) | | 3,516,550 | 35,974,303 |
| Fidelity Series Emerging Markets Fund (b) | | 2,496,356 | 23,540,640 |
| Fidelity Series Emerging Markets Opportunities Fund (b) | | 10,177,180 | 213,517,234 |
| Fidelity Series International Growth Fund (b) | | 5,669,065 | 106,465,034 |
| Fidelity Series International Small Cap Fund (b) | | 1,851,674 | 32,959,790 |
| Fidelity Series International Value Fund (b) | | 12,216,381 | 105,305,207 |
| Fidelity Series Overseas Fund (b) | | 9,508,982 | 106,310,422 |
| TOTAL INTERNATIONAL EQUITY FUNDS | | | |
| (Cost $520,242,102) | | | 624,072,630 |
|
| Bond Funds - 6.0% | | | |
| Fidelity Series Emerging Markets Debt Fund (b) | | 949,901 | 8,606,105 |
| Fidelity Series Floating Rate High Income Fund (b) | | 187,360 | 1,658,135 |
| Fidelity Series High Income Fund (b) | | 1,135,663 | 10,357,243 |
| Fidelity Series Inflation-Protected Bond Index Fund (b) | | 2,846,758 | 30,460,309 |
| Fidelity Series International Credit Fund (b) | | 73,170 | 761,697 |
| Fidelity Series Long-Term Treasury Bond Index Fund (b) | | 3,369,421 | 34,806,121 |
| Fidelity Series Real Estate Income Fund (b) | | 600,700 | 5,994,983 |
| TOTAL BOND FUNDS | | | |
| (Cost $87,945,570) | | | 92,644,593 |
|
| Short-Term Funds - 1.6% | | | |
| Fidelity Cash Central Fund 0.10% (c) | | 3,790,718 | 3,791,476 |
| Fidelity Series Government Money Market Fund 0.16% (b)(d) | | 17,598,379 | 17,598,379 |
| Fidelity Series Short-Term Credit Fund (b) | | 257,097 | 2,635,246 |
| TOTAL SHORT-TERM FUNDS | | | |
| (Cost $23,945,739) | | | 24,025,101 |
| TOTAL INVESTMENT IN SECURITIES - 100.0% | | | |
| (Cost $1,287,103,600) | | | 1,531,455,639 |
| NET OTHER ASSETS (LIABILITIES) - 0.0% | | | (274,522) |
| NET ASSETS - 100% | | | $1,531,181,117 |
| Futures Contracts | | | | | |
| | Number of contracts | Expiration Date | Notional Amount | Value | Unrealized Appreciation/(Depreciation) |
| Purchased | | | | | |
| Equity Index Contracts | | | | | |
| ICE E-mini MSCI EAFE Index Contracts (United States) | 34 | Dec. 2020 | $3,150,440 | $(49,779) | $(49,779) |
| Sold | | | | | |
| Equity Index Contracts | | | | | |
| CME E-mini S&P 500 Index Contracts (United States) | 15 | Dec. 2020 | 2,514,000 | (16,412) | (16,412) |
| TOTAL FUTURES CONTRACTS | | | | | $(66,191) |
The notional amount of futures purchased as a percentage of Net Assets is 0.2%
The notional amount of futures sold as a percentage of Net Assets is 0.2%
Legend
(a) Security or a portion of the security was pledged to cover margin requirements for futures contracts. At period end, the value of securities pledged amounted to $1,409,734.
(b) Affiliated Fund
(c) Affiliated fund that is generally available only to investment companies and other accounts managed by Fidelity Investments. The rate quoted is the annualized seven-day yield of the fund at period end. A complete unaudited listing of the fund's holdings as of its most recent quarter end is available upon request. In addition, each Fidelity Central Fund's financial statements are available on the SEC's website or upon request.
(d) The rate quoted is the annualized seven-day yield of the fund at period end.
Affiliated Central Funds
Information regarding fiscal year to date income earned by the Fund from investments in Fidelity Central Funds is as follows:
| Fund | Income earned |
| Fidelity Cash Central Fund | $2,577 |
| Total | $2,577 |
Amounts in the income column in the above table include any capital gain distributions from underlying funds, which are presented in the corresponding line-item in the Statement of Operations, if applicable.
Affiliated Underlying Funds
Fiscal year to date information regarding the Fund's investments in affiliated Underlying Funds, excluding any Money Market Central Funds, is presented below. Exchanges between classes of the same affiliated Underlying Funds may occur.
| Affiliate | Value, beginning of period | Purchases | Sales Proceeds | Dividend Income | Realized Gain (loss) | Change in Unrealized appreciation (depreciation) | Value, end of period |
| Fidelity Advisor Series Equity Growth Fund | $75,607,075 | $6,608,920 | $21,636,872 | $-- | $4,711,491 | $30,476,328 | $95,766,942 |
| Fidelity Advisor Series Growth Opportunities Fund | 48,812,389 | 4,318,392 | 18,826,628 | -- | 4,596,918 | 27,144,051 | 66,045,122 |
| Fidelity Advisor Series Small Cap Fund | 32,087,950 | 3,412,065 | 2,848,425 | -- | 141,961 | 10,537,779 | 43,331,330 |
| Fidelity Series All-Sector Equity Fund | 33,154,194 | 1,979,856 | 5,640,187 | -- | (64,574) | 11,788,163 | 41,217,452 |
| Fidelity Series Canada Fund | 24,582,543 | 6,192,295 | 1,202,343 | -- | (82,454) | 6,484,262 | 35,974,303 |
| Fidelity Series Commodity Strategy Fund | 41,372,338 | 2,254,504 | 10,341,316 | 164,659 | (3,116,755) | 7,962,195 | 38,130,966 |
| Fidelity Series Emerging Markets Debt Fund | 7,803,484 | 452,958 | 633,747 | 229,840 | 14,216 | 969,194 | 8,606,105 |
| Fidelity Series Emerging Markets Fund | 14,581,407 | 5,111,942 | 1,724,557 | -- | 11,178 | 5,560,670 | 23,540,640 |
| Fidelity Series Emerging Markets Opportunities Fund | 136,554,263 | 36,796,660 | 13,037,410 | -- | 750,878 | 52,452,843 | 213,517,234 |
| Fidelity Series Floating Rate High Income Fund | 1,561,377 | 91,794 | 153,325 | 37,815 | (3,828) | 162,117 | 1,658,135 |
| Fidelity Series Government Money Market Fund 0.16% | 37,187,479 | 14,828,036 | 34,417,136 | 29,042 | -- | -- | 17,598,379 |
| Fidelity Series High Income Fund | 9,537,674 | 556,411 | 766,630 | 286,511 | 6,726 | 1,023,062 | 10,357,243 |
| Fidelity Series Inflation-Protected Bond Index Fund | 26,536,334 | 6,508,129 | 4,247,341 | 22,616 | 17,131 | 1,646,056 | 30,460,309 |
| Fidelity Series International Credit Fund | 689,132 | 10,710 | -- | 10,710 | -- | 61,855 | 761,697 |
| Fidelity Series International Growth Fund | 103,711,518 | 2,448,447 | 27,582,393 | -- | 5,961,813 | 21,925,649 | 106,465,034 |
| Fidelity Series International Small Cap Fund | 24,772,817 | 1,567,599 | 1,687,706 | -- | 86,543 | 8,220,537 | 32,959,790 |
| Fidelity Series International Value Fund | 92,670,000 | 4,076,757 | 10,656,697 | -- | (1,477,631) | 20,692,778 | 105,305,207 |
| Fidelity Series Large Cap Stock Fund | 122,724,451 | 17,970,452 | 11,415,554 | 5,158,619 | (335,081) | 22,472,685 | 151,416,953 |
| Fidelity Series Large Cap Value Index Fund | 12,769,836 | 1,922,525 | 1,064,773 | -- | (22,783) | 2,761,791 | 16,366,596 |
| Fidelity Series Long-Term Treasury Bond Index Fund | 30,290,447 | 9,809,730 | 4,293,983 | 828,585 | 296,033 | (1,296,106) | 34,806,121 |
| Fidelity Series Opportunistic Insights Fund | 71,492,194 | 7,386,468 | 19,325,172 | -- | 2,473,016 | 26,870,356 | 88,896,862 |
| Fidelity Series Overseas Fund | 86,562,100 | 6,971,031 | 13,308,064 | -- | (256,799) | 26,342,154 | 106,310,422 |
| Fidelity Series Real Estate Income Fund | 5,147,913 | 363,546 | 480,460 | 194,370 | (17,979) | 981,963 | 5,994,983 |
| Fidelity Series Short-Term Credit Fund | 2,483,455 | 71,827 | 14,297 | 28,655 | 112 | 94,149 | 2,635,246 |
| Fidelity Series Small Cap Opportunities Fund | 40,625,599 | 5,550,807 | 3,524,189 | 312,206 | 19,374 | 10,674,132 | 53,345,723 |
| Fidelity Series Stock Selector Large Cap Value Fund | 75,740,241 | 9,284,227 | 6,282,302 | -- | (389,355) | 17,949,990 | 96,302,801 |
| Fidelity Series Value Discovery Fund | 78,303,780 | 8,222,230 | 7,568,223 | -- | (44,183) | 19,569,230 | 98,482,834 |
| | $1,237,361,990 | $164,768,318 | $222,679,730 | $7,303,628 | $13,275,968 | $333,527,883 | $1,526,254,429 |
Amounts in the income column in the above table include any capital gain distributions from underlying funds, which are presented in the corresponding line-item in the Statement of Operations, if applicable.
Investment Valuation
The following is a summary of the inputs used, as of September 30, 2020, involving the Fund's assets and liabilities carried at fair value. The inputs or methodology used for valuing securities may not be an indication of the risk associated with investing in those securities. For more information on valuation inputs, and their aggregation into the levels used below, please refer to the Investment Valuation section in the accompanying Notes to Financial Statements.
| | Valuation Inputs at Reporting Date: |
| Description | Total | Level 1 | Level 2 | Level 3 |
| Investments in Securities: | | | | |
| Other Short-Term Investments and Net Other Assets | $1,409,734 | $-- | $1,409,734 | $-- |
| Domestic Equity Funds | 789,303,581 | 789,303,581 | -- | -- |
| International Equity Funds | 624,072,630 | 624,072,630 | -- | -- |
| Bond Funds | 92,644,593 | 92,644,593 | -- | -- |
| Short-Term Funds | 24,025,101 | 24,025,101 | -- | -- |
| Total Investments in Securities: | $1,531,455,639 | $1,530,045,905 | $1,409,734 | $-- |
| Derivative Instruments: | | | | |
| Liabilities | | | | |
| Futures Contracts | $(66,191) | $(66,191) | $-- | $-- |
| Total Liabilities | $(66,191) | $(66,191) | $-- | $-- |
| Total Derivative Instruments: | $(66,191) | $(66,191) | $-- | $-- |
Value of Derivative Instruments
The following table is a summary of the Fund's value of derivative instruments by primary risk exposure as of September 30, 2020. For additional information on derivative instruments, please refer to the Derivative Instruments section in the accompanying Notes to Financial Statements.
| Primary Risk Exposure / Derivative Type | Value |
| | Asset | Liability |
| Equity Risk | | |
| Futures Contracts(a) | $0 | $(66,191) |
| Total Equity Risk | 0 | (66,191) |
| Total Value of Derivatives | $0 | $(66,191) |
(a) Reflects gross cumulative appreciation (depreciation) on futures contracts as presented in the Schedule of Investments. In the Statement of Assets and Liabilities, the period end daily variation margin is included in receivable or payable for daily variation margin on futures contracts, and the net cumulative appreciation (depreciation) is included in Total accumulated earnings (loss).
See accompanying notes which are an integral part of the financial statements.
Fidelity Advisor Freedom® 2045 Fund
Financial Statements
Statement of Assets and Liabilities
| | | September 30, 2020 (Unaudited) |
| Assets | | |
Investment in securities, at value — See accompanying schedule:
Unaffiliated issuers (cost $1,409,704) | $1,409,734 | |
| Fidelity Central Funds (cost $3,791,472) | 3,791,476 | |
| Other affiliated issuers (cost $1,281,902,424) | 1,526,254,429 | |
| Total Investment in Securities (cost $1,287,103,600) | | $1,531,455,639 |
| Cash | | 43,230 |
| Receivable for investments sold | | 22,988,460 |
| Receivable for fund shares sold | | 1,314,457 |
| Distributions receivable from Fidelity Central Funds | | 352 |
| Total assets | | 1,555,802,138 |
| Liabilities | | |
| Payable for investments purchased | $20,098,424 | |
| Payable for fund shares redeemed | 3,306,460 | |
| Accrued management fee | 943,201 | |
| Distribution and service plan fees payable | 231,939 | |
| Payable for daily variation margin on futures contracts | 40,997 | |
| Total liabilities | | 24,621,021 |
| Net Assets | | $1,531,181,117 |
| Net Assets consist of: | | |
| Paid in capital | | $1,282,527,539 |
| Total accumulated earnings (loss) | | 248,653,578 |
| Net Assets | | $1,531,181,117 |
| Net Asset Value and Maximum Offering Price | | |
| Class A: | | |
| Net Asset Value and redemption price per share ($559,125,487 ÷ 48,330,738 shares)(a) | | $11.57 |
| Maximum offering price per share (100/94.25 of $11.57) | | $12.28 |
| Class M: | | |
| Net Asset Value and redemption price per share ($217,584,156 ÷ 19,032,305 shares)(a) | | $11.43 |
| Maximum offering price per share (100/96.50 of $11.43) | | $11.84 |
| Class C: | | |
| Net Asset Value and offering price per share ($28,229,933 ÷ 2,519,310 shares)(a) | | $11.21 |
| Class I: | | |
| Net Asset Value, offering price and redemption price per share ($631,163,550 ÷ 54,068,634 shares) | | $11.67 |
| Class Z: | | |
| Net Asset Value, offering price and redemption price per share ($24,153,768 ÷ 2,084,452 shares) | | $11.59 |
| Class Z6: | | |
| Net Asset Value, offering price and redemption price per share ($70,924,223 ÷ 6,081,253 shares) | | $11.66 |
(a) Redemption price per share is equal to net asset value less any applicable contingent deferred sales charge.
See accompanying notes which are an integral part of the financial statements.
Statement of Operations
| | | Six months ended September 30, 2020 (Unaudited) |
| Investment Income | | |
| Dividends: | | |
| Affiliated issuers | | $3,577,171 |
| Interest | | 2,716 |
| Income from Fidelity Central Funds | | 2,577 |
| Total income | | 3,582,464 |
| Expenses | | |
| Management fee | $5,399,639 | |
| Distribution and service plan fees | 1,319,885 | |
| Independent trustees' fees and expenses | 1,976 | |
| Total expenses before reductions | 6,721,500 | |
| Expense reductions | (197) | |
| Total expenses after reductions | | 6,721,303 |
| Net investment income (loss) | | (3,138,839) |
| Realized and Unrealized Gain (Loss) | | |
| Net realized gain (loss) on: | | |
| Investment securities: | | |
| Unaffiliated issuers | 103,793 | |
| Fidelity Central Funds | (377) | |
| Other affiliated issuers | 13,275,968 | |
| Futures contracts | (761,377) | |
| Capital gain distributions from underlying funds: | | |
| Affiliated issuers | 3,726,457 | |
| Total net realized gain (loss) | | 16,344,464 |
| Change in net unrealized appreciation (depreciation) on: | | |
| Investment securities: | | |
| Unaffiliated issuers | (1,481) | |
| Fidelity Central Funds | (169) | |
| Other affiliated issuers | 333,527,883 | |
| Futures contracts | (192,788) | |
| Total change in net unrealized appreciation (depreciation) | | 333,333,445 |
| Net gain (loss) | | 349,677,909 |
| Net increase (decrease) in net assets resulting from operations | | $346,539,070 |
See accompanying notes which are an integral part of the financial statements.
Statement of Changes in Net Assets
| | Six months ended September 30, 2020 (Unaudited) | Year ended March 31, 2020 |
| Increase (Decrease) in Net Assets | | |
| Operations | | |
| Net investment income (loss) | $(3,138,839) | $18,561,322 |
| Net realized gain (loss) | 16,344,464 | 70,946,497 |
| Change in net unrealized appreciation (depreciation) | 333,333,445 | (236,020,508) |
| Net increase (decrease) in net assets resulting from operations | 346,539,070 | (146,512,689) |
| Distributions to shareholders | (53,982,456) | (102,870,591) |
| Share transactions - net increase (decrease) | (5,571,741) | 99,889,190 |
| Total increase (decrease) in net assets | 286,984,873 | (149,494,090) |
| Net Assets | | |
| Beginning of period | 1,244,196,244 | 1,393,690,334 |
| End of period | $1,531,181,117 | $1,244,196,244 |
See accompanying notes which are an integral part of the financial statements.
Financial Highlights
Fidelity Advisor Freedom 2045 Fund Class A
| | Six months ended (Unaudited) September 30, | Years endedMarch 31, | | | | |
| | 2020 | 2020 | 2019 | 2018 | 2017 | 2016 |
| Selected Per–Share Data | | | | | | |
| Net asset value, beginning of period | $9.43 | $11.33 | $12.21 | $11.26 | $10.23 | $11.15 |
| Income from Investment Operations | | | | | | |
| Net investment income (loss)A | (.03) | .13 | .16 | .10 | .13 | .13 |
| Net realized and unrealized gain (loss) | 2.58 | (1.22) | .13 | 1.40 | 1.39 | (.54) |
| Total from investment operations | 2.55 | (1.09) | .29 | 1.50 | 1.52 | (.41) |
| Distributions from net investment income | – | (.14) | (.18) | (.12) | (.13) | (.14) |
| Distributions from net realized gain | (.41) | (.67) | (.99) | (.43) | (.36) | (.37) |
| Total distributions | (.41) | (.81) | (1.17) | (.55) | (.49) | (.51) |
| Net asset value, end of period | $11.57 | $9.43 | $11.33 | $12.21 | $11.26 | $10.23 |
| Total ReturnB,C,D | 27.70% | (10.68)% | 3.13% | 13.44% | 15.50% | (3.85)% |
| Ratios to Average Net AssetsE,F | | | | | | |
| Expenses before reductions | 1.00%G | 1.00% | .99%H | .87% | .25% | .25% |
| Expenses net of fee waivers, if any | 1.00%G | 1.00% | .99%H | .87% | .25% | .25% |
| Expenses net of all reductions | 1.00%G | 1.00% | .99%H | .87% | .25% | .25% |
| Net investment income (loss) | (.51)%G | 1.19% | 1.38% | .79% | 1.22% | 1.27% |
| Supplemental Data | | | | | | |
| Net assets, end of period (000 omitted) | $559,125 | $456,849 | $547,563 | $566,474 | $556,090 | $531,510 |
| Portfolio turnover rateF | 23%G | 30% | 22% | 21% | 22% | 26% |
A Calculated based on average shares outstanding during the period.
B Total returns for periods of less than one year are not annualized.
C Total returns would have been lower if certain expenses had not been reduced during the applicable periods shown.
D Total returns do not include the effect of the sales charges.
E Expense ratios reflect operating expenses of the class. Expenses before reductions do not reflect amounts reimbursed, waived, or reduced through arrangements with the investment adviser, brokerage services, or other offset arrangements, if applicable, and do not represent the amount paid by the class during periods when reimbursements, waivers or reductions occur.
F Amount does not include the portfolio activity of any underlying mutual funds or exchange-traded funds (ETFs).
G Annualized
H On certain classes, the size and fluctuation of net assets and expense amounts may cause ratios to differ from contractual rates.
See accompanying notes which are an integral part of the financial statements.
Fidelity Advisor Freedom 2045 Fund Class M
| | Six months ended (Unaudited) September 30, | Years endedMarch 31, | | | | |
| | 2020 | 2020 | 2019 | 2018 | 2017 | 2016 |
| Selected Per–Share Data | | | | | | |
| Net asset value, beginning of period | $9.34 | $11.22 | $12.12 | $11.19 | $10.17 | $11.09 |
| Income from Investment Operations | | | | | | |
| Net investment income (loss)A | (.04) | .10 | .13 | .06 | .10 | .11 |
| Net realized and unrealized gain (loss) | 2.54 | (1.20) | .12 | 1.39 | 1.39 | (.54) |
| Total from investment operations | 2.50 | (1.10) | .25 | 1.45 | 1.49 | (.43) |
| Distributions from net investment income | – | (.12) | (.16) | (.10) | (.11) | (.12) |
| Distributions from net realized gain | (.41) | (.67) | (.99) | (.43) | (.36) | (.37) |
| Total distributions | (.41) | (.78)B | (1.15) | (.52)B | (.47) | (.49) |
| Net asset value, end of period | $11.43 | $9.34 | $11.22 | $12.12 | $11.19 | $10.17 |
| Total ReturnC,D,E | 27.43% | (10.80)% | 2.79% | 13.12% | 15.29% | (4.10)% |
| Ratios to Average Net AssetsF,G | | | | | | |
| Expenses before reductions | 1.25%H | 1.25% | 1.24%I | 1.13% | .50% | .50% |
| Expenses net of fee waivers, if any | 1.25%H | 1.25% | 1.24%I | 1.13% | .50% | .50% |
| Expenses net of all reductions | 1.25%H | 1.25% | 1.24%I | 1.13% | .50% | .50% |
| Net investment income (loss) | (.76)%H | .94% | 1.13% | .54% | .97% | 1.02% |
| Supplemental Data | | | | | | |
| Net assets, end of period (000 omitted) | $217,584 | $181,179 | $210,625 | $207,442 | $186,200 | $158,557 |
| Portfolio turnover rateG | 23%H | 30% | 22% | 21% | 22% | 26% |
A Calculated based on average shares outstanding during the period.
B Total distributions per share do not sum due to rounding.
C Total returns for periods of less than one year are not annualized.
D Total returns would have been lower if certain expenses had not been reduced during the applicable periods shown.
E Total returns do not include the effect of the sales charges.
F Expense ratios reflect operating expenses of the class. Expenses before reductions do not reflect amounts reimbursed, waived, or reduced through arrangements with the investment adviser, brokerage services, or other offset arrangements, if applicable, and do not represent the amount paid by the class during periods when reimbursements, waivers or reductions occur.
G Amount does not include the portfolio activity of any underlying mutual funds or exchange-traded funds (ETFs).
H Annualized
I On certain classes, the size and fluctuation of net assets and expense amounts may cause ratios to differ from contractual rates.
See accompanying notes which are an integral part of the financial statements.
Fidelity Advisor Freedom 2045 Fund Class C
| | Six months ended (Unaudited) September 30, | Years endedMarch 31, | | | | |
| | 2020 | 2020 | 2019 | 2018 | 2017 | 2016 |
| Selected Per–Share Data | | | | | | |
| Net asset value, beginning of period | $9.18 | $11.07 | $11.98 | $11.08 | $10.09 | $11.01 |
| Income from Investment Operations | | | | | | |
| Net investment income (loss)A | (.07) | .05 | .07 | –B | .05 | .05 |
| Net realized and unrealized gain (loss) | 2.51 | (1.20) | .13 | 1.38 | 1.38 | (.53) |
| Total from investment operations | 2.44 | (1.15) | .20 | 1.38 | 1.43 | (.48) |
| Distributions from net investment income | – | (.08) | (.12) | (.05) | (.08) | (.08) |
| Distributions from net realized gain | (.41) | (.67) | (.99) | (.43) | (.36) | (.36) |
| Total distributions | (.41) | (.74)C | (1.11) | (.48) | (.44) | (.44) |
| Net asset value, end of period | $11.21 | $9.18 | $11.07 | $11.98 | $11.08 | $10.09 |
| Total ReturnD,E,F | 27.24% | (11.32)% | 2.29% | 12.59% | 14.71% | (4.59)% |
| Ratios to Average Net AssetsG,H | | | | | | |
| Expenses before reductions | 1.74%I,J | 1.75% | 1.74%J | 1.63% | 1.00% | 1.00% |
| Expenses net of fee waivers, if any | 1.74%I,J | 1.75% | 1.74%J | 1.63% | 1.00% | 1.00% |
| Expenses net of all reductions | 1.74%I,J | 1.75% | 1.74%J | 1.63% | 1.00% | 1.00% |
| Net investment income (loss) | (1.26)%I | .44% | .63% | .04% | .47% | .53% |
| Supplemental Data | | | | | | |
| Net assets, end of period (000 omitted) | $28,230 | $22,256 | $25,383 | $30,549 | $27,491 | $23,423 |
| Portfolio turnover rateH | 23%I | 30% | 22% | 21% | 22% | 26% |
A Calculated based on average shares outstanding during the period.
B Amount represents less than $.005 per share.
C Total distributions per share do not sum due to rounding.
D Total returns for periods of less than one year are not annualized.
E Total returns would have been lower if certain expenses had not been reduced during the applicable periods shown.
F Total returns do not include the effect of the contingent deferred sales charge.
G Expense ratios reflect operating expenses of the class. Expenses before reductions do not reflect amounts reimbursed, waived, or reduced through arrangements with the investment adviser, brokerage services, or other offset arrangements, if applicable, and do not represent the amount paid by the class during periods when reimbursements, waivers or reductions occur.
H Amount does not include the portfolio activity of any underlying mutual funds or exchange-traded funds (ETFs).
I Annualized
J On certain classes, the size and fluctuation of net assets and expense amounts may cause ratios to differ from contractual rates.
See accompanying notes which are an integral part of the financial statements.
Fidelity Advisor Freedom 2045 Fund Class I
| | Six months ended (Unaudited) September 30, | Years endedMarch 31, | | | | |
| | 2020 | 2020 | 2019 | 2018 | 2017 | 2016 |
| Selected Per–Share Data | | | | | | |
| Net asset value, beginning of period | $9.50 | $11.41 | $12.29 | $11.33 | $10.28 | $11.21 |
| Income from Investment Operations | | | | | | |
| Net investment income (loss)A | (.01) | .16 | .19 | .12 | .16 | .16 |
| Net realized and unrealized gain (loss) | 2.59 | (1.23) | .13 | 1.42 | 1.40 | (.55) |
| Total from investment operations | 2.58 | (1.07) | .32 | 1.54 | 1.56 | (.39) |
| Distributions from net investment income | – | (.16) | (.20) | (.14) | (.15) | (.17) |
| Distributions from net realized gain | (.41) | (.68) | (.99) | (.44) | (.36) | (.37) |
| Total distributions | (.41) | (.84) | (1.20)B | (.58) | (.51) | (.54) |
| Net asset value, end of period | $11.67 | $9.50 | $11.41 | $12.29 | $11.33 | $10.28 |
| Total ReturnC,D | 27.81% | (10.46)% | 3.34% | 13.77% | 15.83% | (3.66)% |
| Ratios to Average Net AssetsE,F | | | | | | |
| Expenses before reductions | .75%G | .75% | .75% | .64% | - %H | - %H |
| Expenses net of fee waivers, if any | .75%G | .75% | .75% | .64% | -% | -% |
| Expenses net of all reductions | .75%G | .75% | .75% | .64% | -% | -% |
| Net investment income (loss) | (.26)%G | 1.44% | 1.63% | 1.03% | 1.47% | 1.52% |
| Supplemental Data | | | | | | |
| Net assets, end of period (000 omitted) | $631,164 | $522,314 | $577,252 | $543,170 | $420,967 | $390,675 |
| Portfolio turnover rateF | 23%G | 30% | 22% | 21% | 22% | 26% |
A Calculated based on average shares outstanding during the period.
B Total distributions per share do not sum due to rounding.
C Total returns for periods of less than one year are not annualized.
D Total returns would have been lower if certain expenses had not been reduced during the applicable periods shown.
E Expense ratios reflect operating expenses of the class. Expenses before reductions do not reflect amounts reimbursed, waived, or reduced through arrangements with the investment adviser, brokerage services, or other offset arrangements, if applicable, and do not represent the amount paid by the class during periods when reimbursements, waivers or reductions occur.
F Amount does not include the portfolio activity of any underlying mutual funds or exchange-traded funds (ETFs).
G Annualized
H Amount represents less than .005%.
See accompanying notes which are an integral part of the financial statements.
Fidelity Advisor Freedom 2045 Fund Class Z
| | Six months ended (Unaudited) September 30, | Years endedMarch 31, | |
| | 2020 | 2020 | 2019 A |
| Selected Per–Share Data | | | |
| Net asset value, beginning of period | $9.43 | $11.35 | $12.36 |
| Income from Investment Operations | | | |
| Net investment income (loss)B | (.01) | .17 | .20 |
| Net realized and unrealized gain (loss) | 2.58 | (1.22) | (.46) |
| Total from investment operations | 2.57 | (1.05) | (.26) |
| Distributions from net investment income | – | (.18) | (.26) |
| Distributions from net realized gain | (.41) | (.69) | (.49) |
| Total distributions | (.41) | (.87) | (.75) |
| Net asset value, end of period | $11.59 | $9.43 | $11.35 |
| Total ReturnC,D | 27.92% | (10.33)% | (1.33)% |
| Ratios to Average Net AssetsE,F | | | |
| Expenses before reductions | .64%G | .65%H | .64%G |
| Expenses net of fee waivers, if any | .64%G | .65%H | .64%G |
| Expenses net of all reductions | .64%G | .65%H | .64%G |
| Net investment income (loss) | (.16)%G | 1.54% | 3.71%G |
| Supplemental Data | | | |
| Net assets, end of period (000 omitted) | $24,154 | $16,800 | $1,376 |
| Portfolio turnover rateF | 23%G | 30% | 22% |
A For the period October 2, 2018 (commencement of sale of shares) to March 31, 2019.
B Calculated based on average shares outstanding during the period.
C Total returns for periods of less than one year are not annualized.
D Total returns would have been lower if certain expenses had not been reduced during the applicable periods shown.
E Expense ratios reflect operating expenses of the class. Expenses before reductions do not reflect amounts reimbursed, waived, or reduced through arrangements with the investment adviser, brokerage services, or other offset arrangements, if applicable, and do not represent the amount paid by the class during periods when reimbursements, waivers or reductions occur.
F Amount does not include the portfolio activity of any underlying mutual funds or exchange-traded funds (ETFs).
G Annualized
H On certain classes, the size and fluctuation of net assets and expense amounts may cause ratios to differ from contractual rates.
See accompanying notes which are an integral part of the financial statements.
Fidelity Advisor Freedom 2045 Fund Class Z6
| | Six months ended (Unaudited) September 30, | Years endedMarch 31, | | |
| | 2020 | 2020 | 2019 | 2018 A |
| Selected Per–Share Data | | | | |
| Net asset value, beginning of period | $9.48 | $11.39 | $12.28 | $11.65 |
| Income from Investment Operations | | | | |
| Net investment income (loss)B | –C | .19 | .22 | .15 |
| Net realized and unrealized gain (loss) | 2.59 | (1.23) | .12 | .92 |
| Total from investment operations | 2.59 | (1.04) | .34 | 1.07 |
| Distributions from net investment income | – | (.19) | (.24) | (.18) |
| Distributions from net realized gain | (.41) | (.69) | (.99) | (.26) |
| Total distributions | (.41) | (.87)D | (1.23) | (.44) |
| Net asset value, end of period | $11.66 | $9.48 | $11.39 | $12.28 |
| Total ReturnE,F | 27.98% | (10.22)% | 3.58% | 9.15% |
| Ratios to Average Net AssetsG,H | | | | |
| Expenses before reductions | .49%I | .49% | .50%J | .51%I,J |
| Expenses net of fee waivers, if any | .49%I | .49% | .50%J | .51%I,J |
| Expenses net of all reductions | .49%I | .49% | .50%J | .51%I,J |
| Net investment income (loss) | (.01)%I | 1.70% | 1.88% | 1.50%I |
| Supplemental Data | | | | |
| Net assets, end of period (000 omitted) | $70,924 | $44,798 | $31,493 | $9,112 |
| Portfolio turnover rateH | 23%I | 30% | 22% | 21% |
A For the period June 6, 2017 (commencement of sale of shares) to March 31, 2018.
B Calculated based on average shares outstanding during the period.
C Amount represents less than $.005 per share.
D Total distributions per share do not sum due to rounding.
E Total returns for periods of less than one year are not annualized.
F Total returns would have been lower if certain expenses had not been reduced during the applicable periods shown.
G Expense ratios reflect operating expenses of the class. Expenses before reductions do not reflect amounts reimbursed, waived, or reduced through arrangements with the investment adviser, brokerage services, or other offset arrangements, if applicable, and do not represent the amount paid by the class during periods when reimbursements, waivers or reductions occur.
H Amount does not include the portfolio activity of any underlying mutual funds or exchange-traded funds (ETFs).
I Annualized
J On certain classes, the size and fluctuation of net assets and expense amounts may cause ratios to differ from contractual rates.
See accompanying notes which are an integral part of the financial statements.
Fidelity Advisor Freedom® 2050 Fund
Investment Summary (Unaudited)
The information in the following tables is based on the direct investments of the Fund.
Top Holdings as of September 30, 2020
| | % of fund's net assets |
| Fidelity Series Emerging Markets Opportunities Fund | 13.9 |
| Fidelity Series Large Cap Stock Fund | 9.9 |
| Fidelity Series International Growth Fund | 7.0 |
| Fidelity Series Overseas Fund | 6.9 |
| Fidelity Series International Value Fund | 6.9 |
| Fidelity Series Value Discovery Fund | 6.4 |
| Fidelity Series Stock Selector Large Cap Value Fund | 6.3 |
| Fidelity Advisor Series Equity Growth Fund | 6.2 |
| Fidelity Series Opportunistic Insights Fund | 5.8 |
| Fidelity Advisor Series Growth Opportunities Fund | 4.3 |
| | 73.6 |
Asset Allocation (% of fund's net assets)
| Period end |
| | Domestic Equity Funds | 51.5% |
| | International Equity Funds | 40.8% |
| | Bond Funds | 6.0% |
| | Short-Term Funds | 1.6% |
| | Short-Term Investments | 0.1% |

Domestic Equity Funds category includes Fidelity Series Commodity Strategy Fund which invests in commodity-related investments.
Fidelity Advisor Freedom® 2050 Fund
Schedule of Investments September 30, 2020 (Unaudited)
Showing Percentage of Net Assets
| U.S. Treasury Obligations - 0.1% | | | |
| | | Principal Amount | Value |
| U.S. Treasury Bills, yield at date of purchase 0.11% to 0.11% 12/3/20 to 12/10/20 (a) | | | |
| (Cost $1,139,761) | | 1,140,000 | 1,139,785 |
| | | Shares | Value |
|
| Domestic Equity Funds - 51.5% | | | |
| Fidelity Advisor Series Equity Growth Fund (b) | | 4,339,074 | $78,927,765 |
| Fidelity Advisor Series Growth Opportunities Fund (b) | | 2,959,871 | 54,432,027 |
| Fidelity Advisor Series Small Cap Fund (b) | | 3,208,647 | 35,712,240 |
| Fidelity Series All-Sector Equity Fund (b) | | 3,189,670 | 33,969,988 |
| Fidelity Series Commodity Strategy Fund (b) | | 7,563,563 | 31,464,422 |
| Fidelity Series Large Cap Stock Fund (b) | | 8,813,072 | 124,793,105 |
| Fidelity Series Large Cap Value Index Fund (b) | | 1,162,829 | 13,488,816 |
| Fidelity Series Opportunistic Insights Fund (b) | | 3,387,210 | 73,265,342 |
| Fidelity Series Small Cap Opportunities Fund (b) | | 3,445,596 | 43,965,800 |
| Fidelity Series Stock Selector Large Cap Value Fund (b) | | 7,215,418 | 79,369,595 |
| Fidelity Series Value Discovery Fund (b) | | 6,566,857 | 81,166,355 |
| TOTAL DOMESTIC EQUITY FUNDS | | | |
| (Cost $542,397,397) | | | 650,555,455 |
|
| International Equity Funds - 40.8% | | | |
| Fidelity Series Canada Fund (b) | | 2,898,323 | 29,649,844 |
| Fidelity Series Emerging Markets Fund (b) | | 2,059,446 | 19,420,575 |
| Fidelity Series Emerging Markets Opportunities Fund (b) | | 8,388,616 | 175,993,159 |
| Fidelity Series International Growth Fund (b) | | 4,672,242 | 87,744,708 |
| Fidelity Series International Small Cap Fund (b) | | 1,526,051 | 27,163,705 |
| Fidelity Series International Value Fund (b) | | 10,068,265 | 86,788,443 |
| Fidelity Series Overseas Fund (b) | | 7,836,966 | 87,617,283 |
| TOTAL INTERNATIONAL EQUITY FUNDS | | | |
| (Cost $430,065,757) | | | 514,377,717 |
|
| Bond Funds - 6.0% | | | |
| Fidelity Series Emerging Markets Debt Fund (b) | | 783,425 | 7,097,831 |
| Fidelity Series Floating Rate High Income Fund (b) | | 155,101 | 1,372,640 |
| Fidelity Series High Income Fund (b) | | 936,955 | 8,545,033 |
| Fidelity Series Inflation-Protected Bond Index Fund (b) | | 2,346,199 | 25,104,329 |
| Fidelity Series International Credit Fund (b) | | 57,504 | 598,612 |
| Fidelity Series Long-Term Treasury Bond Index Fund (b) | | 2,776,952 | 28,685,916 |
| Fidelity Series Real Estate Income Fund (b) | | 497,552 | 4,965,566 |
| TOTAL BOND FUNDS | | | |
| (Cost $72,542,141) | | | 76,369,927 |
|
| Short-Term Funds - 1.6% | | | |
| Fidelity Cash Central Fund 0.10% (c) | | 3,018,765 | 3,019,369 |
| Fidelity Series Government Money Market Fund 0.16% (b)(d) | | 14,517,821 | 14,517,821 |
| Fidelity Series Short-Term Credit Fund (b) | | 214,228 | 2,195,835 |
| TOTAL SHORT-TERM FUNDS | | | |
| (Cost $19,666,167) | | | 19,733,025 |
| TOTAL INVESTMENT IN SECURITIES - 100.0% | | | |
| (Cost $1,065,811,223) | | | 1,262,175,909 |
| NET OTHER ASSETS (LIABILITIES) - 0.0% | | | (224,384) |
| NET ASSETS - 100% | | | $1,261,951,525 |
| Futures Contracts | | | | | |
| | Number of contracts | Expiration Date | Notional Amount | Value | Unrealized Appreciation/(Depreciation) |
| Purchased | | | | | |
| Equity Index Contracts | | | | | |
| ICE E-mini MSCI EAFE Index Contracts (United States) | 28 | Dec. 2020 | $2,594,480 | $(40,450) | $(40,450) |
| Sold | | | | | |
| Equity Index Contracts | | | | | |
| CME E-mini S&P 500 Index Contracts (United States) | 12 | Dec. 2020 | 2,011,200 | (13,130) | (13,130) |
| TOTAL FUTURES CONTRACTS | | | | | $(53,580) |
The notional amount of futures purchased as a percentage of Net Assets is 0.2%
The notional amount of futures sold as a percentage of Net Assets is 0.2%
Legend
(a) Security or a portion of the security was pledged to cover margin requirements for futures contracts. At period end, the value of securities pledged amounted to $1,139,785.
(b) Affiliated Fund
(c) Affiliated fund that is generally available only to investment companies and other accounts managed by Fidelity Investments. The rate quoted is the annualized seven-day yield of the fund at period end. A complete unaudited listing of the fund's holdings as of its most recent quarter end is available upon request. In addition, each Fidelity Central Fund's financial statements are available on the SEC's website or upon request.
(d) The rate quoted is the annualized seven-day yield of the fund at period end.
Affiliated Central Funds
Information regarding fiscal year to date income earned by the Fund from investments in Fidelity Central Funds is as follows:
| Fund | Income earned |
| Fidelity Cash Central Fund | $2,041 |
| Total | $2,041 |
Amounts in the income column in the above table include any capital gain distributions from underlying funds, which are presented in the corresponding line-item in the Statement of Operations, if applicable.
Affiliated Underlying Funds
Fiscal year to date information regarding the Fund's investments in affiliated Underlying Funds, excluding any Money Market Central Funds, is presented below. Exchanges between classes of the same affiliated Underlying Funds may occur.
| Affiliate | Value, beginning of period | Purchases | Sales Proceeds | Dividend Income | Realized Gain (loss) | Change in Unrealized appreciation (depreciation) | Value, end of period |
| Fidelity Advisor Series Equity Growth Fund | $61,058,917 | $6,024,962 | $16,809,737 | $-- | $3,195,667 | $25,457,956 | $78,927,765 |
| Fidelity Advisor Series Growth Opportunities Fund | 39,418,229 | 3,947,202 | 14,789,841 | -- | 3,548,749 | 22,307,688 | 54,432,027 |
| Fidelity Advisor Series Small Cap Fund | 25,945,611 | 3,008,390 | 1,942,251 | -- | 79,653 | 8,620,837 | 35,712,240 |
| Fidelity Series All-Sector Equity Fund | 26,774,286 | 1,891,094 | 4,241,748 | -- | 66,475 | 9,479,881 | 33,969,988 |
| Fidelity Series Canada Fund | 19,809,649 | 5,419,225 | 789,541 | -- | (62,881) | 5,273,392 | 29,649,844 |
| Fidelity Series Commodity Strategy Fund | 33,420,668 | 2,130,624 | 8,039,008 | 135,451 | (2,349,136) | 6,301,274 | 31,464,422 |
| Fidelity Series Emerging Markets Debt Fund | 6,301,127 | 435,507 | 437,927 | 187,605 | 11,169 | 787,955 | 7,097,831 |
| Fidelity Series Emerging Markets Fund | 11,780,841 | 4,265,196 | 1,168,889 | -- | 15,541 | 4,527,886 | 19,420,575 |
| Fidelity Series Emerging Markets Opportunities Fund | 110,296,509 | 30,796,348 | 8,461,133 | -- | 531,674 | 42,829,761 | 175,993,159 |
| Fidelity Series Floating Rate High Income Fund | 1,258,928 | 90,872 | 105,950 | 30,896 | (5,359) | 134,149 | 1,372,640 |
| Fidelity Series Government Money Market Fund 0.16% | 30,012,201 | 12,353,098 | 27,847,478 | 23,635 | -- | -- | 14,517,821 |
| Fidelity Series High Income Fund | 7,703,311 | 533,812 | 529,750 | 233,930 | (1,056) | 838,716 | 8,545,033 |
| Fidelity Series Inflation-Protected Bond Index Fund | 21,431,412 | 5,423,265 | 3,104,891 | 18,437 | 14,279 | 1,340,264 | 25,104,329 |
| Fidelity Series International Credit Fund | 541,583 | 8,418 | -- | 8,417 | -- | 48,611 | 598,612 |
| Fidelity Series International Growth Fund | 83,827,283 | 2,753,014 | 21,566,337 | -- | 4,159,811 | 18,570,937 | 87,744,708 |
| Fidelity Series International Small Cap Fund | 20,028,601 | 1,413,504 | 1,055,845 | -- | 62,512 | 6,714,933 | 27,163,705 |
| Fidelity Series International Value Fund | 74,915,069 | 3,977,000 | 7,740,807 | -- | (909,131) | 16,546,312 | 86,788,443 |
| Fidelity Series Large Cap Stock Fund | 99,130,398 | 15,610,587 | 7,935,153 | 4,222,332 | (69,543) | 18,056,816 | 124,793,105 |
| Fidelity Series Large Cap Value Index Fund | 10,314,647 | 1,684,602 | 739,821 | -- | (10,754) | 2,240,142 | 13,488,816 |
| Fidelity Series Long-Term Treasury Bond Index Fund | 24,463,695 | 8,280,862 | 3,242,618 | 673,254 | 227,073 | (1,043,096) | 28,685,916 |
| Fidelity Series Opportunistic Insights Fund | 57,733,234 | 6,616,772 | 14,975,132 | -- | 1,702,445 | 22,188,023 | 73,265,342 |
| Fidelity Series Overseas Fund | 69,834,679 | 6,539,983 | 10,003,254 | -- | (215,718) | 21,461,593 | 87,617,283 |
| Fidelity Series Real Estate Income Fund | 4,163,039 | 347,875 | 331,979 | 159,948 | (29,729) | 816,360 | 4,965,566 |
| Fidelity Series Short-Term Credit Fund | 2,033,962 | 86,134 | 2,556 | 23,858 | (11) | 78,306 | 2,195,835 |
| Fidelity Series Small Cap Opportunities Fund | 32,800,494 | 4,894,719 | 2,432,573 | 256,903 | (24,003) | 8,727,163 | 43,965,800 |
| Fidelity Series Stock Selector Large Cap Value Fund | 61,188,399 | 8,253,464 | 4,366,792 | -- | (279,355) | 14,573,879 | 79,369,595 |
| Fidelity Series Value Discovery Fund | 63,247,581 | 7,351,731 | 5,329,967 | -- | 25,590 | 15,871,420 | 81,166,355 |
| | $999,434,353 | $144,138,260 | $167,990,978 | $5,974,666 | $9,683,962 | $272,751,158 | $1,258,016,755 |
Amounts in the income column in the above table include any capital gain distributions from underlying funds, which are presented in the corresponding line-item in the Statement of Operations, if applicable.
Investment Valuation
The following is a summary of the inputs used, as of September 30, 2020, involving the Fund's assets and liabilities carried at fair value. The inputs or methodology used for valuing securities may not be an indication of the risk associated with investing in those securities. For more information on valuation inputs, and their aggregation into the levels used below, please refer to the Investment Valuation section in the accompanying Notes to Financial Statements.
| | Valuation Inputs at Reporting Date: |
| Description | Total | Level 1 | Level 2 | Level 3 |
| Investments in Securities: | | | | |
| Other Short-Term Investments and Net Other Assets | $1,139,785 | $-- | $1,139,785 | $-- |
| Domestic Equity Funds | 650,555,455 | 650,555,455 | -- | -- |
| International Equity Funds | 514,377,717 | 514,377,717 | -- | -- |
| Bond Funds | 76,369,927 | 76,369,927 | -- | -- |
| Short-Term Funds | 19,733,025 | 19,733,025 | -- | -- |
| Total Investments in Securities: | $1,262,175,909 | $1,261,036,124 | $1,139,785 | $-- |
| Derivative Instruments: | | | | |
| Liabilities | | | | |
| Futures Contracts | $(53,580) | $(53,580) | $-- | $-- |
| Total Liabilities | $(53,580) | $(53,580) | $-- | $-- |
| Total Derivative Instruments: | $(53,580) | $(53,580) | $-- | $-- |
Value of Derivative Instruments
The following table is a summary of the Fund's value of derivative instruments by primary risk exposure as of September 30, 2020. For additional information on derivative instruments, please refer to the Derivative Instruments section in the accompanying Notes to Financial Statements.
| Primary Risk Exposure / Derivative Type | Value |
| | Asset | Liability |
| Equity Risk | | |
| Futures Contracts(a) | $0 | $(53,580) |
| Total Equity Risk | 0 | (53,580) |
| Total Value of Derivatives | $0 | $(53,580) |
(a) Reflects gross cumulative appreciation (depreciation) on futures contracts as presented in the Schedule of Investments. In the Statement of Assets and Liabilities, the period end daily variation margin is included in receivable or payable for daily variation margin on futures contracts, and the net cumulative appreciation (depreciation) is included in Total accumulated earnings (loss).
See accompanying notes which are an integral part of the financial statements.
Fidelity Advisor Freedom® 2050 Fund
Financial Statements
Statement of Assets and Liabilities
| | | September 30, 2020 (Unaudited) |
| Assets | | |
Investment in securities, at value — See accompanying schedule:
Unaffiliated issuers (cost $1,139,762) | $1,139,785 | |
| Fidelity Central Funds (cost $3,019,368) | 3,019,369 | |
| Other affiliated issuers (cost $1,061,652,093) | 1,258,016,755 | |
| Total Investment in Securities (cost $1,065,811,223) | | $1,262,175,909 |
| Cash | | 34,930 |
| Receivable for investments sold | | 19,028,492 |
| Receivable for fund shares sold | | 1,266,931 |
| Distributions receivable from Fidelity Central Funds | | 280 |
| Total assets | | 1,282,506,542 |
| Liabilities | | |
| Payable for investments purchased | $16,534,024 | |
| Payable for fund shares redeemed | 3,020,907 | |
| Accrued management fee | 777,108 | |
| Distribution and service plan fees payable | 189,865 | |
| Payable for daily variation margin on futures contracts | 33,113 | |
| Total liabilities | | 20,555,017 |
| Net Assets | | $1,261,951,525 |
| Net Assets consist of: | | |
| Paid in capital | | $1,063,490,990 |
| Total accumulated earnings (loss) | | 198,460,535 |
| Net Assets | | $1,261,951,525 |
| Net Asset Value and Maximum Offering Price | | |
| Class A: | | |
| Net Asset Value and redemption price per share ($450,351,308 ÷ 38,983,963 shares)(a) | | $11.55 |
| Maximum offering price per share (100/94.25 of $11.55) | | $12.25 |
| Class M: | | |
| Net Asset Value and redemption price per share ($172,327,016 ÷ 15,043,971 shares)(a) | | $11.45 |
| Maximum offering price per share (100/96.50 of $11.45) | | $11.87 |
| Class C: | | |
| Net Asset Value and offering price per share ($27,649,939 ÷ 2,459,104 shares)(a) | | $11.24 |
| Class I: | | |
| Net Asset Value, offering price and redemption price per share ($538,264,245 ÷ 46,175,972 shares) | | $11.66 |
| Class Z: | | |
| Net Asset Value, offering price and redemption price per share ($16,965,442 ÷ 1,464,909 shares) | | $11.58 |
| Class Z6: | | |
| Net Asset Value, offering price and redemption price per share ($56,393,575 ÷ 4,842,429 shares) | | $11.65 |
(a) Redemption price per share is equal to net asset value less any applicable contingent deferred sales charge.
See accompanying notes which are an integral part of the financial statements.
Statement of Operations
| | | Six months ended September 30, 2020 (Unaudited) |
| Investment Income | | |
| Dividends: | | |
| Affiliated issuers | | $2,928,679 |
| Interest | | 2,213 |
| Income from Fidelity Central Funds | | 2,041 |
| Total income | | 2,932,933 |
| Expenses | | |
| Management fee | $4,413,784 | |
| Distribution and service plan fees | 1,075,390 | |
| Independent trustees' fees and expenses | 1,606 | |
| Total expenses before reductions | 5,490,780 | |
| Expense reductions | (194) | |
| Total expenses after reductions | | 5,490,586 |
| Net investment income (loss) | | (2,557,653) |
| Realized and Unrealized Gain (Loss) | | |
| Net realized gain (loss) on: | | |
| Investment securities: | | |
| Unaffiliated issuers | 90,316 | |
| Fidelity Central Funds | (297) | |
| Other affiliated issuers | 9,683,962 | |
| Futures contracts | (630,909) | |
| Capital gain distributions from underlying funds: | | |
| Affiliated issuers | 3,045,987 | |
| Total net realized gain (loss) | | 12,189,059 |
| Change in net unrealized appreciation (depreciation) on: | | |
| Investment securities: | | |
| Unaffiliated issuers | (1,205) | |
| Fidelity Central Funds | (136) | |
| Other affiliated issuers | 272,751,158 | |
| Futures contracts | (163,261) | |
| Total change in net unrealized appreciation (depreciation) | | 272,586,556 |
| Net gain (loss) | | 284,775,615 |
| Net increase (decrease) in net assets resulting from operations | | $282,217,962 |
See accompanying notes which are an integral part of the financial statements.
Statement of Changes in Net Assets
| | Six months ended September 30, 2020 (Unaudited) | Year ended March 31, 2020 |
| Increase (Decrease) in Net Assets | | |
| Operations | | |
| Net investment income (loss) | $(2,557,653) | $15,055,161 |
| Net realized gain (loss) | 12,189,059 | 58,144,227 |
| Change in net unrealized appreciation (depreciation) | 272,586,556 | (189,911,558) |
| Net increase (decrease) in net assets resulting from operations | 282,217,962 | (116,712,170) |
| Distributions to shareholders | (44,639,739) | (82,439,055) |
| Share transactions - net increase (decrease) | 19,440,745 | 76,677,887 |
| Total increase (decrease) in net assets | 257,018,968 | (122,473,338) |
| Net Assets | | |
| Beginning of period | 1,004,932,557 | 1,127,405,895 |
| End of period | $1,261,951,525 | $1,004,932,557 |
See accompanying notes which are an integral part of the financial statements.
Financial Highlights
Fidelity Advisor Freedom 2050 Fund Class A
| | Six months ended (Unaudited) September 30, | Years endedMarch 31, | | | | |
| | 2020 | 2020 | 2019 | 2018 | 2017 | 2016 |
| Selected Per–Share Data | | | | | | |
| Net asset value, beginning of period | $9.43 | $11.31 | $12.17 | $11.20 | $10.16 | $11.06 |
| Income from Investment Operations | | | | | | |
| Net investment income (loss)A | (.03) | .13 | .16 | .09 | .13 | .13 |
| Net realized and unrealized gain (loss) | 2.57 | (1.21) | .13 | 1.40 | 1.39 | (.53) |
| Total from investment operations | 2.54 | (1.08) | .29 | 1.49 | 1.52 | (.40) |
| Distributions from net investment income | – | (.14) | (.18) | (.12) | (.13) | (.14) |
| Distributions from net realized gain | (.42) | (.66) | (.97) | (.40) | (.34) | (.36) |
| Total distributions | (.42) | (.80) | (1.15) | (.52) | (.48)B | (.50) |
| Net asset value, end of period | $11.55 | $9.43 | $11.31 | $12.17 | $11.20 | $10.16 |
| Total ReturnC,D,E | 27.57% | (10.58)% | 3.08% | 13.42% | 15.52% | (3.84)% |
| Ratios to Average Net AssetsF,G | | | | | | |
| Expenses before reductions | 1.00%H | 1.00% | .99%I | .88% | .25% | .25% |
| Expenses net of fee waivers, if any | 1.00%H | 1.00% | .99%I | .88% | .25% | .25% |
| Expenses net of all reductions | 1.00%H | 1.00% | .99%I | .88% | .25% | .25% |
| Net investment income (loss) | (.51)%H | 1.20% | 1.38% | .79% | 1.22% | 1.28% |
| Supplemental Data | | | | | | |
| Net assets, end of period (000 omitted) | $450,351 | $358,407 | $417,583 | $418,313 | $396,373 | $363,199 |
| Portfolio turnover rateG | 24%H | 32% | 23% | 20% | 25% | 24% |
A Calculated based on average shares outstanding during the period.
B Total distributions per share do not sum due to rounding.
C Total returns for periods of less than one year are not annualized.
D Total returns would have been lower if certain expenses had not been reduced during the applicable periods shown.
E Total returns do not include the effect of the sales charges.
F Expense ratios reflect operating expenses of the class. Expenses before reductions do not reflect amounts reimbursed, waived, or reduced through arrangements with the investment adviser, brokerage services, or other offset arrangements, if applicable, and do not represent the amount paid by the class during periods when reimbursements, waivers or reductions occur.
G Amount does not include the portfolio activity of any underlying mutual funds or exchange-traded funds (ETFs).
H Annualized
I On certain classes, the size and fluctuation of net assets and expense amounts may cause ratios to differ from contractual rates.
See accompanying notes which are an integral part of the financial statements.
Fidelity Advisor Freedom 2050 Fund Class M
| | Six months ended (Unaudited) September 30, | Years endedMarch 31, | | | | |
| | 2020 | 2020 | 2019 | 2018 | 2017 | 2016 |
| Selected Per–Share Data | | | | | | |
| Net asset value, beginning of period | $9.36 | $11.24 | $12.11 | $11.15 | $10.12 | $11.02 |
| Income from Investment Operations | | | | | | |
| Net investment income (loss)A | (.04) | .11 | .13 | .06 | .10 | .11 |
| Net realized and unrealized gain (loss) | 2.55 | (1.22) | .13 | 1.39 | 1.38 | (.54) |
| Total from investment operations | 2.51 | (1.11) | .26 | 1.45 | 1.48 | (.43) |
| Distributions from net investment income | – | (.11) | (.16) | (.10) | (.11) | (.12) |
| Distributions from net realized gain | (.42) | (.65) | (.97) | (.40) | (.34) | (.36) |
| Total distributions | (.42) | (.77)B | (1.13) | (.49)B | (.45) | (.47)B |
| Net asset value, end of period | $11.45 | $9.36 | $11.24 | $12.11 | $11.15 | $10.12 |
| Total ReturnC,D,E | 27.45% | (10.88)% | 2.83% | 13.16% | 15.22% | (4.08)% |
| Ratios to Average Net AssetsF,G | | | | | | |
| Expenses before reductions | 1.25%H | 1.25% | 1.25% | 1.13% | .50% | .50% |
| Expenses net of fee waivers, if any | 1.25%H | 1.25% | 1.25% | 1.13% | .50% | .50% |
| Expenses net of all reductions | 1.24%H | 1.25% | 1.25% | 1.13% | .50% | .50% |
| Net investment income (loss) | (.76)%H | .95% | 1.13% | .54% | .97% | 1.04% |
| Supplemental Data | | | | | | |
| Net assets, end of period (000 omitted) | $172,327 | $143,526 | $172,974 | $166,634 | $147,601 | $127,842 |
| Portfolio turnover rateG | 24%H | 32% | 23% | 20% | 25% | 24% |
A Calculated based on average shares outstanding during the period.
B Total distributions per share do not sum due to rounding.
C Total returns for periods of less than one year are not annualized.
D Total returns would have been lower if certain expenses had not been reduced during the applicable periods shown.
E Total returns do not include the effect of the sales charges.
F Expense ratios reflect operating expenses of the class. Expenses before reductions do not reflect amounts reimbursed, waived, or reduced through arrangements with the investment adviser, brokerage services, or other offset arrangements, if applicable, and do not represent the amount paid by the class during periods when reimbursements, waivers or reductions occur.
G Amount does not include the portfolio activity of any underlying mutual funds or exchange-traded funds (ETFs).
H Annualized
See accompanying notes which are an integral part of the financial statements.
Fidelity Advisor Freedom 2050 Fund Class C
| | Six months ended (Unaudited) September 30, | Years endedMarch 31, | | | | |
| | 2020 | 2020 | 2019 | 2018 | 2017 | 2016 |
| Selected Per–Share Data | | | | | | |
| Net asset value, beginning of period | $9.22 | $11.10 | $11.98 | $11.05 | $10.04 | $10.95 |
| Income from Investment Operations | | | | | | |
| Net investment income (loss)A | (.07) | .05 | .07 | –B | .05 | .06 |
| Net realized and unrealized gain (loss) | 2.51 | (1.20) | .14 | 1.38 | 1.37 | (.55) |
| Total from investment operations | 2.44 | (1.15) | .21 | 1.38 | 1.42 | (.49) |
| Distributions from net investment income | – | (.07) | (.11) | (.06) | (.08) | (.08) |
| Distributions from net realized gain | (.42) | (.65) | (.97) | (.39) | (.34) | (.34) |
| Total distributions | (.42) | (.73)C | (1.09)C | (.45) | (.41)C | (.42) |
| Net asset value, end of period | $11.24 | $9.22 | $11.10 | $11.98 | $11.05 | $10.04 |
| Total ReturnD,E,F | 27.10% | (11.32)% | 2.34% | 12.59% | 14.73% | (4.67)% |
| Ratios to Average Net AssetsG,H | | | | | | |
| Expenses before reductions | 1.74%I,J | 1.75% | 1.74%J | 1.63% | 1.00% | 1.00% |
| Expenses net of fee waivers, if any | 1.74%I,J | 1.75% | 1.74%J | 1.63% | 1.00% | 1.00% |
| Expenses net of all reductions | 1.74%I,J | 1.75% | 1.74%J | 1.63% | 1.00% | 1.00% |
| Net investment income (loss) | (1.26)%I | .45% | .63% | .04% | .47% | .54% |
| Supplemental Data | | | | | | |
| Net assets, end of period (000 omitted) | $27,650 | $21,457 | $26,139 | $32,763 | $28,268 | $24,460 |
| Portfolio turnover rateH | 24%I | 32% | 23% | 20% | 25% | 24% |
A Calculated based on average shares outstanding during the period.
B Amount represents less than $.005 per share.
C Total distributions per share do not sum due to rounding.
D Total returns for periods of less than one year are not annualized.
E Total returns would have been lower if certain expenses had not been reduced during the applicable periods shown.
F Total returns do not include the effect of the contingent deferred sales charge.
G Expense ratios reflect operating expenses of the class. Expenses before reductions do not reflect amounts reimbursed, waived, or reduced through arrangements with the investment adviser, brokerage services, or other offset arrangements, if applicable, and do not represent the amount paid by the class during periods when reimbursements, waivers or reductions occur.
H Amount does not include the portfolio activity of any underlying mutual funds or exchange-traded funds (ETFs).
I Annualized
J On certain classes, the size and fluctuation of net assets and expense amounts may cause ratios to differ from contractual rates.
See accompanying notes which are an integral part of the financial statements.
Fidelity Advisor Freedom 2050 Fund Class I
| | Six months ended (Unaudited) September 30, | Years endedMarch 31, | | | | |
| | 2020 | 2020 | 2019 | 2018 | 2017 | 2016 |
| Selected Per–Share Data | | | | | | |
| Net asset value, beginning of period | $9.50 | $11.39 | $12.25 | $11.27 | $10.22 | $11.13 |
| Income from Investment Operations | | | | | | |
| Net investment income (loss)A | (.01) | .16 | .19 | .12 | .16 | .16 |
| Net realized and unrealized gain (loss) | 2.59 | (1.22) | .12 | 1.41 | 1.39 | (.55) |
| Total from investment operations | 2.58 | (1.06) | .31 | 1.53 | 1.55 | (.39) |
| Distributions from net investment income | – | (.16) | (.20) | (.14) | (.15) | (.16) |
| Distributions from net realized gain | (.42) | (.67) | (.97) | (.41) | (.35) | (.36) |
| Total distributions | (.42) | (.83) | (1.17) | (.55) | (.50) | (.52) |
| Net asset value, end of period | $11.66 | $9.50 | $11.39 | $12.25 | $11.27 | $10.22 |
| Total ReturnB,C | 27.80% | (10.37)% | 3.30% | 13.74% | 15.81% | (3.65)% |
| Ratios to Average Net AssetsD,E | | | | | | |
| Expenses before reductions | .75%F | .75% | .75% | .64% | - %G | - %G |
| Expenses net of fee waivers, if any | .75%F | .75% | .75% | .64% | -% | -% |
| Expenses net of all reductions | .75%F | .75% | .75% | .64% | -% | -% |
| Net investment income (loss) | (.26)%F | 1.45% | 1.63% | 1.03% | 1.47% | 1.53% |
| Supplemental Data | | | | | | |
| Net assets, end of period (000 omitted) | $538,264 | $436,294 | $488,167 | $466,677 | $357,398 | $320,449 |
| Portfolio turnover rateE | 24%F | 32% | 23% | 20% | 25% | 24% |
A Calculated based on average shares outstanding during the period.
B Total returns for periods of less than one year are not annualized.
C Total returns would have been lower if certain expenses had not been reduced during the applicable periods shown.
D Expense ratios reflect operating expenses of the class. Expenses before reductions do not reflect amounts reimbursed, waived, or reduced through arrangements with the investment adviser, brokerage services, or other offset arrangements, if applicable, and do not represent the amount paid by the class during periods when reimbursements, waivers or reductions occur.
E Amount does not include the portfolio activity of any underlying mutual funds or exchange-traded funds (ETFs).
F Annualized
G Amount represents less than .005%.
See accompanying notes which are an integral part of the financial statements.
Fidelity Advisor Freedom 2050 Fund Class Z
| | Six months ended (Unaudited) September 30, | Years endedMarch 31, | |
| | 2020 | 2020 | 2019 A |
| Selected Per–Share Data | | | |
| Net asset value, beginning of period | $9.43 | $11.34 | $12.34 |
| Income from Investment Operations | | | |
| Net investment income (loss)B | (.01) | .17 | .28 |
| Net realized and unrealized gain (loss) | 2.58 | (1.22) | (.54) |
| Total from investment operations | 2.57 | (1.05) | (.26) |
| Distributions from net investment income | – | (.18) | (.25) |
| Distributions from net realized gain | (.42) | (.68) | (.49) |
| Total distributions | (.42) | (.86) | (.74) |
| Net asset value, end of period | $11.58 | $9.43 | $11.34 |
| Total ReturnC,D | 27.90% | (10.33)% | (1.34)% |
| Ratios to Average Net AssetsE,F | | | |
| Expenses before reductions | .64%G | .65%H | .65%G,H |
| Expenses net of fee waivers, if any | .64%G | .65%H | .65%G,H |
| Expenses net of all reductions | .64%G | .65%H | .65%G,H |
| Net investment income (loss) | (.15)%G | 1.55% | 5.18%G |
| Supplemental Data | | | |
| Net assets, end of period (000 omitted) | $16,965 | $11,414 | $650 |
| Portfolio turnover rateF | 24%G | 32% | 23% |
A For the period October 2, 2018 (commencement of sale of shares) to March 31, 2019.
B Calculated based on average shares outstanding during the period.
C Total returns for periods of less than one year are not annualized.
D Total returns would have been lower if certain expenses had not been reduced during the applicable periods shown.
E Expense ratios reflect operating expenses of the class. Expenses before reductions do not reflect amounts reimbursed, waived, or reduced through arrangements with the investment adviser, brokerage services, or other offset arrangements, if applicable, and do not represent the amount paid by the class during periods when reimbursements, waivers or reductions occur.
F Amount does not include the portfolio activity of any underlying mutual funds or exchange-traded funds (ETFs).
G Annualized
H On certain classes, the size and fluctuation of net assets and expense amounts may cause ratios to differ from contractual rates.
See accompanying notes which are an integral part of the financial statements.
Fidelity Advisor Freedom 2050 Fund Class Z6
| | Six months ended (Unaudited) September 30, | Years endedMarch 31, | | |
| | 2020 | 2020 | 2019 | 2018 A |
| Selected Per–Share Data | | | | |
| Net asset value, beginning of period | $9.48 | $11.37 | $12.24 | $11.59 |
| Income from Investment Operations | | | | |
| Net investment income (loss)B | –C | .19 | .22 | .23 |
| Net realized and unrealized gain (loss) | 2.59 | (1.22) | .12 | .83 |
| Total from investment operations | 2.59 | (1.03) | .34 | 1.06 |
| Distributions from net investment income | – | (.18) | (.24) | (.17) |
| Distributions from net realized gain | (.42) | (.68) | (.97) | (.24) |
| Total distributions | (.42) | (.86) | (1.21) | (.41) |
| Net asset value, end of period | $11.65 | $9.48 | $11.37 | $12.24 |
| Total ReturnD,E | 27.97% | (10.14)% | 3.55% | 9.15% |
| Ratios to Average Net AssetsF,G | | | | |
| Expenses before reductions | .49%H | .49% | .50%I | .51%H,I |
| Expenses net of fee waivers, if any | .49%H | .49% | .50%I | .51%H,I |
| Expenses net of all reductions | .49%H | .49% | .50%I | .51%H,I |
| Net investment income (loss) | - %H,J | 1.70% | 1.88% | 2.27%H |
| Supplemental Data | | | | |
| Net assets, end of period (000 omitted) | $56,394 | $33,835 | $21,893 | $5,410 |
| Portfolio turnover rateG | 24%H | 32% | 23% | 20% |
A For the period June 6, 2017 (commencement of sale of shares) to March 31, 2018.
B Calculated based on average shares outstanding during the period.
C Amount represents less than $.005 per share.
D Total returns for periods of less than one year are not annualized.
E Total returns would have been lower if certain expenses had not been reduced during the applicable periods shown.
F Expense ratios reflect operating expenses of the class. Expenses before reductions do not reflect amounts reimbursed, waived, or reduced through arrangements with the investment adviser, brokerage services, or other offset arrangements, if applicable, and do not represent the amount paid by the class during periods when reimbursements, waivers or reductions occur.
G Amount does not include the portfolio activity of any underlying mutual funds or exchange-traded funds (ETFs).
H Annualized
I On certain classes, the size and fluctuation of net assets and expense amounts may cause ratios to differ from contractual rates.
J Amount represents less than .005%.
See accompanying notes which are an integral part of the financial statements.
Fidelity Advisor Freedom® 2055 Fund
Investment Summary (Unaudited)
The information in the following tables is based on the direct investments of the Fund.
Top Holdings as of September 30, 2020
| | % of fund's net assets |
| Fidelity Series Emerging Markets Opportunities Fund | 14.0 |
| Fidelity Series Large Cap Stock Fund | 9.9 |
| Fidelity Series International Growth Fund | 7.0 |
| Fidelity Series Overseas Fund | 6.9 |
| Fidelity Series International Value Fund | 6.9 |
| Fidelity Series Value Discovery Fund | 6.4 |
| Fidelity Series Stock Selector Large Cap Value Fund | 6.3 |
| Fidelity Advisor Series Equity Growth Fund | 6.2 |
| Fidelity Series Opportunistic Insights Fund | 5.8 |
| Fidelity Advisor Series Growth Opportunities Fund | 4.3 |
| | 73.7 |
Asset Allocation (% of fund's net assets)
| Period end |
| | Domestic Equity Funds | 51.5% |
| | International Equity Funds | 40.8% |
| | Bond Funds | 6.0% |
| | Short-Term Funds | 1.6% |
| | Short-Term Investments | 0.1% |

Domestic Equity Funds category includes Fidelity Series Commodity Strategy Fund which invests in commodity-related investments.
Fidelity Advisor Freedom® 2055 Fund
Schedule of Investments September 30, 2020 (Unaudited)
Showing Percentage of Net Assets
| U.S. Treasury Obligations - 0.1% | | | |
| | | Principal Amount | Value |
| U.S. Treasury Bills, yield at date of purchase 0.11% to 0.11% 12/3/20 to 12/10/20 (a) | | | |
| (Cost $619,869) | | 620,000 | 619,882 |
| | | Shares | Value |
|
| Domestic Equity Funds - 51.5% | | | |
| Fidelity Advisor Series Equity Growth Fund (b) | | 2,611,699 | $47,506,798 |
| Fidelity Advisor Series Growth Opportunities Fund (b) | | 1,781,553 | 32,762,768 |
| Fidelity Advisor Series Small Cap Fund (b) | | 1,931,296 | 21,495,323 |
| Fidelity Series All-Sector Equity Fund (b) | | 1,919,863 | 20,446,545 |
| Fidelity Series Commodity Strategy Fund (b) | | 4,565,967 | 18,994,421 |
| Fidelity Series Large Cap Stock Fund (b) | | 5,304,639 | 75,113,684 |
| Fidelity Series Large Cap Value Index Fund (b) | | 699,911 | 8,118,966 |
| Fidelity Series Opportunistic Insights Fund (b) | | 2,038,745 | 44,098,044 |
| Fidelity Series Small Cap Opportunities Fund (b) | | 2,073,924 | 26,463,276 |
| Fidelity Series Stock Selector Large Cap Value Fund (b) | | 4,342,978 | 47,772,758 |
| Fidelity Series Value Discovery Fund (b) | | 3,952,608 | 48,854,236 |
| TOTAL DOMESTIC EQUITY FUNDS | | | |
| (Cost $353,065,203) | | | 391,626,819 |
|
| International Equity Funds - 40.8% | | | |
| Fidelity Series Canada Fund (b) | | 1,744,258 | 17,843,758 |
| Fidelity Series Emerging Markets Fund (b) | | 1,242,552 | 11,717,263 |
| Fidelity Series Emerging Markets Opportunities Fund (b) | | 5,050,439 | 105,958,202 |
| Fidelity Series International Growth Fund (b) | | 2,812,243 | 52,813,929 |
| Fidelity Series International Small Cap Fund (b) | | 918,261 | 16,345,040 |
| Fidelity Series International Value Fund (b) | | 6,061,038 | 52,246,151 |
| Fidelity Series Overseas Fund (b) | | 4,717,109 | 52,737,276 |
| TOTAL INTERNATIONAL EQUITY FUNDS | | | |
| (Cost $272,415,219) | | | 309,661,619 |
|
| Bond Funds - 6.0% | | | |
| Fidelity Series Emerging Markets Debt Fund (b) | | 473,438 | 4,289,349 |
| Fidelity Series Floating Rate High Income Fund (b) | | 95,355 | 843,889 |
| Fidelity Series High Income Fund (b) | | 565,180 | 5,154,441 |
| Fidelity Series Inflation-Protected Bond Index Fund (b) | | 1,412,189 | 15,110,421 |
| Fidelity Series International Credit Fund (b) | | 26,263 | 273,401 |
| Fidelity Series Long-Term Treasury Bond Index Fund (b) | | 1,671,463 | 17,266,210 |
| Fidelity Series Real Estate Income Fund (b) | | 301,611 | 3,010,073 |
| TOTAL BOND FUNDS | | | |
| (Cost $43,522,544) | | | 45,947,784 |
|
| Short-Term Funds - 1.6% | | | |
| Fidelity Cash Central Fund 0.10% (c) | | 1,725,835 | 1,726,180 |
| Fidelity Series Government Money Market Fund 0.16% (b)(d) | | 8,788,988 | 8,788,988 |
| Fidelity Series Short-Term Credit Fund (b) | | 129,496 | 1,327,330 |
| TOTAL SHORT-TERM FUNDS | | | |
| (Cost $11,799,985) | | | 11,842,498 |
| TOTAL INVESTMENT IN SECURITIES - 100.0% | | | |
| (Cost $681,422,820) | | | 759,698,602 |
| NET OTHER ASSETS (LIABILITIES) - 0.0% | | | (121,634) |
| NET ASSETS - 100% | | | $759,576,968 |
| Futures Contracts | | | | | |
| | Number of contracts | Expiration Date | Notional Amount | Value | Unrealized Appreciation/(Depreciation) |
| Purchased | | | | | |
| Equity Index Contracts | | | | | |
| ICE E-mini MSCI EAFE Index Contracts (United States) | 16 | Dec. 2020 | $1,482,560 | $(11,137) | $(11,137) |
| Sold | | | | | |
| Equity Index Contracts | | | | | |
| CME E-mini S&P 500 Index Contracts (United States) | 7 | Dec. 2020 | 1,173,200 | (7,659) | (7,659) |
| TOTAL FUTURES CONTRACTS | | | | | $(18,796) |
The notional amount of futures purchased as a percentage of Net Assets is 0.2%
The notional amount of futures sold as a percentage of Net Assets is 0.2%
Legend
(a) Security or a portion of the security was pledged to cover margin requirements for futures contracts. At period end, the value of securities pledged amounted to $619,882.
(b) Affiliated Fund
(c) Affiliated fund that is generally available only to investment companies and other accounts managed by Fidelity Investments. The rate quoted is the annualized seven-day yield of the fund at period end. A complete unaudited listing of the fund's holdings as of its most recent quarter end is available upon request. In addition, each Fidelity Central Fund's financial statements are available on the SEC's website or upon request.
(d) The rate quoted is the annualized seven-day yield of the fund at period end.
Affiliated Central Funds
Information regarding fiscal year to date income earned by the Fund from investments in Fidelity Central Funds is as follows:
| Fund | Income earned |
| Fidelity Cash Central Fund | $1,146 |
| Total | $1,146 |
Amounts in the income column in the above table include any capital gain distributions from underlying funds, which are presented in the corresponding line-item in the Statement of Operations, if applicable.
Affiliated Underlying Funds
Fiscal year to date information regarding the Fund's investments in affiliated Underlying Funds, excluding any Money Market Central Funds, is presented below. Exchanges between classes of the same affiliated Underlying Funds may occur.
| Affiliate | Value, beginning of period | Purchases | Sales Proceeds | Dividend Income | Realized Gain (loss) | Change in Unrealized appreciation (depreciation) | Value, end of period |
| Fidelity Advisor Series Equity Growth Fund | $35,430,218 | $4,613,869 | $9,347,953 | $-- | $1,215,126 | $15,595,538 | $47,506,798 |
| Fidelity Advisor Series Growth Opportunities Fund | 22,869,943 | 3,056,935 | 8,343,936 | -- | 1,802,136 | 13,377,690 | 32,762,768 |
| Fidelity Advisor Series Small Cap Fund | 15,070,858 | 2,301,862 | 973,734 | -- | 40,487 | 5,055,850 | 21,495,323 |
| Fidelity Series All-Sector Equity Fund | 15,543,866 | 1,584,649 | 2,281,530 | -- | (321,438) | 5,920,998 | 20,446,545 |
| Fidelity Series Canada Fund | 11,495,621 | 3,674,009 | 380,497 | -- | (36,611) | 3,091,236 | 17,843,758 |
| Fidelity Series Commodity Strategy Fund | 19,435,487 | 1,814,181 | 4,583,004 | 81,218 | (1,169,560) | 3,497,317 | 18,994,421 |
| Fidelity Series Emerging Markets Debt Fund | 3,666,378 | 372,697 | 217,048 | 110,920 | 6,590 | 460,732 | 4,289,349 |
| Fidelity Series Emerging Markets Fund | 6,848,582 | 2,812,806 | 613,767 | -- | 2,907 | 2,666,735 | 11,717,263 |
| Fidelity Series Emerging Markets Opportunities Fund | 64,104,304 | 20,751,250 | 4,339,382 | -- | 68,921 | 25,373,109 | 105,958,202 |
| Fidelity Series Floating Rate High Income Fund | 738,252 | 81,810 | 52,511 | 18,478 | (926) | 77,264 | 843,889 |
| Fidelity Series Government Money Market Fund 0.16% | 17,416,116 | 7,651,894 | 16,279,022 | 13,892 | -- | -- | 8,788,988 |
| Fidelity Series High Income Fund | 4,472,076 | 454,684 | 262,558 | 138,020 | (233) | 490,472 | 5,154,441 |
| Fidelity Series Inflation-Protected Bond Index Fund | 12,449,254 | 3,575,045 | 1,710,762 | 10,846 | 8,711 | 788,173 | 15,110,421 |
| Fidelity Series International Credit Fund | 247,355 | 3,844 | -- | 3,844 | -- | 22,202 | 273,401 |
| Fidelity Series International Growth Fund | 48,743,741 | 2,903,157 | 12,182,042 | -- | 988,651 | 12,360,422 | 52,813,929 |
| Fidelity Series International Small Cap Fund | 11,650,965 | 1,242,266 | 535,685 | -- | 34,860 | 3,952,634 | 16,345,040 |
| Fidelity Series International Value Fund | 43,608,174 | 3,567,437 | 4,073,885 | -- | (238,990) | 9,383,415 | 52,246,151 |
| Fidelity Series Large Cap Stock Fund | 57,573,265 | 10,974,314 | 3,926,225 | 2,507,099 | (88,060) | 10,580,390 | 75,113,684 |
| Fidelity Series Large Cap Value Index Fund | 6,016,237 | 1,162,471 | 368,994 | -- | (12,333) | 1,321,585 | 8,118,966 |
| Fidelity Series Long-Term Treasury Bond Index Fund | 14,209,861 | 5,360,766 | 1,821,610 | 394,152 | 125,781 | (608,588) | 17,266,210 |
| Fidelity Series Opportunistic Insights Fund | 33,504,927 | 4,900,026 | 8,324,241 | -- | 788,344 | 13,228,988 | 44,098,044 |
| Fidelity Series Overseas Fund | 40,426,611 | 5,239,761 | 5,387,616 | -- | (126,341) | 12,584,861 | 52,737,276 |
| Fidelity Series Real Estate Income Fund | 2,419,316 | 293,786 | 164,537 | 95,342 | (9,410) | 470,918 | 3,010,073 |
| Fidelity Series Short-Term Credit Fund | 1,224,166 | 57,839 | 2,033 | 14,422 | (37) | 47,395 | 1,327,330 |
| Fidelity Series Small Cap Opportunities Fund | 19,062,767 | 3,510,174 | 1,204,616 | 154,125 | 4,149 | 5,090,802 | 26,463,276 |
| Fidelity Series Stock Selector Large Cap Value Fund | 35,558,943 | 6,021,173 | 2,180,302 | -- | (102,138) | 8,475,082 | 47,772,758 |
| Fidelity Series Value Discovery Fund | 36,731,477 | 5,511,176 | 2,700,738 | -- | (15,772) | 9,328,093 | 48,854,236 |
| | $580,518,760 | $103,493,881 | $92,258,228 | $3,542,358 | $2,964,814 | $162,633,313 | $757,352,540 |
Amounts in the income column in the above table include any capital gain distributions from underlying funds, which are presented in the corresponding line-item in the Statement of Operations, if applicable.
Investment Valuation
The following is a summary of the inputs used, as of September 30, 2020, involving the Fund's assets and liabilities carried at fair value. The inputs or methodology used for valuing securities may not be an indication of the risk associated with investing in those securities. For more information on valuation inputs, and their aggregation into the levels used below, please refer to the Investment Valuation section in the accompanying Notes to Financial Statements.
| | Valuation Inputs at Reporting Date: |
| Description | Total | Level 1 | Level 2 | Level 3 |
| Investments in Securities: | | | | |
| Other Short-Term Investments and Net Other Assets | $619,882 | $-- | $619,882 | $-- |
| Domestic Equity Funds | 391,626,819 | 391,626,819 | -- | -- |
| International Equity Funds | 309,661,619 | 309,661,619 | -- | -- |
| Bond Funds | 45,947,784 | 45,947,784 | -- | -- |
| Short-Term Funds | 11,842,498 | 11,842,498 | -- | -- |
| Total Investments in Securities: | $759,698,602 | $759,078,720 | $619,882 | $-- |
| Derivative Instruments: | | | | |
| Liabilities | | | | |
| Futures Contracts | $(18,796) | $(18,796) | $-- | $-- |
| Total Liabilities | $(18,796) | $(18,796) | $-- | $-- |
| Total Derivative Instruments: | $(18,796) | $(18,796) | $-- | $-- |
Value of Derivative Instruments
The following table is a summary of the Fund's value of derivative instruments by primary risk exposure as of September 30, 2020. For additional information on derivative instruments, please refer to the Derivative Instruments section in the accompanying Notes to Financial Statements.
| Primary Risk Exposure / Derivative Type | Value |
| | Asset | Liability |
| Equity Risk | | |
| Futures Contracts(a) | $0 | $(18,796) |
| Total Equity Risk | 0 | (18,796) |
| Total Value of Derivatives | $0 | $(18,796) |
(a) Reflects gross cumulative appreciation (depreciation) on futures contracts as presented in the Schedule of Investments. In the Statement of Assets and Liabilities, the period end daily variation margin is included in receivable or payable for daily variation margin on futures contracts, and the net cumulative appreciation (depreciation) is included in Total accumulated earnings (loss).
See accompanying notes which are an integral part of the financial statements.
Fidelity Advisor Freedom® 2055 Fund
Financial Statements
Statement of Assets and Liabilities
| | | September 30, 2020 (Unaudited) |
| Assets | | |
Investment in securities, at value — See accompanying schedule:
Unaffiliated issuers (cost $619,870) | $619,882 | |
| Fidelity Central Funds (cost $1,726,180) | 1,726,180 | |
| Other affiliated issuers (cost $679,076,770) | 757,352,540 | |
| Total Investment in Securities (cost $681,422,820) | | $759,698,602 |
| Cash | | 20,970 |
| Receivable for investments sold | | 10,971,344 |
| Receivable for fund shares sold | | 1,065,977 |
| Distributions receivable from Fidelity Central Funds | | 159 |
| Total assets | | 771,757,052 |
| Liabilities | | |
| Payable for investments purchased | $9,998,679 | |
| Payable for fund shares redeemed | 1,594,643 | |
| Accrued management fee | 465,657 | |
| Distribution and service plan fees payable | 105,024 | |
| Payable for daily variation margin on futures contracts | 16,081 | |
| Total liabilities | | 12,180,084 |
| Net Assets | | $759,576,968 |
| Net Assets consist of: | | |
| Paid in capital | | $683,704,849 |
| Total accumulated earnings (loss) | | 75,872,119 |
| Net Assets | | $759,576,968 |
| Net Asset Value and Maximum Offering Price | | |
| Class A: | | |
| Net Asset Value and redemption price per share ($256,681,721 ÷ 19,869,495 shares)(a) | | $12.92 |
| Maximum offering price per share (100/94.25 of $12.92) | | $13.71 |
| Class M: | | |
| Net Asset Value and redemption price per share ($95,968,768 ÷ 7,491,058 shares)(a) | | $12.81 |
| Maximum offering price per share (100/96.50 of $12.81) | | $13.27 |
| Class C: | | |
| Net Asset Value and offering price per share ($13,737,553 ÷ 1,083,608 shares)(a) | | $12.68 |
| Class I: | | |
| Net Asset Value, offering price and redemption price per share ($347,030,617 ÷ 26,707,065 shares) | | $12.99 |
| Class Z: | | |
| Net Asset Value, offering price and redemption price per share ($9,010,236 ÷ 698,243 shares) | | $12.90 |
| Class Z6: | | |
| Net Asset Value, offering price and redemption price per share ($37,148,073 ÷ 2,861,349 shares) | | $12.98 |
(a) Redemption price per share is equal to net asset value less any applicable contingent deferred sales charge.
See accompanying notes which are an integral part of the financial statements.
Statement of Operations
| | | Six months ended September 30, 2020 (Unaudited) |
| Investment Income | | |
| Dividends: | | |
| Affiliated issuers | | $1,738,309 |
| Interest | | 1,246 |
| Income from Fidelity Central Funds | | 1,146 |
| Total income | | 1,740,701 |
| Expenses | | |
| Management fee | $2,601,624 | |
| Distribution and service plan fees | 581,739 | |
| Independent trustees' fees and expenses | 939 | |
| Total expenses before reductions | 3,184,302 | |
| Expense reductions | (206) | |
| Total expenses after reductions | | 3,184,096 |
| Net investment income (loss) | | (1,443,395) |
| Realized and Unrealized Gain (Loss) | | |
| Net realized gain (loss) on: | | |
| Investment securities: | | |
| Unaffiliated issuers | 44,484 | |
| Fidelity Central Funds | (171) | |
| Other affiliated issuers | 2,964,814 | |
| Futures contracts | (385,879) | |
| Capital gain distributions from underlying funds: | | |
| Affiliated issuers | 1,804,049 | |
| Total net realized gain (loss) | | 4,427,297 |
| Change in net unrealized appreciation (depreciation) on: | | |
| Investment securities: | | |
| Unaffiliated issuers | (673) | |
| Fidelity Central Funds | (82) | |
| Other affiliated issuers | 162,633,313 | |
| Futures contracts | (76,843) | |
| Total change in net unrealized appreciation (depreciation) | | 162,555,715 |
| Net gain (loss) | | 166,983,012 |
| Net increase (decrease) in net assets resulting from operations | | $165,539,617 |
See accompanying notes which are an integral part of the financial statements.
Statement of Changes in Net Assets
| | Six months ended September 30, 2020 (Unaudited) | Year ended March 31, 2020 |
| Increase (Decrease) in Net Assets | | |
| Operations | | |
| Net investment income (loss) | $(1,443,395) | $9,029,338 |
| Net realized gain (loss) | 4,427,297 | 31,945,278 |
| Change in net unrealized appreciation (depreciation) | 162,555,715 | (106,103,640) |
| Net increase (decrease) in net assets resulting from operations | 165,539,617 | (65,129,024) |
| Distributions to shareholders | (25,237,584) | (44,853,483) |
| Share transactions - net increase (decrease) | 35,607,261 | 64,611,189 |
| Total increase (decrease) in net assets | 175,909,294 | (45,371,318) |
| Net Assets | | |
| Beginning of period | 583,667,674 | 629,038,992 |
| End of period | $759,576,968 | $583,667,674 |
See accompanying notes which are an integral part of the financial statements.
Financial Highlights
Fidelity Advisor Freedom 2055 Fund Class A
| | Six months ended (Unaudited) September 30, | Years endedMarch 31, | | | | |
| | 2020 | 2020 | 2019 | 2018 | 2017 | 2016 |
| Selected Per–Share Data | | | | | | |
| Net asset value, beginning of period | $10.53 | $12.58 | $13.37 | $12.19 | $11.02 | $11.92 |
| Income from Investment Operations | | | | | | |
| Net investment income (loss)A | (.03) | .15 | .18 | .11 | .14 | .15 |
| Net realized and unrealized gain (loss) | 2.87 | (1.36) | .15 | 1.51 | 1.51 | (.59) |
| Total from investment operations | 2.84 | (1.21) | .33 | 1.62 | 1.65 | (.44) |
| Distributions from net investment income | – | (.15) | (.19) | (.13) | (.14) | (.14) |
| Distributions from net realized gain | (.45) | (.69) | (.93) | (.32) | (.34) | (.31) |
| Total distributions | (.45) | (.84) | (1.12) | (.44)B | (.48) | (.46)B |
| Net asset value, end of period | $12.92 | $10.53 | $12.58 | $13.37 | $12.19 | $11.02 |
| Total ReturnC,D,E | 27.62% | (10.57)% | 3.08% | 13.40% | 15.49% | (3.89)% |
| Ratios to Average Net AssetsF,G | | | | | | |
| Expenses before reductions | 1.00%H | 1.00% | .99% | .88% | .25% | .25% |
| Expenses net of fee waivers, if any | 1.00%H | 1.00% | .99% | .88% | .25% | .25% |
| Expenses net of all reductions | 1.00%H | 1.00% | .99% | .88% | .25% | .25% |
| Net investment income (loss) | (.51)%H | 1.23% | 1.41% | .81% | 1.24% | 1.31% |
| Supplemental Data | | | | | | |
| Net assets, end of period (000 omitted) | $256,682 | $196,016 | $212,428 | $209,824 | $170,352 | $130,309 |
| Portfolio turnover rateG | 26%H | 35% | 27% | 18% | 24% | 24% |
A Calculated based on average shares outstanding during the period.
B Total distributions per share do not sum due to rounding.
C Total returns for periods of less than one year are not annualized.
D Total returns would have been lower if certain expenses had not been reduced during the applicable periods shown.
E Total returns do not include the effect of the sales charges.
F Expense ratios reflect operating expenses of the class. Expenses before reductions do not reflect amounts reimbursed, waived, or reduced through arrangements with the investment adviser, brokerage services, or other offset arrangements, if applicable, and do not represent the amount paid by the class during periods when reimbursements, waivers or reductions occur.
G Amount does not include the portfolio activity of any underlying mutual funds or exchange-traded funds (ETFs).
H Annualized
See accompanying notes which are an integral part of the financial statements.
Fidelity Advisor Freedom 2055 Fund Class M
| | Six months ended (Unaudited) September 30, | Years endedMarch 31, | | | | |
| | 2020 | 2020 | 2019 | 2018 | 2017 | 2016 |
| Selected Per–Share Data | | | | | | |
| Net asset value, beginning of period | $10.46 | $12.51 | $13.31 | $12.14 | $10.98 | $11.88 |
| Income from Investment Operations | | | | | | |
| Net investment income (loss)A | (.05) | .12 | .15 | .07 | .11 | .12 |
| Net realized and unrealized gain (loss) | 2.85 | (1.36) | .15 | 1.52 | 1.51 | (.59) |
| Total from investment operations | 2.80 | (1.24) | .30 | 1.59 | 1.62 | (.47) |
| Distributions from net investment income | – | (.13) | (.18) | (.11) | (.12) | (.12) |
| Distributions from net realized gain | (.45) | (.68) | (.93) | (.31) | (.34) | (.31) |
| Total distributions | (.45) | (.81) | (1.10)B | (.42) | (.46) | (.43) |
| Net asset value, end of period | $12.81 | $10.46 | $12.51 | $13.31 | $12.14 | $10.98 |
| Total ReturnC,D,E | 27.42% | (10.83)% | 2.86% | 13.15% | 15.27% | (4.11)% |
| Ratios to Average Net AssetsF,G | | | | | | |
| Expenses before reductions | 1.24%H,I | 1.25% | 1.25% | 1.14% | .50% | .50% |
| Expenses net of fee waivers, if any | 1.24%H,I | 1.25% | 1.25% | 1.14% | .50% | .50% |
| Expenses net of all reductions | 1.24%H,I | 1.25% | 1.25% | 1.14% | .50% | .50% |
| Net investment income (loss) | (.75)%H | .98% | 1.16% | .56% | .99% | 1.06% |
| Supplemental Data | | | | | | |
| Net assets, end of period (000 omitted) | $95,969 | $74,904 | $83,858 | $73,101 | $58,052 | $41,956 |
| Portfolio turnover rateG | 26%H | 35% | 27% | 18% | 24% | 24% |
A Calculated based on average shares outstanding during the period.
B Total distributions per share do not sum due to rounding.
C Total returns for periods of less than one year are not annualized.
D Total returns would have been lower if certain expenses had not been reduced during the applicable periods shown.
E Total returns do not include the effect of the sales charges.
F Expense ratios reflect operating expenses of the class. Expenses before reductions do not reflect amounts reimbursed, waived, or reduced through arrangements with the investment adviser, brokerage services, or other offset arrangements, if applicable, and do not represent the amount paid by the class during periods when reimbursements, waivers or reductions occur.
G Amount does not include the portfolio activity of any underlying mutual funds or exchange-traded funds (ETFs).
H Annualized
I On certain classes, the size and fluctuation of net assets and expense amounts may cause ratios to differ from contractual rates.
See accompanying notes which are an integral part of the financial statements.
Fidelity Advisor Freedom 2055 Fund Class C
| | Six months ended (Unaudited) September 30, | Years endedMarch 31, | | | | |
| | 2020 | 2020 | 2019 | 2018 | 2017 | 2016 |
| Selected Per–Share Data | | | | | | |
| Net asset value, beginning of period | $10.38 | $12.44 | $13.26 | $12.11 | $10.98 | $11.88 |
| Income from Investment Operations | | | | | | |
| Net investment income (loss)A | (.07) | .06 | .08 | .01 | .06 | .06 |
| Net realized and unrealized gain (loss) | 2.82 | (1.36) | .16 | 1.51 | 1.49 | (.58) |
| Total from investment operations | 2.75 | (1.30) | .24 | 1.52 | 1.55 | (.52) |
| Distributions from net investment income | – | (.09) | (.13) | (.06) | (.08) | (.08) |
| Distributions from net realized gain | (.45) | (.68) | (.93) | (.31) | (.34) | (.30) |
| Total distributions | (.45) | (.76)B | (1.06) | (.37) | (.42) | (.38) |
| Net asset value, end of period | $12.68 | $10.38 | $12.44 | $13.26 | $12.11 | $10.98 |
| Total ReturnC,D,E | 27.14% | (11.29)% | 2.32% | 12.62% | 14.62% | (4.53)% |
| Ratios to Average Net AssetsF,G | | | | | | |
| Expenses before reductions | 1.74%H,I | 1.75% | 1.74% | 1.64% | 1.00% | 1.00% |
| Expenses net of fee waivers, if any | 1.74%H,I | 1.75% | 1.74% | 1.64% | 1.00% | 1.00% |
| Expenses net of all reductions | 1.74%H,I | 1.75% | 1.74% | 1.64% | 1.00% | 1.00% |
| Net investment income (loss) | (1.25)%H | .48% | .66% | .05% | .49% | .56% |
| Supplemental Data | | | | | | |
| Net assets, end of period (000 omitted) | $13,738 | $9,928 | $10,991 | $10,685 | $8,529 | $5,671 |
| Portfolio turnover rateG | 26%H | 35% | 27% | 18% | 24% | 24% |
A Calculated based on average shares outstanding during the period.
B Total distributions per share do not sum due to rounding.
C Total returns for periods of less than one year are not annualized.
D Total returns would have been lower if certain expenses had not been reduced during the applicable periods shown.
E Total returns do not include the effect of the contingent deferred sales charge.
F Expense ratios reflect operating expenses of the class. Expenses before reductions do not reflect amounts reimbursed, waived, or reduced through arrangements with the investment adviser, brokerage services, or other offset arrangements, if applicable, and do not represent the amount paid by the class during periods when reimbursements, waivers or reductions occur.
G Amount does not include the portfolio activity of any underlying mutual funds or exchange-traded funds (ETFs).
H Annualized
I On certain classes, the size and fluctuation of net assets and expense amounts may cause ratios to differ from contractual rates.
See accompanying notes which are an integral part of the financial statements.
Fidelity Advisor Freedom 2055 Fund Class I
| | Six months ended (Unaudited) September 30, | Years endedMarch 31, | | | | |
| | 2020 | 2020 | 2019 | 2018 | 2017 | 2016 |
| Selected Per–Share Data | | | | | | |
| Net asset value, beginning of period | $10.57 | $12.64 | $13.43 | $12.24 | $11.06 | $11.96 |
| Income from Investment Operations | | | | | | |
| Net investment income (loss)A | (.02) | .19 | .21 | .14 | .17 | .18 |
| Net realized and unrealized gain (loss) | 2.89 | (1.39) | .15 | 1.53 | 1.51 | (.60) |
| Total from investment operations | 2.87 | (1.20) | .36 | 1.67 | 1.68 | (.42) |
| Distributions from net investment income | – | (.18) | (.22) | (.16) | (.16) | (.17) |
| Distributions from net realized gain | (.45) | (.70) | (.93) | (.32) | (.34) | (.31) |
| Total distributions | (.45) | (.87)B | (1.15) | (.48) | (.50) | (.48) |
| Net asset value, end of period | $12.99 | $10.57 | $12.64 | $13.43 | $12.24 | $11.06 |
| Total ReturnC,D | 27.80% | (10.45)% | 3.34% | 13.74% | 15.81% | (3.64)% |
| Ratios to Average Net AssetsE,F | | | | | | |
| Expenses before reductions | .75%G,H | .75% | .75% | .64% | - %I | - %I |
| Expenses net of fee waivers, if any | .75%G,H | .75% | .75% | .64% | -% | -% |
| Expenses net of all reductions | .75%G,H | .75% | .75% | .64% | -% | -% |
| Net investment income (loss) | (.26)%G | 1.48% | 1.66% | 1.05% | 1.49% | 1.56% |
| Supplemental Data | | | | | | |
| Net assets, end of period (000 omitted) | $347,031 | $273,147 | $308,366 | $249,432 | $165,720 | $119,597 |
| Portfolio turnover rateF | 26%G | 35% | 27% | 18% | 24% | 24% |
A Calculated based on average shares outstanding during the period.
B Total distributions per share do not sum due to rounding.
C Total returns for periods of less than one year are not annualized.
D Total returns would have been lower if certain expenses had not been reduced during the applicable periods shown.
E Expense ratios reflect operating expenses of the class. Expenses before reductions do not reflect amounts reimbursed, waived, or reduced through arrangements with the investment adviser, brokerage services, or other offset arrangements, if applicable, and do not represent the amount paid by the class during periods when reimbursements, waivers or reductions occur.
F Amount does not include the portfolio activity of any underlying mutual funds or exchange-traded funds (ETFs).
G Annualized
H On certain classes, the size and fluctuation of net assets and expense amounts may cause ratios to differ from contractual rates.
I Amount represents less than .005%.
See accompanying notes which are an integral part of the financial statements.
Fidelity Advisor Freedom 2055 Fund Class Z
| | Six months ended (Unaudited) September 30, | Years endedMarch 31, | |
| | 2020 | 2020 | 2019 A |
| Selected Per–Share Data | | | |
| Net asset value, beginning of period | $10.50 | $12.58 | $13.57 |
| Income from Investment Operations | | | |
| Net investment income (loss)B | (.01) | .20 | .38 |
| Net realized and unrealized gain (loss) | 2.86 | (1.36) | (.65) |
| Total from investment operations | 2.85 | (1.16) | (.27) |
| Distributions from net investment income | – | (.20) | (.28) |
| Distributions from net realized gain | (.45) | (.71) | (.43) |
| Total distributions | (.45) | (.92)C | (.72)C |
| Net asset value, end of period | $12.90 | $10.50 | $12.58 |
| Total ReturnD,E | 27.80% | (10.28)% | (1.35)% |
| Ratios to Average Net AssetsF,G | | | |
| Expenses before reductions | .64%H | .65% | .65%H,I |
| Expenses net of fee waivers, if any | .64%H | .65% | .65%H,I |
| Expenses net of all reductions | .64%H | .65% | .65%H,I |
| Net investment income (loss) | (.15)%H | 1.58% | 6.29%H |
| Supplemental Data | | | |
| Net assets, end of period (000 omitted) | $9,010 | $5,767 | $428 |
| Portfolio turnover rateG | 26%H | 35% | 27%H |
A For the period October 2, 2018 (commencement of sale of shares) to March 31, 2019.
B Calculated based on average shares outstanding during the period.
C Total distributions per share do not sum due to rounding.
D Total returns for periods of less than one year are not annualized.
E Total returns would have been lower if certain expenses had not been reduced during the applicable periods shown.
F Expense ratios reflect operating expenses of the class. Expenses before reductions do not reflect amounts reimbursed, waived, or reduced through arrangements with the investment adviser, brokerage services, or other offset arrangements, if applicable, and do not represent the amount paid by the class during periods when reimbursements, waivers or reductions occur.
G Amount does not include the portfolio activity of any underlying mutual funds or exchange-traded funds (ETFs).
H Annualized
I On certain classes, the size and fluctuation of net assets and expense amounts may cause ratios to differ from contractual rates.
See accompanying notes which are an integral part of the financial statements.
Fidelity Advisor Freedom 2055 Fund Class Z6
| | Six months ended (Unaudited) September 30, | Years endedMarch 31, | | |
| | 2020 | 2020 | 2019 | 2018 A |
| Selected Per–Share Data | | | | |
| Net asset value, beginning of period | $10.55 | $12.62 | $13.42 | $12.63 |
| Income from Investment Operations | | | | |
| Net investment income (loss)B | –C | .22 | .24 | .47 |
| Net realized and unrealized gain (loss) | 2.88 | (1.38) | .15 | .69 |
| Total from investment operations | 2.88 | (1.16) | .39 | 1.16 |
| Distributions from net investment income | – | (.21) | (.26) | (.19) |
| Distributions from net realized gain | (.45) | (.71) | (.93) | (.18) |
| Total distributions | (.45) | (.91)D | (1.19) | (.37) |
| Net asset value, end of period | $12.98 | $10.55 | $12.62 | $13.42 |
| Total ReturnE,F | 27.96% | (10.22)% | 3.59% | 9.16% |
| Ratios to Average Net AssetsG,H | | | | |
| Expenses before reductions | .49%I | .49% | .50% | .50%I,J |
| Expenses net of fee waivers, if any | .49%I | .49% | .50% | .50%I,J |
| Expenses net of all reductions | .49%I | .49% | .50% | .50%I,J |
| Net investment income (loss) | - %I,K | 1.73% | 1.91% | 4.26%I |
| Supplemental Data | | | | |
| Net assets, end of period (000 omitted) | $37,148 | $23,906 | $12,968 | $3,116 |
| Portfolio turnover rateH | 26%I | 35% | 27% | 18%I |
A For the period June 6, 2017 (commencement of sale of shares) to March 31, 2018.
B Calculated based on average shares outstanding during the period.
C Amount represents less than $.005 per share.
D Total distributions per share do not sum due to rounding.
E Total returns for periods of less than one year are not annualized.
F Total returns would have been lower if certain expenses had not been reduced during the applicable periods shown.
G Expense ratios reflect operating expenses of the class. Expenses before reductions do not reflect amounts reimbursed, waived, or reduced through arrangements with the investment adviser, brokerage services, or other offset arrangements, if applicable, and do not represent the amount paid by the class during periods when reimbursements, waivers or reductions occur.
H Amount does not include the portfolio activity of any underlying mutual funds or exchange-traded funds (ETFs).
I Annualized
J On certain classes, the size and fluctuation of net assets and expense amounts may cause ratios to differ from contractual rates.
K Amount represents less than .005%.
See accompanying notes which are an integral part of the financial statements.
Fidelity Advisor Freedom® 2060 Fund
Investment Summary (Unaudited)
The information in the following tables is based on the direct investments of the Fund.
Top Holdings as of September 30, 2020
| | % of fund's net assets |
| Fidelity Series Emerging Markets Opportunities Fund | 14.0 |
| Fidelity Series Large Cap Stock Fund | 9.9 |
| Fidelity Series International Growth Fund | 7.0 |
| Fidelity Series Overseas Fund | 6.9 |
| Fidelity Series International Value Fund | 6.9 |
| Fidelity Series Value Discovery Fund | 6.4 |
| Fidelity Series Stock Selector Large Cap Value Fund | 6.3 |
| Fidelity Advisor Series Equity Growth Fund | 6.3 |
| Fidelity Series Opportunistic Insights Fund | 5.8 |
| Fidelity Advisor Series Growth Opportunities Fund | 4.3 |
| | 73.8 |
Asset Allocation (% of fund's net assets)
| Period end |
| | Domestic Equity Funds | 51.6% |
| | International Equity Funds | 40.8% |
| | Bond Funds | 6.0% |
| | Short-Term Funds | 1.5% |
| | Short-Term Investments | 0.1% |

Domestic Equity Funds category includes Fidelity Series Commodity Strategy Fund which invests in commodity-related investments.
Fidelity Advisor Freedom® 2060 Fund
Schedule of Investments September 30, 2020 (Unaudited)
Showing Percentage of Net Assets
| U.S. Treasury Obligations - 0.1% | | | |
| | | Principal Amount | Value |
| U.S. Treasury Bills, yield at date of purchase 0.11% to 0.11% 12/3/20 to 12/10/20 (a) | | | |
| (Cost $249,948) | | 250,000 | 249,953 |
| | | Shares | Value |
|
| Domestic Equity Funds - 51.6% | | | |
| Fidelity Advisor Series Equity Growth Fund (b) | | 906,365 | $16,486,780 |
| Fidelity Advisor Series Growth Opportunities Fund (b) | | 618,271 | 11,370,006 |
| Fidelity Advisor Series Small Cap Fund (b) | | 670,237 | 7,459,734 |
| Fidelity Series All-Sector Equity Fund (b) | | 666,266 | 7,095,737 |
| Fidelity Series Commodity Strategy Fund (b) | | 1,591,489 | 6,620,594 |
| Fidelity Series Large Cap Stock Fund (b) | | 1,840,931 | 26,067,585 |
| Fidelity Series Large Cap Value Index Fund (b) | | 242,897 | 2,817,605 |
| Fidelity Series Opportunistic Insights Fund (b) | | 707,516 | 15,303,571 |
| Fidelity Series Small Cap Opportunities Fund (b) | | 719,736 | 9,183,831 |
| Fidelity Series Stock Selector Large Cap Value Fund (b) | | 1,507,185 | 16,579,031 |
| Fidelity Series Value Discovery Fund (b) | | 1,371,711 | 16,954,353 |
| TOTAL DOMESTIC EQUITY FUNDS | | | |
| (Cost $127,774,632) | | | 135,938,827 |
|
| International Equity Funds - 40.8% | | | |
| Fidelity Series Canada Fund (b) | | 605,618 | 6,195,468 |
| Fidelity Series Emerging Markets Fund (b) | | 432,740 | 4,080,734 |
| Fidelity Series Emerging Markets Opportunities Fund (b) | | 1,753,377 | 36,785,853 |
| Fidelity Series International Growth Fund (b) | | 975,959 | 18,328,507 |
| Fidelity Series International Small Cap Fund (b) | | 318,708 | 5,673,008 |
| Fidelity Series International Value Fund (b) | | 2,103,007 | 18,127,922 |
| Fidelity Series Overseas Fund (b) | | 1,637,024 | 18,301,931 |
| TOTAL INTERNATIONAL EQUITY FUNDS | | | |
| (Cost $97,669,390) | | | 107,493,423 |
|
| Bond Funds - 6.0% | | | |
| Fidelity Series Emerging Markets Debt Fund (b) | | 164,796 | 1,493,054 |
| Fidelity Series Floating Rate High Income Fund (b) | | 35,956 | 318,209 |
| Fidelity Series High Income Fund (b) | | 196,841 | 1,795,189 |
| Fidelity Series Inflation-Protected Bond Index Fund (b) | | 490,086 | 5,243,920 |
| Fidelity Series International Credit Fund (b) | | 3,495 | 36,383 |
| Fidelity Series Long-Term Treasury Bond Index Fund (b) | | 580,065 | 5,992,076 |
| Fidelity Series Real Estate Income Fund (b) | | 108,828 | 1,086,100 |
| TOTAL BOND FUNDS | | | |
| (Cost $15,128,251) | | | 15,964,931 |
|
| Short-Term Funds - 1.5% | | | |
| Fidelity Cash Central Fund 0.10% (c) | | 463,421 | 463,513 |
| Fidelity Series Government Money Market Fund 0.16% (b)(d) | | 3,077,853 | 3,077,853 |
| Fidelity Series Short-Term Credit Fund (b) | | 45,039 | 461,648 |
| TOTAL SHORT-TERM FUNDS | | | |
| (Cost $3,987,967) | | | 4,003,014 |
| TOTAL INVESTMENT IN SECURITIES - 100.0% | | | |
| (Cost $244,810,188) | | | 263,650,148 |
| NET OTHER ASSETS (LIABILITIES) - 0.0% | | | (38,616) |
| NET ASSETS - 100% | | | $263,611,532 |
| Futures Contracts | | | | | |
| | Number of contracts | Expiration Date | Notional Amount | Value | Unrealized Appreciation/(Depreciation) |
| Purchased | | | | | |
| Equity Index Contracts | | | | | |
| ICE E-mini MSCI EAFE Index Contracts (United States) | 5 | Dec. 2020 | $463,300 | $(5,617) | $(5,617) |
| Sold | | | | | |
| Equity Index Contracts | | | | | |
| CME E-mini S&P 500 Index Contracts (United States) | 3 | Dec. 2020 | 502,800 | (3,282) | (3,282) |
| TOTAL FUTURES CONTRACTS | | | | | $(8,899) |
The notional amount of futures purchased as a percentage of Net Assets is 0.2%
The notional amount of futures sold as a percentage of Net Assets is 0.2%
Legend
(a) Security or a portion of the security was pledged to cover margin requirements for futures contracts. At period end, the value of securities pledged amounted to $249,953.
(b) Affiliated Fund
(c) Affiliated fund that is generally available only to investment companies and other accounts managed by Fidelity Investments. The rate quoted is the annualized seven-day yield of the fund at period end. A complete unaudited listing of the fund's holdings as of its most recent quarter end is available upon request. In addition, each Fidelity Central Fund's financial statements are available on the SEC's website or upon request.
(d) The rate quoted is the annualized seven-day yield of the fund at period end.
Affiliated Central Funds
Information regarding fiscal year to date income earned by the Fund from investments in Fidelity Central Funds is as follows:
| Fund | Income earned |
| Fidelity Cash Central Fund | $336 |
| Total | $336 |
Amounts in the income column in the above table include any capital gain distributions from underlying funds, which are presented in the corresponding line-item in the Statement of Operations, if applicable.
Affiliated Underlying Funds
Fiscal year to date information regarding the Fund's investments in affiliated Underlying Funds, excluding any Money Market Central Funds, is presented below. Exchanges between classes of the same affiliated Underlying Funds may occur.
| Affiliate | Value, beginning of period | Purchases | Sales Proceeds | Dividend Income | Realized Gain (loss) | Change in Unrealized appreciation (depreciation) | Value, end of period |
| Fidelity Advisor Series Equity Growth Fund | $11,321,317 | $2,718,826 | $3,159,704 | $-- | $239,512 | $5,366,829 | $16,486,780 |
| Fidelity Advisor Series Growth Opportunities Fund | 7,305,630 | 1,824,323 | 2,827,785 | -- | 368,011 | 4,699,827 | 11,370,006 |
| Fidelity Advisor Series Small Cap Fund | 4,827,166 | 1,313,105 | 373,405 | -- | 5,188 | 1,687,680 | 7,459,734 |
| Fidelity Series All-Sector Equity Fund | 4,968,557 | 1,044,352 | 781,984 | -- | (67,865) | 1,932,677 | 7,095,737 |
| Fidelity Series Canada Fund | 3,708,429 | 1,550,738 | 82,173 | -- | (7,683) | 1,026,157 | 6,195,468 |
| Fidelity Series Commodity Strategy Fund | 6,216,251 | 1,166,440 | 1,552,491 | 27,914 | (316,885) | 1,107,279 | 6,620,594 |
| Fidelity Series Emerging Markets Debt Fund | 1,172,125 | 248,658 | 82,218 | 37,355 | (1,743) | 156,232 | 1,493,054 |
| Fidelity Series Emerging Markets Fund | 2,196,379 | 1,223,484 | 232,194 | -- | 891 | 892,174 | 4,080,734 |
| Fidelity Series Emerging Markets Opportunities Fund | 20,506,511 | 9,526,358 | 1,732,945 | -- | 84,223 | 8,401,706 | 36,785,853 |
| Fidelity Series Floating Rate High Income Fund | 253,138 | 57,829 | 19,891 | 6,708 | (638) | 27,771 | 318,209 |
| Fidelity Series Government Money Market Fund 0.16% | 5,554,313 | 2,956,799 | 5,433,259 | 4,636 | -- | -- | 3,077,853 |
| Fidelity Series High Income Fund | 1,430,114 | 302,120 | 99,457 | 46,512 | (1,084) | 163,496 | 1,795,189 |
| Fidelity Series Inflation-Protected Bond Index Fund | 3,980,302 | 1,562,225 | 565,506 | 3,626 | 1,929 | 264,970 | 5,243,920 |
| Fidelity Series International Credit Fund | 32,917 | 511 | -- | 512 | -- | 2,955 | 36,383 |
| Fidelity Series International Growth Fund | 15,539,738 | 2,327,087 | 3,983,640 | -- | 54,749 | 4,390,573 | 18,328,507 |
| Fidelity Series International Small Cap Fund | 3,716,187 | 763,764 | 135,724 | -- | 12,737 | 1,316,044 | 5,673,008 |
| Fidelity Series International Value Fund | 13,958,416 | 2,534,591 | 1,389,772 | -- | 31,774 | 2,992,913 | 18,127,922 |
| Fidelity Series Large Cap Stock Fund | 18,416,531 | 5,637,022 | 1,428,240 | 862,881 | (83,471) | 3,525,743 | 26,067,585 |
| Fidelity Series Large Cap Value Index Fund | 1,917,689 | 608,737 | 141,006 | -- | (9,541) | 441,726 | 2,817,605 |
| Fidelity Series Long-Term Treasury Bond Index Fund | 4,543,154 | 2,134,653 | 522,740 | 129,367 | 37,455 | (200,446) | 5,992,076 |
| Fidelity Series Opportunistic Insights Fund | 10,707,192 | 2,738,945 | 2,823,230 | -- | 175,791 | 4,504,873 | 15,303,571 |
| Fidelity Series Overseas Fund | 12,942,340 | 3,093,641 | 1,892,448 | -- | (23,180) | 4,181,578 | 18,301,931 |
| Fidelity Series Real Estate Income Fund | 796,485 | 193,703 | 62,327 | 33,523 | (4,277) | 162,516 | 1,086,100 |
| Fidelity Series Short-Term Credit Fund | 409,257 | 36,411 | 419 | 4,982 | (5) | 16,404 | 461,648 |
| Fidelity Series Small Cap Opportunities Fund | 6,102,355 | 1,854,535 | 461,939 | 52,986 | (15,849) | 1,704,729 | 9,183,831 |
| Fidelity Series Stock Selector Large Cap Value Fund | 11,382,253 | 3,257,694 | 830,383 | -- | (72,102) | 2,841,569 | 16,579,031 |
| Fidelity Series Value Discovery Fund | 11,746,321 | 3,095,597 | 972,028 | -- | (21,648) | 3,106,111 | 16,954,353 |
| | $185,651,067 | $53,772,148 | $31,586,908 | $1,211,002 | $386,289 | $54,714,086 | $262,936,682 |
Amounts in the income column in the above table include any capital gain distributions from underlying funds, which are presented in the corresponding line-item in the Statement of Operations, if applicable.
Investment Valuation
The following is a summary of the inputs used, as of September 30, 2020, involving the Fund's assets and liabilities carried at fair value. The inputs or methodology used for valuing securities may not be an indication of the risk associated with investing in those securities. For more information on valuation inputs, and their aggregation into the levels used below, please refer to the Investment Valuation section in the accompanying Notes to Financial Statements.
| | Valuation Inputs at Reporting Date: |
| Description | Total | Level 1 | Level 2 | Level 3 |
| Investments in Securities: | | | | |
| Other Short-Term Investments and Net Other Assets | $249,953 | $-- | $249,953 | $-- |
| Domestic Equity Funds | 135,938,827 | 135,938,827 | -- | -- |
| International Equity Funds | 107,493,423 | 107,493,423 | -- | -- |
| Bond Funds | 15,964,931 | 15,964,931 | -- | -- |
| Short-Term Funds | 4,003,014 | 4,003,014 | -- | -- |
| Total Investments in Securities: | $263,650,148 | $263,400,195 | $249,953 | $-- |
| Derivative Instruments: | | | | |
| Liabilities | | | | |
| Futures Contracts | $(8,899) | $(8,899) | $-- | $-- |
| Total Liabilities | $(8,899) | $(8,899) | $-- | $-- |
| Total Derivative Instruments: | $(8,899) | $(8,899) | $-- | $-- |
Value of Derivative Instruments
The following table is a summary of the Fund's value of derivative instruments by primary risk exposure as of September 30, 2020. For additional information on derivative instruments, please refer to the Derivative Instruments section in the accompanying Notes to Financial Statements.
| Primary Risk Exposure / Derivative Type | Value |
| | Asset | Liability |
| Equity Risk | | |
| Futures Contracts(a) | $0 | $(8,899) |
| Total Equity Risk | 0 | (8,899) |
| Total Value of Derivatives | $0 | $(8,899) |
(a) Reflects gross cumulative appreciation (depreciation) on futures contracts as presented in the Schedule of Investments. In the Statement of Assets and Liabilities, the period end daily variation margin is included in receivable or payable for daily variation margin on futures contracts, and the net cumulative appreciation (depreciation) is included in Total accumulated earnings (loss).
See accompanying notes which are an integral part of the financial statements.
Fidelity Advisor Freedom® 2060 Fund
Financial Statements
Statement of Assets and Liabilities
| | | September 30, 2020 (Unaudited) |
| Assets | | |
Investment in securities, at value — See accompanying schedule:
Unaffiliated issuers (cost $249,949) | $249,953 | |
| Fidelity Central Funds (cost $463,513) | 463,513 | |
| Other affiliated issuers (cost $244,096,726) | 262,936,682 | |
| Total Investment in Securities (cost $244,810,188) | | $263,650,148 |
| Cash | | 7,081 |
| Receivable for investments sold | | 3,700,332 |
| Receivable for fund shares sold | | 522,885 |
| Distributions receivable from Fidelity Central Funds | | 41 |
| Total assets | | 267,880,487 |
| Liabilities | | |
| Payable for investments purchased | $3,438,812 | |
| Payable for fund shares redeemed | 632,594 | |
| Accrued management fee | 160,582 | |
| Distribution and service plan fees payable | 36,967 | |
| Total liabilities | | 4,268,955 |
| Net Assets | | $263,611,532 |
| Net Assets consist of: | | |
| Paid in capital | | $246,926,574 |
| Total accumulated earnings (loss) | | 16,684,958 |
| Net Assets | | $263,611,532 |
| Net Asset Value and Maximum Offering Price | | |
| Class A: | | |
| Net Asset Value and redemption price per share ($93,745,309 ÷ 8,015,247 shares)(a) | | $11.70 |
| Maximum offering price per share (100/94.25 of $11.70) | | $12.41 |
| Class M: | | |
| Net Asset Value and redemption price per share ($30,934,589 ÷ 2,653,243 shares)(a) | | $11.66 |
| Maximum offering price per share (100/96.50 of $11.66) | | $12.08 |
| Class C: | | |
| Net Asset Value and offering price per share ($5,678,032 ÷ 489,120 shares)(a) | | $11.61 |
| Class I: | | |
| Net Asset Value, offering price and redemption price per share ($118,675,143 ÷ 10,090,166 shares) | | $11.76 |
| Class Z: | | |
| Net Asset Value, offering price and redemption price per share ($2,450,007 ÷ 209,292 shares) | | $11.71 |
| Class Z6: | | |
| Net Asset Value, offering price and redemption price per share ($12,128,452 ÷ 1,031,165 shares) | | $11.76 |
(a) Redemption price per share is equal to net asset value less any applicable contingent deferred sales charge.
See accompanying notes which are an integral part of the financial statements.
Statement of Operations
| | | Six months ended September 30, 2020 (Unaudited) |
| Investment Income | | |
| Dividends: | | |
| Affiliated issuers | | $595,152 |
| Interest | | 406 |
| Income from Fidelity Central Funds | | 336 |
| Total income | | 595,894 |
| Expenses | | |
| Management fee | $878,987 | |
| Distribution and service plan fees | 198,123 | |
| Independent trustees' fees and expenses | 311 | |
| Total expenses before reductions | 1,077,421 | |
| Expense reductions | (93) | |
| Total expenses after reductions | | 1,077,328 |
| Net investment income (loss) | | (481,434) |
| Realized and Unrealized Gain (Loss) | | |
| Net realized gain (loss) on: | | |
| Investment securities: | | |
| Unaffiliated issuers | 13,513 | |
| Fidelity Central Funds | (55) | |
| Other affiliated issuers | 386,289 | |
| Futures contracts | (145,920) | |
| Capital gain distributions from underlying funds: | | |
| Affiliated issuers | 615,850 | |
| Total net realized gain (loss) | | 869,677 |
| Change in net unrealized appreciation (depreciation) on: | | |
| Investment securities: | | |
| Unaffiliated issuers | (211) | |
| Fidelity Central Funds | (25) | |
| Other affiliated issuers | 54,714,086 | |
| Futures contracts | (33,887) | |
| Total change in net unrealized appreciation (depreciation) | | 54,679,963 |
| Net gain (loss) | | 55,549,640 |
| Net increase (decrease) in net assets resulting from operations | | $55,068,206 |
See accompanying notes which are an integral part of the financial statements.
Statement of Changes in Net Assets
| | Six months ended September 30, 2020 (Unaudited) | Year ended March 31, 2020 |
| Increase (Decrease) in Net Assets | | |
| Operations | | |
| Net investment income (loss) | $(481,434) | $2,519,151 |
| Net realized gain (loss) | 869,677 | 8,617,852 |
| Change in net unrealized appreciation (depreciation) | 54,679,963 | (34,949,643) |
| Net increase (decrease) in net assets resulting from operations | 55,068,206 | (23,812,640) |
| Distributions to shareholders | (7,472,902) | (11,164,327) |
| Share transactions - net increase (decrease) | 29,357,776 | 71,887,699 |
| Total increase (decrease) in net assets | 76,953,080 | 36,910,732 |
| Net Assets | | |
| Beginning of period | 186,658,452 | 149,747,720 |
| End of period | $263,611,532 | $186,658,452 |
See accompanying notes which are an integral part of the financial statements.
Financial Highlights
Fidelity Advisor Freedom 2060 Fund Class A
| | Six months ended (Unaudited) September 30, | Years endedMarch 31, | | | | |
| | 2020 | 2020 | 2019 | 2018 | 2017 | 2016 |
| Selected Per–Share Data | | | | | | |
| Net asset value, beginning of period | $9.49 | $11.31 | $11.86 | $10.76 | $9.62 | $10.34 |
| Income from Investment Operations | | | | | | |
| Net investment income (loss)A | (.03) | .14 | .17 | .10 | .13 | .12 |
| Net realized and unrealized gain (loss) | 2.60 | (1.24) | .13 | 1.34 | 1.33 | (.51) |
| Total from investment operations | 2.57 | (1.10) | .30 | 1.44 | 1.46 | (.39) |
| Distributions from net investment income | – | (.14) | (.17) | (.11) | (.12) | (.11) |
| Distributions from net realized gain | (.36) | (.58) | (.68) | (.23) | (.20) | (.22) |
| Total distributions | (.36) | (.72) | (.85) | (.34) | (.32) | (.33) |
| Net asset value, end of period | $11.70 | $9.49 | $11.31 | $11.86 | $10.76 | $9.62 |
| Total ReturnB,C,D | 27.69% | (10.65)% | 3.09% | 13.44% | 15.55% | (3.89)% |
| Ratios to Average Net AssetsE,F | | | | | | |
| Expenses before reductions | .99%G,H | 1.00% | 1.00% | .91% | .25% | .25% |
| Expenses net of fee waivers, if any | .99%G,H | 1.00% | 1.00% | .91% | .25% | .25% |
| Expenses net of all reductions | .99%G,H | 1.00% | 1.00% | .91% | .25% | .25% |
| Net investment income (loss) | (.50)%G | 1.25% | 1.48% | .84% | 1.30% | 1.29% |
| Supplemental Data | | | | | | |
| Net assets, end of period (000 omitted) | $93,745 | $65,792 | $55,732 | $37,880 | $18,482 | $9,058 |
| Portfolio turnover rateF | 27%G | 31% | 27% | 16% | 32% | 64% |
A Calculated based on average shares outstanding during the period.
B Total returns for periods of less than one year are not annualized.
C Total returns would have been lower if certain expenses had not been reduced during the applicable periods shown.
D Total returns do not include the effect of the sales charges.
E Expense ratios reflect operating expenses of the class. Expenses before reductions do not reflect amounts reimbursed, waived, or reduced through arrangements with the investment adviser, brokerage services, or other offset arrangements, if applicable, and do not represent the amount paid by the class during periods when reimbursements, waivers or reductions occur.
F Amount does not include the portfolio activity of any underlying mutual funds or exchange-traded funds (ETFs).
G Annualized
H On certain classes, the size and fluctuation of net assets and expense amounts may cause ratios to differ from contractual rates.
See accompanying notes which are an integral part of the financial statements.
Fidelity Advisor Freedom 2060 Fund Class M
| | Six months ended (Unaudited) September 30, | Years endedMarch 31, | | | | |
| | 2020 | 2020 | 2019 | 2018 | 2017 | 2016 |
| Selected Per–Share Data | | | | | | |
| Net asset value, beginning of period | $9.47 | $11.29 | $11.85 | $10.77 | $9.63 | $10.33 |
| Income from Investment Operations | | | | | | |
| Net investment income (loss)A | (.04) | .11 | .14 | .07 | .11 | .10 |
| Net realized and unrealized gain (loss) | 2.59 | (1.23) | .14 | 1.33 | 1.33 | (.51) |
| Total from investment operations | 2.55 | (1.12) | .28 | 1.40 | 1.44 | (.41) |
| Distributions from net investment income | – | (.12) | (.16) | (.10) | (.10) | (.08) |
| Distributions from net realized gain | (.36) | (.58) | (.68) | (.22) | (.20) | (.21) |
| Total distributions | (.36) | (.70) | (.84) | (.32) | (.30) | (.29) |
| Net asset value, end of period | $11.66 | $9.47 | $11.29 | $11.85 | $10.77 | $9.63 |
| Total ReturnB,C,D | 27.54% | (10.87)% | 2.82% | 13.04% | 15.29% | (4.09)% |
| Ratios to Average Net AssetsE,F | | | | | | |
| Expenses before reductions | 1.24%G,H | 1.25% | 1.25% | 1.16% | .50% | .50% |
| Expenses net of fee waivers, if any | 1.24%G,H | 1.25% | 1.25% | 1.16% | .50% | .50% |
| Expenses net of all reductions | 1.24%G,H | 1.25% | 1.25% | 1.16% | .50% | .50% |
| Net investment income (loss) | (.75)%G | 1.00% | 1.23% | .59% | 1.05% | 1.04% |
| Supplemental Data | | | | | | |
| Net assets, end of period (000 omitted) | $30,935 | $21,680 | $19,070 | $12,628 | $5,719 | $3,189 |
| Portfolio turnover rateF | 27%G | 31% | 27% | 16% | 32% | 64% |
A Calculated based on average shares outstanding during the period.
B Total returns for periods of less than one year are not annualized.
C Total returns would have been lower if certain expenses had not been reduced during the applicable periods shown.
D Total returns do not include the effect of the sales charges.
E Expense ratios reflect operating expenses of the class. Expenses before reductions do not reflect amounts reimbursed, waived, or reduced through arrangements with the investment adviser, brokerage services, or other offset arrangements, if applicable, and do not represent the amount paid by the class during periods when reimbursements, waivers or reductions occur.
F Amount does not include the portfolio activity of any underlying mutual funds or exchange-traded funds (ETFs).
G Annualized
H On certain classes, the size and fluctuation of net assets and expense amounts may cause ratios to differ from contractual rates.
See accompanying notes which are an integral part of the financial statements.
Fidelity Advisor Freedom 2060 Fund Class C
| | Six months ended (Unaudited) September 30, | Years endedMarch 31, | | | | |
| | 2020 | 2020 | 2019 | 2018 | 2017 | 2016 |
| Selected Per–Share Data | | | | | | |
| Net asset value, beginning of period | $9.46 | $11.29 | $11.87 | $10.81 | $9.68 | $10.31 |
| Income from Investment Operations | | | | | | |
| Net investment income (loss)A | (.07) | .06 | .08 | .01 | .06 | .05 |
| Net realized and unrealized gain (loss) | 2.58 | (1.24) | .14 | 1.34 | 1.33 | (.51) |
| Total from investment operations | 2.51 | (1.18) | .22 | 1.35 | 1.39 | (.46) |
| Distributions from net investment income | – | (.08) | (.12) | (.07) | (.06) | – |
| Distributions from net realized gain | (.36) | (.57) | (.68) | (.22) | (.20) | (.17) |
| Total distributions | (.36) | (.65) | (.80) | (.29) | (.26) | (.17) |
| Net asset value, end of period | $11.61 | $9.46 | $11.29 | $11.87 | $10.81 | $9.68 |
| Total ReturnB,C,D | 27.13% | (11.27)% | 2.33% | 12.53% | 14.65% | (4.60)% |
| Ratios to Average Net AssetsE,F | | | | | | |
| Expenses before reductions | 1.74%G,H | 1.75% | 1.75% | 1.66% | 1.00% | .99% |
| Expenses net of fee waivers, if any | 1.74%G,H | 1.75% | 1.75% | 1.66% | 1.00% | .99% |
| Expenses net of all reductions | 1.74%G,H | 1.75% | 1.75% | 1.66% | 1.00% | .99% |
| Net investment income (loss) | (1.25)%G | .50% | .72% | .09% | .55% | .55% |
| Supplemental Data | | | | | | |
| Net assets, end of period (000 omitted) | $5,678 | $4,022 | $3,723 | $2,604 | $1,209 | $1,292 |
| Portfolio turnover rateF | 27%G | 31% | 27% | 16% | 32% | 64% |
A Calculated based on average shares outstanding during the period.
B Total returns for periods of less than one year are not annualized.
C Total returns would have been lower if certain expenses had not been reduced during the applicable periods shown.
D Total returns do not include the effect of the contingent deferred sales charge.
E Expense ratios reflect operating expenses of the class. Expenses before reductions do not reflect amounts reimbursed, waived, or reduced through arrangements with the investment adviser, brokerage services, or other offset arrangements, if applicable, and do not represent the amount paid by the class during periods when reimbursements, waivers or reductions occur.
F Amount does not include the portfolio activity of any underlying mutual funds or exchange-traded funds (ETFs).
G Annualized
H On certain classes, the size and fluctuation of net assets and expense amounts may cause ratios to differ from contractual rates.
See accompanying notes which are an integral part of the financial statements.
Fidelity Advisor Freedom 2060 Fund Class I
| | Six months ended (Unaudited) September 30, | Years endedMarch 31, | | | | |
| | 2020 | 2020 | 2019 | 2018 | 2017 | 2016 |
| Selected Per–Share Data | | | | | | |
| Net asset value, beginning of period | $9.54 | $11.36 | $11.90 | $10.80 | $9.65 | $10.35 |
| Income from Investment Operations | | | | | | |
| Net investment income (loss)A | (.01) | .17 | .20 | .13 | .16 | .15 |
| Net realized and unrealized gain (loss) | 2.60 | (1.24) | .13 | 1.33 | 1.33 | (.50) |
| Total from investment operations | 2.59 | (1.07) | .33 | 1.46 | 1.49 | (.35) |
| Distributions from net investment income | – | (.16) | (.20) | (.13) | (.13) | (.12) |
| Distributions from net realized gain | (.37) | (.59) | (.68) | (.23) | (.20) | (.23) |
| Total distributions | (.37) | (.75) | (.87)B | (.36) | (.34)B | (.35) |
| Net asset value, end of period | $11.76 | $9.54 | $11.36 | $11.90 | $10.80 | $9.65 |
| Total ReturnC,D | 27.70% | (10.38)% | 3.38% | 13.63% | 15.82% | (3.54)% |
| Ratios to Average Net AssetsE,F | | | | | | |
| Expenses before reductions | .75%G | .75% | .75% | .66% | - %H | - %H |
| Expenses net of fee waivers, if any | .75%G | .75% | .75% | .66% | -% | -% |
| Expenses net of all reductions | .74%G | .75% | .75% | .66% | -% | -% |
| Net investment income (loss) | (.25)%G | 1.50% | 1.73% | 1.09% | 1.55% | 1.54% |
| Supplemental Data | | | | | | |
| Net assets, end of period (000 omitted) | $118,675 | $87,182 | $68,445 | $43,513 | $18,162 | $5,845 |
| Portfolio turnover rateF | 27%G | 31% | 27% | 16% | 32% | 64% |
A Calculated based on average shares outstanding during the period.
B Total distributions per share do not sum due to rounding.
C Total returns for periods of less than one year are not annualized.
D Total returns would have been lower if certain expenses had not been reduced during the applicable periods shown.
E Expense ratios reflect operating expenses of the class. Expenses before reductions do not reflect amounts reimbursed, waived, or reduced through arrangements with the investment adviser, brokerage services, or other offset arrangements, if applicable, and do not represent the amount paid by the class during periods when reimbursements, waivers or reductions occur.
F Amount does not include the portfolio activity of any underlying mutual funds or exchange-traded funds (ETFs).
G Annualized
H Amount represents less than .005%.
See accompanying notes which are an integral part of the financial statements.
Fidelity Advisor Freedom 2060 Fund Class Z
| | Six months ended (Unaudited) September 30, | Years endedMarch 31, | |
| | 2020 | 2020 | 2019 A |
| Selected Per–Share Data | | | |
| Net asset value, beginning of period | $9.49 | $11.32 | $12.10 |
| Income from Investment Operations | | | |
| Net investment income (loss)B | (.01) | .18 | .23 |
| Net realized and unrealized gain (loss) | 2.60 | (1.23) | (.46)C |
| Total from investment operations | 2.59 | (1.05) | (.23) |
| Distributions from net investment income | – | (.18) | (.24) |
| Distributions from net realized gain | (.37) | (.60) | (.31) |
| Total distributions | (.37) | (.78) | (.55) |
| Net asset value, end of period | $11.71 | $9.49 | $11.32 |
| Total ReturnD,E | 27.90% | (10.32)% | (1.34)% |
| Ratios to Average Net AssetsF,G | | | |
| Expenses before reductions | .64%H | .65%I | .64%H,I |
| Expenses net of fee waivers, if any | .64%H | .65%I | .64%H,I |
| Expenses net of all reductions | .64%H | .65%I | .64%H,I |
| Net investment income (loss) | (.14)%H | 1.60% | 4.28%H |
| Supplemental Data | | | |
| Net assets, end of period (000 omitted) | $2,450 | $1,514 | $284 |
| Portfolio turnover rateG | 27%H | 31% | 27% |
A For the period October 2, 2018 (commencement of sale of shares) to March 31, 2019.
B Calculated based on average shares outstanding during the period.
C The amount shown for a share outstanding does not correspond with the aggregate net gain (loss) on investments for the period due to the timing of sales and repurchases of shares in relation to fluctuating market values of the investments of the Fund.
D Total returns for periods of less than one year are not annualized.
E Total returns would have been lower if certain expenses had not been reduced during the applicable periods shown.
F Expense ratios reflect operating expenses of the class. Expenses before reductions do not reflect amounts reimbursed, waived, or reduced through arrangements with the investment adviser, brokerage services, or other offset arrangements, if applicable, and do not represent the amount paid by the class during periods when reimbursements, waivers or reductions occur.
G Amount does not include the portfolio activity of any underlying mutual funds or exchange-traded funds (ETFs).
H Annualized
I On certain classes, the size and fluctuation of net assets and expense amounts may cause ratios to differ from contractual rates.
See accompanying notes which are an integral part of the financial statements.
Fidelity Advisor Freedom 2060 Fund Class Z6
| | Six months ended (Unaudited) September 30, | Years endedMarch 31, | | |
| | 2020 | 2020 | 2019 | 2018 A |
| Selected Per–Share Data | | | | |
| Net asset value, beginning of period | $9.53 | $11.36 | $11.90 | $11.16 |
| Income from Investment Operations | | | | |
| Net investment income (loss)B | – | .20 | .23 | .33 |
| Net realized and unrealized gain (loss) | 2.60 | (1.25) | .13 | .69 |
| Total from investment operations | 2.60 | (1.05) | .36 | 1.02 |
| Distributions from net investment income | – | (.19) | (.22) | (.16) |
| Distributions from net realized gain | (.37) | (.60) | (.68) | (.13) |
| Total distributions | (.37) | (.78)C | (.90) | (.28)C |
| Net asset value, end of period | $11.76 | $9.53 | $11.36 | $11.90 |
| Total ReturnD,E | 27.95% | (10.24)% | 3.63% | 9.14% |
| Ratios to Average Net AssetsF,G | | | | |
| Expenses before reductions | .49%H | .50%I | .50%I | .50%H,I |
| Expenses net of fee waivers, if any | .49%H | .50%I | .50%I | .50%H,I |
| Expenses net of all reductions | .49%H | .50%I | .50%I | .50%H,I |
| Net investment income (loss) | .01%H | 1.75% | 1.98% | 3.41%H |
| Supplemental Data | | | | |
| Net assets, end of period (000 omitted) | $12,128 | $6,468 | $2,493 | $802 |
| Portfolio turnover rateG | 27%H | 31% | 27% | 16%H |
A For the period June 6, 2017 (commencement of sale of shares) to March 31, 2018.
B Calculated based on average shares outstanding during the period.
C Total distributions per share do not sum due to rounding.
D Total returns for periods of less than one year are not annualized.
E Total returns would have been lower if certain expenses had not been reduced during the applicable periods shown.
F Expense ratios reflect operating expenses of the class. Expenses before reductions do not reflect amounts reimbursed, waived, or reduced through arrangements with the investment adviser, brokerage services, or other offset arrangements, if applicable, and do not represent the amount paid by the class during periods when reimbursements, waivers or reductions occur.
G Amount does not include the portfolio activity of any underlying mutual funds or exchange-traded funds (ETFs).
H Annualized
I On certain classes, the size and fluctuation of net assets and expense amounts may cause ratios to differ from contractual rates.
See accompanying notes which are an integral part of the financial statements.
Fidelity Advisor Freedom® 2065 Fund
Investment Summary (Unaudited)
The information in the following tables is based on the direct investments of the Fund.
Top Holdings as of September 30, 2020
| | % of fund's net assets |
| Fidelity Series Emerging Markets Opportunities Fund | 14.0 |
| Fidelity Series Large Cap Stock Fund | 9.9 |
| Fidelity Series International Growth Fund | 7.0 |
| Fidelity Series Overseas Fund | 6.9 |
| Fidelity Series International Value Fund | 6.9 |
| Fidelity Series Value Discovery Fund | 6.4 |
| Fidelity Series Stock Selector Large Cap Value Fund | 6.3 |
| Fidelity Advisor Series Equity Growth Fund | 6.3 |
| Fidelity Series Opportunistic Insights Fund | 5.8 |
| Fidelity Advisor Series Growth Opportunities Fund | 4.3 |
| | 73.8 |
Asset Allocation (% of fund's net assets)
| Period end |
| | Domestic Equity Funds | 51.6% |
| | International Equity Funds | 40.8% |
| | Bond Funds | 6.2% |
| | Short-Term Funds | 1.4% |

Domestic Equity Funds category includes Fidelity Series Commodity Strategy Fund which invests in commodity-related investments.
Fidelity Advisor Freedom® 2065 Fund
Schedule of Investments September 30, 2020 (Unaudited)
Showing Percentage of Net Assets
| Domestic Equity Funds - 51.6% | | | |
| | | Shares | Value |
| Fidelity Advisor Series Equity Growth Fund (a) | | 39,654 | $721,302 |
| Fidelity Advisor Series Growth Opportunities Fund (a) | | 27,047 | 497,397 |
| Fidelity Advisor Series Small Cap Fund (a) | | 29,331 | 326,458 |
| Fidelity Series All-Sector Equity Fund (a) | | 29,148 | 310,428 |
| Fidelity Series Commodity Strategy Fund (a) | | 69,935 | 290,931 |
| Fidelity Series Large Cap Stock Fund (a) | | 80,576 | 1,140,962 |
| Fidelity Series Large Cap Value Index Fund (a) | | 10,630 | 123,308 |
| Fidelity Series Opportunistic Insights Fund (a) | | 30,939 | 669,213 |
| Fidelity Series Small Cap Opportunities Fund (a) | | 31,499 | 401,929 |
| Fidelity Series Stock Selector Large Cap Value Fund (a) | | 65,957 | 725,530 |
| Fidelity Series Value Discovery Fund (a) | | 60,029 | 741,962 |
| TOTAL DOMESTIC EQUITY FUNDS | | | |
| (Cost $5,514,284) | | | 5,949,420 |
|
| International Equity Funds - 40.8% | | | |
| Fidelity Series Canada Fund (a) | | 26,527 | 271,369 |
| Fidelity Series Emerging Markets Fund (a) | | 19,007 | 179,236 |
| Fidelity Series Emerging Markets Opportunities Fund (a) | | 76,760 | 1,610,421 |
| Fidelity Series International Growth Fund (a) | | 42,724 | 802,349 |
| Fidelity Series International Small Cap Fund (a) | | 13,975 | 248,752 |
| Fidelity Series International Value Fund (a) | | 92,397 | 796,460 |
| Fidelity Series Overseas Fund (a) | | 71,663 | 801,198 |
| TOTAL INTERNATIONAL EQUITY FUNDS | | | |
| (Cost $4,319,167) | | | 4,709,785 |
|
| Bond Funds - 6.2% | | | |
| Fidelity Series Emerging Markets Debt Fund (a) | | 7,517 | 68,102 |
| Fidelity Series Floating Rate High Income Fund (a) | | 1,805 | 15,973 |
| Fidelity Series High Income Fund (a) | | 8,785 | 80,122 |
| Fidelity Series Inflation-Protected Bond Index Fund (a) | | 21,831 | 233,589 |
| Fidelity Series International Credit Fund (a) | | 497 | 5,174 |
| Fidelity Series Long-Term Treasury Bond Index Fund (a) | | 25,784 | 266,344 |
| Fidelity Series Real Estate Income Fund (a) | | 4,966 | 49,560 |
| TOTAL BOND FUNDS | | | |
| (Cost $697,120) | | | 718,864 |
|
| Short-Term Funds - 1.4% | | | |
| Fidelity Cash Central Fund 0.10% (b) | | 195 | 195 |
| Fidelity Series Government Money Market Fund 0.16% (a)(c) | | 135,294 | 135,294 |
| Fidelity Series Short-Term Credit Fund (a) | | 2,435 | 24,955 |
| TOTAL SHORT-TERM FUNDS | | | |
| (Cost $160,100) | | | 160,444 |
| TOTAL INVESTMENT IN SECURITIES - 100.0% | | | |
| (Cost $10,690,671) | | | 11,538,513 |
| NET OTHER ASSETS (LIABILITIES) - 0.0% | | | (1,754) |
| NET ASSETS - 100% | | | $11,536,759 |
Legend
(a) Affiliated Fund
(b) Affiliated fund that is generally available only to investment companies and other accounts managed by Fidelity Investments. The rate quoted is the annualized seven-day yield of the fund at period end. A complete unaudited listing of the fund's holdings as of its most recent quarter end is available upon request. In addition, each Fidelity Central Fund's financial statements are available on the SEC's website or upon request.
(c) The rate quoted is the annualized seven-day yield of the fund at period end.
Affiliated Underlying Funds
Fiscal year to date information regarding the Fund's investments in affiliated Underlying Funds, excluding any Money Market Central Funds, is presented below. Exchanges between classes of the same affiliated Underlying Funds may occur. [Certain Underlying Funds incurred name changes since their most recent shareholder report. The names of the Underlying Funds are those in effect at period end.]
| Affiliate | Value, beginning of period | Purchases | Sales Proceeds | Dividend Income | Realized Gain (loss) | Change in Unrealized appreciation (depreciation) | Value, end of period |
| Fidelity Advisor Series Equity Growth Fund | $339,223 | $300,115 | $109,523 | $-- | $2,419 | $189,068 | $721,302 |
| Fidelity Advisor Series Growth Opportunities Fund | 223,605 | 203,854 | 104,760 | -- | 4,341 | 170,357 | 497,397 |
| Fidelity Advisor Series Small Cap Fund | 159,728 | 142,420 | 35,291 | -- | (3,280) | 62,881 | 326,458 |
| Fidelity Series All-Sector Equity Fund | 154,360 | 128,481 | 37,091 | -- | (464) | 65,142 | 310,428 |
| Fidelity Series Canada Fund | 126,311 | 134,588 | 25,771 | -- | (4,544) | 40,785 | 271,369 |
| Fidelity Series Commodity Strategy Fund | 201,905 | 132,449 | 72,269 | 1,185 | (6,293) | 35,139 | 290,931 |
| Fidelity Series Emerging Markets Debt Fund | 38,924 | 30,347 | 6,422 | 1,430 | (650) | 5,903 | 68,102 |
| Fidelity Series Emerging Markets Fund | 72,011 | 90,090 | 14,920 | -- | (1,433) | 33,488 | 179,236 |
| Fidelity Series Emerging Markets Opportunities Fund | 666,838 | 782,165 | 136,557 | -- | (12,117) | 310,092 | 1,610,421 |
| Fidelity Series Floating Rate High Income Fund | 9,197 | 7,277 | 1,554 | 281 | (84) | 1,137 | 15,973 |
| Fidelity Series Government Money Market Fund 0.16% | 204,105 | 135,708 | 204,519 | 200 | -- | -- | 135,294 |
| Fidelity Series High Income Fund | 45,654 | 36,710 | 7,768 | 1,729 | (154) | 5,680 | 80,122 |
| Fidelity Series Inflation-Protected Bond Index Fund | 125,650 | 122,493 | 24,334 | 132 | 45 | 9,735 | 233,589 |
| Fidelity Series International Credit Fund | 2,999 | 2,386 | 518 | 54 | (17) | 324 | 5,174 |
| Fidelity Series International Growth Fund | 492,638 | 322,063 | 168,496 | -- | 621 | 155,523 | 802,349 |
| Fidelity Series International Small Cap Fund | 118,950 | 102,709 | 20,181 | -- | 15 | 47,259 | 248,752 |
| Fidelity Series International Value Fund | 444,926 | 350,236 | 99,328 | -- | (11,491) | 112,117 | 796,460 |
| Fidelity Series Large Cap Stock Fund | 586,850 | 561,553 | 118,801 | 35,042 | (6,755) | 118,115 | 1,140,962 |
| Fidelity Series Large Cap Value Index Fund | 60,178 | 60,318 | 11,318 | -- | (1,148) | 15,278 | 123,308 |
| Fidelity Series Long-Term Treasury Bond Index Fund | 143,957 | 162,459 | 33,913 | 4,510 | (635) | (5,524) | 266,344 |
| Fidelity Series Opportunistic Insights Fund | 316,634 | 303,325 | 109,573 | -- | 2,488 | 156,339 | 669,213 |
| Fidelity Series Overseas Fund | 432,031 | 342,820 | 119,617 | -- | (8,785) | 154,749 | 801,198 |
| Fidelity Series Real Estate Income Fund | 25,680 | 23,257 | 4,868 | 1,336 | (907) | 6,398 | 49,560 |
| Fidelity Series Short-Term Credit Fund | 23,791 | 272 | -- | 270 | -- | 892 | 24,955 |
| Fidelity Series Small Cap Opportunities Fund | 200,839 | 182,664 | 39,953 | 2,312 | (4,029) | 62,408 | 401,929 |
| Fidelity Series Stock Selector Large Cap Value Fund | 373,687 | 337,318 | 80,412 | -- | (7,705) | 102,642 | 725,530 |
| Fidelity Series Value Discovery Fund | 369,715 | 340,347 | 73,908 | -- | (5,882) | 111,690 | 741,962 |
| | $5,960,386 | $5,338,424 | $1,661,665 | $48,481 | $(66,444) | $1,967,617 | $11,538,318 |
Amounts in the income column in the above table include any capital gain distributions from underlying funds, which are presented in the corresponding line-item in the Statement of Operations, if applicable.
Investment Valuation
The following is a summary of the inputs used, as of September 30, 2020, involving the Fund's assets and liabilities carried at fair value. The inputs or methodology used for valuing securities may not be an indication of the risk associated with investing in those securities. For more information on valuation inputs, and their aggregation into the levels used below, please refer to the Investment Valuation section in the accompanying Notes to Financial Statements.
| | Valuation Inputs at Reporting Date: |
| Description | Total | Level 1 | Level 2 | Level 3 |
| Investments in Securities: | | | | |
| Domestic Equity Funds | $5,949,420 | $5,949,420 | $-- | $-- |
| International Equity Funds | 4,709,785 | 4,709,785 | -- | -- |
| Bond Funds | 718,864 | 718,864 | -- | -- |
| Short-Term Funds | 160,444 | 160,444 | -- | -- |
| Total Investments in Securities: | $11,538,513 | $11,538,513 | $-- | $-- |
See accompanying notes which are an integral part of the financial statements.
Fidelity Advisor Freedom® 2065 Fund
Financial Statements
Statement of Assets and Liabilities
| | | September 30, 2020 (Unaudited) |
| Assets | | |
Investment in securities, at value — See accompanying schedule:
| | |
| Fidelity Central Funds (cost $195) | $195 | |
| Other affiliated issuers (cost $10,690,476) | 11,538,318 | |
| Total Investment in Securities (cost $10,690,671) | | $11,538,513 |
| Cash | | 4 |
| Receivable for investments sold | | 49,508 |
| Receivable for fund shares sold | | 198,013 |
| Total assets | | 11,786,038 |
| Liabilities | | |
| Payable for investments purchased | $223,994 | |
| Payable for fund shares redeemed | 17,066 | |
| Accrued management fee | 6,784 | |
| Distribution and service plan fees payable | 1,435 | |
| Total liabilities | | 249,279 |
| Net Assets | | $11,536,759 |
| Net Assets consist of: | | |
| Paid in capital | | $10,782,887 |
| Total accumulated earnings (loss) | | 753,872 |
| Net Assets | | $11,536,759 |
| Net Asset Value and Maximum Offering Price | | |
| Class A: | | |
| Net Asset Value and redemption price per share ($4,831,998 ÷ 453,433 shares)(a) | | $10.66 |
| Maximum offering price per share (100/94.25 of $10.66) | | $11.31 |
| Class M: | | |
| Net Asset Value and redemption price per share ($649,367 ÷ 61,013 shares)(a) | | $10.64 |
| Maximum offering price per share (100/96.50 of $10.64) | | $11.03 |
| Class C: | | |
| Net Asset Value and offering price per share ($264,116 ÷ 24,905 shares)(a) | | $10.60 |
| Class I: | | |
| Net Asset Value, offering price and redemption price per share ($4,862,993 ÷ 455,262 shares) | | $10.68 |
| Class Z: | | |
| Net Asset Value, offering price and redemption price per share ($287,627 ÷ 26,872 shares) | | $10.70 |
| Class Z6: | | |
| Net Asset Value, offering price and redemption price per share ($640,658 ÷ 59,797 shares) | | $10.71 |
(a) Redemption price per share is equal to net asset value less any applicable contingent deferred sales charge.
See accompanying notes which are an integral part of the financial statements.
Statement of Operations
| | | Six months ended September 30, 2020 (Unaudited) |
| Investment Income | | |
| Dividends: | | |
| Affiliated issuers | | $24,039 |
| Expenses | | |
| Management fee | $32,444 | |
| Distribution and service plan fees | 6,790 | |
| Independent trustees' fees and expenses | 11 | |
| Total expenses | | 39,245 |
| Net investment income (loss) | | (15,206) |
| Realized and Unrealized Gain (Loss) | | |
| Net realized gain (loss) on: | | |
| Investment securities: | | |
| Unaffiliated issuers | 4 | |
| Affiliated issuers | (66,444) | |
| Capital gain distributions from underlying funds: | | |
| Affiliated issuers | 24,442 | |
| Total net realized gain (loss) | | (41,998) |
| Change in net unrealized appreciation (depreciation) on: | | |
| Investment securities: | | |
| Affiliated issuers | 1,967,617 | |
| Total change in net unrealized appreciation (depreciation) | | 1,967,617 |
| Net gain (loss) | | 1,925,619 |
| Net increase (decrease) in net assets resulting from operations | | $1,910,413 |
See accompanying notes which are an integral part of the financial statements.
Statement of Changes in Net Assets
| | Six months ended September 30, 2020 (Unaudited) | For the period
June 28, 2019 (commencement of operations) to March 31, 2020 |
| Increase (Decrease) in Net Assets | | |
| Operations | | |
| Net investment income (loss) | $(15,206) | $32,838 |
| Net realized gain (loss) | (41,998) | 85,456 |
| Change in net unrealized appreciation (depreciation) | 1,967,617 | (1,119,775) |
| Net increase (decrease) in net assets resulting from operations | 1,910,413 | (1,001,481) |
| Distributions to shareholders | (100,896) | (54,165) |
| Share transactions - net increase (decrease) | 3,767,407 | 7,015,481 |
| Total increase (decrease) in net assets | 5,576,924 | 5,959,835 |
| Net Assets | | |
| Beginning of period | 5,959,835 | – |
| End of period | $11,536,759 | $5,959,835 |
See accompanying notes which are an integral part of the financial statements.
Financial Highlights
Fidelity Advisor Freedom 2065 Fund Class A
| | Six months ended (Unaudited) September 30, | Years endedMarch 31, |
| | 2020 | 2020 A |
| Selected Per–Share Data | | |
| Net asset value, beginning of period | $8.47 | $10.00 |
| Income from Investment Operations | | |
| Net investment income (loss)B | (.02) | .12 |
| Net realized and unrealized gain (loss) | 2.34 | (1.48) |
| Total from investment operations | 2.32 | (1.36) |
| Distributions from net investment income | – | (.13) |
| Distributions from net realized gain | (.13) | (.04) |
| Total distributions | (.13) | (.17) |
| Net asset value, end of period | $10.66 | $8.47 |
| Total ReturnC,D | 27.58% | (13.92)% |
| Ratios to Average Net AssetsE,F | | |
| Expenses before reductions | .99%G,H | 1.01%G,H |
| Expenses net of fee waivers, if any | .99%G,H | 1.01%G,H |
| Expenses net of all reductions | .99%G,H | 1.01%G,H |
| Net investment income (loss) | (.46)%G | 1.60%G |
| Supplemental Data | | |
| Net assets, end of period (000 omitted) | $4,832 | $1,980 |
| Portfolio turnover rateF | 37%G | 33%G |
A For the period June 28, 2019 (commencement of operations) to March 31, 2020.
B Calculated based on average shares outstanding during the period.
C Total returns for periods of less than one year are not annualized.
D Total returns do not include the effect of the sales charges.
E Expense ratios reflect operating expenses of the class. Expenses before reductions do not reflect amounts reimbursed, waived, or reduced through arrangements with the investment adviser, brokerage services, or other offset arrangements, if applicable, and do not represent the amount paid by the class during periods when reimbursements, waivers or reductions occur.
F Amount does not include the portfolio activity of any underlying mutual funds or exchange-traded funds (ETFs).
G Annualized
H On certain classes, the size and fluctuation of net assets and expense amounts may cause ratios to differ from contractual rates.
See accompanying notes which are an integral part of the financial statements.
Fidelity Advisor Freedom 2065 Fund Class M
| | Six months ended (Unaudited) September 30, | Years endedMarch 31, |
| | 2020 | 2020 A |
| Selected Per–Share Data | | |
| Net asset value, beginning of period | $8.47 | $10.00 |
| Income from Investment Operations | | |
| Net investment income (loss)B | (.04) | .10 |
| Net realized and unrealized gain (loss) | 2.33 | (1.47) |
| Total from investment operations | 2.29 | (1.37) |
| Distributions from net investment income | – | (.11) |
| Distributions from net realized gain | (.12) | (.04) |
| Total distributions | (.12) | (.16)C |
| Net asset value, end of period | $10.64 | $8.47 |
| Total ReturnD,E | 27.28% | (14.05)% |
| Ratios to Average Net AssetsF,G | | |
| Expenses before reductions | 1.24%H,I | 1.25%H |
| Expenses net of fee waivers, if any | 1.24%H,I | 1.25%H |
| Expenses net of all reductions | 1.24%H,I | 1.25%H |
| Net investment income (loss) | (.71)%H | 1.35%H |
| Supplemental Data | | |
| Net assets, end of period (000 omitted) | $649 | $332 |
| Portfolio turnover rateG | 37%H | 33%H |
A For the period June 28, 2019 (commencement of operations) to March 31, 2020.
B Calculated based on average shares outstanding during the period.
C Total distributions per share do not sum due to rounding.
D Total returns for periods of less than one year are not annualized.
E Total returns do not include the effect of the sales charges.
F Expense ratios reflect operating expenses of the class. Expenses before reductions do not reflect amounts reimbursed, waived, or reduced through arrangements with the investment adviser, brokerage services, or other offset arrangements, if applicable, and do not represent the amount paid by the class during periods when reimbursements, waivers or reductions occur.
G Amount does not include the portfolio activity of any underlying mutual funds or exchange-traded funds (ETFs).
H Annualized
I On certain classes, the size and fluctuation of net assets and expense amounts may cause ratios to differ from contractual rates.
See accompanying notes which are an integral part of the financial statements.
Fidelity Advisor Freedom 2065 Fund Class C
| | Six months ended (Unaudited) September 30, | Years endedMarch 31, |
| | 2020 | 2020 A |
| Selected Per–Share Data | | |
| Net asset value, beginning of period | $8.46 | $10.00 |
| Income from Investment Operations | | |
| Net investment income (loss)B | (.06) | .06 |
| Net realized and unrealized gain (loss) | 2.32 | (1.47) |
| Total from investment operations | 2.26 | (1.41) |
| Distributions from net investment income | – | (.09) |
| Distributions from net realized gain | (.12) | (.04) |
| Total distributions | (.12) | (.13) |
| Net asset value, end of period | $10.60 | $8.46 |
| Total ReturnC,D | 26.96% | (14.38)% |
| Ratios to Average Net AssetsE,F | | |
| Expenses before reductions | 1.74%G,H | 1.75%G |
| Expenses net of fee waivers, if any | 1.74%G,H | 1.75%G |
| Expenses net of all reductions | 1.74%G,H | 1.75%G |
| Net investment income (loss) | (1.21)%G | .86%G |
| Supplemental Data | | |
| Net assets, end of period (000 omitted) | $264 | $183 |
| Portfolio turnover rateF | 37%G | 33%G |
A For the period June 28, 2019 (commencement of operations) to March 31, 2020.
B Calculated based on average shares outstanding during the period.
C Total returns for periods of less than one year are not annualized.
D Total returns do not include the effect of the contingent deferred sales charge.
E Expense ratios reflect operating expenses of the class. Expenses before reductions do not reflect amounts reimbursed, waived, or reduced through arrangements with the investment adviser, brokerage services, or other offset arrangements, if applicable, and do not represent the amount paid by the class during periods when reimbursements, waivers or reductions occur.
F Amount does not include the portfolio activity of any underlying mutual funds or exchange-traded funds (ETFs).
G Annualized
H On certain classes, the size and fluctuation of net assets and expense amounts may cause ratios to differ from contractual rates.
See accompanying notes which are an integral part of the financial statements.
Fidelity Advisor Freedom 2065 Fund Class I
| | Six months ended (Unaudited) September 30, | Years endedMarch 31, |
| | 2020 | 2020 A |
| Selected Per–Share Data | | |
| Net asset value, beginning of period | $8.48 | $10.00 |
| Income from Investment Operations | | |
| Net investment income (loss)B | (.01) | .14 |
| Net realized and unrealized gain (loss) | 2.34 | (1.48) |
| Total from investment operations | 2.33 | (1.34) |
| Distributions from net investment income | – | (.14) |
| Distributions from net realized gain | (.13) | (.04) |
| Total distributions | (.13) | (.18) |
| Net asset value, end of period | $10.68 | $8.48 |
| Total ReturnC | 27.71% | (13.78)% |
| Ratios to Average Net AssetsD,E | | |
| Expenses before reductions | .75%F | .75%F |
| Expenses net of fee waivers, if any | .75%F | .75%F |
| Expenses net of all reductions | .75%F | .75%F |
| Net investment income (loss) | (.21)%F | 1.85%F |
| Supplemental Data | | |
| Net assets, end of period (000 omitted) | $4,863 | $2,383 |
| Portfolio turnover rateE | 37%F | 33%F |
A For the period June 28, 2019 (commencement of operations) to March 31, 2020.
B Calculated based on average shares outstanding during the period.
C Total returns for periods of less than one year are not annualized.
D Expense ratios reflect operating expenses of the class. Expenses before reductions do not reflect amounts reimbursed, waived, or reduced through arrangements with the investment adviser, brokerage services, or other offset arrangements, if applicable, and do not represent the amount paid by the class during periods when reimbursements, waivers or reductions occur.
E Amount does not include the portfolio activity of any underlying mutual funds or exchange-traded funds (ETFs).
F Annualized
See accompanying notes which are an integral part of the financial statements.
Fidelity Advisor Freedom 2065 Fund Class Z
| | Six months ended (Unaudited) September 30, | Years endedMarch 31, |
| | 2020 | 2020 A |
| Selected Per–Share Data | | |
| Net asset value, beginning of period | $8.49 | $10.00 |
| Income from Investment Operations | | |
| Net investment income (loss)B | (.01) | .15 |
| Net realized and unrealized gain (loss) | 2.34 | (1.48) |
| Total from investment operations | 2.33 | (1.33) |
| Distributions from net investment income | – | (.14) |
| Distributions from net realized gain | (.12) | (.04) |
| Total distributions | (.12) | (.18) |
| Net asset value, end of period | $10.70 | $8.49 |
| Total ReturnC | 27.69% | (13.68)% |
| Ratios to Average Net AssetsD,E | | |
| Expenses before reductions | .64%F | .64%F |
| Expenses net of fee waivers, if any | .64%F | .64%F |
| Expenses net of all reductions | .64%F | .64%F |
| Net investment income (loss) | (.10)%F | 1.96%F |
| Supplemental Data | | |
| Net assets, end of period (000 omitted) | $288 | $176 |
| Portfolio turnover rateE | 37%F | 33%F |
A For the period June 28, 2019 (commencement of operations) to March 31, 2020.
B Calculated based on average shares outstanding during the period.
C Total returns for periods of less than one year are not annualized.
D Expense ratios reflect operating expenses of the class. Expenses before reductions do not reflect amounts reimbursed, waived, or reduced through arrangements with the investment adviser, brokerage services, or other offset arrangements, if applicable, and do not represent the amount paid by the class during periods when reimbursements, waivers or reductions occur.
E Amount does not include the portfolio activity of any underlying mutual funds or exchange-traded funds (ETFs).
F Annualized
See accompanying notes which are an integral part of the financial statements.
Fidelity Advisor Freedom 2065 Fund Class Z6
| | Six months ended (Unaudited) September 30, | Years endedMarch 31, |
| | 2020 | 2020 A |
| Selected Per–Share Data | | |
| Net asset value, beginning of period | $8.50 | $10.00 |
| Income from Investment Operations | | |
| Net investment income (loss)B | –C | .15 |
| Net realized and unrealized gain (loss) | 2.34 | (1.47) |
| Total from investment operations | 2.34 | (1.32) |
| Distributions from net investment income | – | (.14) |
| Distributions from net realized gain | (.13) | (.04) |
| Total distributions | (.13) | (.18) |
| Net asset value, end of period | $10.71 | $8.50 |
| Total ReturnD | 27.79% | (13.58)% |
| Ratios to Average Net AssetsE,F | | |
| Expenses before reductions | .49%G | .50%G,H |
| Expenses net of fee waivers, if any | .49%G | .50%G,H |
| Expenses net of all reductions | .49%G | .50%G,H |
| Net investment income (loss) | .04%G | 2.11%G |
| Supplemental Data | | |
| Net assets, end of period (000 omitted) | $641 | $905 |
| Portfolio turnover rateF | 37%G | 33%G |
A For the period June 28, 2019 (commencement of operations) to March 31, 2020.
B Calculated based on average shares outstanding during the period.
C Amount represents less than $.005 per share.
D Total returns for periods of less than one year are not annualized.
E Expense ratios reflect operating expenses of the class. Expenses before reductions do not reflect amounts reimbursed, waived, or reduced through arrangements with the investment adviser, brokerage services, or other offset arrangements, if applicable, and do not represent the amount paid by the class during periods when reimbursements, waivers or reductions occur.
F Amount does not include the portfolio activity of any underlying mutual funds or exchange-traded funds (ETFs).
G Annualized
H On certain classes, the size and fluctuation of net assets and expense amounts may cause ratios to differ from contractual rates.
See accompanying notes which are an integral part of the financial statements.
Notes to Financial Statements (Unaudited)
For the period ended September 30, 2020
1. Organization.
Fidelity Advisor Freedom Income Fund, Fidelity Advisor Freedom 2005 Fund, Fidelity Advisor Freedom 2010 Fund, Fidelity Advisor Freedom 2015 Fund, Fidelity Advisor Freedom 2020 Fund, Fidelity Advisor Freedom 2025 Fund, Fidelity Advisor Freedom 2030 Fund, Fidelity Advisor Freedom 2035 Fund, Fidelity Advisor Freedom 2040 Fund, Fidelity Advisor Freedom 2045 Fund, Fidelity Advisor Freedom 2050 Fund, Fidelity Advisor Freedom 2055 Fund, Fidelity Advisor Freedom 2060 Fund and Fidelity Advisor Freedom 2065 Fund (the Funds) are funds of Fidelity Aberdeen Street Trust (the Trust). The Trust is registered under the Investment Company Act of 1940, as amended (the 1940 Act), as an open-end management investment company organized as a Delaware statutory trust. Each Fund is authorized to issue an unlimited number of shares. Each Fund offers Class A, Class M, Class C, Class I, Class Z and Class Z6 shares, each of which has equal rights as to assets and voting privileges. Each class has exclusive voting rights with respect to matters that affect that class. Class C shares will automatically convert to Class A shares after a holding period of ten years from the initial date of purchase, with certain exceptions.
2. Investments in Fidelity Central Funds.
The Funds invest in Fidelity Central Funds, which are open-end investment companies generally available only to other investment companies and accounts managed by the investment adviser and its affiliates. The Funds' Schedules of Investments list each of the Fidelity Central Funds held as of period end, if any, as an investment of each Fund, but do not include the underlying holdings of each Fidelity Central Fund. As an Investing Fund, each Fund indirectly bears its proportionate share of the expenses of the underlying Fidelity Central Funds.
The Money Market Central Funds seek preservation of capital and current income and are managed by the investment adviser. Annualized expenses of the Money Market Central Funds as of their most recent shareholder report date ranged from less than .005% to .01%.
A complete unaudited list of holdings for each Fidelity Central Fund is available upon request or at the Securities and Exchange Commission (the SEC) website at www.sec.gov. In addition, the financial statements of the Fidelity Central Funds are available on the SEC website or upon request.
3. Significant Accounting Policies.
Each Fund is an investment company and applies the accounting and reporting guidance of the Financial Accounting Standards Board (FASB) Accounting Standards Codification Topic 946 Financial Services – Investment Companies. The financial statements have been prepared in conformity with accounting principles generally accepted in the United States of America (GAAP), which require management to make certain estimates and assumptions at the date of the financial statements. Actual results could differ from those estimates. Subsequent events, if any, through the date that the financial statements were issued have been evaluated in the preparation of the financial statements. The following summarizes the significant accounting policies of the Funds:
Investment Valuation. Investments are valued as of 4:00 p.m. Eastern time on the last calendar day of the period. The Board of Trustees (the Board) has delegated the day to day responsibility for the valuation of each Fund's investments to the Fair Value Committee (the Committee) established by each Fund's investment adviser. In accordance with valuation policies and procedures approved by the Board, each Fund attempts to obtain prices from one or more third party pricing vendors or brokers to value its investments. When current market prices, quotations or currency exchange rates are not readily available or reliable, investments will be fair valued in good faith by the Committee, in accordance with procedures adopted by the Board. Factors used in determining fair value vary by investment type and may include market or investment specific events, changes in interest rates and credit quality. The frequency with which these procedures are used cannot be predicted and they may be utilized to a significant extent. The Committee oversees each Fund's valuation policies and procedures and reports to the Board on the Committee's activities and fair value determinations. The Board monitors the appropriateness of the procedures used in valuing each Fund's investments and ratifies the fair value determinations of the Committee. Each Fund categorizes the inputs to valuation techniques used to value its investments into a disclosure hierarchy consisting of three levels as shown below:
- Level 1 – quoted prices in active markets for identical investments
- Level 2 – other significant observable inputs (including quoted prices for similar investments, interest rates, prepayment speeds, etc.)
- Level 3 – unobservable inputs (including the Fund's own assumptions based on the best information available)
Valuation techniques used to value each Fund's investments by major category are as follows. Investments in open-end mutual funds are valued at their closing net asset value (NAV) each business day and are categorized as Level 1 in the hierarchy. Debt securities, including restricted securities, are valued based on evaluated prices received from third party pricing vendors or from brokers who make markets in such securities. U.S. government and government agency obligations are valued by pricing vendors who utilize matrix pricing which considers yield or price of bonds of comparable quality, coupon, maturity and type or by broker-supplied prices. When independent prices are unavailable or unreliable, debt securities may be valued utilizing pricing methodologies which consider similar factors that would be used by third party pricing vendors. Debt securities are generally categorized as Level 2 in the hierarchy but may be Level 3 depending on the circumstances. The aggregate value of investments by input level as of September 30, 2020 is included at the end of each Fund's Schedule of Investments.
Futures contracts are valued at the settlement price established each day by the board of trade or exchange on which they are traded and are categorized as Level 1 in the hierarchy.
Investment Transactions and Income. For financial reporting purposes, the Funds' investment holdings and NAV include trades executed through the end of the last business day of the period. The NAV per share for processing shareholder transactions is calculated as of the close of business of the New York Stock Exchange (NYSE), normally 4:00 p.m. Eastern time and includes trades executed through the end of the prior business day. Gains and losses on securities sold are determined on the basis of identified cost. Income and capital gain distributions from any underlying mutual funds or exchange-traded funds (ETFs) are recorded on the ex-dividend date. Interest income is accrued as earned. Interest income includes coupon interest and amortization of premium and accretion of discount on debt securities as applicable.
Class Allocations and Expenses. Investment income, realized and unrealized capital gains and losses, common expenses of each Fund, and certain fund-level expense reductions, if any, are allocated daily on a pro-rata basis to each class based on the relative net assets of each class to the total net assets of each Fund. Each class differs with respect to distribution and service plan fees incurred. Certain expense reductions may also differ by class. For the reporting period, the allocated portion of income and expenses to each class as a percent of its average net assets may vary due to the timing of recording these transactions in relation to fluctuating net assets of the classes. Expenses directly attributable to a fund are charged to that fund. Expenses attributable to more than one fund are allocated among the respective funds on the basis of relative net assets or other appropriate methods. Expenses included in the accompanying financial statements reflect the expenses of each Fund and do not include any expenses associated with any underlying mutual funds or exchange-traded funds (ETFs). Although not included in each Fund's expenses, each Fund indirectly bears its proportionate share of any underlying mutual funds or exchange-traded funds (ETFs) expenses through the impact of these expenses on each underlying mutual fund's or exchange-traded fund's (ETFs) NAV. Expense estimates are accrued in the period to which they relate and adjustments are made when actual amounts are known.
Income Tax Information and Distributions to Shareholders. Each year, each Fund intends to qualify as a regulated investment company under Subchapter M of the Internal Revenue Code, including distributing substantially all of its taxable income and realized gains. As a result, no provision for U.S. Federal income taxes is required. Each Fund files a U.S. federal tax return, in addition to state and local tax returns as required. Each Fund's federal income tax returns are subject to examination by the Internal Revenue Service (IRS) for a period of three fiscal years after they are filed. State and local tax returns may be subject to examination for an additional fiscal year depending on the jurisdiction.
Distributions are declared and recorded on the ex-dividend date. Income and capital gain distributions are declared separately for each class. Income and capital gain distributions are determined in accordance with income tax regulations, which may differ from GAAP.
Capital accounts within the financial statements are adjusted for permanent book-tax differences. These adjustments have no impact on net assets or the results of operations. Capital accounts are not adjusted for temporary book-tax differences which will reverse in a subsequent period.
Book-tax differences are primarily due to the short-term gain distributions from the underlying mutual funds or exchange-traded funds (ETFs), futures contracts, market discount and losses deferred due to wash sales and excise tax regulations.
As of period end, the cost and unrealized appreciation (depreciation) in securities, and derivatives if applicable, for federal income tax purposes were as follows for each Fund:
| | Tax cost | Gross unrealized appreciation | Gross unrealized depreciation | Net unrealized appreciation (depreciation) |
| Fidelity Advisor Freedom Income Fund | $211,014,360 | $23,389,711 | $(1,166,787) | $22,222,924 |
| Fidelity Advisor Freedom 2005 Fund | 144,890,391 | 18,492,029 | (794,558) | 17,697,471 |
| Fidelity Advisor Freedom 2010 Fund | 329,778,936 | 49,565,697 | (1,968,671) | 47,597,026 |
| Fidelity Advisor Freedom 2015 Fund | 703,805,996 | 128,065,498 | (4,355,931) | 123,709,567 |
| Fidelity Advisor Freedom 2020 Fund | 1,738,747,086 | 318,607,262 | (12,001,561) | 306,605,701 |
| Fidelity Advisor Freedom 2025 Fund | 2,395,273,426 | 450,598,908 | (18,954,448) | 431,644,460 |
| Fidelity Advisor Freedom 2030 Fund | 2,557,619,197 | 514,276,047 | (25,369,337) | 488,906,710 |
| Fidelity Advisor Freedom 2035 Fund | 2,091,430,947 | 454,743,424 | (32,110,267) | 422,633,157 |
| Fidelity Advisor Freedom 2040 Fund | 1,848,299,855 | 428,619,419 | (32,314,796) | 396,304,623 |
| Fidelity Advisor Freedom 2045 Fund | 1,291,441,053 | 271,693,726 | (31,745,331) | 239,948,395 |
| Fidelity Advisor Freedom 2050 Fund | 1,069,906,157 | 220,399,734 | (28,183,562) | 192,216,172 |
| Fidelity Advisor Freedom 2055 Fund | 685,609,934 | 100,844,972 | (26,775,100) | 74,069,872 |
| Fidelity Advisor Freedom 2060 Fund | 247,105,781 | 27,082,043 | (10,546,575) | 16,535,468 |
| Fidelity Advisor Freedom 2065 Fund | 10,798,466 | 986,084 | (246,037) | 740,047 |
Certain of the Funds elected to defer to the next fiscal year ordinary losses recognized during the period January 1, 2020 to March 31, 2020. Loss deferrals were as follows:
| | Ordinary losses |
| Fidelity Advisor Freedom 2035 Fund | $(1,529,880) |
| Fidelity Advisor Freedom 2040 Fund | (2,598,441) |
| Fidelity Advisor Freedom 2045 Fund | (815,646) |
| Fidelity Advisor Freedom 2050 Fund | (268,998) |
| Fidelity Advisor Freedom 2055 Fund | (103,617) |
4. Derivative Instruments.
Risk Exposures and the Use of Derivative Instruments. The Funds' investment objective allows the Funds to enter into various types of derivative contracts, including futures contracts. Derivatives are investments whose value is primarily derived from underlying assets, indices or reference rates and may be transacted on an exchange or over-the-counter (OTC). Derivatives may involve a future commitment to buy or sell a specified asset based on specified terms, to exchange future cash flows at periodic intervals based on a notional principal amount, or for one party to make one or more payments upon the occurrence of specified events in exchange for periodic payments from the other party.
The Funds used derivatives to increase returns and to manage exposure to certain risks as defined below. The success of any strategy involving derivatives depends on analysis of numerous economic factors, and if the strategies for investment do not work as intended, the Funds may not achieve their objectives.
The Funds' use of derivatives increased or decreased their exposure to the following risk:
| Equity Risk | Equity risk relates to the fluctuations in the value of financial instruments as a result of changes in market prices (other than those arising from interest rate risk or foreign exchange risk), whether caused by factors specific to an individual investment, its issuer, or all factors affecting all instruments traded in a market or market segment.
|
The Funds are also exposed to additional risks from investing in derivatives, such as liquidity risk and counterparty credit risk. Liquidity risk is the risk that the Funds will be unable to close out the derivative in the open market in a timely manner. Counterparty credit risk is the risk that the counterparty will not be able to fulfill its obligation to the Funds. Counterparty credit risk related to exchange-traded futures contracts may be mitigated by the protection provided by the exchange on which they trade.
Investing in derivatives may involve greater risks than investing in the underlying assets directly and, to varying degrees, may involve risk of loss in excess of any initial investment and collateral received and amounts recognized in the Statement of Assets and Liabilities. In addition, there may be the risk that the change in value of the derivative contract does not correspond to the change in value of the underlying instrument.
Futures Contracts. A futures contract is an agreement between two parties to buy or sell a specified underlying instrument for a fixed price at a specified future date. The Funds used futures contracts to manage their exposure to the stock market.
Upon entering into a futures contract, a fund is required to deposit either cash or securities (initial margin) with a clearing broker in an amount equal to a certain percentage of the face value of the contract. Futures contracts are marked-to-market daily and subsequent daily payments (variation margin) are made or received by a fund depending on the daily fluctuations in the value of the futures contracts and are recorded as unrealized appreciation or (depreciation). This receivable and/or payable, if any, is included in daily variation margin on futures contracts in the Statement of Assets and Liabilities. Realized gain or (loss) is recorded upon the expiration or closing of a futures contract. The net realized gain (loss) and change in net unrealized appreciation (depreciation) on futures contracts during the period is presented in the Statement of Operations.
Any open futures contracts at period end are presented in the Schedule of Investments under the caption "Futures Contracts". The notional amount at value reflects each contract's exposure to the underlying instrument or index at period end and is representative of volume of activity during the period. Securities deposited to meet initial margin requirements are identified in the Schedule of Investments.
5. Purchases and Sales of Investments.
Purchases and sales of securities, other than short-term securities, are noted in the table below.
| | Purchases ($) | Sales ($) |
| Fidelity Advisor Freedom Income Fund | 37,697,981 | 36,575,625 |
| Fidelity Advisor Freedom 2005 Fund | 24,343,171 | 27,854,145 |
| Fidelity Advisor Freedom 2010 Fund | 45,923,194 | 71,080,463 |
| Fidelity Advisor Freedom 2015 Fund | 98,127,804 | 159,299,080 |
| Fidelity Advisor Freedom 2020 Fund | 235,183,005 | 380,355,246 |
| Fidelity Advisor Freedom 2025 Fund | 328,048,562 | 458,018,327 |
| Fidelity Advisor Freedom 2030 Fund | 363,996,256 | 476,028,881 |
| Fidelity Advisor Freedom 2035 Fund | 285,320,780 | 374,304,066 |
| Fidelity Advisor Freedom 2040 Fund | 221,720,911 | 323,772,055 |
| Fidelity Advisor Freedom 2045 Fund | 164,768,318 | 222,679,730 |
| Fidelity Advisor Freedom 2050 Fund | 144,138,260 | 167,990,978 |
| Fidelity Advisor Freedom 2055 Fund | 103,493,881 | 92,258,228 |
| Fidelity Advisor Freedom 2060 Fund | 53,772,148 | 31,586,908 |
| Fidelity Advisor Freedom 2065 Fund | 5,338,424 | 1,661,665 |
6. Fees and Other Transactions with Affiliates.
Management Fee and Expense Contract. Fidelity Management & Research Company LLC (the investment adviser) and its affiliates provide the Funds with investment management related services. Under the management contract, each Class of each Fund pays a monthly management fee that is set at an annual rate by referring to each Fund's target date, indicated by its name, such that the management fee rate applicable to each Class of each Fund is reduced as the fund approaches, and then passes, its target date. In addition, under the management contract, the investment adviser pays all ordinary operating expenses of each Fund, except distribution and service plan fees, fees and expenses of the independent Trustees, and certain miscellaneous expenses such as proxy and shareholder meeting expenses. For each Fund, with the exception of Fidelity Advisor Freedom 2065 Fund, the management fee is reduced by an amount equal to the fees and expenses paid by each Fund to the independent Trustees. For the reporting period, the total annual management fee rate for each Class of each Fund was as follows:
| | Annual % of Class-Level Average Net Assets (Classes A, M, C, I) | Annual % of Class-Level Average Net Assets
(Classes Z, Z6) |
| Fidelity Advisor Freedom Income Fund | .465% | .415% |
| Fidelity Advisor Freedom 2005 Fund | .465% | .415% |
| Fidelity Advisor Freedom 2010 Fund | .508% | .448% |
| Fidelity Advisor Freedom 2015 Fund | .550% | .482% |
| Fidelity Advisor Freedom 2020 Fund | .593% | .517% |
| Fidelity Advisor Freedom 2025 Fund | .635% | .552% |
| Fidelity Advisor Freedom 2030 Fund | .678% | .587% |
| Fidelity Advisor Freedom 2035 Fund | .720% | .622% |
| Fidelity Advisor Freedom 2040 Fund | .746% | .643% |
| Fidelity Advisor Freedom 2045 Fund | .746% | .643% |
| Fidelity Advisor Freedom 2050 Fund | .746% | .643% |
| Fidelity Advisor Freedom 2055 Fund | .746% | .643% |
| Fidelity Advisor Freedom 2060 Fund | .746% | .643% |
| Fidelity Advisor Freedom 2065 Fund | .746% | .643% |
Under the expense contract, the investment adviser pays class-level expenses for Class Z6 of each Fund as necessary so that Class Z6 total expenses do not exceed certain amounts of Class Z6 average net assets on an annual basis with certain exceptions, as noted in the following table:
| | Annual % of Class-Level Average Net Assets (Class Z6) |
| Fidelity Advisor Freedom Income Fund | .365% |
| Fidelity Advisor Freedom 2005 Fund | .365% |
| Fidelity Advisor Freedom 2010 Fund | .384% |
| Fidelity Advisor Freedom 2015 Fund | .404% |
| Fidelity Advisor Freedom 2020 Fund | .423% |
| Fidelity Advisor Freedom 2025 Fund | .443% |
| Fidelity Advisor Freedom 2030 Fund | .462% |
| Fidelity Advisor Freedom 2035 Fund | .481% |
| Fidelity Advisor Freedom 2040 Fund | .493% |
| Fidelity Advisor Freedom 2045 Fund | .493% |
| Fidelity Advisor Freedom 2050 Fund | .493% |
| Fidelity Advisor Freedom 2055 Fund | .493% |
| Fidelity Advisor Freedom 2060 Fund | .493% |
| Fidelity Advisor Freedom 2065 Fund | .493% |
Distribution and Service Plan Fees. In accordance with Rule 12b-1 of the 1940 Act, each Fund has adopted separate Distribution and Service Plans for each class of shares. Certain classes pay Fidelity Distributors Company LLC (FDC), an affiliate of the investment adviser, separate Distribution and Service Fees, each of which is based on an annual percentage of each class' average net assets. In addition, FDC may pay financial intermediaries for selling shares of each Fund and providing shareholder support services. For the period, the Distribution and Service Fee rates, total fees and amounts retained by FDC were as follows:
| | Distribution Fee | Service Fee | Total Fees | Retained by FDC |
| Fidelity Advisor Freedom Income Fund | | | | |
| Class A | -% | .25% | $81,944 | $1,929 |
| Class M | .25% | .25% | 95,624 | 267 |
| Class C | .75% | .25% | 39,597 | 6,346 |
| | | | $217,165 | $8,542 |
| Fidelity Advisor Freedom 2005 Fund | | | | |
| Class A | -% | .25% | $97,858 | $3,373 |
| Class M | .25% | .25% | 55,600 | 763 |
| Class C | .75% | .25% | 8,537 | 876 |
| | | | $161,995 | $5,012 |
| Fidelity Advisor Freedom 2010 Fund | | | | |
| Class A | -% | .25% | $212,626 | $11,991 |
| Class M | .25% | .25% | 169,238 | 3,005 |
| Class C | .75% | .25% | 42,115 | 2,006 |
| | | | $423,979 | $17,002 |
| Fidelity Advisor Freedom 2015 Fund | | | | |
| Class A | -% | .25% | $475,812 | $16,404 |
| Class M | .25% | .25% | 328,678 | 3,864 |
| Class C | .75% | .25% | 107,403 | 8,776 |
| | | | $911,893 | $29,044 |
| Fidelity Advisor Freedom 2020 Fund | | | | |
| Class A | -% | .25% | $1,077,226 | $37,808 |
| Class M | .25% | .25% | 746,534 | 4,809 |
| Class C | .75% | .25% | 249,591 | 26,118 |
| | | | $2,073,351 | $68,735 |
| Fidelity Advisor Freedom 2025 Fund | | | | |
| Class A | -% | .25% | $1,444,129 | $39,646 |
| Class M | .25% | .25% | 994,636 | 7,095 |
| Class C | .75% | .25% | 281,185 | 41,569 |
| | | | $2,719,950 | $88,310 |
| Fidelity Advisor Freedom 2030 Fund | | | | |
| Class A | -% | .25% | $1,467,261 | $39,311 |
| Class M | .25% | .25% | 1,094,293 | 9,633 |
| Class C | .75% | .25% | 310,344 | 41,235 |
| | | | $2,871,898 | $90,179 |
| Fidelity Advisor Freedom 2035 Fund | | | | |
| Class A | -% | .25% | $1,186,448 | $31,301 |
| Class M | .25% | .25% | 896,363 | 4,235 |
| Class C | .75% | .25% | 217,475 | 36,376 |
| | | | $2,300,286 | $71,912 |
| Fidelity Advisor Freedom 2040 Fund | | | | |
| Class A | -% | .25% | $1,056,036 | $28,109 |
| Class M | .25% | .25% | 825,722 | 4,048 |
| Class C | .75% | .25% | 238,897 | 28,514 |
| | | | $2,120,655 | $60,671 |
| Fidelity Advisor Freedom 2045 Fund | | | | |
| Class A | -% | .25% | $666,716 | $19,620 |
| Class M | .25% | .25% | 520,508 | 2,978 |
| Class C | .75% | .25% | 132,661 | 21,694 |
| | | | $1,319,885 | $44,292 |
| Fidelity Advisor Freedom 2050 Fund | | | | |
| Class A | -% | .25% | $531,428 | $14,335 |
| Class M | .25% | .25% | 414,691 | 2,299 |
| Class C | .75% | .25% | 129,271 | 22,713 |
| | | | $1,075,390 | $39,347 |
| Fidelity Advisor Freedom 2055 Fund | | | | |
| Class A | -% | .25% | $296,360 | $6,990 |
| Class M | .25% | .25% | 223,610 | 723 |
| Class C | .75% | .25% | 61,769 | 13,296 |
| | | | $581,739 | $21,009 |
| Fidelity Advisor Freedom 2060 Fund | | | | |
| Class A | -% | .25% | $104,222 | $3,112 |
| Class M | .25% | .25% | 68,505 | 13 |
| Class C | .75% | .25% | 25,396 | 8,234 |
| | | | $198,123 | $11,359 |
| Fidelity Advisor Freedom 2065 Fund | | | | |
| Class A | -% | .25% | $4,342 | $240 |
| Class M | .25% | .25% | 1,276 | 422 |
| Class C | .75% | .25% | 1,172 | 1,168 |
| | | | $6,790 | $1,830 |
Sales Load. FDC may receive a front-end sales charge of up to 5.75% for selling Class A shares and 3.50% for selling Class M shares, some of which is paid to financial intermediaries for selling shares of each Fund. Depending on the holding period, FDC may receive contingent deferred sales charges levied on Class A, Class M and Class C redemptions. The deferred sales charges are 1.00% for Class C shares, 1.00% for certain purchases of Class A shares and .25% for certain purchases of Class M shares.
For the period, sales charge amounts retained by FDC were as follows:
| | Retained by FDC |
| Fidelity Advisor Freedom Income Fund | |
| Class A | $4,357 |
| Class M | 338 |
| Class C(a) | 1,043 |
| | $5,738 |
| Fidelity Advisor Freedom 2005 Fund | |
| Class A | $3,296 |
| Class M | 327 |
| Class C(a) | 851 |
| | $4,474 |
| Fidelity Advisor Freedom 2010 Fund | |
| Class A | $3,068 |
| Class M | 465 |
| Class C(a) | 354 |
| | $3,887 |
| Fidelity Advisor Freedom 2015 Fund | |
| Class A | $4,866 |
| Class M | 344 |
| Class C(a) | 158 |
| | $5,368 |
| Fidelity Advisor Freedom 2020 Fund | |
| Class A | $13,067 |
| Class M | 6,116 |
| Class C(a) | 2,150 |
| | $21,333 |
| Fidelity Advisor Freedom 2025 Fund | |
| Class A | $36,899 |
| Class M | 8,658 |
| Class C(a) | 6,747 |
| | $52,304 |
| Fidelity Advisor Freedom 2030 Fund | |
| Class A | $39,852 |
| Class M | 11,158 |
| Class C(a) | 3,499 |
| | $54,509 |
| Fidelity Advisor Freedom 2035 Fund | |
| Class A | $30,919 |
| Class M | 9,861 |
| Class C(a) | 3,511 |
| | $44,291 |
| Fidelity Advisor Freedom 2040 Fund | |
| Class A | $34,707 |
| Class M | 8,825 |
| Class C(a) | 2,668 |
| | $46,200 |
| Fidelity Advisor Freedom 2045 Fund | |
| Class A | $25,139 |
| Class M | 6,302 |
| Class C(a) | 1,322 |
| | $32,763 |
| Fidelity Advisor Freedom 2050 Fund | |
| Class A | $29,572 |
| Class M | 6,018 |
| Class C(a) | 1,447 |
| | $37,037 |
| Fidelity Advisor Freedom 2055 Fund | |
| Class A | $19,757 |
| Class M | 4,436 |
| Class C(a) | 1,189 |
| | $25,382 |
| Fidelity Advisor Freedom 2060 Fund | |
| Class A | $11,487 |
| Class M | 2,072 |
| Class C(a) | 775 |
| | $14,334 |
| Fidelity Advisor Freedom 2065 Fund | |
| Class A | $1,996 |
| Class M | 118 |
| | $2,114 |
(a) When Class C shares are initially sold, FDC pays commissions from its own resources to financial intermediaries through which the sales are made.
Interfund Trades. Funds may purchase from or sell securities to other Fidelity Funds under procedures adopted by the Board. The procedures have been designed to ensure these interfund trades are executed in accordance with Rule 17a-7 of the 1940 Act. Interfund trades are included within the respective purchases and sales amounts shown in the Purchases and Sales of Investments note.
Other. During the period, the investment adviser reimbursed the Funds for certain losses, which are included in Net Realized Gain (Loss) in each Fund's accompanying Statement of Operations, as follows:
| | Amount |
| Fidelity Advisor Freedom 2040 Fund | $166,798 |
| Fidelity Advisor Freedom 2045 Fund | 103,796 |
| Fidelity Advisor Freedom 2050 Fund | 90,316 |
| Fidelity Advisor Freedom 2055 Fund | 44,484 |
| Fidelity Advisor Freedom 2060 Fund | 13,480 |
7. Expense Reductions.
Through arrangements with each applicable Fund's custodian, credits realized as a result of certain uninvested cash balances were used to reduce each applicable Fund's or class' expenses. All of the applicable expense reductions are noted in the table below.
| | Custodian credits |
| Fidelity Advisor Freedom Income Fund | $244 |
| Fidelity Advisor Freedom 2005 Fund | 239 |
| Fidelity Advisor Freedom 2010 Fund | 212 |
| Fidelity Advisor Freedom 2015 Fund | 186 |
| Fidelity Advisor Freedom 2020 Fund | 163 |
| Fidelity Advisor Freedom 2025 Fund | 139 |
| Fidelity Advisor Freedom 2030 Fund | 105 |
| Fidelity Advisor Freedom 2035 Fund | 133 |
| Fidelity Advisor Freedom 2040 Fund | 135 |
| Fidelity Advisor Freedom 2045 Fund | 197 |
| Fidelity Advisor Freedom 2050 Fund | 194 |
| Fidelity Advisor Freedom 2055 Fund | 206 |
| Fidelity Advisor Freedom 2060 Fund | 93 |
8. Distributions to Shareholders.
Distributions to shareholders of each class were as follows:
| | Six months ended
September 30, 2020 | Year ended
March 31, 2020 |
| Fidelity Advisor Freedom Income Fund | | |
| Distributions to shareholders | | |
| Class A | $970,711 | $2,423,973 |
| Class M | 523,090 | 1,282,366 |
| Class C | 94,102 | 224,542 |
| Class I | 1,453,849 | 3,187,584 |
| Class Z | 67,689 | 83,117 |
| Class Z6 | 361,524 | 919,934 |
| Total | $3,470,965 | $8,121,516 |
| Fidelity Advisor Freedom 2005 Fund | | |
| Distributions to shareholders | | |
| Class A | $1,678,254 | $3,926,643 |
| Class M | 479,995 | 1,036,707 |
| Class C | 33,309 | 72,965 |
| Class I | 1,092,693 | 2,453,070 |
| Class Z | 66,933 | 95,869 |
| Class Z6 | 62,457 | 106,803 |
| Total | $3,413,641 | $7,692,057 |
| Fidelity Advisor Freedom 2010 Fund | | |
| Distributions to shareholders | | |
| Class A | $4,616,734 | $10,723,120 |
| Class M | 1,778,636 | 3,931,541 |
| Class C | 219,790 | 507,619 |
| Class I | 3,102,743 | 7,362,100 |
| Class Z | 170,638 | 279,212 |
| Class Z6 | 258,886 | 523,761 |
| Total | $10,147,427 | $23,327,353 |
| Fidelity Advisor Freedom 2015 Fund | | |
| Distributions to shareholders | | |
| Class A | $13,893,967 | $30,206,562 |
| Class M | 4,749,811 | 9,667,183 |
| Class C | 745,916 | 1,619,054 |
| Class I | 9,238,605 | 19,784,592 |
| Class Z | 597,821 | 950,751 |
| Class Z6 | 578,402 | 1,242,355 |
| Total | $29,804,522 | $63,470,497 |
| Fidelity Advisor Freedom 2020 Fund | | |
| Distributions to shareholders | | |
| Class A | $32,144,798 | $66,525,410 |
| Class M | 10,813,981 | 21,770,194 |
| Class C | 1,784,413 | 3,483,167 |
| Class I | 26,695,082 | 53,090,515 |
| Class Z | 1,342,006 | 1,673,674 |
| Class Z6 | 2,416,143 | 3,930,457 |
| Total | $75,196,423 | $150,473,417 |
| Fidelity Advisor Freedom 2025 Fund | | |
| Distributions to shareholders | | |
| Class A | $39,084,509 | $83,960,534 |
| Class M | 13,399,996 | 26,603,535 |
| Class C | 1,929,437 | 3,684,828 |
| Class I | 34,740,512 | 70,900,166 |
| Class Z | 1,444,106 | 1,699,890 |
| Class Z6 | 3,113,580 | 4,819,160 |
| Total | $93,712,140 | $191,668,113 |
| Fidelity Advisor Freedom 2030 Fund | | |
| Distributions to shareholders | | |
| Class A | $43,296,783 | $87,803,333 |
| Class M | 16,104,865 | 31,097,792 |
| Class C | 2,263,519 | 4,193,696 |
| Class I | 41,671,339 | 80,313,250 |
| Class Z | 1,642,068 | 1,759,031 |
| Class Z6 | 3,619,672 | 5,491,649 |
| Total | $108,598,246 | $210,658,751 |
| Fidelity Advisor Freedom 2035 Fund | | |
| Distributions to shareholders | | |
| Class A | $37,761,913 | $75,561,562 |
| Class M | 14,482,911 | 26,999,735 |
| Class C | 1,785,219 | 3,076,003 |
| Class I | 37,170,931 | 70,940,899 |
| Class Z | 1,285,679 | 1,304,695 |
| Class Z6 | 2,968,285 | 4,306,379 |
| Total | $95,454,938 | $182,189,273 |
| Fidelity Advisor Freedom 2040 Fund | | |
| Distributions to shareholders | | |
| Class A | $34,943,735 | $65,818,691 |
| Class M | 13,823,805 | 24,948,228 |
| Class C | 2,033,089 | 3,509,869 |
| Class I | 33,865,094 | 61,089,389 |
| Class Z | 950,790 | 789,261 |
| Class Z6 | 2,769,614 | 3,850,649 |
| Total | $88,386,127 | $160,006,087 |
| Fidelity Advisor Freedom 2045 Fund | | |
| Distributions to shareholders | | |
| Class A | $19,759,842 | $38,958,921 |
| Class M | 7,910,733 | 14,899,798 |
| Class C | 996,936 | 1,718,304 |
| Class I | 22,615,029 | 43,814,200 |
| Class Z | 732,793 | 640,990 |
| Class Z6 | 1,967,123 | 2,838,378 |
| Total | $53,982,456 | $102,870,591 |
| Fidelity Advisor Freedom 2050 Fund | | |
| Distributions to shareholders | | |
| Class A | $15,943,654 | $29,698,088 |
| Class M | 6,362,824 | 11,795,835 |
| Class C | 979,953 | 1,660,794 |
| Class I | 19,342,644 | 36,991,678 |
| Class Z | 496,451 | 361,923 |
| Class Z6 | 1,514,213 | 1,930,737 |
| Total | $44,639,739 | $82,439,055 |
| Fidelity Advisor Freedom 2055 Fund | | |
| Distributions to shareholders | | |
| Class A | $8,500,695 | $14,501,911 |
| Class M | 3,236,491 | 5,537,976 |
| Class C | 437,951 | 686,009 |
| Class I | 11,780,864 | 22,820,123 |
| Class Z | 258,356 | 182,309 |
| Class Z6 | 1,023,227 | 1,125,155 |
| Total | $25,237,584 | $44,853,483 |
| Fidelity Advisor Freedom 2060 Fund | | |
| Distributions to shareholders | | |
| Class A | $2,591,840 | $3,975,561 |
| Class M | 856,255 | 1,289,398 |
| Class C | 158,245 | 231,466 |
| Class I | 3,515,246 | 5,368,074 |
| Class Z | 61,063 | 48,289 |
| Class Z6 | 290,253 | 251,539 |
| Total | $7,472,902 | $11,164,327 |
| Fidelity Advisor Freedom 2065 Fund(a) | | |
| Distributions to shareholders | | |
| Class A | $35,977 | $16,986 |
| Class M | 5,346 | 3,436 |
| Class C | 2,732 | 2,276 |
| Class I | 41,306 | 23,019 |
| Class Z | 2,661 | 3,116 |
| Class Z6 | 12,874 | 5,332 |
| Total | $100,896 | $54,165 |
(a) For the period June 28, 2019 (commencement of operations) to March 31, 2020.
9. Share Transactions.
Share transactions for each class were as follows and may contain automatic conversions between classes or exchanges between affiliated funds:
| | Shares | Shares | Dollars | Dollars |
| | Six months ended September 30, 2020 | Year ended March 31, 2020 | Six months ended September 30, 2020 | Year ended March 31, 2020 |
| Fidelity Advisor Freedom Income Fund | | | | |
| Class A | | | | |
| Shares sold | 760,435 | 1,474,305 | $8,367,026 | $16,054,996 |
| Reinvestment of distributions | 88,380 | 217,652 | 949,448 | 2,374,345 |
| Shares redeemed | (778,568) | (2,296,205) | (8,552,029) | (24,989,979) |
| Net increase (decrease) | 70,247 | (604,248) | $764,445 | $(6,560,638) |
| Class M | | | | |
| Shares sold | 386,721 | 1,045,095 | $4,249,333 | $11,406,267 |
| Reinvestment of distributions | 48,062 | 115,197 | 514,934 | 1,255,169 |
| Shares redeemed | (424,164) | (1,255,464) | (4,660,488) | (13,615,186) |
| Net increase (decrease) | 10,619 | (95,172) | $103,779 | $(953,750) |
| Class C | | | | |
| Shares sold | 79,538 | 148,130 | $884,462 | $1,625,978 |
| Reinvestment of distributions | 8,175 | 19,450 | 87,035 | 211,662 |
| Shares redeemed | (117,698) | (242,456) | (1,294,411) | (2,631,225) |
| Net increase (decrease) | (29,985) | (74,876) | $(322,914) | $(793,585) |
| Class I | | | | |
| Shares sold | 1,410,563 | 2,861,021 | $15,536,197 | $31,331,217 |
| Reinvestment of distributions | 131,637 | 285,448 | 1,421,388 | 3,126,751 |
| Shares redeemed | (1,571,801) | (2,935,596) | (17,527,965) | (31,912,962) |
| Net increase (decrease) | (29,601) | 210,873 | $(570,380) | $2,545,006 |
| Class Z | | | | |
| Shares sold | 651,202 | 349,390 | $7,295,544 | $3,804,519 |
| Reinvestment of distributions | 5,391 | 7,553 | 58,354 | 83,116 |
| Shares redeemed | (202,719) | (130,745) | (2,290,603) | (1,438,486) |
| Net increase (decrease) | 453,874 | 226,198 | $5,063,295 | $2,449,149 |
| Class Z6 | | | | |
| Shares sold | 385,120 | 213,312 | $4,232,242 | $2,437,545 |
| Reinvestment of distributions | 33,523 | 59,710 | 361,524 | 663,526 |
| Shares redeemed | (553,613) | (575,524) | (6,059,802) | (6,297,794) |
| Net increase (decrease) | (134,970) | (302,502) | $(1,466,036) | $(3,196,723) |
| Fidelity Advisor Freedom 2005 Fund | | | | |
| Class A | | | | |
| Shares sold | 609,644 | 2,126,648 | $6,987,752 | $24,477,847 |
| Reinvestment of distributions | 147,697 | 333,117 | 1,626,130 | 3,811,456 |
| Shares redeemed | (806,375) | (3,285,468) | (9,249,159) | (37,868,950) |
| Net increase (decrease) | (49,034) | (825,703) | $(635,277) | $(9,579,647) |
| Class M | | | | |
| Shares sold | 239,490 | 675,503 | $2,738,209 | $7,757,805 |
| Reinvestment of distributions | 43,573 | 90,492 | 479,302 | 1,035,277 |
| Shares redeemed | (506,708) | (818,053) | (5,763,183) | (9,258,163) |
| Net increase (decrease) | (223,645) | (52,058) | $(2,545,672) | $(465,081) |
| Class C | | | | |
| Shares sold | 6,470 | 27,850 | $73,353 | $321,622 |
| Reinvestment of distributions | 2,801 | 5,945 | 30,891 | 68,180 |
| Shares redeemed | (13,647) | (85,228) | (156,088) | (967,289) |
| Net increase (decrease) | (4,376) | (51,433) | $(51,844) | $(577,487) |
| Class I | | | | |
| Shares sold | 758,304 | 1,895,410 | $8,664,583 | $21,602,810 |
| Reinvestment of distributions | 97,997 | 212,052 | 1,086,791 | 2,447,375 |
| Shares redeemed | (748,286) | (2,098,573) | (8,680,891) | (24,092,280) |
| Net increase (decrease) | 108,015 | 8,889 | $1,070,483 | $(42,095) |
| Class Z | | | | |
| Shares sold | 85,195 | 330,618 | $990,635 | $3,792,311 |
| Reinvestment of distributions | 6,068 | 8,317 | 66,933 | 95,869 |
| Shares redeemed | (44,060) | (87,924) | (518,257) | (996,354) |
| Net increase (decrease) | 47,203 | 251,011 | $539,311 | $2,891,826 |
| Class Z6 | | | | |
| Shares sold | 103,118 | 215,744 | $1,199,500 | $2,504,485 |
| Reinvestment of distributions | 5,647 | 9,274 | 62,457 | 106,802 |
| Shares redeemed | (36,239) | (143,631) | (422,250) | (1,615,249) |
| Net increase (decrease) | 72,526 | 81,387 | $839,707 | $996,038 |
| Fidelity Advisor Freedom 2010 Fund | | | | |
| Class A | | | | |
| Shares sold | 891,812 | 2,653,509 | $10,419,549 | $31,374,639 |
| Reinvestment of distributions | 406,922 | 895,022 | 4,545,303 | 10,562,784 |
| Shares redeemed | (2,169,285) | (5,564,975) | (25,345,031) | (65,684,572) |
| Net increase (decrease) | (870,551) | (2,016,444) | $(10,380,179) | $(23,747,149) |
| Class M | | | | |
| Shares sold | 357,120 | 1,039,036 | $4,148,979 | $12,253,878 |
| Reinvestment of distributions | 159,500 | 333,353 | 1,773,640 | 3,920,662 |
| Shares redeemed | (781,411) | (1,555,210) | (9,086,098) | (18,091,595) |
| Net increase (decrease) | (264,791) | (182,821) | $(3,163,479) | $(1,917,055) |
| Class C | | | | |
| Shares sold | 14,690 | 104,548 | $171,104 | $1,225,693 |
| Reinvestment of distributions | 19,236 | 42,133 | 213,139 | 493,186 |
| Shares redeemed | (117,267) | (301,798) | (1,351,091) | (3,480,292) |
| Net increase (decrease) | (83,341) | (155,117) | $(966,848) | $(1,761,413) |
| Class I | | | | |
| Shares sold | 948,712 | 2,389,125 | $11,102,177 | $28,347,243 |
| Reinvestment of distributions | 270,759 | 606,022 | 3,035,204 | 7,181,497 |
| Shares redeemed | (1,487,535) | (4,367,927) | (17,542,645) | (51,980,482) |
| Net increase (decrease) | (268,064) | (1,372,780) | $(3,405,264) | $(16,451,742) |
| Class Z | | | | |
| Shares sold | 71,362 | 555,656 | $826,315 | $6,535,070 |
| Reinvestment of distributions | 15,148 | 23,193 | 168,900 | 275,209 |
| Shares redeemed | (49,858) | (62,574) | (581,885) | (732,555) |
| Net increase (decrease) | 36,652 | 516,275 | $413,330 | $6,077,724 |
| Class Z6 | | | | |
| Shares sold | 223,607 | 391,370 | $2,681,339 | $4,701,985 |
| Reinvestment of distributions | 23,156 | 44,154 | 258,886 | 523,761 |
| Shares redeemed | (160,196) | (231,568) | (1,857,994) | (2,750,758) |
| Net increase (decrease) | 86,567 | 203,956 | $1,082,231 | $2,474,988 |
| Fidelity Advisor Freedom 2015 Fund | | | | |
| Class A | | | | |
| Shares sold | 1,649,522 | 4,402,418 | $18,884,685 | $52,165,534 |
| Reinvestment of distributions | 1,262,272 | 2,543,008 | 13,758,765 | 29,945,413 |
| Shares redeemed | (4,428,930) | (13,727,846) | (50,697,814) | (161,245,372) |
| Net increase (decrease) | (1,517,136) | (6,782,420) | $(18,054,364) | $(79,134,425) |
| Class M | | | | |
| Shares sold | 531,340 | 1,450,657 | $6,126,161 | $17,063,991 |
| Reinvestment of distributions | 434,812 | 817,435 | 4,726,404 | 9,607,065 |
| Shares redeemed | (1,356,976) | (3,610,651) | (15,517,913) | (42,260,524) |
| Net increase (decrease) | (390,824) | (1,342,559) | $(4,665,348) | $(15,589,468) |
| Class C | | | | |
| Shares sold | 72,527 | 175,415 | $826,382 | $2,043,567 |
| Reinvestment of distributions | 68,510 | 137,152 | 740,592 | 1,599,094 |
| Shares redeemed | (227,140) | (1,092,284) | (2,599,135) | (12,767,811) |
| Net increase (decrease) | (86,103) | (779,717) | $(1,032,161) | $(9,125,150) |
| Class I | | | | |
| Shares sold | 1,813,491 | 5,287,109 | $20,973,250 | $62,997,820 |
| Reinvestment of distributions | 829,130 | 1,636,083 | 9,112,144 | 19,437,229 |
| Shares redeemed | (3,723,258) | (10,477,798) | (43,519,890) | (124,546,232) |
| Net increase (decrease) | (1,080,637) | (3,554,606) | $(13,434,496) | $(42,111,183) |
| Class Z | | | | |
| Shares sold | 290,824 | 1,597,817 | $3,368,693 | $18,810,995 |
| Reinvestment of distributions | 52,631 | 75,903 | 574,735 | 904,608 |
| Shares redeemed | (374,954) | (299,339) | (4,315,866) | (3,522,651) |
| Net increase (decrease) | (31,499) | 1,374,381 | $(372,438) | $16,192,952 |
| Class Z6 | | | | |
| Shares sold | 466,937 | 683,392 | $5,380,310 | $8,108,663 |
| Reinvestment of distributions | 52,121 | 102,968 | 571,247 | 1,220,747 |
| Shares redeemed | (220,426) | (750,829) | (2,481,123) | (8,868,598) |
| Net increase (decrease) | 298,632 | 35,531 | $3,470,434 | $460,812 |
| Fidelity Advisor Freedom 2020 Fund | | | | |
| Class A | | | | |
| Shares sold | 4,531,042 | 12,498,182 | $56,622,129 | $162,411,933 |
| Reinvestment of distributions | 2,660,056 | 5,079,983 | 31,707,866 | 65,809,040 |
| Shares redeemed | (10,274,202) | (28,851,632) | (129,451,823) | (371,420,567) |
| Net increase (decrease) | (3,083,104) | (11,273,467) | $(41,121,828) | $(143,199,594) |
| Class M | | | | |
| Shares sold | 1,538,270 | 4,286,801 | $19,392,874 | $55,583,047 |
| Reinvestment of distributions | 903,042 | 1,671,581 | 10,755,227 | 21,651,546 |
| Shares redeemed | (3,370,841) | (8,770,608) | (42,531,092) | (112,935,739) |
| Net increase (decrease) | (929,529) | (2,812,226) | $(12,382,991) | $(35,701,146) |
| Class C | | | | |
| Shares sold | 272,791 | 552,093 | $3,377,772 | $7,120,558 |
| Reinvestment of distributions | 148,123 | 265,912 | 1,749,338 | 3,410,332 |
| Shares redeemed | (595,746) | (1,684,099) | (7,401,728) | (21,619,753) |
| Net increase (decrease) | (174,832) | (866,094) | $(2,274,618) | $(11,088,863) |
| Class I | | | | |
| Shares sold | 6,222,538 | 15,187,982 | $78,714,801 | $198,644,077 |
| Reinvestment of distributions | 2,188,717 | 3,997,350 | 26,308,377 | 52,236,295 |
| Shares redeemed | (10,356,172) | (24,252,070) | (133,030,894) | (315,446,604) |
| Net increase (decrease) | (1,944,917) | (5,066,738) | $(28,007,716) | $(64,566,232) |
| Class Z | | | | |
| Shares sold | 360,658 | 2,921,609 | $4,521,489 | $38,182,521 |
| Reinvestment of distributions | 110,652 | 124,275 | 1,320,077 | 1,629,425 |
| Shares redeemed | (294,677) | (397,746) | (3,715,241) | (5,086,628) |
| Net increase (decrease) | 176,633 | 2,648,138 | $2,126,325 | $34,725,318 |
| Class Z6 | | | | |
| Shares sold | 1,212,745 | 2,133,469 | $15,462,441 | $27,982,829 |
| Reinvestment of distributions | 199,479 | 298,986 | 2,387,769 | 3,907,905 |
| Shares redeemed | (958,414) | (1,017,958) | (12,182,783) | (13,058,618) |
| Net increase (decrease) | 453,810 | 1,414,497 | $5,667,427 | $18,832,116 |
| Fidelity Advisor Freedom 2025 Fund | | | | |
| Class A | | | | |
| Shares sold | 7,896,389 | 17,315,893 | $100,100,580 | $225,669,707 |
| Reinvestment of distributions | 3,256,916 | 6,441,432 | 38,887,577 | 83,564,674 |
| Shares redeemed | (12,460,409) | (33,768,087) | (158,729,751) | (434,599,449) |
| Net increase (decrease) | (1,307,104) | (10,010,762) | $(19,741,594) | $(125,365,068) |
| Class M | | | | |
| Shares sold | 2,241,408 | 5,595,595 | $28,414,050 | $72,849,182 |
| Reinvestment of distributions | 1,113,404 | 2,029,720 | 13,316,311 | 26,386,492 |
| Shares redeemed | (4,458,521) | (8,866,357) | (57,074,974) | (115,146,507) |
| Net increase (decrease) | (1,103,709) | (1,241,042) | $(15,344,613) | $(15,910,833) |
| Class C | | | | |
| Shares sold | 284,445 | 782,061 | $3,563,154 | $9,966,650 |
| Reinvestment of distributions | 162,008 | 284,019 | 1,900,355 | 3,620,205 |
| Shares redeemed | (605,185) | (1,578,414) | (7,572,555) | (19,998,108) |
| Net increase (decrease) | (158,732) | (512,334) | $(2,109,046) | $(6,411,253) |
| Class I | | | | |
| Shares sold | 8,954,692 | 23,304,850 | $114,646,576 | $306,164,622 |
| Reinvestment of distributions | 2,828,780 | 5,301,356 | 34,115,092 | 69,500,571 |
| Shares redeemed | (13,203,867) | (30,671,243) | (171,078,894) | (400,738,293) |
| Net increase (decrease) | (1,420,395) | (2,065,037) | $(22,317,226) | $(25,073,100) |
| Class Z | | | | |
| Shares sold | 454,492 | 3,394,075 | $5,694,837 | $44,603,333 |
| Reinvestment of distributions | 120,633 | 128,889 | 1,442,770 | 1,697,164 |
| Shares redeemed | (339,054) | (620,071) | (4,320,551) | (7,982,193) |
| Net increase (decrease) | 236,071 | 2,902,893 | $2,817,056 | $38,318,304 |
| Class Z6 | | | | |
| Shares sold | 1,853,279 | 3,497,762 | $23,438,040 | $46,291,426 |
| Reinvestment of distributions | 258,418 | 376,735 | 3,103,597 | 4,935,899 |
| Shares redeemed | (1,036,291) | (1,482,373) | (13,384,686) | (19,297,811) |
| Net increase (decrease) | 1,075,406 | 2,392,124 | $13,156,951 | $31,929,514 |
| Fidelity Advisor Freedom 2030 Fund | | | | |
| Class A | | | | |
| Shares sold | 7,055,340 | 16,206,403 | $95,548,665 | $226,539,374 |
| Reinvestment of distributions | 3,382,952 | 6,265,438 | 42,963,484 | 87,212,669 |
| Shares redeemed | (11,284,440) | (28,547,452) | (154,383,480) | (393,579,788) |
| Net increase (decrease) | (846,148) | (6,075,611) | $(15,871,331) | $(79,827,745) |
| Class M | | | | |
| Shares sold | 2,566,459 | 6,485,892 | $34,567,055 | $90,170,952 |
| Reinvestment of distributions | 1,265,889 | 2,224,684 | 15,975,521 | 30,795,975 |
| Shares redeemed | (4,119,910) | (9,040,278) | (55,476,191) | (124,863,441) |
| Net increase (decrease) | (287,562) | (329,702) | $(4,933,615) | $(3,896,514) |
| Class C | | | | |
| Shares sold | 311,149 | 808,317 | $4,124,399 | $11,113,474 |
| Reinvestment of distributions | 180,353 | 303,489 | 2,238,186 | 4,134,298 |
| Shares redeemed | (496,537) | (1,298,218) | (6,543,266) | (17,796,138) |
| Net increase (decrease) | (5,035) | (186,412) | $(180,681) | $(2,548,366) |
| Class I | | | | |
| Shares sold | 9,749,296 | 22,989,540 | $132,724,755 | $322,959,549 |
| Reinvestment of distributions | 3,172,199 | 5,564,283 | 40,508,983 | 78,045,729 |
| Shares redeemed | (13,191,803) | (27,132,171) | (183,504,571) | (380,597,580) |
| Net increase (decrease) | (270,308) | 1,421,652 | $(10,270,833) | $20,407,698 |
| Class Z | | | | |
| Shares sold | 535,910 | 3,216,856 | $7,179,444 | $44,863,622 |
| Reinvestment of distributions | 129,187 | 124,056 | 1,638,094 | 1,756,540 |
| Shares redeemed | (275,081) | (433,722) | (3,734,066) | (6,132,293) |
| Net increase (decrease) | 390,016 | 2,907,190 | $5,083,472 | $40,487,869 |
| Class Z6 | | | | |
| Shares sold | 1,700,826 | 3,290,469 | $23,326,440 | $46,464,736 |
| Reinvestment of distributions | 284,343 | 391,952 | 3,616,839 | 5,510,782 |
| Shares redeemed | (782,062) | (1,151,322) | (10,739,720) | (16,177,112) |
| Net increase (decrease) | 1,203,107 | 2,531,099 | $16,203,559 | $35,798,406 |
| Fidelity Advisor Freedom 2035 Fund | | | | |
| Class A | | | | |
| Shares sold | 6,100,722 | 14,424,285 | $78,928,740 | $194,409,564 |
| Reinvestment of distributions | 3,123,861 | 5,596,454 | 37,580,052 | 75,230,574 |
| Shares redeemed | (9,552,033) | (23,625,076) | (125,095,661) | (313,294,772) |
| Net increase (decrease) | (327,450) | (3,604,337) | $(8,586,869) | $(43,654,634) |
| Class M | | | | |
| Shares sold | 2,368,617 | 5,593,464 | $30,401,323 | $74,655,471 |
| Reinvestment of distributions | 1,213,502 | 2,020,285 | 14,416,398 | 26,865,170 |
| Shares redeemed | (3,662,208) | (7,432,819) | (47,585,426) | (98,813,575) |
| Net increase (decrease) | (80,089) | 180,930 | $(2,767,705) | $2,707,066 |
| Class C | | | | |
| Shares sold | 280,798 | 606,636 | $3,506,284 | $7,886,217 |
| Reinvestment of distributions | 151,709 | 232,876 | 1,761,339 | 3,028,444 |
| Shares redeemed | (384,451) | (801,700) | (4,815,625) | (10,409,900) |
| Net increase (decrease) | 48,056 | 37,812 | $451,998 | $504,761 |
| Class I | | | | |
| Shares sold | 9,215,734 | 21,186,294 | $119,696,321 | $286,873,574 |
| Reinvestment of distributions | 2,963,891 | 5,048,332 | 35,981,637 | 68,566,941 |
| Shares redeemed | (12,310,852) | (22,548,007) | (164,307,395) | (306,098,532) |
| Net increase (decrease) | (131,227) | 3,686,619 | $(8,629,437) | $49,341,983 |
| Class Z | | | | |
| Shares sold | 506,089 | 2,554,133 | $6,458,108 | $34,771,823 |
| Reinvestment of distributions | 105,927 | 94,727 | 1,275,359 | 1,301,007 |
| Shares redeemed | (202,289) | (417,420) | (2,662,761) | (5,727,643) |
| Net increase (decrease) | 409,727 | 2,231,440 | $5,070,706 | $30,345,187 |
| Class Z6 | | | | |
| Shares sold | 1,642,788 | 3,053,093 | $21,561,478 | $41,768,708 |
| Reinvestment of distributions | 245,088 | 323,069 | 2,968,018 | 4,397,759 |
| Shares redeemed | (614,524) | (1,162,043) | (8,035,261) | (15,719,663) |
| Net increase (decrease) | 1,273,352 | 2,214,119 | $16,494,235 | $30,446,804 |
| Fidelity Advisor Freedom 2040 Fund | | | | |
| Class A | | | | |
| Shares sold | 5,561,808 | 11,840,045 | $76,375,694 | $170,207,574 |
| Reinvestment of distributions | 2,724,991 | 4,564,793 | 34,716,383 | 65,435,695 |
| Shares redeemed | (8,927,896) | (19,121,121) | (124,108,456) | (270,072,619) |
| Net increase (decrease) | (641,097) | (2,716,283) | $(13,016,379) | $(34,429,350) |
| Class M | | | | |
| Shares sold | 1,904,755 | 4,528,005 | $25,941,408 | $64,920,774 |
| Reinvestment of distributions | 1,085,039 | 1,738,651 | 13,725,741 | 24,738,913 |
| Shares redeemed | (3,355,046) | (7,082,606) | (46,204,505) | (101,386,761) |
| Net increase (decrease) | (365,252) | (815,950) | $(6,537,356) | $(11,727,074) |
| Class C | | | | |
| Shares sold | 201,688 | 466,099 | $2,698,088 | $6,525,727 |
| Reinvestment of distributions | 163,923 | 251,909 | 2,019,534 | 3,492,400 |
| Shares redeemed | (351,122) | (1,003,555) | (4,691,683) | (14,109,320) |
| Net increase (decrease) | 14,489 | (285,547) | $25,939 | $(4,091,193) |
| Class I | | | | |
| Shares sold | 7,982,157 | 17,756,004 | $110,216,662 | $255,999,975 |
| Reinvestment of distributions | 2,556,847 | 4,093,941 | 32,829,916 | 59,230,605 |
| Shares redeemed | (10,947,522) | (18,933,830) | (156,339,536) | (274,181,249) |
| Net increase (decrease) | (408,518) | 2,916,115 | $(13,292,958) | $41,049,331 |
| Class Z | | | | |
| Shares sold | 488,424 | 1,724,653 | $6,648,902 | $24,792,851 |
| Reinvestment of distributions | 74,322 | 52,962 | 946,862 | 781,656 |
| Shares redeemed | (151,853) | (224,624) | (2,085,842) | (3,265,403) |
| Net increase (decrease) | 410,893 | 1,552,991 | $5,509,922 | $22,309,104 |
| Class Z6 | | | | |
| Shares sold | 1,269,946 | 2,387,707 | $17,632,260 | $34,943,439 |
| Reinvestment of distributions | 216,117 | 269,193 | 2,768,453 | 3,906,074 |
| Shares redeemed | (634,828) | (755,102) | (8,939,245) | (10,869,881) |
| Net increase (decrease) | 851,235 | 1,901,798 | $11,461,468 | $27,979,632 |
| Fidelity Advisor Freedom 2045 Fund | | | | |
| Class A | | | | |
| Shares sold | 5,572,965 | 12,576,422 | $60,068,145 | $141,507,919 |
| Reinvestment of distributions | 1,972,190 | 3,477,587 | 19,721,912 | 38,917,915 |
| Shares redeemed | (7,642,651) | (15,971,998) | (83,372,950) | (177,041,754) |
| Net increase (decrease) | (97,496) | 82,011 | $(3,582,893) | $3,384,080 |
| Class M | | | | |
| Shares sold | 2,021,132 | 4,672,530 | $21,575,645 | $51,891,372 |
| Reinvestment of distributions | 798,513 | 1,342,659 | 7,897,293 | 14,870,122 |
| Shares redeemed | (3,189,863) | (5,380,024) | (34,095,400) | (59,627,514) |
| Net increase (decrease) | (370,218) | 635,165 | $(4,622,462) | $7,133,980 |
| Class C | | | | |
| Shares sold | 236,014 | 458,819 | $2,483,819 | $5,033,171 |
| Reinvestment of distributions | 102,202 | 157,375 | 992,384 | 1,711,388 |
| Shares redeemed | (242,807) | (485,675) | (2,603,170) | (5,287,165) |
| Net increase (decrease) | 95,409 | 130,519 | $873,033 | $1,457,394 |
| Class I | | | | |
| Shares sold | 8,426,120 | 20,017,077 | $91,337,192 | $225,404,118 |
| Reinvestment of distributions | 2,153,773 | 3,724,249 | 21,710,029 | 42,082,532 |
| Shares redeemed | (11,469,054) | (19,394,240) | (129,176,960) | (220,868,936) |
| Net increase (decrease) | (889,161) | 4,347,086 | $(16,129,739) | $46,617,714 |
| Class Z | | | | |
| Shares sold | 401,082 | 1,883,456 | $4,278,754 | $21,330,846 |
| Reinvestment of distributions | 73,191 | 55,687 | 731,911 | 639,417 |
| Shares redeemed | (170,953) | (279,216) | (1,865,402) | (3,168,961) |
| Net increase (decrease) | 303,320 | 1,659,927 | $3,145,263 | $18,801,302 |
| Class Z6 | | | | |
| Shares sold | 1,710,152 | 2,348,359 | $18,826,404 | $26,795,871 |
| Reinvestment of distributions | 195,539 | 257,658 | 1,967,123 | 2,917,396 |
| Shares redeemed | (547,979) | (647,308) | (6,048,470) | (7,218,547) |
| Net increase (decrease) | 1,357,712 | 1,958,709 | $14,745,057 | $22,494,720 |
| Fidelity Advisor Freedom 2050 Fund | | | | |
| Class A | | | | |
| Shares sold | 5,344,794 | 11,553,682 | $57,434,553 | $129,656,837 |
| Reinvestment of distributions | 1,594,488 | 2,653,369 | 15,912,991 | 29,642,295 |
| Shares redeemed | (5,974,491) | (13,103,116) | (65,248,932) | (145,401,914) |
| Net increase (decrease) | 964,791 | 1,103,935 | $8,098,612 | $13,897,218 |
| Class M | | | | |
| Shares sold | 1,772,731 | 4,348,376 | $18,970,953 | $48,432,256 |
| Reinvestment of distributions | 640,599 | 1,061,461 | 6,348,338 | 11,762,431 |
| Shares redeemed | (2,699,908) | (5,471,716) | (29,146,189) | (60,880,969) |
| Net increase (decrease) | (286,578) | (61,879) | $(3,826,898) | $(686,282) |
| Class C | | | | |
| Shares sold | 258,152 | 431,780 | $2,720,110 | $4,743,004 |
| Reinvestment of distributions | 100,323 | 151,640 | 977,145 | 1,653,252 |
| Shares redeemed | (226,821) | (611,711) | (2,435,955) | (6,684,997) |
| Net increase (decrease) | 131,654 | (28,291) | $1,261,300 | $(288,741) |
| Class I | | | | |
| Shares sold | 7,569,638 | 17,804,353 | $82,012,801 | $200,570,042 |
| Reinvestment of distributions | 1,843,169 | 3,151,534 | 18,542,283 | 35,564,424 |
| Shares redeemed | (9,175,220) | (17,873,584) | (102,871,436) | (204,260,577) |
| Net increase (decrease) | 237,587 | 3,082,303 | $(2,316,352) | $31,873,889 |
| Class Z | | | | |
| Shares sold | 340,622 | 1,300,654 | $3,641,221 | $14,723,895 |
| Reinvestment of distributions | 49,675 | 31,303 | 496,258 | 361,863 |
| Shares redeemed | (135,283) | (179,414) | (1,452,169) | (2,046,070) |
| Net increase (decrease) | 255,014 | 1,152,543 | $2,685,310 | $13,039,688 |
| Class Z6 | | | | |
| Shares sold | 1,488,831 | 2,118,577 | $16,090,491 | $24,102,651 |
| Reinvestment of distributions | 150,796 | 178,369 | 1,513,989 | 2,013,088 |
| Shares redeemed | (367,372) | (651,542) | (4,065,707) | (7,273,624) |
| Net increase (decrease) | 1,272,255 | 1,645,404 | $13,538,773 | $18,842,115 |
| Fidelity Advisor Freedom 2055 Fund | | | | |
| Class A | | | | |
| Shares sold | 3,592,144 | 7,425,778 | $43,242,974 | $93,033,169 |
| Reinvestment of distributions | 759,221 | 1,162,536 | 8,472,909 | 14,475,535 |
| Shares redeemed | (3,101,612) | (6,849,196) | (37,701,669) | (85,650,199) |
| Net increase (decrease) | 1,249,753 | 1,739,118 | $14,014,214 | $21,858,505 |
| Class M | | | | |
| Shares sold | 1,176,022 | 2,558,602 | $14,104,387 | $31,817,231 |
| Reinvestment of distributions | 291,645 | 447,013 | 3,231,425 | 5,524,763 |
| Shares redeemed | (1,140,415) | (2,546,903) | (13,794,873) | (31,732,087) |
| Net increase (decrease) | 327,252 | 458,712 | $3,540,939 | $5,609,907 |
| Class C | | | | |
| Shares sold | 136,127 | 219,568 | $1,610,793 | $2,704,771 |
| Reinvestment of distributions | 39,795 | 56,069 | 437,352 | 686,005 |
| Shares redeemed | (49,070) | (202,713) | (581,253) | (2,497,024) |
| Net increase (decrease) | 126,852 | 72,924 | $1,466,892 | $893,752 |
| Class I | | | | |
| Shares sold | 4,940,621 | 12,405,149 | $59,442,751 | $155,504,060 |
| Reinvestment of distributions | 983,584 | 1,715,370 | 11,035,813 | 21,518,680 |
| Shares redeemed | (5,050,032) | (12,690,451) | (62,621,458) | (163,071,693) |
| Net increase (decrease) | 874,173 | 1,430,068 | $7,857,106 | $13,951,047 |
| Class Z | | | | |
| Shares sold | 202,576 | 627,717 | $2,399,141 | $7,952,014 |
| Reinvestment of distributions | 23,213 | 14,240 | 258,356 | 182,308 |
| Shares redeemed | (76,901) | (126,620) | (936,306) | (1,539,918) |
| Net increase (decrease) | 148,888 | 515,337 | $1,721,191 | $6,594,404 |
| Class Z6 | | | | |
| Shares sold | 844,691 | 1,491,393 | $10,091,727 | $18,936,714 |
| Reinvestment of distributions | 91,432 | 92,350 | 1,023,124 | 1,160,720 |
| Shares redeemed | (340,331) | (345,849) | (4,107,932) | (4,393,860) |
| Net increase (decrease) | 595,792 | 1,237,894 | $7,006,919 | $15,703,574 |
| Fidelity Advisor Freedom 2060 Fund | | | | |
| Class A | | | | |
| Shares sold | 1,988,341 | 4,341,099 | $21,744,608 | $48,600,678 |
| Reinvestment of distributions | 256,121 | 351,563 | 2,589,378 | 3,973,334 |
| Shares redeemed | (1,160,419) | (2,688,980) | (12,818,955) | (30,043,199) |
| Net increase (decrease) | 1,084,043 | 2,003,682 | $11,515,031 | $22,530,813 |
| Class M | | | | |
| Shares sold | 703,042 | 1,320,400 | $7,664,004 | $14,892,485 |
| Reinvestment of distributions | 84,946 | 114,393 | 856,255 | 1,289,398 |
| Shares redeemed | (422,888) | (835,109) | (4,624,995) | (9,421,193) |
| Net increase (decrease) | 365,100 | 599,684 | $3,895,264 | $6,760,690 |
| Class C | | | | |
| Shares sold | 90,616 | 154,032 | $969,086 | $1,725,988 |
| Reinvestment of distributions | 15,708 | 20,633 | 158,022 | 231,410 |
| Shares redeemed | (42,483) | (79,153) | (455,037) | (893,469) |
| Net increase (decrease) | 63,841 | 95,512 | $672,071 | $1,063,929 |
| Class I | | | | |
| Shares sold | 2,904,922 | 6,260,268 | $31,624,056 | $70,805,650 |
| Reinvestment of distributions | 324,090 | 440,804 | 3,289,511 | 5,023,075 |
| Shares redeemed | (2,281,712) | (3,584,371) | (25,922,332) | (41,078,932) |
| Net increase (decrease) | 947,300 | 3,116,701 | $8,991,235 | $34,749,793 |
| Class Z | | | | |
| Shares sold | 72,434 | 184,538 | $789,115 | $2,099,627 |
| Reinvestment of distributions | 6,046 | 4,169 | 61,063 | 48,196 |
| Shares redeemed | (28,740) | (54,214) | (312,941) | (614,581) |
| Net increase (decrease) | 49,740 | 134,493 | $537,237 | $1,533,242 |
| Class Z6 | | | | |
| Shares sold | 440,572 | 573,547 | $4,728,519 | $6,528,282 |
| Reinvestment of distributions | 28,625 | 22,373 | 290,253 | 256,501 |
| Shares redeemed | (116,556) | (136,889) | (1,271,834) | (1,535,551) |
| Net increase (decrease) | 352,641 | 459,031 | $3,746,938 | $5,249,232 |
| Fidelity Advisor Freedom 2065 Fund(a) | | | | |
| Class A | | | | |
| Shares sold | 270,607 | 270,091 | $2,688,929 | $2,643,573 |
| Reinvestment of distributions | 3,906 | 1,593 | 35,977 | 16,986 |
| Shares redeemed | (54,826) | (37,938) | (547,998) | (368,426) |
| Net increase (decrease) | 219,687 | 233,746 | $2,176,908 | $2,292,133 |
| Class M | | | | |
| Shares sold | 28,521 | 40,888 | $283,310 | $400,716 |
| Reinvestment of distributions | 580 | 322 | 5,346 | 3,436 |
| Shares redeemed | (7,315) | (1,983) | (75,800) | (18,273) |
| Net increase (decrease) | 21,786 | 39,227 | $212,856 | $385,879 |
| Class C | | | | |
| Shares sold | 4,123 | 21,460 | $40,979 | $213,694 |
| Reinvestment of distributions | 297 | 213 | 2,732 | 2,276 |
| Shares redeemed | (1,187) | (1) | (12,359) | (15) |
| Net increase (decrease) | 3,233 | 21,672 | $31,352 | $215,955 |
| Class I | | | | |
| Shares sold | 263,077 | 311,028 | $2,615,824 | $3,116,572 |
| Reinvestment of distributions | 4,480 | 2,157 | 41,306 | 23,020 |
| Shares redeemed | (93,262) | (32,218) | (958,734) | (335,104) |
| Net increase (decrease) | 174,295 | 280,967 | $1,698,396 | $2,804,488 |
| Class Z | | | | |
| Shares sold | 6,732 | 20,936 | $67,539 | $207,081 |
| Reinvestment of distributions | 288 | 292 | 2,661 | 3,116 |
| Shares redeemed | (878) | (498) | (9,399) | (4,717) |
| Net increase (decrease) | 6,142 | 20,730 | $60,801 | $205,480 |
| Class Z6 | | | | |
| Shares sold | 19,431 | 106,399 | $195,935 | $1,110,643 |
| Reinvestment of distributions | 1,393 | 499 | 12,874 | 5,331 |
| Shares redeemed | (67,506) | (419) | (621,715) | (4,427) |
| Net increase (decrease) | (46,682) | 106,479 | $(412,906) | $1,111,547 |
(a) For the period June 28, 2019 (commencement of operations) to March 31, 2020.
10. Other.
The Funds' organizational documents provide former and current trustees and officers with a limited indemnification against liabilities arising in connection with the performance of their duties to the Funds. In the normal course of business, the Funds may also enter into contracts that provide general indemnifications. The Funds' maximum exposure under these arrangements is unknown as this would be dependent on future claims that may be made against the Funds. The risk of material loss from such claims is considered remote.
The Funds do not invest in the underlying mutual funds for the purpose of exercising management or control; however, investments by the Funds within their principal investment strategies may represent a significant portion of the underlying mutual fund's net assets. At the end of the period, the following Funds were the owners of record of 10% or more of the total outstanding shares of the following underlying mutual funds.
| Fund | Fidelity Advisor Freedom 2025 Fund | Fidelity Advisor Freedom 2030 Fund | Fidelity Advisor Freedom 2035 Fund | Fidelity Advisor Freedom 2040 Fund | Fidelity Advisor Freedom 2045 Fund |
| Fidelity Advisor Series Equity Growth Fund | 11% | 14% | 15% | 15% | 10% |
| Fidelity Advisor Series Growth Opportunities Fund | 11% | 14% | 15% | 15% | 10% |
| Fidelity Advisor Series Small Cap Fund | 11% | 14% | 15% | 15% | 10% |
The Funds, in aggregate, were the owners of record of more than 20% of the total outstanding shares of the following underlying mutual funds.
| Fund | % of shares held |
| Fidelity Advisor Series Equity Growth Fund | 91% |
| Fidelity Advisor Series Growth Opportunities Fund | 91% |
| Fidelity Advisor Series Small Cap Fund | 91% |
11. Coronavirus (COVID-19) Pandemic.
An outbreak of COVID-19 first detected in China during December 2019 has since spread globally and was declared a pandemic by the World Health Organization during March 2020. Developments that disrupt global economies and financial markets, such as the COVID-19 pandemic, may magnify factors that affect the Funds' performance.
Shareholder Expense Example
As a shareholder, you incur two types of costs: (1) transaction costs, which may include sales charges (loads) on purchase payments or redemption proceeds, as applicable and (2) ongoing costs, which generally include management fees, distribution and/or service (12b-1) fees and other Fund expenses. This Example is intended to help you understand your ongoing costs (in dollars) of investing in a fund and to compare these costs with the ongoing costs of investing in other mutual funds.
The Example is based on an investment of $1,000 invested at the beginning of the period and held for the entire period (April 1, 2020 to September 30, 2020).
Actual Expenses
The first line of the accompanying table provides information about actual account values and actual expenses. You may use the information in this line, together with the amount you invested, to estimate the expenses that you paid over the period. Simply divide your account value by $1,000.00 (for example, an $8,600 account value divided by $1,000.00 = 8.6), then multiply the result by the number in the first line for a class/Fund under the heading entitled "Expenses Paid During Period" to estimate the expenses you paid on your account during this period. If any fund is a shareholder of any underlying mutual funds or exchange-traded funds (ETFs) (the Underlying Funds), such fund indirectly bears its proportional share of the expenses of the Underlying Funds in addition to the direct expenses incurred presented in the table. These fees and expenses are not included in the annualized expense ratio used to calculate the expense estimate in the table below.
Hypothetical Example for Comparison Purposes
The second line of the accompanying table provides information about hypothetical account values and hypothetical expenses based on the actual expense ratio and an assumed rate of return of 5% per year before expenses, which is not the actual return. The hypothetical account values and expenses may not be used to estimate the actual ending account balance or expenses you paid for the period. You may use this information to compare the ongoing costs of investing in the Fund and other funds. To do so, compare this 5% hypothetical example with the 5% hypothetical examples that appear in the shareholder reports of the other funds. If any fund is a shareholder of any Underlying Funds, such fund indirectly bears its proportional share of the expenses of the Underlying Funds in addition to the direct expenses as presented in the table. These fees and expenses are not included in the annualized expense ratio used to calculate the expense estimate in the table below.
Please note that the expenses shown in the table are meant to highlight your ongoing costs only and do not reflect any transaction costs. Therefore, the second line of the table is useful in comparing ongoing costs only, and will not help you determine the relative total costs of owning different funds. In addition, if these transactional costs were included, your costs would have been higher.
| | Annualized Expense Ratio-A | Beginning
Account Value
April 1, 2020 | Ending
Account Value
September 30, 2020 | Expenses Paid
During Period-B
April 1, 2020
to September 30, 2020 |
| Fidelity Advisor Freedom Income Fund | | | | |
| Class A | .71% | | | |
| Actual | | $1,000.00 | $1,090.90 | $3.72 |
| Hypothetical-C | | $1,000.00 | $1,021.51 | $3.60 |
| Class M | .96% | | | |
| Actual | | $1,000.00 | $1,089.60 | $5.03 |
| Hypothetical-C | | $1,000.00 | $1,020.26 | $4.86 |
| Class C | 1.46% | | | |
| Actual | | $1,000.00 | $1,086.50 | $7.64 |
| Hypothetical-C | | $1,000.00 | $1,017.75 | $7.39 |
| Class I | .46% | | | |
| Actual | | $1,000.00 | $1,092.90 | $2.41 |
| Hypothetical-C | | $1,000.00 | $1,022.76 | $2.33 |
| Class Z | .41% | | | |
| Actual | | $1,000.00 | $1,092.60 | $2.15 |
| Hypothetical-C | | $1,000.00 | $1,023.01 | $2.08 |
| Class Z6 | .37% | | | |
| Actual | | $1,000.00 | $1,093.60 | $1.94 |
| Hypothetical-C | | $1,000.00 | $1,023.21 | $1.88 |
| Fidelity Advisor Freedom 2005 Fund | | | | |
| Class A | .71% | | | |
| Actual | | $1,000.00 | $1,106.90 | $3.75 |
| Hypothetical-C | | $1,000.00 | $1,021.51 | $3.60 |
| Class M | .96% | | | |
| Actual | | $1,000.00 | $1,105.40 | $5.07 |
| Hypothetical-C | | $1,000.00 | $1,020.26 | $4.86 |
| Class C | 1.46% | | | |
| Actual | | $1,000.00 | $1,102.60 | $7.70 |
| Hypothetical-C | | $1,000.00 | $1,017.75 | $7.39 |
| Class I | .46% | | | |
| Actual | | $1,000.00 | $1,107.90 | $2.43 |
| Hypothetical-C | | $1,000.00 | $1,022.76 | $2.33 |
| Class Z | .41% | | | |
| Actual | | $1,000.00 | $1,107.80 | $2.17 |
| Hypothetical-C | | $1,000.00 | $1,023.01 | $2.08 |
| Class Z6 | .36% | | | |
| Actual | | $1,000.00 | $1,108.60 | $1.90 |
| Hypothetical-C | | $1,000.00 | $1,023.26 | $1.83 |
| Fidelity Advisor Freedom 2010 Fund | | | | |
| Class A | .76% | | | |
| Actual | | $1,000.00 | $1,131.30 | $4.06 |
| Hypothetical-C | | $1,000.00 | $1,021.26 | $3.85 |
| Class M | 1.01% | | | |
| Actual | | $1,000.00 | $1,129.20 | $5.39 |
| Hypothetical-C | | $1,000.00 | $1,020.00 | $5.11 |
| Class C | 1.51% | | | |
| Actual | | $1,000.00 | $1,126.20 | $8.05 |
| Hypothetical-C | | $1,000.00 | $1,017.50 | $7.64 |
| Class I | .51% | | | |
| Actual | | $1,000.00 | $1,131.50 | $2.73 |
| Hypothetical-C | | $1,000.00 | $1,022.51 | $2.59 |
| Class Z | .45% | | | |
| Actual | | $1,000.00 | $1,132.50 | $2.41 |
| Hypothetical-C | | $1,000.00 | $1,022.81 | $2.28 |
| Class Z6 | .38% | | | |
| Actual | | $1,000.00 | $1,132.40 | $2.03 |
| Hypothetical-C | | $1,000.00 | $1,023.16 | $1.93 |
| Fidelity Advisor Freedom 2015 Fund | | | | |
| Class A | .80% | | | |
| Actual | | $1,000.00 | $1,154.80 | $4.32 |
| Hypothetical-C | | $1,000.00 | $1,021.06 | $4.05 |
| Class M | 1.05% | | | |
| Actual | | $1,000.00 | $1,153.50 | $5.67 |
| Hypothetical-C | | $1,000.00 | $1,019.80 | $5.32 |
| Class C | 1.55% | | | |
| Actual | | $1,000.00 | $1,149.90 | $8.35 |
| Hypothetical-C | | $1,000.00 | $1,017.30 | $7.84 |
| Class I | .55% | | | |
| Actual | | $1,000.00 | $1,156.10 | $2.97 |
| Hypothetical-C | | $1,000.00 | $1,022.31 | $2.79 |
| Class Z | .48% | | | |
| Actual | | $1,000.00 | $1,156.40 | $2.59 |
| Hypothetical-C | | $1,000.00 | $1,022.66 | $2.43 |
| Class Z6 | .40% | | | |
| Actual | | $1,000.00 | $1,156.90 | $2.16 |
| Hypothetical-C | | $1,000.00 | $1,023.06 | $2.03 |
| Fidelity Advisor Freedom 2020 Fund | | | | |
| Class A | .84% | | | |
| Actual | | $1,000.00 | $1,177.10 | $4.58 |
| Hypothetical-C | | $1,000.00 | $1,020.86 | $4.26 |
| Class M | 1.09% | | | |
| Actual | | $1,000.00 | $1,175.50 | $5.94 |
| Hypothetical-C | | $1,000.00 | $1,019.60 | $5.52 |
| Class C | 1.59% | | | |
| Actual | | $1,000.00 | $1,172.50 | $8.66 |
| Hypothetical-C | | $1,000.00 | $1,017.10 | $8.04 |
| Class I | .59% | | | |
| Actual | | $1,000.00 | $1,178.10 | $3.22 |
| Hypothetical-C | | $1,000.00 | $1,022.11 | $2.99 |
| Class Z | .52% | | | |
| Actual | | $1,000.00 | $1,178.90 | $2.84 |
| Hypothetical-C | | $1,000.00 | $1,022.46 | $2.64 |
| Class Z6 | .42% | | | |
| Actual | | $1,000.00 | $1,179.50 | $2.29 |
| Hypothetical-C | | $1,000.00 | $1,022.96 | $2.13 |
| Fidelity Advisor Freedom 2025 Fund | | | | |
| Class A | .88% | | | |
| Actual | | $1,000.00 | $1,194.40 | $4.84 |
| Hypothetical-C | | $1,000.00 | $1,020.66 | $4.46 |
| Class M | 1.13% | | | |
| Actual | | $1,000.00 | $1,192.70 | $6.21 |
| Hypothetical-C | | $1,000.00 | $1,019.40 | $5.72 |
| Class C | 1.63% | | | |
| Actual | | $1,000.00 | $1,190.20 | $8.95 |
| Hypothetical-C | | $1,000.00 | $1,016.90 | $8.24 |
| Class I | .63% | | | |
| Actual | | $1,000.00 | $1,196.10 | $3.47 |
| Hypothetical-C | | $1,000.00 | $1,021.91 | $3.19 |
| Class Z | .55% | | | |
| Actual | | $1,000.00 | $1,196.10 | $3.03 |
| Hypothetical-C | | $1,000.00 | $1,022.31 | $2.79 |
| Class Z6 | .44% | | | |
| Actual | | $1,000.00 | $1,197.50 | $2.42 |
| Hypothetical-C | | $1,000.00 | $1,022.86 | $2.23 |
| Fidelity Advisor Freedom 2030 Fund | | | | |
| Class A | .93% | | | |
| Actual | | $1,000.00 | $1,219.70 | $5.17 |
| Hypothetical-C | | $1,000.00 | $1,020.41 | $4.71 |
| Class M | 1.18% | | | |
| Actual | | $1,000.00 | $1,218.80 | $6.56 |
| Hypothetical-C | | $1,000.00 | $1,019.15 | $5.97 |
| Class C | 1.68% | | | |
| Actual | | $1,000.00 | $1,215.00 | $9.33 |
| Hypothetical-C | | $1,000.00 | $1,016.65 | $8.49 |
| Class I | .68% | | | |
| Actual | | $1,000.00 | $1,220.90 | $3.79 |
| Hypothetical-C | | $1,000.00 | $1,021.66 | $3.45 |
| Class Z | .59% | | | |
| Actual | | $1,000.00 | $1,222.20 | $3.29 |
| Hypothetical-C | | $1,000.00 | $1,022.11 | $2.99 |
| Class Z6 | .46% | | | |
| Actual | | $1,000.00 | $1,222.60 | $2.56 |
| Hypothetical-C | | $1,000.00 | $1,022.76 | $2.33 |
| Fidelity Advisor Freedom 2035 Fund | | | | |
| Class A | .97% | | | |
| Actual | | $1,000.00 | $1,257.00 | $5.49 |
| Hypothetical-C | | $1,000.00 | $1,020.21 | $4.91 |
| Class M | 1.22% | | | |
| Actual | | $1,000.00 | $1,254.60 | $6.90 |
| Hypothetical-C | | $1,000.00 | $1,018.95 | $6.17 |
| Class C | 1.72% | | | |
| Actual | | $1,000.00 | $1,251.90 | $9.71 |
| Hypothetical-C | | $1,000.00 | $1,016.44 | $8.69 |
| Class I | .72% | | | |
| Actual | | $1,000.00 | $1,257.40 | $4.07 |
| Hypothetical-C | | $1,000.00 | $1,021.46 | $3.65 |
| Class Z | .62% | | | |
| Actual | | $1,000.00 | $1,258.60 | $3.51 |
| Hypothetical-C | | $1,000.00 | $1,021.96 | $3.14 |
| Class Z6 | .48% | | | |
| Actual | | $1,000.00 | $1,259.90 | $2.72 |
| Hypothetical-C | | $1,000.00 | $1,022.66 | $2.43 |
| Fidelity Advisor Freedom 2040 Fund | | | | |
| Class A | 1.00% | | | |
| Actual | | $1,000.00 | $1,276.60 | $5.71 |
| Hypothetical-C | | $1,000.00 | $1,020.05 | $5.06 |
| Class M | 1.25% | | | |
| Actual | | $1,000.00 | $1,275.10 | $7.13 |
| Hypothetical-C | | $1,000.00 | $1,018.80 | $6.33 |
| Class C | 1.74% | | | |
| Actual | | $1,000.00 | $1,271.50 | $9.91 |
| Hypothetical-C | | $1,000.00 | $1,016.34 | $8.80 |
| Class I | .75% | | | |
| Actual | | $1,000.00 | $1,277.90 | $4.28 |
| Hypothetical-C | | $1,000.00 | $1,021.31 | $3.80 |
| Class Z | .64% | | | |
| Actual | | $1,000.00 | $1,278.30 | $3.66 |
| Hypothetical-C | | $1,000.00 | $1,021.86 | $3.24 |
| Class Z6 | .49% | | | |
| Actual | | $1,000.00 | $1,280.50 | $2.80 |
| Hypothetical-C | | $1,000.00 | $1,022.61 | $2.48 |
| Fidelity Advisor Freedom 2045 Fund | | | | |
| Class A | 1.00% | | | |
| Actual | | $1,000.00 | $1,277.00 | $5.71 |
| Hypothetical-C | | $1,000.00 | $1,020.05 | $5.06 |
| Class M | 1.25% | | | |
| Actual | | $1,000.00 | $1,274.30 | $7.13 |
| Hypothetical-C | | $1,000.00 | $1,018.80 | $6.33 |
| Class C | 1.74% | | | |
| Actual | | $1,000.00 | $1,272.40 | $9.91 |
| Hypothetical-C | | $1,000.00 | $1,016.34 | $8.80 |
| Class I | .75% | | | |
| Actual | | $1,000.00 | $1,278.10 | $4.28 |
| Hypothetical-C | | $1,000.00 | $1,021.31 | $3.80 |
| Class Z | .64% | | | |
| Actual | | $1,000.00 | $1,279.20 | $3.66 |
| Hypothetical-C | | $1,000.00 | $1,021.86 | $3.24 |
| Class Z6 | .49% | | | |
| Actual | | $1,000.00 | $1,279.80 | $2.80 |
| Hypothetical-C | | $1,000.00 | $1,022.61 | $2.48 |
| Fidelity Advisor Freedom 2050 Fund | | | | |
| Class A | 1.00% | | | |
| Actual | | $1,000.00 | $1,275.70 | $5.70 |
| Hypothetical-C | | $1,000.00 | $1,020.05 | $5.06 |
| Class M | 1.25% | | | |
| Actual | | $1,000.00 | $1,274.50 | $7.13 |
| Hypothetical-C | | $1,000.00 | $1,018.80 | $6.33 |
| Class C | 1.74% | | | |
| Actual | | $1,000.00 | $1,271.00 | $9.91 |
| Hypothetical-C | | $1,000.00 | $1,016.34 | $8.80 |
| Class I | .75% | | | |
| Actual | | $1,000.00 | $1,278.00 | $4.28 |
| Hypothetical-C | | $1,000.00 | $1,021.31 | $3.80 |
| Class Z | .64% | | | |
| Actual | | $1,000.00 | $1,279.00 | $3.66 |
| Hypothetical-C | | $1,000.00 | $1,021.86 | $3.24 |
| Class Z6 | .49% | | | |
| Actual | | $1,000.00 | $1,279.70 | $2.80 |
| Hypothetical-C | | $1,000.00 | $1,022.61 | $2.48 |
| Fidelity Advisor Freedom 2055 Fund | | | | |
| Class A | 1.00% | | | |
| Actual | | $1,000.00 | $1,276.20 | $5.71 |
| Hypothetical-C | | $1,000.00 | $1,020.05 | $5.06 |
| Class M | 1.24% | | | |
| Actual | | $1,000.00 | $1,274.20 | $7.07 |
| Hypothetical-C | | $1,000.00 | $1,018.85 | $6.28 |
| Class C | 1.74% | | | |
| Actual | | $1,000.00 | $1,271.40 | $9.91 |
| Hypothetical-C | | $1,000.00 | $1,016.34 | $8.80 |
| Class I | .75% | | | |
| Actual | | $1,000.00 | $1,278.00 | $4.28 |
| Hypothetical-C | | $1,000.00 | $1,021.31 | $3.80 |
| Class Z | .64% | | | |
| Actual | | $1,000.00 | $1,278.00 | $3.65 |
| Hypothetical-C | | $1,000.00 | $1,021.86 | $3.24 |
| Class Z6 | .49% | | | |
| Actual | | $1,000.00 | $1,279.60 | $2.80 |
| Hypothetical-C | | $1,000.00 | $1,022.61 | $2.48 |
| Fidelity Advisor Freedom 2060 Fund | | | | |
| Class A | .99% | | | |
| Actual | | $1,000.00 | $1,276.90 | $5.65 |
| Hypothetical-C | | $1,000.00 | $1,020.10 | $5.01 |
| Class M | 1.24% | | | |
| Actual | | $1,000.00 | $1,275.40 | $7.07 |
| Hypothetical-C | | $1,000.00 | $1,018.85 | $6.28 |
| Class C | 1.74% | | | |
| Actual | | $1,000.00 | $1,271.30 | $9.91 |
| Hypothetical-C | | $1,000.00 | $1,016.34 | $8.80 |
| Class I | .75% | | | |
| Actual | | $1,000.00 | $1,277.00 | $4.28 |
| Hypothetical-C | | $1,000.00 | $1,021.31 | $3.80 |
| Class Z | .64% | | | |
| Actual | | $1,000.00 | $1,279.00 | $3.66 |
| Hypothetical-C | | $1,000.00 | $1,021.86 | $3.24 |
| Class Z6 | .49% | | | |
| Actual | | $1,000.00 | $1,279.50 | $2.80 |
| Hypothetical-C | | $1,000.00 | $1,022.61 | $2.48 |
| Fidelity Advisor Freedom 2065 Fund | | | | |
| Class A | .99% | | | |
| Actual | | $1,000.00 | $1,275.80 | $5.65 |
| Hypothetical-C | | $1,000.00 | $1,020.10 | $5.01 |
| Class M | 1.24% | | | |
| Actual | | $1,000.00 | $1,272.80 | $7.06 |
| Hypothetical-C | | $1,000.00 | $1,018.85 | $6.28 |
| Class C | 1.74% | | | |
| Actual | | $1,000.00 | $1,269.60 | $9.90 |
| Hypothetical-C | | $1,000.00 | $1,016.34 | $8.80 |
| Class I | .75% | | | |
| Actual | | $1,000.00 | $1,277.10 | $4.28 |
| Hypothetical-C | | $1,000.00 | $1,021.31 | $3.80 |
| Class Z | .64% | | | |
| Actual | | $1,000.00 | $1,276.90 | $3.65 |
| Hypothetical-C | | $1,000.00 | $1,021.86 | $3.24 |
| Class Z6 | .49% | | | |
| Actual | | $1,000.00 | $1,277.90 | $2.80 |
| Hypothetical-C | | $1,000.00 | $1,022.61 | $2.48 |
A Annualized expense ratio reflects expenses net of applicable fee waivers.
B Expenses are equal to the annualized expense ratio, multiplied by the average account value over the period, multiplied by 183/ 365 (to reflect the one-half year period). The fees and expenses of any Underlying Funds are not included in each annualized expense ratio.
C 5% return per year before expenses
Board Approval of Investment Advisory Contracts and Management Fees
Fidelity Advisor Freedom Funds
Each year, the Board of Trustees, including the Independent Trustees (together, the Board), votes on the renewal of the management contract with Fidelity Management & Research Company LLC (FMR) (the Advisory Contract) for each fund. The Board, assisted by the advice of fund counsel and Independent Trustees' counsel, requests and considers a broad range of information relevant to the renewal of the Advisory Contracts throughout the year.
The Board meets regularly and, at each of its meetings, covers an extensive agenda of topics and materials and considers factors that are relevant to its annual consideration of the renewal of each fund's Advisory Contract, including the services and support provided to each fund and its shareholders. The Board has established four standing committees (Committees) — Operations, Audit, Fair Valuation, and Governance and Nominating — each composed of and chaired by Independent Trustees with varying backgrounds, to which the Board has assigned specific subject matter responsibilities in order to enhance effective decision-making by the Board. The Operations Committee, of which all of the Independent Trustees are members, meets regularly throughout the year and considers, among other matters, information specifically related to the annual consideration of the renewal of each fund's Advisory Contract. The Board, acting directly and through its Committees, requests and receives information concerning the annual consideration of the renewal of each fund's Advisory Contract. The Board also meets as needed to review matters specifically related to the Board's annual consideration of the renewal of the Advisory Contracts. Members of the Board may also meet with trustees of other Fidelity funds through joint ad hoc committees to discuss certain matters relevant to all of the Fidelity funds.
At its September 2020 meeting, the Board unanimously determined to renew each fund's Advisory Contract. In reaching its determination, the Board considered all factors it believed relevant, including (i) the nature, extent, and quality of the services provided to each fund and its shareholders (including the investment performance of each fund); (ii) the competitiveness of each fund's management fee and total expense ratio relative to peer funds; (iii) the total costs of the services provided by and the profits realized by Fidelity from its relationships with each fund; and (iv) the extent to which, if any, economies of scale exist and are realized as each fund grows, and whether any economies of scale are appropriately shared with fund shareholders. The Board also considered that each fund pays an all-inclusive management fee that covers all operating expenses of the fund, subject to certain exceptions, and varies by class (unified fee) and the underlying Fidelity funds in which the fund invests (Series Funds) do not pay expenses, with certain limited exceptions. The Board and the board of other funds that invest their assets in Series Funds and the boards of the Series Funds previously formed a joint ad hoc committee to review the responsibilities of each board related to the consideration of the renewal of the Advisory Contracts for the funds, other funds that invest substantially all of their assets in Series Funds, and the Series Funds. The Board's deliberations were informed by the conclusions of such committee.
In considering whether to renew the Advisory Contract for each fund, the Board reached a determination, with the assistance of fund counsel and Independent Trustees' counsel and through the exercise of its business judgment, that the renewal of the Advisory Contract was in the best interests of each fund and its shareholders and that the compensation payable under the Advisory Contract was fair and reasonable. The Board's decision to renew the Advisory Contracts was not based on any single factor, but rather was based on a comprehensive consideration of all the information provided to the Board at its meetings throughout the year. The Board, in reaching its determination to renew the Advisory Contracts, was aware that shareholders of each fund have a broad range of investment choices available to them, including a wide choice among funds offered by Fidelity's competitors, and that each fund's shareholders, who have the opportunity to review and weigh the disclosure provided by the fund in its prospectus and other public disclosures, have chosen to invest in that fund, which is part of the Fidelity family of funds.
Nature, Extent, and Quality of Services Provided. The Board considered Fidelity's staffing as it relates to the funds, including the backgrounds of investment personnel of FMR, and also considered the funds' investment objectives, strategies, and related investment philosophies. The Independent Trustees also had discussions with senior management of Fidelity's investment operations and investment groups with responsibility for the Series Funds. The Board considered the structure of the investment personnel compensation program and whether this structure provides appropriate incentives to act in the best interests of each fund. Additionally, the Board considered the portfolio managers' investments, if any, in the funds that they manage.
Resources Dedicated to Investment Management and Support Services. The Board reviewed the general qualifications and capabilities of Fidelity's investment staff, including its size, education, experience, and resources, as well as Fidelity's approach to recruiting, managing, and compensating investment personnel. The Board noted that Fidelity has continued to increase the resources devoted to non-U.S. offices, including expansion of Fidelity's global investment organization. The Board also noted that Fidelity's analysts have extensive resources, tools and capabilities that allow them to conduct sophisticated quantitative and fundamental analysis, as well as credit analysis of issuers, counterparties and guarantors. Further, the Board considered that Fidelity's investment professionals have sufficient access to global information and data so as to provide competitive investment results over time, and that those professionals also have access to sophisticated tools that permit them to assess portfolio construction and risk and performance attribution characteristics continuously, as well as to transmit new information and research conclusions rapidly around the world. Additionally, in its deliberations, the Board considered Fidelity's risk management, compliance, and technology and operations capabilities and resources, which are integral parts of the investment management process. The Board also considered Fidelity's investments in business continuity planning, and its success in continuously providing services to the funds notwithstanding the severe disruptions caused by the COVID-19 pandemic.
Shareholder and Administrative Services. The Board considered (i) the nature, extent, quality, and cost of advisory, administrative, and shareholder services performed by Fidelity under the Advisory Contract and under separate agreements covering transfer agency and pricing and bookkeeping services for each fund; (ii) the nature and extent of the supervision of third party service providers, principally custodians, subcustodians, and pricing vendors; and (iii) the resources devoted to, and the record of compliance with, each fund's compliance policies and procedures.
The Board noted that the growth of fund assets over time across the complex allows Fidelity to reinvest in the development of services designed to enhance the value and convenience of the Fidelity funds as investment vehicles. These services include 24-hour access to account information and market information over the Internet and through telephone representatives, investor education materials and asset allocation tools, and the expanded availability of Fidelity Investor Centers.
Investment in a Large Fund Family. The Board considered the benefits to shareholders of investing in a Fidelity fund, including the benefits of investing in a fund that is part of a large family of funds offering a variety of investment disciplines and providing a large variety of mutual fund investor services. The Board noted that Fidelity had taken, or had made recommendations that resulted in the Fidelity funds taking, a number of actions over the previous year that benefited particular funds, including: (i) continuing to dedicate additional resources to Fidelity's investment research process, which includes meetings with management of issuers of securities in which the funds invest, and to the support of the senior management team that oversees asset management; (ii) continuing efforts to enhance Fidelity's global research capabilities; (iii) launching new funds and ETFs with innovative structures, strategies and pricing and making other enhancements to meet client needs; (iv) launching new share classes of existing funds; (v) eliminating purchase minimums and broadening eligibility requirements for certain funds and share classes; (vi) reducing management fees and total expenses for certain target date funds or classes and index funds; (vii) lowering expenses for certain funds and classes by implementing or lowering expense caps; (viii) rationalizing product lines and gaining increased efficiencies from fund mergers, liquidations, and share class consolidations; (ix) continuing to develop, acquire and implement systems and technology to improve services to the funds and shareholders, strengthen information security, and increase efficiency; and (x) continuing to implement enhancements to further strengthen Fidelity's product line to increase investors' probability of success in achieving their investment goals, including retirement income goals.
Investment Performance (for each fund except Fidelity Advisor Freedom 2065 Fund). The Board considered whether each fund has operated in accordance with its investment objective, as well as its record of compliance with its investment restrictions and its performance history.
The Board took into account discussions that occur at Board meetings throughout the year with representatives of the investment adviser about fund investment performance. In this regard the Board noted that as part of regularly scheduled fund reviews and other reports to the Board on fund performance, the Board considers annualized return information for each fund for different time periods, measured against one or more appropriate securities market indices, including a customized blended index that reflects the respective weights of the fund's asset classes (each a benchmark index). In its evaluation of fund investment performance at meetings throughout the year, the Board gave particular attention to information indicating underperformance of certain Fidelity funds for specific time periods and discussed with the investment adviser the reasons for such underperformance. For Fidelity Advisor Freedom 2005 Fund, Fidelity Advisor Freedom 2015 Fund, Fidelity Advisor Freedom 2025 Fund, Fidelity Advisor Freedom 2035 Fund, Fidelity Advisor Freedom 2040 Fund, Fidelity Advisor Freedom 2045 Fund, Fidelity Advisor Freedom 2055 Fund, Fidelity Advisor Freedom 2060 Fund, and Fidelity Advisor Freedom Income Fund, each fund underperformed its benchmark for the one- and three-year periods ended May 31, 2020, and as a result, the Board continues to engage in discussions with FMR about the steps it is taking to address the fund's performance.
In addition to reviewing absolute and relative fund performance, the Independent Trustees periodically consider the appropriateness of fund performance metrics in evaluating the results achieved. In general, the Independent Trustees believe that fund performance should be evaluated based on gross performance (before fees and expenses, including acquired fund fees and expenses, but after transaction costs, if any) compared to appropriate benchmark indices, over appropriate time periods that may include full market cycles, taking into account relevant factors including the following: general market conditions; the extent to which particular underlying funds affected performance; and fund cash flows and other factors. The Independent Trustees generally give greater weight to fund performance over longer time periods than over shorter time periods. Depending on the circumstances, the Independent Trustees may be satisfied with a fund's performance notwithstanding that it lags its benchmark index for certain periods.
The Independent Trustees recognize that shareholders evaluate performance on a net basis over their own holding periods, for which one-, three-, and five-year periods are often used as a proxy. For this reason, the performance information reviewed by the Board also included net cumulative calendar year total return information for each fund and an appropriate benchmark index for the most recent one-, three-, and five-year periods. Due to the characteristics of the funds, no peer group performance information was considered by the Board. The Independent Trustees recognize that shareholders who are not investing through a tax-advantaged retirement account also consider tax consequences in evaluating performance.
Investment Performance (for Fidelity Advisor Freedom 2065 Fund). The Board considered whether the fund has operated in accordance with its investment objective, as well as its record of compliance with its investment restrictions. As the fund recently commenced operations, the Board did not believe that it was appropriate to assign significant weight to its limited investment performance.
Based on its review, the Board concluded that the nature, extent, and quality of services provided to each fund under the Advisory Contracts should continue to benefit the shareholders of each fund.
Competitiveness of Management Fee and Total Expense Ratio. The Board considered each fund's management fee and total expense ratio compared to "mapped groups" of competitive funds and classes created for the purpose of facilitating the Trustees' competitive analysis of management fees and total expenses. Fidelity creates "mapped groups" by combining similar Lipper investment objective categories that have comparable investment mandates. Combining Lipper investment objective categories aids the Board's management fee and total expense ratio comparisons by broadening the competitive group used for comparison.
Management Fee. The Board considered two proprietary management fee comparisons. The group of Lipper funds used by the Board for management fee comparisons is referred to as the "Total Mapped Group." The Total Mapped Group comparison focuses on a fund's standing in terms of gross management fees before expense reimbursements or caps relative to the total universe of funds with comparable investment mandates, regardless of whether their management fee structures also are comparable. Funds with comparable investment mandates offer exposure to similar types of securities. Funds with comparable management fee structures have similar management fee contractual arrangements (
e.g., flat rate charged for advisory services, all-inclusive fee rate,
etc.). The "Asset-Sized Peer Group" (ASPG) comparison focuses on a fund's standing relative to a subset of non-Fidelity funds within the Total Mapped Group that are similar in size and management fee structure. For example, if a fund is in the first quartile of the ASPG, the fund's management fee ranks in the least expensive or lowest 25% of funds in the ASPG. The ASPG represents at least 15% of the funds in the Total Mapped Group with comparable asset size and management fee structures, subject to a minimum of 50 funds (or all funds in the Total Mapped Group if fewer than 50). Additional information, such as the ASPG quartile in which a fund's management fee rate ranked, also was considered by the Board.
The Board compared each fund's class-level management fee rate for the current fiscal year relative to the median of its competitor funds in the applicable Total Mapped Group based on competitive data for 2019. The Board noted that each fund's class-level management fee rate ranks above the median of its competitor funds in the applicable Total Mapped Group based on competitive data for 2019. The Board noted that each fund's unified fee arrangement covers all operating expenses of the fund, subject to certain exceptions, and that the fee structures of the majority of peer funds do not include top-level management fees, similar to the fee structure in place for each fund prior to June 1, 2017. The Board also noted that the primary comparisons for the funds are against active and passive competitor target date funds. The Board also noted that the funds' total expense comparisons, which include the expenses of the Series Funds, facilitate better comparisons with funds and classes that use different expense structures and that, when compared to the total expenses of their load-type competitors, including acquired fund fees and expenses, all classes of the funds rank below their respective load types.
Based on its review, the Board concluded that each fund's management fee is fair and reasonable in light of the services that the fund receives and the other factors considered.
Total Expense Ratio. In its review of the total expense ratio of each class of each fund, the Board considered the fund's class-level management fee rate under the Advisory Contract. The Board also considered other expenses, such as transfer agent fees, pricing and bookkeeping fees, and custodial, legal, and audit fees, paid by FMR under the unified fee arrangement. The Board also noted that Fidelity may agree to waive fees or reimburse expenses from time to time, and the extent to which, if any, it has done so for each fund. As part of its review, the Board considered the total expense ratio of each class of each fund compared to the median total expenses for competitor funds (including expenses of underlying funds) based on competitive data for 2019. Each class of each fund is compared to those funds and classes in the Total Mapped Group (used by the Board for management fee comparisons) that have a similar sales load structure.
The Board noted that each fund offers multiple classes, each of which has a different sales load and 12b-1 fee structure, and that the multiple structures are intended to offer a range of pricing options for the intermediary market. The Board also noted that the total expense ratios of the classes of each fund vary primarily by the level of their 12b-1 fees. The Board considered that, in general, various factors can affect total expense ratios.
The Board noted that the total expense ratio of Class A (including expenses of the Series Funds): (i) ranked below the competitive median for 2019 for Fidelity Advisor Freedom 2005 Fund, Fidelity Advisor Freedom 2010 Fund, Fidelity Advisor Freedom 2015 Fund, and Fidelity Advisor Freedom Income Fund; and (ii) ranked above the competitive median for 2019 for Fidelity Advisor Freedom 2020 Fund, Fidelity Advisor Freedom 2025 Fund, Fidelity Advisor Freedom 2030 Fund, Fidelity Advisor Freedom 2035 Fund, Fidelity Advisor Freedom 2040 Fund, Fidelity Advisor Freedom 2045 Fund, Fidelity Advisor Freedom 2050 Fund, Fidelity Advisor Freedom 2055 Fund, Fidelity Advisor Freedom 2060 Fund, and Fidelity Advisor Freedom 2065 Fund. The Board noted that for each fund for which the total expense ratio of Class A was above the competitive median, the class was above the competitive median because a number of competitor target date funds are classified by Lipper as active, even though their underlying holdings are primarily passive. The Board considered that, when the Total Mapped Group is adjusted to remove funds that invest primarily in passive products and funds that do not have similar vintages, the total expense ratio of Class A of four funds is equal to or below median and the total expense ratio of Class A of each of the remaining funds is two to 12 basis points above median.
The Board noted that the total expense ratio of Class M of each fund (including expenses of the Series Funds) ranked above the competitive median for 2019. The Board noted that the total expense ratio of Class M was above the competitive median primarily because of higher 12b-1 fees on Class M as compared to most competitor funds. Class M has a higher 12b-1 fee, but a lower front-end sales charge, than traditionally priced front-end sales charge classes. The Board considered that Class M is primarily sold load-waived to retirement plans and intermediary wrap programs where its 0.50% 12b-1 fee is comparable to competing no-load, higher 12b-1 fee classes designed specifically for retirement plans and wrap programs. The Board noted that, when the Total Mapped Group is adjusted to remove funds that invest primarily in passive products and funds that do not have similar vintages, and compared with funds with a 0.50% 12b-1 fee, the total expense ratio of Class M of 11 funds is equal to or below median and the total expense ratio of Class M of three funds is two to four basis points above median.
The Board noted that the total expense ratio of Class C of each fund (including expenses of the Series Funds) ranked above the competitive median for 2019. The Board noted that the total expense ratio of Class C was above the competitive median primarily because of its 1.00% 12b-1 fee. The Board noted that, when the Total Mapped Group is adjusted to remove funds that invest primarily in passive products, and compared with funds that charge a 1.00% 12b-1 fee, the total expense ratio of Class C of six funds is equal to or below median and the total expense ratio of Class C of the remaining five funds is four to 14 basis points above median.
The Board noted that the total expense ratio of Class I (including expenses of the Series Funds): (i) ranked below the competitive median for 2019 for Fidelity Advisor Freedom 2005 Fund, Fidelity Advisor Freedom 2010 Fund, and Fidelity Advisor Freedom Income Fund; and (ii) ranked above the competitive median for 2019 for Fidelity Advisor Freedom 2015 Fund, Fidelity Advisor Freedom 2020 Fund, Fidelity Advisor Freedom 2025 Fund, Fidelity Advisor Freedom 2030 Fund, Fidelity Advisor Freedom 2035 Fund, Fidelity Advisor Freedom 2040 Fund, Fidelity Advisor Freedom 2045 Fund, Fidelity Advisor Freedom 2050 Fund, Fidelity Advisor Freedom 2055 Fund, Fidelity Advisor Freedom 2060 Fund, and Fidelity Advisor Freedom 2065 Fund. The Board noted that, for each fund for which the total expense ratio of Class I was above the competitive median, the class was above the competitive median primarily because a number of competitor target date funds are classified by Lipper as active, even though their underlying holdings are primarily passive, and are not limited to no-load products. The Board also considered that Class I has no investment minimum, unlike most competitor funds. The Board considered that, when the Total Mapped Group is adjusted to remove funds that invest primarily in passive products, and compared with no-load products, the total expense ratio of Class I of ten funds is equal to or below median and the total expense ratio of Class I of the remaining fund is one basis point above median.
The Board noted that the total expense ratio of Class Z (including expenses of the Series Funds): (i) ranked below the competitive median for 2019 for Fidelity Advisor Freedom 2005 Fund, Fidelity Advisor Freedom 2010 Fund, Fidelity Advisor Freedom 2015 Fund, Fidelity Advisor Freedom 2020 Fund, and Fidelity Advisor Freedom Income Fund; and (ii) ranked above the competitive median for 2019 for Fidelity Advisor Freedom 2025 Fund, Fidelity Advisor Freedom 2030 Fund, Fidelity Advisor Freedom 2035 Fund, Fidelity Advisor Freedom 2040 Fund, Fidelity Advisor Freedom 2045 Fund, Fidelity Advisor Freedom 2050 Fund, Fidelity Advisor Freedom 2055 Fund, Fidelity Advisor Freedom 2060 Fund, and Fidelity Advisor Freedom 2065 Fund. The Board noted that, for each fund for which the total expense ratio of Class Z was above the competitive median, the class was above the competitive median because a number of competitor target date funds are classified by Lipper as active, even though their underlying holdings are primarily passive. The Board considered that, when the Total Mapped Group is adjusted to remove funds that invest primarily in passive products, the total expense ratio of Class Z of each such fund is equal to or below median.
The Board noted that the total expense ratio of Class Z6 (including expenses of the Series Funds) of each fund ranked below the competitive median for 2019.
The Board considered that current contractual arrangements for the fund oblige FMR to pay all "class-level" expenses of Class Z6 of each fund to the extent necessary to limit total operating expenses, with certain exceptions, to an amount specified in the applicable expense contract. These contractual arrangements may not be amended to increase the fees or expenses payable by Class Z6 of a fund except by a vote of a majority of the Board of Trustees (for each fund) and by a vote of a majority of the outstanding voting securities of Class Z6 of the applicable fund (for each fund, except Fidelity Advisor Freedom 2065 Fund).
In considering the total expense ratio of Class I of Fidelity Advisor Freedom 2030 Fund, the Board also considered an alternative ASPG competitive analysis that focused on competitors most similar in size to the class. The Board noted that the alternative analysis excluded performance fees and 12b-1 fees from the competitive comparisons. The Board noted that, under this alternative competitive analysis, the total expense ratio of Class I of Fidelity Advisor Freedom 2030 Fund ranked below the competitive median for 2019.
Fees Charged to Other Fidelity Clients. The Board also considered Fidelity fee structures and other information with respect to clients of Fidelity, such as other funds advised or subadvised by Fidelity, pension plan clients, and other institutional clients with similar mandates. The Board noted that a joint ad hoc committee created by it and the boards of other Fidelity funds periodically reviews and compares Fidelity's institutional investment advisory business with its business of providing services to the Fidelity funds and also noted the most recent findings of the committee. The Board noted that the committee's review included a consideration of the differences in services provided, fees charged, and costs incurred, as well as competition in the markets serving the different categories of clients.
Based on its review of total expense ratios and fees charged to other Fidelity clients, the Board concluded that the total expense ratio of each class of each fund was reasonable in light of the services that the fund and its shareholders receive and the other factors considered.
Costs of the Services and Profitability. The Board considered the revenues earned and the expenses incurred by Fidelity in conducting the business of developing, marketing, distributing, managing, administering and servicing each fund and the Series Funds in which each fund invests and in servicing each fund's shareholders. The Board also considered the level of Fidelity's profits in respect of all the Fidelity funds.
On an annual basis, Fidelity presents to the Board information about the profitability of its relationships with each fund. Fidelity calculates profitability information for each fund, as well as aggregate profitability information for groups of Fidelity funds and all Fidelity funds, using a series of detailed revenue and cost allocation methodologies which originate with the books and records of Fidelity on which Fidelity's audited financial statements are based. The Audit Committee of the Board reviews any significant changes from the prior year's methodologies and the full Board approves such changes.
A public accounting firm has been engaged annually by the Board as part of the Board's assessment of Fidelity's profitability analysis. The engagement includes the review and assessment of the methodologies used by Fidelity in determining the revenues and expenses attributable to Fidelity's mutual fund business, and completion of agreed-upon procedures in respect of the mathematical accuracy of certain fund profitability information and its conformity to established allocation methodologies. After considering the reports issued under the engagement and information provided by Fidelity, the Board concluded that while other allocation methods may also be reasonable, Fidelity's profitability methodologies are reasonable in all material respects.
The Board also reviewed Fidelity's non-fund businesses and potential indirect benefits such businesses may have received as a result of their association with Fidelity's mutual fund business (i.e., fall-out benefits) as well as cases where Fidelity's affiliates may benefit from the funds' business. The Board considered areas where potential indirect benefits to the Fidelity funds from their relationships with Fidelity may exist. The Board also considered that in 2019 a joint ad hoc committee created by it and the boards of other Fidelity funds evaluated potential fall-out benefits (PFOB Committee). The Board noted that it considered the PFOB Committee's findings in connection with its consideration of the renewal of the Advisory Contracts.
The Board considered the costs of the services provided by and the profits realized by Fidelity in connection with the operation of each fund, including the conclusions of the PFOB Committee, and was satisfied that the profitability was not excessive.
Economies of Scale. The Board considered whether there have been economies of scale in respect of the management of the Fidelity funds, whether the Fidelity funds (including each fund) have appropriately benefited from any such economies of scale, and whether there is potential for realization of any further economies of scale. The Board considered the extent to which each fund will benefit from economies of scale as assets grow through increased services to the fund, through waivers or reimbursements, or through fee or expense ratio reductions. The Board recognized that, due to each fund's current contractual arrangements, its expense ratio will not decline if the fund's operating costs decrease as assets grow, or rise as assets decrease. The Board also noted that a committee (the Economies of Scale Committee) created by it and the boards of other Fidelity funds periodically analyzes whether Fidelity attains economies of scale in respect of the management and servicing of the Fidelity funds, whether the Fidelity funds have appropriately benefited from such economies of scale, and whether there is potential for realization of any further economies of scale.
The Board concluded, taking into account the analysis of the Economies of Scale Committee, that economies of scale, if any, are being appropriately shared between fund shareholders and Fidelity.
Additional Information Requested by the Board. In order to develop fully the factual basis for consideration of the Fidelity funds' advisory contracts, the Board requested and received additional information on certain topics, including: (i) Fidelity's fund profitability methodology, profitability trends for certain funds, the allocation of various costs to different funds, and the impact of certain factors on fund profitability results; (ii) portfolio manager changes that have occurred during the past year and the amount of the investment that each portfolio manager has made in the Fidelity fund(s) that he or she manages; (iii) Fidelity's compensation structure for portfolio managers, research analysts, and other key personnel, including its effects on fund profitability, the rationale for the compensation structure, and the extent to which current market conditions have affected retention and recruitment; (iv) the arrangements with and compensation paid to certain fund sub-advisers on behalf of the Fidelity funds and the treatment of such compensation within Fidelity's fund profitability methodology; (v) the terms of the funds' various management fee structures, including the basic group fee and the terms of Fidelity's voluntary expense limitation agreements; (vi) Fidelity's transfer agent fee, expense, and service structures for different funds and classes relative to competitive trends; (vii) the impact on fund profitability of recent industry trends, such as the growth in passively managed funds and outflows from actively managed equity funds; and (viii) explanations regarding the relative total expense ratios of certain funds and classes, total expense competitive trends and methodologies for total expense competitive comparisons, and actions that might be taken by Fidelity to reduce total expense ratios for certain classes. In addition, the Board considered its discussions with Fidelity regarding Fidelity's efforts to maintain the continuous investment and shareholder services necessary for the funds during the current pandemic and economic circumstances.
Based on its evaluation of all of the conclusions noted above, and after considering all factors it believed relevant, the Board concluded that the advisory fee arrangements are fair and reasonable, and that each fund's Advisory Contract should be renewed.
AFF-SANN-1120
1.792138.117
Fidelity Flex® Freedom Blend Funds - Income, 2005, 2010, 2015, 2020, 2025, 2030, 2035, 2040, 2045, 2050, 2055, 2060, 2065
Semi-Annual Report
September 30, 2020
See the inside front cover for important information about access to your fund’s shareholder reports.
Beginning on January 1, 2021, as permitted by regulations adopted by the Securities and Exchange Commission, paper copies of a fund’s shareholder reports will no longer be sent by mail, unless you specifically request paper copies of the reports from the fund or from your financial intermediary, such as a financial advisor, broker-dealer or bank. Instead, the reports will be made available on a website, and you will be notified by mail each time a report is posted and provided with a website link to access the report.
If you already elected to receive shareholder reports electronically, you will not be affected by this change and you need not take any action. You may elect to receive shareholder reports and other communications from a fund electronically, by contacting your financial intermediary. For Fidelity customers, visit Fidelity's web site or call Fidelity using the contact information listed below.
You may elect to receive all future reports in paper free of charge. If you wish to continue receiving paper copies of your shareholder reports, you may contact your financial intermediary or, if you are a Fidelity customer, visit Fidelity’s website, or call Fidelity at the applicable toll-free number listed below. Your election to receive reports in paper will apply to all funds held with the fund complex/your financial intermediary.
| Account Type | Website | Phone Number |
| Brokerage, Mutual Fund, or Annuity Contracts: | fidelity.com/mailpreferences | 1-800-343-3548 |
| Employer Provided Retirement Accounts: | netbenefits.fidelity.com/preferences (choose 'no' under Required Disclosures to continue to print) | 1-800-343-0860 |
| Advisor Sold Accounts Serviced Through Your Financial Intermediary: | Contact Your Financial Intermediary | Your Financial Intermediary's phone number |
| Advisor Sold Accounts Serviced by Fidelity: | institutional.fidelity.com | 1-877-208-0098 |
Contents
To view a fund's proxy voting guidelines and proxy voting record for the 12-month period ended June 30, visit http://www.fidelity.com/proxyvotingresults or visit the Securities and Exchange Commission's (SEC) web site at http://www.sec.gov.
You may also call 1-800-544-3455 (for managed account clients) or 1-800-835-5092 (for retirement plan participants) to request a free copy of the proxy voting guidelines.
Standard & Poor's, S&P and S&P 500 are registered service marks of The McGraw-Hill Companies, Inc. and have been licensed for use by Fidelity Distributors Corporation.
Other third-party marks appearing herein are the property of their respective owners.
All other marks appearing herein are registered or unregistered trademarks or service marks of FMR LLC or an affiliated company. © 2020 FMR LLC. All rights reserved.
This report and the financial statements contained herein are submitted for the general information of the shareholders of the Funds. This report is not authorized for distribution to prospective investors in the Funds unless preceded or accompanied by an effective prospectus.
A fund files its complete schedule of portfolio holdings with the SEC for the first and third quarters of each fiscal year on Form N-PORT. Forms N-PORT are available on the SEC’s web site at http://www.sec.gov. A fund's Forms N-PORT may be reviewed and copied at the SEC’s Public Reference Room in Washington, DC. Information regarding the operation of the SEC's Public Reference Room may be obtained by calling 1-800-SEC-0330.
For a complete list of a fund's portfolio holdings, view the most recent holdings listing, semiannual report, or annual report on Fidelity's web site at http://www.fidelity.com, http://www.institutional.fidelity.com, or http://www.401k.com, as applicable.
NOT FDIC INSURED •MAY LOSE VALUE •NO BANK GUARANTEE
Neither the Funds nor Fidelity Distributors Corporation is a bank.
Note to Shareholders:
Early in 2020, the outbreak and spread of a new coronavirus emerged as a public health emergency that had a major influence on financial markets, primarily based on its impact on the global economy and the outlook for corporate earnings. The virus causes a respiratory disease known as COVID-19. On March 11, the World Health Organization declared the COVID-19 outbreak a pandemic, citing sustained risk of further global spread.
In the weeks following, as the crisis worsened, we witnessed an escalating human tragedy with wide-scale social and economic consequences from coronavirus-containment measures. The outbreak of COVID-19 prompted a number of measures to limit the spread, including travel and border restrictions, quarantines, and restrictions on large gatherings. In turn, these resulted in lower consumer activity, diminished demand for a wide range of products and services, disruption in manufacturing and supply chains, and – given the wide variability in outcomes regarding the outbreak – significant market uncertainty and volatility. Amid the turmoil, the U.S. government took unprecedented action – in concert with the U.S. Federal Reserve and central banks around the world – to help support consumers, businesses, and the broader economy, and to limit disruption to the financial system.
The situation continues to unfold, and the extent and duration of its impact on financial markets and the economy remain highly uncertain. Extreme events such as the coronavirus crisis are “exogenous shocks” that can have significant adverse effects on mutual funds and their investments. Although multiple asset classes may be affected by market disruption, the duration and impact may not be the same for all types of assets.
Fidelity is committed to helping you stay informed amid news about COVID-19 and during increased market volatility, and we’re taking extra steps to be responsive to customer needs. We encourage you to visit our websites, where we offer ongoing updates, commentary, and analysis on the markets and our funds.
Fidelity Flex® Freedom Blend Income Fund
Investment Summary (Unaudited)
The information in the following tables is based on the direct investments of the Fund.
Top Holdings as of September 30, 2020
| | % of fund's net assets |
| Fidelity Series Treasury Bill Index Fund | 15.2 |
| Fidelity Series Inflation-Protected Bond Index Fund | 12.0 |
| Fidelity Series Investment Grade Bond Fund | 11.5 |
| Fidelity Series Government Bond Index Fund | 10.4 |
| Fidelity Series Corporate Bond Fund | 8.7 |
| Fidelity Series Investment Grade Securitized Fund | 7.9 |
| Fidelity Series Emerging Markets Opportunities Fund | 6.4 |
| Fidelity Series Short-Term Credit Fund | 4.6 |
| Fidelity Series Government Money Market Fund 0.16% | 4.0 |
| Fidelity Series Commodity Strategy Fund | 2.5 |
| | 83.2 |
Asset Allocation (% of fund's net assets)
| Period end |
| | Domestic Equity Funds | 9.0% |
| | International Equity Funds | 12.5% |
| | Bond Funds | 54.7% |
| | Short-Term Funds | 23.8% |

Domestic Equity Funds category includes Fidelity Series Commodity Strategy Fund which invests in commodity-related investments.
Fidelity Flex® Freedom Blend Income Fund
Schedule of Investments September 30, 2020 (Unaudited)
Showing Percentage of Net Assets
| Domestic Equity Funds - 9.0% | | | |
| | | Shares | Value |
| Fidelity Series Blue Chip Growth Fund (a) | | 104 | $1,719 |
| Fidelity Series Commodity Strategy Fund (a) | | 721 | 3,001 |
| Fidelity Series Large Cap Growth Index Fund (a) | | 78 | 1,105 |
| Fidelity Series Large Cap Stock Fund (a) | | 83 | 1,181 |
| Fidelity Series Large Cap Value Index Fund (a) | | 193 | 2,243 |
| Fidelity Series Small Cap Opportunities Fund (a) | | 44 | 564 |
| Fidelity Series Value Discovery Fund (a) | | 66 | 814 |
| TOTAL DOMESTIC EQUITY FUNDS | | | |
| (Cost $10,445) | | | 10,627 |
|
| International Equity Funds - 12.5% | | | |
| Fidelity Series Canada Fund (a) | | 58 | 591 |
| Fidelity Series Emerging Markets Fund (a) | | 90 | 846 |
| Fidelity Series Emerging Markets Opportunities Fund (a) | | 362 | 7,598 |
| Fidelity Series International Growth Fund (a) | | 82 | 1,539 |
| Fidelity Series International Index Fund (a) | | 64 | 634 |
| Fidelity Series International Small Cap Fund (a) | | 30 | 541 |
| Fidelity Series International Value Fund (a) | | 176 | 1,514 |
| Fidelity Series Overseas Fund (a) | | 137 | 1,533 |
| TOTAL INTERNATIONAL EQUITY FUNDS | | | |
| (Cost $13,212) | | | 14,796 |
|
| Bond Funds - 54.7% | | | |
| Fidelity Series Corporate Bond Fund (a) | | 915 | 10,296 |
| Fidelity Series Emerging Markets Debt Fund (a) | | 87 | 790 |
| Fidelity Series Floating Rate High Income Fund (a) | | 19 | 165 |
| Fidelity Series Government Bond Index Fund (a) | | 1,094 | 12,306 |
| Fidelity Series High Income Fund (a) | | 93 | 851 |
| Fidelity Series Inflation-Protected Bond Index Fund (a) | | 1,329 | 14,220 |
| Fidelity Series International Credit Fund (a) | | 6 | 62 |
| Fidelity Series Investment Grade Bond Fund (a) | | 1,119 | 13,696 |
| Fidelity Series Investment Grade Securitized Fund (a) | | 875 | 9,332 |
| Fidelity Series Long-Term Treasury Bond Index Fund (a) | | 263 | 2,720 |
| Fidelity Series Real Estate Income Fund (a) | | 51 | 505 |
| TOTAL BOND FUNDS | | | |
| (Cost $60,972) | | | 64,943 |
|
| Short-Term Funds - 23.8% | | | |
| Fidelity Series Government Money Market Fund 0.16% (a)(b) | | 4,803 | 4,803 |
| Fidelity Series Short-Term Credit Fund (a) | | 534 | 5,472 |
| Fidelity Series Treasury Bill Index Fund (a) | | 1,799 | 18,004 |
| TOTAL SHORT-TERM FUNDS | | | |
| (Cost $28,122) | | | 28,279 |
| TOTAL INVESTMENT IN SECURITIES - 100.0% | | | |
| (Cost $112,751) | | | 118,645 |
| NET OTHER ASSETS (LIABILITIES) - 0.0% | | | 0 |
| NET ASSETS - 100% | | | $118,645 |
Legend
(a) Affiliated Fund
(b) The rate quoted is the annualized seven-day yield of the fund at period end.
Affiliated Underlying Funds
Fiscal year to date information regarding the Fund's investments in affiliated Underlying Funds, excluding any Money Market Central Funds, is presented below. Exchanges between classes of the same affiliated Underlying Funds may occur.
| Affiliate | Value, beginning of period | Purchases | Sales Proceeds | Dividend Income | Realized Gain (loss) | Change in Unrealized appreciation (depreciation) | Value, end of period |
| Fidelity Series Blue Chip Growth Fund | $890 | $987 | $495 | $334 | $60 | $277 | $1,719 |
| Fidelity Series Canada Fund | 576 | 95 | 209 | -- | (41) | 170 | 591 |
| Fidelity Series Commodity Strategy Fund | 3,707 | 141 | 1,232 | 12 | (333) | 718 | 3,001 |
| Fidelity Series Corporate Bond Fund | 8,355 | 1,268 | 244 | 149 | (9) | 926 | 10,296 |
| Fidelity Series Emerging Markets Debt Fund | 685 | 20 | -- | 20 | -- | 85 | 790 |
| Fidelity Series Emerging Markets Fund | 452 | 290 | 96 | -- | (8) | 208 | 846 |
| Fidelity Series Emerging Markets Opportunities Fund | 4,491 | 2,359 | 1,105 | -- | 23 | 1,830 | 7,598 |
| Fidelity Series Floating Rate High Income Fund | 146 | 4 | -- | 4 | -- | 15 | 165 |
| Fidelity Series Government Bond Index Fund | 13,027 | 688 | 1,368 | 93 | 67 | (108) | 12,306 |
| Fidelity Series Government Money Market Fund 0.16% | 5,568 | 1,775 | 2,540 | 6 | -- | -- | 4,803 |
| Fidelity Series High Income Fund | 748 | 23 | -- | 23 | -- | 80 | 851 |
| Fidelity Series Inflation-Protected Bond Index Fund | 13,187 | 400 | 187 | 11 | 4 | 816 | 14,220 |
| Fidelity Series International Credit Fund | 56 | 1 | -- | 1 | -- | 5 | 62 |
| Fidelity Series International Growth Fund | 1,755 | 81 | 733 | -- | 53 | 383 | 1,539 |
| Fidelity Series International Index Fund | 643 | 88 | 229 | -- | (30) | 162 | 634 |
| Fidelity Series International Small Cap Fund | 508 | 12 | 135 | -- | (11) | 167 | 541 |
| Fidelity Series International Value Fund | 1,734 | 105 | 642 | -- | (188) | 505 | 1,514 |
| Fidelity Series Investment Grade Bond Fund | 12,723 | 556 | 362 | 173 | 1 | 778 | 13,696 |
| Fidelity Series Investment Grade Securitized Fund | 8,863 | 761 | 400 | 58 | 4 | 104 | 9,332 |
| Fidelity Series Large Cap Growth Index Fund | 619 | 422 | 272 | 18 | 22 | 314 | 1,105 |
| Fidelity Series Large Cap Stock Fund | 640 | 589 | 177 | 41 | (6) | 135 | 1,181 |
| Fidelity Series Large Cap Value Index Fund | 1,226 | 1,015 | 279 | -- | (30) | 311 | 2,243 |
| Fidelity Series Long-Term Treasury Bond Index Fund | 2,700 | 372 | 270 | 71 | 30 | (112) | 2,720 |
| Fidelity Series Overseas Fund | 1,676 | 181 | 767 | -- | (7) | 450 | 1,533 |
| Fidelity Series Real Estate Income Fund | 412 | 16 | -- | 16 | -- | 77 | 505 |
| Fidelity Series Short-Term Credit Fund | 5,217 | 59 | -- | 59 | -- | 196 | 5,472 |
| Fidelity Series Small Cap Opportunities Fund | 296 | 278 | 107 | 3 | (13) | 110 | 564 |
| Fidelity Series Treasury Bill Index Fund | 17,984 | 74 | -- | 71 | -- | (54) | 18,004 |
| Fidelity Series Value Discovery Fund | 355 | 436 | 85 | -- | (2) | 110 | 814 |
| | $109,239 | $13,096 | $11,934 | $1,163 | $(414) | $8,658 | $118,645 |
Amounts in the income column in the above table include any capital gain distributions from underlying funds, which are presented in the corresponding line-item in the Statement of Operations, if applicable.
Investment Valuation
The following is a summary of the inputs used, as of September 30, 2020, involving the Fund's assets and liabilities carried at fair value. The inputs or methodology used for valuing securities may not be an indication of the risk associated with investing in those securities. For more information on valuation inputs, and their aggregation into the levels used below, please refer to the Investment Valuation section in the accompanying Notes to Financial Statements.
| | Valuation Inputs at Reporting Date: |
| Description | Total | Level 1 | Level 2 | Level 3 |
| Investments in Securities: | | | | |
| Domestic Equity Funds | $10,627 | $10,627 | $-- | $-- |
| International Equity Funds | 14,796 | 14,796 | -- | -- |
| Bond Funds | 64,943 | 64,943 | -- | -- |
| Short-Term Funds | 28,279 | 28,279 | -- | -- |
| Total Investments in Securities: | $118,645 | $118,645 | $-- | $-- |
See accompanying notes which are an integral part of the financial statements.
Fidelity Flex® Freedom Blend Income Fund
Financial Statements
Statement of Assets and Liabilities
| | | September 30, 2020 (Unaudited) |
| Assets | | |
Investment in securities, at value — See accompanying schedule:
| | |
| Affiliated issuers (cost $112,751) | $118,645 | |
| Total Investment in Securities (cost $112,751) | | $118,645 |
| Receivable for investments sold | | 608 |
| Total assets | | 119,253 |
| Liabilities | | |
| Payable for investments purchased | $608 | |
| Total liabilities | | 608 |
| Net Assets | | $118,645 |
| Net Assets consist of: | | |
| Paid in capital | | $112,728 |
| Total accumulated earnings (loss) | | 5,917 |
| Net Assets | | $118,645 |
| Net Asset Value, offering price and redemption price per share ($118,645 ÷ 11,270 shares) | | $10.53 |
See accompanying notes which are an integral part of the financial statements.
Statement of Operations
| | | Six months ended September 30, 2020 (Unaudited) |
| Investment Income | | |
| Dividends: | | |
| Affiliated issuers | | $704 |
| Expenses | | |
| Independent trustees' fees and expenses | $1 | |
| Total expenses | | 1 |
| Net investment income (loss) | | 703 |
| Realized and Unrealized Gain (Loss) | | |
| Net realized gain (loss) on: | | |
| Investment securities: | | |
| Affiliated issuers | (414) | |
| Capital gain distributions from underlying funds: | | |
| Affiliated issuers | 459 | |
| Total net realized gain (loss) | | 45 |
| Change in net unrealized appreciation (depreciation) on: | | |
| Investment securities: | | |
| Affiliated issuers | 8,658 | |
| Total change in net unrealized appreciation (depreciation) | | 8,658 |
| Net gain (loss) | | 8,703 |
| Net increase (decrease) in net assets resulting from operations | | $9,406 |
See accompanying notes which are an integral part of the financial statements.
Statement of Changes in Net Assets
| | Six months ended September 30, 2020 (Unaudited) | Year ended March 31, 2020 |
| Increase (Decrease) in Net Assets | | |
| Operations | | |
| Net investment income (loss) | $703 | $2,560 |
| Net realized gain (loss) | 45 | 1,876 |
| Change in net unrealized appreciation (depreciation) | 8,658 | (2,036) |
| Net increase (decrease) in net assets resulting from operations | 9,406 | 2,400 |
| Distributions to shareholders | (1,165) | (4,839) |
| Share transactions | | |
| Reinvestment of distributions | 1,165 | 4,839 |
| Net increase (decrease) in net assets resulting from share transactions | 1,165 | 4,839 |
| Total increase (decrease) in net assets | 9,406 | 2,400 |
| Net Assets | | |
| Beginning of period | 109,239 | 106,839 |
| End of period | $118,645 | $109,239 |
| Other Information | | |
| Shares | | |
| Sold | – | – |
| Issued in reinvestment of distributions | 115 | 477 |
| Net increase (decrease) | 115 | 477 |
See accompanying notes which are an integral part of the financial statements.
Financial Highlights
Fidelity Flex Freedom Blend Income Fund
| | Six months ended (Unaudited) September 30, | Years endedMarch 31, | | |
| | 2020 | 2020 | 2019 | 2018 A |
| Selected Per–Share Data | | | | |
| Net asset value, beginning of period | $9.79 | $10.01 | $10.09 | $10.00 |
| Income from Investment Operations | | | | |
| Net investment income (loss)B | .06 | .23 | .25 | .18 |
| Net realized and unrealized gain (loss) | .78 | –C | .10 | .13 |
| Total from investment operations | .84 | .23 | .35 | .31 |
| Distributions from net investment income | (.06) | (.24) | (.25) | (.16) |
| Distributions from net realized gain | (.04) | (.21) | (.18) | (.06) |
| Total distributions | (.10) | (.45) | (.43) | (.22) |
| Net asset value, end of period | $10.53 | $9.79 | $10.01 | $10.09 |
| Total ReturnD | 8.67% | 2.17% | 3.63% | 3.14% |
| Ratios to Average Net AssetsE,F | | | | |
| Expenses before reductions | - %G,H | - %H | - %H | - %G |
| Expenses net of fee waivers, if any | - %G,H | - %H | - %H | - %G |
| Expenses net of all reductions | - %G,H | - %H | - %H | - %G |
| Net investment income (loss) | 1.22%G | 2.31% | 2.51% | 2.21%G |
| Supplemental Data | | | | |
| Net assets, end of period (000 omitted) | $119 | $109 | $107 | $103 |
| Portfolio turnover rateF | 21%G | 63% | 23% | 10%G |
A For the period June 8, 2017 (commencement of operations) to March 31, 2018.
B Calculated based on average shares outstanding during the period.
C Amount represents less than $.005 per share.
D Total returns for periods of less than one year are not annualized.
E Expense ratios reflect operating expenses of the class. Expenses before reductions do not reflect amounts reimbursed, waived, or reduced through arrangements with the investment advisor, brokerage services, or other offset arrangements, if applicable, and do not represent the amount paid by the class during periods when reimbursements, waivers or reductions occur.
F Amount does not include the portfolio activity of any underlying mutual funds or exchange-traded funds (ETFs).
G Annualized
H Amount represents less than .005%.
See accompanying notes which are an integral part of the financial statements.
Fidelity Flex® Freedom Blend 2005 Fund
Investment Summary (Unaudited)
The information in the following tables is based on the direct investments of the Fund.
Top Holdings as of September 30, 2020
| | % of fund's net assets |
| Fidelity Series Treasury Bill Index Fund | 13.4 |
| Fidelity Series Inflation-Protected Bond Index Fund | 11.1 |
| Fidelity Series Investment Grade Bond Fund | 11.0 |
| Fidelity Series Government Bond Index Fund | 9.9 |
| Fidelity Series Corporate Bond Fund | 8.3 |
| Fidelity Series Investment Grade Securitized Fund | 7.5 |
| Fidelity Series Emerging Markets Opportunities Fund | 7.0 |
| Fidelity Series Short-Term Credit Fund | 4.0 |
| Fidelity Series Government Money Market Fund 0.16% | 4.0 |
| Fidelity Series Large Cap Value Index Fund | 2.8 |
| | 79.0 |
Asset Allocation (% of fund's net assets)
| Period end |
| | Domestic Equity Funds | 12.1% |
| | International Equity Funds | 14.5% |
| | Bond Funds | 52.0% |
| | Short-Term Funds | 21.4% |

Domestic Equity Funds category includes Fidelity Series Commodity Strategy Fund which invests in commodity-related investments.
Fidelity Flex® Freedom Blend 2005 Fund
Schedule of Investments September 30, 2020 (Unaudited)
Showing Percentage of Net Assets
| Domestic Equity Funds - 12.1% | | | |
| | | Shares | Value |
| Fidelity Series Blue Chip Growth Fund (a) | | 155 | $2,565 |
| Fidelity Series Commodity Strategy Fund (a) | | 732 | 3,044 |
| Fidelity Series Large Cap Growth Index Fund (a) | | 118 | 1,685 |
| Fidelity Series Large Cap Stock Fund (a) | | 126 | 1,787 |
| Fidelity Series Large Cap Value Index Fund (a) | | 291 | 3,380 |
| Fidelity Series Small Cap Opportunities Fund (a) | | 67 | 851 |
| Fidelity Series Value Discovery Fund (a) | | 99 | 1,227 |
| TOTAL DOMESTIC EQUITY FUNDS | | | |
| (Cost $14,311) | | | 14,539 |
|
| International Equity Funds - 14.5% | | | |
| Fidelity Series Canada Fund (a) | | 73 | 752 |
| Fidelity Series Emerging Markets Fund (a) | | 99 | 932 |
| Fidelity Series Emerging Markets Opportunities Fund (a) | | 399 | 8,375 |
| Fidelity Series International Growth Fund (a) | | 106 | 1,984 |
| Fidelity Series International Index Fund (a) | | 82 | 816 |
| Fidelity Series International Small Cap Fund (a) | | 40 | 711 |
| Fidelity Series International Value Fund (a) | | 228 | 1,962 |
| Fidelity Series Overseas Fund (a) | | 177 | 1,981 |
| TOTAL INTERNATIONAL EQUITY FUNDS | | | |
| (Cost $15,788) | | | 17,513 |
|
| Bond Funds - 52.0% | | | |
| Fidelity Series Corporate Bond Fund (a) | | 885 | 9,955 |
| Fidelity Series Emerging Markets Debt Fund (a) | | 87 | 790 |
| Fidelity Series Floating Rate High Income Fund (a) | | 19 | 167 |
| Fidelity Series Government Bond Index Fund (a) | | 1,058 | 11,898 |
| Fidelity Series High Income Fund (a) | | 94 | 859 |
| Fidelity Series Inflation-Protected Bond Index Fund (a) | | 1,246 | 13,334 |
| Fidelity Series International Credit Fund (a) | | 6 | 63 |
| Fidelity Series Investment Grade Bond Fund (a) | | 1,082 | 13,242 |
| Fidelity Series Investment Grade Securitized Fund (a) | | 846 | 9,024 |
| Fidelity Series Long-Term Treasury Bond Index Fund (a) | | 267 | 2,763 |
| Fidelity Series Real Estate Income Fund (a) | | 51 | 511 |
| TOTAL BOND FUNDS | | | |
| (Cost $58,860) | | | 62,606 |
|
| Short-Term Funds - 21.4% | | | |
| Fidelity Series Government Money Market Fund 0.16% (a)(b) | | 4,755 | 4,755 |
| Fidelity Series Short-Term Credit Fund (a) | | 471 | 4,830 |
| Fidelity Series Treasury Bill Index Fund (a) | | 1,610 | 16,118 |
| TOTAL SHORT-TERM FUNDS | | | |
| (Cost $25,569) | | | 25,703 |
| TOTAL INVESTMENT IN SECURITIES - 100.0% | | | |
| (Cost $114,528) | | | 120,361 |
| NET OTHER ASSETS (LIABILITIES) - 0.0% | | | 1 |
| NET ASSETS - 100% | | | $120,362 |
Legend
(a) Affiliated Fund
(b) The rate quoted is the annualized seven-day yield of the fund at period end.
Affiliated Underlying Funds
Fiscal year to date information regarding the Fund's investments in affiliated Underlying Funds, excluding any Money Market Central Funds, is presented below. Exchanges between classes of the same affiliated Underlying Funds may occur.
| Affiliate | Value, beginning of period | Purchases | Sales Proceeds | Dividend Income | Realized Gain (loss) | Change in Unrealized appreciation (depreciation) | Value, end of period |
| Fidelity Series Blue Chip Growth Fund | $1,723 | $1,025 | $793 | $508 | $157 | $453 | $2,565 |
| Fidelity Series Canada Fund | 721 | 96 | 232 | -- | (35) | 202 | 752 |
| Fidelity Series Commodity Strategy Fund | 3,707 | 133 | 1,190 | 13 | (308) | 702 | 3,044 |
| Fidelity Series Corporate Bond Fund | 7,918 | 1,437 | 269 | 142 | (10) | 879 | 9,955 |
| Fidelity Series Emerging Markets Debt Fund | 685 | 20 | -- | 20 | -- | 85 | 790 |
| Fidelity Series Emerging Markets Fund | 522 | 291 | 104 | -- | (9) | 232 | 932 |
| Fidelity Series Emerging Markets Opportunities Fund | 5,153 | 2,328 | 1,178 | -- | 27 | 2,045 | 8,375 |
| Fidelity Series Floating Rate High Income Fund | 148 | 4 | -- | 4 | -- | 15 | 167 |
| Fidelity Series Government Bond Index Fund | 12,258 | 765 | 1,085 | 89 | 51 | (91) | 11,898 |
| Fidelity Series Government Money Market Fund 0.16% | 4,900 | 2,286 | 2,431 | 5 | -- | -- | 4,755 |
| Fidelity Series High Income Fund | 755 | 23 | -- | 23 | -- | 81 | 859 |
| Fidelity Series Inflation-Protected Bond Index Fund | 12,031 | 712 | 164 | 10 | 2 | 753 | 13,334 |
| Fidelity Series International Credit Fund | 57 | 1 | -- | 1 | -- | 5 | 63 |
| Fidelity Series International Growth Fund | 2,316 | 87 | 991 | -- | 69 | 503 | 1,984 |
| Fidelity Series International Index Fund | 827 | 82 | 261 | -- | (31) | 199 | 816 |
| Fidelity Series International Small Cap Fund | 653 | 14 | 155 | -- | (11) | 210 | 711 |
| Fidelity Series International Value Fund | 2,200 | 96 | 739 | -- | (171) | 576 | 1,962 |
| Fidelity Series Investment Grade Bond Fund | 12,029 | 888 | 413 | 165 | 3 | 735 | 13,242 |
| Fidelity Series Investment Grade Securitized Fund | 8,330 | 944 | 352 | 55 | 3 | 99 | 9,024 |
| Fidelity Series Large Cap Growth Index Fund | 1,249 | 315 | 445 | 30 | 59 | 507 | 1,685 |
| Fidelity Series Large Cap Stock Fund | 1,294 | 511 | 262 | 64 | (6) | 250 | 1,787 |
| Fidelity Series Large Cap Value Index Fund | 2,438 | 845 | 419 | -- | (38) | 554 | 3,380 |
| Fidelity Series Long-Term Treasury Bond Index Fund | 2,711 | 412 | 277 | 71 | 34 | (117) | 2,763 |
| Fidelity Series Overseas Fund | 2,115 | 234 | 935 | -- | (5) | 572 | 1,981 |
| Fidelity Series Real Estate Income Fund | 417 | 17 | -- | 16 | -- | 77 | 511 |
| Fidelity Series Short-Term Credit Fund | 4,605 | 52 | -- | 52 | -- | 173 | 4,830 |
| Fidelity Series Small Cap Opportunities Fund | 624 | 226 | 171 | 5 | (20) | 192 | 851 |
| Fidelity Series Treasury Bill Index Fund | 16,102 | 64 | -- | 64 | -- | (48) | 16,118 |
| Fidelity Series Value Discovery Fund | 739 | 417 | 124 | -- | (4) | 199 | 1,227 |
| | $109,227 | $14,325 | $12,990 | $1,337 | $(243) | $10,042 | $120,361 |
Amounts in the income column in the above table include any capital gain distributions from underlying funds, which are presented in the corresponding line-item in the Statement of Operations, if applicable.
Investment Valuation
The following is a summary of the inputs used, as of September 30, 2020, involving the Fund's assets and liabilities carried at fair value. The inputs or methodology used for valuing securities may not be an indication of the risk associated with investing in those securities. For more information on valuation inputs, and their aggregation into the levels used below, please refer to the Investment Valuation section in the accompanying Notes to Financial Statements.
| | Valuation Inputs at Reporting Date: |
| Description | Total | Level 1 | Level 2 | Level 3 |
| Investments in Securities: | | | | |
| Domestic Equity Funds | $14,539 | $14,539 | $-- | $-- |
| International Equity Funds | 17,513 | 17,513 | -- | -- |
| Bond Funds | 62,606 | 62,606 | -- | -- |
| Short-Term Funds | 25,703 | 25,703 | -- | -- |
| Total Investments in Securities: | $120,361 | $120,361 | $-- | $-- |
See accompanying notes which are an integral part of the financial statements.
Fidelity Flex® Freedom Blend 2005 Fund
Financial Statements
Statement of Assets and Liabilities
| | | September 30, 2020 (Unaudited) |
| Assets | | |
Investment in securities, at value — See accompanying schedule:
| | |
| Affiliated issuers (cost $114,528) | $120,361 | |
| Total Investment in Securities (cost $114,528) | | $120,361 |
| Receivable for investments sold | | 549 |
| Total assets | | 120,910 |
| Liabilities | | |
| Payable for investments purchased | $548 | |
| Total liabilities | | 548 |
| Net Assets | | $120,362 |
| Net Assets consist of: | | |
| Paid in capital | | $113,677 |
| Total accumulated earnings (loss) | | 6,685 |
| Net Assets | | $120,362 |
| Net Asset Value, offering price and redemption price per share ($120,362 ÷ 11,370 shares) | | $10.59 |
See accompanying notes which are an integral part of the financial statements.
Statement of Operations
| | | Six months ended September 30, 2020 (Unaudited) |
| Investment Income | | |
| Dividends: | | |
| Affiliated issuers | | $687 |
| Expenses | | |
| Independent trustees' fees and expenses | $1 | |
| Total expenses | | 1 |
| Net investment income (loss) | | 686 |
| Realized and Unrealized Gain (Loss) | | |
| Net realized gain (loss) on: | | |
| Investment securities: | | |
| Affiliated issuers | (243) | |
| Capital gain distributions from underlying funds: | | |
| Affiliated issuers | 650 | |
| Total net realized gain (loss) | | 407 |
| Change in net unrealized appreciation (depreciation) on: | | |
| Investment securities: | | |
| Affiliated issuers | 10,042 | |
| Total change in net unrealized appreciation (depreciation) | | 10,042 |
| Net gain (loss) | | 10,449 |
| Net increase (decrease) in net assets resulting from operations | | $11,135 |
See accompanying notes which are an integral part of the financial statements.
Statement of Changes in Net Assets
| | Six months ended September 30, 2020 (Unaudited) | Year ended March 31, 2020 |
| Increase (Decrease) in Net Assets | | |
| Operations | | |
| Net investment income (loss) | $686 | $2,591 |
| Net realized gain (loss) | 407 | 2,094 |
| Change in net unrealized appreciation (depreciation) | 10,042 | (3,331) |
| Net increase (decrease) in net assets resulting from operations | 11,135 | 1,354 |
| Distributions to shareholders | (1,048) | (5,390) |
| Share transactions | | |
| Reinvestment of distributions | 1,048 | 5,390 |
| Net increase (decrease) in net assets resulting from share transactions | 1,048 | 5,390 |
| Total increase (decrease) in net assets | 11,135 | 1,354 |
| Net Assets | | |
| Beginning of period | 109,227 | 107,873 |
| End of period | $120,362 | $109,227 |
| Other Information | | |
| Shares | | |
| Sold | – | – |
| Issued in reinvestment of distributions | 105 | 531 |
| Net increase (decrease) | 105 | 531 |
See accompanying notes which are an integral part of the financial statements.
Financial Highlights
Fidelity Flex Freedom Blend 2005 Fund
| | Six months ended (Unaudited) September 30, | Years endedMarch 31, | | |
| | 2020 | 2020 | 2019 | 2018 A |
| Selected Per–Share Data | | | | |
| Net asset value, beginning of period | $9.70 | $10.05 | $10.21 | $10.00 |
| Income from Investment Operations | | | | |
| Net investment income (loss)B | .06 | .24 | .25 | .18 |
| Net realized and unrealized gain (loss) | .92 | (.09) | .08 | .25 |
| Total from investment operations | .98 | .15 | .33 | .43 |
| Distributions from net investment income | (.04) | (.25) | (.25) | (.14) |
| Distributions from net realized gain | (.06) | (.25) | (.24) | (.08) |
| Total distributions | (.09)C | (.50) | (.49) | (.22) |
| Net asset value, end of period | $10.59 | $9.70 | $10.05 | $10.21 |
| Total ReturnD | 10.20% | 1.29% | 3.43% | 4.29% |
| Ratios to Average Net AssetsE,F | | | | |
| Expenses before reductions | - %G,H | - %H | - %H | - %G |
| Expenses net of fee waivers, if any | - %G,H | - %H | - %H | - %G |
| Expenses net of all reductions | - %G,H | - %H | - %H | - %G |
| Net investment income (loss) | 1.18%G | 2.31% | 2.49% | 2.21%G |
| Supplemental Data | | | | |
| Net assets, end of period (000 omitted) | $120 | $109 | $108 | $104 |
| Portfolio turnover rateF | 22%G | 65% | 23% | 13%G |
A For the period June 8, 2017 (commencement of operations) to March 31, 2018.
B Calculated based on average shares outstanding during the period.
C Total distributions per share do not sum due to rounding.
D Total returns for periods of less than one year are not annualized.
E Expense ratios reflect operating expenses of the class. Expenses before reductions do not reflect amounts reimbursed, waived, or reduced through arrangements with the investment advisor, brokerage services, or other offset arrangements, if applicable, and do not represent the amount paid by the class during periods when reimbursements, waivers or reductions occur.
F Amount does not include the portfolio activity of any underlying mutual funds or exchange-traded funds (ETFs).
G Annualized
H Amount represents less than .005%.
See accompanying notes which are an integral part of the financial statements.
Fidelity Flex® Freedom Blend 2010 Fund
Investment Summary (Unaudited)
The information in the following tables is based on the direct investments of the Fund.
Top Holdings as of September 30, 2020
| | % of fund's net assets |
| Fidelity Series Treasury Bill Index Fund | 10.9 |
| Fidelity Series Investment Grade Bond Fund | 10.0 |
| Fidelity Series Inflation-Protected Bond Index Fund | 9.6 |
| Fidelity Series Government Bond Index Fund | 8.9 |
| Fidelity Series Emerging Markets Opportunities Fund | 7.9 |
| Fidelity Series Corporate Bond Fund | 7.5 |
| Fidelity Series Investment Grade Securitized Fund | 6.8 |
| Fidelity Series Large Cap Value Index Fund | 4.4 |
| Fidelity Series Blue Chip Growth Fund | 3.4 |
| Fidelity Series Short-Term Credit Fund | 3.2 |
| | 72.6 |
Asset Allocation (% of fund's net assets)
| Period end |
| | Domestic Equity Funds | 17.6% |
| | International Equity Funds | 18.2% |
| | Bond Funds | 47.0% |
| | Short-Term Funds | 17.2% |

Domestic Equity Funds category includes Fidelity Series Commodity Strategy Fund which invests in commodity-related investments.
Fidelity Flex® Freedom Blend 2010 Fund
Schedule of Investments September 30, 2020 (Unaudited)
Showing Percentage of Net Assets
| Domestic Equity Funds - 17.6% | | | |
| | | Shares | Value |
| Fidelity Series Blue Chip Growth Fund (a) | | 249 | $4,104 |
| Fidelity Series Commodity Strategy Fund (a) | | 743 | 3,089 |
| Fidelity Series Large Cap Growth Index Fund (a) | | 190 | 2,699 |
| Fidelity Series Large Cap Stock Fund (a) | | 202 | 2,861 |
| Fidelity Series Large Cap Value Index Fund (a) | | 466 | 5,411 |
| Fidelity Series Small Cap Opportunities Fund (a) | | 107 | 1,362 |
| Fidelity Series Value Discovery Fund (a) | | 159 | 1,964 |
| TOTAL DOMESTIC EQUITY FUNDS | | | |
| (Cost $21,126) | | | 21,490 |
|
| International Equity Funds - 18.2% | | | |
| Fidelity Series Canada Fund (a) | | 104 | 1,067 |
| Fidelity Series Emerging Markets Fund (a) | | 115 | 1,080 |
| Fidelity Series Emerging Markets Opportunities Fund (a) | | 462 | 9,702 |
| Fidelity Series International Growth Fund (a) | | 148 | 2,773 |
| Fidelity Series International Index Fund (a) | | 114 | 1,133 |
| Fidelity Series International Small Cap Fund (a) | | 56 | 994 |
| Fidelity Series International Value Fund (a) | | 317 | 2,737 |
| Fidelity Series Overseas Fund (a) | | 249 | 2,786 |
| TOTAL INTERNATIONAL EQUITY FUNDS | | | |
| (Cost $20,286) | | | 22,272 |
|
| Bond Funds - 47.0% | | | |
| Fidelity Series Corporate Bond Fund (a) | | 812 | 9,138 |
| Fidelity Series Emerging Markets Debt Fund (a) | | 87 | 785 |
| Fidelity Series Floating Rate High Income Fund (a) | | 19 | 169 |
| Fidelity Series Government Bond Index Fund (a) | | 971 | 10,921 |
| Fidelity Series High Income Fund (a) | | 95 | 869 |
| Fidelity Series Inflation-Protected Bond Index Fund (a) | | 1,093 | 11,694 |
| Fidelity Series International Credit Fund (a) | | 6 | 63 |
| Fidelity Series Investment Grade Bond Fund (a) | | 993 | 12,155 |
| Fidelity Series Investment Grade Securitized Fund (a) | | 776 | 8,283 |
| Fidelity Series Long-Term Treasury Bond Index Fund (a) | | 272 | 2,805 |
| Fidelity Series Real Estate Income Fund (a) | | 52 | 516 |
| TOTAL BOND FUNDS | | | |
| (Cost $54,040) | | | 57,398 |
|
| Short-Term Funds - 17.2% | | | |
| Fidelity Series Government Money Market Fund 0.16% (a)(b) | | 3,804 | 3,804 |
| Fidelity Series Short-Term Credit Fund (a) | | 381 | 3,903 |
| Fidelity Series Treasury Bill Index Fund (a) | | 1,333 | 13,346 |
| TOTAL SHORT-TERM FUNDS | | | |
| (Cost $20,944) | | | 21,053 |
| TOTAL INVESTMENT IN SECURITIES - 100.0% | | | |
| (Cost $116,396) | | | 122,213 |
| NET OTHER ASSETS (LIABILITIES) - 0.0% | | | (1) |
| NET ASSETS - 100% | | | $122,212 |
Legend
(a) Affiliated Fund
(b) The rate quoted is the annualized seven-day yield of the fund at period end.
Affiliated Underlying Funds
Fiscal year to date information regarding the Fund's investments in affiliated Underlying Funds, excluding any Money Market Central Funds, is presented below. Exchanges between classes of the same affiliated Underlying Funds may occur.
| Affiliate | Value, beginning of period | Purchases | Sales Proceeds | Dividend Income | Realized Gain (loss) | Change in Unrealized appreciation (depreciation) | Value, end of period |
| Fidelity Series Blue Chip Growth Fund | $2,958 | $1,329 | $1,190 | $814 | $270 | $737 | $4,104 |
| Fidelity Series Canada Fund | 978 | 156 | 292 | -- | (55) | 280 | 1,067 |
| Fidelity Series Commodity Strategy Fund | 3,680 | 136 | 1,122 | 13 | (271) | 666 | 3,089 |
| Fidelity Series Corporate Bond Fund | 7,095 | 1,566 | 305 | 129 | (9) | 791 | 9,138 |
| Fidelity Series Emerging Markets Debt Fund | 680 | 20 | -- | 20 | -- | 85 | 785 |
| Fidelity Series Emerging Markets Fund | 621 | 288 | 88 | -- | (7) | 266 | 1,080 |
| Fidelity Series Emerging Markets Opportunities Fund | 6,114 | 2,308 | 1,122 | -- | 27 | 2,375 | 9,702 |
| Fidelity Series Floating Rate High Income Fund | 150 | 4 | -- | 4 | -- | 15 | 169 |
| Fidelity Series Government Bond Index Fund | 10,982 | 959 | 983 | 80 | 39 | (76) | 10,921 |
| Fidelity Series Government Money Market Fund 0.16% | 3,890 | 2,412 | 2,498 | 4 | -- | -- | 3,804 |
| Fidelity Series High Income Fund | 764 | 23 | -- | 23 | -- | 82 | 869 |
| Fidelity Series Inflation-Protected Bond Index Fund | 10,317 | 896 | 173 | 9 | 2 | 652 | 11,694 |
| Fidelity Series International Credit Fund | 57 | 1 | -- | 1 | -- | 5 | 63 |
| Fidelity Series International Growth Fund | 3,022 | 152 | 1,163 | -- | 74 | 688 | 2,773 |
| Fidelity Series International Index Fund | 1,089 | 97 | 279 | -- | (30) | 256 | 1,133 |
| Fidelity Series International Small Cap Fund | 893 | 12 | 185 | -- | (14) | 288 | 994 |
| Fidelity Series International Value Fund | 2,876 | 104 | 785 | -- | (227) | 769 | 2,737 |
| Fidelity Series Investment Grade Bond Fund | 10,748 | 1,167 | 426 | 150 | 3 | 663 | 12,155 |
| Fidelity Series Investment Grade Securitized Fund | 7,464 | 1,079 | 352 | 50 | 2 | 90 | 8,283 |
| Fidelity Series Large Cap Growth Index Fund | 2,184 | 344 | 766 | 49 | 117 | 820 | 2,699 |
| Fidelity Series Large Cap Stock Fund | 2,266 | 501 | 319 | 101 | (12) | 425 | 2,861 |
| Fidelity Series Large Cap Value Index Fund | 4,232 | 853 | 549 | -- | (39) | 914 | 5,411 |
| Fidelity Series Long-Term Treasury Bond Index Fund | 2,692 | 478 | 283 | 71 | 36 | (118) | 2,805 |
| Fidelity Series Overseas Fund | 2,801 | 290 | 1,063 | -- | (3) | 761 | 2,786 |
| Fidelity Series Real Estate Income Fund | 422 | 16 | -- | 16 | -- | 78 | 516 |
| Fidelity Series Short-Term Credit Fund | 3,721 | 42 | -- | 42 | -- | 140 | 3,903 |
| Fidelity Series Small Cap Opportunities Fund | 1,112 | 221 | 251 | 8 | (34) | 314 | 1,362 |
| Fidelity Series Treasury Bill Index Fund | 13,332 | 54 | -- | 53 | -- | (40) | 13,346 |
| Fidelity Series Value Discovery Fund | 1,310 | 502 | 179 | -- | (10) | 341 | 1,964 |
| | $108,450 | $16,010 | $14,373 | $1,637 | $(141) | $12,267 | $122,213 |
Amounts in the income column in the above table include any capital gain distributions from underlying funds, which are presented in the corresponding line-item in the Statement of Operations, if applicable.
Investment Valuation
The following is a summary of the inputs used, as of September 30, 2020, involving the Fund's assets and liabilities carried at fair value. The inputs or methodology used for valuing securities may not be an indication of the risk associated with investing in those securities. For more information on valuation inputs, and their aggregation into the levels used below, please refer to the Investment Valuation section in the accompanying Notes to Financial Statements.
| | Valuation Inputs at Reporting Date: |
| Description | Total | Level 1 | Level 2 | Level 3 |
| Investments in Securities: | | | | |
| Domestic Equity Funds | $21,490 | $21,490 | $-- | $-- |
| International Equity Funds | 22,272 | 22,272 | -- | -- |
| Bond Funds | 57,398 | 57,398 | -- | -- |
| Short-Term Funds | 21,053 | 21,053 | -- | -- |
| Total Investments in Securities: | $122,213 | $122,213 | $-- | $-- |
See accompanying notes which are an integral part of the financial statements.
Fidelity Flex® Freedom Blend 2010 Fund
Financial Statements
Statement of Assets and Liabilities
| | | September 30, 2020 (Unaudited) |
| Assets | | |
Investment in securities, at value — See accompanying schedule:
| | |
| Affiliated issuers (cost $116,396) | $122,213 | |
| Total Investment in Securities (cost $116,396) | | $122,213 |
| Receivable for investments sold | | 699 |
| Total assets | | 122,912 |
| Liabilities | | |
| Payable for investments purchased | $700 | |
| Total liabilities | | 700 |
| Net Assets | | $122,212 |
| Net Assets consist of: | | |
| Paid in capital | | $115,210 |
| Total accumulated earnings (loss) | | 7,002 |
| Net Assets | | $122,212 |
| Net Asset Value, offering price and redemption price per share ($122,212 ÷ 11,522 shares) | | $10.61 |
See accompanying notes which are an integral part of the financial statements.
Statement of Operations
| | | Six months ended September 30, 2020 (Unaudited) |
| Investment Income | | |
| Dividends: | | |
| Affiliated issuers | | $649 |
| Expenses | | |
| Independent trustees' fees and expenses | $1 | |
| Total expenses | | 1 |
| Net investment income (loss) | | 648 |
| Realized and Unrealized Gain (Loss) | | |
| Net realized gain (loss) on: | | |
| Investment securities: | | |
| Affiliated issuers | (141) | |
| Capital gain distributions from underlying funds: | | |
| Affiliated issuers | 988 | |
| Total net realized gain (loss) | | 847 |
| Change in net unrealized appreciation (depreciation) on: | | |
| Investment securities: | | |
| Affiliated issuers | 12,267 | |
| Total change in net unrealized appreciation (depreciation) | | 12,267 |
| Net gain (loss) | | 13,114 |
| Net increase (decrease) in net assets resulting from operations | | $13,762 |
See accompanying notes which are an integral part of the financial statements.
Statement of Changes in Net Assets
| | Six months ended September 30, 2020 (Unaudited) | Year ended March 31, 2020 |
| Increase (Decrease) in Net Assets | | |
| Operations | | |
| Net investment income (loss) | $648 | $2,627 |
| Net realized gain (loss) | 847 | 2,474 |
| Change in net unrealized appreciation (depreciation) | 12,267 | (5,415) |
| Net increase (decrease) in net assets resulting from operations | 13,762 | (314) |
| Distributions to shareholders | (1,332) | (5,958) |
| Share transactions | | |
| Reinvestment of distributions | 1,332 | 5,958 |
| Net increase (decrease) in net assets resulting from share transactions | 1,332 | 5,958 |
| Total increase (decrease) in net assets | 13,762 | (314) |
| Net Assets | | |
| Beginning of period | 108,450 | 108,764 |
| End of period | $122,212 | $108,450 |
| Other Information | | |
| Shares | | |
| Sold | – | – |
| Issued in reinvestment of distributions | 135 | 585 |
| Net increase (decrease) | 135 | 585 |
See accompanying notes which are an integral part of the financial statements.
Financial Highlights
Fidelity Flex Freedom Blend 2010 Fund
| | Six months ended (Unaudited) September 30, | Years endedMarch 31, | | |
| | 2020 | 2020 | 2019 | 2018 A |
| Selected Per–Share Data | | | | |
| Net asset value, beginning of period | $9.52 | $10.07 | $10.28 | $10.00 |
| Income from Investment Operations | | | | |
| Net investment income (loss)B | .06 | .24 | .25 | .19 |
| Net realized and unrealized gain (loss) | 1.15 | (.24) | .07 | .33 |
| Total from investment operations | 1.21 | –C | .32 | .52 |
| Distributions from net investment income | (.03) | (.25) | (.25) | (.15) |
| Distributions from net realized gain | (.08) | (.30) | (.29) | (.10) |
| Total distributions | (.12)D | (.55) | (.53)D | (.24)D |
| Net asset value, end of period | $10.61 | $9.52 | $10.07 | $10.28 |
| Total ReturnE | 12.77% | (.34)% | 3.40% | 5.20% |
| Ratios to Average Net AssetsF,G | | | | |
| Expenses before reductions | - %H,I | - %I | - %I | - %H |
| Expenses net of fee waivers, if any | - %H,I | - %I | - %I | - %H |
| Expenses net of all reductions | - %H,I | - %I | - %I | - %H |
| Net investment income (loss) | 1.10%H | 2.32% | 2.46% | 2.22%H |
| Supplemental Data | | | | |
| Net assets, end of period (000 omitted) | $122 | $108 | $109 | $105 |
| Portfolio turnover rateG | 24%H | 65% | 23% | 13%H |
A For the period June 8, 2017 (commencement of operations) to March 31, 2018.
B Calculated based on average shares outstanding during the period.
C Amount represents less than $.005 per share.
D Total distributions per share do not sum due to rounding.
E Total returns for periods of less than one year are not annualized.
F Expense ratios reflect operating expenses of the class. Expenses before reductions do not reflect amounts reimbursed, waived, or reduced through arrangements with the investment advisor, brokerage services, or other offset arrangements, if applicable, and do not represent the amount paid by the class during periods when reimbursements, waivers or reductions occur.
G Amount does not include the portfolio activity of any underlying mutual funds or exchange-traded funds (ETFs).
H Annualized
I Amount represents less than .005%.
See accompanying notes which are an integral part of the financial statements.
Fidelity Flex® Freedom Blend 2015 Fund
Investment Summary (Unaudited)
The information in the following tables is based on the direct investments of the Fund.
Top Holdings as of September 30, 2020
| | % of fund's net assets |
| Fidelity Series Emerging Markets Opportunities Fund | 8.9 |
| Fidelity Series Investment Grade Bond Fund | 8.8 |
| Fidelity Series Treasury Bill Index Fund | 8.5 |
| Fidelity Series Inflation-Protected Bond Index Fund | 8.3 |
| Fidelity Series Government Bond Index Fund | 7.9 |
| Fidelity Series Corporate Bond Fund | 6.6 |
| Fidelity Series Large Cap Value Index Fund | 6.1 |
| Fidelity Series Investment Grade Securitized Fund | 6.0 |
| Fidelity Series Blue Chip Growth Fund | 4.6 |
| Fidelity Series Large Cap Stock Fund | 3.2 |
| | 68.9 |
Asset Allocation (% of fund's net assets)
| Period end |
| | Domestic Equity Funds | 23.1% |
| | International Equity Funds | 21.9% |
| | Bond Funds | 41.9% |
| | Short-Term Funds | 13.1% |

Domestic Equity Funds category includes Fidelity Series Commodity Strategy Fund which invests in commodity-related investments.
Fidelity Flex® Freedom Blend 2015 Fund
Schedule of Investments September 30, 2020 (Unaudited)
Showing Percentage of Net Assets
| Domestic Equity Funds - 23.1% | | | |
| | | Shares | Value |
| Fidelity Series Blue Chip Growth Fund (a) | | 345 | $5,699 |
| Fidelity Series Commodity Strategy Fund (a) | | 753 | 3,133 |
| Fidelity Series Large Cap Growth Index Fund (a) | | 262 | 3,731 |
| Fidelity Series Large Cap Stock Fund (a) | | 280 | 3,965 |
| Fidelity Series Large Cap Value Index Fund (a) | | 647 | 7,500 |
| Fidelity Series Small Cap Opportunities Fund (a) | | 148 | 1,887 |
| Fidelity Series Value Discovery Fund (a) | | 220 | 2,723 |
| TOTAL DOMESTIC EQUITY FUNDS | | | |
| (Cost $28,109) | | | 28,638 |
|
| International Equity Funds - 21.9% | | | |
| Fidelity Series Canada Fund (a) | | 135 | 1,379 |
| Fidelity Series Emerging Markets Fund (a) | | 130 | 1,229 |
| Fidelity Series Emerging Markets Opportunities Fund (a) | | 527 | 11,048 |
| Fidelity Series International Growth Fund (a) | | 191 | 3,585 |
| Fidelity Series International Index Fund (a) | | 149 | 1,480 |
| Fidelity Series International Small Cap Fund (a) | | 72 | 1,286 |
| Fidelity Series International Value Fund (a) | | 411 | 3,543 |
| Fidelity Series Overseas Fund (a) | | 320 | 3,580 |
| TOTAL INTERNATIONAL EQUITY FUNDS | | | |
| (Cost $24,862) | | | 27,130 |
|
| Bond Funds - 41.9% | | | |
| Fidelity Series Corporate Bond Fund (a) | | 731 | 8,224 |
| Fidelity Series Emerging Markets Debt Fund (a) | | 86 | 779 |
| Fidelity Series Floating Rate High Income Fund (a) | | 19 | 171 |
| Fidelity Series Government Bond Index Fund (a) | | 874 | 9,829 |
| Fidelity Series High Income Fund (a) | | 96 | 878 |
| Fidelity Series Inflation-Protected Bond Index Fund (a) | | 962 | 10,294 |
| Fidelity Series International Credit Fund (a) | | 6 | 64 |
| Fidelity Series Investment Grade Bond Fund (a) | | 894 | 10,939 |
| Fidelity Series Investment Grade Securitized Fund (a) | | 699 | 7,455 |
| Fidelity Series Long-Term Treasury Bond Index Fund (a) | | 276 | 2,849 |
| Fidelity Series Real Estate Income Fund (a) | | 52 | 520 |
| TOTAL BOND FUNDS | | | |
| (Cost $49,033) | | | 52,002 |
|
| Short-Term Funds - 13.1% | | | |
| Fidelity Series Government Money Market Fund 0.16% (a)(b) | | 2,775 | 2,775 |
| Fidelity Series Short-Term Credit Fund (a) | | 287 | 2,940 |
| Fidelity Series Treasury Bill Index Fund (a) | | 1,050 | 10,508 |
| TOTAL SHORT-TERM FUNDS | | | |
| (Cost $16,141) | | | 16,223 |
| TOTAL INVESTMENT IN SECURITIES - 100.0% | | | |
| (Cost $118,145) | | | 123,993 |
| NET OTHER ASSETS (LIABILITIES) - 0.0% | | | 2 |
| NET ASSETS - 100% | | | $123,995 |
Legend
(a) Affiliated Fund
(b) The rate quoted is the annualized seven-day yield of the fund at period end.
Affiliated Underlying Funds
Fiscal year to date information regarding the Fund's investments in affiliated Underlying Funds, excluding any Money Market Central Funds, is presented below. Exchanges between classes of the same affiliated Underlying Funds may occur.
| Affiliate | Value, beginning of period | Purchases | Sales Proceeds | Dividend Income | Realized Gain (loss) | Change in Unrealized appreciation (depreciation) | Value, end of period |
| Fidelity Series Blue Chip Growth Fund | $4,171 | $1,599 | $1,466 | $1,129 | $363 | $1,032 | $5,699 |
| Fidelity Series Canada Fund | 1,238 | 157 | 298 | -- | (53) | 335 | 1,379 |
| Fidelity Series Commodity Strategy Fund | 3,651 | 137 | 1,050 | 13 | (250) | 645 | 3,133 |
| Fidelity Series Corporate Bond Fund | 6,240 | 1,603 | 309 | 115 | (8) | 698 | 8,224 |
| Fidelity Series Emerging Markets Debt Fund | 675 | 20 | -- | 20 | -- | 84 | 779 |
| Fidelity Series Emerging Markets Fund | 727 | 283 | 75 | -- | (5) | 299 | 1,229 |
| Fidelity Series Emerging Markets Opportunities Fund | 7,032 | 2,323 | 1,044 | -- | 19 | 2,718 | 11,048 |
| Fidelity Series Floating Rate High Income Fund | 151 | 5 | -- | 4 | -- | 15 | 171 |
| Fidelity Series Government Bond Index Fund | 9,656 | 1,192 | 985 | 72 | 29 | (63) | 9,829 |
| Fidelity Series Government Money Market Fund 0.16% | 3,003 | 2,301 | 2,529 | 3 | -- | -- | 2,775 |
| Fidelity Series High Income Fund | 772 | 23 | -- | 23 | -- | 83 | 878 |
| Fidelity Series Inflation-Protected Bond Index Fund | 8,907 | 1,030 | 212 | 8 | 1 | 568 | 10,294 |
| Fidelity Series International Credit Fund | 58 | 1 | -- | 1 | -- | 5 | 64 |
| Fidelity Series International Growth Fund | 3,711 | 179 | 1,275 | -- | 90 | 880 | 3,585 |
| Fidelity Series International Index Fund | 1,359 | 103 | 265 | -- | (30) | 313 | 1,480 |
| Fidelity Series International Small Cap Fund | 1,096 | 21 | 168 | -- | (15) | 352 | 1,286 |
| Fidelity Series International Value Fund | 3,542 | 136 | 817 | -- | (159) | 841 | 3,543 |
| Fidelity Series Investment Grade Bond Fund | 9,410 | 1,339 | 399 | 134 | 1 | 588 | 10,939 |
| Fidelity Series Investment Grade Securitized Fund | 6,566 | 1,208 | 400 | 45 | 2 | 79 | 7,455 |
| Fidelity Series Large Cap Growth Index Fund | 3,099 | 356 | 1,017 | 68 | 163 | 1,130 | 3,731 |
| Fidelity Series Large Cap Stock Fund | 3,217 | 600 | 438 | 139 | (17) | 603 | 3,965 |
| Fidelity Series Large Cap Value Index Fund | 5,990 | 952 | 671 | -- | (54) | 1,283 | 7,500 |
| Fidelity Series Long-Term Treasury Bond Index Fund | 2,684 | 530 | 284 | 71 | 38 | (119) | 2,849 |
| Fidelity Series Overseas Fund | 3,473 | 346 | 1,182 | -- | (17) | 960 | 3,580 |
| Fidelity Series Real Estate Income Fund | 425 | 16 | -- | 16 | -- | 79 | 520 |
| Fidelity Series Short-Term Credit Fund | 2,803 | 32 | -- | 32 | -- | 105 | 2,940 |
| Fidelity Series Small Cap Opportunities Fund | 1,589 | 229 | 330 | 11 | (45) | 444 | 1,887 |
| Fidelity Series Treasury Bill Index Fund | 10,499 | 40 | -- | 41 | -- | (31) | 10,508 |
| Fidelity Series Value Discovery Fund | 1,867 | 623 | 228 | -- | (13) | 474 | 2,723 |
| | $107,611 | $17,384 | $15,442 | $1,945 | $40 | $14,400 | $123,993 |
Amounts in the income column in the above table include any capital gain distributions from underlying funds, which are presented in the corresponding line-item in the Statement of Operations, if applicable.
Investment Valuation
The following is a summary of the inputs used, as of September 30, 2020, involving the Fund's assets and liabilities carried at fair value. The inputs or methodology used for valuing securities may not be an indication of the risk associated with investing in those securities. For more information on valuation inputs, and their aggregation into the levels used below, please refer to the Investment Valuation section in the accompanying Notes to Financial Statements.
| | Valuation Inputs at Reporting Date: |
| Description | Total | Level 1 | Level 2 | Level 3 |
| Investments in Securities: | | | | |
| Domestic Equity Funds | $28,638 | $28,638 | $-- | $-- |
| International Equity Funds | 27,130 | 27,130 | -- | -- |
| Bond Funds | 52,002 | 52,002 | -- | -- |
| Short-Term Funds | 16,223 | 16,223 | -- | -- |
| Total Investments in Securities: | $123,993 | $123,993 | $-- | $-- |
See accompanying notes which are an integral part of the financial statements.
Fidelity Flex® Freedom Blend 2015 Fund
Financial Statements
Statement of Assets and Liabilities
| | | September 30, 2020 (Unaudited) |
| Assets | | |
Investment in securities, at value — See accompanying schedule:
| | |
| Affiliated issuers (cost $118,145) | $123,993 | |
| Total Investment in Securities (cost $118,145) | | $123,993 |
| Receivable for investments sold | | 795 |
| Total assets | | 124,788 |
| Liabilities | | |
| Payable for investments purchased | $793 | |
| Total liabilities | | 793 |
| Net Assets | | $123,995 |
| Net Assets consist of: | | |
| Paid in capital | | $116,498 |
| Total accumulated earnings (loss) | | 7,497 |
| Net Assets | | $123,995 |
| Net Asset Value, offering price and redemption price per share ($123,995 ÷ 11,649 shares) | | $10.64 |
See accompanying notes which are an integral part of the financial statements.
Statement of Operations
| | | Six months ended September 30, 2020 (Unaudited) |
| Investment Income | | |
| Dividends: | | |
| Affiliated issuers | | $618 |
| Expenses | | |
| Independent trustees' fees and expenses | $1 | |
| Total expenses | | 1 |
| Net investment income (loss) | | 617 |
| Realized and Unrealized Gain (Loss) | | |
| Net realized gain (loss) on: | | |
| Investment securities: | | |
| Affiliated issuers | 40 | |
| Capital gain distributions from underlying funds: | | |
| Affiliated issuers | 1,327 | |
| Total net realized gain (loss) | | 1,367 |
| Change in net unrealized appreciation (depreciation) on: | | |
| Investment securities: | | |
| Affiliated issuers | 14,400 | |
| Total change in net unrealized appreciation (depreciation) | | 14,400 |
| Net gain (loss) | | 15,767 |
| Net increase (decrease) in net assets resulting from operations | | $16,384 |
See accompanying notes which are an integral part of the financial statements.
Statement of Changes in Net Assets
| | Six months ended September 30, 2020 (Unaudited) | Year ended March 31, 2020 |
| Increase (Decrease) in Net Assets | | |
| Operations | | |
| Net investment income (loss) | $617 | $2,667 |
| Net realized gain (loss) | 1,367 | 2,625 |
| Change in net unrealized appreciation (depreciation) | 14,400 | (7,301) |
| Net increase (decrease) in net assets resulting from operations | 16,384 | (2,009) |
| Distributions to shareholders | (1,415) | (6,490) |
| Share transactions | | |
| Reinvestment of distributions | 1,415 | 6,490 |
| Net increase (decrease) in net assets resulting from share transactions | 1,415 | 6,490 |
| Total increase (decrease) in net assets | 16,384 | (2,009) |
| Net Assets | | |
| Beginning of period | 107,611 | 109,620 |
| End of period | $123,995 | $107,611 |
| Other Information | | |
| Shares | | |
| Sold | – | – |
| Issued in reinvestment of distributions | 145 | 636 |
| Net increase (decrease) | 145 | 636 |
See accompanying notes which are an integral part of the financial statements.
Financial Highlights
Fidelity Flex Freedom Blend 2015 Fund
| | Six months ended (Unaudited) September 30, | Years endedMarch 31, | | |
| | 2020 | 2020 | 2019 | 2018 A |
| Selected Per–Share Data | | | | |
| Net asset value, beginning of period | $9.35 | $10.09 | $10.35 | $10.00 |
| Income from Investment Operations | | | | |
| Net investment income (loss)B | .05 | .24 | .24 | .19 |
| Net realized and unrealized gain (loss) | 1.36 | (.39) | .08 | .42 |
| Total from investment operations | 1.41 | (.15) | .32 | .61 |
| Distributions from net investment income | (.03) | (.25) | (.24) | (.15) |
| Distributions from net realized gain | (.09) | (.34) | (.33) | (.11) |
| Total distributions | (.12) | (.59) | (.58)C | (.26) |
| Net asset value, end of period | $10.64 | $9.35 | $10.09 | $10.35 |
| Total ReturnD | 15.23% | (1.91)% | 3.37% | 6.09% |
| Ratios to Average Net AssetsE,F | | | | |
| Expenses before reductions | - %G,H | - %H | - %H | - %G |
| Expenses net of fee waivers, if any | - %G,H | - %H | - %H | - %G |
| Expenses net of all reductions | - %G,H | - %H | - %H | - %G |
| Net investment income (loss) | 1.04%G | 2.34% | 2.43% | 2.21%G |
| Supplemental Data | | | | |
| Net assets, end of period (000 omitted) | $124 | $108 | $110 | $106 |
| Portfolio turnover rateF | 26%G | 66% | 23% | 14%G |
A For the period June 8, 2017 (commencement of operations) to March 31, 2018.
B Calculated based on average shares outstanding during the period.
C Total distributions per share do not sum due to rounding.
D Total returns for periods of less than one year are not annualized.
E Expense ratios reflect operating expenses of the class. Expenses before reductions do not reflect amounts reimbursed, waived, or reduced through arrangements with the investment advisor, brokerage services, or other offset arrangements, if applicable, and do not represent the amount paid by the class during periods when reimbursements, waivers or reductions occur.
F Amount does not include the portfolio activity of any underlying mutual funds or exchange-traded funds (ETFs).
G Annualized
H Amount represents less than .005%.
See accompanying notes which are an integral part of the financial statements.
Fidelity Flex® Freedom Blend 2020 Fund
Investment Summary (Unaudited)
The information in the following tables is based on the direct investments of the Fund.
Top Holdings as of September 30, 2020
| | % of fund's net assets |
| Fidelity Series Emerging Markets Opportunities Fund | 9.8 |
| Fidelity Series Investment Grade Bond Fund | 7.7 |
| Fidelity Series Large Cap Value Index Fund | 7.5 |
| Fidelity Series Inflation-Protected Bond Index Fund | 7.1 |
| Fidelity Series Government Bond Index Fund | 7.0 |
| Fidelity Series Treasury Bill Index Fund | 6.4 |
| Fidelity Series Corporate Bond Fund | 5.8 |
| Fidelity Series Blue Chip Growth Fund | 5.8 |
| Fidelity Series Investment Grade Securitized Fund | 5.3 |
| Fidelity Series Large Cap Stock Fund | 4.0 |
| | 66.4 |
Asset Allocation (% of fund's net assets)
| Period end |
| | Domestic Equity Funds | 28.3% |
| | International Equity Funds | 25.3% |
| | Bond Funds | 37.1% |
| | Short-Term Funds | 9.3% |

Domestic Equity Funds category includes Fidelity Series Commodity Strategy Fund which invests in commodity-related investments.
Fidelity Flex® Freedom Blend 2020 Fund
Schedule of Investments September 30, 2020 (Unaudited)
Showing Percentage of Net Assets
| Domestic Equity Funds - 28.3% | | | |
| | | Shares | Value |
| Fidelity Series Blue Chip Growth Fund (a) | | 441 | $7,278 |
| Fidelity Series Commodity Strategy Fund (a) | | 761 | 3,167 |
| Fidelity Series Large Cap Growth Index Fund (a) | | 331 | 4,710 |
| Fidelity Series Large Cap Stock Fund (a) | | 354 | 5,020 |
| Fidelity Series Large Cap Value Index Fund (a) | | 814 | 9,445 |
| Fidelity Series Small Cap Opportunities Fund (a) | | 187 | 2,389 |
| Fidelity Series Value Discovery Fund (a) | | 279 | 3,447 |
| TOTAL DOMESTIC EQUITY FUNDS | | | |
| (Cost $34,761) | | | 35,456 |
|
| International Equity Funds - 25.3% | | | |
| Fidelity Series Canada Fund (a) | | 164 | 1,677 |
| Fidelity Series Emerging Markets Fund (a) | | 145 | 1,371 |
| Fidelity Series Emerging Markets Opportunities Fund (a) | | 587 | 12,313 |
| Fidelity Series International Growth Fund (a) | | 232 | 4,359 |
| Fidelity Series International Index Fund (a) | | 181 | 1,799 |
| Fidelity Series International Small Cap Fund (a) | | 87 | 1,547 |
| Fidelity Series International Value Fund (a) | | 502 | 4,324 |
| Fidelity Series Overseas Fund (a) | | 389 | 4,353 |
| TOTAL INTERNATIONAL EQUITY FUNDS | | | |
| (Cost $29,306) | | | 31,743 |
|
| Bond Funds - 37.1% | | | |
| Fidelity Series Corporate Bond Fund (a) | | 648 | 7,294 |
| Fidelity Series Emerging Markets Debt Fund (a) | | 85 | 772 |
| Fidelity Series Floating Rate High Income Fund (a) | | 19 | 171 |
| Fidelity Series Government Bond Index Fund (a) | | 775 | 8,717 |
| Fidelity Series High Income Fund (a) | | 97 | 882 |
| Fidelity Series Inflation-Protected Bond Index Fund (a) | | 827 | 8,845 |
| Fidelity Series International Credit Fund (a) | | 7 | 78 |
| Fidelity Series Investment Grade Bond Fund (a) | | 793 | 9,702 |
| Fidelity Series Investment Grade Securitized Fund (a) | | 620 | 6,612 |
| Fidelity Series Long-Term Treasury Bond Index Fund (a) | | 279 | 2,882 |
| Fidelity Series Real Estate Income Fund (a) | | 52 | 521 |
| TOTAL BOND FUNDS | | | |
| (Cost $43,888) | | | 46,476 |
|
| Short-Term Funds - 9.3% | | | |
| Fidelity Series Government Money Market Fund 0.16% (a)(b) | | 1,584 | 1,584 |
| Fidelity Series Short-Term Credit Fund (a) | | 203 | 2,083 |
| Fidelity Series Treasury Bill Index Fund (a) | | 801 | 8,020 |
| TOTAL SHORT-TERM FUNDS | | | |
| (Cost $11,628) | | | 11,687 |
| TOTAL INVESTMENT IN SECURITIES - 100.0% | | | |
| (Cost $119,583) | | | 125,362 |
| NET OTHER ASSETS (LIABILITIES) - 0.0% | | | (1) |
| NET ASSETS - 100% | | | $125,361 |
Legend
(a) Affiliated Fund
(b) The rate quoted is the annualized seven-day yield of the fund at period end.
Affiliated Underlying Funds
Fiscal year to date information regarding the Fund's investments in affiliated Underlying Funds, excluding any Money Market Central Funds, is presented below. Exchanges between classes of the same affiliated Underlying Funds may occur.
| Affiliate | Value, beginning of period | Purchases | Sales Proceeds | Dividend Income | Realized Gain (loss) | Change in Unrealized appreciation (depreciation) | Value, end of period |
| Fidelity Series Blue Chip Growth Fund | $5,247 | $2,119 | $1,822 | $1,431 | $422 | $1,312 | $7,278 |
| Fidelity Series Canada Fund | 1,442 | 132 | 226 | -- | (29) | 358 | 1,677 |
| Fidelity Series Commodity Strategy Fund | 3,618 | 158 | 1,004 | 13 | (227) | 622 | 3,167 |
| Fidelity Series Corporate Bond Fund | 5,456 | 1,538 | 306 | 102 | (7) | 613 | 7,294 |
| Fidelity Series Emerging Markets Debt Fund | 668 | 21 | -- | 20 | -- | 83 | 772 |
| Fidelity Series Emerging Markets Fund | 816 | 287 | 55 | -- | (3) | 326 | 1,371 |
| Fidelity Series Emerging Markets Opportunities Fund | 7,822 | 2,390 | 931 | -- | 15 | 3,017 | 12,313 |
| Fidelity Series Floating Rate High Income Fund | 151 | 5 | -- | 4 | -- | 15 | 171 |
| Fidelity Series Government Bond Index Fund | 8,442 | 1,177 | 872 | 63 | 22 | (52) | 8,717 |
| Fidelity Series Government Money Market Fund 0.16% | 2,285 | 1,894 | 2,595 | 2 | -- | -- | 1,584 |
| Fidelity Series High Income Fund | 775 | 24 | -- | 23 | -- | 83 | 882 |
| Fidelity Series Inflation-Protected Bond Index Fund | 7,541 | 1,057 | 238 | 7 | 2 | 483 | 8,845 |
| Fidelity Series International Credit Fund | 70 | 2 | -- | 1 | -- | 6 | 78 |
| Fidelity Series International Growth Fund | 4,328 | 255 | 1,370 | -- | 87 | 1,059 | 4,359 |
| Fidelity Series International Index Fund | 1,602 | 145 | 284 | -- | (25) | 361 | 1,799 |
| Fidelity Series International Small Cap Fund | 1,271 | 18 | 145 | -- | (11) | 414 | 1,547 |
| Fidelity Series International Value Fund | 4,131 | 284 | 905 | -- | (131) | 945 | 4,324 |
| Fidelity Series Investment Grade Bond Fund | 8,185 | 1,475 | 474 | 118 | 2 | 514 | 9,702 |
| Fidelity Series Investment Grade Securitized Fund | 5,743 | 1,171 | 373 | 39 | 2 | 69 | 6,612 |
| Fidelity Series Large Cap Growth Index Fund | 3,908 | 361 | 1,173 | 86 | 189 | 1,425 | 4,710 |
| Fidelity Series Large Cap Stock Fund | 4,057 | 615 | 391 | 174 | (14) | 753 | 5,020 |
| Fidelity Series Large Cap Value Index Fund | 7,546 | 1,002 | 655 | -- | (62) | 1,614 | 9,445 |
| Fidelity Series Long-Term Treasury Bond Index Fund | 2,673 | 579 | 288 | 70 | 39 | (121) | 2,882 |
| Fidelity Series Overseas Fund | 4,061 | 403 | 1,229 | -- | (78) | 1,196 | 4,353 |
| Fidelity Series Real Estate Income Fund | 425 | 17 | -- | 16 | -- | 79 | 521 |
| Fidelity Series Short-Term Credit Fund | 1,986 | 23 | -- | 23 | -- | 74 | 2,083 |
| Fidelity Series Small Cap Opportunities Fund | 2,010 | 234 | 348 | 14 | (56) | 549 | 2,389 |
| Fidelity Series Treasury Bill Index Fund | 8,013 | 31 | -- | 32 | -- | (24) | 8,020 |
| Fidelity Series Value Discovery Fund | 2,359 | 714 | 209 | -- | (14) | 597 | 3,447 |
| | $106,631 | $18,131 | $15,893 | $2,238 | $123 | $16,370 | $125,362 |
Amounts in the income column in the above table include any capital gain distributions from underlying funds, which are presented in the corresponding line-item in the Statement of Operations, if applicable.
Investment Valuation
The following is a summary of the inputs used, as of September 30, 2020, involving the Fund's assets and liabilities carried at fair value. The inputs or methodology used for valuing securities may not be an indication of the risk associated with investing in those securities. For more information on valuation inputs, and their aggregation into the levels used below, please refer to the Investment Valuation section in the accompanying Notes to Financial Statements.
| | Valuation Inputs at Reporting Date: |
| Description | Total | Level 1 | Level 2 | Level 3 |
| Investments in Securities: | | | | |
| Domestic Equity Funds | $35,456 | $35,456 | $-- | $-- |
| International Equity Funds | 31,743 | 31,743 | -- | -- |
| Bond Funds | 46,476 | 46,476 | -- | -- |
| Short-Term Funds | 11,687 | 11,687 | -- | -- |
| Total Investments in Securities: | $125,362 | $125,362 | $-- | $-- |
See accompanying notes which are an integral part of the financial statements.
Fidelity Flex® Freedom Blend 2020 Fund
Financial Statements
Statement of Assets and Liabilities
| | | September 30, 2020 (Unaudited) |
| Assets | | |
Investment in securities, at value — See accompanying schedule:
| | |
| Affiliated issuers (cost $119,583) | $125,362 | |
| Total Investment in Securities (cost $119,583) | | $125,362 |
| Receivable for investments sold | | 934 |
| Total assets | | 126,296 |
| Liabilities | | |
| Payable for investments purchased | $935 | |
| Total liabilities | | 935 |
| Net Assets | | $125,361 |
| Net Assets consist of: | | |
| Paid in capital | | $117,584 |
| Total accumulated earnings (loss) | | 7,777 |
| Net Assets | | $125,361 |
| Net Asset Value, offering price and redemption price per share ($125,361 ÷ 11,759 shares) | | $10.66 |
See accompanying notes which are an integral part of the financial statements.
Statement of Operations
| | | Six months ended September 30, 2020 (Unaudited) |
| Investment Income | | |
| Dividends: | | |
| Affiliated issuers | | $586 |
| Expenses | | |
| Independent trustees' fees and expenses | $1 | |
| Total expenses | | 1 |
| Net investment income (loss) | | 585 |
| Realized and Unrealized Gain (Loss) | | |
| Net realized gain (loss) on: | | |
| Investment securities: | | |
| Affiliated issuers | 123 | |
| Capital gain distributions from underlying funds: | | |
| Affiliated issuers | 1,652 | |
| Total net realized gain (loss) | | 1,775 |
| Change in net unrealized appreciation (depreciation) on: | | |
| Investment securities: | | |
| Affiliated issuers | 16,370 | |
| Total change in net unrealized appreciation (depreciation) | | 16,370 |
| Net gain (loss) | | 18,145 |
| Net increase (decrease) in net assets resulting from operations | | $18,730 |
See accompanying notes which are an integral part of the financial statements.
Statement of Changes in Net Assets
| | Six months ended September 30, 2020 (Unaudited) | Year ended March 31, 2020 |
| Increase (Decrease) in Net Assets | | |
| Operations | | |
| Net investment income (loss) | $585 | $2,697 |
| Net realized gain (loss) | 1,775 | 2,900 |
| Change in net unrealized appreciation (depreciation) | 16,370 | (9,174) |
| Net increase (decrease) in net assets resulting from operations | 18,730 | (3,577) |
| Distributions to shareholders | (1,588) | (6,956) |
| Share transactions | | |
| Reinvestment of distributions | 1,588 | 6,956 |
| Net increase (decrease) in net assets resulting from share transactions | 1,588 | 6,956 |
| Total increase (decrease) in net assets | 18,730 | (3,577) |
| Net Assets | | |
| Beginning of period | 106,631 | 110,208 |
| End of period | $125,361 | $106,631 |
| Other Information | | |
| Shares | | |
| Sold | – | – |
| Issued in reinvestment of distributions | 165 | 681 |
| Net increase (decrease) | 165 | 681 |
See accompanying notes which are an integral part of the financial statements.
Financial Highlights
Fidelity Flex Freedom Blend 2020 Fund
| | Six months ended (Unaudited) September 30, | Years endedMarch 31, | | |
| | 2020 | 2020 | 2019 | 2018 A |
| Selected Per–Share Data | | | | |
| Net asset value, beginning of period | $9.20 | $10.10 | $10.40 | $10.00 |
| Income from Investment Operations | | | | |
| Net investment income (loss)B | .05 | .24 | .24 | .19 |
| Net realized and unrealized gain (loss) | 1.55 | (.51) | .07 | .48 |
| Total from investment operations | 1.60 | (.27) | .31 | .67 |
| Distributions from net investment income | (.03) | (.25) | (.24) | (.16) |
| Distributions from net realized gain | (.11) | (.38) | (.36) | (.12) |
| Total distributions | (.14) | (.63) | (.61)C | (.27)C |
| Net asset value, end of period | $10.66 | $9.20 | $10.10 | $10.40 |
| Total ReturnD | 17.52% | (3.23)% | 3.28% | 6.72% |
| Ratios to Average Net AssetsE,F | | | | |
| Expenses before reductions | - %G,H | - %H | - %H | - %G |
| Expenses net of fee waivers, if any | - %G,H | - %H | - %H | - %G |
| Expenses net of all reductions | - %G,H | - %H | - %H | - %G |
| Net investment income (loss) | .98%G | 2.35% | 2.41% | 2.22%G |
| Supplemental Data | | | | |
| Net assets, end of period (000 omitted) | $125 | $107 | $110 | $107 |
| Portfolio turnover rateF | 27%G | 67% | 22% | 14%G |
A For the period June 8, 2017 (commencement of operations) to March 31, 2018.
B Calculated based on average shares outstanding during the period.
C Total distributions per share do not sum due to rounding.
D Total returns for periods of less than one year are not annualized.
E Expense ratios reflect operating expenses of the class. Expenses before reductions do not reflect amounts reimbursed, waived, or reduced through arrangements with the investment advisor, brokerage services, or other offset arrangements, if applicable, and do not represent the amount paid by the class during periods when reimbursements, waivers or reductions occur.
F Amount does not include the portfolio activity of any underlying mutual funds or exchange-traded funds (ETFs).
G Annualized
H Amount represents less than .005%.
See accompanying notes which are an integral part of the financial statements.
Fidelity Flex® Freedom Blend 2025 Fund
Investment Summary (Unaudited)
The information in the following tables is based on the direct investments of the Fund.
Top Holdings as of September 30, 2020
| | % of fund's net assets |
| Fidelity Series Emerging Markets Opportunities Fund | 10.5 |
| Fidelity Series Large Cap Value Index Fund | 8.7 |
| Fidelity Series Investment Grade Bond Fund | 7.0 |
| Fidelity Series Blue Chip Growth Fund | 6.6 |
| Fidelity Series Inflation-Protected Bond Index Fund | 6.3 |
| Fidelity Series Government Bond Index Fund | 6.3 |
| Fidelity Series Corporate Bond Fund | 5.2 |
| Fidelity Series Investment Grade Securitized Fund | 4.8 |
| Fidelity Series Large Cap Stock Fund | 4.6 |
| Fidelity Series Treasury Bill Index Fund | 4.6 |
| | 64.6 |
Asset Allocation (% of fund's net assets)
| Period end |
| | Domestic Equity Funds | 32.2% |
| | International Equity Funds | 27.9% |
| | Bond Funds | 33.8% |
| | Short-Term Funds | 6.1% |

Domestic Equity Funds category includes Fidelity Series Commodity Strategy Fund which invests in commodity-related investments.
Fidelity Flex® Freedom Blend 2025 Fund
Schedule of Investments September 30, 2020 (Unaudited)
Showing Percentage of Net Assets
| Domestic Equity Funds - 32.2% | | | |
| | | Shares | Value |
| Fidelity Series Blue Chip Growth Fund (a) | | 508 | $8,385 |
| Fidelity Series Commodity Strategy Fund (a) | | 768 | 3,197 |
| Fidelity Series Large Cap Growth Index Fund (a) | | 386 | 5,497 |
| Fidelity Series Large Cap Stock Fund (a) | | 412 | 5,837 |
| Fidelity Series Large Cap Value Index Fund (a) | | 952 | 11,041 |
| Fidelity Series Small Cap Opportunities Fund (a) | | 218 | 2,778 |
| Fidelity Series Value Discovery Fund (a) | | 324 | 4,008 |
| TOTAL DOMESTIC EQUITY FUNDS | | | |
| (Cost $39,953) | | | 40,743 |
|
| International Equity Funds - 27.9% | | | |
| Fidelity Series Canada Fund (a) | | 187 | 1,908 |
| Fidelity Series Emerging Markets Fund (a) | | 157 | 1,483 |
| Fidelity Series Emerging Markets Opportunities Fund (a) | | 635 | 13,320 |
| Fidelity Series International Growth Fund (a) | | 264 | 4,961 |
| Fidelity Series International Index Fund (a) | | 206 | 2,047 |
| Fidelity Series International Small Cap Fund (a) | | 99 | 1,768 |
| Fidelity Series International Value Fund (a) | | 570 | 4,914 |
| Fidelity Series Overseas Fund (a) | | 443 | 4,954 |
| TOTAL INTERNATIONAL EQUITY FUNDS | | | |
| (Cost $32,755) | | | 35,355 |
|
| Bond Funds - 33.8% | | | |
| Fidelity Series Corporate Bond Fund (a) | | 590 | 6,639 |
| Fidelity Series Emerging Markets Debt Fund (a) | | 85 | 767 |
| Fidelity Series Floating Rate High Income Fund (a) | | 19 | 172 |
| Fidelity Series Government Bond Index Fund (a) | | 705 | 7,934 |
| Fidelity Series High Income Fund (a) | | 97 | 886 |
| Fidelity Series Inflation-Protected Bond Index Fund (a) | | 744 | 7,962 |
| Fidelity Series International Credit Fund (a) | | 8 | 79 |
| Fidelity Series Investment Grade Bond Fund (a) | | 721 | 8,829 |
| Fidelity Series Investment Grade Securitized Fund (a) | | 564 | 6,018 |
| Fidelity Series Long-Term Treasury Bond Index Fund (a) | | 282 | 2,913 |
| Fidelity Series Real Estate Income Fund (a) | | 52 | 523 |
| TOTAL BOND FUNDS | | | |
| (Cost $40,407) | | | 42,722 |
|
| Short-Term Funds - 6.1% | | | |
| Fidelity Series Government Money Market Fund 0.16% (a)(b) | | 704 | 704 |
| Fidelity Series Short-Term Credit Fund (a) | | 126 | 1,291 |
| Fidelity Series Treasury Bill Index Fund (a) | | 578 | 5,783 |
| TOTAL SHORT-TERM FUNDS | | | |
| (Cost $7,742) | | | 7,778 |
| TOTAL INVESTMENT IN SECURITIES - 100.0% | | | |
| (Cost $120,857) | | | 126,598 |
| NET OTHER ASSETS (LIABILITIES) - 0.0% | | | 0 |
| NET ASSETS - 100% | | | $126,598 |
Legend
(a) Affiliated Fund
(b) The rate quoted is the annualized seven-day yield of the fund at period end.
Affiliated Underlying Funds
Fiscal year to date information regarding the Fund's investments in affiliated Underlying Funds, excluding any Money Market Central Funds, is presented below. Exchanges between classes of the same affiliated Underlying Funds may occur.
| Affiliate | Value, beginning of period | Purchases | Sales Proceeds | Dividend Income | Realized Gain (loss) | Change in Unrealized appreciation (depreciation) | Value, end of period |
| Fidelity Series Blue Chip Growth Fund | $6,087 | $2,341 | $2,047 | $1,664 | $476 | $1,528 | $8,385 |
| Fidelity Series Canada Fund | 1,639 | 178 | 281 | -- | (51) | 423 | 1,908 |
| Fidelity Series Commodity Strategy Fund | 3,596 | 156 | 951 | 13 | (200) | 596 | 3,197 |
| Fidelity Series Corporate Bond Fund | 4,894 | 1,530 | 328 | 92 | (8) | 551 | 6,639 |
| Fidelity Series Emerging Markets Debt Fund | 664 | 20 | -- | 20 | -- | 83 | 767 |
| Fidelity Series Emerging Markets Fund | 879 | 314 | 56 | -- | (2) | 348 | 1,483 |
| Fidelity Series Emerging Markets Opportunities Fund | 8,438 | 2,454 | 841 | -- | 16 | 3,253 | 13,320 |
| Fidelity Series Floating Rate High Income Fund | 153 | 4 | -- | 4 | -- | 15 | 172 |
| Fidelity Series Government Bond Index Fund | 7,568 | 1,305 | 911 | 57 | 17 | (45) | 7,934 |
| Fidelity Series Government Money Market Fund 0.16% | 1,764 | 1,519 | 2,579 | 1 | -- | -- | 704 |
| Fidelity Series High Income Fund | 779 | 23 | -- | 23 | -- | 84 | 886 |
| Fidelity Series Inflation-Protected Bond Index Fund | 6,733 | 1,075 | 280 | 6 | 2 | 432 | 7,962 |
| Fidelity Series International Credit Fund | 71 | 2 | -- | 1 | -- | 6 | 79 |
| Fidelity Series International Growth Fund | 4,785 | 245 | 1,352 | -- | 90 | 1,193 | 4,961 |
| Fidelity Series International Index Fund | 1,797 | 112 | 239 | -- | (24) | 401 | 2,047 |
| Fidelity Series International Small Cap Fund | 1,413 | 28 | 127 | -- | (10) | 464 | 1,768 |
| Fidelity Series International Value Fund | 4,587 | 282 | 865 | -- | (105) | 1,015 | 4,914 |
| Fidelity Series Investment Grade Bond Fund | 7,300 | 1,457 | 393 | 106 | 2 | 463 | 8,829 |
| Fidelity Series Investment Grade Securitized Fund | 5,153 | 1,188 | 387 | 35 | 2 | 62 | 6,018 |
| Fidelity Series Large Cap Growth Index Fund | 4,544 | 408 | 1,326 | 100 | 200 | 1,671 | 5,497 |
| Fidelity Series Large Cap Stock Fund | 4,708 | 734 | 461 | 202 | (8) | 864 | 5,837 |
| Fidelity Series Large Cap Value Index Fund | 8,756 | 1,134 | 654 | -- | (66) | 1,871 | 11,041 |
| Fidelity Series Long-Term Treasury Bond Index Fund | 2,680 | 625 | 311 | 70 | 44 | (125) | 2,913 |
| Fidelity Series Overseas Fund | 4,490 | 441 | 1,238 | -- | (68) | 1,329 | 4,954 |
| Fidelity Series Real Estate Income Fund | 427 | 17 | -- | 17 | -- | 79 | 523 |
| Fidelity Series Short-Term Credit Fund | 1,231 | 14 | -- | 14 | -- | 46 | 1,291 |
| Fidelity Series Small Cap Opportunities Fund | 2,333 | 246 | 375 | 17 | (61) | 635 | 2,778 |
| Fidelity Series Treasury Bill Index Fund | 5,777 | 23 | -- | 23 | -- | (17) | 5,783 |
| Fidelity Series Value Discovery Fund | 2,738 | 790 | 198 | -- | (9) | 687 | 4,008 |
| | $105,984 | $18,665 | $16,200 | $2,465 | $237 | $17,912 | 126,598 |
Amounts in the income column in the above table include any capital gain distributions from underlying funds, which are presented in the corresponding line-item in the Statement of Operations, if applicable.
Investment Valuation
The following is a summary of the inputs used, as of September 30, 2020, involving the Fund's assets and liabilities carried at fair value. The inputs or methodology used for valuing securities may not be an indication of the risk associated with investing in those securities. For more information on valuation inputs, and their aggregation into the levels used below, please refer to the Investment Valuation section in the accompanying Notes to Financial Statements.
| | Valuation Inputs at Reporting Date: |
| Description | Total | Level 1 | Level 2 | Level 3 |
| Investments in Securities: | | | | |
| Domestic Equity Funds | $40,743 | $40,743 | $-- | $-- |
| International Equity Funds | 35,355 | 35,355 | -- | -- |
| Bond Funds | 42,722 | 42,722 | -- | -- |
| Short-Term Funds | 7,778 | 7,778 | -- | -- |
| Total Investments in Securities: | $126,598 | $126,598 | $-- | $-- |
See accompanying notes which are an integral part of the financial statements.
Fidelity Flex® Freedom Blend 2025 Fund
Financial Statements
Statement of Assets and Liabilities
| | | September 30, 2020 (Unaudited) |
| Assets | | |
Investment in securities, at value — See accompanying schedule:
| | |
| Affiliated issuers (cost $120,857) | $126,598 | |
| Total Investment in Securities (cost $120,857) | | $126,598 |
| Receivable for investments sold | | 881 |
| Total assets | | 127,479 |
| Liabilities | | |
| Payable for investments purchased | $881 | |
| Total liabilities | | 881 |
| Net Assets | | $126,598 |
| Net Assets consist of: | | |
| Paid in capital | | $118,533 |
| Total accumulated earnings (loss) | | 8,065 |
| Net Assets | | $126,598 |
| Net Asset Value, offering price and redemption price per share ($126,598 ÷ 11,853 shares) | | $10.68 |
See accompanying notes which are an integral part of the financial statements.
Statement of Operations
| | | Six months ended September 30, 2020 (Unaudited) |
| Investment Income | | |
| Dividends: | | |
| Affiliated issuers | | $563 |
| Expenses | | |
| Independent trustees' fees and expenses | $1 | |
| Total expenses | | 1 |
| Net investment income (loss) | | 562 |
| Realized and Unrealized Gain (Loss) | | |
| Net realized gain (loss) on: | | |
| Investment securities: | | |
| Affiliated issuers | 237 | |
| Capital gain distributions from underlying funds: | | |
| Affiliated issuers | 1,902 | |
| Total net realized gain (loss) | | 2,139 |
| Change in net unrealized appreciation (depreciation) on: | | |
| Investment securities: | | |
| Affiliated issuers | 17,912 | |
| Total change in net unrealized appreciation (depreciation) | | 17,912 |
| Net gain (loss) | | 20,051 |
| Net increase (decrease) in net assets resulting from operations | | $20,613 |
See accompanying notes which are an integral part of the financial statements.
Statement of Changes in Net Assets
| | Six months ended September 30, 2020 (Unaudited) | Year ended March 31, 2020 |
| Increase (Decrease) in Net Assets | | |
| Operations | | |
| Net investment income (loss) | $562 | $2,718 |
| Net realized gain (loss) | 2,139 | 3,073 |
| Change in net unrealized appreciation (depreciation) | 17,912 | (10,567) |
| Net increase (decrease) in net assets resulting from operations | 20,613 | (4,776) |
| Distributions to shareholders | (1,647) | (7,426) |
| Share transactions | | |
| Reinvestment of distributions | 1,647 | 7,426 |
| Net increase (decrease) in net assets resulting from share transactions | 1,647 | 7,426 |
| Total increase (decrease) in net assets | 20,613 | (4,776) |
| Net Assets | | |
| Beginning of period | 105,985 | 110,761 |
| End of period | $126,598 | $105,985 |
| Other Information | | |
| Shares | | |
| Sold | – | – |
| Issued in reinvestment of distributions | 172 | 726 |
| Net increase (decrease) | 172 | 726 |
See accompanying notes which are an integral part of the financial statements.
Financial Highlights
Fidelity Flex Freedom Blend 2025 Fund
| | Six months ended (Unaudited) September 30, | Years endedMarch 31, | | |
| | 2020 | 2020 | 2019 | 2018 A |
| Selected Per–Share Data | | | | |
| Net asset value, beginning of period | $9.07 | $10.11 | $10.44 | $10.00 |
| Income from Investment Operations | | | | |
| Net investment income (loss)B | .05 | .24 | .24 | .19 |
| Net realized and unrealized gain (loss) | 1.70 | (.61) | .06 | .54 |
| Total from investment operations | 1.75 | (.37) | .30 | .73 |
| Distributions from net investment income | (.02) | (.24) | (.24) | (.16) |
| Distributions from net realized gain | (.12) | (.42) | (.39) | (.13) |
| Total distributions | (.14) | (.67)C | (.63) | (.29) |
| Net asset value, end of period | $10.68 | $9.07 | $10.11 | $10.44 |
| Total ReturnD | 19.49% | (4.34)% | 3.28% | 7.24% |
| Ratios to Average Net AssetsE,F | | | | |
| Expenses before reductions | - %G,H | - %H | - %H | - %G |
| Expenses net of fee waivers, if any | - %G,H | - %H | - %H | - %G |
| Expenses net of all reductions | - %G,H | - %H | - %H | - %G |
| Net investment income (loss) | .94%G | 2.35% | 2.37% | 2.20%G |
| Supplemental Data | | | | |
| Net assets, end of period (000 omitted) | $127 | $106 | $111 | $107 |
| Portfolio turnover rateF | 27%G | 68% | 22% | 14%G |
A For the period June 8, 2017 (commencement of operations) to March 31, 2018.
B Calculated based on average shares outstanding during the period.
C Total distributions per share do not sum due to rounding.
D Total returns for periods of less than one year are not annualized.
E Expense ratios reflect operating expenses of the class. Expenses before reductions do not reflect amounts reimbursed, waived, or reduced through arrangements with the investment advisor, brokerage services, or other offset arrangements, if applicable, and do not represent the amount paid by the class during periods when reimbursements, waivers or reductions occur.
F Amount does not include the portfolio activity of any underlying mutual funds or exchange-traded funds (ETFs).
G Annualized
H Amount represents less than .005%.
See accompanying notes which are an integral part of the financial statements.
Fidelity Flex® Freedom Blend 2030 Fund
Investment Summary (Unaudited)
The information in the following tables is based on the direct investments of the Fund.
Top Holdings as of September 30, 2020
| | % of fund's net assets |
| Fidelity Series Emerging Markets Opportunities Fund | 11.4 |
| Fidelity Series Large Cap Value Index Fund | 10.2 |
| Fidelity Series Blue Chip Growth Fund | 7.7 |
| Fidelity Series Investment Grade Bond Fund | 6.0 |
| Fidelity Series Inflation-Protected Bond Index Fund | 5.5 |
| Fidelity Series Large Cap Stock Fund | 5.4 |
| Fidelity Series Government Bond Index Fund | 5.4 |
| Fidelity Series Large Cap Growth Index Fund | 5.1 |
| Fidelity Series Corporate Bond Fund | 4.5 |
| Fidelity Series International Growth Fund | 4.5 |
| | 65.7 |
Asset Allocation (% of fund's net assets)
| Period end |
| | Domestic Equity Funds | 37.2% |
| | International Equity Funds | 31.3% |
| | Bond Funds | 29.7% |
| | Short-Term Funds | 1.8% |

Domestic Equity Funds category includes Fidelity Series Commodity Strategy Fund which invests in commodity-related investments.
Fidelity Flex® Freedom Blend 2030 Fund
Schedule of Investments September 30, 2020 (Unaudited)
Showing Percentage of Net Assets
| Domestic Equity Funds - 37.2% | | | |
| | | Shares | Value |
| Fidelity Series Blue Chip Growth Fund (a) | | 602 | $9,944 |
| Fidelity Series Commodity Strategy Fund (a) | | 781 | 3,248 |
| Fidelity Series Large Cap Growth Index Fund (a) | | 460 | 6,554 |
| Fidelity Series Large Cap Stock Fund (a) | | 490 | 6,937 |
| Fidelity Series Large Cap Value Index Fund (a) | | 1,131 | 13,121 |
| Fidelity Series Small Cap Opportunities Fund (a) | | 259 | 3,302 |
| Fidelity Series Value Discovery Fund (a) | | 385 | 4,763 |
| TOTAL DOMESTIC EQUITY FUNDS | | | |
| (Cost $46,982) | | | 47,869 |
|
| International Equity Funds - 31.3% | | | |
| Fidelity Series Canada Fund (a) | | 217 | 2,219 |
| Fidelity Series Emerging Markets Fund (a) | | 173 | 1,635 |
| Fidelity Series Emerging Markets Opportunities Fund (a) | | 700 | 14,677 |
| Fidelity Series International Growth Fund (a) | | 307 | 5,767 |
| Fidelity Series International Index Fund (a) | | 239 | 2,380 |
| Fidelity Series International Small Cap Fund (a) | | 116 | 2,059 |
| Fidelity Series International Value Fund (a) | | 663 | 5,718 |
| Fidelity Series Overseas Fund (a) | | 515 | 5,759 |
| TOTAL INTERNATIONAL EQUITY FUNDS | | | |
| (Cost $37,496) | | | 40,214 |
|
| Bond Funds - 29.7% | | | |
| Fidelity Series Corporate Bond Fund (a) | | 514 | 5,788 |
| Fidelity Series Emerging Markets Debt Fund (a) | | 86 | 776 |
| Fidelity Series Floating Rate High Income Fund (a) | | 20 | 176 |
| Fidelity Series Government Bond Index Fund (a) | | 615 | 6,916 |
| Fidelity Series High Income Fund (a) | | 98 | 895 |
| Fidelity Series Inflation-Protected Bond Index Fund (a) | | 668 | 7,143 |
| Fidelity Series International Credit Fund (a) | | 6 | 67 |
| Fidelity Series Investment Grade Bond Fund (a) | | 629 | 7,696 |
| Fidelity Series Investment Grade Securitized Fund (a) | | 492 | 5,247 |
| Fidelity Series Long-Term Treasury Bond Index Fund (a) | | 288 | 2,974 |
| Fidelity Series Real Estate Income Fund (a) | | 53 | 529 |
| TOTAL BOND FUNDS | | | |
| (Cost $36,231) | | | 38,207 |
|
| Short-Term Funds - 1.8% | | | |
| Fidelity Series Government Money Market Fund 0.16% (a)(b) | | 611 | 611 |
| Fidelity Series Short-Term Credit Fund (a) | | 21 | 211 |
| Fidelity Series Treasury Bill Index Fund (a) | | 156 | 1,561 |
| TOTAL SHORT-TERM FUNDS | | | |
| (Cost $2,376) | | | 2,383 |
| TOTAL INVESTMENT IN SECURITIES - 100.0% | | | |
| (Cost $123,085) | | | 128,673 |
| NET OTHER ASSETS (LIABILITIES) - 0.0% | | | 0 |
| NET ASSETS - 100% | | | $128,673 |
Legend
(a) Affiliated Fund
(b) The rate quoted is the annualized seven-day yield of the fund at period end.
Affiliated Underlying Funds
Fiscal year to date information regarding the Fund's investments in affiliated Underlying Funds, excluding any Money Market Central Funds, is presented below. Exchanges between classes of the same affiliated Underlying Funds may occur.
| Affiliate | Value, beginning of period | Purchases | Sales Proceeds | Dividend Income | Realized Gain (loss) | Change in Unrealized appreciation (depreciation) | Value, end of period |
| Fidelity Series Blue Chip Growth Fund | $7,273 | $2,769 | $2,492 | $1,984 | $553 | $1,841 | $9,944 |
| Fidelity Series Canada Fund | 1,868 | 234 | 315 | -- | (49) | 481 | 2,219 |
| Fidelity Series Commodity Strategy Fund | 3,578 | 162 | 891 | 14 | (217) | 616 | 3,248 |
| Fidelity Series Corporate Bond Fund | 4,132 | 1,530 | 332 | 79 | (7) | 465 | 5,788 |
| Fidelity Series Emerging Markets Debt Fund | 672 | 20 | -- | 20 | -- | 84 | 776 |
| Fidelity Series Emerging Markets Fund | 993 | 312 | 54 | -- | (3) | 387 | 1,635 |
| Fidelity Series Emerging Markets Opportunities Fund | 9,262 | 2,554 | 742 | -- | 22 | 3,581 | 14,677 |
| Fidelity Series Floating Rate High Income Fund | 156 | 4 | -- | 4 | -- | 16 | 176 |
| Fidelity Series Government Bond Index Fund | 6,382 | 1,352 | 794 | 49 | 12 | (36) | 6,916 |
| Fidelity Series Government Money Market Fund 0.16% | 1,109 | 932 | 1,430 | 1 | -- | -- | 611 |
| Fidelity Series High Income Fund | 787 | 24 | -- | 24 | -- | 84 | 895 |
| Fidelity Series Inflation-Protected Bond Index Fund | 5,548 | 1,554 | 332 | 5 | 2 | 371 | 7,143 |
| Fidelity Series International Credit Fund | 60 | 2 | -- | 1 | -- | 5 | 67 |
| Fidelity Series International Growth Fund | 5,450 | 325 | 1,487 | -- | 95 | 1,384 | 5,767 |
| Fidelity Series International Index Fund | 2,084 | 52 | 190 | -- | (19) | 453 | 2,380 |
| Fidelity Series International Small Cap Fund | 1,651 | 32 | 149 | -- | (14) | 539 | 2,059 |
| Fidelity Series International Value Fund | 5,206 | 304 | 846 | -- | (180) | 1,234 | 5,718 |
| Fidelity Series Investment Grade Bond Fund | 6,090 | 1,673 | 459 | 91 | 4 | 388 | 7,696 |
| Fidelity Series Investment Grade Securitized Fund | 4,353 | 1,216 | 376 | 30 | 2 | 52 | 5,247 |
| Fidelity Series Large Cap Growth Index Fund | 5,455 | 460 | 1,591 | 119 | 246 | 1,984 | 6,554 |
| Fidelity Series Large Cap Stock Fund | 5,613 | 855 | 550 | 240 | (2) | 1,021 | 6,937 |
| Fidelity Series Large Cap Value Index Fund | 10,463 | 1,224 | 726 | -- | (80) | 2,240 | 13,121 |
| Fidelity Series Long-Term Treasury Bond Index Fund | 2,709 | 692 | 346 | 70 | 51 | (132) | 2,974 |
| Fidelity Series Overseas Fund | 5,116 | 497 | 1,305 | -- | (74) | 1,525 | 5,759 |
| Fidelity Series Real Estate Income Fund | 432 | 17 | -- | 17 | -- | 80 | 529 |
| Fidelity Series Short-Term Credit Fund | 202 | 1 | -- | 2 | -- | 8 | 211 |
| Fidelity Series Small Cap Opportunities Fund | 2,775 | 148 | 304 | 20 | (53) | 736 | 3,302 |
| Fidelity Series Treasury Bill Index Fund | 2,720 | 10 | 1,160 | 10 | (3) | (6) | 1,561 |
| Fidelity Series Value Discovery Fund | 3,258 | 890 | 195 | -- | (14) | 824 | 4,763 |
| | $105,397 | $19,845 | $17,066 | $2,780 | $272 | $20,225 | $128,673 |
Amounts in the income column in the above table include any capital gain distributions from underlying funds, which are presented in the corresponding line-item in the Statement of Operations, if applicable.
Investment Valuation
The following is a summary of the inputs used, as of September 30, 2020, involving the Fund's assets and liabilities carried at fair value. The inputs or methodology used for valuing securities may not be an indication of the risk associated with investing in those securities. For more information on valuation inputs, and their aggregation into the levels used below, please refer to the Investment Valuation section in the accompanying Notes to Financial Statements.
| | Valuation Inputs at Reporting Date: |
| Description | Total | Level 1 | Level 2 | Level 3 |
| Investments in Securities: | | | | |
| Domestic Equity Funds | $47,869 | $47,869 | $-- | $-- |
| International Equity Funds | 40,214 | 40,214 | -- | -- |
| Bond Funds | 38,207 | 38,207 | -- | -- |
| Short-Term Funds | 2,383 | 2,383 | -- | -- |
| Total Investments in Securities: | $128,673 | $128,673 | $-- | $-- |
See accompanying notes which are an integral part of the financial statements.
Fidelity Flex® Freedom Blend 2030 Fund
Financial Statements
Statement of Assets and Liabilities
| | | September 30, 2020 (Unaudited) |
| Assets | | |
Investment in securities, at value — See accompanying schedule:
| | |
| Affiliated issuers (cost $123,085) | $128,673 | |
| Total Investment in Securities (cost $123,085) | | $128,673 |
| Receivable for investments sold | | 863 |
| Total assets | | 129,536 |
| Liabilities | | |
| Payable for investments purchased | $863 | |
| Total liabilities | | 863 |
| Net Assets | | $128,673 |
| Net Assets consist of: | | |
| Paid in capital | | $120,502 |
| Total accumulated earnings (loss) | | 8,171 |
| Net Assets | | $128,673 |
| Net Asset Value, offering price and redemption price per share ($128,673 ÷ 12,054 shares) | | $10.67 |
See accompanying notes which are an integral part of the financial statements.
Statement of Operations
| | | Six months ended September 30, 2020 (Unaudited) |
| Investment Income | | |
| Dividends: | | |
| Affiliated issuers | | $534 |
| Expenses | | |
| Independent trustees' fees and expenses | $1 | |
| Total expenses | | 1 |
| Net investment income (loss) | | 533 |
| Realized and Unrealized Gain (Loss) | | |
| Net realized gain (loss) on: | | |
| Investment securities: | | |
| Affiliated issuers | 272 | |
| Capital gain distributions from underlying funds: | | |
| Affiliated issuers | 2,246 | |
| Total net realized gain (loss) | | 2,518 |
| Change in net unrealized appreciation (depreciation) on: | | |
| Investment securities: | | |
| Affiliated issuers | 20,225 | |
| Total change in net unrealized appreciation (depreciation) | | 20,225 |
| Net gain (loss) | | 22,743 |
| Net increase (decrease) in net assets resulting from operations | | $23,276 |
See accompanying notes which are an integral part of the financial statements.
Statement of Changes in Net Assets
| | Six months ended September 30, 2020 (Unaudited) | Year ended March 31, 2020 |
| Increase (Decrease) in Net Assets | | |
| Operations | | |
| Net investment income (loss) | $533 | $2,766 |
| Net realized gain (loss) | 2,518 | 3,390 |
| Change in net unrealized appreciation (depreciation) | 20,225 | (12,728) |
| Net increase (decrease) in net assets resulting from operations | 23,276 | (6,572) |
| Distributions to shareholders | (1,990) | (8,047) |
| Share transactions | | |
| Reinvestment of distributions | 1,990 | 8,047 |
| Net increase (decrease) in net assets resulting from share transactions | 1,990 | 8,047 |
| Total increase (decrease) in net assets | 23,276 | (6,572) |
| Net Assets | | |
| Beginning of period | 105,397 | 111,969 |
| End of period | $128,673 | $105,397 |
| Other Information | | |
| Shares | | |
| Sold | – | – |
| Issued in reinvestment of distributions | 211 | 788 |
| Net increase (decrease) | 211 | 788 |
See accompanying notes which are an integral part of the financial statements.
Financial Highlights
Fidelity Flex Freedom Blend 2030 Fund
| | Six months ended (Unaudited) September 30, | Years endedMarch 31, | | |
| | 2020 | 2020 | 2019 | 2018 A |
| Selected Per–Share Data | | | | |
| Net asset value, beginning of period | $8.90 | $10.13 | $10.55 | $10.00 |
| Income from Investment Operations | | | | |
| Net investment income (loss)B | .04 | .24 | .24 | .18 |
| Net realized and unrealized gain (loss) | 1.90 | (.75) | .04 | .68 |
| Total from investment operations | 1.94 | (.51) | .28 | .86 |
| Distributions from net investment income | (.02) | (.24) | (.24) | (.17) |
| Distributions from net realized gain | (.15) | (.47) | (.46) | (.15) |
| Total distributions | (.17) | (.72)C | (.70) | (.31)C |
| Net asset value, end of period | $10.67 | $8.90 | $10.13 | $10.55 |
| Total ReturnD | 22.02% | (5.88)% | 3.09% | 8.63% |
| Ratios to Average Net AssetsE,F | | | | |
| Expenses before reductions | - %G,H | - %H | - %H | - %G |
| Expenses net of fee waivers, if any | - %G,H | - %H | - %H | - %G |
| Expenses net of all reductions | - %G,H | - %H | - %H | - %G |
| Net investment income (loss) | .88%G | 2.36% | 2.32% | 2.15%G |
| Supplemental Data | | | | |
| Net assets, end of period (000 omitted) | $129 | $105 | $112 | $109 |
| Portfolio turnover rateF | 28%G | 68% | 20% | 15%G |
A For the period June 8, 2017 (commencement of operations) to March 31, 2018.
B Calculated based on average shares outstanding during the period.
C Total distributions per share do not sum due to rounding.
D Total returns for periods of less than one year are not annualized.
E Expense ratios reflect operating expenses of the class. Expenses before reductions do not reflect amounts reimbursed, waived, or reduced through arrangements with the investment advisor, brokerage services, or other offset arrangements, if applicable, and do not represent the amount paid by the class during periods when reimbursements, waivers or reductions occur.
F Amount does not include the portfolio activity of any underlying mutual funds or exchange-traded funds (ETFs).
G Annualized
H Amount represents less than .005%.
See accompanying notes which are an integral part of the financial statements.
Fidelity Flex® Freedom Blend 2035 Fund
Investment Summary (Unaudited)
The information in the following tables is based on the direct investments of the Fund.
Top Holdings as of September 30, 2020
| | % of fund's net assets |
| Fidelity Series Emerging Markets Opportunities Fund | 13.0 |
| Fidelity Series Large Cap Value Index Fund | 12.8 |
| Fidelity Series Blue Chip Growth Fund | 9.9 |
| Fidelity Series Large Cap Stock Fund | 6.8 |
| Fidelity Series Large Cap Growth Index Fund | 6.4 |
| Fidelity Series International Growth Fund | 5.5 |
| Fidelity Series Overseas Fund | 5.5 |
| Fidelity Series International Value Fund | 5.5 |
| Fidelity Series Value Discovery Fund | 4.6 |
| Fidelity Series Small Cap Opportunities Fund | 3.2 |
| | 73.2 |
Asset Allocation (% of fund's net assets)
| Period end |
| | Domestic Equity Funds | 46.2% |
| | International Equity Funds | 37.2% |
| | Bond Funds | 15.2% |
| | Short-Term Funds | 1.4% |

Domestic Equity Funds category includes Fidelity Series Commodity Strategy Fund which invests in commodity-related investments.
Fidelity Flex® Freedom Blend 2035 Fund
Schedule of Investments September 30, 2020 (Unaudited)
Showing Percentage of Net Assets
| Domestic Equity Funds - 46.2% | | | |
| | | Shares | Value |
| Fidelity Series Blue Chip Growth Fund (a) | | 775 | $12,791 |
| Fidelity Series Commodity Strategy Fund (a) | | 787 | 3,275 |
| Fidelity Series Large Cap Growth Index Fund (a) | | 581 | 8,277 |
| Fidelity Series Large Cap Stock Fund (a) | | 623 | 8,822 |
| Fidelity Series Large Cap Value Index Fund (a) | | 1,438 | 16,686 |
| Fidelity Series Small Cap Opportunities Fund (a) | | 329 | 4,198 |
| Fidelity Series Value Discovery Fund (a) | | 483 | 5,969 |
| TOTAL DOMESTIC EQUITY FUNDS | | | |
| (Cost $58,972) | | | 60,018 |
|
| International Equity Funds - 37.2% | | | |
| Fidelity Series Canada Fund (a) | | 269 | 2,749 |
| Fidelity Series Emerging Markets Fund (a) | | 199 | 1,880 |
| Fidelity Series Emerging Markets Opportunities Fund (a) | | 805 | 16,890 |
| Fidelity Series International Growth Fund (a) | | 380 | 7,145 |
| Fidelity Series International Index Fund (a) | | 297 | 2,949 |
| Fidelity Series International Small Cap Fund (a) | | 141 | 2,517 |
| Fidelity Series International Value Fund (a) | | 823 | 7,091 |
| Fidelity Series Overseas Fund (a) | | 638 | 7,134 |
| TOTAL INTERNATIONAL EQUITY FUNDS | | | |
| (Cost $45,412) | | | 48,355 |
|
| Bond Funds - 15.2% | | | |
| Fidelity Series Corporate Bond Fund (a) | | 233 | 2,617 |
| Fidelity Series Emerging Markets Debt Fund (a) | | 88 | 800 |
| Fidelity Series Floating Rate High Income Fund (a) | | 20 | 178 |
| Fidelity Series Government Bond Index Fund (a) | | 278 | 3,126 |
| Fidelity Series High Income Fund (a) | | 99 | 899 |
| Fidelity Series Inflation-Protected Bond Index Fund (a) | | 245 | 2,620 |
| Fidelity Series International Credit Fund (a) | | 5 | 54 |
| Fidelity Series Investment Grade Bond Fund (a) | | 284 | 3,478 |
| Fidelity Series Investment Grade Securitized Fund (a) | | 222 | 2,373 |
| Fidelity Series Long-Term Treasury Bond Index Fund (a) | | 289 | 2,988 |
| Fidelity Series Real Estate Income Fund (a) | | 53 | 533 |
| TOTAL BOND FUNDS | | | |
| (Cost $18,789) | | | 19,666 |
|
| Short-Term Funds - 1.4% | | | |
| Fidelity Series Government Money Market Fund 0.16% (a)(b) | | 137 | 137 |
| Fidelity Series Short-Term Credit Fund (a) | | 21 | 214 |
| Fidelity Series Treasury Bill Index Fund (a) | | 144 | 1,444 |
| TOTAL SHORT-TERM FUNDS | | | |
| (Cost $1,787) | | | 1,795 |
| TOTAL INVESTMENT IN SECURITIES - 100.0% | | | |
| (Cost $124,960) | | | 129,834 |
| NET OTHER ASSETS (LIABILITIES) - 0.0% | | | 0 |
| NET ASSETS - 100% | | | $129,834 |
Legend
(a) Affiliated Fund
(b) The rate quoted is the annualized seven-day yield of the fund at period end.
Affiliated Underlying Funds
Fiscal year to date information regarding the Fund's investments in affiliated Underlying Funds, excluding any Money Market Central Funds, is presented below. Exchanges between classes of the same affiliated Underlying Funds may occur.
| Affiliate | Value, beginning of period | Purchases | Sales Proceeds | Dividend Income | Realized Gain (loss) | Change in Unrealized appreciation (depreciation) | Value, end of period |
| Fidelity Series Blue Chip Growth Fund | $9,008 | $3,572 | $2,710 | $2,530 | $580 | $2,341 | $12,791 |
| Fidelity Series Canada Fund | 2,303 | 207 | 281 | -- | (45) | 565 | 2,749 |
| Fidelity Series Commodity Strategy Fund | 3,496 | 220 | 838 | 14 | (160) | 557 | 3,275 |
| Fidelity Series Corporate Bond Fund | 1,695 | 1,056 | 315 | 33 | (4) | 185 | 2,617 |
| Fidelity Series Emerging Markets Debt Fund | 693 | 21 | -- | 20 | -- | 86 | 800 |
| Fidelity Series Emerging Markets Fund | 1,148 | 338 | 41 | -- | (2) | 437 | 1,880 |
| Fidelity Series Emerging Markets Opportunities Fund | 10,559 | 2,708 | 474 | -- | 5 | 4,092 | 16,890 |
| Fidelity Series Floating Rate High Income Fund | 158 | 4 | -- | 4 | -- | 16 | 178 |
| Fidelity Series Government Bond Index Fund | 2,650 | 966 | 479 | 20 | 13 | (24) | 3,126 |
| Fidelity Series Government Money Market Fund 0.16% | 1,016 | 563 | 1,442 | 1 | -- | -- | 137 |
| Fidelity Series High Income Fund | 790 | 24 | -- | 24 | -- | 85 | 899 |
| Fidelity Series Inflation-Protected Bond Index Fund | 2,292 | 455 | 269 | 2 | 2 | 140 | 2,620 |
| Fidelity Series International Credit Fund | 49 | 1 | -- | 1 | -- | 4 | 54 |
| Fidelity Series International Growth Fund | 6,404 | 388 | 1,432 | -- | 98 | 1,687 | 7,145 |
| Fidelity Series International Index Fund | 2,503 | 100 | 178 | -- | (17) | 541 | 2,949 |
| Fidelity Series International Small Cap Fund | 1,889 | 52 | 45 | -- | (4) | 625 | 2,517 |
| Fidelity Series International Value Fund | 5,979 | 439 | 597 | -- | (125) | 1,395 | 7,091 |
| Fidelity Series Investment Grade Bond Fund | 2,360 | 1,268 | 307 | 38 | 4 | 153 | 3,478 |
| Fidelity Series Investment Grade Securitized Fund | 1,809 | 920 | 377 | 12 | 2 | 19 | 2,373 |
| Fidelity Series Large Cap Growth Index Fund | 6,710 | 480 | 1,686 | 150 | 278 | 2,495 | 8,277 |
| Fidelity Series Large Cap Stock Fund | 6,970 | 924 | 334 | 303 | (5) | 1,267 | 8,822 |
| Fidelity Series Large Cap Value Index Fund | 12,953 | 1,477 | 435 | -- | (73) | 2,764 | 16,686 |
| Fidelity Series Long-Term Treasury Bond Index Fund | 2,562 | 795 | 287 | 69 | 30 | (112) | 2,988 |
| Fidelity Series Overseas Fund | 6,112 | 561 | 1,282 | -- | (75) | 1,818 | 7,134 |
| Fidelity Series Real Estate Income Fund | 435 | 17 | -- | 17 | -- | 81 | 533 |
| Fidelity Series Short-Term Credit Fund | 204 | 2 | -- | 2 | -- | 8 | 214 |
| Fidelity Series Small Cap Opportunities Fund | 3,453 | 201 | 313 | 25 | (46) | 903 | 4,198 |
| Fidelity Series Treasury Bill Index Fund | 2,719 | 10 | 1,276 | 10 | (4) | (5) | 1,444 |
| Fidelity Series Value Discovery Fund | 4,051 | 1,017 | 115 | -- | (4) | 1,020 | $5,969 |
| | $102,970 | $18,786 | $15,513 | $3,275 | $448 | $23,143 | $129,834 |
Amounts in the income column in the above table include any capital gain distributions from underlying funds, which are presented in the corresponding line-item in the Statement of Operations, if applicable.
Investment Valuation
The following is a summary of the inputs used, as of September 30, 2020, involving the Fund's assets and liabilities carried at fair value. The inputs or methodology used for valuing securities may not be an indication of the risk associated with investing in those securities. For more information on valuation inputs, and their aggregation into the levels used below, please refer to the Investment Valuation section in the accompanying Notes to Financial Statements.
| | Valuation Inputs at Reporting Date: |
| Description | Total | Level 1 | Level 2 | Level 3 |
| Investments in Securities: | | | | |
| Domestic Equity Funds | $60,018 | $60,018 | $-- | $-- |
| International Equity Funds | 48,355 | 48,355 | -- | -- |
| Bond Funds | 19,666 | 19,666 | -- | -- |
| Short-Term Funds | 1,795 | 1,795 | -- | -- |
| Total Investments in Securities: | $129,834 | $129,834 | $-- | $-- |
See accompanying notes which are an integral part of the financial statements.
Fidelity Flex® Freedom Blend 2035 Fund
Financial Statements
Statement of Assets and Liabilities
| | | September 30, 2020 (Unaudited) |
| Assets | | |
Investment in securities, at value — See accompanying schedule:
| | |
| Affiliated issuers (cost $124,960) | $129,834 | |
| Total Investment in Securities (cost $124,960) | | $129,834 |
| Receivable for investments sold | | 691 |
| Total assets | | 130,525 |
| Liabilities | | |
| Payable for investments purchased | $691 | |
| Total liabilities | | 691 |
| Net Assets | | $129,834 |
| Net Assets consist of: | | |
| Paid in capital | | $121,724 |
| Total accumulated earnings (loss) | | 8,110 |
| Net Assets | | $129,834 |
| Net Asset Value, offering price and redemption price per share ($129,834 ÷ 12,178 shares) | | $10.66 |
See accompanying notes which are an integral part of the financial statements.
Statement of Operations
| | | Six months ended September 30, 2020 (Unaudited) |
| Investment Income | | |
| Dividends: | | |
| Affiliated issuers | | $431 |
| Expenses | | |
| Independent trustees' fees and expenses | $1 | |
| Total expenses | | 1 |
| Net investment income (loss) | | 430 |
| Realized and Unrealized Gain (Loss) | | |
| Net realized gain (loss) on: | | |
| Investment securities: | | |
| Affiliated issuers | 448 | |
| Capital gain distributions from underlying funds: | | |
| Affiliated issuers | 2,844 | |
| Total net realized gain (loss) | | 3,292 |
| Change in net unrealized appreciation (depreciation) on: | | |
| Investment securities: | | |
| Affiliated issuers | 23,143 | |
| Total change in net unrealized appreciation (depreciation) | | 23,143 |
| Net gain (loss) | | 26,435 |
| Net increase (decrease) in net assets resulting from operations | | $26,865 |
See accompanying notes which are an integral part of the financial statements.
Statement of Changes in Net Assets
| | Six months ended September 30, 2020 (Unaudited) | Year ended March 31, 2020 |
| Increase (Decrease) in Net Assets | | |
| Operations | | |
| Net investment income (loss) | $430 | $2,740 |
| Net realized gain (loss) | 3,292 | 3,393 |
| Change in net unrealized appreciation (depreciation) | 23,143 | (15,899) |
| Net increase (decrease) in net assets resulting from operations | 26,865 | (9,766) |
| Distributions to shareholders | (2,069) | (8,597) |
| Share transactions | | |
| Reinvestment of distributions | 2,068 | 8,597 |
| Net increase (decrease) in net assets resulting from share transactions | 2,068 | 8,597 |
| Total increase (decrease) in net assets | 26,864 | (9,766) |
| Net Assets | | |
| Beginning of period | 102,970 | 112,736 |
| End of period | $129,834 | $102,970 |
| Other Information | | |
| Shares | | |
| Sold | – | – |
| Issued in reinvestment of distributions | 223 | 843 |
| Net increase (decrease) | 223 | 843 |
See accompanying notes which are an integral part of the financial statements.
Financial Highlights
Fidelity Flex Freedom Blend 2035 Fund
| | Six months ended (Unaudited) September 30, | Years endedMarch 31, | | |
| | 2020 | 2020 | 2019 | 2018 A |
| Selected Per–Share Data | | | | |
| Net asset value, beginning of period | $8.61 | $10.15 | $10.65 | $10.00 |
| Income from Investment Operations | | | | |
| Net investment income (loss)B | .04 | .24 | .22 | .17 |
| Net realized and unrealized gain (loss) | 2.18 | (1.02) | .02 | .81 |
| Total from investment operations | 2.22 | (.78) | .24 | .98 |
| Distributions from net investment income | (.01) | (.24) | (.22) | (.16) |
| Distributions from net realized gain | (.16) | (.52) | (.52) | (.16) |
| Total distributions | (.17) | (.76) | (.74) | (.33)C |
| Net asset value, end of period | $10.66 | $8.61 | $10.15 | $10.65 |
| Total ReturnD | 26.12% | (8.74)% | 2.75% | 9.77% |
| Ratios to Average Net AssetsE,F | | | | |
| Expenses before reductions | - %G,H | - %H | - %H | - %G |
| Expenses net of fee waivers, if any | - %G,H | - %H | - %H | - %G |
| Expenses net of all reductions | - %G,H | - %H | - %H | - %G |
| Net investment income (loss) | .71%G | 2.32% | 2.16% | 2.02%G |
| Supplemental Data | | | | |
| Net assets, end of period (000 omitted) | $130 | $103 | $113 | $110 |
| Portfolio turnover rateF | 26%G | 65% | 20% | 14%G |
A For the period June 8, 2017 (commencement of operations) to March 31, 2018.
B Calculated based on average shares outstanding during the period.
C Total distributions per share do not sum due to rounding.
D Total returns for periods of less than one year are not annualized.
E Expense ratios reflect operating expenses of the class. Expenses before reductions do not reflect amounts reimbursed, waived, or reduced through arrangements with the investment advisor, brokerage services, or other offset arrangements, if applicable, and do not represent the amount paid by the class during periods when reimbursements, waivers or reductions occur.
F Amount does not include the portfolio activity of any underlying mutual funds or exchange-traded funds (ETFs).
G Annualized
H Amount represents less than .005%.
See accompanying notes which are an integral part of the financial statements.
Fidelity Flex® Freedom Blend 2040 Fund
Investment Summary (Unaudited)
The information in the following tables is based on the direct investments of the Fund.
Top Holdings as of September 30, 2020
| | % of fund's net assets |
| Fidelity Series Large Cap Value Index Fund | 14.3 |
| Fidelity Series Emerging Markets Opportunities Fund | 14.0 |
| Fidelity Series Blue Chip Growth Fund | 11.1 |
| Fidelity Series Large Cap Stock Fund | 7.6 |
| Fidelity Series Large Cap Growth Index Fund | 7.2 |
| Fidelity Series International Growth Fund | 6.1 |
| Fidelity Series Overseas Fund | 6.1 |
| Fidelity Series International Value Fund | 6.1 |
| Fidelity Series Value Discovery Fund | 5.3 |
| Fidelity Series Small Cap Opportunities Fund | 3.6 |
| | 81.4 |
Asset Allocation (% of fund's net assets)
| Period end |
| | Domestic Equity Funds | 51.6% |
| | International Equity Funds | 40.8% |
| | Bond Funds | 6.2% |
| | Short-Term Funds | 1.4% |

Domestic Equity Funds category includes Fidelity Series Commodity Strategy Fund which invests in commodity-related investments.
Fidelity Flex® Freedom Blend 2040 Fund
Schedule of Investments September 30, 2020 (Unaudited)
Showing Percentage of Net Assets
| Domestic Equity Funds - 51.6% | | | |
| | | Shares | Value |
| Fidelity Series Blue Chip Growth Fund (a) | | 869 | $14,342 |
| Fidelity Series Commodity Strategy Fund (a) | | 786 | 3,270 |
| Fidelity Series Large Cap Growth Index Fund (a) | | 653 | 9,301 |
| Fidelity Series Large Cap Stock Fund (a) | | 699 | 9,891 |
| Fidelity Series Large Cap Value Index Fund (a) | | 1,602 | 18,590 |
| Fidelity Series Small Cap Opportunities Fund (a) | | 369 | 4,707 |
| Fidelity Series Value Discovery Fund (a) | | 549 | 6,791 |
| TOTAL DOMESTIC EQUITY FUNDS | | | |
| (Cost $65,669) | | | 66,892 |
|
| International Equity Funds - 40.8% | | | |
| Fidelity Series Canada Fund (a) | | 298 | 3,050 |
| Fidelity Series Emerging Markets Fund (a) | | 214 | 2,015 |
| Fidelity Series Emerging Markets Opportunities Fund (a) | | 863 | 18,102 |
| Fidelity Series International Growth Fund (a) | | 422 | 7,924 |
| Fidelity Series International Index Fund (a) | | 329 | 3,272 |
| Fidelity Series International Small Cap Fund (a) | | 157 | 2,792 |
| Fidelity Series International Value Fund (a) | | 912 | 7,865 |
| Fidelity Series Overseas Fund (a) | | 708 | 7,912 |
| TOTAL INTERNATIONAL EQUITY FUNDS | | | |
| (Cost $49,842) | | | 52,932 |
|
| Bond Funds - 6.2% | | | |
| Fidelity Series Emerging Markets Debt Fund (a) | | 88 | 796 |
| Fidelity Series Floating Rate High Income Fund (a) | | 20 | 176 |
| Fidelity Series High Income Fund (a) | | 97 | 883 |
| Fidelity Series Inflation-Protected Bond Index Fund (a) | | 246 | 2,631 |
| Fidelity Series International Credit Fund (a) | | 5 | 54 |
| Fidelity Series Long-Term Treasury Bond Index Fund (a) | | 290 | 2,998 |
| Fidelity Series Real Estate Income Fund (a) | | 53 | 530 |
| TOTAL BOND FUNDS | | | |
| (Cost $7,742) | | | 8,068 |
|
| Short-Term Funds - 1.4% | | | |
| Fidelity Series Government Money Market Fund 0.16% (a)(b) | | 153 | 153 |
| Fidelity Series Short-Term Credit Fund (a) | | 21 | 214 |
| Fidelity Series Treasury Bill Index Fund (a) | | 144 | 1,439 |
| TOTAL SHORT-TERM FUNDS | | | |
| (Cost $1,798) | | | 1,806 |
| TOTAL INVESTMENT IN SECURITIES - 100.0% | | | |
| (Cost $125,051) | | | 129,698 |
| NET OTHER ASSETS (LIABILITIES) - 0.0% | | | 0 |
| NET ASSETS - 100% | | | $129,698 |
Legend
(a) Affiliated Fund
(b) The rate quoted is the annualized seven-day yield of the fund at period end.
Affiliated Underlying Funds
Fiscal year to date information regarding the Fund's investments in affiliated Underlying Funds, excluding any Money Market Central Funds, is presented below. Exchanges between classes of the same affiliated Underlying Funds may occur.
| Affiliate | Value, beginning of period | Purchases | Sales Proceeds | Dividend Income | Realized Gain (loss) | Change in Unrealized appreciation (depreciation) | Value, end of period |
| Fidelity Series Blue Chip Growth Fund | $9,836 | $3,913 | $2,555 | $2,849 | $535 | $2,613 | $14,342 |
| Fidelity Series Canada Fund | 2,317 | 368 | 194 | -- | (33) | 592 | 3,050 |
| Fidelity Series Commodity Strategy Fund | 3,433 | 194 | 748 | 14 | (182) | 573 | 3,270 |
| Fidelity Series Emerging Markets Debt Fund | 702 | 21 | 13 | 20 | (2) | 88 | 796 |
| Fidelity Series Emerging Markets Fund | 1,220 | 367 | 32 | -- | (2) | 462 | 2,015 |
| Fidelity Series Emerging Markets Opportunities Fund | 11,225 | 2,786 | 235 | -- | 1 | 4,325 | 18,102 |
| Fidelity Series Floating Rate High Income Fund | 157 | 3 | -- | 4 | -- | 16 | 176 |
| Fidelity Series Government Money Market Fund 0.16% | 958 | 597 | 1,402 | 1 | -- | -- | 153 |
| Fidelity Series High Income Fund | 776 | 24 | -- | 23 | -- | 83 | 883 |
| Fidelity Series Inflation-Protected Bond Index Fund | 2,307 | 499 | 314 | 2 | -- | 139 | 2,631 |
| Fidelity Series International Credit Fund | 49 | 1 | -- | 1 | -- | 4 | 54 |
| Fidelity Series International Growth Fund | 6,847 | 471 | 1,317 | -- | 59 | 1,864 | 7,924 |
| Fidelity Series International Index Fund | 2,700 | 151 | 149 | -- | (13) | 583 | 3,272 |
| Fidelity Series International Small Cap Fund | 2,052 | 84 | 24 | -- | (2) | 682 | 2,792 |
| Fidelity Series International Value Fund | 6,618 | 453 | 586 | -- | (101) | 1,481 | 7,865 |
| Fidelity Series Large Cap Growth Index Fund | 7,400 | 429 | 1,567 | 165 | 246 | 2,793 | 9,301 |
| Fidelity Series Large Cap Stock Fund | 7,687 | 1,069 | 252 | 338 | (3) | 1,390 | 9,891 |
| Fidelity Series Large Cap Value Index Fund | 14,213 | 1,841 | 416 | -- | (46) | 2,998 | 18,590 |
| Fidelity Series Long-Term Treasury Bond Index Fund | 2,583 | 880 | 384 | 68 | 41 | (122) | 2,998 |
| Fidelity Series Overseas Fund | 6,558 | 569 | 1,101 | -- | (59) | 1,945 | 7,912 |
| Fidelity Series Real Estate Income Fund | 433 | 17 | -- | 17 | -- | 80 | 530 |
| Fidelity Series Short-Term Credit Fund | 204 | 2 | -- | 2 | -- | 8 | 214 |
| Fidelity Series Small Cap Opportunities Fund | 3,607 | 487 | 305 | 28 | (45) | 963 | 4,707 |
| Fidelity Series Treasury Bill Index Fund | 2,708 | 10 | 1,270 | 10 | (4) | (5) | 1,439 |
| Fidelity Series Value Discovery Fund | 4,499 | 1,209 | 41 | -- | -- | 1,124 | 6,791 |
| | $101,089 | $16,445 | $12,905 | $3,542 | $390 | $24,679 | $129,698 |
Amounts in the income column in the above table include any capital gain distributions from underlying funds, which are presented in the corresponding line-item in the Statement of Operations, if applicable.
Investment Valuation
The following is a summary of the inputs used, as of September 30, 2020, involving the Fund's assets and liabilities carried at fair value. The inputs or methodology used for valuing securities may not be an indication of the risk associated with investing in those securities. For more information on valuation inputs, and their aggregation into the levels used below, please refer to the Investment Valuation section in the accompanying Notes to Financial Statements.
| | Valuation Inputs at Reporting Date: |
| Description | Total | Level 1 | Level 2 | Level 3 |
| Investments in Securities: | | | | |
| Domestic Equity Funds | $66,892 | $66,892 | $-- | $-- |
| International Equity Funds | 52,932 | 52,932 | -- | -- |
| Bond Funds | 8,068 | 8,068 | -- | -- |
| Short-Term Funds | 1,806 | 1,806 | -- | -- |
| Total Investments in Securities: | $129,698 | $129,698 | $-- | $-- |
See accompanying notes which are an integral part of the financial statements.
Fidelity Flex® Freedom Blend 2040 Fund
Financial Statements
Statement of Assets and Liabilities
| | | September 30, 2020 (Unaudited) |
| Assets | | |
Investment in securities, at value — See accompanying schedule:
| | |
| Affiliated issuers (cost $125,051) | $129,698 | |
| Total Investment in Securities (cost $125,051) | | $129,698 |
| Receivable for investments sold | | 711 |
| Total assets | | 130,409 |
| Liabilities | | |
| Payable for investments purchased | $711 | |
| Total liabilities | | 711 |
| Net Assets | | $129,698 |
| Net Assets consist of: | | |
| Paid in capital | | $121,605 |
| Total accumulated earnings (loss) | | 8,093 |
| Net Assets | | $129,698 |
| Net Asset Value, offering price and redemption price per share ($129,698 ÷ 12,174 shares) | | $10.65 |
See accompanying notes which are an integral part of the financial statements.
Statement of Operations
| | | Six months ended September 30, 2020 (Unaudited) |
| Investment Income | | |
| Dividends: | | |
| Affiliated issuers | | $354 |
| Expenses | | |
| Independent trustees' fees and expenses | $1 | |
| Total expenses | | 1 |
| Net investment income (loss) | | 353 |
| Realized and Unrealized Gain (Loss) | | |
| Net realized gain (loss) on: | | |
| Investment securities: | | |
| Affiliated issuers | 390 | |
| Capital gain distributions from underlying funds: | | |
| Affiliated issuers | 3,188 | |
| Total net realized gain (loss) | | 3,578 |
| Change in net unrealized appreciation (depreciation) on: | | |
| Investment securities: | | |
| Affiliated issuers | 24,679 | |
| Total change in net unrealized appreciation (depreciation) | | 24,679 |
| Net gain (loss) | | 28,257 |
| Net increase (decrease) in net assets resulting from operations | | $28,610 |
See accompanying notes which are an integral part of the financial statements.
Statement of Changes in Net Assets
| | Six months ended September 30, 2020 (Unaudited) | Year ended March 31, 2020 |
| Increase (Decrease) in Net Assets | | |
| Operations | | |
| Net investment income (loss) | $353 | $2,705 |
| Net realized gain (loss) | 3,578 | 2,975 |
| Change in net unrealized appreciation (depreciation) | 24,679 | (17,265) |
| Net increase (decrease) in net assets resulting from operations | 28,610 | (11,585) |
| Distributions to shareholders | (2,009) | (8,422) |
| Share transactions | | |
| Reinvestment of distributions | 2,008 | 8,422 |
| Net increase (decrease) in net assets resulting from share transactions | 2,008 | 8,422 |
| Total increase (decrease) in net assets | 28,609 | (11,585) |
| Net Assets | | |
| Beginning of period | 101,089 | 112,674 |
| End of period | $129,698 | $101,089 |
| Other Information | | |
| Shares | | |
| Sold | – | – |
| Issued in reinvestment of distributions | 219 | 828 |
| Net increase (decrease) | 219 | 828 |
See accompanying notes which are an integral part of the financial statements.
Financial Highlights
Fidelity Flex Freedom Blend 2040 Fund
| | Six months ended (Unaudited) September 30, | Years endedMarch 31, | | |
| | 2020 | 2020 | 2019 | 2018 A |
| Selected Per–Share Data | | | | |
| Net asset value, beginning of period | $8.46 | $10.13 | $10.66 | $10.00 |
| Income from Investment Operations | | | | |
| Net investment income (loss)B | .03 | .23 | .22 | .17 |
| Net realized and unrealized gain (loss) | 2.33 | (1.16) | –C | .82 |
| Total from investment operations | 2.36 | (.93) | .22 | .99 |
| Distributions from net investment income | (.01) | (.24) | (.22) | (.17) |
| Distributions from net realized gain | (.16) | (.51) | (.53) | (.17) |
| Total distributions | (.17) | (.74)D | (.75) | (.33)D |
| Net asset value, end of period | $10.65 | $8.46 | $10.13 | $10.66 |
| Total ReturnE | 28.20% | (10.27)% | 2.57% | 9.89% |
| Ratios to Average Net AssetsF,G | | | | |
| Expenses before reductions | - %H,I | - %I | - %I | - %H |
| Expenses net of fee waivers, if any | - %H,I | - %I | - %I | - %H |
| Expenses net of all reductions | - %H,I | - %I | - %I | - %H |
| Net investment income (loss) | .59%H | 2.30% | 2.13% | 2.01%H |
| Supplemental Data | | | | |
| Net assets, end of period (000 omitted) | $130 | $101 | $113 | $110 |
| Portfolio turnover rateG | 22%H | 61% | 20% | 13%H |
A For the period June 8, 2017 (commencement of operations) to March 31, 2018.
B Calculated based on average shares outstanding during the period.
C Amount represents less than $.005 per share.
D Total distributions per share do not sum due to rounding.
E Total returns for periods of less than one year are not annualized.
F Expense ratios reflect operating expenses of the class. Expenses before reductions do not reflect amounts reimbursed, waived, or reduced through arrangements with the investment advisor, brokerage services, or other offset arrangements, if applicable, and do not represent the amount paid by the class during periods when reimbursements, waivers or reductions occur.
G Amount does not include the portfolio activity of any underlying mutual funds or exchange-traded funds (ETFs).
H Annualized
I Amount represents less than .005%.
See accompanying notes which are an integral part of the financial statements.
Fidelity Flex® Freedom Blend 2045 Fund
Investment Summary (Unaudited)
The information in the following tables is based on the direct investments of the Fund.
Top Holdings as of September 30, 2020
| | % of fund's net assets |
| Fidelity Series Large Cap Value Index Fund | 14.4 |
| Fidelity Series Emerging Markets Opportunities Fund | 14.0 |
| Fidelity Series Blue Chip Growth Fund | 11.0 |
| Fidelity Series Large Cap Stock Fund | 7.6 |
| Fidelity Series Large Cap Growth Index Fund | 7.3 |
| Fidelity Series International Growth Fund | 6.1 |
| Fidelity Series Overseas Fund | 6.1 |
| Fidelity Series International Value Fund | 6.1 |
| Fidelity Series Value Discovery Fund | 5.2 |
| Fidelity Series Small Cap Opportunities Fund | 3.6 |
| | 81.4 |
Asset Allocation (% of fund's net assets)
| Period end |
| | Domestic Equity Funds | 51.6% |
| | International Equity Funds | 40.8% |
| | Bond Funds | 6.2% |
| | Short-Term Funds | 1.4% |

Domestic Equity Funds category includes Fidelity Series Commodity Strategy Fund which invests in commodity-related investments.
Fidelity Flex® Freedom Blend 2045 Fund
Schedule of Investments September 30, 2020 (Unaudited)
Showing Percentage of Net Assets
| Domestic Equity Funds - 51.6% | | | |
| | | Shares | Value |
| Fidelity Series Blue Chip Growth Fund (a) | | 867 | $14,308 |
| Fidelity Series Commodity Strategy Fund (a) | | 786 | 3,270 |
| Fidelity Series Large Cap Growth Index Fund (a) | | 661 | 9,415 |
| Fidelity Series Large Cap Stock Fund (a) | | 696 | 9,857 |
| Fidelity Series Large Cap Value Index Fund (a) | | 1,602 | 18,591 |
| Fidelity Series Small Cap Opportunities Fund (a) | | 368 | 4,695 |
| Fidelity Series Value Discovery Fund (a) | | 547 | 6,758 |
| TOTAL DOMESTIC EQUITY FUNDS | | | |
| (Cost $65,640) | | | 66,894 |
|
| International Equity Funds - 40.8% | | | |
| Fidelity Series Canada Fund (a) | | 298 | 3,051 |
| Fidelity Series Emerging Markets Fund (a) | | 214 | 2,015 |
| Fidelity Series Emerging Markets Opportunities Fund (a) | | 863 | 18,102 |
| Fidelity Series International Growth Fund (a) | | 422 | 7,924 |
| Fidelity Series International Index Fund (a) | | 329 | 3,272 |
| Fidelity Series International Small Cap Fund (a) | | 157 | 2,792 |
| Fidelity Series International Value Fund (a) | | 912 | 7,865 |
| Fidelity Series Overseas Fund (a) | | 708 | 7,913 |
| TOTAL INTERNATIONAL EQUITY FUNDS | | | |
| (Cost $49,810) | | | 52,934 |
|
| Bond Funds - 6.2% | | | |
| Fidelity Series Emerging Markets Debt Fund (a) | | 88 | 796 |
| Fidelity Series Floating Rate High Income Fund (a) | | 20 | 176 |
| Fidelity Series High Income Fund (a) | | 97 | 883 |
| Fidelity Series Inflation-Protected Bond Index Fund (a) | | 246 | 2,631 |
| Fidelity Series International Credit Fund (a) | | 5 | 54 |
| Fidelity Series Long-Term Treasury Bond Index Fund (a) | | 290 | 2,999 |
| Fidelity Series Real Estate Income Fund (a) | | 53 | 529 |
| TOTAL BOND FUNDS | | | |
| (Cost $7,741) | | | 8,068 |
|
| Short-Term Funds - 1.4% | | | |
| Fidelity Series Government Money Market Fund 0.16% (a)(b) | | 153 | 153 |
| Fidelity Series Short-Term Credit Fund (a) | | 21 | 214 |
| Fidelity Series Treasury Bill Index Fund (a) | | 144 | 1,440 |
| TOTAL SHORT-TERM FUNDS | | | |
| (Cost $1,799) | | | 1,807 |
| TOTAL INVESTMENT IN SECURITIES - 100.0% | | | |
| (Cost $124,990) | | | 129,703 |
| NET OTHER ASSETS (LIABILITIES) - 0.0% | | | 0 |
| NET ASSETS - 100% | | | $129,703 |
Legend
(a) Affiliated Fund
(b) The rate quoted is the annualized seven-day yield of the fund at period end.
Affiliated Underlying Funds
Fiscal year to date information regarding the Fund's investments in affiliated Underlying Funds, excluding any Money Market Central Funds, is presented below. Exchanges between classes of the same affiliated Underlying Funds may occur.
| Affiliate | Value, beginning of period | Purchases | Sales Proceeds | Dividend Income | Realized Gain (loss) | Change in Unrealized appreciation (depreciation) | Value, end of period |
| Fidelity Series Blue Chip Growth Fund | $9,836 | $3,957 | $2,635 | $2,849 | $526 | $2,624 | $14,308 |
| Fidelity Series Canada Fund | 2,431 | 265 | 208 | -- | (30) | 593 | 3,051 |
| Fidelity Series Commodity Strategy Fund | 3,433 | 193 | 747 | 14 | (183) | 574 | 3,270 |
| Fidelity Series Emerging Markets Debt Fund | 698 | 21 | 9 | 20 | (2) | 88 | 796 |
| Fidelity Series Emerging Markets Fund | 1,220 | 367 | 32 | -- | (2) | 462 | 2,015 |
| Fidelity Series Emerging Markets Opportunities Fund | 11,227 | 2,794 | 244 | -- | -- | 4,325 | 18,102 |
| Fidelity Series Floating Rate High Income Fund | 157 | 3 | -- | 4 | -- | 16 | 176 |
| Fidelity Series Government Money Market Fund 0.16% | 957 | 597 | 1,401 | 1 | -- | -- | 153 |
| Fidelity Series High Income Fund | 776 | 24 | -- | 23 | -- | 83 | 883 |
| Fidelity Series Inflation-Protected Bond Index Fund | 2,308 | 498 | 314 | 2 | -- | 139 | 2,631 |
| Fidelity Series International Credit Fund | 49 | 1 | -- | 1 | -- | 4 | 54 |
| Fidelity Series International Growth Fund | 6,838 | 481 | 1,314 | -- | 66 | 1,853 | 7,924 |
| Fidelity Series International Index Fund | 2,700 | 170 | 168 | -- | (17) | 587 | 3,272 |
| Fidelity Series International Small Cap Fund | 2,018 | 110 | 13 | -- | (1) | 678 | 2,792 |
| Fidelity Series International Value Fund | 6,577 | 600 | 699 | -- | (118) | 1,505 | 7,865 |
| Fidelity Series Large Cap Growth Index Fund | 7,401 | 391 | 1,417 | 165 | 219 | 2,821 | 9,415 |
| Fidelity Series Large Cap Stock Fund | 7,687 | 1,131 | 352 | 337 | (3) | 1,394 | 9,857 |
| Fidelity Series Large Cap Value Index Fund | 14,215 | 1,839 | 415 | -- | (49) | 3,001 | 18,591 |
| Fidelity Series Long-Term Treasury Bond Index Fund | 2,583 | 882 | 385 | 68 | 41 | (122) | 2,999 |
| Fidelity Series Overseas Fund | 6,538 | 589 | 1,094 | -- | (57) | 1,937 | 7,913 |
| Fidelity Series Real Estate Income Fund | 432 | 17 | -- | 17 | -- | 80 | 529 |
| Fidelity Series Short-Term Credit Fund | 204 | 2 | -- | 2 | -- | 8 | 214 |
| Fidelity Series Small Cap Opportunities Fund | 3,608 | 478 | 306 | 28 | (46) | 961 | 4,695 |
| Fidelity Series Treasury Bill Index Fund | 2,708 | 11 | 1,270 | 10 | (4) | (5) | 1,440 |
| Fidelity Series Value Discovery Fund | 4,499 | 1,175 | 33 | -- | (1) | 1,118 | 6,758 |
| | $101,100 | $16,596 | $13,056 | $3,541 | $339 | $24,724 | $129,703 |
Amounts in the income column in the above table include any capital gain distributions from underlying funds, which are presented in the corresponding line-item in the Statement of Operations, if applicable.
Investment Valuation
The following is a summary of the inputs used, as of September 30, 2020, involving the Fund's assets and liabilities carried at fair value. The inputs or methodology used for valuing securities may not be an indication of the risk associated with investing in those securities. For more information on valuation inputs, and their aggregation into the levels used below, please refer to the Investment Valuation section in the accompanying Notes to Financial Statements.
| | Valuation Inputs at Reporting Date: |
| Description | Total | Level 1 | Level 2 | Level 3 |
| Investments in Securities: | | | | |
| Domestic Equity Funds | $66,894 | $66,894 | $-- | $-- |
| International Equity Funds | 52,934 | 52,934 | -- | -- |
| Bond Funds | 8,068 | 8,068 | -- | -- |
| Short-Term Funds | 1,807 | 1,807 | -- | -- |
| Total Investments in Securities: | $129,703 | $129,703 | $-- | $-- |
See accompanying notes which are an integral part of the financial statements.
Fidelity Flex® Freedom Blend 2045 Fund
Financial Statements
Statement of Assets and Liabilities
| | | September 30, 2020 (Unaudited) |
| Assets | | |
Investment in securities, at value — See accompanying schedule:
| | |
| Affiliated issuers (cost $124,990) | $129,703 | |
| Total Investment in Securities (cost $124,990) | | $129,703 |
| Receivable for investments sold | | 597 |
| Total assets | | 130,300 |
| Liabilities | | |
| Payable for investments purchased | $597 | |
| Total liabilities | | 597 |
| Net Assets | | $129,703 |
| Net Assets consist of: | | |
| Paid in capital | | $121,607 |
| Total accumulated earnings (loss) | | 8,096 |
| Net Assets | | $129,703 |
| Net Asset Value, offering price and redemption price per share ($129,703 ÷ 12,174 shares) | | $10.65 |
See accompanying notes which are an integral part of the financial statements.
Statement of Operations
| | | Six months ended September 30, 2020 (Unaudited) |
| Investment Income | | |
| Dividends: | | |
| Affiliated issuers | | $352 |
| Expenses | | |
| Independent trustees' fees and expenses | $1 | |
| Total expenses | | 1 |
| Net investment income (loss) | | 351 |
| Realized and Unrealized Gain (Loss) | | |
| Net realized gain (loss) on: | | |
| Investment securities: | | |
| Affiliated issuers | 339 | |
| Capital gain distributions from underlying funds: | | |
| Affiliated issuers | 3,189 | |
| Total net realized gain (loss) | | 3,528 |
| Change in net unrealized appreciation (depreciation) on: | | |
| Investment securities: | | |
| Affiliated issuers | 24,724 | |
| Total change in net unrealized appreciation (depreciation) | | 24,724 |
| Net gain (loss) | | 28,252 |
| Net increase (decrease) in net assets resulting from operations | | $28,603 |
See accompanying notes which are an integral part of the financial statements.
Statement of Changes in Net Assets
| | Six months ended September 30, 2020 (Unaudited) | Year ended March 31, 2020 |
| Increase (Decrease) in Net Assets | | |
| Operations | | |
| Net investment income (loss) | $351 | $2,704 |
| Net realized gain (loss) | 3,528 | 2,962 |
| Change in net unrealized appreciation (depreciation) | 24,724 | (17,257) |
| Net increase (decrease) in net assets resulting from operations | 28,603 | (11,591) |
| Distributions to shareholders | (1,997) | (8,434) |
| Share transactions | | |
| Reinvestment of distributions | 1,997 | 8,434 |
| Net increase (decrease) in net assets resulting from share transactions | 1,997 | 8,434 |
| Total increase (decrease) in net assets | 28,603 | (11,591) |
| Net Assets | | |
| Beginning of period | 101,100 | 112,691 |
| End of period | $129,703 | $101,100 |
| Other Information | | |
| Shares | | |
| Sold | – | – |
| Issued in reinvestment of distributions | 218 | 829 |
| Net increase (decrease) | 218 | 829 |
See accompanying notes which are an integral part of the financial statements.
Financial Highlights
Fidelity Flex Freedom Blend 2045 Fund
| | Six months ended (Unaudited) September 30, | Years endedMarch 31, | | |
| | 2020 | 2020 | 2019 | 2018 A |
| Selected Per–Share Data | | | | |
| Net asset value, beginning of period | $8.46 | $10.13 | $10.66 | $10.00 |
| Income from Investment Operations | | | | |
| Net investment income (loss)B | .03 | .23 | .22 | .17 |
| Net realized and unrealized gain (loss) | 2.33 | (1.16) | –C | .82 |
| Total from investment operations | 2.36 | (.93) | .22 | .99 |
| Distributions from net investment income | (.01) | (.23) | (.22) | (.17) |
| Distributions from net realized gain | (.16) | (.51) | (.53) | (.17) |
| Total distributions | (.17) | (.74) | (.75) | (.33)D |
| Net asset value, end of period | $10.65 | $8.46 | $10.13 | $10.66 |
| Total ReturnE | 28.18% | (10.26)% | 2.55% | 9.91% |
| Ratios to Average Net AssetsF,G | | | | |
| Expenses before reductions | - %H,I | - %I | - %I | - %H |
| Expenses net of fee waivers, if any | - %H,I | - %I | - %I | - %H |
| Expenses net of all reductions | - %H,I | - %I | - %I | - %H |
| Net investment income (loss) | .58%H | 2.30% | 2.13% | 2.00%H |
| Supplemental Data | | | | |
| Net assets, end of period (000 omitted) | $130 | $101 | $113 | $110 |
| Portfolio turnover rateG | 22%H | 61% | 20% | 13%H |
A For the period June 8, 2017 (commencement of operations) to March 31, 2018.
B Calculated based on average shares outstanding during the period.
C Amount represents less than $.005 per share.
D Total distributions per share do not sum due to rounding.
E Total returns for periods of less than one year are not annualized.
F Expense ratios reflect operating expenses of the class. Expenses before reductions do not reflect amounts reimbursed, waived, or reduced through arrangements with the investment advisor, brokerage services, or other offset arrangements, if applicable, and do not represent the amount paid by the class during periods when reimbursements, waivers or reductions occur.
G Amount does not include the portfolio activity of any underlying mutual funds or exchange-traded funds (ETFs).
H Annualized
I Amount represents less than .005%.
See accompanying notes which are an integral part of the financial statements.
Fidelity Flex® Freedom Blend 2050 Fund
Investment Summary (Unaudited)
The information in the following tables is based on the direct investments of the Fund.
Top Holdings as of September 30, 2020
| | % of fund's net assets |
| Fidelity Series Large Cap Value Index Fund | 14.3 |
| Fidelity Series Emerging Markets Opportunities Fund | 14.0 |
| Fidelity Series Blue Chip Growth Fund | 11.1 |
| Fidelity Series Large Cap Stock Fund | 7.6 |
| Fidelity Series Large Cap Growth Index Fund | 7.2 |
| Fidelity Series International Growth Fund | 6.1 |
| Fidelity Series Overseas Fund | 6.1 |
| Fidelity Series International Value Fund | 6.1 |
| Fidelity Series Value Discovery Fund | 5.3 |
| Fidelity Series Small Cap Opportunities Fund | 3.6 |
| | 81.4 |
Asset Allocation (% of fund's net assets)
| Period end |
| | Domestic Equity Funds | 51.6% |
| | International Equity Funds | 40.8% |
| | Bond Funds | 6.2% |
| | Short-Term Funds | 1.4% |

Domestic Equity Funds category includes Fidelity Series Commodity Strategy Fund which invests in commodity-related investments.
Fidelity Flex® Freedom Blend 2050 Fund
Schedule of Investments September 30, 2020 (Unaudited)
Showing Percentage of Net Assets
| Domestic Equity Funds - 51.6% | | | |
| | | Shares | Value |
| Fidelity Series Blue Chip Growth Fund (a) | | 869 | $14,339 |
| Fidelity Series Commodity Strategy Fund (a) | | 786 | 3,270 |
| Fidelity Series Large Cap Growth Index Fund (a) | | 653 | 9,300 |
| Fidelity Series Large Cap Stock Fund (a) | | 698 | 9,889 |
| Fidelity Series Large Cap Value Index Fund (a) | | 1,602 | 18,587 |
| Fidelity Series Small Cap Opportunities Fund (a) | | 369 | 4,706 |
| Fidelity Series Value Discovery Fund (a) | | 549 | 6,790 |
| TOTAL DOMESTIC EQUITY FUNDS | | | |
| (Cost $65,628) | | | 66,881 |
|
| International Equity Funds - 40.8% | | | |
| Fidelity Series Canada Fund (a) | | 298 | 3,050 |
| Fidelity Series Emerging Markets Fund (a) | | 214 | 2,014 |
| Fidelity Series Emerging Markets Opportunities Fund (a) | | 863 | 18,099 |
| Fidelity Series International Growth Fund (a) | | 422 | 7,923 |
| Fidelity Series International Index Fund (a) | | 329 | 3,271 |
| Fidelity Series International Small Cap Fund (a) | | 157 | 2,791 |
| Fidelity Series International Value Fund (a) | | 912 | 7,864 |
| Fidelity Series Overseas Fund (a) | | 708 | 7,911 |
| TOTAL INTERNATIONAL EQUITY FUNDS | | | |
| (Cost $49,821) | | | 52,923 |
|
| Bond Funds - 6.2% | | | |
| Fidelity Series Emerging Markets Debt Fund (a) | | 88 | 796 |
| Fidelity Series Floating Rate High Income Fund (a) | | 20 | 176 |
| Fidelity Series High Income Fund (a) | | 97 | 883 |
| Fidelity Series Inflation-Protected Bond Index Fund (a) | | 246 | 2,630 |
| Fidelity Series International Credit Fund (a) | | 5 | 54 |
| Fidelity Series Long-Term Treasury Bond Index Fund (a) | | 290 | 2,998 |
| Fidelity Series Real Estate Income Fund (a) | | 53 | 531 |
| TOTAL BOND FUNDS | | | |
| (Cost $7,741) | | | 8,068 |
|
| Short-Term Funds - 1.4% | | | |
| Fidelity Series Government Money Market Fund 0.16% (a)(b) | | 153 | 153 |
| Fidelity Series Short-Term Credit Fund (a) | | 21 | 214 |
| Fidelity Series Treasury Bill Index Fund (a) | | 144 | 1,439 |
| TOTAL SHORT-TERM FUNDS | | | |
| (Cost $1,797) | | | 1,806 |
| TOTAL INVESTMENT IN SECURITIES - 100.0% | | | |
| (Cost $124,987) | | | 129,678 |
| NET OTHER ASSETS (LIABILITIES) - 0.0% | | | 0 |
| NET ASSETS - 100% | | | $129,678 |
Legend
(a) Affiliated Fund
(b) The rate quoted is the annualized seven-day yield of the fund at period end.
Affiliated Underlying Funds
Fiscal year to date information regarding the Fund's investments in affiliated Underlying Funds, excluding any Money Market Central Funds, is presented below. Exchanges between classes of the same affiliated Underlying Funds may occur.
| Affiliate | Value, beginning of period | Purchases | Sales Proceeds | Dividend Income | Realized Gain (loss) | Change in Unrealized appreciation (depreciation) | Value, end of period |
| Fidelity Series Blue Chip Growth Fund | $9,835 | $4,039 | $2,665 | $2,850 | $514 | $2,616 | $14,339 |
| Fidelity Series Canada Fund | 2,357 | 362 | 231 | -- | (35) | 597 | 3,050 |
| Fidelity Series Commodity Strategy Fund | 3,432 | 195 | 748 | 14 | (181) | 572 | 3,270 |
| Fidelity Series Emerging Markets Debt Fund | 698 | 20 | 8 | 20 | (2) | 88 | 796 |
| Fidelity Series Emerging Markets Fund | 1,220 | 366 | 31 | -- | (2) | 461 | 2,014 |
| Fidelity Series Emerging Markets Opportunities Fund | 11,225 | 2,802 | 254 | -- | (1) | 4,327 | 18,099 |
| Fidelity Series Floating Rate High Income Fund | 157 | 3 | -- | 4 | -- | 16 | 176 |
| Fidelity Series Government Money Market Fund 0.16% | 958 | 596 | 1,401 | 1 | -- | -- | 153 |
| Fidelity Series High Income Fund | 776 | 24 | -- | 23 | -- | 83 | 883 |
| Fidelity Series Inflation-Protected Bond Index Fund | 2,307 | 499 | 315 | 2 | -- | 139 | 2,630 |
| Fidelity Series International Credit Fund | 49 | 1 | -- | 1 | -- | 4 | 54 |
| Fidelity Series International Growth Fund | 6,837 | 553 | 1,389 | -- | 69 | 1,853 | 7,923 |
| Fidelity Series International Index Fund | 2,700 | 146 | 145 | -- | (13) | 583 | 3,271 |
| Fidelity Series International Small Cap Fund | 2,052 | 102 | 42 | -- | (3) | 682 | 2,791 |
| Fidelity Series International Value Fund | 6,541 | 521 | 581 | -- | (103) | 1,486 | 7,864 |
| Fidelity Series Large Cap Growth Index Fund | 7,400 | 461 | 1,605 | 165 | 251 | 2,793 | 9,300 |
| Fidelity Series Large Cap Stock Fund | 7,686 | 1,175 | 363 | 337 | (5) | 1,396 | 9,889 |
| Fidelity Series Large Cap Value Index Fund | 14,209 | 1,839 | 412 | -- | (49) | 3,000 | 18,587 |
| Fidelity Series Long-Term Treasury Bond Index Fund | 2,583 | 881 | 385 | 68 | 41 | (122) | 2,998 |
| Fidelity Series Overseas Fund | 6,609 | 541 | 1,121 | -- | (59) | 1,941 | 7,911 |
| Fidelity Series Real Estate Income Fund | 434 | 17 | -- | 17 | -- | 80 | 531 |
| Fidelity Series Short-Term Credit Fund | 204 | 2 | -- | 2 | -- | 8 | 214 |
| Fidelity Series Small Cap Opportunities Fund | 3,608 | 665 | 487 | 28 | (73) | 993 | 4,706 |
| Fidelity Series Treasury Bill Index Fund | 2,708 | 10 | 1,270 | 10 | (4) | (5) | 1,439 |
| Fidelity Series Value Discovery Fund | 4,499 | 1,247 | 74 | -- | 2 | 1,116 | 6,790 |
| | $101,084 | $17,067 | $13,527 | $3,542 | $347 | $24,707 | $129,678 |
Amounts in the income column in the above table include any capital gain distributions from underlying funds, which are presented in the corresponding line-item in the Statement of Operations, if applicable.
Investment Valuation
The following is a summary of the inputs used, as of September 30, 2020, involving the Fund's assets and liabilities carried at fair value. The inputs or methodology used for valuing securities may not be an indication of the risk associated with investing in those securities. For more information on valuation inputs, and their aggregation into the levels used below, please refer to the Investment Valuation section in the accompanying Notes to Financial Statements.
| | Valuation Inputs at Reporting Date: |
| Description | Total | Level 1 | Level 2 | Level 3 |
| Investments in Securities: | | | | |
| Domestic Equity Funds | $66,881 | $66,881 | $-- | $-- |
| International Equity Funds | 52,923 | 52,923 | -- | -- |
| Bond Funds | 8,068 | 8,068 | -- | -- |
| Short-Term Funds | 1,806 | 1,806 | -- | -- |
| Total Investments in Securities: | $129,678 | $129,678 | $-- | $-- |
See accompanying notes which are an integral part of the financial statements.
Fidelity Flex® Freedom Blend 2050 Fund
Financial Statements
Statement of Assets and Liabilities
| | | September 30, 2020 (Unaudited) |
| Assets | | |
Investment in securities, at value — See accompanying schedule:
| | |
| Affiliated issuers (cost $124,987) | $129,678 | |
| Total Investment in Securities (cost $124,987) | | $129,678 |
| Receivable for investments sold | | 712 |
| Total assets | | 130,390 |
| Liabilities | | |
| Payable for investments purchased | $712 | |
| Total liabilities | | 712 |
| Net Assets | | $129,678 |
| Net Assets consist of: | | |
| Paid in capital | | $121,595 |
| Total accumulated earnings (loss) | | 8,083 |
| Net Assets | | $129,678 |
| Net Asset Value, offering price and redemption price per share ($129,678 ÷ 12,173 shares) | | $10.65 |
See accompanying notes which are an integral part of the financial statements.
Statement of Operations
| | | Six months ended September 30, 2020 (Unaudited) |
| Investment Income | | |
| Dividends: | | |
| Affiliated issuers | | $354 |
| Expenses | | |
| Independent trustees' fees and expenses | $1 | |
| Total expenses | | 1 |
| Net investment income (loss) | | 353 |
| Realized and Unrealized Gain (Loss) | | |
| Net realized gain (loss) on: | | |
| Investment securities: | | |
| Affiliated issuers | 347 | |
| Capital gain distributions from underlying funds: | | |
| Affiliated issuers | 3,188 | |
| Total net realized gain (loss) | | 3,535 |
| Change in net unrealized appreciation (depreciation) on: | | |
| Investment securities: | | |
| Affiliated issuers | 24,707 | |
| Total change in net unrealized appreciation (depreciation) | | 24,707 |
| Net gain (loss) | | 28,242 |
| Net increase (decrease) in net assets resulting from operations | | $28,595 |
See accompanying notes which are an integral part of the financial statements.
Statement of Changes in Net Assets
| | Six months ended September 30, 2020 (Unaudited) | Year ended March 31, 2020 |
| Increase (Decrease) in Net Assets | | |
| Operations | | |
| Net investment income (loss) | $353 | $2,705 |
| Net realized gain (loss) | 3,535 | 2,961 |
| Change in net unrealized appreciation (depreciation) | 24,707 | (17,258) |
| Net increase (decrease) in net assets resulting from operations | 28,595 | (11,592) |
| Distributions to shareholders | (1,997) | (8,443) |
| Share transactions | | |
| Reinvestment of distributions | 1,996 | 8,443 |
| Net increase (decrease) in net assets resulting from share transactions | 1,996 | 8,443 |
| Total increase (decrease) in net assets | 28,594 | (11,592) |
| Net Assets | | |
| Beginning of period | 101,084 | 112,676 |
| End of period | $129,678 | $101,084 |
| Other Information | | |
| Shares | | |
| Sold | – | – |
| Issued in reinvestment of distributions | 218 | 830 |
| Net increase (decrease) | 218 | 830 |
See accompanying notes which are an integral part of the financial statements.
Financial Highlights
Fidelity Flex Freedom Blend 2050 Fund
| | Six months ended (Unaudited) September 30, | Years endedMarch 31, | | |
| | 2020 | 2020 | 2019 | 2018 A |
| Selected Per–Share Data | | | | |
| Net asset value, beginning of period | $8.46 | $10.13 | $10.66 | $10.00 |
| Income from Investment Operations | | | | |
| Net investment income (loss)B | .03 | .23 | .22 | .17 |
| Net realized and unrealized gain (loss) | 2.33 | (1.15) | –C | .82 |
| Total from investment operations | 2.36 | (.92) | .22 | .99 |
| Distributions from net investment income | (.01) | (.23) | (.22) | (.17) |
| Distributions from net realized gain | (.16) | (.51) | (.53) | (.16) |
| Total distributions | (.17) | (.75)D | (.75) | (.33) |
| Net asset value, end of period | $10.65 | $8.46 | $10.13 | $10.66 |
| Total ReturnE | 28.18% | (10.25)% | 2.55% | 9.89% |
| Ratios to Average Net AssetsF,G | | | | |
| Expenses before reductions | - %H,I | - %I | - %I | - %H |
| Expenses net of fee waivers, if any | - %H,I | - %I | - %I | - %H |
| Expenses net of all reductions | - %H,I | - %I | - %I | - %H |
| Net investment income (loss) | .59%H | 2.30% | 2.13% | 2.00%H |
| Supplemental Data | | | | |
| Net assets, end of period (000 omitted) | $130 | $101 | $113 | $110 |
| Portfolio turnover rateG | 23%H | 61% | 20% | 13%H |
A For the period June 8, 2017 (commencement of operations) to March 31, 2018.
B Calculated based on average shares outstanding during the period.
C Amount represents less than $.005 per share.
D Total distributions per share do not sum due to rounding.
E Total returns for periods of less than one year are not annualized.
F Expense ratios reflect operating expenses of the class. Expenses before reductions do not reflect amounts reimbursed, waived, or reduced through arrangements with the investment advisor, brokerage services, or other offset arrangements, if applicable, and do not represent the amount paid by the class during periods when reimbursements, waivers or reductions occur.
G Amount does not include the portfolio activity of any underlying mutual funds or exchange-traded funds (ETFs).
H Annualized
I Amount represents less than .005%.
See accompanying notes which are an integral part of the financial statements.
Fidelity Flex® Freedom Blend 2055 Fund
Investment Summary (Unaudited)
The information in the following tables is based on the direct investments of the Fund.
Top Holdings as of September 30, 2020
| | % of fund's net assets |
| Fidelity Series Large Cap Value Index Fund | 14.4 |
| Fidelity Series Emerging Markets Opportunities Fund | 14.0 |
| Fidelity Series Blue Chip Growth Fund | 11.1 |
| Fidelity Series Large Cap Stock Fund | 7.6 |
| Fidelity Series Large Cap Growth Index Fund | 7.2 |
| Fidelity Series International Growth Fund | 6.1 |
| Fidelity Series Overseas Fund | 6.1 |
| Fidelity Series International Value Fund | 6.1 |
| Fidelity Series Value Discovery Fund | 5.2 |
| Fidelity Series Small Cap Opportunities Fund | 3.6 |
| | 81.4 |
Asset Allocation (% of fund's net assets)
| Period end |
| | Domestic Equity Funds | 51.6% |
| | International Equity Funds | 40.8% |
| | Bond Funds | 6.2% |
| | Short-Term Funds | 1.4% |

Domestic Equity Funds category includes Fidelity Series Commodity Strategy Fund which invests in commodity-related investments.
Fidelity Flex® Freedom Blend 2055 Fund
Schedule of Investments September 30, 2020 (Unaudited)
Showing Percentage of Net Assets
| Domestic Equity Funds - 51.6% | | | |
| | | Shares | Value |
| Fidelity Series Blue Chip Growth Fund (a) | | 869 | $14,345 |
| Fidelity Series Commodity Strategy Fund (a) | | 786 | 3,271 |
| Fidelity Series Large Cap Growth Index Fund (a) | | 653 | 9,294 |
| Fidelity Series Large Cap Stock Fund (a) | | 699 | 9,894 |
| Fidelity Series Large Cap Value Index Fund (a) | | 1,613 | 18,715 |
| Fidelity Series Small Cap Opportunities Fund (a) | | 369 | 4,708 |
| Fidelity Series Value Discovery Fund (a) | | 541 | 6,683 |
| TOTAL DOMESTIC EQUITY FUNDS | | | |
| (Cost $65,709) | | | 66,910 |
|
| International Equity Funds - 40.8% | | | |
| Fidelity Series Canada Fund (a) | | 298 | 3,052 |
| Fidelity Series Emerging Markets Fund (a) | | 214 | 2,015 |
| Fidelity Series Emerging Markets Opportunities Fund (a) | | 863 | 18,107 |
| Fidelity Series International Growth Fund (a) | | 422 | 7,927 |
| Fidelity Series International Index Fund (a) | | 329 | 3,273 |
| Fidelity Series International Small Cap Fund (a) | | 157 | 2,792 |
| Fidelity Series International Value Fund (a) | | 913 | 7,868 |
| Fidelity Series Overseas Fund (a) | | 708 | 7,915 |
| TOTAL INTERNATIONAL EQUITY FUNDS | | | |
| (Cost $49,835) | | | 52,949 |
|
| Bond Funds - 6.2% | | | |
| Fidelity Series Emerging Markets Debt Fund (a) | | 88 | 796 |
| Fidelity Series Floating Rate High Income Fund (a) | | 20 | 176 |
| Fidelity Series High Income Fund (a) | | 97 | 883 |
| Fidelity Series Inflation-Protected Bond Index Fund (a) | | 246 | 2,635 |
| Fidelity Series International Credit Fund (a) | | 4 | 41 |
| Fidelity Series Long-Term Treasury Bond Index Fund (a) | | 291 | 3,003 |
| Fidelity Series Real Estate Income Fund (a) | | 53 | 530 |
| TOTAL BOND FUNDS | | | |
| (Cost $7,739) | | | 8,064 |
|
| Short-Term Funds - 1.4% | | | |
| Fidelity Series Government Money Market Fund 0.16% (a)(b) | | 151 | 151 |
| Fidelity Series Short-Term Credit Fund (a) | | 21 | 214 |
| Fidelity Series Treasury Bill Index Fund (a) | | 144 | 1,445 |
| TOTAL SHORT-TERM FUNDS | | | |
| (Cost $1,802) | | | 1,810 |
| TOTAL INVESTMENT IN SECURITIES - 100.0% | | | |
| (Cost $125,085) | | | 129,733 |
| NET OTHER ASSETS (LIABILITIES) - 0.0% | | | 0 |
| NET ASSETS - 100% | | | $129,733 |
Legend
(a) Affiliated Fund
(b) The rate quoted is the annualized seven-day yield of the fund at period end.
Affiliated Underlying Funds
Fiscal year to date information regarding the Fund's investments in affiliated Underlying Funds, excluding any Money Market Central Funds, is presented below. Exchanges between classes of the same affiliated Underlying Funds may occur.
| Affiliate | Value, beginning of period | Purchases | Sales Proceeds | Dividend Income | Realized Gain (loss) | Change in Unrealized appreciation (depreciation) | Value, end of period |
| Fidelity Series Blue Chip Growth Fund | $9,837 | $3,920 | $2,566 | $2,847 | $530 | $2,624 | $14,345 |
| Fidelity Series Canada Fund | 2,519 | 219 | 253 | -- | (45) | 612 | 3,052 |
| Fidelity Series Commodity Strategy Fund | 3,433 | 190 | 743 | 14 | (183) | 574 | 3,271 |
| Fidelity Series Emerging Markets Debt Fund | 705 | 21 | 16 | 20 | (3) | 89 | 796 |
| Fidelity Series Emerging Markets Fund | 1,221 | 379 | 45 | -- | (3) | 463 | 2,015 |
| Fidelity Series Emerging Markets Opportunities Fund | 11,230 | 2,792 | 244 | -- | (1) | 4,330 | 18,107 |
| Fidelity Series Floating Rate High Income Fund | 157 | 3 | -- | 4 | -- | 16 | 176 |
| Fidelity Series Government Money Market Fund 0.16% | 957 | 596 | 1,402 | 1 | -- | -- | 151 |
| Fidelity Series High Income Fund | 777 | 23 | -- | 23 | -- | 83 | 883 |
| Fidelity Series Inflation-Protected Bond Index Fund | 2,308 | 494 | 306 | 2 | -- | 139 | 2,635 |
| Fidelity Series International Credit Fund | 37 | 1 | -- | 1 | -- | 3 | 41 |
| Fidelity Series International Growth Fund | 6,827 | 517 | 1,337 | -- | 67 | 1,853 | 7,927 |
| Fidelity Series International Index Fund | 2,704 | 148 | 149 | -- | (12) | 582 | 3,273 |
| Fidelity Series International Small Cap Fund | 2,017 | 110 | 11 | -- | (1) | 677 | 2,792 |
| Fidelity Series International Value Fund | 6,451 | 726 | 696 | -- | (115) | 1,502 | 7,868 |
| Fidelity Series Large Cap Growth Index Fund | 7,401 | 499 | 1,652 | 165 | 255 | 2,791 | 9,294 |
| Fidelity Series Large Cap Stock Fund | 7,688 | 1,071 | 252 | 337 | (2) | 1,389 | 9,894 |
| Fidelity Series Large Cap Value Index Fund | 14,212 | 1,955 | 405 | -- | (48) | 3,001 | 18,715 |
| Fidelity Series Long-Term Treasury Bond Index Fund | 2,584 | 882 | 382 | 68 | 41 | (122) | 3,003 |
| Fidelity Series Overseas Fund | 6,598 | 474 | 1,035 | -- | (54) | 1,932 | 7,915 |
| Fidelity Series Real Estate Income Fund | 433 | 17 | -- | 17 | -- | 80 | 530 |
| Fidelity Series Short-Term Credit Fund | 204 | 2 | -- | 2 | -- | 8 | 214 |
| Fidelity Series Small Cap Opportunities Fund | 3,609 | 485 | 305 | 28 | (44) | 963 | 4,708 |
| Fidelity Series Treasury Bill Index Fund | 2,710 | 10 | 1,266 | 10 | (4) | (5) | 1,445 |
| Fidelity Series Value Discovery Fund | 4,500 | 1,100 | 31 | -- | -- | 1,114 | 6,683 |
| | $101,119 | $16,634 | $13,096 | $3,539 | $378 | $24,698 | $129,733 |
Amounts in the income column in the above table include any capital gain distributions from underlying funds, which are presented in the corresponding line-item in the Statement of Operations, if applicable.
Investment Valuation
The following is a summary of the inputs used, as of September 30, 2020, involving the Fund's assets and liabilities carried at fair value. The inputs or methodology used for valuing securities may not be an indication of the risk associated with investing in those securities. For more information on valuation inputs, and their aggregation into the levels used below, please refer to the Investment Valuation section in the accompanying Notes to Financial Statements.
| | Valuation Inputs at Reporting Date: |
| Description | Total | Level 1 | Level 2 | Level 3 |
| Investments in Securities: | | | | |
| Domestic Equity Funds | $66,910 | $66,910 | $-- | $-- |
| International Equity Funds | 52,949 | 52,949 | -- | -- |
| Bond Funds | 8,064 | 8,064 | -- | -- |
| Short-Term Funds | 1,810 | 1,810 | -- | -- |
| Total Investments in Securities: | $129,733 | $129,733 | $-- | $-- |
See accompanying notes which are an integral part of the financial statements.
Fidelity Flex® Freedom Blend 2055 Fund
Financial Statements
Statement of Assets and Liabilities
| | | September 30, 2020 (Unaudited) |
| Assets | | |
Investment in securities, at value — See accompanying schedule:
| | |
| Affiliated issuers (cost $125,085) | $129,733 | |
| Total Investment in Securities (cost $125,085) | | $129,733 |
| Receivable for investments sold | | 697 |
| Total assets | | 130,430 |
| Liabilities | | |
| Payable for investments purchased | $697 | |
| Total liabilities | | 697 |
| Net Assets | | $129,733 |
| Net Assets consist of: | | |
| Paid in capital | | $121,680 |
| Total accumulated earnings (loss) | | 8,053 |
| Net Assets | | $129,733 |
| Net Asset Value, offering price and redemption price per share ($129,733 ÷ 12,182 shares) | | $10.65 |
See accompanying notes which are an integral part of the financial statements.
Statement of Operations
| | | Six months ended September 30, 2020 (Unaudited) |
| Investment Income | | |
| Dividends: | | |
| Affiliated issuers | | $352 |
| Expenses | | |
| Independent trustees' fees and expenses | $1 | |
| Total expenses | | 1 |
| Net investment income (loss) | | 351 |
| Realized and Unrealized Gain (Loss) | | |
| Net realized gain (loss) on: | | |
| Investment securities: | | |
| Affiliated issuers | 378 | |
| Capital gain distributions from underlying funds: | | |
| Affiliated issuers | 3,187 | |
| Total net realized gain (loss) | | 3,565 |
| Change in net unrealized appreciation (depreciation) on: | | |
| Investment securities: | | |
| Affiliated issuers | 24,698 | |
| Total change in net unrealized appreciation (depreciation) | | 24,698 |
| Net gain (loss) | | 28,263 |
| Net increase (decrease) in net assets resulting from operations | | $28,614 |
See accompanying notes which are an integral part of the financial statements.
Statement of Changes in Net Assets
| | Six months ended September 30, 2020 (Unaudited) | Year ended March 31, 2020 |
| Increase (Decrease) in Net Assets | | |
| Operations | | |
| Net investment income (loss) | $351 | $2,705 |
| Net realized gain (loss) | 3,565 | 3,006 |
| Change in net unrealized appreciation (depreciation) | 24,698 | (17,283) |
| Net increase (decrease) in net assets resulting from operations | 28,614 | (11,572) |
| Distributions to shareholders | (2,045) | (8,457) |
| Share transactions | | |
| Reinvestment of distributions | 2,045 | 8,457 |
| Net increase (decrease) in net assets resulting from share transactions | 2,045 | 8,457 |
| Total increase (decrease) in net assets | 28,614 | (11,572) |
| Net Assets | | |
| Beginning of period | 101,119 | 112,691 |
| End of period | $129,733 | $101,119 |
| Other Information | | |
| Shares | | |
| Sold | – | – |
| Issued in reinvestment of distributions | 223 | 832 |
| Net increase (decrease) | 223 | 832 |
See accompanying notes which are an integral part of the financial statements.
Financial Highlights
Fidelity Flex Freedom Blend 2055 Fund
| | Six months ended (Unaudited) September 30, | Years endedMarch 31, | | |
| | 2020 | 2020 | 2019 | 2018 A |
| Selected Per–Share Data | | | | |
| Net asset value, beginning of period | $8.46 | $10.13 | $10.66 | $10.00 |
| Income from Investment Operations | | | | |
| Net investment income (loss)B | .03 | .23 | .22 | .17 |
| Net realized and unrealized gain (loss) | 2.33 | (1.15) | –C | .82 |
| Total from investment operations | 2.36 | (.92) | .22 | .99 |
| Distributions from net investment income | (.01) | (.24) | (.22) | (.17) |
| Distributions from net realized gain | (.17) | (.51) | (.53) | (.17) |
| Total distributions | (.17)D | (.75) | (.75) | (.33)D |
| Net asset value, end of period | $10.65 | $8.46 | $10.13 | $10.66 |
| Total ReturnE | 28.24% | (10.24)% | 2.56% | 9.90% |
| Ratios to Average Net AssetsF,G | | | | |
| Expenses before reductions | - %H,I | - %I | - %I | - %H |
| Expenses net of fee waivers, if any | - %H,I | - %I | - %I | - %H |
| Expenses net of all reductions | - %H,I | - %I | - %I | - %H |
| Net investment income (loss) | .58%H | 2.30% | 2.13% | 2.00%H |
| Supplemental Data | | | | |
| Net assets, end of period (000 omitted) | $130 | $101 | $113 | $110 |
| Portfolio turnover rateG | 22%H | 61% | 20% | 13%H |
A For the period June 8, 2017 (commencement of operations) to March 31, 2018.
B Calculated based on average shares outstanding during the period.
C Amount represents less than $.005 per share.
D Total distributions per share do not sum due to rounding.
E Total returns for periods of less than one year are not annualized.
F Expense ratios reflect operating expenses of the class. Expenses before reductions do not reflect amounts reimbursed, waived, or reduced through arrangements with the investment advisor, brokerage services, or other offset arrangements, if applicable, and do not represent the amount paid by the class during periods when reimbursements, waivers or reductions occur.
G Amount does not include the portfolio activity of any underlying mutual funds or exchange-traded funds (ETFs).
H Annualized
I Amount represents less than .005%.
See accompanying notes which are an integral part of the financial statements.
Fidelity Flex® Freedom Blend 2060 Fund
Investment Summary (Unaudited)
The information in the following tables is based on the direct investments of the Fund.
Top Holdings as of September 30, 2020
| | % of fund's net assets |
| Fidelity Series Large Cap Value Index Fund | 14.4 |
| Fidelity Series Emerging Markets Opportunities Fund | 14.0 |
| Fidelity Series Blue Chip Growth Fund | 11.1 |
| Fidelity Series Large Cap Stock Fund | 7.6 |
| Fidelity Series Large Cap Growth Index Fund | 7.2 |
| Fidelity Series International Growth Fund | 6.1 |
| Fidelity Series Overseas Fund | 6.1 |
| Fidelity Series International Value Fund | 6.1 |
| Fidelity Series Value Discovery Fund | 5.2 |
| Fidelity Series Small Cap Opportunities Fund | 3.6 |
| | 81.4 |
Asset Allocation (% of fund's net assets)
| Period end |
| | Domestic Equity Funds | 51.6% |
| | International Equity Funds | 40.8% |
| | Bond Funds | 6.2% |
| | Short-Term Funds | 1.4% |

Domestic Equity Funds category includes Fidelity Series Commodity Strategy Fund which invests in commodity-related investments.
Fidelity Flex® Freedom Blend 2060 Fund
Schedule of Investments September 30, 2020 (Unaudited)
Showing Percentage of Net Assets
| Domestic Equity Funds - 51.6% | | | |
| | | Shares | Value |
| Fidelity Series Blue Chip Growth Fund (a) | | 869 | $14,344 |
| Fidelity Series Commodity Strategy Fund (a) | | 786 | 3,271 |
| Fidelity Series Large Cap Growth Index Fund (a) | | 653 | 9,293 |
| Fidelity Series Large Cap Stock Fund (a) | | 699 | 9,892 |
| Fidelity Series Large Cap Value Index Fund (a) | | 1,613 | 18,710 |
| Fidelity Series Small Cap Opportunities Fund (a) | | 369 | 4,708 |
| Fidelity Series Value Discovery Fund (a) | | 541 | 6,683 |
| TOTAL DOMESTIC EQUITY FUNDS | | | |
| (Cost $65,668) | | | 66,901 |
|
| International Equity Funds - 40.8% | | | |
| Fidelity Series Canada Fund (a) | | 298 | 3,052 |
| Fidelity Series Emerging Markets Fund (a) | | 214 | 2,015 |
| Fidelity Series Emerging Markets Opportunities Fund (a) | | 863 | 18,105 |
| Fidelity Series International Growth Fund (a) | | 422 | 7,926 |
| Fidelity Series International Index Fund (a) | | 329 | 3,273 |
| Fidelity Series International Small Cap Fund (a) | | 157 | 2,792 |
| Fidelity Series International Value Fund (a) | | 913 | 7,867 |
| Fidelity Series Overseas Fund (a) | | 708 | 7,914 |
| TOTAL INTERNATIONAL EQUITY FUNDS | | | |
| (Cost $49,899) | | | 52,944 |
|
| Bond Funds - 6.2% | | | |
| Fidelity Series Emerging Markets Debt Fund (a) | | 88 | 796 |
| Fidelity Series Floating Rate High Income Fund (a) | | 20 | 176 |
| Fidelity Series High Income Fund (a) | | 97 | 883 |
| Fidelity Series Inflation-Protected Bond Index Fund (a) | | 246 | 2,635 |
| Fidelity Series International Credit Fund (a) | | 4 | 41 |
| Fidelity Series Long-Term Treasury Bond Index Fund (a) | | 291 | 3,002 |
| Fidelity Series Real Estate Income Fund (a) | | 53 | 530 |
| TOTAL BOND FUNDS | | | |
| (Cost $7,737) | | | 8,063 |
|
| Short-Term Funds - 1.4% | | | |
| Fidelity Series Government Money Market Fund 0.16% (a)(b) | | 153 | 153 |
| Fidelity Series Short-Term Credit Fund (a) | | 21 | 215 |
| Fidelity Series Treasury Bill Index Fund (a) | | 144 | 1,443 |
| TOTAL SHORT-TERM FUNDS | | | |
| (Cost $1,802) | | | 1,811 |
| TOTAL INVESTMENT IN SECURITIES - 100.0% | | | |
| (Cost $125,106) | | | 129,719 |
| NET OTHER ASSETS (LIABILITIES) - 0.0% | | | 0 |
| NET ASSETS - 100% | | | $129,719 |
Legend
(a) Affiliated Fund
(b) The rate quoted is the annualized seven-day yield of the fund at period end.
Affiliated Underlying Funds
Fiscal year to date information regarding the Fund's investments in affiliated Underlying Funds, excluding any Money Market Central Funds, is presented below. Exchanges between classes of the same affiliated Underlying Funds may occur.
| Affiliate | Value, beginning of period | Purchases | Sales Proceeds | Dividend Income | Realized Gain (loss) | Change in Unrealized appreciation (depreciation) | Value, end of period |
| Fidelity Series Blue Chip Growth Fund | $9,838 | $4,114 | $2,747 | $2,850 | $522 | $2,617 | $14,344 |
| Fidelity Series Canada Fund | 2,457 | 233 | 201 | -- | (25) | 588 | 3,052 |
| Fidelity Series Commodity Strategy Fund | 3,433 | 192 | 744 | 14 | (170) | 560 | 3,271 |
| Fidelity Series Emerging Markets Debt Fund | 705 | 21 | 16 | 20 | (3) | 89 | 796 |
| Fidelity Series Emerging Markets Fund | 1,221 | 379 | 45 | -- | (3) | 463 | 2,015 |
| Fidelity Series Emerging Markets Opportunities Fund | 11,231 | 2,791 | 244 | -- | -- | 4,327 | 18,105 |
| Fidelity Series Floating Rate High Income Fund | 157 | 3 | -- | 4 | -- | 16 | 176 |
| Fidelity Series Government Money Market Fund 0.16% | 956 | 600 | 1,403 | 1 | -- | -- | 153 |
| Fidelity Series High Income Fund | 777 | 23 | -- | 23 | -- | 83 | 883 |
| Fidelity Series Inflation-Protected Bond Index Fund | 2,308 | 493 | 306 | 2 | -- | 140 | 2,635 |
| Fidelity Series International Credit Fund | 37 | 1 | -- | 1 | -- | 3 | 41 |
| Fidelity Series International Growth Fund | 6,825 | 361 | 1,192 | -- | 80 | 1,852 | 7,926 |
| Fidelity Series International Index Fund | 2,704 | 147 | 148 | -- | (11) | 581 | 3,273 |
| Fidelity Series International Small Cap Fund | 2,017 | 116 | 17 | -- | (1) | 677 | 2,792 |
| Fidelity Series International Value Fund | 6,511 | 549 | 570 | -- | (68) | 1,445 | 7,867 |
| Fidelity Series Large Cap Growth Index Fund | 7,402 | 387 | 1,538 | 165 | 251 | 2,791 | 9,293 |
| Fidelity Series Large Cap Stock Fund | 7,689 | 1,166 | 354 | 337 | (5) | 1,396 | 9,892 |
| Fidelity Series Large Cap Value Index Fund | 14,214 | 1,950 | 406 | -- | (47) | 2,999 | 18,710 |
| Fidelity Series Long-Term Treasury Bond Index Fund | 2,584 | 880 | 382 | 68 | 42 | (122) | 3,002 |
| Fidelity Series Overseas Fund | 6,598 | 574 | 1,132 | -- | (53) | 1,927 | 7,914 |
| Fidelity Series Real Estate Income Fund | 433 | 17 | -- | 17 | -- | 80 | 530 |
| Fidelity Series Short-Term Credit Fund | 205 | 2 | -- | 2 | -- | 8 | 215 |
| Fidelity Series Small Cap Opportunities Fund | 3,610 | 665 | 487 | 28 | (74) | 994 | 4,708 |
| Fidelity Series Treasury Bill Index Fund | 2,710 | 10 | 1,268 | 10 | (4) | (5) | 1,443 |
| Fidelity Series Value Discovery Fund | 4,500 | 1,139 | 73 | -- | 2 | 1,115 | 6,683 |
| | $101,122 | $16,813 | $13,273 | $3,542 | $433 | $24,624 | $129,719 |
Amounts in the income column in the above table include any capital gain distributions from underlying funds, which are presented in the corresponding line-item in the Statement of Operations, if applicable.
Investment Valuation
The following is a summary of the inputs used, as of September 30, 2020, involving the Fund's assets and liabilities carried at fair value. The inputs or methodology used for valuing securities may not be an indication of the risk associated with investing in those securities. For more information on valuation inputs, and their aggregation into the levels used below, please refer to the Investment Valuation section in the accompanying Notes to Financial Statements.
| | Valuation Inputs at Reporting Date: |
| Description | Total | Level 1 | Level 2 | Level 3 |
| Investments in Securities: | | | | |
| Domestic Equity Funds | $66,901 | $66,901 | $-- | $-- |
| International Equity Funds | 52,944 | 52,944 | -- | -- |
| Bond Funds | 8,063 | 8,063 | -- | -- |
| Short-Term Funds | 1,811 | 1,811 | -- | -- |
| Total Investments in Securities: | $129,719 | $129,719 | $-- | $-- |
See accompanying notes which are an integral part of the financial statements.
Fidelity Flex® Freedom Blend 2060 Fund
Financial Statements
Statement of Assets and Liabilities
| | | September 30, 2020 (Unaudited) |
| Assets | | |
Investment in securities, at value — See accompanying schedule:
| | |
| Affiliated issuers (cost $125,106) | $129,719 | |
| Total Investment in Securities (cost $125,106) | | $129,719 |
| Receivable for investments sold | | 697 |
| Total assets | | 130,416 |
| Liabilities | | |
| Payable for investments purchased | $697 | |
| Total liabilities | | 697 |
| Net Assets | | $129,719 |
| Net Assets consist of: | | |
| Paid in capital | | $121,665 |
| Total accumulated earnings (loss) | | 8,054 |
| Net Assets | | $129,719 |
| Net Asset Value, offering price and redemption price per share ($129,719 ÷ 12,182 shares) | | $10.65 |
See accompanying notes which are an integral part of the financial statements.
Statement of Operations
| | | Six months ended September 30, 2020 (Unaudited) |
| Investment Income | | |
| Dividends: | | |
| Affiliated issuers | | $355 |
| Expenses | | |
| Independent trustees' fees and expenses | $1 | |
| Total expenses | | 1 |
| Net investment income (loss) | | 354 |
| Realized and Unrealized Gain (Loss) | | |
| Net realized gain (loss) on: | | |
| Investment securities: | | |
| Affiliated issuers | 433 | |
| Capital gain distributions from underlying funds: | | |
| Affiliated issuers | 3,187 | |
| Total net realized gain (loss) | | 3,620 |
| Change in net unrealized appreciation (depreciation) on: | | |
| Investment securities: | | |
| Affiliated issuers | 24,624 | |
| Total change in net unrealized appreciation (depreciation) | | 24,624 |
| Net gain (loss) | | 28,244 |
| Net increase (decrease) in net assets resulting from operations | | $28,598 |
See accompanying notes which are an integral part of the financial statements.
Statement of Changes in Net Assets
| | Six months ended September 30, 2020 (Unaudited) | Year ended March 31, 2020 |
| Increase (Decrease) in Net Assets | | |
| Operations | | |
| Net investment income (loss) | $354 | $2,709 |
| Net realized gain (loss) | 3,620 | 2,987 |
| Change in net unrealized appreciation (depreciation) | 24,624 | (17,258) |
| Net increase (decrease) in net assets resulting from operations | 28,598 | (11,562) |
| Distributions to shareholders | (2,057) | (8,455) |
| Share transactions | | |
| Reinvestment of distributions | 2,056 | 8,455 |
| Net increase (decrease) in net assets resulting from share transactions | 2,056 | 8,455 |
| Total increase (decrease) in net assets | 28,597 | (11,562) |
| Net Assets | | |
| Beginning of period | 101,122 | 112,684 |
| End of period | $129,719 | $101,122 |
| Other Information | | |
| Shares | | |
| Sold | – | – |
| Issued in reinvestment of distributions | 225 | 832 |
| Net increase (decrease) | 225 | 832 |
See accompanying notes which are an integral part of the financial statements.
Financial Highlights
Fidelity Flex Freedom Blend 2060 Fund
| | Six months ended (Unaudited) September 30, | Years endedMarch 31, | | |
| | 2020 | 2020 | 2019 | 2018 A |
| Selected Per–Share Data | | | | |
| Net asset value, beginning of period | $8.46 | $10.13 | $10.66 | $10.00 |
| Income from Investment Operations | | | | |
| Net investment income (loss)B | .03 | .23 | .22 | .17 |
| Net realized and unrealized gain (loss) | 2.33 | (1.15) | –C | .82 |
| Total from investment operations | 2.36 | (.92) | .22 | .99 |
| Distributions from net investment income | (.01) | (.24) | (.22) | (.17) |
| Distributions from net realized gain | (.17) | (.51) | (.53) | (.17) |
| Total distributions | (.17)D | (.75) | (.75) | (.33)D |
| Net asset value, end of period | $10.65 | $8.46 | $10.13 | $10.66 |
| Total ReturnE | 28.25% | (10.24)% | 2.55% | 9.89% |
| Ratios to Average Net AssetsF,G | | | | |
| Expenses before reductions | - %H,I | - %I | - %I | - %H |
| Expenses net of fee waivers, if any | - %H,I | - %I | - %I | - %H |
| Expenses net of all reductions | - %H,I | - %I | - %I | - %H |
| Net investment income (loss) | .59%H | 2.30% | 2.13% | 2.00%H |
| Supplemental Data | | | | |
| Net assets, end of period (000 omitted) | $130 | $101 | $113 | $110 |
| Portfolio turnover rateG | 22%H | 62% | 20% | 13%H |
A For the period June 8, 2017 (commencement of operations) to March 31, 2018.
B Calculated based on average shares outstanding during the period.
C Amount represents less than $.005 per share.
D Total distributions per share do not sum due to rounding.
E Total returns for periods of less than one year are not annualized.
F Expense ratios reflect operating expenses of the class. Expenses before reductions do not reflect amounts reimbursed, waived, or reduced through arrangements with the investment advisor, brokerage services, or other offset arrangements, if applicable, and do not represent the amount paid by the class during periods when reimbursements, waivers or reductions occur.
G Amount does not include the portfolio activity of any underlying mutual funds or exchange-traded funds (ETFs).
H Annualized
I Amount represents less than .005%.
See accompanying notes which are an integral part of the financial statements.
Fidelity Flex® Freedom Blend 2065 Fund
Investment Summary (Unaudited)
The information in the following tables is based on the direct investments of the Fund.
Top Holdings as of September 30, 2020
| | % of fund's net assets |
| Fidelity Series Large Cap Value Index Fund | 14.4 |
| Fidelity Series Emerging Markets Opportunities Fund | 14.0 |
| Fidelity Series Blue Chip Growth Fund | 11.1 |
| Fidelity Series Large Cap Stock Fund | 7.6 |
| Fidelity Series Large Cap Growth Index Fund | 7.2 |
| Fidelity Series International Growth Fund | 6.1 |
| Fidelity Series Overseas Fund | 6.1 |
| Fidelity Series International Value Fund | 6.1 |
| Fidelity Series Value Discovery Fund | 5.2 |
| Fidelity Series Small Cap Opportunities Fund | 3.6 |
| | 81.4 |
Asset Allocation (% of fund's net assets)
| Period end |
| | Domestic Equity Funds | 51.6% |
| | International Equity Funds | 40.8% |
| | Bond Funds | 6.2% |
| | Short-Term Funds | 1.4% |

Domestic Equity Funds category includes Fidelity Series Commodity Strategy Fund which invests in commodity-related investments.
Fidelity Flex® Freedom Blend 2065 Fund
Schedule of Investments September 30, 2020 (Unaudited)
Showing Percentage of Net Assets
| Domestic Equity Funds - 51.6% | | | |
| | | Shares | Value |
| Fidelity Series Blue Chip Growth Fund (a) | | 746 | $12,324 |
| Fidelity Series Commodity Strategy Fund (a) | | 676 | 2,810 |
| Fidelity Series Large Cap Growth Index Fund (a) | | 561 | 7,984 |
| Fidelity Series Large Cap Stock Fund (a) | | 600 | 8,500 |
| Fidelity Series Large Cap Value Index Fund (a) | | 1,386 | 16,077 |
| Fidelity Series Small Cap Opportunities Fund (a) | | 317 | 4,045 |
| Fidelity Series Value Discovery Fund (a) | | 465 | 5,742 |
| TOTAL DOMESTIC EQUITY FUNDS | | | |
| (Cost $56,520) | | | 57,482 |
|
| International Equity Funds - 40.8% | | | |
| Fidelity Series Canada Fund (a) | | 256 | 2,622 |
| Fidelity Series Emerging Markets Fund (a) | | 184 | 1,731 |
| Fidelity Series Emerging Markets Opportunities Fund (a) | | 741 | 15,556 |
| Fidelity Series International Growth Fund (a) | | 363 | 6,810 |
| Fidelity Series International Index Fund (a) | | 283 | 2,812 |
| Fidelity Series International Small Cap Fund (a) | | 135 | 2,399 |
| Fidelity Series International Value Fund (a) | | 784 | 6,759 |
| Fidelity Series Overseas Fund (a) | | 608 | 6,800 |
| TOTAL INTERNATIONAL EQUITY FUNDS | | | |
| (Cost $42,812) | | | 45,489 |
|
| Bond Funds - 6.2% | | | |
| Fidelity Series Emerging Markets Debt Fund (a) | | 75 | 684 |
| Fidelity Series Floating Rate High Income Fund (a) | | 17 | 152 |
| Fidelity Series High Income Fund (a) | | 83 | 759 |
| Fidelity Series Inflation-Protected Bond Index Fund (a) | | 212 | 2,263 |
| Fidelity Series International Credit Fund (a) | | 3 | 33 |
| Fidelity Series Long-Term Treasury Bond Index Fund (a) | | 250 | 2,579 |
| Fidelity Series Real Estate Income Fund (a) | | 46 | 459 |
| TOTAL BOND FUNDS | | | |
| (Cost $6,722) | | | 6,929 |
|
| Short-Term Funds - 1.4% | | | |
| Fidelity Cash Central Fund 0.10% (b) | | 19 | 19 |
| Fidelity Series Government Money Market Fund 0.16% (a)(c) | | 131 | 131 |
| Fidelity Series Short-Term Credit Fund (a) | | 18 | 184 |
| Fidelity Series Treasury Bill Index Fund (a) | | 124 | 1,240 |
| TOTAL SHORT-TERM FUNDS | | | |
| (Cost $1,570) | | | 1,574 |
| TOTAL INVESTMENT IN SECURITIES - 100.0% | | | |
| (Cost $107,624) | | | 111,474 |
| NET OTHER ASSETS (LIABILITIES) - 0.0% | | | 0 |
| NET ASSETS - 100% | | | $111,474 |
Legend
(a) Affiliated Fund
(b) Affiliated fund that is generally available only to investment companies and other accounts managed by Fidelity Investments. The rate quoted is the annualized seven-day yield of the fund at period end. A complete unaudited listing of the fund's holdings as of its most recent quarter end is available upon request. In addition, each Fidelity Central Fund's financial statements are available on the SEC's website or upon request.
(c) The rate quoted is the annualized seven-day yield of the fund at period end.
Affiliated Underlying Funds
Fiscal year to date information regarding the Fund's investments in affiliated Underlying Funds, excluding any Money Market Central Funds, is presented below. Exchanges between classes of the same affiliated Underlying Funds may occur.
| Affiliate | Value, beginning of period | Purchases | Sales Proceeds | Dividend Income | Realized Gain (loss) | Change in Unrealized appreciation (depreciation) | Value, end of period |
| Fidelity Series Blue Chip Growth Fund | $8,452 | $3,330 | $2,163 | $2,447 | $352 | $2,353 | $12,324 |
| Fidelity Series Canada Fund | 2,017 | 321 | 197 | -- | (41) | 522 | 2,622 |
| Fidelity Series Commodity Strategy Fund | 2,950 | 163 | 639 | 12 | (135) | 471 | 2,810 |
| Fidelity Series Emerging Markets Debt Fund | 603 | 18 | 11 | 17 | (2) | 76 | 684 |
| Fidelity Series Emerging Markets Fund | 1,048 | 327 | 39 | -- | (1) | 396 | 1,731 |
| Fidelity Series Emerging Markets Opportunities Fund | 9,645 | 2,403 | 209 | -- | (7) | 3,724 | 15,556 |
| Fidelity Series Floating Rate High Income Fund | 135 | 3 | -- | 3 | -- | 14 | 152 |
| Fidelity Series Government Money Market Fund 0.16% | 823 | 515 | 1,207 | 1 | -- | -- | 131 |
| Fidelity Series High Income Fund | 667 | 20 | -- | 20 | -- | 72 | 759 |
| Fidelity Series Inflation-Protected Bond Index Fund | 1,983 | 422 | 262 | 1 | -- | 120 | 2,263 |
| Fidelity Series International Credit Fund | 30 | -- | -- | -- | -- | 3 | 33 |
| Fidelity Series International Growth Fund | 5,875 | 460 | 1,174 | -- | 12 | 1,637 | 6,810 |
| Fidelity Series International Index Fund | 2,319 | 127 | 124 | -- | (10) | 500 | 2,812 |
| Fidelity Series International Small Cap Fund | 1,735 | 97 | 14 | -- | -- | 581 | 2,399 |
| Fidelity Series International Value Fund | 5,654 | 511 | 601 | -- | (85) | 1,280 | 6,759 |
| Fidelity Series Large Cap Growth Index Fund | 6,359 | 405 | 1,398 | 142 | 220 | 2,398 | 7,984 |
| Fidelity Series Large Cap Stock Fund | 6,606 | 1,011 | 312 | 290 | (5) | 1,200 | 8,500 |
| Fidelity Series Large Cap Value Index Fund | 12,214 | 1,671 | 345 | -- | (39) | 2,576 | 16,077 |
| Fidelity Series Long-Term Treasury Bond Index Fund | 2,220 | 758 | 329 | 59 | 23 | (93) | 2,579 |
| Fidelity Series Overseas Fund | 5,690 | 456 | 964 | -- | (52) | 1,670 | 6,800 |
| Fidelity Series Real Estate Income Fund | 375 | 14 | -- | 14 | -- | 70 | 459 |
| Fidelity Series Short-Term Credit Fund | 175 | 2 | -- | 2 | -- | 7 | 184 |
| Fidelity Series Small Cap Opportunities Fund | 3,104 | 413 | 261 | 24 | (49) | 838 | 4,045 |
| Fidelity Series Treasury Bill Index Fund | 2,327 | 9 | 1,088 | 8 | (3) | (5) | 1,240 |
| Fidelity Series Value Discovery Fund | 3,866 | 946 | 26 | -- | (1) | 957 | 5,742 |
| | $86,872 | $14,402 | $11,363 | $3,040 | $177 | $21,367 | $111,455 |
Amounts in the income column in the above table include any capital gain distributions from underlying funds, which are presented in the corresponding line-item in the Statement of Operations, if applicable.
Investment Valuation
The following is a summary of the inputs used, as of September 30, 2020, involving the Fund's assets and liabilities carried at fair value. The inputs or methodology used for valuing securities may not be an indication of the risk associated with investing in those securities. For more information on valuation inputs, and their aggregation into the levels used below, please refer to the Investment Valuation section in the accompanying Notes to Financial Statements.
| | Valuation Inputs at Reporting Date: |
| Description | Total | Level 1 | Level 2 | Level 3 |
| Investments in Securities: | | | | |
| Domestic Equity Funds | $57,482 | $57,482 | $-- | $-- |
| International Equity Funds | 45,489 | 45,489 | -- | -- |
| Bond Funds | 6,929 | 6,929 | -- | -- |
| Short-Term Funds | 1,574 | 1,574 | -- | -- |
| Total Investments in Securities: | $111,474 | $111,474 | $-- | $-- |
See accompanying notes which are an integral part of the financial statements.
Fidelity Flex® Freedom Blend 2065 Fund
Financial Statements
Statement of Assets and Liabilities
| | | September 30, 2020 (Unaudited) |
| Assets | | |
Investment in securities, at value — See accompanying schedule:
| | |
| Fidelity Central Funds (cost $19) | $19 | |
| Other affiliated issuers (cost $107,605) | 111,455 | |
| Total Investment in Securities (cost $107,624) | | $111,474 |
| Receivable for investments sold | | 600 |
| Total assets | | 112,074 |
| Liabilities | | |
| Payable for investments purchased | $600 | |
| Total liabilities | | 600 |
| Net Assets | | $111,474 |
| Net Assets consist of: | | |
| Paid in capital | | $104,784 |
| Total accumulated earnings (loss) | | 6,690 |
| Net Assets | | $111,474 |
| Net Asset Value, offering price and redemption price per share ($111,474 ÷ 10,473 shares) | | $10.64 |
See accompanying notes which are an integral part of the financial statements.
Statement of Operations
| | | Six months ended September 30, 2020 (Unaudited) |
| Investment Income | | |
| Dividends: | | |
| Affiliated issuers | | $302 |
| Expenses | | |
| Independent trustees' fees and expenses | $1 | |
| Total expenses | | 1 |
| Net investment income (loss) | | 301 |
| Realized and Unrealized Gain (Loss) | | |
| Net realized gain (loss) on: | | |
| Investment securities: | | |
| Affiliated issuers | 177 | |
| Capital gain distributions from underlying funds: | | |
| Affiliated issuers | 2,738 | |
| Total net realized gain (loss) | | 2,915 |
| Change in net unrealized appreciation (depreciation) on: | | |
| Investment securities: | | |
| Affiliated issuers | 21,367 | |
| Total change in net unrealized appreciation (depreciation) | | 21,367 |
| Net gain (loss) | | 24,282 |
| Net increase (decrease) in net assets resulting from operations | | $24,583 |
See accompanying notes which are an integral part of the financial statements.
Statement of Changes in Net Assets
| | Six months ended September 30, 2020 (Unaudited) | For the period
June 28, 2019 (commencement of operations) to March 31, 2020 |
| Increase (Decrease) in Net Assets | | |
| Operations | | |
| Net investment income (loss) | $301 | $2,211 |
| Net realized gain (loss) | 2,915 | 2,197 |
| Change in net unrealized appreciation (depreciation) | 21,367 | (17,517) |
| Net increase (decrease) in net assets resulting from operations | 24,583 | (13,109) |
| Distributions to shareholders | (1,404) | (3,380) |
| Share transactions | | |
| Proceeds from sales of shares | – | 100,000 |
| Reinvestment of distributions | 1,404 | 3,380 |
| Net increase (decrease) in net assets resulting from share transactions | 1,404 | 103,380 |
| Total increase (decrease) in net assets | 24,583 | 86,891 |
| Net Assets | | |
| Beginning of period | 86,891 | – |
| End of period | $111,474 | $86,891 |
| Other Information | | |
| Shares | | |
| Sold | – | 10,000 |
| Issued in reinvestment of distributions | 153 | 320 |
| Net increase (decrease) | 153 | 10,320 |
See accompanying notes which are an integral part of the financial statements.
Financial Highlights
Fidelity Flex Freedom Blend 2065 Fund
| | Six months ended (Unaudited) September 30, | Years endedMarch 31, |
| | 2020 | 2020 A |
| Selected Per–Share Data | | |
| Net asset value, beginning of period | $8.42 | $10.00 |
| Income from Investment Operations | | |
| Net investment income (loss)B | .03 | .22 |
| Net realized and unrealized gain (loss) | 2.33 | (1.46) |
| Total from investment operations | 2.36 | (1.24) |
| Distributions from net investment income | (.01) | (.22) |
| Distributions from net realized gain | (.13) | (.12) |
| Total distributions | (.14) | (.34) |
| Net asset value, end of period | $10.64 | $8.42 |
| Total ReturnC | 28.24% | (13.10)% |
| Ratios to Average Net AssetsD,E | | |
| Expenses before reductionsF | - %G | - %G |
| Expenses net of fee waivers, if anyF | - %G | - %G |
| Expenses net of all reductionsF | - %G | - %G |
| Net investment income (loss) | .58%G | 2.88%G |
| Supplemental Data | | |
| Net assets, end of period (000 omitted) | $111 | $87 |
| Portfolio turnover rateE | 22%G | 208%G |
A For the period June 28, 2019 (commencement of operations) to March 31, 2020.
B Calculated based on average shares outstanding during the period.
C Total returns for periods of less than one year are not annualized.
D Expense ratios reflect operating expenses of the class. Expenses before reductions do not reflect amounts reimbursed, waived, or reduced through arrangements with the investment advisor, brokerage services, or other offset arrangements, if applicable, and do not represent the amount paid by the class during periods when reimbursements, waivers or reductions occur.
E Amount does not include the portfolio activity of any underlying mutual funds or exchange-traded funds (ETFs).
F Amount represents less than .005%.
G Annualized
See accompanying notes which are an integral part of the financial statements.
Notes to Financial Statements (Unaudited)
For the period ended September 30, 2020
1. Organization.
Fidelity Flex Freedom Blend Income Fund, Fidelity Flex Freedom Blend 2005 Fund, Fidelity Flex Freedom Blend 2010 Fund, Fidelity Flex Freedom Blend 2015 Fund, Fidelity Flex Freedom Blend 2020 Fund, Fidelity Flex Freedom Blend 2025 Fund, Fidelity Flex Freedom Blend 2030 Fund, Fidelity Flex Freedom Blend 2035 Fund, Fidelity Flex Freedom Blend 2040 Fund, Fidelity Flex Freedom Blend 2045 Fund, Fidelity Flex Freedom Blend 2050 Fund, Fidelity Flex Freedom Blend 2055 Fund, Fidelity Flex Freedom Blend 2060 Fund and Fidelity Flex Freedom Blend 2065 Fund (the Funds) are funds of Fidelity Aberdeen Street Trust (the Trust). The Trust is registered under the Investment Company Act of 1940, as amended (the 1940 Act), as an open-end management investment company organized as a Delaware statutory trust. Each Fund is authorized to issue an unlimited number of shares. The Funds are available only to certain fee-based accounts and advisory programs offered by Fidelity. Share transactions on the Statement of Changes in Net Assets may contain exchanges between affiliated funds.
2. Investments in Fidelity Central Funds.
The Funds may invest in Fidelity Central Funds, which are open-end investment companies generally available only to other investment companies and accounts managed by the investment adviser and its affiliates. The Funds' Schedules of Investments list each of the Fidelity Central Funds held as of period end, if any, as an investment of each Fund, but do not include the underlying holdings of each Fidelity Central Fund. As an Investing Fund, each Fund indirectly bears its proportionate share of the expenses of the underlying Fidelity Central Funds.
The Money Market Central Funds seek preservation of capital and current income and are managed by the investment adviser. Annualized expenses of the Money Market Central Funds as of their most recent shareholder report date ranged from less than .005% to .01%.
A complete unaudited list of holdings for each Fidelity Central Fund is available upon request or at the Securities and Exchange Commission (the SEC) website at www.sec.gov. In addition, the financial statements of the Fidelity Central Funds are available on the SEC website or upon request.
3. Significant Accounting Policies.
Each Fund is an investment company and applies the accounting and reporting guidance of the Financial Accounting Standards Board (FASB) Accounting Standards Codification Topic 946 Financial Services – Investment Companies. The financial statements have been prepared in conformity with accounting principles generally accepted in the United States of America (GAAP), which require management to make certain estimates and assumptions at the date of the financial statements. Actual results could differ from those estimates. Subsequent events, if any, through the date that the financial statements were issued have been evaluated in the preparation of the financial statements. The following summarizes the significant accounting policies of the Funds:
Investment Valuation. Investments are valued as of 4:00 p.m. Eastern time on the last calendar day of the period. Each Fund categorizes the inputs to valuation techniques used to value its investments into a disclosure hierarchy consisting of three levels as shown below:
- Level 1 – quoted prices in active markets for identical investments
- Level 2 – other significant observable inputs (including quoted prices for similar investments, interest rates, prepayment speeds, etc.)
- Level 3 – unobservable inputs (including the Fund's own assumptions based on the best information available)
Valuation techniques used to value each Fund's investments by major category are as follows. Investments in open-end mutual funds are valued at their closing net asset value (NAV) each business day and are categorized as Level 1 in the hierarchy. The aggregate value of investments by input level as of September 30, 2020 is included at the end of each Fund's Schedule of Investments.
Investment Transactions and Income. For financial reporting purposes, the Funds' investment holdings and NAV include trades executed through the end of the last business day of the period. The NAV per share for processing shareholder transactions is calculated as of the close of business of the New York Stock Exchange (NYSE), normally 4:00 p.m. Eastern time and includes trades executed through the end of the prior business day. Gains and losses on securities sold are determined on the basis of identified cost. Income and capital gain distributions from any underlying mutual funds or exchange-traded funds (ETFs) are recorded on the ex-dividend date.
Expenses. Expenses directly attributable to a fund are charged to that fund. Expenses attributable to more than one fund are allocated among the respective funds on the basis of relative net assets or other appropriate methods. Expenses included in the accompanying financial statements reflect the expenses of each Fund and do not include any expenses associated with any underlying mutual funds or exchange-traded funds (ETFs). Although not included in each Fund's expenses, each Fund indirectly bears its proportionate share of any underlying mutual funds or exchange-traded funds (ETFs) expenses through the impact of these expenses on each underlying mutual fund's or exchange-traded fund's (ETFs) NAV. Expense estimates are accrued in the period to which they relate and adjustments are made when actual amounts are known.
Income Tax Information and Distributions to Shareholders. Each year, each Fund intends to qualify as a regulated investment company under Subchapter M of the Internal Revenue Code, including distributing substantially all of its taxable income and realized gains. As a result, no provision for U.S. Federal income taxes is required. Each Fund files a U.S. federal tax return, in addition to state and local tax returns as required. Each Fund's federal income tax returns are subject to examination by the Internal Revenue Service (IRS) for a period of three fiscal years after they are filed. State and local tax returns may be subject to examination for an additional fiscal year depending on the jurisdiction.
Distributions are declared and recorded on the ex-dividend date. Income and capital gain distributions are determined in accordance with income tax regulations, which may differ from GAAP.
Capital accounts within the financial statements are adjusted for permanent book-tax differences. These adjustments have no impact on net assets or the results of operations. Capital accounts are not adjusted for temporary book-tax differences which will reverse in a subsequent period.
Book-tax differences are primarily due to the short-term gain distributions from the Underlying Funds and losses deferred due to wash sales and excise tax regulations.
As of period end, the cost and unrealized appreciation (depreciation) in securities, and derivatives if applicable, for federal income tax purposes were as follows for each Fund:
| | Tax cost | Gross unrealized appreciation | Gross unrealized depreciation | Net unrealized appreciation (depreciation) |
| Fidelity Flex Freedom Blend Income Fund | $113,068 | $6,591 | $(1,014) | $5,577 |
| Fidelity Flex Freedom Blend 2005 Fund | 114,844 | 6,878 | (1,361) | 5,517 |
| Fidelity Flex Freedom Blend 2010 Fund | 116,759 | 7,332 | (1,878) | 5,454 |
| Fidelity Flex Freedom Blend 2015 Fund | 118,507 | 7,929 | (2,443) | 5,486 |
| Fidelity Flex Freedom Blend 2020 Fund | 119,941 | 8,367 | (2,946) | 5,421 |
| Fidelity Flex Freedom Blend 2025 Fund | 121,195 | 8,766 | (3,363) | 5,403 |
| Fidelity Flex Freedom Blend 2030 Fund | 123,544 | 9,034 | (3,905) | 5,129 |
| Fidelity Flex Freedom Blend 2035 Fund | 125,487 | 9,321 | (4,974) | 4,347 |
| Fidelity Flex Freedom Blend 2040 Fund | 125,607 | 9,494 | (5,403) | 4,091 |
| Fidelity Flex Freedom Blend 2045 Fund | 125,535 | 9,556 | (5,388) | 4,168 |
| Fidelity Flex Freedom Blend 2050 Fund | 125,586 | 9,479 | (5,387) | 4,092 |
| Fidelity Flex Freedom Blend 2055 Fund | 125,627 | 9,441 | (5,335) | 4,106 |
| Fidelity Flex Freedom Blend 2060 Fund | 125,660 | 9,406 | (5,347) | 4,059 |
| Fidelity Flex Freedom Blend 2065 Fund | 108,066 | 7,586 | (4,178) | 3,408 |
4. Purchases and Sales of Investments.
Purchases and sales of securities, other than short-term securities are noted in the table below.
| | Purchases ($) | Sales ($) |
| Fidelity Flex Freedom Blend Income Fund | 13,096 | 11,934 |
| Fidelity Flex Freedom Blend 2005 Fund | 14,325 | 12,990 |
| Fidelity Flex Freedom Blend 2010 Fund | 16,010 | 14,373 |
| Fidelity Flex Freedom Blend 2015 Fund | 17,384 | 15,442 |
| Fidelity Flex Freedom Blend 2020 Fund | 18,131 | 15,893 |
| Fidelity Flex Freedom Blend 2025 Fund | 18,665 | 16,200 |
| Fidelity Flex Freedom Blend 2030 Fund | 19,845 | 17,066 |
| Fidelity Flex Freedom Blend 2035 Fund | 18,786 | 15,513 |
| Fidelity Flex Freedom Blend 2040 Fund | 16,445 | 12,905 |
| Fidelity Flex Freedom Blend 2045 Fund | 16,596 | 13,056 |
| Fidelity Flex Freedom Blend 2050 Fund | 17,067 | 13,527 |
| Fidelity Flex Freedom Blend 2055 Fund | 16,634 | 13,096 |
| Fidelity Flex Freedom Blend 2060 Fund | 16,813 | 13,273 |
| Fidelity Flex Freedom Blend 2065 Fund | 14,402 | 11,363 |
5. Fees and Other Transactions with Affiliates.
Management Fee. Fidelity Management & Research Company LLC (the investment adviser) and its affiliates provide the Funds with investment management related services and the Funds do not pay any fees for these services. Under the management contract, the investment adviser or an affiliate pays all other expenses of the Funds, excluding fees and expenses of the independent Trustees, and certain miscellaneous expenses such as proxy and shareholder meeting expenses.
Interfund Trades. Funds may purchase from or sell securities to other Fidelity Funds under procedures adopted by the Board. The procedures have been designed to ensure these interfund trades are executed in accordance with Rule 17a-7 of the 1940 Act. Interfund trades are included within the respective purchases and sales amounts shown in the Purchases and Sales of Investments note.
6. Other.
The Funds' organizational documents provide former and current trustees and officers with a limited indemnification against liabilities arising in connection with the performance of their duties to the Funds. In the normal course of business, the Funds may also enter into contracts that provide general indemnifications. The Funds' maximum exposure under these arrangements is unknown as this would be dependent on future claims that may be made against the Funds. The risk of material loss from such claims is considered remote.
At the end of the period, the investment adviser or its affiliates were owners of record of more than 10% of the outstanding shares of the following Funds:
| | Affiliated % |
| Fidelity Flex Freedom Blend Income Fund | 100% |
| Fidelity Flex Freedom Blend 2005 Fund | 100% |
| Fidelity Flex Freedom Blend 2010 Fund | 100% |
| Fidelity Flex Freedom Blend 2015 Fund | 100% |
| Fidelity Flex Freedom Blend 2020 Fund | 100% |
| Fidelity Flex Freedom Blend 2025 Fund | 100% |
| Fidelity Flex Freedom Blend 2030 Fund | 100% |
| Fidelity Flex Freedom Blend 2035 Fund | 100% |
| Fidelity Flex Freedom Blend 2040 Fund | 100% |
| Fidelity Flex Freedom Blend 2045 Fund | 100% |
| Fidelity Flex Freedom Blend 2050 Fund | 100% |
| Fidelity Flex Freedom Blend 2055 Fund | 100% |
| Fidelity Flex Freedom Blend 2060 Fund | 100% |
| Fidelity Flex Freedom Blend 2065 Fund | 100% |
7. Coronavirus (COVID-19) Pandemic.
An outbreak of COVID-19 first detected in China during December 2019 has since spread globally and was declared a pandemic by the World Health Organization during March 2020. Developments that disrupt global economies and financial markets, such as the COVID-19 pandemic, may magnify factors that affect the Funds' performance.
Shareholder Expense Example
As a shareholder, you incur two types of costs: (1) transaction costs, which may include sales charges (loads) on purchase payments or redemption proceeds, as applicable and (2) ongoing costs, which generally include management fees, distribution and/or service (12b-1) fees and other Fund expenses. This Example is intended to help you understand your ongoing costs (in dollars) of investing in a fund and to compare these costs with the ongoing costs of investing in other mutual funds.
The Example is based on an investment of $1,000 invested at the beginning of the period and held for the entire period (April 1, 2020 to September 30, 2020).
Actual Expenses
The first line of the accompanying table provides information about actual account values and actual expenses. You may use the information in this line, together with the amount you invested, to estimate the expenses that you paid over the period. Simply divide your account value by $1,000.00 (for example, an $8,600 account value divided by $1,000.00 = 8.6), then multiply the result by the number in the first line for a class/Fund under the heading entitled "Expenses Paid During Period" to estimate the expenses you paid on your account during this period. If any fund is a shareholder of any underlying mutual funds or exchange-traded funds (ETFs) (the Underlying Funds), such fund indirectly bears its proportional share of the expenses of the Underlying Funds in addition to the direct expenses incurred presented in the table. These fees and expenses are not included in the annualized expense ratio used to calculate the expense estimate in the table below.
Hypothetical Example for Comparison Purposes
The second line of the accompanying table provides information about hypothetical account values and hypothetical expenses based on the actual expense ratio and an assumed rate of return of 5% per year before expenses, which is not the actual return. The hypothetical account values and expenses may not be used to estimate the actual ending account balance or expenses you paid for the period. You may use this information to compare the ongoing costs of investing in the Fund and other funds. To do so, compare this 5% hypothetical example with the 5% hypothetical examples that appear in the shareholder reports of the other funds. If any fund is a shareholder of any Underlying Funds, such fund indirectly bears its proportional share of the expenses of the Underlying Funds in addition to the direct expenses as presented in the table. These fees and expenses are not included in the annualized expense ratio used to calculate the expense estimate in the table below.
Please note that the expenses shown in the table are meant to highlight your ongoing costs only and do not reflect any transaction costs. Therefore, the second line of the table is useful in comparing ongoing costs only, and will not help you determine the relative total costs of owning different funds.
| | Annualized Expense Ratio-A,B | Beginning
Account Value
April 1, 2020 | Ending
Account Value
September 30, 2020 | Expenses Paid
During Period
April 1, 2020
to September 30, 2020-C,D |
| Fidelity Flex Freedom Blend Income Fund | - % | | | |
| Actual | | $1,000.00 | $1,086.70 | $- |
| Hypothetical-E | | $1,000.00 | $1,025.07 | $- |
| Fidelity Flex Freedom Blend 2005 Fund | - % | | | |
| Actual | | $1,000.00 | $1,102.00 | $- |
| Hypothetical-E | | $1,000.00 | $1,025.07 | $- |
| Fidelity Flex Freedom Blend 2010 Fund | - % | | | |
| Actual | | $1,000.00 | $1,127.70 | $- |
| Hypothetical-E | | $1,000.00 | $1,025.07 | $- |
| Fidelity Flex Freedom Blend 2015 Fund | - % | | | |
| Actual | | $1,000.00 | $1,152.30 | $- |
| Hypothetical-E | | $1,000.00 | $1,025.07 | $- |
| Fidelity Flex Freedom Blend 2020 Fund | - % | | | |
| Actual | | $1,000.00 | $1,175.20 | $- |
| Hypothetical-E | | $1,000.00 | $1,025.07 | $- |
| Fidelity Flex Freedom Blend 2025 Fund | - % | | | |
| Actual | | $1,000.00 | $1,194.90 | $- |
| Hypothetical-E | | $1,000.00 | $1,025.07 | $- |
| Fidelity Flex Freedom Blend 2030 Fund | - % | | | |
| Actual | | $1,000.00 | $1,220.20 | $- |
| Hypothetical-E | | $1,000.00 | $1,025.07 | $- |
| Fidelity Flex Freedom Blend 2035 Fund | - % | | | |
| Actual | | $1,000.00 | $1,261.20 | $- |
| Hypothetical-E | | $1,000.00 | $1,025.07 | $- |
| Fidelity Flex Freedom Blend 2040 Fund | - % | | | |
| Actual | | $1,000.00 | $1,282.00 | $- |
| Hypothetical-E | | $1,000.00 | $1,025.07 | $- |
| Fidelity Flex Freedom Blend 2045 Fund | - % | | | |
| Actual | | $1,000.00 | $1,281.80 | $- |
| Hypothetical-E | | $1,000.00 | $1,025.07 | $- |
| Fidelity Flex Freedom Blend 2050 Fund | - % | | | |
| Actual | | $1,000.00 | $1,281.80 | $- |
| Hypothetical-E | | $1,000.00 | $1,025.07 | $- |
| Fidelity Flex Freedom Blend 2055 Fund | - % | | | |
| Actual | | $1,000.00 | $1,282.40 | $- |
| Hypothetical-E | | $1,000.00 | $1,025.07 | $- |
| Fidelity Flex Freedom Blend 2060 Fund | - % | | | |
| Actual | | $1,000.00 | $1,282.50 | $- |
| Hypothetical-E | | $1,000.00 | $1,025.07 | $- |
| Fidelity Flex Freedom Blend 2065 Fund | - % | | | |
| Actual | | $1,000.00 | $1,282.40 | $- |
| Hypothetical-E | | $1,000.00 | $1,025.07 | $- |
A Annualized expense ratio reflects expenses net of applicable fee waivers.
B Amount represents less than .005%.
C Expenses are equal to the annualized expense ratio, multiplied by the average account value over the period, multiplied by 183/ 365 (to reflect the one-half year period). The fees and expenses of any Underlying Funds are not included in each annualized expense ratio.
D Amount represents less than $.005.
E 5% return per year before expenses
Board Approval of Investment Advisory Contracts and Management Fees
Fidelity Flex Freedom Blend Funds
Each year, the Board of Trustees, including the Independent Trustees (together, the Board), votes on the renewal of the management contract with Fidelity Management & Research Company LLC (FMR) (the Advisory Contract) for each fund. The Board, assisted by the advice of fund counsel and Independent Trustees' counsel, requests and considers a broad range of information relevant to the renewal of the Advisory Contracts throughout the year.
The Board meets regularly and, at each of its meetings, covers an extensive agenda of topics and materials and considers factors that are relevant to its annual consideration of the renewal of each fund's Advisory Contract, including the services and support provided to each fund and its shareholders. The Board has established four standing committees (Committees) — Operations, Audit, Fair Valuation, and Governance and Nominating — each composed of and chaired by Independent Trustees with varying backgrounds, to which the Board has assigned specific subject matter responsibilities in order to enhance effective decision-making by the Board. The Operations Committee, of which all of the Independent Trustees are members, meets regularly throughout the year and considers, among other matters, information specifically related to the annual consideration of the renewal of each fund's Advisory Contract. The Board, acting directly and through its Committees, requests and receives information concerning the annual consideration of the renewal of each fund's Advisory Contract. The Board also meets as needed to review matters specifically related to the Board's annual consideration of the renewal of the Advisory Contracts. Members of the Board may also meet with trustees of other Fidelity funds through joint ad hoc committees to discuss certain matters relevant to all of the Fidelity funds.
At its September 2020 meeting, the Board unanimously determined to renew each fund's Advisory Contract. In considering whether to renew the Advisory Contract for each fund, the Board considered all factors it believed relevant and reached a determination, with the assistance of fund counsel and Independent Trustees' counsel and through the exercise of its business judgment, that the renewal of the Advisory Contract was in the best interests of each fund and its shareholders and the fact that no fee is payable under the management contract was fair and reasonable.
Nature, Extent, and Quality of Services Provided. The Board considered Fidelity's staffing as it relates to the funds, including the backgrounds of investment personnel of FMR, and also considered the funds' investment objectives, strategies, and related investment philosophies. The Independent Trustees also had discussions with senior management of Fidelity's investment operations and investment groups with responsibility for the Series Funds. The Board considered the structure of the investment personnel compensation program and whether this structure provides appropriate incentives to act in the best interests of each fund. Additionally, the Board considered the portfolio managers' investments, if any, in the funds that they manage.
Resources Dedicated to Investment Management and Support Services. The Board reviewed the general qualifications and capabilities of Fidelity's investment staff, including its size, education, experience, and resources, as well as Fidelity's approach to recruiting, managing, and compensating investment personnel. The Board noted that Fidelity has continued to increase the resources devoted to non-U.S. offices, including expansion of Fidelity's global investment organization. The Board also noted that Fidelity's analysts have extensive resources, tools and capabilities that allow them to conduct sophisticated quantitative and fundamental analysis, as well as credit analysis of issuers, counterparties and guarantors. Further, the Board considered that Fidelity's investment professionals have sufficient access to global information and data so as to provide competitive investment results over time, and that those professionals also have access to sophisticated tools that permit them to assess portfolio construction and risk and performance attribution characteristics continuously, as well as to transmit new information and research conclusions rapidly around the world. Additionally, in its deliberations, the Board considered Fidelity's risk management, compliance, and technology and operations capabilities and resources, which are integral parts of the investment management process. The Board also considered Fidelity's investments in business continuity planning, and its success in continuously providing services to the funds notwithstanding the severe disruptions caused by the COVID-19 pandemic.
Shareholder and Administrative Services. The Board considered (i) the nature, extent, quality, and cost of advisory, administrative, and shareholder services performed by Fidelity under the Advisory Contract and under separate agreements covering transfer agency and pricing and bookkeeping services for each fund; (ii) the nature and extent of the supervision of third party service providers, principally custodians, subcustodians, and pricing vendors; and (iii) the resources devoted to, and the record of compliance with, each fund's compliance policies and procedures.
The Board noted that the growth of fund assets over time across the complex allows Fidelity to reinvest in the development of services designed to enhance the value and convenience of the Fidelity funds as investment vehicles. These services include 24-hour access to account information and market information over the Internet and through telephone representatives, investor education materials and asset allocation tools, and the expanded availability of Fidelity Investor Centers.
Investment in a Large Fund Family. The Board considered the benefits to shareholders of investing in a Fidelity fund, including the benefits of investing in a fund that is part of a large family of funds offering a variety of investment disciplines and providing a large variety of mutual fund investor services. The Board noted that Fidelity had taken, or had made recommendations that resulted in the Fidelity funds taking, a number of actions over the previous year that benefited particular funds, including: (i) continuing to dedicate additional resources to Fidelity's investment research process, which includes meetings with management of issuers of securities in which the funds invest, and to the support of the senior management team that oversees asset management; (ii) continuing efforts to enhance Fidelity's global research capabilities; (iii) launching new funds and ETFs with innovative structures, strategies and pricing and making other enhancements to meet client needs; (iv) launching new share classes of existing funds; (v) eliminating purchase minimums and broadening eligibility requirements for certain funds and share classes; (vi) reducing management fees and total expenses for certain target date funds or classes and index funds; (vii) lowering expenses for certain funds and classes by implementing or lowering expense caps; (viii) rationalizing product lines and gaining increased efficiencies from fund mergers, liquidations, and share class consolidations; (ix) continuing to develop, acquire and implement systems and technology to improve services to the funds and shareholders, strengthen information security, and increase efficiency; and (x) continuing to implement enhancements to further strengthen Fidelity's product line to increase investors' probability of success in achieving their investment goals, including retirement income goals.
Investment Performance. The Board considered whether each fund has operated in accordance with its investment objective, as well as its record of compliance with its investment restrictions. The Board reviewed the absolute investment performance of each fund, as well as each fund's relative investment performance.
Based on its review, the Board concluded that the nature, extent, and quality of services provided to each fund under the Advisory Contracts should continue to benefit the shareholders of each fund.
Competitiveness of Management Fee and Total Expense Ratio. The Board noted that each fund is available exclusively through certain Fidelity fee-based accounts and advisory programs. The Board considered that each fund does not pay FMR a management fee for investment advisory services, but that FMR is indirectly compensated for its services out of Fidelity fee-based account and advisory program fees. The Board also noted that FMR or an affiliate undertakes to pay all operating expenses of each fund, except Independent Trustee fees and expenses, proxy and shareholder meeting expenses, interest, taxes, and extraordinary expenses (such as litigation expenses). The Board further noted that each fund pays its non-operating expenses, including brokerage commissions and fees and expenses associated with the fund's securities lending program, if applicable.
Based on its review, the Board considered that each fund does not pay a management fee and concluded that each fund's total expense ratio was reasonable in light of the services that the fund and its shareholders receive and the other factors considered.
Costs of the Services and Profitability. The Board considered the level of Fidelity's profits in respect of all the Fidelity funds.
A public accounting firm has been engaged annually by the Board as part of the Board's assessment of Fidelity's profitability analysis. The engagement includes the review and assessment of the methodologies used by Fidelity in determining the revenues and expenses attributable to Fidelity's mutual fund business, and completion of agreed-upon procedures in respect of the mathematical accuracy of certain fund profitability information and its conformity to established allocation methodologies. After considering the reports issued under the engagement and information provided by Fidelity, the Board concluded that while other allocation methods may also be reasonable, Fidelity's profitability methodologies are reasonable in all material respects.
The Board also reviewed Fidelity's non-fund businesses and potential indirect benefits such businesses may have received as a result of their association with Fidelity's mutual fund business (i.e., fall-out benefits) as well as cases where Fidelity's affiliates may benefit from the funds' business. The Board considered areas where potential indirect benefits to the Fidelity funds from their relationships with Fidelity may exist. The Board also considered that in 2019 a joint ad hoc committee created by it and the boards of other Fidelity funds evaluated potential fall-out benefits (PFOB Committee). The Board noted that it considered the PFOB Committee's findings in connection with its consideration of the renewal of the Advisory Contracts.
The Board concluded that the costs of the services provided by and the profits realized by Fidelity in connection with the operation of the funds were not relevant to the renewal of the Advisory Contracts because the funds pay no advisory fees and FMR or an affiliate bears all expenses of the funds, with limited exceptions.
Economies of Scale. The Board concluded that because the funds pay no advisory fees and FMR or an affiliate bears all expenses of the funds with certain limited exceptions, the realization of economies of scale was not a material factor in the Board's decision to renew the funds' Advisory Contracts.
Additional Information Requested by the Board. In order to develop fully the factual basis for consideration of the Fidelity funds' advisory contracts, the Board requested and received additional information on certain topics, including: (i) Fidelity's fund profitability methodology, profitability trends for certain funds, the allocation of various costs to different funds, and the impact of certain factors on fund profitability results; (ii) portfolio manager changes that have occurred during the past year and the amount of the investment that each portfolio manager has made in the Fidelity fund(s) that he or she manages; (iii) Fidelity's compensation structure for portfolio managers, research analysts, and other key personnel, including its effects on fund profitability, the rationale for the compensation structure, and the extent to which current market conditions have affected retention and recruitment; (iv) the arrangements with and compensation paid to certain fund sub-advisers on behalf of the Fidelity funds and the treatment of such compensation within Fidelity's fund profitability methodology; (v) the terms of the funds' various management fee structures, including the basic group fee and the terms of Fidelity's voluntary expense limitation agreements; (vi) Fidelity's transfer agent fee, expense, and service structures for different funds and classes relative to competitive trends; (vii) the impact on fund profitability of recent industry trends, such as the growth in passively managed funds and outflows from actively managed equity funds; and (viii) explanations regarding the relative total expense ratios of certain funds and classes, total expense competitive trends and methodologies for total expense competitive comparisons, and actions that might be taken by Fidelity to reduce total expense ratios for certain classes. In addition, the Board considered its discussions with Fidelity regarding Fidelity's efforts to maintain the continuous investment and shareholder services necessary for the funds during the current pandemic and economic circumstances.
Based on its evaluation of all of the conclusions noted above, and after considering all factors it believed relevant, the Board concluded that the advisory fee arrangements are fair and reasonable, and that each fund's Advisory Contract should be renewed.
XFC-SANN-1120
1.9884227.103
Fidelity Freedom® Blend Funds - Income, 2005, 2010, 2015, 2020, 2025, 2030, 2035, 2040, 2045, 2050, 2055, 2060, 2065
Semi-Annual Report
September 30, 2020
Includes Fidelity and Fidelity Advisor share classes
See the inside front cover for important information about access to your fund’s shareholder reports.
Beginning on January 1, 2021, as permitted by regulations adopted by the Securities and Exchange Commission, paper copies of a fund’s shareholder reports will no longer be sent by mail, unless you specifically request paper copies of the reports from the fund or from your financial intermediary, such as a financial advisor, broker-dealer or bank. Instead, the reports will be made available on a website, and you will be notified by mail each time a report is posted and provided with a website link to access the report.
If you already elected to receive shareholder reports electronically, you will not be affected by this change and you need not take any action. You may elect to receive shareholder reports and other communications from a fund electronically, by contacting your financial intermediary. For Fidelity customers, visit Fidelity's web site or call Fidelity using the contact information listed below.
You may elect to receive all future reports in paper free of charge. If you wish to continue receiving paper copies of your shareholder reports, you may contact your financial intermediary or, if you are a Fidelity customer, visit Fidelity’s website, or call Fidelity at the applicable toll-free number listed below. Your election to receive reports in paper will apply to all funds held with the fund complex/your financial intermediary.
| Account Type | Website | Phone Number |
| Brokerage, Mutual Fund, or Annuity Contracts: | fidelity.com/mailpreferences | 1-800-343-3548 |
| Employer Provided Retirement Accounts: | netbenefits.fidelity.com/preferences (choose 'no' under Required Disclosures to continue to print) | 1-800-343-0860 |
| Advisor Sold Accounts Serviced Through Your Financial Intermediary: | Contact Your Financial Intermediary | Your Financial Intermediary's phone number |
| Advisor Sold Accounts Serviced by Fidelity: | institutional.fidelity.com | 1-877-208-0098 |
Contents
To view a fund's proxy voting guidelines and proxy voting record for the 12-month period ended June 30, visit http://www.fidelity.com/proxyvotingresults or visit the Securities and Exchange Commission's (SEC) web site at http://www.sec.gov.
You may also call 1-800-544-8544 if you’re an individual investing directly with Fidelity, call 1-800-835-5092 if you’re a plan sponsor or participant with Fidelity as your recordkeeper or call 1-877-208-0098 on institutional accounts or if you’re an advisor or invest through one to request a free copy of the proxy voting guidelines.
Standard & Poor's, S&P and S&P 500 are registered service marks of The McGraw-Hill Companies, Inc. and have been licensed for use by Fidelity Distributors Corporation.
Other third-party marks appearing herein are the property of their respective owners.
All other marks appearing herein are registered or unregistered trademarks or service marks of FMR LLC or an affiliated company. © 2020 FMR LLC. All rights reserved.
This report and the financial statements contained herein are submitted for the general information of the shareholders of the Funds. This report is not authorized for distribution to prospective investors in the Funds unless preceded or accompanied by an effective prospectus.
A fund files its complete schedule of portfolio holdings with the SEC for the first and third quarters of each fiscal year on Form N-PORT. Forms N-PORT are available on the SEC’s web site at http://www.sec.gov. A fund's Forms N-PORT may be reviewed and copied at the SEC’s Public Reference Room in Washington, DC. Information regarding the operation of the SEC's Public Reference Room may be obtained by calling 1-800-SEC-0330.
For a complete list of a fund's portfolio holdings, view the most recent holdings listing, semiannual report, or annual report on Fidelity's web site at http://www.fidelity.com, http://www.institutional.fidelity.com, or http://www.401k.com, as applicable.
NOT FDIC INSURED •MAY LOSE VALUE •NO BANK GUARANTEE
Neither the Funds nor Fidelity Distributors Corporation is a bank.
Note to Shareholders:
Early in 2020, the outbreak and spread of a new coronavirus emerged as a public health emergency that had a major influence on financial markets, primarily based on its impact on the global economy and the outlook for corporate earnings. The virus causes a respiratory disease known as COVID-19. On March 11, the World Health Organization declared the COVID-19 outbreak a pandemic, citing sustained risk of further global spread.
In the weeks following, as the crisis worsened, we witnessed an escalating human tragedy with wide-scale social and economic consequences from coronavirus-containment measures. The outbreak of COVID-19 prompted a number of measures to limit the spread, including travel and border restrictions, quarantines, and restrictions on large gatherings. In turn, these resulted in lower consumer activity, diminished demand for a wide range of products and services, disruption in manufacturing and supply chains, and – given the wide variability in outcomes regarding the outbreak – significant market uncertainty and volatility. Amid the turmoil, the U.S. government took unprecedented action – in concert with the U.S. Federal Reserve and central banks around the world – to help support consumers, businesses, and the broader economy, and to limit disruption to the financial system.
The situation continues to unfold, and the extent and duration of its impact on financial markets and the economy remain highly uncertain. Extreme events such as the coronavirus crisis are “exogenous shocks” that can have significant adverse effects on mutual funds and their investments. Although multiple asset classes may be affected by market disruption, the duration and impact may not be the same for all types of assets.
Fidelity is committed to helping you stay informed amid news about COVID-19 and during increased market volatility, and we’re taking extra steps to be responsive to customer needs. We encourage you to visit our websites, where we offer ongoing updates, commentary, and analysis on the markets and our funds.
Fidelity Freedom® Blend Income Fund
Investment Summary (Unaudited)
The information in the following tables is based on the direct investments of the Fund.
Top Holdings as of September 30, 2020
| | % of fund's net assets |
| Fidelity Series Treasury Bill Index Fund | 13.2 |
| Fidelity Series Inflation-Protected Bond Index Fund | 12.0 |
| Fidelity Series Investment Grade Bond Fund | 11.5 |
| Fidelity Series Government Bond Index Fund | 10.4 |
| Fidelity Series Corporate Bond Fund | 8.7 |
| Fidelity Series Investment Grade Securitized Fund | 7.9 |
| Fidelity Series Government Money Market Fund 0.16% | 6.6 |
| Fidelity Series Emerging Markets Opportunities Fund | 6.4 |
| Fidelity Series Short-Term Credit Fund | 4.0 |
| Fidelity Series Commodity Strategy Fund | 2.5 |
| | 83.2 |
Asset Allocation (% of fund's net assets)
| Period end |
| | Domestic Equity Funds | 9.0% |
| | International Equity Funds | 12.5% |
| | Bond Funds | 54.7% |
| | Short-Term Funds | 23.8% |

Domestic Equity Funds category includes Fidelity Series Commodity Strategy Fund which invests in commodity-related investments.
Fidelity Freedom® Blend Income Fund
Schedule of Investments September 30, 2020 (Unaudited)
Showing Percentage of Net Assets
| Domestic Equity Funds - 9.0% | | | |
| | | Shares | Value |
| Fidelity Series Blue Chip Growth Fund (a) | | 48,343 | $798,139 |
| Fidelity Series Commodity Strategy Fund (a) | | 334,862 | 1,393,024 |
| Fidelity Series Large Cap Growth Index Fund (a) | | 35,883 | 510,975 |
| Fidelity Series Large Cap Stock Fund (a) | | 38,878 | 550,513 |
| Fidelity Series Large Cap Value Index Fund (a) | | 89,759 | 1,041,209 |
| Fidelity Series Small Cap Opportunities Fund (a) | | 20,537 | 262,057 |
| Fidelity Series Value Discovery Fund (a) | | 30,579 | 377,954 |
| TOTAL DOMESTIC EQUITY FUNDS | | | |
| (Cost $4,768,971) | | | 4,933,871 |
|
| International Equity Funds - 12.5% | | | |
| Fidelity Series Canada Fund (a) | | 26,731 | 273,462 |
| Fidelity Series Emerging Markets Fund (a) | | 41,623 | 392,505 |
| Fidelity Series Emerging Markets Opportunities Fund (a) | | 168,118 | 3,527,115 |
| Fidelity Series International Growth Fund (a) | | 37,962 | 712,927 |
| Fidelity Series International Index Fund (a) | | 29,523 | 293,463 |
| Fidelity Series International Small Cap Fund (a) | | 14,112 | 251,200 |
| Fidelity Series International Value Fund (a) | | 82,017 | 706,987 |
| Fidelity Series Overseas Fund (a) | | 63,606 | 711,115 |
| TOTAL INTERNATIONAL EQUITY FUNDS | | | |
| (Cost $6,110,109) | | | 6,868,774 |
|
| Bond Funds - 54.7% | | | |
| Fidelity Series Corporate Bond Fund (a) | | 425,417 | 4,785,937 |
| Fidelity Series Emerging Markets Debt Fund (a) | | 40,192 | 364,136 |
| Fidelity Series Floating Rate High Income Fund (a) | | 8,838 | 78,216 |
| Fidelity Series Government Bond Index Fund (a) | | 508,484 | 5,720,449 |
| Fidelity Series High Income Fund (a) | | 43,807 | 399,518 |
| Fidelity Series Inflation-Protected Bond Index Fund (a) | | 616,919 | 6,601,038 |
| Fidelity Series Investment Grade Bond Fund (a) | | 520,132 | 6,366,421 |
| Fidelity Series Investment Grade Securitized Fund (a) | | 406,568 | 4,338,084 |
| Fidelity Series Long-Term Treasury Bond Index Fund (a) | | 122,139 | 1,261,700 |
| Fidelity Series Real Estate Income Fund (a) | | 23,784 | 237,368 |
| TOTAL BOND FUNDS | | | |
| (Cost $28,332,294) | | | 30,152,867 |
|
| Short-Term Funds - 23.8% | | | |
| Fidelity Cash Central Fund 0.10% (b) | | 49 | 49 |
| Fidelity Series Government Money Market Fund 0.16% (a)(c) | | 3,641,207 | 3,641,207 |
| Fidelity Series Short-Term Credit Fund (a) | | 214,264 | 2,196,205 |
| Fidelity Series Treasury Bill Index Fund (a) | | 728,273 | 7,290,016 |
| TOTAL SHORT-TERM FUNDS | | | |
| (Cost $13,073,721) | | | 13,127,477 |
| TOTAL INVESTMENT IN SECURITIES - 100.0% | | | |
| (Cost $52,285,095) | | | 55,082,989 |
| NET OTHER ASSETS (LIABILITIES) - 0.0% | | | (1,004) |
| NET ASSETS - 100% | | | $55,081,985 |
Legend
(a) Affiliated Fund
(b) Affiliated fund that is generally available only to investment companies and other accounts managed by Fidelity Investments. The rate quoted is the annualized seven-day yield of the fund at period end. A complete unaudited listing of the fund's holdings as of its most recent quarter end is available upon request. In addition, each Fidelity Central Fund's financial statements are available on the SEC's website or upon request.
(c) The rate quoted is the annualized seven-day yield of the fund at period end.
Affiliated Underlying Funds
Fiscal year to date information regarding the Fund's investments in affiliated Underlying Funds, excluding any Money Market Central Funds, is presented below. Exchanges between classes of the same affiliated Underlying Funds may occur.
| Affiliate | Value, beginning of period | Purchases | Sales Proceeds | Dividend Income | Realized Gain (loss) | Change in Unrealized appreciation (depreciation) | Value, end of period |
| Fidelity Series Blue Chip Growth Fund | $355,531 | $576,239 | $268,051 | $150,284 | $27,591 | $106,829 | $798,139 |
| Fidelity Series Canada Fund | 235,871 | 99,113 | 115,625 | -- | (17,592) | 71,695 | 273,462 |
| Fidelity Series Commodity Strategy Fund | 1,480,023 | 433,281 | 686,688 | 5,594 | (79,240) | 245,648 | 1,393,024 |
| Fidelity Series Corporate Bond Fund | 3,341,347 | 1,649,111 | 582,514 | 64,518 | 5,285 | 372,708 | 4,785,937 |
| Fidelity Series Emerging Markets Debt Fund | 273,292 | 100,431 | 45,119 | 8,709 | (441) | 35,973 | 364,136 |
| Fidelity Series Emerging Markets Fund | 181,052 | 208,620 | 81,534 | -- | (3,222) | 87,589 | 392,505 |
| Fidelity Series Emerging Markets Opportunities Fund | 1,794,359 | 1,780,365 | 827,161 | -- | 13,657 | 765,895 | 3,527,115 |
| Fidelity Series Floating Rate High Income Fund | 59,053 | 23,756 | 10,916 | 1,566 | (75) | 6,398 | 78,216 |
| Fidelity Series Government Bond Index Fund | 5,206,475 | 1,674,506 | 1,142,564 | 40,057 | 285 | (18,253) | 5,720,449 |
| Fidelity Series Government Money Market Fund 0.16% | 2,245,847 | 3,963,108 | 2,567,748 | 3,243 | -- | -- | 3,641,207 |
| Fidelity Series High Income Fund | 299,437 | 120,767 | 54,579 | 9,812 | (288) | 34,181 | 399,518 |
| Fidelity Series Inflation-Protected Bond Index Fund | 5,263,372 | 1,874,604 | 884,800 | 4,766 | 2,665 | 345,197 | 6,601,038 |
| Fidelity Series International Growth Fund | 697,239 | 228,512 | 397,111 | -- | 12,627 | 171,660 | 712,927 |
| Fidelity Series International Index Fund | 252,292 | 119,008 | 132,863 | -- | (9,855) | 64,881 | 293,463 |
| Fidelity Series International Small Cap Fund | 201,686 | 67,706 | 84,031 | -- | (414) | 66,253 | 251,200 |
| Fidelity Series International Value Fund | 689,032 | 249,625 | 362,875 | -- | (30,879) | 162,084 | 706,987 |
| Fidelity Series Investment Grade Bond Fund | 5,083,603 | 1,862,189 | 902,633 | 74,703 | 4,395 | 318,867 | 6,366,421 |
| Fidelity Series Investment Grade Securitized Fund | 3,543,334 | 1,338,412 | 589,288 | 24,822 | (47) | 45,673 | 4,338,084 |
| Fidelity Series Large Cap Growth Index Fund | 247,587 | 273,187 | 152,260 | 7,470 | 8,891 | 133,570 | 510,975 |
| Fidelity Series Large Cap Stock Fund | 255,848 | 371,840 | 129,909 | 18,432 | (35) | 52,769 | 550,513 |
| Fidelity Series Large Cap Value Index Fund | 489,718 | 639,080 | 204,951 | -- | 5,825 | 111,537 | 1,041,209 |
| Fidelity Series Long-Term Treasury Bond Index Fund | 1,076,791 | 427,557 | 207,629 | 29,665 | (75) | (34,944) | 1,261,700 |
| Fidelity Series Overseas Fund | 677,636 | 261,274 | 413,774 | -- | (5,767) | 191,746 | 711,115 |
| Fidelity Series Real Estate Income Fund | 162,999 | 76,509 | 34,206 | 6,974 | (1,001) | 33,067 | 237,368 |
| Fidelity Series Short-Term Credit Fund | 2,093,791 | 23,888 | -- | 23,887 | -- | 78,526 | 2,196,205 |
| Fidelity Series Small Cap Opportunities Fund | 118,432 | 169,094 | 66,551 | 1,484 | (2,632) | 43,714 | 262,057 |
| Fidelity Series Treasury Bill Index Fund | 7,146,861 | 220,561 | 55,655 | 28,807 | (38) | (21,713) | 7,290,016 |
| Fidelity Series Value Discovery Fund | 142,099 | 263,471 | 73,187 | -- | (710) | 46,281 | 377,954 |
| | 43,614,607 | 19,095,814 | 11,074,222 | 504,793 | (71,090) | 3,517,831 | 55,082,940 |
Amounts in the income column in the above table include any capital gain distributions from underlying funds, which are presented in the corresponding line-item in the Statement of Operations, if applicable.
Investment Valuation
The following is a summary of the inputs used, as of September 30, 2020, involving the Fund's assets and liabilities carried at fair value. The inputs or methodology used for valuing securities may not be an indication of the risk associated with investing in those securities. For more information on valuation inputs, and their aggregation into the levels used below, please refer to the Investment Valuation section in the accompanying Notes to Financial Statements.
| | Valuation Inputs at Reporting Date: |
| Description | Total | Level 1 | Level 2 | Level 3 |
| Investments in Securities: | | | | |
| Domestic Equity Funds | $4,933,871 | $4,933,871 | $-- | $-- |
| International Equity Funds | 6,868,774 | 6,868,774 | -- | -- |
| Bond Funds | 30,152,867 | 30,152,867 | -- | -- |
| Short-Term Funds | 13,127,477 | 13,127,477 | -- | -- |
| Total Investments in Securities: | $55,082,989 | $55,082,989 | $-- | $-- |
See accompanying notes which are an integral part of the financial statements.
Fidelity Freedom® Blend Income Fund
Financial Statements
Statement of Assets and Liabilities
| | | September 30, 2020 (Unaudited) |
| Assets | | |
Investment in securities, at value — See accompanying schedule:
| | |
| Fidelity Central Funds (cost $49) | $49 | |
| Other affiliated issuers (cost $52,285,046) | 55,082,940 | |
| Total Investment in Securities (cost $52,285,095) | | $55,082,989 |
| Cash | | 275 |
| Receivable for investments sold | | 18,123 |
| Receivable for fund shares sold | | 789,893 |
| Total assets | | 55,891,280 |
| Liabilities | | |
| Payable for investments purchased | $795,482 | |
| Payable for fund shares redeemed | 273 | |
| Accrued management fee | 12,885 | |
| Distribution and service plan fees payable | 655 | |
| Total liabilities | | 809,295 |
| Net Assets | | $55,081,985 |
| Net Assets consist of: | | |
| Paid in capital | | $52,269,328 |
| Total accumulated earnings (loss) | | 2,812,657 |
| Net Assets | | $55,081,985 |
| Net Asset Value and Maximum Offering Price | | |
| Class A: | | |
| Net Asset Value and redemption price per share ($1,406,107 ÷ 131,008 shares)(a) | | $10.73 |
| Maximum offering price per share (100/94.25 of $10.73) | | $11.38 |
| Class M: | | |
| Net Asset Value and redemption price per share ($180,385 ÷ 16,797 shares)(a) | | $10.74 |
| Maximum offering price per share (100/96.50 of $10.74) | | $11.13 |
| Class C: | | |
| Net Asset Value and offering price per share ($759,697 ÷ 71,063 shares)(a) | | $10.69 |
| Fidelity Freedom Blend Income Fund: | | |
| Net Asset Value, offering price and redemption price per share ($3,684,487 ÷ 343,039 shares) | | $10.74 |
| Class K: | | |
| Net Asset Value, offering price and redemption price per share ($408,225 ÷ 37,989 shares) | | $10.75 |
| Class K6: | | |
| Net Asset Value, offering price and redemption price per share ($46,811,221 ÷ 4,354,880 shares) | | $10.75 |
| Class I: | | |
| Net Asset Value, offering price and redemption price per share ($670,217 ÷ 62,366 shares) | | $10.75 |
| Class Z: | | |
| Net Asset Value, offering price and redemption price per share ($1,043,412 ÷ 97,103 shares) | | $10.75 |
| Class Z6: | | |
| Net Asset Value, offering price and redemption price per share ($118,234 ÷ 10,993 shares) | | $10.76 |
(a) Redemption price per share is equal to net asset value less any applicable contingent deferred sales charge.
See accompanying notes which are an integral part of the financial statements.
Statement of Operations
| | | Six months ended September 30, 2020 (Unaudited) |
| Investment Income | | |
| Dividends: | | |
| Affiliated issuers | | $298,293 |
| Expenses | | |
| Management fee | $70,547 | |
| Distribution and service plan fees | 3,127 | |
| Independent trustees' fees and expenses | 66 | |
| Total expenses before reductions | 73,740 | |
| Expense reductions | (4) | |
| Total expenses after reductions | | 73,736 |
| Net investment income (loss) | | 224,557 |
| Realized and Unrealized Gain (Loss) | | |
| Net realized gain (loss) on: | | |
| Investment securities: | | |
| Affiliated issuers | (71,090) | |
| Capital gain distributions from underlying funds: | | |
| Affiliated issuers | 206,500 | |
| Total net realized gain (loss) | | 135,410 |
| Change in net unrealized appreciation (depreciation) on: | | |
| Investment securities: | | |
| Affiliated issuers | 3,517,831 | |
| Total change in net unrealized appreciation (depreciation) | | 3,517,831 |
| Net gain (loss) | | 3,653,241 |
| Net increase (decrease) in net assets resulting from operations | | $3,877,798 |
See accompanying notes which are an integral part of the financial statements.
Statement of Changes in Net Assets
| | Six months ended September 30, 2020 (Unaudited) | Year ended March 31, 2020 |
| Increase (Decrease) in Net Assets | | |
| Operations | | |
| Net investment income (loss) | $224,557 | $654,391 |
| Net realized gain (loss) | 135,410 | 216,863 |
| Change in net unrealized appreciation (depreciation) | 3,517,831 | (789,089) |
| Net increase (decrease) in net assets resulting from operations | 3,877,798 | 82,165 |
| Distributions to shareholders | (381,304) | (838,295) |
| Share transactions - net increase (decrease) | 7,971,443 | 41,593,540 |
| Total increase (decrease) in net assets | 11,467,937 | 40,837,410 |
| Net Assets | | |
| Beginning of period | 43,614,048 | 2,776,638 |
| End of period | $55,081,985 | $43,614,048 |
See accompanying notes which are an integral part of the financial statements.
Financial Highlights
Fidelity Freedom Blend Income Fund Class A
| | Six months ended (Unaudited) September 30, | Years endedMarch 31, | |
| | 2020 | 2020 | 2019 A |
| Selected Per–Share Data | | | |
| Net asset value, beginning of period | $9.98 | $10.03 | $10.00 |
| Income from Investment Operations | | | |
| Net investment income (loss)B | .03 | .16 | .11 |
| Net realized and unrealized gain (loss) | .78 | .01C | .08 |
| Total from investment operations | .81 | .17 | .19 |
| Distributions from net investment income | (.03) | (.15) | (.11) |
| Distributions from net realized gain | (.03) | (.07) | (.05) |
| Total distributions | (.06) | (.22) | (.16) |
| Net asset value, end of period | $10.73 | $9.98 | $10.03 |
| Total ReturnD,E | 8.18% | 1.60% | 1.91% |
| Ratios to Average Net AssetsF | | | |
| Expenses before reductions | .71%G | .71% | .71%G |
| Expenses net of fee waivers, if any | .71%G | .71% | .71%G |
| Expenses net of all reductions | .71%G | .71% | .71%G |
| Net investment income (loss) | .49%G | 1.55% | 1.95%G |
| Supplemental Data | | | |
| Net assets, end of period (000 omitted) | $1,406 | $699 | $107 |
| Portfolio turnover rateH | 45%G | 44% | 48%G |
A For the period August 31, 2018 (commencement of operations) to March 31, 2019.
B Calculated based on average shares outstanding during the period.
C The amount shown for a share outstanding does not correspond with the aggregate net gain (loss) on investments for the period due to the timing of sales and repurchases of shares in relation to fluctuating market values of the investments of the Fund.
D Total returns for periods of less than one year are not annualized.
E Total returns do not include the effect of the sales charges.
F Expense ratios reflect operating expenses of the class. Expenses before reductions do not reflect amounts reimbursed, waived, or reduced through arrangements with the investment adviser, brokerage services, or other offset arrangements, if applicable, and do not represent the amount paid by the class during periods when reimbursements, waivers or reductions occur.
G Annualized
H Amount does not include the portfolio activity of any underlying mutual funds or exchange-traded funds (ETFs).
See accompanying notes which are an integral part of the financial statements.
Fidelity Freedom Blend Income Fund Class M
| | Six months ended (Unaudited) September 30, | Years endedMarch 31, | |
| | 2020 | 2020 | 2019 A |
| Selected Per–Share Data | | | |
| Net asset value, beginning of period | $9.98 | $10.03 | $10.00 |
| Income from Investment Operations | | | |
| Net investment income (loss)B | .01 | .13 | .10 |
| Net realized and unrealized gain (loss) | .79 | .01C | .07 |
| Total from investment operations | .80 | .14 | .17 |
| Distributions from net investment income | (.01) | (.12) | (.09) |
| Distributions from net realized gain | (.03) | (.07) | (.05) |
| Total distributions | (.04) | (.19) | (.14) |
| Net asset value, end of period | $10.74 | $9.98 | $10.03 |
| Total ReturnD,E,F | 8.08% | 1.35% | 1.76% |
| Ratios to Average Net AssetsG | | | |
| Expenses before reductions | .96%H | .96% | .96%H |
| Expenses net of fee waivers, if any | .96%H | .96% | .96%H |
| Expenses net of all reductions | .95%H | .96% | .96%H |
| Net investment income (loss) | .25%H | 1.30% | 1.70%H |
| Supplemental Data | | | |
| Net assets, end of period (000 omitted) | $180 | $156 | $102 |
| Portfolio turnover rateI | 45%H | 44% | 48%H |
A For the period August 31, 2018 (commencement of operations) to March 31, 2019.
B Calculated based on average shares outstanding during the period.
C The amount shown for a share outstanding does not correspond with the aggregate net gain (loss) on investments for the period due to the timing of sales and repurchases of shares in relation to fluctuating market values of the investments of the Fund.
D Total returns for periods of less than one year are not annualized.
E Total returns would have been lower if certain expenses had not been reduced during the applicable periods shown.
F Total returns do not include the effect of the sales charges.
G Expense ratios reflect operating expenses of the class. Expenses before reductions do not reflect amounts reimbursed, waived, or reduced through arrangements with the investment adviser, brokerage services, or other offset arrangements, if applicable, and do not represent the amount paid by the class during periods when reimbursements, waivers or reductions occur.
H Annualized
I Amount does not include the portfolio activity of any underlying mutual funds or exchange-traded funds (ETFs).
See accompanying notes which are an integral part of the financial statements.
Fidelity Freedom Blend Income Fund Class C
| | Six months ended (Unaudited) September 30, | Years endedMarch 31, | |
| | 2020 | 2020 | 2019 A |
| Selected Per–Share Data | | | |
| Net asset value, beginning of period | $9.95 | $10.01 | $10.00 |
| Income from Investment Operations | | | |
| Net investment income (loss)B | (.01) | .08 | .07 |
| Net realized and unrealized gain (loss) | .78 | .01C | .07 |
| Total from investment operations | .77 | .09 | .14 |
| Distributions from net investment income | –D | (.08) | (.08) |
| Distributions from net realized gain | (.03) | (.07) | (.05) |
| Total distributions | (.03) | (.15) | (.13) |
| Net asset value, end of period | $10.69 | $9.95 | $10.01 |
| Total ReturnE,F | 7.80% | .85% | 1.45% |
| Ratios to Average Net AssetsG | | | |
| Expenses before reductions | 1.46%H | 1.46% | 1.47%H,I |
| Expenses net of fee waivers, if any | 1.46%H | 1.46% | 1.47%H,I |
| Expenses net of all reductions | 1.46%H | 1.46% | 1.47%H,I |
| Net investment income (loss) | (.26)%H | .81% | 1.19%H |
| Supplemental Data | | | |
| Net assets, end of period (000 omitted) | $760 | $228 | $123 |
| Portfolio turnover rateJ | 45%H | 44% | 48%H |
A For the period August 31, 2018 (commencement of operations) to March 31, 2019.
B Calculated based on average shares outstanding during the period.
C The amount shown for a share outstanding does not correspond with the aggregate net gain (loss) on investments for the period due to the timing of sales and repurchases of shares in relation to fluctuating market values of the investments of the Fund.
D Amount represents less than $.005 per share.
E Total returns for periods of less than one year are not annualized.
F Total returns do not include the effect of the contingent deferred sales charge.
G Expense ratios reflect operating expenses of the class. Expenses before reductions do not reflect amounts reimbursed, waived, or reduced through arrangements with the investment adviser, brokerage services, or other offset arrangements, if applicable, and do not represent the amount paid by the class during periods when reimbursements, waivers or reductions occur.
H Annualized
I On certain classes, the size and fluctuation of net assets and expense amounts may cause ratios to differ from contractual rates.
J Amount does not include the portfolio activity of any underlying mutual funds or exchange-traded funds (ETFs).
See accompanying notes which are an integral part of the financial statements.
Fidelity Freedom Blend Income Fund
| | Six months ended (Unaudited) September 30, | Years endedMarch 31, | |
| | 2020 | 2020 | 2019 A |
| Selected Per–Share Data | | | |
| Net asset value, beginning of period | $9.98 | $10.03 | $10.00 |
| Income from Investment Operations | | | |
| Net investment income (loss)B | .04 | .18 | .13 |
| Net realized and unrealized gain (loss) | .79 | .01C | .07 |
| Total from investment operations | .83 | .19 | .20 |
| Distributions from net investment income | (.04) | (.17) | (.12) |
| Distributions from net realized gain | (.03) | (.07) | (.05) |
| Total distributions | (.07) | (.24) | (.17) |
| Net asset value, end of period | $10.74 | $9.98 | $10.03 |
| Total ReturnD | 8.38% | 1.83% | 2.04% |
| Ratios to Average Net AssetsE | | | |
| Expenses before reductions | .46%F | .46% | .46%F |
| Expenses net of fee waivers, if any | .46%F | .46% | .46%F |
| Expenses net of all reductions | .46%F | .46% | .46%F |
| Net investment income (loss) | .74%F | 1.80% | 2.20%F |
| Supplemental Data | | | |
| Net assets, end of period (000 omitted) | $3,684 | $2,729 | $378 |
| Portfolio turnover rateG | 45%F | 44% | 48%F |
A For the period August 31, 2018 (commencement of operations) to March 31, 2019.
B Calculated based on average shares outstanding during the period.
C The amount shown for a share outstanding does not correspond with the aggregate net gain (loss) on investments for the period due to the timing of sales and repurchases of shares in relation to fluctuating market values of the investments of the Fund.
D Total returns for periods of less than one year are not annualized.
E Expense ratios reflect operating expenses of the class. Expenses before reductions do not reflect amounts reimbursed, waived, or reduced through arrangements with the investment adviser, brokerage services, or other offset arrangements, if applicable, and do not represent the amount paid by the class during periods when reimbursements, waivers or reductions occur.
F Annualized
G Amount does not include the portfolio activity of any underlying mutual funds or exchange-traded funds (ETFs).
See accompanying notes which are an integral part of the financial statements.
Fidelity Freedom Blend Income Fund Class K
| | Six months ended (Unaudited) September 30, | Years endedMarch 31, | |
| | 2020 | 2020 | 2019 A |
| Selected Per–Share Data | | | |
| Net asset value, beginning of period | $9.99 | $10.04 | $10.00 |
| Income from Investment Operations | | | |
| Net investment income (loss)B | .04 | .20 | .13 |
| Net realized and unrealized gain (loss) | .80 | –C | .08 |
| Total from investment operations | .84 | .20 | .21 |
| Distributions from net investment income | (.04) | (.18) | (.12) |
| Distributions from net realized gain | (.03) | (.07) | (.05) |
| Total distributions | (.08)D | (.25) | (.17) |
| Net asset value, end of period | $10.75 | $9.99 | $10.04 |
| Total ReturnE | 8.41% | 1.90% | 2.20% |
| Ratios to Average Net AssetsF | | | |
| Expenses before reductions | .36%G | .36% | .36%G |
| Expenses net of fee waivers, if any | .36%G | .36% | .36%G |
| Expenses net of all reductions | .36%G | .36% | .36%G |
| Net investment income (loss) | .84%G | 1.90% | 2.30%G |
| Supplemental Data | | | |
| Net assets, end of period (000 omitted) | $408 | $404 | $102 |
| Portfolio turnover rateH | 45%G | 44% | 48%G |
A For the period August 31, 2018 (commencement of operations) to March 31, 2019.
B Calculated based on average shares outstanding during the period.
C Amount represents less than $.005 per share.
D Total distributions per share do not sum due to rounding.
E Total returns for periods of less than one year are not annualized.
F Expense ratios reflect operating expenses of the class. Expenses before reductions do not reflect amounts reimbursed, waived, or reduced through arrangements with the investment adviser, brokerage services, or other offset arrangements, if applicable, and do not represent the amount paid by the class during periods when reimbursements, waivers or reductions occur.
G Annualized
H Amount does not include the portfolio activity of any underlying mutual funds or exchange-traded funds (ETFs).
See accompanying notes which are an integral part of the financial statements.
Fidelity Freedom Blend Income Fund Class K6
| | Six months ended (Unaudited) September 30, | Years endedMarch 31, | |
| | 2020 | 2020 | 2019 A |
| Selected Per–Share Data | | | |
| Net asset value, beginning of period | $9.99 | $10.04 | $10.00 |
| Income from Investment Operations | | | |
| Net investment income (loss)B | .05 | .21 | .14 |
| Net realized and unrealized gain (loss) | .79 | –C | .08 |
| Total from investment operations | .84 | .21 | .22 |
| Distributions from net investment income | (.05) | (.19) | (.13) |
| Distributions from net realized gain | (.03) | (.07) | (.05) |
| Total distributions | (.08) | (.26) | (.18) |
| Net asset value, end of period | $10.75 | $9.99 | $10.04 |
| Total ReturnD | 8.48% | 1.97% | 2.24% |
| Ratios to Average Net AssetsE | | | |
| Expenses before reductions | .26%F | .26% | .26%F |
| Expenses net of fee waivers, if any | .26%F | .26% | .26%F |
| Expenses net of all reductions | .26%F | .26% | .26%F |
| Net investment income (loss) | .94%F | 2.00% | 2.39%F |
| Supplemental Data | | | |
| Net assets, end of period (000 omitted) | $46,811 | $38,898 | $1,658 |
| Portfolio turnover rateG | 45%F | 44% | 48%F |
A For the period August 31, 2018 (commencement of operations) to March 31, 2019.
B Calculated based on average shares outstanding during the period.
C Amount represents less than $.005 per share.
D Total returns for periods of less than one year are not annualized.
E Expense ratios reflect operating expenses of the class. Expenses before reductions do not reflect amounts reimbursed, waived, or reduced through arrangements with the investment adviser, brokerage services, or other offset arrangements, if applicable, and do not represent the amount paid by the class during periods when reimbursements, waivers or reductions occur.
F Annualized
G Amount does not include the portfolio activity of any underlying mutual funds or exchange-traded funds (ETFs).
See accompanying notes which are an integral part of the financial statements.
Fidelity Freedom Blend Income Fund Class I
| | Six months ended (Unaudited) September 30, | Years endedMarch 31, | |
| | 2020 | 2020 | 2019 A |
| Selected Per–Share Data | | | |
| Net asset value, beginning of period | $9.99 | $10.04 | $10.00 |
| Income from Investment Operations | | | |
| Net investment income (loss)B | .04 | .19 | .13 |
| Net realized and unrealized gain (loss) | .80 | (.01) | .08 |
| Total from investment operations | .84 | .18 | .21 |
| Distributions from net investment income | (.04) | (.17) | (.12) |
| Distributions from net realized gain | (.03) | (.07) | (.05) |
| Total distributions | (.08)C | (.23)C | (.17) |
| Net asset value, end of period | $10.75 | $9.99 | $10.04 |
| Total ReturnD | 8.40% | 1.76% | 2.14% |
| Ratios to Average Net AssetsE | | | |
| Expenses before reductions | .46%F | .46% | .46%F |
| Expenses net of fee waivers, if any | .46%F | .46% | .46%F |
| Expenses net of all reductions | .46%F | .46% | .46%F |
| Net investment income (loss) | .74%F | 1.80% | 2.20%F |
| Supplemental Data | | | |
| Net assets, end of period (000 omitted) | $670 | $242 | $102 |
| Portfolio turnover rateG | 45%F | 44% | 48%F |
A For the period August 31, 2018 (commencement of operations) to March 31, 2019.
B Calculated based on average shares outstanding during the period.
C Total distributions per share do not sum due to rounding.
D Total returns for periods of less than one year are not annualized.
E Expense ratios reflect operating expenses of the class. Expenses before reductions do not reflect amounts reimbursed, waived, or reduced through arrangements with the investment adviser, brokerage services, or other offset arrangements, if applicable, and do not represent the amount paid by the class during periods when reimbursements, waivers or reductions occur.
F Annualized
G Amount does not include the portfolio activity of any underlying mutual funds or exchange-traded funds (ETFs).
See accompanying notes which are an integral part of the financial statements.
Fidelity Freedom Blend Income Fund Class Z
| | Six months ended (Unaudited) September 30, | Years endedMarch 31, | |
| | 2020 | 2020 | 2019 A |
| Selected Per–Share Data | | | |
| Net asset value, beginning of period | $9.99 | $10.04 | $10.00 |
| Income from Investment Operations | | | |
| Net investment income (loss)B | .04 | .20 | .13 |
| Net realized and unrealized gain (loss) | .80 | (.01) | .08 |
| Total from investment operations | .84 | .19 | .21 |
| Distributions from net investment income | (.05) | (.18) | (.12) |
| Distributions from net realized gain | (.03) | (.07) | (.05) |
| Total distributions | (.08) | (.24)C | (.17) |
| Net asset value, end of period | $10.75 | $9.99 | $10.04 |
| Total ReturnD | 8.46% | 1.86% | 2.20% |
| Ratios to Average Net AssetsE | | | |
| Expenses before reductions | .37%F,G | .36% | .36%F |
| Expenses net of fee waivers, if any | .37%F,G | .36% | .36%F |
| Expenses net of all reductions | .37%F,G | .36% | .36%F |
| Net investment income (loss) | .83%F | 1.90% | 2.30%F |
| Supplemental Data | | | |
| Net assets, end of period (000 omitted) | $1,043 | $104 | $102 |
| Portfolio turnover rateH | 45%F | 44% | 48%F |
A For the period August 31, 2018 (commencement of operations) to March 31, 2019.
B Calculated based on average shares outstanding during the period.
C Total distributions per share do not sum due to rounding.
D Total returns for periods of less than one year are not annualized.
E Expense ratios reflect operating expenses of the class. Expenses before reductions do not reflect amounts reimbursed, waived, or reduced through arrangements with the investment adviser, brokerage services, or other offset arrangements, if applicable, and do not represent the amount paid by the class during periods when reimbursements, waivers or reductions occur.
F Annualized
G On certain classes, the size and fluctuation of net assets and expense amounts may cause ratios to differ from contractual rates.
H Amount does not include the portfolio activity of any underlying mutual funds or exchange-traded funds (ETFs).
See accompanying notes which are an integral part of the financial statements.
Fidelity Freedom Blend Income Fund Class Z6
| | Six months ended (Unaudited) September 30, | Years endedMarch 31, | |
| | 2020 | 2020 | 2019 A |
| Selected Per–Share Data | | | |
| Net asset value, beginning of period | $10.00 | $10.04 | $10.00 |
| Income from Investment Operations | | | |
| Net investment income (loss)B | .05 | .21 | .14 |
| Net realized and unrealized gain (loss) | .79 | –C | .08 |
| Total from investment operations | .84 | .21 | .22 |
| Distributions from net investment income | (.05) | (.18) | (.13) |
| Distributions from net realized gain | (.03) | (.07) | (.05) |
| Total distributions | (.08) | (.25) | (.18) |
| Net asset value, end of period | $10.76 | $10.00 | $10.04 |
| Total ReturnD | 8.46% | 2.04% | 2.23% |
| Ratios to Average Net AssetsE | | | |
| Expenses before reductions | .26%F | .26% | .26%F |
| Expenses net of fee waivers, if any | .26%F | .26% | .26%F |
| Expenses net of all reductions | .26%F | .26% | .26%F |
| Net investment income (loss) | .94%F | 2.00% | 2.40%F |
| Supplemental Data | | | |
| Net assets, end of period (000 omitted) | $118 | $154 | $102 |
| Portfolio turnover rateG | 45%F | 44% | 48%F |
A For the period August 31, 2018 (commencement of operations) to March 31, 2019.
B Calculated based on average shares outstanding during the period.
C Amount represents less than $.005 per share.
D Total returns for periods of less than one year are not annualized.
E Expense ratios reflect operating expenses of the class. Expenses before reductions do not reflect amounts reimbursed, waived, or reduced through arrangements with the investment adviser, brokerage services, or other offset arrangements, if applicable, and do not represent the amount paid by the class during periods when reimbursements, waivers or reductions occur.
F Annualized
G Amount does not include the portfolio activity of any underlying mutual funds or exchange-traded funds (ETFs).
See accompanying notes which are an integral part of the financial statements.
Fidelity Freedom® Blend 2005 Fund
Investment Summary (Unaudited)
The information in the following tables is based on the direct investments of the Fund.
Top Holdings as of September 30, 2020
| | % of fund's net assets |
| Fidelity Series Inflation-Protected Bond Index Fund | 11.1 |
| Fidelity Series Investment Grade Bond Fund | 11.0 |
| Fidelity Series Treasury Bill Index Fund | 10.7 |
| Fidelity Series Government Bond Index Fund | 9.9 |
| Fidelity Series Corporate Bond Fund | 8.3 |
| Fidelity Series Investment Grade Securitized Fund | 7.5 |
| Fidelity Series Government Money Market Fund 0.16% | 7.5 |
| Fidelity Series Emerging Markets Opportunities Fund | 7.0 |
| Fidelity Series Short-Term Credit Fund | 3.2 |
| Fidelity Series Large Cap Value Index Fund | 2.8 |
| | 79.0 |
Asset Allocation (% of fund's net assets)
| Period end |
| | Domestic Equity Funds | 12.1% |
| | International Equity Funds | 14.5% |
| | Bond Funds | 52.0% |
| | Short-Term Funds | 21.4% |

Domestic Equity Funds category includes Fidelity Series Commodity Strategy Fund which invests in commodity-related investments.
Fidelity Freedom® Blend 2005 Fund
Schedule of Investments September 30, 2020 (Unaudited)
Showing Percentage of Net Assets
| Domestic Equity Funds - 12.1% | | | |
| | | Shares | Value |
| Fidelity Series Blue Chip Growth Fund (a) | | 27,575 | $455,257 |
| Fidelity Series Commodity Strategy Fund (a) | | 128,545 | 534,749 |
| Fidelity Series Large Cap Growth Index Fund (a) | | 20,468 | 291,463 |
| Fidelity Series Large Cap Stock Fund (a) | | 22,173 | 313,970 |
| Fidelity Series Large Cap Value Index Fund (a) | | 51,195 | 593,868 |
| Fidelity Series Small Cap Opportunities Fund (a) | | 11,711 | 149,431 |
| Fidelity Series Value Discovery Fund (a) | | 17,442 | 215,587 |
| TOTAL DOMESTIC EQUITY FUNDS | | | |
| (Cost $2,454,979) | | | 2,554,325 |
|
| International Equity Funds - 14.5% | | | |
| Fidelity Series Canada Fund (a) | | 13,079 | 133,794 |
| Fidelity Series Emerging Markets Fund (a) | | 17,366 | 163,766 |
| Fidelity Series Emerging Markets Opportunities Fund (a) | | 70,136 | 1,471,463 |
| Fidelity Series International Growth Fund (a) | | 18,557 | 348,494 |
| Fidelity Series International Index Fund (a) | | 14,371 | 142,848 |
| Fidelity Series International Small Cap Fund (a) | | 6,990 | 124,430 |
| Fidelity Series International Value Fund (a) | | 39,963 | 344,485 |
| Fidelity Series Overseas Fund (a) | | 31,126 | 347,994 |
| TOTAL INTERNATIONAL EQUITY FUNDS | | | |
| (Cost $2,770,403) | | | 3,077,274 |
|
| Bond Funds - 52.0% | | | |
| Fidelity Series Corporate Bond Fund (a) | | 155,660 | 1,751,174 |
| Fidelity Series Emerging Markets Debt Fund (a) | | 15,139 | 137,162 |
| Fidelity Series Floating Rate High Income Fund (a) | | 3,375 | 29,867 |
| Fidelity Series Government Bond Index Fund (a) | | 186,050 | 2,093,059 |
| Fidelity Series High Income Fund (a) | | 16,676 | 152,086 |
| Fidelity Series Inflation-Protected Bond Index Fund (a) | | 218,895 | 2,342,172 |
| Fidelity Series Investment Grade Bond Fund (a) | | 190,312 | 2,329,416 |
| Fidelity Series Investment Grade Securitized Fund (a) | | 148,768 | 1,587,357 |
| Fidelity Series Long-Term Treasury Bond Index Fund (a) | | 46,947 | 484,964 |
| Fidelity Series Real Estate Income Fund (a) | | 9,152 | 91,338 |
| TOTAL BOND FUNDS | | | |
| (Cost $10,348,080) | | | 10,998,595 |
|
| Short-Term Funds - 21.4% | | | |
| Fidelity Cash Central Fund 0.10% (b) | | 49 | 49 |
| Fidelity Series Government Money Market Fund 0.16% (a)(c) | | 1,577,311 | 1,577,311 |
| Fidelity Series Short-Term Credit Fund (a) | | 65,572 | 672,110 |
| Fidelity Series Treasury Bill Index Fund (a) | | 226,374 | 2,265,999 |
| TOTAL SHORT-TERM FUNDS | | | |
| (Cost $4,496,419) | | | 4,515,469 |
| TOTAL INVESTMENT IN SECURITIES - 100.0% | | | |
| (Cost $20,069,881) | | | 21,145,663 |
| NET OTHER ASSETS (LIABILITIES) - 0.0% | | | (379) |
| NET ASSETS - 100% | | | $21,145,284 |
Legend
(a) Affiliated Fund
(b) Affiliated fund that is generally available only to investment companies and other accounts managed by Fidelity Investments. The rate quoted is the annualized seven-day yield of the fund at period end. A complete unaudited listing of the fund's holdings as of its most recent quarter end is available upon request. In addition, each Fidelity Central Fund's financial statements are available on the SEC's website or upon request.
(c) The rate quoted is the annualized seven-day yield of the fund at period end.
Affiliated Underlying Funds
Fiscal year to date information regarding the Fund's investments in affiliated Underlying Funds, excluding any Money Market Central Funds, is presented below. Exchanges between classes of the same affiliated Underlying Funds may occur.
| Affiliate | Value, beginning of period | Purchases | Sales Proceeds | Dividend Income | Realized Gain (loss) | Change in Unrealized appreciation (depreciation) | Value, end of period |
| Fidelity Series Blue Chip Growth Fund | $234,125 | $287,508 | $147,365 | $88,910 | $14,564 | $66,425 | $455,257 |
| Fidelity Series Canada Fund | 107,781 | 45,294 | 43,514 | -- | (5,738) | 29,971 | 133,794 |
| Fidelity Series Commodity Strategy Fund | 503,406 | 179,494 | 207,510 | 2,206 | (24,514) | 83,873 | 534,749 |
| Fidelity Series Corporate Bond Fund | 1,078,330 | 667,109 | 120,052 | 22,444 | 2,060 | 123,727 | 1,751,174 |
| Fidelity Series Emerging Markets Debt Fund | 92,988 | 40,839 | 8,884 | 3,148 | 345 | 11,874 | 137,162 |
| Fidelity Series Emerging Markets Fund | 70,351 | 83,904 | 24,484 | -- | 1,291 | 32,704 | 163,766 |
| Fidelity Series Emerging Markets Opportunities Fund | 700,881 | 694,233 | 237,164 | -- | 15,289 | 298,224 | 1,471,463 |
| Fidelity Series Floating Rate High Income Fund | 20,111 | 9,690 | 2,149 | 572 | 95 | 2,120 | 29,867 |
| Fidelity Series Government Bond Index Fund | 1,666,476 | 709,303 | 276,987 | 13,863 | 4,014 | (9,747) | 2,093,059 |
| Fidelity Series Government Money Market Fund 0.16% | 651,371 | 1,587,907 | 661,967 | 1,213 | -- | -- | 1,577,311 |
| Fidelity Series High Income Fund | 101,928 | 49,171 | 10,746 | 3,577 | 438 | 11,295 | 152,086 |
| Fidelity Series Inflation-Protected Bond Index Fund | 1,634,575 | 753,958 | 161,389 | 1,573 | 500 | 114,528 | 2,342,172 |
| Fidelity Series International Growth Fund | 312,968 | 108,361 | 158,352 | -- | 7,899 | 77,618 | 348,494 |
| Fidelity Series International Index Fund | 101,586 | 62,942 | 46,821 | -- | (630) | 25,771 | 142,848 |
| Fidelity Series International Small Cap Fund | 87,392 | 32,033 | 24,849 | -- | 2,102 | 27,752 | 124,430 |
| Fidelity Series International Value Fund | 295,735 | 114,940 | 125,259 | -- | (1,218) | 60,287 | 344,485 |
| Fidelity Series Investment Grade Bond Fund | 1,636,524 | 770,649 | 186,120 | 25,881 | 1,453 | 106,910 | 2,329,416 |
| Fidelity Series Investment Grade Securitized Fund | 1,132,511 | 567,897 | 128,279 | 8,539 | 494 | 14,734 | 1,587,357 |
| Fidelity Series Large Cap Growth Index Fund | 169,793 | 123,729 | 87,828 | 4,618 | 5,294 | 80,475 | 291,463 |
| Fidelity Series Large Cap Stock Fund | 175,820 | 158,455 | 54,244 | 10,444 | 3,115 | 30,824 | 313,970 |
| Fidelity Series Large Cap Value Index Fund | 331,392 | 283,575 | 94,681 | -- | 5,210 | 68,372 | 593,868 |
| Fidelity Series Long-Term Treasury Bond Index Fund | 368,589 | 196,866 | 68,754 | 10,363 | 3,579 | (15,316) | 484,964 |
| Fidelity Series Overseas Fund | 295,600 | 118,419 | 150,160 | -- | 1,941 | 82,194 | 347,994 |
| Fidelity Series Real Estate Income Fund | 55,473 | 31,204 | 6,734 | 2,632 | 506 | 10,889 | 91,338 |
| Fidelity Series Short-Term Credit Fund | 640,769 | 7,309 | -- | 7,310 | -- | 24,032 | 672,110 |
| Fidelity Series Small Cap Opportunities Fund | 84,852 | 73,234 | 33,408 | 877 | (212) | 24,965 | 149,431 |
| Fidelity Series Treasury Bill Index Fund | 2,186,416 | 87,925 | 1,618 | 8,940 | (2) | (6,722) | 2,265,999 |
| Fidelity Series Value Discovery Fund | 100,501 | 116,872 | 30,028 | -- | 891 | 27,351 | 215,587 |
| | 14,838,244 | 7,962,820 | 3,099,346 | 217,110 | 38,766 | 1,405,130 | 21,145,614 |
Amounts in the income column in the above table include any capital gain distributions from underlying funds, which are presented in the corresponding line-item in the Statement of Operations, if applicable.
Investment Valuation
The following is a summary of the inputs used, as of September 30, 2020, involving the Fund's assets and liabilities carried at fair value. The inputs or methodology used for valuing securities may not be an indication of the risk associated with investing in those securities. For more information on valuation inputs, and their aggregation into the levels used below, please refer to the Investment Valuation section in the accompanying Notes to Financial Statements.
| | Valuation Inputs at Reporting Date: |
| Description | Total | Level 1 | Level 2 | Level 3 |
| Investments in Securities: | | | | |
| Domestic Equity Funds | $2,554,325 | $2,554,325 | $-- | $-- |
| International Equity Funds | 3,077,274 | 3,077,274 | -- | -- |
| Bond Funds | 10,998,595 | 10,998,595 | -- | -- |
| Short-Term Funds | 4,515,469 | 4,515,469 | -- | -- |
| Total Investments in Securities: | $21,145,663 | $21,145,663 | $-- | $-- |
See accompanying notes which are an integral part of the financial statements.
Fidelity Freedom® Blend 2005 Fund
Financial Statements
Statement of Assets and Liabilities
| | | September 30, 2020 (Unaudited) |
| Assets | | |
Investment in securities, at value — See accompanying schedule:
| | |
| Fidelity Central Funds (cost $49) | $49 | |
| Other affiliated issuers (cost $20,069,832) | 21,145,614 | |
| Total Investment in Securities (cost $20,069,881) | | $21,145,663 |
| Cash | | 193 |
| Receivable for investments sold | | 97,447 |
| Receivable for fund shares sold | | 6,944 |
| Total assets | | 21,250,247 |
| Liabilities | | |
| Payable for investments purchased | $99,544 | |
| Payable for fund shares redeemed | 2 | |
| Accrued management fee | 5,084 | |
| Distribution and service plan fees payable | 333 | |
| Total liabilities | | 104,963 |
| Net Assets | | $21,145,284 |
| Net Assets consist of: | | |
| Paid in capital | | $19,978,765 |
| Total accumulated earnings (loss) | | 1,166,519 |
| Net Assets | | $21,145,284 |
| Net Asset Value and Maximum Offering Price | | |
| Class A: | | |
| Net Asset Value and redemption price per share ($306,153 ÷ 28,501 shares)(a) | | $10.74 |
| Maximum offering price per share (100/94.25 of $10.74) | | $11.40 |
| Class M: | | |
| Net Asset Value and redemption price per share ($129,318 ÷ 12,036 shares)(a) | | $10.74 |
| Maximum offering price per share (100/96.50 of $10.74) | | $11.13 |
| Class C: | | |
| Net Asset Value and offering price per share ($251,215 ÷ 23,554 shares)(a) | | $10.67 |
| Fidelity Freedom Blend 2005 Fund: | | |
| Net Asset Value, offering price and redemption price per share ($1,594,694 ÷ 148,122 shares) | | $10.77 |
| Class K: | | |
| Net Asset Value, offering price and redemption price per share ($567,746 ÷ 52,674 shares) | | $10.78 |
| Class K6: | | |
| Net Asset Value, offering price and redemption price per share ($17,207,602 ÷ 1,595,773 shares) | | $10.78 |
| Class I: | | |
| Net Asset Value, offering price and redemption price per share ($726,611 ÷ 67,512 shares) | | $10.76 |
| Class Z: | | |
| Net Asset Value, offering price and redemption price per share ($242,651 ÷ 22,497 shares) | | $10.79 |
| Class Z6: | | |
| Net Asset Value, offering price and redemption price per share ($119,294 ÷ 11,053 shares) | | $10.79 |
(a) Redemption price per share is equal to net asset value less any applicable contingent deferred sales charge.
See accompanying notes which are an integral part of the financial statements.
Statement of Operations
| | | Six months ended September 30, 2020 (Unaudited) |
| Investment Income | | |
| Dividends: | | |
| Affiliated issuers | | $106,181 |
| Expenses | | |
| Management fee | $26,740 | |
| Distribution and service plan fees | 2,059 | |
| Independent trustees' fees and expenses | 24 | |
| Total expenses | | 28,823 |
| Net investment income (loss) | | 77,358 |
| Realized and Unrealized Gain (Loss) | | |
| Net realized gain (loss) on: | | |
| Investment securities: | | |
| Affiliated issuers | 38,766 | |
| Capital gain distributions from underlying funds: | | |
| Affiliated issuers | 110,929 | |
| Total net realized gain (loss) | | 149,695 |
| Change in net unrealized appreciation (depreciation) on: | | |
| Investment securities: | | |
| Affiliated issuers | 1,405,130 | |
| Total change in net unrealized appreciation (depreciation) | | 1,405,130 |
| Net gain (loss) | | 1,554,825 |
| Net increase (decrease) in net assets resulting from operations | | $1,632,183 |
See accompanying notes which are an integral part of the financial statements.
Statement of Changes in Net Assets
| | Six months ended September 30, 2020 (Unaudited) | Year ended March 31, 2020 |
| Increase (Decrease) in Net Assets | | |
| Operations | | |
| Net investment income (loss) | $77,358 | $262,828 |
| Net realized gain (loss) | 149,695 | 68,151 |
| Change in net unrealized appreciation (depreciation) | 1,405,130 | (375,039) |
| Net increase (decrease) in net assets resulting from operations | 1,632,183 | (44,060) |
| Distributions to shareholders | (121,042) | (354,729) |
| Share transactions - net increase (decrease) | 4,796,122 | 13,151,118 |
| Total increase (decrease) in net assets | 6,307,263 | 12,752,329 |
| Net Assets | | |
| Beginning of period | 14,838,021 | 2,085,692 |
| End of period | $21,145,284 | $14,838,021 |
See accompanying notes which are an integral part of the financial statements.
Financial Highlights
Fidelity Freedom Blend 2005 Fund Class A
| | Six months ended (Unaudited) September 30, | Years endedMarch 31, | |
| | 2020 | 2020 | 2019 A |
| Selected Per–Share Data | | | |
| Net asset value, beginning of period | $9.85 | $9.99 | $10.00 |
| Income from Investment Operations | | | |
| Net investment income (loss)B | .02 | .16 | .11 |
| Net realized and unrealized gain (loss) | .94 | (.08) | .04 |
| Total from investment operations | .96 | .08 | .15 |
| Distributions from net investment income | (.02) | (.13) | (.10) |
| Distributions from net realized gain | (.05) | (.09) | (.07) |
| Total distributions | (.07) | (.22) | (.16)C |
| Net asset value, end of period | $10.74 | $9.85 | $9.99 |
| Total ReturnD,E | 9.76% | .68% | 1.62% |
| Ratios to Average Net AssetsF | | | |
| Expenses before reductions | .71%G | .71% | .71%G |
| Expenses net of fee waivers, if any | .71%G | .71% | .71%G |
| Expenses net of all reductions | .71%G | .71% | .71%G |
| Net investment income (loss) | .45%G | 1.56% | 1.88%G |
| Supplemental Data | | | |
| Net assets, end of period (000 omitted) | $306 | $263 | $187 |
| Portfolio turnover rateH | 34%G | 64% | 11%G |
A For the period August 31, 2018 (commencement of operations) to March 31, 2019.
B Calculated based on average shares outstanding during the period.
C Total distributions per share do not sum due to rounding.
D Total returns for periods of less than one year are not annualized.
E Total returns do not include the effect of the sales charges.
F Expense ratios reflect operating expenses of the class. Expenses before reductions do not reflect amounts reimbursed, waived, or reduced through arrangements with the investment adviser, brokerage services, or other offset arrangements, if applicable, and do not represent the amount paid by the class during periods when reimbursements, waivers or reductions occur.
G Annualized
H Amount does not include the portfolio activity of any underlying mutual funds or exchange-traded funds (ETFs).
See accompanying notes which are an integral part of the financial statements.
Fidelity Freedom Blend 2005 Fund Class M
| | Six months ended (Unaudited) September 30, | Years endedMarch 31, | |
| | 2020 | 2020 | 2019 A |
| Selected Per–Share Data | | | |
| Net asset value, beginning of period | $9.85 | $9.99 | $10.00 |
| Income from Investment Operations | | | |
| Net investment income (loss)B | .01 | .13 | .09 |
| Net realized and unrealized gain (loss) | .93 | (.07) | .05 |
| Total from investment operations | .94 | .06 | .14 |
| Distributions from net investment income | (.01) | (.11) | (.08) |
| Distributions from net realized gain | (.05) | (.09) | (.07) |
| Total distributions | (.05)C | (.20) | (.15) |
| Net asset value, end of period | $10.74 | $9.85 | $9.99 |
| Total ReturnD,E | 9.62% | .45% | 1.43% |
| Ratios to Average Net AssetsF | | | |
| Expenses before reductions | .96%G | .96% | .96%G |
| Expenses net of fee waivers, if any | .96%G | .96% | .96%G |
| Expenses net of all reductions | .96%G | .96% | .96%G |
| Net investment income (loss) | .20%G | 1.31% | 1.63%G |
| Supplemental Data | | | |
| Net assets, end of period (000 omitted) | $129 | $108 | $101 |
| Portfolio turnover rateH | 34%G | 64% | 11%G |
A For the period August 31, 2018 (commencement of operations) to March 31, 2019.
B Calculated based on average shares outstanding during the period.
C Total distributions per share do not sum due to rounding.
D Total returns for periods of less than one year are not annualized.
E Total returns do not include the effect of the sales charges.
F Expense ratios reflect operating expenses of the class. Expenses before reductions do not reflect amounts reimbursed, waived, or reduced through arrangements with the investment adviser, brokerage services, or other offset arrangements, if applicable, and do not represent the amount paid by the class during periods when reimbursements, waivers or reductions occur.
G Annualized
H Amount does not include the portfolio activity of any underlying mutual funds or exchange-traded funds (ETFs).
See accompanying notes which are an integral part of the financial statements.
Fidelity Freedom Blend 2005 Fund Class C
| | Six months ended (Unaudited) September 30, | Years endedMarch 31, | |
| | 2020 | 2020 | 2019 A |
| Selected Per–Share Data | | | |
| Net asset value, beginning of period | $9.81 | $9.98 | $10.00 |
| Income from Investment Operations | | | |
| Net investment income (loss)B | (.02) | .08 | .06 |
| Net realized and unrealized gain (loss) | .94 | (.08) | .05 |
| Total from investment operations | .92 | – | .11 |
| Distributions from net investment income | (.01) | (.08) | (.06) |
| Distributions from net realized gain | (.05) | (.09) | (.07) |
| Total distributions | (.06) | (.17) | (.13) |
| Net asset value, end of period | $10.67 | $9.81 | $9.98 |
| Total ReturnC,D | 9.44% | (.07)% | 1.15% |
| Ratios to Average Net AssetsE | | | |
| Expenses before reductions | 1.46%F | 1.46% | 1.46%F |
| Expenses net of fee waivers, if any | 1.46%F | 1.46% | 1.46%F |
| Expenses net of all reductions | 1.46%F | 1.46% | 1.46%F |
| Net investment income (loss) | (.30)%F | .81% | 1.13%F |
| Supplemental Data | | | |
| Net assets, end of period (000 omitted) | $251 | $256 | $101 |
| Portfolio turnover rateG | 34%F | 64% | 11%F |
A For the period August 31, 2018 (commencement of operations) to March 31, 2019.
B Calculated based on average shares outstanding during the period.
C Total returns for periods of less than one year are not annualized.
D Total returns do not include the effect of the contingent deferred sales charge.
E Expense ratios reflect operating expenses of the class. Expenses before reductions do not reflect amounts reimbursed, waived, or reduced through arrangements with the investment adviser, brokerage services, or other offset arrangements, if applicable, and do not represent the amount paid by the class during periods when reimbursements, waivers or reductions occur.
F Annualized
G Amount does not include the portfolio activity of any underlying mutual funds or exchange-traded funds (ETFs).
See accompanying notes which are an integral part of the financial statements.
Fidelity Freedom Blend 2005 Fund
| | Six months ended (Unaudited) September 30, | Years endedMarch 31, | |
| | 2020 | 2020 | 2019 A |
| Selected Per–Share Data | | | |
| Net asset value, beginning of period | $9.87 | $10.01 | $10.00 |
| Income from Investment Operations | | | |
| Net investment income (loss)B | .04 | .19 | .12 |
| Net realized and unrealized gain (loss) | .93 | (.08) | .05 |
| Total from investment operations | .97 | .11 | .17 |
| Distributions from net investment income | (.03) | (.15) | (.10) |
| Distributions from net realized gain | (.05) | (.10) | (.07) |
| Total distributions | (.07)C | (.25) | (.16)C |
| Net asset value, end of period | $10.77 | $9.87 | $10.01 |
| Total ReturnD | 9.92% | .94% | 1.80% |
| Ratios to Average Net AssetsE | | | |
| Expenses before reductions | .46%F | .46% | .46%F |
| Expenses net of fee waivers, if any | .46%F | .46% | .46%F |
| Expenses net of all reductions | .46%F | .46% | .46%F |
| Net investment income (loss) | .70%F | 1.81% | 2.13%F |
| Supplemental Data | | | |
| Net assets, end of period (000 omitted) | $1,595 | $1,126 | $111 |
| Portfolio turnover rateG | 34%F | 64% | 11%F |
A For the period August 31, 2018 (commencement of operations) to March 31, 2019.
B Calculated based on average shares outstanding during the period.
C Total distributions per share do not sum due to rounding.
D Total returns for periods of less than one year are not annualized.
E Expense ratios reflect operating expenses of the class. Expenses before reductions do not reflect amounts reimbursed, waived, or reduced through arrangements with the investment adviser, brokerage services, or other offset arrangements, if applicable, and do not represent the amount paid by the class during periods when reimbursements, waivers or reductions occur.
F Annualized
G Amount does not include the portfolio activity of any underlying mutual funds or exchange-traded funds (ETFs).
See accompanying notes which are an integral part of the financial statements.
Fidelity Freedom Blend 2005 Fund Class K
| | Six months ended (Unaudited) September 30, | Years endedMarch 31, | |
| | 2020 | 2020 | 2019 A |
| Selected Per–Share Data | | | |
| Net asset value, beginning of period | $9.88 | $10.01 | $10.00 |
| Income from Investment Operations | | | |
| Net investment income (loss)B | .04 | .20 | .13 |
| Net realized and unrealized gain (loss) | .94 | (.08) | .04 |
| Total from investment operations | .98 | .12 | .17 |
| Distributions from net investment income | (.03) | (.16) | (.10) |
| Distributions from net realized gain | (.05) | (.09) | (.07) |
| Total distributions | (.08) | (.25) | (.16)C |
| Net asset value, end of period | $10.78 | $9.88 | $10.01 |
| Total ReturnD | 9.95% | 1.06% | 1.83% |
| Ratios to Average Net AssetsE | | | |
| Expenses before reductions | .37%F,G | .36% | .36%F |
| Expenses net of fee waivers, if any | .37%F,G | .36% | .36%F |
| Expenses net of all reductions | .37%F,G | .36% | .36%F |
| Net investment income (loss) | .79%F | 1.91% | 2.23%F |
| Supplemental Data | | | |
| Net assets, end of period (000 omitted) | $568 | $178 | $102 |
| Portfolio turnover rateH | 34%F | 64% | 11%F |
A For the period August 31, 2018 (commencement of operations) to March 31, 2019.
B Calculated based on average shares outstanding during the period.
C Total distributions per share do not sum due to rounding.
D Total returns for periods of less than one year are not annualized.
E Expense ratios reflect operating expenses of the class. Expenses before reductions do not reflect amounts reimbursed, waived, or reduced through arrangements with the investment adviser, brokerage services, or other offset arrangements, if applicable, and do not represent the amount paid by the class during periods when reimbursements, waivers or reductions occur.
F Annualized
G On certain classes, the size and fluctuation of net assets and expense amounts may cause ratios to differ from contractual-rates.
H Amount does not include the portfolio activity of any underlying mutual funds or exchange-traded funds (ETFs).
See accompanying notes which are an integral part of the financial statements.
Fidelity Freedom Blend 2005 Fund Class K6
| | Six months ended (Unaudited) September 30, | Years endedMarch 31, | |
| | 2020 | 2020 | 2019 A |
| Selected Per–Share Data | | | |
| Net asset value, beginning of period | $9.88 | $10.01 | $10.00 |
| Income from Investment Operations | | | |
| Net investment income (loss)B | .05 | .21 | .13 |
| Net realized and unrealized gain (loss) | .93 | (.08) | .05 |
| Total from investment operations | .98 | .13 | .18 |
| Distributions from net investment income | (.03) | (.17) | (.10) |
| Distributions from net realized gain | (.05) | (.10) | (.07) |
| Total distributions | (.08) | (.26)C | (.17) |
| Net asset value, end of period | $10.78 | $9.88 | $10.01 |
| Total ReturnD | 9.96% | 1.19% | 1.86% |
| Ratios to Average Net AssetsE | | | |
| Expenses before reductions | .26%F | .26% | .26%F |
| Expenses net of fee waivers, if any | .26%F | .26% | .26%F |
| Expenses net of all reductions | .26%F | .26% | .26%F |
| Net investment income (loss) | .90%F | 2.01% | 2.32%F |
| Supplemental Data | | | |
| Net assets, end of period (000 omitted) | $17,208 | $12,005 | $1,177 |
| Portfolio turnover rateG | 34%F | 64% | 11%F |
A For the period August 31, 2018 (commencement of operations) to March 31, 2019.
B Calculated based on average shares outstanding during the period.
C Total distributions per share do not sum due to rounding.
D Total returns for periods of less than one year are not annualized.
E Expense ratios reflect operating expenses of the class. Expenses before reductions do not reflect amounts reimbursed, waived, or reduced through arrangements with the investment adviser, brokerage services, or other offset arrangements, if applicable, and do not represent the amount paid by the class during periods when reimbursements, waivers or reductions occur.
F Annualized
G Amount does not include the portfolio activity of any underlying mutual funds or exchange-traded funds (ETFs).
See accompanying notes which are an integral part of the financial statements.
Fidelity Freedom Blend 2005 Fund Class I
| | Six months ended (Unaudited) September 30, | Years endedMarch 31, | |
| | 2020 | 2020 | 2019 A |
| Selected Per–Share Data | | | |
| Net asset value, beginning of period | $9.86 | $10.01 | $10.00 |
| Income from Investment Operations | | | |
| Net investment income (loss)B | .04 | .19 | .12 |
| Net realized and unrealized gain (loss) | .93 | (.09) | .05 |
| Total from investment operations | .97 | .10 | .17 |
| Distributions from net investment income | (.03) | (.16) | (.10) |
| Distributions from net realized gain | (.05) | (.09) | (.07) |
| Total distributions | (.07)C | (.25) | (.16)C |
| Net asset value, end of period | $10.76 | $9.86 | $10.01 |
| Total ReturnD | 9.92% | .86% | 1.80% |
| Ratios to Average Net AssetsE | | | |
| Expenses before reductions | .46%F | .46% | .46%F |
| Expenses net of fee waivers, if any | .46%F | .46% | .46%F |
| Expenses net of all reductions | .46%F | .46% | .46%F |
| Net investment income (loss) | .70%F | 1.81% | 2.13%F |
| Supplemental Data | | | |
| Net assets, end of period (000 omitted) | $727 | $691 | $102 |
| Portfolio turnover rateG | 34%F | 64% | 11%F |
A For the period August 31, 2018 (commencement of operations) to March 31, 2019.
B Calculated based on average shares outstanding during the period.
C Total distributions per share do not sum due to rounding.
D Total returns for periods of less than one year are not annualized.
E Expense ratios reflect operating expenses of the class. Expenses before reductions do not reflect amounts reimbursed, waived, or reduced through arrangements with the investment adviser, brokerage services, or other offset arrangements, if applicable, and do not represent the amount paid by the class during periods when reimbursements, waivers or reductions occur.
F Annualized
G Amount does not include the portfolio activity of any underlying mutual funds or exchange-traded funds (ETFs).
See accompanying notes which are an integral part of the financial statements.
Fidelity Freedom Blend 2005 Fund Class Z
| | Six months ended (Unaudited) September 30, | Years endedMarch 31, | |
| | 2020 | 2020 | 2019 A |
| Selected Per–Share Data | | | |
| Net asset value, beginning of period | $9.88 | $10.01 | $10.00 |
| Income from Investment Operations | | | |
| Net investment income (loss)B | .04 | .20 | .13 |
| Net realized and unrealized gain (loss) | .95 | (.09) | .04 |
| Total from investment operations | .99 | .11 | .17 |
| Distributions from net investment income | (.03) | (.15) | (.10) |
| Distributions from net realized gain | (.05) | (.09) | (.07) |
| Total distributions | (.08) | (.24) | (.16)C |
| Net asset value, end of period | $10.79 | $9.88 | $10.01 |
| Total ReturnD | 10.03% | 1.01% | 1.83% |
| Ratios to Average Net AssetsE | | | |
| Expenses before reductions | .36%F | .36% | .36%F |
| Expenses net of fee waivers, if any | .36%F | .36% | .36%F |
| Expenses net of all reductions | .36%F | .36% | .36%F |
| Net investment income (loss) | .80%F | 1.91% | 2.23%F |
| Supplemental Data | | | |
| Net assets, end of period (000 omitted) | $243 | $103 | $102 |
| Portfolio turnover rateG | 34%F | 64% | 11%F |
A For the period August 31, 2018 (commencement of operations) to March 31, 2019.
B Calculated based on average shares outstanding during the period.
C Total distributions per share do not sum due to rounding.
D Total returns for periods of less than one year are not annualized.
E Expense ratios reflect operating expenses of the class. Expenses before reductions do not reflect amounts reimbursed, waived, or reduced through arrangements with the investment adviser, brokerage services, or other offset arrangements, if applicable, and do not represent the amount paid by the class during periods when reimbursements, waivers or reductions occur.
F Annualized
G Amount does not include the portfolio activity of any underlying mutual funds or exchange-traded funds (ETFs).
See accompanying notes which are an integral part of the financial statements.
Fidelity Freedom Blend 2005 Fund Class Z6
| | Six months ended (Unaudited) September 30, | Years endedMarch 31, | |
| | 2020 | 2020 | 2019 A |
| Selected Per–Share Data | | | |
| Net asset value, beginning of period | $9.88 | $10.01 | $10.00 |
| Income from Investment Operations | | | |
| Net investment income (loss)B | .05 | .21 | .13 |
| Net realized and unrealized gain (loss) | .94 | (.09) | .05 |
| Total from investment operations | .99 | .12 | .18 |
| Distributions from net investment income | (.03) | (.16) | (.10) |
| Distributions from net realized gain | (.05) | (.10) | (.07) |
| Total distributions | (.08) | (.25)C | (.17) |
| Net asset value, end of period | $10.79 | $9.88 | $10.01 |
| Total ReturnD | 10.05% | 1.11% | 1.86% |
| Ratios to Average Net AssetsE | | | |
| Expenses before reductions | .26%F | .26% | .26%F |
| Expenses net of fee waivers, if any | .26%F | .26% | .26%F |
| Expenses net of all reductions | .26%F | .26% | .26%F |
| Net investment income (loss) | .90%F | 2.01% | 2.33%F |
| Supplemental Data | | | |
| Net assets, end of period (000 omitted) | $119 | $107 | $102 |
| Portfolio turnover rateG | 34%F | 64% | 11%F |
A For the period August 31, 2018 (commencement of operations) to March 31, 2019.
B Calculated based on average shares outstanding during the period.
C Total distributions per share do not sum due to rounding.
D Total returns for periods of less than one year are not annualized.
E Expense ratios reflect operating expenses of the class. Expenses before reductions do not reflect amounts reimbursed, waived, or reduced through arrangements with the investment adviser, brokerage services, or other offset arrangements, if applicable, and do not represent the amount paid by the class during periods when reimbursements, waivers or reductions occur.
F Annualized
G Amount does not include the portfolio activity of any underlying mutual funds or exchange-traded funds (ETFs).
See accompanying notes which are an integral part of the financial statements.
Fidelity Freedom® Blend 2010 Fund
Investment Summary (Unaudited)
The information in the following tables is based on the direct investments of the Fund.
Top Holdings as of September 30, 2020
| | % of fund's net assets |
| Fidelity Series Investment Grade Bond Fund | 10.0 |
| Fidelity Series Inflation-Protected Bond Index Fund | 9.6 |
| Fidelity Series Treasury Bill Index Fund | 9.4 |
| Fidelity Series Government Bond Index Fund | 9.0 |
| Fidelity Series Emerging Markets Opportunities Fund | 7.9 |
| Fidelity Series Corporate Bond Fund | 7.5 |
| Fidelity Series Investment Grade Securitized Fund | 6.8 |
| Fidelity Series Government Money Market Fund 0.16% | 5.0 |
| Fidelity Series Large Cap Value Index Fund | 4.4 |
| Fidelity Series Blue Chip Growth Fund | 3.4 |
| | 73.0 |
Asset Allocation (% of fund's net assets)
| Period end |
| | Domestic Equity Funds | 17.6% |
| | International Equity Funds | 18.2% |
| | Bond Funds | 47.0% |
| | Short-Term Funds | 17.2% |

Domestic Equity Funds category includes Fidelity Series Commodity Strategy Fund which invests in commodity-related investments.
Fidelity Freedom® Blend 2010 Fund
Schedule of Investments September 30, 2020 (Unaudited)
Showing Percentage of Net Assets
| Domestic Equity Funds - 17.6% | | | |
| | | Shares | Value |
| Fidelity Series Blue Chip Growth Fund (a) | | 158,391 | $2,615,031 |
| Fidelity Series Commodity Strategy Fund (a) | | 468,157 | 1,947,535 |
| Fidelity Series Large Cap Growth Index Fund (a) | | 117,570 | 1,674,193 |
| Fidelity Series Large Cap Stock Fund (a) | | 127,366 | 1,803,498 |
| Fidelity Series Large Cap Value Index Fund (a) | | 294,077 | 3,411,297 |
| Fidelity Series Small Cap Opportunities Fund (a) | | 67,270 | 858,366 |
| Fidelity Series Value Discovery Fund (a) | | 100,192 | 1,238,373 |
| TOTAL DOMESTIC EQUITY FUNDS | | | |
| (Cost $13,081,135) | | | 13,548,293 |
|
| International Equity Funds - 18.2% | | | |
| Fidelity Series Canada Fund (a) | | 65,684 | 671,945 |
| Fidelity Series Emerging Markets Fund (a) | | 72,186 | 680,716 |
| Fidelity Series Emerging Markets Opportunities Fund (a) | | 291,535 | 6,116,404 |
| Fidelity Series International Growth Fund (a) | | 93,070 | 1,747,857 |
| Fidelity Series International Index Fund (a) | | 72,288 | 718,542 |
| Fidelity Series International Small Cap Fund (a) | | 35,227 | 627,047 |
| Fidelity Series International Value Fund (a) | | 200,947 | 1,732,165 |
| Fidelity Series Overseas Fund (a) | | 156,113 | 1,745,346 |
| TOTAL INTERNATIONAL EQUITY FUNDS | | | |
| (Cost $12,739,540) | | | 14,040,022 |
|
| Bond Funds - 47.0% | | | |
| Fidelity Series Corporate Bond Fund (a) | | 512,844 | 5,769,495 |
| Fidelity Series Emerging Markets Debt Fund (a) | | 54,290 | 491,863 |
| Fidelity Series Floating Rate High Income Fund (a) | | 12,162 | 107,632 |
| Fidelity Series Government Bond Index Fund (a) | | 612,936 | 6,895,527 |
| Fidelity Series High Income Fund (a) | | 60,151 | 548,575 |
| Fidelity Series Inflation-Protected Bond Index Fund (a) | | 689,020 | 7,372,514 |
| Fidelity Series Investment Grade Bond Fund (a) | | 626,980 | 7,674,237 |
| Fidelity Series Investment Grade Securitized Fund (a) | | 490,136 | 5,229,756 |
| Fidelity Series Long-Term Treasury Bond Index Fund (a) | | 171,237 | 1,768,878 |
| Fidelity Series Real Estate Income Fund (a) | | 32,522 | 324,567 |
| TOTAL BOND FUNDS | | | |
| (Cost $33,993,382) | | | 36,183,044 |
|
| Short-Term Funds - 17.2% | | | |
| Fidelity Cash Central Fund 0.10% (b) | | 49 | 49 |
| Fidelity Series Government Money Market Fund 0.16% (a)(c) | | 3,896,229 | 3,896,229 |
| Fidelity Series Short-Term Credit Fund (a) | | 211,308 | 2,165,908 |
| Fidelity Series Treasury Bill Index Fund (a) | | 720,331 | 7,210,510 |
| TOTAL SHORT-TERM FUNDS | | | |
| (Cost $13,214,637) | | | 13,272,696 |
| TOTAL INVESTMENT IN SECURITIES - 100.0% | | | |
| (Cost $73,028,694) | | | 77,044,055 |
| NET OTHER ASSETS (LIABILITIES) - 0.0% | | | (1,079) |
| NET ASSETS - 100% | | | $77,042,976 |
Legend
(a) Affiliated Fund
(b) Affiliated fund that is generally available only to investment companies and other accounts managed by Fidelity Investments. The rate quoted is the annualized seven-day yield of the fund at period end. A complete unaudited listing of the fund's holdings as of its most recent quarter end is available upon request. In addition, each Fidelity Central Fund's financial statements are available on the SEC's website or upon request.
(c) The rate quoted is the annualized seven-day yield of the fund at period end.
Affiliated Underlying Funds
Fiscal year to date information regarding the Fund's investments in affiliated Underlying Funds, excluding any Money Market Central Funds, is presented below. Exchanges between classes of the same affiliated Underlying Funds may occur.
| Affiliate | Value, beginning of period | Purchases | Sales Proceeds | Dividend Income | Realized Gain (loss) | Change in Unrealized appreciation (depreciation) | Value, end of period |
| Fidelity Series Blue Chip Growth Fund | $1,583,767 | $1,262,510 | $766,391 | $514,677 | $94,386 | $440,759 | $2,615,031 |
| Fidelity Series Canada Fund | 532,654 | 180,028 | 166,555 | -- | (16,791) | 142,609 | 671,945 |
| Fidelity Series Commodity Strategy Fund | 1,970,686 | 452,361 | 709,959 | 8,140 | (96,935) | 331,382 | 1,947,535 |
| Fidelity Series Corporate Bond Fund | 3,803,180 | 1,891,930 | 358,656 | 77,054 | 2,828 | 430,213 | 5,769,495 |
| Fidelity Series Emerging Markets Debt Fund | 364,007 | 103,692 | 22,840 | 11,839 | 320 | 46,684 | 491,863 |
| Fidelity Series Emerging Markets Fund | 333,113 | 278,402 | 79,831 | -- | 1,568 | 147,464 | 680,716 |
| Fidelity Series Emerging Markets Opportunities Fund | 3,278,590 | 2,360,248 | 897,080 | -- | 24,374 | 1,350,272 | 6,116,404 |
| Fidelity Series Floating Rate High Income Fund | 80,173 | 24,397 | 5,526 | 2,173 | 43 | 8,545 | 107,632 |
| Fidelity Series Government Bond Index Fund | 5,890,670 | 1,871,536 | 847,622 | 47,630 | 14,836 | (33,893) | 6,895,527 |
| Fidelity Series Government Money Market Fund 0.16% | 2,009,286 | 3,842,225 | 1,955,282 | 3,384 | -- | -- | 3,896,229 |
| Fidelity Series High Income Fund | 405,538 | 124,709 | 27,628 | 13,596 | 286 | 45,670 | 548,575 |
| Fidelity Series Inflation-Protected Bond Index Fund | 5,522,760 | 1,870,402 | 402,642 | 5,165 | 3,550 | 378,444 | 7,372,514 |
| Fidelity Series International Growth Fund | 1,613,636 | 424,626 | 729,497 | -- | 16,226 | 422,866 | 1,747,857 |
| Fidelity Series International Index Fund | 577,479 | 203,852 | 189,876 | -- | (11,099) | 138,186 | 718,542 |
| Fidelity Series International Small Cap Fund | 475,189 | 122,075 | 123,719 | -- | (1,513) | 155,015 | 627,047 |
| Fidelity Series International Value Fund | 1,538,771 | 450,854 | 559,175 | -- | (27,585) | 329,300 | 1,732,165 |
| Fidelity Series Investment Grade Bond Fund | 5,764,412 | 2,058,488 | 522,054 | 88,910 | 5,371 | 368,020 | 7,674,237 |
| Fidelity Series Investment Grade Securitized Fund | 4,003,490 | 1,558,870 | 385,872 | 29,309 | 1,348 | 51,920 | 5,229,756 |
| Fidelity Series Large Cap Growth Index Fund | 1,170,649 | 465,734 | 500,495 | 26,978 | 50,217 | 488,088 | 1,674,193 |
| Fidelity Series Large Cap Stock Fund | 1,214,409 | 631,346 | 266,019 | 63,483 | 7,281 | 216,481 | 1,803,498 |
| Fidelity Series Large Cap Value Index Fund | 2,267,339 | 1,104,100 | 449,391 | -- | 7,026 | 482,223 | 3,411,297 |
| Fidelity Series Long-Term Treasury Bond Index Fund | 1,439,458 | 600,765 | 227,763 | 39,674 | 15,623 | (59,205) | 1,768,878 |
| Fidelity Series Overseas Fund | 1,511,094 | 480,751 | 670,731 | -- | (23,798) | 448,030 | 1,745,346 |
| Fidelity Series Real Estate Income Fund | 219,579 | 79,305 | 17,316 | 9,670 | 147 | 42,852 | 324,567 |
| Fidelity Series Short-Term Credit Fund | 2,064,907 | 23,558 | -- | 23,558 | -- | 77,443 | 2,165,908 |
| Fidelity Series Small Cap Opportunities Fund | 596,490 | 280,052 | 175,643 | 5,088 | (9,605) | 167,072 | 858,366 |
| Fidelity Series Treasury Bill Index Fund | 7,142,092 | 90,976 | 1,042 | 28,494 | (2) | (21,514) | 7,210,510 |
| Fidelity Series Value Discovery Fund | 702,241 | 505,166 | 153,826 | -- | 4,769 | 180,023 | 1,238,373 |
| | 58,075,659 | 23,342,958 | 11,212,431 | 998,822 | 62,871 | 6,774,949 | 77,044,006 |
Amounts in the income column in the above table include any capital gain distributions from underlying funds, which are presented in the corresponding line-item in the Statement of Operations, if applicable.
Investment Valuation
The following is a summary of the inputs used, as of September 30, 2020, involving the Fund's assets and liabilities carried at fair value. The inputs or methodology used for valuing securities may not be an indication of the risk associated with investing in those securities. For more information on valuation inputs, and their aggregation into the levels used below, please refer to the Investment Valuation section in the accompanying Notes to Financial Statements.
| | Valuation Inputs at Reporting Date: |
| Description | Total | Level 1 | Level 2 | Level 3 |
| Investments in Securities: | | | | |
| Domestic Equity Funds | $13,548,293 | $13,548,293 | $-- | $-- |
| International Equity Funds | 14,040,022 | 14,040,022 | -- | -- |
| Bond Funds | 36,183,044 | 36,183,044 | -- | -- |
| Short-Term Funds | 13,272,696 | 13,272,696 | -- | -- |
| Total Investments in Securities: | $77,044,055 | $77,044,055 | $-- | $-- |
See accompanying notes which are an integral part of the financial statements.
Fidelity Freedom® Blend 2010 Fund
Financial Statements
Statement of Assets and Liabilities
| | | September 30, 2020 (Unaudited) |
| Assets | | |
Investment in securities, at value — See accompanying schedule:
| | |
| Fidelity Central Funds (cost $49) | $49 | |
| Other affiliated issuers (cost $73,028,645) | 77,044,006 | |
| Total Investment in Securities (cost $73,028,694) | | $77,044,055 |
| Cash | | 299 |
| Receivable for investments sold | | 473,618 |
| Receivable for fund shares sold | | 25,361 |
| Total assets | | 77,543,333 |
| Liabilities | | |
| Payable for investments purchased | $476,874 | |
| Payable for fund shares redeemed | 4,046 | |
| Accrued management fee | 18,960 | |
| Distribution and service plan fees payable | 477 | |
| Total liabilities | | 500,357 |
| Net Assets | | $77,042,976 |
| Net Assets consist of: | | |
| Paid in capital | | $72,483,708 |
| Total accumulated earnings (loss) | | 4,559,268 |
| Net Assets | | $77,042,976 |
| Net Asset Value and Maximum Offering Price | | |
| Class A: | | |
| Net Asset Value and redemption price per share ($701,408 ÷ 65,364 shares)(a) | | $10.73 |
| Maximum offering price per share (100/94.25 of $10.73) | | $11.38 |
| Class M: | | |
| Net Asset Value and redemption price per share ($354,891 ÷ 33,111 shares)(a) | | $10.72 |
| Maximum offering price per share (100/96.50 of $10.72) | | $11.11 |
| Class C: | | |
| Net Asset Value and offering price per share ($218,311 ÷ 20,436 shares)(a) | | $10.68 |
| Fidelity Freedom Blend 2010 Fund: | | |
| Net Asset Value, offering price and redemption price per share ($3,720,983 ÷ 346,119 shares) | | $10.75 |
| Class K: | | |
| Net Asset Value, offering price and redemption price per share ($6,896,253 ÷ 640,406 shares) | | $10.77 |
| Class K6: | | |
| Net Asset Value, offering price and redemption price per share ($63,276,967 ÷ 5,866,297 shares) | | $10.79 |
| Class I: | | |
| Net Asset Value, offering price and redemption price per share ($752,795 ÷ 69,966 shares) | | $10.76 |
| Class Z: | | |
| Net Asset Value, offering price and redemption price per share ($158,366 ÷ 14,681 shares) | | $10.79 |
| Class Z6: | | |
| Net Asset Value, offering price and redemption price per share ($963,002 ÷ 89,216 shares) | | $10.79 |
(a) Redemption price per share is equal to net asset value less any applicable contingent deferred sales charge.
See accompanying notes which are an integral part of the financial statements.
Statement of Operations
| | | Six months ended September 30, 2020 (Unaudited) |
| Investment Income | | |
| Dividends: | | |
| Affiliated issuers | | $385,344 |
| Expenses | | |
| Management fee | $102,509 | |
| Distribution and service plan fees | 2,383 | |
| Independent trustees' fees and expenses | 92 | |
| Total expenses before reductions | 104,984 | |
| Expense reductions | (1) | |
| Total expenses after reductions | | 104,983 |
| Net investment income (loss) | | 280,361 |
| Realized and Unrealized Gain (Loss) | | |
| Net realized gain (loss) on: | | |
| Investment securities: | | |
| Affiliated issuers | 62,871 | |
| Capital gain distributions from underlying funds: | | |
| Affiliated issuers | 613,478 | |
| Total net realized gain (loss) | | 676,349 |
| Change in net unrealized appreciation (depreciation) on: | | |
| Investment securities: | | |
| Affiliated issuers | 6,774,949 | |
| Total change in net unrealized appreciation (depreciation) | | 6,774,949 |
| Net gain (loss) | | 7,451,298 |
| Net increase (decrease) in net assets resulting from operations | | $7,731,659 |
See accompanying notes which are an integral part of the financial statements.
Statement of Changes in Net Assets
| | Six months ended September 30, 2020 (Unaudited) | Year ended March 31, 2020 |
| Increase (Decrease) in Net Assets | | |
| Operations | | |
| Net investment income (loss) | $280,361 | $1,041,232 |
| Net realized gain (loss) | 676,349 | 574,311 |
| Change in net unrealized appreciation (depreciation) | 6,774,949 | (2,858,550) |
| Net increase (decrease) in net assets resulting from operations | 7,731,659 | (1,243,007) |
| Distributions to shareholders | (566,464) | (1,444,075) |
| Share transactions - net increase (decrease) | 11,802,546 | 58,119,134 |
| Total increase (decrease) in net assets | 18,967,741 | 55,432,052 |
| Net Assets | | |
| Beginning of period | 58,075,235 | 2,643,183 |
| End of period | $77,042,976 | $58,075,235 |
See accompanying notes which are an integral part of the financial statements.
Financial Highlights
Fidelity Freedom Blend 2010 Fund Class A
| | Six months ended (Unaudited) September 30, | Years endedMarch 31, | |
| | 2020 | 2020 | 2019 A |
| Selected Per–Share Data | | | |
| Net asset value, beginning of period | $9.65 | $9.93 | $10.00 |
| Income from Investment Operations | | | |
| Net investment income (loss)B | .02 | .16 | .10 |
| Net realized and unrealized gain (loss) | 1.16 | (.22) | .01 |
| Total from investment operations | 1.18 | (.06) | .11 |
| Distributions from net investment income | (.03) | (.12) | (.11) |
| Distributions from net realized gain | (.07) | (.09) | (.08) |
| Total distributions | (.10) | (.22)C | (.18)C |
| Net asset value, end of period | $10.73 | $9.65 | $9.93 |
| Total ReturnD,E,F | 12.25% | (.82)% | 1.24% |
| Ratios to Average Net AssetsG | | | |
| Expenses before reductions | .72%H | .72% | .72%H |
| Expenses net of fee waivers, if any | .72%H | .72% | .72%H |
| Expenses net of all reductions | .72%H | .72% | .72%H |
| Net investment income (loss) | .38%H | 1.60% | 1.81%H |
| Supplemental Data | | | |
| Net assets, end of period (000 omitted) | $701 | $190 | $166 |
| Portfolio turnover rateI | 33%H | 42% | 98%H |
A For the period August 31, 2018 (commencement of operations) to March 31, 2019.
B Calculated based on average shares outstanding during the period.
C Total distributions per share do not sum due to rounding.
D Total returns for periods of less than one year are not annualized.
E Total returns would have been lower if certain expenses had not been reduced during the applicable periods shown.
F Total returns do not include the effect of the sales charges.
G Expense ratios reflect operating expenses of the class. Expenses before reductions do not reflect amounts reimbursed, waived, or reduced through arrangements with the investment adviser, brokerage services, or other offset arrangements, if applicable, and do not represent the amount paid by the class during periods when reimbursements, waivers or reductions occur.
H Annualized
I Amount does not include the portfolio activity of any underlying mutual funds or exchange-traded funds (ETFs).
See accompanying notes which are an integral part of the financial statements.
Fidelity Freedom Blend 2010 Fund Class M
| | Six months ended (Unaudited) September 30, | Years endedMarch 31, | |
| | 2020 | 2020 | 2019 A |
| Selected Per–Share Data | | | |
| Net asset value, beginning of period | $9.63 | $9.92 | $10.00 |
| Income from Investment Operations | | | |
| Net investment income (loss)B | .01 | .14 | .09 |
| Net realized and unrealized gain (loss) | 1.16 | (.23) | –C |
| Total from investment operations | 1.17 | (.09) | .09 |
| Distributions from net investment income | (.01) | (.11) | (.10) |
| Distributions from net realized gain | (.07) | (.09) | (.08) |
| Total distributions | (.08) | (.20) | (.17)D |
| Net asset value, end of period | $10.72 | $9.63 | $9.92 |
| Total ReturnE,F | 12.20% | (1.07)% | 1.03% |
| Ratios to Average Net AssetsG | | | |
| Expenses before reductions | .97%H | .97% | .97%H |
| Expenses net of fee waivers, if any | .97%H | .97% | .97%H |
| Expenses net of all reductions | .97%H | .97% | .97%H |
| Net investment income (loss) | .14%H | 1.35% | 1.56%H |
| Supplemental Data | | | |
| Net assets, end of period (000 omitted) | $355 | $259 | $126 |
| Portfolio turnover rateI | 33%H | 42% | 98%H |
A For the period August 31, 2018 (commencement of operations) to March 31, 2019.
B Calculated based on average shares outstanding during the period.
C Amount represents less than $.005 per share.
D Total distributions per share do not sum due to rounding.
E Total returns for periods of less than one year are not annualized.
F Total returns do not include the effect of the sales charges.
G Expense ratios reflect operating expenses of the class. Expenses before reductions do not reflect amounts reimbursed, waived, or reduced through arrangements with the investment adviser, brokerage services, or other offset arrangements, if applicable, and do not represent the amount paid by the class during periods when reimbursements, waivers or reductions occur.
H Annualized
I Amount does not include the portfolio activity of any underlying mutual funds or exchange-traded funds (ETFs).
See accompanying notes which are an integral part of the financial statements.
Fidelity Freedom Blend 2010 Fund Class C
| | Six months ended (Unaudited) September 30, | Years endedMarch 31, | |
| | 2020 | 2020 | 2019 A |
| Selected Per–Share Data | | | |
| Net asset value, beginning of period | $9.61 | $9.92 | $10.00 |
| Income from Investment Operations | | | |
| Net investment income (loss)B | (.02) | .09 | .06 |
| Net realized and unrealized gain (loss) | 1.15 | (.23) | .01 |
| Total from investment operations | 1.13 | (.14) | .07 |
| Distributions from net investment income | – | (.07) | (.08) |
| Distributions from net realized gain | (.06) | (.09) | (.08) |
| Total distributions | (.06) | (.17)C | (.15)C |
| Net asset value, end of period | $10.68 | $9.61 | $9.92 |
| Total ReturnD,E | 11.81% | (1.57)% | .81% |
| Ratios to Average Net AssetsF | | | |
| Expenses before reductions | 1.48%G,H | 1.47% | 1.47%G |
| Expenses net of fee waivers, if any | 1.48%G,H | 1.47% | 1.47%G |
| Expenses net of all reductions | 1.48%G,H | 1.47% | 1.47%G |
| Net investment income (loss) | (.37)%G | .85% | 1.06%G |
| Supplemental Data | | | |
| Net assets, end of period (000 omitted) | $218 | $117 | $101 |
| Portfolio turnover rateI | 33%G | 42% | 98%G |
A For the period August 31, 2018 (commencement of operations) to March 31, 2019.
B Calculated based on average shares outstanding during the period.
C Total distributions per share do not sum due to rounding.
D Total returns for periods of less than one year are not annualized.
E Total returns do not include the effect of the contingent deferred sales charge.
F Expense ratios reflect operating expenses of the class. Expenses before reductions do not reflect amounts reimbursed, waived, or reduced through arrangements with the investment adviser, brokerage services, or other offset arrangements, if applicable, and do not represent the amount paid by the class during periods when reimbursements, waivers or reductions occur.
G Annualized
H On certain classes, the size and fluctuation of net assets and expense amounts may cause ratios to differ from contractual-rates.
I Amount does not include the portfolio activity of any underlying mutual funds or exchange-traded funds (ETFs).
See accompanying notes which are an integral part of the financial statements.
Fidelity Freedom Blend 2010 Fund
| | Six months ended (Unaudited) September 30, | Years endedMarch 31, | |
| | 2020 | 2020 | 2019 A |
| Selected Per–Share Data | | | |
| Net asset value, beginning of period | $9.65 | $9.94 | $10.00 |
| Income from Investment Operations | | | |
| Net investment income (loss)B | .03 | .19 | .12 |
| Net realized and unrealized gain (loss) | 1.16 | (.23) | .01 |
| Total from investment operations | 1.19 | (.04) | .13 |
| Distributions from net investment income | (.02) | (.16) | (.11) |
| Distributions from net realized gain | (.07) | (.10) | (.08) |
| Total distributions | (.09) | (.25)C | (.19) |
| Net asset value, end of period | $10.75 | $9.65 | $9.94 |
| Total ReturnD | 12.40% | (.56)% | 1.37% |
| Ratios to Average Net AssetsE | | | |
| Expenses before reductions | .47%F | .47% | .47%F |
| Expenses net of fee waivers, if any | .47%F | .47% | .47%F |
| Expenses net of all reductions | .47%F | .47% | .47%F |
| Net investment income (loss) | .64%F | 1.85% | 2.06%F |
| Supplemental Data | | | |
| Net assets, end of period (000 omitted) | $3,721 | $2,197 | $148 |
| Portfolio turnover rateG | 33%F | 42% | 98%F |
A For the period August 31, 2018 (commencement of operations) to March 31, 2019.
B Calculated based on average shares outstanding during the period.
C Total distributions per share do not sum due to rounding.
D Total returns for periods of less than one year are not annualized.
E Expense ratios reflect operating expenses of the class. Expenses before reductions do not reflect amounts reimbursed, waived, or reduced through arrangements with the investment adviser, brokerage services, or other offset arrangements, if applicable, and do not represent the amount paid by the class during periods when reimbursements, waivers or reductions occur.
F Annualized
G Amount does not include the portfolio activity of any underlying mutual funds or exchange-traded funds (ETFs).
See accompanying notes which are an integral part of the financial statements.
Fidelity Freedom Blend 2010 Fund Class K
| | Six months ended (Unaudited) September 30, | Years endedMarch 31, | |
| | 2020 | 2020 | 2019 A |
| Selected Per–Share Data | | | |
| Net asset value, beginning of period | $9.66 | $9.94 | $10.00 |
| Income from Investment Operations | | | |
| Net investment income (loss)B | .04 | .20 | .12 |
| Net realized and unrealized gain (loss) | 1.16 | (.22) | .01 |
| Total from investment operations | 1.20 | (.02) | .13 |
| Distributions from net investment income | (.02) | (.16) | (.11) |
| Distributions from net realized gain | (.07) | (.09) | (.08) |
| Total distributions | (.09) | (.26)C | (.19) |
| Net asset value, end of period | $10.77 | $9.66 | $9.94 |
| Total ReturnD | 12.49% | (.43)% | 1.38% |
| Ratios to Average Net AssetsE | | | |
| Expenses before reductions | .37%F | .37% | .37%F |
| Expenses net of fee waivers, if any | .37%F | .37% | .37%F |
| Expenses net of all reductions | .37%F | .37% | .37%F |
| Net investment income (loss) | .74%F | 1.95% | 2.16%F |
| Supplemental Data | | | |
| Net assets, end of period (000 omitted) | $6,896 | $6,317 | $101 |
| Portfolio turnover rateG | 33%F | 42% | 98%F |
A For the period August 31, 2018 (commencement of operations) to March 31, 2019.
B Calculated based on average shares outstanding during the period.
C Total distributions per share do not sum due to rounding.
D Total returns for periods of less than one year are not annualized.
E Expense ratios reflect operating expenses of the class. Expenses before reductions do not reflect amounts reimbursed, waived, or reduced through arrangements with the investment adviser, brokerage services, or other offset arrangements, if applicable, and do not represent the amount paid by the class during periods when reimbursements, waivers or reductions occur.
F Annualized
G Amount does not include the portfolio activity of any underlying mutual funds or exchange-traded funds (ETFs).
See accompanying notes which are an integral part of the financial statements.
Fidelity Freedom Blend 2010 Fund Class K6
| | Six months ended (Unaudited) September 30, | Years endedMarch 31, | |
| | 2020 | 2020 | 2019 A |
| Selected Per–Share Data | | | |
| Net asset value, beginning of period | $9.67 | $9.95 | $10.00 |
| Income from Investment Operations | | | |
| Net investment income (loss)B | .04 | .21 | .13 |
| Net realized and unrealized gain (loss) | 1.17 | (.23) | .01 |
| Total from investment operations | 1.21 | (.02) | .14 |
| Distributions from net investment income | (.03) | (.16) | (.11) |
| Distributions from net realized gain | (.07) | (.10) | (.08) |
| Total distributions | (.09)C | (.26) | (.19) |
| Net asset value, end of period | $10.79 | $9.67 | $9.95 |
| Total ReturnD | 12.62% | (.44)% | 1.52% |
| Ratios to Average Net AssetsE | | | |
| Expenses before reductions | .27%F | .27% | .28%F,G |
| Expenses net of fee waivers, if any | .27%F | .27% | .28%F,G |
| Expenses net of all reductions | .27%F | .27% | .28%F,G |
| Net investment income (loss) | .84%F | 2.05% | 2.26%F |
| Supplemental Data | | | |
| Net assets, end of period (000 omitted) | $63,277 | $48,155 | $1,697 |
| Portfolio turnover rateH | 33%F | 42% | 98%F |
A For the period August 31, 2018 (commencement of operations) to March 31, 2019.
B Calculated based on average shares outstanding during the period.
C Total distributions per share do not sum due to rounding.
D Total returns for periods of less than one year are not annualized.
E Expense ratios reflect operating expenses of the class. Expenses before reductions do not reflect amounts reimbursed, waived, or reduced through arrangements with the investment adviser, brokerage services, or other offset arrangements, if applicable, and do not represent the amount paid by the class during periods when reimbursements, waivers or reductions occur.
F Annualized
G On certain classes, the size and fluctuation of net assets and expense amounts may cause ratios to differ from contractual rates.
H Amount does not include the portfolio activity of any underlying mutual funds or exchange-traded funds (ETFs).
See accompanying notes which are an integral part of the financial statements.
Fidelity Freedom Blend 2010 Fund Class I
| | Six months ended (Unaudited) September 30, | Years endedMarch 31, | |
| | 2020 | 2020 | 2019 A |
| Selected Per–Share Data | | | |
| Net asset value, beginning of period | $9.66 | $9.94 | $10.00 |
| Income from Investment Operations | | | |
| Net investment income (loss)B | .03 | .19 | .12 |
| Net realized and unrealized gain (loss) | 1.16 | (.22) | –C |
| Total from investment operations | 1.19 | (.03) | .12 |
| Distributions from net investment income | (.02) | (.15) | (.11) |
| Distributions from net realized gain | (.07) | (.09) | (.08) |
| Total distributions | (.09) | (.25)D | (.18)D |
| Net asset value, end of period | $10.76 | $9.66 | $9.94 |
| Total ReturnE | 12.40% | (.53)% | 1.35% |
| Ratios to Average Net AssetsF | | | |
| Expenses before reductions | .47%G | .47% | .47%G |
| Expenses net of fee waivers, if any | .47%G | .47% | .47%G |
| Expenses net of all reductions | .47%G | .47% | .47%G |
| Net investment income (loss) | .63%G | 1.85% | 2.06%G |
| Supplemental Data | | | |
| Net assets, end of period (000 omitted) | $753 | $453 | $101 |
| Portfolio turnover rateH | 33%G | 42% | 98%G |
A For the period August 31, 2018 (commencement of operations) to March 31, 2019.
B Calculated based on average shares outstanding during the period.
C Amount represents less than $.005 per share.
D Total distributions per share do not sum due to rounding.
E Total returns for periods of less than one year are not annualized.
F Expense ratios reflect operating expenses of the class. Expenses before reductions do not reflect amounts reimbursed, waived, or reduced through arrangements with the investment adviser, brokerage services, or other offset arrangements, if applicable, and do not represent the amount paid by the class during periods when reimbursements, waivers or reductions occur.
G Annualized
H Amount does not include the portfolio activity of any underlying mutual funds or exchange-traded funds (ETFs).
See accompanying notes which are an integral part of the financial statements.
Fidelity Freedom Blend 2010 Fund Class Z
| | Six months ended (Unaudited) September 30, | Years endedMarch 31, | |
| | 2020 | 2020 | 2019 A |
| Selected Per–Share Data | | | |
| Net asset value, beginning of period | $9.68 | $9.94 | $10.00 |
| Income from Investment Operations | | | |
| Net investment income (loss)B | .04 | .20 | .12 |
| Net realized and unrealized gain (loss) | 1.16 | (.22) | .01 |
| Total from investment operations | 1.20 | (.02) | .13 |
| Distributions from net investment income | (.02) | (.15) | (.11) |
| Distributions from net realized gain | (.07) | (.09) | (.08) |
| Total distributions | (.09) | (.24) | (.19) |
| Net asset value, end of period | $10.79 | $9.68 | $9.94 |
| Total ReturnC | 12.48% | (.40)% | 1.38% |
| Ratios to Average Net AssetsD | | | |
| Expenses before reductions | .37%E | .37% | .37%E |
| Expenses net of fee waivers, if any | .37%E | .37% | .37%E |
| Expenses net of all reductions | .37%E | .37% | .37%E |
| Net investment income (loss) | .74%E | 1.95% | 2.16%E |
| Supplemental Data | | | |
| Net assets, end of period (000 omitted) | $158 | $101 | $101 |
| Portfolio turnover rateF | 33%E | 42% | 98%E |
A For the period August 31, 2018 (commencement of operations) to March 31, 2019.
B Calculated based on average shares outstanding during the period.
C Total returns for periods of less than one year are not annualized.
D Expense ratios reflect operating expenses of the class. Expenses before reductions do not reflect amounts reimbursed, waived, or reduced through arrangements with the investment adviser, brokerage services, or other offset arrangements, if applicable, and do not represent the amount paid by the class during periods when reimbursements, waivers or reductions occur.
E Annualized
F Amount does not include the portfolio activity of any underlying mutual funds or exchange-traded funds (ETFs).
See accompanying notes which are an integral part of the financial statements.
Fidelity Freedom Blend 2010 Fund Class Z6
| | Six months ended (Unaudited) September 30, | Years endedMarch 31, | |
| | 2020 | 2020 | 2019 A |
| Selected Per–Share Data | | | |
| Net asset value, beginning of period | $9.68 | $9.95 | $10.00 |
| Income from Investment Operations | | | |
| Net investment income (loss)B | .04 | .21 | .13 |
| Net realized and unrealized gain (loss) | 1.17 | (.23) | .01 |
| Total from investment operations | 1.21 | (.02) | .14 |
| Distributions from net investment income | (.03) | (.15) | (.11) |
| Distributions from net realized gain | (.07) | (.09) | (.08) |
| Total distributions | (.10) | (.25)C | (.19) |
| Net asset value, end of period | $10.79 | $9.68 | $9.95 |
| Total ReturnD | 12.52% | (.43)% | 1.52% |
| Ratios to Average Net AssetsE | | | |
| Expenses before reductions | .27%F | .27% | .27%F |
| Expenses net of fee waivers, if any | .27%F | .27% | .27%F |
| Expenses net of all reductions | .27%F | .27% | .27%F |
| Net investment income (loss) | .83%F | 2.05% | 2.26%F |
| Supplemental Data | | | |
| Net assets, end of period (000 omitted) | $963 | $287 | $101 |
| Portfolio turnover rateG | 33%F | 42% | 98%F |
A For the period August 31, 2018 (commencement of operations) to March 31, 2019.
B Calculated based on average shares outstanding during the period.
C Total distributions per share do not sum due to rounding.
D Total returns for periods of less than one year are not annualized.
E Expense ratios reflect operating expenses of the class. Expenses before reductions do not reflect amounts reimbursed, waived, or reduced through arrangements with the investment adviser, brokerage services, or other offset arrangements, if applicable, and do not represent the amount paid by the class during periods when reimbursements, waivers or reductions occur.
F Annualized
G Amount does not include the portfolio activity of any underlying mutual funds or exchange-traded funds (ETFs).
See accompanying notes which are an integral part of the financial statements.
Fidelity Freedom® Blend 2015 Fund
Investment Summary (Unaudited)
The information in the following tables is based on the direct investments of the Fund.
Top Holdings as of September 30, 2020
| | % of fund's net assets |
| Fidelity Series Emerging Markets Opportunities Fund | 8.9 |
| Fidelity Series Investment Grade Bond Fund | 8.8 |
| Fidelity Series Inflation-Protected Bond Index Fund | 8.3 |
| Fidelity Series Government Bond Index Fund | 8.0 |
| Fidelity Series Treasury Bill Index Fund | 7.9 |
| Fidelity Series Corporate Bond Fund | 6.7 |
| Fidelity Series Large Cap Value Index Fund | 6.1 |
| Fidelity Series Investment Grade Securitized Fund | 6.0 |
| Fidelity Series Blue Chip Growth Fund | 4.6 |
| Fidelity Series Large Cap Stock Fund | 3.2 |
| | 68.5 |
Asset Allocation (% of fund's net assets)
| Period end |
| | Domestic Equity Funds | 23.1% |
| | International Equity Funds | 21.9% |
| | Bond Funds | 41.9% |
| | Short-Term Funds | 13.1% |

Domestic Equity Funds category includes Fidelity Series Commodity Strategy Fund which invests in commodity-related investments.
Fidelity Freedom® Blend 2015 Fund
Schedule of Investments September 30, 2020 (Unaudited)
Showing Percentage of Net Assets
| Domestic Equity Funds - 23.1% | | | |
| | | Shares | Value |
| Fidelity Series Blue Chip Growth Fund (a) | | 638,364 | $10,539,390 |
| Fidelity Series Commodity Strategy Fund (a) | | 1,380,702 | 5,743,720 |
| Fidelity Series Large Cap Growth Index Fund (a) | | 473,824 | 6,747,260 |
| Fidelity Series Large Cap Stock Fund (a) | | 513,319 | 7,268,600 |
| Fidelity Series Large Cap Value Index Fund (a) | | 1,185,213 | 13,748,471 |
| Fidelity Series Small Cap Opportunities Fund (a) | | 271,115 | 3,459,427 |
| Fidelity Series Value Discovery Fund (a) | | 403,802 | 4,990,994 |
| TOTAL DOMESTIC EQUITY FUNDS | | | |
| (Cost $50,642,264) | | | 52,497,862 |
|
| International Equity Funds - 21.9% | | | |
| Fidelity Series Canada Fund (a) | | 247,135 | 2,528,195 |
| Fidelity Series Emerging Markets Fund (a) | | 239,011 | 2,253,875 |
| Fidelity Series Emerging Markets Opportunities Fund (a) | | 965,274 | 20,251,445 |
| Fidelity Series International Growth Fund (a) | | 349,918 | 6,571,457 |
| Fidelity Series International Index Fund (a) | | 272,288 | 2,706,543 |
| Fidelity Series International Small Cap Fund (a) | | 131,912 | 2,348,042 |
| Fidelity Series International Value Fund (a) | | 756,071 | 6,517,332 |
| Fidelity Series Overseas Fund (a) | | 586,939 | 6,561,979 |
| TOTAL INTERNATIONAL EQUITY FUNDS | | | |
| (Cost $45,151,086) | | | 49,738,868 |
|
| Bond Funds - 41.9% | | | |
| Fidelity Series Corporate Bond Fund (a) | | 1,342,531 | 15,103,474 |
| Fidelity Series Emerging Markets Debt Fund (a) | | 157,426 | 1,426,281 |
| Fidelity Series Floating Rate High Income Fund (a) | | 35,328 | 312,651 |
| Fidelity Series Government Bond Index Fund (a) | | 1,604,479 | 18,050,388 |
| Fidelity Series High Income Fund (a) | | 175,274 | 1,598,496 |
| Fidelity Series Inflation-Protected Bond Index Fund (a) | | 1,764,113 | 18,876,004 |
| Fidelity Series Investment Grade Bond Fund (a) | | 1,641,217 | 20,088,492 |
| Fidelity Series Investment Grade Securitized Fund (a) | | 1,283,134 | 13,691,045 |
| Fidelity Series Long-Term Treasury Bond Index Fund (a) | | 506,104 | 5,228,055 |
| Fidelity Series Real Estate Income Fund (a) | | 94,548 | 943,589 |
| TOTAL BOND FUNDS | | | |
| (Cost $88,947,155) | | | 95,318,475 |
|
| Short-Term Funds - 13.1% | | | |
| Fidelity Cash Central Fund 0.10% (b) | | 49 | 49 |
| Fidelity Series Government Money Market Fund 0.16% (a)(c) | | 6,833,588 | 6,833,588 |
| Fidelity Series Short-Term Credit Fund (a) | | 491,714 | 5,040,070 |
| Fidelity Series Treasury Bill Index Fund (a) | | 1,785,381 | 17,871,665 |
| TOTAL SHORT-TERM FUNDS | | | |
| (Cost $29,600,420) | | | 29,745,372 |
| TOTAL INVESTMENT IN SECURITIES - 100.0% | | | |
| (Cost $214,340,925) | | | 227,300,577 |
| NET OTHER ASSETS (LIABILITIES) - 0.0% | | | (2,809) |
| NET ASSETS - 100% | | | $227,297,768 |
Legend
(a) Affiliated Fund
(b) Affiliated fund that is generally available only to investment companies and other accounts managed by Fidelity Investments. The rate quoted is the annualized seven-day yield of the fund at period end. A complete unaudited listing of the fund's holdings as of its most recent quarter end is available upon request. In addition, each Fidelity Central Fund's financial statements are available on the SEC's website or upon request.
(c) The rate quoted is the annualized seven-day yield of the fund at period end.
Affiliated Underlying Funds
Fiscal year to date information regarding the Fund's investments in affiliated Underlying Funds, excluding any Money Market Central Funds, is presented below. Exchanges between classes of the same affiliated Underlying Funds may occur.
| Affiliate | Value, beginning of period | Purchases | Sales Proceeds | Dividend Income | Realized Gain (loss) | Change in Unrealized appreciation (depreciation) | Value, end of period |
| Fidelity Series Blue Chip Growth Fund | $7,069,051 | $4,248,126 | $3,177,970 | $2,071,880 | $435,904 | $1,964,279 | $10,539,390 |
| Fidelity Series Canada Fund | 2,104,725 | 480,966 | 546,443 | -- | (52,078) | 541,025 | 2,528,195 |
| Fidelity Series Commodity Strategy Fund | 6,188,649 | 942,735 | 2,096,660 | 24,077 | (300,589) | 1,009,585 | 5,743,720 |
| Fidelity Series Corporate Bond Fund | 10,589,640 | 4,455,175 | 1,154,036 | 207,995 | 11,531 | 1,201,164 | 15,103,474 |
| Fidelity Series Emerging Markets Debt Fund | 1,143,208 | 218,135 | 82,840 | 35,750 | 1,162 | 146,616 | 1,426,281 |
| Fidelity Series Emerging Markets Fund | 1,241,776 | 725,806 | 236,226 | -- | (4,052) | 526,571 | 2,253,875 |
| Fidelity Series Emerging Markets Opportunities Fund | 11,928,317 | 6,291,128 | 2,810,746 | -- | 70,663 | 4,772,083 | 20,251,445 |
| Fidelity Series Floating Rate High Income Fund | 255,132 | 50,734 | 20,042 | 6,608 | 204 | 26,623 | 312,651 |
| Fidelity Series Government Bond Index Fund | 16,391,161 | 4,237,860 | 2,525,723 | 128,914 | 12,909 | (65,819) | 18,050,388 |
| Fidelity Series Government Money Market Fund 0.16% | 5,029,221 | 8,051,877 | 6,247,510 | 7,066 | -- | -- | 6,833,588 |
| Fidelity Series High Income Fund | 1,292,857 | 262,062 | 100,209 | 41,434 | 1,474 | 142,312 | 1,598,496 |
| Fidelity Series Inflation-Protected Bond Index Fund | 15,092,061 | 4,088,936 | 1,319,836 | 13,828 | 8,216 | 1,006,627 | 18,876,004 |
| Fidelity Series International Growth Fund | 6,291,017 | 1,219,555 | 2,652,804 | -- | 144,274 | 1,569,415 | 6,571,457 |
| Fidelity Series International Index Fund | 2,286,110 | 555,878 | 635,131 | -- | (44,003) | 543,689 | 2,706,543 |
| Fidelity Series International Small Cap Fund | 1,852,946 | 315,558 | 414,402 | -- | (942) | 594,882 | 2,348,042 |
| Fidelity Series International Value Fund | 6,000,464 | 1,218,585 | 1,900,221 | -- | (125,812) | 1,324,316 | 6,517,332 |
| Fidelity Series Investment Grade Bond Fund | 15,974,695 | 4,817,736 | 1,743,067 | 240,569 | 11,232 | 1,027,896 | 20,088,492 |
| Fidelity Series Investment Grade Securitized Fund | 11,145,200 | 3,654,814 | 1,252,334 | 79,627 | 4,269 | 139,096 | 13,691,045 |
| Fidelity Series Large Cap Growth Index Fund | 5,256,125 | 1,362,557 | 2,147,872 | 120,210 | 282,350 | 1,994,100 | 6,747,260 |
| Fidelity Series Large Cap Stock Fund | 5,455,426 | 1,860,867 | 1,056,466 | 252,710 | 1,546 | 1,007,227 | 7,268,600 |
| Fidelity Series Large Cap Value Index Fund | 10,154,836 | 3,266,659 | 1,810,462 | -- | (15,753) | 2,153,191 | 13,748,471 |
| Fidelity Series Long-Term Treasury Bond Index Fund | 4,545,328 | 1,567,884 | 750,267 | 123,248 | 53,155 | (188,045) | 5,228,055 |
| Fidelity Series Overseas Fund | 5,912,166 | 1,423,456 | 2,436,458 | -- | (61,900) | 1,724,715 | 6,561,979 |
| Fidelity Series Real Estate Income Fund | 703,230 | 167,495 | 62,798 | 29,234 | 1,493 | 134,169 | 943,589 |
| Fidelity Series Short-Term Credit Fund | 4,805,041 | 54,819 | -- | 54,819 | -- | 180,210 | 5,040,070 |
| Fidelity Series Small Cap Opportunities Fund | 2,696,895 | 810,290 | 731,952 | 20,493 | (66,197) | 750,391 | 3,459,427 |
| Fidelity Series Treasury Bill Index Fund | 17,797,466 | 219,574 | 91,948 | 70,652 | (84) | (53,343) | 17,871,665 |
| Fidelity Series Value Discovery Fund | 3,167,627 | 1,625,213 | 605,105 | -- | (18,492) | 821,751 | 4,990,994 |
| | 182,370,370 | 58,194,480 | 38,609,528 | 3,529,114 | 350,480 | 24,994,726 | 227,300,528 |
Amounts in the income column in the above table include any capital gain distributions from underlying funds, which are presented in the corresponding line-item in the Statement of Operations, if applicable.
Investment Valuation
The following is a summary of the inputs used, as of September 30, 2020, involving the Fund's assets and liabilities carried at fair value. The inputs or methodology used for valuing securities may not be an indication of the risk associated with investing in those securities. For more information on valuation inputs, and their aggregation into the levels used below, please refer to the Investment Valuation section in the accompanying Notes to Financial Statements.
| | Valuation Inputs at Reporting Date: |
| Description | Total | Level 1 | Level 2 | Level 3 |
| Investments in Securities: | | | | |
| Domestic Equity Funds | $52,497,862 | $52,497,862 | $-- | $-- |
| International Equity Funds | 49,738,868 | 49,738,868 | -- | -- |
| Bond Funds | 95,318,475 | 95,318,475 | -- | -- |
| Short-Term Funds | 29,745,372 | 29,745,372 | -- | -- |
| Total Investments in Securities: | $227,300,577 | $227,300,577 | $-- | $-- |
See accompanying notes which are an integral part of the financial statements.
Fidelity Freedom® Blend 2015 Fund
Financial Statements
Statement of Assets and Liabilities
| | | September 30, 2020 (Unaudited) |
| Assets | | |
Investment in securities, at value — See accompanying schedule:
| | |
| Fidelity Central Funds (cost $49) | $49 | |
| Other affiliated issuers (cost $214,340,876) | 227,300,528 | |
| Total Investment in Securities (cost $214,340,925) | | $227,300,577 |
| Cash | | 623 |
| Receivable for investments sold | | 1,917,420 |
| Receivable for fund shares sold | | 71,325 |
| Total assets | | 229,289,945 |
| Liabilities | | |
| Payable for investments purchased | $1,436,281 | |
| Payable for fund shares redeemed | 498,953 | |
| Accrued management fee | 56,184 | |
| Distribution and service plan fees payable | 759 | |
| Total liabilities | | 1,992,177 |
| Net Assets | | $227,297,768 |
| Net Assets consist of: | | |
| Paid in capital | | $211,649,998 |
| Total accumulated earnings (loss) | | 15,647,770 |
| Net Assets | | $227,297,768 |
| Net Asset Value and Maximum Offering Price | | |
| Class A: | | |
| Net Asset Value and redemption price per share ($605,187 ÷ 56,442 shares)(a) | | $10.72 |
| Maximum offering price per share (100/94.25 of $10.72) | | $11.37 |
| Class M: | | |
| Net Asset Value and redemption price per share ($122,892 ÷ 11,460 shares)(a) | | $10.72 |
| Maximum offering price per share (100/96.50 of $10.72) | | $11.11 |
| Class C: | | |
| Net Asset Value and offering price per share ($695,176 ÷ 65,379 shares)(a) | | $10.63 |
| Fidelity Freedom Blend 2015 Fund: | | |
| Net Asset Value, offering price and redemption price per share ($8,292,299 ÷ 772,431 shares) | | $10.74 |
| Class K: | | |
| Net Asset Value, offering price and redemption price per share ($5,197,232 ÷ 483,188 shares) | | $10.76 |
| Class K6: | | |
| Net Asset Value, offering price and redemption price per share ($205,268,825 ÷ 19,048,692 shares) | | $10.78 |
| Class I: | | |
| Net Asset Value, offering price and redemption price per share ($5,439,744 ÷ 506,849 shares) | | $10.73 |
| Class Z: | | |
| Net Asset Value, offering price and redemption price per share ($113,901 ÷ 10,571 shares) | | $10.77 |
| Class Z6: | | |
| Net Asset Value, offering price and redemption price per share ($1,562,512 ÷ 145,068 shares) | | $10.77 |
(a) Redemption price per share is equal to net asset value less any applicable contingent deferred sales charge.
See accompanying notes which are an integral part of the financial statements.
Statement of Operations
| | | Six months ended September 30, 2020 (Unaudited) |
| Investment Income | | |
| Dividends: | | |
| Affiliated issuers | | $1,108,973 |
| Expenses | | |
| Management fee | $315,884 | |
| Distribution and service plan fees | 4,113 | |
| Independent trustees' fees and expenses | 284 | |
| Total expenses | | 320,281 |
| Net investment income (loss) | | 788,692 |
| Realized and Unrealized Gain (Loss) | | |
| Net realized gain (loss) on: | | |
| Investment securities: | | |
| Affiliated issuers | 350,480 | |
| Capital gain distributions from underlying funds: | | |
| Affiliated issuers | 2,420,141 | |
| Total net realized gain (loss) | | 2,770,621 |
| Change in net unrealized appreciation (depreciation) on: | | |
| Investment securities: | | |
| Affiliated issuers | 24,994,726 | |
| Total change in net unrealized appreciation (depreciation) | | 24,994,726 |
| Net gain (loss) | | 27,765,347 |
| Net increase (decrease) in net assets resulting from operations | | $28,554,039 |
See accompanying notes which are an integral part of the financial statements.
Statement of Changes in Net Assets
| | Six months ended September 30, 2020 (Unaudited) | Year ended March 31, 2020 |
| Increase (Decrease) in Net Assets | | |
| Operations | | |
| Net investment income (loss) | $788,692 | $3,499,365 |
| Net realized gain (loss) | 2,770,621 | 3,042,260 |
| Change in net unrealized appreciation (depreciation) | 24,994,726 | (12,460,486) |
| Net increase (decrease) in net assets resulting from operations | 28,554,039 | (5,918,861) |
| Distributions to shareholders | (2,066,451) | (5,354,235) |
| Share transactions - net increase (decrease) | 18,441,664 | 184,166,038 |
| Total increase (decrease) in net assets | 44,929,252 | 172,892,942 |
| Net Assets | | |
| Beginning of period | 182,368,516 | 9,475,574 |
| End of period | $227,297,768 | $182,368,516 |
See accompanying notes which are an integral part of the financial statements.
Financial Highlights
Fidelity Freedom Blend 2015 Fund Class A
| | Six months ended (Unaudited) September 30, | Years endedMarch 31, | |
| | 2020 | 2020 | 2019 A |
| Selected Per–Share Data | | | |
| Net asset value, beginning of period | $9.43 | $9.91 | $10.00 |
| Income from Investment Operations | | | |
| Net investment income (loss)B | .02 | .16 | .07 |
| Net realized and unrealized gain (loss) | 1.37 | (.37) | –C |
| Total from investment operations | 1.39 | (.21) | .07 |
| Distributions from net investment income | (.02) | (.15) | (.09) |
| Distributions from net realized gain | (.08) | (.12) | (.07) |
| Total distributions | (.10) | (.27) | (.16) |
| Net asset value, end of period | $10.72 | $9.43 | $9.91 |
| Total ReturnD,E | 14.82% | (2.38)% | .85% |
| Ratios to Average Net AssetsF | | | |
| Expenses before reductions | .73%G | .73% | .74%G |
| Expenses net of fee waivers, if any | .73%G | .73% | .74%G |
| Expenses net of all reductions | .73%G | .73% | .74%G |
| Net investment income (loss) | .31%G | 1.58% | 1.24%G |
| Supplemental Data | | | |
| Net assets, end of period (000 omitted) | $605 | $346 | $195 |
| Portfolio turnover rateH | 37%G | 40% | 52%G |
A For the period August 31, 2018 (commencement of operations) to March 31, 2019.
B Calculated based on average shares outstanding during the period.
C Amount represents less than $.005 per share.
D Total returns for periods of less than one year are not annualized.
E Total returns do not include the effect of the sales charges.
F Expense ratios reflect operating expenses of the class. Expenses before reductions do not reflect amounts reimbursed, waived, or reduced through arrangements with the investment adviser, brokerage services, or other offset arrangements, if applicable, and do not represent the amount paid by the class during periods when reimbursements, waivers or reductions occur.
G Annualized
H Amount does not include the portfolio activity of any underlying mutual funds or exchange-traded funds (ETFs).
See accompanying notes which are an integral part of the financial statements.
Fidelity Freedom Blend 2015 Fund Class M
| | Six months ended (Unaudited) September 30, | Years endedMarch 31, | |
| | 2020 | 2020 | 2019 A |
| Selected Per–Share Data | | | |
| Net asset value, beginning of period | $9.44 | $9.90 | $10.00 |
| Income from Investment Operations | | | |
| Net investment income (loss)B | –C | .14 | .06 |
| Net realized and unrealized gain (loss) | 1.37 | (.36) | –C |
| Total from investment operations | 1.37 | (.22) | .06 |
| Distributions from net investment income | –C | (.12) | (.09) |
| Distributions from net realized gain | (.08) | (.12) | (.07) |
| Total distributions | (.09)D | (.24) | (.16) |
| Net asset value, end of period | $10.72 | $9.44 | $9.90 |
| Total ReturnE,F | 14.57% | (2.50)% | .67% |
| Ratios to Average Net AssetsG | | | |
| Expenses before reductions | .98%H | .98% | .99%H |
| Expenses net of fee waivers, if any | .98%H | .98% | .99%H |
| Expenses net of all reductions | .98%H | .98% | .99%H |
| Net investment income (loss) | .06%H | 1.33% | .99%H |
| Supplemental Data | | | |
| Net assets, end of period (000 omitted) | $123 | $107 | $101 |
| Portfolio turnover rateI | 37%H | 40% | 52%H |
A For the period August 31, 2018 (commencement of operations) to March 31, 2019.
B Calculated based on average shares outstanding during the period.
C Amount represents less than $.005 per share.
D Total distributions per share do not sum due to rounding.
E Total returns for periods of less than one year are not annualized.
F Total returns do not include the effect of the sales charges.
G Expense ratios reflect operating expenses of the class. Expenses before reductions do not reflect amounts reimbursed, waived, or reduced through arrangements with the investment adviser, brokerage services, or other offset arrangements, if applicable, and do not represent the amount paid by the class during periods when reimbursements, waivers or reductions occur.
H Annualized
I Amount does not include the portfolio activity of any underlying mutual funds or exchange-traded funds (ETFs).
See accompanying notes which are an integral part of the financial statements.
Fidelity Freedom Blend 2015 Fund Class C
| | Six months ended (Unaudited) September 30, | Years endedMarch 31, | |
| | 2020 | 2020 | 2019 A |
| Selected Per–Share Data | | | |
| Net asset value, beginning of period | $9.39 | $9.87 | $10.00 |
| Income from Investment Operations | | | |
| Net investment income (loss)B | (.02) | .08 | .03 |
| Net realized and unrealized gain (loss) | 1.35 | (.36) | –C |
| Total from investment operations | 1.33 | (.28) | .03 |
| Distributions from net investment income | (.01) | (.08) | (.09) |
| Distributions from net realized gain | (.08) | (.12) | (.07) |
| Total distributions | (.09) | (.20) | (.16) |
| Net asset value, end of period | $10.63 | $9.39 | $9.87 |
| Total ReturnD,E | 14.28% | (3.04)% | .43% |
| Ratios to Average Net AssetsF | | | |
| Expenses before reductions | 1.48%G | 1.48% | 1.50%G,H |
| Expenses net of fee waivers, if any | 1.48%G | 1.48% | 1.50%G,H |
| Expenses net of all reductions | 1.48%G | 1.48% | 1.50%G,H |
| Net investment income (loss) | (.44)%G | .83% | .48%G |
| Supplemental Data | | | |
| Net assets, end of period (000 omitted) | $695 | $467 | $144 |
| Portfolio turnover rateI | 37%G | 40% | 52%G |
A For the period August 31, 2018 (commencement of operations) to March 31, 2019.
B Calculated based on average shares outstanding during the period.
C Amount represents less than $.005 per share.
D Total returns for periods of less than one year are not annualized.
E Total returns do not include the effect of the contingent deferred sales charge.
F Expense ratios reflect operating expenses of the class. Expenses before reductions do not reflect amounts reimbursed, waived, or reduced through arrangements with the investment adviser, brokerage services, or other offset arrangements, if applicable, and do not represent the amount paid by the class during periods when reimbursements, waivers or reductions occur.
G Annualized
H On certain classes, the size and fluctuation of net assets and expense amounts may cause ratios to differ from contractual rates.
I Amount does not include the portfolio activity of any underlying mutual funds or exchange-traded funds (ETFs).
See accompanying notes which are an integral part of the financial statements.
Fidelity Freedom Blend 2015 Fund
| | Six months ended (Unaudited) September 30, | Years endedMarch 31, | |
| | 2020 | 2020 | 2019 A |
| Selected Per–Share Data | | | |
| Net asset value, beginning of period | $9.44 | $9.91 | $10.00 |
| Income from Investment Operations | | | |
| Net investment income (loss)B | .03 | .19 | .08 |
| Net realized and unrealized gain (loss) | 1.37 | (.37) | .01 |
| Total from investment operations | 1.40 | (.18) | .09 |
| Distributions from net investment income | (.02) | (.17) | (.11) |
| Distributions from net realized gain | (.08) | (.12) | (.07) |
| Total distributions | (.10) | (.29) | (.18) |
| Net asset value, end of period | $10.74 | $9.44 | $9.91 |
| Total ReturnC | 14.96% | (2.09)% | 1.02% |
| Ratios to Average Net AssetsD | | | |
| Expenses before reductions | .48%E | .49%F | .49%E |
| Expenses net of fee waivers, if any | .48%E | .49%F | .49%E |
| Expenses net of all reductions | .48%E | .49%F | .49%E |
| Net investment income (loss) | .56%E | 1.83% | 1.49%E |
| Supplemental Data | | | |
| Net assets, end of period (000 omitted) | $8,292 | $8,440 | $468 |
| Portfolio turnover rateG | 37%E | 40% | 52%E |
A For the period August 31, 2018 (commencement of operations) to March 31, 2019.
B Calculated based on average shares outstanding during the period.
C Total returns for periods of less than one year are not annualized.
D Expense ratios reflect operating expenses of the class. Expenses before reductions do not reflect amounts reimbursed, waived, or reduced through arrangements with the investment adviser, brokerage services, or other offset arrangements, if applicable, and do not represent the amount paid by the class during periods when reimbursements, waivers or reductions occur.
E Annualized
F On certain classes, the size and fluctuation of net assets and expense amounts may cause ratios to differ from contractual rates.
G Amount does not include the portfolio activity of any underlying mutual funds or exchange-traded funds (ETFs).
See accompanying notes which are an integral part of the financial statements.
Fidelity Freedom Blend 2015 Fund Class K
| | Six months ended (Unaudited) September 30, | Years endedMarch 31, | |
| | 2020 | 2020 | 2019 A |
| Selected Per–Share Data | | | |
| Net asset value, beginning of period | $9.45 | $9.92 | $10.00 |
| Income from Investment Operations | | | |
| Net investment income (loss)B | .03 | .20 | .09 |
| Net realized and unrealized gain (loss) | 1.38 | (.37) | –C |
| Total from investment operations | 1.41 | (.17) | .09 |
| Distributions from net investment income | (.02) | (.18) | (.11) |
| Distributions from net realized gain | (.08) | (.12) | (.07) |
| Total distributions | (.10) | (.30) | (.17)D |
| Net asset value, end of period | $10.76 | $9.45 | $9.92 |
| Total ReturnE | 15.06% | (2.03)% | 1.07% |
| Ratios to Average Net AssetsF | | | |
| Expenses before reductions | .38%G | .38% | .39%G |
| Expenses net of fee waivers, if any | .38%G | .38% | .39%G |
| Expenses net of all reductions | .38%G | .38% | .39%G |
| Net investment income (loss) | .66%G | 1.93% | 1.59%G |
| Supplemental Data | | | |
| Net assets, end of period (000 omitted) | $5,197 | $6,147 | $101 |
| Portfolio turnover rateH | 37%G | 40% | 52%G |
A For the period August 31, 2018 (commencement of operations) to March 31, 2019.
B Calculated based on average shares outstanding during the period.
C Amount represents less than $.005 per share.
D Total distributions per share do not sum due to rounding.
E Total returns for periods of less than one year are not annualized.
F Expense ratios reflect operating expenses of the class. Expenses before reductions do not reflect amounts reimbursed, waived, or reduced through arrangements with the investment adviser, brokerage services, or other offset arrangements, if applicable, and do not represent the amount paid by the class during periods when reimbursements, waivers or reductions occur.
G Annualized
H Amount does not include the portfolio activity of any underlying mutual funds or exchange-traded funds (ETFs).
See accompanying notes which are an integral part of the financial statements.
Fidelity Freedom Blend 2015 Fund Class K6
| | Six months ended (Unaudited) September 30, | Years endedMarch 31, | |
| | 2020 | 2020 | 2019 A |
| Selected Per–Share Data | | | |
| Net asset value, beginning of period | $9.47 | $9.92 | $10.00 |
| Income from Investment Operations | | | |
| Net investment income (loss)B | .04 | .21 | .09 |
| Net realized and unrealized gain (loss) | 1.38 | (.37) | .01 |
| Total from investment operations | 1.42 | (.16) | .10 |
| Distributions from net investment income | (.02) | (.17) | (.11) |
| Distributions from net realized gain | (.08) | (.12) | (.07) |
| Total distributions | (.11)C | (.29) | (.18) |
| Net asset value, end of period | $10.78 | $9.47 | $9.92 |
| Total ReturnD | 15.05% | (1.86)% | 1.12% |
| Ratios to Average Net AssetsE | | | |
| Expenses before reductions | .28%F | .28% | .30%F,G |
| Expenses net of fee waivers, if any | .28%F | .28% | .30%F,G |
| Expenses net of all reductions | .28%F | .28% | .30%F,G |
| Net investment income (loss) | .76%F | 2.03% | 1.68%F |
| Supplemental Data | | | |
| Net assets, end of period (000 omitted) | $205,269 | $162,504 | $8,164 |
| Portfolio turnover rateH | 37%F | 40% | 52%F |
A For the period August 31, 2018 (commencement of operations) to March 31, 2019.
B Calculated based on average shares outstanding during the period.
C Total distributions per share do not sum due to rounding.
D Total returns for periods of less than one year are not annualized.
E Expense ratios reflect operating expenses of the class. Expenses before reductions do not reflect amounts reimbursed, waived, or reduced through arrangements with the investment adviser, brokerage services, or other offset arrangements, if applicable, and do not represent the amount paid by the class during periods when reimbursements, waivers or reductions occur.
F Annualized
G On certain classes, the size and fluctuation of net assets and expense amounts may cause ratios to differ from contractual rates.
H Amount does not include the portfolio activity of any underlying mutual funds or exchange-traded funds (ETFs).
See accompanying notes which are an integral part of the financial statements.
Fidelity Freedom Blend 2015 Fund Class I
| | Six months ended (Unaudited) September 30, | Years endedMarch 31, | |
| | 2020 | 2020 | 2019 A |
| Selected Per–Share Data | | | |
| Net asset value, beginning of period | $9.44 | $9.92 | $10.00 |
| Income from Investment Operations | | | |
| Net investment income (loss)B | .03 | .19 | .08 |
| Net realized and unrealized gain (loss) | 1.36 | (.37) | .01 |
| Total from investment operations | 1.39 | (.18) | .09 |
| Distributions from net investment income | (.02) | (.18) | (.10) |
| Distributions from net realized gain | (.08) | (.12) | (.07) |
| Total distributions | (.10) | (.30) | (.17) |
| Net asset value, end of period | $10.73 | $9.44 | $9.92 |
| Total ReturnC | 14.87% | (2.09)% | 1.04% |
| Ratios to Average Net AssetsD | | | |
| Expenses before reductions | .48%E | .48% | .49%E |
| Expenses net of fee waivers, if any | .48%E | .48% | .49%E |
| Expenses net of all reductions | .48%E | .48% | .49%E |
| Net investment income (loss) | .56%E | 1.83% | 1.49%E |
| Supplemental Data | | | |
| Net assets, end of period (000 omitted) | $5,440 | $3,592 | $101 |
| Portfolio turnover rateF | 37%E | 40% | 52%E |
A For the period August 31, 2018 (commencement of operations) to March 31, 2019.
B Calculated based on average shares outstanding during the period.
C Total returns for periods of less than one year are not annualized.
D Expense ratios reflect operating expenses of the class. Expenses before reductions do not reflect amounts reimbursed, waived, or reduced through arrangements with the investment adviser, brokerage services, or other offset arrangements, if applicable, and do not represent the amount paid by the class during periods when reimbursements, waivers or reductions occur.
E Annualized
F Amount does not include the portfolio activity of any underlying mutual funds or exchange-traded funds (ETFs).
See accompanying notes which are an integral part of the financial statements.
Fidelity Freedom Blend 2015 Fund Class Z
| | Six months ended (Unaudited) September 30, | Years endedMarch 31, | |
| | 2020 | 2020 | 2019 A |
| Selected Per–Share Data | | | |
| Net asset value, beginning of period | $9.47 | $9.92 | $10.00 |
| Income from Investment Operations | | | |
| Net investment income (loss)B | .03 | .20 | .09 |
| Net realized and unrealized gain (loss) | 1.37 | (.37) | –C |
| Total from investment operations | 1.40 | (.17) | .09 |
| Distributions from net investment income | (.02) | (.16) | (.11) |
| Distributions from net realized gain | (.08) | (.12) | (.07) |
| Total distributions | (.10) | (.28) | (.17)D |
| Net asset value, end of period | $10.77 | $9.47 | $9.92 |
| Total ReturnE | 14.92% | (1.99)% | 1.07% |
| Ratios to Average Net AssetsF | | | |
| Expenses before reductions | .38%G | .38% | .39%G |
| Expenses net of fee waivers, if any | .38%G | .38% | .39%G |
| Expenses net of all reductions | .38%G | .38% | .39%G |
| Net investment income (loss) | .66%G | 1.93% | 1.59%G |
| Supplemental Data | | | |
| Net assets, end of period (000 omitted) | $114 | $99 | $101 |
| Portfolio turnover rateH | 37%G | 40% | 52%G |
A For the period August 31, 2018 (commencement of operations) to March 31, 2019.
B Calculated based on average shares outstanding during the period.
C Amount represents less than $.005 per share.
D Total distributions per share do not sum due to rounding.
E Total returns for periods of less than one year are not annualized.
F Expense ratios reflect operating expenses of the class. Expenses before reductions do not reflect amounts reimbursed, waived, or reduced through arrangements with the investment adviser, brokerage services, or other offset arrangements, if applicable, and do not represent the amount paid by the class during periods when reimbursements, waivers or reductions occur.
G Annualized
H Amount does not include the portfolio activity of any underlying mutual funds or exchange-traded funds (ETFs).
See accompanying notes which are an integral part of the financial statements.
Fidelity Freedom Blend 2015 Fund Class Z6
| | Six months ended (Unaudited) September 30, | Years endedMarch 31, | |
| | 2020 | 2020 | 2019 A |
| Selected Per–Share Data | | | |
| Net asset value, beginning of period | $9.46 | $9.92 | $10.00 |
| Income from Investment Operations | | | |
| Net investment income (loss)B | .04 | .21 | .10 |
| Net realized and unrealized gain (loss) | 1.38 | (.37) | –C |
| Total from investment operations | 1.42 | (.16) | .10 |
| Distributions from net investment income | (.03) | (.18) | (.11) |
| Distributions from net realized gain | (.08) | (.12) | (.07) |
| Total distributions | (.11) | (.30) | (.18) |
| Net asset value, end of period | $10.77 | $9.46 | $9.92 |
| Total ReturnD | 15.11% | (1.95)% | 1.12% |
| Ratios to Average Net AssetsE | | | |
| Expenses before reductions | .28%F | .28% | .29%F |
| Expenses net of fee waivers, if any | .28%F | .28% | .29%F |
| Expenses net of all reductions | .28%F | .28% | .29%F |
| Net investment income (loss) | .76%F | 2.03% | 1.69%F |
| Supplemental Data | | | |
| Net assets, end of period (000 omitted) | $1,563 | $667 | $101 |
| Portfolio turnover rateG | 37%F | 40% | 52%F |
A For the period August 31, 2018 (commencement of operations) to March 31, 2019.
B Calculated based on average shares outstanding during the period.
C Amount represents less than $.005 per share.
D Total returns for periods of less than one year are not annualized.
E Expense ratios reflect operating expenses of the class. Expenses before reductions do not reflect amounts reimbursed, waived, or reduced through arrangements with the investment adviser, brokerage services, or other offset arrangements, if applicable, and do not represent the amount paid by the class during periods when reimbursements, waivers or reductions occur.
F Annualized
G Amount does not include the portfolio activity of any underlying mutual funds or exchange-traded funds (ETFs).
See accompanying notes which are an integral part of the financial statements.
Fidelity Freedom® Blend 2020 Fund
Investment Summary (Unaudited)
The information in the following tables is based on the direct investments of the Fund.
Top Holdings as of September 30, 2020
| | % of fund's net assets |
| Fidelity Series Emerging Markets Opportunities Fund | 9.8 |
| Fidelity Series Investment Grade Bond Fund | 7.8 |
| Fidelity Series Large Cap Value Index Fund | 7.6 |
| Fidelity Series Inflation-Protected Bond Index Fund | 7.1 |
| Fidelity Series Government Bond Index Fund | 7.0 |
| Fidelity Series Treasury Bill Index Fund | 5.9 |
| Fidelity Series Corporate Bond Fund | 5.8 |
| Fidelity Series Blue Chip Growth Fund | 5.8 |
| Fidelity Series Investment Grade Securitized Fund | 5.3 |
| Fidelity Series Large Cap Stock Fund | 4.0 |
| | 66.1 |
Asset Allocation (% of fund's net assets)
| Period end |
| | Domestic Equity Funds | 28.3% |
| | International Equity Funds | 25.3% |
| | Bond Funds | 37.1% |
| | Short-Term Funds | 9.3% |

Domestic Equity Funds category includes Fidelity Series Commodity Strategy Fund which invests in commodity-related investments.
Fidelity Freedom® Blend 2020 Fund
Schedule of Investments September 30, 2020 (Unaudited)
Showing Percentage of Net Assets
| Domestic Equity Funds - 28.3% | | | |
| | | Shares | Value |
| Fidelity Series Blue Chip Growth Fund (a) | | 2,417,841 | $39,918,552 |
| Fidelity Series Commodity Strategy Fund (a) | | 4,174,869 | 17,367,457 |
| Fidelity Series Large Cap Growth Index Fund (a) | | 1,794,647 | 25,555,773 |
| Fidelity Series Large Cap Stock Fund (a) | | 1,944,258 | 27,530,690 |
| Fidelity Series Large Cap Value Index Fund (a) | | 4,489,123 | 52,073,824 |
| Fidelity Series Small Cap Opportunities Fund (a) | | 1,026,876 | 13,102,934 |
| Fidelity Series Value Discovery Fund (a) | | 1,529,449 | 18,903,984 |
| TOTAL DOMESTIC EQUITY FUNDS | | | |
| (Cost $187,320,868) | | | 194,453,214 |
|
| International Equity Funds - 25.3% | | | |
| Fidelity Series Canada Fund (a) | | 899,754 | 9,204,482 |
| Fidelity Series Emerging Markets Fund (a) | | 797,274 | 7,518,290 |
| Fidelity Series Emerging Markets Opportunities Fund (a) | | 3,219,697 | 67,549,236 |
| Fidelity Series International Growth Fund (a) | | 1,273,356 | 23,913,629 |
| Fidelity Series International Index Fund (a) | | 992,590 | 9,866,345 |
| Fidelity Series International Small Cap Fund (a) | | 475,990 | 8,472,614 |
| Fidelity Series International Value Fund (a) | | 2,752,873 | 23,729,767 |
| Fidelity Series Overseas Fund (a) | | 2,135,881 | 23,879,149 |
| TOTAL INTERNATIONAL EQUITY FUNDS | | | |
| (Cost $158,268,002) | | | 174,133,512 |
|
| Bond Funds - 37.1% | | | |
| Fidelity Series Corporate Bond Fund (a) | | 3,563,553 | 40,089,976 |
| Fidelity Series Emerging Markets Debt Fund (a) | | 467,299 | 4,233,729 |
| Fidelity Series Floating Rate High Income Fund (a) | | 106,100 | 938,986 |
| Fidelity Series Government Bond Index Fund (a) | | 4,258,642 | 47,909,718 |
| Fidelity Series High Income Fund (a) | | 526,830 | 4,804,689 |
| Fidelity Series Inflation-Protected Bond Index Fund (a) | | 4,536,102 | 48,536,292 |
| Fidelity Series Investment Grade Bond Fund (a) | | 4,356,064 | 53,318,225 |
| Fidelity Series Investment Grade Securitized Fund (a) | | 3,405,968 | 36,341,683 |
| Fidelity Series Long-Term Treasury Bond Index Fund (a) | | 1,532,597 | 15,831,724 |
| Fidelity Series Real Estate Income Fund (a) | | 285,003 | 2,844,329 |
| TOTAL BOND FUNDS | | | |
| (Cost $238,230,023) | | | 254,849,351 |
|
| Short-Term Funds - 9.3% | | | |
| Fidelity Series Government Money Market Fund 0.16% (a)(b) | | 13,338,843 | 13,338,843 |
| Fidelity Series Short-Term Credit Fund (a) | | 1,032,472 | 10,582,837 |
| Fidelity Series Treasury Bill Index Fund (a) | | 4,016,157 | 40,201,729 |
| TOTAL SHORT-TERM FUNDS | | | |
| (Cost $63,821,727) | | | 64,123,409 |
| TOTAL INVESTMENT IN SECURITIES - 100.0% | | | |
| (Cost $647,640,620) | | | 687,559,486 |
| NET OTHER ASSETS (LIABILITIES) - 0.0% | | | (8,248) |
| NET ASSETS - 100% | | | $687,551,238 |
Legend
(a) Affiliated Fund
(b) The rate quoted is the annualized seven-day yield of the fund at period end.
Affiliated Underlying Funds
Fiscal year to date information regarding the Fund's investments in affiliated Underlying Funds, excluding any Money Market Central Funds, is presented below. Exchanges between classes of the same affiliated Underlying Funds may occur.
| Affiliate | Value, beginning of period | Purchases | Sales Proceeds | Dividend Income | Realized Gain (loss) | Change in Unrealized appreciation (depreciation) | Value, end of period |
| Fidelity Series Blue Chip Growth Fund | $26,012,694 | $16,189,589 | $11,188,295 | $7,852,945 | $1,576,661 | $7,327,903 | $39,918,552 |
| Fidelity Series Canada Fund | 7,248,132 | 1,777,400 | 1,545,930 | -- | (163,350) | 1,888,230 | 9,204,482 |
| Fidelity Series Commodity Strategy Fund | 17,938,733 | 3,137,048 | 5,858,044 | 73,202 | (780,145) | 2,929,865 | 17,367,457 |
| Fidelity Series Corporate Bond Fund | 27,094,612 | 12,911,902 | 3,082,059 | 549,971 | 21,506 | 3,144,015 | 40,089,976 |
| Fidelity Series Emerging Markets Debt Fund | 3,314,311 | 695,203 | 214,887 | 106,221 | 1,616 | 437,486 | 4,233,729 |
| Fidelity Series Emerging Markets Fund | 4,086,412 | 2,311,332 | 606,221 | -- | 2,549 | 1,724,218 | 7,518,290 |
| Fidelity Series Emerging Markets Opportunities Fund | 38,817,674 | 20,404,970 | 7,757,524 | -- | 229,837 | 15,854,279 | 67,549,236 |
| Fidelity Series Floating Rate High Income Fund | 748,391 | 162,379 | 51,988 | 19,884 | 322 | 79,882 | 938,986 |
| Fidelity Series Government Bond Index Fund | 41,922,340 | 12,708,132 | 6,581,070 | 340,347 | 18,363 | (158,047) | 47,909,718 |
| Fidelity Series Government Money Market Fund 0.16% | 11,006,228 | 19,592,565 | 17,259,950 | 15,207 | -- | -- | 13,338,843 |
| Fidelity Series High Income Fund | 3,797,208 | 837,304 | 259,945 | 124,825 | 1,498 | 428,624 | 4,804,689 |
| Fidelity Series Inflation-Protected Bond Index Fund | 37,365,671 | 11,978,825 | 3,394,699 | 35,134 | 27,128 | 2,559,367 | 48,536,292 |
| Fidelity Series International Growth Fund | 21,407,755 | 4,612,326 | 8,168,993 | -- | 460,355 | 5,602,186 | 23,913,629 |
| Fidelity Series International Index Fund | 7,850,319 | 1,965,911 | 1,713,053 | -- | (111,322) | 1,874,490 | 9,866,345 |
| Fidelity Series International Small Cap Fund | 6,308,839 | 1,163,787 | 1,102,214 | -- | (10,611) | 2,112,813 | 8,472,614 |
| Fidelity Series International Value Fund | 20,489,878 | 4,747,483 | 5,741,585 | -- | (185,464) | 4,419,455 | 23,729,767 |
| Fidelity Series Investment Grade Bond Fund | 40,661,440 | 14,685,749 | 4,750,343 | 635,541 | 34,572 | 2,686,807 | 53,318,225 |
| Fidelity Series Investment Grade Securitized Fund | 28,518,951 | 10,746,706 | 3,298,291 | 209,633 | 8,286 | 366,031 | 36,341,683 |
| Fidelity Series Large Cap Growth Index Fund | 19,388,748 | 5,128,890 | 7,477,380 | 453,852 | 973,332 | 7,542,183 | 25,555,773 |
| Fidelity Series Large Cap Stock Fund | 20,128,885 | 7,045,350 | 3,396,351 | 964,907 | 76,317 | 3,676,489 | 27,530,690 |
| Fidelity Series Large Cap Value Index Fund | 37,421,552 | 12,552,490 | 5,894,707 | -- | (91,482) | 8,085,971 | 52,073,824 |
| Fidelity Series Long-Term Treasury Bond Index Fund | 13,229,317 | 5,157,866 | 2,159,964 | 363,648 | 153,826 | (549,321) | 15,831,724 |
| Fidelity Series Overseas Fund | 20,238,998 | 5,240,302 | 7,489,957 | -- | (262,598) | 6,152,404 | 23,879,149 |
| Fidelity Series Real Estate Income Fund | 2,064,509 | 535,084 | 162,988 | 88,508 | 2,440 | 405,284 | 2,844,329 |
| Fidelity Series Short-Term Credit Fund | 10,089,337 | 115,106 | -- | 115,106 | -- | 378,394 | 10,582,837 |
| Fidelity Series Small Cap Opportunities Fund | 9,978,241 | 2,792,440 | 2,221,633 | 77,775 | (196,144) | 2,750,030 | 13,102,934 |
| Fidelity Series Treasury Bill Index Fund | 39,804,187 | 715,459 | 197,822 | 158,898 | (136) | (119,959) | 40,201,729 |
| Fidelity Series Value Discovery Fund | 11,708,583 | 6,085,030 | 1,897,330 | -- | 45,690 | 2,962,011 | 18,903,984 |
| | 528,641,945 | 185,996,628 | 113,473,223 | 12,185,604 | 1,833,046 | 84,561,090 | 687,559,486 |
Amounts in the income column in the above table include any capital gain distributions from underlying funds, which are presented in the corresponding line-item in the Statement of Operations, if applicable.
Investment Valuation
The following is a summary of the inputs used, as of September 30, 2020, involving the Fund's assets and liabilities carried at fair value. The inputs or methodology used for valuing securities may not be an indication of the risk associated with investing in those securities. For more information on valuation inputs, and their aggregation into the levels used below, please refer to the Investment Valuation section in the accompanying Notes to Financial Statements.
| | Valuation Inputs at Reporting Date: |
| Description | Total | Level 1 | Level 2 | Level 3 |
| Investments in Securities: | | | | |
| Domestic Equity Funds | $194,453,214 | $194,453,214 | $-- | $-- |
| International Equity Funds | 174,133,512 | 174,133,512 | -- | -- |
| Bond Funds | 254,849,351 | 254,849,351 | -- | -- |
| Short-Term Funds | 64,123,409 | 64,123,409 | -- | -- |
| Total Investments in Securities: | $687,559,486 | $687,559,486 | $-- | $-- |
See accompanying notes which are an integral part of the financial statements.
Fidelity Freedom® Blend 2020 Fund
Financial Statements
Statement of Assets and Liabilities
| | | September 30, 2020 (Unaudited) |
| Assets | | |
Investment in securities, at value — See accompanying schedule:
| | |
| Affiliated issuers (cost $647,640,620) | $687,559,486 | |
| Total Investment in Securities (cost $647,640,620) | | $687,559,486 |
| Cash | | 1,460 |
| Receivable for investments sold | | 5,438,629 |
| Receivable for fund shares sold | | 1,326,368 |
| Total assets | | 694,325,943 |
| Liabilities | | |
| Payable for investments purchased | $5,392,625 | |
| Payable for fund shares redeemed | 1,205,802 | |
| Accrued management fee | 174,900 | |
| Distribution and service plan fees payable | 1,378 | |
| Total liabilities | | 6,774,705 |
| Net Assets | | $687,551,238 |
| Net Assets consist of: | | |
| Paid in capital | | $637,869,455 |
| Total accumulated earnings (loss) | | 49,681,783 |
| Net Assets | | $687,551,238 |
| Net Asset Value and Maximum Offering Price | | |
| Class A: | | |
| Net Asset Value and redemption price per share ($2,328,386 ÷ 215,986 shares)(a) | | $10.78 |
| Maximum offering price per share (100/94.25 of $10.78) | | $11.44 |
| Class M: | | |
| Net Asset Value and redemption price per share ($603,115 ÷ 56,005 shares)(a) | | $10.77 |
| Maximum offering price per share (100/96.50 of $10.77) | | $11.16 |
| Class C: | | |
| Net Asset Value and offering price per share ($787,913 ÷ 73,563 shares)(a) | | $10.71 |
| Fidelity Freedom Blend 2020 Fund: | | |
| Net Asset Value, offering price and redemption price per share ($25,975,975 ÷ 2,406,163 shares) | | $10.80 |
| Class K: | | |
| Net Asset Value, offering price and redemption price per share ($22,872,806 ÷ 2,114,670 shares) | | $10.82 |
| Class K6: | | |
| Net Asset Value, offering price and redemption price per share ($623,903,762 ÷ 57,556,964 shares) | | $10.84 |
| Class I: | | |
| Net Asset Value, offering price and redemption price per share ($7,777,745 ÷ 719,960 shares) | | $10.80 |
| Class Z: | | |
| Net Asset Value, offering price and redemption price per share ($141,793 ÷ 13,083 shares) | | $10.84 |
| Class Z6: | | |
| Net Asset Value, offering price and redemption price per share ($3,159,743 ÷ 291,549 shares) | | $10.84 |
(a) Redemption price per share is equal to net asset value less any applicable contingent deferred sales charge.
See accompanying notes which are an integral part of the financial statements.
Statement of Operations
| | | Six months ended September 30, 2020 (Unaudited) |
| Investment Income | | |
| Dividends: | | |
| Affiliated issuers | | $3,163,391 |
| Expenses | | |
| Management fee | $973,936 | |
| Distribution and service plan fees | 6,716 | |
| Independent trustees' fees and expenses | 849 | |
| Total expenses before reductions | 981,501 | |
| Expense reductions | (122) | |
| Total expenses after reductions | | 981,379 |
| Net investment income (loss) | | 2,182,012 |
| Realized and Unrealized Gain (Loss) | | |
| Net realized gain (loss) on: | | |
| Investment securities: | | |
| Affiliated issuers | 1,833,046 | |
| Capital gain distributions from underlying funds: | | |
| Affiliated issuers | 9,022,213 | |
| Total net realized gain (loss) | | 10,855,259 |
| Change in net unrealized appreciation (depreciation) on: | | |
| Investment securities: | | |
| Affiliated issuers | 84,561,090 | |
| Total change in net unrealized appreciation (depreciation) | | 84,561,090 |
| Net gain (loss) | | 95,416,349 |
| Net increase (decrease) in net assets resulting from operations | | $97,598,361 |
See accompanying notes which are an integral part of the financial statements.
Statement of Changes in Net Assets
| | Six months ended September 30, 2020 (Unaudited) | Year ended March 31, 2020 |
| Increase (Decrease) in Net Assets | | |
| Operations | | |
| Net investment income (loss) | $2,182,012 | $10,320,788 |
| Net realized gain (loss) | 10,855,259 | 9,700,383 |
| Change in net unrealized appreciation (depreciation) | 84,561,090 | (46,012,630) |
| Net increase (decrease) in net assets resulting from operations | 97,598,361 | (25,991,459) |
| Distributions to shareholders | (6,532,306) | (16,892,690) |
| Share transactions - net increase (decrease) | 67,848,981 | 547,478,331 |
| Total increase (decrease) in net assets | 158,915,036 | 504,594,182 |
| Net Assets | | |
| Beginning of period | 528,636,202 | 24,042,020 |
| End of period | $687,551,238 | $528,636,202 |
See accompanying notes which are an integral part of the financial statements.
Financial Highlights
Fidelity Freedom Blend 2020 Fund Class A
| | Six months ended (Unaudited) September 30, | Years endedMarch 31, | |
| | 2020 | 2020 | 2019 A |
| Selected Per–Share Data | | | |
| Net asset value, beginning of period | $9.30 | $9.92 | $10.00 |
| Income from Investment Operations | | | |
| Net investment income (loss)B | .01 | .16 | .05 |
| Net realized and unrealized gain (loss) | 1.57 | (.49) | (.01) |
| Total from investment operations | 1.58 | (.33) | .04 |
| Distributions from net investment income | –C | (.15) | (.07) |
| Distributions from net realized gain | (.10) | (.14) | (.05) |
| Total distributions | (.10) | (.29) | (.12) |
| Net asset value, end of period | $10.78 | $9.30 | $9.92 |
| Total ReturnD,E,F | 17.09% | (3.65)% | .55% |
| Ratios to Average Net AssetsG | | | |
| Expenses before reductions | .74%H | .75% | .77%H,I |
| Expenses net of fee waivers, if any | .74%H | .75% | .77%H,I |
| Expenses net of all reductions | .74%H | .75% | .77%H,I |
| Net investment income (loss) | .25%H | 1.57% | .81%H |
| Supplemental Data | | | |
| Net assets, end of period (000 omitted) | $2,328 | $1,422 | $894 |
| Portfolio turnover rateJ | 36%H | 40% | 78%H |
A For the period August 31, 2018 (commencement of operations) to March 31, 2019.
B Calculated based on average shares outstanding during the period.
C Amount represents less than $.005 per share.
D Total returns for periods of less than one year are not annualized.
E Total returns would have been lower if certain expenses had not been reduced during the applicable periods shown.
F Total returns do not include the effect of the sales charges.
G Expense ratios reflect operating expenses of the class. Expenses before reductions do not reflect amounts reimbursed, waived, or reduced through arrangements with the investment adviser, brokerage services, or other offset arrangements, if applicable, and do not represent the amount paid by the class during periods when reimbursements, waivers or reductions occur.
H Annualized
I On certain classes, the size and fluctuation of net assets and expense amounts may cause ratios to differ from contractual rates.
J Amount does not include the portfolio activity of any underlying mutual funds or exchange-traded funds (ETFs).
See accompanying notes which are an integral part of the financial statements.
Fidelity Freedom Blend 2020 Fund Class M
| | Six months ended (Unaudited) September 30, | Years endedMarch 31, | |
| | 2020 | 2020 | 2019 A |
| Selected Per–Share Data | | | |
| Net asset value, beginning of period | $9.29 | $9.92 | $10.00 |
| Income from Investment Operations | | | |
| Net investment income (loss)B | –C | .13 | .03 |
| Net realized and unrealized gain (loss) | 1.58 | (.48) | (.01) |
| Total from investment operations | 1.58 | (.35) | .02 |
| Distributions from net investment income | – | (.14) | (.05) |
| Distributions from net realized gain | (.10) | (.14) | (.05) |
| Total distributions | (.10) | (.28) | (.10) |
| Net asset value, end of period | $10.77 | $9.29 | $9.92 |
| Total ReturnD,E,F | 17.06% | (3.91)% | .33% |
| Ratios to Average Net AssetsG | | | |
| Expenses before reductions | .99%H | 1.00% | 1.00%H |
| Expenses net of fee waivers, if any | .99%H | 1.00% | 1.00%H |
| Expenses net of all reductions | .99%H | 1.00% | 1.00%H |
| Net investment income (loss) | (.01)%H | 1.32% | .58%H |
| Supplemental Data | | | |
| Net assets, end of period (000 omitted) | $603 | $267 | $107 |
| Portfolio turnover rateI | 36%H | 40% | 78%H |
A For the period August 31, 2018 (commencement of operations) to March 31, 2019.
B Calculated based on average shares outstanding during the period.
C Amount represents less than $.005 per share.
D Total returns for periods of less than one year are not annualized.
E Total returns would have been lower if certain expenses had not been reduced during the applicable periods shown.
F Total returns do not include the effect of the sales charges.
G Expense ratios reflect operating expenses of the class. Expenses before reductions do not reflect amounts reimbursed, waived, or reduced through arrangements with the investment adviser, brokerage services, or other offset arrangements, if applicable, and do not represent the amount paid by the class during periods when reimbursements, waivers or reductions occur.
H Annualized
I Amount does not include the portfolio activity of any underlying mutual funds or exchange-traded funds (ETFs).
See accompanying notes which are an integral part of the financial statements.
Fidelity Freedom Blend 2020 Fund Class C
| | Six months ended (Unaudited) September 30, | Years endedMarch 31, | |
| | 2020 | 2020 | 2019 A |
| Selected Per–Share Data | | | |
| Net asset value, beginning of period | $9.26 | $9.90 | $10.00 |
| Income from Investment Operations | | | |
| Net investment income (loss)B | (.02) | .08 | –C |
| Net realized and unrealized gain (loss) | 1.56 | (.49) | –C |
| Total from investment operations | 1.54 | (.41) | –C |
| Distributions from net investment income | – | (.09) | (.05) |
| Distributions from net realized gain | (.09) | (.14) | (.05) |
| Total distributions | (.09) | (.23) | (.10) |
| Net asset value, end of period | $10.71 | $9.26 | $9.90 |
| Total ReturnD,E,F | 16.75% | (4.42)% | .08% |
| Ratios to Average Net AssetsG | | | |
| Expenses before reductions | 1.49%H | 1.50% | 1.52%H,I |
| Expenses net of fee waivers, if any | 1.49%H | 1.50% | 1.52%H,I |
| Expenses net of all reductions | 1.46%H | 1.50% | 1.52%H,I |
| Net investment income (loss) | (.47)%H | .82% | .06%H |
| Supplemental Data | | | |
| Net assets, end of period (000 omitted) | $788 | $413 | $385 |
| Portfolio turnover rateJ | 36%H | 40% | 78%H |
A For the period August 31, 2018 (commencement of operations) to March 31, 2019.
B Calculated based on average shares outstanding during the period.
C Amount represents less than $.005 per share.
D Total returns for periods of less than one year are not annualized.
E Total returns would have been lower if certain expenses had not been reduced during the applicable periods shown.
F Total returns do not include the effect of the contingent deferred sales charge.
G Expense ratios reflect operating expenses of the class. Expenses before reductions do not reflect amounts reimbursed, waived, or reduced through arrangements with the investment adviser, brokerage services, or other offset arrangements, if applicable, and do not represent the amount paid by the class during periods when reimbursements, waivers or reductions occur.
H Annualized
I On certain classes, the size and fluctuation of net assets and expense amounts may cause ratios to differ from contractual rates.
J Amount does not include the portfolio activity of any underlying mutual funds or exchange-traded funds (ETFs).
See accompanying notes which are an integral part of the financial statements.
Fidelity Freedom Blend 2020 Fund
| | Six months ended (Unaudited) September 30, | Years endedMarch 31, | |
| | 2020 | 2020 | 2019 A |
| Selected Per–Share Data | | | |
| Net asset value, beginning of period | $9.31 | $9.92 | $10.00 |
| Income from Investment Operations | | | |
| Net investment income (loss)B | .03 | .18 | .06 |
| Net realized and unrealized gain (loss) | 1.57 | (.48) | (.01) |
| Total from investment operations | 1.60 | (.30) | .05 |
| Distributions from net investment income | (.02) | (.17) | (.08) |
| Distributions from net realized gain | (.10) | (.14) | (.05) |
| Total distributions | (.11)C | (.31) | (.13) |
| Net asset value, end of period | $10.80 | $9.31 | $9.92 |
| Total ReturnD,E | 17.32% | (3.38)% | .63% |
| Ratios to Average Net AssetsF | | | |
| Expenses before reductions | .49%G | .51%H | .50%G |
| Expenses net of fee waivers, if any | .49%G | .51%H | .50%G |
| Expenses net of all reductions | .49%G | .51%H | .50%G |
| Net investment income (loss) | .50%G | 1.81% | 1.08%G |
| Supplemental Data | | | |
| Net assets, end of period (000 omitted) | $25,976 | $19,124 | $1,168 |
| Portfolio turnover rateI | 36%G | 40% | 78%G |
A For the period August 31, 2018 (commencement of operations) to March 31, 2019.
B Calculated based on average shares outstanding during the period.
C Total distributions per share do not sum due to rounding.
D Total returns for periods of less than one year are not annualized.
E Total returns would have been lower if certain expenses had not been reduced during the applicable periods shown.
F Expense ratios reflect operating expenses of the class. Expenses before reductions do not reflect amounts reimbursed, waived, or reduced through arrangements with the investment adviser, brokerage services, or other offset arrangements, if applicable, and do not represent the amount paid by the class during periods when reimbursements, waivers or reductions occur.
G Annualized
H On certain classes, the size and fluctuation of net assets and expense amounts may cause ratios to differ from contractual rates.
I Amount does not include the portfolio activity of any underlying mutual funds or exchange-traded funds (ETFs).
See accompanying notes which are an integral part of the financial statements.
Fidelity Freedom Blend 2020 Fund Class K
| | Six months ended (Unaudited) September 30, | Years endedMarch 31, | |
| | 2020 | 2020 | 2019 A |
| Selected Per–Share Data | | | |
| Net asset value, beginning of period | $9.32 | $9.94 | $10.00 |
| Income from Investment Operations | | | |
| Net investment income (loss)B | .03 | .20 | .07 |
| Net realized and unrealized gain (loss) | 1.58 | (.49) | (.01) |
| Total from investment operations | 1.61 | (.29) | .06 |
| Distributions from net investment income | (.02) | (.19) | (.07) |
| Distributions from net realized gain | (.10) | (.14) | (.05) |
| Total distributions | (.11)C | (.33) | (.12) |
| Net asset value, end of period | $10.82 | $9.32 | $9.94 |
| Total ReturnD,E | 17.40% | (3.35)% | .73% |
| Ratios to Average Net AssetsF | | | |
| Expenses before reductions | .39%G | .40% | .40%G |
| Expenses net of fee waivers, if any | .39%G | .40% | .40%G |
| Expenses net of all reductions | .39%G | .40% | .40%G |
| Net investment income (loss) | .60%G | 1.92% | 1.18%G |
| Supplemental Data | | | |
| Net assets, end of period (000 omitted) | $22,873 | $23,420 | $101 |
| Portfolio turnover rateH | 36%G | 40% | 78%G |
A For the period August 31, 2018 (commencement of operations) to March 31, 2019.
B Calculated based on average shares outstanding during the period.
C Total distributions per share do not sum due to rounding.
D Total returns for periods of less than one year are not annualized.
E Total returns would have been lower if certain expenses had not been reduced during the applicable periods shown.
F Expense ratios reflect operating expenses of the class. Expenses before reductions do not reflect amounts reimbursed, waived, or reduced through arrangements with the investment adviser, brokerage services, or other offset arrangements, if applicable, and do not represent the amount paid by the class during periods when reimbursements, waivers or reductions occur.
G Annualized
H Amount does not include the portfolio activity of any underlying mutual funds or exchange-traded funds (ETFs).
See accompanying notes which are an integral part of the financial statements.
Fidelity Freedom Blend 2020 Fund Class K6
| | Six months ended (Unaudited) September 30, | Years endedMarch 31, | |
| | 2020 | 2020 | 2019 A |
| Selected Per–Share Data | | | |
| Net asset value, beginning of period | $9.34 | $9.94 | $10.00 |
| Income from Investment Operations | | | |
| Net investment income (loss)B | .04 | .21 | .07 |
| Net realized and unrealized gain (loss) | 1.57 | (.49) | –C |
| Total from investment operations | 1.61 | (.28) | .07 |
| Distributions from net investment income | (.02) | (.18) | (.08) |
| Distributions from net realized gain | (.10) | (.14) | (.05) |
| Total distributions | (.11)D | (.32) | (.13) |
| Net asset value, end of period | $10.84 | $9.34 | $9.94 |
| Total ReturnE,F | 17.40% | (3.21)% | .77% |
| Ratios to Average Net AssetsG | | | |
| Expenses before reductions | .29%H | .30% | .31%H,I |
| Expenses net of fee waivers, if any | .29%H | .30% | .31%H,I |
| Expenses net of all reductions | .29%H | .30% | .31%H,I |
| Net investment income (loss) | .70%H | 2.02% | 1.27%H |
| Supplemental Data | | | |
| Net assets, end of period (000 omitted) | $623,904 | $476,911 | $21,065 |
| Portfolio turnover rateJ | 36%H | 40% | 78%H |
A For the period August 31, 2018 (commencement of operations) to March 31, 2019.
B Calculated based on average shares outstanding during the period.
C Amount represents less than $.005 per share.
D Total distributions per share do not sum due to rounding.
E Total returns for periods of less than one year are not annualized.
F Total returns would have been lower if certain expenses had not been reduced during the applicable periods shown.
G Expense ratios reflect operating expenses of the class. Expenses before reductions do not reflect amounts reimbursed, waived, or reduced through arrangements with the investment adviser, brokerage services, or other offset arrangements, if applicable, and do not represent the amount paid by the class during periods when reimbursements, waivers or reductions occur.
H Annualized
I On certain classes, the size and fluctuation of net assets and expense amounts may cause ratios to differ from contractual rates.
J Amount does not include the portfolio activity of any underlying mutual funds or exchange-traded funds (ETFs).
See accompanying notes which are an integral part of the financial statements.
Fidelity Freedom Blend 2020 Fund Class I
| | Six months ended (Unaudited) September 30, | Years endedMarch 31, | |
| | 2020 | 2020 | 2019 A |
| Selected Per–Share Data | | | |
| Net asset value, beginning of period | $9.31 | $9.94 | $10.00 |
| Income from Investment Operations | | | |
| Net investment income (loss)B | .03 | .19 | .06 |
| Net realized and unrealized gain (loss) | 1.57 | (.50) | –C |
| Total from investment operations | 1.60 | (.31) | .06 |
| Distributions from net investment income | (.02) | (.18) | (.07) |
| Distributions from net realized gain | (.10) | (.14) | (.05) |
| Total distributions | (.11)D | (.32) | (.12) |
| Net asset value, end of period | $10.80 | $9.31 | $9.94 |
| Total ReturnE,F | 17.31% | (3.50)% | .69% |
| Ratios to Average Net AssetsG | | | |
| Expenses before reductions | .49%H | .51%I | .50%H |
| Expenses net of fee waivers, if any | .49%H | .51%I | .50%H |
| Expenses net of all reductions | .49%H | .51%I | .50%H |
| Net investment income (loss) | .50%H | 1.81% | 1.08%H |
| Supplemental Data | | | |
| Net assets, end of period (000 omitted) | $7,778 | $5,169 | $121 |
| Portfolio turnover rateJ | 36%H | 40% | 78%H |
A For the period August 31, 2018 (commencement of operations) to March 31, 2019.
B Calculated based on average shares outstanding during the period.
C Amount represents less than $.005 per share.
D Total distributions per share do not sum due to rounding.
E Total returns for periods of less than one year are not annualized.
F Total returns would have been lower if certain expenses had not been reduced during the applicable periods shown.
G Expense ratios reflect operating expenses of the class. Expenses before reductions do not reflect amounts reimbursed, waived, or reduced through arrangements with the investment adviser, brokerage services, or other offset arrangements, if applicable, and do not represent the amount paid by the class during periods when reimbursements, waivers or reductions occur.
H Annualized
I On certain classes, the size and fluctuation of net assets and expense amounts may cause ratios to differ from contractual rates.
J Amount does not include the portfolio activity of any underlying mutual funds or exchange-traded funds (ETFs).
See accompanying notes which are an integral part of the financial statements.
Fidelity Freedom Blend 2020 Fund Class Z
| | Six months ended (Unaudited) September 30, | Years endedMarch 31, | |
| | 2020 | 2020 | 2019 A |
| Selected Per–Share Data | | | |
| Net asset value, beginning of period | $9.34 | $9.94 | $10.00 |
| Income from Investment Operations | | | |
| Net investment income (loss)B | .03 | .20 | .07 |
| Net realized and unrealized gain (loss) | 1.58 | (.50) | (.01) |
| Total from investment operations | 1.61 | (.30) | .06 |
| Distributions from net investment income | (.02) | (.17) | (.07) |
| Distributions from net realized gain | (.10) | (.14) | (.05) |
| Total distributions | (.11)C | (.30)C | (.12) |
| Net asset value, end of period | $10.84 | $9.34 | $9.94 |
| Total ReturnD,E | 17.37% | (3.35)% | .73% |
| Ratios to Average Net AssetsF | | | |
| Expenses before reductions | .39%G | .40% | .40%G |
| Expenses net of fee waivers, if any | .39%G | .40% | .40%G |
| Expenses net of all reductions | .39%G | .40% | .40%G |
| Net investment income (loss) | .60%G | 1.92% | 1.18%G |
| Supplemental Data | | | |
| Net assets, end of period (000 omitted) | $142 | $121 | $101 |
| Portfolio turnover rateH | 36%G | 40% | 78%G |
A For the period August 31, 2018 (commencement of operations) to March 31, 2019.
B Calculated based on average shares outstanding during the period.
C Total distributions per share do not sum due to rounding.
D Total returns for periods of less than one year are not annualized.
E Total returns would have been lower if certain expenses had not been reduced during the applicable periods shown.
F Expense ratios reflect operating expenses of the class. Expenses before reductions do not reflect amounts reimbursed, waived, or reduced through arrangements with the investment adviser, brokerage services, or other offset arrangements, if applicable, and do not represent the amount paid by the class during periods when reimbursements, waivers or reductions occur.
G Annualized
H Amount does not include the portfolio activity of any underlying mutual funds or exchange-traded funds (ETFs).
See accompanying notes which are an integral part of the financial statements.
Fidelity Freedom Blend 2020 Fund Class Z6
| | Six months ended (Unaudited) September 30, | Years endedMarch 31, | |
| | 2020 | 2020 | 2019 A |
| Selected Per–Share Data | | | |
| Net asset value, beginning of period | $9.34 | $9.94 | $10.00 |
| Income from Investment Operations | | | |
| Net investment income (loss)B | .04 | .20 | .07 |
| Net realized and unrealized gain (loss) | 1.57 | (.48) | –C |
| Total from investment operations | 1.61 | (.28) | .07 |
| Distributions from net investment income | (.02) | (.18) | (.08) |
| Distributions from net realized gain | (.10) | (.14) | (.05) |
| Total distributions | (.11)D | (.32) | (.13) |
| Net asset value, end of period | $10.84 | $9.34 | $9.94 |
| Total ReturnE,F | 17.38% | (3.19)% | .77% |
| Ratios to Average Net AssetsG | | | |
| Expenses before reductions | .29%H | .31%I | .30%H |
| Expenses net of fee waivers, if any | .29%H | .31%I | .30%H |
| Expenses net of all reductions | .29%H | .31%I | .30%H |
| Net investment income (loss) | .70%H | 2.01% | 1.28%H |
| Supplemental Data | | | |
| Net assets, end of period (000 omitted) | $3,160 | $1,790 | $101 |
| Portfolio turnover rateJ | 36%H | 40% | 78%H |
A For the period August 31, 2018 (commencement of operations) to March 31, 2019.
B Calculated based on average shares outstanding during the period.
C Amount represents less than $.005 per share.
D Total distributions per share do not sum due to rounding.
E Total returns for periods of less than one year are not annualized.
F Total returns would have been lower if certain expenses had not been reduced during the applicable periods shown.
G Expense ratios reflect operating expenses of the class. Expenses before reductions do not reflect amounts reimbursed, waived, or reduced through arrangements with the investment adviser, brokerage services, or other offset arrangements, if applicable, and do not represent the amount paid by the class during periods when reimbursements, waivers or reductions occur.
H Annualized
I On certain classes, the size and fluctuation of net assets and expense amounts may cause ratios to differ from contractual rates.
J Amount does not include the portfolio activity of any underlying mutual funds or exchange-traded funds (ETFs).
See accompanying notes which are an integral part of the financial statements.
Fidelity Freedom® Blend 2025 Fund
Investment Summary (Unaudited)
The information in the following tables is based on the direct investments of the Fund.
Top Holdings as of September 30, 2020
| | % of fund's net assets |
| Fidelity Series Emerging Markets Opportunities Fund | 10.5 |
| Fidelity Series Large Cap Value Index Fund | 8.7 |
| Fidelity Series Investment Grade Bond Fund | 7.0 |
| Fidelity Series Blue Chip Growth Fund | 6.7 |
| Fidelity Series Inflation-Protected Bond Index Fund | 6.3 |
| Fidelity Series Government Bond Index Fund | 6.3 |
| Fidelity Series Corporate Bond Fund | 5.2 |
| Fidelity Series Investment Grade Securitized Fund | 4.8 |
| Fidelity Series Large Cap Stock Fund | 4.6 |
| Fidelity Series Large Cap Growth Index Fund | 4.3 |
| | 64.4 |
Asset Allocation (% of fund's net assets)
| Period end |
| | Domestic Equity Funds | 32.2% |
| | International Equity Funds | 27.9% |
| | Bond Funds | 33.7% |
| | Short-Term Funds | 6.2% |

Domestic Equity Funds category includes Fidelity Series Commodity Strategy Fund which invests in commodity-related investments.
Fidelity Freedom® Blend 2025 Fund
Schedule of Investments September 30, 2020 (Unaudited)
Showing Percentage of Net Assets
| Domestic Equity Funds - 32.2% | | | |
| | | Shares | Value |
| Fidelity Series Blue Chip Growth Fund (a) | | 3,969,583 | $65,537,809 |
| Fidelity Series Commodity Strategy Fund (a) | | 5,950,726 | 24,755,018 |
| Fidelity Series Large Cap Growth Index Fund (a) | | 2,946,414 | 41,956,937 |
| Fidelity Series Large Cap Stock Fund (a) | | 3,192,064 | 45,199,633 |
| Fidelity Series Large Cap Value Index Fund (a) | | 7,370,193 | 85,494,238 |
| Fidelity Series Small Cap Opportunities Fund (a) | | 1,685,894 | 21,512,011 |
| Fidelity Series Value Discovery Fund (a) | | 2,511,040 | 31,036,451 |
| TOTAL DOMESTIC EQUITY FUNDS | | | |
| (Cost $302,928,746) | | | 315,492,097 |
|
| International Equity Funds - 27.9% | | | |
| Fidelity Series Canada Fund (a) | | 1,445,120 | 14,783,580 |
| Fidelity Series Emerging Markets Fund (a) | | 1,217,415 | 11,480,224 |
| Fidelity Series Emerging Markets Opportunities Fund (a) | | 4,916,388 | 103,145,822 |
| Fidelity Series International Growth Fund (a) | | 2,045,690 | 38,418,054 |
| Fidelity Series International Index Fund (a) | | 1,595,414 | 15,858,418 |
| Fidelity Series International Small Cap Fund (a) | | 764,208 | 13,602,894 |
| Fidelity Series International Value Fund (a) | | 4,423,234 | 38,128,277 |
| Fidelity Series Overseas Fund (a) | | 3,431,354 | 38,362,541 |
| TOTAL INTERNATIONAL EQUITY FUNDS | | | |
| (Cost $248,926,898) | | | 273,779,810 |
|
| Bond Funds - 33.7% | | | |
| Fidelity Series Corporate Bond Fund (a) | | 4,579,598 | 51,520,473 |
| Fidelity Series Emerging Markets Debt Fund (a) | | 656,519 | 5,948,064 |
| Fidelity Series Floating Rate High Income Fund (a) | | 151,607 | 1,341,723 |
| Fidelity Series Government Bond Index Fund (a) | | 5,472,725 | 61,568,158 |
| Fidelity Series High Income Fund (a) | | 751,485 | 6,853,546 |
| Fidelity Series Inflation-Protected Bond Index Fund (a) | | 5,763,550 | 61,669,984 |
| Fidelity Series Investment Grade Bond Fund (a) | | 5,597,859 | 68,517,790 |
| Fidelity Series Investment Grade Securitized Fund (a) | | 4,377,173 | 46,704,439 |
| Fidelity Series Long-Term Treasury Bond Index Fund (a) | | 2,185,178 | 22,572,894 |
| Fidelity Series Real Estate Income Fund (a) | | 409,623 | 4,088,037 |
| TOTAL BOND FUNDS | | | |
| (Cost $311,525,649) | | | 330,785,108 |
|
| Short-Term Funds - 6.2% | | | |
| Fidelity Cash Central Fund 0.10% (b) | | 1,542 | 1,542 |
| Fidelity Series Government Money Market Fund 0.16% (a)(c) | | 13,734,811 | 13,734,811 |
| Fidelity Series Short-Term Credit Fund (a) | | 836,250 | 8,571,565 |
| Fidelity Series Treasury Bill Index Fund (a) | | 3,789,727 | 37,935,165 |
| TOTAL SHORT-TERM FUNDS | | | |
| (Cost $60,016,311) | | | 60,243,083 |
| TOTAL INVESTMENT IN SECURITIES - 100.0% | | | |
| (Cost $923,397,604) | | | 980,300,098 |
| NET OTHER ASSETS (LIABILITIES) - 0.0% | | | (14,733) |
| NET ASSETS - 100% | | | $980,285,365 |
Legend
(a) Affiliated Fund
(b) Affiliated fund that is generally available only to investment companies and other accounts managed by Fidelity Investments. The rate quoted is the annualized seven-day yield of the fund at period end. A complete unaudited listing of the fund's holdings as of its most recent quarter end is available upon request. In addition, each Fidelity Central Fund's financial statements are available on the SEC's website or upon request.
(c) The rate quoted is the annualized seven-day yield of the fund at period end.
Affiliated Central Funds
Information regarding fiscal year to date income earned by the Fund from investments in Fidelity Central Funds is as follows:
| Fund | Income earned |
| Fidelity Cash Central Fund | $1 |
| Total | $1 |
Amounts in the income column in the above table include any capital gain distributions from underlying funds, which are presented in the corresponding line-item in the Statement of Operations, if applicable.
Affiliated Underlying Funds
Fiscal year to date information regarding the Fund's investments in affiliated Underlying Funds, excluding any Money Market Central Funds, is presented below. Exchanges between classes of the same affiliated Underlying Funds may occur.
| Affiliate | Value, beginning of period | Purchases | Sales Proceeds | Dividend Income | Realized Gain (loss) | Change in Unrealized appreciation (depreciation) | Value, end of period |
| Fidelity Series Blue Chip Growth Fund. | $39,276,904 | $28,680,522 | $15,806,015 | $12,912,979 | $2,020,146 | $11,366,252 | $65,537,809 |
| Fidelity Series Canada Fund | 10,389,447 | 3,478,764 | 1,677,033 | -- | (239,052) | 2,831,454 | 14,783,580 |
| Fidelity Series Commodity Strategy Fund | 23,200,992 | 5,550,274 | 6,954,517 | 104,648 | (812,240) | 3,770,509 | 24,755,018 |
| Fidelity Series Corporate Bond Fund | 31,642,886 | 18,850,038 | 2,764,467 | 681,738 | 42,235 | 3,749,781 | 51,520,473 |
| Fidelity Series Emerging Markets Debt Fund | 4,287,511 | 1,237,849 | 161,498 | 144,622 | 1,228 | 582,974 | 5,948,064 |
| Fidelity Series Emerging Markets Fund | 5,717,669 | 3,890,394 | 640,979 | -- | 1,007 | 2,512,133 | 11,480,224 |
| Fidelity Series Emerging Markets Opportunities Fund | 54,494,556 | 33,140,968 | 7,951,141 | -- | 92,197 | 23,369,242 | 103,145,822 |
| Fidelity Series Floating Rate High Income Fund | 980,429 | 291,972 | 39,072 | 27,482 | 461 | 107,933 | 1,341,723 |
| Fidelity Series Government Bond Index Fund | 48,924,364 | 19,714,220 | 6,902,643 | 420,641 | 16,545 | (184,328) | 61,568,158 |
| Fidelity Series Government Money Market Fund 0.16% | 11,100,027 | 23,677,974 | 21,043,190 | 15,078 | -- | -- | 13,734,811 |
| Fidelity Series High Income Fund | 4,974,465 | 1,494,854 | 195,360 | 172,402 | 2,299 | 577,288 | 6,853,546 |
| Fidelity Series Inflation-Protected Bond Index Fund | 43,423,368 | 18,367,049 | 3,264,037 | 42,679 | 26,419 | 3,117,185 | 61,669,984 |
| Fidelity Series International Growth Fund | 30,898,510 | 9,170,029 | 10,855,673 | -- | 329,516 | 8,875,672 | 38,418,054 |
| Fidelity Series International Index Fund | 11,486,700 | 3,673,797 | 1,964,336 | -- | (138,911) | 2,801,168 | 15,858,418 |
| Fidelity Series International Small Cap Fund | 9,110,460 | 2,441,642 | 1,153,477 | -- | 59,946 | 3,144,323 | 13,602,894 |
| Fidelity Series International Value Fund | 29,741,178 | 9,061,413 | 7,034,606 | -- | (180,308) | 6,540,600 | 38,128,277 |
| Fidelity Series Investment Grade Bond Fund | 47,202,122 | 22,673,593 | 4,639,724 | 786,127 | 48,747 | 3,233,052 | 68,517,790 |
| Fidelity Series Investment Grade Securitized Fund | 33,309,800 | 16,145,293 | 3,205,458 | 257,898 | 10,908 | 443,896 | 46,704,439 |
| Fidelity Series Large Cap Growth Index Fund | 29,317,674 | 9,579,837 | 10,271,784 | 713,813 | 1,054,042 | 12,277,168 | 41,956,937 |
| Fidelity Series Large Cap Stock Fund | 30,402,665 | 12,878,966 | 3,832,077 | 1,552,887 | (50,108) | 5,800,187 | 45,199,633 |
| Fidelity Series Large Cap Value Index Fund | 56,512,480 | 23,113,541 | 6,532,177 | -- | 64,816 | 12,335,578 | 85,494,238 |
| Fidelity Series Long-Term Treasury Bond Index Fund | 17,274,484 | 8,431,250 | 2,618,759 | 483,382 | 208,344 | (722,425) | 22,572,894 |
| Fidelity Series Overseas Fund | 29,163,804 | 10,168,763 | 9,905,649 | -- | (487,194) | 9,422,817 | 38,362,541 |
| Fidelity Series Real Estate Income Fund | 2,704,880 | 953,492 | 122,425 | 124,755 | 539 | 551,551 | 4,088,037 |
| Fidelity Series Short-Term Credit Fund | 8,171,855 | 93,230 | -- | 93,230 | -- | 306,480 | 8,571,565 |
| Fidelity Series Small Cap Opportunities Fund | 15,075,941 | 4,985,134 | 2,508,391 | 127,995 | (266,991) | 4,226,318 | 21,512,011 |
| Fidelity Series Treasury Bill Index Fund | 37,333,959 | 761,023 | 46,628 | 149,889 | (72) | (113,117) | 37,935,165 |
| Fidelity Series Value Discovery Fund | 17,686,922 | 10,617,445 | 1,940,973 | -- | 98,783 | 4,574,274 | 31,036,451 |
| | 683,806,052 | 303,123,326 | 134,032,089 | 18,812,245 | 1,903,302 | 125,497,965 | 980,298,556 |
Amounts in the income column in the above table include any capital gain distributions from underlying funds, which are presented in the corresponding line-item in the Statement of Operations, if applicable.
Investment Valuation
The following is a summary of the inputs used, as of September 30, 2020, involving the Fund's assets and liabilities carried at fair value. The inputs or methodology used for valuing securities may not be an indication of the risk associated with investing in those securities. For more information on valuation inputs, and their aggregation into the levels used below, please refer to the Investment Valuation section in the accompanying Notes to Financial Statements.
| | Valuation Inputs at Reporting Date: |
| Description | Total | Level 1 | Level 2 | Level 3 |
| Investments in Securities: | | | | |
| Domestic Equity Funds | $315,492,097 | $315,492,097 | $-- | $-- |
| International Equity Funds | 273,779,810 | 273,779,810 | -- | -- |
| Bond Funds | 330,785,108 | 330,785,108 | -- | -- |
| Short-Term Funds | 60,243,083 | 60,243,083 | -- | -- |
| Total Investments in Securities: | $980,300,098 | $980,300,098 | $-- | $-- |
See accompanying notes which are an integral part of the financial statements.
Fidelity Freedom® Blend 2025 Fund
Financial Statements
Statement of Assets and Liabilities
| | | September 30, 2020 (Unaudited) |
| Assets | | |
Investment in securities, at value — See accompanying schedule:
| | |
| Fidelity Central Funds (cost $1,542) | $1,542 | |
| Other affiliated issuers (cost $923,396,062) | 980,298,556 | |
| Total Investment in Securities (cost $923,397,604) | | $980,300,098 |
| Cash | | 1 |
| Receivable for investments sold | | 8,183,494 |
| Receivable for fund shares sold | | 664,561 |
| Total assets | | 989,148,154 |
| Liabilities | | |
| Payable for investments purchased | $7,730,004 | |
| Payable for fund shares redeemed | 864,469 | |
| Accrued management fee | 266,270 | |
| Distribution and service plan fees payable | 2,046 | |
| Total liabilities | | 8,862,789 |
| Net Assets | | $980,285,365 |
| Net Assets consist of: | | |
| Paid in capital | | $908,492,057 |
| Total accumulated earnings (loss) | | 71,793,308 |
| Net Assets | | $980,285,365 |
| Net Asset Value and Maximum Offering Price | | |
| Class A: | | |
| Net Asset Value and redemption price per share ($2,869,249 ÷ 267,705 shares)(a) | | $10.72 |
| Maximum offering price per share (100/94.25 of $10.72) | | $11.37 |
| Class M: | | |
| Net Asset Value and redemption price per share ($1,633,359 ÷ 151,889 shares)(a) | | $10.75 |
| Maximum offering price per share (100/96.50 of $10.75) | | $11.14 |
| Class C: | | |
| Net Asset Value and offering price per share ($978,324 ÷ 91,973 shares)(a) | | $10.64 |
| Fidelity Freedom Blend 2025 Fund: | | |
| Net Asset Value, offering price and redemption price per share ($29,815,137 ÷ 2,778,444 shares) | | $10.73 |
| Class K: | | |
| Net Asset Value, offering price and redemption price per share ($24,933,457 ÷ 2,319,338 shares) | | $10.75 |
| Class K6: | | |
| Net Asset Value, offering price and redemption price per share ($890,266,691 ÷ 82,651,056 shares)�� | | $10.77 |
| Class I: | | |
| Net Asset Value, offering price and redemption price per share ($24,719,315 ÷ 2,304,605 shares) | | $10.73 |
| Class Z: | | |
| Net Asset Value, offering price and redemption price per share ($114,562 ÷ 10,638 shares) | | $10.77 |
| Class Z6: | | |
| Net Asset Value, offering price and redemption price per share ($4,955,271 ÷ 460,336 shares) | | $10.76 |
(a) Redemption price per share is equal to net asset value less any applicable contingent deferred sales charge.
See accompanying notes which are an integral part of the financial statements.
Statement of Operations
| | | Six months ended September 30, 2020 (Unaudited) |
| Investment Income | | |
| Dividends: | | |
| Affiliated issuers | | $4,189,590 |
| Income from Fidelity Central Funds | | 1 |
| Total income | | 4,189,591 |
| Expenses | | |
| Management fee | $1,433,344 | |
| Distribution and service plan fees | 10,019 | |
| Independent trustees' fees and expenses | 1,145 | |
| Total expenses before reductions | 1,444,508 | |
| Expense reductions | (9) | |
| Total expenses after reductions | | 1,444,499 |
| Net investment income (loss) | | 2,745,092 |
| Realized and Unrealized Gain (Loss) | | |
| Net realized gain (loss) on: | | |
| Investment securities: | | |
| Affiliated issuers | 1,903,302 | |
| Capital gain distributions from underlying funds: | | |
| Affiliated issuers | 14,622,655 | |
| Total net realized gain (loss) | | 16,525,957 |
| Change in net unrealized appreciation (depreciation) on: | | |
| Investment securities: | | |
| Affiliated issuers | 125,497,965 | |
| Total change in net unrealized appreciation (depreciation) | | 125,497,965 |
| Net gain (loss) | | 142,023,922 |
| Net increase (decrease) in net assets resulting from operations | | $144,769,014 |
See accompanying notes which are an integral part of the financial statements.
Statement of Changes in Net Assets
| | Six months ended September 30, 2020 (Unaudited) | Year ended March 31, 2020 |
| Increase (Decrease) in Net Assets | | |
| Operations | | |
| Net investment income (loss) | $2,745,092 | $12,790,239 |
| Net realized gain (loss) | 16,525,957 | 12,980,716 |
| Change in net unrealized appreciation (depreciation) | 125,497,965 | (71,048,710) |
| Net increase (decrease) in net assets resulting from operations | 144,769,014 | (45,277,755) |
| Distributions to shareholders | (7,962,829) | (22,266,810) |
| Share transactions - net increase (decrease) | 159,681,198 | 707,275,688 |
| Total increase (decrease) in net assets | 296,487,383 | 639,731,123 |
| Net Assets | | |
| Beginning of period | 683,797,982 | 44,066,859 |
| End of period | $980,285,365 | $683,797,982 |
See accompanying notes which are an integral part of the financial statements.
Financial Highlights
Fidelity Freedom Blend 2025 Fund Class A
| | Six months ended (Unaudited) September 30, | Years endedMarch 31, | |
| | 2020 | 2020 | 2019 A |
| Selected Per–Share Data | | | |
| Net asset value, beginning of period | $9.09 | $9.82 | $10.00 |
| Income from Investment Operations | | | |
| Net investment income (loss)B | .01 | .16 | .03 |
| Net realized and unrealized gain (loss) | 1.71 | (.58) | (.02) |
| Total from investment operations | 1.72 | (.42) | .01 |
| Distributions from net investment income | (.01) | (.15) | (.11) |
| Distributions from net realized gain | (.09) | (.15) | (.08) |
| Total distributions | (.09)C | (.31)C | (.19) |
| Net asset value, end of period | $10.72 | $9.09 | $9.82 |
| Total ReturnD,E | 19.06% | (4.73)% | .29% |
| Ratios to Average Net AssetsF,G | | | |
| Expenses before reductions | .76%H | .76% | .76%H |
| Expenses net of fee waivers, if any | .76%H | .76% | .76%H |
| Expenses net of all reductions | .76%H | .76% | .76%H |
| Net investment income (loss) | .19%H | 1.56% | .58%H |
| Supplemental Data | | | |
| Net assets, end of period (000 omitted) | $2,869 | $1,706 | $168 |
| Portfolio turnover rateI | 31%H | 34% | 23%H |
A For the period August 31, 2018 (commencement of operations) to March 31, 2019.
B Calculated based on average shares outstanding during the period.
C Total distributions per share do not sum due to rounding.
D Total returns for periods of less than one year are not annualized.
E Total returns do not include the effect of the sales charges.
F Fees and expenses of any underlying mutual funds or exchange-traded funds (ETFs) are not included in the Fund's expense ratio. The Fund indirectly bears its proportionate share of these expenses. For additional expense information related to investments in Fidelity Central Funds, please refer to the "Investments in Fidelity Central Funds" note found in the Notes to Financial Statements section of the most recent Annual or Semi-Annual report.
G Expense ratios reflect operating expenses of the class. Expenses before reductions do not reflect amounts reimbursed, waived, or reduced through arrangements with the investment adviser, brokerage services, or other offset arrangements, if applicable, and do not represent the amount paid by the class during periods when reimbursements, waivers or reductions occur.
H Annualized
I Amount does not include the portfolio activity of any underlying mutual funds or exchange-traded funds (ETFs).
See accompanying notes which are an integral part of the financial statements.
Fidelity Freedom Blend 2025 Fund Class M
| | Six months ended (Unaudited) September 30, | Years endedMarch 31, | |
| | 2020 | 2020 | 2019 A |
| Selected Per–Share Data | | | |
| Net asset value, beginning of period | $9.13 | $9.82 | $10.00 |
| Income from Investment Operations | | | |
| Net investment income (loss)B | –C | .13 | .02 |
| Net realized and unrealized gain (loss) | 1.71 | (.58) | (.02) |
| Total from investment operations | 1.71 | (.45) | – |
| Distributions from net investment income | – | (.08) | (.10) |
| Distributions from net realized gain | (.09) | (.15) | (.08) |
| Total distributions | (.09) | (.24)D | (.18) |
| Net asset value, end of period | $10.75 | $9.13 | $9.82 |
| Total ReturnE,F | 18.79% | (4.94)% | .16% |
| Ratios to Average Net AssetsG,H | | | |
| Expenses before reductions | 1.01%I | 1.02%J | 1.02%I,J |
| Expenses net of fee waivers, if any | 1.01%I | 1.02%J | 1.02%I,J |
| Expenses net of all reductions | 1.01%I | 1.02%J | 1.02%I,J |
| Net investment income (loss) | (.06)%I | 1.31% | .32%I |
| Supplemental Data | | | |
| Net assets, end of period (000 omitted) | $1,633 | $886 | $746 |
| Portfolio turnover rateK | 31%I | 34% | 23%I |
A For the period August 31, 2018 (commencement of operations) to March 31, 2019.
B Calculated based on average shares outstanding during the period.
C Amount represents less than $.005 per share.
D Total distributions per share do not sum due to rounding.
E Total returns for periods of less than one year are not annualized.
F Total returns do not include the effect of the sales charges.
G Fees and expenses of any underlying mutual funds or exchange-traded funds (ETFs) are not included in the Fund's expense ratio. The Fund indirectly bears its proportionate share of these expenses. For additional expense information related to investments in Fidelity Central Funds, please refer to the "Investments in Fidelity Central Funds" note found in the Notes to Financial Statements section of the most recent Annual or Semi-Annual report.
H Expense ratios reflect operating expenses of the class. Expenses before reductions do not reflect amounts reimbursed, waived, or reduced through arrangements with the investment adviser, brokerage services, or other offset arrangements, if applicable, and do not represent the amount paid by the class during periods when reimbursements, waivers or reductions occur.
I Annualized
J On certain classes, the size and fluctuation of net assets and expense amounts may cause ratios to differ from contractual rates.
K Amount does not include the portfolio activity of any underlying mutual funds or exchange-traded funds (ETFs).
See accompanying notes which are an integral part of the financial statements.
Fidelity Freedom Blend 2025 Fund Class C
| | Six months ended (Unaudited) September 30, | Years endedMarch 31, | |
| | 2020 | 2020 | 2019 A |
| Selected Per–Share Data | | | |
| Net asset value, beginning of period | $9.05 | $9.81 | $10.00 |
| Income from Investment Operations | | | |
| Net investment income (loss)B | (.03) | .08 | (.01) |
| Net realized and unrealized gain (loss) | 1.70 | (.58) | (.02) |
| Total from investment operations | 1.67 | (.50) | (.03) |
| Distributions from net investment income | – | (.11) | (.09) |
| Distributions from net realized gain | (.08) | (.15) | (.08) |
| Total distributions | (.08) | (.26) | (.16)C |
| Net asset value, end of period | $10.64 | $9.05 | $9.81 |
| Total ReturnD,E,F | 18.59% | (5.45)% | (.12)% |
| Ratios to Average Net AssetsG,H | | | |
| Expenses before reductions | 1.51%I | 1.51% | 1.51%I |
| Expenses net of fee waivers, if any | 1.51%I | 1.51% | 1.51%I |
| Expenses net of all reductions | 1.51%I | 1.51% | 1.51%I |
| Net investment income (loss) | (.56)%I | .81% | (.17)%I |
| Supplemental Data | | | |
| Net assets, end of period (000 omitted) | $978 | $472 | $298 |
| Portfolio turnover rateJ | 31%I | 34% | 23%I |
A For the period August 31, 2018 (commencement of operations) to March 31, 2019.
B Calculated based on average shares outstanding during the period.
C Total distributions per share do not sum due to rounding.
D Total returns for periods of less than one year are not annualized.
E Total returns would have been lower if certain expenses had not been reduced during the applicable periods shown.
F Total returns do not include the effect of the contingent deferred sales charge.
G Fees and expenses of any underlying mutual funds or exchange-traded funds (ETFs) are not included in the Fund's expense ratio. The Fund indirectly bears its proportionate share of these expenses. For additional expense information related to investments in Fidelity Central Funds, please refer to the "Investments in Fidelity Central Funds" note found in the Notes to Financial Statements section of the most recent Annual or Semi-Annual report.
H Expense ratios reflect operating expenses of the class. Expenses before reductions do not reflect amounts reimbursed, waived, or reduced through arrangements with the investment adviser, brokerage services, or other offset arrangements, if applicable, and do not represent the amount paid by the class during periods when reimbursements, waivers or reductions occur.
I Annualized
J Amount does not include the portfolio activity of any underlying mutual funds or exchange-traded funds (ETFs).
See accompanying notes which are an integral part of the financial statements.
Fidelity Freedom Blend 2025 Fund
| | Six months ended (Unaudited) September 30, | Years endedMarch 31, | |
| | 2020 | 2020 | 2019 A |
| Selected Per–Share Data | | | |
| Net asset value, beginning of period | $9.10 | $9.82 | $10.00 |
| Income from Investment Operations | | | |
| Net investment income (loss)B | .02 | .18 | .05 |
| Net realized and unrealized gain (loss) | 1.71 | (.57) | (.03) |
| Total from investment operations | 1.73 | (.39) | .02 |
| Distributions from net investment income | (.01) | (.17) | (.13) |
| Distributions from net realized gain | (.09) | (.15) | (.08) |
| Total distributions | (.10) | (.33)C | (.20)C |
| Net asset value, end of period | $10.73 | $9.10 | $9.82 |
| Total ReturnD | 19.14% | (4.45)% | .42% |
| Ratios to Average Net AssetsE,F | | | |
| Expenses before reductions | .51%G | .52%H | .52%G,H |
| Expenses net of fee waivers, if any | .51%G | .52%H | .52%G,H |
| Expenses net of all reductions | .51%G | .52%H | .52%G,H |
| Net investment income (loss) | .44%G | 1.80% | .83%G |
| Supplemental Data | | | |
| Net assets, end of period (000 omitted) | $29,815 | $21,223 | $1,621 |
| Portfolio turnover rateI | 31%G | 34% | 23%G |
A For the period August 31, 2018 (commencement of operations) to March 31, 2019.
B Calculated based on average shares outstanding during the period.
C Total distributions per share do not sum due to rounding.
D Total returns for periods of less than one year are not annualized.
E Fees and expenses of any underlying mutual funds or exchange-traded funds (ETFs) are not included in the Fund's expense ratio. The Fund indirectly bears its proportionate share of these expenses. For additional expense information related to investments in Fidelity Central Funds, please refer to the "Investments in Fidelity Central Funds" note found in the Notes to Financial Statements section of the most recent Annual or Semi-Annual report.
F Expense ratios reflect operating expenses of the class. Expenses before reductions do not reflect amounts reimbursed, waived, or reduced through arrangements with the investment adviser, brokerage services, or other offset arrangements, if applicable, and do not represent the amount paid by the class during periods when reimbursements, waivers or reductions occur.
G Annualized
H On certain classes, the size and fluctuation of net assets and expense amounts may cause ratios to differ from contractual rates.
I Amount does not include the portfolio activity of any underlying mutual funds or exchange-traded funds (ETFs).
See accompanying notes which are an integral part of the financial statements.
Fidelity Freedom Blend 2025 Fund Class K
| | Six months ended (Unaudited) September 30, | Years endedMarch 31, | |
| | 2020 | 2020 | 2019 A |
| Selected Per–Share Data | | | |
| Net asset value, beginning of period | $9.11 | $9.83 | $10.00 |
| Income from Investment Operations | | | |
| Net investment income (loss)B | .03 | .20 | .05 |
| Net realized and unrealized gain (loss) | 1.71 | (.58) | (.02) |
| Total from investment operations | 1.74 | (.38) | .03 |
| Distributions from net investment income | (.01) | (.18) | (.12) |
| Distributions from net realized gain | (.09) | (.15) | (.08) |
| Total distributions | (.10) | (.34)C | (.20) |
| Net asset value, end of period | $10.75 | $9.11 | $9.83 |
| Total ReturnD | 19.20% | (4.34)% | .47% |
| Ratios to Average Net AssetsE,F | | | |
| Expenses before reductions | .41%G | .41% | .41%G |
| Expenses net of fee waivers, if any | .41%G | .41% | .41%G |
| Expenses net of all reductions | .41%G | .41% | .41%G |
| Net investment income (loss) | .54%G | 1.91% | .93%G |
| Supplemental Data | | | |
| Net assets, end of period (000 omitted) | $24,933 | $24,031 | $101 |
| Portfolio turnover rateH | 31%G | 34% | 23%G |
A For the period August 31, 2018 (commencement of operations) to March 31, 2019.
B Calculated based on average shares outstanding during the period.
C Total distributions per share do not sum due to rounding.
D Total returns for periods of less than one year are not annualized.
E Fees and expenses of any underlying mutual funds or exchange-traded funds (ETFs) are not included in the Fund's expense ratio. The Fund indirectly bears its proportionate share of these expenses. For additional expense information related to investments in Fidelity Central Funds, please refer to the "Investments in Fidelity Central Funds" note found in the Notes to Financial Statements section of the most recent Annual or Semi-Annual report.
F Expense ratios reflect operating expenses of the class. Expenses before reductions do not reflect amounts reimbursed, waived, or reduced through arrangements with the investment adviser, brokerage services, or other offset arrangements, if applicable, and do not represent the amount paid by the class during periods when reimbursements, waivers or reductions occur.
G Annualized
H Amount does not include the portfolio activity of any underlying mutual funds or exchange-traded funds (ETFs).
See accompanying notes which are an integral part of the financial statements.
Fidelity Freedom Blend 2025 Fund Class K6
| | Six months ended (Unaudited) September 30, | Years endedMarch 31, | |
| | 2020 | 2020 | 2019 A |
| Selected Per–Share Data | | | |
| Net asset value, beginning of period | $9.13 | $9.84 | $10.00 |
| Income from Investment Operations | | | |
| Net investment income (loss)B | .03 | .21 | .06 |
| Net realized and unrealized gain (loss) | 1.71 | (.59) | (.02) |
| Total from investment operations | 1.74 | (.38) | .04 |
| Distributions from net investment income | (.02) | (.18) | (.12) |
| Distributions from net realized gain | (.09) | (.16) | (.08) |
| Total distributions | (.10)C | (.33)C | (.20) |
| Net asset value, end of period | $10.77 | $9.13 | $9.84 |
| Total ReturnD | 19.21% | (4.28)% | .60% |
| Ratios to Average Net AssetsE,F | | | |
| Expenses before reductions | .31%G | .31% | .32%G,H |
| Expenses net of fee waivers, if any | .31%G | .31% | .32%G,H |
| Expenses net of all reductions | .31%G | .31% | .32%G,H |
| Net investment income (loss) | .64%G | 2.01% | 1.02%G |
| Supplemental Data | | | |
| Net assets, end of period (000 omitted) | $890,267 | $623,940 | $40,828 |
| Portfolio turnover rateI | 31%G | 34% | 23%G |
A For the period August 31, 2018 (commencement of operations) to March 31, 2019.
B Calculated based on average shares outstanding during the period.
C Total distributions per share do not sum due to rounding.
D Total returns for periods of less than one year are not annualized.
E Fees and expenses of any underlying mutual funds or exchange-traded funds (ETFs) are not included in the Fund's expense ratio. The Fund indirectly bears its proportionate share of these expenses. For additional expense information related to investments in Fidelity Central Funds, please refer to the "Investments in Fidelity Central Funds" note found in the Notes to Financial Statements section of the most recent Annual or Semi-Annual report.
F Expense ratios reflect operating expenses of the class. Expenses before reductions do not reflect amounts reimbursed, waived, or reduced through arrangements with the investment adviser, brokerage services, or other offset arrangements, if applicable, and do not represent the amount paid by the class during periods when reimbursements, waivers or reductions occur.
G Annualized
H On certain classes, the size and fluctuation of net assets and expense amounts may cause ratios to differ from contractual rates.
I Amount does not include the portfolio activity of any underlying mutual funds or exchange-traded funds (ETFs).
See accompanying notes which are an integral part of the financial statements.
Fidelity Freedom Blend 2025 Fund Class I
| | Six months ended (Unaudited) September 30, | Years endedMarch 31, | |
| | 2020 | 2020 | 2019 A |
| Selected Per–Share Data | | | |
| Net asset value, beginning of period | $9.10 | $9.83 | $10.00 |
| Income from Investment Operations | | | |
| Net investment income (loss)B | .02 | .18 | .05 |
| Net realized and unrealized gain (loss) | 1.71 | (.57) | (.02) |
| Total from investment operations | 1.73 | (.39) | .03 |
| Distributions from net investment income | (.02) | (.18) | (.12) |
| Distributions from net realized gain | (.09) | (.15) | (.08) |
| Total distributions | (.10)C | (.34)C | (.20) |
| Net asset value, end of period | $10.73 | $9.10 | $9.83 |
| Total ReturnD | 19.19% | (4.46)% | .43% |
| Ratios to Average Net AssetsE,F | | | |
| Expenses before reductions | .51%G | .51% | .51%G |
| Expenses net of fee waivers, if any | .51%G | .51% | .51%G |
| Expenses net of all reductions | .51%G | .51% | .51%G |
| Net investment income (loss) | .44%G | 1.81% | .83%G |
| Supplemental Data | | | |
| Net assets, end of period (000 omitted) | $24,719 | $7,685 | $100 |
| Portfolio turnover rateH | 31%G | 34% | 23%G |
A For the period August 31, 2018 (commencement of operations) to March 31, 2019.
B Calculated based on average shares outstanding during the period.
C Total distributions per share do not sum due to rounding.
D Total returns for periods of less than one year are not annualized.
E Fees and expenses of any underlying mutual funds or exchange-traded funds (ETFs) are not included in the Fund's expense ratio. The Fund indirectly bears its proportionate share of these expenses. For additional expense information related to investments in Fidelity Central Funds, please refer to the "Investments in Fidelity Central Funds" note found in the Notes to Financial Statements section of the most recent Annual or Semi-Annual report.
F Expense ratios reflect operating expenses of the class. Expenses before reductions do not reflect amounts reimbursed, waived, or reduced through arrangements with the investment adviser, brokerage services, or other offset arrangements, if applicable, and do not represent the amount paid by the class during periods when reimbursements, waivers or reductions occur.
G Annualized
H Amount does not include the portfolio activity of any underlying mutual funds or exchange-traded funds (ETFs).
See accompanying notes which are an integral part of the financial statements.
Fidelity Freedom Blend 2025 Fund Class Z
| | Six months ended (Unaudited) September 30, | Years endedMarch 31, | |
| | 2020 | 2020 | 2019 A |
| Selected Per–Share Data | | | |
| Net asset value, beginning of period | $9.13 | $9.83 | $10.00 |
| Income from Investment Operations | | | |
| Net investment income (loss)B | .03 | .20 | .05 |
| Net realized and unrealized gain (loss) | 1.71 | (.58) | (.02) |
| Total from investment operations | 1.74 | (.38) | .03 |
| Distributions from net investment income | (.01) | (.17) | (.12) |
| Distributions from net realized gain | (.09) | (.15) | (.08) |
| Total distributions | (.10) | (.32) | (.20) |
| Net asset value, end of period | $10.77 | $9.13 | $9.83 |
| Total ReturnC | 19.17% | (4.30)% | .47% |
| Ratios to Average Net AssetsD,E | | | |
| Expenses before reductions | .41%F | .41% | .41%F |
| Expenses net of fee waivers, if any | .41%F | .41% | .41%F |
| Expenses net of all reductions | .41%F | .41% | .41%F |
| Net investment income (loss) | .54%F | 1.91% | .93%F |
| Supplemental Data | | | |
| Net assets, end of period (000 omitted) | $115 | $96 | $101 |
| Portfolio turnover rateG | 31%F | 34% | 23%F |
A For the period August 31, 2018 (commencement of operations) to March 31, 2019.
B Calculated based on average shares outstanding during the period.
C Total returns for periods of less than one year are not annualized.
D Fees and expenses of any underlying mutual funds or exchange-traded funds (ETFs) are not included in the Fund's expense ratio. The Fund indirectly bears its proportionate share of these expenses. For additional expense information related to investments in Fidelity Central Funds, please refer to the "Investments in Fidelity Central Funds" note found in the Notes to Financial Statements section of the most recent Annual or Semi-Annual report.
E Expense ratios reflect operating expenses of the class. Expenses before reductions do not reflect amounts reimbursed, waived, or reduced through arrangements with the investment adviser, brokerage services, or other offset arrangements, if applicable, and do not represent the amount paid by the class during periods when reimbursements, waivers or reductions occur.
F Annualized
G Amount does not include the portfolio activity of any underlying mutual funds or exchange-traded funds (ETFs).
See accompanying notes which are an integral part of the financial statements.
Fidelity Freedom Blend 2025 Fund Class Z6
| | Six months ended (Unaudited) September 30, | Years endedMarch 31, | |
| | 2020 | 2020 | 2019 A |
| Selected Per–Share Data | | | |
| Net asset value, beginning of period | $9.12 | $9.84 | $10.00 |
| Income from Investment Operations | | | |
| Net investment income (loss)B | .03 | .20 | .06 |
| Net realized and unrealized gain (loss) | 1.71 | (.58) | (.02) |
| Total from investment operations | 1.74 | (.38) | .04 |
| Distributions from net investment income | (.02) | (.18) | (.12) |
| Distributions from net realized gain | (.09) | (.15) | (.08) |
| Total distributions | (.10)C | (.34)C | (.20) |
| Net asset value, end of period | $10.76 | $9.12 | $9.84 |
| Total ReturnD | 19.25% | (4.35)% | .60% |
| Ratios to Average Net AssetsE,F | | | |
| Expenses before reductions | .31%G | .32%H | .31%G |
| Expenses net of fee waivers, if any | .31%G | .32%H | .31%G |
| Expenses net of all reductions | .31%G | .32%H | .31%G |
| Net investment income (loss) | .64%G | 2.01% | 1.03%G |
| Supplemental Data | | | |
| Net assets, end of period (000 omitted) | $4,955 | $3,760 | $104 |
| Portfolio turnover rateI | 31%G | 34% | 23%G |
A For the period August 31, 2018 (commencement of operations) to March 31, 2019.
B Calculated based on average shares outstanding during the period.
C Total distributions per share do not sum due to rounding.
D Total returns for periods of less than one year are not annualized.
E Fees and expenses of any underlying mutual funds or exchange-traded funds (ETFs) are not included in the Fund's expense ratio. The Fund indirectly bears its proportionate share of these expenses. For additional expense information related to investments in Fidelity Central Funds, please refer to the "Investments in Fidelity Central Funds" note found in the Notes to Financial Statements section of the most recent Annual or Semi-Annual report.
F Expense ratios reflect operating expenses of the class. Expenses before reductions do not reflect amounts reimbursed, waived, or reduced through arrangements with the investment adviser, brokerage services, or other offset arrangements, if applicable, and do not represent the amount paid by the class during periods when reimbursements, waivers or reductions occur.
G Annualized
H On certain classes, the size and fluctuation of net assets and expense amounts may cause ratios to differ from contractual rates.
I Amount does not include the portfolio activity of any underlying mutual funds or exchange-traded funds (ETFs).
See accompanying notes which are an integral part of the financial statements.
Fidelity Freedom® Blend 2030 Fund
Investment Summary (Unaudited)
The information in the following tables is based on the direct investments of the Fund.
Top Holdings as of September 30, 2020
| | % of fund's net assets |
| Fidelity Series Emerging Markets Opportunities Fund | 11.4 |
| Fidelity Series Large Cap Value Index Fund | 10.2 |
| Fidelity Series Blue Chip Growth Fund | 7.8 |
| Fidelity Series Investment Grade Bond Fund | 6.0 |
| Fidelity Series Inflation-Protected Bond Index Fund | 5.6 |
| Fidelity Series Large Cap Stock Fund | 5.4 |
| Fidelity Series Government Bond Index Fund | 5.4 |
| Fidelity Series Large Cap Growth Index Fund | 5.0 |
| Fidelity Series Corporate Bond Fund | 4.5 |
| Fidelity Series International Growth Fund | 4.5 |
| | 65.8 |
Asset Allocation (% of fund's net assets)
| Period end |
| | Domestic Equity Funds | 37.2% |
| | International Equity Funds | 31.3% |
| | Bond Funds | 29.7% |
| | Short-Term Funds | 1.8% |

Domestic Equity Funds category includes Fidelity Series Commodity Strategy Fund which invests in commodity-related investments.
Fidelity Freedom® Blend 2030 Fund
Schedule of Investments September 30, 2020 (Unaudited)
Showing Percentage of Net Assets
| Domestic Equity Funds - 37.2% | | | |
| | | Shares | Value |
| Fidelity Series Blue Chip Growth Fund (a) | | 4,670,673 | $77,112,810 |
| Fidelity Series Commodity Strategy Fund (a) | | 5,986,123 | 24,902,271 |
| Fidelity Series Large Cap Growth Index Fund (a) | | 3,466,779 | 49,366,937 |
| Fidelity Series Large Cap Stock Fund (a) | | 3,755,831 | 53,182,566 |
| Fidelity Series Large Cap Value Index Fund (a) | | 8,671,860 | 100,593,572 |
| Fidelity Series Small Cap Opportunities Fund (a) | | 1,983,614 | 25,310,912 |
| Fidelity Series Value Discovery Fund (a) | | 2,954,537 | 36,518,077 |
| TOTAL DOMESTIC EQUITY FUNDS | | | |
| (Cost $352,290,557) | | | 366,987,145 |
|
| International Equity Funds - 31.3% | | | |
| Fidelity Series Canada Fund (a) | | 1,663,605 | 17,018,683 |
| Fidelity Series Emerging Markets Fund (a) | | 1,328,404 | 12,526,846 |
| Fidelity Series Emerging Markets Opportunities Fund (a) | | 5,364,394 | 112,544,982 |
| Fidelity Series International Growth Fund (a) | | 2,354,718 | 44,221,607 |
| Fidelity Series International Index Fund (a) | | 1,836,545 | 18,255,255 |
| Fidelity Series International Small Cap Fund (a) | | 881,932 | 15,698,383 |
| Fidelity Series International Value Fund (a) | | 5,090,881 | 43,883,398 |
| Fidelity Series Overseas Fund (a) | | 3,949,674 | 44,157,351 |
| TOTAL INTERNATIONAL EQUITY FUNDS | | | |
| (Cost $281,275,581) | | | 308,306,505 |
|
| Bond Funds - 29.7% | | | |
| Fidelity Series Corporate Bond Fund (a) | | 3,954,104 | 44,483,669 |
| Fidelity Series Emerging Markets Debt Fund (a) | | 658,782 | 5,968,569 |
| Fidelity Series Floating Rate High Income Fund (a) | | 151,167 | 1,337,831 |
| Fidelity Series Government Bond Index Fund (a) | | 4,724,690 | 53,152,764 |
| Fidelity Series High Income Fund (a) | | 750,938 | 6,848,554 |
| Fidelity Series Inflation-Protected Bond Index Fund (a) | | 5,117,614 | 54,758,472 |
| Fidelity Series Investment Grade Bond Fund (a) | | 4,832,420 | 59,148,825 |
| Fidelity Series Investment Grade Securitized Fund (a) | | 3,779,618 | 40,328,527 |
| Fidelity Series Long-Term Treasury Bond Index Fund (a) | | 2,206,786 | 22,796,097 |
| Fidelity Series Real Estate Income Fund (a) | | 409,154 | 4,083,352 |
| TOTAL BOND FUNDS | | | |
| (Cost $277,341,875) | | | 292,906,660 |
|
| Short-Term Funds - 1.8% | | | |
| Fidelity Cash Central Fund 0.10% (b) | | 1,208 | 1,208 |
| Fidelity Series Government Money Market Fund 0.16% (a)(c) | | 5,095,339 | 5,095,339 |
| Fidelity Series Short-Term Credit Fund (a) | | 146,500 | 1,501,628 |
| Fidelity Series Treasury Bill Index Fund (a) | | 1,166,641 | 11,678,081 |
| TOTAL SHORT-TERM FUNDS | | | |
| (Cost $18,242,902) | | | 18,276,256 |
| TOTAL INVESTMENT IN SECURITIES - 100.0% | | | |
| (Cost $929,150,915) | | | 986,476,566 |
| NET OTHER ASSETS (LIABILITIES) - 0.0% | | | (16,239) |
| NET ASSETS - 100% | | | $986,460,327 |
Legend
(a) Affiliated Fund
(b) Affiliated fund that is generally available only to investment companies and other accounts managed by Fidelity Investments. The rate quoted is the annualized seven-day yield of the fund at period end. A complete unaudited listing of the fund's holdings as of its most recent quarter end is available upon request. In addition, each Fidelity Central Fund's financial statements are available on the SEC's website or upon request.
(c) The rate quoted is the annualized seven-day yield of the fund at period end.
Affiliated Central Funds
Information regarding fiscal year to date income earned by the Fund from investments in Fidelity Central Funds is as follows:
| Fund | Income earned |
| Fidelity Cash Central Fund | $1 |
| Total | $1 |
Amounts in the income column in the above table include any capital gain distributions from underlying funds, which are presented in the corresponding line-item in the Statement of Operations, if applicable.
Affiliated Underlying Funds
Fiscal year to date information regarding the Fund's investments in affiliated Underlying Funds, excluding any Money Market Central Funds, is presented below. Exchanges between classes of the same affiliated Underlying Funds may occur.
| Affiliate | Value, beginning of period | Purchases | Sales Proceeds | Dividend Income | Realized Gain (loss) | Change in Unrealized appreciation (depreciation) | Value, end of period |
| Fidelity Series Blue Chip Growth Fund | $46,431,602 | $33,562,626 | $18,636,557 | $15,216,269 | $2,287,392 | $13,467,747 | $77,112,810 |
| Fidelity Series Canada Fund | 11,264,649 | 4,314,256 | 1,516,271 | -- | (154,219) | 3,110,268 | 17,018,683 |
| Fidelity Series Commodity Strategy Fund | 22,844,118 | 5,464,203 | 6,349,045 | 105,620 | (862,192) | 3,805,187 | 24,902,271 |
| Fidelity Series Corporate Bond Fund | 26,442,962 | 17,455,583 | 2,575,394 | 577,192 | 36,107 | 3,124,411 | 44,483,669 |
| Fidelity Series Emerging Markets Debt Fund | 4,304,484 | 1,224,930 | 145,121 | 144,954 | 207 | 584,069 | 5,968,569 |
| Fidelity Series Emerging Markets Fund | 6,338,473 | 4,089,486 | 633,376 | -- | (5,562) | 2,737,825 | 12,526,846 |
| Fidelity Series Emerging Markets Opportunities Fund | 59,212,903 | 34,909,250 | 7,129,454 | -- | (17,753) | 25,570,036 | 112,544,982 |
| Fidelity Series Floating Rate High Income Fund | 976,777 | 288,643 | 35,110 | 27,359 | 62 | 107,459 | 1,337,831 |
| Fidelity Series Government Bond Index Fund | 40,835,997 | 18,735,029 | 6,276,132 | 355,789 | 16,963 | (159,093) | 53,152,764 |
| Fidelity Series Government Money Market Fund 0.16% | 6,946,249 | 12,004,684 | 13,855,594 | 5,404 | -- | -- | 5,095,339 |
| Fidelity Series High Income Fund | 4,969,414 | 1,478,442 | 175,549 | 172,020 | 134 | 576,113 | 6,848,554 |
| Fidelity Series Inflation-Protected Bond Index Fund | 35,414,710 | 19,940,129 | 3,280,858 | 36,139 | 10,377 | 2,674,114 | 54,758,472 |
| Fidelity Series International Growth Fund | 34,839,346 | 10,209,722 | 11,308,868 | -- | 279,145 | 10,202,262 | 44,221,607 |
| Fidelity Series International Index Fund | 13,264,285 | 3,702,802 | 1,726,995 | -- | (140,028) | 3,155,191 | 18,255,255 |
| Fidelity Series International Small Cap Fund | 10,500,823 | 2,742,182 | 1,217,258 | -- | (8,355) | 3,680,991 | 15,698,383 |
| Fidelity Series International Value Fund | 33,590,402 | 9,816,066 | 6,733,767 | -- | (697,396) | 7,908,093 | 43,883,398 |
| Fidelity Series Investment Grade Bond Fund | 38,981,456 | 21,569,828 | 4,148,539 | 664,934 | 42,566 | 2,703,514 | 59,148,825 |
| Fidelity Series Investment Grade Securitized Fund | 27,852,376 | 15,164,242 | 3,070,428 | 217,744 | 9,131 | 373,206 | 40,328,527 |
| Fidelity Series Large Cap Growth Index Fund | 34,828,705 | 11,148,796 | 12,326,458 | 836,716 | 1,202,911 | 14,512,983 | 49,366,937 |
| Fidelity Series Large Cap Stock Fund | 35,858,801 | 14,778,288 | 4,196,627 | 1,829,720 | (198,878) | 6,940,982 | 53,182,566 |
| Fidelity Series Large Cap Value Index Fund | 66,802,413 | 25,873,017 | 6,671,763 | -- | (429,844) | 15,019,749 | 100,593,572 |
| Fidelity Series Long-Term Treasury Bond Index Fund | 17,290,919 | 8,651,447 | 2,649,753 | 478,648 | 234,387 | (730,903) | 22,796,097 |
| Fidelity Series Overseas Fund | 32,981,347 | 11,184,856 | 10,167,775 | -- | (499,356) | 10,658,279 | 44,157,351 |
| Fidelity Series Real Estate Income Fund | 2,701,228 | 942,634 | 110,159 | 123,794 | (1,798) | 551,447 | 4,083,352 |
| Fidelity Series Short-Term Credit Fund | 1,431,604 | 16,333 | -- | 16,333 | -- | 53,691 | 1,501,628 |
| Fidelity Series Small Cap Opportunities Fund | 17,739,595 | 5,437,443 | 2,522,536 | 150,982 | (380,211) | 5,036,621 | 25,310,912 |
| Fidelity Series Treasury Bill Index Fund | 17,358,861 | 388,305 | 6,012,713 | 67,672 | (16,866) | (39,506) | 11,678,081 |
| Fidelity Series Value Discovery Fund | 20,826,021 | 12,129,582 | 1,940,348 | -- | 6,098 | 5,496,724 | 36,518,077 |
| | 672,830,520 | 307,222,804 | 135,412,448 | 21,027,289 | 713,022 | 141,121,460 | 986,475,358 |
Amounts in the income column in the above table include any capital gain distributions from underlying funds, which are presented in the corresponding line-item in the Statement of Operations, if applicable.
Investment Valuation
The following is a summary of the inputs used, as of September 30, 2020, involving the Fund's assets and liabilities carried at fair value. The inputs or methodology used for valuing securities may not be an indication of the risk associated with investing in those securities. For more information on valuation inputs, and their aggregation into the levels used below, please refer to the Investment Valuation section in the accompanying Notes to Financial Statements.
| | Valuation Inputs at Reporting Date: |
| Description | Total | Level 1 | Level 2 | Level 3 |
| Investments in Securities: | | | | |
| Domestic Equity Funds | $366,987,145 | $366,987,145 | $-- | $-- |
| International Equity Funds | 308,306,505 | 308,306,505 | -- | -- |
| Bond Funds | 292,906,660 | 292,906,660 | -- | -- |
| Short-Term Funds | 18,276,256 | 18,276,256 | -- | -- |
| Total Investments in Securities: | $986,476,566 | $986,476,566 | $-- | $-- |
See accompanying notes which are an integral part of the financial statements.
Fidelity Freedom® Blend 2030 Fund
Financial Statements
Statement of Assets and Liabilities
| | | September 30, 2020 (Unaudited) |
| Assets | | |
Investment in securities, at value — See accompanying schedule:
| | |
| Fidelity Central Funds (cost $1,208) | $1,208 | |
| Other affiliated issuers (cost $929,149,707) | 986,475,358 | |
| Total Investment in Securities (cost $929,150,915) | | $986,476,566 |
| Cash | | 76 |
| Receivable for investments sold | | 7,941,706 |
| Receivable for fund shares sold | | 830,285 |
| Total assets | | 995,248,633 |
| Liabilities | | |
| Payable for investments purchased | $7,505,065 | |
| Payable for fund shares redeemed | 1,005,080 | |
| Accrued management fee | 274,940 | |
| Distribution and service plan fees payable | 3,221 | |
| Total liabilities | | 8,788,306 |
| Net Assets | | $986,460,327 |
| Net Assets consist of: | | |
| Paid in capital | | $912,151,374 |
| Total accumulated earnings (loss) | | 74,308,953 |
| Net Assets | | $986,460,327 |
| Net Asset Value and Maximum Offering Price | | |
| Class A: | | |
| Net Asset Value and redemption price per share ($2,349,989 ÷ 221,597 shares)(a) | | $10.60 |
| Maximum offering price per share (100/94.25 of $10.60) | | $11.25 |
| Class M: | | |
| Net Asset Value and redemption price per share ($1,423,747 ÷ 134,452 shares)(a) | | $10.59 |
| Maximum offering price per share (100/96.50 of $10.59) | | $10.97 |
| Class C: | | |
| Net Asset Value and offering price per share ($2,169,172 ÷ 206,229 shares)(a) | | $10.52 |
| Fidelity Freedom Blend 2030 Fund: | | |
| Net Asset Value, offering price and redemption price per share ($23,820,010 ÷ 2,241,745 shares) | | $10.63 |
| Class K: | | |
| Net Asset Value, offering price and redemption price per share ($24,714,329 ÷ 2,322,469 shares) | | $10.64 |
| Class K6: | | |
| Net Asset Value, offering price and redemption price per share ($903,091,138 ÷ 84,691,925 shares) | | $10.66 |
| Class I: | | |
| Net Asset Value, offering price and redemption price per share ($24,028,878 ÷ 2,261,329 shares) | | $10.63 |
| Class Z: | | |
| Net Asset Value, offering price and redemption price per share ($201,178 ÷ 18,874 shares) | | $10.66 |
| Class Z6: | | |
| Net Asset Value, offering price and redemption price per share ($4,661,886 ÷ 437,242 shares) | | $10.66 |
(a) Redemption price per share is equal to net asset value less any applicable contingent deferred sales charge.
See accompanying notes which are an integral part of the financial statements.
Statement of Operations
| | | Six months ended September 30, 2020 (Unaudited) |
| Investment Income | | |
| Dividends: | | |
| Affiliated issuers | | $3,941,733 |
| Income from Fidelity Central Funds | | 1 |
| Total income | | 3,941,734 |
| Expenses | | |
| Management fee | $1,471,652 | |
| Distribution and service plan fees | 15,672 | |
| Independent trustees' fees and expenses | 1,136 | |
| Total expenses before reductions | 1,488,460 | |
| Expense reductions | (36) | |
| Total expenses after reductions | | 1,488,424 |
| Net investment income (loss) | | 2,453,310 |
| Realized and Unrealized Gain (Loss) | | |
| Net realized gain (loss) on: | | |
| Investment securities: | | |
| Affiliated issuers | 713,022 | |
| Capital gain distributions from underlying funds: | | |
| Affiliated issuers | 17,085,556 | |
| Total net realized gain (loss) | | 17,798,578 |
| Change in net unrealized appreciation (depreciation) on: | | |
| Investment securities: | | |
| Affiliated issuers | 141,121,460 | |
| Total change in net unrealized appreciation (depreciation) | | 141,121,460 |
| Net gain (loss) | | 158,920,038 |
| Net increase (decrease) in net assets resulting from operations | | $161,373,348 |
See accompanying notes which are an integral part of the financial statements.
Statement of Changes in Net Assets
| | Six months ended September 30, 2020 (Unaudited) | Year ended March 31, 2020 |
| Increase (Decrease) in Net Assets | | |
| Operations | | |
| Net investment income (loss) | $2,453,310 | $12,382,383 |
| Net realized gain (loss) | 17,798,578 | 15,476,861 |
| Change in net unrealized appreciation (depreciation) | 141,121,460 | (85,353,280) |
| Net increase (decrease) in net assets resulting from operations | 161,373,348 | (57,494,036) |
| Distributions to shareholders | (8,278,044) | (22,856,187) |
| Share transactions - net increase (decrease) | 160,543,056 | 729,183,489 |
| Total increase (decrease) in net assets | 313,638,360 | 648,833,266 |
| Net Assets | | |
| Beginning of period | 672,821,967 | 23,988,701 |
| End of period | $986,460,327 | $672,821,967 |
See accompanying notes which are an integral part of the financial statements.
Financial Highlights
Fidelity Freedom Blend 2030 Fund Class A
| | Six months ended (Unaudited) September 30, | Years endedMarch 31, | |
| | 2020 | 2020 | 2019 A |
| Selected Per–Share Data | | | |
| Net asset value, beginning of period | $8.81 | $9.68 | $10.00 |
| Income from Investment Operations | | | |
| Net investment income (loss)B | .01 | .16 | .02 |
| Net realized and unrealized gain (loss) | 1.87 | (.70) | (.09) |
| Total from investment operations | 1.88 | (.54) | (.07) |
| Distributions from net investment income | – | (.16) | (.13) |
| Distributions from net realized gain | (.09) | (.17) | (.12) |
| Total distributions | (.09) | (.33) | (.25) |
| Net asset value, end of period | $10.60 | $8.81 | $9.68 |
| Total ReturnC,D,E | 21.51% | (6.09)% | (.45)% |
| Ratios to Average Net AssetsF,G | | | |
| Expenses before reductions | .77%H | .77% | .78%H,I |
| Expenses net of fee waivers, if any | .77%H | .77% | .78%H,I |
| Expenses net of all reductions | .77%H | .77% | .78%H,I |
| Net investment income (loss) | .12%H | 1.56% | .39%H |
| Supplemental Data | | | |
| Net assets, end of period (000 omitted) | $2,350 | $1,516 | $348 |
| Portfolio turnover rateJ | 31%H | 31% | 29%H |
A For the period August 31, 2018 (commencement of operations) to March 31, 2019.
B Calculated based on average shares outstanding during the period.
C Total returns for periods of less than one year are not annualized.
D Total returns would have been lower if certain expenses had not been reduced during the applicable periods shown.
E Total returns do not include the effect of the sales charges.
F Fees and expenses of any underlying mutual funds or exchange-traded funds (ETFs) are not included in the Fund's expense ratio. The Fund indirectly bears its proportionate share of these expenses. For additional expense information related to investments in Fidelity Central Funds, please refer to the "Investments in Fidelity Central Funds" note found in the Notes to Financial Statements section of the most recent Annual or Semi-Annual report.
G Expense ratios reflect operating expenses of the class. Expenses before reductions do not reflect amounts reimbursed, waived, or reduced through arrangements with the investment adviser, brokerage services, or other offset arrangements, if applicable, and do not represent the amount paid by the class during periods when reimbursements, waivers or reductions occur.
H Annualized
I On certain classes, the size and fluctuation of net assets and expense amounts may cause ratios to differ from contractual rates.
J Amount does not include the portfolio activity of any underlying mutual funds or exchange-traded funds (ETFs).
See accompanying notes which are an integral part of the financial statements.
Fidelity Freedom Blend 2030 Fund Class M
| | Six months ended (Unaudited) September 30, | Years endedMarch 31, | |
| | 2020 | 2020 | 2019 A |
| Selected Per–Share Data | | | |
| Net asset value, beginning of period | $8.79 | $9.68 | $10.00 |
| Income from Investment Operations | | | |
| Net investment income (loss)B | (.01) | .13 | .01 |
| Net realized and unrealized gain (loss) | 1.89 | (.70) | (.09) |
| Total from investment operations | 1.88 | (.57) | (.08) |
| Distributions from net investment income | – | (.15) | (.12) |
| Distributions from net realized gain | (.08) | (.17) | (.12) |
| Total distributions | (.08) | (.32) | (.24) |
| Net asset value, end of period | $10.59 | $8.79 | $9.68 |
| Total ReturnC,D,E | 21.53% | (6.44)% | (.56)% |
| Ratios to Average Net AssetsF,G | | | |
| Expenses before reductions | 1.02%H | 1.02% | 1.02%H |
| Expenses net of fee waivers, if any | 1.02%H | 1.02% | 1.02%H |
| Expenses net of all reductions | 1.02%H | 1.02% | 1.02%H |
| Net investment income (loss) | (.13)%H | 1.32% | .15%H |
| Supplemental Data | | | |
| Net assets, end of period (000 omitted) | $1,424 | $976 | $170 |
| Portfolio turnover rateI | 31%H | 31% | 29%H |
A For the period August 31, 2018 (commencement of operations) to March 31, 2019.
B Calculated based on average shares outstanding during the period.
C Total returns for periods of less than one year are not annualized.
D Total returns would have been lower if certain expenses had not been reduced during the applicable periods shown.
E Total returns do not include the effect of the sales charges.
F Fees and expenses of any underlying mutual funds or exchange-traded funds (ETFs) are not included in the Fund's expense ratio. The Fund indirectly bears its proportionate share of these expenses. For additional expense information related to investments in Fidelity Central Funds, please refer to the "Investments in Fidelity Central Funds" note found in the Notes to Financial Statements section of the most recent Annual or Semi-Annual report.
G Expense ratios reflect operating expenses of the class. Expenses before reductions do not reflect amounts reimbursed, waived, or reduced through arrangements with the investment adviser, brokerage services, or other offset arrangements, if applicable, and do not represent the amount paid by the class during periods when reimbursements, waivers or reductions occur.
H Annualized
I Amount does not include the portfolio activity of any underlying mutual funds or exchange-traded funds (ETFs).
See accompanying notes which are an integral part of the financial statements.
Fidelity Freedom Blend 2030 Fund Class C
| | Six months ended (Unaudited) September 30, | Years endedMarch 31, | |
| | 2020 | 2020 | 2019 A |
| Selected Per–Share Data | | | |
| Net asset value, beginning of period | $8.77 | $9.66 | $10.00 |
| Income from Investment Operations | | | |
| Net investment income (loss)B | (.03) | .08 | (.02) |
| Net realized and unrealized gain (loss) | 1.88 | (.71) | (.08) |
| Total from investment operations | 1.85 | (.63) | (.10) |
| Distributions from net investment income | (.01) | (.09) | (.12) |
| Distributions from net realized gain | (.09) | (.17) | (.12) |
| Total distributions | (.10) | (.26) | (.24) |
| Net asset value, end of period | $10.52 | $8.77 | $9.66 |
| Total ReturnC,D,E | 21.23% | (6.94)% | (.81)% |
| Ratios to Average Net AssetsF,G | | | |
| Expenses before reductions | 1.53%H,I | 1.51%I | 1.52%H |
| Expenses net of fee waivers, if any | 1.53%H,I | 1.51%I | 1.52%H |
| Expenses net of all reductions | 1.52%H,I | 1.51%I | 1.52%H |
| Net investment income (loss) | (.63)%H | .82% | (.35)%H |
| Supplemental Data | | | |
| Net assets, end of period (000 omitted) | $2,169 | $987 | $259 |
| Portfolio turnover rateJ | 31%H | 31% | 29%H |
A For the period August 31, 2018 (commencement of operations) to March 31, 2019.
B Calculated based on average shares outstanding during the period.
C Total returns for periods of less than one year are not annualized.
D Total returns would have been lower if certain expenses had not been reduced during the applicable periods shown.
E Total returns do not include the effect of the contingent deferred sales charge.
F Fees and expenses of any underlying mutual funds or exchange-traded funds (ETFs) are not included in the Fund's expense ratio. The Fund indirectly bears its proportionate share of these expenses. For additional expense information related to investments in Fidelity Central Funds, please refer to the "Investments in Fidelity Central Funds" note found in the Notes to Financial Statements section of the most recent Annual or Semi-Annual report.
G Expense ratios reflect operating expenses of the class. Expenses before reductions do not reflect amounts reimbursed, waived, or reduced through arrangements with the investment adviser, brokerage services, or other offset arrangements, if applicable, and do not represent the amount paid by the class during periods when reimbursements, waivers or reductions occur.
H Annualized
I On certain classes, the size and fluctuation of net assets and expense amounts may cause ratios to differ from contractual rates.
J Amount does not include the portfolio activity of any underlying mutual funds or exchange-traded funds (ETFs).
See accompanying notes which are an integral part of the financial statements.
Fidelity Freedom Blend 2030 Fund
| | Six months ended (Unaudited) September 30, | Years endedMarch 31, | |
| | 2020 | 2020 | 2019 A |
| Selected Per–Share Data | | | |
| Net asset value, beginning of period | $8.82 | $9.69 | $10.00 |
| Income from Investment Operations | | | |
| Net investment income (loss)B | .02 | .18 | .04 |
| Net realized and unrealized gain (loss) | 1.89 | (.70) | (.09) |
| Total from investment operations | 1.91 | (.52) | (.05) |
| Distributions from net investment income | (.01) | (.18) | (.14) |
| Distributions from net realized gain | (.09) | (.17) | (.12) |
| Total distributions | (.10) | (.35) | (.26) |
| Net asset value, end of period | $10.63 | $8.82 | $9.69 |
| Total ReturnC,D | 21.83% | (5.94)% | (.26)% |
| Ratios to Average Net AssetsE,F | | | |
| Expenses before reductions | .52%G | .53%H | .52%G |
| Expenses net of fee waivers, if any | .52%G | .53%H | .52%G |
| Expenses net of all reductions | .52%G | .53%H | .52%G |
| Net investment income (loss) | .37%G | 1.81% | .65%G |
| Supplemental Data | | | |
| Net assets, end of period (000 omitted) | $23,820 | $17,917 | $762 |
| Portfolio turnover rateI | 31%G | 31% | 29%G |
A For the period August 31, 2018 (commencement of operations) to March 31, 2019.
B Calculated based on average shares outstanding during the period.
C Total returns for periods of less than one year are not annualized.
D Total returns would have been lower if certain expenses had not been reduced during the applicable periods shown.
E Fees and expenses of any underlying mutual funds or exchange-traded funds (ETFs) are not included in the Fund's expense ratio. The Fund indirectly bears its proportionate share of these expenses. For additional expense information related to investments in Fidelity Central Funds, please refer to the "Investments in Fidelity Central Funds" note found in the Notes to Financial Statements section of the most recent Annual or Semi-Annual report.
F Expense ratios reflect operating expenses of the class. Expenses before reductions do not reflect amounts reimbursed, waived, or reduced through arrangements with the investment adviser, brokerage services, or other offset arrangements, if applicable, and do not represent the amount paid by the class during periods when reimbursements, waivers or reductions occur.
G Annualized
H On certain classes, the size and fluctuation of net assets and expense amounts may cause ratios to differ from contractual rates.
I Amount does not include the portfolio activity of any underlying mutual funds or exchange-traded funds (ETFs).
See accompanying notes which are an integral part of the financial statements.
Fidelity Freedom Blend 2030 Fund Class K
| | Six months ended (Unaudited) September 30, | Years endedMarch 31, | |
| | 2020 | 2020 | 2019 A |
| Selected Per–Share Data | | | |
| Net asset value, beginning of period | $8.83 | $9.70 | $10.00 |
| Income from Investment Operations | | | |
| Net investment income (loss)B | .02 | .20 | .04 |
| Net realized and unrealized gain (loss) | 1.89 | (.71) | (.08) |
| Total from investment operations | 1.91 | (.51) | (.04) |
| Distributions from net investment income | (.01) | (.19) | (.14) |
| Distributions from net realized gain | (.09) | (.17) | (.12) |
| Total distributions | (.10) | (.36) | (.26) |
| Net asset value, end of period | $10.64 | $8.83 | $9.70 |
| Total ReturnC,D | 21.79% | (5.86)% | (.15)% |
| Ratios to Average Net AssetsE,F | | | |
| Expenses before reductions | .42%G | .42% | .42%G |
| Expenses net of fee waivers, if any | .42%G | .42% | .42%G |
| Expenses net of all reductions | .42%G | .42% | .42%G |
| Net investment income (loss) | .47%G | 1.91% | .75%G |
| Supplemental Data | | | |
| Net assets, end of period (000 omitted) | $24,714 | $21,646 | $100 |
| Portfolio turnover rateH | 31%G | 31% | 29%G |
A For the period August 31, 2018 (commencement of operations) to March 31, 2019.
B Calculated based on average shares outstanding during the period.
C Total returns for periods of less than one year are not annualized.
D Total returns would have been lower if certain expenses had not been reduced during the applicable periods shown.
E Fees and expenses of any underlying mutual funds or exchange-traded funds (ETFs) are not included in the Fund's expense ratio. The Fund indirectly bears its proportionate share of these expenses. For additional expense information related to investments in Fidelity Central Funds, please refer to the "Investments in Fidelity Central Funds" note found in the Notes to Financial Statements section of the most recent Annual or Semi-Annual report.
F Expense ratios reflect operating expenses of the class. Expenses before reductions do not reflect amounts reimbursed, waived, or reduced through arrangements with the investment adviser, brokerage services, or other offset arrangements, if applicable, and do not represent the amount paid by the class during periods when reimbursements, waivers or reductions occur.
G Annualized
H Amount does not include the portfolio activity of any underlying mutual funds or exchange-traded funds (ETFs).
See accompanying notes which are an integral part of the financial statements.
Fidelity Freedom Blend 2030 Fund Class K6
| | Six months ended (Unaudited) September 30, | Years endedMarch 31, | |
| | 2020 | 2020 | 2019 A |
| Selected Per–Share Data | | | |
| Net asset value, beginning of period | $8.85 | $9.70 | $10.00 |
| Income from Investment Operations | | | |
| Net investment income (loss)B | .03 | .20 | .05 |
| Net realized and unrealized gain (loss) | 1.88 | (.70) | (.09) |
| Total from investment operations | 1.91 | (.50) | (.04) |
| Distributions from net investment income | (.01) | (.18) | (.14) |
| Distributions from net realized gain | (.09) | (.17) | (.12) |
| Total distributions | (.10) | (.35) | (.26) |
| Net asset value, end of period | $10.66 | $8.85 | $9.70 |
| Total ReturnC,D | 21.78% | (5.71)% | (.11)% |
| Ratios to Average Net AssetsE,F | | | |
| Expenses before reductions | .32%G | .32% | .33%G,H |
| Expenses net of fee waivers, if any | .32%G | .32% | .33%G,H |
| Expenses net of all reductions | .32%G | .32% | .33%G,H |
| Net investment income (loss) | .57%G | 2.02% | .84%G |
| Supplemental Data | | | |
| Net assets, end of period (000 omitted) | $903,091 | $615,185 | $21,781 |
| Portfolio turnover rateI | 31%G | 31% | 29%G |
A For the period August 31, 2018 (commencement of operations) to March 31, 2019.
B Calculated based on average shares outstanding during the period.
C Total returns for periods of less than one year are not annualized.
D Total returns would have been lower if certain expenses had not been reduced during the applicable periods shown.
E Fees and expenses of any underlying mutual funds or exchange-traded funds (ETFs) are not included in the Fund's expense ratio. The Fund indirectly bears its proportionate share of these expenses. For additional expense information related to investments in Fidelity Central Funds, please refer to the "Investments in Fidelity Central Funds" note found in the Notes to Financial Statements section of the most recent Annual or Semi-Annual report.
F Expense ratios reflect operating expenses of the class. Expenses before reductions do not reflect amounts reimbursed, waived, or reduced through arrangements with the investment adviser, brokerage services, or other offset arrangements, if applicable, and do not represent the amount paid by the class during periods when reimbursements, waivers or reductions occur.
G Annualized
H On certain classes, the size and fluctuation of net assets and expense amounts may cause ratios to differ from contractual rates.
I Amount does not include the portfolio activity of any underlying mutual funds or exchange-traded funds (ETFs).
See accompanying notes which are an integral part of the financial statements.
Fidelity Freedom Blend 2030 Fund Class I
| | Six months ended (Unaudited) September 30, | Years endedMarch 31, | |
| | 2020 | 2020 | 2019 A |
| Selected Per–Share Data | | | |
| Net asset value, beginning of period | $8.82 | $9.69 | $10.00 |
| Income from Investment Operations | | | |
| Net investment income (loss)B | .02 | .18 | .04 |
| Net realized and unrealized gain (loss) | 1.89 | (.70) | (.10) |
| Total from investment operations | 1.91 | (.52) | (.06) |
| Distributions from net investment income | (.01) | (.18) | (.14) |
| Distributions from net realized gain | (.09) | (.17) | (.12) |
| Total distributions | (.10) | (.35) | (.25)C |
| Net asset value, end of period | $10.63 | $8.82 | $9.69 |
| Total ReturnD,E | 21.84% | (5.92)% | (.29)% |
| Ratios to Average Net AssetsF,G | | | |
| Expenses before reductions | .52%H | .53%I | .52%H |
| Expenses net of fee waivers, if any | .52%H | .53%I | .52%H |
| Expenses net of all reductions | .52%H | .53%I | .52%H |
| Net investment income (loss) | .37%H | 1.81% | .65%H |
| Supplemental Data | | | |
| Net assets, end of period (000 omitted) | $24,029 | $10,530 | $100 |
| Portfolio turnover rateJ | 31%H | 31% | 29%H |
A For the period August 31, 2018 (commencement of operations) to March 31, 2019.
B Calculated based on average shares outstanding during the period.
C Total distributions per share do not sum due to rounding.
D Total returns for periods of less than one year are not annualized.
E Total returns would have been lower if certain expenses had not been reduced during the applicable periods shown.
F Fees and expenses of any underlying mutual funds or exchange-traded funds (ETFs) are not included in the Fund's expense ratio. The Fund indirectly bears its proportionate share of these expenses. For additional expense information related to investments in Fidelity Central Funds, please refer to the "Investments in Fidelity Central Funds" note found in the Notes to Financial Statements section of the most recent Annual or Semi-Annual report.
G Expense ratios reflect operating expenses of the class. Expenses before reductions do not reflect amounts reimbursed, waived, or reduced through arrangements with the investment adviser, brokerage services, or other offset arrangements, if applicable, and do not represent the amount paid by the class during periods when reimbursements, waivers or reductions occur.
H Annualized
I On certain classes, the size and fluctuation of net assets and expense amounts may cause ratios to differ from contractual rates.
J Amount does not include the portfolio activity of any underlying mutual funds or exchange-traded funds (ETFs).
See accompanying notes which are an integral part of the financial statements.
Fidelity Freedom Blend 2030 Fund Class Z
| | Six months ended (Unaudited) September 30, | Years endedMarch 31, | |
| | 2020 | 2020 | 2019 A |
| Selected Per–Share Data | | | |
| Net asset value, beginning of period | $8.85 | $9.70 | $10.00 |
| Income from Investment Operations | | | |
| Net investment income (loss)B | .02 | .19 | .04 |
| Net realized and unrealized gain (loss) | 1.89 | (.70) | (.08) |
| Total from investment operations | 1.91 | (.51) | (.04) |
| Distributions from net investment income | (.01) | (.17) | (.14) |
| Distributions from net realized gain | (.09) | (.17) | (.12) |
| Total distributions | (.10) | (.34) | (.26) |
| Net asset value, end of period | $10.66 | $8.85 | $9.70 |
| Total ReturnC,D | 21.78% | (5.83)% | (.15)% |
| Ratios to Average Net AssetsE,F | | | |
| Expenses before reductions | .42%G | .42% | .42%G |
| Expenses net of fee waivers, if any | .42%G | .42% | .42%G |
| Expenses net of all reductions | .42%G | .42% | .42%G |
| Net investment income (loss) | .47%G | 1.92% | .75%G |
| Supplemental Data | | | |
| Net assets, end of period (000 omitted) | $201 | $141 | $100 |
| Portfolio turnover rateH | 31%G | 31% | 29%G |
A For the period August 31, 2018 (commencement of operations) to March 31, 2019.
B Calculated based on average shares outstanding during the period.
C Total returns for periods of less than one year are not annualized.
D Total returns would have been lower if certain expenses had not been reduced during the applicable periods shown.
E Fees and expenses of any underlying mutual funds or exchange-traded funds (ETFs) are not included in the Fund's expense ratio. The Fund indirectly bears its proportionate share of these expenses. For additional expense information related to investments in Fidelity Central Funds, please refer to the "Investments in Fidelity Central Funds" note found in the Notes to Financial Statements section of the most recent Annual or Semi-Annual report.
F Expense ratios reflect operating expenses of the class. Expenses before reductions do not reflect amounts reimbursed, waived, or reduced through arrangements with the investment adviser, brokerage services, or other offset arrangements, if applicable, and do not represent the amount paid by the class during periods when reimbursements, waivers or reductions occur.
G Annualized
H Amount does not include the portfolio activity of any underlying mutual funds or exchange-traded funds (ETFs).
See accompanying notes which are an integral part of the financial statements.
Fidelity Freedom Blend 2030 Fund Class Z6
| | Six months ended (Unaudited) September 30, | Years endedMarch 31, | |
| | 2020 | 2020 | 2019 A |
| Selected Per–Share Data | | | |
| Net asset value, beginning of period | $8.85 | $9.70 | $10.00 |
| Income from Investment Operations | | | |
| Net investment income (loss)B | .03 | .19 | .05 |
| Net realized and unrealized gain (loss) | 1.89 | (.69) | (.09) |
| Total from investment operations | 1.92 | (.50) | (.04) |
| Distributions from net investment income | (.01) | (.18) | (.14) |
| Distributions from net realized gain | (.09) | (.17) | (.12) |
| Total distributions | (.11)C | (.35) | (.26) |
| Net asset value, end of period | $10.66 | $8.85 | $9.70 |
| Total ReturnD,E | 21.80% | (5.72)% | (.11)% |
| Ratios to Average Net AssetsF,G | | | |
| Expenses before reductions | .32%H | .33%I | .32%H |
| Expenses net of fee waivers, if any | .32%H | .33%I | .32%H |
| Expenses net of all reductions | .32%H | .33%I | .32%H |
| Net investment income (loss) | .57%H | 2.01% | .85%H |
| Supplemental Data | | | |
| Net assets, end of period (000 omitted) | $4,662 | $3,925 | $368 |
| Portfolio turnover rateJ | 31%H | 31% | 29%H |
A For the period August 31, 2018 (commencement of operations) to March 31, 2019.
B Calculated based on average shares outstanding during the period.
C Total distributions per share do not sum due to rounding.
D Total returns for periods of less than one year are not annualized.
E Total returns would have been lower if certain expenses had not been reduced during the applicable periods shown.
F Fees and expenses of any underlying mutual funds or exchange-traded funds (ETFs) are not included in the Fund's expense ratio. The Fund indirectly bears its proportionate share of these expenses. For additional expense information related to investments in Fidelity Central Funds, please refer to the "Investments in Fidelity Central Funds" note found in the Notes to Financial Statements section of the most recent Annual or Semi-Annual report.
G Expense ratios reflect operating expenses of the class. Expenses before reductions do not reflect amounts reimbursed, waived, or reduced through arrangements with the investment adviser, brokerage services, or other offset arrangements, if applicable, and do not represent the amount paid by the class during periods when reimbursements, waivers or reductions occur.
H Annualized
I On certain classes, the size and fluctuation of net assets and expense amounts may cause ratios to differ from contractual rates.
J Amount does not include the portfolio activity of any underlying mutual funds or exchange-traded funds (ETFs).
See accompanying notes which are an integral part of the financial statements.
Fidelity Freedom® Blend 2035 Fund
Investment Summary (Unaudited)
The information in the following tables is based on the direct investments of the Fund.
Top Holdings as of September 30, 2020
| | % of fund's net assets |
| Fidelity Series Emerging Markets Opportunities Fund | 13.0 |
| Fidelity Series Large Cap Value Index Fund | 12.9 |
| Fidelity Series Blue Chip Growth Fund | 9.8 |
| Fidelity Series Large Cap Stock Fund | 6.8 |
| Fidelity Series Large Cap Growth Index Fund | 6.3 |
| Fidelity Series International Growth Fund | 5.5 |
| Fidelity Series Overseas Fund | 5.5 |
| Fidelity Series International Value Fund | 5.5 |
| Fidelity Series Value Discovery Fund | 4.7 |
| Fidelity Series Small Cap Opportunities Fund | 3.2 |
| | 73.2 |
Asset Allocation (% of fund's net assets)
| Period end |
| | Domestic Equity Funds | 46.2% |
| | International Equity Funds | 37.2% |
| | Bond Funds | 15.2% |
| | Short-Term Funds | 1.4% |

Domestic Equity Funds category includes Fidelity Series Commodity Strategy Fund which invests in commodity-related investments.
Fidelity Freedom® Blend 2035 Fund
Schedule of Investments September 30, 2020 (Unaudited)
Showing Percentage of Net Assets
| Domestic Equity Funds - 46.2% | | | |
| | | Shares | Value |
| Fidelity Series Blue Chip Growth Fund (a) | | 5,324,355 | $87,905,093 |
| Fidelity Series Commodity Strategy Fund (a) | | 5,410,792 | 22,508,896 |
| Fidelity Series Large Cap Growth Index Fund (a) | | 3,951,945 | 56,275,695 |
| Fidelity Series Large Cap Stock Fund (a) | | 4,281,536 | 60,626,543 |
| Fidelity Series Large Cap Value Index Fund (a) | | 9,885,632 | 114,673,328 |
| Fidelity Series Small Cap Opportunities Fund (a) | | 2,261,212 | 28,853,070 |
| Fidelity Series Value Discovery Fund (a) | | 3,368,092 | 41,629,613 |
| TOTAL DOMESTIC EQUITY FUNDS | | | |
| (Cost $396,894,877) | | | 412,472,238 |
|
| International Equity Funds - 37.2% | | | |
| Fidelity Series Canada Fund (a) | | 1,847,057 | 18,895,393 |
| Fidelity Series Emerging Markets Fund (a) | | 1,369,899 | 12,918,144 |
| Fidelity Series Emerging Markets Opportunities Fund (a) | | 5,532,435 | 116,070,491 |
| Fidelity Series International Growth Fund (a) | | 2,614,507 | 49,100,446 |
| Fidelity Series International Index Fund (a) | | 2,039,038 | 20,268,035 |
| Fidelity Series International Small Cap Fund (a) | | 971,586 | 17,294,228 |
| Fidelity Series International Value Fund (a) | | 5,653,612 | 48,734,135 |
| Fidelity Series Overseas Fund (a) | | 4,385,415 | 49,028,937 |
| TOTAL INTERNATIONAL EQUITY FUNDS | | | |
| (Cost $305,384,159) | | | 332,309,809 |
|
| Bond Funds - 15.2% | | | |
| Fidelity Series Corporate Bond Fund (a) | | 1,607,373 | 18,082,947 |
| Fidelity Series Emerging Markets Debt Fund (a) | | 603,959 | 5,471,867 |
| Fidelity Series Floating Rate High Income Fund (a) | | 135,447 | 1,198,705 |
| Fidelity Series Government Bond Index Fund (a) | | 1,920,147 | 21,601,654 |
| Fidelity Series High Income Fund (a) | | 673,874 | 6,145,734 |
| Fidelity Series Inflation-Protected Bond Index Fund (a) | | 1,683,351 | 18,011,855 |
| Fidelity Series Investment Grade Bond Fund (a) | | 1,963,621 | 24,034,715 |
| Fidelity Series Investment Grade Securitized Fund (a) | | 1,536,695 | 16,396,531 |
| Fidelity Series Long-Term Treasury Bond Index Fund (a) | | 1,988,564 | 20,541,866 |
| Fidelity Series Real Estate Income Fund (a) | | 365,606 | 3,648,749 |
| TOTAL BOND FUNDS | | | |
| (Cost $129,368,428) | | | 135,134,623 |
|
| Short-Term Funds - 1.4% | | | |
| Fidelity Cash Central Fund 0.10% (b) | | 49 | 49 |
| Fidelity Series Government Money Market Fund 0.16% (a)(c) | | 1,299,897 | 1,299,897 |
| Fidelity Series Short-Term Credit Fund (a) | | 143,898 | 1,474,953 |
| Fidelity Series Treasury Bill Index Fund (a) | | 955,435 | 9,563,907 |
| TOTAL SHORT-TERM FUNDS | | | |
| (Cost $12,304,220) | | | 12,338,806 |
| TOTAL INVESTMENT IN SECURITIES - 100.0% | | | |
| (Cost $843,951,684) | | | 892,255,476 |
| NET OTHER ASSETS (LIABILITIES) - 0.0% | | | (12,728) |
| NET ASSETS - 100% | | | $892,242,748 |
Legend
(a) Affiliated Fund
(b) Affiliated fund that is generally available only to investment companies and other accounts managed by Fidelity Investments. The rate quoted is the annualized seven-day yield of the fund at period end. A complete unaudited listing of the fund's holdings as of its most recent quarter end is available upon request. In addition, each Fidelity Central Fund's financial statements are available on the SEC's website or upon request.
(c) The rate quoted is the annualized seven-day yield of the fund at period end.
Affiliated Underlying Funds
Fiscal year to date information regarding the Fund's investments in affiliated Underlying Funds, excluding any Money Market Central Funds, is presented below. Exchanges between classes of the same affiliated Underlying Funds may occur.
| Affiliate | Value, beginning of period | Purchases | Sales Proceeds | Dividend Income | Realized Gain (loss) | Change in Unrealized appreciation (depreciation) | Value, end of period |
| Fidelity Series Blue Chip Growth Fund | $53,605,125 | $34,231,007 | $17,722,149 | $17,341,239 | $2,390,502 | $15,400,608 | $87,905,093 |
| Fidelity Series Canada Fund | 12,956,167 | 4,104,112 | 1,408,150 | -- | (142,974) | 3,386,238 | 18,895,393 |
| Fidelity Series Commodity Strategy Fund | 20,802,498 | 4,557,713 | 5,496,103 | 95,986 | (698,621) | 3,343,409 | 22,508,896 |
| Fidelity Series Corporate Bond Fund | 10,151,361 | 8,747,159 | 1,964,209 | 218,273 | (22,772) | 1,171,408 | 18,082,947 |
| Fidelity Series Emerging Markets Debt Fund | 4,120,323 | 909,200 | 105,336 | 134,233 | 1,689 | 545,991 | 5,471,867 |
| Fidelity Series Emerging Markets Fund | 6,831,507 | 3,762,833 | 492,402 | -- | 887 | 2,815,319 | 12,918,144 |
| Fidelity Series Emerging Markets Opportunities Fund | 62,858,766 | 31,341,342 | 4,564,950 | -- | 70,343 | 26,364,990 | 116,070,491 |
| Fidelity Series Floating Rate High Income Fund | 913,185 | 212,237 | 25,484 | 24,746 | 365 | 98,402 | 1,198,705 |
| Fidelity Series Government Bond Index Fund | 15,858,297 | 9,495,584 | 3,685,342 | 134,015 | 25,697 | (92,582) | 21,601,654 |
| Fidelity Series Government Money Market Fund 0.16% | 5,905,521 | 7,075,217 | 11,680,841 | 4,141 | -- | -- | 1,299,897 |
| Fidelity Series High Income Fund | 4,649,299 | 1,093,217 | 127,423 | 155,757 | 1,933 | 528,708 | 6,145,734 |
| Fidelity Series Inflation-Protected Bond Index Fund | 13,647,353 | 5,254,613 | 1,813,703 | 12,345 | 9,915 | 913,677 | 18,011,855 |
| Fidelity Series International Growth Fund | 38,109,618 | 9,264,462 | 9,759,402 | -- | 224,347 | 11,261,421 | 49,100,446 |
| Fidelity Series International Index Fund | 14,782,569 | 3,461,584 | 1,306,194 | -- | (58,596) | 3,388,672 | 20,268,035 |
| Fidelity Series International Small Cap Fund | 11,377,259 | 2,602,516 | 715,641 | -- | 49,271 | 3,980,823 | 17,294,228 |
| Fidelity Series International Value Fund | 36,453,641 | 9,258,145 | 4,959,916 | -- | (285,190) | 8,267,455 | 48,734,135 |
| Fidelity Series Investment Grade Bond Fund | 14,136,106 | 11,251,053 | 2,352,613 | 250,207 | 38,187 | 961,982 | 24,034,715 |
| Fidelity Series Investment Grade Securitized Fund | 10,828,640 | 7,759,597 | 2,331,117 | 81,825 | 4,618 | 134,793 | 16,396,531 |
| Fidelity Series Large Cap Growth Index Fund | 39,935,026 | 10,763,423 | 12,218,419 | 959,484 | 1,272,502 | 16,523,163 | 56,275,695 |
| Fidelity Series Large Cap Stock Fund | 41,481,954 | 14,610,005 | 3,216,571 | 2,074,329 | (59,376) | 7,810,531 | 60,626,543 |
| Fidelity Series Large Cap Value Index Fund | 77,082,200 | 25,111,345 | 4,313,873 | -- | (152,829) | 16,946,485 | 114,673,328 |
| Fidelity Series Long-Term Treasury Bond Index Fund | 15,259,420 | 7,900,544 | 2,138,704 | 432,786 | 141,458 | (620,852) | 20,541,866 |
| Fidelity Series Overseas Fund | 36,192,417 | 10,494,339 | 8,818,836 | -- | (442,080) | 11,603,097 | 49,028,937 |
| Fidelity Series Real Estate Income Fund | 2,526,561 | 698,931 | 79,875 | 111,433 | 1,029 | 502,103 | 3,648,749 |
| Fidelity Series Short-Term Credit Fund | 1,406,173 | 16,042 | -- | 16,043 | -- | 52,738 | 1,474,953 |
| Fidelity Series Small Cap Opportunities Fund | 20,553,439 | 5,312,536 | 2,333,356 | 172,046 | (398,387) | 5,718,838 | 28,853,070 |
| Fidelity Series Treasury Bill Index Fund | 16,132,168 | 249,484 | 6,765,322 | 62,192 | (18,452) | (33,971) | 9,563,907 |
| Fidelity Series Value Discovery Fund | 24,115,610 | 12,229,785 | 1,086,118 | -- | (10,381) | 6,380,717 | 41,629,613 |
| | 612,672,203 | 241,768,025 | 111,482,049 | 22,281,080 | 1,943,085 | 147,354,163 | 892,255,427 |
Amounts in the income column in the above table include any capital gain distributions from underlying funds, which are presented in the corresponding line-item in the Statement of Operations, if applicable.
Investment Valuation
The following is a summary of the inputs used, as of September 30, 2020, involving the Fund's assets and liabilities carried at fair value. The inputs or methodology used for valuing securities may not be an indication of the risk associated with investing in those securities. For more information on valuation inputs, and their aggregation into the levels used below, please refer to the Investment Valuation section in the accompanying Notes to Financial Statements.
| | Valuation Inputs at Reporting Date: |
| Description | Total | Level 1 | Level 2 | Level 3 |
| Investments in Securities: | | | | |
| Domestic Equity Funds | $412,472,238 | $412,472,238 | $-- | $-- |
| International Equity Funds | 332,309,809 | 332,309,809 | -- | -- |
| Bond Funds | 135,134,623 | 135,134,623 | -- | -- |
| Short-Term Funds | 12,338,806 | 12,338,806 | -- | -- |
| Total Investments in Securities: | $892,255,476 | $892,255,476 | $-- | $-- |
See accompanying notes which are an integral part of the financial statements.
Fidelity Freedom® Blend 2035 Fund
Financial Statements
Statement of Assets and Liabilities
| | | September 30, 2020 (Unaudited) |
| Assets | | |
Investment in securities, at value — See accompanying schedule:
| | |
| Fidelity Central Funds (cost $49) | $49 | |
| Other affiliated issuers (cost $843,951,635) | 892,255,427 | |
| Total Investment in Securities (cost $843,951,684) | | $892,255,476 |
| Cash | | 507 |
| Receivable for investments sold | | 5,328,896 |
| Receivable for fund shares sold | | 976,105 |
| Total assets | | 898,560,984 |
| Liabilities | | |
| Payable for investments purchased | $5,885,301 | |
| Payable for fund shares redeemed | 178,298 | |
| Accrued management fee | 253,473 | |
| Distribution and service plan fees payable | 1,164 | |
| Total liabilities | | 6,318,236 |
| Net Assets | | $892,242,748 |
| Net Assets consist of: | | |
| Paid in capital | | $825,158,883 |
| Total accumulated earnings (loss) | | 67,083,865 |
| Net Assets | | $892,242,748 |
| Net Asset Value and Maximum Offering Price | | |
| Class A: | | |
| Net Asset Value and redemption price per share ($1,582,139 ÷ 150,512 shares)(a) | | $10.51 |
| Maximum offering price per share (100/94.25 of $10.51) | | $11.15 |
| Class M: | | |
| Net Asset Value and redemption price per share ($498,253 ÷ 47,477 shares)(a) | | $10.49 |
| Maximum offering price per share (100/96.50 of $10.49) | | $10.87 |
| Class C: | | |
| Net Asset Value and offering price per share ($842,917 ÷ 80,716 shares)(a) | | $10.44 |
| Fidelity Freedom Blend 2035 Fund: | | |
| Net Asset Value, offering price and redemption price per share ($23,400,232 ÷ 2,221,975 shares) | | $10.53 |
| Class K: | | |
| Net Asset Value, offering price and redemption price per share ($17,211,452 ÷ 1,632,468 shares) | | $10.54 |
| Class K6: | | |
| Net Asset Value, offering price and redemption price per share ($832,891,737 ÷ 78,837,962 shares) | | $10.56 |
| Class I: | | |
| Net Asset Value, offering price and redemption price per share ($12,328,862 ÷ 1,171,301 shares) | | $10.53 |
| Class Z: | | |
| Net Asset Value, offering price and redemption price per share ($286,578 ÷ 27,159 shares) | | $10.55 |
| Class Z6: | | |
| Net Asset Value, offering price and redemption price per share ($3,200,578 ÷ 303,139 shares) | | $10.56 |
(a) Redemption price per share is equal to net asset value less any applicable contingent deferred sales charge.
See accompanying notes which are an integral part of the financial statements.
Statement of Operations
| | | Six months ended September 30, 2020 (Unaudited) |
| Investment Income | | |
| Dividends: | | |
| Affiliated issuers | | $2,890,994 |
| Expenses | | |
| Management fee | $1,358,432 | |
| Distribution and service plan fees | 5,119 | |
| Independent trustees' fees and expenses | 1,030 | |
| Total expenses before reductions | 1,364,581 | |
| Expense reductions | (61) | |
| Total expenses after reductions | | 1,364,520 |
| Net investment income (loss) | | 1,526,474 |
| Realized and Unrealized Gain (Loss) | | |
| Net realized gain (loss) on: | | |
| Investment securities: | | |
| Affiliated issuers | 1,943,085 | |
| Capital gain distributions from underlying funds: | | |
| Affiliated issuers | 19,390,086 | |
| Total net realized gain (loss) | | 21,333,171 |
| Change in net unrealized appreciation (depreciation) on: | | |
| Investment securities: | | |
| Affiliated issuers | 147,354,163 | |
| Total change in net unrealized appreciation (depreciation) | | 147,354,163 |
| Net gain (loss) | | 168,687,334 |
| Net increase (decrease) in net assets resulting from operations | | $170,213,808 |
See accompanying notes which are an integral part of the financial statements.
Statement of Changes in Net Assets
| | Six months ended September 30, 2020 (Unaudited) | Year ended March 31, 2020 |
| Increase (Decrease) in Net Assets | | |
| Operations | | |
| Net investment income (loss) | $1,526,474 | $11,474,916 |
| Net realized gain (loss) | 21,333,171 | 16,132,295 |
| Change in net unrealized appreciation (depreciation) | 147,354,163 | (100,716,270) |
| Net increase (decrease) in net assets resulting from operations | 170,213,808 | (73,109,059) |
| Distributions to shareholders | (8,636,201) | (23,043,735) |
| Share transactions - net increase (decrease) | 118,000,903 | 683,771,373 |
| Total increase (decrease) in net assets | 279,578,510 | 587,618,579 |
| Net Assets | | |
| Beginning of period | 612,664,238 | 25,045,659 |
| End of period | $892,242,748 | $612,664,238 |
See accompanying notes which are an integral part of the financial statements.
Financial Highlights
Fidelity Freedom Blend 2035 Fund Class A
| | Six months ended (Unaudited) September 30, | Years endedMarch 31, | |
| | 2020 | 2020 | 2019 A |
| Selected Per–Share Data | | | |
| Net asset value, beginning of period | $8.46 | $9.60 | $10.00 |
| Income from Investment Operations | | | |
| Net investment income (loss)B | –C | .15 | –C |
| Net realized and unrealized gain (loss) | 2.15 | (.94) | (.15) |
| Total from investment operations | 2.15 | (.79) | (.15) |
| Distributions from net investment income | – | (.17) | (.14) |
| Distributions from net realized gain | (.10) | (.19) | (.12) |
| Total distributions | (.10) | (.35)D | (.25)D |
| Net asset value, end of period | $10.51 | $8.46 | $9.60 |
| Total ReturnE,F,G | 25.64% | (8.89)% | (1.18)% |
| Ratios to Average Net AssetsH | | | |
| Expenses before reductions | .78%I | .78% | .79%I,J |
| Expenses net of fee waivers, if any | .78%I | .78% | .79%I,J |
| Expenses net of all reductions | .77%I | .78% | .79%I,J |
| Net investment income (loss) | (.05)%I | 1.52% | .09%I |
| Supplemental Data | | | |
| Net assets, end of period (000 omitted) | $1,582 | $790 | $357 |
| Portfolio turnover rateK | 28%I | 31% | 16%I |
A For the period August 31, 2018 (commencement of operations) to March 31, 2019.
B Calculated based on average shares outstanding during the period.
C Amount represents less than $.005 per share.
D Total distributions per share do not sum due to rounding.
E Total returns for periods of less than one year are not annualized.
F Total returns would have been lower if certain expenses had not been reduced during the applicable periods shown.
G Total returns do not include the effect of the sales charges.
H Expense ratios reflect operating expenses of the class. Expenses before reductions do not reflect amounts reimbursed, waived, or reduced through arrangements with the investment adviser, brokerage services, or other offset arrangements, if applicable, and do not represent the amount paid by the class during periods when reimbursements, waivers or reductions occur.
I Annualized
J On certain classes, the size and fluctuation of net assets and expense amounts may cause ratios to differ from contractual rates.
K Amount does not include the portfolio activity of any underlying mutual funds or exchange-traded funds (ETFs).
See accompanying notes which are an integral part of the financial statements.
Fidelity Freedom Blend 2035 Fund Class M
| | Six months ended (Unaudited) September 30, | Years endedMarch 31, | |
| | 2020 | 2020 | 2019 A |
| Selected Per–Share Data | | | |
| Net asset value, beginning of period | $8.46 | $9.59 | $10.00 |
| Income from Investment Operations | | | |
| Net investment income (loss)B | (.02) | .13 | (.01) |
| Net realized and unrealized gain (loss) | 2.15 | (.94) | (.15) |
| Total from investment operations | 2.13 | (.81) | (.16) |
| Distributions from net investment income | – | (.14) | (.13) |
| Distributions from net realized gain | (.10) | (.19) | (.12) |
| Total distributions | (.10) | (.32)C | (.25) |
| Net asset value, end of period | $10.49 | $8.46 | $9.59 |
| Total ReturnD,E | 25.34% | (9.06)% | (1.30)% |
| Ratios to Average Net AssetsF | | | |
| Expenses before reductions | 1.03%G | 1.03% | 1.03%G |
| Expenses net of fee waivers, if any | 1.03%G | 1.03% | 1.03%G |
| Expenses net of all reductions | 1.03%G | 1.03% | 1.03%G |
| Net investment income (loss) | (.31)%G | 1.27% | (.16)%G |
| Supplemental Data | | | |
| Net assets, end of period (000 omitted) | $498 | $291 | $177 |
| Portfolio turnover rateH | 28%G | 31% | 16%G |
A For the period August 31, 2018 (commencement of operations) to March 31, 2019.
B Calculated based on average shares outstanding during the period.
C Total distributions per share do not sum due to rounding.
D Total returns for periods of less than one year are not annualized.
E Total returns do not include the effect of the sales charges.
F Expense ratios reflect operating expenses of the class. Expenses before reductions do not reflect amounts reimbursed, waived, or reduced through arrangements with the investment adviser, brokerage services, or other offset arrangements, if applicable, and do not represent the amount paid by the class during periods when reimbursements, waivers or reductions occur.
G Annualized
H Amount does not include the portfolio activity of any underlying mutual funds or exchange-traded funds (ETFs).
See accompanying notes which are an integral part of the financial statements.
Fidelity Freedom Blend 2035 Fund Class C
| | Six months ended (Unaudited) September 30, | Years endedMarch 31, | |
| | 2020 | 2020 | 2019 A |
| Selected Per–Share Data | | | |
| Net asset value, beginning of period | $8.44 | $9.59 | $10.00 |
| Income from Investment Operations | | | |
| Net investment income (loss)B | (.04) | .08 | (.04) |
| Net realized and unrealized gain (loss) | 2.14 | (.94) | (.14) |
| Total from investment operations | 2.10 | (.86) | (.18) |
| Distributions from net investment income | – | (.10) | (.11) |
| Distributions from net realized gain | (.10) | (.19) | (.12) |
| Total distributions | (.10) | (.29) | (.23) |
| Net asset value, end of period | $10.44 | $8.44 | $9.59 |
| Total ReturnC,D | 25.04% | (9.54)% | (1.56)% |
| Ratios to Average Net AssetsE | | | |
| Expenses before reductions | 1.54%F,G | 1.53% | 1.54%F,G |
| Expenses net of fee waivers, if any | 1.54%F,G | 1.53% | 1.54%F,G |
| Expenses net of all reductions | 1.54%F,G | 1.53% | 1.54%F,G |
| Net investment income (loss) | (.81)%F | .77% | (.67)%F |
| Supplemental Data | | | |
| Net assets, end of period (000 omitted) | $843 | $274 | $207 |
| Portfolio turnover rateH | 28%F | 31% | 16%F |
A For the period August 31, 2018 (commencement of operations) to March 31, 2019.
B Calculated based on average shares outstanding during the period.
C Total returns for periods of less than one year are not annualized.
D Total returns do not include the effect of the contingent deferred sales charge.
E Expense ratios reflect operating expenses of the class. Expenses before reductions do not reflect amounts reimbursed, waived, or reduced through arrangements with the investment adviser, brokerage services, or other offset arrangements, if applicable, and do not represent the amount paid by the class during periods when reimbursements, waivers or reductions occur.
F Annualized
G On certain classes, the size and fluctuation of net assets and expense amounts may cause ratios to differ from contractual rates.
H Amount does not include the portfolio activity of any underlying mutual funds or exchange-traded funds (ETFs).
See accompanying notes which are an integral part of the financial statements.
Fidelity Freedom Blend 2035 Fund
| | Six months ended (Unaudited) September 30, | Years endedMarch 31, | |
| | 2020 | 2020 | 2019 A |
| Selected Per–Share Data | | | |
| Net asset value, beginning of period | $8.48 | $9.61 | $10.00 |
| Income from Investment Operations | | | |
| Net investment income (loss)B | .01 | .17 | .02 |
| Net realized and unrealized gain (loss) | 2.16 | (.94) | (.15) |
| Total from investment operations | 2.17 | (.77) | (.13) |
| Distributions from net investment income | – | (.18) | (.15) |
| Distributions from net realized gain | (.12) | (.19) | (.12) |
| Total distributions | (.12) | (.36)C | (.26)C |
| Net asset value, end of period | $10.53 | $8.48 | $9.61 |
| Total ReturnD | 25.73% | (8.68)% | (.96)% |
| Ratios to Average Net AssetsE | | | |
| Expenses before reductions | .53%F | .54%G | .53%F |
| Expenses net of fee waivers, if any | .53%F | .54%G | .53%F |
| Expenses net of all reductions | .53%F | .54%G | .53%F |
| Net investment income (loss) | .19%F | 1.76% | .34%F |
| Supplemental Data | | | |
| Net assets, end of period (000 omitted) | $23,400 | $14,672 | $984 |
| Portfolio turnover rateH | 28%F | 31% | 16%F |
A For the period August 31, 2018 (commencement of operations) to March 31, 2019.
B Calculated based on average shares outstanding during the period.
C Total distributions per share do not sum due to rounding.
D Total returns for periods of less than one year are not annualized.
E Expense ratios reflect operating expenses of the class. Expenses before reductions do not reflect amounts reimbursed, waived, or reduced through arrangements with the investment adviser, brokerage services, or other offset arrangements, if applicable, and do not represent the amount paid by the class during periods when reimbursements, waivers or reductions occur.
F Annualized
G On certain classes, the size and fluctuation of net assets and expense amounts may cause ratios to differ from contractual rates.
H Amount does not include the portfolio activity of any underlying mutual funds or exchange-traded funds (ETFs).
See accompanying notes which are an integral part of the financial statements.
Fidelity Freedom Blend 2035 Fund Class K
| | Six months ended (Unaudited) September 30, | Years endedMarch 31, | |
| | 2020 | 2020 | 2019 A |
| Selected Per–Share Data | | | |
| Net asset value, beginning of period | $8.48 | $9.61 | $10.00 |
| Income from Investment Operations | | | |
| Net investment income (loss)B | .01 | .19 | .02 |
| Net realized and unrealized gain (loss) | 2.16 | (.94) | (.15) |
| Total from investment operations | 2.17 | (.75) | (.13) |
| Distributions from net investment income | – | (.19) | (.15) |
| Distributions from net realized gain | (.11) | (.19) | (.12) |
| Total distributions | (.11) | (.38) | (.26)C |
| Net asset value, end of period | $10.54 | $8.48 | $9.61 |
| Total ReturnD | 25.82% | (8.56)% | (.97)% |
| Ratios to Average Net AssetsE | | | |
| Expenses before reductions | .43%F | .43% | .43%F |
| Expenses net of fee waivers, if any | .43%F | .43% | .43%F |
| Expenses net of all reductions | .43%F | .43% | .43%F |
| Net investment income (loss) | .29%F | 1.87% | .44%F |
| Supplemental Data | | | |
| Net assets, end of period (000 omitted) | $17,211 | $16,000 | $99 |
| Portfolio turnover rateG | 28%F | 31% | 16%F |
A For the period August 31, 2018 (commencement of operations) to March 31, 2019.
B Calculated based on average shares outstanding during the period.
C Total distributions per share do not sum due to rounding.
D Total returns for periods of less than one year are not annualized.
E Expense ratios reflect operating expenses of the class. Expenses before reductions do not reflect amounts reimbursed, waived, or reduced through arrangements with the investment adviser, brokerage services, or other offset arrangements, if applicable, and do not represent the amount paid by the class during periods when reimbursements, waivers or reductions occur.
F Annualized
G Amount does not include the portfolio activity of any underlying mutual funds or exchange-traded funds (ETFs).
See accompanying notes which are an integral part of the financial statements.
Fidelity Freedom Blend 2035 Fund Class K6
| | Six months ended (Unaudited) September 30, | Years endedMarch 31, | |
| | 2020 | 2020 | 2019 A |
| Selected Per–Share Data | | | |
| Net asset value, beginning of period | $8.50 | $9.61 | $10.00 |
| Income from Investment Operations | | | |
| Net investment income (loss)B | .02 | .20 | .03 |
| Net realized and unrealized gain (loss) | 2.16 | (.94) | (.15) |
| Total from investment operations | 2.18 | (.74) | (.12) |
| Distributions from net investment income | – | (.18) | (.15) |
| Distributions from net realized gain | (.12) | (.19) | (.12) |
| Total distributions | (.12) | (.37) | (.27) |
| Net asset value, end of period | $10.56 | $8.50 | $9.61 |
| Total ReturnC | 25.80% | (8.41)% | (.93)% |
| Ratios to Average Net AssetsD | | | |
| Expenses before reductions | .33%E | .33% | .34%E,F |
| Expenses net of fee waivers, if any | .33%E | .33% | .34%E,F |
| Expenses net of all reductions | .33%E | .33% | .34%E,F |
| Net investment income (loss) | .39%E | 1.97% | .54%E |
| Supplemental Data | | | |
| Net assets, end of period (000 omitted) | $832,892 | $572,455 | $22,910 |
| Portfolio turnover rateG | 28%E | 31% | 16%E |
A For the period August 31, 2018 (commencement of operations) to March 31, 2019.
B Calculated based on average shares outstanding during the period.
C Total returns for periods of less than one year are not annualized.
D Expense ratios reflect operating expenses of the class. Expenses before reductions do not reflect amounts reimbursed, waived, or reduced through arrangements with the investment adviser, brokerage services, or other offset arrangements, if applicable, and do not represent the amount paid by the class during periods when reimbursements, waivers or reductions occur.
E Annualized
F On certain classes, the size and fluctuation of net assets and expense amounts may cause ratios to differ from contractual rates.
G Amount does not include the portfolio activity of any underlying mutual funds or exchange-traded funds (ETFs).
See accompanying notes which are an integral part of the financial statements.
Fidelity Freedom Blend 2035 Fund Class I
| | Six months ended (Unaudited) September 30, | Years endedMarch 31, | |
| | 2020 | 2020 | 2019 A |
| Selected Per–Share Data | | | |
| Net asset value, beginning of period | $8.48 | $9.61 | $10.00 |
| Income from Investment Operations | | | |
| Net investment income (loss)B | .01 | .18 | .02 |
| Net realized and unrealized gain (loss) | 2.16 | (.94) | (.15) |
| Total from investment operations | 2.17 | (.76) | (.13) |
| Distributions from net investment income | – | (.19) | (.14) |
| Distributions from net realized gain | (.12) | (.19) | (.12) |
| Total distributions | (.12) | (.37)C | (.26) |
| Net asset value, end of period | $10.53 | $8.48 | $9.61 |
| Total ReturnD | 25.75% | (8.60)% | (1.01)% |
| Ratios to Average Net AssetsE | | | |
| Expenses before reductions | .53%F | .54%G | .53%F |
| Expenses net of fee waivers, if any | .53%F | .54%G | .53%F |
| Expenses net of all reductions | .53%F | .54%G | .53%F |
| Net investment income (loss) | .19%F | 1.76% | .34%F |
| Supplemental Data | | | |
| Net assets, end of period (000 omitted) | $12,329 | $5,807 | $108 |
| Portfolio turnover rateH | 28%F | 31% | 16%F |
A For the period August 31, 2018 (commencement of operations) to March 31, 2019.
B Calculated based on average shares outstanding during the period.
C Total distributions per share do not sum due to rounding.
D Total returns for periods of less than one year are not annualized.
E Expense ratios reflect operating expenses of the class. Expenses before reductions do not reflect amounts reimbursed, waived, or reduced through arrangements with the investment adviser, brokerage services, or other offset arrangements, if applicable, and do not represent the amount paid by the class during periods when reimbursements, waivers or reductions occur.
F Annualized
G On certain classes, the size and fluctuation of net assets and expense amounts may cause ratios to differ from contractual rates.
H Amount does not include the portfolio activity of any underlying mutual funds or exchange-traded funds (ETFs).
See accompanying notes which are an integral part of the financial statements.
Fidelity Freedom Blend 2035 Fund Class Z
| | Six months ended (Unaudited) September 30, | Years endedMarch 31, | |
| | 2020 | 2020 | 2019 A |
| Selected Per–Share Data | | | |
| Net asset value, beginning of period | $8.49 | $9.61 | $10.00 |
| Income from Investment Operations | | | |
| Net investment income (loss)B | .01 | .19 | .02 |
| Net realized and unrealized gain (loss) | 2.16 | (.94) | (.15) |
| Total from investment operations | 2.17 | (.75) | (.13) |
| Distributions from net investment income | – | (.18) | (.15) |
| Distributions from net realized gain | (.11) | (.19) | (.12) |
| Total distributions | (.11) | (.37) | (.26)C |
| Net asset value, end of period | $10.55 | $8.49 | $9.61 |
| Total ReturnD | 25.79% | (8.52)% | (.97)% |
| Ratios to Average Net AssetsE | | | |
| Expenses before reductions | .43%F | .43% | .43%F |
| Expenses net of fee waivers, if any | .43%F | .43% | .43%F |
| Expenses net of all reductions | .43%F | .43% | .43%F |
| Net investment income (loss) | .29%F | 1.87% | .44%F |
| Supplemental Data | | | |
| Net assets, end of period (000 omitted) | $287 | $228 | $103 |
| Portfolio turnover rateG | 28%F | 31% | 16%F |
A For the period August 31, 2018 (commencement of operations) to March 31, 2019.
B Calculated based on average shares outstanding during the period.
C Total distributions per share do not sum due to rounding.
D Total returns for periods of less than one year are not annualized.
E Expense ratios reflect operating expenses of the class. Expenses before reductions do not reflect amounts reimbursed, waived, or reduced through arrangements with the investment adviser, brokerage services, or other offset arrangements, if applicable, and do not represent the amount paid by the class during periods when reimbursements, waivers or reductions occur.
F Annualized
G Amount does not include the portfolio activity of any underlying mutual funds or exchange-traded funds (ETFs).
See accompanying notes which are an integral part of the financial statements.
Fidelity Freedom Blend 2035 Fund Class Z6
| | Six months ended (Unaudited) September 30, | Years endedMarch 31, | |
| | 2020 | 2020 | 2019 A |
| Selected Per–Share Data | | | |
| Net asset value, beginning of period | $8.50 | $9.62 | $10.00 |
| Income from Investment Operations | | | |
| Net investment income (loss)B | .02 | .18 | .03 |
| Net realized and unrealized gain (loss) | 2.16 | (.93) | (.14) |
| Total from investment operations | 2.18 | (.75) | (.11) |
| Distributions from net investment income | – | (.19) | (.15) |
| Distributions from net realized gain | (.12) | (.19) | (.12) |
| Total distributions | (.12) | (.37)C | (.27) |
| Net asset value, end of period | $10.56 | $8.50 | $9.62 |
| Total ReturnD | 25.85% | (8.48)% | (.83)% |
| Ratios to Average Net AssetsE | | | |
| Expenses before reductions | .33%F | .34%G | .33%F |
| Expenses net of fee waivers, if any | .33%F | .34%G | .33%F |
| Expenses net of all reductions | .33%F | .34%G | .33%F |
| Net investment income (loss) | .39%F | 1.96% | .54%F |
| Supplemental Data | | | |
| Net assets, end of period (000 omitted) | $3,201 | $2,148 | $99 |
| Portfolio turnover rateH | 28%F | 31% | 16%F |
A For the period August 31, 2018 (commencement of operations) to March 31, 2019.
B Calculated based on average shares outstanding during the period.
C Total distributions per share do not sum due to rounding.
D Total returns for periods of less than one year are not annualized.
E Expense ratios reflect operating expenses of the class. Expenses before reductions do not reflect amounts reimbursed, waived, or reduced through arrangements with the investment adviser, brokerage services, or other offset arrangements, if applicable, and do not represent the amount paid by the class during periods when reimbursements, waivers or reductions occur.
F Annualized
G On certain classes, the size and fluctuation of net assets and expense amounts may cause ratios to differ from contractual rates.
H Amount does not include the portfolio activity of any underlying mutual funds or exchange-traded funds (ETFs).
See accompanying notes which are an integral part of the financial statements.
Fidelity Freedom® Blend 2040 Fund
Investment Summary (Unaudited)
The information in the following tables is based on the direct investments of the Fund.
Top Holdings as of September 30, 2020
| | % of fund's net assets |
| Fidelity Series Large Cap Value Index Fund | 14.4 |
| Fidelity Series Emerging Markets Opportunities Fund | 14.0 |
| Fidelity Series Blue Chip Growth Fund | 11.1 |
| Fidelity Series Large Cap Stock Fund | 7.6 |
| Fidelity Series Large Cap Growth Index Fund | 7.1 |
| Fidelity Series International Growth Fund | 6.1 |
| Fidelity Series Overseas Fund | 6.1 |
| Fidelity Series International Value Fund | 6.1 |
| Fidelity Series Value Discovery Fund | 5.3 |
| Fidelity Series Small Cap Opportunities Fund | 3.6 |
| | 81.4 |
Asset Allocation (% of fund's net assets)
| Period end |
| | Domestic Equity Funds | 51.6% |
| | International Equity Funds | 40.8% |
| | Bond Funds | 6.2% |
| | Short-Term Funds | 1.4% |

Domestic Equity Funds category includes Fidelity Series Commodity Strategy Fund which invests in commodity-related investments.
Fidelity Freedom® Blend 2040 Fund
Schedule of Investments September 30, 2020 (Unaudited)
Showing Percentage of Net Assets
| Domestic Equity Funds - 51.6% | | | |
| | | Shares | Value |
| Fidelity Series Blue Chip Growth Fund (a) | | 5,287,052 | $87,289,231 |
| Fidelity Series Commodity Strategy Fund (a) | | 4,784,512 | 19,903,570 |
| Fidelity Series Large Cap Growth Index Fund (a) | | 3,924,284 | 55,881,804 |
| Fidelity Series Large Cap Stock Fund (a) | | 4,251,483 | 60,201,001 |
| Fidelity Series Large Cap Value Index Fund (a) | | 9,816,144 | 113,867,268 |
| Fidelity Series Small Cap Opportunities Fund (a) | | 2,245,319 | 28,650,270 |
| Fidelity Series Value Discovery Fund (a) | | 3,344,388 | 41,336,641 |
| TOTAL DOMESTIC EQUITY FUNDS | | | |
| (Cost $392,236,096) | | | 407,129,785 |
|
| International Equity Funds - 40.8% | | | |
| Fidelity Series Canada Fund (a) | | 1,814,687 | 18,564,244 |
| Fidelity Series Emerging Markets Fund (a) | | 1,300,323 | 12,262,049 |
| Fidelity Series Emerging Markets Opportunities Fund (a) | | 5,251,439 | 110,175,200 |
| Fidelity Series International Growth Fund (a) | | 2,568,010 | 48,227,226 |
| Fidelity Series International Index Fund (a) | | 2,003,234 | 19,912,145 |
| Fidelity Series International Small Cap Fund (a) | | 954,589 | 16,991,692 |
| Fidelity Series International Value Fund (a) | | 5,553,041 | 47,867,209 |
| Fidelity Series Overseas Fund (a) | | 4,307,419 | 48,156,949 |
| TOTAL INTERNATIONAL EQUITY FUNDS | | | |
| (Cost $297,155,409) | | | 322,156,714 |
|
| Bond Funds - 6.2% | | | |
| Fidelity Series Corporate Bond Fund (a) | | 8,173 | 91,944 |
| Fidelity Series Emerging Markets Debt Fund (a) | | 532,676 | 4,826,048 |
| Fidelity Series Floating Rate High Income Fund (a) | | 119,268 | 1,055,525 |
| Fidelity Series Government Bond Index Fund (a) | | 9,770 | 109,907 |
| Fidelity Series High Income Fund (a) | | 591,948 | 5,398,570 |
| Fidelity Series Inflation-Protected Bond Index Fund (a) | | 1,495,482 | 16,001,658 |
| Fidelity Series Investment Grade Bond Fund (a) | | 10,005 | 122,458 |
| Fidelity Series Investment Grade Securitized Fund (a) | | 7,812 | 83,350 |
| Fidelity Series Long-Term Treasury Bond Index Fund (a) | | 1,765,600 | 18,238,647 |
| Fidelity Series Real Estate Income Fund (a) | | 321,146 | 3,205,041 |
| TOTAL BOND FUNDS | | | |
| (Cost $46,959,559) | | | 49,133,148 |
|
| Short-Term Funds - 1.4% | | | |
| Fidelity Series Government Money Market Fund 0.16% (a)(b) | | 1,168,073 | 1,168,073 |
| Fidelity Series Short-Term Credit Fund (a) | | 135,281 | 1,386,630 |
| Fidelity Series Treasury Bill Index Fund (a) | | 842,161 | 8,430,036 |
| TOTAL SHORT-TERM FUNDS | | | |
| (Cost $10,953,039) | | | 10,984,739 |
| TOTAL INVESTMENT IN SECURITIES - 100.0% | | | |
| (Cost $747,304,103) | | | 789,404,386 |
| NET OTHER ASSETS (LIABILITIES) - 0.0% | | | (12,141) |
| NET ASSETS - 100% | | | $789,392,245 |
Legend
(a) Affiliated Fund
(b) The rate quoted is the annualized seven-day yield of the fund at period end.
Affiliated Underlying Funds
Fiscal year to date information regarding the Fund's investments in affiliated Underlying Funds, excluding any Money Market Central Funds, is presented below. Exchanges between classes of the same affiliated Underlying Funds may occur.
| Affiliate | Value, beginning of period | Purchases | Sales Proceeds | Dividend Income | Realized Gain (loss) | Change in Unrealized appreciation (depreciation) | Value, end of period |
| Fidelity Series Blue Chip Growth Fund | $53,295,544 | $31,900,981 | $15,260,259 | $17,284,371 | $2,055,103 | $15,297,862 | $87,289,231 |
| Fidelity Series Canada Fund | 12,765,429 | 3,898,108 | 1,276,601 | -- | (138,098) | 3,315,406 | 18,564,244 |
| Fidelity Series Commodity Strategy Fund | 18,602,659 | 3,537,611 | 4,557,691 | 84,268 | (763,586) | 3,084,577 | 19,903,570 |
| Fidelity Series Corporate Bond Fund | 164,811 | 33,659 | 112,602 | 1,158 | (9,514) | 15,590 | 91,944 |
| Fidelity Series Emerging Markets Debt Fund | 3,735,342 | 698,010 | 100,321 | 119,616 | 1,387 | 491,630 | 4,826,048 |
| Fidelity Series Emerging Markets Fund | 6,612,327 | 3,370,343 | 399,791 | -- | 3,655 | 2,675,515 | 12,262,049 |
| Fidelity Series Emerging Markets Opportunities Fund | 60,871,006 | 27,251,248 | 3,022,969 | -- | 36,645 | 25,039,270 | 110,175,200 |
| Fidelity Series Floating Rate High Income Fund | 829,033 | 161,974 | 24,271 | 22,039 | 261 | 88,528 | 1,055,525 |
| Fidelity Series Government Bond Index Fund | 251,199 | 28,492 | 169,887 | 725 | (152) | 255 | 109,907 |
| Fidelity Series Government Money Market Fund 0.16% | 5,078,540 | 6,091,393 | 10,001,860 | 3,686 | -- | -- | 1,168,073 |
| Fidelity Series High Income Fund | 4,206,121 | 837,991 | 121,356 | 138,319 | 1,353 | 474,461 | 5,398,570 |
| Fidelity Series Inflation-Protected Bond Index Fund | 12,505,366 | 4,543,033 | 1,860,045 | 10,954 | (9,157) | 822,461 | 16,001,658 |
| Fidelity Series International Growth Fund | 37,076,431 | 7,825,707 | 7,873,118 | -- | 272,298 | 10,925,908 | 48,227,226 |
| Fidelity Series International Index Fund | 14,568,713 | 3,245,966 | 1,169,105 | -- | (49,998) | 3,316,569 | 19,912,145 |
| Fidelity Series International Small Cap Fund | 11,048,153 | 2,438,139 | 412,019 | -- | 42,067 | 3,875,352 | 16,991,692 |
| Fidelity Series International Value Fund | 35,647,691 | 8,726,206 | 4,359,849 | -- | (146,081) | 7,999,242 | 47,867,209 |
| Fidelity Series Investment Grade Bond Fund | 248,523 | 37,618 | 168,983 | 1,356 | (6,458) | 11,758 | 122,458 |
| Fidelity Series Investment Grade Securitized Fund | 172,200 | 28,253 | 117,768 | 442 | 2 | 663 | 83,350 |
| Fidelity Series Large Cap Growth Index Fund | 39,786,276 | 9,153,022 | 10,541,626 | 958,928 | 1,219,380 | 16,264,752 | 55,881,804 |
| Fidelity Series Large Cap Stock Fund | 41,404,147 | 13,987,390 | 2,916,861 | 2,051,386 | (90,129) | 7,816,454 | 60,201,001 |
| Fidelity Series Large Cap Value Index Fund | 76,703,329 | 23,928,214 | 3,446,040 | -- | (95,543) | 16,777,308 | 113,867,268 |
| Fidelity Series Long-Term Treasury Bond Index Fund | 14,013,171 | 7,170,999 | 2,504,395 | 384,341 | 175,169 | (616,297) | 18,238,647 |
| Fidelity Series Overseas Fund | 35,484,619 | 9,317,656 | 7,477,149 | -- | (369,994) | 11,201,817 | 48,156,949 |
| Fidelity Series Real Estate Income Fund | 2,292,455 | 537,551 | 76,068 | 99,072 | 765 | 450,338 | 3,205,041 |
| Fidelity Series Short-Term Credit Fund | 1,321,969 | 15,081 | -- | 15,082 | -- | 49,580 | 1,386,630 |
| Fidelity Series Small Cap Opportunities Fund | 20,518,813 | 4,978,399 | 2,108,233 | 171,122 | (347,812) | 5,609,103 | 28,650,270 |
| Fidelity Series Treasury Bill Index Fund | 14,573,808 | 154,775 | 6,250,519 | 55,824 | (17,819) | (30,209) | 8,430,036 |
| Fidelity Series Value Discovery Fund | 24,063,777 | 11,726,729 | 783,818 | -- | 16,871 | 6,313,082 | 41,336,641 |
| | 547,841,452 | 185,624,548 | 87,113,204 | 21,402,689 | 1,780,615 | 141,270,975 | 789,404,386 |
Amounts in the income column in the above table include any capital gain distributions from underlying funds, which are presented in the corresponding line-item in the Statement of Operations, if applicable.
Investment Valuation
The following is a summary of the inputs used, as of September 30, 2020, involving the Fund's assets and liabilities carried at fair value. The inputs or methodology used for valuing securities may not be an indication of the risk associated with investing in those securities. For more information on valuation inputs, and their aggregation into the levels used below, please refer to the Investment Valuation section in the accompanying Notes to Financial Statements.
| | Valuation Inputs at Reporting Date: |
| Description | Total | Level 1 | Level 2 | Level 3 |
| Investments in Securities: | | | | |
| Domestic Equity Funds | $407,129,785 | $407,129,785 | $-- | $-- |
| International Equity Funds | 322,156,714 | 322,156,714 | -- | -- |
| Bond Funds | 49,133,148 | 49,133,148 | -- | -- |
| Short-Term Funds | 10,984,739 | 10,984,739 | -- | -- |
| Total Investments in Securities: | $789,404,386 | $789,404,386 | $-- | $-- |
See accompanying notes which are an integral part of the financial statements.
Fidelity Freedom® Blend 2040 Fund
Financial Statements
Statement of Assets and Liabilities
| | | September 30, 2020 (Unaudited) |
| Assets | | |
Investment in securities, at value — See accompanying schedule:
| | |
| Affiliated issuers (cost $747,304,103) | $789,404,386 | |
| Total Investment in Securities (cost $747,304,103) | | $789,404,386 |
| Cash | | 255 |
| Receivable for investments sold | | 5,072,892 |
| Receivable for fund shares sold | | 910,765 |
| Total assets | | 795,388,298 |
| Liabilities | | |
| Payable for investments purchased | $5,331,822 | |
| Payable for fund shares redeemed | 431,621 | |
| Accrued management fee | 231,210 | |
| Distribution and service plan fees payable | 1,400 | |
| Total liabilities | | 5,996,053 |
| Net Assets | | $789,392,245 |
| Net Assets consist of: | | |
| Paid in capital | | $728,691,458 |
| Total accumulated earnings (loss) | | 60,700,787 |
| Net Assets | | $789,392,245 |
| Net Asset Value and Maximum Offering Price | | |
| Class A: | | |
| Net Asset Value and redemption price per share ($1,604,835 ÷ 153,566 shares)(a) | | $10.45 |
| Maximum offering price per share (100/94.25 of $10.45) | | $11.09 |
| Class M: | | |
| Net Asset Value and redemption price per share ($578,196 ÷ 55,347 shares)(a) | | $10.45 |
| Maximum offering price per share (100/96.50 of $10.45) | | $10.83 |
| Class C: | | |
| Net Asset Value and offering price per share ($1,003,235 ÷ 96,670 shares)(a) | | $10.38 |
| Fidelity Freedom Blend 2040 Fund: | | |
| Net Asset Value, offering price and redemption price per share ($22,185,102 ÷ 2,116,819 shares) | | $10.48 |
| Class K: | | |
| Net Asset Value, offering price and redemption price per share ($13,830,856 ÷ 1,317,590 shares) | | $10.50 |
| Class K6: | | |
| Net Asset Value, offering price and redemption price per share ($739,277,657 ÷ 70,277,856 shares) | | $10.52 |
| Class I: | | |
| Net Asset Value, offering price and redemption price per share ($9,102,262 ÷ 868,389 shares) | | $10.48 |
| Class Z: | | |
| Net Asset Value, offering price and redemption price per share ($113,581 ÷ 10,798 shares) | | $10.52 |
| Class Z6: | | |
| Net Asset Value, offering price and redemption price per share ($1,696,521 ÷ 161,201 shares) | | $10.52 |
(a) Redemption price per share is equal to net asset value less any applicable contingent deferred sales charge.
See accompanying notes which are an integral part of the financial statements.
Statement of Operations
| | | Six months ended September 30, 2020 (Unaudited) |
| Investment Income | | |
| Dividends: | | |
| Affiliated issuers | | $2,117,199 |
| Expenses | | |
| Management fee | $1,242,297 | |
| Distribution and service plan fees | 6,256 | |
| Independent trustees' fees and expenses | 917 | |
| Total expenses | | 1,249,470 |
| Net investment income (loss) | | 867,729 |
| Realized and Unrealized Gain (Loss) | | |
| Net realized gain (loss) on: | | |
| Investment securities: | | |
| Affiliated issuers | 1,780,615 | |
| Capital gain distributions from underlying funds: | | |
| Affiliated issuers | 19,285,490 | |
| Total net realized gain (loss) | | 21,066,105 |
| Change in net unrealized appreciation (depreciation) on: | | |
| Investment securities: | | |
| Affiliated issuers | 141,270,975 | |
| Total change in net unrealized appreciation (depreciation) | | 141,270,975 |
| Net gain (loss) | | 162,337,080 |
| Net increase (decrease) in net assets resulting from operations | | $163,204,809 |
See accompanying notes which are an integral part of the financial statements.
Statement of Changes in Net Assets
| | Six months ended September 30, 2020 (Unaudited) | Year ended March 31, 2020 |
| Increase (Decrease) in Net Assets | | |
| Operations | | |
| Net investment income (loss) | $867,729 | $10,143,182 |
| Net realized gain (loss) | 21,066,105 | 14,434,632 |
| Change in net unrealized appreciation (depreciation) | 141,270,975 | (100,419,627) |
| Net increase (decrease) in net assets resulting from operations | 163,204,809 | (75,841,813) |
| Distributions to shareholders | (7,700,929) | (20,176,064) |
| Share transactions - net increase (decrease) | 86,054,573 | 627,158,598 |
| Total increase (decrease) in net assets | 241,558,453 | 531,140,721 |
| Net Assets | | |
| Beginning of period | 547,833,792 | 16,693,071 |
| End of period | $789,392,245 | $547,833,792 |
See accompanying notes which are an integral part of the financial statements.
Financial Highlights
Fidelity Freedom Blend 2040 Fund Class A
| | Six months ended (Unaudited) September 30, | Years endedMarch 31, | |
| | 2020 | 2020 | 2019 A |
| Selected Per–Share Data | | | |
| Net asset value, beginning of period | $8.27 | $9.55 | $10.00 |
| Income from Investment Operations | | | |
| Net investment income (loss)B | (.01) | .15 | –C |
| Net realized and unrealized gain (loss) | 2.30 | (1.09) | (.17) |
| Total from investment operations | 2.29 | (.94) | (.17) |
| Distributions from net investment income | – | (.17) | (.14) |
| Distributions from net realized gain | (.11) | (.17) | (.14) |
| Total distributions | (.11) | (.34) | (.28) |
| Net asset value, end of period | $10.45 | $8.27 | $9.55 |
| Total ReturnD,E | 27.86% | (10.57)% | (1.39)% |
| Ratios to Average Net AssetsF | | | |
| Expenses before reductions | .79%G | .79% | .80%G,H |
| Expenses net of fee waivers, if any | .79%G | .79% | .80%G,H |
| Expenses net of all reductions | .79%G | .79% | .80%G,H |
| Net investment income (loss) | (.19)%G | 1.48% | .01%G |
| Supplemental Data | | | |
| Net assets, end of period (000 omitted) | $1,605 | $695 | $255 |
| Portfolio turnover rateI | 25%G | 27% | 17%G |
A For the period August 31, 2018 (commencement of operations) to March 31, 2019.
B Calculated based on average shares outstanding during the period.
C Amount represents less than $.005 per share.
D Total returns for periods of less than one year are not annualized.
E Total returns do not include the effect of the sales charges.
F Expense ratios reflect operating expenses of the class. Expenses before reductions do not reflect amounts reimbursed, waived, or reduced through arrangements with the investment adviser, brokerage services, or other offset arrangements, if applicable, and do not represent the amount paid by the class during periods when reimbursements, waivers or reductions occur.
G Annualized
H On certain classes, the size and fluctuation of net assets and expense amounts may cause ratios to differ from contractual rates.
I Amount does not include the portfolio activity of any underlying mutual funds or exchange-traded funds (ETFs).
See accompanying notes which are an integral part of the financial statements.
Fidelity Freedom Blend 2040 Fund Class M
| | Six months ended (Unaudited) September 30, | Years endedMarch 31, | |
| | 2020 | 2020 | 2019 A |
| Selected Per–Share Data | | | |
| Net asset value, beginning of period | $8.28 | $9.55 | $10.00 |
| Income from Investment Operations | | | |
| Net investment income (loss)B | (.02) | .12 | (.01) |
| Net realized and unrealized gain (loss) | 2.29 | (1.08) | (.18) |
| Total from investment operations | 2.27 | (.96) | (.19) |
| Distributions from net investment income | – | (.14) | (.12) |
| Distributions from net realized gain | (.10) | (.17) | (.14) |
| Total distributions | (.10) | (.31) | (.26) |
| Net asset value, end of period | $10.45 | $8.28 | $9.55 |
| Total ReturnC,D | 27.66% | (10.74)% | (1.59)% |
| Ratios to Average Net AssetsE | | | |
| Expenses before reductions | 1.04%F | 1.04% | 1.04%F |
| Expenses net of fee waivers, if any | 1.04%F | 1.04% | 1.04%F |
| Expenses net of all reductions | 1.04%F | 1.04% | 1.04%F |
| Net investment income (loss) | (.44)%F | 1.23% | (.23)%F |
| Supplemental Data | | | |
| Net assets, end of period (000 omitted) | $578 | $318 | $131 |
| Portfolio turnover rateG | 25%F | 27% | 17%F |
A For the period August 31, 2018 (commencement of operations) to March 31, 2019.
B Calculated based on average shares outstanding during the period.
C Total returns for periods of less than one year are not annualized.
D Total returns do not include the effect of the sales charges.
E Expense ratios reflect operating expenses of the class. Expenses before reductions do not reflect amounts reimbursed, waived, or reduced through arrangements with the investment adviser, brokerage services, or other offset arrangements, if applicable, and do not represent the amount paid by the class during periods when reimbursements, waivers or reductions occur.
F Annualized
G Amount does not include the portfolio activity of any underlying mutual funds or exchange-traded funds (ETFs).
See accompanying notes which are an integral part of the financial statements.
Fidelity Freedom Blend 2040 Fund Class C
| | Six months ended (Unaudited) September 30, | Years endedMarch 31, | |
| | 2020 | 2020 | 2019 A |
| Selected Per–Share Data | | | |
| Net asset value, beginning of period | $8.25 | $9.54 | $10.00 |
| Income from Investment Operations | | | |
| Net investment income (loss)B | (.05) | .07 | (.04) |
| Net realized and unrealized gain (loss) | 2.28 | (1.07) | (.18) |
| Total from investment operations | 2.23 | (1.00) | (.22) |
| Distributions from net investment income | – | (.12) | (.11) |
| Distributions from net realized gain | (.10) | (.17) | (.14) |
| Total distributions | (.10) | (.29) | (.24)C |
| Net asset value, end of period | $10.38 | $8.25 | $9.54 |
| Total ReturnD,E | 27.28% | (11.10)% | (1.88)% |
| Ratios to Average Net AssetsF | | | |
| Expenses before reductions | 1.55%G,H | 1.54% | 1.55%G,H |
| Expenses net of fee waivers, if any | 1.55%G,H | 1.54% | 1.55%G,H |
| Expenses net of all reductions | 1.55%G,H | 1.54% | 1.55%G,H |
| Net investment income (loss) | (.95)%G | .73% | (.74)%G |
| Supplemental Data | | | |
| Net assets, end of period (000 omitted) | $1,003 | $357 | $208 |
| Portfolio turnover rateI | 25%G | 27% | 17%G |
A For the period August 31, 2018 (commencement of operations) to March 31, 2019.
B Calculated based on average shares outstanding during the period.
C Total distributions per share do not sum due to rounding.
D Total returns for periods of less than one year are not annualized.
E Total returns do not include the effect of the contingent deferred sales charge.
F Expense ratios reflect operating expenses of the class. Expenses before reductions do not reflect amounts reimbursed, waived, or reduced through arrangements with the investment adviser, brokerage services, or other offset arrangements, if applicable, and do not represent the amount paid by the class during periods when reimbursements, waivers or reductions occur.
G Annualized
H On certain classes, the size and fluctuation of net assets and expense amounts may cause ratios to differ from contractual rates.
I Amount does not include the portfolio activity of any underlying mutual funds or exchange-traded funds (ETFs).
See accompanying notes which are an integral part of the financial statements.
Fidelity Freedom Blend 2040 Fund
| | Six months ended (Unaudited) September 30, | Years endedMarch 31, | |
| | 2020 | 2020 | 2019 A |
| Selected Per–Share Data | | | |
| Net asset value, beginning of period | $8.29 | $9.55 | $10.00 |
| Income from Investment Operations | | | |
| Net investment income (loss)B | –C | .16 | .01 |
| Net realized and unrealized gain (loss) | 2.30 | (1.06) | (.18) |
| Total from investment operations | 2.30 | (.90) | (.17) |
| Distributions from net investment income | – | (.18) | (.14) |
| Distributions from net realized gain | (.11) | (.17) | (.14) |
| Total distributions | (.11) | (.36)D | (.28) |
| Net asset value, end of period | $10.48 | $8.29 | $9.55 |
| Total ReturnE | 27.99% | (10.24)% | (1.35)% |
| Ratios to Average Net AssetsF | | | |
| Expenses before reductions | .54%G | .55%H | .54%G |
| Expenses net of fee waivers, if any | .54%G | .55%H | .54%G |
| Expenses net of all reductions | .54%G | .55%H | .54%G |
| Net investment income (loss) | .06%G | 1.72% | .27%G |
| Supplemental Data | | | |
| Net assets, end of period (000 omitted) | $22,185 | $15,147 | $590 |
| Portfolio turnover rateI | 25%G | 27% | 17%G |
A For the period August 31, 2018 (commencement of operations) to March 31, 2019.
B Calculated based on average shares outstanding during the period.
C Amount represents less than $.005 per share.
D Total distributions per share do not sum due to rounding.
E Total returns for periods of less than one year are not annualized.
F Expense ratios reflect operating expenses of the class. Expenses before reductions do not reflect amounts reimbursed, waived, or reduced through arrangements with the investment adviser, brokerage services, or other offset arrangements, if applicable, and do not represent the amount paid by the class during periods when reimbursements, waivers or reductions occur.
G Annualized
H On certain classes, the size and fluctuation of net assets and expense amounts may cause ratios to differ from contractual rates.
I Amount does not include the portfolio activity of any underlying mutual funds or exchange-traded funds (ETFs).
See accompanying notes which are an integral part of the financial statements.
Fidelity Freedom Blend 2040 Fund Class K
| | Six months ended (Unaudited) September 30, | Years endedMarch 31, | |
| | 2020 | 2020 | 2019 A |
| Selected Per–Share Data | | | |
| Net asset value, beginning of period | $8.30 | $9.57 | $10.00 |
| Income from Investment Operations | | | |
| Net investment income (loss)B | .01 | .18 | .02 |
| Net realized and unrealized gain (loss) | 2.30 | (1.08) | (.17) |
| Total from investment operations | 2.31 | (.90) | (.15) |
| Distributions from net investment income | – | (.19) | (.14) |
| Distributions from net realized gain | (.11) | (.17) | (.14) |
| Total distributions | (.11) | (.37)C | (.28) |
| Net asset value, end of period | $10.50 | $8.30 | $9.57 |
| Total ReturnD | 28.06% | (10.22)% | (1.19)% |
| Ratios to Average Net AssetsE | | | |
| Expenses before reductions | .44%F | .44% | .44%F |
| Expenses net of fee waivers, if any | .44%F | .44% | .44%F |
| Expenses net of all reductions | .44%F | .44% | .44%F |
| Net investment income (loss) | .16%F | 1.83% | .37%F |
| Supplemental Data | | | |
| Net assets, end of period (000 omitted) | $13,831 | $15,212 | $99 |
| Portfolio turnover rateG | 25%F | 27% | 17%F |
A For the period August 31, 2018 (commencement of operations) to March 31, 2019.
B Calculated based on average shares outstanding during the period.
C Total distributions per share do not sum due to rounding.
D Total returns for periods of less than one year are not annualized.
E Expense ratios reflect operating expenses of the class. Expenses before reductions do not reflect amounts reimbursed, waived, or reduced through arrangements with the investment adviser, brokerage services, or other offset arrangements, if applicable, and do not represent the amount paid by the class during periods when reimbursements, waivers or reductions occur.
F Annualized
G Amount does not include the portfolio activity of any underlying mutual funds or exchange-traded funds (ETFs).
See accompanying notes which are an integral part of the financial statements.
Fidelity Freedom Blend 2040 Fund Class K6
| | Six months ended (Unaudited) September 30, | Years endedMarch 31, | |
| | 2020 | 2020 | 2019 A |
| Selected Per–Share Data | | | |
| Net asset value, beginning of period | $8.32 | $9.57 | $10.00 |
| Income from Investment Operations | | | |
| Net investment income (loss)B | .01 | .19 | .02 |
| Net realized and unrealized gain (loss) | 2.30 | (1.08) | (.17) |
| Total from investment operations | 2.31 | (.89) | (.15) |
| Distributions from net investment income | – | (.18) | (.14) |
| Distributions from net realized gain | (.11) | (.18) | (.14) |
| Total distributions | (.11) | (.36) | (.28) |
| Net asset value, end of period | $10.52 | $8.32 | $9.57 |
| Total ReturnC | 28.04% | (10.07)% | (1.14)% |
| Ratios to Average Net AssetsD | | | |
| Expenses before reductions | .34%E | .34% | .35%E,F |
| Expenses net of fee waivers, if any | .34%E | .34% | .35%E,F |
| Expenses net of all reductions | .34%E | .34% | .35%E,F |
| Net investment income (loss) | .26%E | 1.93% | .46%E |
| Supplemental Data | | | |
| Net assets, end of period (000 omitted) | $739,278 | $510,439 | $14,956 |
| Portfolio turnover rateG | 25%E | 27% | 17%E |
A For the period August 31, 2018 (commencement of operations) to March 31, 2019.
B Calculated based on average shares outstanding during the period.
C Total returns for periods of less than one year are not annualized.
D Expense ratios reflect operating expenses of the class. Expenses before reductions do not reflect amounts reimbursed, waived, or reduced through arrangements with the investment adviser, brokerage services, or other offset arrangements, if applicable, and do not represent the amount paid by the class during periods when reimbursements, waivers or reductions occur.
E Annualized
F On certain classes, the size and fluctuation of net assets and expense amounts may cause ratios to differ from contractual rates.
G Amount does not include the portfolio activity of any underlying mutual funds or exchange-traded funds (ETFs).
See accompanying notes which are an integral part of the financial statements.
Fidelity Freedom Blend 2040 Fund Class I
| | Six months ended (Unaudited) September 30, | Years endedMarch 31, | |
| | 2020 | 2020 | 2019 A |
| Selected Per–Share Data | | | |
| Net asset value, beginning of period | $8.30 | $9.56 | $10.00 |
| Income from Investment Operations | | | |
| Net investment income (loss)B | –C | .17 | .01 |
| Net realized and unrealized gain (loss) | 2.29 | (1.07) | (.18) |
| Total from investment operations | 2.29 | (.90) | (.17) |
| Distributions from net investment income | –C | (.19) | (.14) |
| Distributions from net realized gain | (.11) | (.17) | (.14) |
| Total distributions | (.11) | (.36) | (.27)D |
| Net asset value, end of period | $10.48 | $8.30 | $9.56 |
| Total ReturnE | 27.85% | (10.17)% | (1.33)% |
| Ratios to Average Net AssetsF | | | |
| Expenses before reductions | .54%G | .55%H | .54%G |
| Expenses net of fee waivers, if any | .54%G | .55%H | .54%G |
| Expenses net of all reductions | .54%G | .55%H | .54%G |
| Net investment income (loss) | .06%G | 1.73% | .27%G |
| Supplemental Data | | | |
| Net assets, end of period (000 omitted) | $9,102 | $4,049 | $100 |
| Portfolio turnover rateI | 25%G | 27% | 17%G |
A For the period August 31, 2018 (commencement of operations) to March 31, 2019.
B Calculated based on average shares outstanding during the period.
C Amount represents less than $.005 per share.
D Total distributions per share do not sum due to rounding.
E Total returns for periods of less than one year are not annualized.
F Expense ratios reflect operating expenses of the class. Expenses before reductions do not reflect amounts reimbursed, waived, or reduced through arrangements with the investment adviser, brokerage services, or other offset arrangements, if applicable, and do not represent the amount paid by the class during periods when reimbursements, waivers or reductions occur.
G Annualized
H On certain classes, the size and fluctuation of net assets and expense amounts may cause ratios to differ from contractual rates.
I Amount does not include the portfolio activity of any underlying mutual funds or exchange-traded funds (ETFs).
See accompanying notes which are an integral part of the financial statements.
Fidelity Freedom Blend 2040 Fund Class Z
| | Six months ended (Unaudited) September 30, | Years endedMarch 31, | |
| | 2020 | 2020 | 2019 A |
| Selected Per–Share Data | | | |
| Net asset value, beginning of period | $8.32 | $9.57 | $10.00 |
| Income from Investment Operations | | | |
| Net investment income (loss)B | .01 | .18 | .02 |
| Net realized and unrealized gain (loss) | 2.30 | (1.08) | (.17) |
| Total from investment operations | 2.31 | (.90) | (.15) |
| Distributions from net investment income | – | (.17) | (.14) |
| Distributions from net realized gain | (.11) | (.17) | (.14) |
| Total distributions | (.11) | (.35)C | (.28) |
| Net asset value, end of period | $10.52 | $8.32 | $9.57 |
| Total ReturnD | 27.98% | (10.17)% | (1.19)% |
| Ratios to Average Net AssetsE | | | |
| Expenses before reductions | .44%F | .44% | .44%F |
| Expenses net of fee waivers, if any | .44%F | .44% | .44%F |
| Expenses net of all reductions | .44%F | .44% | .44%F |
| Net investment income (loss) | .16%F | 1.83% | .37%F |
| Supplemental Data | | | |
| Net assets, end of period (000 omitted) | $114 | $89 | $99 |
| Portfolio turnover rateG | 25%F | 27% | 17%F |
A For the period August 31, 2018 (commencement of operations) to March 31, 2019.
B Calculated based on average shares outstanding during the period.
C Total distributions per share do not sum due to rounding.
D Total returns for periods of less than one year are not annualized.
E Expense ratios reflect operating expenses of the class. Expenses before reductions do not reflect amounts reimbursed, waived, or reduced through arrangements with the investment adviser, brokerage services, or other offset arrangements, if applicable, and do not represent the amount paid by the class during periods when reimbursements, waivers or reductions occur.
F Annualized
G Amount does not include the portfolio activity of any underlying mutual funds or exchange-traded funds (ETFs).
See accompanying notes which are an integral part of the financial statements.
Fidelity Freedom Blend 2040 Fund Class Z6
| | Six months ended (Unaudited) September 30, | Years endedMarch 31, | |
| | 2020 | 2020 | 2019 A |
| Selected Per–Share Data | | | |
| Net asset value, beginning of period | $8.32 | $9.57 | $10.00 |
| Income from Investment Operations | | | |
| Net investment income (loss)B | .01 | .18 | .03 |
| Net realized and unrealized gain (loss) | 2.31 | (1.08) | (.18) |
| Total from investment operations | 2.32 | (.90) | (.15) |
| Distributions from net investment income | – | (.18) | (.14) |
| Distributions from net realized gain | (.12) | (.17) | (.14) |
| Total distributions | (.12) | (.35) | (.28) |
| Net asset value, end of period | $10.52 | $8.32 | $9.57 |
| Total ReturnC | 28.08% | (10.14)% | (1.14)% |
| Ratios to Average Net AssetsD | | | |
| Expenses before reductions | .34%E | .35%F | .34%E |
| Expenses net of fee waivers, if any | .34%E | .35%F | .34%E |
| Expenses net of all reductions | .34%E | .35%F | .34%E |
| Net investment income (loss) | .26%E | 1.92% | .47%E |
| Supplemental Data | | | |
| Net assets, end of period (000 omitted) | $1,697 | $1,528 | $256 |
| Portfolio turnover rateG | 25%E | 27% | 17%E |
A For the period August 31, 2018 (commencement of operations) to March 31, 2019.
B Calculated based on average shares outstanding during the period.
C Total returns for periods of less than one year are not annualized.
D Expense ratios reflect operating expenses of the class. Expenses before reductions do not reflect amounts reimbursed, waived, or reduced through arrangements with the investment adviser, brokerage services, or other offset arrangements, if applicable, and do not represent the amount paid by the class during periods when reimbursements, waivers or reductions occur.
E Annualized
F On certain classes, the size and fluctuation of net assets and expense amounts may cause ratios to differ from contractual rates.
G Amount does not include the portfolio activity of any underlying mutual funds or exchange-traded funds (ETFs).
See accompanying notes which are an integral part of the financial statements.
Fidelity Freedom® Blend 2045 Fund
Investment Summary (Unaudited)
The information in the following tables is based on the direct investments of the Fund.
Top Holdings as of September 30, 2020
| | % of fund's net assets |
| Fidelity Series Large Cap Value Index Fund | 14.4 |
| Fidelity Series Emerging Markets Opportunities Fund | 14.0 |
| Fidelity Series Blue Chip Growth Fund | 11.1 |
| Fidelity Series Large Cap Stock Fund | 7.6 |
| Fidelity Series Large Cap Growth Index Fund | 7.1 |
| Fidelity Series International Growth Fund | 6.1 |
| Fidelity Series Overseas Fund | 6.1 |
| Fidelity Series International Value Fund | 6.1 |
| Fidelity Series Value Discovery Fund | 5.3 |
| Fidelity Series Small Cap Opportunities Fund | 3.6 |
| | 81.4 |
Asset Allocation (% of fund's net assets)
| Period end |
| | Domestic Equity Funds | 51.6% |
| | International Equity Funds | 40.8% |
| | Bond Funds | 6.2% |
| | Short-Term Funds | 1.4% |

Domestic Equity Funds category includes Fidelity Series Commodity Strategy Fund which invests in commodity-related investments.
Fidelity Freedom® Blend 2045 Fund
Schedule of Investments September 30, 2020 (Unaudited)
Showing Percentage of Net Assets
| Domestic Equity Funds - 51.6% | | | |
| | | Shares | Value |
| Fidelity Series Blue Chip Growth Fund (a) | | 4,517,493 | $74,583,808 |
| Fidelity Series Commodity Strategy Fund (a) | | 4,088,093 | 17,006,467 |
| Fidelity Series Large Cap Growth Index Fund (a) | | 3,353,084 | 47,747,912 |
| Fidelity Series Large Cap Stock Fund (a) | | 3,632,654 | 51,438,380 |
| Fidelity Series Large Cap Value Index Fund (a) | | 8,387,343 | 97,293,173 |
| Fidelity Series Small Cap Opportunities Fund (a) | | 1,918,502 | 24,480,084 |
| Fidelity Series Value Discovery Fund (a) | | 2,857,589 | 35,319,805 |
| TOTAL DOMESTIC EQUITY FUNDS | | | |
| (Cost $335,084,726) | | | 347,869,629 |
|
| International Equity Funds - 40.8% | | | |
| Fidelity Series Canada Fund (a) | | 1,550,575 | 15,862,378 |
| Fidelity Series Emerging Markets Fund (a) | | 1,111,049 | 10,477,189 |
| Fidelity Series Emerging Markets Opportunities Fund (a) | | 4,487,044 | 94,138,183 |
| Fidelity Series International Growth Fund (a) | | 2,194,240 | 41,207,827 |
| Fidelity Series International Index Fund (a) | | 1,711,683 | 17,014,128 |
| Fidelity Series International Small Cap Fund (a) | | 815,573 | 14,517,192 |
| Fidelity Series International Value Fund (a) | | 4,744,813 | 40,900,290 |
| Fidelity Series Overseas Fund (a) | | 3,680,483 | 41,147,798 |
| TOTAL INTERNATIONAL EQUITY FUNDS | | | |
| (Cost $253,585,537) | | | 275,264,985 |
|
| Bond Funds - 6.2% | | | |
| Fidelity Series Corporate Bond Fund (a) | | 6,979 | 78,518 |
| Fidelity Series Emerging Markets Debt Fund (a) | | 455,101 | 4,123,214 |
| Fidelity Series Floating Rate High Income Fund (a) | | 101,905 | 901,857 |
| Fidelity Series Government Bond Index Fund (a) | | 8,339 | 93,812 |
| Fidelity Series High Income Fund (a) | | 505,726 | 4,612,218 |
| Fidelity Series Inflation-Protected Bond Index Fund (a) | | 1,277,802 | 13,672,484 |
| Fidelity Series Investment Grade Bond Fund (a) | | 8,557 | 104,737 |
| Fidelity Series Investment Grade Securitized Fund (a) | | 6,673 | 71,203 |
| Fidelity Series Long-Term Treasury Bond Index Fund (a) | | 1,508,606 | 15,583,896 |
| Fidelity Series Real Estate Income Fund (a) | | 274,527 | 2,739,783 |
| TOTAL BOND FUNDS | | | |
| (Cost $40,127,608) | | | 41,981,722 |
|
| Short-Term Funds - 1.4% | | | |
| Fidelity Cash Central Fund 0.10% (b) | | 246 | 246 |
| Fidelity Series Government Money Market Fund 0.16% (a)(c) | | 1,045,956 | 1,045,956 |
| Fidelity Series Short-Term Credit Fund (a) | | 113,544 | 1,163,826 |
| Fidelity Series Treasury Bill Index Fund (a) | | 716,883 | 7,175,997 |
| TOTAL SHORT-TERM FUNDS | | | |
| (Cost $9,359,310) | | | 9,386,025 |
| TOTAL INVESTMENT IN SECURITIES - 100.0% | | | |
| (Cost $638,157,181) | | | 674,502,361 |
| NET OTHER ASSETS (LIABILITIES) - 0.0% | | | (10,886) |
| NET ASSETS - 100% | | | $674,491,475 |
Legend
(a) Affiliated Fund
(b) Affiliated fund that is generally available only to investment companies and other accounts managed by Fidelity Investments. The rate quoted is the annualized seven-day yield of the fund at period end. A complete unaudited listing of the fund's holdings as of its most recent quarter end is available upon request. In addition, each Fidelity Central Fund's financial statements are available on the SEC's website or upon request.
(c) The rate quoted is the annualized seven-day yield of the fund at period end.
Affiliated Central Funds
Information regarding fiscal year to date income earned by the Fund from investments in Fidelity Central Funds is as follows:
| Fund | Income earned |
| Fidelity Cash Central Fund | $5 |
| Total | $5 |
Amounts in the income column in the above table include any capital gain distributions from underlying funds, which are presented in the corresponding line-item in the Statement of Operations, if applicable.
Affiliated Underlying Funds
Fiscal year to date information regarding the Fund's investments in affiliated Underlying Funds, excluding any Money Market Central Funds, is presented below. Exchanges between classes of the same affiliated Underlying Funds may occur.
| Affiliate | Value, beginning of period | Purchases | Sales Proceeds | Dividend Income | Realized Gain (loss) | Change in Unrealized appreciation (depreciation) | Value, end of period |
| Fidelity Series Blue Chip Growth Fund | $45,398,547 | $27,416,106 | $13,013,797 | $14,750,405 | $1,824,121 | $12,958,831 | $74,583,808 |
| Fidelity Series Canada Fund | 10,877,362 | 3,337,810 | 1,072,321 | -- | (127,550) | 2,847,077 | 15,862,378 |
| Fidelity Series Commodity Strategy Fund | 15,847,876 | 3,016,514 | 3,830,584 | 71,909 | (649,913) | 2,622,574 | 17,006,467 |
| Fidelity Series Corporate Bond Fund | 139,934 | 28,723 | 95,322 | 986 | (8,057) | 13,240 | 78,518 |
| Fidelity Series Emerging Markets Debt Fund | 3,182,890 | 599,825 | 80,661 | 101,851 | 905 | 420,255 | 4,123,214 |
| Fidelity Series Emerging Markets Fund | 5,633,587 | 2,887,964 | 330,312 | -- | 5,422 | 2,280,528 | 10,477,189 |
| Fidelity Series Emerging Markets Opportunities Fund | 51,858,394 | 23,367,510 | 2,495,535 | -- | 66,217 | 21,341,597 | 94,138,183 |
| Fidelity Series Floating Rate High Income Fund | 706,212 | 139,235 | 19,515 | 18,758 | 214 | 75,711 | 901,857 |
| Fidelity Series Government Bond Index Fund | 213,162 | 24,335 | 143,757 | 617 | (128) | 200 | 93,812 |
| Fidelity Series Government Money Market Fund 0.16% | 4,354,063 | 5,070,999 | 8,379,106 | 3,179 | -- | -- | 1,045,956 |
| Fidelity Series High Income Fund | 3,582,891 | 720,105 | 97,574 | 117,718 | 1,231 | 405,565 | 4,612,218 |
| Fidelity Series Inflation-Protected Bond Index Fund | 10,644,373 | 3,884,713 | 1,547,877 | 9,329 | (6,809) | 698,084 | 13,672,484 |
| Fidelity Series International Growth Fund | 31,568,620 | 6,670,586 | 6,595,265 | -- | 179,045 | 9,384,841 | 41,207,827 |
| Fidelity Series International Index Fund | 12,407,656 | 2,805,057 | 995,584 | -- | (41,486) | 2,838,485 | 17,014,128 |
| Fidelity Series International Small Cap Fund | 9,400,796 | 2,102,885 | 331,033 | -- | 34,078 | 3,310,466 | 14,517,192 |
| Fidelity Series International Value Fund | 30,343,617 | 7,508,537 | 3,688,724 | -- | (200,750) | 6,937,610 | 40,900,290 |
| Fidelity Series Investment Grade Bond Fund | 211,130 | 32,189 | 143,096 | 1,156 | (5,469) | 9,983 | 104,737 |
| Fidelity Series Investment Grade Securitized Fund | 146,201 | 24,132 | 99,694 | 377 | 3 | 561 | 71,203 |
| Fidelity Series Large Cap Growth Index Fund | 33,894,819 | 7,936,386 | 8,987,360 | 824,360 | 1,044,481 | 13,859,586 | 47,747,912 |
| Fidelity Series Large Cap Stock Fund | 35,267,491 | 11,937,657 | 2,409,360 | 1,739,650 | (57,148) | 6,699,740 | 51,438,380 |
| Fidelity Series Large Cap Value Index Fund | 65,339,354 | 20,407,001 | 2,765,278 | -- | (74,198) | 14,386,294 | 97,293,173 |
| Fidelity Series Long-Term Treasury Bond Index Fund | 11,941,249 | 6,140,695 | 2,110,749 | 327,607 | 143,363 | (530,662) | 15,583,896 |
| Fidelity Series Overseas Fund | 30,281,498 | 7,966,594 | 6,354,925 | -- | (333,798) | 9,588,429 | 41,147,798 |
| Fidelity Series Real Estate Income Fund | 1,952,890 | 462,163 | 61,173 | 84,640 | 779 | 385,124 | 2,739,783 |
| Fidelity Series Short-Term Credit Fund | 1,109,555 | 12,658 | -- | 12,659 | -- | 41,613 | 1,163,826 |
| Fidelity Series Small Cap Opportunities Fund | 17,479,666 | 4,405,762 | 1,910,088 | 146,022 | (320,725) | 4,825,469 | 24,480,084 |
| Fidelity Series Treasury Bill Index Fund | 12,403,593 | 151,588 | 5,338,218 | 47,576 | (15,268) | (25,698) | 7,175,997 |
| Fidelity Series Value Discovery Fund | 20,499,714 | 10,037,631 | 631,279 | -- | 17,763 | 5,395,976 | 35,319,805 |
| | 466,687,140 | 159,095,360 | 73,528,187 | 18,258,799 | 1,476,323 | 120,771,479 | 674,502,115 |
Amounts in the income column in the above table include any capital gain distributions from underlying funds, which are presented in the corresponding line-item in the Statement of Operations, if applicable.
Investment Valuation
The following is a summary of the inputs used, as of September 30, 2020, involving the Fund's assets and liabilities carried at fair value. The inputs or methodology used for valuing securities may not be an indication of the risk associated with investing in those securities. For more information on valuation inputs, and their aggregation into the levels used below, please refer to the Investment Valuation section in the accompanying Notes to Financial Statements.
| | Valuation Inputs at Reporting Date: |
| Description | Total | Level 1 | Level 2 | Level 3 |
| Investments in Securities: | | | | |
| Domestic Equity Funds | $347,869,629 | $347,869,629 | $-- | $-- |
| International Equity Funds | 275,264,985 | 275,264,985 | -- | -- |
| Bond Funds | 41,981,722 | 41,981,722 | -- | -- |
| Short-Term Funds | 9,386,025 | 9,386,025 | -- | -- |
| Total Investments in Securities: | $674,502,361 | $674,502,361 | $-- | $-- |
See accompanying notes which are an integral part of the financial statements.
Fidelity Freedom® Blend 2045 Fund
Financial Statements
Statement of Assets and Liabilities
| | | September 30, 2020 (Unaudited) |
| Assets | | |
Investment in securities, at value — See accompanying schedule:
| | |
| Fidelity Central Funds (cost $246) | $246 | |
| Other affiliated issuers (cost $638,156,935) | 674,502,115 | |
| Total Investment in Securities (cost $638,157,181) | | $674,502,361 |
| Cash | | 5 |
| Receivable for investments sold | | 4,229,347 |
| Receivable for fund shares sold | | 938,132 |
| Total assets | | 679,669,845 |
| Liabilities | | |
| Payable for investments purchased | $4,702,527 | |
| Payable for fund shares redeemed | 277,211 | |
| Accrued management fee | 197,126 | |
| Distribution and service plan fees payable | 1,506 | |
| Total liabilities | | 5,178,370 |
| Net Assets | | $674,491,475 |
| Net Assets consist of: | | |
| Paid in capital | | $622,418,088 |
| Total accumulated earnings (loss) | | 52,073,387 |
| Net Assets | | $674,491,475 |
| Net Asset Value and Maximum Offering Price | | |
| Class A: | | |
| Net Asset Value and redemption price per share ($1,342,991 ÷ 128,332 shares)(a) | | $10.46 |
| Maximum offering price per share (100/94.25 of $10.46) | | $11.10 |
| Class M: | | |
| Net Asset Value and redemption price per share ($1,405,098 ÷ 134,628 shares)(a) | | $10.44 |
| Maximum offering price per share (100/96.50 of $10.44) | | $10.82 |
| Class C: | | |
| Net Asset Value and offering price per share ($774,384 ÷ 74,502 shares)(a) | | $10.39 |
| Fidelity Freedom Blend 2045 Fund: | | |
| Net Asset Value, offering price and redemption price per share ($16,967,254 ÷ 1,617,834 shares) | | $10.49 |
| Class K: | | |
| Net Asset Value, offering price and redemption price per share ($12,621,542 ÷ 1,202,260 shares) | | $10.50 |
| Class K6: | | |
| Net Asset Value, offering price and redemption price per share ($631,929,572 ÷ 60,052,942 shares) | | $10.52 |
| Class I: | | |
| Net Asset Value, offering price and redemption price per share ($7,948,897 ÷ 758,331 shares) | | $10.48 |
| Class Z: | | |
| Net Asset Value, offering price and redemption price per share ($122,208 ÷ 11,617 shares) | | $10.52 |
| Class Z6: | | |
| Net Asset Value, offering price and redemption price per share ($1,379,529 ÷ 131,156 shares) | | $10.52 |
(a) Redemption price per share is equal to net asset value less any applicable contingent deferred sales charge.
See accompanying notes which are an integral part of the financial statements.
Statement of Operations
| | | Six months ended September 30, 2020 (Unaudited) |
| Investment Income | | |
| Dividends: | | |
| Affiliated issuers | | $1,802,604 |
| Income from Fidelity Central Funds | | 5 |
| Total income | | 1,802,609 |
| Expenses | | |
| Management fee | $1,056,778 | |
| Distribution and service plan fees | 7,199 | |
| Independent trustees' fees and expenses | 780 | |
| Total expenses before reductions | 1,064,757 | |
| Expense reductions | (1) | |
| Total expenses after reductions | | 1,064,756 |
| Net investment income (loss) | | 737,853 |
| Realized and Unrealized Gain (Loss) | | |
| Net realized gain (loss) on: | | |
| Investment securities: | | |
| Affiliated issuers | 1,476,323 | |
| Capital gain distributions from underlying funds: | | |
| Affiliated issuers | 16,456,195 | |
| Total net realized gain (loss) | | 17,932,518 |
| Change in net unrealized appreciation (depreciation) on: | | |
| Investment securities: | | |
| Affiliated issuers | 120,771,479 | |
| Total change in net unrealized appreciation (depreciation) | | 120,771,479 |
| Net gain (loss) | | 138,703,997 |
| Net increase (decrease) in net assets resulting from operations | | $139,441,850 |
See accompanying notes which are an integral part of the financial statements.
Statement of Changes in Net Assets
| | Six months ended September 30, 2020 (Unaudited) | Year ended March 31, 2020 |
| Increase (Decrease) in Net Assets | | |
| Operations | | |
| Net investment income (loss) | $737,853 | $8,616,466 |
| Net realized gain (loss) | 17,932,518 | 12,039,211 |
| Change in net unrealized appreciation (depreciation) | 120,771,479 | (84,989,975) |
| Net increase (decrease) in net assets resulting from operations | 139,441,850 | (64,334,298) |
| Distributions to shareholders | (6,568,655) | (17,037,978) |
| Share transactions - net increase (decrease) | 74,938,016 | 538,033,978 |
| Total increase (decrease) in net assets | 207,811,211 | 456,661,702 |
| Net Assets | | |
| Beginning of period | 466,680,264 | 10,018,562 |
| End of period | $674,491,475 | $466,680,264 |
See accompanying notes which are an integral part of the financial statements.
Financial Highlights
Fidelity Freedom Blend 2045 Fund Class A
| | Six months ended (Unaudited) September 30, | Years endedMarch 31, | |
| | 2020 | 2020 | 2019 A |
| Selected Per–Share Data | | | |
| Net asset value, beginning of period | $8.29 | $9.55 | $10.00 |
| Income from Investment Operations | | | |
| Net investment income (loss)B | (.01) | .15 | .03 |
| Net realized and unrealized gain (loss) | 2.29 | (1.07) | (.22) |
| Total from investment operations | 2.28 | (.92) | (.19) |
| Distributions from net investment income | – | (.17) | (.15) |
| Distributions from net realized gain | (.11) | (.17) | (.11) |
| Total distributions | (.11) | (.34) | (.26) |
| Net asset value, end of period | $10.46 | $8.29 | $9.55 |
| Total ReturnC,D | 27.64% | (10.38)% | (1.56)% |
| Ratios to Average Net AssetsE,F | | | |
| Expenses before reductions | .79%G | .79% | .79%G |
| Expenses net of fee waivers, if any | .79%G | .79% | .79%G |
| Expenses net of all reductions | .79%G | .79% | .79%G |
| Net investment income (loss) | (.19)%G | 1.49% | .64%G |
| Supplemental Data | | | |
| Net assets, end of period (000 omitted) | $1,343 | $835 | $253 |
| Portfolio turnover rateH | 25%G | 27% | 19%G |
A For the period August 31, 2018 (commencement of operations) to March 31, 2019.
B Calculated based on average shares outstanding during the period.
C Total returns for periods of less than one year are not annualized.
D Total returns do not include the effect of the sales charges.
E Fees and expenses of any underlying mutual funds or exchange-traded funds (ETFs) are not included in the Fund's expense ratio. The Fund indirectly bears its proportionate share of these expenses. For additional expense information related to investments in Fidelity Central Funds, please refer to the "Investments in Fidelity Central Funds" note found in the Notes to Financial Statements section of the most recent Annual or Semi-Annual report.
F Expense ratios reflect operating expenses of the class. Expenses before reductions do not reflect amounts reimbursed, waived, or reduced through arrangements with the investment adviser, brokerage services, or other offset arrangements, if applicable, and do not represent the amount paid by the class during periods when reimbursements, waivers or reductions occur.
G Annualized
H Amount does not include the portfolio activity of any underlying mutual funds or exchange-traded funds (ETFs).
See accompanying notes which are an integral part of the financial statements.
Fidelity Freedom Blend 2045 Fund Class M
| | Six months ended (Unaudited) September 30, | Years endedMarch 31, | |
| | 2020 | 2020 | 2019 A |
| Selected Per–Share Data | | | |
| Net asset value, beginning of period | $8.27 | $9.54 | $10.00 |
| Income from Investment Operations | | | |
| Net investment income (loss)B | (.02) | .12 | .02 |
| Net realized and unrealized gain (loss) | 2.29 | (1.08) | (.22) |
| Total from investment operations | 2.27 | (.96) | (.20) |
| Distributions from net investment income | – | (.14) | (.15) |
| Distributions from net realized gain | (.10) | (.17) | (.11) |
| Total distributions | (.10) | (.31) | (.26) |
| Net asset value, end of period | $10.44 | $8.27 | $9.54 |
| Total ReturnC,D,E | 27.70% | (10.71)% | (1.68)% |
| Ratios to Average Net AssetsF,G | | | |
| Expenses before reductions | 1.04%H | 1.05%I | 1.04%H |
| Expenses net of fee waivers, if any | 1.04%H | 1.05%I | 1.04%H |
| Expenses net of all reductions | 1.04%H | 1.05%I | 1.04%H |
| Net investment income (loss) | (.44)%H | 1.23% | .39%H |
| Supplemental Data | | | |
| Net assets, end of period (000 omitted) | $1,405 | $1,120 | $160 |
| Portfolio turnover rateJ | 25%H | 27% | 19%H |
A For the period August 31, 2018 (commencement of operations) to March 31, 2019.
B Calculated based on average shares outstanding during the period.
C Total returns for periods of less than one year are not annualized.
D Total returns would have been lower if certain expenses had not been reduced during the applicable periods shown.
E Total returns do not include the effect of the sales charges.
F Fees and expenses of any underlying mutual funds or exchange-traded funds (ETFs) are not included in the Fund's expense ratio. The Fund indirectly bears its proportionate share of these expenses. For additional expense information related to investments in Fidelity Central Funds, please refer to the "Investments in Fidelity Central Funds" note found in the Notes to Financial Statements section of the most recent Annual or Semi-Annual report.
G Expense ratios reflect operating expenses of the class. Expenses before reductions do not reflect amounts reimbursed, waived, or reduced through arrangements with the investment adviser, brokerage services, or other offset arrangements, if applicable, and do not represent the amount paid by the class during periods when reimbursements, waivers or reductions occur.
H Annualized
I On certain classes, the size and fluctuation of net assets and expense amounts may cause ratios to differ from contractual rates.
J Amount does not include the portfolio activity of any underlying mutual funds or exchange-traded funds (ETFs).
See accompanying notes which are an integral part of the financial statements.
Fidelity Freedom Blend 2045 Fund Class C
| | Six months ended (Unaudited) September 30, | Years endedMarch 31, | |
| | 2020 | 2020 | 2019 A |
| Selected Per–Share Data | | | |
| Net asset value, beginning of period | $8.26 | $9.54 | $10.00 |
| Income from Investment Operations | | | |
| Net investment income (loss)B | (.05) | .07 | (.01) |
| Net realized and unrealized gain (loss) | 2.28 | (1.08) | (.21)C |
| Total from investment operations | 2.23 | (1.01) | (.22) |
| Distributions from net investment income | – | (.10) | (.13) |
| Distributions from net realized gain | (.10) | (.17) | (.11) |
| Total distributions | (.10) | (.27) | (.24) |
| Net asset value, end of period | $10.39 | $8.26 | $9.54 |
| Total ReturnD,E | 27.20% | (11.14)% | (1.91)% |
| Ratios to Average Net AssetsF,G | | | |
| Expenses before reductions | 1.55%H,I | 1.54% | 1.55%H,I |
| Expenses net of fee waivers, if any | 1.55%H,I | 1.54% | 1.55%H,I |
| Expenses net of all reductions | 1.55%H,I | 1.54% | 1.55%H,I |
| Net investment income (loss) | (.95)%H | .74% | (.12)%H |
| Supplemental Data | | | |
| Net assets, end of period (000 omitted) | $774 | $261 | $157 |
| Portfolio turnover rateJ | 25%H | 27% | 19%H |
A For the period August 31, 2018 (commencement of operations) to March 31, 2019.
B Calculated based on average shares outstanding during the period.
C The amount shown for a share outstanding does not correspond with the aggregate net gain (loss) on investments for the period due to the timing of sales and repurchases of shares in relation to fluctuating market values of the investments of the Fund.
D Total returns for periods of less than one year are not annualized.
E Total returns do not include the effect of the contingent deferred sales charge.
F Fees and expenses of any underlying mutual funds or exchange-traded funds (ETFs) are not included in the Fund's expense ratio. The Fund indirectly bears its proportionate share of these expenses. For additional expense information related to investments in Fidelity Central Funds, please refer to the "Investments in Fidelity Central Funds" note found in the Notes to Financial Statements section of the most recent Annual or Semi-Annual report.
G Expense ratios reflect operating expenses of the class. Expenses before reductions do not reflect amounts reimbursed, waived, or reduced through arrangements with the investment adviser, brokerage services, or other offset arrangements, if applicable, and do not represent the amount paid by the class during periods when reimbursements, waivers or reductions occur.
H Annualized
I On certain classes, the size and fluctuation of net assets and expense amounts may cause ratios to differ from contractual rates.
J Amount does not include the portfolio activity of any underlying mutual funds or exchange-traded funds (ETFs).
See accompanying notes which are an integral part of the financial statements.
Fidelity Freedom Blend 2045 Fund
| | Six months ended (Unaudited) September 30, | Years endedMarch 31, | |
| | 2020 | 2020 | 2019 A |
| Selected Per–Share Data | | | |
| Net asset value, beginning of period | $8.30 | $9.56 | $10.00 |
| Income from Investment Operations | | | |
| Net investment income (loss)B | –C | .16 | .05 |
| Net realized and unrealized gain (loss) | 2.30 | (1.07) | (.22) |
| Total from investment operations | 2.30 | (.91) | (.17) |
| Distributions from net investment income | –C | (.18) | (.16) |
| Distributions from net realized gain | (.11) | (.17) | (.11) |
| Total distributions | (.11) | (.35) | (.27) |
| Net asset value, end of period | $10.49 | $8.30 | $9.56 |
| Total ReturnD | 27.97% | (10.29)% | (1.31)% |
| Ratios to Average Net AssetsE,F | | | |
| Expenses before reductions | .54%G | .56%H | .55%G,H |
| Expenses net of fee waivers, if any | .54%G | .56%H | .55%G,H |
| Expenses net of all reductions | .54%G | .56%H | .55%G,H |
| Net investment income (loss) | .06%G | 1.72% | .88%G |
| Supplemental Data | | | |
| Net assets, end of period (000 omitted) | $16,967 | $10,682 | $748 |
| Portfolio turnover rateI | 25%G | 27% | 19%G |
A For the period August 31, 2018 (commencement of operations) to March 31, 2019.
B Calculated based on average shares outstanding during the period.
C Amount represents less than $.005 per share.
D Total returns for periods of less than one year are not annualized.
E Fees and expenses of any underlying mutual funds or exchange-traded funds (ETFs) are not included in the Fund's expense ratio. The Fund indirectly bears its proportionate share of these expenses. For additional expense information related to investments in Fidelity Central Funds, please refer to the "Investments in Fidelity Central Funds" note found in the Notes to Financial Statements section of the most recent Annual or Semi-Annual report.
F Expense ratios reflect operating expenses of the class. Expenses before reductions do not reflect amounts reimbursed, waived, or reduced through arrangements with the investment adviser, brokerage services, or other offset arrangements, if applicable, and do not represent the amount paid by the class during periods when reimbursements, waivers or reductions occur.
G Annualized
H On certain classes, the size and fluctuation of net assets and expense amounts may cause ratios to differ from contractual rates.
I Amount does not include the portfolio activity of any underlying mutual funds or exchange-traded funds (ETFs).
See accompanying notes which are an integral part of the financial statements.
Fidelity Freedom Blend 2045 Fund Class K
| | Six months ended (Unaudited) September 30, | Years endedMarch 31, | |
| | 2020 | 2020 | 2019 A |
| Selected Per–Share Data | | | |
| Net asset value, beginning of period | $8.30 | $9.56 | $10.00 |
| Income from Investment Operations | | | |
| Net investment income (loss)B | .01 | .18 | .05 |
| Net realized and unrealized gain (loss) | 2.30 | (1.07) | (.22) |
| Total from investment operations | 2.31 | (.89) | (.17) |
| Distributions from net investment income | – | (.19) | (.16) |
| Distributions from net realized gain | (.11) | (.17) | (.11) |
| Total distributions | (.11) | (.37)C | (.27) |
| Net asset value, end of period | $10.50 | $8.30 | $9.56 |
| Total ReturnD | 28.06% | (10.14)% | (1.35)% |
| Ratios to Average Net AssetsE,F | | | |
| Expenses before reductions | .44%G | .44% | .44%G |
| Expenses net of fee waivers, if any | .44%G | .44% | .44%G |
| Expenses net of all reductions | .44%G | .44% | .44%G |
| Net investment income (loss) | .16%G | 1.84% | .99%G |
| Supplemental Data | | | |
| Net assets, end of period (000 omitted) | $12,622 | $13,473 | $99 |
| Portfolio turnover rateH | 25%G | 27% | 19%G |
A For the period August 31, 2018 (commencement of operations) to March 31, 2019.
B Calculated based on average shares outstanding during the period.
C Total distributions per share do not sum due to rounding.
D Total returns for periods of less than one year are not annualized.
E Fees and expenses of any underlying mutual funds or exchange-traded funds (ETFs) are not included in the Fund's expense ratio. The Fund indirectly bears its proportionate share of these expenses. For additional expense information related to investments in Fidelity Central Funds, please refer to the "Investments in Fidelity Central Funds" note found in the Notes to Financial Statements section of the most recent Annual or Semi-Annual report.
F Expense ratios reflect operating expenses of the class. Expenses before reductions do not reflect amounts reimbursed, waived, or reduced through arrangements with the investment adviser, brokerage services, or other offset arrangements, if applicable, and do not represent the amount paid by the class during periods when reimbursements, waivers or reductions occur.
G Annualized
H Amount does not include the portfolio activity of any underlying mutual funds or exchange-traded funds (ETFs).
See accompanying notes which are an integral part of the financial statements.
Fidelity Freedom Blend 2045 Fund Class K6
| | Six months ended (Unaudited) September 30, | Years endedMarch 31, | |
| | 2020 | 2020 | 2019 A |
| Selected Per–Share Data | | | |
| Net asset value, beginning of period | $8.32 | $9.57 | $10.00 |
| Income from Investment Operations | | | |
| Net investment income (loss)B | .01 | .19 | .06 |
| Net realized and unrealized gain (loss) | 2.30 | (1.08) | (.22) |
| Total from investment operations | 2.31 | (.89) | (.16) |
| Distributions from net investment income | – | (.18) | (.16) |
| Distributions from net realized gain | (.11) | (.17) | (.11) |
| Total distributions | (.11) | (.36)C | (.27) |
| Net asset value, end of period | $10.52 | $8.32 | $9.57 |
| Total ReturnD | 28.03% | (10.10)% | (1.21)% |
| Ratios to Average Net AssetsE,F | | | |
| Expenses before reductions | .34%G | .34% | .35%G,H |
| Expenses net of fee waivers, if any | .34%G | .34% | .35%G,H |
| Expenses net of all reductions | .34%G | .34% | .35%G,H |
| Net investment income (loss) | .26%G | 1.94% | 1.08%G |
| Supplemental Data | | | |
| Net assets, end of period (000 omitted) | $631,930 | $435,714 | $8,306 |
| Portfolio turnover rateI | 25%G | 27% | 19%G |
A For the period August 31, 2018 (commencement of operations) to March 31, 2019.
B Calculated based on average shares outstanding during the period.
C Total distributions per share do not sum due to rounding.
D Total returns for periods of less than one year are not annualized.
E Fees and expenses of any underlying mutual funds or exchange-traded funds (ETFs) are not included in the Fund's expense ratio. The Fund indirectly bears its proportionate share of these expenses. For additional expense information related to investments in Fidelity Central Funds, please refer to the "Investments in Fidelity Central Funds" note found in the Notes to Financial Statements section of the most recent Annual or Semi-Annual report.
F Expense ratios reflect operating expenses of the class. Expenses before reductions do not reflect amounts reimbursed, waived, or reduced through arrangements with the investment adviser, brokerage services, or other offset arrangements, if applicable, and do not represent the amount paid by the class during periods when reimbursements, waivers or reductions occur.
G Annualized
H On certain classes, the size and fluctuation of net assets and expense amounts may cause ratios to differ from contractual rates.
I Amount does not include the portfolio activity of any underlying mutual funds or exchange-traded funds (ETFs).
See accompanying notes which are an integral part of the financial statements.
Fidelity Freedom Blend 2045 Fund Class I
| | Six months ended (Unaudited) September 30, | Years endedMarch 31, | |
| | 2020 | 2020 | 2019 A |
| Selected Per–Share Data | | | |
| Net asset value, beginning of period | $8.30 | $9.56 | $10.00 |
| Income from Investment Operations | | | |
| Net investment income (loss)B | –C | .17 | .05 |
| Net realized and unrealized gain (loss) | 2.29 | (1.07) | (.22) |
| Total from investment operations | 2.29 | (.90) | (.17) |
| Distributions from net investment income | – | (.19) | (.16) |
| Distributions from net realized gain | (.11) | (.17) | (.11) |
| Total distributions | (.11) | (.36) | (.27) |
| Net asset value, end of period | $10.48 | $8.30 | $9.56 |
| Total ReturnD | 27.85% | (10.18)% | (1.38)% |
| Ratios to Average Net AssetsE,F | | | |
| Expenses before reductions | .54%G | .55%H | .54%G |
| Expenses net of fee waivers, if any | .54%G | .55%H | .54%G |
| Expenses net of all reductions | .54%G | .55%H | .54%G |
| Net investment income (loss) | .06%G | 1.74% | .89%G |
| Supplemental Data | | | |
| Net assets, end of period (000 omitted) | $7,949 | $3,395 | $99 |
| Portfolio turnover rateI | 25%G | 27% | 19%G |
A For the period August 31, 2018 (commencement of operations) to March 31, 2019.
B Calculated based on average shares outstanding during the period.
C Amount represents less than $.005 per share.
D Total returns for periods of less than one year are not annualized.
E Fees and expenses of any underlying mutual funds or exchange-traded funds (ETFs) are not included in the Fund's expense ratio. The Fund indirectly bears its proportionate share of these expenses. For additional expense information related to investments in Fidelity Central Funds, please refer to the "Investments in Fidelity Central Funds" note found in the Notes to Financial Statements section of the most recent Annual or Semi-Annual report.
F Expense ratios reflect operating expenses of the class. Expenses before reductions do not reflect amounts reimbursed, waived, or reduced through arrangements with the investment adviser, brokerage services, or other offset arrangements, if applicable, and do not represent the amount paid by the class during periods when reimbursements, waivers or reductions occur.
G Annualized
H On certain classes, the size and fluctuation of net assets and expense amounts may cause ratios to differ from contractual rates.
I Amount does not include the portfolio activity of any underlying mutual funds or exchange-traded funds (ETFs).
See accompanying notes which are an integral part of the financial statements.
Fidelity Freedom Blend 2045 Fund Class Z
| | Six months ended (Unaudited) September 30, | Years endedMarch 31, | |
| | 2020 | 2020 | 2019 A |
| Selected Per–Share Data | | | |
| Net asset value, beginning of period | $8.32 | $9.56 | $10.00 |
| Income from Investment Operations | | | |
| Net investment income (loss)B | .01 | .18 | .05 |
| Net realized and unrealized gain (loss) | 2.30 | (1.08) | (.22) |
| Total from investment operations | 2.31 | (.90) | (.17) |
| Distributions from net investment income | – | (.17) | (.16) |
| Distributions from net realized gain | (.11) | (.17) | (.11) |
| Total distributions | (.11) | (.34) | (.27) |
| Net asset value, end of period | $10.52 | $8.32 | $9.56 |
| Total ReturnC | 27.99% | (10.10)% | (1.35)% |
| Ratios to Average Net AssetsD,E | | | |
| Expenses before reductions | .44%F | .44% | .44%F |
| Expenses net of fee waivers, if any | .44%F | .44% | .44%F |
| Expenses net of all reductions | .44%F | .44% | .44%F |
| Net investment income (loss) | .16%F | 1.84% | .99%F |
| Supplemental Data | | | |
| Net assets, end of period (000 omitted) | $122 | $92 | $99 |
| Portfolio turnover rateG | 25%F | 27% | 19%F |
A For the period August 31, 2018 (commencement of operations) to March 31, 2019.
B Calculated based on average shares outstanding during the period.
C Total returns for periods of less than one year are not annualized.
D Fees and expenses of any underlying mutual funds or exchange-traded funds (ETFs) are not included in the Fund's expense ratio. The Fund indirectly bears its proportionate share of these expenses. For additional expense information related to investments in Fidelity Central Funds, please refer to the "Investments in Fidelity Central Funds" note found in the Notes to Financial Statements section of the most recent Annual or Semi-Annual report.
E Expense ratios reflect operating expenses of the class. Expenses before reductions do not reflect amounts reimbursed, waived, or reduced through arrangements with the investment adviser, brokerage services, or other offset arrangements, if applicable, and do not represent the amount paid by the class during periods when reimbursements, waivers or reductions occur.
F Annualized
G Amount does not include the portfolio activity of any underlying mutual funds or exchange-traded funds (ETFs).
See accompanying notes which are an integral part of the financial statements.
Fidelity Freedom Blend 2045 Fund Class Z6
| | Six months ended (Unaudited) September 30, | Years endedMarch 31, | |
| | 2020 | 2020 | 2019 A |
| Selected Per–Share Data | | | |
| Net asset value, beginning of period | $8.32 | $9.57 | $10.00 |
| Income from Investment Operations | | | |
| Net investment income (loss)B | .01 | .18 | .06 |
| Net realized and unrealized gain (loss) | 2.31 | (1.07) | (.22) |
| Total from investment operations | 2.32 | (.89) | (.16) |
| Distributions from net investment income | – | (.19) | (.16) |
| Distributions from net realized gain | (.12) | (.17) | (.11) |
| Total distributions | (.12) | (.36) | (.27) |
| Net asset value, end of period | $10.52 | $8.32 | $9.57 |
| Total ReturnC | 28.09% | (10.10)% | (1.21)% |
| Ratios to Average Net AssetsD,E | | | |
| Expenses before reductions | .34%F | .35%G | .34%F |
| Expenses net of fee waivers, if any | .34%F | .35%G | .34%F |
| Expenses net of all reductions | .34%F | .35%G | .34%F |
| Net investment income (loss) | .26%F | 1.94% | 1.09%F |
| Supplemental Data | | | |
| Net assets, end of period (000 omitted) | $1,380 | $1,108 | $99 |
| Portfolio turnover rateH | 25%F | 27% | 19%F |
A For the period August 31, 2018 (commencement of operations) to March 31, 2019.
B Calculated based on average shares outstanding during the period.
C Total returns for periods of less than one year are not annualized.
D Fees and expenses of any underlying mutual funds or exchange-traded funds (ETFs) are not included in the Fund's expense ratio. The Fund indirectly bears its proportionate share of these expenses. For additional expense information related to investments in Fidelity Central Funds, please refer to the "Investments in Fidelity Central Funds" note found in the Notes to Financial Statements section of the most recent Annual or Semi-Annual report.
E Expense ratios reflect operating expenses of the class. Expenses before reductions do not reflect amounts reimbursed, waived, or reduced through arrangements with the investment adviser, brokerage services, or other offset arrangements, if applicable, and do not represent the amount paid by the class during periods when reimbursements, waivers or reductions occur.
F Annualized
G On certain classes, the size and fluctuation of net assets and expense amounts may cause ratios to differ from contractual rates.
H Amount does not include the portfolio activity of any underlying mutual funds or exchange-traded funds (ETFs).
See accompanying notes which are an integral part of the financial statements.
Fidelity Freedom® Blend 2050 Fund
Investment Summary (Unaudited)
The information in the following tables is based on the direct investments of the Fund.
Top Holdings as of September 30, 2020
| | % of fund's net assets |
| Fidelity Series Large Cap Value Index Fund | 14.4 |
| Fidelity Series Emerging Markets Opportunities Fund | 14.0 |
| Fidelity Series Blue Chip Growth Fund | 11.1 |
| Fidelity Series Large Cap Stock Fund | 7.6 |
| Fidelity Series Large Cap Growth Index Fund | 7.1 |
| Fidelity Series International Growth Fund | 6.1 |
| Fidelity Series Overseas Fund | 6.1 |
| Fidelity Series International Value Fund | 6.1 |
| Fidelity Series Value Discovery Fund | 5.3 |
| Fidelity Series Small Cap Opportunities Fund | 3.6 |
| | 81.4 |
Asset Allocation (% of fund's net assets)
| Period end |
| | Domestic Equity Funds | 51.6% |
| | International Equity Funds | 40.8% |
| | Bond Funds | 6.2% |
| | Short-Term Funds | 1.4% |

Domestic Equity Funds category includes Fidelity Series Commodity Strategy Fund which invests in commodity-related investments.
Fidelity Freedom® Blend 2050 Fund
Schedule of Investments September 30, 2020 (Unaudited)
Showing Percentage of Net Assets
| Domestic Equity Funds - 51.6% | | | |
| | | Shares | Value |
| Fidelity Series Blue Chip Growth Fund (a) | | 3,656,857 | $60,374,711 |
| Fidelity Series Commodity Strategy Fund (a) | | 3,309,255 | 13,766,502 |
| Fidelity Series Large Cap Growth Index Fund (a) | | 2,714,283 | 38,651,396 |
| Fidelity Series Large Cap Stock Fund (a) | | 2,940,592 | 41,638,784 |
| Fidelity Series Large Cap Value Index Fund (a) | | 6,789,459 | 78,757,728 |
| Fidelity Series Small Cap Opportunities Fund (a) | | 1,553,008 | 19,816,386 |
| Fidelity Series Value Discovery Fund (a) | | 2,313,185 | 28,590,969 |
| TOTAL DOMESTIC EQUITY FUNDS | | | |
| (Cost $270,032,230) | | | 281,596,476 |
|
| International Equity Funds - 40.8% | | | |
| Fidelity Series Canada Fund (a) | | 1,255,200 | 12,840,698 |
| Fidelity Series Emerging Markets Fund (a) | | 899,377 | 8,481,128 |
| Fidelity Series Emerging Markets Opportunities Fund (a) | | 3,632,195 | 76,203,444 |
| Fidelity Series International Growth Fund (a) | | 1,776,230 | 33,357,600 |
| Fidelity Series International Index Fund (a) | | 1,385,619 | 13,773,056 |
| Fidelity Series International Small Cap Fund (a) | | 660,183 | 11,751,256 |
| Fidelity Series International Value Fund (a) | | 3,840,925 | 33,108,776 |
| Fidelity Series Overseas Fund (a) | | 2,979,341 | 33,309,032 |
| TOTAL INTERNATIONAL EQUITY FUNDS | | | |
| (Cost $204,812,147) | | | 222,824,990 |
|
| Bond Funds - 6.2% | | | |
| Fidelity Series Corporate Bond Fund (a) | | 5,648 | 63,538 |
| Fidelity Series Emerging Markets Debt Fund (a) | | 366,770 | 3,322,935 |
| Fidelity Series Floating Rate High Income Fund (a) | | 82,727 | 732,130 |
| Fidelity Series Government Bond Index Fund (a) | | 6,746 | 75,890 |
| Fidelity Series High Income Fund (a) | | 409,592 | 3,735,476 |
| Fidelity Series Inflation-Protected Bond Index Fund (a) | | 1,034,462 | 11,068,741 |
| Fidelity Series Investment Grade Bond Fund (a) | | 6,931 | 84,840 |
| Fidelity Series Investment Grade Securitized Fund (a) | | 5,401 | 57,630 |
| Fidelity Series Long-Term Treasury Bond Index Fund (a) | | 1,221,302 | 12,616,053 |
| Fidelity Series Real Estate Income Fund (a) | | 222,903 | 2,224,572 |
| TOTAL BOND FUNDS | | | |
| (Cost $32,510,744) | | | 33,981,805 |
|
| Short-Term Funds - 1.4% | | | |
| Fidelity Cash Central Fund 0.10% (b) | | 49 | 49 |
| Fidelity Series Government Money Market Fund 0.16% (a)(c) | | 904,729 | 904,729 |
| Fidelity Series Short-Term Credit Fund (a) | | 97,020 | 994,456 |
| Fidelity Series Treasury Bill Index Fund (a) | | 569,385 | 5,699,543 |
| TOTAL SHORT-TERM FUNDS | | | |
| (Cost $7,578,932) | | | 7,598,777 |
| TOTAL INVESTMENT IN SECURITIES - 100.0% | | | |
| (Cost $514,934,053) | | | 546,002,048 |
| NET OTHER ASSETS (LIABILITIES) - 0.0% | | | (8,413) |
| NET ASSETS - 100% | | | $545,993,635 |
Legend
(a) Affiliated Fund
(b) Affiliated fund that is generally available only to investment companies and other accounts managed by Fidelity Investments. The rate quoted is the annualized seven-day yield of the fund at period end. A complete unaudited listing of the fund's holdings as of its most recent quarter end is available upon request. In addition, each Fidelity Central Fund's financial statements are available on the SEC's website or upon request.
(c) The rate quoted is the annualized seven-day yield of the fund at period end.
Affiliated Underlying Funds
Fiscal year to date information regarding the Fund's investments in affiliated Underlying Funds, excluding any Money Market Central Funds, is presented below. Exchanges between classes of the same affiliated Underlying Funds may occur.
| Affiliate | Value, beginning of period | Purchases | Sales Proceeds | Dividend Income | Realized Gain (loss) | Change in Unrealized appreciation (depreciation) | Value, end of period |
| Fidelity Series Blue Chip Growth Fund | $35,853,859 | $22,958,539 | $10,190,614 | $11,925,585 | $1,397,153 | $10,355,774 | $60,374,711 |
| Fidelity Series Canada Fund | 8,592,715 | 2,870,999 | 805,098 | -- | (92,563) | 2,274,645 | 12,840,698 |
| Fidelity Series Commodity Strategy Fund | 12,516,653 | 2,691,629 | 3,032,184 | 58,140 | (477,508) | 2,067,912 | 13,766,502 |
| Fidelity Series Corporate Bond Fund | 109,969 | 24,106 | 74,681 | 792 | (6,305) | 10,449 | 63,538 |
| Fidelity Series Emerging Markets Debt Fund | 2,504,000 | 548,503 | 65,822 | 81,447 | 713 | 335,541 | 3,322,935 |
| Fidelity Series Emerging Markets Fund | 4,450,181 | 2,457,518 | 262,981 | -- | 6,963 | 1,829,447 | 8,481,128 |
| Fidelity Series Emerging Markets Opportunities Fund | 40,965,399 | 20,089,584 | 2,044,690 | -- | 82,303 | 17,110,848 | 76,203,444 |
| Fidelity Series Floating Rate High Income Fund | 558,973 | 128,102 | 15,925 | 15,110 | 117 | 60,863 | 732,130 |
| Fidelity Series Government Bond Index Fund | 167,351 | 20,973 | 112,482 | 495 | (100) | 148 | 75,890 |
| Fidelity Series Government Money Market Fund 0.16% | 3,379,025 | 4,333,681 | 6,807,977 | 2,561 | -- | -- | 904,729 |
| Fidelity Series High Income Fund | 2,829,486 | 659,577 | 79,624 | 94,623 | 782 | 325,255 | 3,735,476 |
| Fidelity Series Inflation-Protected Bond Index Fund | 8,398,507 | 3,301,085 | 1,185,023 | 7,438 | (10,900) | 565,072 | 11,068,741 |
| Fidelity Series International Growth Fund | 24,938,580 | 5,792,745 | 5,049,269 | -- | 134,387 | 7,541,157 | 33,357,600 |
| Fidelity Series International Index Fund | 9,816,743 | 2,445,557 | 736,741 | -- | (21,614) | 2,269,111 | 13,773,056 |
| Fidelity Series International Small Cap Fund | 7,433,165 | 1,889,452 | 256,548 | -- | 19,574 | 2,665,613 | 11,751,256 |
| Fidelity Series International Value Fund | 23,967,588 | 6,555,301 | 2,820,415 | -- | (99,755) | 5,506,057 | 33,108,776 |
| Fidelity Series Investment Grade Bond Fund | 166,004 | 27,381 | 112,164 | 928 | (4,277) | 7,896 | 84,840 |
| Fidelity Series Investment Grade Securitized Fund | 114,859 | 20,393 | 78,074 | 302 | 2 | 450 | 57,630 |
| Fidelity Series Large Cap Growth Index Fund | 26,770,691 | 6,987,988 | 7,049,226 | 663,313 | 711,972 | 11,229,971 | 38,651,396 |
| Fidelity Series Large Cap Stock Fund | 27,851,364 | 10,439,915 | 1,967,496 | 1,404,605 | (27,193) | 5,342,194 | 41,638,784 |
| Fidelity Series Large Cap Value Index Fund | 51,603,703 | 17,980,280 | 2,297,686 | -- | (56,783) | 11,528,214 | 78,757,728 |
| Fidelity Series Long-Term Treasury Bond Index Fund | 9,437,840 | 5,155,604 | 1,665,906 | 261,097 | 65,191 | (376,676) | 12,616,053 |
| Fidelity Series Overseas Fund | 23,880,282 | 6,939,464 | 4,934,475 | -- | (260,357) | 7,684,118 | 33,309,032 |
| Fidelity Series Real Estate Income Fund | 1,542,372 | 422,551 | 49,913 | 68,478 | 32 | 309,530 | 2,224,572 |
| Fidelity Series Short-Term Credit Fund | 948,082 | 10,817 | -- | 10,816 | -- | 35,557 | 994,456 |
| Fidelity Series Small Cap Opportunities Fund | 13,805,646 | 3,952,307 | 1,547,613 | 118,055 | (251,643) | 3,857,689 | 19,816,386 |
| Fidelity Series Treasury Bill Index Fund | 9,784,765 | 149,966 | 4,202,805 | 37,666 | (12,398) | (19,985) | 5,699,543 |
| Fidelity Series Value Discovery Fund | 16,190,967 | 8,584,775 | 526,844 | -- | 16,588 | 4,325,483 | 28,590,969 |
| | 368,578,769 | 137,438,792 | 57,972,276 | 14,751,451 | 1,114,381 | 96,842,333 | 546,001,999 |
Amounts in the income column in the above table include any capital gain distributions from underlying funds, which are presented in the corresponding line-item in the Statement of Operations, if applicable.
Investment Valuation
The following is a summary of the inputs used, as of September 30, 2020, involving the Fund's assets and liabilities carried at fair value. The inputs or methodology used for valuing securities may not be an indication of the risk associated with investing in those securities. For more information on valuation inputs, and their aggregation into the levels used below, please refer to the Investment Valuation section in the accompanying Notes to Financial Statements.
| | Valuation Inputs at Reporting Date: |
| Description | Total | Level 1 | Level 2 | Level 3 |
| Investments in Securities: | | | | |
| Domestic Equity Funds | $281,596,476 | $281,596,476 | $-- | $-- |
| International Equity Funds | 222,824,990 | 222,824,990 | -- | -- |
| Bond Funds | 33,981,805 | 33,981,805 | -- | -- |
| Short-Term Funds | 7,598,777 | 7,598,777 | -- | -- |
| Total Investments in Securities: | $546,002,048 | $546,002,048 | $-- | $-- |
See accompanying notes which are an integral part of the financial statements.
Fidelity Freedom® Blend 2050 Fund
Financial Statements
Statement of Assets and Liabilities
| | | September 30, 2020 (Unaudited) |
| Assets | | |
Investment in securities, at value — See accompanying schedule:
| | |
| Fidelity Central Funds (cost $49) | $49 | |
| Other affiliated issuers (cost $514,934,004) | 546,001,999 | |
| Total Investment in Securities (cost $514,934,053) | | $546,002,048 |
| Cash | | 186 |
| Receivable for investments sold | | 3,336,181 |
| Receivable for fund shares sold | | 1,104,620 |
| Total assets | | 550,443,035 |
| Liabilities | | |
| Payable for investments purchased | $4,002,103 | |
| Payable for fund shares redeemed | 286,612 | |
| Accrued management fee | 159,661 | |
| Distribution and service plan fees payable | 1,024 | |
| Total liabilities | | 4,449,400 |
| Net Assets | | $545,993,635 |
| Net Assets consist of: | | |
| Paid in capital | | $502,307,605 |
| Total accumulated earnings (loss) | | 43,686,030 |
| Net Assets | | $545,993,635 |
| Net Asset Value and Maximum Offering Price | | |
| Class A: | | |
| Net Asset Value and redemption price per share ($1,282,430 ÷ 122,853 shares)(a) | | $10.44 |
| Maximum offering price per share (100/94.25 of $10.44) | | $11.08 |
| Class M: | | |
| Net Asset Value and redemption price per share ($488,789 ÷ 46,973 shares)(a) | | $10.41 |
| Maximum offering price per share (100/96.50 of $10.41) | | $10.79 |
| Class C: | | |
| Net Asset Value and offering price per share ($644,452 ÷ 62,334 shares)(a) | | $10.34 |
| Fidelity Freedom Blend 2050 Fund: | | |
| Net Asset Value, offering price and redemption price per share ($16,132,510 ÷ 1,543,910 shares) | | $10.45 |
| Class K: | | |
| Net Asset Value, offering price and redemption price per share ($7,288,993 ÷ 696,726 shares) | | $10.46 |
| Class K6: | | |
| Net Asset Value, offering price and redemption price per share ($511,739,552 ÷ 48,810,789 shares) | | $10.48 |
| Class I: | | |
| Net Asset Value, offering price and redemption price per share ($5,724,728 ÷ 547,859 shares) | | $10.45 |
| Class Z: | | |
| Net Asset Value, offering price and redemption price per share ($113,470 ÷ 10,823 shares) | | $10.48 |
| Class Z6: | | |
| Net Asset Value, offering price and redemption price per share ($2,578,711 ÷ 245,996 shares) | | $10.48 |
(a) Redemption price per share is equal to net asset value less any applicable contingent deferred sales charge.
See accompanying notes which are an integral part of the financial statements.
Statement of Operations
| | | Six months ended September 30, 2020 (Unaudited) |
| Investment Income | | |
| Dividends: | | |
| Affiliated issuers | | $1,454,088 |
| Expenses | | |
| Management fee | $849,056 | |
| Distribution and service plan fees | 5,339 | |
| Independent trustees' fees and expenses | 621 | |
| Total expenses before reductions | 855,016 | |
| Expense reductions | (5) | |
| Total expenses after reductions | | 855,011 |
| Net investment income (loss) | | 599,077 |
| Realized and Unrealized Gain (Loss) | | |
| Net realized gain (loss) on: | | |
| Investment securities: | | |
| Affiliated issuers | 1,114,381 | |
| Capital gain distributions from underlying funds: | | |
| Affiliated issuers | 13,297,363 | |
| Total net realized gain (loss) | | 14,411,744 |
| Change in net unrealized appreciation (depreciation) on: | | |
| Investment securities: | | |
| Affiliated issuers | 96,842,333 | |
| Total change in net unrealized appreciation (depreciation) | | 96,842,333 |
| Net gain (loss) | | 111,254,077 |
| Net increase (decrease) in net assets resulting from operations | | $111,853,154 |
See accompanying notes which are an integral part of the financial statements.
Statement of Changes in Net Assets
| | Six months ended September 30, 2020 (Unaudited) | Year ended March 31, 2020 |
| Increase (Decrease) in Net Assets | | |
| Operations | | |
| Net investment income (loss) | $599,077 | $6,431,323 |
| Net realized gain (loss) | 14,411,744 | 8,604,244 |
| Change in net unrealized appreciation (depreciation) | 96,842,333 | (66,297,105) |
| Net increase (decrease) in net assets resulting from operations | 111,853,154 | (51,261,538) |
| Distributions to shareholders | (4,931,027) | (12,506,845) |
| Share transactions - net increase (decrease) | 70,485,091 | 423,536,446 |
| Total increase (decrease) in net assets | 177,407,218 | 359,768,063 |
| Net Assets | | |
| Beginning of period | 368,586,417 | 8,818,354 |
| End of period | $545,993,635 | $368,586,417 |
See accompanying notes which are an integral part of the financial statements.
Financial Highlights
Fidelity Freedom Blend 2050 Fund Class A
| | Six months ended (Unaudited) September 30, | Years endedMarch 31, | |
| | 2020 | 2020 | 2019 A |
| Selected Per–Share Data | | | |
| Net asset value, beginning of period | $8.26 | $9.51 | $10.00 |
| Income from Investment Operations | | | |
| Net investment income (loss)B | (.01) | .15 | .02 |
| Net realized and unrealized gain (loss) | 2.29 | (1.08) | (.21) |
| Total from investment operations | 2.28 | (.93) | (.19) |
| Distributions from net investment income | – | (.16) | (.14) |
| Distributions from net realized gain | (.10) | (.16) | (.16) |
| Total distributions | (.10) | (.32) | (.30) |
| Net asset value, end of period | $10.44 | $8.26 | $9.51 |
| Total ReturnC,D | 27.77% | (10.48)% | (1.50)% |
| Ratios to Average Net AssetsE | | | |
| Expenses before reductions | .79%F | .79% | .79%F |
| Expenses net of fee waivers, if any | .79%F | .79% | .79%F |
| Expenses net of all reductions | .79%F | .79% | .79%F |
| Net investment income (loss) | (.19)%F | 1.51% | .31%F |
| Supplemental Data | | | |
| Net assets, end of period (000 omitted) | $1,282 | $644 | $239 |
| Portfolio turnover rateG | 24%F | 26% | 12%F |
A For the period August 31, 2018 (commencement of operations) to March 31, 2019.
B Calculated based on average shares outstanding during the period.
C Total returns for periods of less than one year are not annualized.
D Total returns do not include the effect of the sales charges.
E Expense ratios reflect operating expenses of the class. Expenses before reductions do not reflect amounts reimbursed, waived, or reduced through arrangements with the investment adviser, brokerage services, or other offset arrangements, if applicable, and do not represent the amount paid by the class during periods when reimbursements, waivers or reductions occur.
F Annualized
G Amount does not include the portfolio activity of any underlying mutual funds or exchange-traded funds (ETFs).
See accompanying notes which are an integral part of the financial statements.
Fidelity Freedom Blend 2050 Fund Class M
| | Six months ended (Unaudited) September 30, | Years endedMarch 31, | |
| | 2020 | 2020 | 2019 A |
| Selected Per–Share Data | | | |
| Net asset value, beginning of period | $8.24 | $9.51 | $10.00 |
| Income from Investment Operations | | | |
| Net investment income (loss)B | (.02) | .12 | –C |
| Net realized and unrealized gain (loss) | 2.29 | (1.08) | (.20) |
| Total from investment operations | 2.27 | (.96) | (.20) |
| Distributions from net investment income | – | (.14) | (.13) |
| Distributions from net realized gain | (.10) | (.16) | (.16) |
| Total distributions | (.10) | (.31)D | (.29) |
| Net asset value, end of period | $10.41 | $8.24 | $9.51 |
| Total ReturnE,F | 27.70% | (10.80)% | (1.60)% |
| Ratios to Average Net AssetsG | | | |
| Expenses before reductions | 1.04%H | 1.04% | 1.04%H |
| Expenses net of fee waivers, if any | 1.04%H | 1.04% | 1.04%H |
| Expenses net of all reductions | 1.04%H | 1.04% | 1.04%H |
| Net investment income (loss) | (.44)%H | 1.26% | .07%H |
| Supplemental Data | | | |
| Net assets, end of period (000 omitted) | $489 | $298 | $99 |
| Portfolio turnover rateI | 24%H | 26% | 12%H |
A For the period August 31, 2018 (commencement of operations) to March 31, 2019.
B Calculated based on average shares outstanding during the period.
C Amount represents less than $.005 per share.
D Total distributions per share do not sum due to rounding.
E Total returns for periods of less than one year are not annualized.
F Total returns do not include the effect of the sales charges.
G Expense ratios reflect operating expenses of the class. Expenses before reductions do not reflect amounts reimbursed, waived, or reduced through arrangements with the investment adviser, brokerage services, or other offset arrangements, if applicable, and do not represent the amount paid by the class during periods when reimbursements, waivers or reductions occur.
H Annualized
I Amount does not include the portfolio activity of any underlying mutual funds or exchange-traded funds (ETFs).
See accompanying notes which are an integral part of the financial statements.
Fidelity Freedom Blend 2050 Fund Class C
| | Six months ended (Unaudited) September 30, | Years endedMarch 31, | |
| | 2020 | 2020 | 2019 A |
| Selected Per–Share Data | | | |
| Net asset value, beginning of period | $8.21 | $9.50 | $10.00 |
| Income from Investment Operations | | | |
| Net investment income (loss)B | (.05) | .07 | (.02) |
| Net realized and unrealized gain (loss) | 2.28 | (1.08) | (.20) |
| Total from investment operations | 2.23 | (1.01) | (.22) |
| Distributions from net investment income | – | (.12) | (.12) |
| Distributions from net realized gain | (.10) | (.16) | (.16) |
| Total distributions | (.10) | (.28) | (.28) |
| Net asset value, end of period | $10.34 | $8.21 | $9.50 |
| Total ReturnC,D,E | 27.31% | (11.22)% | (1.89)% |
| Ratios to Average Net AssetsF | | | |
| Expenses before reductions | 1.54%G | 1.54% | 1.54%G |
| Expenses net of fee waivers, if any | 1.54%G | 1.54% | 1.54%G |
| Expenses net of all reductions | 1.54%G | 1.54% | 1.54%G |
| Net investment income (loss) | (.94)%G | .76% | (.43)%G |
| Supplemental Data | | | |
| Net assets, end of period (000 omitted) | $644 | $449 | $137 |
| Portfolio turnover rateH | 24%G | 26% | 12%G |
A For the period August 31, 2018 (commencement of operations) to March 31, 2019.
B Calculated based on average shares outstanding during the period.
C Total returns for periods of less than one year are not annualized.
D Total returns would have been lower if certain expenses had not been reduced during the applicable periods shown.
E Total returns do not include the effect of the contingent deferred sales charge.
F Expense ratios reflect operating expenses of the class. Expenses before reductions do not reflect amounts reimbursed, waived, or reduced through arrangements with the investment adviser, brokerage services, or other offset arrangements, if applicable, and do not represent the amount paid by the class during periods when reimbursements, waivers or reductions occur.
G Annualized
H Amount does not include the portfolio activity of any underlying mutual funds or exchange-traded funds (ETFs).
See accompanying notes which are an integral part of the financial statements.
Fidelity Freedom Blend 2050 Fund
| | Six months ended (Unaudited) September 30, | Years endedMarch 31, | |
| | 2020 | 2020 | 2019 A |
| Selected Per–Share Data | | | |
| Net asset value, beginning of period | $8.26 | $9.51 | $10.00 |
| Income from Investment Operations | | | |
| Net investment income (loss)B | –C | .16 | .03 |
| Net realized and unrealized gain (loss) | 2.30 | (1.07) | (.21) |
| Total from investment operations | 2.30 | (.91) | (.18) |
| Distributions from net investment income | – | (.18) | (.15) |
| Distributions from net realized gain | (.11) | (.16) | (.16) |
| Total distributions | (.11) | (.34) | (.31) |
| Net asset value, end of period | $10.45 | $8.26 | $9.51 |
| Total ReturnD | 28.00% | (10.29)% | (1.39)% |
| Ratios to Average Net AssetsE | | | |
| Expenses before reductions | .54%F | .56%G | .54%F |
| Expenses net of fee waivers, if any | .54%F | .56%G | .54%F |
| Expenses net of all reductions | .54%F | .56%G | .54%F |
| Net investment income (loss) | .06%F | 1.75% | .57%F |
| Supplemental Data | | | |
| Net assets, end of period (000 omitted) | $16,133 | $9,530 | $466 |
| Portfolio turnover rateH | 24%F | 26% | 12%F |
A For the period August 31, 2018 (commencement of operations) to March 31, 2019.
B Calculated based on average shares outstanding during the period.
C Amount represents less than $.005 per share.
D Total returns for periods of less than one year are not annualized.
E Expense ratios reflect operating expenses of the class. Expenses before reductions do not reflect amounts reimbursed, waived, or reduced through arrangements with the investment adviser, brokerage services, or other offset arrangements, if applicable, and do not represent the amount paid by the class during periods when reimbursements, waivers or reductions occur.
F Annualized
G On certain classes, the size and fluctuation of net assets and expense amounts may cause ratios to differ from contractual rates.
H Amount does not include the portfolio activity of any underlying mutual funds or exchange-traded funds (ETFs).
See accompanying notes which are an integral part of the financial statements.
Fidelity Freedom Blend 2050 Fund Class K
| | Six months ended (Unaudited) September 30, | Years endedMarch 31, | |
| | 2020 | 2020 | 2019 A |
| Selected Per–Share Data | | | |
| Net asset value, beginning of period | $8.27 | $9.52 | $10.00 |
| Income from Investment Operations | | | |
| Net investment income (loss)B | .01 | .19 | .04 |
| Net realized and unrealized gain (loss) | 2.28 | (1.09) | (.21) |
| Total from investment operations | 2.29 | (.90) | (.17) |
| Distributions from net investment income | – | (.19) | (.15) |
| Distributions from net realized gain | (.10) | (.16) | (.16) |
| Total distributions | (.10) | (.35) | (.31) |
| Net asset value, end of period | $10.46 | $8.27 | $9.52 |
| Total ReturnC | 27.93% | (10.17)% | (1.28)% |
| Ratios to Average Net AssetsD | | | |
| Expenses before reductions | .44%E | .44% | .44%E |
| Expenses net of fee waivers, if any | .44%E | .44% | .44%E |
| Expenses net of all reductions | .44%E | .44% | .44%E |
| Net investment income (loss) | .16%E | 1.86% | .67%E |
| Supplemental Data | | | |
| Net assets, end of period (000 omitted) | $7,289 | $8,346 | $99 |
| Portfolio turnover rateF | 24%E | 26% | 12%E |
A For the period August 31, 2018 (commencement of operations) to March 31, 2019.
B Calculated based on average shares outstanding during the period.
C Total returns for periods of less than one year are not annualized.
D Expense ratios reflect operating expenses of the class. Expenses before reductions do not reflect amounts reimbursed, waived, or reduced through arrangements with the investment adviser, brokerage services, or other offset arrangements, if applicable, and do not represent the amount paid by the class during periods when reimbursements, waivers or reductions occur.
E Annualized
F Amount does not include the portfolio activity of any underlying mutual funds or exchange-traded funds (ETFs).
See accompanying notes which are an integral part of the financial statements.
Fidelity Freedom Blend 2050 Fund Class K6
| | Six months ended (Unaudited) September 30, | Years endedMarch 31, | |
| | 2020 | 2020 | 2019 A |
| Selected Per–Share Data | | | |
| Net asset value, beginning of period | $8.28 | $9.52 | $10.00 |
| Income from Investment Operations | | | |
| Net investment income (loss)B | .01 | .19 | .04 |
| Net realized and unrealized gain (loss) | 2.30 | (1.08) | (.20) |
| Total from investment operations | 2.31 | (.89) | (.16) |
| Distributions from net investment income | – | (.18) | (.16) |
| Distributions from net realized gain | (.11) | (.17) | (.16) |
| Total distributions | (.11) | (.35) | (.32) |
| Net asset value, end of period | $10.48 | $8.28 | $9.52 |
| Total ReturnC | 28.07% | (10.13)% | (1.25)% |
| Ratios to Average Net AssetsD | | | |
| Expenses before reductions | .34%E | .34% | .35%E,F |
| Expenses net of fee waivers, if any | .34%E | .34% | .35%E,F |
| Expenses net of all reductions | .34%E | .34% | .35%E,F |
| Net investment income (loss) | .26%E | 1.96% | .76%E |
| Supplemental Data | | | |
| Net assets, end of period (000 omitted) | $511,740 | $344,082 | $7,480 |
| Portfolio turnover rateG | 24%E | 26% | 12%E |
A For the period August 31, 2018 (commencement of operations) to March 31, 2019.
B Calculated based on average shares outstanding during the period.
C Total returns for periods of less than one year are not annualized.
D Expense ratios reflect operating expenses of the class. Expenses before reductions do not reflect amounts reimbursed, waived, or reduced through arrangements with the investment adviser, brokerage services, or other offset arrangements, if applicable, and do not represent the amount paid by the class during periods when reimbursements, waivers or reductions occur.
E Annualized
F On certain classes, the size and fluctuation of net assets and expense amounts may cause ratios to differ from contractual rates.
G Amount does not include the portfolio activity of any underlying mutual funds or exchange-traded funds (ETFs).
See accompanying notes which are an integral part of the financial statements.
Fidelity Freedom Blend 2050 Fund Class I
| | Six months ended (Unaudited) September 30, | Years endedMarch 31, | |
| | 2020 | 2020 | 2019 A |
| Selected Per–Share Data | | | |
| Net asset value, beginning of period | $8.26 | $9.52 | $10.00 |
| Income from Investment Operations | | | |
| Net investment income (loss)B | –C | .17 | .03 |
| Net realized and unrealized gain (loss) | 2.29 | (1.08) | (.20) |
| Total from investment operations | 2.29 | (.91) | (.17) |
| Distributions from net investment income | – | (.19) | (.15) |
| Distributions from net realized gain | (.10) | (.16) | (.16) |
| Total distributions | (.10) | (.35) | (.31) |
| Net asset value, end of period | $10.45 | $8.26 | $9.52 |
| Total ReturnD | 27.95% | (10.32)% | (1.32)% |
| Ratios to Average Net AssetsE | | | |
| Expenses before reductions | .54%F | .54% | .54%F |
| Expenses net of fee waivers, if any | .54%F | .54% | .54%F |
| Expenses net of all reductions | .54%F | .54% | .54%F |
| Net investment income (loss) | .06%F | 1.76% | .57%F |
| Supplemental Data | | | |
| Net assets, end of period (000 omitted) | $5,725 | $3,181 | $101 |
| Portfolio turnover rateG | 24%F | 26% | 12%F |
A For the period August 31, 2018 (commencement of operations) to March 31, 2019.
B Calculated based on average shares outstanding during the period.
C Amount represents less than $.005 per share.
D Total returns for periods of less than one year are not annualized.
E Expense ratios reflect operating expenses of the class. Expenses before reductions do not reflect amounts reimbursed, waived, or reduced through arrangements with the investment adviser, brokerage services, or other offset arrangements, if applicable, and do not represent the amount paid by the class during periods when reimbursements, waivers or reductions occur.
F Annualized
G Amount does not include the portfolio activity of any underlying mutual funds or exchange-traded funds (ETFs).
See accompanying notes which are an integral part of the financial statements.
Fidelity Freedom Blend 2050 Fund Class Z
| | Six months ended (Unaudited) September 30, | Years endedMarch 31, | |
| | 2020 | 2020 | 2019 A |
| Selected Per–Share Data | | | |
| Net asset value, beginning of period | $8.28 | $9.52 | $10.00 |
| Income from Investment Operations | | | |
| Net investment income (loss)B | .01 | .18 | .04 |
| Net realized and unrealized gain (loss) | 2.29 | (1.09) | (.21) |
| Total from investment operations | 2.30 | (.91) | (.17) |
| Distributions from net investment income | – | (.17) | (.15) |
| Distributions from net realized gain | (.10) | (.16) | (.16) |
| Total distributions | (.10) | (.33) | (.31) |
| Net asset value, end of period | $10.48 | $8.28 | $9.52 |
| Total ReturnC | 28.01% | (10.24)% | (1.28)% |
| Ratios to Average Net AssetsD | | | |
| Expenses before reductions | .44%E | .44% | .44%E |
| Expenses net of fee waivers, if any | .44%E | .44% | .44%E |
| Expenses net of all reductions | .44%E | .44% | .44%E |
| Net investment income (loss) | .16%E | 1.86% | .67%E |
| Supplemental Data | | | |
| Net assets, end of period (000 omitted) | $113 | $89 | $99 |
| Portfolio turnover rateF | 24%E | 26% | 12%E |
A For the period August 31, 2018 (commencement of operations) to March 31, 2019.
B Calculated based on average shares outstanding during the period.
C Total returns for periods of less than one year are not annualized.
D Expense ratios reflect operating expenses of the class. Expenses before reductions do not reflect amounts reimbursed, waived, or reduced through arrangements with the investment adviser, brokerage services, or other offset arrangements, if applicable, and do not represent the amount paid by the class during periods when reimbursements, waivers or reductions occur.
E Annualized
F Amount does not include the portfolio activity of any underlying mutual funds or exchange-traded funds (ETFs).
See accompanying notes which are an integral part of the financial statements.
Fidelity Freedom Blend 2050 Fund Class Z6
| | Six months ended (Unaudited) September 30, | Years endedMarch 31, | |
| | 2020 | 2020 | 2019 A |
| Selected Per–Share Data | | | |
| Net asset value, beginning of period | $8.28 | $9.52 | $10.00 |
| Income from Investment Operations | | | |
| Net investment income (loss)B | .01 | .18 | .04 |
| Net realized and unrealized gain (loss) | 2.30 | (1.08) | (.20) |
| Total from investment operations | 2.31 | (.90) | (.16) |
| Distributions from net investment income | – | (.18) | (.16) |
| Distributions from net realized gain | (.11) | (.16) | (.16) |
| Total distributions | (.11) | (.34) | (.32) |
| Net asset value, end of period | $10.48 | $8.28 | $9.52 |
| Total ReturnC | 28.11% | (10.15)% | (1.25)% |
| Ratios to Average Net AssetsD | | | |
| Expenses before reductions | .34%E | .35%F | .34%E |
| Expenses net of fee waivers, if any | .34%E | .35%F | .34%E |
| Expenses net of all reductions | .34%E | .35%F | .34%E |
| Net investment income (loss) | .26%E | 1.95% | .77%E |
| Supplemental Data | | | |
| Net assets, end of period (000 omitted) | $2,579 | $1,968 | $99 |
| Portfolio turnover rateG | 24%E | 26% | 12%E |
A For the period August 31, 2018 (commencement of operations) to March 31, 2019.
B Calculated based on average shares outstanding during the period.
C Total returns for periods of less than one year are not annualized.
D Expense ratios reflect operating expenses of the class. Expenses before reductions do not reflect amounts reimbursed, waived, or reduced through arrangements with the investment adviser, brokerage services, or other offset arrangements, if applicable, and do not represent the amount paid by the class during periods when reimbursements, waivers or reductions occur.
E Annualized
F On certain classes, the size and fluctuation of net assets and expense amounts may cause ratios to differ from contractual rates.
G Amount does not include the portfolio activity of any underlying mutual funds or exchange-traded funds (ETFs).
See accompanying notes which are an integral part of the financial statements.
Fidelity Freedom® Blend 2055 Fund
Investment Summary (Unaudited)
The information in the following tables is based on the direct investments of the Fund.
Top Holdings as of September 30, 2020
| | % of fund's net assets |
| Fidelity Series Large Cap Value Index Fund | 14.4 |
| Fidelity Series Emerging Markets Opportunities Fund | 14.0 |
| Fidelity Series Blue Chip Growth Fund | 11.1 |
| Fidelity Series Large Cap Stock Fund | 7.6 |
| Fidelity Series Large Cap Growth Index Fund | 7.1 |
| Fidelity Series International Growth Fund | 6.1 |
| Fidelity Series Overseas Fund | 6.1 |
| Fidelity Series International Value Fund | 6.1 |
| Fidelity Series Value Discovery Fund | 5.3 |
| Fidelity Series Small Cap Opportunities Fund | 3.6 |
| | 81.4 |
Asset Allocation (% of fund's net assets)
| Period end |
| | Domestic Equity Funds | 51.6% |
| | International Equity Funds | 40.8% |
| | Bond Funds | 6.2% |
| | Short-Term Funds | 1.4% |

Domestic Equity Funds category includes Fidelity Series Commodity Strategy Fund which invests in commodity-related investments.
Fidelity Freedom® Blend 2055 Fund
Schedule of Investments September 30, 2020 (Unaudited)
Showing Percentage of Net Assets
| Domestic Equity Funds - 51.6% | | | |
| | | Shares | Value |
| Fidelity Series Blue Chip Growth Fund (a) | | 1,915,011 | $31,616,835 |
| Fidelity Series Commodity Strategy Fund (a) | | 1,732,967 | 7,209,142 |
| Fidelity Series Large Cap Growth Index Fund (a) | | 1,421,410 | 20,240,876 |
| Fidelity Series Large Cap Stock Fund (a) | | 1,539,922 | 21,805,294 |
| Fidelity Series Large Cap Value Index Fund (a) | | 3,555,489 | 41,243,667 |
| Fidelity Series Small Cap Opportunities Fund (a) | | 813,280 | 10,377,453 |
| Fidelity Series Value Discovery Fund (a) | | 1,211,361 | 14,972,425 |
| TOTAL DOMESTIC EQUITY FUNDS | | | |
| (Cost $140,480,901) | | | 147,465,692 |
|
| International Equity Funds - 40.8% | | | |
| Fidelity Series Canada Fund (a) | | 657,343 | 6,724,619 |
| Fidelity Series Emerging Markets Fund (a) | | 470,977 | 4,441,317 |
| Fidelity Series Emerging Markets Opportunities Fund (a) | | 1,902,073 | 39,905,493 |
| Fidelity Series International Growth Fund (a) | | 930,189 | 17,468,943 |
| Fidelity Series International Index Fund (a) | | 725,646 | 7,212,921 |
| Fidelity Series International Small Cap Fund (a) | | 345,680 | 6,153,099 |
| Fidelity Series International Value Fund (a) | | 2,011,464 | 17,338,822 |
| Fidelity Series Overseas Fund (a) | | 1,560,246 | 17,443,547 |
| TOTAL INTERNATIONAL EQUITY FUNDS | | | |
| (Cost $106,890,573) | | | 116,688,761 |
|
| Bond Funds - 6.2% | | | |
| Fidelity Series Corporate Bond Fund (a) | | 2,955 | 33,245 |
| Fidelity Series Emerging Markets Debt Fund (a) | | 190,112 | 1,722,410 |
| Fidelity Series Floating Rate High Income Fund (a) | | 43,684 | 386,603 |
| Fidelity Series Government Bond Index Fund (a) | | 3,527 | 39,675 |
| Fidelity Series High Income Fund (a) | | 214,940 | 1,960,250 |
| Fidelity Series Inflation-Protected Bond Index Fund (a) | | 541,739 | 5,796,610 |
| Fidelity Series Investment Grade Bond Fund (a) | | 3,636 | 44,507 |
| Fidelity Series Investment Grade Securitized Fund (a) | | 2,828 | 30,171 |
| Fidelity Series Long-Term Treasury Bond Index Fund (a) | | 639,590 | 6,606,962 |
| Fidelity Series Real Estate Income Fund (a) | | 117,731 | 1,174,959 |
| TOTAL BOND FUNDS | | | |
| (Cost $17,094,119) | | | 17,795,392 |
|
| Short-Term Funds - 1.4% | | | |
| Fidelity Series Government Money Market Fund 0.16% (a)(b) | | 531,016 | 531,016 |
| Fidelity Series Short-Term Credit Fund (a) | | 55,458 | 568,445 |
| Fidelity Series Treasury Bill Index Fund (a) | | 287,712 | 2,879,996 |
| TOTAL SHORT-TERM FUNDS | | | |
| (Cost $3,971,115) | | | 3,979,457 |
| TOTAL INVESTMENT IN SECURITIES - 100.0% | | | |
| (Cost $268,436,708) | | | 285,929,302 |
| NET OTHER ASSETS (LIABILITIES) - 0.0% | | | (4,314) |
| NET ASSETS - 100% | | | $285,924,988 |
Legend
(a) Affiliated Fund
(b) The rate quoted is the annualized seven-day yield of the fund at period end.
Affiliated Underlying Funds
Fiscal year to date information regarding the Fund's investments in affiliated Underlying Funds, excluding any Money Market Central Funds, is presented below. Exchanges between classes of the same affiliated Underlying Funds may occur.
| Affiliate | Value, beginning of period | Purchases | Sales Proceeds | Dividend Income | Realized Gain (loss) | Change in Unrealized appreciation (depreciation) | Value, end of period |
| Fidelity Series Blue Chip Growth Fund | $17,629,639 | $13,421,819 | $5,287,953 | $6,217,447 | $640,307 | $5,213,023 | $31,616,835 |
| Fidelity Series Canada Fund | 4,240,298 | 1,757,828 | 383,838 | -- | (41,533) | 1,151,864 | 6,724,619 |
| Fidelity Series Commodity Strategy Fund | 6,154,116 | 1,718,548 | 1,484,603 | 30,313 | (210,578) | 1,031,659 | 7,209,142 |
| Fidelity Series Corporate Bond Fund | 53,784 | 13,790 | 36,425 | 407 | (3,077) | 5,173 | 33,245 |
| Fidelity Series Emerging Markets Debt Fund | 1,218,132 | 366,291 | 31,307 | 41,327 | 41 | 169,253 | 1,722,410 |
| Fidelity Series Emerging Markets Fund | 2,188,485 | 1,446,382 | 131,767 | -- | 5,304 | 932,913 | 4,441,317 |
| Fidelity Series Emerging Markets Opportunities Fund | 20,148,369 | 11,998,538 | 1,021,003 | -- | 62,728 | 8,716,861 | 39,905,493 |
| Fidelity Series Floating Rate High Income Fund | 276,620 | 86,424 | 7,574 | 7,761 | 41 | 31,092 | 386,603 |
| Fidelity Series Government Bond Index Fund | 81,727 | 12,672 | 54,740 | 254 | (49) | 65 | 39,675 |
| Fidelity Series Government Money Market Fund 0.16% | 1,593,579 | 2,610,083 | 3,672,646 | 1,321 | -- | -- | 531,016 |
| Fidelity Series High Income Fund | 1,391,175 | 441,694 | 37,871 | 48,593 | 315 | 164,937 | 1,960,250 |
| Fidelity Series Inflation-Protected Bond Index Fund | 4,124,271 | 1,945,403 | 556,117 | 3,797 | (4,522) | 287,575 | 5,796,610 |
| Fidelity Series International Growth Fund | 12,262,644 | 3,711,173 | 2,418,517 | -- | 80,177 | 3,833,466 | 17,468,943 |
| Fidelity Series International Index Fund | 4,826,634 | 1,595,232 | 352,947 | -- | (8,849) | 1,152,851 | 7,212,921 |
| Fidelity Series International Small Cap Fund | 3,637,021 | 1,262,604 | 113,240 | -- | 6,878 | 1,359,836 | 6,153,099 |
| Fidelity Series International Value Fund | 11,761,177 | 4,192,813 | 1,359,721 | -- | (15,052) | 2,759,605 | 17,338,822 |
| Fidelity Series Investment Grade Bond Fund | 81,226 | 16,172 | 54,736 | 478 | (2,086) | 3,931 | 44,507 |
| Fidelity Series Investment Grade Securitized Fund | 56,141 | 11,847 | 38,046 | 155 | 2 | 227 | 30,171 |
| Fidelity Series Large Cap Growth Index Fund | 13,163,490 | 4,612,025 | 3,606,474 | 341,379 | 277,827 | 5,794,008 | 20,240,876 |
| Fidelity Series Large Cap Stock Fund | 13,693,571 | 6,398,423 | 959,503 | 729,535 | (9,996) | 2,682,799 | 21,805,294 |
| Fidelity Series Large Cap Value Index Fund | 25,373,711 | 11,193,096 | 1,111,281 | -- | (29,731) | 5,817,872 | 41,243,667 |
| Fidelity Series Long-Term Treasury Bond Index Fund | 4,648,520 | 2,950,876 | 835,293 | 130,944 | (11,284) | (145,857) | 6,606,962 |
| Fidelity Series Overseas Fund | 11,770,612 | 4,303,491 | 2,411,828 | -- | (142,940) | 3,924,212 | 17,443,547 |
| Fidelity Series Real Estate Income Fund | 758,851 | 282,112 | 23,745 | 35,757 | (153) | 157,894 | 1,174,959 |
| Fidelity Series Short-Term Credit Fund | 541,937 | 6,183 | -- | 6,150 | -- | 20,325 | 568,445 |
| Fidelity Series Small Cap Opportunities Fund | 6,788,869 | 2,537,232 | 768,595 | 61,545 | (139,555) | 1,959,502 | 10,377,453 |
| Fidelity Series Treasury Bill Index Fund | 4,803,949 | 87,432 | 1,995,562 | 18,563 | (6,213) | (9,610) | 2,879,996 |
| Fidelity Series Value Discovery Fund | 7,961,607 | 5,066,308 | 251,427 | -- | 8,196 | 2,187,741 | 14,972,425 |
| | 181,230,155 | 84,046,491 | 29,006,759 | 7,675,726 | 456,198 | 49,203,217 | 285,929,302 |
Amounts in the income column in the above table include any capital gain distributions from underlying funds, which are presented in the corresponding line-item in the Statement of Operations, if applicable.
Investment Valuation
The following is a summary of the inputs used, as of September 30, 2020, involving the Fund's assets and liabilities carried at fair value. The inputs or methodology used for valuing securities may not be an indication of the risk associated with investing in those securities. For more information on valuation inputs, and their aggregation into the levels used below, please refer to the Investment Valuation section in the accompanying Notes to Financial Statements.
| | Valuation Inputs at Reporting Date: |
| Description | Total | Level 1 | Level 2 | Level 3 |
| Investments in Securities: | | | | |
| Domestic Equity Funds | $147,465,692 | $147,465,692 | $-- | $-- |
| International Equity Funds | 116,688,761 | 116,688,761 | -- | -- |
| Bond Funds | 17,795,392 | 17,795,392 | -- | -- |
| Short-Term Funds | 3,979,457 | 3,979,457 | -- | -- |
| Total Investments in Securities: | $285,929,302 | $285,929,302 | $-- | $-- |
See accompanying notes which are an integral part of the financial statements.
Fidelity Freedom® Blend 2055 Fund
Financial Statements
Statement of Assets and Liabilities
| | | September 30, 2020 (Unaudited) |
| Assets | | |
Investment in securities, at value — See accompanying schedule:
| | |
| Affiliated issuers (cost $268,436,708) | $285,929,302 | |
| Total Investment in Securities (cost $268,436,708) | | $285,929,302 |
| Cash | | 214 |
| Receivable for investments sold | | 1,607,151 |
| Receivable for fund shares sold | | 898,790 |
| Total assets | | 288,435,457 |
| Liabilities | | |
| Payable for investments purchased | $2,388,529 | |
| Payable for fund shares redeemed | 37,675 | |
| Accrued management fee | 83,708 | |
| Distribution and service plan fees payable | 557 | |
| Total liabilities | | 2,510,469 |
| Net Assets | | $285,924,988 |
| Net Assets consist of: | | |
| Paid in capital | | $262,135,631 |
| Total accumulated earnings (loss) | | 23,789,357 |
| Net Assets | | $285,924,988 |
| Net Asset Value and Maximum Offering Price | | |
| Class A: | | |
| Net Asset Value and redemption price per share ($842,911 ÷ 80,468 shares)(a) | | $10.48 |
| Maximum offering price per share (100/94.25 of $10.47) | | $11.11 |
| Class M: | | |
| Net Asset Value and redemption price per share ($432,296 ÷ 41,360 shares)(a) | | $10.45 |
| Maximum offering price per share (100/96.50 of $10.45) | | $10.83 |
| Class C: | | |
| Net Asset Value and offering price per share ($251,865 ÷ 24,239 shares)(a) | | $10.39 |
| Fidelity Freedom Blend 2055 Fund: | | |
| Net Asset Value, offering price and redemption price per share ($9,164,773 ÷ 872,750 shares) | | $10.50 |
| Class K: | | |
| Net Asset Value, offering price and redemption price per share ($4,672,993 ÷ 444,790 shares) | | $10.51 |
| Class K6: | | |
| Net Asset Value, offering price and redemption price per share ($266,116,863 ÷ 25,280,861 shares) | | $10.53 |
| Class I: | | |
| Net Asset Value, offering price and redemption price per share ($3,317,906 ÷ 316,117 shares) | | $10.50 |
| Class Z: | | |
| Net Asset Value, offering price and redemption price per share ($113,537 ÷ 10,786 shares) | | $10.53 |
| Class Z6: | | |
| Net Asset Value, offering price and redemption price per share ($1,011,844 ÷ 96,146 shares) | | $10.52 |
(a) Redemption price per share is equal to net asset value less any applicable contingent deferred sales charge.
See accompanying notes which are an integral part of the financial statements.
Statement of Operations
| | | Six months ended September 30, 2020 (Unaudited) |
| Investment Income | | |
| Dividends: | | |
| Affiliated issuers | | $753,460 |
| Expenses | | |
| Management fee | $438,145 | |
| Distribution and service plan fees | 2,748 | |
| Independent trustees' fees and expenses | 313 | |
| Total expenses | | 441,206 |
| Net investment income (loss) | | 312,254 |
| Realized and Unrealized Gain (Loss) | | |
| Net realized gain (loss) on: | | |
| Investment securities: | | |
| Affiliated issuers | 456,198 | |
| Capital gain distributions from underlying funds: | | |
| Affiliated issuers | 6,922,266 | |
| Total net realized gain (loss) | | 7,378,464 |
| Change in net unrealized appreciation (depreciation) on: | | |
| Investment securities: | | |
| Affiliated issuers | 49,203,217 | |
| Total change in net unrealized appreciation (depreciation) | | 49,203,217 |
| Net gain (loss) | | 56,581,681 |
| Net increase (decrease) in net assets resulting from operations | | $56,893,935 |
See accompanying notes which are an integral part of the financial statements.
Statement of Changes in Net Assets
| | Six months ended September 30, 2020 (Unaudited) | Year ended March 31, 2020 |
| Increase (Decrease) in Net Assets | | |
| Operations | | |
| Net investment income (loss) | $312,254 | $2,761,863 |
| Net realized gain (loss) | 7,378,464 | 3,031,085 |
| Change in net unrealized appreciation (depreciation) | 49,203,217 | (31,971,950) |
| Net increase (decrease) in net assets resulting from operations | 56,893,935 | (26,179,002) |
| Distributions to shareholders | (2,085,875) | (5,105,487) |
| Share transactions - net increase (decrease) | 49,889,218 | 207,416,351 |
| Total increase (decrease) in net assets | 104,697,278 | 176,131,862 |
| Net Assets | | |
| Beginning of period | 181,227,710 | 5,095,848 |
| End of period | $285,924,988 | $181,227,710 |
See accompanying notes which are an integral part of the financial statements.
Financial Highlights
Fidelity Freedom Blend 2055 Fund Class A
| | Six months ended (Unaudited) September 30, | Years endedMarch 31, | |
| | 2020 | 2020 | 2019 A |
| Selected Per–Share Data | | | |
| Net asset value, beginning of period | $8.27 | $9.51 | $10.00 |
| Income from Investment Operations | | | |
| Net investment income (loss)B | (.01) | .16 | .04 |
| Net realized and unrealized gain (loss) | 2.31 | (1.10) | (.22) |
| Total from investment operations | 2.30 | (.94) | (.18) |
| Distributions from net investment income | – | (.15) | (.14) |
| Distributions from net realized gain | (.09) | (.14) | (.16) |
| Total distributions | (.09) | (.30)C | (.31)C |
| Net asset value, end of period | $10.48 | $8.27 | $9.51 |
| Total ReturnD,E | 27.92% | (10.55)% | (1.46)% |
| Ratios to Average Net AssetsF | | | |
| Expenses before reductions | .79%G | .79% | .79%G |
| Expenses net of fee waivers, if any | .79%G | .79% | .79%G |
| Expenses net of all reductions | .79%G | .79% | .79%G |
| Net investment income (loss) | (.19)%G | 1.58% | .70%G |
| Supplemental Data | | | |
| Net assets, end of period (000 omitted) | $843 | $393 | $151 |
| Portfolio turnover rateH | 24%G | 26% | 14%G |
A For the period August 31, 2018 (commencement of operations) to March 31, 2019.
B Calculated based on average shares outstanding during the period.
C Total distributions per share do not sum due to rounding.
D Total returns for periods of less than one year are not annualized.
E Total returns do not include the effect of the sales charges.
F Expense ratios reflect operating expenses of the class. Expenses before reductions do not reflect amounts reimbursed, waived, or reduced through arrangements with the investment adviser, brokerage services, or other offset arrangements, if applicable, and do not represent the amount paid by the class during periods when reimbursements, waivers or reductions occur.
G Annualized
H Amount does not include the portfolio activity of any underlying mutual funds or exchange-traded funds (ETFs).
See accompanying notes which are an integral part of the financial statements.
Fidelity Freedom Blend 2055 Fund Class M
| | Six months ended (Unaudited) September 30, | Years endedMarch 31, | |
| | 2020 | 2020 | 2019 A |
| Selected Per–Share Data | | | |
| Net asset value, beginning of period | $8.27 | $9.51 | $10.00 |
| Income from Investment Operations | | | |
| Net investment income (loss)B | (.02) | .13 | .02 |
| Net realized and unrealized gain (loss) | 2.29 | (1.09) | (.21) |
| Total from investment operations | 2.27 | (.96) | (.19) |
| Distributions from net investment income | – | (.13) | (.13) |
| Distributions from net realized gain | (.09) | (.14) | (.16) |
| Total distributions | (.09) | (.28)C | (.30)C |
| Net asset value, end of period | $10.45 | $8.27 | $9.51 |
| Total ReturnD,E | 27.55% | (10.73)% | (1.55)% |
| Ratios to Average Net AssetsF | | | |
| Expenses before reductions | 1.04%G | 1.04% | 1.04%G |
| Expenses net of fee waivers, if any | 1.04%G | 1.04% | 1.04%G |
| Expenses net of all reductions | 1.04%G | 1.04% | 1.04%G |
| Net investment income (loss) | (.44)%G | 1.33% | .45%G |
| Supplemental Data | | | |
| Net assets, end of period (000 omitted) | $432 | $249 | $101 |
| Portfolio turnover rateH | 24%G | 26% | 14%G |
A For the period August 31, 2018 (commencement of operations) to March 31, 2019.
B Calculated based on average shares outstanding during the period.
C Total distributions per share do not sum due to rounding.
D Total returns for periods of less than one year are not annualized.
E Total returns do not include the effect of the sales charges.
F Expense ratios reflect operating expenses of the class. Expenses before reductions do not reflect amounts reimbursed, waived, or reduced through arrangements with the investment adviser, brokerage services, or other offset arrangements, if applicable, and do not represent the amount paid by the class during periods when reimbursements, waivers or reductions occur.
G Annualized
H Amount does not include the portfolio activity of any underlying mutual funds or exchange-traded funds (ETFs).}
See accompanying notes which are an integral part of the financial statements.
Fidelity Freedom Blend 2055 Fund Class C
| | Six months ended (Unaudited) September 30, | Years endedMarch 31, | |
| | 2020 | 2020 | 2019 A |
| Selected Per–Share Data | | | |
| Net asset value, beginning of period | $8.24 | $9.49 | $10.00 |
| Income from Investment Operations | | | |
| Net investment income (loss)B | (.05) | .08 | –C |
| Net realized and unrealized gain (loss) | 2.29 | (1.08) | (.23) |
| Total from investment operations | 2.24 | (1.00) | (.23) |
| Distributions from net investment income | – | (.10) | (.12) |
| Distributions from net realized gain | (.09) | (.14) | (.16) |
| Total distributions | (.09) | (.25)D | (.28) |
| Net asset value, end of period | $10.39 | $8.24 | $9.49 |
| Total ReturnE,F | 27.29% | (11.12)% | (1.93)% |
| Ratios to Average Net AssetsG | | | |
| Expenses before reductions | 1.54%H | 1.54% | 1.54%H |
| Expenses net of fee waivers, if any | 1.54%H | 1.54% | 1.54%H |
| Expenses net of all reductions | 1.54%H | 1.54% | 1.54%H |
| Net investment income (loss) | (.94)%H | .83% | (.05)%H |
| Supplemental Data | | | |
| Net assets, end of period (000 omitted) | $252 | $153 | $107 |
| Portfolio turnover rateI | 24%H | 26% | 14%H |
A For the period August 31, 2018 (commencement of operations) to March 31, 2019.
B Calculated based on average shares outstanding during the period.
C Amount represents less than $.005 per share.
D Total distributions per share do not sum due to rounding.
E Total returns for periods of less than one year are not annualized.
F Total returns do not include the effect of the contingent deferred sales charge.
G Expense ratios reflect operating expenses of the class. Expenses before reductions do not reflect amounts reimbursed, waived, or reduced through arrangements with the investment adviser, brokerage services, or other offset arrangements, if applicable, and do not represent the amount paid by the class during periods when reimbursements, waivers or reductions occur.
H Annualized
I Amount does not include the portfolio activity of any underlying mutual funds or exchange-traded funds (ETFs).
See accompanying notes which are an integral part of the financial statements.
Fidelity Freedom Blend 2055 Fund
| | Six months ended (Unaudited) September 30, | Years endedMarch 31, | |
| | 2020 | 2020 | 2019 A |
| Selected Per–Share Data | | | |
| Net asset value, beginning of period | $8.29 | $9.51 | $10.00 |
| Income from Investment Operations | | | |
| Net investment income (loss)B | –C | .17 | .05 |
| Net realized and unrealized gain (loss) | 2.30 | (1.08) | (.22) |
| Total from investment operations | 2.30 | (.91) | (.17) |
| Distributions from net investment income | – | (.17) | (.15) |
| Distributions from net realized gain | (.09) | (.14) | (.16) |
| Total distributions | (.09) | (.31) | (.32)D |
| Net asset value, end of period | $10.50 | $8.29 | $9.51 |
| Total ReturnE | 27.92% | (10.22)% | (1.35)% |
| Ratios to Average Net AssetsF | | | |
| Expenses before reductions | .54%G | .56%H | .54%G |
| Expenses net of fee waivers, if any | .54%G | .56%H | .54%G |
| Expenses net of all reductions | .54%G | .56%H | .54%G |
| Net investment income (loss) | .06%G | 1.82% | .95%G |
| Supplemental Data | | | |
| Net assets, end of period (000 omitted) | $9,165 | $5,211 | $320 |
| Portfolio turnover rateI | 24%G | 26% | 14%G |
A For the period August 31, 2018 (commencement of operations) to March 31, 2019.
B Calculated based on average shares outstanding during the period.
C Amount represents less than $.005 per share.
D Total distributions per share do not sum due to rounding.
E Total returns for periods of less than one year are not annualized.
F Expense ratios reflect operating expenses of the class. Expenses before reductions do not reflect amounts reimbursed, waived, or reduced through arrangements with the investment adviser, brokerage services, or other offset arrangements, if applicable, and do not represent the amount paid by the class during periods when reimbursements, waivers or reductions occur.
G Annualized
H On certain classes, the size and fluctuation of net assets and expense amounts may cause ratios to differ from contractual rates.
I Amount does not include the portfolio activity of any underlying mutual funds or exchange-traded funds (ETFs).
See accompanying notes which are an integral part of the financial statements.
Fidelity Freedom Blend 2055 Fund Class K
| | Six months ended (Unaudited) September 30, | Years endedMarch 31, | |
| | 2020 | 2020 | 2019 A |
| Selected Per–Share Data | | | |
| Net asset value, beginning of period | $8.29 | $9.52 | $10.00 |
| Income from Investment Operations | | | |
| Net investment income (loss)B | .01 | .19 | .06 |
| Net realized and unrealized gain (loss) | 2.30 | (1.09) | (.22) |
| Total from investment operations | 2.31 | (.90) | (.16) |
| Distributions from net investment income | – | (.19) | (.15) |
| Distributions from net realized gain | (.09) | (.14) | (.16) |
| Total distributions | (.09) | (.33) | (.32)C |
| Net asset value, end of period | $10.51 | $8.29 | $9.52 |
| Total ReturnD | 28.00% | (10.17)% | (1.23)% |
| Ratios to Average Net AssetsE | | | |
| Expenses before reductions | .44%F | .44% | .44%F |
| Expenses net of fee waivers, if any | .44%F | .44% | .44%F |
| Expenses net of all reductions | .44%F | .44% | .44%F |
| Net investment income (loss) | .16%F | 1.93% | 1.05%F |
| Supplemental Data | | | |
| Net assets, end of period (000 omitted) | $4,673 | $4,757 | $99 |
| Portfolio turnover rateG | 24%F | 26% | 14%F |
A For the period August 31, 2018 (commencement of operations) to March 31, 2019.
B Calculated based on average shares outstanding during the period.
C Total distributions per share do not sum due to rounding.
D Total returns for periods of less than one year are not annualized.
E Expense ratios reflect operating expenses of the class. Expenses before reductions do not reflect amounts reimbursed, waived, or reduced through arrangements with the investment adviser, brokerage services, or other offset arrangements, if applicable, and do not represent the amount paid by the class during periods when reimbursements, waivers or reductions occur.
F Annualized
G Amount does not include the portfolio activity of any underlying mutual funds or exchange-traded funds (ETFs).
See accompanying notes which are an integral part of the financial statements.
Fidelity Freedom Blend 2055 Fund Class K6
| | Six months ended (Unaudited) September 30, | Years endedMarch 31, | |
| | 2020 | 2020 | 2019 A |
| Selected Per–Share Data | | | |
| Net asset value, beginning of period | $8.30 | $9.52 | $10.00 |
| Income from Investment Operations | | | |
| Net investment income (loss)B | .01 | .20 | .06 |
| Net realized and unrealized gain (loss) | 2.31 | (1.10) | (.22) |
| Total from investment operations | 2.32 | (.90) | (.16) |
| Distributions from net investment income | – | (.18) | (.16) |
| Distributions from net realized gain | (.09) | (.15) | (.16) |
| Total distributions | (.09) | (.32)C | (.32) |
| Net asset value, end of period | $10.53 | $8.30 | $9.52 |
| Total ReturnD | 28.14% | (10.11)% | (1.19)% |
| Ratios to Average Net AssetsE | | | |
| Expenses before reductions | .34%F | .34% | .35%F,G |
| Expenses net of fee waivers, if any | .34%F | .34% | .35%F,G |
| Expenses net of all reductions | .34%F | .34% | .35%F,G |
| Net investment income (loss) | .26%F | 2.03% | 1.15%F |
| Supplemental Data | | | |
| Net assets, end of period (000 omitted) | $266,117 | $167,831 | $4,021 |
| Portfolio turnover rateH | 24%F | 26% | 14%F |
A For the period August 31, 2018 (commencement of operations) to March 31, 2019.
B Calculated based on average shares outstanding during the period.
C Total distributions per share do not sum due to rounding.
D Total returns for periods of less than one year are not annualized.
E Expense ratios reflect operating expenses of the class. Expenses before reductions do not reflect amounts reimbursed, waived, or reduced through arrangements with the investment adviser, brokerage services, or other offset arrangements, if applicable, and do not represent the amount paid by the class during periods when reimbursements, waivers or reductions occur.
F Annualized
G On certain classes, the size and fluctuation of net assets and expense amounts may cause ratios to differ from contractual rates.
H Amount does not include the portfolio activity of any underlying mutual funds or exchange-traded funds (ETFs).
See accompanying notes which are an integral part of the financial statements.
Fidelity Freedom Blend 2055 Fund Class I
| | Six months ended (Unaudited) September 30, | Years endedMarch 31, | |
| | 2020 | 2020 | 2019 A |
| Selected Per–Share Data | | | |
| Net asset value, beginning of period | $8.28 | $9.52 | $10.00 |
| Income from Investment Operations | | | |
| Net investment income (loss)B | –C | .18 | .05 |
| Net realized and unrealized gain (loss) | 2.31 | (1.10) | (.22) |
| Total from investment operations | 2.31 | (.92) | (.17) |
| Distributions from net investment income | – | (.18) | (.15) |
| Distributions from net realized gain | (.09) | (.14) | (.16) |
| Total distributions | (.09) | (.32) | (.31) |
| Net asset value, end of period | $10.50 | $8.28 | $9.52 |
| Total ReturnD | 28.02% | (10.32)% | (1.27)% |
| Ratios to Average Net AssetsE | | | |
| Expenses before reductions | .54%F | .54% | .54%F |
| Expenses net of fee waivers, if any | .54%F | .54% | .54%F |
| Expenses net of all reductions | .54%F | .54% | .54%F |
| Net investment income (loss) | .06%F | 1.83% | .95%F |
| Supplemental Data | | | |
| Net assets, end of period (000 omitted) | $3,318 | $1,851 | $99 |
| Portfolio turnover rateG | 24%F | 26% | 14%F |
A For the period August 31, 2018 (commencement of operations) to March 31, 2019.
B Calculated based on average shares outstanding during the period.
C Amount represents less than $.005 per share.
D Total returns for periods of less than one year are not annualized.
E Expense ratios reflect operating expenses of the class. Expenses before reductions do not reflect amounts reimbursed, waived, or reduced through arrangements with the investment adviser, brokerage services, or other offset arrangements, if applicable, and do not represent the amount paid by the class during periods when reimbursements, waivers or reductions occur.
F Annualized
G Amount does not include the portfolio activity of any underlying mutual funds or exchange-traded funds (ETFs).
See accompanying notes which are an integral part of the financial statements.
Fidelity Freedom Blend 2055 Fund Class Z
| | Six months ended (Unaudited) September 30, | Years endedMarch 31, | |
| | 2020 | 2020 | 2019 A |
| Selected Per–Share Data | | | |
| Net asset value, beginning of period | $8.30 | $9.52 | $10.00 |
| Income from Investment Operations | | | |
| Net investment income (loss)B | .01 | .19 | .06 |
| Net realized and unrealized gain (loss) | 2.31 | (1.10) | (.22) |
| Total from investment operations | 2.32 | (.91) | (.16) |
| Distributions from net investment income | – | (.17) | (.15) |
| Distributions from net realized gain | (.09) | (.14) | (.16) |
| Total distributions | (.09) | (.31) | (.32)C |
| Net asset value, end of period | $10.53 | $8.30 | $9.52 |
| Total ReturnD | 28.09% | (10.23)% | (1.23)% |
| Ratios to Average Net AssetsE | | | |
| Expenses before reductions | .44%F | .44% | .44%F |
| Expenses net of fee waivers, if any | .44%F | .44% | .44%F |
| Expenses net of all reductions | .44%F | .44% | .44%F |
| Net investment income (loss) | .16%F | 1.93% | 1.05%F |
| Supplemental Data | | | |
| Net assets, end of period (000 omitted) | $114 | $89 | $99 |
| Portfolio turnover rateG | 24%F | 26% | 14%F |
A For the period August 31, 2018 (commencement of operations) to March 31, 2019.
B Calculated based on average shares outstanding during the period.
C Total distributions per share do not sum due to rounding.
D Total returns for periods of less than one year are not annualized.
E Expense ratios reflect operating expenses of the class. Expenses before reductions do not reflect amounts reimbursed, waived, or reduced through arrangements with the investment adviser, brokerage services, or other offset arrangements, if applicable, and do not represent the amount paid by the class during periods when reimbursements, waivers or reductions occur.
F Annualized
G Amount does not include the portfolio activity of any underlying mutual funds or exchange-traded funds (ETFs).
See accompanying notes which are an integral part of the financial statements.
Fidelity Freedom Blend 2055 Fund Class Z6
| | Six months ended (Unaudited) September 30, | Years endedMarch 31, | |
| | 2020 | 2020 | 2019 A |
| Selected Per–Share Data | | | |
| Net asset value, beginning of period | $8.30 | $9.52 | $10.00 |
| Income from Investment Operations | | | |
| Net investment income (loss)B | .01 | .19 | .06 |
| Net realized and unrealized gain (loss) | 2.30 | (1.09) | (.22) |
| Total from investment operations | 2.31 | (.90) | (.16) |
| Distributions from net investment income | – | (.18) | (.16) |
| Distributions from net realized gain | (.09) | (.14) | (.16) |
| Total distributions | (.09) | (.32) | (.32) |
| Net asset value, end of period | $10.52 | $8.30 | $9.52 |
| Total ReturnC | 28.05% | (10.11)% | (1.19)% |
| Ratios to Average Net AssetsD | | | |
| Expenses before reductions | .34%E | .35%F | .34%E |
| Expenses net of fee waivers, if any | .34%E | .35%F | .34%E |
| Expenses net of all reductions | .34%E | .35%F | .34%E |
| Net investment income (loss) | .26%E | 2.03% | 1.15%E |
| Supplemental Data | | | |
| Net assets, end of period (000 omitted) | $1,012 | $694 | $99 |
| Portfolio turnover rateG | 24%E | 26% | 14%E |
A For the period August 31, 2018 (commencement of operations) to March 31, 2019.
B Calculated based on average shares outstanding during the period.
C Total returns for periods of less than one year are not annualized.
D Expense ratios reflect operating expenses of the class. Expenses before reductions do not reflect amounts reimbursed, waived, or reduced through arrangements with the investment adviser, brokerage services, or other offset arrangements, if applicable, and do not represent the amount paid by the class during periods when reimbursements, waivers or reductions occur.
E Annualized
F On certain classes, the size and fluctuation of net assets and expense amounts may cause ratios to differ from contractual rates.
G Amount does not include the portfolio activity of any underlying mutual funds or exchange-traded funds (ETFs).
See accompanying notes which are an integral part of the financial statements.
Fidelity Freedom® Blend 2060 Fund
Investment Summary (Unaudited)
The information in the following tables is based on the direct investments of the Fund.
Top Holdings as of September 30, 2020
| | % of fund's net assets |
| Fidelity Series Large Cap Value Index Fund | 14.4 |
| Fidelity Series Emerging Markets Opportunities Fund | 14.0 |
| Fidelity Series Blue Chip Growth Fund | 11.1 |
| Fidelity Series Large Cap Stock Fund | 7.6 |
| Fidelity Series Large Cap Growth Index Fund | 7.1 |
| Fidelity Series International Growth Fund | 6.1 |
| Fidelity Series Overseas Fund | 6.1 |
| Fidelity Series International Value Fund | 6.1 |
| Fidelity Series Value Discovery Fund | 5.3 |
| Fidelity Series Small Cap Opportunities Fund | 3.6 |
| | 81.4 |
Asset Allocation (% of fund's net assets)
| Period end |
| | Domestic Equity Funds | 51.6% |
| | International Equity Funds | 40.8% |
| | Bond Funds | 6.2% |
| | Short-Term Funds | 1.4% |

Domestic Equity Funds category includes Fidelity Series Commodity Strategy Fund which invests in commodity-related investments.
Fidelity Freedom® Blend 2060 Fund
Schedule of Investments September 30, 2020 (Unaudited)
Showing Percentage of Net Assets
| Domestic Equity Funds - 51.6% | | | |
| | | Shares | Value |
| Fidelity Series Blue Chip Growth Fund (a) | | 598,977 | $9,889,117 |
| Fidelity Series Commodity Strategy Fund (a) | | 542,034 | 2,254,861 |
| Fidelity Series Large Cap Growth Index Fund (a) | | 444,589 | 6,330,952 |
| Fidelity Series Large Cap Stock Fund (a) | | 481,657 | 6,820,269 |
| Fidelity Series Large Cap Value Index Fund (a) | | 1,112,087 | 12,900,216 |
| Fidelity Series Small Cap Opportunities Fund (a) | | 254,379 | 3,245,881 |
| Fidelity Series Value Discovery Fund (a) | | 378,889 | 4,683,073 |
| TOTAL DOMESTIC EQUITY FUNDS | | | |
| (Cost $43,582,575) | | | 46,124,369 |
|
| International Equity Funds - 40.8% | | | |
| Fidelity Series Canada Fund (a) | | 205,603 | 2,103,320 |
| Fidelity Series Emerging Markets Fund (a) | | 147,310 | 1,389,137 |
| Fidelity Series Emerging Markets Opportunities Fund (a) | | 594,923 | 12,481,481 |
| Fidelity Series International Growth Fund (a) | | 290,945 | 5,463,954 |
| Fidelity Series International Index Fund (a) | | 226,968 | 2,256,064 |
| Fidelity Series International Small Cap Fund (a) | | 108,114 | 1,924,428 |
| Fidelity Series International Value Fund (a) | | 629,155 | 5,423,315 |
| Fidelity Series Overseas Fund (a) | | 488,016 | 5,456,022 |
| TOTAL INTERNATIONAL EQUITY FUNDS | | | |
| (Cost $33,248,602) | | | 36,497,721 |
|
| Bond Funds - 6.2% | | | |
| Fidelity Series Corporate Bond Fund (a) | | 923 | 10,385 |
| Fidelity Series Emerging Markets Debt Fund (a) | | 58,653 | 531,392 |
| Fidelity Series Floating Rate High Income Fund (a) | | 13,801 | 122,135 |
| Fidelity Series Government Bond Index Fund (a) | | 1,100 | 12,378 |
| Fidelity Series High Income Fund (a) | | 67,484 | 615,456 |
| Fidelity Series Inflation-Protected Bond Index Fund (a) | | 169,422 | 1,812,814 |
| Fidelity Series Investment Grade Bond Fund (a) | | 1,141 | 13,962 |
| Fidelity Series Investment Grade Securitized Fund (a) | | 884 | 9,434 |
| Fidelity Series Long-Term Treasury Bond Index Fund (a) | | 200,029 | 2,066,297 |
| Fidelity Series Real Estate Income Fund (a) | | 37,311 | 372,367 |
| TOTAL BOND FUNDS | | | |
| (Cost $5,390,923) | | | 5,566,620 |
|
| Short-Term Funds - 1.4% | | | |
| Fidelity Series Government Money Market Fund 0.16% (a)(b) | | 217,426 | 217,426 |
| Fidelity Series Short-Term Credit Fund (a) | | 18,477 | 189,384 |
| Fidelity Series Treasury Bill Index Fund (a) | | 83,680 | 837,638 |
| TOTAL SHORT-TERM FUNDS | | | |
| (Cost $1,242,584) | | | 1,244,448 |
| TOTAL INVESTMENT IN SECURITIES - 100.0% | | | |
| (Cost $83,464,684) | | | 89,433,158 |
| NET OTHER ASSETS (LIABILITIES) - 0.0% | | | (1,641) |
| NET ASSETS - 100% | | | $89,431,517 |
Legend
(a) Affiliated Fund
(b) The rate quoted is the annualized seven-day yield of the fund at period end.
Affiliated Underlying Funds
Fiscal year to date information regarding the Fund's investments in affiliated Underlying Funds, excluding any Money Market Central Funds, is presented below. Exchanges between classes of the same affiliated Underlying Funds may occur.
| Affiliate | Value, beginning of period | Purchases | Sales Proceeds | Dividend Income | Realized Gain (loss) | Change in Unrealized appreciation (depreciation) | Value, end of period |
| Fidelity Series Blue Chip Growth Fund | $4,978,324 | $4,816,348 | $1,565,904 | $1,935,440 | $120,425 | $1,539,924 | $9,889,117 |
| Fidelity Series Canada Fund | 1,200,585 | 696,606 | 122,714 | -- | (10,400) | 339,243 | 2,103,320 |
| Fidelity Series Commodity Strategy Fund | 1,737,562 | 698,208 | 427,687 | 9,439 | (48,509) | 295,287 | 2,254,861 |
| Fidelity Series Corporate Bond Fund | 14,954 | 4,843 | 10,025 | 123 | (846) | 1,459 | 10,385 |
| Fidelity Series Emerging Markets Debt Fund | 338,404 | 154,228 | 10,232 | 12,244 | 59 | 48,933 | 531,392 |
| Fidelity Series Emerging Markets Fund | 618,240 | 531,171 | 38,604 | -- | 1,252 | 277,078 | 1,389,137 |
| Fidelity Series Emerging Markets Opportunities Fund | 5,692,038 | 4,474,283 | 293,659 | -- | 17,396 | 2,591,423 | 12,481,481 |
| Fidelity Series Floating Rate High Income Fund | 78,644 | 36,718 | 2,476 | 2,356 | 23 | 9,226 | 122,135 |
| Fidelity Series Government Bond Index Fund | 22,654 | 4,731 | 15,007 | 76 | (13) | 13 | 12,378 |
| Fidelity Series Government Money Market Fund 0.16% | 428,307 | 934,937 | 1,145,818 | 415 | -- | -- | 217,426 |
| Fidelity Series High Income Fund | 392,767 | 186,401 | 12,378 | 14,646 | 96 | 48,570 | 615,456 |
| Fidelity Series Inflation-Protected Bond Index Fund | 1,160,476 | 707,017 | 139,013 | 1,137 | (744) | 85,078 | 1,812,814 |
| Fidelity Series International Growth Fund | 3,457,712 | 1,566,596 | 724,955 | -- | 21,582 | 1,143,019 | 5,463,954 |
| Fidelity Series International Index Fund | 1,361,733 | 670,466 | 114,919 | -- | (3,776) | 342,560 | 2,256,064 |
| Fidelity Series International Small Cap Fund | 1,019,630 | 531,247 | 33,529 | -- | 2,125 | 404,955 | 1,924,428 |
| Fidelity Series International Value Fund | 3,302,734 | 1,721,734 | 408,351 | -- | (10,399) | 817,597 | 5,423,315 |
| Fidelity Series Investment Grade Bond Fund | 22,620 | 5,882 | 15,087 | 145 | (574) | 1,121 | 13,962 |
| Fidelity Series Investment Grade Securitized Fund | 15,595 | 4,230 | 10,459 | 46 | 1 | 67 | 9,434 |
| Fidelity Series Large Cap Growth Index Fund | 3,717,336 | 1,898,552 | 1,087,789 | 102,555 | 61,686 | 1,741,167 | 6,330,952 |
| Fidelity Series Large Cap Stock Fund | 3,865,673 | 2,471,970 | 297,287 | 223,021 | 1,545 | 778,368 | 6,820,269 |
| Fidelity Series Large Cap Value Index Fund | 7,164,828 | 4,416,947 | 385,807 | -- | (10,060) | 1,714,308 | 12,900,216 |
| Fidelity Series Long-Term Treasury Bond Index Fund | 1,318,052 | 1,035,725 | 239,820 | 38,337 | (3,453) | (44,207) | 2,066,297 |
| Fidelity Series Overseas Fund | 3,353,354 | 1,719,593 | 741,195 | -- | (44,988) | 1,169,258 | 5,456,022 |
| Fidelity Series Real Estate Income Fund | 214,435 | 118,723 | 7,763 | 11,084 | 4 | 46,968 | 372,367 |
| Fidelity Series Short-Term Credit Fund | 180,553 | 2,059 | -- | 2,049 | -- | 6,772 | 189,384 |
| Fidelity Series Small Cap Opportunities Fund | 1,917,349 | 1,034,855 | 242,746 | 19,159 | (42,912) | 579,335 | 3,245,881 |
| Fidelity Series Treasury Bill Index Fund | 1,350,828 | 43,244 | 551,951 | 5,301 | (1,876) | (2,607) | 837,638 |
| Fidelity Series Value Discovery Fund | 2,248,437 | 1,868,880 | 83,229 | -- | 1,744 | 647,241 | 4,683,073 |
| | 51,173,824 | 32,356,194 | 8,728,404 | 2,377,573 | 49,388 | 14,582,156 | 89,433,158 |
Amounts in the income column in the above table include any capital gain distributions from underlying funds, which are presented in the corresponding line-item in the Statement of Operations, if applicable.
Investment Valuation
The following is a summary of the inputs used, as of September 30, 2020, involving the Fund's assets and liabilities carried at fair value. The inputs or methodology used for valuing securities may not be an indication of the risk associated with investing in those securities. For more information on valuation inputs, and their aggregation into the levels used below, please refer to the Investment Valuation section in the accompanying Notes to Financial Statements.
| | Valuation Inputs at Reporting Date: |
| Description | Total | Level 1 | Level 2 | Level 3 |
| Investments in Securities: | | | | |
| Domestic Equity Funds | $46,124,369 | $46,124,369 | $-- | $-- |
| International Equity Funds | 36,497,721 | 36,497,721 | -- | -- |
| Bond Funds | 5,566,620 | 5,566,620 | -- | -- |
| Short-Term Funds | 1,244,448 | 1,244,448 | -- | -- |
| Total Investments in Securities: | $89,433,158 | $89,433,158 | $-- | $-- |
See accompanying notes which are an integral part of the financial statements.
Fidelity Freedom® Blend 2060 Fund
Financial Statements
Statement of Assets and Liabilities
| | | September 30, 2020 (Unaudited) |
| Assets | | |
Investment in securities, at value — See accompanying schedule:
| | |
| Affiliated issuers (cost $83,464,684) | $89,433,158 | |
| Total Investment in Securities (cost $83,464,684) | | $89,433,158 |
| Cash | | 203 |
| Receivable for investments sold | | 463,079 |
| Receivable for fund shares sold | | 436,072 |
| Total assets | | 90,332,512 |
| Liabilities | | |
| Payable for investments purchased | $834,074 | |
| Payable for fund shares redeemed | 39,555 | |
| Accrued management fee | 26,784 | |
| Distribution and service plan fees payable | 582 | |
| Total liabilities | | 900,995 |
| Net Assets | | $89,431,517 |
| Net Assets consist of: | | |
| Paid in capital | | $81,679,162 |
| Total accumulated earnings (loss) | | 7,752,355 |
| Net Assets | | $89,431,517 |
| Net Asset Value and Maximum Offering Price | | |
| Class A: | | |
| Net Asset Value and redemption price per share ($945,110 ÷ 89,727 shares)(a) | | $10.53 |
| Maximum offering price per share (100/94.25 of $10.53) | | $11.17 |
| Class M: | | |
| Net Asset Value and redemption price per share ($275,705 ÷ 26,243 shares)(a) | | $10.51 |
| Maximum offering price per share (100/96.50 of $10.51) | | $10.89 |
| Class C: | | |
| Net Asset Value and offering price per share ($344,466 ÷ 33,003 shares)(a) | | $10.44 |
| Fidelity Freedom Blend 2060 Fund: | | |
| Net Asset Value, offering price and redemption price per share ($4,375,362 ÷ 414,556 shares) | | $10.55 |
| Class K: | | |
| Net Asset Value, offering price and redemption price per share ($1,365,733 ÷ 129,306 shares) | | $10.56 |
| Class K6: | | |
| Net Asset Value, offering price and redemption price per share ($79,751,190 ÷ 7,539,249 shares) | | $10.58 |
| Class I: | | |
| Net Asset Value, offering price and redemption price per share ($1,680,386 ÷ 159,307 shares) | | $10.55 |
| Class Z: | | |
| Net Asset Value, offering price and redemption price per share ($114,003 ÷ 10,772 shares) | | $10.58 |
| Class Z6: | | |
| Net Asset Value, offering price and redemption price per share ($579,562 ÷ 54,741 shares) | | $10.59 |
(a) Redemption price per share is equal to net asset value less any applicable contingent deferred sales charge.
See accompanying notes which are an integral part of the financial statements.
Statement of Operations
| | | Six months ended September 30, 2020 (Unaudited) |
| Investment Income | | |
| Dividends: | | |
| Affiliated issuers | | $230,503 |
| Expenses | | |
| Management fee | $135,414 | |
| Distribution and service plan fees | 2,964 | |
| Independent trustees' fees and expenses | 92 | |
| Total expenses before reductions | 138,470 | |
| Expense reductions | (1) | |
| Total expenses after reductions | | 138,469 |
| Net investment income (loss) | | 92,034 |
| Realized and Unrealized Gain (Loss) | | |
| Net realized gain (loss) on: | | |
| Investment securities: | | |
| Affiliated issuers | 49,388 | |
| Capital gain distributions from underlying funds: | | |
| Affiliated issuers | 2,147,070 | |
| Total net realized gain (loss) | | 2,196,458 |
| Change in net unrealized appreciation (depreciation) on: | | |
| Investment securities: | | |
| Affiliated issuers | 14,582,156 | |
| Total change in net unrealized appreciation (depreciation) | | 14,582,156 |
| Net gain (loss) | | 16,778,614 |
| Net increase (decrease) in net assets resulting from operations | | $16,870,648 |
See accompanying notes which are an integral part of the financial statements.
Statement of Changes in Net Assets
| | Six months ended September 30, 2020 (Unaudited) | Year ended March 31, 2020 |
| Increase (Decrease) in Net Assets | | |
| Operations | | |
| Net investment income (loss) | $92,034 | $614,960 |
| Net realized gain (loss) | 2,196,458 | 442,582 |
| Change in net unrealized appreciation (depreciation) | 14,582,156 | (8,667,644) |
| Net increase (decrease) in net assets resulting from operations | 16,870,648 | (7,610,102) |
| Distributions to shareholders | (458,642) | (1,132,008) |
| Share transactions - net increase (decrease) | 21,846,493 | 57,305,021 |
| Total increase (decrease) in net assets | 38,258,499 | 48,562,911 |
| Net Assets | | |
| Beginning of period | 51,173,018 | 2,610,107 |
| End of period | $89,431,517 | $51,173,018 |
See accompanying notes which are an integral part of the financial statements.
Financial Highlights
Fidelity Freedom Blend 2060 Fund Class A
| | Six months ended (Unaudited) September 30, | Years endedMarch 31, | |
| | 2020 | 2020 | 2019 A |
| Selected Per–Share Data | | | |
| Net asset value, beginning of period | $8.30 | $9.53 | $10.00 |
| Income from Investment Operations | | | |
| Net investment income (loss)B | (.01) | .16 | .08 |
| Net realized and unrealized gain (loss) | 2.31 | (1.11) | (.27) |
| Total from investment operations | 2.30 | (.95) | (.19) |
| Distributions from net investment income | – | (.14) | (.14) |
| Distributions from net realized gain | (.07) | (.14) | (.15) |
| Total distributions | (.07) | (.28) | (.28)C |
| Net asset value, end of period | $10.53 | $8.30 | $9.53 |
| Total ReturnD,E,F | 27.79% | (10.54)% | (1.50)% |
| Ratios to Average Net AssetsG | | | |
| Expenses before reductions | .79%H | .79% | .80%H,I |
| Expenses net of fee waivers, if any | .79%H | .79% | .80%H,I |
| Expenses net of all reductions | .79%H | .79% | .80%H,I |
| Net investment income (loss) | (.18)%H | 1.62% | 1.50%H |
| Supplemental Data | | | |
| Net assets, end of period (000 omitted) | $945 | $493 | $243 |
| Portfolio turnover rateJ | 24%H | 27% | 11%H |
A For the period August 31, 2018 (commencement of operations) to March 31, 2019.
B Calculated based on average shares outstanding during the period.
C Total distributions per share do not sum due to rounding.
D Total returns for periods of less than one year are not annualized.
E Total returns would have been lower if certain expenses had not been reduced during the applicable periods shown.
F Total returns do not include the effect of the sales charges.
G Expense ratios reflect operating expenses of the class. Expenses before reductions do not reflect amounts reimbursed, waived, or reduced through arrangements with the investment adviser, brokerage services, or other offset arrangements, if applicable, and do not represent the amount paid by the class during periods when reimbursements, waivers or reductions occur.
H Annualized
I On certain classes, the size and fluctuation of net assets and expense amounts may cause ratios to differ from contractual rates.
J Amount does not include the portfolio activity of any underlying mutual funds or exchange-traded funds (ETFs).
See accompanying notes which are an integral part of the financial statements.
Fidelity Freedom Blend 2060 Fund Class M
| | Six months ended (Unaudited) September 30, | Years endedMarch 31, | |
| | 2020 | 2020 | 2019 A |
| Selected Per–Share Data | | | |
| Net asset value, beginning of period | $8.29 | $9.53 | $10.00 |
| Income from Investment Operations | | | |
| Net investment income (loss)B | (.02) | .14 | .07 |
| Net realized and unrealized gain (loss) | 2.31 | (1.12) | (.26) |
| Total from investment operations | 2.29 | (.98) | (.19) |
| Distributions from net investment income | – | (.12) | (.13) |
| Distributions from net realized gain | (.07) | (.14) | (.15) |
| Total distributions | (.07) | (.26) | (.28) |
| Net asset value, end of period | $10.51 | $8.29 | $9.53 |
| Total ReturnC,D | 27.70% | (10.80)% | (1.59)% |
| Ratios to Average Net AssetsE | | | |
| Expenses before reductions | 1.04%F | 1.04% | 1.04%F |
| Expenses net of fee waivers, if any | 1.04%F | 1.04% | 1.04%F |
| Expenses net of all reductions | 1.04%F | 1.04% | 1.04%F |
| Net investment income (loss) | (.43)%F | 1.37% | 1.25%F |
| Supplemental Data | | | |
| Net assets, end of period (000 omitted) | $276 | $174 | $143 |
| Portfolio turnover rateG | 24%F | 27% | 11%F |
A For the period August 31, 2018 (commencement of operations) to March 31, 2019.
B Calculated based on average shares outstanding during the period.
C Total returns for periods of less than one year are not annualized.
D Total returns do not include the effect of the sales charges.
E Expense ratios reflect operating expenses of the class. Expenses before reductions do not reflect amounts reimbursed, waived, or reduced through arrangements with the investment adviser, brokerage services, or other offset arrangements, if applicable, and do not represent the amount paid by the class during periods when reimbursements, waivers or reductions occur.
F Annualized
G Amount does not include the portfolio activity of any underlying mutual funds or exchange-traded funds (ETFs).
See accompanying notes which are an integral part of the financial statements.
Fidelity Freedom Blend 2060 Fund Class C
| | Six months ended (Unaudited) September 30, | Years endedMarch 31, | |
| | 2020 | 2020 | 2019 A |
| Selected Per–Share Data | | | |
| Net asset value, beginning of period | $8.26 | $9.52 | $10.00 |
| Income from Investment Operations | | | |
| Net investment income (loss)B | (.05) | .09 | .04 |
| Net realized and unrealized gain (loss) | 2.30 | (1.11) | (.26) |
| Total from investment operations | 2.25 | (1.02) | (.22) |
| Distributions from net investment income | – | (.10) | (.12) |
| Distributions from net realized gain | (.07) | (.14) | (.15) |
| Total distributions | (.07) | (.24) | (.26)C |
| Net asset value, end of period | $10.44 | $8.26 | $9.52 |
| Total ReturnD,E | 27.32% | (11.22)% | (1.87)% |
| Ratios to Average Net AssetsF | | | |
| Expenses before reductions | 1.54%G | 1.54% | 1.54%G |
| Expenses net of fee waivers, if any | 1.54%G | 1.54% | 1.54%G |
| Expenses net of all reductions | 1.54%G | 1.54% | 1.54%G |
| Net investment income (loss) | (.93)%G | .87% | .76%G |
| Supplemental Data | | | |
| Net assets, end of period (000 omitted) | $344 | $222 | $107 |
| Portfolio turnover rateH | 24%G | 27% | 11%G |
A For the period August 31, 2018 (commencement of operations) to March 31, 2019.
B Calculated based on average shares outstanding during the period.
C Total distributions per share do not sum due to rounding.
D Total returns for periods of less than one year are not annualized.
E Total returns do not include the effect of the contingent deferred sales charge.
F Expense ratios reflect operating expenses of the class. Expenses before reductions do not reflect amounts reimbursed, waived, or reduced through arrangements with the investment adviser, brokerage services, or other offset arrangements, if applicable, and do not represent the amount paid by the class during periods when reimbursements, waivers or reductions occur.
G Annualized
H Amount does not include the portfolio activity of any underlying mutual funds or exchange-traded funds (ETFs).
See accompanying notes which are an integral part of the financial statements.
Fidelity Freedom Blend 2060 Fund
| | Six months ended (Unaudited) September 30, | Years endedMarch 31, | |
| | 2020 | 2020 | 2019 A |
| Selected Per–Share Data | | | |
| Net asset value, beginning of period | $8.31 | $9.54 | $10.00 |
| Income from Investment Operations | | | |
| Net investment income (loss)B | –C | .18 | .09 |
| Net realized and unrealized gain (loss) | 2.31 | (1.11) | (.25) |
| Total from investment operations | 2.31 | (.93) | (.16) |
| Distributions from net investment income | – | (.16) | (.15) |
| Distributions from net realized gain | (.07) | (.14) | (.15) |
| Total distributions | (.07) | (.30) | (.30) |
| Net asset value, end of period | $10.55 | $8.31 | $9.54 |
| Total ReturnD | 27.88% | (10.35)% | (1.27)% |
| Ratios to Average Net AssetsE | | | |
| Expenses before reductions | .54%F | .55%G | .54%F |
| Expenses net of fee waivers, if any | .54%F | .55%G | .54%F |
| Expenses net of all reductions | .54%F | .55%G | .54%F |
| Net investment income (loss) | .07%F | 1.87% | 1.75%F |
| Supplemental Data | | | |
| Net assets, end of period (000 omitted) | $4,375 | $2,773 | $453 |
| Portfolio turnover rateH | 24%F | 27% | 11%F |
A For the period August 31, 2018 (commencement of operations) to March 31, 2019.
B Calculated based on average shares outstanding during the period.
C Amount represents less than $.005 per share.
D Total returns for periods of less than one year are not annualized.
E Expense ratios reflect operating expenses of the class. Expenses before reductions do not reflect amounts reimbursed, waived, or reduced through arrangements with the investment adviser, brokerage services, or other offset arrangements, if applicable, and do not represent the amount paid by the class during periods when reimbursements, waivers or reductions occur.
F Annualized
G On certain classes, the size and fluctuation of net assets and expense amounts may cause ratios to differ from contractual rates.
H Amount does not include the portfolio activity of any underlying mutual funds or exchange-traded funds (ETFs).
See accompanying notes which are an integral part of the financial statements.
Fidelity Freedom Blend 2060 Fund Class K
| | Six months ended (Unaudited) September 30, | Years endedMarch 31, | |
| | 2020 | 2020 | 2019 A |
| Selected Per–Share Data | | | |
| Net asset value, beginning of period | $8.31 | $9.54 | $10.00 |
| Income from Investment Operations | | | |
| Net investment income (loss)B | .01 | .20 | .10 |
| Net realized and unrealized gain (loss) | 2.31 | (1.11) | (.26) |
| Total from investment operations | 2.32 | (.91) | (.16) |
| Distributions from net investment income | – | (.18) | (.15) |
| Distributions from net realized gain | (.07) | (.14) | (.15) |
| Total distributions | (.07) | (.32) | (.30) |
| Net asset value, end of period | $10.56 | $8.31 | $9.54 |
| Total ReturnC | 28.00% | (10.22)% | (1.28)% |
| Ratios to Average Net AssetsD | | | |
| Expenses before reductions | .44%E | .44% | .44%E |
| Expenses net of fee waivers, if any | .44%E | .44% | .44%E |
| Expenses net of all reductions | .44%E | .44% | .44%E |
| Net investment income (loss) | .17%E | 1.97% | 1.85%E |
| Supplemental Data | | | |
| Net assets, end of period (000 omitted) | $1,366 | $1,307 | $99 |
| Portfolio turnover rateF | 24%E | 27% | 11%E |
A For the period August 31, 2018 (commencement of operations) to March 31, 2019.
B Calculated based on average shares outstanding during the period.
C Total returns for periods of less than one year are not annualized.
D Expense ratios reflect operating expenses of the class. Expenses before reductions do not reflect amounts reimbursed, waived, or reduced through arrangements with the investment adviser, brokerage services, or other offset arrangements, if applicable, and do not represent the amount paid by the class during periods when reimbursements, waivers or reductions occur.
E Annualized
F Amount does not include the portfolio activity of any underlying mutual funds or exchange-traded funds (ETFs).
See accompanying notes which are an integral part of the financial statements.
Fidelity Freedom Blend 2060 Fund Class K6
| | Six months ended (Unaudited) September 30, | Years endedMarch 31, | |
| | 2020 | 2020 | 2019 A |
| Selected Per–Share Data | | | |
| Net asset value, beginning of period | $8.32 | $9.54 | $10.00 |
| Income from Investment Operations | | | |
| Net investment income (loss)B | .01 | .20 | .10 |
| Net realized and unrealized gain (loss) | 2.32 | (1.10) | (.26) |
| Total from investment operations | 2.33 | (.90) | (.16) |
| Distributions from net investment income | – | (.17) | (.15) |
| Distributions from net realized gain | (.07) | (.14) | (.15) |
| Total distributions | (.07) | (.32)C | (.30) |
| Net asset value, end of period | $10.58 | $8.32 | $9.54 |
| Total ReturnD | 28.13% | (10.12)% | (1.24)% |
| Ratios to Average Net AssetsE | | | |
| Expenses before reductions | .34%F | .34% | .34%F |
| Expenses net of fee waivers, if any | .34%F | .34% | .34%F |
| Expenses net of all reductions | .34%F | .34% | .34%F |
| Net investment income (loss) | .27%F | 2.07% | 1.95%F |
| Supplemental Data | | | |
| Net assets, end of period (000 omitted) | $79,751 | $44,655 | $1,261 |
| Portfolio turnover rateG | 24%F | 27% | 11%F |
A For the period August 31, 2018 (commencement of operations) to March 31, 2019.
B Calculated based on average shares outstanding during the period.
C Total distributions per share do not sum due to rounding.
D Total returns for periods of less than one year are not annualized.
E Expense ratios reflect operating expenses of the class. Expenses before reductions do not reflect amounts reimbursed, waived, or reduced through arrangements with the investment adviser, brokerage services, or other offset arrangements, if applicable, and do not represent the amount paid by the class during periods when reimbursements, waivers or reductions occur.
F Annualized
G Amount does not include the portfolio activity of any underlying mutual funds or exchange-traded funds (ETFs).
See accompanying notes which are an integral part of the financial statements.
Fidelity Freedom Blend 2060 Fund Class I
| | Six months ended (Unaudited) September 30, | Years endedMarch 31, | |
| | 2020 | 2020 | 2019 A |
| Selected Per–Share Data | | | |
| Net asset value, beginning of period | $8.30 | $9.54 | $10.00 |
| Income from Investment Operations | | | |
| Net investment income (loss)B | –C | .19 | .10 |
| Net realized and unrealized gain (loss) | 2.32 | (1.12) | (.27) |
| Total from investment operations | 2.32 | (.93) | (.17) |
| Distributions from net investment income | – | (.17) | (.15) |
| Distributions from net realized gain | (.07) | (.14) | (.15) |
| Total distributions | (.07) | (.31) | (.29)D |
| Net asset value, end of period | $10.55 | $8.30 | $9.54 |
| Total ReturnE | 28.03% | (10.37)% | (1.31)% |
| Ratios to Average Net AssetsF | | | |
| Expenses before reductions | .54%G | .54% | .54%G |
| Expenses net of fee waivers, if any | .54%G | .54% | .54%G |
| Expenses net of all reductions | .54%G | .54% | .54%G |
| Net investment income (loss) | .07%G | 1.87% | 1.75%G |
| Supplemental Data | | | |
| Net assets, end of period (000 omitted) | $1,680 | $1,084 | $102 |
| Portfolio turnover rateH | 24%G | 27% | 11%G |
A For the period August 31, 2018 (commencement of operations) to March 31, 2019.
B Calculated based on average shares outstanding during the period.
C Amount represents less than $.005 per share.
D Total distributions per share do not sum due to rounding.
E Total returns for periods of less than one year are not annualized.
F Expense ratios reflect operating expenses of the class. Expenses before reductions do not reflect amounts reimbursed, waived, or reduced through arrangements with the investment adviser, brokerage services, or other offset arrangements, if applicable, and do not represent the amount paid by the class during periods when reimbursements, waivers or reductions occur.
G Annualized
H Amount does not include the portfolio activity of any underlying mutual funds or exchange-traded funds (ETFs).
See accompanying notes which are an integral part of the financial statements.
Fidelity Freedom Blend 2060 Fund Class Z
| | Six months ended (Unaudited) September 30, | Years endedMarch 31, | |
| | 2020 | 2020 | 2019 A |
| Selected Per–Share Data | | | |
| Net asset value, beginning of period | $8.33 | $9.54 | $10.00 |
| Income from Investment Operations | | | |
| Net investment income (loss)B | .01 | .20 | .10 |
| Net realized and unrealized gain (loss) | 2.31 | (1.11) | (.26) |
| Total from investment operations | 2.32 | (.91) | (.16) |
| Distributions from net investment income | – | (.16) | (.15) |
| Distributions from net realized gain | (.07) | (.14) | (.15) |
| Total distributions | (.07) | (.30) | (.30) |
| Net asset value, end of period | $10.58 | $8.33 | $9.54 |
| Total ReturnC | 27.93% | (10.17)% | (1.28)% |
| Ratios to Average Net AssetsD | | | |
| Expenses before reductions | .44%E | .44% | .44%E |
| Expenses net of fee waivers, if any | .44%E | .44% | .44%E |
| Expenses net of all reductions | .44%E | .44% | .44%E |
| Net investment income (loss) | .17%E | 1.97% | 1.86%E |
| Supplemental Data | | | |
| Net assets, end of period (000 omitted) | $114 | $89 | $99 |
| Portfolio turnover rateF | 24%E | 27% | 11%E |
A For the period August 31, 2018 (commencement of operations) to March 31, 2019.
B Calculated based on average shares outstanding during the period.
C Total returns for periods of less than one year are not annualized.
D Expense ratios reflect operating expenses of the class. Expenses before reductions do not reflect amounts reimbursed, waived, or reduced through arrangements with the investment adviser, brokerage services, or other offset arrangements, if applicable, and do not represent the amount paid by the class during periods when reimbursements, waivers or reductions occur.
E Annualized
F Amount does not include the portfolio activity of any underlying mutual funds or exchange-traded funds (ETFs).
See accompanying notes which are an integral part of the financial statements.
Fidelity Freedom Blend 2060 Fund Class Z6
| | Six months ended (Unaudited) September 30, | Years endedMarch 31, | |
| | 2020 | 2020 | 2019 A |
| Selected Per–Share Data | | | |
| Net asset value, beginning of period | $8.33 | $9.54 | $10.00 |
| Income from Investment Operations | | | |
| Net investment income (loss)B | .01 | .20 | .11 |
| Net realized and unrealized gain (loss) | 2.32 | (1.10) | (.27) |
| Total from investment operations | 2.33 | (.90) | (.16) |
| Distributions from net investment income | – | (.17) | (.15) |
| Distributions from net realized gain | (.07) | (.14) | (.15) |
| Total distributions | (.07) | (.31) | (.30) |
| Net asset value, end of period | $10.59 | $8.33 | $9.54 |
| Total ReturnC | 28.11% | (10.10)% | (1.24)% |
| Ratios to Average Net AssetsD | | | |
| Expenses before reductions | .34%E | .34% | .34%E |
| Expenses net of fee waivers, if any | .34%E | .34% | .34%E |
| Expenses net of all reductions | .34%E | .34% | .34%E |
| Net investment income (loss) | .27%E | 2.07% | 1.96%E |
| Supplemental Data | | | |
| Net assets, end of period (000 omitted) | $580 | $375 | $103 |
| Portfolio turnover rateF | 24%E | 27% | 11%E |
A For the period August 31, 2018 (commencement of operations) to March 31, 2019.
B Calculated based on average shares outstanding during the period.
C Total returns for periods of less than one year are not annualized.
D Expense ratios reflect operating expenses of the class. Expenses before reductions do not reflect amounts reimbursed, waived, or reduced through arrangements with the investment adviser, brokerage services, or other offset arrangements, if applicable, and do not represent the amount paid by the class during periods when reimbursements, waivers or reductions occur.
E Annualized
F Amount does not include the portfolio activity of any underlying mutual funds or exchange-traded funds (ETFs).
See accompanying notes which are an integral part of the financial statements.
Fidelity Freedom® Blend 2065 Fund
Investment Summary (Unaudited)
The information in the following tables is based on the direct investments of the Fund.
Top Holdings as of September 30, 2020
| | % of fund's net assets |
| Fidelity Series Large Cap Value Index Fund | 14.4 |
| Fidelity Series Emerging Markets Opportunities Fund | 14.0 |
| Fidelity Series Blue Chip Growth Fund | 11.1 |
| Fidelity Series Large Cap Stock Fund | 7.6 |
| Fidelity Series Large Cap Growth Index Fund | 7.1 |
| Fidelity Series International Growth Fund | 6.1 |
| Fidelity Series Overseas Fund | 6.1 |
| Fidelity Series International Value Fund | 6.1 |
| Fidelity Series Value Discovery Fund | 5.3 |
| Fidelity Series Small Cap Opportunities Fund | 3.6 |
| | 81.4 |
Asset Allocation (% of fund's net assets)
| Period end |
| | Domestic Equity Funds | 51.6% |
| | International Equity Funds | 40.8% |
| | Bond Funds | 6.2% |
| | Short-Term Funds | 1.4% |

Domestic Equity Funds category includes Fidelity Series Commodity Strategy Fund which invests in commodity-related investments.
Fidelity Freedom® Blend 2065 Fund
Schedule of Investments September 30, 2020 (Unaudited)
Showing Percentage of Net Assets
| Domestic Equity Funds - 51.6% | | | |
| | | Shares | Value |
| Fidelity Series Blue Chip Growth Fund (a) | | 39,843 | $657,812 |
| Fidelity Series Commodity Strategy Fund (a) | | 36,058 | 150,002 |
| Fidelity Series Large Cap Growth Index Fund (a) | | 29,584 | 421,280 |
| Fidelity Series Large Cap Stock Fund (a) | | 32,043 | 453,732 |
| Fidelity Series Large Cap Value Index Fund (a) | | 73,982 | 858,195 |
| Fidelity Series Small Cap Opportunities Fund (a) | | 16,924 | 215,944 |
| Fidelity Series Value Discovery Fund (a) | | 25,204 | 311,518 |
| TOTAL DOMESTIC EQUITY FUNDS | | | |
| (Cost $2,913,929) | | | 3,068,483 |
|
| International Equity Funds - 40.8% | | | |
| Fidelity Series Canada Fund (a) | | 13,683 | 139,974 |
| Fidelity Series Emerging Markets Fund (a) | | 9,800 | 92,414 |
| Fidelity Series Emerging Markets Opportunities Fund (a) | | 39,578 | 830,350 |
| Fidelity Series International Growth Fund (a) | | 19,359 | 363,571 |
| Fidelity Series International Index Fund (a) | | 15,105 | 150,142 |
| Fidelity Series International Small Cap Fund (a) | | 7,190 | 127,980 |
| Fidelity Series International Value Fund (a) | | 41,851 | 360,754 |
| Fidelity Series Overseas Fund (a) | | 32,473 | 363,050 |
| TOTAL INTERNATIONAL EQUITY FUNDS | | | |
| (Cost $2,223,353) | | | 2,428,235 |
|
| Bond Funds - 6.2% | | | |
| Fidelity Series Corporate Bond Fund (a) | | 59 | 663 |
| Fidelity Series Emerging Markets Debt Fund (a) | | 3,833 | 34,727 |
| Fidelity Series Floating Rate High Income Fund (a) | | 922 | 8,158 |
| Fidelity Series Government Bond Index Fund (a) | | 70 | 791 |
| Fidelity Series High Income Fund (a) | | 4,528 | 41,297 |
| Fidelity Series Inflation-Protected Bond Index Fund (a) | | 11,264 | 120,530 |
| Fidelity Series Investment Grade Bond Fund (a) | | 73 | 889 |
| Fidelity Series Investment Grade Securitized Fund (a) | | 56 | 602 |
| Fidelity Series Long-Term Treasury Bond Index Fund (a) | | 13,306 | 137,452 |
| Fidelity Series Real Estate Income Fund (a) | | 2,552 | 25,464 |
| TOTAL BOND FUNDS | | | |
| (Cost $360,714) | | | 370,573 |
|
| Short-Term Funds - 1.4% | | | |
| Fidelity Series Government Money Market Fund 0.16% (a)(b) | | 28,190 | 28,190 |
| Fidelity Series Short-Term Credit Fund (a) | | 605 | 6,198 |
| Fidelity Series Treasury Bill Index Fund (a) | | 4,827 | 48,319 |
| TOTAL SHORT-TERM FUNDS | | | |
| (Cost $82,657) | | | 82,707 |
| TOTAL INVESTMENT IN SECURITIES - 100.0% | | | |
| (Cost $5,580,653) | | | 5,949,998 |
| NET OTHER ASSETS (LIABILITIES) - 0.0% | | | (267) |
| NET ASSETS - 100% | | | $5,949,731 |
Legend
(a) Affiliated Fund
(b) The rate quoted is the annualized seven-day yield of the fund at period end.
Affiliated Underlying Funds
Fiscal year to date information regarding the Fund's investments in affiliated Underlying Funds, excluding any Money Market Central Funds, is presented below. Exchanges between classes of the same affiliated Underlying Funds may occur.
| Affiliate | Value, beginning of period | Purchases | Sales Proceeds | Dividend Income | Realized Gain (loss) | Change in Unrealized appreciation (depreciation) | Value, end of period |
| Fidelity Series Blue Chip Growth Fund | $246,710 | $513,235 | $176,558 | $126,132 | $(57) | $74,482 | $657,812 |
| Fidelity Series Canada Fund | 58,816 | 88,961 | 25,420 | -- | (1,823) | 19,440 | 139,974 |
| Fidelity Series Commodity Strategy Fund | 87,912 | 92,872 | 44,766 | 615 | (1,831) | 15,815 | 150,002 |
| Fidelity Series Corporate Bond Fund | 668 | 379 | 414 | 7 | (35) | 65 | 663 |
| Fidelity Series Emerging Markets Debt Fund | 16,137 | 22,004 | 5,839 | 689 | (230) | 2,655 | 34,727 |
| Fidelity Series Emerging Markets Fund | 30,515 | 61,102 | 14,324 | -- | (242) | 15,363 | 92,414 |
| Fidelity Series Emerging Markets Opportunities Fund | 280,112 | 538,208 | 129,285 | -- | (6,517) | 147,832 | 830,350 |
| Fidelity Series Floating Rate High Income Fund | 3,787 | 5,293 | 1,413 | 135 | (67) | 558 | 8,158 |
| Fidelity Series Government Bond Index Fund | 1,022 | 396 | 626 | 4 | (1) | -- | 791 |
| Fidelity Series Government Money Market Fund 0.16% | 31,125 | 94,112 | 97,047 | 36 | -- | -- | 28,190 |
| Fidelity Series High Income Fund | 19,212 | 26,631 | 7,064 | 845 | (266) | 2,784 | 41,297 |
| Fidelity Series Inflation-Protected Bond Index Fund | 54,819 | 83,240 | 22,220 | 63 | (55) | 4,746 | 120,530 |
| Fidelity Series International Growth Fund | 171,036 | 216,631 | 88,073 | -- | (956) | 64,933 | 363,571 |
| Fidelity Series International Index Fund | 67,715 | 92,169 | 27,890 | -- | (1,684) | 19,832 | 150,142 |
| Fidelity Series International Small Cap Fund | 51,927 | 73,061 | 19,834 | -- | 330 | 22,496 | 127,980 |
| Fidelity Series International Value Fund | 165,447 | 227,616 | 74,079 | -- | (5,789) | 47,559 | 360,754 |
| Fidelity Series Investment Grade Bond Fund | 1,012 | 469 | 619 | 8 | (24) | 51 | 889 |
| Fidelity Series Investment Grade Securitized Fund | 696 | 334 | 432 | 2 | -- | 4 | 602 |
| Fidelity Series Large Cap Growth Index Fund | 183,258 | 258,402 | 120,339 | 5,642 | 3,691 | 96,268 | 421,280 |
| Fidelity Series Large Cap Stock Fund | 191,426 | 302,291 | 78,933 | 14,236 | (4,953) | 43,901 | 453,732 |
| Fidelity Series Large Cap Value Index Fund | 353,202 | 550,997 | 136,929 | -- | (13,038) | 103,963 | 858,195 |
| Fidelity Series Long-Term Treasury Bond Index Fund | 67,221 | 104,212 | 30,695 | 2,077 | (628) | (2,658) | 137,452 |
| Fidelity Series Overseas Fund | 164,074 | 224,684 | 86,538 | -- | (3,807) | 64,637 | 363,050 |
| Fidelity Series Real Estate Income Fund | 10,519 | 16,848 | 4,427 | 689 | (429) | 2,953 | 25,464 |
| Fidelity Series Short-Term Credit Fund | 5,909 | 67 | -- | 67 | -- | 222 | 6,198 |
| Fidelity Series Small Cap Opportunities Fund | 94,087 | 134,963 | 41,264 | 1,249 | (2,982) | 31,140 | 215,944 |
| Fidelity Series Treasury Bill Index Fund | 59,792 | 232 | 11,527 | 233 | (33) | (145) | 48,319 |
| Fidelity Series Value Discovery Fund | 110,508 | 213,388 | 47,377 | -- | (3,305) | 38,304 | 311,518 |
| | 2,528,664 | 3,942,797 | 1,293,932 | 152,729 | (44,731) | 817,200 | 5,949,998 |
Amounts in the income column in the above table include any capital gain distributions from underlying funds, which are presented in the corresponding line-item in the Statement of Operations, if applicable.
Investment Valuation
The following is a summary of the inputs used, as of September 30, 2020, involving the Fund's assets and liabilities carried at fair value. The inputs or methodology used for valuing securities may not be an indication of the risk associated with investing in those securities. For more information on valuation inputs, and their aggregation into the levels used below, please refer to the Investment Valuation section in the accompanying Notes to Financial Statements.
| | Valuation Inputs at Reporting Date: |
| Description | Total | Level 1 | Level 2 | Level 3 |
| Investments in Securities: | | | | |
| Domestic Equity Funds | $3,068,483 | $3,068,483 | $-- | $-- |
| International Equity Funds | 2,428,235 | 2,428,235 | -- | -- |
| Bond Funds | 370,573 | 370,573 | -- | -- |
| Short-Term Funds | 82,707 | 82,707 | -- | -- |
| Total Investments in Securities: | $5,949,998 | $5,949,998 | $-- | $-- |
See accompanying notes which are an integral part of the financial statements.
Fidelity Freedom® Blend 2065 Fund
Financial Statements
Statement of Assets and Liabilities
| | | September 30, 2020 (Unaudited) |
| Assets | | |
Investment in securities, at value — See accompanying schedule:
| | |
| Affiliated issuers (cost $5,580,653) | $5,949,998 | |
| Total Investment in Securities (cost $5,580,653) | | $5,949,998 |
| Cash | | 199 |
| Receivable for investments sold | | 14,636 |
| Receivable for fund shares sold | | 82,563 |
| Total assets | | 6,047,396 |
| Liabilities | | |
| Payable for investments purchased | $95,176 | |
| Accrued management fee | 2,115 | |
| Distribution and service plan fees payable | 374 | |
| Total liabilities | | 97,665 |
| Net Assets | | $5,949,731 |
| Net Assets consist of: | | |
| Paid in capital | | $5,498,287 |
| Total accumulated earnings (loss) | | 451,444 |
| Net Assets | | $5,949,731 |
| Net Asset Value and Maximum Offering Price | | |
| Class A: | | |
| Net Asset Value and redemption price per share ($248,414 ÷ 23,218 shares)(a) | | $10.70 |
| Maximum offering price per share (100/94.25 of $10.70) | | $11.35 |
| Class M: | | |
| Net Asset Value and redemption price per share ($264,161 ÷ 24,733 shares)(a) | | $10.68 |
| Maximum offering price per share (100/96.50 of $10.68) | | $11.07 |
| Class C: | | |
| Net Asset Value and offering price per share ($274,427 ÷ 25,814 shares)(a) | | $10.63 |
| Fidelity Freedom Blend 2065 Fund: | | |
| Net Asset Value, offering price and redemption price per share ($1,034,944 ÷ 96,531 shares) | | $10.72 |
| Class K: | | |
| Net Asset Value, offering price and redemption price per share ($163,827 ÷ 15,258 shares) | | $10.74 |
| Class K6: | | |
| Net Asset Value, offering price and redemption price per share ($3,499,473 ÷ 326,005 shares) | | $10.73 |
| Class I: | | |
| Net Asset Value, offering price and redemption price per share ($216,594 ÷ 20,186 shares) | | $10.73 |
| Class Z: | | |
| Net Asset Value, offering price and redemption price per share ($123,378 ÷ 11,490 shares) | | $10.74 |
| Class Z6: | | |
| Net Asset Value, offering price and redemption price per share ($124,513 ÷ 11,586 shares) | | $10.75 |
(a) Redemption price per share is equal to net asset value less any applicable contingent deferred sales charge.
See accompanying notes which are an integral part of the financial statements.
Statement of Operations
| | | Six months ended September 30, 2020 (Unaudited) |
| Investment Income | | |
| Dividends: | | |
| Affiliated issuers | | $14,245 |
| Expenses | | |
| Management fee | $9,187 | |
| Distribution and service plan fees | 1,872 | |
| Independent trustees' fees and expenses | 5 | |
| Total expenses | | 11,064 |
| Net investment income (loss) | | 3,181 |
| Realized and Unrealized Gain (Loss) | | |
| Net realized gain (loss) on: | | |
| Investment securities: | | |
| Affiliated issuers | (44,731) | |
| Capital gain distributions from underlying funds: | | |
| Affiliated issuers | 138,484 | |
| Total net realized gain (loss) | | 93,753 |
| Change in net unrealized appreciation (depreciation) on: | | |
| Investment securities: | | |
| Affiliated issuers | 817,200 | |
| Total change in net unrealized appreciation (depreciation) | | 817,200 |
| Net gain (loss) | | 910,953 |
| Net increase (decrease) in net assets resulting from operations | | $914,134 |
See accompanying notes which are an integral part of the financial statements.
Statement of Changes in Net Assets
| | Six months ended September 30, 2020 (Unaudited) | For the period
June 28, 2019 (commencement of operations) to March 31, 2020 |
| Increase (Decrease) in Net Assets | | |
| Operations | | |
| Net investment income (loss) | $3,181 | $21,707 |
| Net realized gain (loss) | 93,753 | 24,775 |
| Change in net unrealized appreciation (depreciation) | 817,200 | (447,855) |
| Net increase (decrease) in net assets resulting from operations | 914,134 | (401,373) |
| Distributions to shareholders | (18,320) | (42,997) |
| Share transactions - net increase (decrease) | 2,525,297 | 2,972,990 |
| Total increase (decrease) in net assets | 3,421,111 | 2,528,620 |
| Net Assets | | |
| Beginning of period | 2,528,620 | – |
| End of period | $5,949,731 | $2,528,620 |
See accompanying notes which are an integral part of the financial statements.
Financial Highlights
Fidelity Freedom Blend 2065 Fund Class A
| | Six months ended (Unaudited) September 30, | Years endedMarch 31, |
| | 2020 | 2020 A |
| Selected Per–Share Data | | |
| Net asset value, beginning of period | $8.42 | $10.00 |
| Income from Investment Operations | | |
| Net investment income (loss)B | (.01) | .14 |
| Net realized and unrealized gain (loss) | 2.34 | (1.43) |
| Total from investment operations | 2.33 | (1.29) |
| Distributions from net investment income | – | (.16) |
| Distributions from net realized gain | (.05) | (.14) |
| Total distributions | (.05) | (.29)C |
| Net asset value, end of period | $10.70 | $8.42 |
| Total ReturnD,E | 27.78% | (13.48)% |
| Ratios to Average Net AssetsF | | |
| Expenses before reductions | .79%G | .79%G |
| Expenses net of fee waivers, if any | .79%G | .79%G |
| Expenses net of all reductions | .79%G | .79%G |
| Net investment income (loss) | (.14)%G | 1.78%G |
| Supplemental Data | | |
| Net assets, end of period (000 omitted) | $248 | $154 |
| Portfolio turnover rateH | 60%G | 29%G |
A For the period June 28, 2019 (commencement of operations) to March 31, 2020.
B Calculated based on average shares outstanding during the period.
C Total distributions per share do not sum due to rounding.
D Total returns for periods of less than one year are not annualized.
E Total returns do not include the effect of the sales charges.
F Expense ratios reflect operating expenses of the class. Expenses before reductions do not reflect amounts reimbursed, waived, or reduced through arrangements with the investment adviser, brokerage services, or other offset arrangements, if applicable, and do not represent the amount paid by the class during periods when reimbursements, waivers or reductions occur.
G Annualized
H Amount does not include the portfolio activity of any underlying mutual funds or exchange-traded funds (ETFs).
See accompanying notes which are an integral part of the financial statements.
Fidelity Freedom Blend 2065 Fund Class M
| | Six months ended (Unaudited) September 30, | Years endedMarch 31, |
| | 2020 | 2020 A |
| Selected Per–Share Data | | |
| Net asset value, beginning of period | $8.42 | $10.00 |
| Income from Investment Operations | | |
| Net investment income (loss)B | (.02) | .12 |
| Net realized and unrealized gain (loss) | 2.33 | (1.42) |
| Total from investment operations | 2.31 | (1.30) |
| Distributions from net investment income | – | (.14) |
| Distributions from net realized gain | (.05) | (.14) |
| Total distributions | (.05) | (.28) |
| Net asset value, end of period | $10.68 | $8.42 |
| Total ReturnC,D | 27.54% | (13.60)% |
| Ratios to Average Net AssetsE | | |
| Expenses before reductions | 1.04%F | 1.05%F,G |
| Expenses net of fee waivers, if any | 1.04%F | 1.05%F,G |
| Expenses net of all reductions | 1.04%F | 1.05%F,G |
| Net investment income (loss) | (.39)%F | 1.53%F |
| Supplemental Data | | |
| Net assets, end of period (000 omitted) | $264 | $165 |
| Portfolio turnover rateH | 60%F | 29%F |
A For the period June 28, 2019 (commencement of operations) to March 31, 2020.
B Calculated based on average shares outstanding during the period.
C Total returns for periods of less than one year are not annualized.
D Total returns do not include the effect of the sales charges.
E Expense ratios reflect operating expenses of the class. Expenses before reductions do not reflect amounts reimbursed, waived, or reduced through arrangements with the investment adviser, brokerage services, or other offset arrangements, if applicable, and do not represent the amount paid by the class during periods when reimbursements, waivers or reductions occur.
F Annualized
G On certain classes, the size and fluctuation of net assets and expense amounts may cause ratios to differ from contractual rates.
H Amount does not include the portfolio activity of any underlying mutual funds or exchange-traded funds (ETFs).
See accompanying notes which are an integral part of the financial statements.
Fidelity Freedom Blend 2065 Fund Class C
| | Six months ended (Unaudited) September 30, | Years endedMarch 31, |
| | 2020 | 2020 A |
| Selected Per–Share Data | | |
| Net asset value, beginning of period | $8.40 | $10.00 |
| Income from Investment Operations | | |
| Net investment income (loss)B | (.04) | .08 |
| Net realized and unrealized gain (loss) | 2.32 | (1.42) |
| Total from investment operations | 2.28 | (1.34) |
| Distributions from net investment income | – | (.12) |
| Distributions from net realized gain | (.05) | (.14) |
| Total distributions | (.05) | (.26) |
| Net asset value, end of period | $10.63 | $8.40 |
| Total ReturnC,D | 27.25% | (13.94)% |
| Ratios to Average Net AssetsE | | |
| Expenses before reductions | 1.54%F | 1.55%F,G |
| Expenses net of fee waivers, if any | 1.54%F | 1.55%F,G |
| Expenses net of all reductions | 1.54%F | 1.55%F,G |
| Net investment income (loss) | (.89)%F | 1.03%F |
| Supplemental Data | | |
| Net assets, end of period (000 omitted) | $274 | $156 |
| Portfolio turnover rateH | 60%F | 29%F |
A For the period June 28, 2019 (commencement of operations) to March 31, 2020.
B Calculated based on average shares outstanding during the period.
C Total returns for periods of less than one year are not annualized.
D Total returns do not include the effect of the contingent deferred sales charge.
E Expense ratios reflect operating expenses of the class. Expenses before reductions do not reflect amounts reimbursed, waived, or reduced through arrangements with the investment adviser, brokerage services, or other offset arrangements, if applicable, and do not represent the amount paid by the class during periods when reimbursements, waivers or reductions occur.
F Annualized
G On certain classes, the size and fluctuation of net assets and expense amounts may cause ratios to differ from contractual rates.
H Amount does not include the portfolio activity of any underlying mutual funds or exchange-traded funds (ETFs).
See accompanying notes which are an integral part of the financial statements.
Fidelity Freedom Blend 2065 Fund
| | Six months ended (Unaudited) September 30, | Years endedMarch 31, |
| | 2020 | 2020 A |
| Selected Per–Share Data | | |
| Net asset value, beginning of period | $8.43 | $10.00 |
| Income from Investment Operations | | |
| Net investment income (loss)B | .01 | .15 |
| Net realized and unrealized gain (loss) | 2.33 | (1.42) |
| Total from investment operations | 2.34 | (1.27) |
| Distributions from net investment income | – | (.17) |
| Distributions from net realized gain | (.05) | (.14) |
| Total distributions | (.05) | (.30)C |
| Net asset value, end of period | $10.72 | $8.43 |
| Total ReturnD | 27.87% | (13.28)% |
| Ratios to Average Net AssetsE | | |
| Expenses before reductions | .54%F | .54%F |
| Expenses net of fee waivers, if any | .54%F | .54%F |
| Expenses net of all reductions | .54%F | .54%F |
| Net investment income (loss) | .11%F | 2.03%F |
| Supplemental Data | | |
| Net assets, end of period (000 omitted) | $1,035 | $423 |
| Portfolio turnover rateG | 60%F | 29%F |
A For the period June 28, 2019 (commencement of operations) to March 31, 2020.
B Calculated based on average shares outstanding during the period.
C Total distributions per share do not sum due to rounding.
D Total returns for periods of less than one year are not annualized.
E Expense ratios reflect operating expenses of the class. Expenses before reductions do not reflect amounts reimbursed, waived, or reduced through arrangements with the investment adviser, brokerage services, or other offset arrangements, if applicable, and do not represent the amount paid by the class during periods when reimbursements, waivers or reductions occur.
F Annualized
G Amount does not include the portfolio activity of any underlying mutual funds or exchange-traded funds (ETFs).
See accompanying notes which are an integral part of the financial statements.
Fidelity Freedom Blend 2065 Fund Class K
| | Six months ended (Unaudited) September 30, | Years endedMarch 31, |
| | 2020 | 2020 A |
| Selected Per–Share Data | | |
| Net asset value, beginning of period | $8.43 | $10.00 |
| Income from Investment Operations | | |
| Net investment income (loss)B | .01 | .16 |
| Net realized and unrealized gain (loss) | 2.35 | (1.43) |
| Total from investment operations | 2.36 | (1.27) |
| Distributions from net investment income | – | (.17) |
| Distributions from net realized gain | (.05) | (.14) |
| Total distributions | (.05) | (.30)C |
| Net asset value, end of period | $10.74 | $8.43 |
| Total ReturnD | 28.10% | (13.30)% |
| Ratios to Average Net AssetsE | | |
| Expenses before reductions | .44%F | .44%F |
| Expenses net of fee waivers, if any | .44%F | .44%F |
| Expenses net of all reductions | .44%F | .44%F |
| Net investment income (loss) | .21%F | 2.13%F |
| Supplemental Data | | |
| Net assets, end of period (000 omitted) | $164 | $118 |
| Portfolio turnover rateG | 60%F | 29%F |
A For the period June 28, 2019 (commencement of operations) to March 31, 2020.
B Calculated based on average shares outstanding during the period.
C Total distributions per share do not sum due to rounding.
D Total returns for periods of less than one year are not annualized.
E Expense ratios reflect operating expenses of the class. Expenses before reductions do not reflect amounts reimbursed, waived, or reduced through arrangements with the investment adviser, brokerage services, or other offset arrangements, if applicable, and do not represent the amount paid by the class during periods when reimbursements, waivers or reductions occur.
F Annualized
G Amount does not include the portfolio activity of any underlying mutual funds or exchange-traded funds (ETFs).
See accompanying notes which are an integral part of the financial statements.
Fidelity Freedom Blend 2065 Fund Class K6
| | Six months ended (Unaudited) September 30, | Years endedMarch 31, |
| | 2020 | 2020 A |
| Selected Per–Share Data | | |
| Net asset value, beginning of period | $8.43 | $10.00 |
| Income from Investment Operations | | |
| Net investment income (loss)B | .02 | .16 |
| Net realized and unrealized gain (loss) | 2.33 | (1.42) |
| Total from investment operations | 2.35 | (1.26) |
| Distributions from net investment income | – | (.18) |
| Distributions from net realized gain | (.05) | (.14) |
| Total distributions | (.05) | (.31)C |
| Net asset value, end of period | $10.73 | $8.43 |
| Total ReturnD | 28.03% | (13.20)% |
| Ratios to Average Net AssetsE | | |
| Expenses before reductions | .34%F | .34%F |
| Expenses net of fee waivers, if any | .34%F | .34%F |
| Expenses net of all reductions | .34%F | .34%F |
| Net investment income (loss) | .31%F | 2.23%F |
| Supplemental Data | | |
| Net assets, end of period (000 omitted) | $3,500 | $1,084 |
| Portfolio turnover rateG | 60%F | 29%F |
A For the period June 28, 2019 (commencement of operations) to March 31, 2020.
B Calculated based on average shares outstanding during the period.
C Total distributions per share do not sum due to rounding.
D Total returns for periods of less than one year are not annualized.
E Expense ratios reflect operating expenses of the class. Expenses before reductions do not reflect amounts reimbursed, waived, or reduced through arrangements with the investment adviser, brokerage services, or other offset arrangements, if applicable, and do not represent the amount paid by the class during periods when reimbursements, waivers or reductions occur.
F Annualized
G Amount does not include the portfolio activity of any underlying mutual funds or exchange-traded funds (ETFs).
See accompanying notes which are an integral part of the financial statements.
Fidelity Freedom Blend 2065 Fund Class I
| | Six months ended (Unaudited) September 30, | Years endedMarch 31, |
| | 2020 | 2020 A |
| Selected Per–Share Data | | |
| Net asset value, beginning of period | $8.43 | $10.00 |
| Income from Investment Operations | | |
| Net investment income (loss)B | .01 | .15 |
| Net realized and unrealized gain (loss) | 2.34 | (1.42) |
| Total from investment operations | 2.35 | (1.27) |
| Distributions from net investment income | – | (.16) |
| Distributions from net realized gain | (.05) | (.14) |
| Total distributions | (.05) | (.30) |
| Net asset value, end of period | $10.73 | $8.43 |
| Total ReturnC | 27.99% | (13.34)% |
| Ratios to Average Net AssetsD | | |
| Expenses before reductions | .54%E | .54%E |
| Expenses net of fee waivers, if any | .54%E | .54%E |
| Expenses net of all reductions | .54%E | .54%E |
| Net investment income (loss) | .11%E | 2.03%E |
| Supplemental Data | | |
| Net assets, end of period (000 omitted) | $217 | $235 |
| Portfolio turnover rateF | 60%E | 29%E |
A For the period June 28, 2019 (commencement of operations) to March 31, 2020.
B Calculated based on average shares outstanding during the period.
C Total returns for periods of less than one year are not annualized.
D Expense ratios reflect operating expenses of the class. Expenses before reductions do not reflect amounts reimbursed, waived, or reduced through arrangements with the investment adviser, brokerage services, or other offset arrangements, if applicable, and do not represent the amount paid by the class during periods when reimbursements, waivers or reductions occur.
E Annualized
F Amount does not include the portfolio activity of any underlying mutual funds or exchange-traded funds (ETFs).
See accompanying notes which are an integral part of the financial statements.
Fidelity Freedom Blend 2065 Fund Class Z
| | Six months ended (Unaudited) September 30, | Years endedMarch 31, |
| | 2020 | 2020 A |
| Selected Per–Share Data | | |
| Net asset value, beginning of period | $8.44 | $10.00 |
| Income from Investment Operations | | |
| Net investment income (loss)B | .01 | .16 |
| Net realized and unrealized gain (loss) | 2.34 | (1.42) |
| Total from investment operations | 2.35 | (1.26) |
| Distributions from net investment income | – | (.17) |
| Distributions from net realized gain | (.05) | (.14) |
| Total distributions | (.05) | (.30)C |
| Net asset value, end of period | $10.74 | $8.44 |
| Total ReturnD | 27.95% | (13.20)% |
| Ratios to Average Net AssetsE | | |
| Expenses before reductions | .44%F | .44%F |
| Expenses net of fee waivers, if any | .44%F | .44%F |
| Expenses net of all reductions | .44%F | .44%F |
| Net investment income (loss) | .21%F | 2.13%F |
| Supplemental Data | | |
| Net assets, end of period (000 omitted) | $123 | $96 |
| Portfolio turnover rateG | 60%F | 29%F |
A For the period June 28, 2019 (commencement of operations) to March 31, 2020.
B Calculated based on average shares outstanding during the period.
C Total distributions per share do not sum due to rounding.
D Total returns for periods of less than one year are not annualized.
E Expense ratios reflect operating expenses of the class. Expenses before reductions do not reflect amounts reimbursed, waived, or reduced through arrangements with the investment adviser, brokerage services, or other offset arrangements, if applicable, and do not represent the amount paid by the class during periods when reimbursements, waivers or reductions occur.
F Annualized
G Amount does not include the portfolio activity of any underlying mutual funds or exchange-traded funds (ETFs).
See accompanying notes which are an integral part of the financial statements.
Fidelity Freedom Blend 2065 Fund Class Z6
| | Six months ended (Unaudited) September 30, | Years endedMarch 31, |
| | 2020 | 2020 A |
| Selected Per–Share Data | | |
| Net asset value, beginning of period | $8.44 | $10.00 |
| Income from Investment Operations | | |
| Net investment income (loss)B | .02 | .17 |
| Net realized and unrealized gain (loss) | 2.34 | (1.42) |
| Total from investment operations | 2.36 | (1.25) |
| Distributions from net investment income | – | (.17) |
| Distributions from net realized gain | (.05) | (.14) |
| Total distributions | (.05) | (.31) |
| Net asset value, end of period | $10.75 | $8.44 |
| Total ReturnC | 28.07% | (13.16)% |
| Ratios to Average Net AssetsD | | |
| Expenses before reductions | .34%E | .34%E |
| Expenses net of fee waivers, if any | .34%E | .34%E |
| Expenses net of all reductions | .34%E | .34%E |
| Net investment income (loss) | .31%E | 2.24%E |
| Supplemental Data | | |
| Net assets, end of period (000 omitted) | $125 | $97 |
| Portfolio turnover rateF | 60%E | 29%E |
A For the period June 28, 2019 (commencement of operations) to March 31, 2020.
B Calculated based on average shares outstanding during the period.
C Total returns for periods of less than one year are not annualized.
D Expense ratios reflect operating expenses of the class. Expenses before reductions do not reflect amounts reimbursed, waived, or reduced through arrangements with the investment adviser, brokerage services, or other offset arrangements, if applicable, and do not represent the amount paid by the class during periods when reimbursements, waivers or reductions occur.
E Annualized
F Amount does not include the portfolio activity of any underlying mutual funds or exchange-traded funds (ETFs).
See accompanying notes which are an integral part of the financial statements.
Notes to Financial Statements (Unaudited)
For the period ended September 30, 2020
1. Organization.
Fidelity Freedom Blend Income Fund, Fidelity Freedom Blend 2005 Fund, Fidelity Freedom Blend 2010 Fund, Fidelity Freedom Blend 2015 Fund, Fidelity Freedom Blend 2020 Fund, Fidelity Freedom Blend 2025 Fund, Fidelity Freedom Blend 2030 Fund, Fidelity Freedom Blend 2035 Fund, Fidelity Freedom Blend 2040 Fund, Fidelity Freedom Blend 2045 Fund, Fidelity Freedom Blend 2050 Fund, Fidelity Freedom Blend 2055 Fund, Fidelity Freedom Blend 2060 Fund and Fidelity Freedom Blend 2065 Fund (the Funds) are funds of Fidelity Aberdeen Street Trust (the Trust). The Trust is registered under the Investment Company Act of 1940, as amended (the 1940 Act), as an open-end management investment company organized as a Delaware statutory trust. Each Fund is authorized to issue an unlimited number of shares. Each Fund offers Class A, Class M, Class C, Fidelity Freedom Blend, Class K, Class K6, Class I, Class Z and Class Z6 shares, each of which has equal rights as to assets and voting privileges. Each class has exclusive voting rights with respect to matters that affect that class. Class C shares will automatically convert to Class A shares after a holding period of ten years from the initial date of purchase, with certain exceptions.
2. Investments in Fidelity Central Funds.
The Funds may invest in Fidelity Central Funds, which are open-end investment companies generally available only to other investment companies and accounts managed by the investment adviser and its affiliates. The Funds' Schedules of Investments list each of the Fidelity Central Funds held as of period end, if any, as an investment of each Fund, but do not include the underlying holdings of each Fidelity Central Fund. As an Investing Fund, each Fund indirectly bears its proportionate share of the expenses of the underlying Fidelity Central Funds.
The Money Market Central Funds seek preservation of capital and current income and are managed by the investment adviser. Annualized expenses of the Money Market Central Funds as of their most recent shareholder report date ranged from less than .005% to .01%.
A complete unaudited list of holdings for each Fidelity Central Fund is available upon request or at the Securities and Exchange Commission (the SEC) website at www.sec.gov. In addition, the financial statements of the Fidelity Central Funds are available on the SEC website or upon request.
3. Significant Accounting Policies.
Each Fund is an investment company and applies the accounting and reporting guidance of the Financial Accounting Standards Board (FASB) Accounting Standards Codification Topic 946 Financial Services – Investment Companies. The financial statements have been prepared in conformity with accounting principles generally accepted in the United States of America (GAAP), which require management to make certain estimates and assumptions at the date of the financial statements. Actual results could differ from those estimates. Subsequent events, if any, through the date that the financial statements were issued have been evaluated in the preparation of the financial statements. The following summarizes the significant accounting policies of the Funds:
Investment Valuation. Investments are valued as of 4:00 p.m. Eastern time on the last calendar day of the period. Each Fund categorizes the inputs to valuation techniques used to value its investments into a disclosure hierarchy consisting of three levels as shown below:
- Level 1 – quoted prices in active markets for identical investments
- Level 2 – other significant observable inputs (including quoted prices for similar investments, interest rates, prepayment speeds, etc.)
- Level 3 – unobservable inputs (including the Fund's own assumptions based on the best information available)
Valuation techniques used to value each Fund's investments by major category are as follows. Investments in open-end mutual funds are valued at their closing net asset value (NAV) each business day and are categorized as Level 1 in the hierarchy. The aggregate value of investments by input level as of September 30, 2020 is included at the end of each Fund's Schedule of Investments.
Investment Transactions and Income. For financial reporting purposes, the Funds' investment holdings and NAV include trades executed through the end of the last business day of the period. The NAV per share for processing shareholder transactions is calculated as of the close of business of the New York Stock Exchange (NYSE), normally 4:00 p.m. Eastern time and includes trades executed through the end of the prior business day. Gains and losses on securities sold are determined on the basis of identified cost. Income and capital gain distributions from any underlying mutual funds or exchange-traded funds (ETFs) are recorded on the ex-dividend date.
Class Allocations and Expenses. Investment income, realized and unrealized capital gains and losses, common expenses of each Fund, and certain fund-level expense reductions, if any, are allocated daily on a pro-rata basis to each class based on the relative net assets of each class to the total net assets of each Fund. Each class differs with respect to distribution and service plan fees incurred. Certain expense reductions may also differ by class. For the reporting period, the allocated portion of income and expenses to each class as a percent of its average net assets may vary due to the timing of recording these transactions in relation to fluctuating net assets of the classes. Expenses directly attributable to a fund are charged to that fund. Expenses attributable to more than one fund are allocated among the respective funds on the basis of relative net assets or other appropriate methods. Expenses included in the accompanying financial statements reflect the expenses of each Fund and do not include any expenses associated with any underlying mutual funds or exchange-traded funds (ETFs). Although not included in each Fund's expenses, each Fund indirectly bears its proportionate share of any underlying mutual funds or exchange-traded funds (ETFs) expenses through the impact of these expenses on each underlying mutual fund's or exchange-traded fund's (ETFs) NAV. Expense estimates are accrued in the period to which they relate and adjustments are made when actual amounts are known.
Income Tax Information and Distributions to Shareholders. Each year, each Fund intends to qualify as a regulated investment company under Subchapter M of the Internal Revenue Code, including distributing substantially all of its taxable income and realized gains. As a result, no provision for U.S. Federal income taxes is required. Each Fund files a U.S. federal tax return, in addition to state and local tax returns as required. Each Fund's federal income tax returns are subject to examination by the Internal Revenue Service (IRS) for a period of three fiscal years after they are filed. State and local tax returns may be subject to examination for an additional fiscal year depending on the jurisdiction.
Distributions are declared and recorded on the ex-dividend date. Income and capital gain distributions are declared separately for each class. Income and capital gain distributions are determined in accordance with income tax regulations, which may differ from GAAP.
Capital accounts within the financial statements are adjusted for permanent book-tax differences. These adjustments have no impact on net assets or the results of operations. Capital accounts are not adjusted for temporary book-tax differences which will reverse in a subsequent period.
Book-tax differences are primarily due to the short-term gain distributions from the Underlying Funds and losses deferred due to wash sales and excise tax regulations.
As of period end, the cost and unrealized appreciation (depreciation) in securities, and derivatives if applicable, for federal income tax purposes were as follows for each Fund:
| | Tax cost | Gross unrealized appreciation | Gross unrealized depreciation | Net unrealized appreciation (depreciation) |
| Fidelity Freedom Blend Income Fund | $52,469,140 | $2,952,066 | $(338,217) | $2,613,849 |
| Fidelity Freedom Blend 2005 Fund | 20,168,446 | 1,168,010 | (190,793) | 977,217 |
| Fidelity Freedom Blend 2010 Fund | 73,318,760 | 4,572,996 | (847,701) | 3,725,295 |
| Fidelity Freedom Blend 2015 Fund | 215,178,728 | 15,170,364 | (3,048,515) | 12,121,849 |
| Fidelity Freedom Blend 2020 Fund | 650,469,793 | 48,034,730 | (10,945,037) | 37,089,693 |
| Fidelity Freedom Blend 2025 Fund | 927,969,704 | 69,193,126 | (16,862,732) | 52,330,394 |
| Fidelity Freedom Blend 2030 Fund | 934,523,705 | 71,496,521 | (19,543,660) | 51,952,861 |
| Fidelity Freedom Blend 2035 Fund | 848,607,284 | 65,674,463 | (22,026,271) | 43,648,192 |
| Fidelity Freedom Blend 2040 Fund | 750,929,966 | 59,747,089 | (21,272,669) | 38,474,420 |
| Fidelity Freedom Blend 2045 Fund | 641,338,736 | 51,278,250 | (18,114,625) | 33,163,625 |
| Fidelity Freedom Blend 2050 Fund | 517,499,751 | 42,319,390 | (13,817,093) | 28,502,297 |
| Fidelity Freedom Blend 2055 Fund | 269,857,775 | 22,670,225 | (6,598,698) | 16,071,527 |
| Fidelity Freedom Blend 2060 Fund | 83,939,111 | 7,318,986 | (1,824,939) | 5,494,047 |
| Fidelity Freedom Blend 2065 Fund | 5,644,323 | 427,833 | (122,158) | 305,675 |
4. Purchases and Sales of Investments.
Purchases and sales of securities, other than short-term securities, are noted in the table below.
| | Purchases ($) | Sales ($) |
| Fidelity Freedom Blend Income Fund | 19,095,814 | 11,074,222 |
| Fidelity Freedom Blend 2005 Fund | 7,962,820 | 3,099,346 |
| Fidelity Freedom Blend 2010 Fund | 23,342,958 | 11,212,431 |
| Fidelity Freedom Blend 2015 Fund | 58,194,480 | 38,609,528 |
| Fidelity Freedom Blend 2020 Fund | 185,996,628 | 113,473,223 |
| Fidelity Freedom Blend 2025 Fund | 303,123,326 | 134,032,089 |
| Fidelity Freedom Blend 2030 Fund | 307,222,804 | 135,412,448 |
| Fidelity Freedom Blend 2035 Fund | 241,768,025 | 111,482,049 |
| Fidelity Freedom Blend 2040 Fund | 185,624,548 | 87,113,204 |
| Fidelity Freedom Blend 2045 Fund | 159,095,360 | 73,528,187 |
| Fidelity Freedom Blend 2050 Fund | 137,438,792 | 57,972,276 |
| Fidelity Freedom Blend 2055 Fund | 84,046,491 | 29,006,759 |
| Fidelity Freedom Blend 2060 Fund | 32,356,194 | 8,728,404 |
| Fidelity Freedom Blend 2065 Fund | 3,942,797 | 1,293,932 |
5. Fees and Other Transactions with Affiliates.
Management Fee and Expense Contract. Fidelity Management & Research Company LLC (the investment adviser) and its affiliates provide the Funds with investment management related services. Under the management contract, each Class of each Fund pays a monthly management fee that is set at an annual rate by referring to each Fund's target date, indicated by its name, such that the management fee rate applicable to each Class of each Fund is reduced as the fund approaches, and then passes, its target date. In addition, under the management contract, the investment adviser pays all ordinary operating expenses of each Fund, except distribution and service plan fees, fees and expenses of the independent Trustees, and certain miscellaneous expenses such as proxy and shareholder meeting expenses. For the reporting period, the total annual management fee rate for each Class of each Fund was as follows:
| | Annual % of Class-Level Average Net Assets (Classes A, M, C, I, Fidelity Freedom Blend Class) | Annual % of Class-Level Average Net Assets
(Classes K, K6, Z, Z6) |
| Fidelity Freedom Blend Income Fund | .46% | .36% |
| Fidelity Freedom Blend 2005 Fund | .46% | .36% |
| Fidelity Freedom Blend 2010 Fund | .47% | .37% |
| Fidelity Freedom Blend 2015 Fund | .48% | .38% |
| Fidelity Freedom Blend 2020 Fund | .49% | .39% |
| Fidelity Freedom Blend 2025 Fund | .51% | .41% |
| Fidelity Freedom Blend 2030 Fund | .52% | .42% |
| Fidelity Freedom Blend 2035 Fund | .53% | .43% |
| Fidelity Freedom Blend 2040 Fund | .54% | .44% |
| Fidelity Freedom Blend 2045 Fund | .54% | .44% |
| Fidelity Freedom Blend 2050 Fund | .54% | .44% |
| Fidelity Freedom Blend 2055 Fund | .54% | .44% |
| Fidelity Freedom Blend 2060 Fund | .54% | .44% |
| Fidelity Freedom Blend 2065 Fund | .54% | .44% |
Under the expense contract, the investment adviser pays class-level expenses for Class K6 and Class Z6 of each Fund as necessary so that Class K6 and Class Z6 total expenses do not exceed certain amounts of Class K6 and Class Z6 average net assets, respectively, on an annual basis with certain exceptions, as noted in the following table:
| | Annual % of Class-Level Average Net Assets (Classes K6, Z6) |
| Fidelity Freedom Blend Income Fund | .26% |
| Fidelity Freedom Blend 2005 Fund | .26% |
| Fidelity Freedom Blend 2010 Fund | .27% |
| Fidelity Freedom Blend 2015 Fund | .28% |
| Fidelity Freedom Blend 2020 Fund | .29% |
| Fidelity Freedom Blend 2025 Fund | .31% |
| Fidelity Freedom Blend 2030 Fund | .32% |
| Fidelity Freedom Blend 2035 Fund | .33% |
| Fidelity Freedom Blend 2040 Fund | .34% |
| Fidelity Freedom Blend 2045 Fund | .34% |
| Fidelity Freedom Blend 2050 Fund | .34% |
| Fidelity Freedom Blend 2055 Fund | .34% |
| Fidelity Freedom Blend 2060 Fund | .34% |
| Fidelity Freedom Blend 2065 Fund | .34% |
Distribution and Service Plan Fees. In accordance with Rule 12b-1 of the 1940 Act, each Fund has adopted separate Distribution and Service Plans for each class of shares. Certain classes pay Fidelity Distributors Company LLC (FDC), an affiliate of the investment adviser, separate Distribution and Service Fees, each of which is based on an annual percentage of each class' average net assets. In addition, FDC may pay financial intermediaries for selling shares of each Fund and providing shareholder support services. For the period, the Distribution and Service Fee rates, total fees and amounts retained by FDC were as follows:
| | Distribution Fee | Service Fee | Total Fees | Retained by FDC |
| Fidelity Freedom Blend Income Fund | | | | |
| Class A | -% | .25% | $1,396 | $195 |
| Class M | .25% | .25% | 434 | 232 |
| Class C | .75% | .25% | 1,297 | 542 |
| | | | $3,127 | $969 |
| Fidelity Freedom Blend 2005 Fund | | | | |
| Class A | -% | .25% | $360 | $137 |
| Class M | .25% | .25% | 308 | 271 |
| Class C | .75% | .25% | 1,391 | 627 |
| | | | $2,059 | $1,035 |
| Fidelity Freedom Blend 2010 Fund | | | | |
| Class A | -% | .25% | $782 | $112 |
| Class M | .25% | .25% | 816 | 269 |
| Class C | .75% | .25% | 785 | 669 |
| | | | $2,383 | $1,050 |
| Fidelity Freedom Blend 2015 Fund | | | | |
| Class A | -% | .25% | $680 | $97 |
| Class M | .25% | .25% | 294 | 270 |
| Class C | .75% | .25% | 3,139 | 2,641 |
| | | | $4,113 | $3,008 |
| Fidelity Freedom Blend 2020 Fund | | | | |
| Class A | -% | .25% | $2,439 | $138 |
| Class M | .25% | .25% | 952 | 330 |
| Class C | .75% | .25% | 3,325 | 1,000 |
| | | | $6,716 | $1,468 |
| Fidelity Freedom Blend 2025 Fund | | | | |
| Class A | -% | .25% | $2,696 | $237 |
| Class M | .25% | .25% | 3,218 | 214 |
| Class C | .75% | .25% | 4,105 | 2,172 |
| | | | $10,019 | $2,623 |
| Fidelity Freedom Blend 2030 Fund | | | | |
| Class A | -% | .25% | $2,499 | $196 |
| Class M | .25% | .25% | 3,116 | 356 |
| Class C | .75% | .25% | 10,057 | 4,557 |
| | | | $15,672 | $5,109 |
| Fidelity Freedom Blend 2035 Fund | | | | |
| Class A | -% | .25% | $1,550 | $134 |
| Class M | .25% | .25% | 926 | 254 |
| Class C | .75% | .25% | 2,643 | 1,156 |
| | | | $5,119 | $1,544 |
| Fidelity Freedom Blend 2040 Fund | | | | |
| Class A | -% | .25% | $1,544 | $142 |
| Class M | .25% | .25% | 1,140 | 237 |
| Class C | .75% | .25% | 3,572 | 1,674 |
| | | | $6,256 | $2,053 |
| Fidelity Freedom Blend 2045 Fund | | | | |
| Class A | -% | .25% | $1,427 | $195 |
| Class M | .25% | .25% | 3,172 | 248 |
| Class C | .75% | .25% | 2,600 | 1,696 |
| | | | $7,199 | $2,139 |
| Fidelity Freedom Blend 2050 Fund | | | | |
| Class A | -% | .25% | $1,248 | $193 |
| Class M | .25% | .25% | 1,010 | 246 |
| Class C | .75% | .25% | 3,081 | 2,268 |
| | | | $5,339 | $2,707 |
| Fidelity Freedom Blend 2055 Fund | | | | |
| Class A | -% | .25% | $797 | $173 |
| Class M | .25% | .25% | 884 | 313 |
| Class C | .75% | .25% | 1,067 | 931 |
| | | | $2,748 | $1,417 |
| Fidelity Freedom Blend 2060 Fund | | | | |
| Class A | -% | .25% | $898 | $139 |
| Class M | .25% | .25% | 570 | 263 |
| Class C | .75% | .25% | 1,496 | 1,304 |
| | | | $2,964 | $1,706 |
| Fidelity Freedom Blend 2065 Fund | | | | |
| Class A | -% | .25% | $263 | $143 |
| Class M | .25% | .25% | 562 | 283 |
| Class C | .75% | .25% | 1,047 | 836 |
| | | | $1,872 | $1,262 |
Sales Load. FDC may receive a front-end sales charge of up to 5.75% for selling Class A shares and 3.50% for selling Class M shares, some of which is paid to financial intermediaries for selling shares of each Fund. Depending on the holding period, FDC may receive contingent deferred sales charges levied on Class A, Class M and Class C redemptions. The deferred sales charges are 1.00% for Class C shares, 1.00% for certain purchases of Class A shares and .25% for certain purchases of Class M shares.
For the period, sales charge amounts retained by FDC were as follows:
| | Retained by FDC |
| Fidelity Freedom Blend Income Fund | |
| Class A | $398 |
| Class M | 20 |
| | $418 |
| Fidelity Freedom Blend 2005 Fund | |
| Class A | $22 |
| | $22 |
| Fidelity Freedom Blend 2010 Fund | |
| Class A | $16 |
| Class M | 1 |
| | $17 |
| Fidelity Freedom Blend 2015 Fund | |
| Class A | $9 |
| Class M | 4 |
| | $13 |
| Fidelity Freedom Blend 2020 Fund | |
| Class A | $363 |
| Class M | 26 |
| Class C(a) | 29 |
| | $418 |
| Fidelity Freedom Blend 2025 Fund | |
| Class A | $2,907 |
| Class M | 631 |
| Class C(a) | 62 |
| | $3,600 |
| Fidelity Freedom Blend 2030 Fund | |
| Class A | $1,518 |
| Class M | 782 |
| Class C(a) | 198 |
| | $2,498 |
| Fidelity Freedom Blend 2035 Fund | |
| Class A | $1,412 |
| Class M | 282 |
| Class C(a) | 100 |
| | $1,794 |
| Fidelity Freedom Blend 2040 Fund | |
| Class A | $2,121 |
| Class M | 191 |
| Class C(a) | 48 |
| | $2,360 |
| Fidelity Freedom Blend 2045 Fund | |
| Class A | $1,696 |
| Class M | 219 |
| Class C(a) | 27 |
| | $1,942 |
| Fidelity Freedom Blend 2050 Fund | |
| Class A | $1,944 |
| Class M | 485 |
| Class C(a) | 559 |
| | $2,988 |
| Fidelity Freedom Blend 2055 Fund | |
| Class A | $995 |
| Class M | 569 |
| | $1,564 |
| Fidelity Freedom Blend 2060 Fund | |
| Class A | $1,115 |
| Class M | 335 |
| Class C(a) | 20 |
| | $1,470 |
| Fidelity Freedom Blend 2065 Fund | |
| Class M | $87 |
| | $87 |
(a) When Class C shares are initially sold, FDC pays commissions from its own resources to financial intermediaries through which the sales are made.
Interfund Trades. Funds may purchase from or sell securities to other Fidelity Funds under procedures adopted by the Board. The procedures have been designed to ensure these interfund trades are executed in accordance with Rule 17a-7 of the 1940 Act. Interfund trades are included within the respective purchases and sales amounts shown in the Purchases and Sales of Investments note.
6. Expense Reductions.
Through arrangements with each applicable Fund's custodian and each class' transfer agent, credits realized as a result of certain uninvested cash balances were used to reduce each applicable Fund's or class' expenses. All of the applicable expense reductions are noted in the table below.
| | Custodian credits | Transfer Agent credits |
| Fidelity Freedom Blend Income Fund | | |
| Class M | $ – | $ 4 |
| | $ – | $ 4 |
| Fidelity Freedom Blend 2010 Fund | | |
| Class A | $ – | $ 1 |
| | $ – | $ 1 |
| Fidelity Freedom Blend 2020 Fund | | |
| Class A | $ – | $11 |
| Class C | – | 107 |
| Class K6 | 4 | – |
| | $4 | $118 |
| Fidelity Freedom Blend 2025 Fund | | |
| Class C | $ – | $9 |
| | $ – | $9 |
| Fidelity Freedom Blend 2030 Fund | | |
| Class M | $ – | $13
|
| Class C | – | 20 |
| Class K6 | 3 | – |
| | $3 | $33 |
| Fidelity Freedom Blend 2035 Fund | | |
| Class A | $ – | $ 61 |
| | $ – | $ 61 |
| Fidelity Freedom Blend 2045 Fund | | |
| Class M | $ – | $ 1 |
| | $ – | $ 1 |
| Fidelity Freedom Blend 2050 Fund | | |
| Class C | $ – | $5 |
| | $ – | $ 5 |
| Fidelity Freedom Blend 2060 Fund | | |
| Class A | $ – | $ 1 |
| | $ – | $ 1 |
7. Distributions to Shareholders.
Distributions to shareholders of each class were as follows:
| | Six months ended
September 30, 2020 | Year ended
March 31, 2020 |
| Fidelity Freedom Blend Income Fund | | |
| Distributions to shareholders | | |
| Class A | $5,748 | $8,738 |
| Class M | 728 | 5,134 |
| Class C | 731 | 2,540 |
| Fidelity Freedom Blend Income Fund | 23,199 | 32,325 |
| Class K | 3,034 | 6,526 |
| Class K6 | 342,240 | 775,253 |
| Class I | 2,270 | 2,636 |
| Class Z | 2,179 | 2,493 |
| Class Z6 | 1,175 | 2,650 |
| Total | $381,304 | $838,295 |
| Fidelity Freedom Blend 2005 Fund | | |
| Distributions to shareholders | | |
| Class A | $1,840 | $5,423 |
| Class M | 592 | 1,990 |
| Class C | 1,674 | 2,254 |
| Fidelity Freedom Blend 2005 Fund | 8,488 | 23,445 |
| Class K | 1,407 | 3,270 |
| Class K6 | 99,961 | 300,610 |
| Class I | 5,440 | 12,666 |
| Class Z | 792 | 2,484 |
| Class Z6 | 848 | 2,587 |
| Total | $121,042 | $354,729 |
| Fidelity Freedom Blend 2010 Fund | | |
| Distributions to shareholders | | |
| Class A | $6,341 | $4,117 |
| Class M | 2,365 | 3,946 |
| Class C | 745 | 2,008 |
| Fidelity Freedom Blend 2010 Fund | 23,021 | 36,055 |
| Class K | 58,950 | 166,144 |
| Class K6 | 465,734 | 1,219,643 |
| Class I | 5,493 | 7,112 |
| Class Z | 949 | 2,428 |
| Class Z6 | 2,866 | 2,622 |
| Total | $566,464 | $1,444,075 |
| Fidelity Freedom Blend 2015 Fund | | |
| Distributions to shareholders | | |
| Class A | $5,557 | $10,755 |
| Class M | 995 | 2,598 |
| Class C | 4,927 | 3,226 |
| Fidelity Freedom Blend 2015 Fund | 92,165 | 138,729 |
| Class K | 67,225 | 159,590 |
| Class K6 | 1,837,151 | 4,932,297 |
| Class I | 49,638 | 95,192 |
| Class Z | 1,088 | 2,853 |
| Class Z6 | 7,705 | 8,995 |
| Total | $2,066,451 | $5,354,235 |
| Fidelity Freedom Blend 2020 Fund | | |
| Distributions to shareholders | | |
| Class A | $15,578 | $52,543 |
| Class M | 2,552 | 4,631 |
| Class C | 6,121 | 13,577 |
| Fidelity Freedom Blend 2020 Fund | 227,006 | 229,606 |
| Class K | 276,897 | 809,512 |
| Class K6 | 5,909,470 | 15,685,257 |
| Class I | 71,813 | 88,111 |
| Class Z | 1,437 | 3,071 |
| Class Z6 | 21,432 | 6,382 |
| Total | $6,532,306 | $16,892,690 |
| Fidelity Freedom Blend 2025 Fund | | |
| Distributions to shareholders | | |
| Class A | $17,140 | $40,279 |
| Class M | 8,391 | 8,783 |
| Class C | 5,839 | 11,457 |
| Fidelity Freedom Blend 2025 Fund | 232,260 | 213,672 |
| Class K | 259,770 | 799,085 |
| Class K6 | 7,186,707 | 21,003,005 |
| Class I | 208,606 | 174,303 |
| Class Z | 1,042 | 3,260 |
| Class Z6 | 43,074 | 12,966 |
| Total | $7,962,829 | $22,266,810 |
| Fidelity Freedom Blend 2030 Fund | | |
| Distributions to shareholders | | |
| Class A | $16,410 | $34,389 |
| Class M | 9,320 | 19,154 |
| Class C | 19,266 | 12,929 |
| Fidelity Freedom Blend 2030 Fund | 194,428 | 162,703 |
| Class K | 248,706 | 769,504 |
| Class K6 | 7,546,094 | 21,676,270 |
| Class I | 194,987 | 159,079 |
| Class Z | 1,942 | 3,704 |
| Class Z6 | 46,891 | 18,455 |
| Total | $8,278,044 | $22,856,187 |
| Fidelity Freedom Blend 2035 Fund | | |
| Distributions to shareholders | | |
| Class A | $10,240 | $32,283 |
| Class M | 3,497 | 8,010 |
| Class C | 4,249 | 8,722 |
| Fidelity Freedom Blend 2035 Fund | 205,876 | 134,952 |
| Class K | 206,030 | 598,323 |
| Class K6 | 8,042,871 | 22,128,385 |
| Class I | 129,776 | 113,319 |
| Class Z | 3,032 | 9,587 |
| Class Z6 | 30,630 | 10,154 |
| Total | $8,636,201 | $23,043,735 |
| Fidelity Freedom Blend 2040 Fund | | |
| Distributions to shareholders | | |
| Class A | $10,050 | $19,594 |
| Class M | 4,130 | 5,585 |
| Class C | 5,648 | 10,160 |
| Fidelity Freedom Blend 2040 Fund | 207,677 | 121,223 |
| Class K | 203,408 | 516,568 |
| Class K6 | 7,170,709 | 19,412,655 |
| Class I | 76,892 | 81,386 |
| Class Z | 1,173 | 3,583 |
| Class Z6 | 21,242 | 5,310 |
| Total | $7,700,929 | $20,176,064 |
| Fidelity Freedom Blend 2045 Fund | | |
| Distributions to shareholders | | |
| Class A | $11,359 | $27,494 |
| Class M | 13,030 | 7,045 |
| Class C | 3,571 | 6,265 |
| Fidelity Freedom Blend 2045 Fund | 148,179 | 68,591 |
| Class K | 180,799 | 461,012 |
| Class K6 | 6,127,549 | 16,369,836 |
| Class I | 66,878 | 88,782 |
| Class Z | 1,237 | 3,619 |
| Class Z6 | 16,053 | 5,334 |
| Total | $6,568,655 | $17,037,978 |
| Fidelity Freedom Blend 2050 Fund | | |
| Distributions to shareholders | | |
| Class A | $8,056 | $19,819 |
| Class M | 3,632 | 8,625 |
| Class C | 5,816 | 9,876 |
| Fidelity Freedom Blend 2050 Fund | 128,193 | 60,239 |
| Class K | 103,798 | 308,941 |
| Class K6 | 4,612,080 | 11,994,804 |
| Class I | 41,900 | 96,721 |
| Class Z | 1,102 | 3,453 |
| Class Z6 | 26,450 | 4,367 |
| Total | $4,931,027 | $12,506,845 |
| Fidelity Freedom Blend 2055 Fund | | |
| Distributions to shareholders | | |
| Class A | $4,489 | $11,061 |
| Class M | 2,658 | 4,435 |
| Class C | 1,654 | 4,029 |
| Fidelity Freedom Blend 2055 Fund | 59,989 | 22,905 |
| Class K | 51,362 | 153,497 |
| Class K6 | 1,936,039 | 4,851,114 |
| Class I | 20,536 | 50,084 |
| Class Z | 929 | 3,206 |
| Class Z6 | 8,219 | 5,156 |
| Total | $2,085,875 | $5,105,487 |
| Fidelity Freedom Blend 2060 Fund | | |
| Distributions to shareholders | | |
| Class A | $4,154 | $12,880 |
| Class M | 1,460 | 4,107 |
| Class C | 1,914 | 4,470 |
| Fidelity Freedom Blend 2060 Fund | 24,386 | 29,908 |
| Class K | 10,493 | 38,953 |
| Class K6 | 402,696 | 1,010,306 |
| Class I | 9,268 | 25,016 |
| Class Z | 706 | 3,118 |
| Class Z6 | 3,565 | 3,250 |
| Total | $458,642 | $1,132,008 |
| Fidelity Freedom Blend 2065 Fund | | |
| Distributions to shareholders(a) | | |
| Class A | $1,059 | $4,538 |
| Class M | 1,058 | 3,736 |
| Class C | 984 | 4,126 |
| Fidelity Freedom Blend 2065 Fund | 3,054 | 7,111 |
| Class K | 710 | 3,966 |
| Class K6 | 9,434 | 9,439 |
| Class I | 850 | 3,337 |
| Class Z | 583 | 3,344 |
| Class Z6 | 588 | 3,400 |
| Total | $18,320 | $42,997 |
(a) For the period June 28, 2019 (commencement of operations) to March 31, 2020.
8. Share Transactions.
Share transactions for each class were as follows and may contain automatic conversions between classes or exchanges between affiliated funds:
| | Shares | Shares | Dollars | Dollars |
| | Six months ended September 30, 2020 | Year ended March 31, 2020 | Six months ended September 30, 2020 | Year ended March 31, 2020 |
| Fidelity Freedom Blend Income Fund | | | | |
| Class A | | | | |
| Shares sold | 71,051 | 62,555 | $741,302 | $638,682 |
| Reinvestment of distributions | 557 | 843 | 5,747 | 8,738 |
| Shares redeemed | (10,671) | (3,991) | (113,899) | (40,199) |
| Net increase (decrease) | 60,937 | 59,407 | $633,150 | $607,221 |
| Class M | | | | |
| Shares sold | 1,127 | 26,230 | $11,446 | $269,516 |
| Reinvestment of distributions | 71 | 495 | 728 | 5,135 |
| Shares redeemed | – | (21,272) | – | (214,074) |
| Net increase (decrease) | 1,198 | 5,453 | $12,174 | $60,577 |
| Class C | | | | |
| Shares sold | 50,627 | 12,316 | $538,333 | $127,258 |
| Reinvestment of distributions | 72 | 245 | 731 | 2,540 |
| Shares redeemed | (2,513) | (1,986) | (25,791) | (20,608) |
| Net increase (decrease) | 48,186 | 10,575 | $513,273 | $109,190 |
| Fidelity Freedom Blend Income Fund | | | | |
| Shares sold | 169,606 | 422,104 | $1,775,221 | $4,378,184 |
| Reinvestment of distributions | 2,242 | 3,109 | 23,170 | 32,325 |
| Shares redeemed | (102,196) | (189,533) | (1,086,408) | (1,961,292) |
| Net increase (decrease) | 69,652 | 235,680 | $711,983 | $2,449,217 |
| Class K | | | | |
| Shares sold | 4,895 | 29,755 | $51,299 | $309,910 |
| Reinvestment of distributions | 294 | 628 | 3,034 | 6,526 |
| Shares redeemed | (7,649) | (113) | (79,615) | (1,186) |
| Net increase (decrease) | (2,460) | 30,270 | $(25,282) | $315,250 |
| Class K6 | | | | |
| Shares sold | 1,253,980 | 4,799,951 | $13,200,007 | $48,890,496 |
| Reinvestment of distributions | 33,083 | 74,806 | 342,240 | 775,252 |
| Shares redeemed | (825,106) | (1,147,013) | (8,715,597) | (11,817,975) |
| Net increase (decrease) | 461,957 | 3,727,744 | $4,826,650 | $37,847,773 |
| Class I | | | | |
| Shares sold | 39,771 | 15,112 | $429,760 | $157,824 |
| Reinvestment of distributions | 218 | 254 | 2,270 | 2,636 |
| Shares redeemed | (1,837) | (1,325) | (19,454) | (13,883) |
| Net increase (decrease) | 38,152 | 14,041 | $412,576 | $146,577 |
| Class Z | | | | |
| Shares sold | 111,413 | – | $1,199,397 | $– |
| Reinvestment of distributions | 90 | 241 | 940 | 2,493 |
| Shares redeemed | (24,820) | – | (267,018) | – |
| Net increase (decrease) | 86,683 | 241 | $933,319 | $2,493 |
| Class Z6 | | | | |
| Shares sold | 444 | 5,361 | $4,706 | $56,499 |
| Reinvestment of distributions | 114 | 256 | 1,174 | 2,650 |
| Shares redeemed | (4,985) | (379) | (52,280) | (3,907) |
| Net increase (decrease) | (4,427) | 5,238 | $(46,400) | $55,242 |
| Fidelity Freedom Blend 2005 Fund | | | | |
| Class A | | | | |
| Shares sold | 2,586 | 11,122 | $27,084 | $112,529 |
| Reinvestment of distributions | 182 | 521 | 1,840 | 5,424 |
| Shares redeemed | (934) | (3,711) | (9,610) | (36,690) |
| Net increase (decrease) | 1,834 | 7,932 | $19,314 | $81,263 |
| Class M | | | | |
| Shares sold | 1,019 | 4,369 | $10,282 | $45,521 |
| Reinvestment of distributions | 58 | 191 | 592 | 1,991 |
| Shares redeemed | – | (3,754) | – | (37,013) |
| Net increase (decrease) | 1,077 | 806 | $10,874 | $10,499 |
| Class C | | | | |
| Shares sold | 1,582 | 16,140 | $16,190 | $161,085 |
| Reinvestment of distributions | 166 | 217 | 1,674 | 2,254 |
| Shares redeemed | (4,267) | (419) | (45,827) | (4,103) |
| Net increase (decrease) | (2,519) | 15,938 | $(27,963) | $159,236 |
| Fidelity Freedom Blend 2005 Fund | | | | |
| Shares sold | 49,856 | 279,891 | $532,044 | $2,857,879 |
| Reinvestment of distributions | 838 | 2,253 | 8,488 | 23,445 |
| Shares redeemed | (16,726) | (179,100) | (177,585) | (1,816,731) |
| Net increase (decrease) | 33,968 | 103,044 | $362,947 | $1,064,593 |
| Class K | | | | |
| Shares sold | 42,736 | 7,581 | $459,114 | $76,208 |
| Reinvestment of distributions | 139 | 314 | 1,407 | 3,271 |
| Shares redeemed | (8,248) | (21) | (85,903) | (201) |
| Net increase (decrease) | 34,627 | 7,874 | $374,618 | $79,278 |
| Class K6 | | | | |
| Shares sold | 554,798 | 1,882,369 | $5,790,429 | $19,120,279 |
| Reinvestment of distributions | 9,858 | 28,850 | 99,961 | 300,610 |
| Shares redeemed | (184,448) | (813,267) | (1,940,475) | (8,297,598) |
| Net increase (decrease) | 380,208 | 1,097,952 | $3,949,915 | $11,123,291 |
| Class I | | | | |
| Shares sold | 12,629 | 61,852 | $132,297 | $643,522 |
| Reinvestment of distributions | 537 | 1,215 | 5,440 | 12,666 |
| Shares redeemed | (15,759) | (3,132) | (163,477) | (32,974) |
| Net increase (decrease) | (2,593) | 59,935 | $(25,740) | $623,214 |
| Class Z | | | | |
| Shares sold | 20,032 | – | $216,014 | $– |
| Reinvestment of distributions | 78 | 238 | 791 | 2,484 |
| Shares redeemed | (8,024) | – | (86,558) | – |
| Net increase (decrease) | 12,086 | 238 | $130,247 | $2,484 |
| Class Z6 | | | | |
| Shares sold | 99 | 448 | $1,077 | $4,680 |
| Reinvestment of distributions | 84 | 248 | 848 | 2,587 |
| Shares redeemed | (1) | (1) | (15) | (7) |
| Net increase (decrease) | 182 | 695 | $1,910 | $7,260 |
| Fidelity Freedom Blend 2010 Fund | | | | |
| Class A | | | | |
| Shares sold | 50,085 | 5,025 | $498,669 | $50,531 |
| Reinvestment of distributions | 635 | 394 | 6,341 | 4,117 |
| Shares redeemed | (5,028) | (2,458) | (51,945) | (22,933) |
| Net increase (decrease) | 45,692 | 2,961 | $453,065 | $31,715 |
| Class M | | | | |
| Shares sold | 6,019 | 16,393 | $60,693 | $168,719 |
| Reinvestment of distributions | 237 | 378 | 2,366 | 3,946 |
| Shares redeemed | – | (2,618) | – | (24,213) |
| Net increase (decrease) | 6,256 | 14,153 | $63,059 | $148,452 |
| Class C | | | | |
| Shares sold | 10,048 | 1,860 | $105,444 | $19,066 |
| Reinvestment of distributions | 75 | 192 | 745 | 2,007 |
| Shares redeemed | (1,901) | – | (18,825) | – |
| Net increase (decrease) | 8,222 | 2,052 | $87,364 | $21,073 |
| Fidelity Freedom Blend 2010 Fund | | | | |
| Shares sold | 162,883 | 347,271 | $1,683,742 | $3,601,555 |
| Reinvestment of distributions | 2,304 | 3,451 | 23,021 | 36,055 |
| Shares redeemed | (46,780) | (137,893) | (488,737) | (1,430,093) |
| Net increase (decrease) | 118,407 | 212,829 | $1,218,026 | $2,207,517 |
| Class K | | | | |
| Shares sold | 7,369 | 659,888 | $77,043 | $6,824,771 |
| Reinvestment of distributions | 5,895 | 15,884 | 58,950 | 166,144 |
| Shares redeemed | (26,765) | (32,064) | (275,420) | (329,148) |
| Net increase (decrease) | (13,501) | 643,708 | $(139,427) | $6,661,767 |
| Class K6 | | | | |
| Shares sold | 1,385,338 | 6,005,660 | $14,424,379 | $60,620,115 |
| Reinvestment of distributions | 46,527 | 116,622 | 465,734 | 1,219,643 |
| Shares redeemed | (542,987) | (1,315,490) | (5,686,977) | (13,382,189) |
| Net increase (decrease) | 888,878 | 4,806,792 | $9,203,136 | $48,457,569 |
| Class I | | | | |
| Shares sold | 30,589 | 37,258 | $306,248 | $387,686 |
| Reinvestment of distributions | 549 | 680 | 5,493 | 7,112 |
| Shares redeemed | (8,035) | (1,271) | (84,586) | (13,355) |
| Net increase (decrease) | 23,103 | 36,667 | $227,155 | $381,443 |
| Class Z | | | | |
| Shares sold | 4,155 | – | $44,463 | $– |
| Reinvestment of distributions | 95 | 232 | 949 | 2,427 |
| Net increase (decrease) | 4,250 | 232 | $45,412 | $2,427 |
| Class Z6 | | | | |
| Shares sold | 59,494 | 33,688 | $643,600 | $356,908 |
| Reinvestment of distributions | 286 | 250 | 2,866 | 2,623 |
| Shares redeemed | (168) | (14,537) | (1,710) | (152,360) |
| Net increase (decrease) | 59,612 | 19,401 | $644,756 | $207,171 |
| Fidelity Freedom Blend 2015 Fund | | | | |
| Class A | | | | |
| Shares sold | 21,990 | 28,250 | $216,767 | $293,223 |
| Reinvestment of distributions | 565 | 837 | 5,557 | 8,766 |
| Shares redeemed | (2,766) | (12,078) | (28,495) | (114,023) |
| Net increase (decrease) | 19,789 | 17,009 | $193,829 | $187,966 |
| Class M | | | | |
| Shares sold | 60 | 889 | $639 | $9,027 |
| Reinvestment of distributions | 101 | 248 | 995 | 2,598 |
| Shares redeemed | (6) | – | (60) | – |
| Net increase (decrease) | 155 | 1,137 | $1,574 | $11,625 |
| Class C | | | | |
| Shares sold | 15,173 | 36,356 | $149,209 | $359,968 |
| Reinvestment of distributions | 503 | 309 | 4,926 | 3,226 |
| Shares redeemed | (97) | (1,494) | (990) | (15,824) |
| Net increase (decrease) | 15,579 | 35,171 | $153,145 | $347,370 |
| Fidelity Freedom Blend 2015 Fund | | | | |
| Shares sold | 307,461 | 1,342,090 | $3,185,031 | $13,848,094 |
| Reinvestment of distributions | 9,355 | 13,245 | 92,146 | 138,673 |
| Shares redeemed | (438,697) | (508,223) | (4,607,050) | (5,227,808) |
| Net increase (decrease) | (121,881) | 847,112 | $(1,329,873) | $8,758,959 |
| Class K | | | | |
| Shares sold | 47,631 | 807,937 | $499,011 | $8,362,163 |
| Reinvestment of distributions | 6,818 | 15,228 | 67,225 | 159,590 |
| Shares redeemed | (221,593) | (183,022) | (2,247,255) | (1,891,984) |
| Net increase (decrease) | (167,144) | 640,143 | $(1,681,019) | $6,629,769 |
| Class K6 | | | | |
| Shares sold | 3,563,763 | 19,726,381 | $36,511,287 | $198,186,726 |
| Reinvestment of distributions | 185,946 | 470,564 | 1,837,151 | 4,932,297 |
| Shares redeemed | (1,867,758) | (3,853,351) | (19,312,619) | (39,415,063) |
| Net increase (decrease) | 1,881,951 | 16,343,594 | $19,035,819 | $163,703,960 |
| Class I | | | | |
| Shares sold | 180,651 | 372,907 | $1,832,871 | $3,909,828 |
| Reinvestment of distributions | 5,045 | 9,101 | 49,638 | 95,191 |
| Shares redeemed | (59,488) | (11,553) | (631,983) | (114,498) |
| Net increase (decrease) | 126,208 | 370,455 | $1,250,526 | $3,890,521 |
| Class Z | | | | |
| Reinvestment of distributions | 110 | 272 | $1,088 | $2,853 |
| Net increase (decrease) | 110 | 272 | $1,088 | $2,853 |
| Class Z6 | | | | |
| Shares sold | 98,389 | 77,326 | $1,072,995 | $792,258 |
| Reinvestment of distributions | 781 | 858 | 7,705 | 8,996 |
| Shares redeemed | (24,604) | (17,875) | (264,125) | (168,239) |
| Net increase (decrease) | 74,566 | 60,309 | $816,575 | $633,015 |
| Fidelity Freedom Blend 2020 Fund | | | | |
| Class A | | | | |
| Shares sold | 113,939 | 210,830 | $1,182,927 | $2,137,244 |
| Reinvestment of distributions | 1,593 | 4,985 | 15,578 | 52,542 |
| Shares redeemed | (52,475) | (153,051) | (559,018) | (1,532,924) |
| Net increase (decrease) | 63,057 | 62,764 | $639,487 | $656,862 |
| Class M | | | | |
| Shares sold | 28,994 | 22,771 | $305,945 | $238,437 |
| Reinvestment of distributions | 261 | 439 | 2,552 | 4,631 |
| Shares redeemed | (1,947) | (5,246) | (18,834) | (51,676) |
| Net increase (decrease) | 27,308 | 17,964 | $289,663 | $191,392 |
| Class C | | | | |
| Shares sold | 34,703 | 32,007 | $348,920 | $327,258 |
| Reinvestment of distributions | 628 | 1,291 | 6,121 | 13,577 |
| Shares redeemed | (6,316) | (27,669) | (65,560) | (294,717) |
| Net increase (decrease) | 29,015 | 5,629 | $289,481 | $46,118 |
| Fidelity Freedom Blend 2020 Fund | | | | |
| Shares sold | 1,420,155 | 3,071,141 | $14,921,079 | $31,827,871 |
| Reinvestment of distributions | 23,211 | 21,350 | 227,003 | 225,245 |
| Shares redeemed | (1,091,595) | (1,155,853) | (11,502,233) | (11,831,997) |
| Net increase (decrease) | 351,771 | 1,936,638 | $3,645,849 | $20,221,119 |
| Class K | | | | |
| Shares sold | 265,329 | 2,837,630 | $2,804,362 | $29,553,993 |
| Reinvestment of distributions | 28,255 | 76,658 | 276,897 | 809,512 |
| Shares redeemed | (691,475) | (411,861) | (7,011,735) | (4,345,988) |
| Net increase (decrease) | (397,891) | 2,502,427 | $(3,930,476) | $26,017,517 |
| Class K6 | | | | |
| Shares sold | 12,062,207 | 58,938,931 | $122,388,720 | $593,707,590 |
| Reinvestment of distributions | 601,779 | 1,483,753 | 5,909,469 | 15,685,257 |
| Shares redeemed | (6,171,114) | (11,477,811) | (64,161,504) | (117,101,198) |
| Net increase (decrease) | 6,492,872 | 48,944,873 | $64,136,685 | $492,291,649 |
| Class I | | | | |
| Shares sold | 248,682 | 589,216 | $2,549,426 | $6,185,794 |
| Reinvestment of distributions | 7,335 | 8,344 | 71,812 | 88,112 |
| Shares redeemed | (90,968) | (54,803) | (925,254) | (521,841) |
| Net increase (decrease) | 165,049 | 542,757 | $1,695,984 | $5,752,065 |
| Class Z | | | | |
| Shares sold | – | 2,526 | $– | $27,000 |
| Reinvestment of distributions | 133 | 290 | 1,302 | 3,071 |
| Net increase (decrease) | 133 | 2,816 | $1,302 | $30,071 |
| Class Z6 | | | | |
| Shares sold | 104,846 | 447,539 | $1,131,750 | $4,712,064 |
| Reinvestment of distributions | 2,183 | 603 | 21,432 | 6,382 |
| Shares redeemed | (7,180) | (266,580) | (72,176) | (2,446,908) |
| Net increase (decrease) | 99,849 | 181,562 | $1,081,006 | $2,271,538 |
| Fidelity Freedom Blend 2025 Fund | | | | |
| Class A | | | | |
| Shares sold | 111,808 | 219,652 | $1,137,927 | $2,222,602 |
| Reinvestment of distributions | 1,780 | 3,840 | 17,139 | 40,279 |
| Shares redeemed | (33,456) | (53,075) | (318,665) | (530,975) |
| Net increase (decrease) | 80,132 | 170,417 | $836,401 | $1,731,906 |
| Class M | | | | |
| Shares sold | 58,455 | 75,724 | $599,426 | $798,245 |
| Reinvestment of distributions | 867 | 833 | 8,391 | 8,782 |
| Shares redeemed | (4,449) | (55,530) | (45,640) | (565,093) |
| Net increase (decrease) | 54,873 | 21,027 | $562,177 | $241,934 |
| Class C | | | | |
| Shares sold | 56,733 | 32,708 | $563,804 | $320,137 |
| Reinvestment of distributions | 609 | 1,095 | 5,839 | 11,456 |
| Shares redeemed | (17,538) | (12,041) | (178,528) | (121,855) |
| Net increase (decrease) | 39,804 | 21,762 | $391,115 | $209,738 |
| Fidelity Freedom Blend 2025 Fund | | | | |
| Shares sold | 1,175,315 | 2,937,252 | $11,987,959 | $30,409,391 |
| Reinvestment of distributions | 23,542 | 20,195 | 226,942 | 211,842 |
| Shares redeemed | (752,544) | (790,375) | (7,522,167) | (8,102,956) |
| Net increase (decrease) | 446,313 | 2,167,072 | $4,692,734 | $22,518,277 |
| Class K | | | | |
| Shares sold | 255,168 | 3,101,173 | $2,649,069 | $31,910,064 |
| Reinvestment of distributions | 26,919 | 76,103 | 259,770 | 799,085 |
| Shares redeemed | (600,644) | (549,601) | (6,046,256) | (5,393,857) |
| Net increase (decrease) | (318,557) | 2,627,675 | $(3,137,417) | $27,315,292 |
| Class K6 | | | | |
| Shares sold | 19,739,506 | 70,458,538 | $198,046,412 | $703,260,058 |
| Reinvestment of distributions | 743,196 | 1,997,769 | 7,186,707 | 21,003,005 |
| Shares redeemed | (6,193,851) | (8,245,281) | (63,693,714) | (81,859,127) |
| Net increase (decrease) | 14,288,851 | 64,211,026 | $141,539,405 | $642,403,936 |
| Class I | | | | |
| Shares sold | 1,631,627 | 909,969 | $16,003,687 | $9,435,701 |
| Reinvestment of distributions | 21,662 | 16,616 | 208,606 | 174,302 |
| Shares redeemed | (193,196) | (92,290) | (1,961,204) | (947,828) |
| Net increase (decrease) | 1,460,093 | 834,295 | $14,251,089 | $8,662,175 |
| Class Z | | | | |
| Reinvestment of distributions | 108 | 310 | $1,042 | $3,260 |
| Net increase (decrease) | 108 | 310 | $1,042 | $3,260 |
| Class Z6 | | | | |
| Shares sold | 128,241 | 443,762 | $1,396,519 | $4,623,109 |
| Reinvestment of distributions | 4,459 | 1,234 | 43,074 | 12,965 |
| Shares redeemed | (84,547) | (43,344) | (894,941) | (446,904) |
| Net increase (decrease) | 48,153 | 401,652 | $544,652 | $4,189,170 |
| Fidelity Freedom Blend 2030 Fund | | | | |
| Class A | | | | |
| Shares sold | 118,080 | 222,484 | $1,153,965 | $2,218,980 |
| Reinvestment of distributions | 1,744 | 3,300 | 16,410 | 34,389 |
| Shares redeemed | (70,324) | (89,605) | (677,191) | (829,687) |
| Net increase (decrease) | 49,500 | 136,179 | $493,184 | $1,423,682 |
| Class M | | | | |
| Shares sold | 26,676 | 212,482 | $266,119 | $2,218,002 |
| Reinvestment of distributions | 990 | 1,840 | 9,320 | 19,154 |
| Shares redeemed | (4,185) | (120,923) | (42,323) | (1,251,910) |
| Net increase (decrease) | 23,481 | 93,399 | $233,116 | $985,246 |
| Class C | | | | |
| Shares sold | 158,172 | 96,524 | $1,548,204 | $852,234 |
| Reinvestment of distributions | 2,056 | 1,243 | 19,266 | 12,929 |
| Shares redeemed | (66,495) | (12,142) | (683,022) | (123,032) |
| Net increase (decrease) | 93,733 | 85,625 | $884,448 | $742,131 |
| Fidelity Freedom Blend 2030 Fund | | | | |
| Shares sold | 698,845 | 2,219,255 | $7,104,985 | $22,724,146 |
| Reinvestment of distributions | 20,630 | 15,582 | 194,335 | 162,525 |
| Shares redeemed | (508,824) | (282,422) | (5,034,458) | (2,812,945) |
| Net increase (decrease) | 210,651 | 1,952,415 | $2,264,862 | $20,073,726 |
| Class K | | | | |
| Shares sold | 283,569 | 2,663,047 | $2,876,051 | $26,975,778 |
| Reinvestment of distributions | 26,374 | 73,778 | 248,706 | 769,504 |
| Shares redeemed | (439,290) | (295,302) | (4,315,282) | (2,979,983) |
| Net increase (decrease) | (129,347) | 2,441,523 | $(1,190,525) | $24,765,299 |
| Class K6 | | | | |
| Shares sold | 19,127,408 | 71,449,167 | $188,227,278 | $703,759,303 |
| Reinvestment of distributions | 798,528 | 2,075,308 | 7,546,094 | 21,676,270 |
| Shares redeemed | (4,784,727) | (6,220,182) | (48,420,176) | (60,775,687) |
| Net increase (decrease) | 15,141,209 | 67,304,293 | $147,353,196 | $664,659,886 |
| Class I | | | | |
| Shares sold | 1,229,336 | 1,330,677 | $12,125,444 | $13,669,900 |
| Reinvestment of distributions | 20,699 | 15,252 | 194,987 | 159,078 |
| Shares redeemed | (182,211) | (162,714) | (1,825,685) | (1,623,820) |
| Net increase (decrease) | 1,067,824 | 1,183,215 | $10,494,746 | $12,205,158 |
| Class Z | | | | |
| Shares sold | 2,759 | 5,262 | $25,191 | $55,731 |
| Reinvestment of distributions | 205 | 355 | 1,942 | 3,705 |
| Net increase (decrease) | 2,964 | 5,617 | $27,133 | $59,436 |
| Class Z6 | | | | |
| Shares sold | 152,085 | 456,774 | $1,632,258 | $4,726,736 |
| Reinvestment of distributions | 4,962 | 1,766 | 46,890 | 18,455 |
| Shares redeemed | (163,466) | (52,856) | (1,696,252) | (476,266) |
| Net increase (decrease) | (6,419) | 405,684 | $(17,104) | $4,268,925 |
| Fidelity Freedom Blend 2035 Fund | | | | |
| Class A | | | | |
| Shares sold | 68,215 | 74,994 | $687,269 | $759,705 |
| Reinvestment of distributions | 1,118 | 3,098 | 10,240 | 32,283 |
| Shares redeemed | (12,186) | (21,952) | (122,546) | (212,265) |
| Net increase (decrease) | 57,147 | 56,140 | $574,963 | $579,723 |
| Class M | | | | |
| Shares sold | 12,822 | 35,509 | $130,158 | $361,165 |
| Reinvestment of distributions | 382 | 769 | 3,497 | 8,010 |
| Shares redeemed | (91) | (20,415) | (961) | (213,271) |
| Net increase (decrease) | 13,113 | 15,863 | $132,694 | $155,904 |
| Class C | | | | |
| Shares sold | 53,029 | 11,572 | $526,724 | $114,935 |
| Reinvestment of distributions | 466 | 838 | 4,249 | 8,721 |
| Shares redeemed | (5,254) | (1,519) | (50,970) | (15,601) |
| Net increase (decrease) | 48,241 | 10,891 | $480,003 | $108,055 |
| Fidelity Freedom Blend 2035 Fund | | | | |
| Shares sold | 650,895 | 1,936,875 | $6,517,435 | $19,814,978 |
| Reinvestment of distributions | 22,415 | 12,930 | 205,546 | 134,860 |
| Shares redeemed | (181,656) | (321,953) | (1,866,480) | (3,252,705) |
| Net increase (decrease) | 491,654 | 1,627,852 | $4,856,501 | $16,697,133 |
| Class K | | | | |
| Shares sold | 200,713 | 1,894,188 | $2,028,379 | $18,850,169 |
| Reinvestment of distributions | 22,468 | 57,311 | 206,030 | 598,323 |
| Shares redeemed | (476,884) | (75,633) | (4,524,385) | (760,821) |
| Net increase (decrease) | (253,703) | 1,875,866 | $(2,289,976) | $18,687,671 |
| Class K6 | | | | |
| Shares sold | 15,523,041 | 68,941,798 | $150,131,811 | $674,125,737 |
| Reinvestment of distributions | 875,176 | 2,118,650 | 8,042,871 | 22,128,385 |
| Shares redeemed | (4,921,660) | (6,081,849) | (48,885,491) | (58,379,394) |
| Net increase (decrease) | 11,476,557 | 64,978,599 | $109,289,191 | $637,874,728 |
| Class I | | | | |
| Shares sold | 615,276 | 802,010 | $5,632,357 | $8,214,796 |
| Reinvestment of distributions | 14,168 | 10,865 | 129,776 | 113,319 |
| Shares redeemed | (143,320) | (138,887) | (1,333,390) | (1,371,432) |
| Net increase (decrease) | 486,124 | 673,988 | $4,428,743 | $6,956,683 |
| Class Z | | | | |
| Shares sold | – | 15,166 | $– | $152,875 |
| Reinvestment of distributions | 330 | 918 | 3,032 | 9,587 |
| Net increase (decrease) | 330 | 16,084 | $3,032 | $162,462 |
| Class Z6 | | | | |
| Shares sold | 79,075 | 274,462 | $817,397 | $2,848,481 |
| Reinvestment of distributions | 3,337 | 972 | 30,630 | 10,155 |
| Shares redeemed | (32,046) | (32,970) | (322,275) | (309,622) |
| Net increase (decrease) | 50,366 | 242,464 | $525,752 | $2,549,014 |
| Fidelity Freedom Blend 2040 Fund | | | | |
| Class A | | | | |
| Shares sold | 72,866 | 60,630 | $692,612 | $596,550 |
| Reinvestment of distributions | 1,115 | 1,884 | 10,050 | 19,594 |
| Shares redeemed | (4,375) | (5,252) | (41,965) | (54,714) |
| Net increase (decrease) | 69,606 | 57,262 | $660,697 | $561,430 |
| Class M | | | | |
| Shares sold | 16,543 | 38,917 | $163,141 | $406,464 |
| Reinvestment of distributions | 458 | 536 | 4,130 | 5,585 |
| Shares redeemed | (97) | (14,723) | (1,020) | (138,164) |
| Net increase (decrease) | 16,904 | 24,730 | $166,251 | $273,885 |
| Class C | | | | |
| Shares sold | 62,676 | 24,274 | $600,723 | $235,367 |
| Reinvestment of distributions | 630 | 978 | 5,648 | 10,160 |
| Shares redeemed | (9,879) | (3,808) | (92,228) | (38,081) |
| Net increase (decrease) | 53,427 | 21,444 | $514,143 | $207,446 |
| Fidelity Freedom Blend 2040 Fund | | | | |
| Shares sold | 453,343 | 1,965,272 | $4,436,296 | $20,064,811 |
| Reinvestment of distributions | 22,995 | 11,629 | 207,647 | 121,169 |
| Shares redeemed | (185,996) | (212,164) | (1,770,526) | (2,040,180) |
| Net increase (decrease) | 290,342 | 1,764,737 | $2,873,417 | $18,145,800 |
| Class K | | | | |
| Shares sold | 183,247 | 1,855,388 | $1,816,117 | $18,520,673 |
| Reinvestment of distributions | 22,501 | 49,527 | 203,408 | 516,568 |
| Shares redeemed | (720,745) | (82,653) | (6,872,003) | (837,026) |
| Net increase (decrease) | (514,997) | 1,822,262 | $(4,852,478) | $18,200,215 |
| Class K6 | | | | |
| Shares sold | 12,466,791 | 62,771,495 | $118,803,764 | $609,899,447 |
| Reinvestment of distributions | 792,344 | 1,860,502 | 7,170,709 | 19,412,656 |
| Shares redeemed | (4,353,570) | (4,823,088) | (42,768,558) | (46,032,380) |
| Net increase (decrease) | 8,905,565 | 59,808,909 | $83,205,915 | $583,279,723 |
| Class I | | | | |
| Shares sold | 440,437 | 573,473 | $4,295,292 | $5,791,422 |
| Reinvestment of distributions | 8,515 | 7,811 | 76,892 | 81,387 |
| Shares redeemed | (68,730) | (103,563) | (664,942) | (1,078,530) |
| Net increase (decrease) | 380,222 | 477,721 | $3,707,242 | $4,794,279 |
| Class Z | | | | |
| Reinvestment of distributions | 130 | 343 | $1,173 | 3,583 |
| Net increase (decrease) | 130 | 343 | $1,173 | $3,583 |
| Class Z6 | | | | |
| Shares sold | 31,221 | 216,662 | $319,521 | $2,260,493 |
| Reinvestment of distributions | 2,345 | 508 | 21,242 | 5,310 |
| Shares redeemed | (55,887) | (60,449) | (562,550) | (573,566) |
| Net increase (decrease) | (22,321) | 156,721 | $(221,787) | $1,692,237 |
| Fidelity Freedom Blend 2045 Fund | | | | |
| Class A | | | | |
| Shares sold | 38,917 | 82,028 | $365,404 | $819,225 |
| Reinvestment of distributions | 1,259 | 2,639 | 11,359 | 27,494 |
| Shares redeemed | (12,679) | (10,297) | (112,935) | (103,421) |
| Net increase (decrease) | 27,497 | 74,370 | $263,828 | $743,298 |
| Class M | | | | |
| Shares sold | 9,871 | 121,324 | $96,904 | $1,272,405 |
| Reinvestment of distributions | 1,446 | 677 | 13,030 | 7,045 |
| Shares redeemed | (12,030) | (3,456) | (106,935) | (34,441) |
| Net increase (decrease) | (713) | 118,545 | $2,999 | $1,245,009 |
| Class C | | | | |
| Shares sold | 44,797 | 16,836 | $441,250 | $168,708 |
| Reinvestment of distributions | 397 | 603 | 3,571 | 6,265 |
| Shares redeemed | (2,257) | (2,291) | (22,094) | (22,573) |
| Net increase (decrease) | 42,937 | 15,148 | $422,727 | $152,400 |
| Fidelity Freedom Blend 2045 Fund | | | | |
| Shares sold | 467,870 | 1,374,727 | $4,573,707 | $14,041,739 |
| Reinvestment of distributions | 16,398 | 6,577 | 148,074 | 68,591 |
| Shares redeemed | (153,477) | (172,550) | (1,453,136) | (1,608,006) |
| Net increase (decrease) | 330,791 | 1,208,754 | $3,268,645 | $12,502,324 |
| Class K | | | | |
| Shares sold | 185,333 | 1,685,191 | $1,819,691 | $16,854,788 |
| Reinvestment of distributions | 20,000 | 44,201 | 180,799 | 461,013 |
| Shares redeemed | (625,883) | (116,901) | (5,951,524) | (1,169,196) |
| Net increase (decrease) | (420,550) | 1,612,491 | $(3,951,034) | $16,146,605 |
| Class K6 | | | | |
| Shares sold | 10,520,548 | 53,576,395 | $99,943,257 | $520,549,509 |
| Reinvestment of distributions | 676,330 | 1,567,387 | 6,127,549 | 16,369,837 |
| Shares redeemed | (3,514,512) | (3,641,445) | (34,479,912) | (34,923,157) |
| Net increase (decrease) | 7,682,366 | 51,502,337 | $71,590,894 | $501,996,189 |
| Class I | | | | |
| Shares sold | 362,983 | 414,698 | $3,502,201 | $4,173,178 |
| Reinvestment of distributions | 7,406 | 8,521 | 66,878 | 88,783 |
| Shares redeemed | (21,380) | (24,213) | (209,853) | (250,866) |
| Net increase (decrease) | 349,009 | 399,006 | $3,359,226 | $4,011,095 |
| Class Z | | | | |
| Shares sold | 1,053 | 416 | $10,322 | $4,098 |
| Reinvestment of distributions | 137 | 346 | 1,237 | 3,619 |
| Shares redeemed | (654) | – | (6,806) | – |
| Net increase (decrease) | 536 | 762 | $4,753 | $7,717 |
| Class Z6 | | | | |
| Shares sold | 26,232 | 125,922 | $262,682 | $1,256,608 |
| Reinvestment of distributions | 1,774 | 511 | 16,053 | 5,334 |
| Shares redeemed | (30,054) | (3,552) | (302,757) | (32,601) |
| Net increase (decrease) | (2,048) | 122,881 | $(24,022) | $1,229,341 |
| Fidelity Freedom Blend 2050 Fund | | | | |
| Class A | | | | |
| Shares sold | 49,081 | 60,808 | $476,616 | $577,409 |
| Reinvestment of distributions | 895 | 1,893 | 8,056 | 19,643 |
| Shares redeemed | (5,082) | (9,904) | (51,351) | (98,042) |
| Net increase (decrease) | 44,894 | 52,797 | $433,321 | $499,010 |
| Class M | | | | |
| Shares sold | 10,739 | 30,577 | $104,959 | $298,706 |
| Reinvestment of distributions | 404 | 832 | 3,632 | 8,625 |
| Shares redeemed | (310) | (5,655) | (3,152) | (56,777) |
| Net increase (decrease) | 10,833 | 25,754 | $105,439 | $250,554 |
| Class C | | | | |
| Shares sold | 27,477 | 43,888 | $261,332 | $419,403 |
| Reinvestment of distributions | 651 | 955 | 5,816 | 9,876 |
| Shares redeemed | (20,481) | (4,602) | (202,514) | (44,442) |
| Net increase (decrease) | 7,647 | 40,241 | $64,634 | $384,837 |
| Fidelity Freedom Blend 2050 Fund | | | | |
| Shares sold | 549,946 | 1,196,246 | $5,434,230 | $12,158,738 |
| Reinvestment of distributions | 14,244 | 5,804 | 128,193 | 60,239 |
| Shares redeemed | (173,555) | (97,735) | (1,756,057) | (961,160) |
| Net increase (decrease) | 390,635 | 1,104,315 | $3,806,366 | $11,257,817 |
| Class K | | | | |
| Shares sold | 139,397 | 1,085,097 | $1,371,141 | $10,766,293 |
| Reinvestment of distributions | 11,520 | 29,763 | 103,798 | 308,941 |
| Shares redeemed | (463,881) | (115,539) | (4,397,273) | (1,168,292) |
| Net increase (decrease) | (312,964) | 999,321 | $(2,922,334) | $9,906,942 |
| Class K6 | | | | |
| Shares sold | 9,911,468 | 42,505,008 | $93,562,501 | $410,753,832 |
| Reinvestment of distributions | 511,317 | 1,153,996 | 4,612,080 | 11,994,804 |
| Shares redeemed | (3,151,146) | (2,905,330) | (30,931,706) | (27,598,201) |
| Net increase (decrease) | 7,271,639 | 40,753,674 | $67,242,875 | $395,150,435 |
| Class I | | | | |
| Shares sold | 200,168 | 411,997 | $2,056,433 | $4,090,112 |
| Reinvestment of distributions | 4,656 | 9,318 | 41,900 | 96,721 |
| Shares redeemed | (42,038) | (46,900) | (424,501) | (452,765) |
| Net increase (decrease) | 162,786 | 374,415 | $1,673,832 | $3,734,068 |
| Class Z | | | | |
| Reinvestment of distributions | 122 | 332 | $1,102 | $3,453 |
| Net increase (decrease) | 122 | 332 | $1,102 | $3,453 |
| Class Z6 | | | | |
| Shares sold | 34,755 | 229,013 | $339,064 | $2,363,808 |
| Reinvestment of distributions | 2,932 | 420 | 26,450 | 4,366 |
| Shares redeemed | (29,258) | (2,239) | (285,658) | (18,844) |
| Net increase (decrease) | 8,429 | 227,194 | $79,856 | $2,349,330 |
| Fidelity Freedom Blend 2055 Fund | | | | |
| Class A | | | | |
| Shares sold | 34,201 | 32,623 | $334,614 | $320,492 |
| Reinvestment of distributions | 497 | 1,064 | 4,489 | 11,061 |
| Shares redeemed | (1,719) | (2,079) | (17,136) | (20,792) |
| Net increase (decrease) | 32,979 | 31,608 | $321,967 | $310,761 |
| Class M | | | | |
| Shares sold | 13,848 | 19,745 | $131,593 | $198,412 |
| Reinvestment of distributions | 295 | 427 | 2,658 | 4,435 |
| Shares redeemed | (2,880) | (730) | (26,561) | (7,443) |
| Net increase (decrease) | 11,263 | 19,442 | $107,690 | $195,404 |
| Class C | | | | |
| Shares sold | 6,652 | 9,252 | $63,352 | $90,453 |
| Reinvestment of distributions | 184 | 388 | 1,654 | 4,029 |
| Shares redeemed | (1,220) | (2,339) | (11,957) | (23,298) |
| Net increase (decrease) | 5,616 | 7,301 | $53,049 | $71,184 |
| Fidelity Freedom Blend 2055 Fund | | | | |
| Shares sold | 307,956 | 628,014 | $3,007,793 | $6,395,015 |
| Reinvestment of distributions | 6,636 | 2,201 | 59,989 | 22,905 |
| Shares redeemed | (70,447) | (35,245) | (702,996) | (351,096) |
| Net increase (decrease) | 244,145 | 594,970 | $2,364,786 | $6,066,824 |
| Class K | | | | |
| Shares sold | 126,780 | 621,789 | $1,255,064 | $6,185,860 |
| Reinvestment of distributions | 5,675 | 14,745 | 51,362 | 153,497 |
| Shares redeemed | (261,815) | (72,759) | (2,499,899) | (708,474) |
| Net increase (decrease) | (129,360) | 563,775 | $(1,193,473) | $5,630,883 |
| Class K6 | | | | |
| Shares sold | 6,683,279 | 20,720,008 | $63,348,285 | $200,342,623 |
| Reinvestment of distributions | 213,691 | 465,881 | 1,936,039 | 4,851,113 |
| Shares redeemed | (1,832,994) | (1,391,367) | (18,127,140) | (12,921,590) |
| Net increase (decrease) | 5,063,976 | 19,794,522 | $47,157,184 | $192,272,146 |
| Class I | | | | |
| Shares sold | 115,109 | 238,393 | $1,185,810 | $2,364,256 |
| Reinvestment of distributions | 2,272 | 4,816 | 20,536 | 50,084 |
| Shares redeemed | (24,837) | (30,006) | (247,921) | (304,125) |
| Net increase (decrease) | 92,544 | 213,203 | $958,425 | $2,110,215 |
| Class Z | | | | |
| Reinvestment of distributions | 103 | 308 | $929 | $3,207 |
| Net increase (decrease) | 103 | 308 | $929 | $3,207 |
| Class Z6 | | | | |
| Shares sold | 22,611 | 76,670 | $220,371 | $788,359 |
| Reinvestment of distributions | 907 | 495 | 8,219 | 5,156 |
| Shares redeemed | (10,935) | (3,981) | (109,929) | (37,788) |
| Net increase (decrease) | 12,583 | 73,184 | $118,661 | $755,727 |
| Fidelity Freedom Blend 2060 Fund | | | | |
| Class A | | | | |
| Shares sold | 31,280 | 37,225 | $308,574 | $363,717 |
| Reinvestment of distributions | 457 | 1,237 | 4,154 | 12,881 |
| Shares redeemed | (1,436) | (4,518) | (14,266) | (46,270) |
| Net increase (decrease) | 30,301 | 33,944 | $298,462 | $330,328 |
| Class M | | | | |
| Shares sold | 7,339 | 9,936 | $72,310 | $99,900 |
| Reinvestment of distributions | 161 | 395 | 1,460 | 4,107 |
| Shares redeemed | (2,232) | (4,387) | (20,957) | (42,552) |
| Net increase (decrease) | 5,268 | 5,944 | $52,813 | $61,455 |
| Class C | | | | |
| Shares sold | 8,747 | 16,593 | $83,474 | $164,497 |
| Reinvestment of distributions | 212 | 431 | 1,914 | 4,470 |
| Shares redeemed | (2,887) | (1,343) | (28,082) | (13,597) |
| Net increase (decrease) | 6,072 | 15,681 | $57,306 | $155,370 |
| Fidelity Freedom Blend 2060 Fund | | | | |
| Shares sold | 114,466 | 301,091 | $1,104,321 | $3,009,069 |
| Reinvestment of distributions | 2,683 | 2,870 | 24,386 | 29,908 |
| Shares redeemed | (36,291) | (17,766) | (364,009) | (175,374) |
| Net increase (decrease) | 80,858 | 286,195 | $764,698 | $2,863,603 |
| Class K | | | | |
| Shares sold | 41,234 | 159,219 | $403,347 | $1,575,376 |
| Reinvestment of distributions | 1,154 | 3,732 | 10,493 | 38,953 |
| Shares redeemed | (70,367) | (16,014) | (672,909) | (160,325) |
| Net increase (decrease) | (27,979) | 146,937 | $(259,069) | $1,454,004 |
| Class K6 | | | | |
| Shares sold | 2,756,545 | 5,632,561 | $26,304,420 | $54,434,732 |
| Reinvestment of distributions | 44,252 | 96,880 | 402,696 | 1,010,306 |
| Shares redeemed | (627,363) | (495,746) | (6,153,231) | (4,563,687) |
| Net increase (decrease) | 2,173,434 | 5,233,695 | $20,553,885 | $50,881,351 |
| Class I | | | | |
| Shares sold | 58,920 | 125,809 | $597,454 | $1,254,763 |
| Reinvestment of distributions | 1,020 | 2,399 | 9,268 | 25,017 |
| Shares redeemed | (31,178) | (8,394) | (318,322) | (84,666) |
| Net increase (decrease) | 28,762 | 119,814 | $288,400 | $1,195,114 |
| Class Z | | | | |
| Shares sold | – | 37 | $– | $370 |
| Reinvestment of distributions | 77 | 299 | 706 | 3,118 |
| Net increase (decrease) | 77 | 336 | $706 | $3,488 |
| Class Z6 | | | | |
| Shares sold | 16,165 | 35,644 | $155,504 | $373,562 |
| Reinvestment of distributions | 391 | 312 | 3,565 | 3,250 |
| Shares redeemed | (6,860) | (1,699) | (69,777) | (16,504) |
| Net increase (decrease) | 9,696 | 34,257 | $89,292 | $360,308 |
| Fidelity Freedom Blend 2065 Fund(a) | | | | |
| Class A | | | | |
| Shares sold | 6,716 | 21,250 | $65,639 | $212,603 |
| Reinvestment of distributions | 115 | 429 | 1,059 | 4,538 |
| Shares redeemed | (1,925) | (3,367) | (54,240) | (35,787) |
| Net increase (decrease) | 4,906 | 18,312 | $12,458 | $181,354 |
| Class M | | | | |
| Shares sold | 6,347 | 19,398 | $63,157 | $197,568 |
| Reinvestment of distributions | 115 | 353 | 1,058 | 3,736 |
| Shares redeemed | (1,380) | (100) | (14,556) | (1,055) |
| Net increase (decrease) | 5,082 | 19,651 | $49,659 | $200,249 |
| Class C | | | | |
| Shares sold | 7,543 | 18,175 | $77,339 | $181,622 |
| Reinvestment of distributions | 107 | 390 | 984 | 4,126 |
| Shares redeemed | (398) | (3) | (4,064) | (30) |
| Net increase (decrease) | 7,252 | 18,562 | $74,259 | $185,718 |
| Fidelity Freedom Blend 2065 Fund | | | | |
| Shares sold | 52,023 | 50,839 | $518,094 | $513,322 |
| Reinvestment of distributions | 330 | 672 | 3,054 | 7,112 |
| Shares redeemed | (5,975) | (1,358) | (72,754) | (13,934) |
| Net increase (decrease) | 46,378 | 50,153 | $448,394 | $506,500 |
| Class K | | | | |
| Shares sold | 2,313 | 13,889 | $23,200 | $138,798 |
| Reinvestment of distributions | 77 | 375 | 710 | 3,966 |
| Shares redeemed | (1,101) | (295) | (13,598) | (3,102) |
| Net increase (decrease) | 1,289 | 13,969 | $10,312 | $139,662 |
| Class K6 | | | | |
| Shares sold | 270,929 | 130,843 | $2,717,020 | $1,290,645 |
| Reinvestment of distributions | 1,021 | 892 | 9,434 | 9,439 |
| Shares redeemed | (74,538) | (3,142) | (733,602) | (29,862) |
| Net increase (decrease) | 197,412 | 128,593 | $1,992,852 | $1,270,222 |
| Class I | | | | |
| Shares sold | 25,041 | 27,553 | $252,296 | $256,437 |
| Reinvestment of distributions | 92 | 315 | 850 | 3,337 |
| Shares redeemed | (32,799) | (16) | (316,940) | (166) |
| Net increase (decrease) | (7,666) | 27,852 | $(63,794) | $259,608 |
| Class Z | | | | |
| Shares sold | – | 11,111 | $– | $111,110 |
| Reinvestment of distributions | 63 | 316 | 583 | 3,344 |
| Net increase (decrease) | 63 | 11,427 | $583 | $114,454 |
| Class Z6 | | | | |
| Shares sold | – | 11,203 | $– | $111,823 |
| Reinvestment of distributions | 64 | 321 | 588 | 3,400 |
| Shares redeemed | (2) | – | (14) | – |
| Net increase (decrease) | 62 | 11,524 | $574 | $115,223 |
(a) For the period June 28, 2019 (commencement of operations) to March 31, 2020.
9. Other.
The Funds' organizational documents provide former and current trustees and officers with a limited indemnification against liabilities arising in connection with the performance of their duties to the Funds. In the normal course of business, the Funds may also enter into contracts that provide general indemnifications. The Funds' maximum exposure under these arrangements is unknown as this would be dependent on future claims that may be made against the Funds. The risk of material loss from such claims is considered remote.
The Funds do not invest in underlying mutual funds for the purpose of exercising management or control; however, investments by the Funds within their principal investment strategies may represent a significant portion of the underlying mutual fund's net assets. At the end of the period, the following Funds were the owners of record of 10% or more of the total outstanding shares of the following underlying mutual funds.
| Fund | Fidelity Freedom Blend 2020 Fund | Fidelity Freedom Blend 2025 Fund | Fidelity Freedom Blend 2030 Fund | Fidelity Freedom Blend 2035 Fund | Fidelity Freedom Blend 2040 Fund | Fidelity Freedom Blend 2045 Fund | Fidelity Freedom Blend 2050 Fund |
| Fidelity Series Corporate Bond Fund | 19% | 25% | 22% | – | – | – | – |
| Fidelity Series Government Bond Index Fund | 20% | 26% | 22% | – | – | – | – |
| Fidelity Series Large Cap Growth Index Fund | – | 12% | 14% | 16% | 15% | 13% | 11% |
| Fidelity Series Investment Grade Securitized Fund | 19% | 25% | 22% | – | – | – | – |
| Fidelity Series International Index Fund | – | 12% | 14% | 15% | 15% | 13% | 10% |
The Funds, in aggregate, were the owners of record of more than 20% of the total outstanding shares of the following underlying mutual funds.
| Fund | % of shares held |
| Fidelity Series Corporate Bond Fund | 88% |
| Fidelity Series Government Bond Index Fund | 91% |
| Fidelity Series Large Cap Growth Index Fund | 97% |
| Fidelity Series Investment Grade Securitized Fund | 88% |
| Fidelity Series International Index Fund | 96% |
At the end of the period the investment adviser or its affiliates were owners of record of more than 10% of the outstanding shares of the following Fund:
| | Affiliated % |
| Fidelity Freedom Blend 2065 Fund | 19% |
10. Coronavirus (COVID-19) Pandemic.
An outbreak of COVID-19 first detected in China during December 2019 has since spread globally and was declared a pandemic by the World Health Organization during March 2020. Developments that disrupt global economies and financial markets, such as the COVID-19 pandemic, may magnify factors that affect the Funds' performance.
Shareholder Expense Example
As a shareholder, you incur two types of costs: (1) transaction costs, which may include sales charges (loads) on purchase payments or redemption proceeds, as applicable and (2) ongoing costs, which generally include management fees, distribution and/or service (12b-1) fees and other Fund expenses. This Example is intended to help you understand your ongoing costs (in dollars) of investing in a fund and to compare these costs with the ongoing costs of investing in other mutual funds.
The Example is based on an investment of $1,000 invested at the beginning of the period and held for the entire period (April 1, 2020 to September 30, 2020).
Actual Expenses
The first line of the accompanying table provides information about actual account values and actual expenses. You may use the information in this line, together with the amount you invested, to estimate the expenses that you paid over the period. Simply divide your account value by $1,000.00 (for example, an $8,600 account value divided by $1,000.00 = 8.6), then multiply the result by the number in the first line for a class/Fund under the heading entitled "Expenses Paid During Period" to estimate the expenses you paid on your account during this period. If any fund is a shareholder of any underlying mutual funds or exchange-traded funds (ETFs) (the Underlying Funds), such fund indirectly bears its proportional share of the expenses of the Underlying Funds in addition to the direct expenses incurred presented in the table. These fees and expenses are not included in the annualized expense ratio used to calculate the expense estimate in the table below.
Hypothetical Example for Comparison Purposes
The second line of the accompanying table provides information about hypothetical account values and hypothetical expenses based on the actual expense ratio and an assumed rate of return of 5% per year before expenses, which is not the actual return. The hypothetical account values and expenses may not be used to estimate the actual ending account balance or expenses you paid for the period. You may use this information to compare the ongoing costs of investing in the Fund and other funds. To do so, compare this 5% hypothetical example with the 5% hypothetical examples that appear in the shareholder reports of the other funds. If any fund is a shareholder of any Underlying Funds, such fund indirectly bears its proportional share of the expenses of the Underlying Funds in addition to the direct expenses as presented in the table. These fees and expenses are not included in the annualized expense ratio used to calculate the expense estimate in the table below.
Please note that the expenses shown in the table are meant to highlight your ongoing costs only and do not reflect any transaction costs. Therefore, the second line of the table is useful in comparing ongoing costs only, and will not help you determine the relative total costs of owning different funds. In addition, if these transactional costs were included, your costs would have been higher.
| | Annualized Expense Ratio-A | Beginning
Account Value
April 1, 2020 | Ending
Account Value
September 30, 2020 | Expenses Paid
During Period-B
April 1, 2020
to September 30, 2020 |
| Fidelity Freedom Blend Income Fund | | | | |
| Class A | .71% | | | |
| Actual | | $1,000.00 | $1,081.80 | $3.71 |
| Hypothetical-C | | $1,000.00 | $1,021.51 | $3.60 |
| Class M | .96% | | | |
| Actual | | $1,000.00 | $1,080.80 | $5.01 |
| Hypothetical-C | | $1,000.00 | $1,020.26 | $4.86 |
| Class C | 1.44% | | | |
| Actual | | $1,000.00 | $1,078.00 | $7.50 |
| Hypothetical-C | | $1,000.00 | $1,017.85 | $7.28 |
| Fidelity Freedom Blend Income Fund | .46% | | | |
| Actual | | $1,000.00 | $1,083.80 | $2.40 |
| Hypothetical-C | | $1,000.00 | $1,022.76 | $2.33 |
| Class K | .36% | | | |
| Actual | | $1,000.00 | $1,084.10 | $1.88 |
| Hypothetical-C | | $1,000.00 | $1,023.26 | $1.83 |
| Class K6 | .26% | | | |
| Actual | | $1,000.00 | $1,084.80 | $1.36 |
| Hypothetical-C | | $1,000.00 | $1,023.76 | $1.32 |
| Class I | .46% | | | |
| Actual | | $1,000.00 | $1,084.00 | $2.40 |
| Hypothetical-C | | $1,000.00 | $1,022.76 | $2.33 |
| Class Z | .37% | | | |
| Actual | | $1,000.00 | $1,084.60 | $1.93 |
| Hypothetical-C | | $1,000.00 | $1,023.21 | $1.88 |
| Class Z6 | .26% | | | |
| Actual | | $1,000.00 | $1,084.60 | $1.36 |
| Hypothetical-C | | $1,000.00 | $1,023.76 | $1.32 |
| Fidelity Freedom Blend 2005 Fund | | | | |
| Class A | .71% | | | |
| Actual | | $1,000.00 | $1,097.60 | $3.73 |
| Hypothetical-C | | $1,000.00 | $1,021.51 | $3.60 |
| Class M | .96% | | | |
| Actual | | $1,000.00 | $1,096.20 | $5.04 |
| Hypothetical-C | | $1,000.00 | $1,020.26 | $4.86 |
| Class C | 1.46% | | | |
| Actual | | $1,000.00 | $1,094.40 | $7.67 |
| Hypothetical-C | | $1,000.00 | $1,017.75 | $7.39 |
| Fidelity Freedom Blend 2005 Fund | .46% | | | |
| Actual | | $1,000.00 | $1,099.20 | $2.42 |
| Hypothetical-C | | $1,000.00 | $1,022.76 | $2.33 |
| Class K | .37% | | | |
| Actual | | $1,000.00 | $1,099.50 | $1.95 |
| Hypothetical-C | | $1,000.00 | $1,023.21 | $1.88 |
| Class K6 | .26% | | | |
| Actual | | $1,000.00 | $1,099.60 | $1.37 |
| Hypothetical-C | | $1,000.00 | $1,023.76 | $1.32 |
| Class I | .46% | | | |
| Actual | | $1,000.00 | $1,099.20 | $2.42 |
| Hypothetical-C | | $1,000.00 | $1,022.76 | $2.33 |
| Class Z | .36% | | | |
| Actual | | $1,000.00 | $1,100.30 | $1.90 |
| Hypothetical-C | | $1,000.00 | $1,023.26 | $1.83 |
| Class Z6 | .26% | | | |
| Actual | | $1,000.00 | $1,100.50 | $1.37 |
| Hypothetical-C | | $1,000.00 | $1,023.76 | $1.32 |
| Fidelity Freedom Blend 2010 Fund | | | | |
| Class A | .72% | | | |
| Actual | | $1,000.00 | $1,122.50 | $3.83 |
| Hypothetical-C | | $1,000.00 | $1,021.46 | $3.65 |
| Class M | .97% | | | |
| Actual | | $1,000.00 | $1,122.00 | $5.16 |
| Hypothetical-C | | $1,000.00 | $1,020.21 | $4.91 |
| Class C | 1.48% | | | |
| Actual | | $1,000.00 | $1,118.10 | $7.86 |
| Hypothetical-C | | $1,000.00 | $1,017.65 | $7.49 |
| Fidelity Freedom Blend 2010 Fund | .47% | | | |
| Actual | | $1,000.00 | $1,124.00 | $2.50 |
| Hypothetical-C | | $1,000.00 | $1,022.71 | $2.38 |
| Class K | .37% | | | |
| Actual | | $1,000.00 | $1,124.90 | $1.97 |
| Hypothetical-C | | $1,000.00 | $1,023.21 | $1.88 |
| Class K6 | .27% | | | |
| Actual | | $1,000.00 | $1,126.20 | $1.44 |
| Hypothetical-C | | $1,000.00 | $1,023.71 | $1.37 |
| Class I | .47% | | | |
| Actual | | $1,000.00 | $1,124.00 | $2.50 |
| Hypothetical-C | | $1,000.00 | $1,022.71 | $2.38 |
| Class Z | .37% | | | |
| Actual | | $1,000.00 | $1,124.80 | $1.97 |
| Hypothetical-C | | $1,000.00 | $1,023.21 | $1.88 |
| Class Z6 | .27% | | | |
| Actual | | $1,000.00 | $1,125.20 | $1.44 |
| Hypothetical-C | | $1,000.00 | $1,023.71 | $1.37 |
| Fidelity Freedom Blend 2015 Fund | | | | |
| Class A | .73% | | | |
| Actual | | $1,000.00 | $1,148.20 | $3.93 |
| Hypothetical-C | | $1,000.00 | $1,021.41 | $3.70 |
| Class M | .98% | | | |
| Actual | | $1,000.00 | $1,145.70 | $5.27 |
| Hypothetical-C | | $1,000.00 | $1,020.16 | $4.96 |
| Class C | 1.48% | | | |
| Actual | | $1,000.00 | $1,142.80 | $7.95 |
| Hypothetical-C | | $1,000.00 | $1,017.65 | $7.49 |
| Fidelity Freedom Blend 2015 Fund | .48% | | | |
| Actual | | $1,000.00 | $1,149.60 | $2.59 |
| Hypothetical-C | | $1,000.00 | $1,022.66 | $2.43 |
| Class K | .38% | | | |
| Actual | | $1,000.00 | $1,150.60 | $2.05 |
| Hypothetical-C | | $1,000.00 | $1,023.16 | $1.93 |
| Class K6 | .28% | | | |
| Actual | | $1,000.00 | $1,150.50 | $1.51 |
| Hypothetical-C | | $1,000.00 | $1,023.66 | $1.42 |
| Class I | .48% | | | |
| Actual | | $1,000.00 | $1,148.70 | $2.59 |
| Hypothetical-C | | $1,000.00 | $1,022.66 | $2.43 |
| Class Z | .38% | | | |
| Actual | | $1,000.00 | $1,149.20 | $2.05 |
| Hypothetical-C | | $1,000.00 | $1,023.16 | $1.93 |
| Class Z6 | .28% | | | |
| Actual | | $1,000.00 | $1,151.10 | $1.51 |
| Hypothetical-C | | $1,000.00 | $1,023.66 | $1.42 |
| Fidelity Freedom Blend 2020 Fund | | | | |
| Class A | .74% | | | |
| Actual | | $1,000.00 | $1,170.90 | $4.03 |
| Hypothetical-C | | $1,000.00 | $1,021.36 | $3.75 |
| Class M | .99% | | | |
| Actual | | $1,000.00 | $1,170.60 | $5.39 |
| Hypothetical-C | | $1,000.00 | $1,020.10 | $5.01 |
| Class C | 1.49% | | | |
| Actual | | $1,000.00 | $1,167.50 | $8.10 |
| Hypothetical-C | | $1,000.00 | $1,017.60 | $7.54 |
| Fidelity Freedom Blend 2020 Fund | .49% | | | |
| Actual | | $1,000.00 | $1,173.20 | $2.67 |
| Hypothetical-C | | $1,000.00 | $1,022.61 | $2.48 |
| Class K | .39% | | | |
| Actual | | $1,000.00 | $1,174.00 | $2.13 |
| Hypothetical-C | | $1,000.00 | $1,023.11 | $1.98 |
| Class K6 | .29% | | | |
| Actual | | $1,000.00 | $1,174.00 | $1.58 |
| Hypothetical-C | | $1,000.00 | $1,023.61 | $1.47 |
| Class I | .49% | | | |
| Actual | | $1,000.00 | $1,173.10 | $2.67 |
| Hypothetical-C | | $1,000.00 | $1,022.61 | $2.48 |
| Class Z | .39% | | | |
| Actual | | $1,000.00 | $1,173.70 | $2.13 |
| Hypothetical-C | | $1,000.00 | $1,023.11 | $1.98 |
| Class Z6 | .29% | | | |
| Actual | | $1,000.00 | $1,173.80 | $1.58 |
| Hypothetical-C | | $1,000.00 | $1,023.61 | $1.47 |
| Fidelity Freedom Blend 2025 Fund | | | | |
| Class A | .76% | | | |
| Actual | | $1,000.00 | $1,190.60 | $4.17 |
| Hypothetical-C | | $1,000.00 | $1,021.26 | $3.85 |
| Class M | 1.01% | | | |
| Actual | | $1,000.00 | $1,187.90 | $5.54 |
| Hypothetical-C | | $1,000.00 | $1,020.00 | $5.11 |
| Class C | 1.51% | | | |
| Actual | | $1,000.00 | $1,185.90 | $8.27 |
| Hypothetical-C | | $1,000.00 | $1,017.50 | $7.64 |
| Fidelity Freedom Blend 2025 Fund | .51% | | | |
| Actual | | $1,000.00 | $1,191.40 | $2.80 |
| Hypothetical-C | | $1,000.00 | $1,022.51 | $2.59 |
| Class K | .41% | | | |
| Actual | | $1,000.00 | $1,192.00 | $2.25 |
| Hypothetical-C | | $1,000.00 | $1,023.01 | $2.08 |
| Class K6 | .31% | | | |
| Actual | | $1,000.00 | $1,192.10 | $1.70 |
| Hypothetical-C | | $1,000.00 | $1,023.51 | $1.57 |
| Class I | .51% | | | |
| Actual | | $1,000.00 | $1,191.90 | $2.80 |
| Hypothetical-C | | $1,000.00 | $1,022.51 | $2.59 |
| Class Z | .41% | | | |
| Actual | | $1,000.00 | $1,191.70 | $2.25 |
| Hypothetical-C | | $1,000.00 | $1,023.01 | $2.08 |
| Class Z6 | .31% | | | |
| Actual | | $1,000.00 | $1,192.50 | $1.70 |
| Hypothetical-C | | $1,000.00 | $1,023.51 | $1.57 |
| Fidelity Freedom Blend 2030 Fund | | | | |
| Class A | .77% | | | |
| Actual | | $1,000.00 | $1,215.10 | $4.28 |
| Hypothetical-C | | $1,000.00 | $1,021.21 | $3.90 |
| Class M | 1.02% | | | |
| Actual | | $1,000.00 | $1,215.30 | $5.66 |
| Hypothetical-C | | $1,000.00 | $1,019.95 | $5.17 |
| Class C | 1.53% | | | |
| Actual | | $1,000.00 | $1,212.30 | $8.49 |
| Hypothetical-C | | $1,000.00 | $1,017.40 | $7.74 |
| Fidelity Freedom Blend 2030 Fund | .52% | | | |
| Actual | | $1,000.00 | $1,218.30 | $2.89 |
| Hypothetical-C | | $1,000.00 | $1,022.46 | $2.64 |
| Class K | .42% | | | |
| Actual | | $1,000.00 | $1,217.90 | $2.34 |
| Hypothetical-C | | $1,000.00 | $1,022.96 | $2.13 |
| Class K6 | .32% | | | |
| Actual | | $1,000.00 | $1,217.80 | $1.78 |
| Hypothetical-C | | $1,000.00 | $1,023.46 | $1.62 |
| Class I | .52% | | | |
| Actual | | $1,000.00 | $1,218.40 | $2.89 |
| Hypothetical-C | | $1,000.00 | $1,022.46 | $2.64 |
| Class Z | .42% | | | |
| Actual | | $1,000.00 | $1,217.80 | $2.34 |
| Hypothetical-C | | $1,000.00 | $1,022.96 | $2.13 |
| Class Z6 | .32% | | | |
| Actual | | $1,000.00 | $1,218.00 | $1.78 |
| Hypothetical-C | | $1,000.00 | $1,023.46 | $1.62 |
| Fidelity Freedom Blend 2035 Fund | | | | |
| Class A | .78% | | | |
| Actual | | $1,000.00 | $1,256.40 | $4.41 |
| Hypothetical-C | | $1,000.00 | $1,021.16 | $3.95 |
| Class M | 1.03% | | | |
| Actual | | $1,000.00 | $1,253.40 | $5.82 |
| Hypothetical-C | | $1,000.00 | $1,019.90 | $5.22 |
| Class C | 1.54% | | | |
| Actual | | $1,000.00 | $1,250.40 | $8.69 |
| Hypothetical-C | | $1,000.00 | $1,017.35 | $7.79 |
| Fidelity Freedom Blend 2035 Fund | .53% | | | |
| Actual | | $1,000.00 | $1,257.30 | $3.00 |
| Hypothetical-C | | $1,000.00 | $1,022.41 | $2.69 |
| Class K | .43% | | | |
| Actual | | $1,000.00 | $1,258.20 | $2.43 |
| Hypothetical-C | | $1,000.00 | $1,022.91 | $2.18 |
| Class K6 | .33% | | | |
| Actual | | $1,000.00 | $1,258.00 | $1.87 |
| Hypothetical-C | | $1,000.00 | $1,023.41 | $1.67 |
| Class I | .53% | | | |
| Actual | | $1,000.00 | $1,257.50 | $3.00 |
| Hypothetical-C | | $1,000.00 | $1,022.41 | $2.69 |
| Class Z | .43% | | | |
| Actual | | $1,000.00 | $1,257.90 | $2.43 |
| Hypothetical-C | | $1,000.00 | $1,022.91 | $2.18 |
| Class Z6 | .33% | | | |
| Actual | | $1,000.00 | $1,258.50 | $1.87 |
| Hypothetical-C | | $1,000.00 | $1,023.41 | $1.67 |
| Fidelity Freedom Blend 2040 Fund | | | | |
| Class A | .79% | | | |
| Actual | | $1,000.00 | $1,278.60 | $4.51 |
| Hypothetical-C | | $1,000.00 | $1,021.11 | $4.00 |
| Class M | 1.04% | | | |
| Actual | | $1,000.00 | $1,276.60 | $5.94 |
| Hypothetical-C | | $1,000.00 | $1,019.85 | $5.27 |
| Class C | 1.55% | | | |
| Actual | | $1,000.00 | $1,272.80 | $8.83 |
| Hypothetical-C | | $1,000.00 | $1,017.30 | $7.84 |
| Fidelity Freedom Blend 2040 Fund | .54% | | | |
| Actual | | $1,000.00 | $1,279.90 | $3.09 |
| Hypothetical-C | | $1,000.00 | $1,022.36 | $2.74 |
| Class K | .44% | | | |
| Actual | | $1,000.00 | $1,280.60 | $2.52 |
| Hypothetical-C | | $1,000.00 | $1,022.86 | $2.23 |
| Class K6 | .34% | | | |
| Actual | | $1,000.00 | $1,280.40 | $1.94 |
| Hypothetical-C | | $1,000.00 | $1,023.36 | $1.72 |
| Class I | .54% | | | |
| Actual | | $1,000.00 | $1,278.50 | $3.08 |
| Hypothetical-C | | $1,000.00 | $1,022.36 | $2.74 |
| Class Z | .44% | | | |
| Actual | | $1,000.00 | $1,279.80 | $2.51 |
| Hypothetical-C | | $1,000.00 | $1,022.86 | $2.23 |
| Class Z6 | .34% | | | |
| Actual | | $1,000.00 | $1,280.80 | $1.94 |
| Hypothetical-C | | $1,000.00 | $1,023.36 | $1.72 |
| Fidelity Freedom Blend 2045 Fund | | | | |
| Class A | .79% | | | |
| Actual | | $1,000.00 | $1,276.40 | $4.51 |
| Hypothetical-C | | $1,000.00 | $1,021.11 | $4.00 |
| Class M | 1.04% | | | |
| Actual | | $1,000.00 | $1,277.00 | $5.94 |
| Hypothetical-C | | $1,000.00 | $1,019.85 | $5.27 |
| Class C | 1.55% | | | |
| Actual | | $1,000.00 | $1,272.00 | $8.83 |
| Hypothetical-C | | $1,000.00 | $1,017.30 | $7.84 |
| Fidelity Freedom Blend 2045 Fund | .54% | | | |
| Actual | | $1,000.00 | $1,279.70 | $3.09 |
| Hypothetical-C | | $1,000.00 | $1,022.36 | $2.74 |
| Class K | .44% | | | |
| Actual | | $1,000.00 | $1,280.60 | $2.52 |
| Hypothetical-C | | $1,000.00 | $1,022.86 | $2.23 |
| Class K6 | .34% | | | |
| Actual | | $1,000.00 | $1,280.30 | $1.94 |
| Hypothetical-C | | $1,000.00 | $1,023.36 | $1.72 |
| Class I | .54% | | | |
| Actual | | $1,000.00 | $1,278.50 | $3.08 |
| Hypothetical-C | | $1,000.00 | $1,022.36 | $2.74 |
| Class Z | .44% | | | |
| Actual | | $1,000.00 | $1,279.90 | $2.51 |
| Hypothetical-C | | $1,000.00 | $1,022.86 | $2.23 |
| Class Z6 | .34% | | | |
| Actual | | $1,000.00 | $1,280.90 | $1.94 |
| Hypothetical-C | | $1,000.00 | $1,023.36 | $1.72 |
| Fidelity Freedom Blend 2050 Fund | | | | |
| Class A | .79% | | | |
| Actual | | $1,000.00 | $1,277.70 | $4.51 |
| Hypothetical-C | | $1,000.00 | $1,021.11 | $4.00 |
| Class M | 1.04% | | | |
| Actual | | $1,000.00 | $1,277.00 | $5.94 |
| Hypothetical-C | | $1,000.00 | $1,019.85 | $5.27 |
| Class C | 1.54% | | | |
| Actual | | $1,000.00 | $1,273.10 | $8.78 |
| Hypothetical-C | | $1,000.00 | $1,017.35 | $7.79 |
| Fidelity Freedom Blend 2050 Fund | .54% | | | |
| Actual | | $1,000.00 | $1,280.00 | $3.09 |
| Hypothetical-C | | $1,000.00 | $1,022.36 | $2.74 |
| Class K | .44% | | | |
| Actual | | $1,000.00 | $1,279.30 | $2.51 |
| Hypothetical-C | | $1,000.00 | $1,022.86 | $2.23 |
| Class K6 | .34% | | | |
| Actual | | $1,000.00 | $1,280.70 | $1.94 |
| Hypothetical-C | | $1,000.00 | $1,023.36 | $1.72 |
| Class I | .54% | | | |
| Actual | | $1,000.00 | $1,279.50 | $3.09 |
| Hypothetical-C | | $1,000.00 | $1,022.36 | $2.74 |
| Class Z | .44% | | | |
| Actual | | $1,000.00 | $1,280.10 | $2.51 |
| Hypothetical-C | | $1,000.00 | $1,022.86 | $2.23 |
| Class Z6 | .34% | | | |
| Actual | | $1,000.00 | $1,281.10 | $1.94 |
| Hypothetical-C | | $1,000.00 | $1,023.36 | $1.72 |
| Fidelity Freedom Blend 2055 Fund | | | | |
| Class A | .79% | | | |
| Actual | | $1,000.00 | $1,279.20 | $4.51 |
| Hypothetical-C | | $1,000.00 | $1,021.11 | $4.00 |
| Class M | 1.04% | | | |
| Actual | | $1,000.00 | $1,275.50 | $5.93 |
| Hypothetical-C | | $1,000.00 | $1,019.85 | $5.27 |
| Class C | 1.54% | | | |
| Actual | | $1,000.00 | $1,272.90 | $8.77 |
| Hypothetical-C | | $1,000.00 | $1,017.35 | $7.79 |
| Fidelity Freedom Blend 2055 Fund | .54% | | | |
| Actual | | $1,000.00 | $1,279.20 | $3.09 |
| Hypothetical-C | | $1,000.00 | $1,022.36 | $2.74 |
| Class K | .44% | | | |
| Actual | | $1,000.00 | $1,280.00 | $2.51 |
| Hypothetical-C | | $1,000.00 | $1,022.86 | $2.23 |
| Class K6 | .34% | | | |
| Actual | | $1,000.00 | $1,281.40 | $1.94 |
| Hypothetical-C | | $1,000.00 | $1,023.36 | $1.72 |
| Class I | .54% | | | |
| Actual | | $1,000.00 | $1,280.20 | $3.09 |
| Hypothetical-C | | $1,000.00 | $1,022.36 | $2.74 |
| Class Z | .44% | | | |
| Actual | | $1,000.00 | $1,280.90 | $2.52 |
| Hypothetical-C | | $1,000.00 | $1,022.86 | $2.23 |
| Class Z6 | .34% | | | |
| Actual | | $1,000.00 | $1,280.50 | $1.94 |
| Hypothetical-C | | $1,000.00 | $1,023.36 | $1.72 |
| Fidelity Freedom Blend 2060 Fund | | | | |
| Class A | .79% | | | |
| Actual | | $1,000.00 | $1,277.90 | $4.51 |
| Hypothetical-C | | $1,000.00 | $1,021.11 | $4.00 |
| Class M | 1.04% | | | |
| Actual | | $1,000.00 | $1,277.00 | $5.94 |
| Hypothetical-C | | $1,000.00 | $1,019.85 | $5.27 |
| Class C | 1.54% | | | |
| Actual | | $1,000.00 | $1,273.20 | $8.78 |
| Hypothetical-C | | $1,000.00 | $1,017.35 | $7.79 |
| Fidelity Freedom Blend 2060 Fund | .54% | | | |
| Actual | | $1,000.00 | $1,278.80 | $3.08 |
| Hypothetical-C | | $1,000.00 | $1,022.36 | $2.74 |
| Class K | .44% | | | |
| Actual | | $1,000.00 | $1,280.00 | $2.51 |
| Hypothetical-C | | $1,000.00 | $1,022.86 | $2.23 |
| Class K6 | .34% | | | |
| Actual | | $1,000.00 | $1,281.30 | $1.94 |
| Hypothetical-C | | $1,000.00 | $1,023.36 | $1.72 |
| Class I | .54% | | | |
| Actual | | $1,000.00 | $1,280.30 | $3.09 |
| Hypothetical-C | | $1,000.00 | $1,022.36 | $2.74 |
| Class Z | .44% | | | |
| Actual | | $1,000.00 | $1,279.30 | $2.51 |
| Hypothetical-C | | $1,000.00 | $1,022.86 | $2.23 |
| Class Z6 | .34% | | | |
| Actual | | $1,000.00 | $1,281.10 | $1.94 |
| Hypothetical-C | | $1,000.00 | $1,023.36 | $1.72 |
| Fidelity Freedom Blend 2065 Fund | | | | |
| Class A | .79% | | | |
| Actual | | $1,000.00 | $1,277.80 | $4.51 |
| Hypothetical-C | | $1,000.00 | $1,021.11 | $4.00 |
| Class M | 1.04% | | | |
| Actual | | $1,000.00 | $1,275.40 | $5.93 |
| Hypothetical-C | | $1,000.00 | $1,019.85 | $5.27 |
| Class C | 1.54% | | | |
| Actual | | $1,000.00 | $1,272.50 | $8.77 |
| Hypothetical-C | | $1,000.00 | $1,017.35 | $7.79 |
| Fidelity Freedom Blend 2065 Fund | .54% | | | |
| Actual | | $1,000.00 | $1,278.70 | $3.08 |
| Hypothetical-C | | $1,000.00 | $1,022.36 | $2.74 |
| Class K | .44% | | | |
| Actual | | $1,000.00 | $1,281.00 | $2.52 |
| Hypothetical-C | | $1,000.00 | $1,022.86 | $2.23 |
| Class K6 | .34% | | | |
| Actual | | $1,000.00 | $1,280.30 | $1.94 |
| Hypothetical-C | | $1,000.00 | $1,023.36 | $1.72 |
| Class I | .54% | | | |
| Actual | | $1,000.00 | $1,279.90 | $3.09 |
| Hypothetical-C | | $1,000.00 | $1,022.36 | $2.74 |
| Class Z | .44% | | | |
| Actual | | $1,000.00 | $1,279.50 | $2.51 |
| Hypothetical-C | | $1,000.00 | $1,022.86 | $2.23 |
| Class Z6 | .34% | | | |
| Actual | | $1,000.00 | $1,280.70 | $1.94 |
| Hypothetical-C | | $1,000.00 | $1,023.36 | $1.72 |
A Annualized expense ratio reflects expenses net of applicable fee waivers.
B Expenses are equal to the annualized expense ratio, multiplied by the average account value over the period, multiplied by 183/ 365 (to reflect the one-half year period). The fees and expenses of any Underlying Funds are not included in each annualized expense ratio.
C 5% return per year before expenses
Board Approval of Investment Advisory Contracts and Management Fees
Fidelity Freedom Blend Funds
Each year, the Board of Trustees, including the Independent Trustees (together, the Board), votes on the renewal of the management contract with Fidelity Management & Research Company LLC (FMR) (the Advisory Contract) for each fund. The Board, assisted by the advice of fund counsel and Independent Trustees' counsel, requests and considers a broad range of information relevant to the renewal of the Advisory Contracts throughout the year.
The Board meets regularly and, at each of its meetings, covers an extensive agenda of topics and materials and considers factors that are relevant to its annual consideration of the renewal of each fund's Advisory Contract, including the services and support provided to each fund and its shareholders. The Board has established four standing committees (Committees) — Operations, Audit, Fair Valuation, and Governance and Nominating — each composed of and chaired by Independent Trustees with varying backgrounds, to which the Board has assigned specific subject matter responsibilities in order to enhance effective decision-making by the Board. The Operations Committee, of which all of the Independent Trustees are members, meets regularly throughout the year and considers, among other matters, information specifically related to the annual consideration of the renewal of each fund's Advisory Contract. The Board, acting directly and through its Committees, requests and receives information concerning the annual consideration of the renewal of each fund's Advisory Contract. The Board also meets as needed to review matters specifically related to the Board's annual consideration of the renewal of the Advisory Contracts. Members of the Board may also meet with trustees of other Fidelity funds through joint ad hoc committees to discuss certain matters relevant to all of the Fidelity funds.
At its September 2020 meeting, the Board unanimously determined to renew each fund's Advisory Contract. In reaching its determination, the Board considered all factors it believed relevant, including (i) the nature, extent, and quality of the services provided to each fund and its shareholders (including the investment performance of each fund); (ii) the competitiveness of each fund's management fee and total expense ratio relative to peer funds; (iii) the total costs of the services provided by and the profits realized by Fidelity from its relationships with each fund; and (iv) the extent to which, if any, economies of scale exist and are realized as each fund grows, and whether any economies of scale are appropriately shared with fund shareholders. The Board also considered that each fund pays an all-inclusive management fee that covers all operating expenses of the fund, subject to certain exceptions, and varies by class (unified fee) and the underlying Fidelity funds in which the fund invests (Series Funds) do not pay expenses, with certain limited exceptions. The Board and the board of other funds that invest their assets in Series Funds and the boards of the Series Funds previously formed a joint ad hoc committee to review the responsibilities of each board related to the consideration of the renewal of the Advisory Contracts for the funds, other funds that invest substantially all of their assets in Series Funds, and the Series Funds. The Board's deliberations were informed by the conclusions of such committee.
In considering whether to renew the Advisory Contract for each fund, the Board reached a determination, with the assistance of fund counsel and Independent Trustees' counsel and through the exercise of its business judgment, that the renewal of the Advisory Contract was in the best interests of each fund and its shareholders and that the compensation payable under the Advisory Contract was fair and reasonable. The Board's decision to renew the Advisory Contracts was not based on any single factor, but rather was based on a comprehensive consideration of all the information provided to the Board at its meetings throughout the year. The Board, in reaching its determination to renew the Advisory Contracts, was aware that shareholders of each fund have a broad range of investment choices available to them, including a wide choice among funds offered by Fidelity's competitors, and that each fund's shareholders, who have the opportunity to review and weigh the disclosure provided by the fund in its prospectus and other public disclosures, have chosen to invest in that fund, which is part of the Fidelity family of funds.
Nature, Extent, and Quality of Services Provided. The Board considered Fidelity's staffing as it relates to the funds, including the backgrounds of investment personnel of FMR, and also considered the funds' investment objectives, strategies, and related investment philosophies. The Independent Trustees also had discussions with senior management of Fidelity's investment operations and investment groups with responsibility for the Series Funds. The Board considered the structure of the investment personnel compensation program and whether this structure provides appropriate incentives to act in the best interests of each fund. Additionally, the Board considered the portfolio managers' investments, if any, in the funds that they manage.
Resources Dedicated to Investment Management and Support Services. The Board reviewed the general qualifications and capabilities of Fidelity's investment staff, including its size, education, experience, and resources, as well as Fidelity's approach to recruiting, managing, and compensating investment personnel. The Board noted that Fidelity has continued to increase the resources devoted to non-U.S. offices, including expansion of Fidelity's global investment organization. The Board also noted that Fidelity's analysts have extensive resources, tools and capabilities that allow them to conduct sophisticated quantitative and fundamental analysis, as well as credit analysis of issuers, counterparties and guarantors. Further, the Board considered that Fidelity's investment professionals have sufficient access to global information and data so as to provide competitive investment results over time, and that those professionals also have access to sophisticated tools that permit them to assess portfolio construction and risk and performance attribution characteristics continuously, as well as to transmit new information and research conclusions rapidly around the world. Additionally, in its deliberations, the Board considered Fidelity's risk management, compliance, and technology and operations capabilities and resources, which are integral parts of the investment management process. The Board also considered Fidelity's investments in business continuity planning, and its success in continuously providing services to the funds notwithstanding the severe disruptions caused by the COVID-19 pandemic.
Shareholder and Administrative Services. The Board considered (i) the nature, extent, quality, and cost of advisory, administrative, and shareholder services performed by Fidelity under the Advisory Contract and under separate agreements covering transfer agency and pricing and bookkeeping services for each fund; (ii) the nature and extent of the supervision of third party service providers, principally custodians, subcustodians, and pricing vendors; and (iii) the resources devoted to, and the record of compliance with, each fund's compliance policies and procedures.
The Board noted that the growth of fund assets over time across the complex allows Fidelity to reinvest in the development of services designed to enhance the value and convenience of the Fidelity funds as investment vehicles. These services include 24-hour access to account information and market information over the Internet and through telephone representatives, investor education materials and asset allocation tools, and the expanded availability of Fidelity Investor Centers.
Investment in a Large Fund Family. The Board considered the benefits to shareholders of investing in a Fidelity fund, including the benefits of investing in a fund that is part of a large family of funds offering a variety of investment disciplines and providing a large variety of mutual fund investor services. The Board noted that Fidelity had taken, or had made recommendations that resulted in the Fidelity funds taking, a number of actions over the previous year that benefited particular funds, including: (i) continuing to dedicate additional resources to Fidelity's investment research process, which includes meetings with management of issuers of securities in which the funds invest, and to the support of the senior management team that oversees asset management; (ii) continuing efforts to enhance Fidelity's global research capabilities; (iii) launching new funds and ETFs with innovative structures, strategies and pricing and making other enhancements to meet client needs; (iv) launching new share classes of existing funds; (v) eliminating purchase minimums and broadening eligibility requirements for certain funds and share classes; (vi) reducing management fees and total expenses for certain target date funds or classes and index funds; (vii) lowering expenses for certain funds and classes by implementing or lowering expense caps; (viii) rationalizing product lines and gaining increased efficiencies from fund mergers, liquidations, and share class consolidations; (ix) continuing to develop, acquire and implement systems and technology to improve services to the funds and shareholders, strengthen information security, and increase efficiency; and (x) continuing to implement enhancements to further strengthen Fidelity's product line to increase investors' probability of success in achieving their investment goals, including retirement income goals.
Investment Performance (Except Freedom Blend 2065 Fund). The Board considered whether each fund has operated in accordance with its investment objective, as well as its record of compliance with its investment restrictions and its performance history.
The Board took into account discussions that occur at Board meetings throughout the year with representatives of the investment adviser about fund investment performance. In this regard the Board noted that as part of regularly scheduled fund reviews and other reports to the Board on fund performance, the Board considers annualized return information for each fund for different time periods, measured against one or more appropriate securities market indices, including a customized blended index that reflects the respective weights of the fund's asset classes (each a benchmark index). In its evaluation of fund investment performance at meetings throughout the year, the Board gave particular attention to information indicating underperformance of certain Fidelity funds for specific time periods and discussed with the investment adviser the reasons for such underperformance.
In addition to reviewing absolute and relative fund performance, the Independent Trustees periodically consider the appropriateness of fund performance metrics in evaluating the results achieved. In general, the Independent Trustees believe that fund performance should be evaluated based on gross performance (before fees and expenses, including acquired fund fees and expenses, but after transaction costs, if any) compared to appropriate benchmark indices, over appropriate time periods that may include full market cycles, taking into account relevant factors including the following: general market conditions; the extent to which particular underlying funds affected performance; and fund cash flows and other factors. The Independent Trustees generally give greater weight to fund performance over longer time periods than over shorter time periods. Depending on the circumstances, the Independent Trustees may be satisfied with a fund's performance notwithstanding that it lags its benchmark index for certain periods.
The Independent Trustees recognize that shareholders evaluate performance on a net basis over their own holding periods, for which one-, three-, and five-year periods are often used as a proxy. For this reason, the performance information reviewed by the Board also included net cumulative calendar year total return information for each fund and an appropriate benchmark index for the most recent one-year period. Due to the characteristics of the funds, no peer group performance information was considered by the Board. The Independent Trustees recognize that shareholders who are not investing through a tax-advantaged retirement account also consider tax consequences in evaluating performance.
Investment Performance (for Freedom Blend 2065 Fund). The Board considered whether the fund has operated in accordance with its investment objective, as well as its record of compliance with its investment restrictions. As the fund recently commenced operations, the Board did not believe that it was appropriate to assign significant weight to its limited investment performance.
Based on its review, the Board concluded that the nature, extent, and quality of services provided to each fund under the Advisory Contracts should continue to benefit the shareholders of each fund.
Competitiveness of Management Fee and Total Expense Ratio. The Board considered each fund's management fee and total expense ratio compared to "mapped groups" of competitive funds and classes created for the purpose of facilitating the Trustees' competitive analysis of management fees and total expenses. Fidelity creates "mapped groups" by combining similar Lipper investment objective categories that have comparable investment mandates. Combining Lipper investment objective categories aids the Board's management fee and total expense ratio comparisons by broadening the competitive group used for comparison.
Management Fee. The Board considered two proprietary management fee comparisons. The group of Lipper funds used by the Board for management fee comparisons is referred to as the "Total Mapped Group." The Total Mapped Group comparison focuses on a fund's standing in terms of gross management fees before expense reimbursements or caps relative to the total universe of funds with comparable investment mandates, regardless of whether their management fee structures also are comparable. Funds with comparable investment mandates offer exposure to similar types of securities. Funds with comparable management fee structures have similar management fee contractual arrangements (e.g., flat rate charged for advisory services, all-inclusive fee rate,
etc.). The "Asset-Sized Peer Group" (ASPG) comparison focuses on a fund's standing relative to a subset of non-Fidelity funds within the Total Mapped Group that are similar in size and management fee structure. For example, if a fund is in the first quartile of the ASPG, the fund's management fee ranks in the least expensive or lowest 25% of funds in the ASPG. The ASPG represents at least 15% of the funds in the Total Mapped Group with comparable asset size and management fee structures, subject to a minimum of 50 funds (or all funds in the Total Mapped Group if fewer than 50). Additional information, such as the ASPG quartile in which a fund's management fee rate ranked, also was considered by the Board.
The Board compared each fund's class-level management fee rate for the current fiscal year relative to the median of its competitor funds in the applicable Total Mapped Group based on competitive data for 2019. The Board noted that each fund's class-level management fee rate ranks above the median of its competitor funds in the applicable Total Mapped Group based on competitive data for 2019. The Board noted that each fund's unified fee arrangement covers all operating expenses of the fund, subject to certain exceptions, and that the fee structures of the majority of peer funds do not include top-level management fees. The Board also noted that the primary comparisons for the funds are against active and passive competitor target date funds. The Board also noted that the funds' total expense comparisons, which include the expenses of the Series Funds, facilitate better comparisons with funds and classes that use different expense structures and that, when compared to the total expenses of their load-type competitors, including acquired fund fees and expenses, all classes of the funds rank below their respective load types.
Based on its review, the Board concluded that each fund's management fee is fair and reasonable in light of the services that the fund receives and the other factors considered.
Total Expense Ratio. In its review of the total expense ratio of each class of each fund, the Board considered the fund's class-level management fee rate under the Advisory Contract. The Board also considered other expenses, such as transfer agent fees, pricing and bookkeeping fees, and custodial, legal, and audit fees, paid by FMR under the unified fee arrangement. The Board also noted that Fidelity may agree to waive fees or reimburse expenses from time to time, and the extent to which, if any, it has done so for each fund. As part of its review, the Board considered the total expense ratio of each class of each fund compared to the median total expenses for competitor funds (including expenses of underlying funds) based on competitive data for 2019. Each class of each fund is compared to those funds and classes in the Total Mapped Group (used by the Board for management fee comparisons) that have a similar sales load structure.
The Board noted that each fund offers multiple classes, each of which has a different sales load and 12b-1 fee structure, and that the multiple structures are intended to offer a range of pricing options for the intermediary market. The Board also noted that the total expense ratios of the classes of each fund vary primarily by the level of their 12b-1 fees. The Board considered that, in general, various factors can affect total expense ratios.
The Board noted that the total expense ratio of Class A (including expenses of the Series Funds) for each fund ranked below the competitive median for 2019.
The Board noted that the total expense ratio of Class M of each fund (including expenses of the Series Funds) ranked above the competitive median for 2019. The Board noted that the total expense ratio of Class M was above the competitive median primarily because of higher 12b-1 fees on Class M as compared to most competitor funds. Class M has a higher 12b-1 fee, but a lower front-end sales charge, than traditionally priced front-end sales charge classes. The Board considered that Class M is primarily sold load-waived to retirement plans and intermediary wrap programs where its 0.50% 12b-1 fee is comparable to competing no-load, higher 12b-1 fee classes designed specifically for retirement plans and wrap programs. The Board noted that, when the Total Mapped Group is adjusted to include only those funds with between 25% and 75% active holdings and funds that do not have similar vintages, and compared with funds with a 0.50% 12b-1 fee, the total expense ratio of Class M of each such fund is equal to or below median.
The Board noted that the total expense ratio of Class C (including expenses of the Series Funds) ranked below the competitive median for 2019 for Fidelity Freedom Blend 2005 Fund and Fidelity Freedom Blend Income Fund and ranked above the competitive median for 2019 for each other fund. The Board noted that, for each fund for which the total expense ratio of Class C was above the competitive median, the class was above the competitive median primarily because of its 1.00% 12b-1 fee. The Board noted that, when the Total Mapped Group is adjusted to include only those funds with between 25% and 75% active holdings, and compared with funds that charge a 1.00% 12b-1 fee, the total expense ratio of Class C of each such fund is equal to or below median.
The Board noted that the total expense ratio of each of Class I, Class Z, Class Z6, the retail class, Class K, and Class K6 (including expenses of the Series Funds) of each fund ranked below the competitive median for 2019.
The Board considered that current contractual arrangements for the fund oblige FMR to pay all "class-level" expenses of each of Class Z6 and Class K6 of each fund to the extent necessary to limit total operating expenses, with certain exceptions, to an amount specified in the applicable expense contract. These contractual arrangements may not be amended to increase the fees or expenses payable except by a vote of a majority of the Board of Trustees (for each fund) and by a vote of a majority of the outstanding voting securities of the applicable class (for each fund, except Fidelity Freedom Blend 2065 Fund).
Fees Charged to Other Fidelity Clients. The Board also considered Fidelity fee structures and other information with respect to clients of Fidelity, such as other funds advised or subadvised by Fidelity, pension plan clients, and other institutional clients with similar mandates. The Board noted that a joint ad hoc committee created by it and the boards of other Fidelity funds periodically reviews and compares Fidelity's institutional investment advisory business with its business of providing services to the Fidelity funds and also noted the most recent findings of the committee. The Board noted that the committee's review included a consideration of the differences in services provided, fees charged, and costs incurred, as well as competition in the markets serving the different categories of clients.
Based on its review of total expense ratios and fees charged to other Fidelity clients, the Board concluded that the total expense ratio of each class of each fund was reasonable in light of the services that the fund and its shareholders receive and the other factors considered.
Costs of the Services and Profitability. The Board considered the revenues earned and the expenses incurred by Fidelity in conducting the business of developing, marketing, distributing, managing, administering and servicing each fund and the Series Funds in which each fund invests and in servicing each fund's shareholders. The Board also considered the level of Fidelity's profits in respect of all the Fidelity funds.
On an annual basis, Fidelity presents to the Board information about the profitability of its relationships with each fund. Fidelity calculates profitability information for each fund, as well as aggregate profitability information for groups of Fidelity funds and all Fidelity funds, using a series of detailed revenue and cost allocation methodologies which originate with the books and records of Fidelity on which Fidelity's audited financial statements are based. The Audit Committee of the Board reviews any significant changes from the prior year's methodologies and the full Board approves such changes.
A public accounting firm has been engaged annually by the Board as part of the Board's assessment of Fidelity's profitability analysis. The engagement includes the review and assessment of the methodologies used by Fidelity in determining the revenues and expenses attributable to Fidelity's mutual fund business, and completion of agreed-upon procedures in respect of the mathematical accuracy of certain fund profitability information and its conformity to established allocation methodologies. After considering the reports issued under the engagement and information provided by Fidelity, the Board concluded that while other allocation methods may also be reasonable, Fidelity's profitability methodologies are reasonable in all material respects.
The Board also reviewed Fidelity's non-fund businesses and potential indirect benefits such businesses may have received as a result of their association with Fidelity's mutual fund business (i.e., fall-out benefits) as well as cases where Fidelity's affiliates may benefit from the funds' business. The Board considered areas where potential indirect benefits to the Fidelity funds from their relationships with Fidelity may exist. The Board also considered that in 2019 a joint ad hoc committee created by it and the boards of other Fidelity funds evaluated potential fall-out benefits (PFOB Committee). The Board noted that it considered the PFOB Committee's findings in connection with its consideration of the renewal of the Advisory Contracts.
The Board considered the costs of the services provided by and the profits realized by Fidelity in connection with the operation of each fund, including the conclusions of the PFOB Committee, and was satisfied that the profitability was not excessive.
Economies of Scale. The Board considered whether there have been economies of scale in respect of the management of the Fidelity funds, whether the Fidelity funds (including each fund) have appropriately benefited from any such economies of scale, and whether there is potential for realization of any further economies of scale. The Board considered the extent to which each fund will benefit from economies of scale as assets grow through increased services to the fund, through waivers or reimbursements, or through fee or expense ratio reductions. The Board recognized that, due to each fund's current contractual arrangements, its expense ratio will not decline if the fund's operating costs decrease as assets grow, or rise as assets decrease. The Board also noted that a committee (the Economies of Scale Committee) created by it and the boards of other Fidelity funds periodically analyzes whether Fidelity attains economies of scale in respect of the management and servicing of the Fidelity funds, whether the Fidelity funds have appropriately benefited from such economies of scale, and whether there is potential for realization of any further economies of scale.
The Board concluded, taking into account the analysis of the Economies of Scale Committee, that economies of scale, if any, are being appropriately shared between fund shareholders and Fidelity.
Additional Information Requested by the Board. In order to develop fully the factual basis for consideration of the Fidelity funds' advisory contracts, the Board requested and received additional information on certain topics, including: (i) Fidelity's fund profitability methodology, profitability trends for certain funds, the allocation of various costs to different funds, and the impact of certain factors on fund profitability results; (ii) portfolio manager changes that have occurred during the past year and the amount of the investment that each portfolio manager has made in the Fidelity fund(s) that he or she manages; (iii) Fidelity's compensation structure for portfolio managers, research analysts, and other key personnel, including its effects on fund profitability, the rationale for the compensation structure, and the extent to which current market conditions have affected retention and recruitment; (iv) the arrangements with and compensation paid to certain fund sub-advisers on behalf of the Fidelity funds and the treatment of such compensation within Fidelity's fund profitability methodology; (v) the terms of the funds' various management fee structures, including the basic group fee and the terms of Fidelity's voluntary expense limitation agreements; (vi) Fidelity's transfer agent fee, expense, and service structures for different funds and classes relative to competitive trends; (vii) the impact on fund profitability of recent industry trends, such as the growth in passively managed funds and outflows from actively managed equity funds; and (viii) explanations regarding the relative total expense ratios of certain funds and classes, total expense competitive trends and methodologies for total expense competitive comparisons, and actions that might be taken by Fidelity to reduce total expense ratios for certain classes. In addition, the Board considered its discussions with Fidelity regarding Fidelity's efforts to maintain the continuous investment and shareholder services necessary for the funds during the current pandemic and economic circumstances.
Based on its evaluation of all of the conclusions noted above, and after considering all factors it believed relevant, the Board concluded that the advisory fee arrangements are fair and reasonable, and that each fund's Advisory Contract should be renewed.
FBF-SANN-1120
1.9890345.102
Item 2.
Code of Ethics
Not applicable.
Item 3.
Audit Committee Financial Expert
Not applicable.
Item 4.
Principal Accountant Fees and Services
Not applicable.
Item 5.
Audit Committee of Listed Registrants
Not applicable.
Item 6.
Investments
(a)
Not applicable.
(b)
Not applicable
Item 7.
Disclosure of Proxy Voting Policies and Procedures for Closed-End Management Investment Companies
Not applicable.
Item 8.
Portfolio Managers of Closed-End Management Investment Companies
Not applicable.
Item 9.
Purchase of Equity Securities by Closed-End Management Investment Company and Affiliated Purchasers
Not applicable.
Item 10.
Submission of Matters to a Vote of Security Holders
There were no material changes to the procedures by which shareholders may recommend nominees to the Fidelity Aberdeen Street Trust’s Board of Trustees.
Item 11.
Controls and Procedures
(a)(i) The President and Treasurer and the Chief Financial Officer have concluded that the Fidelity Aberdeen Street Trust’s (the “Trust”) disclosure controls and procedures (as defined in Rule 30a-3(c) under the Investment Company Act) provide reasonable
assurances that material information relating to the Trust is made known to them by the appropriate persons, based on their evaluation of these controls and procedures as of a date within 90 days of the filing date of this report.
(a)(ii) There was no change in the Trust’s internal control over financial reporting (as defined in Rule 30a-3(d) under the Investment Company Act) that occurred during the period covered by this report that has materially affected, or is reasonably likely to materially affect, the Trust’s internal control over financial reporting.
Item 12.
Disclosure of Securities Lending Activities for Closed-End Management
Investment Companies
Not applicable.
Item 13.
Exhibits
SIGNATURES
Pursuant to the requirements of the Securities Exchange Act of 1934 and the Investment Company Act of 1940, the registrant has duly caused this report to be signed on its behalf by the undersigned, thereunto duly authorized.
Fidelity Aberdeen Street Trust
| |
By: | /s/Laura M. Del Prato |
| Laura M. Del Prato |
| President and Treasurer |
|
|
Date: | November 19, 2020 |
Pursuant to the requirements of the Securities Exchange Act of 1934 and the Investment Company Act of 1940, this report has been signed below by the following persons on behalf of the registrant and in the capacities and on the dates indicated.
| |
By: | /s/Laura M. Del Prato |
| Laura M. Del Prato |
| President and Treasurer |
|
|
Date: | November 19, 2020 |
| |
By: | /s/John J. Burke III |
| John J. Burke III |
| Chief Financial Officer |
|
|
Date: | November 19, 2020 |