UNITED STATES
SECURITIES AND EXCHANGE COMMISSION
Washington, D.C. 20549
FORM N-CSR
CERTIFIED SHAREHOLDER REPORT OF REGISTERED
MANAGEMENT INVESTMENT COMPANIES
Investment Company Act file number 811-06440
Fidelity Aberdeen Street Trust
(Exact name of registrant as specified in charter)
245 Summer St., Boston, Massachusetts 02210
(Address of principal executive offices) (Zip code)
Cynthia Lo Bessette, Secretary
245 Summer St.
Boston, Massachusetts 02210
(Name and address of agent for service)
Registrant's telephone number, including area code:
617-563-7000
| |
Date of fiscal year end: | March 31 |
|
|
Date of reporting period: | March 31, 2022 |
Item 1.
Reports to Stockholders
Fidelity Advisor Freedom® Funds - Income, 2005, 2010, 2015, 2020, 2025, 2030, 2035, 2040, 2045, 2050, 2055, 2060, 2065
Annual Report
March 31, 2022


Contents
To view a fund's proxy voting guidelines and proxy voting record for the 12-month period ended June 30, visit http://www.fidelity.com/proxyvotingresults or visit the Securities and Exchange Commission's (SEC) web site at http://www.sec.gov.
You may also call 1-877-208-0098 to request a free copy of the proxy voting guidelines.
Standard & Poor's, S&P and S&P 500 are registered service marks of The McGraw-Hill Companies, Inc. and have been licensed for use by Fidelity Distributors Corporation.
Other third-party marks appearing herein are the property of their respective owners.
All other marks appearing herein are registered or unregistered trademarks or service marks of FMR LLC or an affiliated company. © 2022 FMR LLC. All rights reserved.
This report and the financial statements contained herein are submitted for the general information of the shareholders of the Funds. This report is not authorized for distribution to prospective investors in the Funds unless preceded or accompanied by an effective prospectus.
A fund files its complete schedule of portfolio holdings with the SEC for the first and third quarters of each fiscal year on Form N-PORT. Forms N-PORT are available on the SEC’s web site at http://www.sec.gov. A fund's Forms N-PORT may be reviewed and copied at the SEC’s Public Reference Room in Washington, DC. Information regarding the operation of the SEC's Public Reference Room may be obtained by calling 1-800-SEC-0330.
For a complete list of a fund's portfolio holdings, view the most recent holdings listing, semiannual report, or annual report on Fidelity's web site at http://www.fidelity.com, http://www.institutional.fidelity.com, or http://www.401k.com, as applicable.
NOT FDIC INSURED •MAY LOSE VALUE •NO BANK GUARANTEE
Neither the Funds nor Fidelity Distributors Corporation is a bank.
Note to Shareholders:
Early in 2020, the outbreak and spread of COVID-19 emerged as a public health emergency that had a major influence on financial markets, primarily based on its impact on the global economy and corporate earnings. On March 11, 2020, the World Health Organization declared the COVID-19 outbreak a pandemic, citing sustained risk of further global spread. The pandemic prompted a number of measures to limit the spread of COVID-19, including travel and border restrictions, quarantines, and restrictions on large gatherings. In turn, these resulted in lower consumer activity, diminished demand for a wide range of products and services, disruption in manufacturing and supply chains, and – given the wide variability in outcomes regarding the outbreak – significant market uncertainty and volatility. To help stem the turmoil, the U.S. government took unprecedented action – in concert with the U.S. Federal Reserve and central banks around the world – to help support consumers, businesses, and the broader economy, and to limit disruption to the financial system.
In general, the overall impact of the pandemic lessened in 2021, amid a resilient economy and widespread distribution of three COVID-19 vaccines granted emergency use authorization from the U.S. Food and Drug Administration (FDA) early in the year. Still, the situation remains dynamic, and the extent and duration of its influence on financial markets and the economy is highly uncertain, due in part to a recent spike in cases based on highly contagious variants of the coronavirus.
Extreme events such as the COVID-19 crisis are exogenous shocks that can have significant adverse effects on mutual funds and their investments. Although multiple asset classes may be affected by market disruption, the duration and impact may not be the same for all types of assets. Fidelity is committed to helping you stay informed amid news about COVID-19 and during increased market volatility, and we continue to take extra steps to be responsive to customer needs. We encourage you to visit us online, where we offer ongoing updates, commentary, and analysis on the markets and our funds.
Fidelity Advisor Freedom® Income Fund
Performance: The Bottom Line
Average annual total return reflects the change in the value of an investment, assuming reinvestment of distributions from dividend income and capital gains (the profits earned upon the sale of securities that have grown in value, if any) and assuming a constant rate of performance each year. The hypothetical investment and the average annual total returns do not reflect the deduction of taxes that a shareholder would pay on fund distributions or the redemption of fund shares. During periods of reimbursement by Fidelity, a fund’s total return will be greater than it would be had the reimbursement not occurred. How a fund did yesterday is no guarantee of how it will do tomorrow.
Average Annual Total Returns
| For the periods ended March 31, 2022 | Past 1 year | Past 5 years | Past 10 years |
| Class A (incl. 5.75% sales charge) | (6.73)% | 2.86% | 3.12% |
| Class M (incl. 3.50% sales charge) | (4.77)% | 3.08% | 3.11% |
| Class C (incl. contingent deferred sales charge) | (2.69)% | 3.30% | 3.11% |
| Class I | (0.80)% | 4.33% | 3.99% |
| Class Z | (0.75)% | 4.37% | 4.01% |
| Class Z6 | (0.71)% | 4.44% | 4.04% |
Prior to June 1, 2017, the fund operated under a different pricing structure. The fund’s historical performance prior to June 1, 2017 does not reflect the fund’s current pricing structure.
The initial offering of Class Z shares took place on October 2, 2018. Returns prior to October 2, 2018 are those of Class I.
The initial offering of Class Z6 shares took place on June 6, 2017. Returns prior to June 6, 2017 are those of Class I.
Class C shares' contingent deferred sales charges included in the past one year, past five years and past ten years total return figures are 1%, 0% and 0%, respectively.
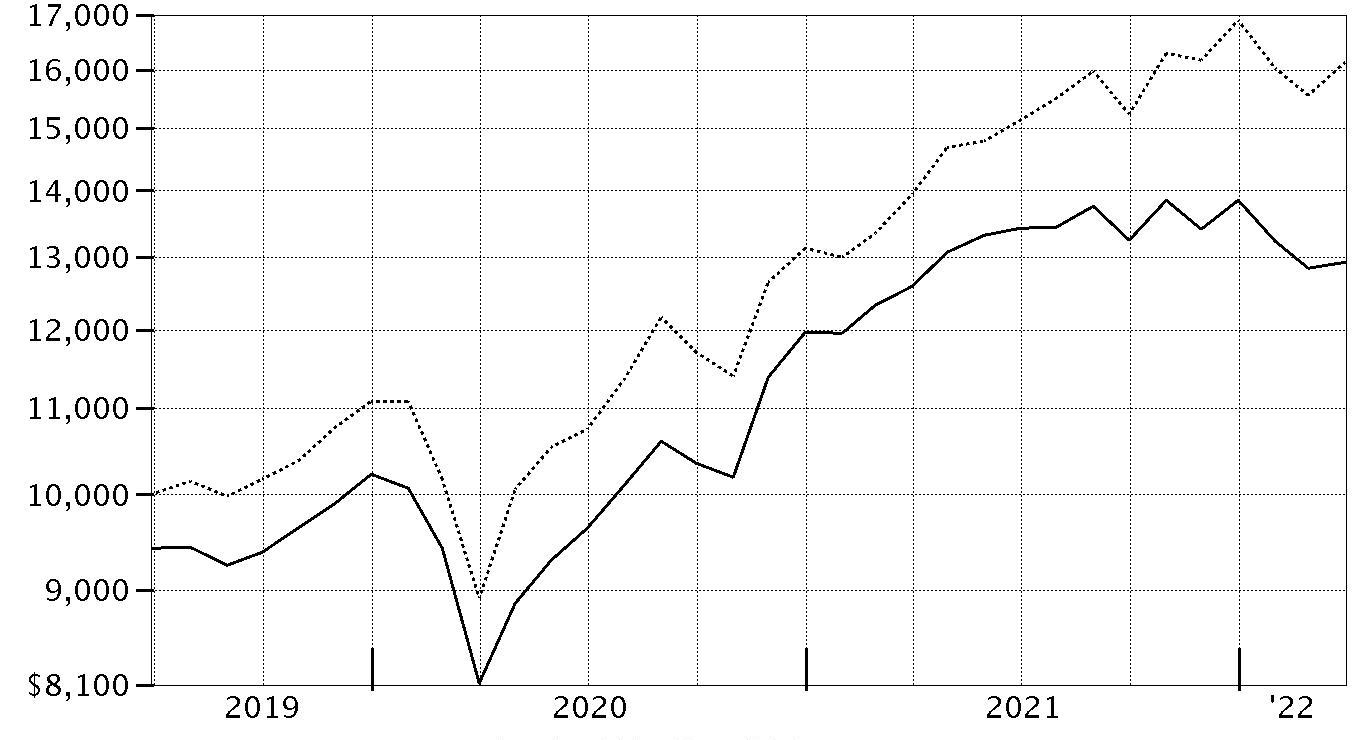
$10,000 Over 10 Years
Let's say hypothetically that $10,000 was invested in Fidelity Advisor Freedom® Income Fund - Class A on March 31, 2012, and the current 5.75% sales charge was paid.
The chart shows how the value of your investment would have changed, and also shows how the Bloomberg U.S. Aggregate Bond Index performed over the same period.
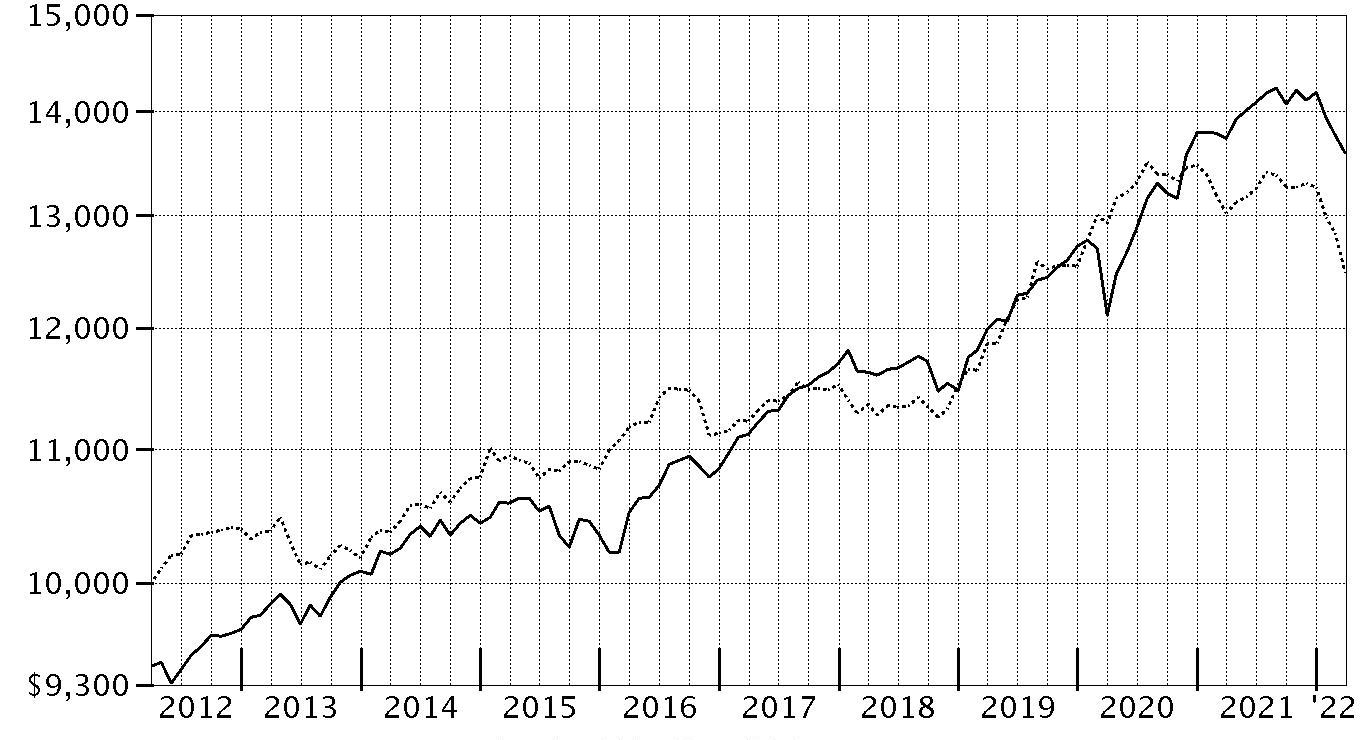
| Period Ending Values |
| $13,593 | Fidelity Advisor Freedom® Income Fund - Class A |
| $12,480 | Bloomberg U.S. Aggregate Bond Index |
Effective August 24, 2021, all Bloomberg Barclays Indices were re-branded as Bloomberg Indices.
Fidelity Advisor Freedom® 2005 Fund
Performance: The Bottom Line
Average annual total return reflects the change in the value of an investment, assuming reinvestment of distributions from dividend income and capital gains (the profits earned upon the sale of securities that have grown in value, if any) and assuming a constant rate of performance each year. The hypothetical investment and the average annual total returns do not reflect the deduction of taxes that a shareholder would pay on fund distributions or the redemption of fund shares. During periods of reimbursement by Fidelity, a fund’s total return will be greater than it would be had the reimbursement not occurred. How a fund did yesterday is no guarantee of how it will do tomorrow.
Average Annual Total Returns
| For the periods ended March 31, 2022 | Past 1 year | Past 5 years | Past 10 years |
| Class A (incl. 5.75% sales charge) | (6.60)% | 3.50% | 4.00% |
| Class M (incl. 3.50% sales charge) | (4.59)% | 3.73% | 3.98% |
| Class C (incl. contingent deferred sales charge) | (2.48)% | 3.97% | 3.99% |
| Class I | (0.64)% | 4.99% | 4.88% |
| Class Z | (0.48)% | 5.05% | 4.91% |
| Class Z6 | (0.52)% | 5.10% | 4.93% |
Prior to June 1, 2017, the fund operated under a different pricing structure. The fund’s historical performance prior to June 1, 2017 does not reflect the fund’s current pricing structure.
The initial offering of Class Z shares took place on October 2, 2018. Returns prior to October 2, 2018 are those of Class I.
The initial offering of Class Z6 shares took place on June 6, 2017. Returns prior to June 6, 2017 are those of Class I.
Class C shares' contingent deferred sales charges included in the past one year, past five years and past ten years total return figures are 1%, 0% and 0%, respectively.
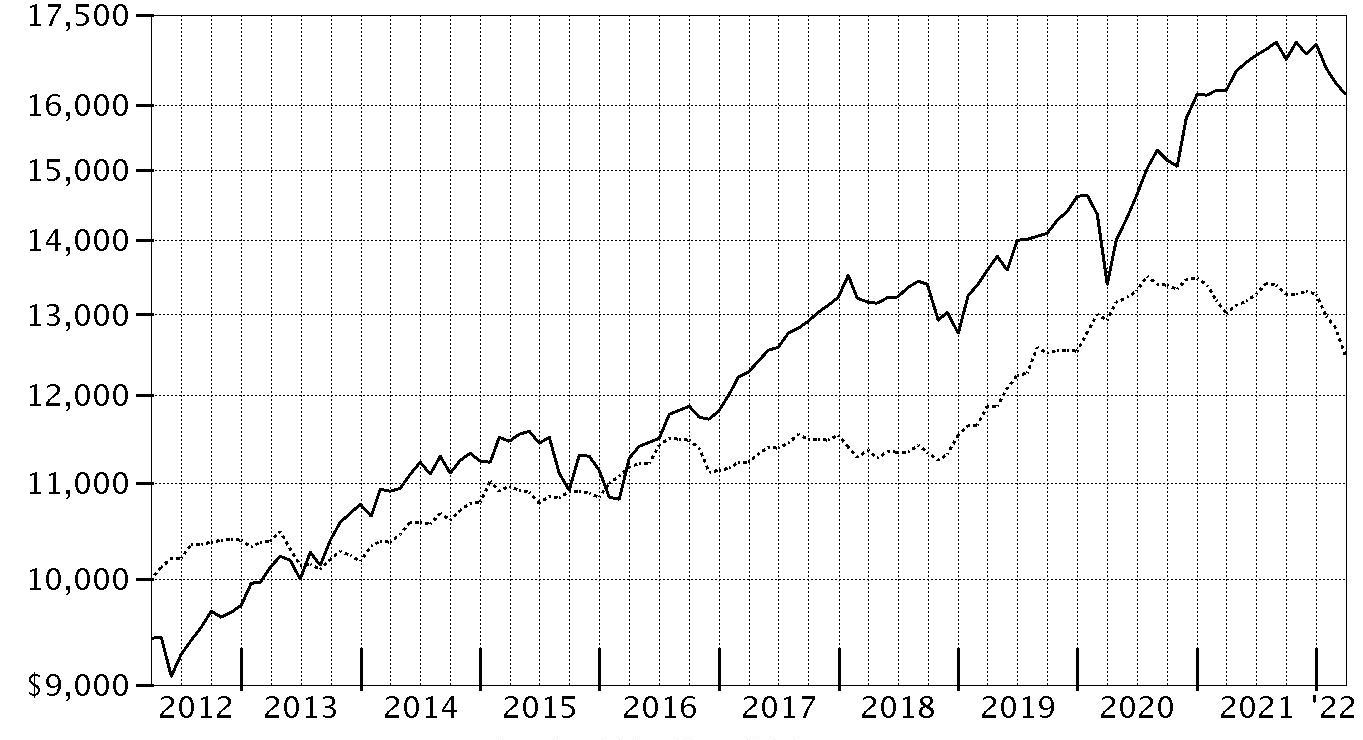
$10,000 Over 10 Years
Let's say hypothetically that $10,000 was invested in Fidelity Advisor Freedom® 2005 Fund - Class A on March 31, 2012, and the current 5.75% sales charge was paid.
The chart shows how the value of your investment would have changed, and also shows how the Bloomberg U.S. Aggregate Bond Index performed over the same period.

| Period Ending Values |
| $14,797 | Fidelity Advisor Freedom® 2005 Fund - Class A |
| $12,480 | Bloomberg U.S. Aggregate Bond Index |
Effective August 24, 2021, all Bloomberg Barclays Indices were re-branded as Bloomberg Indices.
Fidelity Advisor Freedom® 2010 Fund
Performance: The Bottom Line
Average annual total return reflects the change in the value of an investment, assuming reinvestment of distributions from dividend income and capital gains (the profits earned upon the sale of securities that have grown in value, if any) and assuming a constant rate of performance each year. The hypothetical investment and the average annual total returns do not reflect the deduction of taxes that a shareholder would pay on fund distributions or the redemption of fund shares. During periods of reimbursement by Fidelity, a fund’s total return will be greater than it would be had the reimbursement not occurred. How a fund did yesterday is no guarantee of how it will do tomorrow.
Average Annual Total Returns
| For the periods ended March 31, 2022 | Past 1 year | Past 5 years | Past 10 years |
| Class A (incl. 5.75% sales charge) | (6.14)% | 4.44% | 4.93% |
| Class M (incl. 3.50% sales charge) | (4.11)% | 4.67% | 4.91% |
| Class C (incl. contingent deferred sales charge) | (2.10)% | 4.90% | 4.93% |
| Class I | (0.21)% | 5.92% | 5.81% |
| Class Z | (0.20)% | 5.97% | 5.83% |
| Class Z6 | (0.10)% | 6.05% | 5.87% |
Prior to June 1, 2017, the fund operated under a different pricing structure. The fund’s historical performance prior to June 1, 2017 does not reflect the fund’s current pricing structure.
The initial offering of Class Z shares took place on October 2, 2018. Returns prior to October 2, 2018 are those of Class I.
The initial offering of Class Z6 shares took place on June 6, 2017. Returns prior to June 6, 2017 are those of Class I.
Class C shares' contingent deferred sales charges included in the past one year, past five years and past ten years total return figures are 1%, 0% and 0%, respectively.
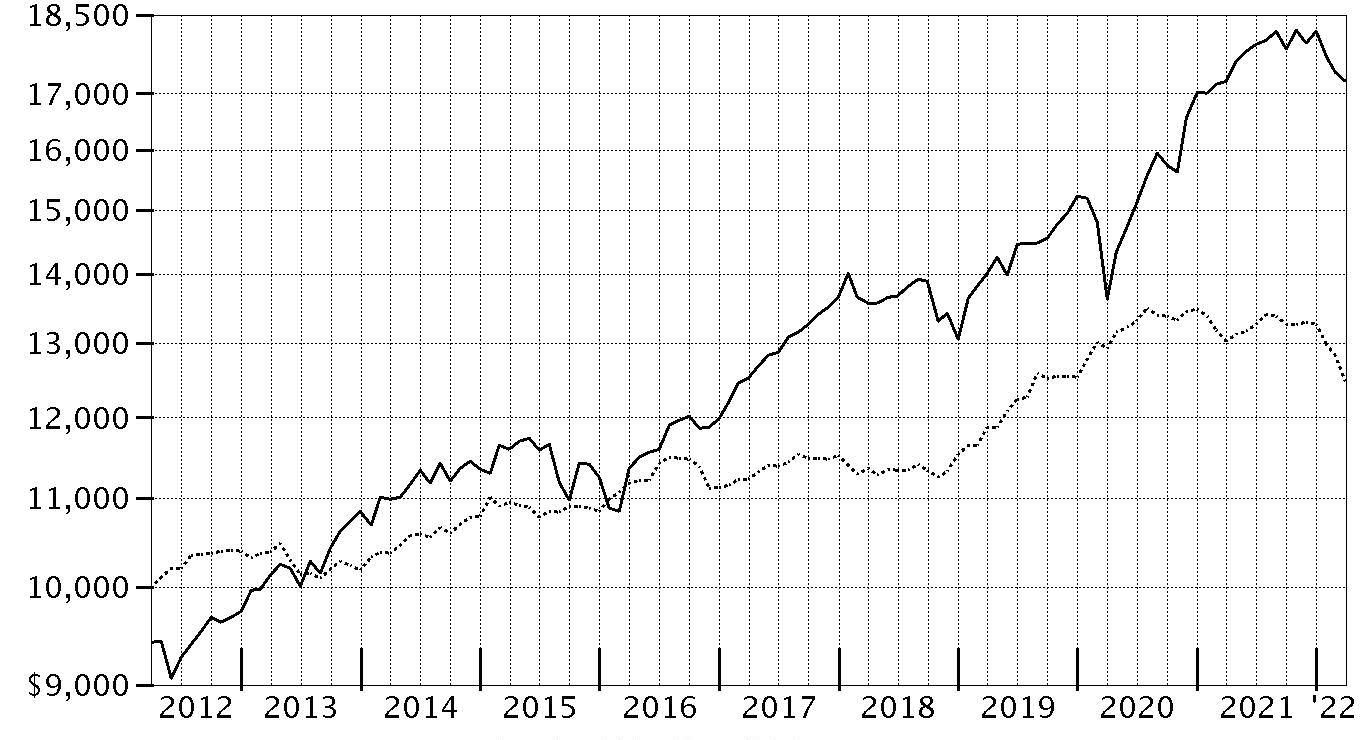
$10,000 Over 10 Years
Let's say hypothetically that $10,000 was invested in Fidelity Advisor Freedom® 2010 Fund - Class A on March 31, 2012, and the current 5.75% sales charge was paid.
The chart shows how the value of your investment would have changed, and also shows how the Bloomberg U.S. Aggregate Bond Index performed over the same period.
| Period Ending Values |
| $16,180 | Fidelity Advisor Freedom® 2010 Fund - Class A |
| $12,480 | Bloomberg U.S. Aggregate Bond Index |
Effective August 24, 2021, all Bloomberg Barclays Indices were re-branded as Bloomberg Indices.
Fidelity Advisor Freedom® 2015 Fund
Performance: The Bottom Line
Average annual total return reflects the change in the value of an investment, assuming reinvestment of distributions from dividend income and capital gains (the profits earned upon the sale of securities that have grown in value, if any) and assuming a constant rate of performance each year. The hypothetical investment and the average annual total returns do not reflect the deduction of taxes that a shareholder would pay on fund distributions or the redemption of fund shares. During periods of reimbursement by Fidelity, a fund’s total return will be greater than it would be had the reimbursement not occurred. How a fund did yesterday is no guarantee of how it will do tomorrow.
Average Annual Total Returns
| For the periods ended March 31, 2022 | Past 1 year | Past 5 years | Past 10 years |
| Class A (incl. 5.75% sales charge) | (5.82)% | 5.33% | 5.59% |
| Class M (incl. 3.50% sales charge) | (3.84)% | 5.55% | 5.57% |
| Class C (incl. contingent deferred sales charge) | (1.65)% | 5.80% | 5.58% |
| Class I | 0.20% | 6.85% | 6.48% |
| Class Z | 0.25% | 6.90% | 6.50% |
| Class Z6 | 0.31% | 6.99% | 6.55% |
Prior to June 1, 2017, the fund operated under a different pricing structure. The fund’s historical performance prior to June 1, 2017 does not reflect the fund’s current pricing structure.
The initial offering of Class Z shares took place on October 2, 2018. Returns prior to October 2, 2018 are those of Class I.
The initial offering of Class Z6 shares took place on June 6, 2017. Returns prior to June 6, 2017 are those of Class I.
Class C shares' contingent deferred sales charges included in the past one year, past five years and past ten years total return figures are 1%, 0% and 0%, respectively.
$10,000 Over 10 Years
Let's say hypothetically that $10,000 was invested in Fidelity Advisor Freedom® 2015 Fund - Class A on March 31, 2012, and the current 5.75% sales charge was paid.
The chart shows how the value of your investment would have changed, and also shows how the Bloomberg U.S. Aggregate Bond Index performed over the same period.
| Period Ending Values |
| $17,220 | Fidelity Advisor Freedom® 2015 Fund - Class A |
| $12,480 | Bloomberg U.S. Aggregate Bond Index |
Effective August 24, 2021, all Bloomberg Barclays Indices were re-branded as Bloomberg Indices.
Fidelity Advisor Freedom® 2020 Fund
Performance: The Bottom Line
Average annual total return reflects the change in the value of an investment, assuming reinvestment of distributions from dividend income and capital gains (the profits earned upon the sale of securities that have grown in value, if any) and assuming a constant rate of performance each year. The hypothetical investment and the average annual total returns do not reflect the deduction of taxes that a shareholder would pay on fund distributions or the redemption of fund shares. During periods of reimbursement by Fidelity, a fund’s total return will be greater than it would be had the reimbursement not occurred. How a fund did yesterday is no guarantee of how it will do tomorrow.
Average Annual Total Returns
| For the periods ended March 31, 2022 | Past 1 year | Past 5 years | Past 10 years |
| Class A (incl. 5.75% sales charge) | (5.51)% | 6.07% | 6.18% |
| Class M (incl. 3.50% sales charge) | (3.52)% | 6.32% | 6.17% |
| Class C (incl. contingent deferred sales charge) | (1.37)% | 6.55% | 6.18% |
| Class I | 0.53% | 7.62% | 7.08% |
| Class Z | 0.58% | 7.66% | 7.11% |
| Class Z6 | 0.69% | 7.80% | 7.17% |
Prior to June 1, 2017, the fund operated under a different pricing structure. The fund’s historical performance prior to June 1, 2017 does not reflect the fund’s current pricing structure.
The initial offering of Class Z shares took place on October 2, 2018. Returns prior to October 2, 2018 are those of Class I.
The initial offering of Class Z6 shares took place on June 6, 2017. Returns prior to June 6, 2017 are those of Class I.
Class C shares' contingent deferred sales charges included in the past one year, past five years and past ten years total return figures are 1%, 0% and 0%, respectively.
$10,000 Over 10 Years
Let's say hypothetically that $10,000 was invested in Fidelity Advisor Freedom® 2020 Fund - Class A on March 31, 2012, and the current 5.75% sales charge was paid.
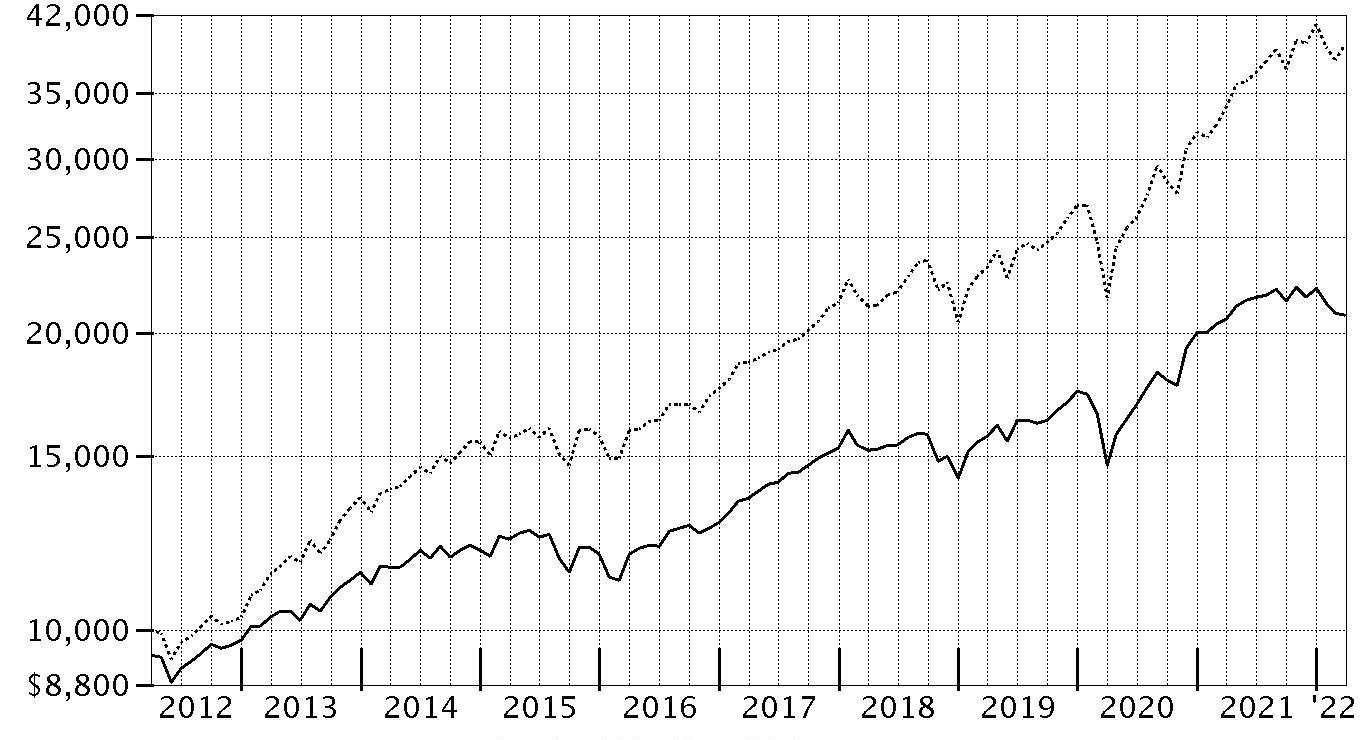
The chart shows how the value of your investment would have changed, and also shows how the Bloomberg U.S. Aggregate Bond Index and S&P 500 Index performed over the same period.
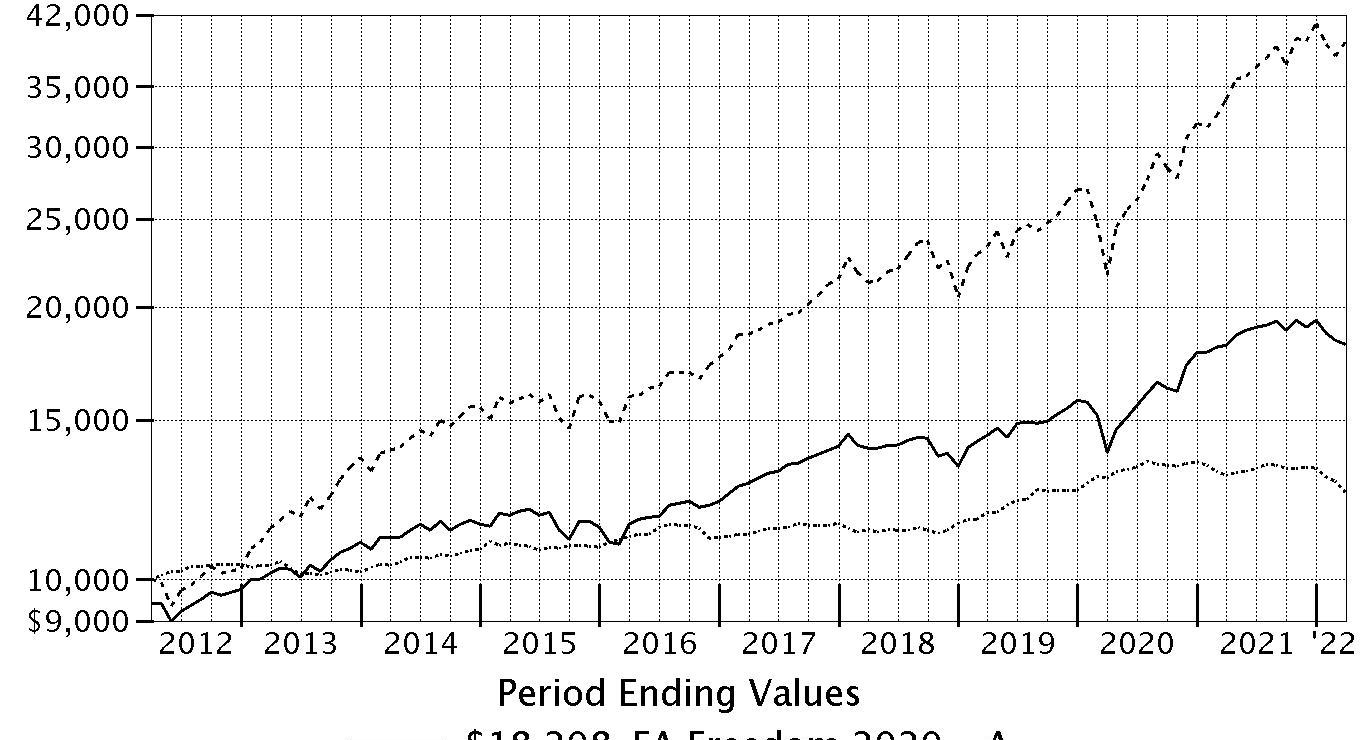
| Period Ending Values |
| $18,208 | Fidelity Advisor Freedom® 2020 Fund - Class A |
| $12,480 | Bloomberg U.S. Aggregate Bond Index |
| $39,197 | S&P 500® Index |
Effective August 24, 2021, all Bloomberg Barclays Indices were re-branded as Bloomberg Indices.
Effective October 1, 2021, the fund’s benchmark changed from the S&P 500 Index to the Bloomberg U.S. Aggregate Bond Index.
Fidelity Advisor Freedom® 2025 Fund
Performance: The Bottom Line
Average annual total return reflects the change in the value of an investment, assuming reinvestment of distributions from dividend income and capital gains (the profits earned upon the sale of securities that have grown in value, if any) and assuming a constant rate of performance each year. The hypothetical investment and the average annual total returns do not reflect the deduction of taxes that a shareholder would pay on fund distributions or the redemption of fund shares. During periods of reimbursement by Fidelity, a fund’s total return will be greater than it would be had the reimbursement not occurred. How a fund did yesterday is no guarantee of how it will do tomorrow.
Average Annual Total Returns
| For the periods ended March 31, 2022 | Past 1 year | Past 5 years | Past 10 years |
| Class A (incl. 5.75% sales charge) | (5.15)% | 6.70% | 6.89% |
| Class M (incl. 3.50% sales charge) | (3.13)% | 6.94% | 6.88% |
| Class C (incl. contingent deferred sales charge) | (1.03)% | 7.17% | 6.88% |
| Class I | 0.89% | 8.25% | 7.79% |
| Class Z | 0.94% | 8.30% | 7.82% |
| Class Z6 | 1.07% | 8.45% | 7.89% |
Prior to June 1, 2017, the fund operated under a different pricing structure. The fund’s historical performance prior to June 1, 2017 does not reflect the fund’s current pricing structure.
The initial offering of Class Z shares took place on October 2, 2018. Returns prior to October 2, 2018 are those of Class I.
The initial offering of Class Z6 shares took place on June 6, 2017. Returns prior to June 6, 2017 are those of Class I.
Class C shares' contingent deferred sales charges included in the past one year, past five years and past ten years total return figures are 1%, 0% and 0%, respectively.
$10,000 Over 10 Years
Let's say hypothetically that $10,000 was invested in Fidelity Advisor Freedom® 2025 Fund - Class A on March 31, 2012, and the current 5.75% sales charge was paid.
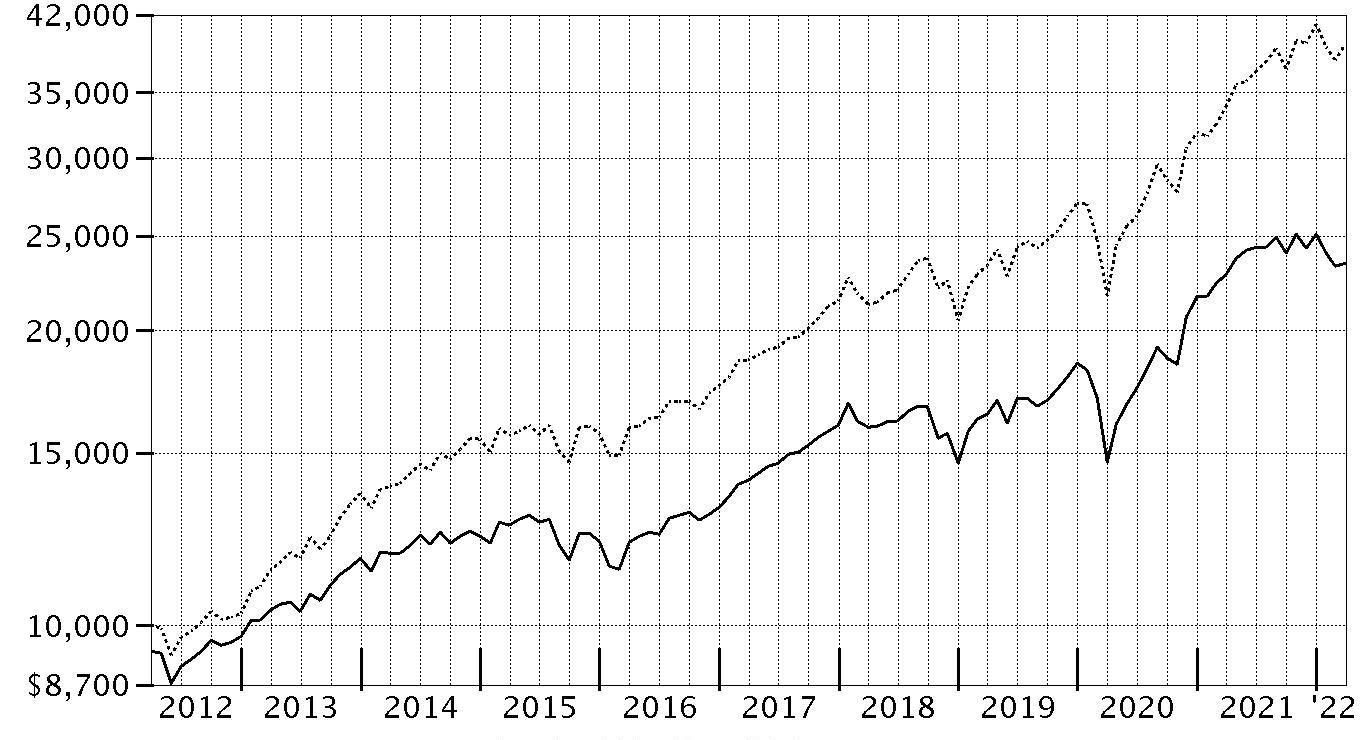
The chart shows how the value of your investment would have changed, and also shows how the S&P 500® Index performed over the same period.

| Period Ending Values |
| $19,471 | Fidelity Advisor Freedom® 2025 Fund - Class A |
| $39,197 | S&P 500® Index |
Fidelity Advisor Freedom® 2030 Fund
Performance: The Bottom Line
Average annual total return reflects the change in the value of an investment, assuming reinvestment of distributions from dividend income and capital gains (the profits earned upon the sale of securities that have grown in value, if any) and assuming a constant rate of performance each year. The hypothetical investment and the average annual total returns do not reflect the deduction of taxes that a shareholder would pay on fund distributions or the redemption of fund shares. During periods of reimbursement by Fidelity, a fund’s total return will be greater than it would be had the reimbursement not occurred. How a fund did yesterday is no guarantee of how it will do tomorrow.
Average Annual Total Returns
| For the periods ended March 31, 2022 | Past 1 year | Past 5 years | Past 10 years |
| Class A (incl. 5.75% sales charge) | (4.76)% | 7.64% | 7.63% |
| Class M (incl. 3.50% sales charge) | (2.72)% | 7.88% | 7.62% |
| Class C (incl. contingent deferred sales charge) | (0.62)% | 8.10% | 7.62% |
| Class I | 1.37% | 9.19% | 8.54% |
| Class Z | 1.37% | 9.25% | 8.57% |
| Class Z6 | 1.56% | 9.41% | 8.65% |
Prior to June 1, 2017, the fund operated under a different pricing structure. The fund’s historical performance prior to June 1, 2017 does not reflect the fund’s current pricing structure.
The initial offering of Class Z shares took place on October 2, 2018. Returns prior to October 2, 2018 are those of Class I.
The initial offering of Class Z6 shares took place on June 6, 2017. Returns prior to June 6, 2017 are those of Class I.
Class C shares' contingent deferred sales charges included in the past one year, past five years and past ten years total return figures are 1%, 0% and 0%, respectively.
$10,000 Over 10 Years
Let's say hypothetically that $10,000 was invested in Fidelity Advisor Freedom® 2030 Fund - Class A on March 31, 2012, and the current 5.75% sales charge was paid.
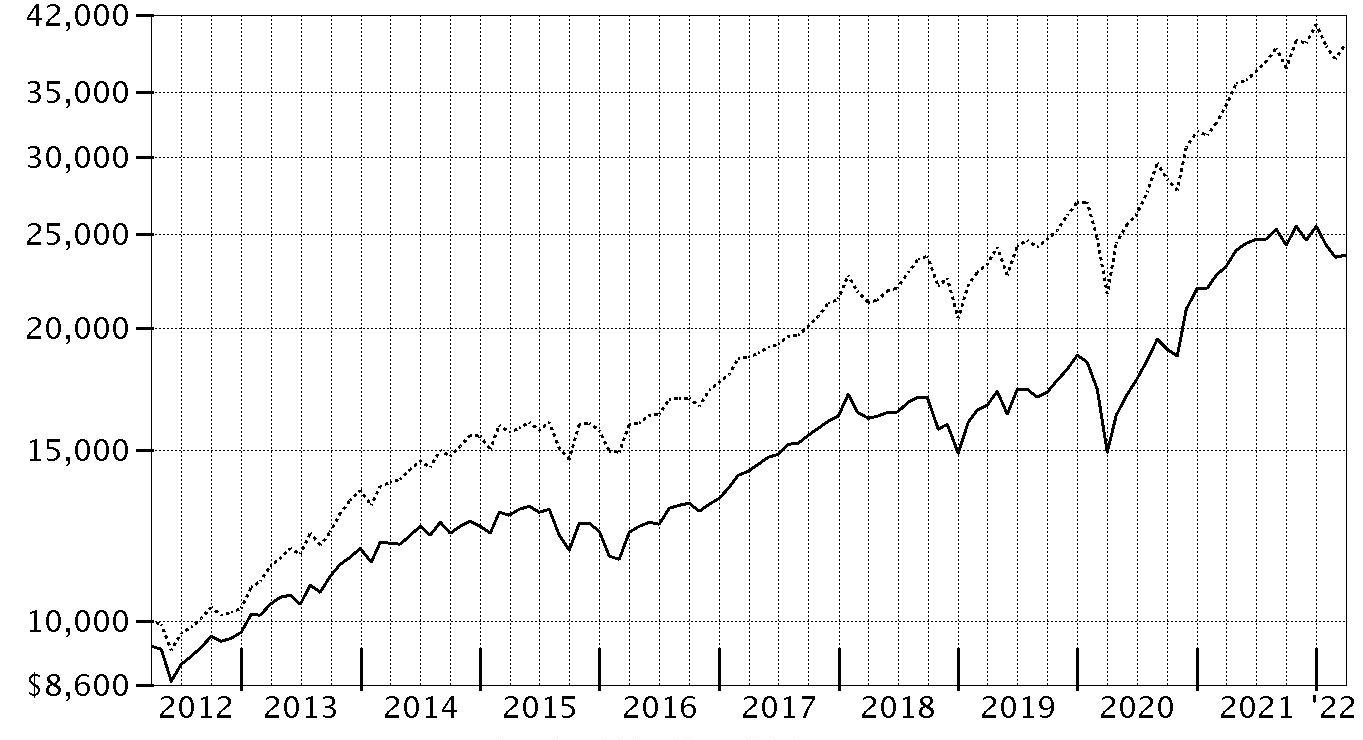
The chart shows how the value of your investment would have changed, and also shows how the S&P 500® Index performed over the same period.
| Period Ending Values |
| $20,866 | Fidelity Advisor Freedom® 2030 Fund - Class A |
| $39,197 | S&P 500® Index |
Fidelity Advisor Freedom® 2035 Fund
Performance: The Bottom Line
Average annual total return reflects the change in the value of an investment, assuming reinvestment of distributions from dividend income and capital gains (the profits earned upon the sale of securities that have grown in value, if any) and assuming a constant rate of performance each year. The hypothetical investment and the average annual total returns do not reflect the deduction of taxes that a shareholder would pay on fund distributions or the redemption of fund shares. During periods of reimbursement by Fidelity, a fund’s total return will be greater than it would be had the reimbursement not occurred. How a fund did yesterday is no guarantee of how it will do tomorrow.
Average Annual Total Returns
| For the periods ended March 31, 2022 | Past 1 year | Past 5 years | Past 10 years |
| Class A (incl. 5.75% sales charge) | (3.91)% | 8.84% | 8.55% |
| Class M (incl. 3.50% sales charge) | (1.83)% | 9.08% | 8.54% |
| Class C (incl. contingent deferred sales charge) | 0.25% | 9.30% | 8.54% |
| Class I | 2.25% | 10.41% | 9.47% |
| Class Z | 2.35% | 10.48% | 9.50% |
| Class Z6 | 2.48% | 10.66% | 9.59% |
Prior to June 1, 2017, the fund operated under a different pricing structure. The fund’s historical performance prior to June 1, 2017 does not reflect the fund’s current pricing structure.
The initial offering of Class Z shares took place on October 2, 2018. Returns prior to October 2, 2018 are those of Class I.
The initial offering of Class Z6 shares took place on June 6, 2017. Returns prior to June 6, 2017 are those of Class I.
Class C shares' contingent deferred sales charges included in the past one year, past five years and past ten years total return figures are 1%, 0% and 0%, respectively.
$10,000 Over 10 Years
Let's say hypothetically that $10,000 was invested in Fidelity Advisor Freedom® 2035 Fund - Class A on March 31, 2012, and the current 5.75% sales charge was paid.
The chart shows how the value of your investment would have changed, and also shows how the S&P 500® Index performed over the same period.

| Period Ending Values |
| $22,715 | Fidelity Advisor Freedom® 2035 Fund - Class A |
| $39,197 | S&P 500® Index |
Fidelity Advisor Freedom® 2040 Fund
Performance: The Bottom Line
Average annual total return reflects the change in the value of an investment, assuming reinvestment of distributions from dividend income and capital gains (the profits earned upon the sale of securities that have grown in value, if any) and assuming a constant rate of performance each year. The hypothetical investment and the average annual total returns do not reflect the deduction of taxes that a shareholder would pay on fund distributions or the redemption of fund shares. During periods of reimbursement by Fidelity, a fund’s total return will be greater than it would be had the reimbursement not occurred. How a fund did yesterday is no guarantee of how it will do tomorrow.
Average Annual Total Returns
| For the periods ended March 31, 2022 | Past 1 year | Past 5 years | Past 10 years |
| Class A (incl. 5.75% sales charge) | (3.17)% | 9.46% | 8.89% |
| Class M (incl. 3.50% sales charge) | (1.08)% | 9.71% | 8.88% |
| Class C (incl. contingent deferred sales charge) | 1.05% | 9.93% | 8.88% |
| Class I | 3.03% | 11.06% | 9.82% |
| Class Z | 3.14% | 11.14% | 9.86% |
| Class Z6 | 3.31% | 11.32% | 9.95% |
Prior to June 1, 2017, the fund operated under a different pricing structure. The fund’s historical performance prior to June 1, 2017 does not reflect the fund’s current pricing structure.
The initial offering of Class Z shares took place on October 2, 2018. Returns prior to October 2, 2018 are those of Class I.
The initial offering of Class Z6 shares took place on June 6, 2017. Returns prior to June 6, 2017 are those of Class I.
Class C shares' contingent deferred sales charges included in the past one year, past five years and past ten years total return figures are 1%, 0% and 0%, respectively.
$10,000 Over 10 Years
Let's say hypothetically that $10,000 was invested in Fidelity Advisor Freedom® 2040 Fund - Class A on March 31, 2012, and the current 5.75% sales charge was paid.
The chart shows how the value of your investment would have changed, and also shows how the S&P 500® Index performed over the same period.
| Period Ending Values |
| $23,442 | Fidelity Advisor Freedom® 2040 Fund - Class A |
| $39,197 | S&P 500® Index |
Fidelity Advisor Freedom® 2045 Fund
Performance: The Bottom Line
Average annual total return reflects the change in the value of an investment, assuming reinvestment of distributions from dividend income and capital gains (the profits earned upon the sale of securities that have grown in value, if any) and assuming a constant rate of performance each year. The hypothetical investment and the average annual total returns do not reflect the deduction of taxes that a shareholder would pay on fund distributions or the redemption of fund shares. During periods of reimbursement by Fidelity, a fund’s total return will be greater than it would be had the reimbursement not occurred. How a fund did yesterday is no guarantee of how it will do tomorrow.
Average Annual Total Returns
| For the periods ended March 31, 2022 | Past 1 year | Past 5 years | Past 10 years |
| Class A (incl. 5.75% sales charge) | (3.14)% | 9.48% | 8.96% |
| Class M (incl. 3.50% sales charge) | (1.05)% | 9.71% | 8.95% |
| Class C (incl. contingent deferred sales charge) | 1.03% | 9.94% | 8.96% |
| Class I | 3.02% | 11.06% | 9.88% |
| Class Z | 3.12% | 11.12% | 9.91% |
| Class Z6 | 3.32% | 11.33% | 10.02% |
Prior to June 1, 2017, the fund operated under a different pricing structure. The fund’s historical performance prior to June 1, 2017 does not reflect the fund’s current pricing structure.
The initial offering of Class Z shares took place on October 2, 2018. Returns prior to October 2, 2018 are those of Class I.
The initial offering of Class Z6 shares took place on June 6, 2017. Returns prior to June 6, 2017 are those of Class I.
Class C shares' contingent deferred sales charges included in the past one year, past five years and past ten years total return figures are 1%, 0% and 0%, respectively.
$10,000 Over 10 Years
Let's say hypothetically that $10,000 was invested in Fidelity Advisor Freedom® 2045 Fund - Class A on March 31, 2012, and the current 5.75% sales charge was paid.
The chart shows how the value of your investment would have changed, and also shows how the S&P 500® Index performed over the same period.

| Period Ending Values |
| $23,589 | Fidelity Advisor Freedom® 2045 Fund - Class A |
| $39,197 | S&P 500® Index |
Fidelity Advisor Freedom® 2050 Fund
Performance: The Bottom Line
Average annual total return reflects the change in the value of an investment, assuming reinvestment of distributions from dividend income and capital gains (the profits earned upon the sale of securities that have grown in value, if any) and assuming a constant rate of performance each year. The hypothetical investment and the average annual total returns do not reflect the deduction of taxes that a shareholder would pay on fund distributions or the redemption of fund shares. During periods of reimbursement by Fidelity, a fund’s total return will be greater than it would be had the reimbursement not occurred. How a fund did yesterday is no guarantee of how it will do tomorrow.
Average Annual Total Returns
| For the periods ended March 31, 2022 | Past 1 year | Past 5 years | Past 10 years |
| Class A (incl. 5.75% sales charge) | (3.15)% | 9.47% | 8.98% |
| Class M (incl. 3.50% sales charge) | (1.07)% | 9.71% | 8.96% |
| Class C (incl. contingent deferred sales charge) | 1.07% | 9.94% | 8.97% |
| Class I | 3.01% | 11.05% | 9.90% |
| Class Z | 3.10% | 11.14% | 9.94% |
| Class Z6 | 3.30% | 11.31% | 10.03% |
Prior to June 1, 2017, the fund operated under a different pricing structure. The fund’s historical performance prior to June 1, 2017 does not reflect the fund’s current pricing structure.
The initial offering of Class Z shares took place on October 2, 2018. Returns prior to October 2, 2018 are those of Class I.
The initial offering of Class Z6 shares took place on June 6, 2017. Returns prior to June 6, 2017 are those of Class I.
Class C shares' contingent deferred sales charges included in the past one year, past five years and past ten years total return figures are 1%, 0% and 0%, respectively.
$10,000 Over 10 Years
Let's say hypothetically that $10,000 was invested in Fidelity Advisor Freedom® 2050 Fund - Class A on March 31, 2012, and the current 5.75% sales charge was paid.
The chart shows how the value of your investment would have changed, and also shows how the S&P 500® Index performed over the same period.

| Period Ending Values |
| $23,622 | Fidelity Advisor Freedom® 2050 Fund - Class A |
| $39,197 | S&P 500® Index |
Fidelity Advisor Freedom® 2055 Fund
Performance: The Bottom Line
Average annual total return reflects the change in the value of an investment, assuming reinvestment of distributions from dividend income and capital gains (the profits earned upon the sale of securities that have grown in value, if any) and assuming a constant rate of performance each year. The hypothetical investment and the average annual total returns do not reflect the deduction of taxes that a shareholder would pay on fund distributions or the redemption of fund shares. During periods of reimbursement by Fidelity, a fund’s total return will be greater than it would be had the reimbursement not occurred. How a fund did yesterday is no guarantee of how it will do tomorrow.
Average Annual Total Returns
| For the periods ended March 31, 2022 | Past 1 year | Past 5 years | Past 10 years |
| Class A (incl. 5.75% sales charge) | (3.16)% | 9.47% | 9.05% |
| Class M (incl. 3.50% sales charge) | (1.06)% | 9.72% | 9.04% |
| Class C (incl. contingent deferred sales charge) | 1.09% | 9.95% | 9.04% |
| Class I | 3.00% | 11.04% | 9.97% |
| Class Z | 3.10% | 11.13% | 10.01% |
| Class Z6 | 3.30% | 11.31% | 10.11% |
Prior to June 1, 2017, the fund operated under a different pricing structure. The fund’s historical performance prior to June 1, 2017 does not reflect the fund’s current pricing structure.
The initial offering of Class Z shares took place on October 2, 2018. Returns prior to October 2, 2018 are those of Class I.
The initial offering of Class Z6 shares took place on June 6, 2017. Returns prior to June 6, 2017 are those of Class I.
Class C shares' contingent deferred sales charges included in the past one year, past five years, and life of fund total return figures are 1%, 0%, and 0%, respectively.
$10,000 Over 10 Years
Let's say hypothetically that $10,000 was invested in Fidelity Advisor Freedom® 2055 Fund - Class A on March 31, 2012, and the current 5.75% sales charge was paid.
The chart shows how the value of your investment would have changed, and also shows how the S&P 500® Index performed over the same period.
| Period Ending Values |
| $23,792 | Fidelity Advisor Freedom® 2055 Fund - Class A |
| $39,197 | S&P 500® Index |
Fidelity Advisor Freedom® 2060 Fund
Performance: The Bottom Line
Average annual total return reflects the change in the value of an investment, assuming reinvestment of distributions from dividend income and capital gains (the profits earned upon the sale of securities that have grown in value, if any) and assuming a constant rate of performance each year. The hypothetical investment and the average annual total returns do not reflect the deduction of taxes that a shareholder would pay on fund distributions or the redemption of fund shares. During periods of reimbursement by Fidelity, a fund’s total return will be greater than it would be had the reimbursement not occurred. How a fund did yesterday is no guarantee of how it will do tomorrow.
Average Annual Total Returns
| For the periods ended March 31, 2022 | Past 1 year | Past 5 years | Life of fundA |
| Class A (incl. 5.75% sales charge) | (3.17)% | 9.46% | 8.26% |
| Class M (incl. 3.50% sales charge) | (1.09)% | 9.70% | 8.33% |
| Class C (incl. contingent deferred sales charge) | 0.99% | 9.93% | 8.29% |
| Class I | 3.01% | 11.03% | 9.38% |
| Class Z | 3.06% | 11.11% | 9.43% |
| Class Z6 | 3.23% | 11.28% | 9.54% |
A From August 5, 2014
Prior to June 1, 2017, the fund operated under a different pricing structure. The fund’s historical performance prior to June 1, 2017 does not reflect the fund’s current pricing structure.
Class C shares’ contingent deferred sales charges included in the past one year, past five years, and life of fund total return figures are 1%, 0%, and 0%, respectively.
The initial offering of Class Z shares took place on October 2, 2018. Returns prior to October 2, 2018 are those of Class I.
The initial offering of Class Z6 shares took place on June 6, 2017. Returns prior to June 6, 2017 are those of Class I.
$10,000 Over Life of Fund
Let's say hypothetically that $10,000 was invested in Fidelity Advisor Freedom® 2060 Fund - Class A on August 5, 2014, when the fund started, and the current 5.75% sales charge was paid.
The chart shows how the value of your investment would have changed, and also shows how the S&P 500® Index performed over the same period.
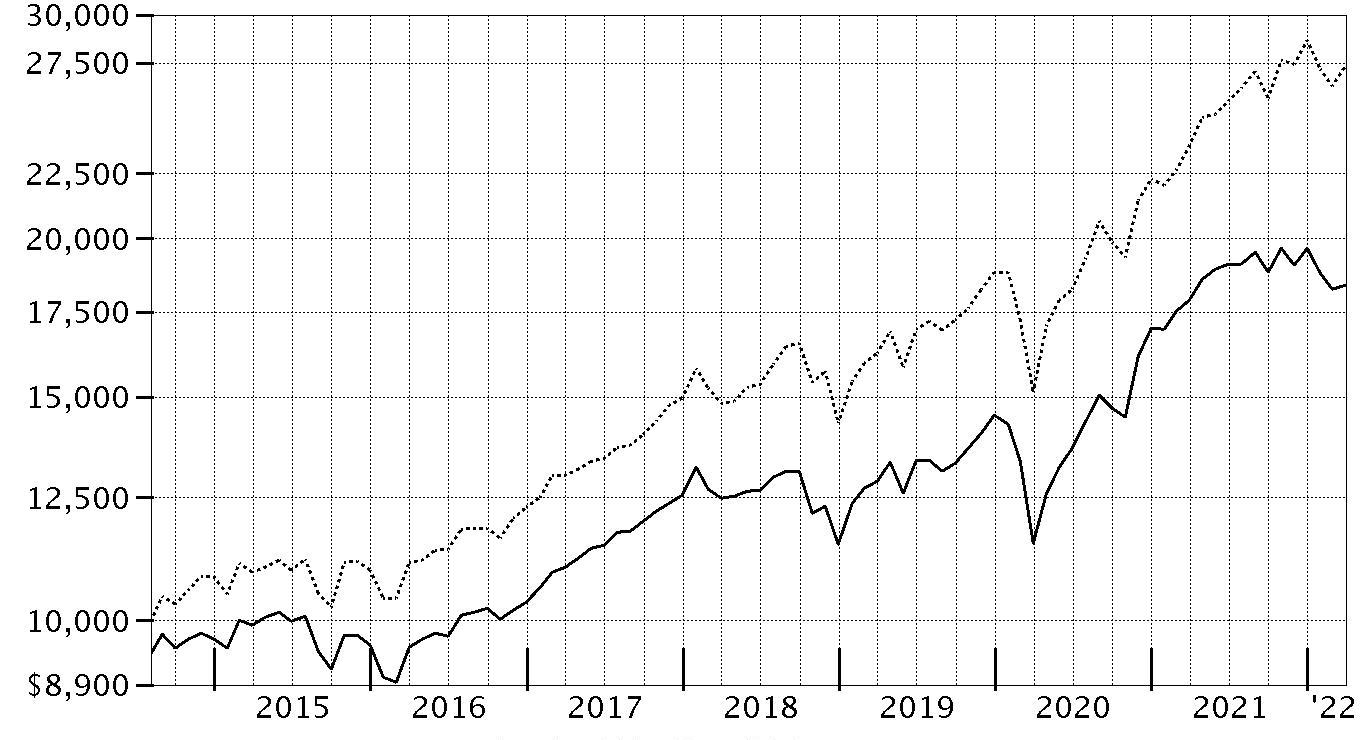
| Period Ending Values |
| $18,363 | Fidelity Advisor Freedom® 2060 Fund - Class A |
| $27,342 | S&P 500® Index |
Fidelity Advisor Freedom® 2065 Fund
Performance: The Bottom Line
Average annual total return reflects the change in the value of an investment, assuming reinvestment of distributions from dividend income and capital gains (the profits earned upon the sale of securities that have grown in value, if any) and assuming a constant rate of performance each year. The hypothetical investment and the average annual total returns do not reflect the deduction of taxes that a shareholder would pay on fund distributions or the redemption of fund shares. During periods of reimbursement by Fidelity, a fund’s total return will be greater than it would be had the reimbursement not occurred. How a fund did yesterday is no guarantee of how it will do tomorrow.
Average Annual Total Returns
| For the periods ended March 31, 2022 | Past 1 year | Life of fundA |
| Class A (incl. 5.75% sales charge) | (3.16)% | 9.81% |
| Class M (incl. 3.50% sales charge) | (1.11)% | 10.48% |
| Class C (incl. contingent deferred sales charge) | 1.04% | 11.37% |
| Class I | 2.94% | 12.48% |
| Class Z | 3.02% | 12.59% |
| Class Z6 | 3.27% | 12.78% |
A From June 28, 2019
Class C shares’ contingent deferred sales charges included in the past one year and life of fund total return figures are 1% and 0%, respectively.
$10,000 Over Life of Fund
Let's say hypothetically that $10,000 was invested in Fidelity Advisor Freedom® 2065 Fund - Class A on June 28, 2019, when the fund started, and the current 5.75% sales charge was paid.
The chart shows how the value of your investment would have changed, and also shows how the S&P 500® Index performed over the same period.
| Period Ending Values |
| $12,935 | Fidelity Advisor Freedom® 2065 Fund - Class A |
| $16,126 | S&P 500® Index |
Management's Discussion of Fund Performance
Market Recap: For the 12 months ending March 31, 2022, global financial markets were influenced by the reopening of businesses, an improved outlook for global economic growth, and fiscal and monetary stimulus. Strong corporate earnings growth amid ongoing midcycle economic expansion in several countries provided support for risk assets. However, as the calendar turned, investors grappled with soaring inflation, increasing bond yields, supply constraint and disruption, and Russia’s invasion of Ukraine, which led to surging commodity prices.
International equities returned -1.33% the past 12 months, according to the MSCI ACWI (All Country World Index) ex USA Index. By region, emerging markets (-11%) lagged most, followed by Japan (-6%). Conversely, Canada (+21%) topped the broader index by a wide margin. The U.K. (+15%), Asia Pacific ex Japan (+3%) and Europe ex U.K. (+1%) also outperformed. By sector, consumer discretionary (-21%) and communication services (-16%) fared worst. In contrast, energy (+24%) notably outperformed due to rising prices for oil and natural gas. Materials and financials each gained about 10%.
U.S. stocks gained 11.67% for the 12 months, as measured by the Dow Jones U.S. Total Stock Market Index. Among sectors, energy (+64%) led the way. Real estate (+20%), utilities (+19%) and information technology (+16%) also showed strength. In contrast, communication services (-3%) notably lagged. Small-cap stocks widely trailed larger-caps, while value outpaced growth, except among large-caps. Commodities rose 49.25%, per the Bloomberg Commodity Index Total Return.
U.S. taxable investment-grade bonds returned -4.15%, according to the Bloomberg U.S. Aggregate Bond Index, amid rising market interest rates and inflation. In December, the U.S. Federal Reserve said it was time to retire the term “transitory” in describing U.S. inflation and raised prospects for three quarter-point rate hikes in 2022. Corporate bonds (-4.16%) trailed U.S. Treasuries (-3.67%). Commercial mortgage-backed securities (-4.46%) and agencies (-3.94%) also lost ground. Outside the index, Treasury Inflation-Protected Securities (+4.29%) and leveraged loans (+3.38%) gained, but other non-core groups declined, such as emerging-markets debt (-6.18%) and U.S. corporate high-yield bonds (-0.30%).
Comments from Co-Portfolio Managers Andrew Dierdorf and Brett Sumsion: For the fiscal year, the Class I shares of each Fidelity Advisor Freedom
® Fund posted a return ranging from -0.80% for Fidelity Advisor Freedom Income Fund to 3.03% for Fidelity Advisor Freedom 2040 Fund. Each Fund underperformed its Composite index the past 12 months. Security selection among the underlying investment portfolios was the primary relative detractor, whereas active asset allocation contributed to the Funds' relative results. Specifically, investments in underlying emerging-markets equity funds detracted most. In this asset class, Fidelity
® Series Emerging Markets Opportunities Fund (-19.20%) lagged the -11.36% result of its benchmark, the MSCI Emerging Markets Index. Underlying investments in U.S. equities also held back the Funds' performance versus Composites. Specifically, Fidelity Advisor
® Series Growth Opportunities Fund (-5.04%) hurt most, as the fund trailed the 12.86% advance of its benchmark, the Russell 3000
® Growth Index. An investment in Fidelity
® Series Large Cap Stock Fund (+12.85%) also detracted, given the fund trailed the 15.65% gain of its benchmark, the S&P 500
® index. Conversely, investments in non-U.S. developed-markets equities and investment-grade bonds lifted the Funds' relative performance the past year. In terms of active asset allocation, a non-Composite allocation to commodities added relative value, given the 48.79% return for Fidelity
® Series Commodity Strategy Fund. Underweighting investment-grade bonds also contributed versus Composites, as this asset class lagged many others in which the Funds invest. In contrast, positioning in equities detracted from the Funds' relative results. Lastly, an outsized allocation to emerging-markets equities hurt, as did an underweighting in strong-performing U.S. equities.
The views expressed above reflect those of the portfolio manager(s) only through the end of the period as stated on the cover of this report and do not necessarily represent the views of Fidelity or any other person in the Fidelity organization. Any such views are subject to change at any time based upon market or other conditions and Fidelity disclaims any responsibility to update such views. These views may not be relied on as investment advice and, because investment decisions for a Fidelity fund are based on numerous factors, may not be relied on as an indication of trading intent on behalf of any Fidelity fund.
Fidelity Advisor Freedom® Income Fund
Investment Summary (Unaudited)
The information in the following tables is based on the direct investments of the Fund.
Top Holdings as of March 31, 2022
| | % of fund's net assets |
| Fidelity Series Investment Grade Bond Fund | 39.6 |
| Fidelity Series 0-5 Year Inflation-Protected Bond Index Fund | 15.9 |
| Fidelity Series Government Money Market Fund 0.31% | 10.1 |
| Fidelity Series Emerging Markets Opportunities Fund | 5.4 |
| Fidelity Series Long-Term Treasury Bond Index Fund | 3.7 |
| Fidelity Series International Developed Markets Bond Index Fund | 3.1 |
| Fidelity Series Short-Term Credit Fund | 2.5 |
| Fidelity Series International Value Fund | 2.0 |
| Fidelity Series Inflation-Protected Bond Index Fund | 2.0 |
| Fidelity Series Overseas Fund | 2.0 |
| | 86.3 |
Asset Allocation (% of fund's net assets)
| Period end |
| | Domestic Equity Funds | 7.8% |
| | International Equity Funds | 13.4% |
| | Bond Funds | 66.2% |
| | Short-Term Funds | 12.6% |

Domestic Equity Funds category includes Fidelity Series Commodity Strategy Fund which invests in commodity-related investments.
Fidelity Advisor Freedom® Income Fund
Schedule of Investments March 31, 2022
Showing Percentage of Net Assets
| U.S. Treasury Obligations - 0.0% | | | |
| | | Principal Amount | Value |
| U.S. Treasury Bills, yield at date of purchase 0.33% to 0.38% 6/2/22 to 6/9/22 (a) | | | |
| (Cost $79,948) | | 80,000 | 79,947 |
| | | Shares | Value |
|
| Domestic Equity Funds - 7.8% | | | |
| Fidelity Advisor Series Equity Growth Fund (b) | | 112,179 | $1,730,921 |
| Fidelity Advisor Series Growth Opportunities Fund (b) | | 97,058 | 1,187,018 |
| Fidelity Advisor Series Small Cap Fund (b) | | 60,482 | 785,658 |
| Fidelity Series All-Sector Equity Fund (b) | | 68,868 | 742,393 |
| Fidelity Series Commodity Strategy Fund (b) | | 619,904 | 3,167,711 |
| Fidelity Series Large Cap Stock Fund (b) | | 143,265 | 2,723,467 |
| Fidelity Series Large Cap Value Index Fund (b) | | 19,177 | 294,561 |
| Fidelity Series Opportunistic Insights Fund (b) | | 87,502 | 1,599,533 |
| Fidelity Series Small Cap Opportunities Fund (b) | | 71,219 | 969,997 |
| Fidelity Series Stock Selector Large Cap Value Fund (b) | | 128,292 | 1,738,355 |
| Fidelity Series Value Discovery Fund (b) | | 110,660 | 1,770,556 |
| TOTAL DOMESTIC EQUITY FUNDS | | | |
| (Cost $11,936,494) | | | 16,710,170 |
|
| International Equity Funds - 13.4% | | | |
| Fidelity Series Canada Fund (b) | | 119,029 | 1,847,336 |
| Fidelity Series Emerging Markets Fund (b) | | 139,879 | 1,298,074 |
| Fidelity Series Emerging Markets Opportunities Fund (b) | | 635,608 | 11,695,185 |
| Fidelity Series International Growth Fund (b) | | 255,441 | 4,235,213 |
| Fidelity Series International Small Cap Fund (b) | | 65,155 | 1,169,533 |
| Fidelity Series International Value Fund (b) | | 387,862 | 4,278,116 |
| Fidelity Series Overseas Fund (b) | | 337,469 | 4,258,859 |
| TOTAL INTERNATIONAL EQUITY FUNDS | | | |
| (Cost $23,771,196) | | | 28,782,316 |
|
| Bond Funds - 66.2% | | | |
| Fidelity Series 0-5 Year Inflation-Protected Bond Index Fund (b) | | 3,404,422 | 34,146,354 |
| Fidelity Series 5+ Year Inflation-Protected Bond Index Fund (b) | | 22,075 | 211,922 |
| Fidelity Series Emerging Markets Debt Fund (b) | | 133,235 | 1,099,191 |
| Fidelity Series Emerging Markets Debt Local Currency Fund (b) | | 40,163 | 361,867 |
| Fidelity Series Floating Rate High Income Fund (b) | | 23,603 | 216,914 |
| Fidelity Series High Income Fund (b) | | 141,332 | 1,284,707 |
| Fidelity Series Inflation-Protected Bond Index Fund (b) | | 420,751 | 4,270,619 |
| Fidelity Series International Credit Fund (b) | | 13,875 | 128,486 |
| Fidelity Series International Developed Markets Bond Index Fund (b) | | 710,011 | 6,624,405 |
| Fidelity Series Investment Grade Bond Fund (b) | | 7,797,021 | 85,065,499 |
| Fidelity Series Long-Term Treasury Bond Index Fund (b) | | 1,034,258 | 7,881,047 |
| Fidelity Series Real Estate Income Fund (b) | | 68,993 | 783,758 |
| TOTAL BOND FUNDS | | | |
| (Cost $143,037,461) | | | 142,074,769 |
|
| Short-Term Funds - 12.6% | | | |
| Fidelity Cash Central Fund 0.31% (c) | | 53,354 | 53,365 |
| Fidelity Series Government Money Market Fund 0.31% (b)(d) | | 21,517,858 | 21,517,858 |
| Fidelity Series Short-Term Credit Fund (b) | | 552,814 | 5,389,935 |
| TOTAL SHORT-TERM FUNDS | | | |
| (Cost $27,053,767) | | | 26,961,158 |
| TOTAL INVESTMENT IN SECURITIES - 100.0% | | | |
| (Cost $205,878,866) | | | 214,608,360 |
| NET OTHER ASSETS (LIABILITIES) - 0.0% | | | (34,552) |
| NET ASSETS - 100% | | | $214,573,808 |
| Futures Contracts | | | | | |
| | Number of contracts | Expiration Date | Notional Amount | Value | Unrealized Appreciation/(Depreciation) |
| Purchased | | | | | |
| Equity Index Contracts | | | | | |
| ICE E-mini MSCI EAFE Index Contracts (United States) | 5 | June 2022 | $536,100 | $24,378 | $24,378 |
| ICE E-mini MSCI Emerging Markets Index Contracts (United States) | 10 | June 2022 | 562,750 | 33,606 | 33,606 |
|
| TOTAL PURCHASED | | | | | 57,984 |
|
| Sold | | | | | |
| Equity Index Contracts | | | | | |
| CME Micro E-mini S&P 500 Index Contracts (United States) | 5 | June 2022 | 1,132,688 | (14,649) | (14,649) |
| TOTAL FUTURES CONTRACTS | | | | | $43,335 |
The notional amount of futures purchased as a percentage of Net Assets is 0.5%
The notional amount of futures sold as a percentage of Net Assets is 0.5%
Legend
(a) Security or a portion of the security was pledged to cover margin requirements for futures contracts. At period end, the value of securities pledged amounted to $79,947.
(b) Affiliated Fund
(c) Affiliated fund that is generally available only to investment companies and other accounts managed by Fidelity Investments. The rate quoted is the annualized seven-day yield of the fund at period end. A complete unaudited listing of the fund's holdings as of its most recent quarter end is available upon request. In addition, each Fidelity Central Fund's financial statements, which are not covered by the Fund's Report of Independent Registered Public Accounting Firm, are available on the SEC's website or upon request.
(d) The rate quoted is the annualized seven-day yield of the fund at period end.
Affiliated Central Funds
Fiscal year to date information regarding the Fund's investments in Fidelity Central Funds, including the ownership percentage, is presented below.
| Fund | Value, beginning of period | Purchases(a) | Sales Proceeds(a) | Dividend Income | Realized Gain/Loss | Change in Unrealized appreciation (depreciation) | Value, end of period | % ownership, end of period |
| Fidelity Cash Central Fund 0.31% | $145,509 | $247,607 | $339,751 | $74 | $-- | $-- | $53,365 | 0.0% |
| Total | $145,509 | $247,607 | $339,751 | $74 | $-- | $-- | $53,365 | |
(a) Includes the value of shares purchased or redeemed through in-kind transactions, if applicable.
Amounts in the income column in the above table include any capital gain distributions from underlying funds, which are presented in the corresponding line-item in the Statement of Operations, if applicable.
Affiliated Underlying Funds
Fiscal year to date information regarding the Fund's investments in affiliated Underlying Funds is presented below. Exchanges between classes of the same affiliated Underlying Funds may occur. If an underlying Fund changes its name, the name presented below is the name in effect at period end.
| Fund | Value, beginning of period | Purchases(a) | Sales Proceeds(a) | Dividend Income | Realized Gain (loss) | Change in Unrealized appreciation (depreciation) | Value, end of period |
| Fidelity Advisor Series Equity Growth Fund | $1,963,475 | $961,452 | $1,105,070 | $344,906 | $67,381 | $(156,317) | $1,730,921 |
| Fidelity Advisor Series Growth Opportunities Fund | 1,365,514 | 900,695 | 725,797 | 319,986 | (1,818) | (351,576) | 1,187,018 |
| Fidelity Advisor Series Small Cap Fund | 888,116 | 393,626 | 383,778 | 159,881 | 42,467 | (154,773) | 785,658 |
| Fidelity Series 0-5 Year Inflation-Protected Bond Index Fund | -- | 37,043,273 | 2,812,659 | 135,554 | (6,383) | (57,695) | 34,146,354 |
| Fidelity Series 5+ Year Inflation-Protected Bond Index Fund | -- | 6,520,719 | 6,268,883 | 16,666 | (39,897) | (17) | 211,922 |
| Fidelity Series All-Sector Equity Fund | 839,210 | 323,654 | 370,748 | 157,550 | 32,234 | (81,957) | 742,393 |
| Fidelity Series Canada Fund | 1,218,792 | 810,042 | 485,404 | 40,175 | 13,821 | 290,085 | 1,847,336 |
| Fidelity Series Commodity Strategy Fund | 6,551,523 | 2,839,250 | 6,420,534 | 2,067,417 | (164,903) | 362,375 | 3,167,711 |
| Fidelity Series Emerging Markets Debt Fund | 1,270,488 | 256,767 | 318,011 | 57,735 | (18,892) | (91,161) | 1,099,191 |
| Fidelity Series Emerging Markets Debt Local Currency Fund | 413,737 | 100,567 | 109,659 | 16,119 | (3,315) | (39,463) | 361,867 |
| Fidelity Series Emerging Markets Fund | 1,671,168 | 546,165 | 612,529 | 46,231 | 40,306 | (347,036) | 1,298,074 |
| Fidelity Series Emerging Markets Opportunities Fund | 15,321,215 | 6,445,602 | 6,021,345 | 1,507,327 | 416,160 | (4,466,447) | 11,695,185 |
| Fidelity Series Floating Rate High Income Fund | 255,922 | 40,933 | 80,276 | 10,666 | (3,901) | 4,236 | 216,914 |
| Fidelity Series Government Money Market Fund 0.31% | 45,852,734 | 5,932,464 | 30,267,340 | 32,473 | -- | -- | 21,517,858 |
| Fidelity Series High Income Fund | 1,508,394 | 257,690 | 440,870 | 79,950 | (1,305) | (39,202) | 1,284,707 |
| Fidelity Series Inflation-Protected Bond Index Fund | 28,604,275 | 3,956,997 | 28,397,954 | 1,190,459 | 2,409,170 | (2,301,869) | 4,270,619 |
| Fidelity Series International Credit Fund | 134,105 | 4,328 | -- | 4,328 | -- | (9,947) | 128,486 |
| Fidelity Series International Developed Markets Bond Index Fund | -- | 7,339,110 | 416,032 | 2,375 | (5,977) | (292,696) | 6,624,405 |
| Fidelity Series International Growth Fund | 3,415,325 | 2,706,109 | 1,445,496 | 374,334 | (13,130) | (427,595) | 4,235,213 |
| Fidelity Series International Small Cap Fund | 1,082,206 | 627,337 | 339,264 | 172,123 | 4,697 | (205,443) | 1,169,533 |
| Fidelity Series International Value Fund | 3,411,504 | 2,414,722 | 1,595,129 | 234,630 | 26,321 | 20,698 | 4,278,116 |
| Fidelity Series Investment Grade Bond Fund | 91,906,911 | 18,723,075 | 20,864,435 | 2,075,353 | (224,254) | (4,475,798) | 85,065,499 |
| Fidelity Series Large Cap Stock Fund | 3,064,744 | 856,048 | 1,298,908 | 284,778 | 124,218 | (22,635) | 2,723,467 |
| Fidelity Series Large Cap Value Index Fund | 330,754 | 77,281 | 130,234 | 21,436 | 17,158 | (398) | 294,561 |
| Fidelity Series Long-Term Treasury Bond Index Fund | 6,455,375 | 3,945,925 | 2,352,904 | 165,106 | (142,096) | (25,253) | 7,881,047 |
| Fidelity Series Opportunistic Insights Fund | 1,820,213 | 900,877 | 986,582 | 334,698 | 118,896 | (253,871) | 1,599,533 |
| Fidelity Series Overseas Fund | 3,421,024 | 2,444,415 | 1,538,302 | 139,134 | 47,117 | (115,395) | 4,258,859 |
| Fidelity Series Real Estate Income Fund | 907,464 | 140,917 | 293,492 | 35,356 | 21,170 | 7,699 | 783,758 |
| Fidelity Series Short-Term Credit Fund | 9,654,824 | 2,062,724 | 6,013,830 | 159,151 | (3,479) | (310,304) | 5,389,935 |
| Fidelity Series Small Cap Opportunities Fund | 1,096,039 | 597,279 | 478,955 | 282,782 | 30,072 | (274,438) | 969,997 |
| Fidelity Series Stock Selector Large Cap Value Fund | 1,940,778 | 688,893 | 818,892 | 335,528 | 56,883 | (129,307) | 1,738,355 |
| Fidelity Series Value Discovery Fund | 1,986,849 | 602,197 | 847,144 | 223,169 | 87,076 | (58,422) | 1,770,556 |
| | $238,352,678 | $111,461,133 | $124,240,456 | $11,027,376 | $2,925,797 | $(14,003,922) | $214,475,048 |
(a) Includes the value of shares purchased or redeemed through in-kind transactions, if applicable.
Amounts in the income column in the above table include any capital gain distributions from underlying funds, which are presented in the corresponding line-item in the Statement of Operations, if applicable.
Investment Valuation
The following is a summary of the inputs used, as of March 31, 2022, involving the Fund's assets and liabilities carried at fair value. The inputs or methodology used for valuing securities may not be an indication of the risk associated with investing in those securities. For more information on valuation inputs, and their aggregation into the levels used below, please refer to the Investment Valuation section in the accompanying Notes to Financial Statements.
| | Valuation Inputs at Reporting Date: |
| Description | Total | Level 1 | Level 2 | Level 3 |
| Investments in Securities: | | | | |
| Other Short-Term Investments and Net Other Assets | $79,947 | $-- | $79,947 | $-- |
| Domestic Equity Funds | 16,710,170 | 16,710,170 | -- | -- |
| International Equity Funds | 28,782,316 | 28,782,316 | -- | -- |
| Bond Funds | 142,074,769 | 142,074,769 | -- | -- |
| Short-Term Funds | 26,961,158 | 26,961,158 | -- | -- |
| Total Investments in Securities: | $214,608,360 | $214,528,413 | $79,947 | $-- |
| Derivative Instruments: | | | | |
| Assets | | | | |
| Futures Contracts | $57,984 | $57,984 | $-- | $-- |
| Total Assets | $57,984 | $57,984 | $-- | $-- |
| Liabilities | | | | |
| Futures Contracts | $(14,649) | $(14,649) | $-- | $-- |
| Total Liabilities | $(14,649) | $(14,649) | $-- | $-- |
| Total Derivative Instruments: | $43,335 | $43,335 | $-- | $-- |
Value of Derivative Instruments
The following table is a summary of the Fund's value of derivative instruments by primary risk exposure as of March 31, 2022. For additional information on derivative instruments, please refer to the Derivative Instruments section in the accompanying Notes to Financial Statements.
| Primary Risk Exposure / Derivative Type | Value |
| | Asset | Liability |
| Equity Risk | | |
| Futures Contracts(a) | $57,984 | $(14,649) |
| Total Equity Risk | 57,984 | (14,649) |
| Total Value of Derivatives | $57,984 | $(14,649) |
(a) Reflects gross cumulative appreciation (depreciation) on futures contracts as presented in the Schedule of Investments. In the Statement of Assets and Liabilities, the period end daily variation margin is included in receivable or payable for daily variation margin on futures contracts, and the net cumulative appreciation (depreciation) is included in Total accumulated earnings (loss).
See accompanying notes which are an integral part of the financial statements.
Fidelity Advisor Freedom® Income Fund
Financial Statements
Statement of Assets and Liabilities
| | | March 31, 2022 |
| Assets | | |
Investment in securities, at value — See accompanying schedule:
Unaffiliated issuers (cost $79,948) | $79,947 | |
| Fidelity Central Funds (cost $53,365) | 53,365 | |
| Other affiliated issuers (cost $205,745,553) | 214,475,048 | |
| Total Investment in Securities (cost $205,878,866) | | $214,608,360 |
| Cash | | 13,373 |
| Receivable for investments sold | | 6,469,384 |
| Receivable for fund shares sold | | 342,461 |
| Distributions receivable from Fidelity Central Funds | | 7 |
| Total assets | | 221,433,585 |
| Liabilities | | |
| Payable for investments purchased | $6,218,718 | |
| Payable for fund shares redeemed | 514,766 | |
| Accrued management fee | 82,392 | |
| Distribution and service plan fees payable | 34,741 | |
| Payable for daily variation margin on futures contracts | 9,160 | |
| Total liabilities | | 6,859,777 |
| Net Assets | | $214,573,808 |
| Net Assets consist of: | | |
| Paid in capital | | $201,826,943 |
| Total accumulated earnings (loss) | | 12,746,865 |
| Net Assets | | $214,573,808 |
| Net Asset Value and Maximum Offering Price | | |
| Class A: | | |
| Net Asset Value and redemption price per share ($75,687,289 ÷ 6,997,563 shares)(a) | | $10.82 |
| Maximum offering price per share (100/94.25 of $10.82) | | $11.48 |
| Class M: | | |
| Net Asset Value and redemption price per share ($31,924,777 ÷ 2,957,785 shares)(a) | | $10.79 |
| Maximum offering price per share (100/96.50 of $10.79) | | $11.18 |
| Class C: | | |
| Net Asset Value and offering price per share ($6,377,570 ÷ 594,962 shares)(a) | | $10.72 |
| Class I: | | |
| Net Asset Value, offering price and redemption price per share ($79,536,113 ÷ 7,323,838 shares) | | $10.86 |
| Class Z: | | |
| Net Asset Value, offering price and redemption price per share ($7,064,224 ÷ 651,124 shares) | | $10.85 |
| Class Z6: | | |
| Net Asset Value, offering price and redemption price per share ($13,983,835 ÷ 1,288,899 shares) | | $10.85 |
(a) Redemption price per share is equal to net asset value less any applicable contingent deferred sales charge.
See accompanying notes which are an integral part of the financial statements.
Statement of Operations
| | | Year ended March 31, 2022 |
| Investment Income | | |
| Dividends: | | |
| Affiliated issuers | | $6,743,977 |
| Interest | | 35 |
| Income from Fidelity Central Funds | | 74 |
| Total income | | 6,744,086 |
| Expenses | | |
| Management fee | $1,083,356 | |
| Distribution and service plan fees | 445,220 | |
| Independent trustees' fees and expenses | 731 | |
| Total expenses before reductions | 1,529,307 | |
| Expense reductions | (7) | |
| Total expenses after reductions | | 1,529,300 |
| Net investment income (loss) | | 5,214,786 |
| Realized and Unrealized Gain (Loss) | | |
| Net realized gain (loss) on: | | |
| Investment securities: | | |
| Affiliated issuers | 2,925,797 | |
| Futures contracts | 14,975 | |
| Capital gain distributions from underlying funds: | | |
| Affiliated issuers | 4,283,399 | |
| Total net realized gain (loss) | | 7,224,171 |
| Change in net unrealized appreciation (depreciation) on: | | |
| Investment securities: | | |
| Unaffiliated issuers | (3) | |
| Affiliated issuers | (14,003,922) | |
| Futures contracts | 43,335 | |
| Total change in net unrealized appreciation (depreciation) | | (13,960,590) |
| Net gain (loss) | | (6,736,419) |
| Net increase (decrease) in net assets resulting from operations | | $(1,521,633) |
See accompanying notes which are an integral part of the financial statements.
Statement of Changes in Net Assets
| | Year ended March 31, 2022 | Year ended March 31, 2021 |
| Increase (Decrease) in Net Assets | | |
| Operations | | |
| Net investment income (loss) | $5,214,786 | $2,035,277 |
| Net realized gain (loss) | 7,224,171 | 7,945,503 |
| Change in net unrealized appreciation (depreciation) | (13,960,590) | 18,948,278 |
| Net increase (decrease) in net assets resulting from operations | (1,521,633) | 28,929,058 |
| Distributions to shareholders | (12,106,656) | (8,450,575) |
| Share transactions - net increase (decrease) | (10,275,204) | 4,537,128 |
| Total increase (decrease) in net assets | (23,903,493) | 25,015,611 |
| Net Assets | | |
| Beginning of period | 238,477,301 | 213,461,690 |
| End of period | $214,573,808 | $238,477,301 |
See accompanying notes which are an integral part of the financial statements.
Financial Highlights
Fidelity Advisor Freedom Income Fund Class A
| Years ended March 31, | 2022 | 2021 | 2020 | 2019 | 2018 |
| Selected Per–Share Data | | | | | |
| Net asset value, beginning of period | $11.49 | $10.50 | $10.76 | $11.01 | $10.94 |
| Income from Investment Operations | | | | | |
| Net investment income (loss)A,B | .24 | .09 | .18 | .20 | .15 |
| Net realized and unrealized gain (loss) | (.34) | 1.30 | (.06)C | .12 | .34 |
| Total from investment operations | (.10) | 1.39 | .12 | .32 | .49 |
| Distributions from net investment income | (.23) | (.11) | (.18) | (.19) | (.15) |
| Distributions from net realized gain | (.34) | (.30) | (.20) | (.38) | (.26) |
| Total distributions | (.57) | (.40)D | (.38) | (.57) | (.42)D |
| Net asset value, end of period | $10.82 | $11.49 | $10.50 | $10.76 | $11.01 |
| Total ReturnE,F | (1.04)% | 13.41% | 1.04%C | 3.14% | 4.47% |
| Ratios to Average Net AssetsB,G,H | | | | | |
| Expenses before reductions | .72% | .72% | .72% | .71%I | .63% |
| Expenses net of fee waivers, if any | .72% | .72% | .72% | .71%I | .63% |
| Expenses net of all reductions | .72% | .72% | .72% | .71%I | .63% |
| Net investment income (loss) | 2.11% | .80% | 1.64% | 1.84% | 1.38% |
| Supplemental Data | | | | | |
| Net assets, end of period (000 omitted) | $75,687 | $73,935 | $61,807 | $69,817 | $76,141 |
| Portfolio turnover rateJ | 47% | 29% | 25% | 36% | 21% |
A Calculated based on average shares outstanding during the period.
B Net investment income (loss) is affected by the timing of the declaration of dividends by any underlying mutual funds or exchange-traded funds (ETFs). Net investment income (loss) of any such underlying funds is not included in the Fund's net investment income (loss) ratio.
C Amount includes a reimbursement from the investment adviser for an operational error which amounted to less than $.01 per share. Excluding this reimbursement, the total return would have been 0.93%.
D Total distributions per share do not sum due to rounding.
E Total returns would have been lower if certain expenses had not been reduced during the applicable periods shown.
F Total returns do not include the effect of the sales charges.
G Fees and expenses of any underlying mutual funds or exchange-traded funds (ETFs) are not included in the Fund's expense ratio. The Fund indirectly bears its proportionate share of these expenses. For additional expense information related to investments in Fidelity Central Funds, please refer to the "Investments in Fidelity Central Funds" note found in the Notes to Financial Statements section of the most recent Annual or Semi-Annual report.
H Expense ratios reflect operating expenses of the class. Expenses before reductions do not reflect amounts reimbursed, waived, or reduced through arrangements with the investment adviser, brokerage services, or other offset arrangements, if applicable, and do not represent the amount paid by the class during periods when reimbursements, waivers or reductions occur.
I On certain classes, the size and fluctuation of net assets and expense amounts may cause ratios to differ from contractual rates.
J Amount does not include the portfolio activity of any underlying mutual funds or exchange-traded funds (ETFs).
See accompanying notes which are an integral part of the financial statements.
Fidelity Advisor Freedom Income Fund Class M
| Years ended March 31, | 2022 | 2021 | 2020 | 2019 | 2018 |
| Selected Per–Share Data | | | | | |
| Net asset value, beginning of period | $11.47 | $10.49 | $10.74 | $11.00 | $10.93 |
| Income from Investment Operations | | | | | |
| Net investment income (loss)A,B | .21 | .06 | .15 | .17 | .13 |
| Net realized and unrealized gain (loss) | (.34) | 1.30 | (.04)C | .12 | .33 |
| Total from investment operations | (.13) | 1.36 | .11 | .29 | .46 |
| Distributions from net investment income | (.21) | (.08) | (.16) | (.17) | (.13) |
| Distributions from net realized gain | (.34) | (.30) | (.20) | (.38) | (.26) |
| Total distributions | (.55) | (.38) | (.36) | (.55) | (.39) |
| Net asset value, end of period | $10.79 | $11.47 | $10.49 | $10.74 | $11.00 |
| Total ReturnD,E | (1.31)% | 13.06% | .90%C | 2.78% | 4.22% |
| Ratios to Average Net AssetsB,F,G | | | | | |
| Expenses before reductions | .97% | .96%H | .97% | .96%H | .89% |
| Expenses net of fee waivers, if any | .97% | .96%H | .97% | .96%H | .89% |
| Expenses net of all reductions | .97% | .96%H | .97% | .96%H | .89% |
| Net investment income (loss) | 1.86% | .55% | 1.39% | 1.59% | 1.13% |
| Supplemental Data | | | | | |
| Net assets, end of period (000 omitted) | $31,925 | $36,006 | $36,147 | $38,059 | $38,204 |
| Portfolio turnover rateI | 47% | 29% | 25% | 36% | 21% |
A Calculated based on average shares outstanding during the period.
B Net investment income (loss) is affected by the timing of the declaration of dividends by any underlying mutual funds or exchange-traded funds (ETFs). Net investment income (loss) of any such underlying funds is not included in the Fund's net investment income (loss) ratio.
C Amount includes a reimbursement from the investment adviser for an operational error which amounted to less than $.01 per share. Excluding this reimbursement, the total return would have been 0.79%.
D Total returns would have been lower if certain expenses had not been reduced during the applicable periods shown.
E Total returns do not include the effect of the sales charges.
F Fees and expenses of any underlying mutual funds or exchange-traded funds (ETFs) are not included in the Fund's expense ratio. The Fund indirectly bears its proportionate share of these expenses. For additional expense information related to investments in Fidelity Central Funds, please refer to the "Investments in Fidelity Central Funds" note found in the Notes to Financial Statements section of the most recent Annual or Semi-Annual report.
G Expense ratios reflect operating expenses of the class. Expenses before reductions do not reflect amounts reimbursed, waived, or reduced through arrangements with the investment adviser, brokerage services, or other offset arrangements, if applicable, and do not represent the amount paid by the class during periods when reimbursements, waivers or reductions occur.
H On certain classes, the size and fluctuation of net assets and expense amounts may cause ratios to differ from contractual rates.
I Amount does not include the portfolio activity of any underlying mutual funds or exchange-traded funds (ETFs).
See accompanying notes which are an integral part of the financial statements.
Fidelity Advisor Freedom Income Fund Class C
| Years ended March 31, | 2022 | 2021 | 2020 | 2019 | 2018 |
| Selected Per–Share Data | | | | | |
| Net asset value, beginning of period | $11.43 | $10.47 | $10.73 | $10.98 | $10.91 |
| Income from Investment Operations | | | | | |
| Net investment income (loss)A,B | .15 | .01 | .10 | .12 | .07 |
| Net realized and unrealized gain (loss) | (.33) | 1.29 | (.06)C | .12 | .33 |
| Total from investment operations | (.18) | 1.30 | .04 | .24 | .40 |
| Distributions from net investment income | (.20) | (.04) | (.10) | (.11) | (.07) |
| Distributions from net realized gain | (.34) | (.30) | (.20) | (.38) | (.26) |
| Total distributions | (.53)D | (.34) | (.30) | (.49) | (.33) |
| Net asset value, end of period | $10.72 | $11.43 | $10.47 | $10.73 | $10.98 |
| Total ReturnE,F | (1.75)% | 12.49% | .30%C | 2.35% | 3.69% |
| Ratios to Average Net AssetsB,G,H | | | | | |
| Expenses before reductions | 1.47% | 1.47% | 1.46%I | 1.46%I | 1.39% |
| Expenses net of fee waivers, if any | 1.47% | 1.47% | 1.46%I | 1.46%B,I | 1.39% |
| Expenses net of all reductions | 1.47% | 1.46% | 1.46%I | 1.46%I | 1.39% |
| Net investment income (loss) | 1.36% | .05% | .89% | 1.09% | .63% |
| Supplemental Data | | | | | |
| Net assets, end of period (000 omitted) | $6,378 | $8,255 | $7,918 | $8,915 | $13,727 |
| Portfolio turnover rateJ | 47% | 29% | 25% | 36% | 21% |
A Calculated based on average shares outstanding during the period.
B Net investment income (loss) is affected by the timing of the declaration of dividends by any underlying mutual funds or exchange-traded funds (ETFs). Net investment income (loss) of any such underlying funds is not included in the Fund's net investment income (loss) ratio.
C Amount includes a reimbursement from the investment adviser for an operational error which amounted to less than $.01 per share. Excluding this reimbursement, the total return would have been 0.19%.
D Total distributions per share do not sum due to rounding.
E Total returns would have been lower if certain expenses had not been reduced during the applicable periods shown.
F Total returns do not include the effect of the contingent deferred sales charge.
G Fees and expenses of any underlying mutual funds or exchange-traded funds (ETFs) are not included in the Fund's expense ratio. The Fund indirectly bears its proportionate share of these expenses. For additional expense information related to investments in Fidelity Central Funds, please refer to the "Investments in Fidelity Central Funds" note found in the Notes to Financial Statements section of the most recent Annual or Semi-Annual report.
H Expense ratios reflect operating expenses of the class. Expenses before reductions do not reflect amounts reimbursed, waived, or reduced through arrangements with the investment adviser, brokerage services, or other offset arrangements, if applicable, and do not represent the amount paid by the class during periods when reimbursements, waivers or reductions occur.
I On certain classes, the size and fluctuation of net assets and expense amounts may cause ratios to differ from contractual rates.
J Amount does not include the portfolio activity of any underlying mutual funds or exchange-traded funds (ETFs).
See accompanying notes which are an integral part of the financial statements.
Fidelity Advisor Freedom Income Fund Class I
| Years ended March 31, | 2022 | 2021 | 2020 | 2019 | 2018 |
| Selected Per–Share Data | | | | | |
| Net asset value, beginning of period | $11.53 | $10.53 | $10.79 | $11.05 | $10.98 |
| Income from Investment Operations | | | | | |
| Net investment income (loss)A,B | .27 | .12 | .21 | .23 | .18 |
| Net realized and unrealized gain (loss) | (.34) | 1.31 | (.06)C | .11 | .33 |
| Total from investment operations | (.07) | 1.43 | .15 | .34 | .51 |
| Distributions from net investment income | (.26) | (.13) | (.21) | (.22) | (.18) |
| Distributions from net realized gain | (.34) | (.30) | (.20) | (.38) | (.26) |
| Total distributions | (.60) | (.43) | (.41) | (.60) | (.44) |
| Net asset value, end of period | $10.86 | $11.53 | $10.53 | $10.79 | $11.05 |
| Total ReturnD | (.80)% | 13.72% | 1.30%C | 3.30% | 4.70% |
| Ratios to Average Net AssetsB,E,F | | | | | |
| Expenses before reductions | .46%G | .46%G | .47% | .46%G | .39% |
| Expenses net of fee waivers, if any | .46%G | .46%G | .47% | .46%G | .39% |
| Expenses net of all reductions | .46%G | .46%G | .47% | .46%G | .39% |
| Net investment income (loss) | 2.36% | 1.05% | 1.89% | 2.09% | 1.63% |
| Supplemental Data | | | | | |
| Net assets, end of period (000 omitted) | $79,536 | $87,775 | $83,215 | $82,975 | $83,723 |
| Portfolio turnover rateH | 47% | 29% | 25% | 36% | 21% |
A Calculated based on average shares outstanding during the period.
B Net investment income (loss) is affected by the timing of the declaration of dividends by any underlying mutual funds or exchange-traded funds (ETFs). Net investment income (loss) of any such underlying funds is not included in the Fund's net investment income (loss) ratio.
C Amount includes a reimbursement from the investment adviser for an operational error which amounted to less than $.01 per share. Excluding this reimbursement, the total return would have been 1.19%.
D Total returns would have been lower if certain expenses had not been reduced during the applicable periods shown.
E Fees and expenses of any underlying mutual funds or exchange-traded funds (ETFs) are not included in the Fund's expense ratio. The Fund indirectly bears its proportionate share of these expenses. For additional expense information related to investments in Fidelity Central Funds, please refer to the "Investments in Fidelity Central Funds" note found in the Notes to Financial Statements section of the most recent Annual or Semi-Annual report.
F Expense ratios reflect operating expenses of the class. Expenses before reductions do not reflect amounts reimbursed, waived, or reduced through arrangements with the investment adviser, brokerage services, or other offset arrangements, if applicable, and do not represent the amount paid by the class during periods when reimbursements, waivers or reductions occur.
G On certain classes, the size and fluctuation of net assets and expense amounts may cause ratios to differ from contractual rates.
H Amount does not include the portfolio activity of any underlying mutual funds or exchange-traded funds (ETFs).
See accompanying notes which are an integral part of the financial statements.
Fidelity Advisor Freedom Income Fund Class Z
| Years ended March 31, | 2022 | 2021 | 2020 | 2019 A |
| Selected Per–Share Data | | | | |
| Net asset value, beginning of period | $11.52 | $10.53 | $10.79 | $10.91 |
| Income from Investment Operations | | | | |
| Net investment income (loss)B,C | .28 | .12 | .21 | .24 |
| Net realized and unrealized gain (loss) | (.34) | 1.31 | (.05)D | .01 |
| Total from investment operations | (.06) | 1.43 | .16 | .25 |
| Distributions from net investment income | (.27) | (.14) | (.22) | (.15) |
| Distributions from net realized gain | (.34) | (.30) | (.20) | (.22) |
| Total distributions | (.61) | (.44) | (.42) | (.37) |
| Net asset value, end of period | $10.85 | $11.52 | $10.53 | $10.79 |
| Total ReturnE,F | (.75)% | 13.72% | 1.36%D | 2.47% |
| Ratios to Average Net AssetsC,G,H | | | | |
| Expenses before reductions | .41%I | .42% | .42% | .42%J |
| Expenses net of fee waivers, if any | .41%I | .42% | .42% | .42%J |
| Expenses net of all reductions | .41%I | .42% | .42% | .42%J |
| Net investment income (loss) | 2.41% | 1.10% | 1.94% | 4.60%J |
| Supplemental Data | | | | |
| Net assets, end of period (000 omitted) | $7,064 | $8,919 | $3,128 | $765 |
| Portfolio turnover rateK | 47% | 29% | 25% | 36% |
A For the period October 2, 2018 (commencement of sale of shares) through March 31, 2019.
B Calculated based on average shares outstanding during the period.
C Net investment income (loss) is affected by the timing of the declaration of dividends by any underlying mutual funds or exchange-traded funds (ETFs). Net investment income (loss) of any such underlying funds is not included in the Fund's net investment income (loss) ratio.
D Amount includes a reimbursement from the investment adviser for an operational error which amounted to less than $.01 per share. Excluding this reimbursement, the total return would have been 1.25%.
E Total returns for periods of less than one year are not annualized.
F Total returns would have been lower if certain expenses had not been reduced during the applicable periods shown.
G Fees and expenses of any underlying mutual funds or exchange-traded funds (ETFs) are not included in the Fund's expense ratio. The Fund indirectly bears its proportionate share of these expenses. For additional expense information related to investments in Fidelity Central Funds, please refer to the "Investments in Fidelity Central Funds" note found in the Notes to Financial Statements section of the most recent Annual or Semi-Annual report.
H Expense ratios reflect operating expenses of the class. Expenses before reductions do not reflect amounts reimbursed, waived, or reduced through arrangements with the investment adviser, brokerage services, or other offset arrangements, if applicable, and do not represent the amount paid by the class during periods when reimbursements, waivers or reductions occur.
I On certain classes, the size and fluctuation of net assets and expense amounts may cause ratios to differ from contractual rates.
J Annualized
K Amount does not include the portfolio activity of any underlying mutual funds or exchange-traded funds (ETFs).
See accompanying notes which are an integral part of the financial statements.
Fidelity Advisor Freedom Income Fund Class Z6
| Years ended March 31, | 2022 | 2021 | 2020 | 2019 | 2018 A |
| Selected Per–Share Data | | | | | |
| Net asset value, beginning of period | $11.52 | $10.52 | $10.78 | $11.04 | $11.09 |
| Income from Investment Operations | | | | | |
| Net investment income (loss)B,C | .28 | .13 | .22 | .23 | .27 |
| Net realized and unrealized gain (loss) | (.34) | 1.31 | (.06)D | .13 | .03 |
| Total from investment operations | (.06) | 1.44 | .16 | .36 | .30 |
| Distributions from net investment income | (.27) | (.14) | (.22) | (.24) | (.16) |
| Distributions from net realized gain | (.34) | (.30) | (.20) | (.38) | (.19) |
| Total distributions | (.61) | (.44) | (.42) | (.62) | (.35) |
| Net asset value, end of period | $10.85 | $11.52 | $10.52 | $10.78 | $11.04 |
| Total ReturnE,F | (.71)% | 13.87% | 1.38%D | 3.48% | 2.69% |
| Ratios to Average Net AssetsC,G,H | | | | | |
| Expenses before reductions | .36%I | .37% | .36%I | .37% | .37%J |
| Expenses net of fee waivers, if any | .36%I | .37% | .36%I | .37% | .37%J |
| Expenses net of all reductions | .36%I | .37% | .36%I | .37% | .37%J |
| Net investment income (loss) | 2.46% | 1.15% | 1.99% | 2.19% | 2.92%J |
| Supplemental Data | | | | | |
| Net assets, end of period (000 omitted) | $13,984 | $23,587 | $21,248 | $25,022 | $1,693 |
| Portfolio turnover rateK | 47% | 29% | 25% | 36% | 21% |
A For the period June 6, 2017 (commencement of sale of shares) through March 31, 2018.
B Calculated based on average shares outstanding during the period.
C Net investment income (loss) is affected by the timing of the declaration of dividends by any underlying mutual funds or exchange-traded funds (ETFs). Net investment income (loss) of any such underlying funds is not included in the Fund's net investment income (loss) ratio.
D Amount includes a reimbursement from the investment adviser for an operational error which amounted to less than $.01 per share. Excluding this reimbursement, the total return would have been 1.27%.
E Total returns for periods of less than one year are not annualized.
F Total returns would have been lower if certain expenses had not been reduced during the applicable periods shown.
G Fees and expenses of any underlying mutual funds or exchange-traded funds (ETFs) are not included in the Fund's expense ratio. The Fund indirectly bears its proportionate share of these expenses. For additional expense information related to investments in Fidelity Central Funds, please refer to the "Investments in Fidelity Central Funds" note found in the Notes to Financial Statements section of the most recent Annual or Semi-Annual report.
H Expense ratios reflect operating expenses of the class. Expenses before reductions do not reflect amounts reimbursed, waived, or reduced through arrangements with the investment adviser, brokerage services, or other offset arrangements, if applicable, and do not represent the amount paid by the class during periods when reimbursements, waivers or reductions occur.
I On certain classes, the size and fluctuation of net assets and expense amounts may cause ratios to differ from contractual rates.
J Annualized
K Amount does not include the portfolio activity of any underlying mutual funds or exchange-traded funds (ETFs).
See accompanying notes which are an integral part of the financial statements.
Fidelity Advisor Freedom® 2005 Fund
Investment Summary (Unaudited)
The information in the following tables is based on the direct investments of the Fund.
Top Holdings as of March 31, 2022
| | % of fund's net assets |
| Fidelity Series Investment Grade Bond Fund | 38.6 |
| Fidelity Series 0-5 Year Inflation-Protected Bond Index Fund | 14.6 |
| Fidelity Series Government Money Market Fund 0.31% | 9.4 |
| Fidelity Series Emerging Markets Opportunities Fund | 5.7 |
| Fidelity Series Long-Term Treasury Bond Index Fund | 3.7 |
| Fidelity Series International Developed Markets Bond Index Fund | 3.0 |
| Fidelity Series Short-Term Credit Fund | 2.4 |
| Fidelity Series International Value Fund | 2.2 |
| Fidelity Series Overseas Fund | 2.2 |
| Fidelity Series International Growth Fund | 2.2 |
| | 84.0 |
Asset Allocation (% of fund's net assets)
| Period end |
| | Domestic Equity Funds | 9.3% |
| | International Equity Funds | 14.4% |
| | Bond Funds | 64.4% |
| | Short-Term Funds | 11.8% |
| | Short-Term Investments | 0.1% |

Domestic Equity Funds category includes Fidelity Series Commodity Strategy Fund which invests in commodity-related investments.
Fidelity Advisor Freedom® 2005 Fund
Schedule of Investments March 31, 2022
Showing Percentage of Net Assets
| U.S. Treasury Obligations - 0.1% | | | |
| | | Principal Amount | Value |
| U.S. Treasury Bills, yield at date of purchase 0.33% to 0.5% 6/2/22 to 6/23/22 (a) | | | |
| (Cost $59,957) | | 60,000 | 59,956 |
| | | Shares | Value |
|
| Domestic Equity Funds - 9.3% | | | |
| Fidelity Advisor Series Equity Growth Fund (b) | | 93,055 | $1,435,837 |
| Fidelity Advisor Series Growth Opportunities Fund (b) | | 80,507 | 984,605 |
| Fidelity Advisor Series Small Cap Fund (b) | | 50,172 | 651,729 |
| Fidelity Series All-Sector Equity Fund (b) | | 57,125 | 615,810 |
| Fidelity Series Commodity Strategy Fund (b) | | 414,542 | 2,118,309 |
| Fidelity Series Large Cap Stock Fund (b) | | 118,838 | 2,259,110 |
| Fidelity Series Large Cap Value Index Fund (b) | | 15,908 | 244,343 |
| Fidelity Series Opportunistic Insights Fund (b) | | 72,584 | 1,326,831 |
| Fidelity Series Small Cap Opportunities Fund (b) | | 59,080 | 804,665 |
| Fidelity Series Stock Selector Large Cap Value Fund (b) | | 106,420 | 1,441,992 |
| Fidelity Series Value Discovery Fund (b) | | 91,793 | 1,468,683 |
| TOTAL DOMESTIC EQUITY FUNDS | | | |
| (Cost $9,374,872) | | | 13,351,914 |
|
| International Equity Funds - 14.4% | | | |
| Fidelity Series Canada Fund (b) | | 87,764 | 1,362,090 |
| Fidelity Series Emerging Markets Fund (b) | | 97,949 | 908,970 |
| Fidelity Series Emerging Markets Opportunities Fund (b) | | 445,082 | 8,189,517 |
| Fidelity Series International Growth Fund (b) | | 187,543 | 3,109,470 |
| Fidelity Series International Small Cap Fund (b) | | 47,510 | 852,805 |
| Fidelity Series International Value Fund (b) | | 284,772 | 3,141,037 |
| Fidelity Series Overseas Fund (b) | | 247,771 | 3,126,870 |
| TOTAL INTERNATIONAL EQUITY FUNDS | | | |
| (Cost $16,261,501) | | | 20,690,759 |
|
| Bond Funds - 64.4% | | | |
| Fidelity Series 0-5 Year Inflation-Protected Bond Index Fund (b) | | 2,084,506 | 20,907,595 |
| Fidelity Series 5+ Year Inflation-Protected Bond Index Fund (b) | | 107,434 | 1,031,370 |
| Fidelity Series Emerging Markets Debt Fund (b) | | 88,643 | 731,304 |
| Fidelity Series Emerging Markets Debt Local Currency Fund (b) | | 26,826 | 241,705 |
| Fidelity Series Floating Rate High Income Fund (b) | | 15,783 | 145,049 |
| Fidelity Series High Income Fund (b) | | 94,503 | 859,033 |
| Fidelity Series Inflation-Protected Bond Index Fund (b) | | 268,723 | 2,727,543 |
| Fidelity Series International Credit Fund (b) | | 13,187 | 122,111 |
| Fidelity Series International Developed Markets Bond Index Fund (b) | | 470,343 | 4,388,303 |
| Fidelity Series Investment Grade Bond Fund (b) | | 5,077,181 | 55,392,046 |
| Fidelity Series Long-Term Treasury Bond Index Fund (b) | | 702,306 | 5,351,573 |
| Fidelity Series Real Estate Income Fund (b) | | 45,975 | 522,278 |
| TOTAL BOND FUNDS | | | |
| (Cost $93,120,968) | | | 92,419,910 |
|
| Short-Term Funds - 11.8% | | | |
| Fidelity Cash Central Fund 0.31% (c) | | 55,803 | 55,815 |
| Fidelity Series Government Money Market Fund 0.31% (b)(d) | | 13,492,074 | 13,492,074 |
| Fidelity Series Short-Term Credit Fund (b) | | 346,601 | 3,379,362 |
| TOTAL SHORT-TERM FUNDS | | | |
| (Cost $16,986,017) | | | 16,927,251 |
| TOTAL INVESTMENT IN SECURITIES - 100.0% | | | |
| (Cost $135,803,315) | | | 143,449,790 |
| NET OTHER ASSETS (LIABILITIES) - 0.0% | | | (22,693) |
| NET ASSETS - 100% | | | $143,427,097 |
| Futures Contracts | | | | | |
| | Number of contracts | Expiration Date | Notional Amount | Value | Unrealized Appreciation/(Depreciation) |
| Purchased | | | | | |
| Equity Index Contracts | | | | | |
| ICE E-mini MSCI EAFE Index Contracts (United States) | 3 | June 2022 | $321,660 | $18,286 | $18,286 |
| ICE E-mini MSCI Emerging Markets Index Contracts (United States) | 7 | June 2022 | 393,925 | 25,405 | 25,405 |
|
| TOTAL PURCHASED | | | | | 43,691 |
|
| Sold | | | | | |
| Equity Index Contracts | | | | | |
| CME Micro E-mini S&P 500 Index Contracts (United States) | 3 | June 2022 | 679,613 | (2,522) | (2,522) |
| TOTAL FUTURES CONTRACTS | | | | | $41,169 |
The notional amount of futures purchased as a percentage of Net Assets is 0.5%
The notional amount of futures sold as a percentage of Net Assets is 0.5%
Legend
(a) Security or a portion of the security was pledged to cover margin requirements for futures contracts. At period end, the value of securities pledged amounted to $59,956.
(b) Affiliated Fund
(c) Affiliated fund that is generally available only to investment companies and other accounts managed by Fidelity Investments. The rate quoted is the annualized seven-day yield of the fund at period end. A complete unaudited listing of the fund's holdings as of its most recent quarter end is available upon request. In addition, each Fidelity Central Fund's financial statements, which are not covered by the Fund's Report of Independent Registered Public Accounting Firm, are available on the SEC's website or upon request.
(d) The rate quoted is the annualized seven-day yield of the fund at period end.
Affiliated Central Funds
Fiscal year to date information regarding the Fund's investments in Fidelity Central Funds, including the ownership percentage, is presented below.
| Fund | Value, beginning of period | Purchases(a) | Sales Proceeds(a) | Dividend Income | Realized Gain/Loss | Change in Unrealized appreciation (depreciation) | Value, end of period | % ownership, end of period |
| Fidelity Cash Central Fund 0.31% | $101,141 | $211,843 | $257,169 | $53 | $-- | $-- | $55,815 | 0.0% |
| Total | $101,141 | $211,843 | $257,169 | $53 | $-- | $-- | $55,815 | |
(a) Includes the value of shares purchased or redeemed through in-kind transactions, if applicable.
Amounts in the income column in the above table include any capital gain distributions from underlying funds, which are presented in the corresponding line-item in the Statement of Operations, if applicable.
Affiliated Underlying Funds
Fiscal year to date information regarding the Fund's investments in affiliated Underlying Funds is presented below. Exchanges between classes of the same affiliated Underlying Funds may occur. If an underlying Fund changes its name, the name presented below is the name in effect at period end.
| Fund | Value, beginning of period | Purchases(a) | Sales Proceeds(a) | Dividend Income | Realized Gain (loss) | Change in Unrealized appreciation (depreciation) | Value, end of period |
| Fidelity Advisor Series Equity Growth Fund | $1,878,960 | $717,590 | $1,113,452 | $287,956 | $187,291 | $(234,552) | $1,435,837 |
| Fidelity Advisor Series Growth Opportunities Fund | 1,306,902 | 679,669 | 721,811 | 267,499 | 60,966 | (341,121) | 984,605 |
| Fidelity Advisor Series Small Cap Fund | 849,799 | 304,754 | 415,306 | 133,945 | 84,483 | (172,001) | 651,729 |
| Fidelity Series 0-5 Year Inflation-Protected Bond Index Fund | -- | 22,419,790 | 1,462,592 | 78,780 | (1,327) | (36,487) | 20,907,595 |
| Fidelity Series 5+ Year Inflation-Protected Bond Index Fund | -- | 4,390,511 | 3,295,216 | 15,061 | (51,345) | (12,580) | 1,031,370 |
| Fidelity Series All-Sector Equity Fund | 803,031 | 244,931 | 399,896 | 131,801 | 46,049 | (78,305) | 615,810 |
| Fidelity Series Canada Fund | 1,017,716 | 512,378 | 402,746 | 29,105 | 21,373 | 213,369 | 1,362,090 |
| Fidelity Series Commodity Strategy Fund | 4,459,065 | 1,717,910 | 4,257,804 | 1,300,860 | (44,712) | 243,850 | 2,118,309 |
| Fidelity Series Emerging Markets Debt Fund | 864,462 | 156,013 | 217,206 | 37,778 | (15,263) | (56,702) | 731,304 |
| Fidelity Series Emerging Markets Debt Local Currency Fund | 281,687 | 60,451 | 73,133 | 10,394 | (1,311) | (25,989) | 241,705 |
| Fidelity Series Emerging Markets Fund | 1,217,255 | 342,573 | 438,169 | 31,674 | 39,679 | (252,368) | 908,970 |
| Fidelity Series Emerging Markets Opportunities Fund | 11,206,901 | 4,102,334 | 4,337,728 | 1,029,941 | 602,963 | (3,384,953) | 8,189,517 |
| Fidelity Series Floating Rate High Income Fund | 174,502 | 22,692 | 52,335 | 6,972 | (2,279) | 2,469 | 145,049 |
| Fidelity Series Government Money Market Fund 0.31% | 28,478,789 | 3,485,786 | 18,472,501 | 19,725 | -- | -- | 13,492,074 |
| Fidelity Series High Income Fund | 1,026,935 | 149,351 | 290,475 | 52,290 | 15,182 | (41,960) | 859,033 |
| Fidelity Series Inflation-Protected Bond Index Fund | 18,251,059 | 2,126,565 | 17,725,391 | 734,392 | 1,549,444 | (1,474,134) | 2,727,543 |
| Fidelity Series International Credit Fund | 127,451 | 4,114 | -- | 4,113 | -- | (9,454) | 122,111 |
| Fidelity Series International Developed Markets Bond Index Fund | -- | 4,904,329 | 320,677 | 1,483 | (4,914) | (190,435) | 4,388,303 |
| Fidelity Series International Growth Fund | 2,851,868 | 1,719,217 | 1,176,137 | 270,781 | 57,751 | (343,229) | 3,109,470 |
| Fidelity Series International Small Cap Fund | 903,607 | 384,768 | 300,339 | 124,319 | 29,635 | (164,866) | 852,805 |
| Fidelity Series International Value Fund | 2,848,685 | 1,569,630 | 1,327,087 | 169,849 | 53,230 | (3,421) | 3,141,037 |
| Fidelity Series Investment Grade Bond Fund | 60,169,198 | 11,729,750 | 13,505,838 | 1,315,935 | (51,955) | (2,949,109) | 55,392,046 |
| Fidelity Series Large Cap Stock Fund | 2,932,570 | 596,080 | 1,377,074 | 242,469 | 288,634 | (181,100) | 2,259,110 |
| Fidelity Series Large Cap Value Index Fund | 316,487 | 48,959 | 137,487 | 17,897 | 29,515 | (13,131) | 244,343 |
| Fidelity Series Long-Term Treasury Bond Index Fund | 4,382,053 | 2,719,977 | 1,635,711 | 108,902 | (79,167) | (35,579) | 5,351,573 |
| Fidelity Series Opportunistic Insights Fund | 1,741,831 | 664,221 | 993,192 | 279,659 | 252,846 | (338,875) | 1,326,831 |
| Fidelity Series Overseas Fund | 2,856,670 | 1,527,577 | 1,241,775 | 100,645 | 72,898 | (88,500) | 3,126,870 |
| Fidelity Series Real Estate Income Fund | 618,163 | 78,680 | 194,045 | 22,824 | 15,693 | 3,787 | 522,278 |
| Fidelity Series Short-Term Credit Fund | 5,989,828 | 1,132,789 | 3,551,739 | 95,825 | (6,540) | (184,976) | 3,379,362 |
| Fidelity Series Small Cap Opportunities Fund | 1,048,760 | 448,958 | 491,782 | 237,707 | 111,996 | (313,267) | 804,665 |
| Fidelity Series Stock Selector Large Cap Value Fund | 1,857,092 | 507,689 | 878,448 | 280,064 | 119,050 | (163,391) | 1,441,992 |
| Fidelity Series Value Discovery Fund | 1,901,163 | 425,778 | 898,716 | 186,344 | 175,053 | (134,595) | 1,468,683 |
| | $162,362,489 | $69,895,814 | $81,705,808 | $7,626,989 | $3,554,918 | $(10,761,605) | $143,334,019 |
(a) Includes the value of shares purchased or redeemed through in-kind transactions, if applicable.
Amounts in the income column in the above table include any capital gain distributions from underlying funds, which are presented in the corresponding line-item in the Statement of Operations, if applicable.
Investment Valuation
The following is a summary of the inputs used, as of March 31, 2022, involving the Fund's assets and liabilities carried at fair value. The inputs or methodology used for valuing securities may not be an indication of the risk associated with investing in those securities. For more information on valuation inputs, and their aggregation into the levels used below, please refer to the Investment Valuation section in the accompanying Notes to Financial Statements.
| | Valuation Inputs at Reporting Date: |
| Description | Total | Level 1 | Level 2 | Level 3 |
| Investments in Securities: | | | | |
| Other Short-Term Investments and Net Other Assets | $59,956 | $-- | $59,956 | $-- |
| Domestic Equity Funds | 13,351,914 | 13,351,914 | -- | -- |
| International Equity Funds | 20,690,759 | 20,690,759 | -- | -- |
| Bond Funds | 92,419,910 | 92,419,910 | -- | -- |
| Short-Term Funds | 16,927,251 | 16,927,251 | -- | -- |
| Total Investments in Securities: | $143,449,790 | $143,389,834 | $59,956 | $-- |
| Derivative Instruments: | | | | |
| Assets | | | | |
| Futures Contracts | $43,691 | $43,691 | $-- | $-- |
| Total Assets | $43,691 | $43,691 | $-- | $-- |
| Liabilities | | | | |
| Futures Contracts | $(2,522) | $(2,522) | $-- | $-- |
| Total Liabilities | $(2,522) | $(2,522) | $-- | $-- |
| Total Derivative Instruments: | $41,169 | $41,169 | $-- | $-- |
Value of Derivative Instruments
The following table is a summary of the Fund's value of derivative instruments by primary risk exposure as of March 31, 2022. For additional information on derivative instruments, please refer to the Derivative Instruments section in the accompanying Notes to Financial Statements.
| Primary Risk Exposure / Derivative Type | Value |
| | Asset | Liability |
| Equity Risk | | |
| Futures Contracts(a) | $43,691 | $(2,522) |
| Total Equity Risk | 43,691 | (2,522) |
| Total Value of Derivatives | $43,691 | $(2,522) |
(a) Reflects gross cumulative appreciation (depreciation) on futures contracts as presented in the Schedule of Investments. In the Statement of Assets and Liabilities, the period end daily variation margin is included in receivable or payable for daily variation margin on futures contracts, and the net cumulative appreciation (depreciation) is included in Total accumulated earnings (loss).
See accompanying notes which are an integral part of the financial statements.
Fidelity Advisor Freedom® 2005 Fund
Financial Statements
Statement of Assets and Liabilities
| | | March 31, 2022 |
| Assets | | |
Investment in securities, at value — See accompanying schedule:
Unaffiliated issuers (cost $59,957) | $59,956 | |
| Fidelity Central Funds (cost $55,815) | 55,815 | |
| Other affiliated issuers (cost $135,687,543) | 143,334,019 | |
| Total Investment in Securities (cost $135,803,315) | | $143,449,790 |
| Cash | | 9,115 |
| Receivable for investments sold | | 4,225,344 |
| Receivable for fund shares sold | | 73,895 |
| Distributions receivable from Fidelity Central Funds | | 7 |
| Total assets | | 147,758,151 |
| Liabilities | | |
| Payable for investments purchased | $4,187,207 | |
| Payable for fund shares redeemed | 59,687 | |
| Accrued management fee | 55,176 | |
| Distribution and service plan fees payable | 22,994 | |
| Payable for daily variation margin on futures contracts | 5,990 | |
| Total liabilities | | 4,331,054 |
| Net Assets | | $143,427,097 |
| Net Assets consist of: | | |
| Paid in capital | | $132,532,362 |
| Total accumulated earnings (loss) | | 10,894,735 |
| Net Assets | | $143,427,097 |
| Net Asset Value and Maximum Offering Price | | |
| Class A: | | |
| Net Asset Value and redemption price per share ($64,023,371 ÷ 5,781,096 shares)(a) | | $11.07 |
| Maximum offering price per share (100/94.25 of $11.07) | | $11.75 |
| Class M: | | |
| Net Asset Value and redemption price per share ($20,759,640 ÷ 1,878,167 shares)(a) | | $11.05 |
| Maximum offering price per share (100/96.50 of $11.05) | | $11.45 |
| Class C: | | |
| Net Asset Value and offering price per share ($1,051,465 ÷ 94,818 shares)(a) | | $11.09 |
| Class I: | | |
| Net Asset Value, offering price and redemption price per share ($45,985,840 ÷ 4,118,878 shares) | | $11.16 |
| Class Z: | | |
| Net Asset Value, offering price and redemption price per share ($5,884,901 ÷ 530,780 shares) | | $11.09 |
| Class Z6: | | |
| Net Asset Value, offering price and redemption price per share ($5,721,880 ÷ 514,875 shares) | | $11.11 |
(a) Redemption price per share is equal to net asset value less any applicable contingent deferred sales charge.
See accompanying notes which are an integral part of the financial statements.
Statement of Operations
| | | Year ended March 31, 2022 |
| Investment Income | | |
| Dividends: | | |
| Affiliated issuers | | $4,349,139 |
| Interest | | 25 |
| Income from Fidelity Central Funds | | 53 |
| Total income | | 4,349,217 |
| Expenses | | |
| Management fee | $718,656 | |
| Distribution and service plan fees | 298,242 | |
| Independent trustees' fees and expenses | 481 | |
| Total expenses before reductions | 1,017,379 | |
| Expense reductions | (8) | |
| Total expenses after reductions | | 1,017,371 |
| Net investment income (loss) | | 3,331,846 |
| Realized and Unrealized Gain (Loss) | | |
| Net realized gain (loss) on: | | |
| Investment securities: | | |
| Unaffiliated issuers | (30) | |
| Affiliated issuers | 3,554,918 | |
| Futures contracts | 10,398 | |
| Capital gain distributions from underlying funds: | | |
| Affiliated issuers | 3,277,850 | |
| Total net realized gain (loss) | | 6,843,136 |
| Change in net unrealized appreciation (depreciation) on: | | |
| Investment securities: | | |
| Unaffiliated issuers | (3) | |
| Affiliated issuers | (10,761,605) | |
| Futures contracts | 41,169 | |
| Total change in net unrealized appreciation (depreciation) | | (10,720,439) |
| Net gain (loss) | | (3,877,303) |
| Net increase (decrease) in net assets resulting from operations | | $(545,457) |
See accompanying notes which are an integral part of the financial statements.
Statement of Changes in Net Assets
| | Year ended March 31, 2022 | Year ended March 31, 2021 |
| Increase (Decrease) in Net Assets | | |
| Operations | | |
| Net investment income (loss) | $3,331,846 | $1,406,859 |
| Net realized gain (loss) | 6,843,136 | 7,950,064 |
| Change in net unrealized appreciation (depreciation) | (10,720,439) | 14,938,139 |
| Net increase (decrease) in net assets resulting from operations | (545,457) | 24,295,062 |
| Distributions to shareholders | (10,944,435) | (8,287,216) |
| Share transactions - net increase (decrease) | (7,545,903) | (4,182,799) |
| Total increase (decrease) in net assets | (19,035,795) | 11,825,047 |
| Net Assets | | |
| Beginning of period | 162,462,892 | 150,637,845 |
| End of period | $143,427,097 | $162,462,892 |
See accompanying notes which are an integral part of the financial statements.
Financial Highlights
Fidelity Advisor Freedom 2005 Fund Class A
| Years ended March 31, | 2022 | 2021 | 2020 | 2019 | 2018 |
| Selected Per–Share Data | | | | | |
| Net asset value, beginning of period | $11.99 | $10.85 | $11.36 | $11.92 | $11.84 |
| Income from Investment Operations | | | | | |
| Net investment income (loss)A,B | .25 | .10 | .19 | .21 | .16 |
| Net realized and unrealized gain (loss) | (.33) | 1.64 | (.16) | .14 | .53 |
| Total from investment operations | (.08) | 1.74 | .03 | .35 | .69 |
| Distributions from net investment income | (.26) | (.11) | (.20) | (.22) | (.17) |
| Distributions from net realized gain | (.59) | (.49) | (.34) | (.68) | (.44) |
| Total distributions | (.84)C | (.60) | (.54) | (.91)C | (.61) |
| Net asset value, end of period | $11.07 | $11.99 | $10.85 | $11.36 | $11.92 |
| Total ReturnD,E | (.90)% | 16.31% | .04% | 3.24% | 5.87% |
| Ratios to Average Net AssetsB,F,G | | | | | |
| Expenses before reductions | .72% | .72% | .72% | .73% | .66% |
| Expenses net of fee waivers, if any | .72% | .72% | .72% | .73% | .66% |
| Expenses net of all reductions | .72% | .71% | .72% | .73% | .66% |
| Net investment income (loss) | 2.07% | .81% | 1.62% | 1.80% | 1.34% |
| Supplemental Data | | | | | |
| Net assets, end of period (000 omitted) | $64,023 | $76,060 | $74,103 | $86,981 | $101,642 |
| Portfolio turnover rateH | 45% | 31% | 28% | 28% | 20% |
A Calculated based on average shares outstanding during the period.
B Net investment income (loss) is affected by the timing of the declaration of dividends by any underlying mutual funds or exchange-traded funds (ETFs). Net investment income (loss) of any such underlying funds is not included in the Fund's net investment income (loss) ratio.
C Total distributions per share do not sum due to rounding.
D Total returns would have been lower if certain expenses had not been reduced during the applicable periods shown.
E Total returns do not include the effect of the sales charges.
F Fees and expenses of any underlying mutual funds or exchange-traded funds (ETFs) are not included in the Fund's expense ratio. The Fund indirectly bears its proportionate share of these expenses. For additional expense information related to investments in Fidelity Central Funds, please refer to the "Investments in Fidelity Central Funds" note found in the Notes to Financial Statements section of the most recent Annual or Semi-Annual report.
G Expense ratios reflect operating expenses of the class. Expenses before reductions do not reflect amounts reimbursed, waived, or reduced through arrangements with the investment adviser, brokerage services, or other offset arrangements, if applicable, and do not represent the amount paid by the class during periods when reimbursements, waivers or reductions occur.
H Amount does not include the portfolio activity of any underlying mutual funds or exchange-traded funds (ETFs).
See accompanying notes which are an integral part of the financial statements.
Fidelity Advisor Freedom 2005 Fund Class M
| Years ended March 31, | 2022 | 2021 | 2020 | 2019 | 2018 |
| Selected Per–Share Data | | | | | |
| Net asset value, beginning of period | $11.97 | $10.83 | $11.35 | $11.91 | $11.83 |
| Income from Investment Operations | | | | | |
| Net investment income (loss)A,B | .22 | .07 | .16 | .18 | .13 |
| Net realized and unrealized gain (loss) | (.32) | 1.64 | (.17) | .14 | .53 |
| Total from investment operations | (.10) | 1.71 | (.01) | .32 | .66 |
| Distributions from net investment income | (.23) | (.08) | (.17) | (.19) | (.14) |
| Distributions from net realized gain | (.59) | (.49) | (.34) | (.68) | (.44) |
| Total distributions | (.82) | (.57) | (.51) | (.88)C | (.58) |
| Net asset value, end of period | $11.05 | $11.97 | $10.83 | $11.35 | $11.91 |
| Total ReturnD,E | (1.13)% | 16.06% | (.31)% | 2.98% | 5.64% |
| Ratios to Average Net AssetsB,F,G | | | | | |
| Expenses before reductions | .96%H | .97% | .97% | .98% | .91% |
| Expenses net of fee waivers, if any | .96%H | .97% | .97% | .98% | .91% |
| Expenses net of all reductions | .96%H | .97% | .97% | .98% | .91% |
| Net investment income (loss) | 1.82% | .56% | 1.37% | 1.55% | 1.08% |
| Supplemental Data | | | | | |
| Net assets, end of period (000 omitted) | $20,760 | $21,606 | $22,480 | $24,132 | $25,730 |
| Portfolio turnover rateI | 45% | 31% | 28% | 28% | 20% |
A Calculated based on average shares outstanding during the period.
B Net investment income (loss) is affected by the timing of the declaration of dividends by any underlying mutual funds or exchange-traded funds (ETFs). Net investment income (loss) of any such underlying funds is not included in the Fund's net investment income (loss) ratio.
C Total distributions per share do not sum due to rounding.
D Total returns would have been lower if certain expenses had not been reduced during the applicable periods shown.
E Total returns do not include the effect of the sales charges.
F Fees and expenses of any underlying mutual funds or exchange-traded funds (ETFs) are not included in the Fund's expense ratio. The Fund indirectly bears its proportionate share of these expenses. For additional expense information related to investments in Fidelity Central Funds, please refer to the "Investments in Fidelity Central Funds" note found in the Notes to Financial Statements section of the most recent Annual or Semi-Annual report.
G Expense ratios reflect operating expenses of the class. Expenses before reductions do not reflect amounts reimbursed, waived, or reduced through arrangements with the investment adviser, brokerage services, or other offset arrangements, if applicable, and do not represent the amount paid by the class during periods when reimbursements, waivers or reductions occur.
H On certain classes, the size and fluctuation of net assets and expense amounts may cause ratios to differ from contractual rates.
I Amount does not include the portfolio activity of any underlying mutual funds or exchange-traded funds (ETFs).
See accompanying notes which are an integral part of the financial statements.
Fidelity Advisor Freedom 2005 Fund Class C
| Years ended March 31, | 2022 | 2021 | 2020 | 2019 | 2018 |
| Selected Per–Share Data | | | | | |
| Net asset value, beginning of period | $11.99 | $10.85 | $11.35 | $11.91 | $11.81 |
| Income from Investment Operations | | | | | |
| Net investment income (loss)A,B | .16 | .01 | .10 | .12 | .07 |
| Net realized and unrealized gain (loss) | (.32) | 1.64 | (.16) | .13 | .54 |
| Total from investment operations | (.16) | 1.65 | (.06) | .25 | .61 |
| Distributions from net investment income | (.16) | (.02) | (.10) | (.12) | (.07) |
| Distributions from net realized gain | (.59) | (.49) | (.34) | (.68) | (.44) |
| Total distributions | (.74)C | (.51) | (.44) | (.81)C | (.51) |
| Net asset value, end of period | $11.09 | $11.99 | $10.85 | $11.35 | $11.91 |
| Total ReturnD,E | (1.55)% | 15.42% | (.70)% | 2.35% | 5.21% |
| Ratios to Average Net AssetsB,F,G | | | | | |
| Expenses before reductions | 1.46%H | 1.47% | 1.47% | 1.48% | 1.41% |
| Expenses net of fee waivers, if any | 1.46%H | 1.47% | 1.47% | 1.48% | 1.41% |
| Expenses net of all reductions | 1.46%H | 1.47% | 1.47% | 1.48% | 1.41% |
| Net investment income (loss) | 1.32% | .06% | .87% | 1.05% | .58% |
| Supplemental Data | | | | | |
| Net assets, end of period (000 omitted) | $1,051 | $1,360 | $1,642 | $2,302 | $5,867 |
| Portfolio turnover rateI | 45% | 31% | 28% | 28% | 20% |
A Calculated based on average shares outstanding during the period.
B Net investment income (loss) is affected by the timing of the declaration of dividends by any underlying mutual funds or exchange-traded funds (ETFs). Net investment income (loss) of any such underlying funds is not included in the Fund's net investment income (loss) ratio.
C Total distributions per share do not sum due to rounding.
D Total returns would have been lower if certain expenses had not been reduced during the applicable periods shown.
E Total returns do not include the effect of the contingent deferred sales charge.
F Fees and expenses of any underlying mutual funds or exchange-traded funds (ETFs) are not included in the Fund's expense ratio. The Fund indirectly bears its proportionate share of these expenses. For additional expense information related to investments in Fidelity Central Funds, please refer to the "Investments in Fidelity Central Funds" note found in the Notes to Financial Statements section of the most recent Annual or Semi-Annual report.
G Expense ratios reflect operating expenses of the class. Expenses before reductions do not reflect amounts reimbursed, waived, or reduced through arrangements with the investment adviser, brokerage services, or other offset arrangements, if applicable, and do not represent the amount paid by the class during periods when reimbursements, waivers or reductions occur.
H On certain classes, the size and fluctuation of net assets and expense amounts may cause ratios to differ from contractual rates.
I Amount does not include the portfolio activity of any underlying mutual funds or exchange-traded funds (ETFs).
See accompanying notes which are an integral part of the financial statements.
Fidelity Advisor Freedom 2005 Fund Class I
| Years ended March 31, | 2022 | 2021 | 2020 | 2019 | 2018 |
| Selected Per–Share Data | | | | | |
| Net asset value, beginning of period | $12.08 | $10.93 | $11.45 | $12.00 | $11.92 |
| Income from Investment Operations | | | | | |
| Net investment income (loss)A,B | .28 | .13 | .22 | .24 | .19 |
| Net realized and unrealized gain (loss) | (.33) | 1.66 | (.17) | .14 | .54 |
| Total from investment operations | (.05) | 1.79 | .05 | .38 | .73 |
| Distributions from net investment income | (.29) | (.15) | (.23) | (.25) | (.20) |
| Distributions from net realized gain | (.59) | (.49) | (.34) | (.68) | (.44) |
| Total distributions | (.87)C | (.64) | (.57) | (.93) | (.65)C |
| Net asset value, end of period | $11.16 | $12.08 | $10.93 | $11.45 | $12.00 |
| Total ReturnD | (.64)% | 16.62% | .21% | 3.53% | 6.13% |
| Ratios to Average Net AssetsB,E,F | | | | | |
| Expenses before reductions | .46%G | .47% | .47% | .48% | .41% |
| Expenses net of fee waivers, if any | .46%G | .47% | .47% | .48% | .41% |
| Expenses net of all reductions | .46%G | .46% | .47% | .48% | .41% |
| Net investment income (loss) | 2.32% | 1.06% | 1.87% | 2.05% | 1.58% |
| Supplemental Data | | | | | |
| Net assets, end of period (000 omitted) | $45,986 | $54,932 | $46,911 | $49,013 | $59,386 |
| Portfolio turnover rateH | 45% | 31% | 28% | 28% | 20% |
A Calculated based on average shares outstanding during the period.
B Net investment income (loss) is affected by the timing of the declaration of dividends by any underlying mutual funds or exchange-traded funds (ETFs). Net investment income (loss) of any such underlying funds is not included in the Fund's net investment income (loss) ratio.
C Total distributions per share do not sum due to rounding.
D Total returns would have been lower if certain expenses had not been reduced during the applicable periods shown.
E Fees and expenses of any underlying mutual funds or exchange-traded funds (ETFs) are not included in the Fund's expense ratio. The Fund indirectly bears its proportionate share of these expenses. For additional expense information related to investments in Fidelity Central Funds, please refer to the "Investments in Fidelity Central Funds" note found in the Notes to Financial Statements section of the most recent Annual or Semi-Annual report.
F Expense ratios reflect operating expenses of the class. Expenses before reductions do not reflect amounts reimbursed, waived, or reduced through arrangements with the investment adviser, brokerage services, or other offset arrangements, if applicable, and do not represent the amount paid by the class during periods when reimbursements, waivers or reductions occur.
G On certain classes, the size and fluctuation of net assets and expense amounts may cause ratios to differ from contractual rates.
H Amount does not include the portfolio activity of any underlying mutual funds or exchange-traded funds (ETFs).
See accompanying notes which are an integral part of the financial statements.
Fidelity Advisor Freedom 2005 Fund Class Z
| Years ended March 31, | 2022 | 2021 | 2020 | 2019 A |
| Selected Per–Share Data | | | | |
| Net asset value, beginning of period | $12.01 | $10.88 | $11.41 | $11.84 |
| Income from Investment Operations | | | | |
| Net investment income (loss)B,C | .28 | .13 | .22 | .20 |
| Net realized and unrealized gain (loss) | (.31) | 1.64 | (.16) | .01 |
| Total from investment operations | (.03) | 1.77 | .06 | .21 |
| Distributions from net investment income | (.31) | (.15) | (.25) | (.26) |
| Distributions from net realized gain | (.59) | (.49) | (.34) | (.39) |
| Total distributions | (.89)D | (.64) | (.59) | (.64)D |
| Net asset value, end of period | $11.09 | $12.01 | $10.88 | $11.41 |
| Total ReturnE,F | (.48)% | 16.59% | .32% | 2.09% |
| Ratios to Average Net AssetsC,G,H | | | | |
| Expenses before reductions | .42% | .41%I | .42% | .43%J |
| Expenses net of fee waivers, if any | .42% | .41%I | .42% | .43%J |
| Expenses net of all reductions | .42% | .41%I | .42% | .43%J |
| Net investment income (loss) | 2.37% | 1.11% | 1.92% | 3.58%J |
| Supplemental Data | | | | |
| Net assets, end of period (000 omitted) | $5,885 | $4,101 | $2,851 | $126 |
| Portfolio turnover rateK | 45% | 31% | 28% | 28% |
A For the period October 2, 2018 (commencement of sale of shares) through March 31, 2019.
B Calculated based on average shares outstanding during the period.
C Net investment income (loss) is affected by the timing of the declaration of dividends by any underlying mutual funds or exchange-traded funds (ETFs). Net investment income (loss) of any such underlying funds is not included in the Fund's net investment income (loss) ratio.
D Total distributions per share do not sum due to rounding.
E Total returns for periods of less than one year are not annualized.
F Total returns would have been lower if certain expenses had not been reduced during the applicable periods shown.
G Fees and expenses of any underlying mutual funds or exchange-traded funds (ETFs) are not included in the Fund's expense ratio. The Fund indirectly bears its proportionate share of these expenses. For additional expense information related to investments in Fidelity Central Funds, please refer to the "Investments in Fidelity Central Funds" note found in the Notes to Financial Statements section of the most recent Annual or Semi-Annual report.
H Expense ratios reflect operating expenses of the class. Expenses before reductions do not reflect amounts reimbursed, waived, or reduced through arrangements with the investment adviser, brokerage services, or other offset arrangements, if applicable, and do not represent the amount paid by the class during periods when reimbursements, waivers or reductions occur.
I On certain classes, the size and fluctuation of net assets and expense amounts may cause ratios to differ from contractual rates.
J Annualized
K Amount does not include the portfolio activity of any underlying mutual funds or exchange-traded funds (ETFs).
See accompanying notes which are an integral part of the financial statements.
Fidelity Advisor Freedom 2005 Fund Class Z6
| Years ended March 31, | 2022 | 2021 | 2020 | 2019 | 2018 A |
| Selected Per–Share Data | | | | | |
| Net asset value, beginning of period | $12.04 | $10.90 | $11.42 | $12.00 | $12.04 |
| Income from Investment Operations | | | | | |
| Net investment income (loss)B,C | .29 | .14 | .23 | .25 | .13 |
| Net realized and unrealized gain (loss) | (.32) | 1.65 | (.16) | .13 | .33 |
| Total from investment operations | (.03) | 1.79 | .07 | .38 | .46 |
| Distributions from net investment income | (.31) | (.16) | (.25) | (.28) | (.19) |
| Distributions from net realized gain | (.59) | (.49) | (.34) | (.68) | (.31) |
| Total distributions | (.90) | (.65) | (.59) | (.96) | (.50) |
| Net asset value, end of period | $11.11 | $12.04 | $10.90 | $11.42 | $12.00 |
| Total ReturnD,E | (.52)% | 16.72% | .35% | 3.53% | 3.78% |
| Ratios to Average Net AssetsC,F,G | | | | | |
| Expenses before reductions | .36%H | .37% | .37% | .37% | .39%H,I |
| Expenses net of fee waivers, if any | .36%H | .37% | .37% | .37% | .39%H,I |
| Expenses net of all reductions | .36%H | .37% | .37% | .37% | .39%H,I |
| Net investment income (loss) | 2.42% | 1.16% | 1.97% | 2.16% | 1.30%I |
| Supplemental Data | | | | | |
| Net assets, end of period (000 omitted) | $5,722 | $4,404 | $2,652 | $1,849 | $1,408 |
| Portfolio turnover rateJ | 45% | 31% | 28% | 28% | 20% |
A For the period June 6, 2017 (commencement of sale of shares) through March 31, 2018.
B Calculated based on average shares outstanding during the period.
C Net investment income (loss) is affected by the timing of the declaration of dividends by any underlying mutual funds or exchange-traded funds (ETFs). Net investment income (loss) of any such underlying funds is not included in the Fund's net investment income (loss) ratio.
D Total returns for periods of less than one year are not annualized.
E Total returns would have been lower if certain expenses had not been reduced during the applicable periods shown.
F Fees and expenses of any underlying mutual funds or exchange-traded funds (ETFs) are not included in the Fund's expense ratio. The Fund indirectly bears its proportionate share of these expenses. For additional expense information related to investments in Fidelity Central Funds, please refer to the "Investments in Fidelity Central Funds" note found in the Notes to Financial Statements section of the most recent Annual or Semi-Annual report.
G Expense ratios reflect operating expenses of the class. Expenses before reductions do not reflect amounts reimbursed, waived, or reduced through arrangements with the investment adviser, brokerage services, or other offset arrangements, if applicable, and do not represent the amount paid by the class during periods when reimbursements, waivers or reductions occur.
H On certain classes, the size and fluctuation of net assets and expense amounts may cause ratios to differ from contractual rates.
I Annualized
J Amount does not include the portfolio activity of any underlying mutual funds or exchange-traded funds (ETFs).
See accompanying notes which are an integral part of the financial statements.
Fidelity Advisor Freedom® 2010 Fund
Investment Summary (Unaudited)
The information in the following tables is based on the direct investments of the Fund.
Top Holdings as of March 31, 2022
| | % of fund's net assets |
| Fidelity Series Investment Grade Bond Fund | 35.1 |
| Fidelity Series 0-5 Year Inflation-Protected Bond Index Fund | 10.1 |
| Fidelity Series Government Money Market Fund 0.31% | 7.0 |
| Fidelity Series Emerging Markets Opportunities Fund | 6.6 |
| Fidelity Series Long-Term Treasury Bond Index Fund | 3.9 |
| Fidelity Series International Developed Markets Bond Index Fund | 3.1 |
| Fidelity Series International Value Fund | 2.9 |
| Fidelity Series Overseas Fund | 2.9 |
| Fidelity Series International Growth Fund | 2.9 |
| Fidelity Series 5+ Year Inflation-Protected Bond Index Fund | 2.8 |
| | 77.3 |
Asset Allocation (% of fund's net assets)
| Period end |
| | Domestic Equity Funds | 14.7% |
| | International Equity Funds | 18.0% |
| | Bond Funds | 58.5% |
| | Short-Term Funds | 8.8% |

Domestic Equity Funds category includes Fidelity Series Commodity Strategy Fund which invests in commodity-related investments.
Fidelity Advisor Freedom® 2010 Fund
Schedule of Investments March 31, 2022
Showing Percentage of Net Assets
| U.S. Treasury Obligations - 0.0% | | | |
| | | Principal Amount | Value |
| U.S. Treasury Bills, yield at date of purchase 0.18% to 0.36% 4/28/22 to 6/9/22 (a) | | | |
| (Cost $119,930) | | 120,000 | 119,930 |
| | | Shares | Value |
|
| Domestic Equity Funds - 14.7% | | | |
| Fidelity Advisor Series Equity Growth Fund (b) | | 364,760 | $5,628,251 |
| Fidelity Advisor Series Growth Opportunities Fund (b) | | 315,588 | 3,859,646 |
| Fidelity Advisor Series Small Cap Fund (b) | | 196,665 | 2,554,673 |
| Fidelity Series All-Sector Equity Fund (b) | | 223,929 | 2,413,957 |
| Fidelity Series Commodity Strategy Fund (b) | | 967,744 | 4,945,170 |
| Fidelity Series Large Cap Stock Fund (b) | | 465,840 | 8,855,618 |
| Fidelity Series Large Cap Value Index Fund (b) | | 62,357 | 957,808 |
| Fidelity Series Opportunistic Insights Fund (b) | | 284,526 | 5,201,135 |
| Fidelity Series Small Cap Opportunities Fund (b) | | 231,583 | 3,154,164 |
| Fidelity Series Stock Selector Large Cap Value Fund (b) | | 417,156 | 5,652,465 |
| Fidelity Series Value Discovery Fund (b) | | 359,825 | 5,757,199 |
| TOTAL DOMESTIC EQUITY FUNDS | | | |
| (Cost $34,868,372) | | | 48,980,086 |
|
| International Equity Funds - 18.0% | | | |
| Fidelity Series Canada Fund (b) | | 268,147 | 4,161,643 |
| Fidelity Series Emerging Markets Fund (b) | | 264,904 | 2,458,307 |
| Fidelity Series Emerging Markets Opportunities Fund (b) | | 1,203,767 | 22,149,317 |
| Fidelity Series International Growth Fund (b) | | 576,005 | 9,550,160 |
| Fidelity Series International Small Cap Fund (b) | | 147,123 | 2,640,861 |
| Fidelity Series International Value Fund (b) | | 874,566 | 9,646,462 |
| Fidelity Series Overseas Fund (b) | | 760,956 | 9,603,263 |
| TOTAL INTERNATIONAL EQUITY FUNDS | | | |
| (Cost $47,390,863) | | | 60,210,013 |
|
| Bond Funds - 58.5% | | | |
| Fidelity Series 0-5 Year Inflation-Protected Bond Index Fund (b) | | 3,369,042 | 33,791,489 |
| Fidelity Series 5+ Year Inflation-Protected Bond Index Fund (b) | | 983,796 | 9,444,444 |
| Fidelity Series Emerging Markets Debt Fund (b) | | 205,246 | 1,693,283 |
| Fidelity Series Emerging Markets Debt Local Currency Fund (b) | | 62,486 | 563,000 |
| Fidelity Series Floating Rate High Income Fund (b) | | 36,847 | 338,625 |
| Fidelity Series High Income Fund (b) | | 220,618 | 2,005,415 |
| Fidelity Series Inflation-Protected Bond Index Fund (b) | | 528,999 | 5,369,336 |
| Fidelity Series International Credit Fund (b) | | 31,691 | 293,461 |
| Fidelity Series International Developed Markets Bond Index Fund (b) | | 1,098,488 | 10,248,891 |
| Fidelity Series Investment Grade Bond Fund (b) | | 10,764,484 | 117,440,520 |
| Fidelity Series Long-Term Treasury Bond Index Fund (b) | | 1,725,413 | 13,147,649 |
| Fidelity Series Real Estate Income Fund (b) | | 106,883 | 1,214,196 |
| TOTAL BOND FUNDS | | | |
| (Cost $196,743,532) | | | 195,550,309 |
|
| Short-Term Funds - 8.8% | | | |
| Fidelity Cash Central Fund 0.31% (c) | | 121,962 | 121,986 |
| Fidelity Series Government Money Market Fund 0.31% (b)(d) | | 23,543,772 | 23,543,772 |
| Fidelity Series Short-Term Credit Fund (b) | | 604,834 | 5,897,136 |
| TOTAL SHORT-TERM FUNDS | | | |
| (Cost $29,669,991) | | | 29,562,894 |
| TOTAL INVESTMENT IN SECURITIES - 100.0% | | | |
| (Cost $308,792,688) | | | 334,423,232 |
| NET OTHER ASSETS (LIABILITIES) - 0.0% | | | (55,287) |
| NET ASSETS - 100% | | | $334,367,945 |
| Futures Contracts | | | | | |
| | Number of contracts | Expiration Date | Notional Amount | Value | Unrealized Appreciation/(Depreciation) |
| Purchased | | | | | |
| Equity Index Contracts | | | | | |
| ICE E-mini MSCI EAFE Index Contracts (United States) | 7 | June 2022 | $750,540 | $42,666 | $42,666 |
| ICE E-mini MSCI Emerging Markets Index Contracts (United States) | 16 | June 2022 | 900,400 | 50,340 | 50,340 |
|
| TOTAL PURCHASED | | | | | 93,006 |
|
| Sold | | | | | |
| Equity Index Contracts | | | | | |
| CME Micro E-mini S&P 500 Index Contracts (United States) | 7 | June 2022 | 1,585,763 | (5,775) | (5,775) |
| TOTAL FUTURES CONTRACTS | | | | | $87,231 |
The notional amount of futures purchased as a percentage of Net Assets is 0.5%
The notional amount of futures sold as a percentage of Net Assets is 0.5%
For the period, the average monthly notional amount at value for futures contracts in the aggregate was $502,213.
Legend
(a) Security or a portion of the security was pledged to cover margin requirements for futures contracts. At period end, the value of securities pledged amounted to $119,930.
(b) Affiliated Fund
(c) Affiliated fund that is generally available only to investment companies and other accounts managed by Fidelity Investments. The rate quoted is the annualized seven-day yield of the fund at period end. A complete unaudited listing of the fund's holdings as of its most recent quarter end is available upon request. In addition, each Fidelity Central Fund's financial statements, which are not covered by the Fund's Report of Independent Registered Public Accounting Firm, are available on the SEC's website or upon request.
(d) The rate quoted is the annualized seven-day yield of the fund at period end.
Affiliated Central Funds
Fiscal year to date information regarding the Fund's investments in Fidelity Central Funds, including the ownership percentage, is presented below.
| Fund | Value, beginning of period | Purchases(a) | Sales Proceeds(a) | Dividend Income | Realized Gain/Loss | Change in Unrealized appreciation (depreciation) | Value, end of period | % ownership, end of period |
| Fidelity Cash Central Fund 0.31% | $301,035 | $936,209 | $1,115,258 | $138 | $-- | $-- | $121,986 | 0.0% |
| Total | $301,035 | $936,209 | $1,115,258 | $138 | $-- | $-- | $121,986 | |
(a) Includes the value of shares purchased or redeemed through in-kind transactions, if applicable.
Amounts in the income column in the above table include any capital gain distributions from underlying funds, which are presented in the corresponding line-item in the Statement of Operations, if applicable.
Affiliated Underlying Funds
Fiscal year to date information regarding the Fund's investments in affiliated Underlying Funds is presented below. Exchanges between classes of the same affiliated Underlying Funds may occur. If an underlying Fund changes its name, the name presented below is the name in effect at period end.
| Fund | Value, beginning of period | Purchases(a) | Sales Proceeds(a) | Dividend Income | Realized Gain (loss) | Change in Unrealized appreciation (depreciation) | Value, end of period |
| Fidelity Advisor Series Equity Growth Fund | $6,955,716 | $2,335,669 | $3,445,968 | $1,102,516 | $609,397 | $(826,563) | $5,628,251 |
| Fidelity Advisor Series Growth Opportunities Fund | 4,838,055 | 2,310,820 | 2,193,171 | 1,024,223 | 138,778 | (1,234,836) | 3,859,646 |
| Fidelity Advisor Series Small Cap Fund | 3,145,999 | 986,025 | 1,232,417 | 512,911 | 274,497 | (619,431) | 2,554,673 |
| Fidelity Series 0-5 Year Inflation-Protected Bond Index Fund | -- | 35,286,418 | 1,412,590 | 126,998 | (698) | (62,733) | 33,791,489 |
| Fidelity Series 5+ Year Inflation-Protected Bond Index Fund | -- | 11,824,565 | 1,967,559 | 62,879 | (74,445) | (338,117) | 9,444,444 |
| Fidelity Series All-Sector Equity Fund | 2,972,883 | 777,151 | 1,199,767 | 505,547 | 149,508 | (285,818) | 2,413,957 |
| Fidelity Series Canada Fund | 3,264,391 | 1,166,424 | 1,002,066 | 88,907 | 66,427 | 666,467 | 4,161,643 |
| Fidelity Series Commodity Strategy Fund | 10,286,783 | 3,577,191 | 9,312,522 | 3,080,461 | (207,003) | 600,721 | 4,945,170 |
| Fidelity Series Emerging Markets Debt Fund | 1,979,856 | 277,125 | 395,623 | 87,907 | (26,954) | (141,121) | 1,693,283 |
| Fidelity Series Emerging Markets Debt Local Currency Fund | 648,406 | 109,877 | 131,190 | 24,245 | (3,019) | (61,074) | 563,000 |
| Fidelity Series Emerging Markets Fund | 3,241,054 | 714,609 | 917,323 | 86,927 | 95,630 | (675,663) | 2,458,307 |
| Fidelity Series Emerging Markets Opportunities Fund | 29,602,746 | 9,294,378 | 9,177,384 | 2,789,332 | 1,390,749 | (8,961,172) | 22,149,317 |
| Fidelity Series Floating Rate High Income Fund | 399,004 | 31,883 | 92,723 | 16,084 | (6,028) | 6,489 | 338,625 |
| Fidelity Series Government Money Market Fund 0.31% | 52,805,064 | 4,520,195 | 33,781,487 | 36,164 | -- | -- | 23,543,772 |
| Fidelity Series High Income Fund | 2,353,592 | 230,827 | 515,769 | 121,041 | (2,998) | (60,237) | 2,005,415 |
| Fidelity Series Inflation-Protected Bond Index Fund | 36,367,585 | 3,248,064 | 34,423,397 | 1,447,700 | 3,129,646 | (2,952,562) | 5,369,336 |
| Fidelity Series International Credit Fund | 306,295 | 9,885 | -- | 9,885 | -- | (22,719) | 293,461 |
| Fidelity Series International Developed Markets Bond Index Fund | -- | 11,150,373 | 449,469 | 3,500 | (6,285) | (445,728) | 10,248,891 |
| Fidelity Series International Growth Fund | 9,147,621 | 4,021,424 | 2,787,176 | 827,133 | 256,602 | (1,088,311) | 9,550,160 |
| Fidelity Series International Small Cap Fund | 2,898,565 | 787,923 | 645,654 | 378,259 | 100,464 | (500,437) | 2,640,861 |
| Fidelity Series International Value Fund | 9,137,455 | 3,662,043 | 3,329,044 | 518,894 | 178,413 | (2,405) | 9,646,462 |
| Fidelity Series Investment Grade Bond Fund | 125,794,262 | 19,480,223 | 21,464,386 | 2,780,139 | (141,553) | (6,228,026) | 117,440,520 |
| Fidelity Series Large Cap Stock Fund | 10,857,265 | 1,910,688 | 4,290,924 | 925,880 | 926,248 | (547,659) | 8,855,618 |
| Fidelity Series Large Cap Value Index Fund | 1,171,779 | 132,644 | 406,488 | 69,059 | 96,847 | (36,974) | 957,808 |
| Fidelity Series Long-Term Treasury Bond Index Fund | 10,135,877 | 6,422,376 | 3,081,014 | 258,154 | (176,496) | (153,094) | 13,147,649 |
| Fidelity Series Opportunistic Insights Fund | 6,448,205 | 2,187,268 | 3,069,938 | 1,069,938 | 859,512 | (1,223,912) | 5,201,135 |
| Fidelity Series Overseas Fund | 9,162,964 | 3,460,218 | 3,013,658 | 306,568 | 310,813 | (317,074) | 9,603,263 |
| Fidelity Series Real Estate Income Fund | 1,424,794 | 105,544 | 360,859 | 53,168 | 35,273 | 9,444 | 1,214,196 |
| Fidelity Series Short-Term Credit Fund | 11,073,148 | 1,617,610 | 6,446,754 | 176,946 | (13,468) | (333,400) | 5,897,136 |
| Fidelity Series Small Cap Opportunities Fund | 3,882,584 | 1,532,365 | 1,472,790 | 919,603 | 229,237 | (1,017,232) | 3,154,164 |
| Fidelity Series Stock Selector Large Cap Value Fund | 6,875,823 | 1,603,240 | 2,634,136 | 1,081,296 | 360,294 | (552,756) | 5,652,465 |
| Fidelity Series Value Discovery Fund | 7,038,805 | 1,288,207 | 2,704,932 | 718,689 | 537,324 | (402,205) | 5,757,199 |
| | $374,216,576 | $136,063,252 | $157,358,178 | $21,210,953 | $9,086,712 | $(27,808,138) | $334,181,316 |
(a) Includes the value of shares purchased or redeemed through in-kind transactions, if applicable.
Amounts in the income column in the above table include any capital gain distributions from underlying funds, which are presented in the corresponding line-item in the Statement of Operations, if applicable.
Investment Valuation
The following is a summary of the inputs used, as of March 31, 2022, involving the Fund's assets and liabilities carried at fair value. The inputs or methodology used for valuing securities may not be an indication of the risk associated with investing in those securities. For more information on valuation inputs, and their aggregation into the levels used below, please refer to the Investment Valuation section in the accompanying Notes to Financial Statements.
| | Valuation Inputs at Reporting Date: |
| Description | Total | Level 1 | Level 2 | Level 3 |
| Investments in Securities: | | | | |
| Other Short-Term Investments and Net Other Assets | $119,930 | $-- | $119,930 | $-- |
| Domestic Equity Funds | 48,980,086 | 48,980,086 | -- | -- |
| International Equity Funds | 60,210,013 | 60,210,013 | -- | -- |
| Bond Funds | 195,550,309 | 195,550,309 | -- | -- |
| Short-Term Funds | 29,562,894 | 29,562,894 | -- | -- |
| Total Investments in Securities: | $334,423,232 | $334,303,302 | $119,930 | $-- |
| Derivative Instruments: | | | | |
| Assets | | | | |
| Futures Contracts | $93,006 | $93,006 | $-- | $-- |
| Total Assets | $93,006 | $93,006 | $-- | $-- |
| Liabilities | | | | |
| Futures Contracts | $(5,775) | $(5,775) | $-- | $-- |
| Total Liabilities | $(5,775) | $(5,775) | $-- | $-- |
| Total Derivative Instruments: | $87,231 | $87,231 | $-- | $-- |
Value of Derivative Instruments
The following table is a summary of the Fund's value of derivative instruments by primary risk exposure as of March 31, 2022. For additional information on derivative instruments, please refer to the Derivative Instruments section in the accompanying Notes to Financial Statements.
| Primary Risk Exposure / Derivative Type | Value |
| | Asset | Liability |
| Equity Risk | | |
| Futures Contracts(a) | $93,006 | $(5,775) |
| Total Equity Risk | 93,006 | (5,775) |
| Total Value of Derivatives | $93,006 | $(5,775) |
(a) Reflects gross cumulative appreciation (depreciation) on futures contracts as presented in the Schedule of Investments. In the Statement of Assets and Liabilities, the period end daily variation margin is included in receivable or payable for daily variation margin on futures contracts, and the net cumulative appreciation (depreciation) is included in Total accumulated earnings (loss).
See accompanying notes which are an integral part of the financial statements.
Fidelity Advisor Freedom® 2010 Fund
Financial Statements
Statement of Assets and Liabilities
| | | March 31, 2022 |
| Assets | | |
Investment in securities, at value — See accompanying schedule:
Unaffiliated issuers (cost $119,930) | $119,930 | |
| Fidelity Central Funds (cost $121,986) | 121,986 | |
| Other affiliated issuers (cost $308,550,772) | 334,181,316 | |
| Total Investment in Securities (cost $308,792,688) | | $334,423,232 |
| Cash | | 25,564 |
| Receivable for investments sold | | 8,395,358 |
| Receivable for fund shares sold | | 76,811 |
| Distributions receivable from Fidelity Central Funds | | 19 |
| Total assets | | 342,920,984 |
| Liabilities | | |
| Payable for investments purchased | $8,256,864 | |
| Payable for fund shares redeemed | 85,506 | |
| Accrued management fee | 136,455 | |
| Distribution and service plan fees payable | 57,494 | |
| Payable for daily variation margin on futures contracts | 16,720 | |
| Total liabilities | | 8,553,039 |
| Net Assets | | $334,367,945 |
| Net Assets consist of: | | |
| Paid in capital | | $298,631,609 |
| Total accumulated earnings (loss) | | 35,736,336 |
| Net Assets | | $334,367,945 |
| Net Asset Value and Maximum Offering Price | | |
| Class A: | | |
| Net Asset Value and redemption price per share ($137,046,091 ÷ 11,961,184 shares)(a) | | $11.46 |
| Maximum offering price per share (100/94.25 of $11.46) | | $12.16 |
| Class M: | | |
| Net Asset Value and redemption price per share ($60,633,290 ÷ 5,324,501 shares)(a) | | $11.39 |
| Maximum offering price per share (100/96.50 of $11.39) | | $11.80 |
| Class C: | | |
| Net Asset Value and offering price per share ($4,335,422 ÷ 382,455 shares)(a) | | $11.34 |
| Class I: | | |
| Net Asset Value, offering price and redemption price per share ($103,753,879 ÷ 9,019,143 shares) | | $11.50 |
| Class Z: | | |
| Net Asset Value, offering price and redemption price per share ($8,545,447 ÷ 748,043 shares) | | $11.42 |
| Class Z6: | | |
| Net Asset Value, offering price and redemption price per share ($20,053,816 ÷ 1,750,722 shares) | | $11.45 |
(a) Redemption price per share is equal to net asset value less any applicable contingent deferred sales charge.
See accompanying notes which are an integral part of the financial statements.
Statement of Operations
| | | Year ended March 31, 2022 |
| Investment Income | | |
| Dividends: | | |
| Affiliated issuers | | $10,232,788 |
| Interest | | 56 |
| Income from Fidelity Central Funds | | 138 |
| Total income | | 10,232,982 |
| Expenses | | |
| Management fee | $1,791,335 | |
| Distribution and service plan fees | 771,427 | |
| Independent trustees' fees and expenses | 1,121 | |
| Total expenses before reductions | 2,563,883 | |
| Expense reductions | (8) | |
| Total expenses after reductions | | 2,563,875 |
| Net investment income (loss) | | 7,669,107 |
| Realized and Unrealized Gain (Loss) | | |
| Net realized gain (loss) on: | | |
| Investment securities: | | |
| Unaffiliated issuers | 92 | |
| Affiliated issuers | 9,086,712 | |
| Futures contracts | 38,154 | |
| Capital gain distributions from underlying funds: | | |
| Affiliated issuers | 10,978,165 | |
| Total net realized gain (loss) | | 20,103,123 |
| Change in net unrealized appreciation (depreciation) on: | | |
| Investment securities: | | |
| Unaffiliated issuers | (4) | |
| Affiliated issuers | (27,808,138) | |
| Futures contracts | 87,231 | |
| Total change in net unrealized appreciation (depreciation) | | (27,720,911) |
| Net gain (loss) | | (7,617,788) |
| Net increase (decrease) in net assets resulting from operations | | $51,319 |
See accompanying notes which are an integral part of the financial statements.
Statement of Changes in Net Assets
| | Year ended March 31, 2022 | Year ended March 31, 2021 |
| Increase (Decrease) in Net Assets | | |
| Operations | | |
| Net investment income (loss) | $7,669,107 | $3,195,221 |
| Net realized gain (loss) | 20,103,123 | 23,322,163 |
| Change in net unrealized appreciation (depreciation) | (27,720,911) | 46,461,926 |
| Net increase (decrease) in net assets resulting from operations | 51,319 | 72,979,310 |
| Distributions to shareholders | (30,763,243) | (22,669,069) |
| Share transactions - net increase (decrease) | (9,416,963) | (33,837,760) |
| Total increase (decrease) in net assets | (40,128,887) | 16,472,481 |
| Net Assets | | |
| Beginning of period | 374,496,832 | 358,024,351 |
| End of period | $334,367,945 | $374,496,832 |
See accompanying notes which are an integral part of the financial statements.
Financial Highlights
Fidelity Advisor Freedom 2010 Fund Class A
| Years ended March 31, | 2022 | 2021 | 2020 | 2019 | 2018 |
| Selected Per–Share Data | | | | | |
| Net asset value, beginning of period | $12.53 | $10.97 | $11.78 | $12.42 | $12.34 |
| Income from Investment Operations | | | | | |
| Net investment income (loss)A,B | .25 | .10 | .19 | .21 | .16 |
| Net realized and unrealized gain (loss) | (.26) | 2.18 | (.31) | .15 | .72 |
| Total from investment operations | (.01) | 2.28 | (.12) | .36 | .88 |
| Distributions from net investment income | (.26) | (.11) | (.20) | (.21) | (.17) |
| Distributions from net realized gain | (.80) | (.61) | (.49) | (.79) | (.62) |
| Total distributions | (1.06) | (.72) | (.69) | (1.00) | (.80)C |
| Net asset value, end of period | $11.46 | $12.53 | $10.97 | $11.78 | $12.42 |
| Total ReturnD,E | (.41)% | 21.28% | (1.39)% | 3.28% | 7.18% |
| Ratios to Average Net AssetsB,F,G | | | | | |
| Expenses before reductions | .75% | .76% | .77% | .77%H | .69% |
| Expenses net of fee waivers, if any | .75% | .76% | .77% | .77%H | .69% |
| Expenses net of all reductions | .75% | .76% | .77% | .77%H | .69% |
| Net investment income (loss) | 2.06% | .81% | 1.56% | 1.75% | 1.29% |
| Supplemental Data | | | | | |
| Net assets, end of period (000 omitted) | $137,046 | $164,212 | $162,920 | $198,633 | $230,553 |
| Portfolio turnover rateI | 37% | 26% | 23% | 24% | 20% |
A Calculated based on average shares outstanding during the period.
B Net investment income (loss) is affected by the timing of the declaration of dividends by any underlying mutual funds or exchange-traded funds (ETFs). Net investment income (loss) of any such underlying funds is not included in the Fund's net investment income (loss) ratio.
C Total distributions per share do not sum due to rounding.
D Total returns would have been lower if certain expenses had not been reduced during the applicable periods shown.
E Total returns do not include the effect of the sales charges.
F Fees and expenses of any underlying mutual funds or exchange-traded funds (ETFs) are not included in the Fund's expense ratio. The Fund indirectly bears its proportionate share of these expenses. For additional expense information related to investments in Fidelity Central Funds, please refer to the "Investments in Fidelity Central Funds" note found in the Notes to Financial Statements section of the most recent Annual or Semi-Annual report.
G Expense ratios reflect operating expenses of the class. Expenses before reductions do not reflect amounts reimbursed, waived, or reduced through arrangements with the investment adviser, brokerage services, or other offset arrangements, if applicable, and do not represent the amount paid by the class during periods when reimbursements, waivers or reductions occur.
H On certain classes, the size and fluctuation of net assets and expense amounts may cause ratios to differ from contractual rates.
I Amount does not include the portfolio activity of any underlying mutual funds or exchange-traded funds (ETFs).
See accompanying notes which are an integral part of the financial statements.
Fidelity Advisor Freedom 2010 Fund Class M
| Years ended March 31, | 2022 | 2021 | 2020 | 2019 | 2018 |
| Selected Per–Share Data | | | | | |
| Net asset value, beginning of period | $12.46 | $10.92 | $11.73 | $12.37 | $12.30 |
| Income from Investment Operations | | | | | |
| Net investment income (loss)A,B | .22 | .07 | .15 | .18 | .13 |
| Net realized and unrealized gain (loss) | (.26) | 2.16 | (.30) | .15 | .71 |
| Total from investment operations | (.04) | 2.23 | (.15) | .33 | .84 |
| Distributions from net investment income | (.24) | (.09) | (.17) | (.18) | (.15) |
| Distributions from net realized gain | (.80) | (.61) | (.49) | (.79) | (.62) |
| Total distributions | (1.03)C | (.69)C | (.66) | (.97) | (.77) |
| Net asset value, end of period | $11.39 | $12.46 | $10.92 | $11.73 | $12.37 |
| Total ReturnD,E | (.63)% | 20.90% | (1.63)% | 3.06% | 6.89% |
| Ratios to Average Net AssetsB,F,G | | | | | |
| Expenses before reductions | 1.00% | 1.01% | 1.02% | 1.02%H | .94% |
| Expenses net of fee waivers, if any | 1.00% | 1.01% | 1.02% | 1.02%H | .94% |
| Expenses net of all reductions | 1.00% | 1.01% | 1.02% | 1.02%H | .94% |
| Net investment income (loss) | 1.81% | .56% | 1.31% | 1.50% | 1.03% |
| Supplemental Data | | | | | |
| Net assets, end of period (000 omitted) | $60,633 | $69,654 | $64,750 | $71,679 | $77,068 |
| Portfolio turnover rateI | 37% | 26% | 23% | 24% | 20% |
A Calculated based on average shares outstanding during the period.
B Net investment income (loss) is affected by the timing of the declaration of dividends by any underlying mutual funds or exchange-traded funds (ETFs). Net investment income (loss) of any such underlying funds is not included in the Fund's net investment income (loss) ratio.
C Total distributions per share do not sum due to rounding.
D Total returns would have been lower if certain expenses had not been reduced during the applicable periods shown.
E Total returns do not include the effect of the sales charges.
F Fees and expenses of any underlying mutual funds or exchange-traded funds (ETFs) are not included in the Fund's expense ratio. The Fund indirectly bears its proportionate share of these expenses. For additional expense information related to investments in Fidelity Central Funds, please refer to the "Investments in Fidelity Central Funds" note found in the Notes to Financial Statements section of the most recent Annual or Semi-Annual report.
G Expense ratios reflect operating expenses of the class. Expenses before reductions do not reflect amounts reimbursed, waived, or reduced through arrangements with the investment adviser, brokerage services, or other offset arrangements, if applicable, and do not represent the amount paid by the class during periods when reimbursements, waivers or reductions occur.
H On certain classes, the size and fluctuation of net assets and expense amounts may cause ratios to differ from contractual rates.
I Amount does not include the portfolio activity of any underlying mutual funds or exchange-traded funds (ETFs).
See accompanying notes which are an integral part of the financial statements.
Fidelity Advisor Freedom 2010 Fund Class C
| Years ended March 31, | 2022 | 2021 | 2020 | 2019 | 2018 |
| Selected Per–Share Data | | | | | |
| Net asset value, beginning of period | $12.42 | $10.87 | $11.66 | $12.29 | $12.22 |
| Income from Investment Operations | | | | | |
| Net investment income (loss)A,B | .16 | .01 | .10 | .12 | .07 |
| Net realized and unrealized gain (loss) | (.27) | 2.16 | (.30) | .14 | .70 |
| Total from investment operations | (.11) | 2.17 | (.20) | .26 | .77 |
| Distributions from net investment income | (.18) | (.02) | (.10) | (.11) | (.08) |
| Distributions from net realized gain | (.80) | (.60) | (.49) | (.78) | (.62) |
| Total distributions | (.97)C | (.62) | (.59) | (.89) | (.70) |
| Net asset value, end of period | $11.34 | $12.42 | $10.87 | $11.66 | $12.29 |
| Total ReturnD,E | (1.19)% | 20.36% | (2.02)% | 2.45% | 6.37% |
| Ratios to Average Net AssetsB,F,G | | | | | |
| Expenses before reductions | 1.50% | 1.51% | 1.51%H | 1.52%H | 1.44% |
| Expenses net of fee waivers, if any | 1.50% | 1.51% | 1.51%H | 1.52%H | 1.44% |
| Expenses net of all reductions | 1.50% | 1.51% | 1.51%H | 1.52%H | 1.44% |
| Net investment income (loss) | 1.31% | .06% | .81% | 1.00% | .54% |
| Supplemental Data | | | | | |
| Net assets, end of period (000 omitted) | $4,335 | $6,544 | $8,343 | $10,765 | $26,227 |
| Portfolio turnover rateI | 37% | 26% | 23% | 24% | 20% |
A Calculated based on average shares outstanding during the period.
B Net investment income (loss) is affected by the timing of the declaration of dividends by any underlying mutual funds or exchange-traded funds (ETFs). Net investment income (loss) of any such underlying funds is not included in the Fund's net investment income (loss) ratio.
C Total distributions per share do not sum due to rounding.
D Total returns would have been lower if certain expenses had not been reduced during the applicable periods shown.
E Total returns do not include the effect of the contingent deferred sales charge.
F Fees and expenses of any underlying mutual funds or exchange-traded funds (ETFs) are not included in the Fund's expense ratio. The Fund indirectly bears its proportionate share of these expenses. For additional expense information related to investments in Fidelity Central Funds, please refer to the "Investments in Fidelity Central Funds" note found in the Notes to Financial Statements section of the most recent Annual or Semi-Annual report.
G Expense ratios reflect operating expenses of the class. Expenses before reductions do not reflect amounts reimbursed, waived, or reduced through arrangements with the investment adviser, brokerage services, or other offset arrangements, if applicable, and do not represent the amount paid by the class during periods when reimbursements, waivers or reductions occur.
H On certain classes, the size and fluctuation of net assets and expense amounts may cause ratios to differ from contractual rates.
I Amount does not include the portfolio activity of any underlying mutual funds or exchange-traded funds (ETFs).
See accompanying notes which are an integral part of the financial statements.
Fidelity Advisor Freedom 2010 Fund Class I
| Years ended March 31, | 2022 | 2021 | 2020 | 2019 | 2018 |
| Selected Per–Share Data | | | | | |
| Net asset value, beginning of period | $12.58 | $11.02 | $11.82 | $12.47 | $12.40 |
| Income from Investment Operations | | | | | |
| Net investment income (loss)A,B | .29 | .13 | .22 | .24 | .19 |
| Net realized and unrealized gain (loss) | (.28) | 2.19 | (.30) | .14 | .72 |
| Total from investment operations | .01 | 2.32 | (.08) | .38 | .91 |
| Distributions from net investment income | (.30) | (.15) | (.23) | (.25) | (.21) |
| Distributions from net realized gain | (.80) | (.61) | (.49) | (.79) | (.62) |
| Total distributions | (1.09)C | (.76) | (.72) | (1.03)C | (.84)C |
| Net asset value, end of period | $11.50 | $12.58 | $11.02 | $11.82 | $12.47 |
| Total ReturnD | (.21)% | 21.50% | (1.04)% | 3.50% | 7.39% |
| Ratios to Average Net AssetsB,E,F | | | | | |
| Expenses before reductions | .50% | .51% | .52% | .52%G | .45% |
| Expenses net of fee waivers, if any | .50% | .51% | .52% | .52%G | .45% |
| Expenses net of all reductions | .50% | .51% | .52% | .52%G | .45% |
| Net investment income (loss) | 2.31% | 1.06% | 1.81% | 2.00% | 1.53% |
| Supplemental Data | | | | | |
| Net assets, end of period (000 omitted) | $103,754 | $114,929 | $107,764 | $131,896 | $137,019 |
| Portfolio turnover rateH | 37% | 26% | 23% | 24% | 20% |
A Calculated based on average shares outstanding during the period.
B Net investment income (loss) is affected by the timing of the declaration of dividends by any underlying mutual funds or exchange-traded funds (ETFs). Net investment income (loss) of any such underlying funds is not included in the Fund's net investment income (loss) ratio.
C Total distributions per share do not sum due to rounding.
D Total returns would have been lower if certain expenses had not been reduced during the applicable periods shown.
E Fees and expenses of any underlying mutual funds or exchange-traded funds (ETFs) are not included in the Fund's expense ratio. The Fund indirectly bears its proportionate share of these expenses. For additional expense information related to investments in Fidelity Central Funds, please refer to the "Investments in Fidelity Central Funds" note found in the Notes to Financial Statements section of the most recent Annual or Semi-Annual report.
F Expense ratios reflect operating expenses of the class. Expenses before reductions do not reflect amounts reimbursed, waived, or reduced through arrangements with the investment adviser, brokerage services, or other offset arrangements, if applicable, and do not represent the amount paid by the class during periods when reimbursements, waivers or reductions occur.
G On certain classes, the size and fluctuation of net assets and expense amounts may cause ratios to differ from contractual rates.
H Amount does not include the portfolio activity of any underlying mutual funds or exchange-traded funds (ETFs).
See accompanying notes which are an integral part of the financial statements.
Fidelity Advisor Freedom 2010 Fund Class Z
| Years ended March 31, | 2022 | 2021 | 2020 | 2019 A |
| Selected Per–Share Data | | | | |
| Net asset value, beginning of period | $12.51 | $10.95 | $11.78 | $12.30 |
| Income from Investment Operations | | | | |
| Net investment income (loss)B,C | .29 | .14 | .22 | .27 |
| Net realized and unrealized gain (loss) | (.27) | 2.18 | (.30) | (.11) |
| Total from investment operations | .02 | 2.32 | (.08) | .16 |
| Distributions from net investment income | (.31) | (.15) | (.26) | (.26) |
| Distributions from net realized gain | (.80) | (.61) | (.49) | (.42) |
| Total distributions | (1.11) | (.76) | (.75) | (.68) |
| Net asset value, end of period | $11.42 | $12.51 | $10.95 | $11.78 |
| Total ReturnD,E | (.20)% | 21.71% | (1.05)% | 1.65% |
| Ratios to Average Net AssetsC,F,G | | | | |
| Expenses before reductions | .44% | .45% | .46%H | .47%H,I |
| Expenses net of fee waivers, if any | .44% | .45% | .46%H | .47%H,I |
| Expenses net of all reductions | .44% | .45% | .46%H | .47%H,I |
| Net investment income (loss) | 2.37% | 1.12% | 1.87% | 4.58%I |
| Supplemental Data | | | | |
| Net assets, end of period (000 omitted) | $8,545 | $6,514 | $5,895 | $257 |
| Portfolio turnover rateJ | 37% | 26% | 23% | 24% |
A For the period October 2, 2018 (commencement of sale of shares) through March 31, 2019.
B Calculated based on average shares outstanding during the period.
C Net investment income (loss) is affected by the timing of the declaration of dividends by any underlying mutual funds or exchange-traded funds (ETFs). Net investment income (loss) of any such underlying funds is not included in the Fund's net investment income (loss) ratio.
D Total returns for periods of less than one year are not annualized.
E Total returns would have been lower if certain expenses had not been reduced during the applicable periods shown.
F Fees and expenses of any underlying mutual funds or exchange-traded funds (ETFs) are not included in the Fund's expense ratio. The Fund indirectly bears its proportionate share of these expenses. For additional expense information related to investments in Fidelity Central Funds, please refer to the "Investments in Fidelity Central Funds" note found in the Notes to Financial Statements section of the most recent Annual or Semi-Annual report.
G Expense ratios reflect operating expenses of the class. Expenses before reductions do not reflect amounts reimbursed, waived, or reduced through arrangements with the investment adviser, brokerage services, or other offset arrangements, if applicable, and do not represent the amount paid by the class during periods when reimbursements, waivers or reductions occur.
H On certain classes, the size and fluctuation of net assets and expense amounts may cause ratios to differ from contractual rates.
I Annualized
J Amount does not include the portfolio activity of any underlying mutual funds or exchange-traded funds (ETFs).
See accompanying notes which are an integral part of the financial statements.
Fidelity Advisor Freedom 2010 Fund Class Z6
| Years ended March 31, | 2022 | 2021 | 2020 | 2019 | 2018 A |
| Selected Per–Share Data | | | | | |
| Net asset value, beginning of period | $12.54 | $10.99 | $11.81 | $12.47 | $12.50 |
| Income from Investment Operations | | | | | |
| Net investment income (loss)B,C | .30 | .14 | .23 | .25 | .05 |
| Net realized and unrealized gain (loss) | (.27) | 2.19 | (.31) | .15 | .53 |
| Total from investment operations | .03 | 2.33 | (.08) | .40 | .58 |
| Distributions from net investment income | (.32) | (.17) | (.26) | (.27) | (.20) |
| Distributions from net realized gain | (.80) | (.61) | (.49) | (.79) | (.42) |
| Total distributions | (1.12) | (.78) | (.74)D | (1.06) | (.61)D |
| Net asset value, end of period | $11.45 | $12.54 | $10.99 | $11.81 | $12.47 |
| Total ReturnE,F | (.10)% | 21.67% | (1.01)% | 3.66% | 4.62% |
| Ratios to Average Net AssetsC,G,H | | | | | |
| Expenses before reductions | .38% | .38% | .39% | .39% | .41%I,J |
| Expenses net of fee waivers, if any | .38% | .38% | .39% | .39% | .41%I,J |
| Expenses net of all reductions | .38% | .38% | .39% | .39% | .41%I,J |
| Net investment income (loss) | 2.43% | 1.18% | 1.94% | 2.13% | .45%I |
| Supplemental Data | | | | | |
| Net assets, end of period (000 omitted) | $20,054 | $12,643 | $8,352 | $6,566 | $4,744 |
| Portfolio turnover rateK | 37% | 26% | 23% | 24% | 20% |
A For the period June 6, 2017 (commencement of sale of shares) through March 31, 2018.
B Calculated based on average shares outstanding during the period.
C Net investment income (loss) is affected by the timing of the declaration of dividends by any underlying mutual funds or exchange-traded funds (ETFs). Net investment income (loss) of any such underlying funds is not included in the Fund's net investment income (loss) ratio.
D Total distributions per share do not sum due to rounding.
E Total returns for periods of less than one year are not annualized.
F Total returns would have been lower if certain expenses had not been reduced during the applicable periods shown.
G Fees and expenses of any underlying mutual funds or exchange-traded funds (ETFs) are not included in the Fund's expense ratio. The Fund indirectly bears its proportionate share of these expenses. For additional expense information related to investments in Fidelity Central Funds, please refer to the "Investments in Fidelity Central Funds" note found in the Notes to Financial Statements section of the most recent Annual or Semi-Annual report.
H Expense ratios reflect operating expenses of the class. Expenses before reductions do not reflect amounts reimbursed, waived, or reduced through arrangements with the investment adviser, brokerage services, or other offset arrangements, if applicable, and do not represent the amount paid by the class during periods when reimbursements, waivers or reductions occur.
I Annualized
J On certain classes, the size and fluctuation of net assets and expense amounts may cause ratios to differ from contractual rates.
K Amount does not include the portfolio activity of any underlying mutual funds or exchange-traded funds (ETFs).
See accompanying notes which are an integral part of the financial statements.
Fidelity Advisor Freedom® 2015 Fund
Investment Summary (Unaudited)
The information in the following tables is based on the direct investments of the Fund.
Top Holdings as of March 31, 2022
| | % of fund's net assets |
| Fidelity Series Investment Grade Bond Fund | 31.6 |
| Fidelity Series Emerging Markets Opportunities Fund | 7.6 |
| Fidelity Series 0-5 Year Inflation-Protected Bond Index Fund | 5.6 |
| Fidelity Series 5+ Year Inflation-Protected Bond Index Fund | 4.9 |
| Fidelity Series Government Money Market Fund 0.31% | 4.5 |
| Fidelity Series Long-Term Treasury Bond Index Fund | 4.1 |
| Fidelity Series Large Cap Stock Fund | 3.8 |
| Fidelity Series International Value Fund | 3.6 |
| Fidelity Series Overseas Fund | 3.6 |
| Fidelity Series International Growth Fund | 3.6 |
| | 72.9 |
Asset Allocation (% of fund's net assets)
| Period end |
| | Domestic Equity Funds | 20.1% |
| | International Equity Funds | 21.7% |
| | Bond Funds | 52.5% |
| | Short-Term Funds | 5.7% |

Domestic Equity Funds category includes Fidelity Series Commodity Strategy Fund which invests in commodity-related investments.
Fidelity Advisor Freedom® 2015 Fund
Schedule of Investments March 31, 2022
Showing Percentage of Net Assets
| U.S. Treasury Obligations - 0.0% | | | |
| | | Principal Amount | Value |
| U.S. Treasury Bills, yield at date of purchase 0.18% to 0.38% 4/28/22 to 6/9/22 (a) | | | |
| (Cost $289,838) | | 290,000 | 289,837 |
| | | Shares | Value |
|
| Domestic Equity Funds - 20.1% | | | |
| Fidelity Advisor Series Equity Growth Fund (b) | | 1,107,628 | $17,090,705 |
| Fidelity Advisor Series Growth Opportunities Fund (b) | | 958,349 | 11,720,610 |
| Fidelity Advisor Series Small Cap Fund (b) | | 597,193 | 7,757,541 |
| Fidelity Series All-Sector Equity Fund (b) | | 679,995 | 7,330,350 |
| Fidelity Series Commodity Strategy Fund (b) | | 2,078,943 | 10,623,401 |
| Fidelity Series Large Cap Stock Fund (b) | | 1,414,610 | 26,891,734 |
| Fidelity Series Large Cap Value Index Fund (b) | | 189,357 | 2,908,521 |
| Fidelity Series Opportunistic Insights Fund (b) | | 864,010 | 15,794,099 |
| Fidelity Series Small Cap Opportunities Fund (b) | | 703,225 | 9,577,921 |
| Fidelity Series Stock Selector Large Cap Value Fund (b) | | 1,266,749 | 17,164,449 |
| Fidelity Series Value Discovery Fund (b) | | 1,092,667 | 17,482,673 |
| TOTAL DOMESTIC EQUITY FUNDS | | | |
| (Cost $100,717,601) | | | 144,342,004 |
|
| International Equity Funds - 21.7% | | | |
| Fidelity Series Canada Fund (b) | | 716,048 | 11,113,065 |
| Fidelity Series Emerging Markets Fund (b) | | 648,464 | 6,017,747 |
| Fidelity Series Emerging Markets Opportunities Fund (b) | | 2,946,912 | 54,223,177 |
| Fidelity Series International Growth Fund (b) | | 1,540,070 | 25,534,360 |
| Fidelity Series International Small Cap Fund (b) | | 394,124 | 7,074,526 |
| Fidelity Series International Value Fund (b) | | 2,338,267 | 25,791,086 |
| Fidelity Series Overseas Fund (b) | | 2,034,576 | 25,676,347 |
| TOTAL INTERNATIONAL EQUITY FUNDS | | | |
| (Cost $116,431,317) | | | 155,430,308 |
|
| Bond Funds - 52.5% | | | |
| Fidelity Series 0-5 Year Inflation-Protected Bond Index Fund (b) | | 4,027,364 | 40,394,461 |
| Fidelity Series 5+ Year Inflation-Protected Bond Index Fund (b) | | 3,632,760 | 34,874,501 |
| Fidelity Series Emerging Markets Debt Fund (b) | | 439,595 | 3,626,658 |
| Fidelity Series Emerging Markets Debt Local Currency Fund (b) | | 133,840 | 1,205,895 |
| Fidelity Series Floating Rate High Income Fund (b) | | 79,164 | 727,513 |
| Fidelity Series High Income Fund (b) | | 473,993 | 4,308,592 |
| Fidelity Series Inflation-Protected Bond Index Fund (b) | | 946,196 | 9,603,893 |
| Fidelity Series International Credit Fund (b) | | 75,431 | 698,487 |
| Fidelity Series International Developed Markets Bond Index Fund (b) | | 2,362,798 | 22,044,901 |
| Fidelity Series Investment Grade Bond Fund (b) | | 20,766,942 | 226,567,329 |
| Fidelity Series Long-Term Treasury Bond Index Fund (b) | | 3,890,700 | 29,647,133 |
| Fidelity Series Real Estate Income Fund (b) | | 229,028 | 2,601,759 |
| TOTAL BOND FUNDS | | | |
| (Cost $378,540,404) | | | 376,301,122 |
|
| Short-Term Funds - 5.7% | | | |
| Fidelity Cash Central Fund 0.31% (c) | | 391,991 | 392,069 |
| Fidelity Series Government Money Market Fund 0.31% (b)(d) | | 32,567,120 | 32,567,120 |
| Fidelity Series Short-Term Credit Fund (b) | | 836,690 | 8,157,727 |
| TOTAL SHORT-TERM FUNDS | | | |
| (Cost $41,277,919) | | | 41,116,916 |
| TOTAL INVESTMENT IN SECURITIES - 100.0% | | | |
| (Cost $637,257,079) | | | 717,480,187 |
| NET OTHER ASSETS (LIABILITIES) - 0.0% | | | (184,832) |
| NET ASSETS - 100% | | | $717,295,355 |
| Futures Contracts | | | | | |
| | Number of contracts | Expiration Date | Notional Amount | Value | Unrealized Appreciation/(Depreciation) |
| Purchased | | | | | |
| Equity Index Contracts | | | | | |
| ICE E-mini MSCI EAFE Index Contracts (United States) | 15 | June 2022 | $1,608,300 | $90,670 | $90,670 |
| ICE E-mini MSCI Emerging Markets Index Contracts (United States) | 37 | June 2022 | 2,082,175 | 104,737 | 104,737 |
|
| TOTAL PURCHASED | | | | | 195,407 |
|
| Sold | | | | | |
| Equity Index Contracts | | | | | |
| CME Micro E-mini S&P 500 Index Contracts (United States) | 16 | June 2022 | 3,624,600 | (3,037) | (3,037) |
| TOTAL FUTURES CONTRACTS | | | | | $192,370 |
The notional amount of futures purchased as a percentage of Net Assets is 0.5%
The notional amount of futures sold as a percentage of Net Assets is 0.5%
Legend
(a) Security or a portion of the security was pledged to cover margin requirements for futures contracts. At period end, the value of securities pledged amounted to $289,837.
(b) Affiliated Fund
(c) Affiliated fund that is generally available only to investment companies and other accounts managed by Fidelity Investments. The rate quoted is the annualized seven-day yield of the fund at period end. A complete unaudited listing of the fund's holdings as of its most recent quarter end is available upon request. In addition, each Fidelity Central Fund's financial statements, which are not covered by the Fund's Report of Independent Registered Public Accounting Firm, are available on the SEC's website or upon request.
(d) The rate quoted is the annualized seven-day yield of the fund at period end.
Affiliated Central Funds
Fiscal year to date information regarding the Fund's investments in Fidelity Central Funds, including the ownership percentage, is presented below.
| Fund | Value, beginning of period | Purchases(a) | Sales Proceeds(a) | Dividend Income | Realized Gain/Loss | Change in Unrealized appreciation (depreciation) | Value, end of period | % ownership, end of period |
| Fidelity Cash Central Fund 0.31% | $763,958 | $2,421,389 | $2,793,277 | $343 | $-- | $(1) | $392,069 | 0.0% |
| Total | $763,958 | $2,421,389 | $2,793,277 | $343 | $-- | $(1) | $392,069 | |
(a) Includes the value of shares purchased or redeemed through in-kind transactions, if applicable.
Amounts in the income column in the above table include any capital gain distributions from underlying funds, which are presented in the corresponding line-item in the Statement of Operations, if applicable.
Affiliated Underlying Funds
Fiscal year to date information regarding the Fund's investments in affiliated Underlying Funds is presented below. Exchanges between classes of the same affiliated Underlying Funds may occur. If an underlying Fund changes its name, the name presented below is the name in effect at period end.
| Fund | Value, beginning of period | Purchases(a) | Sales Proceeds(a) | Dividend Income | Realized Gain (loss) | Change in Unrealized appreciation (depreciation) | Value, end of period |
| Fidelity Advisor Series Equity Growth Fund | $21,685,695 | $6,604,305 | $10,542,167 | $3,391,872 | $1,719,439 | $(2,376,567) | $17,090,705 |
| Fidelity Advisor Series Growth Opportunities Fund | 15,082,676 | 6,757,351 | 6,746,950 | 3,146,158 | 392,613 | (3,765,080) | 11,720,610 |
| Fidelity Advisor Series Small Cap Fund | 9,808,927 | 2,762,624 | 3,751,777 | 1,570,914 | 855,863 | (1,918,096) | 7,757,541 |
| Fidelity Series 0-5 Year Inflation-Protected Bond Index Fund | -- | 42,854,341 | 2,364,530 | 155,598 | (3,099) | (69,213) | 40,394,461 |
| Fidelity Series 5+ Year Inflation-Protected Bond Index Fund | -- | 40,337,684 | 3,995,817 | 211,806 | (86,666) | (1,380,700) | 34,874,501 |
| Fidelity Series All-Sector Equity Fund | 9,269,255 | 2,210,862 | 3,722,047 | 1,567,112 | 603,879 | (1,031,599) | 7,330,350 |
| Fidelity Series Canada Fund | 9,453,254 | 2,653,868 | 3,027,600 | 244,984 | 176,848 | 1,856,695 | 11,113,065 |
| Fidelity Series Commodity Strategy Fund | 23,227,544 | 7,647,702 | 21,099,238 | 6,866,908 | (478,286) | 1,325,679 | 10,623,401 |
| Fidelity Series Emerging Markets Debt Fund | 4,445,548 | 569,481 | 1,020,150 | 195,845 | (75,348) | (292,873) | 3,626,658 |
| Fidelity Series Emerging Markets Debt Local Currency Fund | 1,462,105 | 223,152 | 338,497 | 53,666 | (12,520) | (128,345) | 1,205,895 |
| Fidelity Series Emerging Markets Fund | 8,256,890 | 1,596,993 | 2,359,762 | 221,235 | 219,954 | (1,696,328) | 6,017,747 |
| Fidelity Series Emerging Markets Opportunities Fund | 75,449,249 | 20,853,140 | 22,862,215 | 7,046,740 | 3,597,367 | (22,814,364) | 54,223,177 |
| Fidelity Series Floating Rate High Income Fund | 895,877 | 52,077 | 221,407 | 35,556 | (15,796) | 16,762 | 727,513 |
| Fidelity Series Government Money Market Fund 0.31% | 90,200,663 | 7,001,416 | 64,634,959 | 58,527 | -- | -- | 32,567,120 |
| Fidelity Series High Income Fund | 5,289,001 | 424,220 | 1,267,143 | 268,264 | 40,427 | (177,913) | 4,308,592 |
| Fidelity Series Inflation-Protected Bond Index Fund | 71,306,373 | 5,440,159 | 67,663,514 | 2,678,872 | 6,152,149 | (5,631,274) | 9,603,893 |
| Fidelity Series International Credit Fund | 729,035 | 23,528 | -- | 23,527 | -- | (54,076) | 698,487 |
| Fidelity Series International Developed Markets Bond Index Fund | -- | 24,311,081 | 1,282,818 | 7,591 | (19,231) | (964,131) | 22,044,901 |
| Fidelity Series International Growth Fund | 26,490,631 | 9,339,041 | 8,160,970 | 2,272,572 | 300,122 | (2,434,464) | 25,534,360 |
| Fidelity Series International Small Cap Fund | 8,394,404 | 1,682,846 | 1,964,864 | 1,036,144 | 499,759 | (1,537,619) | 7,074,526 |
| Fidelity Series International Value Fund | 26,461,208 | 8,625,157 | 9,812,869 | 1,425,627 | 494,419 | 23,171 | 25,791,086 |
| Fidelity Series Investment Grade Bond Fund | 252,528,086 | 37,303,959 | 50,920,101 | 5,518,873 | (541,559) | (11,803,056) | 226,567,329 |
| Fidelity Series Large Cap Stock Fund | 33,853,090 | 5,290,254 | 13,375,592 | 2,895,613 | 2,908,236 | (1,784,254) | 26,891,734 |
| Fidelity Series Large Cap Value Index Fund | 3,653,671 | 341,256 | 1,269,580 | 214,043 | 324,835 | (141,661) | 2,908,521 |
| Fidelity Series Long-Term Treasury Bond Index Fund | 22,844,322 | 15,039,134 | 7,453,977 | 585,140 | (456,842) | (325,504) | 29,647,133 |
| Fidelity Series Opportunistic Insights Fund | 20,103,810 | 6,133,016 | 9,338,903 | 3,290,344 | 2,446,833 | (3,550,657) | 15,794,099 |
| Fidelity Series Overseas Fund | 26,535,003 | 7,775,630 | 8,762,686 | 841,708 | 684,936 | (556,536) | 25,676,347 |
| Fidelity Series Real Estate Income Fund | 3,217,095 | 174,960 | 893,196 | 118,164 | 97,190 | 5,710 | 2,601,759 |
| Fidelity Series Short-Term Credit Fund | 18,870,432 | 2,341,944 | 12,516,466 | 289,453 | (10,234) | (527,949) | 8,157,727 |
| Fidelity Series Small Cap Opportunities Fund | 12,105,545 | 4,460,531 | 4,519,146 | 2,856,573 | 870,220 | (3,339,229) | 9,577,921 |
| Fidelity Series Stock Selector Large Cap Value Fund | 21,438,754 | 4,562,218 | 8,228,273 | 3,348,273 | 1,141,727 | (1,749,977) | 17,164,449 |
| Fidelity Series Value Discovery Fund | 21,946,920 | 3,613,177 | 8,488,458 | 2,224,197 | 1,827,036 | (1,416,002) | 17,482,673 |
| | $845,005,063 | $279,007,107 | $362,605,672 | $54,661,899 | $23,654,271 | $(68,239,450) | $716,798,281 |
(a) Includes the value of shares purchased or redeemed through in-kind transactions, if applicable.
Amounts in the income column in the above table include any capital gain distributions from underlying funds, which are presented in the corresponding line-item in the Statement of Operations, if applicable.
Investment Valuation
The following is a summary of the inputs used, as of March 31, 2022, involving the Fund's assets and liabilities carried at fair value. The inputs or methodology used for valuing securities may not be an indication of the risk associated with investing in those securities. For more information on valuation inputs, and their aggregation into the levels used below, please refer to the Investment Valuation section in the accompanying Notes to Financial Statements.
| | Valuation Inputs at Reporting Date: |
| Description | Total | Level 1 | Level 2 | Level 3 |
| Investments in Securities: | | | | |
| Other Short-Term Investments and Net Other Assets | $289,837 | $-- | $289,837 | $-- |
| Domestic Equity Funds | 144,342,004 | 144,342,004 | -- | -- |
| International Equity Funds | 155,430,308 | 155,430,308 | -- | -- |
| Bond Funds | 376,301,122 | 376,301,122 | -- | -- |
| Short-Term Funds | 41,116,916 | 41,116,916 | -- | -- |
| Total Investments in Securities: | $717,480,187 | $717,190,350 | $289,837 | $-- |
| Derivative Instruments: | | | | |
| Assets | | | | |
| Futures Contracts | $195,407 | $195,407 | $-- | $-- |
| Total Assets | $195,407 | $195,407 | $-- | $-- |
| Liabilities | | | | |
| Futures Contracts | $(3,037) | $(3,037) | $-- | $-- |
| Total Liabilities | $(3,037) | $(3,037) | $-- | $-- |
| Total Derivative Instruments: | $192,370 | $192,370 | $-- | $-- |
Value of Derivative Instruments
The following table is a summary of the Fund's value of derivative instruments by primary risk exposure as of March 31, 2022. For additional information on derivative instruments, please refer to the Derivative Instruments section in the accompanying Notes to Financial Statements.
| Primary Risk Exposure / Derivative Type | Value |
| | Asset | Liability |
| Equity Risk | | |
| Futures Contracts(a) | $195,407 | $(3,037) |
| Total Equity Risk | 195,407 | (3,037) |
| Total Value of Derivatives | $195,407 | $(3,037) |
(a) Reflects gross cumulative appreciation (depreciation) on futures contracts as presented in the Schedule of Investments. In the Statement of Assets and Liabilities, the period end daily variation margin is included in receivable or payable for daily variation margin on futures contracts, and the net cumulative appreciation (depreciation) is included in Total accumulated earnings (loss).
See accompanying notes which are an integral part of the financial statements.
Fidelity Advisor Freedom® 2015 Fund
Financial Statements
Statement of Assets and Liabilities
| | | March 31, 2022 |
| Assets | | |
Investment in securities, at value — See accompanying schedule:
Unaffiliated issuers (cost $289,838) | $289,837 | |
| Fidelity Central Funds (cost $392,067) | 392,069 | |
| Other affiliated issuers (cost $636,575,174) | 716,798,281 | |
| Total Investment in Securities (cost $637,257,079) | | $717,480,187 |
| Receivable for investments sold | | 16,477,682 |
| Receivable for fund shares sold | | 286,051 |
| Distributions receivable from Fidelity Central Funds | | 51 |
| Total assets | | 734,243,971 |
| Liabilities | | |
| Payable for investments purchased | $15,880,424 | |
| Payable for fund shares redeemed | 579,545 | |
| Accrued management fee | 319,824 | |
| Distribution and service plan fees payable | 122,106 | |
| Payable for daily variation margin on futures contracts | 46,717 | |
| Total liabilities | | 16,948,616 |
| Net Assets | | $717,295,355 |
| Net Assets consist of: | | |
| Paid in capital | | $609,440,815 |
| Total accumulated earnings (loss) | | 107,854,540 |
| Net Assets | | $717,295,355 |
| Net Asset Value and Maximum Offering Price | | |
| Class A: | | |
| Net Asset Value and redemption price per share ($315,459,638 ÷ 27,677,135 shares)(a) | | $11.40 |
| Maximum offering price per share (100/94.25 of $11.40) | | $12.10 |
| Class M: | | |
| Net Asset Value and redemption price per share ($107,957,022 ÷ 9,510,283 shares)(a) | | $11.35 |
| Maximum offering price per share (100/96.50 of $11.35) | | $11.76 |
| Class C: | | |
| Net Asset Value and offering price per share ($12,553,657 ÷ 1,113,386 shares)(a) | | $11.28 |
| Class I: | | |
| Net Asset Value, offering price and redemption price per share ($222,906,449 ÷ 19,357,150 shares) | | $11.52 |
| Class Z: | | |
| Net Asset Value, offering price and redemption price per share ($24,200,124 ÷ 2,119,858 shares) | | $11.42 |
| Class Z6: | | |
| Net Asset Value, offering price and redemption price per share ($34,218,465 ÷ 2,985,038 shares) | | $11.46 |
(a) Redemption price per share is equal to net asset value less any applicable contingent deferred sales charge.
See accompanying notes which are an integral part of the financial statements.
Statement of Operations
| | | Year ended March 31, 2022 |
| Investment Income | | |
| Dividends: | | |
| Affiliated issuers | | $22,891,716 |
| Interest | | 132 |
| Income from Fidelity Central Funds | | 343 |
| Total income | | 22,892,191 |
| Expenses | | |
| Management fee | $4,332,771 | |
| Distribution and service plan fees | 1,704,033 | |
| Independent trustees' fees and expenses | 2,508 | |
| Total expenses before reductions | 6,039,312 | |
| Expense reductions | (6) | |
| Total expenses after reductions | | 6,039,306 |
| Net investment income (loss) | | 16,852,885 |
| Realized and Unrealized Gain (Loss) | | |
| Net realized gain (loss) on: | | |
| Investment securities: | | |
| Unaffiliated issuers | 431 | |
| Affiliated issuers | 23,654,271 | |
| Futures contracts | 182,814 | |
| Capital gain distributions from underlying funds: | | |
| Affiliated issuers | 31,770,183 | |
| Total net realized gain (loss) | | 55,607,699 |
| Change in net unrealized appreciation (depreciation) on: | | |
| Investment securities: | | |
| Unaffiliated issuers | (7) | |
| Fidelity Central Funds | (1) | |
| Other affiliated issuers | (68,239,450) | |
| Futures contracts | 192,370 | |
| Total change in net unrealized appreciation (depreciation) | | (68,047,088) |
| Net gain (loss) | | (12,439,389) |
| Net increase (decrease) in net assets resulting from operations | | $4,413,496 |
See accompanying notes which are an integral part of the financial statements.
Statement of Changes in Net Assets
| | Year ended March 31, 2022 | Year ended March 31, 2021 |
| Increase (Decrease) in Net Assets | | |
| Operations | | |
| Net investment income (loss) | $16,852,885 | $6,927,871 |
| Net realized gain (loss) | 55,607,699 | 59,379,995 |
| Change in net unrealized appreciation (depreciation) | (68,047,088) | 127,893,433 |
| Net increase (decrease) in net assets resulting from operations | 4,413,496 | 194,201,299 |
| Distributions to shareholders | (78,805,498) | (60,060,127) |
| Share transactions - net increase (decrease) | (53,924,482) | (62,469,417) |
| Total increase (decrease) in net assets | (128,316,484) | 71,671,755 |
| Net Assets | | |
| Beginning of period | 845,611,839 | 773,940,084 |
| End of period | $717,295,355 | $845,611,839 |
See accompanying notes which are an integral part of the financial statements.
Financial Highlights
Fidelity Advisor Freedom 2015 Fund Class A
| Years ended March 31, | 2022 | 2021 | 2020 | 2019 | 2018 |
| Selected Per–Share Data | | | | | |
| Net asset value, beginning of period | $12.59 | $10.71 | $11.79 | $12.59 | $12.43 |
| Income from Investment Operations | | | | | |
| Net investment income (loss)A,B | .25 | .09 | .18 | .21 | .16 |
| Net realized and unrealized gain (loss) | (.21) | 2.66 | (.44) | .14 | .87 |
| Total from investment operations | .04 | 2.75 | (.26) | .35 | 1.03 |
| Distributions from net investment income | (.26) | (.11) | (.19) | (.21) | (.18) |
| Distributions from net realized gain | (.97) | (.76) | (.62) | (.94) | (.70) |
| Total distributions | (1.23) | (.87) | (.82)C | (1.15) | (.87)C |
| Net asset value, end of period | $11.40 | $12.59 | $10.71 | $11.79 | $12.59 |
| Total ReturnD,E | (.08)% | 26.45% | (2.77)% | 3.26% | 8.42% |
| Ratios to Average Net AssetsB,F,G | | | | | |
| Expenses before reductions | .79% | .80% | .81% | .82% | .72% |
| Expenses net of fee waivers, if any | .79% | .80% | .81% | .82% | .72% |
| Expenses net of all reductions | .79% | .80% | .81% | .82% | .72% |
| Net investment income (loss) | 2.03% | .79% | 1.50% | 1.71% | 1.22% |
| Supplemental Data | | | | | |
| Net assets, end of period (000 omitted) | $315,460 | $385,409 | $360,371 | $476,763 | $551,179 |
| Portfolio turnover rateH | 35% | 27% | 22% | 21% | 19% |
A Calculated based on average shares outstanding during the period.
B Net investment income (loss) is affected by the timing of the declaration of dividends by any underlying mutual funds or exchange-traded funds (ETFs). Net investment income (loss) of any such underlying funds is not included in the Fund's net investment income (loss) ratio.
C Total distributions per share do not sum due to rounding.
D Total returns would have been lower if certain expenses had not been reduced during the applicable periods shown.
E Total returns do not include the effect of the sales charges.
F Fees and expenses of any underlying mutual funds or exchange-traded funds (ETFs) are not included in the Fund's expense ratio. The Fund indirectly bears its proportionate share of these expenses. For additional expense information related to investments in Fidelity Central Funds, please refer to the "Investments in Fidelity Central Funds" note found in the Notes to Financial Statements section of the most recent Annual or Semi-Annual report.
G Expense ratios reflect operating expenses of the class. Expenses before reductions do not reflect amounts reimbursed, waived, or reduced through arrangements with the investment adviser, brokerage services, or other offset arrangements, if applicable, and do not represent the amount paid by the class during periods when reimbursements, waivers or reductions occur.
H Amount does not include the portfolio activity of any underlying mutual funds or exchange-traded funds (ETFs).
See accompanying notes which are an integral part of the financial statements.
Fidelity Advisor Freedom 2015 Fund Class M
| Years ended March 31, | 2022 | 2021 | 2020 | 2019 | 2018 |
| Selected Per–Share Data | | | | | |
| Net asset value, beginning of period | $12.55 | $10.68 | $11.76 | $12.56 | $12.41 |
| Income from Investment Operations | | | | | |
| Net investment income (loss)A,B | .22 | .06 | .15 | .17 | .12 |
| Net realized and unrealized gain (loss) | (.21) | 2.65 | (.44) | .15 | .87 |
| Total from investment operations | .01 | 2.71 | (.29) | .32 | .99 |
| Distributions from net investment income | (.24) | (.08) | (.16) | (.18) | (.15) |
| Distributions from net realized gain | (.97) | (.76) | (.62) | (.94) | (.70) |
| Total distributions | (1.21) | (.84) | (.79)C | (1.12) | (.84)C |
| Net asset value, end of period | $11.35 | $12.55 | $10.68 | $11.76 | $12.56 |
| Total ReturnD,E | (.35)% | 26.13% | (3.00)% | 3.01% | 8.10% |
| Ratios to Average Net AssetsB,F,G | | | | | |
| Expenses before reductions | 1.04% | 1.05% | 1.06% | 1.07% | .98% |
| Expenses net of fee waivers, if any | 1.04% | 1.05% | 1.06% | 1.07% | .98% |
| Expenses net of all reductions | 1.04% | 1.05% | 1.06% | 1.07% | .98% |
| Net investment income (loss) | 1.78% | .54% | 1.25% | 1.45% | .96% |
| Supplemental Data | | | | | |
| Net assets, end of period (000 omitted) | $107,957 | $134,240 | $123,857 | $152,212 | $167,835 |
| Portfolio turnover rateH | 35% | 27% | 22% | 21% | 19% |
A Calculated based on average shares outstanding during the period.
B Net investment income (loss) is affected by the timing of the declaration of dividends by any underlying mutual funds or exchange-traded funds (ETFs). Net investment income (loss) of any such underlying funds is not included in the Fund's net investment income (loss) ratio.
C Total distributions per share do not sum due to rounding.
D Total returns would have been lower if certain expenses had not been reduced during the applicable periods shown.
E Total returns do not include the effect of the sales charges.
F Fees and expenses of any underlying mutual funds or exchange-traded funds (ETFs) are not included in the Fund's expense ratio. The Fund indirectly bears its proportionate share of these expenses. For additional expense information related to investments in Fidelity Central Funds, please refer to the "Investments in Fidelity Central Funds" note found in the Notes to Financial Statements section of the most recent Annual or Semi-Annual report.
G Expense ratios reflect operating expenses of the class. Expenses before reductions do not reflect amounts reimbursed, waived, or reduced through arrangements with the investment adviser, brokerage services, or other offset arrangements, if applicable, and do not represent the amount paid by the class during periods when reimbursements, waivers or reductions occur.
H Amount does not include the portfolio activity of any underlying mutual funds or exchange-traded funds (ETFs).
See accompanying notes which are an integral part of the financial statements.
Fidelity Advisor Freedom 2015 Fund Class C
| Years ended March 31, | 2022 | 2021 | 2020 | 2019 | 2018 |
| Selected Per–Share Data | | | | | |
| Net asset value, beginning of period | $12.46 | $10.62 | $11.69 | $12.47 | $12.32 |
| Income from Investment Operations | | | | | |
| Net investment income (loss)A,B | .16 | –C | .09 | .11 | .06 |
| Net realized and unrealized gain (loss) | (.20) | 2.62 | (.44) | .16 | .86 |
| Total from investment operations | (.04) | 2.62 | (.35) | .27 | .92 |
| Distributions from net investment income | (.17) | (.03) | (.09) | (.13) | (.08) |
| Distributions from net realized gain | (.97) | (.74) | (.62) | (.93) | (.70) |
| Total distributions | (1.14) | (.78)D | (.72)D | (1.05)D | (.77)D |
| Net asset value, end of period | $11.28 | $12.46 | $10.62 | $11.69 | $12.47 |
| Total ReturnE,F | (.74)% | 25.36% | (3.48)% | 2.60% | 7.57% |
| Ratios to Average Net AssetsB,G,H | | | | | |
| Expenses before reductions | 1.54% | 1.55% | 1.56% | 1.57% | 1.48% |
| Expenses net of fee waivers, if any | 1.54% | 1.55% | 1.56% | 1.57% | 1.48% |
| Expenses net of all reductions | 1.54% | 1.55% | 1.55% | 1.57% | 1.48% |
| Net investment income (loss) | 1.28% | .04% | .76% | .96% | .47% |
| Supplemental Data | | | | | |
| Net assets, end of period (000 omitted) | $12,554 | $20,654 | $20,129 | $31,274 | $54,730 |
| Portfolio turnover rateI | 35% | 27% | 22% | 21% | 19% |
A Calculated based on average shares outstanding during the period.
B Net investment income (loss) is affected by the timing of the declaration of dividends by any underlying mutual funds or exchange-traded funds (ETFs). Net investment income (loss) of any such underlying funds is not included in the Fund's net investment income (loss) ratio.
C Amount represents less than $.005 per share.
D Total distributions per share do not sum due to rounding.
E Total returns would have been lower if certain expenses had not been reduced during the applicable periods shown.
F Total returns do not include the effect of the contingent deferred sales charge.
G Fees and expenses of any underlying mutual funds or exchange-traded funds (ETFs) are not included in the Fund's expense ratio. The Fund indirectly bears its proportionate share of these expenses. For additional expense information related to investments in Fidelity Central Funds, please refer to the "Investments in Fidelity Central Funds" note found in the Notes to Financial Statements section of the most recent Annual or Semi-Annual report.
H Expense ratios reflect operating expenses of the class. Expenses before reductions do not reflect amounts reimbursed, waived, or reduced through arrangements with the investment adviser, brokerage services, or other offset arrangements, if applicable, and do not represent the amount paid by the class during periods when reimbursements, waivers or reductions occur.
I Amount does not include the portfolio activity of any underlying mutual funds or exchange-traded funds (ETFs).
See accompanying notes which are an integral part of the financial statements.
Fidelity Advisor Freedom 2015 Fund Class I
| Years ended March 31, | 2022 | 2021 | 2020 | 2019 | 2018 |
| Selected Per–Share Data | | | | | |
| Net asset value, beginning of period | $12.71 | $10.81 | $11.89 | $12.69 | $12.53 |
| Income from Investment Operations | | | | | |
| Net investment income (loss)A,B | .29 | .13 | .21 | .24 | .19 |
| Net realized and unrealized gain (loss) | (.22) | 2.67 | (.44) | .14 | .88 |
| Total from investment operations | .07 | 2.80 | (.23) | .38 | 1.07 |
| Distributions from net investment income | (.29) | (.14) | (.22) | (.24) | (.21) |
| Distributions from net realized gain | (.97) | (.76) | (.62) | (.94) | (.70) |
| Total distributions | (1.26) | (.90) | (.85)C | (1.18) | (.91) |
| Net asset value, end of period | $11.52 | $12.71 | $10.81 | $11.89 | $12.69 |
| Total ReturnD | .20% | 26.71% | (2.50)% | 3.55% | 8.66% |
| Ratios to Average Net AssetsB,E,F | | | | | |
| Expenses before reductions | .54% | .55% | .56% | .57% | .48% |
| Expenses net of fee waivers, if any | .54% | .55% | .56% | .57% | .48% |
| Expenses net of all reductions | .54% | .55% | .56% | .57% | .48% |
| Net investment income (loss) | 2.28% | 1.04% | 1.75% | 1.95% | 1.46% |
| Supplemental Data | | | | | |
| Net assets, end of period (000 omitted) | $222,906 | $256,243 | $238,048 | $304,221 | $324,189 |
| Portfolio turnover rateG | 35% | 27% | 22% | 21% | 19% |
A Calculated based on average shares outstanding during the period.
B Net investment income (loss) is affected by the timing of the declaration of dividends by any underlying mutual funds or exchange-traded funds (ETFs). Net investment income (loss) of any such underlying funds is not included in the Fund's net investment income (loss) ratio.
C Total distributions per share do not sum due to rounding.
D Total returns would have been lower if certain expenses had not been reduced during the applicable periods shown.
E Fees and expenses of any underlying mutual funds or exchange-traded funds (ETFs) are not included in the Fund's expense ratio. The Fund indirectly bears its proportionate share of these expenses. For additional expense information related to investments in Fidelity Central Funds, please refer to the "Investments in Fidelity Central Funds" note found in the Notes to Financial Statements section of the most recent Annual or Semi-Annual report.
F Expense ratios reflect operating expenses of the class. Expenses before reductions do not reflect amounts reimbursed, waived, or reduced through arrangements with the investment adviser, brokerage services, or other offset arrangements, if applicable, and do not represent the amount paid by the class during periods when reimbursements, waivers or reductions occur.
G Amount does not include the portfolio activity of any underlying mutual funds or exchange-traded funds (ETFs).
See accompanying notes which are an integral part of the financial statements.
Fidelity Advisor Freedom 2015 Fund Class Z
| Years ended March 31, | 2022 | 2021 | 2020 | 2019 A |
| Selected Per–Share Data | | | | |
| Net asset value, beginning of period | $12.62 | $10.74 | $11.85 | $12.50 |
| Income from Investment Operations | | | | |
| Net investment income (loss)B,C | .29 | .13 | .22 | .27 |
| Net realized and unrealized gain (loss) | (.21) | 2.66 | (.45) | (.17) |
| Total from investment operations | .08 | 2.79 | (.23) | .10 |
| Distributions from net investment income | (.31) | (.15) | (.26) | (.27) |
| Distributions from net realized gain | (.97) | (.76) | (.62) | (.48) |
| Total distributions | (1.28) | (.91) | (.88) | (.75) |
| Net asset value, end of period | $11.42 | $12.62 | $10.74 | $11.85 |
| Total ReturnD,E | .25% | 26.82% | (2.48)% | 1.29% |
| Ratios to Average Net AssetsC,F,G | | | | |
| Expenses before reductions | .48% | .48% | .49% | .51%H,I |
| Expenses net of fee waivers, if any | .48% | .48% | .49% | .51%H,I |
| Expenses net of all reductions | .48% | .48% | .49% | .51%H,I |
| Net investment income (loss) | 2.35% | 1.11% | 1.82% | 4.73%H |
| Supplemental Data | | | | |
| Net assets, end of period (000 omitted) | $24,200 | $20,850 | $16,135 | $1,522 |
| Portfolio turnover rateJ | 35% | 27% | 22% | 21% |
A For the period October 2, 2018 (commencement of sale of shares) through March 31, 2019.
B Calculated based on average shares outstanding during the period.
C Net investment income (loss) is affected by the timing of the declaration of dividends by any underlying mutual funds or exchange-traded funds (ETFs). Net investment income (loss) of any such underlying funds is not included in the Fund's net investment income (loss) ratio.
D Total returns for periods of less than one year are not annualized.
E Total returns would have been lower if certain expenses had not been reduced during the applicable periods shown.
F Fees and expenses of any underlying mutual funds or exchange-traded funds (ETFs) are not included in the Fund's expense ratio. The Fund indirectly bears its proportionate share of these expenses. For additional expense information related to investments in Fidelity Central Funds, please refer to the "Investments in Fidelity Central Funds" note found in the Notes to Financial Statements section of the most recent Annual or Semi-Annual report.
G Expense ratios reflect operating expenses of the class. Expenses before reductions do not reflect amounts reimbursed, waived, or reduced through arrangements with the investment adviser, brokerage services, or other offset arrangements, if applicable, and do not represent the amount paid by the class during periods when reimbursements, waivers or reductions occur.
H Annualized
I On certain classes, the size and fluctuation of net assets and expense amounts may cause ratios to differ from contractual rates.
J Amount does not include the portfolio activity of any underlying mutual funds or exchange-traded funds (ETFs).
See accompanying notes which are an integral part of the financial statements.
Fidelity Advisor Freedom 2015 Fund Class Z6
| Years ended March 31, | 2022 | 2021 | 2020 | 2019 | 2018 A |
| Selected Per–Share Data | | | | | |
| Net asset value, beginning of period | $12.66 | $10.78 | $11.87 | $12.67 | $12.66 |
| Income from Investment Operations | | | | | |
| Net investment income (loss)B,C | .30 | .14 | .23 | .25 | .18 |
| Net realized and unrealized gain (loss) | (.21) | 2.66 | (.45) | .16 | .51 |
| Total from investment operations | .09 | 2.80 | (.22) | .41 | .69 |
| Distributions from net investment income | (.32) | (.17) | (.25) | (.27) | (.21) |
| Distributions from net realized gain | (.97) | (.76) | (.62) | (.94) | (.47) |
| Total distributions | (1.29) | (.92) | (.87) | (1.21) | (.68) |
| Net asset value, end of period | $11.46 | $12.66 | $10.78 | $11.87 | $12.67 |
| Total ReturnD,E | .31% | 26.84% | (2.40)% | 3.81% | 5.42% |
| Ratios to Average Net AssetsC,F,G | | | | | |
| Expenses before reductions | .40% | .40% | .41% | .41% | .43%H,I |
| Expenses net of fee waivers, if any | .40% | .40% | .41% | .41% | .43%H,I |
| Expenses net of all reductions | .40% | .40% | .41% | .41% | .43%H,I |
| Net investment income (loss) | 2.42% | 1.19% | 1.90% | 2.11% | 1.75%H |
| Supplemental Data | | | | | |
| Net assets, end of period (000 omitted) | $34,218 | $28,215 | $15,400 | $16,536 | $12,903 |
| Portfolio turnover rateJ | 35% | 27% | 22% | 21% | 19% |
A For the period June 6, 2017 (commencement of sale of shares) through March 31, 2018.
B Calculated based on average shares outstanding during the period.
C Net investment income (loss) is affected by the timing of the declaration of dividends by any underlying mutual funds or exchange-traded funds (ETFs). Net investment income (loss) of any such underlying funds is not included in the Fund's net investment income (loss) ratio.
D Total returns for periods of less than one year are not annualized.
E Total returns would have been lower if certain expenses had not been reduced during the applicable periods shown.
F Fees and expenses of any underlying mutual funds or exchange-traded funds (ETFs) are not included in the Fund's expense ratio. The Fund indirectly bears its proportionate share of these expenses. For additional expense information related to investments in Fidelity Central Funds, please refer to the "Investments in Fidelity Central Funds" note found in the Notes to Financial Statements section of the most recent Annual or Semi-Annual report.
G Expense ratios reflect operating expenses of the class. Expenses before reductions do not reflect amounts reimbursed, waived, or reduced through arrangements with the investment adviser, brokerage services, or other offset arrangements, if applicable, and do not represent the amount paid by the class during periods when reimbursements, waivers or reductions occur.
H Annualized
I On certain classes, the size and fluctuation of net assets and expense amounts may cause ratios to differ from contractual rates.
J Amount does not include the portfolio activity of any underlying mutual funds or exchange-traded funds (ETFs).
See accompanying notes which are an integral part of the financial statements.
Fidelity Advisor Freedom® 2020 Fund
Investment Summary (Unaudited)
The information in the following tables is based on the direct investments of the Fund.
Top Holdings as of March 31, 2022
| | % of fund's net assets |
| Fidelity Series Investment Grade Bond Fund | 28.0 |
| Fidelity Series Emerging Markets Opportunities Fund | 8.5 |
| Fidelity Series 5+ Year Inflation-Protected Bond Index Fund | 6.9 |
| Fidelity Series Large Cap Stock Fund | 4.9 |
| Fidelity Series Long-Term Treasury Bond Index Fund | 4.3 |
| Fidelity Series International Value Fund | 4.3 |
| Fidelity Series Overseas Fund | 4.3 |
| Fidelity Series International Growth Fund | 4.3 |
| Fidelity Series Value Discovery Fund | 3.2 |
| Fidelity Series Stock Selector Large Cap Value Fund | 3.1 |
| | 71.8 |
Asset Allocation (% of fund's net assets)
| Period end |
| | Domestic Equity Funds | 25.7% |
| | International Equity Funds | 25.4% |
| | Bond Funds | 46.3% |
| | Short-Term Funds | 2.6% |

Domestic Equity Funds category includes Fidelity Series Commodity Strategy Fund which invests in commodity-related investments.
Fidelity Advisor Freedom® 2020 Fund
Schedule of Investments March 31, 2022
Showing Percentage of Net Assets
| U.S. Treasury Obligations - 0.0% | | | |
| | | Principal Amount | Value |
| U.S. Treasury Bills, yield at date of purchase 0.18% to 0.38% 4/28/22 to 6/9/22 (a) | | | |
| (Cost $789,539) | | 790,000 | 789,537 |
| | | Shares | Value |
|
| Domestic Equity Funds - 25.7% | | | |
| Fidelity Advisor Series Equity Growth Fund (b) | | 3,668,128 | $56,599,222 |
| Fidelity Advisor Series Growth Opportunities Fund (b) | | 3,173,826 | 38,815,894 |
| Fidelity Advisor Series Small Cap Fund (b) | | 1,977,721 | 25,690,600 |
| Fidelity Series All-Sector Equity Fund (b) | | 2,251,949 | 24,276,012 |
| Fidelity Series Commodity Strategy Fund (b) | | 5,317,685 | 27,173,368 |
| Fidelity Series Large Cap Stock Fund (b) | | 4,684,843 | 89,058,863 |
| Fidelity Series Large Cap Value Index Fund (b) | | 627,106 | 9,632,344 |
| Fidelity Series Opportunistic Insights Fund (b) | | 2,861,376 | 52,305,954 |
| Fidelity Series Small Cap Opportunities Fund (b) | | 2,328,859 | 31,719,066 |
| Fidelity Series Stock Selector Large Cap Value Fund (b) | | 4,195,111 | 56,843,759 |
| Fidelity Series Value Discovery Fund (b) | | 3,618,636 | 57,898,184 |
| TOTAL DOMESTIC EQUITY FUNDS | | | |
| (Cost $335,785,124) | | | 470,013,266 |
|
| International Equity Funds - 25.4% | | | |
| Fidelity Series Canada Fund (b) | | 2,206,668 | 34,247,494 |
| Fidelity Series Emerging Markets Fund (b) | | 1,863,714 | 17,295,269 |
| Fidelity Series Emerging Markets Opportunities Fund (b) | | 8,469,677 | 155,842,052 |
| Fidelity Series International Growth Fund (b) | | 4,712,886 | 78,139,643 |
| Fidelity Series International Small Cap Fund (b) | | 1,203,145 | 21,596,458 |
| Fidelity Series International Value Fund (b) | | 7,165,345 | 79,033,754 |
| Fidelity Series Overseas Fund (b) | | 6,234,787 | 78,683,012 |
| TOTAL INTERNATIONAL EQUITY FUNDS | | | |
| (Cost $356,143,317) | | | 464,837,682 |
|
| Bond Funds - 46.3% | | | |
| Fidelity Series 0-5 Year Inflation-Protected Bond Index Fund (b) | | 2,024,845 | 20,309,191 |
| Fidelity Series 5+ Year Inflation-Protected Bond Index Fund (b) | | 13,221,414 | 126,925,574 |
| Fidelity Series Emerging Markets Debt Fund (b) | | 1,110,542 | 9,161,970 |
| Fidelity Series Emerging Markets Debt Local Currency Fund (b) | | 341,300 | 3,075,117 |
| Fidelity Series Floating Rate High Income Fund (b) | | 202,007 | 1,856,440 |
| Fidelity Series High Income Fund (b) | | 1,212,613 | 11,022,652 |
| Fidelity Series Inflation-Protected Bond Index Fund (b) | | 1,969,635 | 19,991,795 |
| Fidelity Series International Credit Fund (b) | | 162,126 | 1,501,290 |
| Fidelity Series International Developed Markets Bond Index Fund (b) | | 6,070,847 | 56,641,000 |
| Fidelity Series Investment Grade Bond Fund (b) | | 46,975,624 | 512,504,061 |
| Fidelity Series Long-Term Treasury Bond Index Fund (b) | | 10,410,318 | 79,326,622 |
| Fidelity Series Real Estate Income Fund (b) | | 585,115 | 6,646,911 |
| TOTAL BOND FUNDS | | | |
| (Cost $872,809,024) | | | 848,962,623 |
|
| Short-Term Funds - 2.6% | | | |
| Fidelity Cash Central Fund 0.31% (c) | | 1,250,619 | 1,250,869 |
| Fidelity Series Government Money Market Fund 0.31% (b)(d) | | 37,374,752 | 37,374,752 |
| Fidelity Series Short-Term Credit Fund (b) | | 960,318 | 9,363,105 |
| TOTAL SHORT-TERM FUNDS | | | |
| (Cost $48,171,269) | | | 47,988,726 |
| TOTAL INVESTMENT IN SECURITIES - 100.0% | | | |
| (Cost $1,613,698,273) | | | 1,832,591,834 |
| NET OTHER ASSETS (LIABILITIES) - 0.0% | | | (463,696) |
| NET ASSETS - 100% | | | $1,832,128,138 |
| Futures Contracts | | | | | |
| | Number of contracts | Expiration Date | Notional Amount | Value | Unrealized Appreciation/(Depreciation) |
| Purchased | | | | | |
| Equity Index Contracts | | | | | |
| ICE E-mini MSCI EAFE Index Contracts (United States) | 37 | June 2022 | $3,967,140 | $225,522 | $225,522 |
| ICE E-mini MSCI Emerging Markets Index Contracts (United States) | 98 | June 2022 | 5,514,950 | 250,080 | 250,080 |
|
| TOTAL PURCHASED | | | | | 475,602 |
|
| Sold | | | | | |
| Equity Index Contracts | | | | | |
| CME Micro E-mini S&P 500 Index Contracts (United States) | 40 | June 2022 | 9,061,500 | (4,674) | (4,674) |
| TOTAL FUTURES CONTRACTS | | | | | $470,928 |
The notional amount of futures purchased as a percentage of Net Assets is 0.5%
The notional amount of futures sold as a percentage of Net Assets is 0.5%
Legend
(a) Security or a portion of the security was pledged to cover margin requirements for futures contracts. At period end, the value of securities pledged amounted to $623,657.
(b) Affiliated Fund
(c) Affiliated fund that is generally available only to investment companies and other accounts managed by Fidelity Investments. The rate quoted is the annualized seven-day yield of the fund at period end. A complete unaudited listing of the fund's holdings as of its most recent quarter end is available upon request. In addition, each Fidelity Central Fund's financial statements, which are not covered by the Fund's Report of Independent Registered Public Accounting Firm, are available on the SEC's website or upon request.
(d) The rate quoted is the annualized seven-day yield of the fund at period end.
Affiliated Central Funds
Fiscal year to date information regarding the Fund's investments in Fidelity Central Funds, including the ownership percentage, is presented below.
| Fund | Value, beginning of period | Purchases(a) | Sales Proceeds(a) | Dividend Income | Realized Gain/Loss | Change in Unrealized appreciation (depreciation) | Value, end of period | % ownership, end of period |
| Fidelity Cash Central Fund 0.31% | $1,880,907 | $7,718,362 | $8,348,400 | $927 | $-- | $-- | $1,250,869 | 0.0% |
| Total | $1,880,907 | $7,718,362 | $8,348,400 | $927 | $-- | $-- | $1,250,869 | |
(a) Includes the value of shares purchased or redeemed through in-kind transactions, if applicable.
Amounts in the income column in the above table include any capital gain distributions from underlying funds, which are presented in the corresponding line-item in the Statement of Operations, if applicable.
Affiliated Underlying Funds
Fiscal year to date information regarding the Fund's investments in affiliated Underlying Funds is presented below. Exchanges between classes of the same affiliated Underlying Funds may occur. If an underlying Fund changes its name, the name presented below is the name in effect at period end.
| Fund | Value, beginning of period | Purchases(a) | Sales Proceeds(a) | Dividend Income | Realized Gain (loss) | Change in Unrealized appreciation (depreciation) | Value, end of period |
| Fidelity Advisor Series Equity Growth Fund | $69,060,001 | $20,596,557 | $30,503,139 | $11,162,553 | $4,091,278 | $(6,645,475) | $56,599,222 |
| Fidelity Advisor Series Growth Opportunities Fund | 48,027,636 | 21,436,317 | 19,297,397 | 10,344,543 | 619,659 | (11,970,321) | 38,815,894 |
| Fidelity Advisor Series Small Cap Fund | 31,239,796 | 8,400,839 | 10,320,281 | 5,156,178 | 2,304,809 | (5,934,563) | 25,690,600 |
| Fidelity Series 0-5 Year Inflation-Protected Bond Index Fund | -- | 39,866,040 | 19,495,716 | 89,320 | (54,677) | 6,846 | 20,309,191 |
| Fidelity Series 5+ Year Inflation-Protected Bond Index Fund | -- | 143,798,269 | 11,696,656 | 723,774 | (260,353) | (4,915,686) | 126,925,574 |
| Fidelity Series All-Sector Equity Fund | 29,521,471 | 6,903,092 | 10,589,196 | 5,187,043 | 1,214,044 | (2,773,399) | 24,276,012 |
| Fidelity Series Canada Fund | 28,822,162 | 7,378,884 | 8,145,706 | 751,625 | 473,139 | 5,719,015 | 34,247,494 |
| Fidelity Series Commodity Strategy Fund | 58,310,541 | 18,909,553 | 52,252,099 | 17,309,704 | (1,177,350) | 3,382,723 | 27,173,368 |
| Fidelity Series Emerging Markets Debt Fund | 11,161,613 | 1,389,436 | 2,448,925 | 497,281 | (207,143) | (733,011) | 9,161,970 |
| Fidelity Series Emerging Markets Debt Local Currency Fund | 3,658,565 | 581,553 | 805,280 | 137,883 | (31,258) | (328,463) | 3,075,117 |
| Fidelity Series Emerging Markets Fund | 23,110,809 | 4,206,186 | 5,790,439 | 639,439 | 533,675 | (4,764,962) | 17,295,269 |
| Fidelity Series Emerging Markets Opportunities Fund | 210,443,985 | 55,980,042 | 55,236,840 | 20,354,186 | 6,775,803 | (62,120,938) | 155,842,052 |
| Fidelity Series Floating Rate High Income Fund | 2,239,827 | 114,753 | 500,253 | 89,535 | (36,260) | 38,373 | 1,856,440 |
| Fidelity Series Government Money Market Fund 0.31% | 157,038,457 | 11,376,444 | 131,040,149 | 93,188 | -- | -- | 37,374,752 |
| Fidelity Series High Income Fund | 13,228,837 | 990,308 | 2,835,191 | 680,823 | (162,692) | (198,610) | 11,022,652 |
| Fidelity Series Inflation-Protected Bond Index Fund | 152,232,478 | 12,153,786 | 145,661,624 | 5,614,995 | 12,606,730 | (11,339,575) | 19,991,795 |
| Fidelity Series International Credit Fund | 1,566,949 | 50,568 | -- | 50,568 | -- | (116,227) | 1,501,290 |
| Fidelity Series International Developed Markets Bond Index Fund | -- | 61,939,419 | 2,776,358 | 19,412 | (38,718) | (2,483,343) | 56,641,000 |
| Fidelity Series International Growth Fund | 80,767,622 | 25,205,349 | 21,155,880 | 6,968,075 | 301,971 | (6,979,419) | 78,139,643 |
| Fidelity Series International Small Cap Fund | 25,594,902 | 4,133,336 | 4,925,973 | 3,169,711 | 1,291,089 | (4,496,896) | 21,596,458 |
| Fidelity Series International Value Fund | 80,678,094 | 23,588,780 | 26,816,011 | 4,371,257 | 1,369,916 | 212,975 | 79,033,754 |
| Fidelity Series Investment Grade Bond Fund | 554,354,434 | 95,001,411 | 108,911,322 | 12,243,316 | (1,388,591) | (26,551,871) | 512,504,061 |
| Fidelity Series Large Cap Stock Fund | 107,822,301 | 15,677,215 | 37,967,871 | 9,406,105 | 7,961,455 | (4,434,237) | 89,058,863 |
| Fidelity Series Large Cap Value Index Fund | 11,636,912 | 1,032,368 | 3,608,773 | 708,810 | 893,263 | (321,426) | 9,632,344 |
| Fidelity Series Long-Term Treasury Bond Index Fund | 57,417,129 | 41,881,430 | 17,595,943 | 1,508,650 | (1,272,210) | (1,103,784) | 79,326,622 |
| Fidelity Series Opportunistic Insights Fund | 64,023,791 | 19,275,138 | 26,966,407 | 10,841,873 | 5,973,337 | (9,999,905) | 52,305,954 |
| Fidelity Series Overseas Fund | 80,902,403 | 20,075,997 | 22,552,015 | 2,580,828 | 1,751,701 | (1,495,074) | 78,683,012 |
| Fidelity Series Real Estate Income Fund | 8,072,324 | 378,912 | 2,057,539 | 300,335 | 224,501 | 28,713 | 6,646,911 |
| Fidelity Series Short-Term Credit Fund | 32,801,002 | 3,629,921 | 26,270,501 | 470,662 | 33,633 | (830,950) | 9,363,105 |
| Fidelity Series Small Cap Opportunities Fund | 38,554,130 | 14,009,748 | 12,727,740 | 9,257,060�� | 1,806,740 | (9,923,812) | 31,719,066 |
| Fidelity Series Stock Selector Large Cap Value Fund | 68,284,126 | 14,509,798 | 23,726,425 | 11,073,566 | 2,940,146 | (5,163,886) | 56,843,759 |
| Fidelity Series Value Discovery Fund | 69,901,785 | 11,176,647 | 24,336,671 | 7,355,090 | 4,914,502 | (3,758,079) | 57,898,184 |
| | $2,120,474,082 | $705,648,096 | $869,014,320 | $159,157,388 | $53,452,139 | $(179,995,267) | $1,830,551,428 |
(a) Includes the value of shares purchased or redeemed through in-kind transactions, if applicable.
Amounts in the income column in the above table include any capital gain distributions from underlying funds, which are presented in the corresponding line-item in the Statement of Operations, if applicable.
Investment Valuation
The following is a summary of the inputs used, as of March 31, 2022, involving the Fund's assets and liabilities carried at fair value. The inputs or methodology used for valuing securities may not be an indication of the risk associated with investing in those securities. For more information on valuation inputs, and their aggregation into the levels used below, please refer to the Investment Valuation section in the accompanying Notes to Financial Statements.
| | Valuation Inputs at Reporting Date: |
| Description | Total | Level 1 | Level 2 | Level 3 |
| Investments in Securities: | | | | |
| Other Short-Term Investments and Net Other Assets | $789,537 | $-- | $789,537 | $-- |
| Domestic Equity Funds | 470,013,266 | 470,013,266 | -- | -- |
| International Equity Funds | 464,837,682 | 464,837,682 | -- | -- |
| Bond Funds | 848,962,623 | 848,962,623 | -- | -- |
| Short-Term Funds | 47,988,726 | 47,988,726 | -- | -- |
| Total Investments in Securities: | $1,832,591,834 | $1,831,802,297 | $789,537 | $-- |
| Derivative Instruments: | | | | |
| Assets | | | | |
| Futures Contracts | $475,602 | $475,602 | $-- | $-- |
| Total Assets | $475,602 | $475,602 | $-- | $-- |
| Liabilities | | | | |
| Futures Contracts | $(4,674) | $(4,674) | $-- | $-- |
| Total Liabilities | $(4,674) | $(4,674) | $-- | $-- |
| Total Derivative Instruments: | $470,928 | $470,928 | $-- | $-- |
Value of Derivative Instruments
The following table is a summary of the Fund's value of derivative instruments by primary risk exposure as of March 31, 2022. For additional information on derivative instruments, please refer to the Derivative Instruments section in the accompanying Notes to Financial Statements.
| Primary Risk Exposure / Derivative Type | Value |
| | Asset | Liability |
| Equity Risk | | |
| Futures Contracts(a) | $475,602 | $(4,674) |
| Total Equity Risk | 475,602 | (4,674) |
| Total Value of Derivatives | $475,602 | $(4,674) |
(a) Reflects gross cumulative appreciation (depreciation) on futures contracts as presented in the Schedule of Investments. In the Statement of Assets and Liabilities, the period end daily variation margin is included in receivable or payable for daily variation margin on futures contracts, and the net cumulative appreciation (depreciation) is included in Total accumulated earnings (loss).
See accompanying notes which are an integral part of the financial statements.
Fidelity Advisor Freedom® 2020 Fund
Financial Statements
Statement of Assets and Liabilities
| | | March 31, 2022 |
| Assets | | |
Investment in securities, at value — See accompanying schedule:
Unaffiliated issuers (cost $789,539) | $789,537 | |
| Fidelity Central Funds (cost $1,250,869) | 1,250,869 | |
| Other affiliated issuers (cost $1,611,657,865) | 1,830,551,428 | |
| Total Investment in Securities (cost $1,613,698,273) | | $1,832,591,834 |
| Receivable for investments sold | | 40,034,781 |
| Receivable for fund shares sold | | 514,286 |
| Distributions receivable from Fidelity Central Funds | | 170 |
| Total assets | | 1,873,141,071 |
| Liabilities | | |
| Payable for investments purchased | $37,572,690 | |
| Payable for fund shares redeemed | 2,149,287 | |
| Accrued management fee | 873,963 | |
| Distribution and service plan fees payable | 295,938 | |
| Payable for daily variation margin on futures contracts | 121,055 | |
| Total liabilities | | 41,012,933 |
| Net Assets | | $1,832,128,138 |
| Net Assets consist of: | | |
| Paid in capital | | $1,531,728,764 |
| Total accumulated earnings (loss) | | 300,399,374 |
| Net Assets | | $1,832,128,138 |
| Net Asset Value and Maximum Offering Price | | |
| Class A: | | |
| Net Asset Value and redemption price per share ($741,474,472 ÷ 57,784,154 shares)(a) | | $12.83 |
| Maximum offering price per share (100/94.25 of $12.83) | | $13.61 |
| Class M: | | |
| Net Asset Value and redemption price per share ($265,388,484 ÷ 20,710,248 shares)(a) | | $12.81 |
| Maximum offering price per share (100/96.50 of $12.81) | | $13.27 |
| Class C: | | |
| Net Asset Value and offering price per share ($36,340,183 ÷ 2,870,662 shares)(a) | | $12.66 |
| Class I: | | |
| Net Asset Value, offering price and redemption price per share ($616,519,982 ÷ 47,537,091 shares) | | $12.97 |
| Class Z: | | |
| Net Asset Value, offering price and redemption price per share ($59,576,387 ÷ 4,634,895 shares) | | $12.85 |
| Class Z6: | | |
| Net Asset Value, offering price and redemption price per share ($112,828,630 ÷ 8,747,438 shares) | | $12.90 |
(a) Redemption price per share is equal to net asset value less any applicable contingent deferred sales charge.
See accompanying notes which are an integral part of the financial statements.
Statement of Operations
| | | Year ended March 31, 2022 |
| Investment Income | | |
| Dividends: | | |
| Affiliated issuers | | $58,634,569 |
| Interest | | 365 |
| Income from Fidelity Central Funds | | 927 |
| Total income | | 58,635,861 |
| Expenses | | |
| Management fee | $11,774,494 | |
| Distribution and service plan fees | 4,044,098 | |
| Independent trustees' fees and expenses | 6,323 | |
| Total expenses before reductions | 15,824,915 | |
| Expense reductions | (4) | |
| Total expenses after reductions | | 15,824,911 |
| Net investment income (loss) | | 42,810,950 |
| Realized and Unrealized Gain (Loss) | | |
| Net realized gain (loss) on: | | |
| Investment securities: | | |
| Unaffiliated issuers | 1,216 | |
| Affiliated issuers | 53,452,139 | |
| Futures contracts | 477,088 | |
| Capital gain distributions from underlying funds: | | |
| Affiliated issuers | 100,522,819 | |
| Total net realized gain (loss) | | 154,453,262 |
| Change in net unrealized appreciation (depreciation) on: | | |
| Investment securities: | | |
| Unaffiliated issuers | (20) | |
| Affiliated issuers | (179,995,267) | |
| Futures contracts | 470,928 | |
| Total change in net unrealized appreciation (depreciation) | | (179,524,359) |
| Net gain (loss) | | (25,071,097) |
| Net increase (decrease) in net assets resulting from operations | | $17,739,853 |
See accompanying notes which are an integral part of the financial statements.
Statement of Changes in Net Assets
| | Year ended March 31, 2022 | Year ended March 31, 2021 |
| Increase (Decrease) in Net Assets | | |
| Operations | | |
| Net investment income (loss) | $42,810,950 | $17,293,824 |
| Net realized gain (loss) | 154,453,262 | 158,746,849 |
| Change in net unrealized appreciation (depreciation) | (179,524,359) | 382,563,737 |
| Net increase (decrease) in net assets resulting from operations | 17,739,853 | 558,604,410 |
| Distributions to shareholders | (210,125,505) | (150,975,667) |
| Share transactions - net increase (decrease) | (97,568,805) | (155,025,861) |
| Total increase (decrease) in net assets | (289,954,457) | 252,602,882 |
| Net Assets | | |
| Beginning of period | 2,122,082,595 | 1,869,479,713 |
| End of period | $1,832,128,138 | $2,122,082,595 |
See accompanying notes which are an integral part of the financial statements.
Financial Highlights
Fidelity Advisor Freedom 2020 Fund Class A
| Years ended March 31, | 2022 | 2021 | 2020 | 2019 | 2018 |
| Selected Per–Share Data | | | | | |
| Net asset value, beginning of period | $14.19 | $11.63 | $12.97 | $13.71 | $13.31 |
| Income from Investment Operations | | | | | |
| Net investment income (loss)A,B | .28 | .10 | .19 | .22 | .16 |
| Net realized and unrealized gain (loss) | (.18) | 3.43 | (.65) | .18 | 1.05 |
| Total from investment operations | .10 | 3.53 | (.46) | .40 | 1.21 |
| Distributions from net investment income | (.30) | (.12) | (.20) | (.22) | (.18) |
| Distributions from net realized gain | (1.16) | (.85) | (.68) | (.92) | (.62) |
| Total distributions | (1.46) | (.97) | (.88) | (1.14) | (.81)C |
| Net asset value, end of period | $12.83 | $14.19 | $11.63 | $12.97 | $13.71 |
| Total ReturnD,E | .25% | 31.39% | (4.15)% | 3.40% | 9.15% |
| Ratios to Average Net AssetsB,F,G | | | | | |
| Expenses before reductions | .83% | .84% | .85% | .86% | .76% |
| Expenses net of fee waivers, if any | .83% | .84% | .85% | .86% | .76% |
| Expenses net of all reductions | .83% | .84% | .85% | .86% | .76% |
| Net investment income (loss) | 2.02% | .78% | 1.46% | 1.68% | 1.18% |
| Supplemental Data | | | | | |
| Net assets, end of period (000 omitted) | $741,474 | $877,842 | $800,330 | $1,038,299 | $1,196,128 |
| Portfolio turnover rateH | 34% | 26% | 25% | 22% | 20% |
A Calculated based on average shares outstanding during the period.
B Net investment income (loss) is affected by the timing of the declaration of dividends by any underlying mutual funds or exchange-traded funds (ETFs). Net investment income (loss) of any such underlying funds is not included in the Fund's net investment income (loss) ratio.
C Total distributions per share do not sum due to rounding.
D Total returns would have been lower if certain expenses had not been reduced during the applicable periods shown.
E Total returns do not include the effect of the sales charges.
F Fees and expenses of any underlying mutual funds or exchange-traded funds (ETFs) are not included in the Fund's expense ratio. The Fund indirectly bears its proportionate share of these expenses. For additional expense information related to investments in Fidelity Central Funds, please refer to the "Investments in Fidelity Central Funds" note found in the Notes to Financial Statements section of the most recent Annual or Semi-Annual report.
G Expense ratios reflect operating expenses of the class. Expenses before reductions do not reflect amounts reimbursed, waived, or reduced through arrangements with the investment adviser, brokerage services, or other offset arrangements, if applicable, and do not represent the amount paid by the class during periods when reimbursements, waivers or reductions occur.
H Amount does not include the portfolio activity of any underlying mutual funds or exchange-traded funds (ETFs).
See accompanying notes which are an integral part of the financial statements.
Fidelity Advisor Freedom 2020 Fund Class M
| Years ended March 31, | 2022 | 2021 | 2020 | 2019 | 2018 |
| Selected Per–Share Data | | | | | |
| Net asset value, beginning of period | $14.18 | $11.62 | $12.96 | $13.71 | $13.30 |
| Income from Investment Operations | | | | | |
| Net investment income (loss)A,B | .25 | .07 | .16 | .19 | .13 |
| Net realized and unrealized gain (loss) | (.19) | 3.43 | (.65) | .17 | 1.05 |
| Total from investment operations | .06 | 3.50 | (.49) | .36 | 1.18 |
| Distributions from net investment income | (.27) | (.09) | (.17) | (.19) | (.15) |
| Distributions from net realized gain | (1.16) | (.85) | (.68) | (.92) | (.62) |
| Total distributions | (1.43) | (.94) | (.85) | (1.11) | (.77) |
| Net asset value, end of period | $12.81 | $14.18 | $11.62 | $12.96 | $13.71 |
| Total ReturnC,D | (.02)% | 31.08% | (4.38)% | 3.07% | 8.97% |
| Ratios to Average Net AssetsB,E,F | | | | | |
| Expenses before reductions | 1.08% | 1.09% | 1.10% | 1.11% | 1.01% |
| Expenses net of fee waivers, if any | 1.08% | 1.09% | 1.10% | 1.11% | 1.01% |
| Expenses net of all reductions | 1.08% | 1.09% | 1.10% | 1.11% | 1.01% |
| Net investment income (loss) | 1.77% | .53% | 1.21% | 1.43% | .92% |
| Supplemental Data | | | | | |
| Net assets, end of period (000 omitted) | $265,388 | $309,456 | $277,496 | $345,810 | $374,470 |
| Portfolio turnover rateG | 34% | 26% | 25% | 22% | 20% |
A Calculated based on average shares outstanding during the period.
B Net investment income (loss) is affected by the timing of the declaration of dividends by any underlying mutual funds or exchange-traded funds (ETFs). Net investment income (loss) of any such underlying funds is not included in the Fund's net investment income (loss) ratio.
C Total returns would have been lower if certain expenses had not been reduced during the applicable periods shown.
D Total returns do not include the effect of the sales charges.
E Fees and expenses of any underlying mutual funds or exchange-traded funds (ETFs) are not included in the Fund's expense ratio. The Fund indirectly bears its proportionate share of these expenses. For additional expense information related to investments in Fidelity Central Funds, please refer to the "Investments in Fidelity Central Funds" note found in the Notes to Financial Statements section of the most recent Annual or Semi-Annual report.
F Expense ratios reflect operating expenses of the class. Expenses before reductions do not reflect amounts reimbursed, waived, or reduced through arrangements with the investment adviser, brokerage services, or other offset arrangements, if applicable, and do not represent the amount paid by the class during periods when reimbursements, waivers or reductions occur.
G Amount does not include the portfolio activity of any underlying mutual funds or exchange-traded funds (ETFs).
See accompanying notes which are an integral part of the financial statements.
Fidelity Advisor Freedom 2020 Fund Class C
| Years ended March 31, | 2022 | 2021 | 2020 | 2019 | 2018 |
| Selected Per–Share Data | | | | | |
| Net asset value, beginning of period | $14.03 | $11.52 | $12.86 | $13.60 | $13.20 |
| Income from Investment Operations | | | | | |
| Net investment income (loss)A,B | .18 | –C | .09 | .12 | .06 |
| Net realized and unrealized gain (loss) | (.18) | 3.39 | (.64) | .17 | 1.05 |
| Total from investment operations | – | 3.39 | (.55) | .29 | 1.11 |
| Distributions from net investment income | (.21) | (.04) | (.11) | (.14) | (.09) |
| Distributions from net realized gain | (1.16) | (.84) | (.68) | (.90) | (.62) |
| Total distributions | (1.37) | (.88) | (.79) | (1.03)D | (.71) |
| Net asset value, end of period | $12.66 | $14.03 | $11.52 | $12.86 | $13.60 |
| Total ReturnE,F | (.47)% | 30.36% | (4.81)% | 2.55% | 8.45% |
| Ratios to Average Net AssetsB,G,H | | | | | |
| Expenses before reductions | 1.58% | 1.59% | 1.60% | 1.61% | 1.52% |
| Expenses net of fee waivers, if any | 1.58% | 1.59% | 1.60% | 1.61% | 1.52% |
| Expenses net of all reductions | 1.58% | 1.59% | 1.60% | 1.61% | 1.52% |
| Net investment income (loss) | 1.27% | .03% | .71% | .93% | .42% |
| Supplemental Data | | | | | |
| Net assets, end of period (000 omitted) | $36,340 | $51,480 | $46,563 | $63,123 | $98,878 |
| Portfolio turnover rateI | 34% | 26% | 25% | 22% | 20% |
A Calculated based on average shares outstanding during the period.
B Net investment income (loss) is affected by the timing of the declaration of dividends by any underlying mutual funds or exchange-traded funds (ETFs). Net investment income (loss) of any such underlying funds is not included in the Fund's net investment income (loss) ratio.
C Amount represents less than $.005 per share.
D Total distributions per share do not sum due to rounding.
E Total returns would have been lower if certain expenses had not been reduced during the applicable periods shown.
F Total returns do not include the effect of the contingent deferred sales charge.
G Fees and expenses of any underlying mutual funds or exchange-traded funds (ETFs) are not included in the Fund's expense ratio. The Fund indirectly bears its proportionate share of these expenses. For additional expense information related to investments in Fidelity Central Funds, please refer to the "Investments in Fidelity Central Funds" note found in the Notes to Financial Statements section of the most recent Annual or Semi-Annual report.
H Expense ratios reflect operating expenses of the class. Expenses before reductions do not reflect amounts reimbursed, waived, or reduced through arrangements with the investment adviser, brokerage services, or other offset arrangements, if applicable, and do not represent the amount paid by the class during periods when reimbursements, waivers or reductions occur.
I Amount does not include the portfolio activity of any underlying mutual funds or exchange-traded funds (ETFs).
See accompanying notes which are an integral part of the financial statements.
Fidelity Advisor Freedom 2020 Fund Class I
| Years ended March 31, | 2022 | 2021 | 2020 | 2019 | 2018 |
| Selected Per–Share Data | | | | | |
| Net asset value, beginning of period | $14.32 | $11.73 | $13.07 | $13.82 | $13.41 |
| Income from Investment Operations | | | | | |
| Net investment income (loss)A,B | .32 | .14 | .22 | .26 | .20 |
| Net realized and unrealized gain (loss) | (.18) | 3.46 | (.65) | .17 | 1.05 |
| Total from investment operations | .14 | 3.60 | (.43) | .43 | 1.25 |
| Distributions from net investment income | (.32) | (.15) | (.23) | (.26) | (.22) |
| Distributions from net realized gain | (1.16) | (.85) | (.68) | (.92) | (.62) |
| Total distributions | (1.49)C | (1.01)C | (.91) | (1.18) | (.84) |
| Net asset value, end of period | $12.97 | $14.32 | $11.73 | $13.07 | $13.82 |
| Total ReturnD | .53% | 31.70% | (3.87)% | 3.61% | 9.45% |
| Ratios to Average Net AssetsB,E,F | | | | | |
| Expenses before reductions | .58% | .59% | .60% | .61% | .52% |
| Expenses net of fee waivers, if any | .58% | .59% | .60% | .61% | .52% |
| Expenses net of all reductions | .58% | .59% | .60% | .61% | .52% |
| Net investment income (loss) | 2.27% | 1.03% | 1.71% | 1.92% | 1.42% |
| Supplemental Data | | | | | |
| Net assets, end of period (000 omitted) | $616,520 | $743,070 | $654,422 | $795,372 | $803,562 |
| Portfolio turnover rateG | 34% | 26% | 25% | 22% | 20% |
A Calculated based on average shares outstanding during the period.
B Net investment income (loss) is affected by the timing of the declaration of dividends by any underlying mutual funds or exchange-traded funds (ETFs). Net investment income (loss) of any such underlying funds is not included in the Fund's net investment income (loss) ratio.
C Total distributions per share do not sum due to rounding.
D Total returns would have been lower if certain expenses had not been reduced during the applicable periods shown.
E Fees and expenses of any underlying mutual funds or exchange-traded funds (ETFs) are not included in the Fund's expense ratio. The Fund indirectly bears its proportionate share of these expenses. For additional expense information related to investments in Fidelity Central Funds, please refer to the "Investments in Fidelity Central Funds" note found in the Notes to Financial Statements section of the most recent Annual or Semi-Annual report.
F Expense ratios reflect operating expenses of the class. Expenses before reductions do not reflect amounts reimbursed, waived, or reduced through arrangements with the investment adviser, brokerage services, or other offset arrangements, if applicable, and do not represent the amount paid by the class during periods when reimbursements, waivers or reductions occur.
G Amount does not include the portfolio activity of any underlying mutual funds or exchange-traded funds (ETFs).
See accompanying notes which are an integral part of the financial statements.
Fidelity Advisor Freedom 2020 Fund Class Z
| Years ended March 31, | 2022 | 2021 | 2020 | 2019 A |
| Selected Per–Share Data | | | | |
| Net asset value, beginning of period | $14.21 | $11.65 | $13.02 | $13.69 |
| Income from Investment Operations | | | | |
| Net investment income (loss)B,C | .33 | .15 | .23 | .21 |
| Net realized and unrealized gain (loss) | (.19) | 3.43 | (.64) | (.15) |
| Total from investment operations | .14 | 3.58 | (.41) | .06 |
| Distributions from net investment income | (.34) | (.17) | (.28) | (.30) |
| Distributions from net realized gain | (1.17) | (.85) | (.68) | (.43) |
| Total distributions | (1.50)D | (1.02) | (.96) | (.73) |
| Net asset value, end of period | $12.85 | $14.21 | $11.65 | $13.02 |
| Total ReturnE,F | .58% | 31.82% | (3.82)% | .91% |
| Ratios to Average Net AssetsC,G,H | | | | |
| Expenses before reductions | .51% | .52% | .53%I | .54%I,J |
| Expenses net of fee waivers, if any | .51% | .52% | .53%I | .54%I,J |
| Expenses net of all reductions | .51% | .52% | .53%I | .54%I,J |
| Net investment income (loss) | 2.35% | 1.10% | 1.78% | 3.41%J |
| Supplemental Data | | | | |
| Net assets, end of period (000 omitted) | $59,576 | $45,836 | $33,172 | $2,585 |
| Portfolio turnover rateK | 34% | 26% | 25% | 22% |
A For the period October 2, 2018 (commencement of sale of shares) through March 31, 2019.
B Calculated based on average shares outstanding during the period.
C Net investment income (loss) is affected by the timing of the declaration of dividends by any underlying mutual funds or exchange-traded funds (ETFs). Net investment income (loss) of any such underlying funds is not included in the Fund's net investment income (loss) ratio.
D Total distributions per share do not sum due to rounding.
E Total returns for periods of less than one year are not annualized.
F Total returns would have been lower if certain expenses had not been reduced during the applicable periods shown.
G Fees and expenses of any underlying mutual funds or exchange-traded funds (ETFs) are not included in the Fund's expense ratio. The Fund indirectly bears its proportionate share of these expenses. For additional expense information related to investments in Fidelity Central Funds, please refer to the "Investments in Fidelity Central Funds" note found in the Notes to Financial Statements section of the most recent Annual or Semi-Annual report.
H Expense ratios reflect operating expenses of the class. Expenses before reductions do not reflect amounts reimbursed, waived, or reduced through arrangements with the investment adviser, brokerage services, or other offset arrangements, if applicable, and do not represent the amount paid by the class during periods when reimbursements, waivers or reductions occur.
I On certain classes, the size and fluctuation of net assets and expense amounts may cause ratios to differ from contractual rates.
J Annualized
K Amount does not include the portfolio activity of any underlying mutual funds or exchange-traded funds (ETFs).
See accompanying notes which are an integral part of the financial statements.
Fidelity Advisor Freedom 2020 Fund Class Z6
| Years ended March 31, | 2022 | 2021 | 2020 | 2019 | 2018 A |
| Selected Per–Share Data | | | | | |
| Net asset value, beginning of period | $14.26 | $11.69 | $13.04 | $13.81 | $13.62 |
| Income from Investment Operations | | | | | |
| Net investment income (loss)B,C | .34 | .16 | .25 | .28 | .08 |
| Net realized and unrealized gain (loss) | (.18) | 3.45 | (.65) | .17 | .75 |
| Total from investment operations | .16 | 3.61 | (.40) | .45 | .83 |
| Distributions from net investment income | (.35) | (.18) | (.27) | (.30) | (.23) |
| Distributions from net realized gain | (1.17) | (.85) | (.68) | (.92) | (.41) |
| Total distributions | (1.52) | (1.04)D | (.95) | (1.22) | (.64) |
| Net asset value, end of period | $12.90 | $14.26 | $11.69 | $13.04 | $13.81 |
| Total ReturnE,F | .69% | 31.94% | (3.72)% | 3.76% | 6.08% |
| Ratios to Average Net AssetsC,G,H | | | | | |
| Expenses before reductions | .42% | .42% | .43% | .43% | .45%I,J |
| Expenses net of fee waivers, if any | .42% | .42% | .43% | .43% | .45%I,J |
| Expenses net of all reductions | .42% | .42% | .43% | .43% | .45%I,J |
| Net investment income (loss) | 2.44% | 1.20% | 1.88% | 2.10% | .71%I |
| Supplemental Data | | | | | |
| Net assets, end of period (000 omitted) | $112,829 | $94,399 | $57,497 | $45,686 | $29,132 |
| Portfolio turnover rateK | 34% | 26% | 25% | 22% | 20% |
A For the period June 6, 2017 (commencement of sale of shares) through March 31, 2018.
B Calculated based on average shares outstanding during the period.
C Net investment income (loss) is affected by the timing of the declaration of dividends by any underlying mutual funds or exchange-traded funds (ETFs). Net investment income (loss) of any such underlying funds is not included in the Fund's net investment income (loss) ratio.
D Total distributions per share do not sum due to rounding.
E Total returns for periods of less than one year are not annualized.
F Total returns would have been lower if certain expenses had not been reduced during the applicable periods shown.
G Fees and expenses of any underlying mutual funds or exchange-traded funds (ETFs) are not included in the Fund's expense ratio. The Fund indirectly bears its proportionate share of these expenses. For additional expense information related to investments in Fidelity Central Funds, please refer to the "Investments in Fidelity Central Funds" note found in the Notes to Financial Statements section of the most recent Annual or Semi-Annual report.
H Expense ratios reflect operating expenses of the class. Expenses before reductions do not reflect amounts reimbursed, waived, or reduced through arrangements with the investment adviser, brokerage services, or other offset arrangements, if applicable, and do not represent the amount paid by the class during periods when reimbursements, waivers or reductions occur.
I Annualized
J On certain classes, the size and fluctuation of net assets and expense amounts may cause ratios to differ from contractual rates.
K Amount does not include the portfolio activity of any underlying mutual funds or exchange-traded funds (ETFs).
See accompanying notes which are an integral part of the financial statements.
Fidelity Advisor Freedom® 2025 Fund
Investment Summary (Unaudited)
The information in the following tables is based on the direct investments of the Fund.
Top Holdings as of March 31, 2022
| | % of fund's net assets |
| Fidelity Series Investment Grade Bond Fund | 24.7 |
| Fidelity Series Emerging Markets Opportunities Fund | 9.2 |
| Fidelity Series 5+ Year Inflation-Protected Bond Index Fund | 5.9 |
| Fidelity Series Large Cap Stock Fund | 5.7 |
| Fidelity Series International Value Fund | 4.8 |
| Fidelity Series Overseas Fund | 4.8 |
| Fidelity Series International Growth Fund | 4.8 |
| Fidelity Series Long-Term Treasury Bond Index Fund | 4.7 |
| Fidelity Series Value Discovery Fund | 3.7 |
| Fidelity Series Stock Selector Large Cap Value Fund | 3.6 |
| | 71.9 |
Asset Allocation (% of fund's net assets)
| Period end |
| | Domestic Equity Funds | 29.7% |
| | International Equity Funds | 28.0% |
| | Bond Funds | 41.1% |
| | Short-Term Funds | 1.2% |

Domestic Equity Funds category includes Fidelity Series Commodity Strategy Fund which invests in commodity-related investments.
Fidelity Advisor Freedom® 2025 Fund
Schedule of Investments March 31, 2022
Showing Percentage of Net Assets
| U.S. Treasury Obligations - 0.0% | | | |
| | | Principal Amount | Value |
| U.S. Treasury Bills, yield at date of purchase 0.17% to 0.38% 4/21/22 to 6/9/22 (a) | | | |
| (Cost $1,219,296) | | 1,220,000 | 1,219,306 |
| | | Shares | Value |
|
| Domestic Equity Funds - 29.7% | | | |
| Fidelity Advisor Series Equity Growth Fund (b) | | 6,839,758 | $105,537,469 |
| Fidelity Advisor Series Growth Opportunities Fund (b) | | 5,918,186 | 72,379,418 |
| Fidelity Advisor Series Small Cap Fund (b) | | 3,687,765 | 47,904,066 |
| Fidelity Series All-Sector Equity Fund (b) | | 4,199,158 | 45,266,926 |
| Fidelity Series Commodity Strategy Fund (b) | | 8,512,501 | 43,498,882 |
| Fidelity Series Large Cap Stock Fund (b) | | 8,735,767 | 166,066,924 |
| Fidelity Series Large Cap Value Index Fund (b) | | 1,169,362 | 17,961,399 |
| Fidelity Series Opportunistic Insights Fund (b) | | 5,335,578 | 97,534,370 |
| Fidelity Series Small Cap Opportunities Fund (b) | | 4,342,491 | 59,144,723 |
| Fidelity Series Stock Selector Large Cap Value Fund (b) | | 7,822,499 | 105,994,860 |
| Fidelity Series Value Discovery Fund (b) | | 6,747,641 | 107,962,263 |
| TOTAL DOMESTIC EQUITY FUNDS | | | |
| (Cost $633,247,792) | | | 869,251,300 |
|
| International Equity Funds - 28.0% | | | |
| Fidelity Series Canada Fund (b) | | 3,918,132 | 60,809,411 |
| Fidelity Series Emerging Markets Fund (b) | | 3,220,446 | 29,885,734 |
| Fidelity Series Emerging Markets Opportunities Fund (b) | | 14,637,272 | 269,325,801 |
| Fidelity Series International Growth Fund (b) | | 8,423,854 | 139,667,496 |
| Fidelity Series International Small Cap Fund (b) | | 2,136,718 | 38,354,082 |
| Fidelity Series International Value Fund (b) | | 12,843,088 | 141,659,255 |
| Fidelity Series Overseas Fund (b) | | 11,169,275 | 140,956,251 |
| TOTAL INTERNATIONAL EQUITY FUNDS | | | |
| (Cost $656,752,627) | | | 820,658,030 |
|
| Bond Funds - 41.1% | | | |
| Fidelity Series 5+ Year Inflation-Protected Bond Index Fund (b) | | 17,991,197 | 172,715,495 |
| Fidelity Series Emerging Markets Debt Fund (b) | | 1,773,779 | 14,633,679 |
| Fidelity Series Emerging Markets Debt Local Currency Fund (b) | | 544,887 | 4,909,436 |
| Fidelity Series Floating Rate High Income Fund (b) | | 322,699 | 2,965,603 |
| Fidelity Series High Income Fund (b) | | 1,940,952 | 17,643,256 |
| Fidelity Series Inflation-Protected Bond Index Fund (b) | | 2,604,591 | 26,436,598 |
| Fidelity Series International Credit Fund (b) | | 187,964 | 1,740,549 |
| Fidelity Series International Developed Markets Bond Index Fund (b) | | 9,586,439 | 89,441,480 |
| Fidelity Series Investment Grade Bond Fund (b) | | 66,302,956 | 723,365,250 |
| Fidelity Series Long-Term Treasury Bond Index Fund (b) | | 18,207,232 | 138,739,105 |
| Fidelity Series Real Estate Income Fund (b) | | 933,644 | 10,606,190 |
| TOTAL BOND FUNDS | | | |
| (Cost $1,251,819,494) | | | 1,203,196,641 |
|
| Short-Term Funds - 1.2% | | | |
| Fidelity Cash Central Fund 0.31% (c) | | 1,995,043 | 1,995,442 |
| Fidelity Series Government Money Market Fund 0.31% (b)(d) | | 27,190,089 | 27,190,089 |
| Fidelity Series Short-Term Credit Fund (b) | | 698,993 | 6,815,179 |
| TOTAL SHORT-TERM FUNDS | | | |
| (Cost $36,130,823) | | | 36,000,710 |
| TOTAL INVESTMENT IN SECURITIES - 100.0% | | | |
| (Cost $2,579,170,032) | | | 2,930,325,987 |
| NET OTHER ASSETS (LIABILITIES) - 0.0% | | | (697,335) |
| NET ASSETS - 100% | | | $2,929,628,652 |
| Futures Contracts | | | | | |
| | Number of contracts | Expiration Date | Notional Amount | Value | Unrealized Appreciation/(Depreciation) |
| Purchased | | | | | |
| Equity Index Contracts | | | | | |
| ICE E-mini MSCI EAFE Index Contracts (United States) | 72 | June 2022 | $7,719,840 | $435,824 | $435,824 |
| ICE E-mini MSCI Emerging Markets Index Contracts (United States) | 157 | June 2022 | 8,835,175 | 355,088 | 355,088 |
|
| TOTAL PURCHASED | | | | | 790,912 |
|
| Sold | | | | | |
| Equity Index Contracts | | | | | |
| CME Micro E-mini S&P 500 Index Contracts (United States) | 64 | June 2022 | 14,498,400 | (14,217) | (14,217) |
| TOTAL FUTURES CONTRACTS | | | | | $776,695 |
The notional amount of futures purchased as a percentage of Net Assets is 0.6%
The notional amount of futures sold as a percentage of Net Assets is 0.5%
Legend
(a) Security or a portion of the security was pledged to cover margin requirements for futures contracts. At period end, the value of securities pledged amounted to $935,473.
(b) Affiliated Fund
(c) Affiliated fund that is generally available only to investment companies and other accounts managed by Fidelity Investments. The rate quoted is the annualized seven-day yield of the fund at period end. A complete unaudited listing of the fund's holdings as of its most recent quarter end is available upon request. In addition, each Fidelity Central Fund's financial statements, which are not covered by the Fund's Report of Independent Registered Public Accounting Firm, are available on the SEC's website or upon request.
(d) The rate quoted is the annualized seven-day yield of the fund at period end.
Affiliated Central Funds
Fiscal year to date information regarding the Fund's investments in Fidelity Central Funds, including the ownership percentage, is presented below.
| Fund | Value, beginning of period | Purchases(a) | Sales Proceeds(a) | Dividend Income | Realized Gain/Loss | Change in Unrealized appreciation (depreciation) | Value, end of period | % ownership, end of period |
| Fidelity Cash Central Fund 0.31% | $2,893,144 | $11,474,613 | $12,372,315 | $1,256 | $-- | $-- | $1,995,442 | 0.0% |
| Total | $2,893,144 | $11,474,613 | $12,372,315 | $1,256 | $-- | $-- | $1,995,442 | |
(a) Includes the value of shares purchased or redeemed through in-kind transactions, if applicable.
Amounts in the income column in the above table include any capital gain distributions from underlying funds, which are presented in the corresponding line-item in the Statement of Operations, if applicable.
Affiliated Underlying Funds
Fiscal year to date information regarding the Fund's investments in affiliated Underlying Funds is presented below. Exchanges between classes of the same affiliated Underlying Funds may occur. If an underlying Fund changes its name, the name presented below is the name in effect at period end.
| Fund | Value, beginning of period | Purchases(a) | Sales Proceeds(a) | Dividend Income | Realized Gain (loss) | Change in Unrealized appreciation (depreciation) | Value, end of period |
| Fidelity Advisor Series Equity Growth Fund | $117,325,141 | $38,807,593 | $45,368,000 | $20,096,272 | $3,140,492 | $(8,367,757) | $105,537,469 |
| Fidelity Advisor Series Growth Opportunities Fund | 81,589,798 | 40,390,819 | 28,754,518 | 18,606,226 | (76,564) | (20,770,117) | 72,379,418 |
| Fidelity Advisor Series Small Cap Fund | 53,075,634 | 16,195,117 | 14,592,362 | 9,301,195 | 2,897,707 | (9,672,030) | 47,904,066 |
| Fidelity Series 0-5 Year Inflation-Protected Bond Index Fund | -- | 49,087,952 | 49,077,871 | 44,219 | (3,496) | -- | -- |
| Fidelity Series 5+ Year Inflation-Protected Bond Index Fund | -- | 192,375,129 | 12,704,800 | 936,006 | (330,667) | (6,624,167) | 172,715,495 |
| Fidelity Series All-Sector Equity Fund | 50,156,552 | 13,417,011 | 15,179,352 | 9,420,218 | 1,382,617 | (4,509,902) | 45,266,926 |
| Fidelity Series Canada Fund | 47,898,345 | 12,721,135 | 10,474,604 | 1,308,213 | 374,384 | 10,290,151 | 60,809,411 |
| Fidelity Series Commodity Strategy Fund | 85,914,004 | 30,589,092 | 76,326,106 | 26,669,022 | (2,623,321) | 5,945,213 | 43,498,882 |
| Fidelity Series Emerging Markets Debt Fund | 16,550,675 | 2,422,317 | 2,840,481 | 767,075 | (204,889) | (1,293,943) | 14,633,679 |
| Fidelity Series Emerging Markets Debt Local Currency Fund | 5,374,056 | 1,020,655 | 913,072 | 215,060 | (39,769) | (532,434) | 4,909,436 |
| Fidelity Series Emerging Markets Fund | 36,564,242 | 7,574,634 | 7,085,319 | 1,079,017 | 545,417 | (7,713,240) | 29,885,734 |
| Fidelity Series Emerging Markets Opportunities Fund | 332,255,096 | 98,591,624 | 67,828,968 | 34,229,048 | 6,194,585 | (99,886,536) | 269,325,801 |
| Fidelity Series Floating Rate High Income Fund | 3,295,592 | 280,490 | 612,475 | 138,066 | (27,995) | 29,991 | 2,965,603 |
| Fidelity Series Government Money Market Fund 0.31% | 151,643,561 | 15,577,123 | 140,030,595 | 89,728 | -- | -- | 27,190,089 |
| Fidelity Series High Income Fund | 19,441,988 | 2,179,677 | 3,380,835 | 1,054,521 | (95,210) | (502,364) | 17,643,256 |
| Fidelity Series Inflation-Protected Bond Index Fund | 198,330,262 | 18,894,846 | 192,556,423 | 7,413,157 | 15,163,329 | (13,395,416) | 26,436,598 |
| Fidelity Series International Credit Fund | 1,816,672 | 58,627 | -- | 58,627 | -- | (134,750) | 1,740,549 |
| Fidelity Series International Developed Markets Bond Index Fund | -- | 96,176,330 | 2,799,558 | 30,087 | (45,313) | (3,889,979) | 89,441,480 |
| Fidelity Series International Growth Fund | 134,224,589 | 43,901,068 | 26,117,506 | 12,112,269 | 204,185 | (12,544,840) | 139,667,496 |
| Fidelity Series International Small Cap Fund | 42,536,580 | 7,336,722 | 5,678,649 | 5,515,113 | 983,207 | (6,823,778) | 38,354,082 |
| Fidelity Series International Value Fund | 134,076,208 | 41,020,184 | 35,907,556 | 7,598,265 | 1,329,052 | 1,141,367 | 141,659,255 |
| Fidelity Series Investment Grade Bond Fund | 736,452,079 | 142,425,099 | 115,998,066 | 16,897,711 | (1,930,133) | (37,583,729) | 723,365,250 |
| Fidelity Series Large Cap Stock Fund | 183,189,958 | 31,702,814 | 54,684,914 | 16,725,054 | 8,218,941 | (2,359,875) | 166,066,924 |
| Fidelity Series Large Cap Value Index Fund | 19,771,097 | 2,203,716 | 4,977,434 | 1,282,203 | 935,599 | 28,421 | 17,961,399 |
| Fidelity Series Long-Term Treasury Bond Index Fund | 84,656,016 | 80,570,921 | 21,323,701 | 2,415,119 | (2,367,036) | (2,797,095) | 138,739,105 |
| Fidelity Series Opportunistic Insights Fund | 108,770,464 | 36,509,029 | 39,706,780 | 19,559,244 | 5,015,704 | (13,054,047) | 97,534,370 |
| Fidelity Series Overseas Fund | 134,448,368 | 35,097,449 | 28,254,901 | 4,486,131 | 1,678,005 | (2,012,670) | 140,956,251 |
| Fidelity Series Real Estate Income Fund | 11,887,719 | 782,003 | 2,425,654 | 464,497 | 113,328 | 248,794 | 10,606,190 |
| Fidelity Series Short-Term Credit Fund | 31,581,232 | 4,066,569 | 28,078,412 | 460,673 | (36,959) | (717,251) | 6,815,179 |
| Fidelity Series Small Cap Opportunities Fund | 65,504,909 | 26,257,144 | 18,036,310 | 16,469,679 | 1,520,512 | (16,101,532) | 59,144,723 |
| Fidelity Series Stock Selector Large Cap Value Fund | 116,015,293 | 28,426,860 | 33,906,613 | 20,089,154 | 2,977,145 | (7,517,825) | 105,994,860 |
| Fidelity Series Value Discovery Fund | 118,763,449 | 23,239,328 | 35,561,908 | 13,353,000 | 4,713,920 | (3,192,526) | 107,962,263 |
| | $3,123,109,579 | $1,139,899,077 | $1,121,183,743 | $268,883,869 | $49,606,777 | $(264,313,866) | $2,927,111,239 |
(a) Includes the value of shares purchased or redeemed through in-kind transactions, if applicable.
Amounts in the income column in the above table include any capital gain distributions from underlying funds, which are presented in the corresponding line-item in the Statement of Operations, if applicable.
Investment Valuation
The following is a summary of the inputs used, as of March 31, 2022, involving the Fund's assets and liabilities carried at fair value. The inputs or methodology used for valuing securities may not be an indication of the risk associated with investing in those securities. For more information on valuation inputs, and their aggregation into the levels used below, please refer to the Investment Valuation section in the accompanying Notes to Financial Statements.
| | Valuation Inputs at Reporting Date: |
| Description | Total | Level 1 | Level 2 | Level 3 |
| Investments in Securities: | | | | |
| Other Short-Term Investments and Net Other Assets | $1,219,306 | $-- | $1,219,306 | $-- |
| Domestic Equity Funds | 869,251,300 | 869,251,300 | -- | -- |
| International Equity Funds | 820,658,030 | 820,658,030 | -- | -- |
| Bond Funds | 1,203,196,641 | 1,203,196,641 | -- | -- |
| Short-Term Funds | 36,000,710 | 36,000,710 | -- | -- |
| Total Investments in Securities: | $2,930,325,987 | $2,929,106,681 | $1,219,306 | $-- |
| Derivative Instruments: | | | | |
| Assets | | | | |
| Futures Contracts | $790,912 | $790,912 | $-- | $-- |
| Total Assets | $790,912 | $790,912 | $-- | $-- |
| Liabilities | | | | |
| Futures Contracts | $(14,217) | $(14,217) | $-- | $-- |
| Total Liabilities | $(14,217) | $(14,217) | $-- | $-- |
| Total Derivative Instruments: | $776,695 | $776,695 | $-- | $-- |
Value of Derivative Instruments
The following table is a summary of the Fund's value of derivative instruments by primary risk exposure as of March 31, 2022. For additional information on derivative instruments, please refer to the Derivative Instruments section in the accompanying Notes to Financial Statements.
| Primary Risk Exposure / Derivative Type | Value |
| | Asset | Liability |
| Equity Risk | | |
| Futures Contracts(a) | $790,912 | $(14,217) |
| Total Equity Risk | 790,912 | (14,217) |
| Total Value of Derivatives | $790,912 | $(14,217) |
(a) Reflects gross cumulative appreciation (depreciation) on futures contracts as presented in the Schedule of Investments. In the Statement of Assets and Liabilities, the period end daily variation margin is included in receivable or payable for daily variation margin on futures contracts, and the net cumulative appreciation (depreciation) is included in Total accumulated earnings (loss).
See accompanying notes which are an integral part of the financial statements.
Fidelity Advisor Freedom® 2025 Fund
Financial Statements
Statement of Assets and Liabilities
| | | March 31, 2022 |
| Assets | | |
Investment in securities, at value — See accompanying schedule:
Unaffiliated issuers (cost $1,219,296) | $1,219,306 | |
| Fidelity Central Funds (cost $1,995,442) | 1,995,442 | |
| Other affiliated issuers (cost $2,575,955,294) | 2,927,111,239 | |
| Total Investment in Securities (cost $2,579,170,032) | | $2,930,325,987 |
| Receivable for investments sold | | 61,223,473 |
| Receivable for fund shares sold | | 2,404,946 |
| Distributions receivable from Fidelity Central Funds | | 277 |
| Total assets | | 2,993,954,683 |
| Liabilities | | |
| Payable for investments purchased | $58,298,519 | |
| Payable for fund shares redeemed | 3,916,109 | |
| Accrued management fee | 1,484,977 | |
| Distribution and service plan fees payable | 447,216 | |
| Payable for daily variation margin on futures contracts | 179,210 | |
| Total liabilities | | 64,326,031 |
| Net Assets | | $2,929,628,652 |
| Net Assets consist of: | | |
| Paid in capital | | $2,442,141,720 |
| Total accumulated earnings (loss) | | 487,486,932 |
| Net Assets | | $2,929,628,652 |
| Net Asset Value and Maximum Offering Price | | |
| Class A: | | |
| Net Asset Value and redemption price per share ($1,161,792,321 ÷ 86,393,791 shares)(a) | | $13.45 |
| Maximum offering price per share (100/94.25 of $13.45) | | $14.27 |
| Class M: | | |
| Net Asset Value and redemption price per share ($405,616,269 ÷ 30,130,721 shares)(a) | | $13.46 |
| Maximum offering price per share (100/96.50 of $13.46) | | $13.95 |
| Class C: | | |
| Net Asset Value and offering price per share ($46,294,943 ÷ 3,523,540 shares)(a) | | $13.14 |
| Class I: | | |
| Net Asset Value, offering price and redemption price per share ($1,026,795,656 ÷ 75,445,553 shares) | | $13.61 |
| Class Z: | | |
| Net Asset Value, offering price and redemption price per share ($94,133,363 ÷ 6,980,990 shares) | | $13.48 |
| Class Z6: | | |
| Net Asset Value, offering price and redemption price per share ($194,996,100 ÷ 14,389,251 shares) | | $13.55 |
(a) Redemption price per share is equal to net asset value less any applicable contingent deferred sales charge.
See accompanying notes which are an integral part of the financial statements.
Statement of Operations
| | | Year ended March 31, 2022 |
| Investment Income | | |
| Dividends: | | |
| Affiliated issuers | | $91,172,558 |
| Interest | | 558 |
| Income from Fidelity Central Funds | | 1,256 |
| Total income | | 91,174,372 |
| Expenses | | |
| Management fee | $19,419,230 | |
| Distribution and service plan fees | 5,900,047 | |
| Independent trustees' fees and expenses | 9,607 | |
| Total expenses before reductions | 25,328,884 | |
| Expense reductions | (2) | |
| Total expenses after reductions | | 25,328,882 |
| Net investment income (loss) | | 65,845,490 |
| Realized and Unrealized Gain (Loss) | | |
| Net realized gain (loss) on: | | |
| Investment securities: | | |
| Unaffiliated issuers | 1,696 | |
| Affiliated issuers | 49,606,777 | |
| Futures contracts | 566,702 | |
| Capital gain distributions from underlying funds: | | |
| Affiliated issuers | 177,711,311 | |
| Total net realized gain (loss) | | 227,886,486 |
| Change in net unrealized appreciation (depreciation) on: | | |
| Investment securities: | | |
| Unaffiliated issuers | (7) | |
| Affiliated issuers | (264,313,866) | |
| Futures contracts | 776,695 | |
| Total change in net unrealized appreciation (depreciation) | | (263,537,178) |
| Net gain (loss) | | (35,650,692) |
| Net increase (decrease) in net assets resulting from operations | | $30,194,798 |
See accompanying notes which are an integral part of the financial statements.
Statement of Changes in Net Assets
| | Year ended March 31, 2022 | Year ended March 31, 2021 |
| Increase (Decrease) in Net Assets | | |
| Operations | | |
| Net investment income (loss) | $65,845,490 | $23,987,455 |
| Net realized gain (loss) | 227,886,486 | 203,330,189 |
| Change in net unrealized appreciation (depreciation) | (263,537,178) | 623,552,088 |
| Net increase (decrease) in net assets resulting from operations | 30,194,798 | 850,869,732 |
| Distributions to shareholders | (281,648,202) | (186,504,252) |
| Share transactions - net increase (decrease) | 55,749,404 | (21,442,735) |
| Total increase (decrease) in net assets | (195,704,000) | 642,922,745 |
| Net Assets | | |
| Beginning of period | 3,125,332,652 | 2,482,409,907 |
| End of period | $2,929,628,652 | $3,125,332,652 |
See accompanying notes which are an integral part of the financial statements.
Financial Highlights
Fidelity Advisor Freedom 2025 Fund Class A
| Years ended March 31, | 2022 | 2021 | 2020 | 2019 | 2018 |
| Selected Per–Share Data | | | | | |
| Net asset value, beginning of period | $14.62 | $11.55 | $12.99 | $13.74 | $13.16 |
| Income from Investment Operations | | | | | |
| Net investment income (loss)A,B | .29 | .10 | .18 | .21 | .15 |
| Net realized and unrealized gain (loss) | (.14) | 3.84 | (.76) | .18 | 1.15 |
| Total from investment operations | .15 | 3.94 | (.58) | .39 | 1.30 |
| Distributions from net investment income | (.30) | (.12) | (.19) | (.21) | (.17) |
| Distributions from net realized gain | (1.02) | (.76) | (.67) | (.93) | (.55) |
| Total distributions | (1.32) | (.87)C | (.86) | (1.14) | (.72) |
| Net asset value, end of period | $13.45 | $14.62 | $11.55 | $12.99 | $13.74 |
| Total ReturnD,E | .64% | 35.22% | (5.09)% | 3.34% | 9.96% |
| Ratios to Average Net AssetsB,F,G | | | | | |
| Expenses before reductions | .88% | .89% | .89% | .90% | .80% |
| Expenses net of fee waivers, if any | .88% | .89% | .89% | .90% | .80% |
| Expenses net of all reductions | .88% | .89% | .89% | .90% | .80% |
| Net investment income (loss) | 2.01% | .76% | 1.40% | 1.62% | 1.11% |
| Supplemental Data | | | | | |
| Net assets, end of period (000 omitted) | $1,161,792 | $1,276,609 | $1,043,442 | $1,304,020 | $1,435,987 |
| Portfolio turnover rateH | 36% | 28% | 29% | 24% | 23% |
A Calculated based on average shares outstanding during the period.
B Net investment income (loss) is affected by the timing of the declaration of dividends by any underlying mutual funds or exchange-traded funds (ETFs). Net investment income (loss) of any such underlying funds is not included in the Fund's net investment income (loss) ratio.
C Total distributions per share do not sum due to rounding.
D Total returns would have been lower if certain expenses had not been reduced during the applicable periods shown.
E Total returns do not include the effect of the sales charges.
F Fees and expenses of any underlying mutual funds or exchange-traded funds (ETFs) are not included in the Fund's expense ratio. The Fund indirectly bears its proportionate share of these expenses. For additional expense information related to investments in Fidelity Central Funds, please refer to the "Investments in Fidelity Central Funds" note found in the Notes to Financial Statements section of the most recent Annual or Semi-Annual report.
G Expense ratios reflect operating expenses of the class. Expenses before reductions do not reflect amounts reimbursed, waived, or reduced through arrangements with the investment adviser, brokerage services, or other offset arrangements, if applicable, and do not represent the amount paid by the class during periods when reimbursements, waivers or reductions occur.
H Amount does not include the portfolio activity of any underlying mutual funds or exchange-traded funds (ETFs).
See accompanying notes which are an integral part of the financial statements.
Fidelity Advisor Freedom 2025 Fund Class M
| Years ended March 31, | 2022 | 2021 | 2020 | 2019 | 2018 |
| Selected Per–Share Data | | | | | |
| Net asset value, beginning of period | $14.64 | $11.57 | $13.01 | $13.76 | $13.18 |
| Income from Investment Operations | | | | | |
| Net investment income (loss)A,B | .26 | .07 | .15 | .18 | .12 |
| Net realized and unrealized gain (loss) | (.15) | 3.84 | (.76) | .18 | 1.15 |
| Total from investment operations | .11 | 3.91 | (.61) | .36 | 1.27 |
| Distributions from net investment income | (.28) | (.09) | (.16) | (.19) | (.14) |
| Distributions from net realized gain | (1.02) | (.75) | (.67) | (.92) | (.55) |
| Total distributions | (1.29)C | (.84) | (.83) | (1.11) | (.69) |
| Net asset value, end of period | $13.46 | $14.64 | $11.57 | $13.01 | $13.76 |
| Total ReturnD,E | .38% | 34.85% | (5.31)% | 3.09% | 9.69% |
| Ratios to Average Net AssetsB,F,G | | | | | |
| Expenses before reductions | 1.13% | 1.14% | 1.14% | 1.15% | 1.05% |
| Expenses net of fee waivers, if any | 1.13% | 1.14% | 1.14% | 1.15% | 1.05% |
| Expenses net of all reductions | 1.13% | 1.14% | 1.14% | 1.15% | 1.05% |
| Net investment income (loss) | 1.76% | .51% | 1.15% | 1.37% | .86% |
| Supplemental Data | | | | | |
| Net assets, end of period (000 omitted) | $405,616 | $432,038 | $362,131 | $423,584 | $432,227 |
| Portfolio turnover rateH | 36% | 28% | 29% | 24% | 23% |
A Calculated based on average shares outstanding during the period.
B Net investment income (loss) is affected by the timing of the declaration of dividends by any underlying mutual funds or exchange-traded funds (ETFs). Net investment income (loss) of any such underlying funds is not included in the Fund's net investment income (loss) ratio.
C Total distributions per share do not sum due to rounding.
D Total returns would have been lower if certain expenses had not been reduced during the applicable periods shown.
E Total returns do not include the effect of the sales charges.
F Fees and expenses of any underlying mutual funds or exchange-traded funds (ETFs) are not included in the Fund's expense ratio. The Fund indirectly bears its proportionate share of these expenses. For additional expense information related to investments in Fidelity Central Funds, please refer to the "Investments in Fidelity Central Funds" note found in the Notes to Financial Statements section of the most recent Annual or Semi-Annual report.
G Expense ratios reflect operating expenses of the class. Expenses before reductions do not reflect amounts reimbursed, waived, or reduced through arrangements with the investment adviser, brokerage services, or other offset arrangements, if applicable, and do not represent the amount paid by the class during periods when reimbursements, waivers or reductions occur.
H Amount does not include the portfolio activity of any underlying mutual funds or exchange-traded funds (ETFs).
See accompanying notes which are an integral part of the financial statements.
Fidelity Advisor Freedom 2025 Fund Class C
| Years ended March 31, | 2022 | 2021 | 2020 | 2019 | 2018 |
| Selected Per–Share Data | | | | | |
| Net asset value, beginning of period | $14.33 | $11.35 | $12.80 | $13.54 | $12.98 |
| Income from Investment Operations | | | | | |
| Net investment income (loss)A,B | .18 | –C | .08 | .11 | .05 |
| Net realized and unrealized gain (loss) | (.14) | 3.77 | (.75) | .18 | 1.13 |
| Total from investment operations | .04 | 3.77 | (.67) | .29 | 1.18 |
| Distributions from net investment income | (.21) | (.04) | (.11) | (.13) | (.08) |
| Distributions from net realized gain | (1.02) | (.75) | (.66) | (.91) | (.54) |
| Total distributions | (1.23) | (.79) | (.78)D | (1.03)D | (.62) |
| Net asset value, end of period | $13.14 | $14.33 | $11.35 | $12.80 | $13.54 |
| Total ReturnE,F | (.12)% | 34.28% | (5.85)% | 2.59% | 9.14% |
| Ratios to Average Net AssetsB,G,H | | | | | |
| Expenses before reductions | 1.63% | 1.64% | 1.64% | 1.65% | 1.55% |
| Expenses net of fee waivers, if any | 1.63% | 1.64% | 1.64% | 1.65% | 1.55% |
| Expenses net of all reductions | 1.63% | 1.64% | 1.64% | 1.65% | 1.55% |
| Net investment income (loss) | 1.26% | .01% | .65% | .87% | .36% |
| Supplemental Data | | | | | |
| Net assets, end of period (000 omitted) | $46,295 | $60,128 | $51,559 | $64,691 | $97,691 |
| Portfolio turnover rateI | 36% | 28% | 29% | 24% | 23% |
A Calculated based on average shares outstanding during the period.
B Net investment income (loss) is affected by the timing of the declaration of dividends by any underlying mutual funds or exchange-traded funds (ETFs). Net investment income (loss) of any such underlying funds is not included in the Fund's net investment income (loss) ratio.
C Amount represents less than $.005 per share.
D Total distributions per share do not sum due to rounding.
E Total returns would have been lower if certain expenses had not been reduced during the applicable periods shown.
F Total returns do not include the effect of the contingent deferred sales charge.
G Fees and expenses of any underlying mutual funds or exchange-traded funds (ETFs) are not included in the Fund's expense ratio. The Fund indirectly bears its proportionate share of these expenses. For additional expense information related to investments in Fidelity Central Funds, please refer to the "Investments in Fidelity Central Funds" note found in the Notes to Financial Statements section of the most recent Annual or Semi-Annual report.
H Expense ratios reflect operating expenses of the class. Expenses before reductions do not reflect amounts reimbursed, waived, or reduced through arrangements with the investment adviser, brokerage services, or other offset arrangements, if applicable, and do not represent the amount paid by the class during periods when reimbursements, waivers or reductions occur.
I Amount does not include the portfolio activity of any underlying mutual funds or exchange-traded funds (ETFs).
See accompanying notes which are an integral part of the financial statements.
Fidelity Advisor Freedom 2025 Fund Class I
| Years ended March 31, | 2022 | 2021 | 2020 | 2019 | 2018 |
| Selected Per–Share Data | | | | | |
| Net asset value, beginning of period | $14.77 | $11.66 | $13.11 | $13.86 | $13.27 |
| Income from Investment Operations | | | | | |
| Net investment income (loss)A,B | .33 | .14 | .22 | .25 | .19 |
| Net realized and unrealized gain (loss) | (.14) | 3.88 | (.77) | .18 | 1.16 |
| Total from investment operations | .19 | 4.02 | (.55) | .43 | 1.35 |
| Distributions from net investment income | (.33) | (.15) | (.22) | (.25) | (.21) |
| Distributions from net realized gain | (1.02) | (.76) | (.67) | (.93) | (.55) |
| Total distributions | (1.35) | (.91) | (.90)C | (1.18) | (.76) |
| Net asset value, end of period | $13.61 | $14.77 | $11.66 | $13.11 | $13.86 |
| Total ReturnD | .89% | 35.57% | (4.89)% | 3.63% | 10.26% |
| Ratios to Average Net AssetsB,E,F | | | | | |
| Expenses before reductions | .63% | .64% | .64% | .65% | .56% |
| Expenses net of fee waivers, if any | .63% | .64% | .64% | .65% | .56% |
| Expenses net of all reductions | .63% | .64% | .64% | .65% | .56% |
| Net investment income (loss) | 2.26% | 1.01% | 1.65% | 1.87% | 1.35% |
| Supplemental Data | | | | | |
| Net assets, end of period (000 omitted) | $1,026,796 | $1,150,782 | $911,020 | $1,051,420 | $1,018,536 |
| Portfolio turnover rateG | 36% | 28% | 29% | 24% | 23% |
A Calculated based on average shares outstanding during the period.
B Net investment income (loss) is affected by the timing of the declaration of dividends by any underlying mutual funds or exchange-traded funds (ETFs). Net investment income (loss) of any such underlying funds is not included in the Fund's net investment income (loss) ratio.
C Total distributions per share do not sum due to rounding.
D Total returns would have been lower if certain expenses had not been reduced during the applicable periods shown.
E Fees and expenses of any underlying mutual funds or exchange-traded funds (ETFs) are not included in the Fund's expense ratio. The Fund indirectly bears its proportionate share of these expenses. For additional expense information related to investments in Fidelity Central Funds, please refer to the "Investments in Fidelity Central Funds" note found in the Notes to Financial Statements section of the most recent Annual or Semi-Annual report.
F Expense ratios reflect operating expenses of the class. Expenses before reductions do not reflect amounts reimbursed, waived, or reduced through arrangements with the investment adviser, brokerage services, or other offset arrangements, if applicable, and do not represent the amount paid by the class during periods when reimbursements, waivers or reductions occur.
G Amount does not include the portfolio activity of any underlying mutual funds or exchange-traded funds (ETFs).
See accompanying notes which are an integral part of the financial statements.
Fidelity Advisor Freedom 2025 Fund Class Z
| Years ended March 31, | 2022 | 2021 | 2020 | 2019 A |
| Selected Per–Share Data | | | | |
| Net asset value, beginning of period | $14.65 | $11.58 | $13.05 | $13.78 |
| Income from Investment Operations | | | | |
| Net investment income (loss)B,C | .34 | .15 | .23 | .03 |
| Net realized and unrealized gain (loss) | (.14) | 3.85 | (.76) | (.02) |
| Total from investment operations | .20 | 4.00 | (.53) | .01 |
| Distributions from net investment income | (.35) | (.17) | (.27) | (.30) |
| Distributions from net realized gain | (1.02) | (.76) | (.67) | (.44) |
| Total distributions | (1.37) | (.93) | (.94) | (.74) |
| Net asset value, end of period | $13.48 | $14.65 | $11.58 | $13.05 |
| Total ReturnD,E | .94% | 35.65% | (4.77)% | .56% |
| Ratios to Average Net AssetsC,F,G | | | | |
| Expenses before reductions | .54%H | .55% | .56% | .56%I |
| Expenses net of fee waivers, if any | .54%H | .55% | .56% | .56%I |
| Expenses net of all reductions | .54%H | .55% | .56% | .56%I |
| Net investment income (loss) | 2.34% | 1.10% | 1.74% | .43%I |
| Supplemental Data | | | | |
| Net assets, end of period (000 omitted) | $94,133 | $60,905 | $36,620 | $3,396 |
| Portfolio turnover rateJ | 36% | 28% | 29% | 24% |
A For the period October 2, 2018 (commencement of sale of shares) through March 31, 2019.
B Calculated based on average shares outstanding during the period.
C Net investment income (loss) is affected by the timing of the declaration of dividends by any underlying mutual funds or exchange-traded funds (ETFs). Net investment income (loss) of any such underlying funds is not included in the Fund's net investment income (loss) ratio.
D Total returns for periods of less than one year are not annualized.
E Total returns would have been lower if certain expenses had not been reduced during the applicable periods shown.
F Fees and expenses of any underlying mutual funds or exchange-traded funds (ETFs) are not included in the Fund's expense ratio. The Fund indirectly bears its proportionate share of these expenses. For additional expense information related to investments in Fidelity Central Funds, please refer to the "Investments in Fidelity Central Funds" note found in the Notes to Financial Statements section of the most recent Annual or Semi-Annual report.
G Expense ratios reflect operating expenses of the class. Expenses before reductions do not reflect amounts reimbursed, waived, or reduced through arrangements with the investment adviser, brokerage services, or other offset arrangements, if applicable, and do not represent the amount paid by the class during periods when reimbursements, waivers or reductions occur.
H On certain classes, the size and fluctuation of net assets and expense amounts may cause ratios to differ from contractual rates.
I Annualized
J Amount does not include the portfolio activity of any underlying mutual funds or exchange-traded funds (ETFs).
See accompanying notes which are an integral part of the financial statements.
Fidelity Advisor Freedom 2025 Fund Class Z6
| Years ended March 31, | 2022 | 2021 | 2020 | 2019 | 2018 A |
| Selected Per–Share Data | | | | | |
| Net asset value, beginning of period | $14.71 | $11.62 | $13.08 | $13.85 | $13.53 |
| Income from Investment Operations | | | | | |
| Net investment income (loss)B,C | .36 | .16 | .24 | .27 | .10 |
| Net realized and unrealized gain (loss) | (.15) | 3.87 | (.77) | .18 | .80 |
| Total from investment operations | .21 | 4.03 | (.53) | .45 | .90 |
| Distributions from net investment income | (.36) | (.18) | (.26) | (.29) | (.22) |
| Distributions from net realized gain | (1.02) | (.76) | (.67) | (.93) | (.36) |
| Total distributions | (1.37)D | (.94) | (.93) | (1.22) | (.58) |
| Net asset value, end of period | $13.55 | $14.71 | $11.62 | $13.08 | $13.85 |
| Total ReturnE,F | 1.07% | 35.82% | (4.72)% | 3.85% | 6.61% |
| Ratios to Average Net AssetsC,G,H | | | | | |
| Expenses before reductions | .44% | .44% | .45% | .45% | .47%I,J |
| Expenses net of fee waivers, if any | .44% | .44% | .45% | .45% | .47%I,J |
| Expenses net of all reductions | .44% | .44% | .45% | .45% | .47%I,J |
| Net investment income (loss) | 2.45% | 1.21% | 1.85% | 2.07% | .89%I |
| Supplemental Data | | | | | |
| Net assets, end of period (000 omitted) | $194,996 | $144,871 | $77,638 | $56,103 | $24,926 |
| Portfolio turnover rateK | 36% | 28% | 29% | 24% | 23% |
A For the period June 6, 2017 (commencement of sale of shares) through March 31, 2018.
B Calculated based on average shares outstanding during the period.
C Net investment income (loss) is affected by the timing of the declaration of dividends by any underlying mutual funds or exchange-traded funds (ETFs). Net investment income (loss) of any such underlying funds is not included in the Fund's net investment income (loss) ratio.
D Total distributions per share do not sum due to rounding.
E Total returns for periods of less than one year are not annualized.
F Total returns would have been lower if certain expenses had not been reduced during the applicable periods shown.
G Fees and expenses of any underlying mutual funds or exchange-traded funds (ETFs) are not included in the Fund's expense ratio. The Fund indirectly bears its proportionate share of these expenses. For additional expense information related to investments in Fidelity Central Funds, please refer to the "Investments in Fidelity Central Funds" note found in the Notes to Financial Statements section of the most recent Annual or Semi-Annual report.
H Expense ratios reflect operating expenses of the class. Expenses before reductions do not reflect amounts reimbursed, waived, or reduced through arrangements with the investment adviser, brokerage services, or other offset arrangements, if applicable, and do not represent the amount paid by the class during periods when reimbursements, waivers or reductions occur.
I Annualized
J On certain classes, the size and fluctuation of net assets and expense amounts may cause ratios to differ from contractual rates.
K Amount does not include the portfolio activity of any underlying mutual funds or exchange-traded funds (ETFs).
See accompanying notes which are an integral part of the financial statements.
Fidelity Advisor Freedom® 2030 Fund
Investment Summary (Unaudited)
The information in the following tables is based on the direct investments of the Fund.
Top Holdings as of March 31, 2022
| | % of fund's net assets |
| Fidelity Series Investment Grade Bond Fund | 21.9 |
| Fidelity Series Emerging Markets Opportunities Fund | 9.9 |
| Fidelity Series Large Cap Stock Fund | 6.5 |
| Fidelity Series International Value Fund | 5.3 |
| Fidelity Series Overseas Fund | 5.3 |
| Fidelity Series International Growth Fund | 5.3 |
| Fidelity Series Long-Term Treasury Bond Index Fund | 5.1 |
| Fidelity Series Value Discovery Fund | 4.2 |
| Fidelity Series Stock Selector Large Cap Value Fund | 4.1 |
| Fidelity Advisor Series Equity Growth Fund | 4.1 |
| | 71.7 |
Asset Allocation (% of fund's net assets)
| Period end |
| | Domestic Equity Funds | 33.6% |
| | International Equity Funds | 30.6% |
| | Bond Funds | 35.1% |
| | Short-Term Funds | 0.6% |
| | Short-Term Investments | 0.1% |

Domestic Equity Funds category includes Fidelity Series Commodity Strategy Fund which invests in commodity-related investments.
Fidelity Advisor Freedom® 2030 Fund
Schedule of Investments March 31, 2022
Showing Percentage of Net Assets
| U.S. Treasury Obligations - 0.1% | | | |
| | | Principal Amount | Value |
| U.S. Treasury Bills, yield at date of purchase 0.17% to 0.38% 4/21/22 to 6/9/22 (a) | | | |
| (Cost $1,289,366) | | 1,290,000 | 1,289,390 |
| | | Shares | Value |
|
| Domestic Equity Funds - 33.6% | | | |
| Fidelity Advisor Series Equity Growth Fund (b) | | 8,930,237 | $137,793,553 |
| Fidelity Advisor Series Growth Opportunities Fund (b) | | 7,727,145 | 94,502,979 |
| Fidelity Advisor Series Small Cap Fund (b) | | 4,814,876 | 62,545,241 |
| Fidelity Series All-Sector Equity Fund (b) | | 5,482,650 | 59,102,963 |
| Fidelity Series Commodity Strategy Fund (b) | | 9,758,185 | 49,864,325 |
| Fidelity Series Large Cap Stock Fund (b) | | 11,405,928 | 216,826,686 |
| Fidelity Series Large Cap Value Index Fund (b) | | 1,526,781 | 23,451,357 |
| Fidelity Series Opportunistic Insights Fund (b) | | 6,966,421 | 127,346,178 |
| Fidelity Series Small Cap Opportunities Fund (b) | | 5,669,705 | 77,221,382 |
| Fidelity Series Stock Selector Large Cap Value Fund (b) | | 10,213,410 | 138,391,706 |
| Fidelity Series Value Discovery Fund (b) | | 8,810,104 | 140,961,665 |
| TOTAL DOMESTIC EQUITY FUNDS | | | |
| (Cost $830,230,072) | | | 1,128,008,035 |
|
| International Equity Funds - 30.6% | | | |
| Fidelity Series Canada Fund (b) | | 4,981,149 | 77,307,427 |
| Fidelity Series Emerging Markets Fund (b) | | 3,956,416 | 36,715,537 |
| Fidelity Series Emerging Markets Opportunities Fund (b) | | 17,982,200 | 330,872,482 |
| Fidelity Series International Growth Fund (b) | | 10,674,613 | 176,985,081 |
| Fidelity Series International Small Cap Fund (b) | | 2,716,540 | 48,761,896 |
| Fidelity Series International Value Fund (b) | | 16,239,025 | 179,116,446 |
| Fidelity Series Overseas Fund (b) | | 14,105,756 | 178,014,643 |
| TOTAL INTERNATIONAL EQUITY FUNDS | | | |
| (Cost $835,275,193) | | | 1,027,773,512 |
|
| Bond Funds - 35.1% | | | |
| Fidelity Series 5+ Year Inflation-Protected Bond Index Fund (b) | | 9,146,754 | 87,808,843 |
| Fidelity Series Emerging Markets Debt Fund (b) | | 2,011,861 | 16,597,853 |
| Fidelity Series Emerging Markets Debt Local Currency Fund (b) | | 622,870 | 5,612,058 |
| Fidelity Series Floating Rate High Income Fund (b) | | 369,118 | 3,392,195 |
| Fidelity Series High Income Fund (b) | | 2,224,662 | 20,222,174 |
| Fidelity Series Inflation-Protected Bond Index Fund (b) | | 2,272,087 | 23,061,684 |
| Fidelity Series International Credit Fund (b) | | 184,293 | 1,706,551 |
| Fidelity Series International Developed Markets Bond Index Fund (b) | | 10,924,231 | 101,923,080 |
| Fidelity Series Investment Grade Bond Fund (b) | | 67,448,747 | 735,865,825 |
| Fidelity Series Long-Term Treasury Bond Index Fund (b) | | 22,363,569 | 170,410,396 |
| Fidelity Series Real Estate Income Fund (b) | | 1,066,919 | 12,120,195 |
| TOTAL BOND FUNDS | | | |
| (Cost $1,231,631,412) | | | 1,178,720,854 |
|
| Short-Term Funds - 0.6% | | | |
| Fidelity Cash Central Fund 0.31% (c) | | 2,651,363 | 2,651,893 |
| Fidelity Series Government Money Market Fund 0.31% (b)(d) | | 13,551,946 | 13,551,946 |
| Fidelity Series Short-Term Credit Fund (b) | | 348,344 | 3,396,357 |
| TOTAL SHORT-TERM FUNDS | | | |
| (Cost $19,634,568) | | | 19,600,196 |
| TOTAL INVESTMENT IN SECURITIES - 100.0% | | | |
| (Cost $2,918,060,611) | | | 3,355,391,987 |
| NET OTHER ASSETS (LIABILITIES) - 0.0% | | | (792,159) |
| NET ASSETS - 100% | | | $3,354,599,828 |
| Futures Contracts | | | | | |
| | Number of contracts | Expiration Date | Notional Amount | Value | Unrealized Appreciation/(Depreciation) |
| Purchased | | | | | |
| Equity Index Contracts | | | | | |
| ICE E-mini MSCI EAFE Index Contracts (United States) | 85 | June 2022 | $9,113,700 | $480,407 | $480,407 |
| ICE E-mini MSCI Emerging Markets Index Contracts (United States) | 186 | June 2022 | 10,467,150 | 340,259 | 340,259 |
|
| TOTAL PURCHASED | | | | | 820,666 |
|
| Sold | | | | | |
| Equity Index Contracts | | | | | |
| CME Micro E-mini S&P 500 Index Contracts (United States) | 73 | June 2022 | 16,537,238 | (33,826) | (33,826) |
| TOTAL FUTURES CONTRACTS | | | | | $786,840 |
The notional amount of futures purchased as a percentage of Net Assets is 0.6%
The notional amount of futures sold as a percentage of Net Assets is 0.5%
Legend
(a) Security or a portion of the security was pledged to cover margin requirements for futures contracts. At period end, the value of securities pledged amounted to $1,031,451.
(b) Affiliated Fund
(c) Affiliated fund that is generally available only to investment companies and other accounts managed by Fidelity Investments. The rate quoted is the annualized seven-day yield of the fund at period end. A complete unaudited listing of the fund's holdings as of its most recent quarter end is available upon request. In addition, each Fidelity Central Fund's financial statements, which are not covered by the Fund's Report of Independent Registered Public Accounting Firm, are available on the SEC's website or upon request.
(d) The rate quoted is the annualized seven-day yield of the fund at period end.
Affiliated Central Funds
Fiscal year to date information regarding the Fund's investments in Fidelity Central Funds, including the ownership percentage, is presented below.
| Fund | Value, beginning of period | Purchases(a) | Sales Proceeds(a) | Dividend Income | Realized Gain/Loss | Change in Unrealized appreciation (depreciation) | Value, end of period | % ownership, end of period |
| Fidelity Cash Central Fund 0.31% | $3,332,299 | $13,244,482 | $13,924,887 | $1,447 | $-- | $(1) | $2,651,893 | 0.0% |
| Total | $3,332,299 | $13,244,482 | $13,924,887 | $1,447 | $-- | $(1) | $2,651,893 | |
(a) Includes the value of shares purchased or redeemed through in-kind transactions, if applicable.
Amounts in the income column in the above table include any capital gain distributions from underlying funds, which are presented in the corresponding line-item in the Statement of Operations, if applicable.
Affiliated Underlying Funds
Fiscal year to date information regarding the Fund's investments in affiliated Underlying Funds is presented below. Exchanges between classes of the same affiliated Underlying Funds may occur. If an underlying Fund changes its name, the name presented below is the name in effect at period end.
| Fund | Value, beginning of period | Purchases(a) | Sales Proceeds(a) | Dividend Income | Realized Gain (loss) | Change in Unrealized appreciation (depreciation) | Value, end of period |
| Fidelity Advisor Series Equity Growth Fund | $149,529,963 | $49,981,622 | $54,893,342 | $25,829,169 | $3,920,600 | $(10,745,290) | $137,793,553 |
| Fidelity Advisor Series Growth Opportunities Fund | 103,996,741 | 52,252,016 | 34,890,540 | 23,894,671 | 98,345 | (26,953,583) | 94,502,979 |
| Fidelity Advisor Series Small Cap Fund | 67,650,819 | 21,306,214 | 17,606,473 | 12,001,103 | 3,404,206 | (12,209,525) | 62,545,241 |
| Fidelity Series 0-5 Year Inflation-Protected Bond Index Fund | -- | 41,324,359 | 41,277,151 | 50,078 | (39,749) | -- | -- |
| Fidelity Series 5+ Year Inflation-Protected Bond Index Fund | -- | 100,572,697 | 8,784,909 | 532,484 | (257,326) | (3,721,619) | 87,808,843 |
| Fidelity Series All-Sector Equity Fund | 63,929,868 | 17,380,975 | 18,096,556 | 12,160,295 | 1,587,460 | (5,698,784) | 59,102,963 |
| Fidelity Series Canada Fund | 59,860,681 | 15,998,997 | 11,931,606 | 1,636,490 | 368,152 | 13,011,203 | 77,307,427 |
| Fidelity Series Commodity Strategy Fund | 95,042,520 | 35,701,476 | 84,531,479 | 30,064,201 | (3,417,645) | 7,069,453 | 49,864,325 |
| Fidelity Series Emerging Markets Debt Fund | 18,409,545 | 2,871,521 | 2,978,105 | 862,894 | (198,134) | (1,506,974) | 16,597,853 |
| Fidelity Series Emerging Markets Debt Local Currency Fund | 5,920,666 | 1,270,803 | 928,201 | 243,762 | (41,723) | (609,487) | 5,612,058 |
| Fidelity Series Emerging Markets Fund | 43,613,936 | 9,412,455 | 7,559,654 | 1,316,568 | 510,967 | (9,262,167) | 36,715,537 |
| Fidelity Series Emerging Markets Opportunities Fund | 395,593,052 | 122,579,535 | 73,154,998 | 41,641,942 | 5,459,884 | (119,604,991) | 330,872,482 |
| Fidelity Series Floating Rate High Income Fund | 3,630,840 | 370,364 | 610,739 | 154,846 | (19,434) | 21,164 | 3,392,195 |
| Fidelity Series Government Money Market Fund 0.31% | 60,525,573 | 17,766,917 | 64,740,544 | 40,819 | -- | -- | 13,551,946 |
| Fidelity Series High Income Fund | 21,420,125 | 3,030,289 | 3,541,927 | 1,188,445 | (82,057) | (604,256) | 20,222,174 |
| Fidelity Series Inflation-Protected Bond Index Fund | 192,943,059 | 21,450,975 | 193,352,162 | 7,100,375 | 12,489,850 | (10,470,038) | 23,061,684 |
| Fidelity Series International Credit Fund | 1,781,187 | 57,482 | -- | 57,482 | -- | (132,118) | 1,706,551 |
| Fidelity Series International Developed Markets Bond Index Fund | -- | 108,802,236 | 2,416,925 | 34,014 | (46,058) | (4,416,173) | 101,923,080 |
| Fidelity Series International Growth Fund | 167,745,684 | 52,280,192 | 27,579,046 | 15,140,130 | 307,573 | (15,769,322) | 176,985,081 |
| Fidelity Series International Small Cap Fund | 53,159,585 | 9,091,736 | 6,152,847 | 6,912,574 | 1,185,779 | (8,522,357) | 48,761,896 |
| Fidelity Series International Value Fund | 167,560,003 | 49,832,686 | 41,433,643 | 9,497,989 | 1,427,519 | 1,729,881 | 179,116,446 |
| Fidelity Series Investment Grade Bond Fund | 712,021,525 | 169,634,814 | 105,547,569 | 16,825,138 | (1,909,498) | (38,333,447) | 735,865,825 |
| Fidelity Series Large Cap Stock Fund | 233,493,403 | 41,084,018 | 65,284,061 | 21,425,325 | 7,612,907 | (79,581) | 216,826,686 |
| Fidelity Series Large Cap Value Index Fund | 25,200,199 | 3,100,254 | 6,079,345 | 1,654,023 | 1,029,970 | 200,279 | 23,451,357 |
| Fidelity Series Long-Term Treasury Bond Index Fund | 93,652,657 | 105,470,065 | 21,691,423 | 2,808,226 | (2,870,717) | (4,150,186) | 170,410,396 |
| Fidelity Series Opportunistic Insights Fund | 138,635,127 | 46,868,608 | 47,642,239 | 25,173,780 | 4,992,444 | (15,507,762) | 127,346,178 |
| Fidelity Series Overseas Fund | 168,025,490 | 41,159,869 | 30,727,993 | 5,610,648 | 2,014,528 | (2,457,251) | 178,014,643 |
| Fidelity Series Real Estate Income Fund | 13,136,561 | 1,035,273 | 2,444,549 | 524,347 | 86,786 | 306,124 | 12,120,195 |
| Fidelity Series Short-Term Credit Fund | 12,395,858 | 4,529,524 | 13,164,439 | 209,627 | (209,169) | (155,417) | 3,396,357 |
| Fidelity Series Small Cap Opportunities Fund | 83,495,484 | 33,935,567 | 21,424,012 | 21,173,203 | 1,440,882 | (20,226,539) | 77,221,382 |
| Fidelity Series Stock Selector Large Cap Value Fund | 147,872,038 | 37,839,162 | 41,277,802 | 25,916,471 | 3,273,325 | (9,315,017) | 138,391,706 |
| Fidelity Series Value Discovery Fund | 151,375,272 | 29,902,179 | 42,153,608 | 17,228,513 | 4,983,817 | (3,145,995) | 140,961,665 |
| | $3,451,617,461 | $1,247,894,880 | $1,093,897,887 | $328,909,632 | $47,103,484 | $(301,259,775) | $3,351,450,704 |
(a) Includes the value of shares purchased or redeemed through in-kind transactions, if applicable.
Amounts in the income column in the above table include any capital gain distributions from underlying funds, which are presented in the corresponding line-item in the Statement of Operations, if applicable.
Investment Valuation
The following is a summary of the inputs used, as of March 31, 2022, involving the Fund's assets and liabilities carried at fair value. The inputs or methodology used for valuing securities may not be an indication of the risk associated with investing in those securities. For more information on valuation inputs, and their aggregation into the levels used below, please refer to the Investment Valuation section in the accompanying Notes to Financial Statements.
| | Valuation Inputs at Reporting Date: |
| Description | Total | Level 1 | Level 2 | Level 3 |
| Investments in Securities: | | | | |
| Other Short-Term Investments and Net Other Assets | $1,289,390 | $-- | $1,289,390 | $-- |
| Domestic Equity Funds | 1,128,008,035 | 1,128,008,035 | -- | -- |
| International Equity Funds | 1,027,773,512 | 1,027,773,512 | -- | -- |
| Bond Funds | 1,178,720,854 | 1,178,720,854 | -- | -- |
| Short-Term Funds | 19,600,196 | 19,600,196 | -- | -- |
| Total Investments in Securities: | $3,355,391,987 | $3,354,102,597 | $1,289,390 | $-- |
| Derivative Instruments: | | | | |
| Assets | | | | |
| Futures Contracts | $820,666 | $820,666 | $-- | $-- |
| Total Assets | $820,666 | $820,666 | $-- | $-- |
| Liabilities | | | | |
| Futures Contracts | $(33,826) | $(33,826) | $-- | $-- |
| Total Liabilities | $(33,826) | $(33,826) | $-- | $-- |
| Total Derivative Instruments: | $786,840 | $786,840 | $-- | $-- |
Value of Derivative Instruments
The following table is a summary of the Fund's value of derivative instruments by primary risk exposure as of March 31, 2022. For additional information on derivative instruments, please refer to the Derivative Instruments section in the accompanying Notes to Financial Statements.
| Primary Risk Exposure / Derivative Type | Value |
| | Asset | Liability |
| Equity Risk | | |
| Futures Contracts(a) | $820,666 | $(33,826) |
| Total Equity Risk | 820,666 | (33,826) |
| Total Value of Derivatives | $820,666 | $(33,826) |
(a) Reflects gross cumulative appreciation (depreciation) on futures contracts as presented in the Schedule of Investments. In the Statement of Assets and Liabilities, the period end daily variation margin is included in receivable or payable for daily variation margin on futures contracts, and the net cumulative appreciation (depreciation) is included in Total accumulated earnings (loss).
See accompanying notes which are an integral part of the financial statements.
Fidelity Advisor Freedom® 2030 Fund
Financial Statements
Statement of Assets and Liabilities
| | | March 31, 2022 |
| Assets | | |
Investment in securities, at value — See accompanying schedule:
Unaffiliated issuers (cost $1,289,366) | $1,289,390 | |
| Fidelity Central Funds (cost $2,651,841) | 2,651,893 | |
| Other affiliated issuers (cost $2,914,119,404) | 3,351,450,704 | |
| Total Investment in Securities (cost $2,918,060,611) | | $3,355,391,987 |
| Receivable for investments sold | | 61,052,357 |
| Receivable for fund shares sold | | 2,172,565 |
| Distributions receivable from Fidelity Central Funds | | 379 |
| Total assets | | 3,418,617,288 |
| Liabilities | | |
| Payable for investments purchased | $57,424,457 | |
| Payable for fund shares redeemed | 4,084,655 | |
| Accrued management fee | 1,802,600 | |
| Distribution and service plan fees payable | 503,243 | |
| Payable for daily variation margin on futures contracts | 202,505 | |
| Total liabilities | | 64,017,460 |
| Net Assets | | $3,354,599,828 |
| Net Assets consist of: | | |
| Paid in capital | | $2,754,173,274 |
| Total accumulated earnings (loss) | | 600,426,554 |
| Net Assets | | $3,354,599,828 |
| Net Asset Value and Maximum Offering Price | | |
| Class A: | | |
| Net Asset Value and redemption price per share ($1,246,929,793 ÷ 84,535,598 shares)(a) | | $14.75 |
| Maximum offering price per share (100/94.25 of $14.75) | | $15.65 |
| Class M: | | |
| Net Asset Value and redemption price per share ($477,840,909 ÷ 32,677,307 shares)(a) | | $14.62 |
| Maximum offering price per share (100/96.50 of $14.62) | | $15.15 |
| Class C: | | |
| Net Asset Value and offering price per share ($58,819,913 ÷ 4,107,252 shares)(a) | | $14.32 |
| Class I: | | |
| Net Asset Value, offering price and redemption price per share ($1,242,060,393 ÷ 83,548,896 shares) | | $14.87 |
| Class Z: | | |
| Net Asset Value, offering price and redemption price per share ($102,337,163 ÷ 6,945,382 shares) | | $14.73 |
| Class Z6: | | |
| Net Asset Value, offering price and redemption price per share ($226,611,657 ÷ 15,311,246 shares) | | $14.80 |
(a) Redemption price per share is equal to net asset value less any applicable contingent deferred sales charge.
See accompanying notes which are an integral part of the financial statements.
Statement of Operations
| | | Year ended March 31, 2022 |
| Investment Income | | |
| Dividends: | | |
| Affiliated issuers | | $103,446,120 |
| Interest | | 614 |
| Income from Fidelity Central Funds | | 1,447 |
| Total income | | 103,448,181 |
| Expenses | | |
| Management fee | $23,266,316 | |
| Distribution and service plan fees | 6,564,888 | |
| Independent trustees' fees and expenses | 10,754 | |
| Total expenses before reductions | 29,841,958 | |
| Expense reductions | (2) | |
| Total expenses after reductions | | 29,841,956 |
| Net investment income (loss) | | 73,606,225 |
| Realized and Unrealized Gain (Loss) | | |
| Net realized gain (loss) on: | | |
| Investment securities: | | |
| Unaffiliated issuers | 2,112 | |
| Affiliated issuers | 47,103,484 | |
| Futures contracts | 671,595 | |
| Capital gain distributions from underlying funds: | | |
| Affiliated issuers | 225,463,512 | |
| Total net realized gain (loss) | | 273,240,703 |
| Change in net unrealized appreciation (depreciation) on: | | |
| Investment securities: | | |
| Unaffiliated issuers | 9 | |
| Fidelity Central Funds | (1) | |
| Other affiliated issuers | (301,259,775) | |
| Futures contracts | 786,840 | |
| Total change in net unrealized appreciation (depreciation) | | (300,472,927) |
| Net gain (loss) | | (27,232,224) |
| Net increase (decrease) in net assets resulting from operations | | $46,374,001 |
See accompanying notes which are an integral part of the financial statements.
Statement of Changes in Net Assets
| | Year ended March 31, 2022 | Year ended March 31, 2021 |
| Increase (Decrease) in Net Assets | | |
| Operations | | |
| Net investment income (loss) | $73,606,225 | $25,646,197 |
| Net realized gain (loss) | 273,240,703 | 230,155,083 |
| Change in net unrealized appreciation (depreciation) | (300,472,927) | 772,888,900 |
| Net increase (decrease) in net assets resulting from operations | 46,374,001 | 1,028,690,180 |
| Distributions to shareholders | (325,099,563) | (211,698,260) |
| Share transactions - net increase (decrease) | 179,328,125 | 42,304,748 |
| Total increase (decrease) in net assets | (99,397,437) | 859,296,668 |
| Net Assets | | |
| Beginning of period | 3,453,997,265 | 2,594,700,597 |
| End of period | $3,354,599,828 | $3,453,997,265 |
See accompanying notes which are an integral part of the financial statements.
Financial Highlights
Fidelity Advisor Freedom 2030 Fund Class A
| Years ended March 31, | 2022 | 2021 | 2020 | 2019 | 2018 |
| Selected Per–Share Data | | | | | |
| Net asset value, beginning of period | $16.00 | $12.21 | $14.01 | $14.95 | $14.12 |
| Income from Investment Operations | | | | | |
| Net investment income (loss)A,B | .32 | .11 | .19 | .23 | .15 |
| Net realized and unrealized gain (loss) | (.09) | 4.67 | (1.01) | .19 | 1.50 |
| Total from investment operations | .23 | 4.78 | (.82) | .42 | 1.65 |
| Distributions from net investment income | (.33) | (.13) | (.19) | (.24) | (.16) |
| Distributions from net realized gain | (1.15) | (.87) | (.79) | (1.13) | (.66) |
| Total distributions | (1.48) | (.99)C | (.98) | (1.36)C | (.82) |
| Net asset value, end of period | $14.75 | $16.00 | $12.21 | $14.01 | $14.95 |
| Total ReturnD,E | 1.05% | 40.51% | (6.61)% | 3.43% | 11.80% |
| Ratios to Average Net AssetsB,F,G | | | | | |
| Expenses before reductions | .92% | .93% | .94% | .94%H | .84% |
| Expenses net of fee waivers, if any | .92% | .93% | .94% | .94%H | .84% |
| Expenses net of all reductions | .92% | .93% | .94% | .94%H | .84% |
| Net investment income (loss) | 1.99% | .75% | 1.35% | 1.57% | .99% |
| Supplemental Data | | | | | |
| Net assets, end of period (000 omitted) | $1,246,930 | $1,318,549 | $1,041,706 | $1,279,896 | $1,374,112 |
| Portfolio turnover rateI | 31% | 29% | 33% | 22% | 25% |
A Calculated based on average shares outstanding during the period.
B Net investment income (loss) is affected by the timing of the declaration of dividends by any underlying mutual funds or exchange-traded funds (ETFs). Net investment income (loss) of any such underlying funds is not included in the Fund's net investment income (loss) ratio.
C Total distributions per share do not sum due to rounding.
D Total returns would have been lower if certain expenses had not been reduced during the applicable periods shown.
E Total returns do not include the effect of the sales charges.
F Fees and expenses of any underlying mutual funds or exchange-traded funds (ETFs) are not included in the Fund's expense ratio. The Fund indirectly bears its proportionate share of these expenses. For additional expense information related to investments in Fidelity Central Funds, please refer to the "Investments in Fidelity Central Funds" note found in the Notes to Financial Statements section of the most recent Annual or Semi-Annual report.
G Expense ratios reflect operating expenses of the class. Expenses before reductions do not reflect amounts reimbursed, waived, or reduced through arrangements with the investment adviser, brokerage services, or other offset arrangements, if applicable, and do not represent the amount paid by the class during periods when reimbursements, waivers or reductions occur.
H On certain classes, the size and fluctuation of net assets and expense amounts may cause ratios to differ from contractual rates.
I Amount does not include the portfolio activity of any underlying mutual funds or exchange-traded funds (ETFs).
See accompanying notes which are an integral part of the financial statements.
Fidelity Advisor Freedom 2030 Fund Class M
| Years ended March 31, | 2022 | 2021 | 2020 | 2019 | 2018 |
| Selected Per–Share Data | | | | | |
| Net asset value, beginning of period | $15.88 | $12.13 | $13.93 | $14.88 | $14.06 |
| Income from Investment Operations | | | | | |
| Net investment income (loss)A,B | .28 | .07 | .15 | .19 | .11 |
| Net realized and unrealized gain (loss) | (.09) | 4.64 | (1.00) | .19 | 1.50 |
| Total from investment operations | .19 | 4.71 | (.85) | .38 | 1.61 |
| Distributions from net investment income | (.30) | (.10) | (.17) | (.21) | (.13) |
| Distributions from net realized gain | (1.15) | (.86) | (.78) | (1.12) | (.66) |
| Total distributions | (1.45) | (.96) | (.95) | (1.33) | (.79) |
| Net asset value, end of period | $14.62 | $15.88 | $12.13 | $13.93 | $14.88 |
| Total ReturnC,D | .81% | 40.15% | (6.84)% | 3.12% | 11.53% |
| Ratios to Average Net AssetsB,E,F | | | | | |
| Expenses before reductions | 1.17% | 1.18% | 1.19% | 1.19%G | 1.09% |
| Expenses net of fee waivers, if any | 1.17% | 1.18% | 1.19% | 1.19%G | 1.09% |
| Expenses net of all reductions | 1.17% | 1.18% | 1.19% | 1.19%G | 1.09% |
| Net investment income (loss) | 1.74% | .50% | 1.10% | 1.32% | .74% |
| Supplemental Data | | | | | |
| Net assets, end of period (000 omitted) | $477,841 | $502,610 | $391,371 | $453,917 | $452,750 |
| Portfolio turnover rateH | 31% | 29% | 33% | 22% | 25% |
A Calculated based on average shares outstanding during the period.
B Net investment income (loss) is affected by the timing of the declaration of dividends by any underlying mutual funds or exchange-traded funds (ETFs). Net investment income (loss) of any such underlying funds is not included in the Fund's net investment income (loss) ratio.
C Total returns would have been lower if certain expenses had not been reduced during the applicable periods shown.
D Total returns do not include the effect of the sales charges.
E Fees and expenses of any underlying mutual funds or exchange-traded funds (ETFs) are not included in the Fund's expense ratio. The Fund indirectly bears its proportionate share of these expenses. For additional expense information related to investments in Fidelity Central Funds, please refer to the "Investments in Fidelity Central Funds" note found in the Notes to Financial Statements section of the most recent Annual or Semi-Annual report.
F Expense ratios reflect operating expenses of the class. Expenses before reductions do not reflect amounts reimbursed, waived, or reduced through arrangements with the investment adviser, brokerage services, or other offset arrangements, if applicable, and do not represent the amount paid by the class during periods when reimbursements, waivers or reductions occur.
G On certain classes, the size and fluctuation of net assets and expense amounts may cause ratios to differ from contractual rates.
H Amount does not include the portfolio activity of any underlying mutual funds or exchange-traded funds (ETFs).
See accompanying notes which are an integral part of the financial statements.
Fidelity Advisor Freedom 2030 Fund Class C
| Years ended March 31, | 2022 | 2021 | 2020 | 2019 | 2018 |
| Selected Per–Share Data | | | | | |
| Net asset value, beginning of period | $15.60 | $11.95 | $13.75 | $14.71 | $13.92 |
| Income from Investment Operations | | | | | |
| Net investment income (loss)A,B | .19 | –C | .08 | .12 | .03 |
| Net realized and unrealized gain (loss) | (.08) | 4.55 | (.98) | .18 | 1.48 |
| Total from investment operations | .11 | 4.55 | (.90) | .30 | 1.51 |
| Distributions from net investment income | (.24) | (.05) | (.12) | (.15) | (.07) |
| Distributions from net realized gain | (1.15) | (.85) | (.78) | (1.11) | (.65) |
| Total distributions | (1.39) | (.90) | (.90) | (1.26) | (.72) |
| Net asset value, end of period | $14.32 | $15.60 | $11.95 | $13.75 | $14.71 |
| Total ReturnD,E | .30% | 39.41% | (7.25)% | 2.57% | 10.97% |
| Ratios to Average Net AssetsB,F,G | | | | | |
| Expenses before reductions | 1.67% | 1.68% | 1.69% | 1.69%H | 1.59% |
| Expenses net of fee waivers, if any | 1.67% | 1.68% | 1.69% | 1.69%H | 1.59% |
| Expenses net of all reductions | 1.67% | 1.68% | 1.69% | 1.69%H | 1.59% |
| Net investment income (loss) | 1.24% | - %I | .60% | .82% | .24% |
| Supplemental Data | | | | | |
| Net assets, end of period (000 omitted) | $58,820 | $69,899 | $55,554 | $66,505 | $96,199 |
| Portfolio turnover rateJ | 31% | 29% | 33% | 22% | 25% |
A Calculated based on average shares outstanding during the period.
B Net investment income (loss) is affected by the timing of the declaration of dividends by any underlying mutual funds or exchange-traded funds (ETFs). Net investment income (loss) of any such underlying funds is not included in the Fund's net investment income (loss) ratio.
C Amount represents less than $.005 per share.
D Total returns would have been lower if certain expenses had not been reduced during the applicable periods shown.
E Total returns do not include the effect of the contingent deferred sales charge.
F Fees and expenses of any underlying mutual funds or exchange-traded funds (ETFs) are not included in the Fund's expense ratio. The Fund indirectly bears its proportionate share of these expenses. For additional expense information related to investments in Fidelity Central Funds, please refer to the "Investments in Fidelity Central Funds" note found in the Notes to Financial Statements section of the most recent Annual or Semi-Annual report.
G Expense ratios reflect operating expenses of the class. Expenses before reductions do not reflect amounts reimbursed, waived, or reduced through arrangements with the investment adviser, brokerage services, or other offset arrangements, if applicable, and do not represent the amount paid by the class during periods when reimbursements, waivers or reductions occur.
H On certain classes, the size and fluctuation of net assets and expense amounts may cause ratios to differ from contractual rates.
I Amount represents less than .005%.
J Amount does not include the portfolio activity of any underlying mutual funds or exchange-traded funds (ETFs).
See accompanying notes which are an integral part of the financial statements.
Fidelity Advisor Freedom 2030 Fund Class I
| Years ended March 31, | 2022 | 2021 | 2020 | 2019 | 2018 |
| Selected Per–Share Data | | | | | |
| Net asset value, beginning of period | $16.10 | $12.29 | $14.09 | $15.04 | $14.21 |
| Income from Investment Operations | | | | | |
| Net investment income (loss)A,B | .36 | .15 | .23 | .26 | .18 |
| Net realized and unrealized gain (loss) | (.08) | 4.69 | (1.01) | .19 | 1.51 |
| Total from investment operations | .28 | 4.84 | (.78) | .45 | 1.69 |
| Distributions from net investment income | (.36) | (.15) | (.22) | (.27) | (.21) |
| Distributions from net realized gain | (1.15) | (.88) | (.80) | (1.14) | (.66) |
| Total distributions | (1.51) | (1.03) | (1.02) | (1.40)C | (.86)C |
| Net asset value, end of period | $14.87 | $16.10 | $12.29 | $14.09 | $15.04 |
| Total ReturnD | 1.37% | 40.77% | (6.32)% | 3.65% | 12.04% |
| Ratios to Average Net AssetsB,E,F | | | | | |
| Expenses before reductions | .67% | .68% | .69% | .69%G | .60% |
| Expenses net of fee waivers, if any | .67% | .68% | .69% | .69%G | .60% |
| Expenses net of all reductions | .67% | .68% | .69% | .69%G | .60% |
| Net investment income (loss) | 2.24% | 1.00% | 1.60% | 1.82% | 1.23% |
| Supplemental Data | | | | | |
| Net assets, end of period (000 omitted) | $1,242,060 | $1,325,192 | $984,341 | $1,108,684 | $1,043,420 |
| Portfolio turnover rateH | 31% | 29% | 33% | 22% | 25% |
A Calculated based on average shares outstanding during the period.
B Net investment income (loss) is affected by the timing of the declaration of dividends by any underlying mutual funds or exchange-traded funds (ETFs). Net investment income (loss) of any such underlying funds is not included in the Fund's net investment income (loss) ratio.
C Total distributions per share do not sum due to rounding.
D Total returns would have been lower if certain expenses had not been reduced during the applicable periods shown.
E Fees and expenses of any underlying mutual funds or exchange-traded funds (ETFs) are not included in the Fund's expense ratio. The Fund indirectly bears its proportionate share of these expenses. For additional expense information related to investments in Fidelity Central Funds, please refer to the "Investments in Fidelity Central Funds" note found in the Notes to Financial Statements section of the most recent Annual or Semi-Annual report.
F Expense ratios reflect operating expenses of the class. Expenses before reductions do not reflect amounts reimbursed, waived, or reduced through arrangements with the investment adviser, brokerage services, or other offset arrangements, if applicable, and do not represent the amount paid by the class during periods when reimbursements, waivers or reductions occur.
G On certain classes, the size and fluctuation of net assets and expense amounts may cause ratios to differ from contractual rates.
H Amount does not include the portfolio activity of any underlying mutual funds or exchange-traded funds (ETFs).
See accompanying notes which are an integral part of the financial statements.
Fidelity Advisor Freedom 2030 Fund Class Z
| Years ended March 31, | 2022 | 2021 | 2020 | 2019 A |
| Selected Per–Share Data | | | | |
| Net asset value, beginning of period | $15.98 | $12.20 | $14.03 | $14.99 |
| Income from Investment Operations | | | | |
| Net investment income (loss)B,C | .37 | .16 | .24 | .04 |
| Net realized and unrealized gain (loss) | (.09) | 4.67 | (1.01) | (.15) |
| Total from investment operations | .28 | 4.83 | (.77) | (.11) |
| Distributions from net investment income | (.38) | (.17) | (.25) | (.33) |
| Distributions from net realized gain | (1.15) | (.88) | (.82) | (.53) |
| Total distributions | (1.53) | (1.05) | (1.06)D | (.85)D |
| Net asset value, end of period | $14.73 | $15.98 | $12.20 | $14.03 |
| Total ReturnE,F | 1.37% | 41.01% | (6.28)% | (.09)% |
| Ratios to Average Net AssetsC,G,H | | | | |
| Expenses before reductions | .58% | .59% | .60%I | .60%J |
| Expenses net of fee waivers, if any | .58% | .59% | .60%I | .60%J |
| Expenses net of all reductions | .58% | .59% | .60%I | .60%J |
| Net investment income (loss) | 2.33% | 1.09% | 1.69% | .65%J |
| Supplemental Data | | | | |
| Net assets, end of period (000 omitted) | $102,337 | $63,499 | $38,041 | $2,948 |
| Portfolio turnover rateK | 31% | 29% | 33% | 22% |
A For the period October 2, 2018 (commencement of sale of shares) through March 31, 2019.
B Calculated based on average shares outstanding during the period.
C Net investment income (loss) is affected by the timing of the declaration of dividends by any underlying mutual funds or exchange-traded funds (ETFs). Net investment income (loss) of any such underlying funds is not included in the Fund's net investment income (loss) ratio.
D Total distributions per share do not sum due to rounding.
E Total returns for periods of less than one year are not annualized.
F Total returns would have been lower if certain expenses had not been reduced during the applicable periods shown.
G Fees and expenses of any underlying mutual funds or exchange-traded funds (ETFs) are not included in the Fund's expense ratio. The Fund indirectly bears its proportionate share of these expenses. For additional expense information related to investments in Fidelity Central Funds, please refer to the "Investments in Fidelity Central Funds" note found in the Notes to Financial Statements section of the most recent Annual or Semi-Annual report.
H Expense ratios reflect operating expenses of the class. Expenses before reductions do not reflect amounts reimbursed, waived, or reduced through arrangements with the investment adviser, brokerage services, or other offset arrangements, if applicable, and do not represent the amount paid by the class during periods when reimbursements, waivers or reductions occur.
I On certain classes, the size and fluctuation of net assets and expense amounts may cause ratios to differ from contractual rates.
J Annualized
K Amount does not include the portfolio activity of any underlying mutual funds or exchange-traded funds (ETFs).
See accompanying notes which are an integral part of the financial statements.
Fidelity Advisor Freedom 2030 Fund Class Z6
| Years ended March 31, | 2022 | 2021 | 2020 | 2019 | 2018 A |
| Selected Per–Share Data | | | | | |
| Net asset value, beginning of period | $16.03 | $12.24 | $14.05 | $15.03 | $14.53 |
| Income from Investment Operations | | | | | |
| Net investment income (loss)B,C | .39 | .18 | .26 | .29 | .16 |
| Net realized and unrealized gain (loss) | (.08) | 4.68 | (1.01) | .19 | .99 |
| Total from investment operations | .31 | 4.86 | (.75) | .48 | 1.15 |
| Distributions from net investment income | (.39) | (.19) | (.25) | (.30) | (.23) |
| Distributions from net realized gain | (1.15) | (.88) | (.81) | (1.15) | (.42) |
| Total distributions | (1.54) | (1.07) | (1.06) | (1.46)D | (.65) |
| Net asset value, end of period | $14.80 | $16.03 | $12.24 | $14.05 | $15.03 |
| Total ReturnE,F | 1.56% | 41.14% | (6.16)% | 3.84% | 7.90% |
| Ratios to Average Net AssetsC,G,H | | | | | |
| Expenses before reductions | .46% | .46% | .47% | .47% | .49%I,J |
| Expenses net of fee waivers, if any | .46% | .46% | .47% | .47% | .49%I,J |
| Expenses net of all reductions | .46% | .46% | .47% | .47% | .49%I,J |
| Net investment income (loss) | 2.45% | 1.22% | 1.82% | 2.05% | 1.29%I |
| Supplemental Data | | | | | |
| Net assets, end of period (000 omitted) | $226,612 | $174,248 | $83,686 | $60,480 | $26,854 |
| Portfolio turnover rateK | 31% | 29% | 33% | 22% | 25% |
A For the period June 6, 2017 (commencement of sale of shares) through March 31, 2018.
B Calculated based on average shares outstanding during the period.
C Net investment income (loss) is affected by the timing of the declaration of dividends by any underlying mutual funds or exchange-traded funds (ETFs). Net investment income (loss) of any such underlying funds is not included in the Fund's net investment income (loss) ratio.
D Total distributions per share do not sum due to rounding.
E Total returns for periods of less than one year are not annualized.
F Total returns would have been lower if certain expenses had not been reduced during the applicable periods shown.
G Fees and expenses of any underlying mutual funds or exchange-traded funds (ETFs) are not included in the Fund's expense ratio. The Fund indirectly bears its proportionate share of these expenses. For additional expense information related to investments in Fidelity Central Funds, please refer to the "Investments in Fidelity Central Funds" note found in the Notes to Financial Statements section of the most recent Annual or Semi-Annual report.
H Expense ratios reflect operating expenses of the class. Expenses before reductions do not reflect amounts reimbursed, waived, or reduced through arrangements with the investment adviser, brokerage services, or other offset arrangements, if applicable, and do not represent the amount paid by the class during periods when reimbursements, waivers or reductions occur.
I Annualized
J On certain classes, the size and fluctuation of net assets and expense amounts may cause ratios to differ from contractual rates.
K Amount does not include the portfolio activity of any underlying mutual funds or exchange-traded funds (ETFs).
See accompanying notes which are an integral part of the financial statements.
Fidelity Advisor Freedom® 2035 Fund
Investment Summary (Unaudited)
The information in the following tables is based on the direct investments of the Fund.
Top Holdings as of March 31, 2022
| | % of fund's net assets |
| Fidelity Series Investment Grade Bond Fund | 11.8 |
| Fidelity Series Emerging Markets Opportunities Fund | 11.4 |
| Fidelity Series Large Cap Stock Fund | 8.3 |
| Fidelity Series International Value Fund | 6.5 |
| Fidelity Series Overseas Fund | 6.4 |
| Fidelity Series International Growth Fund | 6.4 |
| Fidelity Series Value Discovery Fund | 5.4 |
| Fidelity Series Long-Term Treasury Bond Index Fund | 5.3 |
| Fidelity Series Stock Selector Large Cap Value Fund | 5.3 |
| Fidelity Advisor Series Equity Growth Fund | 5.2 |
| | 72.0 |
Asset Allocation (% of fund's net assets)
| Period end |
| | Domestic Equity Funds | 42.6% |
| | International Equity Funds | 36.6% |
| | Bond Funds | 20.7% |
| | Short-Term Funds | 0.1% |

Domestic Equity Funds category includes Fidelity Series Commodity Strategy Fund which invests in commodity-related investments.
Fidelity Advisor Freedom® 2035 Fund
Schedule of Investments March 31, 2022
Showing Percentage of Net Assets
| U.S. Treasury Obligations - 0.0% | | | |
| | | Principal Amount | Value |
| U.S. Treasury Bills, yield at date of purchase 0.17% to 0.55% 4/21/22 to 6/30/22 (a) | | | |
| (Cost $1,069,591) | | 1,070,000 | 1,069,630 |
| | | Shares | Value |
|
| Domestic Equity Funds - 42.6% | | | |
| Fidelity Advisor Series Equity Growth Fund (b) | | 10,042,490 | $154,955,626 |
| Fidelity Advisor Series Growth Opportunities Fund (b) | | 8,689,814 | 106,276,427 |
| Fidelity Advisor Series Small Cap Fund (b) | | 5,414,573 | 70,335,305 |
| Fidelity Series All-Sector Equity Fund (b) | | 6,165,591 | 66,465,075 |
| Fidelity Series Commodity Strategy Fund (b) | | 8,624,740 | 44,072,423 |
| Fidelity Series Large Cap Stock Fund (b) | | 12,826,873 | 243,838,851 |
| Fidelity Series Large Cap Value Index Fund (b) | | 1,717,000 | 26,373,112 |
| Fidelity Series Opportunistic Insights Fund (b) | | 7,834,278 | 143,210,611 |
| Fidelity Series Small Cap Opportunities Fund (b) | | 6,375,853 | 86,839,117 |
| Fidelity Series Stock Selector Large Cap Value Fund (b) | | 11,485,612 | 155,630,044 |
| Fidelity Series Value Discovery Fund (b) | | 9,907,652 | 158,522,424 |
| TOTAL DOMESTIC EQUITY FUNDS | | | |
| (Cost $943,670,725) | | | 1,256,519,015 |
|
| International Equity Funds - 36.6% | | | |
| Fidelity Series Canada Fund (b) | | 5,343,194 | 82,926,364 |
| Fidelity Series Emerging Markets Fund (b) | | 4,020,926 | 37,314,196 |
| Fidelity Series Emerging Markets Opportunities Fund (b) | | 18,276,584 | 336,289,152 |
| Fidelity Series International Growth Fund (b) | | 11,441,459 | 189,699,394 |
| Fidelity Series International Small Cap Fund (b) | | 2,906,697 | 52,175,215 |
| Fidelity Series International Value Fund (b) | | 17,369,671 | 191,587,475 |
| Fidelity Series Overseas Fund (b) | | 15,114,630 | 190,746,630 |
| TOTAL INTERNATIONAL EQUITY FUNDS | | | |
| (Cost $895,938,086) | | | 1,080,738,426 |
|
| Bond Funds - 20.7% | | | |
| Fidelity Series 5+ Year Inflation-Protected Bond Index Fund (b) | | 306,657 | 2,943,906 |
| Fidelity Series Emerging Markets Debt Fund (b) | | 1,756,023 | 14,487,192 |
| Fidelity Series Emerging Markets Debt Local Currency Fund (b) | | 545,111 | 4,911,448 |
| Fidelity Series Floating Rate High Income Fund (b) | | 323,048 | 2,968,808 |
| Fidelity Series High Income Fund (b) | | 1,962,285 | 17,837,167 |
| Fidelity Series International Credit Fund (b) | | 145,474 | 1,347,087 |
| Fidelity Series International Developed Markets Bond Index Fund (b) | | 5,299,589 | 49,445,166 |
| Fidelity Series Investment Grade Bond Fund (b) | | 32,052,441 | 349,692,135 |
| Fidelity Series Long-Term Treasury Bond Index Fund (b) | | 20,657,716 | 157,411,797 |
| Fidelity Series Real Estate Income Fund (b) | | 933,257 | 10,601,801 |
| TOTAL BOND FUNDS | | | |
| (Cost $648,681,087) | | | 611,646,507 |
|
| Short-Term Funds - 0.1% | | | |
| Fidelity Cash Central Fund 0.31% (c) | | | |
| (Cost $2,329,723) | | 2,329,303 | 2,329,769 |
| TOTAL INVESTMENT IN SECURITIES - 100.0% | | | |
| (Cost $2,491,689,212) | | | 2,952,303,347 |
| NET OTHER ASSETS (LIABILITIES) - 0.0% | | | (654,422) |
| NET ASSETS - 100% | | | $2,951,648,925 |
| Futures Contracts | | | | | |
| | Number of contracts | Expiration Date | Notional Amount | Value | Unrealized Appreciation/(Depreciation) |
| Purchased | | | | | |
| Equity Index Contracts | | | | | |
| ICE E-mini MSCI EAFE Index Contracts (United States) | 76 | June 2022 | $8,148,720 | $361,387 | $361,387 |
| ICE E-mini MSCI Emerging Markets Index Contracts (United States) | 169 | June 2022 | 9,510,475 | 213,566 | 213,566 |
|
| TOTAL PURCHASED | | | | | 574,953 |
|
| Sold | | | | | |
| Equity Index Contracts | | | | | |
| CME Micro E-mini S&P 500 Index Contracts (United States) | 65 | June 2022 | 14,724,938 | (226,672) | (226,672) |
| TOTAL FUTURES CONTRACTS | | | | | $348,281 |
The notional amount of futures purchased as a percentage of Net Assets is 0.6%
The notional amount of futures sold as a percentage of Net Assets is 0.5%
Legend
(a) Security or a portion of the security was pledged to cover margin requirements for futures contracts. At period end, the value of securities pledged amounted to $1,069,630.
(b) Affiliated Fund
(c) Affiliated fund that is generally available only to investment companies and other accounts managed by Fidelity Investments. The rate quoted is the annualized seven-day yield of the fund at period end. A complete unaudited listing of the fund's holdings as of its most recent quarter end is available upon request. In addition, each Fidelity Central Fund's financial statements, which are not covered by the Fund's Report of Independent Registered Public Accounting Firm, are available on the SEC's website or upon request.
Affiliated Central Funds
Fiscal year to date information regarding the Fund's investments in Fidelity Central Funds, including the ownership percentage, is presented below.
| Fund | Value, beginning of period | Purchases(a) | Sales Proceeds(a) | Dividend Income | Realized Gain/Loss | Change in Unrealized appreciation (depreciation) | Value, end of period | % ownership, end of period |
| Fidelity Cash Central Fund 0.31% | $2,227,592 | $10,997,562 | $10,895,385 | $1,109 | $-- | $-- | $2,329,769 | 0.0% |
| Total | $2,227,592 | $10,997,562 | $10,895,385 | $1,109 | $-- | $-- | $2,329,769 | |
(a) Includes the value of shares purchased or redeemed through in-kind transactions, if applicable.
Amounts in the income column in the above table include any capital gain distributions from underlying funds, which are presented in the corresponding line-item in the Statement of Operations, if applicable.
Affiliated Underlying Funds
Fiscal year to date information regarding the Fund's investments in affiliated Underlying Funds is presented below. Exchanges between classes of the same affiliated Underlying Funds may occur. If an underlying Fund changes its name, the name presented below is the name in effect at period end.
| Fund | Value, beginning of period | Purchases(a) | Sales Proceeds(a) | Dividend Income | Realized Gain (loss) | Change in Unrealized appreciation (depreciation) | Value, end of period |
| Fidelity Advisor Series Equity Growth Fund | $163,995,226 | $56,288,059 | $57,286,082 | $28,993,391 | $3,865,860 | $(11,907,437) | $154,955,626 |
| Fidelity Advisor Series Growth Opportunities Fund | 114,044,587 | 59,064,035 | 36,385,143 | 26,791,769 | (21,460) | (30,425,592) | 106,276,427 |
| Fidelity Advisor Series Small Cap Fund | 74,200,216 | 24,321,371 | 18,085,629 | 13,556,496 | 2,940,776 | (13,041,429) | 70,335,305 |
| Fidelity Series 0-5 Year Inflation-Protected Bond Index Fund | -- | 10,417,718 | 10,362,147 | 43,948 | (49,026) | -- | -- |
| Fidelity Series 5+ Year Inflation-Protected Bond Index Fund | -- | 26,228,918 | 22,241,192 | 146,133 | (954,890) | (88,930) | 2,943,906 |
| Fidelity Series All-Sector Equity Fund | 70,119,692 | 19,643,492 | 18,492,321 | 13,711,404 | 1,403,740 | (6,209,528) | 66,465,075 |
| Fidelity Series Canada Fund | 63,681,540 | 18,041,829 | 13,082,949 | 1,763,068 | 283,724 | 14,002,220 | 82,926,364 |
| Fidelity Series Commodity Strategy Fund | 81,911,858 | 33,062,915 | 73,786,889 | 26,509,184 | (3,213,014) | 6,097,553 | 44,072,423 |
| Fidelity Series Emerging Markets Debt Fund | 15,932,237 | 3,140,542 | 3,080,452 | 756,881 | (247,996) | (1,257,139) | 14,487,192 |
| Fidelity Series Emerging Markets Debt Local Currency Fund | 5,101,229 | 1,325,915 | 932,773 | 214,608 | (53,278) | (529,645) | 4,911,448 |
| Fidelity Series Emerging Markets Fund | 43,262,795 | 9,913,132 | 6,902,845 | 1,351,991 | 123,007 | (9,081,893) | 37,314,196 |
| Fidelity Series Emerging Markets Opportunities Fund | 391,615,493 | 125,947,282 | 64,508,338 | 42,476,549 | 1,579,438 | (118,344,723) | 336,289,152 |
| Fidelity Series Floating Rate High Income Fund | 3,102,700 | 633,036 | 767,264 | 136,384 | (37,180) | 37,516 | 2,968,808 |
| Fidelity Series Government Money Market Fund 0.31% | 19,621,289 | 1,405,000 | 21,026,289 | 5,520 | -- | -- | -- |
| Fidelity Series High Income Fund | 18,308,195 | 3,978,375 | 3,835,687 | 1,045,078 | (123,610) | (490,106) | 17,837,167 |
| Fidelity Series Inflation-Protected Bond Index Fund | 59,415,206 | 5,460,240 | 67,275,739 | 593,284 | 5,698,292 | (3,297,999) | -- |
| Fidelity Series International Credit Fund | 1,406,003 | 45,373 | -- | 45,374 | -- | (104,289) | 1,347,087 |
| Fidelity Series International Developed Markets Bond Index Fund | -- | 52,781,660 | 1,260,637 | 14,476 | (25,506) | (2,050,351) | 49,445,166 |
| Fidelity Series International Growth Fund | 178,741,719 | 51,917,449 | 24,354,055 | 16,255,649 | (7,452) | (16,598,267) | 189,699,394 |
| Fidelity Series International Small Cap Fund | 56,514,629 | 10,481,927 | 6,956,070 | 7,407,831 | 659,322 | (8,524,593) | 52,175,215 |
| Fidelity Series International Value Fund | 178,705,461 | 53,142,048 | 43,605,267 | 10,197,841 | 759,885 | 2,585,348 | 191,587,475 |
| Fidelity Series Investment Grade Bond Fund | 302,325,677 | 125,905,126 | 59,552,241 | 7,612,822 | (1,582,416) | (17,404,011) | 349,692,135 |
| Fidelity Series Large Cap Stock Fund | 256,108,247 | 47,056,646 | 67,291,528 | 24,119,199 | 4,728,372 | 3,237,114 | 243,838,851 |
| Fidelity Series Large Cap Value Index Fund | 27,641,016 | 4,354,592 | 6,953,775 | 1,867,907 | 868,006 | 463,273 | 26,373,112 |
| Fidelity Series Long-Term Treasury Bond Index Fund | 80,716,253 | 102,902,809 | 19,308,805 | 2,513,392 | (2,524,144) | (4,374,316) | 157,411,797 |
| Fidelity Series Opportunistic Insights Fund | 152,049,024 | 53,394,391 | 49,949,419 | 28,364,371 | 3,095,538 | (15,378,923) | 143,210,611 |
| Fidelity Series Overseas Fund | 179,039,468 | 39,413,362 | 27,211,040 | 6,020,660 | 980,375 | (1,475,535) | 190,746,630 |
| Fidelity Series Real Estate Income Fund | 11,309,368 | 1,261,118 | 2,299,262 | 461,590 | 34,722 | 295,855 | 10,601,801 |
| Fidelity Series Short-Term Credit Fund | 4,132,933 | 184,600 | 4,299,582 | 28,686 | 106,820 | (124,771) | -- |
| Fidelity Series Small Cap Opportunities Fund | 91,593,734 | 38,698,361 | 22,022,347 | 23,977,269 | 479,638 | (21,910,269) | 86,839,117 |
| Fidelity Series Stock Selector Large Cap Value Fund | 162,196,526 | 44,479,877 | 43,884,497 | 29,193,295 | 1,410,598 | (8,572,460) | 155,630,044 |
| Fidelity Series Value Discovery Fund | 166,038,017 | 36,195,799 | 45,435,555 | 19,401,930 | 3,310,782 | (1,586,619) | 158,522,424 |
| | $2,972,830,338 | $1,061,086,997 | $842,435,819 | $335,577,980 | $23,488,923 | $(266,059,946) | $2,948,903,948 |
(a) Includes the value of shares purchased or redeemed through in-kind transactions, if applicable.
Amounts in the income column in the above table include any capital gain distributions from underlying funds, which are presented in the corresponding line-item in the Statement of Operations, if applicable.
Investment Valuation
The following is a summary of the inputs used, as of March 31, 2022, involving the Fund's assets and liabilities carried at fair value. The inputs or methodology used for valuing securities may not be an indication of the risk associated with investing in those securities. For more information on valuation inputs, and their aggregation into the levels used below, please refer to the Investment Valuation section in the accompanying Notes to Financial Statements.
| | Valuation Inputs at Reporting Date: |
| Description | Total | Level 1 | Level 2 | Level 3 |
| Investments in Securities: | | | | |
| Other Short-Term Investments and Net Other Assets | $1,069,630 | $-- | $1,069,630 | $-- |
| Domestic Equity Funds | 1,256,519,015 | 1,256,519,015 | -- | -- |
| International Equity Funds | 1,080,738,426 | 1,080,738,426 | -- | -- |
| Bond Funds | 611,646,507 | 611,646,507 | -- | -- |
| Short-Term Funds | 2,329,769 | 2,329,769 | -- | -- |
| Total Investments in Securities: | $2,952,303,347 | $2,951,233,717 | $1,069,630 | $-- |
| Derivative Instruments: | | | | |
| Assets | | | | |
| Futures Contracts | $574,953 | $574,953 | $-- | $-- |
| Total Assets | $574,953 | $574,953 | $-- | $-- |
| Liabilities | | | | |
| Futures Contracts | $(226,672) | $(226,672) | $-- | $-- |
| Total Liabilities | $(226,672) | $(226,672) | $-- | $-- |
| Total Derivative Instruments: | $348,281 | $348,281 | $-- | $-- |
Value of Derivative Instruments
The following table is a summary of the Fund's value of derivative instruments by primary risk exposure as of March 31, 2022. For additional information on derivative instruments, please refer to the Derivative Instruments section in the accompanying Notes to Financial Statements.
| Primary Risk Exposure / Derivative Type | Value |
| | Asset | Liability |
| Equity Risk | | |
| Futures Contracts(a) | $574,953 | $(226,672) |
| Total Equity Risk | 574,953 | (226,672) |
| Total Value of Derivatives | $574,953 | $(226,672) |
(a) Reflects gross cumulative appreciation (depreciation) on futures contracts as presented in the Schedule of Investments. In the Statement of Assets and Liabilities, the period end daily variation margin is included in receivable or payable for daily variation margin on futures contracts, and the net cumulative appreciation (depreciation) is included in Total accumulated earnings (loss).
See accompanying notes which are an integral part of the financial statements.
Fidelity Advisor Freedom® 2035 Fund
Financial Statements
Statement of Assets and Liabilities
| | | March 31, 2022 |
| Assets | | |
Investment in securities, at value — See accompanying schedule:
Unaffiliated issuers (cost $1,069,591) | $1,069,630 | |
| Fidelity Central Funds (cost $2,329,723) | 2,329,769 | |
| Other affiliated issuers (cost $2,488,289,898) | 2,948,903,948 | |
| Total Investment in Securities (cost $2,491,689,212) | | $2,952,303,347 |
| Receivable for investments sold | | 54,888,728 |
| Receivable for fund shares sold | | 2,375,343 |
| Distributions receivable from Fidelity Central Funds | | 364 |
| Total assets | | 3,009,567,782 |
| Liabilities | | |
| Payable for investments purchased | $53,965,650 | |
| Payable for fund shares redeemed | 1,703,338 | |
| Accrued management fee | 1,671,837 | |
| Distribution and service plan fees payable | 424,741 | |
| Payable for daily variation margin on futures contracts | 153,291 | |
| Total liabilities | | 57,918,857 |
| Net Assets | | $2,951,648,925 |
| Net Assets consist of: | | |
| Paid in capital | | $2,321,219,427 |
| Total accumulated earnings (loss) | | 630,429,498 |
| Net Assets | | $2,951,648,925 |
| Net Asset Value and Maximum Offering Price | | |
| Class A: | | |
| Net Asset Value and redemption price per share ($1,068,425,603 ÷ 71,705,281 shares)(a) | | $14.90 |
| Maximum offering price per share (100/94.25 of $14.90) | | $15.81 |
| Class M: | | |
| Net Asset Value and redemption price per share ($408,691,132 ÷ 27,857,323 shares)(a) | | $14.67 |
| Maximum offering price per share (100/96.50 of $14.67) | | $15.20 |
| Class C: | | |
| Net Asset Value and offering price per share ($45,936,917 ÷ 3,221,061 shares)(a) | | $14.26 |
| Class I: | | |
| Net Asset Value, offering price and redemption price per share ($1,109,011,331 ÷ 73,600,859 shares) | | $15.07 |
| Class Z: | | |
| Net Asset Value, offering price and redemption price per share ($97,458,041 ÷ 6,528,594 shares) | | $14.93 |
| Class Z6: | | |
| Net Asset Value, offering price and redemption price per share ($222,125,901 ÷ 14,768,341 shares) | | $15.04 |
(a) Redemption price per share is equal to net asset value less any applicable contingent deferred sales charge.
See accompanying notes which are an integral part of the financial statements.
Statement of Operations
| | | Year ended March 31, 2022 |
| Investment Income | | |
| Dividends: | | |
| Affiliated issuers | | $88,171,189 |
| Interest | | 527 |
| Income from Fidelity Central Funds | | 1,109 |
| Total income | | 88,172,825 |
| Expenses | | |
| Management fee | $21,655,550 | |
| Distribution and service plan fees | 5,589,794 | |
| Independent trustees' fees and expenses | 9,385 | |
| Total expenses before reductions | 27,254,729 | |
| Expense reductions | (3) | |
| Total expenses after reductions | | 27,254,726 |
| Net investment income (loss) | | 60,918,099 |
| Realized and Unrealized Gain (Loss) | | |
| Net realized gain (loss) on: | | |
| Investment securities: | | |
| Unaffiliated issuers | 2,010 | |
| Affiliated issuers | 23,488,923 | |
| Futures contracts | 229,578 | |
| Capital gain distributions from underlying funds: | | |
| Affiliated issuers | 247,406,791 | |
| Total net realized gain (loss) | | 271,127,302 |
| Change in net unrealized appreciation (depreciation) on: | | |
| Investment securities: | | |
| Unaffiliated issuers | 32 | |
| Affiliated issuers | (266,059,946) | |
| Futures contracts | 348,281 | |
| Total change in net unrealized appreciation (depreciation) | | (265,711,633) |
| Net gain (loss) | | 5,415,669 |
| Net increase (decrease) in net assets resulting from operations | | $66,333,768 |
See accompanying notes which are an integral part of the financial statements.
Statement of Changes in Net Assets
| | Year ended March 31, 2022 | Year ended March 31, 2021 |
| Increase (Decrease) in Net Assets | | |
| Operations | | |
| Net investment income (loss) | $60,918,099 | $19,926,493 |
| Net realized gain (loss) | 271,127,302 | 187,876,435 |
| Change in net unrealized appreciation (depreciation) | (265,711,633) | 802,957,373 |
| Net increase (decrease) in net assets resulting from operations | 66,333,768 | 1,010,760,301 |
| Distributions to shareholders | (284,614,476) | (169,240,316) |
| Share transactions - net increase (decrease) | 195,925,285 | 59,160,333 |
| Total increase (decrease) in net assets | (22,355,423) | 900,680,318 |
| Net Assets | | |
| Beginning of period | 2,974,004,348 | 2,073,324,030 |
| End of period | $2,951,648,925 | $2,974,004,348 |
See accompanying notes which are an integral part of the financial statements.
Financial Highlights
Fidelity Advisor Freedom 2035 Fund Class A
| Years ended March 31, | 2022 | 2021 | 2020 | 2019 | 2018 |
| Selected Per–Share Data | | | | | |
| Net asset value, beginning of period | $16.02 | $11.46 | $13.58 | $14.65 | $13.61 |
| Income from Investment Operations | | | | | |
| Net investment income (loss)A,B | .30 | .10 | .17 | .20 | .12 |
| Net realized and unrealized gain (loss) | .07 | 5.39 | (1.28) | .16 | 1.67 |
| Total from investment operations | .37 | 5.49 | (1.11) | .36 | 1.79 |
| Distributions from net investment income | (.30)C | (.12) | (.17) | (.22) | (.14) |
| Distributions from net realized gain | (1.20)C | (.81) | (.85) | (1.22) | (.61) |
| Total distributions | (1.49)D | (.93) | (1.01)D | (1.43)D | (.75) |
| Net asset value, end of period | $14.90 | $16.02 | $11.46 | $13.58 | $14.65 |
| Total ReturnE,F | 1.95% | 49.73% | (9.15)% | 3.19% | 13.26% |
| Ratios to Average Net AssetsB,G,H | | | | | |
| Expenses before reductions | .96% | .97% | .98% | .99% | .87% |
| Expenses net of fee waivers, if any | .96% | .97% | .98% | .99% | .87% |
| Expenses net of all reductions | .96% | .97% | .98% | .99% | .87% |
| Net investment income (loss) | 1.87% | .69% | 1.23% | 1.40% | .80% |
| Supplemental Data | | | | | |
| Net assets, end of period (000 omitted) | $1,068,426 | $1,122,730 | $824,792 | $1,026,416 | $1,082,982 |
| Portfolio turnover rateI | 27% | 27% | 33% | 23% | 23% |
A Calculated based on average shares outstanding during the period.
B Net investment income (loss) is affected by the timing of the declaration of dividends by any underlying mutual funds or exchange-traded funds (ETFs). Net investment income (loss) of any such underlying funds is not included in the Fund's net investment income (loss) ratio.
C The amount shown reflects reclassifications related to book to tax differences that were made in the year shown.
D Total distributions per share do not sum due to rounding.
E Total returns would have been lower if certain expenses had not been reduced during the applicable periods shown.
F Total returns do not include the effect of the sales charges.
G Fees and expenses of any underlying mutual funds or exchange-traded funds (ETFs) are not included in the Fund's expense ratio. The Fund indirectly bears its proportionate share of these expenses. For additional expense information related to investments in Fidelity Central Funds, please refer to the "Investments in Fidelity Central Funds" note found in the Notes to Financial Statements section of the most recent Annual or Semi-Annual report.
H Expense ratios reflect operating expenses of the class. Expenses before reductions do not reflect amounts reimbursed, waived, or reduced through arrangements with the investment adviser, brokerage services, or other offset arrangements, if applicable, and do not represent the amount paid by the class during periods when reimbursements, waivers or reductions occur.
I Amount does not include the portfolio activity of any underlying mutual funds or exchange-traded funds (ETFs).
See accompanying notes which are an integral part of the financial statements.
Fidelity Advisor Freedom 2035 Fund Class M
| Years ended March 31, | 2022 | 2021 | 2020 | 2019 | 2018 |
| Selected Per–Share Data | | | | | |
| Net asset value, beginning of period | $15.80 | $11.33 | $13.44 | $14.53 | $13.51 |
| Income from Investment Operations | | | | | |
| Net investment income (loss)A,B | .26 | .06 | .13 | .16 | .08 |
| Net realized and unrealized gain (loss) | .08 | 5.31 | (1.26) | .16 | 1.66 |
| Total from investment operations | .34 | 5.37 | (1.13) | .32 | 1.74 |
| Distributions from net investment income | (.27)C | (.09) | (.14) | (.19) | (.12) |
| Distributions from net realized gain | (1.20)C | (.81) | (.84) | (1.22) | (.60) |
| Total distributions | (1.47) | (.90) | (.98) | (1.41) | (.72) |
| Net asset value, end of period | $14.67 | $15.80 | $11.33 | $13.44 | $14.53 |
| Total ReturnD,E | 1.73% | 49.26% | (9.36)% | 2.89% | 12.98% |
| Ratios to Average Net AssetsB,F,G | | | | | |
| Expenses before reductions | 1.21% | 1.22% | 1.23% | 1.24% | 1.13% |
| Expenses net of fee waivers, if any | 1.21% | 1.22% | 1.23% | 1.24% | 1.13% |
| Expenses net of all reductions | 1.21% | 1.22% | 1.23% | 1.24% | 1.13% |
| Net investment income (loss) | 1.62% | .44% | .98% | 1.15% | .55% |
| Supplemental Data | | | | | |
| Net assets, end of period (000 omitted) | $408,691 | $425,013 | $310,544 | $366,074 | $364,455 |
| Portfolio turnover rateH | 27% | 27% | 33% | 23% | 23% |
A Calculated based on average shares outstanding during the period.
B Net investment income (loss) is affected by the timing of the declaration of dividends by any underlying mutual funds or exchange-traded funds (ETFs). Net investment income (loss) of any such underlying funds is not included in the Fund's net investment income (loss) ratio.
C The amount shown reflects reclassifications related to book to tax differences that were made in the year shown.
D Total returns would have been lower if certain expenses had not been reduced during the applicable periods shown.
E Total returns do not include the effect of the sales charges.
F Fees and expenses of any underlying mutual funds or exchange-traded funds (ETFs) are not included in the Fund's expense ratio. The Fund indirectly bears its proportionate share of these expenses. For additional expense information related to investments in Fidelity Central Funds, please refer to the "Investments in Fidelity Central Funds" note found in the Notes to Financial Statements section of the most recent Annual or Semi-Annual report.
G Expense ratios reflect operating expenses of the class. Expenses before reductions do not reflect amounts reimbursed, waived, or reduced through arrangements with the investment adviser, brokerage services, or other offset arrangements, if applicable, and do not represent the amount paid by the class during periods when reimbursements, waivers or reductions occur.
H Amount does not include the portfolio activity of any underlying mutual funds or exchange-traded funds (ETFs).
See accompanying notes which are an integral part of the financial statements.
See accompanying notes which are an integral part of the financial statements.
See accompanying notes which are an integral part of the financial statements.
Fidelity Advisor Freedom 2035 Fund Class C
| Years ended March 31, | 2022 | 2021 | 2020 | 2019 | 2018 |
| Selected Per–Share Data | | | | | |
| Net asset value, beginning of period | $15.42 | $11.09 | $13.20 | $14.29 | $13.32 |
| Income from Investment Operations | | | | | |
| Net investment income (loss)A,B | .17 | (.01) | .06 | .09 | .01 |
| Net realized and unrealized gain (loss) | .07 | 5.20 | (1.23) | .17 | 1.62 |
| Total from investment operations | .24 | 5.19 | (1.17) | .26 | 1.63 |
| Distributions from net investment income | (.21)C | (.05) | (.10) | (.13) | (.07) |
| Distributions from net realized gain | (1.20)C | (.81) | (.84) | (1.22) | (.60) |
| Total distributions | (1.40)D | (.86) | (.94) | (1.35) | (.66)D |
| Net asset value, end of period | $14.26 | $15.42 | $11.09 | $13.20 | $14.29 |
| Total ReturnE,F | 1.18% | 48.61% | (9.84)% | 2.39% | 12.40% |
| Ratios to Average Net AssetsB,G,H | | | | | |
| Expenses before reductions | 1.71% | 1.72% | 1.73% | 1.73%I | 1.63% |
| Expenses net of fee waivers, if any | 1.71% | 1.72% | 1.73% | 1.73%I | 1.63% |
| Expenses net of all reductions | 1.71% | 1.72% | 1.73% | 1.73%I | 1.63% |
| Net investment income (loss) | 1.12% | (.06)% | .48% | .65% | .05% |
| Supplemental Data | | | | | |
| Net assets, end of period (000 omitted) | $45,937 | $53,192 | $37,642 | $44,302 | $65,519 |
| Portfolio turnover rateJ | 27% | 27% | 33% | 23% | 23% |
A Calculated based on average shares outstanding during the period.
B Net investment income (loss) is affected by the timing of the declaration of dividends by any underlying mutual funds or exchange-traded funds (ETFs). Net investment income (loss) of any such underlying funds is not included in the Fund's net investment income (loss) ratio.
C The amount shown reflects reclassifications related to book to tax differences that were made in the year shown.
D Total distributions per share do not sum due to rounding.
E Total returns would have been lower if certain expenses had not been reduced during the applicable periods shown.
F Total returns do not include the effect of the contingent deferred sales charge.
G Fees and expenses of any underlying mutual funds or exchange-traded funds (ETFs) are not included in the Fund's expense ratio. The Fund indirectly bears its proportionate share of these expenses. For additional expense information related to investments in Fidelity Central Funds, please refer to the "Investments in Fidelity Central Funds" note found in the Notes to Financial Statements section of the most recent Annual or Semi-Annual report.
H Expense ratios reflect operating expenses of the class. Expenses before reductions do not reflect amounts reimbursed, waived, or reduced through arrangements with the investment adviser, brokerage services, or other offset arrangements, if applicable, and do not represent the amount paid by the class during periods when reimbursements, waivers or reductions occur.
I On certain classes, the size and fluctuation of net assets and expense amounts may cause ratios to differ from contractual rates.
J Amount does not include the portfolio activity of any underlying mutual funds or exchange-traded funds (ETFs).
See accompanying notes which are an integral part of the financial statements.
Fidelity Advisor Freedom 2035 Fund Class I
| Years ended March 31, | 2022 | 2021 | 2020 | 2019 | 2018 |
| Selected Per–Share Data | | | | | |
| Net asset value, beginning of period | $16.17 | $11.56 | $13.69 | $14.75 | $13.71 |
| Income from Investment Operations | | | | | |
| Net investment income (loss)A,B | .34 | .13 | .20 | .23 | .15 |
| Net realized and unrealized gain (loss) | .09 | 5.44 | (1.28) | .17 | 1.68 |
| Total from investment operations | .43 | 5.57 | (1.08) | .40 | 1.83 |
| Distributions from net investment income | (.33)C | (.14) | (.20) | (.25) | (.17) |
| Distributions from net realized gain | (1.20)C | (.81) | (.85) | (1.22) | (.62) |
| Total distributions | (1.53) | (.96)D | (1.05) | (1.46)D | (.79) |
| Net asset value, end of period | $15.07 | $16.17 | $11.56 | $13.69 | $14.75 |
| Total ReturnE | 2.25% | 49.99% | (8.91)% | 3.47% | 13.50% |
| Ratios to Average Net AssetsB,F,G | | | | | |
| Expenses before reductions | .71% | .72% | .73% | .74% | .64% |
| Expenses net of fee waivers, if any | .71% | .72% | .73% | .74% | .64% |
| Expenses net of all reductions | .71% | .72% | .73% | .74% | .64% |
| Net investment income (loss) | 2.12% | .94% | 1.48% | 1.65% | 1.04% |
| Supplemental Data | | | | | |
| Net assets, end of period (000 omitted) | $1,109,011 | $1,169,461 | $808,586 | $907,369 | $867,707 |
| Portfolio turnover rateH | 27% | 27% | 33% | 23% | 23% |
A Calculated based on average shares outstanding during the period.
B Net investment income (loss) is affected by the timing of the declaration of dividends by any underlying mutual funds or exchange-traded funds (ETFs). Net investment income (loss) of any such underlying funds is not included in the Fund's net investment income (loss) ratio.
C The amount shown reflects reclassifications related to book to tax differences that were made in the year shown.
D Total distributions per share do not sum due to rounding.
E Total returns would have been lower if certain expenses had not been reduced during the applicable periods shown.
F Fees and expenses of any underlying mutual funds or exchange-traded funds (ETFs) are not included in the Fund's expense ratio. The Fund indirectly bears its proportionate share of these expenses. For additional expense information related to investments in Fidelity Central Funds, please refer to the "Investments in Fidelity Central Funds" note found in the Notes to Financial Statements section of the most recent Annual or Semi-Annual report.
G Expense ratios reflect operating expenses of the class. Expenses before reductions do not reflect amounts reimbursed, waived, or reduced through arrangements with the investment adviser, brokerage services, or other offset arrangements, if applicable, and do not represent the amount paid by the class during periods when reimbursements, waivers or reductions occur.
H Amount does not include the portfolio activity of any underlying mutual funds or exchange-traded funds (ETFs).
See accompanying notes which are an integral part of the financial statements.
Fidelity Advisor Freedom 2035 Fund Class Z
| Years ended March 31, | 2022 | 2021 | 2020 | 2019 A |
| Selected Per–Share Data | | | | |
| Net asset value, beginning of period | $16.04 | $11.47 | $13.63 | $14.78 |
| Income from Investment Operations | | | | |
| Net investment income (loss)B,C | .36 | .15 | .21 | .07 |
| Net realized and unrealized gain (loss) | .08 | 5.39 | (1.27) | (.32) |
| Total from investment operations | .44 | 5.54 | (1.06) | (.25) |
| Distributions from net investment income | (.35)D | (.16) | (.22) | (.31) |
| Distributions from net realized gain | (1.20)D | (.81) | (.88) | (.59) |
| Total distributions | (1.55) | (.97) | (1.10) | (.90) |
| Net asset value, end of period | $14.93 | $16.04 | $11.47 | $13.63 |
| Total ReturnE,F | 2.35% | 50.19% | (8.87)% | (.96)% |
| Ratios to Average Net AssetsC,G,H | | | | |
| Expenses before reductions | .61%I | .62% | .63% | .63%I,J |
| Expenses net of fee waivers, if any | .61%I | .62% | .63% | .63%I,J |
| Expenses net of all reductions | .61%I | .62% | .63% | .63%I,J |
| Net investment income (loss) | 2.22% | 1.04% | 1.58% | 1.01%J |
| Supplemental Data | | | | |
| Net assets, end of period (000 omitted) | $97,458 | $53,381 | $27,968 | $2,821 |
| Portfolio turnover rateK | 27% | 27% | 33% | 23% |
A For the period October 2, 2018 (commencement of sale of shares) through March 31, 2019.
B Calculated based on average shares outstanding during the period.
C Net investment income (loss) is affected by the timing of the declaration of dividends by any underlying mutual funds or exchange-traded funds (ETFs). Net investment income (loss) of any such underlying funds is not included in the Fund's net investment income (loss) ratio.
D The amount shown reflects reclassifications related to book to tax differences that were made in the year shown.
E Total returns for periods of less than one year are not annualized.
F Total returns would have been lower if certain expenses had not been reduced during the applicable periods shown.
G Fees and expenses of any underlying mutual funds or exchange-traded funds (ETFs) are not included in the Fund's expense ratio. The Fund indirectly bears its proportionate share of these expenses. For additional expense information related to investments in Fidelity Central Funds, please refer to the "Investments in Fidelity Central Funds" note found in the Notes to Financial Statements section of the most recent Annual or Semi-Annual report.
H Expense ratios reflect operating expenses of the class. Expenses before reductions do not reflect amounts reimbursed, waived, or reduced through arrangements with the investment adviser, brokerage services, or other offset arrangements, if applicable, and do not represent the amount paid by the class during periods when reimbursements, waivers or reductions occur.
I On certain classes, the size and fluctuation of net assets and expense amounts may cause ratios to differ from contractual rates.
J Annualized
K Amount does not include the portfolio activity of any underlying mutual funds or exchange-traded funds (ETFs).
See accompanying notes which are an integral part of the financial statements.
Fidelity Advisor Freedom 2035 Fund Class Z6
| Years ended March 31, | 2022 | 2021 | 2020 | 2019 | 2018 A |
| Selected Per–Share Data | | | | | |
| Net asset value, beginning of period | $16.14 | $11.53 | $13.67 | $14.75 | $14.07 |
| Income from Investment Operations | | | | | |
| Net investment income (loss)B,C | .38 | .17 | .23 | .26 | .12 |
| Net realized and unrealized gain (loss) | .08 | 5.43 | (1.28) | .16 | 1.15 |
| Total from investment operations | .46 | 5.60 | (1.05) | .42 | 1.27 |
| Distributions from net investment income | (.37)D | (.17) | (.23) | (.29) | (.22) |
| Distributions from net realized gain | (1.20)D | (.81) | (.86) | (1.22) | (.38) |
| Total distributions | (1.56)E | (.99)E | (1.09) | (1.50)E | (.59)E |
| Net asset value, end of period | $15.04 | $16.14 | $11.53 | $13.67 | $14.75 |
| Total ReturnF,G | 2.48% | 50.43% | (8.74)% | 3.65% | 9.03% |
| Ratios to Average Net AssetsC,H,I | | | | | |
| Expenses before reductions | .48% | .48% | .49% | .49% | .51%J,K |
| Expenses net of fee waivers, if any | .48% | .48% | .49% | .49% | .51%J,K |
| Expenses net of all reductions | .48% | .48% | .49% | .49% | .51%J,K |
| Net investment income (loss) | 2.35% | 1.18% | 1.73% | 1.90% | .97%J |
| Supplemental Data | | | | | |
| Net assets, end of period (000 omitted) | $222,126 | $150,227 | $63,792 | $45,355 | $15,784 |
| Portfolio turnover rateL | 27% | 27% | 33% | 23% | 23% |
A For the period June 6, 2017 (commencement of sale of shares) through March 31, 2018.
B Calculated based on average shares outstanding during the period.
C Net investment income (loss) is affected by the timing of the declaration of dividends by any underlying mutual funds or exchange-traded funds (ETFs). Net investment income (loss) of any such underlying funds is not included in the Fund's net investment income (loss) ratio.
D The amount shown reflects reclassifications related to book to tax differences that were made in the year shown.
E Total distributions per share do not sum due to rounding.
F Total returns for periods of less than one year are not annualized.
G Total returns would have been lower if certain expenses had not been reduced during the applicable periods shown.
H Fees and expenses of any underlying mutual funds or exchange-traded funds (ETFs) are not included in the Fund's expense ratio. The Fund indirectly bears its proportionate share of these expenses. For additional expense information related to investments in Fidelity Central Funds, please refer to the "Investments in Fidelity Central Funds" note found in the Notes to Financial Statements section of the most recent Annual or Semi-Annual report.
I Expense ratios reflect operating expenses of the class. Expenses before reductions do not reflect amounts reimbursed, waived, or reduced through arrangements with the investment adviser, brokerage services, or other offset arrangements, if applicable, and do not represent the amount paid by the class during periods when reimbursements, waivers or reductions occur.
J Annualized
K On certain classes, the size and fluctuation of net assets and expense amounts may cause ratios to differ from contractual rates.
L Amount does not include the portfolio activity of any underlying mutual funds or exchange-traded funds (ETFs).
See accompanying notes which are an integral part of the financial statements.
Fidelity Advisor Freedom® 2040 Fund
Investment Summary (Unaudited)
The information in the following tables is based on the direct investments of the Fund.
Top Holdings as of March 31, 2022
| | % of fund's net assets |
| Fidelity Series Emerging Markets Opportunities Fund | 12.6 |
| Fidelity Series Large Cap Stock Fund | 9.7 |
| Fidelity Series International Value Fund | 7.5 |
| Fidelity Series Overseas Fund | 7.4 |
| Fidelity Series International Growth Fund | 7.4 |
| Fidelity Series Value Discovery Fund | 6.3 |
| Fidelity Series Stock Selector Large Cap Value Fund | 6.2 |
| Fidelity Advisor Series Equity Growth Fund | 6.2 |
| Fidelity Series Opportunistic Insights Fund | 5.7 |
| Fidelity Series Long-Term Treasury Bond Index Fund | 5.4 |
| | 74.4 |
Asset Allocation (% of fund's net assets)
| Period end |
| | Domestic Equity Funds | 49.9% |
| | International Equity Funds | 41.5% |
| | Bond Funds | 8.5% |
| | Short-Term Funds | 0.1% |

Domestic Equity Funds category includes Fidelity Series Commodity Strategy Fund which invests in commodity-related investments.
Fidelity Advisor Freedom® 2040 Fund
Schedule of Investments March 31, 2022
Showing Percentage of Net Assets
| U.S. Treasury Obligations - 0.0% | | | |
| | | Principal Amount | Value |
| U.S. Treasury Bills, yield at date of purchase 0.12% to 0.17% 4/14/22 to 4/21/22 (a) | | | |
| (Cost $1,059,910) | | 1,060,000 | 1,059,930 |
| | | Shares | Value |
|
| Domestic Equity Funds - 49.9% | | | |
| Fidelity Advisor Series Equity Growth Fund (b) | | 10,717,675 | $165,373,731 |
| Fidelity Advisor Series Growth Opportunities Fund (b) | | 9,274,487 | 113,426,978 |
| Fidelity Advisor Series Small Cap Fund (b) | | 5,778,484 | 75,062,505 |
| Fidelity Series All-Sector Equity Fund (b) | | 6,580,275 | 70,935,366 |
| Fidelity Series Commodity Strategy Fund (b) | | 7,798,134 | 39,848,462 |
| Fidelity Series Large Cap Stock Fund (b) | | 13,689,855 | 260,244,135 |
| Fidelity Series Large Cap Value Index Fund (b) | | 1,832,517 | 28,147,463 |
| Fidelity Series Opportunistic Insights Fund (b) | | 8,361,308 | 152,844,704 |
| Fidelity Series Small Cap Opportunities Fund (b) | | 6,804,487 | 92,677,106 |
| Fidelity Series Stock Selector Large Cap Value Fund (b) | | 12,258,045 | 166,096,507 |
| Fidelity Series Value Discovery Fund (b) | | 10,574,194 | 169,187,107 |
| TOTAL DOMESTIC EQUITY FUNDS | | | |
| (Cost $1,023,123,931) | | | 1,333,844,064 |
|
| International Equity Funds - 41.5% | | | |
| Fidelity Series Canada Fund (b) | | 5,562,734 | 86,333,631 |
| Fidelity Series Emerging Markets Fund (b) | | 3,953,113 | 36,684,889 |
| Fidelity Series Emerging Markets Opportunities Fund (b) | | 18,346,015 | 337,566,672 |
| Fidelity Series International Growth Fund (b) | | 11,895,407 | 197,225,844 |
| Fidelity Series International Small Cap Fund (b) | | 3,007,910 | 53,991,986 |
| Fidelity Series International Value Fund (b) | | 18,057,691 | 199,176,336 |
| Fidelity Series Overseas Fund (b) | | 15,713,190 | 198,300,462 |
| TOTAL INTERNATIONAL EQUITY FUNDS | | | |
| (Cost $927,810,276) | | | 1,109,279,820 |
|
| Bond Funds - 8.5% | | | |
| Fidelity Series 5+ Year Inflation-Protected Bond Index Fund (b) | | 278,619 | 2,674,746 |
| Fidelity Series Emerging Markets Debt Fund (b) | | 1,582,718 | 13,057,426 |
| Fidelity Series Emerging Markets Debt Local Currency Fund (b) | | 491,377 | 4,427,308 |
| Fidelity Series Floating Rate High Income Fund (b) | | 291,175 | 2,675,897 |
| Fidelity Series High Income Fund (b) | | 1,781,634 | 16,195,054 |
| Fidelity Series International Credit Fund (b) | | 132,490 | 1,226,857 |
| Fidelity Series International Developed Markets Bond Index Fund (b) | | 68,478 | 638,901 |
| Fidelity Series Investment Grade Bond Fund (b) | | 3,178,547 | 34,677,953 |
| Fidelity Series Long-Term Treasury Bond Index Fund (b) | | 18,807,071 | 143,309,882 |
| Fidelity Series Real Estate Income Fund (b) | | 841,390 | 9,558,193 |
| TOTAL BOND FUNDS | | | |
| (Cost $245,246,707) | | | 228,442,217 |
|
| Short-Term Funds - 0.1% | | | |
| Fidelity Cash Central Fund 0.31% (c) | | | |
| (Cost $2,038,177) | | 2,037,776 | 2,038,184 |
| TOTAL INVESTMENT IN SECURITIES - 100.0% | | | |
| (Cost $2,199,279,001) | | | 2,674,664,215 |
| NET OTHER ASSETS (LIABILITIES) - 0.0% | | | (568,096) |
| NET ASSETS - 100% | | | $2,674,096,119 |
| Futures Contracts | | | | | |
| | Number of contracts | Expiration Date | Notional Amount | Value | Unrealized Appreciation/(Depreciation) |
| Purchased | | | | | |
| Equity Index Contracts | | | | | |
| ICE E-mini MSCI EAFE Index Contracts (United States) | 60 | June 2022 | $6,433,200 | $297,801 | $297,801 |
| ICE E-mini MSCI Emerging Markets Index Contracts (United States) | 185 | June 2022 | 10,410,875 | 113,225 | 113,225 |
|
| TOTAL PURCHASED | | | | | 411,026 |
|
| Sold | | | | | |
| Equity Index Contracts | | | | | |
| CME Micro E-mini S&P 500 Index Contracts (United States) | 59 | June 2022 | 13,365,713 | (379,803) | (379,803) |
| TOTAL FUTURES CONTRACTS | | | | | $31,223 |
The notional amount of futures purchased as a percentage of Net Assets is 0.6%
The notional amount of futures sold as a percentage of Net Assets is 0.5%
Legend
(a) Security or a portion of the security was pledged to cover margin requirements for futures contracts. At period end, the value of securities pledged amounted to $1,034,932.
(b) Affiliated Fund
(c) Affiliated fund that is generally available only to investment companies and other accounts managed by Fidelity Investments. The rate quoted is the annualized seven-day yield of the fund at period end. A complete unaudited listing of the fund's holdings as of its most recent quarter end is available upon request. In addition, each Fidelity Central Fund's financial statements, which are not covered by the Fund's Report of Independent Registered Public Accounting Firm, are available on the SEC's website or upon request.
Affiliated Central Funds
Fiscal year to date information regarding the Fund's investments in Fidelity Central Funds, including the ownership percentage, is presented below.
| Fund | Value, beginning of period | Purchases(a) | Sales Proceeds(a) | Dividend Income | Realized Gain/Loss | Change in Unrealized appreciation (depreciation) | Value, end of period | % ownership, end of period |
| Fidelity Cash Central Fund 0.31% | $1,121,756 | $9,707,787 | $8,791,359 | $897 | $-- | $-- | $2,038,184 | 0.0% |
| Total | $1,121,756 | $9,707,787 | $8,791,359 | $897 | $-- | $-- | $2,038,184 | |
(a) Includes the value of shares purchased or redeemed through in-kind transactions, if applicable.
Amounts in the income column in the above table include any capital gain distributions from underlying funds, which are presented in the corresponding line-item in the Statement of Operations, if applicable.
Affiliated Underlying Funds
Fiscal year to date information regarding the Fund's investments in affiliated Underlying Funds is presented below. Exchanges between classes of the same affiliated Underlying Funds may occur. If an underlying Fund changes its name, the name presented below is the name in effect at period end.
| Fund | Value, beginning of period | Purchases(a) | Sales Proceeds(a) | Dividend Income | Realized Gain (loss) | Change in Unrealized appreciation (depreciation) | Value, end of period |
| Fidelity Advisor Series Equity Growth Fund | $169,378,765 | $58,322,626 | $53,297,192 | $30,533,537 | $3,422,151 | $(12,452,619) | $165,373,731 |
| Fidelity Advisor Series Growth Opportunities Fund | 117,786,198 | 61,746,453 | 33,752,950 | 28,076,980 | (191,922) | (32,160,801) | 113,426,978 |
| Fidelity Advisor Series Small Cap Fund | 76,636,365 | 25,431,494 | 16,178,023 | 14,279,213 | 2,408,220 | (13,235,551) | 75,062,505 |
| Fidelity Series 0-5 Year Inflation-Protected Bond Index Fund | -- | 12,552,884 | 12,502,579 | 39,690 | (44,395) | -- | -- |
| Fidelity Series 5+ Year Inflation-Protected Bond Index Fund | -- | 24,682,853 | 21,067,250 | 125,021 | (860,060) | (80,797) | 2,674,746 |
| Fidelity Series All-Sector Equity Fund | 72,422,063 | 19,761,509 | 16,001,747 | 14,450,666 | 1,082,349 | (6,328,808) | 70,935,366 |
| Fidelity Series Canada Fund | 65,072,557 | 19,223,473 | 12,621,775 | 1,783,772 | 272,604 | 14,386,772 | 86,333,631 |
| Fidelity Series Commodity Strategy Fund | 74,234,374 | 29,237,923 | 66,129,140 | 24,051,107 | (3,130,994) | 5,636,299 | 39,848,462 |
| Fidelity Series Emerging Markets Debt Fund | 14,485,779 | 2,443,590 | 2,520,199 | 684,621 | (200,092) | (1,151,652) | 13,057,426 |
| Fidelity Series Emerging Markets Debt Local Currency Fund | 4,688,955 | 1,015,176 | 760,427 | 194,215 | (50,246) | (466,150) | 4,427,308 |
| Fidelity Series Emerging Markets Fund | 42,555,333 | 9,443,206 | 6,329,852 | 1,340,780 | (6,237) | (8,977,561) | 36,684,889 |
| Fidelity Series Emerging Markets Opportunities Fund | 384,393,494 | 126,454,446 | 56,456,274 | 42,353,434 | 20,171 | (116,845,165) | 337,566,672 |
| Fidelity Series Floating Rate High Income Fund | 2,791,561 | 337,604 | 454,319 | 121,303 | (15,000) | 16,051 | 2,675,897 |
| Fidelity Series Government Money Market Fund 0.31% | 17,747,351 | 1,902,523 | 19,649,874 | 3,994 | -- | -- | -- |
| Fidelity Series High Income Fund | 16,614,138 | 2,969,067 | 2,863,975 | 931,631 | (39,975) | (484,201) | 16,195,054 |
| Fidelity Series Inflation-Protected Bond Index Fund | 53,306,779 | 5,368,172 | 60,837,348 | 546,883 | 5,024,978 | (2,862,581) | -- |
| Fidelity Series International Credit Fund | 1,280,514 | 41,324 | -- | 41,324 | -- | (94,981) | 1,226,857 |
| Fidelity Series International Developed Markets Bond Index Fund | -- | 721,155 | 60,229 | 202 | (763) | (21,262) | 638,901 |
| Fidelity Series International Growth Fund | 182,346,956 | 52,026,348 | 19,767,393 | 16,711,526 | (114,265) | (17,265,802) | 197,225,844 |
| Fidelity Series International Small Cap Fund | 57,220,529 | 11,383,850 | 6,439,749 | 7,600,695 | 121,896 | (8,294,540) | 53,991,986 |
| Fidelity Series International Value Fund | 182,265,277 | 56,142,044 | 42,572,866 | 10,492,414 | 550,904 | 2,790,977 | 199,176,336 |
| Fidelity Series Investment Grade Bond Fund | 1,194,742 | 43,806,113 | 9,225,980 | 160,566 | (99,865) | (997,057) | 34,677,953 |
| Fidelity Series Large Cap Stock Fund | 264,528,590 | 46,893,514 | 59,254,278 | 25,297,422 | 2,248,298 | 5,828,011 | 260,244,135 |
| Fidelity Series Large Cap Value Index Fund | 28,550,060 | 4,951,745 | 6,714,359 | 1,971,639 | 545,028 | 814,989 | 28,147,463 |
| Fidelity Series Long-Term Treasury Bond Index Fund | 73,158,566 | 94,136,603 | 17,695,760 | 2,264,826 | (2,175,738) | (4,113,789) | 143,309,882 |
| Fidelity Series Opportunistic Insights Fund | 157,041,766 | 56,297,666 | 47,040,384 | 29,877,834 | 2,775,666 | (16,230,010) | 152,844,704 |
| Fidelity Series Overseas Fund | 182,649,273 | 39,323,483 | 22,830,341 | 6,181,985 | 355,857 | (1,197,810) | 198,300,462 |
| Fidelity Series Real Estate Income Fund | 10,229,243 | 870,022 | 1,842,548 | 414,801 | 51,262 | 250,214 | 9,558,193 |
| Fidelity Series Short-Term Credit Fund | 3,738,236 | 197,902 | 3,936,111 | 18,108 | 84,041 | (84,068) | -- |
| Fidelity Series Small Cap Opportunities Fund | 94,591,406 | 40,119,639 | 19,309,728 | 25,236,257 | (30,953) | (22,693,258) | 92,677,106 |
| Fidelity Series Stock Selector Large Cap Value Fund | 167,531,918 | 47,973,609 | 41,576,525 | 30,771,044 | 743,638 | (8,576,133) | 166,096,507 |
| Fidelity Series Value Discovery Fund | 171,498,496 | 39,222,514 | 43,068,716 | 20,453,769 | 1,955,100 | (420,287) | 169,187,107 |
| | $2,689,939,284 | $935,000,530 | $722,757,891 | $337,011,259 | $14,701,658 | $(245,311,570) | $2,671,566,101 |
(a) Includes the value of shares purchased or redeemed through in-kind transactions, if applicable.
Amounts in the income column in the above table include any capital gain distributions from underlying funds, which are presented in the corresponding line-item in the Statement of Operations, if applicable.
Investment Valuation
The following is a summary of the inputs used, as of March 31, 2022, involving the Fund's assets and liabilities carried at fair value. The inputs or methodology used for valuing securities may not be an indication of the risk associated with investing in those securities. For more information on valuation inputs, and their aggregation into the levels used below, please refer to the Investment Valuation section in the accompanying Notes to Financial Statements.
| | Valuation Inputs at Reporting Date: |
| Description | Total | Level 1 | Level 2 | Level 3 |
| Investments in Securities: | | | | |
| Other Short-Term Investments and Net Other Assets | $1,059,930 | $-- | $1,059,930 | $-- |
| Domestic Equity Funds | 1,333,844,064 | 1,333,844,064 | -- | -- |
| International Equity Funds | 1,109,279,820 | 1,109,279,820 | -- | -- |
| Bond Funds | 228,442,217 | 228,442,217 | -- | -- |
| Short-Term Funds | 2,038,184 | 2,038,184 | -- | -- |
| Total Investments in Securities: | $2,674,664,215 | $2,673,604,285 | $1,059,930 | $-- |
| Derivative Instruments: | | | | |
| Assets | | | | |
| Futures Contracts | $411,026 | $411,026 | $-- | $-- |
| Total Assets | $411,026 | $411,026 | $-- | $-- |
| Liabilities | | | | |
| Futures Contracts | $(379,803) | $(379,803) | $-- | $-- |
| Total Liabilities | $(379,803) | $(379,803) | $-- | $-- |
| Total Derivative Instruments: | $31,223 | $31,223 | $-- | $-- |
Value of Derivative Instruments
The following table is a summary of the Fund's value of derivative instruments by primary risk exposure as of March 31, 2022. For additional information on derivative instruments, please refer to the Derivative Instruments section in the accompanying Notes to Financial Statements.
| Primary Risk Exposure / Derivative Type | Value |
| | Asset | Liability |
| Equity Risk | | |
| Futures Contracts(a) | $411,026 | $(379,803) |
| Total Equity Risk | 411,026 | (379,803) |
| Total Value of Derivatives | $411,026 | $(379,803) |
(a) Reflects gross cumulative appreciation (depreciation) on futures contracts as presented in the Schedule of Investments. In the Statement of Assets and Liabilities, the period end daily variation margin is included in receivable or payable for daily variation margin on futures contracts, and the net cumulative appreciation (depreciation) is included in Total accumulated earnings (loss).
See accompanying notes which are an integral part of the financial statements.
Fidelity Advisor Freedom® 2040 Fund
Financial Statements
Statement of Assets and Liabilities
| | | March 31, 2022 |
| Assets | | |
Investment in securities, at value — See accompanying schedule:
Unaffiliated issuers (cost $1,059,910) | $1,059,930 | |
| Fidelity Central Funds (cost $2,038,177) | 2,038,184 | |
| Other affiliated issuers (cost $2,196,180,914) | 2,671,566,101 | |
| Total Investment in Securities (cost $2,199,279,001) | | $2,674,664,215 |
| Receivable for investments sold | | 43,915,071 |
| Receivable for fund shares sold | | 2,295,200 |
| Distributions receivable from Fidelity Central Funds | | 317 |
| Total assets | | 2,720,874,803 |
| Liabilities | | |
| Payable for investments purchased | $42,153,821 | |
| Payable for fund shares redeemed | 2,546,618 | |
| Accrued management fee | 1,578,440 | |
| Distribution and service plan fees payable | 389,675 | |
| Payable for daily variation margin on futures contracts | 110,130 | |
| Total liabilities | | 46,778,684 |
| Net Assets | | $2,674,096,119 |
| Net Assets consist of: | | |
| Paid in capital | | $2,025,711,998 |
| Total accumulated earnings (loss) | | 648,384,121 |
| Net Assets | | $2,674,096,119 |
| Net Asset Value and Maximum Offering Price | | |
| Class A: | | |
| Net Asset Value and redemption price per share ($963,235,675 ÷ 58,840,090 shares)(a) | | $16.37 |
| Maximum offering price per share (100/94.25 of $16.37) | | $17.37 |
| Class M: | | |
| Net Asset Value and redemption price per share ($386,534,434 ÷ 23,836,875 shares)(a) | | $16.22 |
| Maximum offering price per share (100/96.50 of $16.22) | | $16.81 |
| Class C: | | |
| Net Asset Value and offering price per share ($42,441,100 ÷ 2,700,692 shares)(a) | | $15.71 |
| Class I: | | |
| Net Asset Value, offering price and redemption price per share ($1,000,721,746 ÷ 60,518,864 shares) | | $16.54 |
| Class Z: | | |
| Net Asset Value, offering price and redemption price per share ($80,497,571 ÷ 4,915,252 shares) | | $16.38 |
| Class Z6: | | |
| Net Asset Value, offering price and redemption price per share ($200,665,593 ÷ 12,165,232 shares) | | $16.50 |
(a) Redemption price per share is equal to net asset value less any applicable contingent deferred sales charge.
See accompanying notes which are an integral part of the financial statements.
Statement of Operations
| | | Year ended March 31, 2022 |
| Investment Income | | |
| Dividends: | | |
| Affiliated issuers | | $79,375,034 |
| Interest | | 535 |
| Income from Fidelity Central Funds | | 897 |
| Total income | | 79,376,466 |
| Expenses | | |
| Management fee | $20,554,249 | |
| Distribution and service plan fees | 5,142,969 | |
| Independent trustees' fees and expenses | 8,504 | |
| Total expenses before reductions | 25,705,722 | |
| Expense reductions | (4) | |
| Total expenses after reductions | | 25,705,718 |
| Net investment income (loss) | | 53,670,748 |
| Realized and Unrealized Gain (Loss) | | |
| Net realized gain (loss) on: | | |
| Investment securities: | | |
| Unaffiliated issuers | 1,309 | |
| Affiliated issuers | 14,701,658 | |
| Futures contracts | 66,366 | |
| Capital gain distributions from underlying funds: | | |
| Affiliated issuers | 257,636,225 | |
| Total net realized gain (loss) | | 272,405,558 |
| Change in net unrealized appreciation (depreciation) on: | | |
| Investment securities: | | |
| Unaffiliated issuers | 16 | |
| Affiliated issuers | (245,311,570) | |
| Futures contracts | 31,223 | |
| Total change in net unrealized appreciation (depreciation) | | (245,280,331) |
| Net gain (loss) | | 27,125,227 |
| Net increase (decrease) in net assets resulting from operations | | $80,795,975 |
See accompanying notes which are an integral part of the financial statements.
Statement of Changes in Net Assets
| | Year ended March 31, 2022 | Year ended March 31, 2021 |
| Increase (Decrease) in Net Assets | | |
| Operations | | |
| Net investment income (loss) | $53,670,748 | $15,947,218 |
| Net realized gain (loss) | 272,405,558 | 172,059,302 |
| Change in net unrealized appreciation (depreciation) | (245,280,331) | 803,816,612 |
| Net increase (decrease) in net assets resulting from operations | 80,795,975 | 991,823,132 |
| Distributions to shareholders | (269,416,376) | (147,549,653) |
| Share transactions - net increase (decrease) | 172,603,391 | 6,639,596 |
| Total increase (decrease) in net assets | (16,017,010) | 850,913,075 |
| Net Assets | | |
| Beginning of period | 2,690,113,129 | 1,839,200,054 |
| End of period | $2,674,096,119 | $2,690,113,129 |
See accompanying notes which are an integral part of the financial statements.
Financial Highlights
Fidelity Advisor Freedom 2040 Fund Class A
| Years ended March 31, | 2022 | 2021 | 2020 | 2019 | 2018 |
| Selected Per–Share Data | | | | | |
| Net asset value, beginning of period | $17.54 | $12.08 | $14.52 | $15.69 | $14.57 |
| Income from Investment Operations | | | | | |
| Net investment income (loss)A,B | .32 | .09 | .17 | .21 | .12 |
| Net realized and unrealized gain (loss) | .23 | 6.34 | (1.55) | .15 | 1.81 |
| Total from investment operations | .55 | 6.43 | (1.38) | .36 | 1.93 |
| Distributions from net investment income | (.34) | (.11) | (.17) | (.23) | (.15) |
| Distributions from net realized gain | (1.38) | (.85) | (.88) | (1.31) | (.66) |
| Total distributions | (1.72) | (.97)C | (1.06)C | (1.53)C | (.81) |
| Net asset value, end of period | $16.37 | $17.54 | $12.08 | $14.52 | $15.69 |
| Total ReturnD,E | 2.74% | 55.32% | (10.59)% | 3.04% | 13.42% |
| Ratios to Average Net AssetsB,F,G | | | | | |
| Expenses before reductions | 1.00% | 1.00% | 1.00% | .99%H | .87% |
| Expenses net of fee waivers, if any | 1.00% | 1.00% | 1.00% | .99%H | .87% |
| Expenses net of all reductions | 1.00% | 1.00% | 1.00% | .99%H | .87% |
| Net investment income (loss) | 1.82% | .61% | 1.17% | 1.37% | .78% |
| Supplemental Data | | | | | |
| Net assets, end of period (000 omitted) | $963,236 | $1,000,757 | $729,343 | $916,426 | $948,970 |
| Portfolio turnover rateI | 26% | 25% | 31% | 21% | 23% |
A Calculated based on average shares outstanding during the period.
B Net investment income (loss) is affected by the timing of the declaration of dividends by any underlying mutual funds or exchange-traded funds (ETFs). Net investment income (loss) of any such underlying funds is not included in the Fund's net investment income (loss) ratio.
C Total distributions per share do not sum due to rounding.
D Total returns would have been lower if certain expenses had not been reduced during the applicable periods shown.
E Total returns do not include the effect of the sales charges.
F Fees and expenses of any underlying mutual funds or exchange-traded funds (ETFs) are not included in the Fund's expense ratio. The Fund indirectly bears its proportionate share of these expenses. For additional expense information related to investments in Fidelity Central Funds, please refer to the "Investments in Fidelity Central Funds" note found in the Notes to Financial Statements section of the most recent Annual or Semi-Annual report.
G Expense ratios reflect operating expenses of the class. Expenses before reductions do not reflect amounts reimbursed, waived, or reduced through arrangements with the investment adviser, brokerage services, or other offset arrangements, if applicable, and do not represent the amount paid by the class during periods when reimbursements, waivers or reductions occur.
H On certain classes, the size and fluctuation of net assets and expense amounts may cause ratios to differ from contractual rates.
I Amount does not include the portfolio activity of any underlying mutual funds or exchange-traded funds (ETFs).
See accompanying notes which are an integral part of the financial statements.
Fidelity Advisor Freedom 2040 Fund Class M
| Years ended March 31, | 2022 | 2021 | 2020 | 2019 | 2018 |
| Selected Per–Share Data | | | | | |
| Net asset value, beginning of period | $17.40 | $12.00 | $14.44 | $15.62 | $14.52 |
| Income from Investment Operations | | | | | |
| Net investment income (loss)A,B | .27 | .05 | .13 | .17 | .08 |
| Net realized and unrealized gain (loss) | .23 | 6.29 | (1.55) | .16 | 1.80 |
| Total from investment operations | .50 | 6.34 | (1.42) | .33 | 1.88 |
| Distributions from net investment income | (.30) | (.09) | (.15) | (.20) | (.12) |
| Distributions from net realized gain | (1.38) | (.85) | (.88) | (1.31) | (.66) |
| Total distributions | (1.68) | (.94) | (1.02)C | (1.51) | (.78) |
| Net asset value, end of period | $16.22 | $17.40 | $12.00 | $14.44 | $15.62 |
| Total ReturnD,E | 2.50% | 54.96% | (10.84)% | 2.82% | 13.11% |
| Ratios to Average Net AssetsB,F,G | | | | | |
| Expenses before reductions | 1.25% | 1.25% | 1.25% | 1.25% | 1.13% |
| Expenses net of fee waivers, if any | 1.25% | 1.25% | 1.25% | 1.25% | 1.13% |
| Expenses net of all reductions | 1.25% | 1.25% | 1.25% | 1.25% | 1.13% |
| Net investment income (loss) | 1.57% | .36% | .92% | 1.12% | .53% |
| Supplemental Data | | | | | |
| Net assets, end of period (000 omitted) | $386,534 | $402,667 | $286,126 | $356,107 | $343,164 |
| Portfolio turnover rateH | 26% | 25% | 31% | 21% | 23% |
A Calculated based on average shares outstanding during the period.
B Net investment income (loss) is affected by the timing of the declaration of dividends by any underlying mutual funds or exchange-traded funds (ETFs). Net investment income (loss) of any such underlying funds is not included in the Fund's net investment income (loss) ratio.
C Total distributions per share do not sum due to rounding.
D Total returns would have been lower if certain expenses had not been reduced during the applicable periods shown.
E Total returns do not include the effect of the sales charges.
F Fees and expenses of any underlying mutual funds or exchange-traded funds (ETFs) are not included in the Fund's expense ratio. The Fund indirectly bears its proportionate share of these expenses. For additional expense information related to investments in Fidelity Central Funds, please refer to the "Investments in Fidelity Central Funds" note found in the Notes to Financial Statements section of the most recent Annual or Semi-Annual report.
G Expense ratios reflect operating expenses of the class. Expenses before reductions do not reflect amounts reimbursed, waived, or reduced through arrangements with the investment adviser, brokerage services, or other offset arrangements, if applicable, and do not represent the amount paid by the class during periods when reimbursements, waivers or reductions occur.
H Amount does not include the portfolio activity of any underlying mutual funds or exchange-traded funds (ETFs).
See accompanying notes which are an integral part of the financial statements.
Fidelity Advisor Freedom 2040 Fund Class C
| Years ended March 31, | 2022 | 2021 | 2020 | 2019 | 2018 |
| Selected Per–Share Data | | | | | |
| Net asset value, beginning of period | $16.91 | $11.71 | $14.14 | $15.32 | $14.28 |
| Income from Investment Operations | | | | | |
| Net investment income (loss)A,B | .18 | (.02) | .06 | .09 | –C |
| Net realized and unrealized gain (loss) | .22 | 6.11 | (1.52) | .18 | 1.77 |
| Total from investment operations | .40 | 6.09 | (1.46) | .27 | 1.77 |
| Distributions from net investment income | (.22) | (.04) | (.09) | (.14) | (.07) |
| Distributions from net realized gain | (1.38) | (.85) | (.88) | (1.31) | (.66) |
| Total distributions | (1.60) | (.89) | (.97) | (1.45) | (.73) |
| Net asset value, end of period | $15.71 | $16.91 | $11.71 | $14.14 | $15.32 |
| Total ReturnD,E | 1.98% | 54.12% | (11.31)% | 2.37% | 12.52% |
| Ratios to Average Net AssetsB,F,G | | | | | |
| Expenses before reductions | 1.75% | 1.75% | 1.75% | 1.74%H | 1.63% |
| Expenses net of fee waivers, if any | 1.75% | 1.75% | 1.75% | 1.74%H | 1.63% |
| Expenses net of all reductions | 1.75% | 1.75% | 1.75% | 1.74%H | 1.63% |
| Net investment income (loss) | 1.07% | (.14)% | .42% | .62% | .03% |
| Supplemental Data | | | | | |
| Net assets, end of period (000 omitted) | $42,441 | $56,710 | $41,153 | $53,715 | $84,365 |
| Portfolio turnover rateI | 26% | 25% | 31% | 21% | 23% |
A Calculated based on average shares outstanding during the period.
B Net investment income (loss) is affected by the timing of the declaration of dividends by any underlying mutual funds or exchange-traded funds (ETFs). Net investment income (loss) of any such underlying funds is not included in the Fund's net investment income (loss) ratio.
C Amount represents less than $.005 per share.
D Total returns would have been lower if certain expenses had not been reduced during the applicable periods shown.
E Total returns do not include the effect of the contingent deferred sales charge.
F Fees and expenses of any underlying mutual funds or exchange-traded funds (ETFs) are not included in the Fund's expense ratio. The Fund indirectly bears its proportionate share of these expenses. For additional expense information related to investments in Fidelity Central Funds, please refer to the "Investments in Fidelity Central Funds" note found in the Notes to Financial Statements section of the most recent Annual or Semi-Annual report.
G Expense ratios reflect operating expenses of the class. Expenses before reductions do not reflect amounts reimbursed, waived, or reduced through arrangements with the investment adviser, brokerage services, or other offset arrangements, if applicable, and do not represent the amount paid by the class during periods when reimbursements, waivers or reductions occur.
H On certain classes, the size and fluctuation of net assets and expense amounts may cause ratios to differ from contractual rates.
I Amount does not include the portfolio activity of any underlying mutual funds or exchange-traded funds (ETFs).
See accompanying notes which are an integral part of the financial statements.
Fidelity Advisor Freedom 2040 Fund Class I
| Years ended March 31, | 2022 | 2021 | 2020 | 2019 | 2018 |
| Selected Per–Share Data | | | | | |
| Net asset value, beginning of period | $17.69 | $12.17 | $14.62 | $15.78 | $14.65 |
| Income from Investment Operations | | | | | |
| Net investment income (loss)A,B | .37 | .13 | .21 | .24 | .16 |
| Net realized and unrealized gain (loss) | .23 | 6.39 | (1.57) | .16 | 1.83 |
| Total from investment operations | .60 | 6.52 | (1.36) | .40 | 1.99 |
| Distributions from net investment income | (.37) | (.14) | (.20) | (.26) | (.19) |
| Distributions from net realized gain | (1.38) | (.85) | (.89) | (1.31) | (.67) |
| Total distributions | (1.75) | (1.00)C | (1.09) | (1.56)C | (.86) |
| Net asset value, end of period | $16.54 | $17.69 | $12.17 | $14.62 | $15.78 |
| Total ReturnD | 3.03% | 55.69% | (10.35)% | 3.31% | 13.74% |
| Ratios to Average Net AssetsB,E,F | | | | | |
| Expenses before reductions | .75% | .75% | .75% | .75% | .63% |
| Expenses net of fee waivers, if any | .75% | .75% | .75% | .75% | .63% |
| Expenses net of all reductions | .75% | .75% | .75% | .75% | .63% |
| Net investment income (loss) | 2.07% | .86% | 1.42% | 1.62% | 1.02% |
| Supplemental Data | | | | | |
| Net assets, end of period (000 omitted) | $1,000,722 | $1,045,866 | $705,362 | $805,102 | $790,667 |
| Portfolio turnover rateG | 26% | 25% | 31% | 21% | 23% |
A Calculated based on average shares outstanding during the period.
B Net investment income (loss) is affected by the timing of the declaration of dividends by any underlying mutual funds or exchange-traded funds (ETFs). Net investment income (loss) of any such underlying funds is not included in the Fund's net investment income (loss) ratio.
C Total distributions per share do not sum due to rounding.
D Total returns would have been lower if certain expenses had not been reduced during the applicable periods shown.
E Fees and expenses of any underlying mutual funds or exchange-traded funds (ETFs) are not included in the Fund's expense ratio. The Fund indirectly bears its proportionate share of these expenses. For additional expense information related to investments in Fidelity Central Funds, please refer to the "Investments in Fidelity Central Funds" note found in the Notes to Financial Statements section of the most recent Annual or Semi-Annual report.
F Expense ratios reflect operating expenses of the class. Expenses before reductions do not reflect amounts reimbursed, waived, or reduced through arrangements with the investment adviser, brokerage services, or other offset arrangements, if applicable, and do not represent the amount paid by the class during periods when reimbursements, waivers or reductions occur.
G Amount does not include the portfolio activity of any underlying mutual funds or exchange-traded funds (ETFs).
See accompanying notes which are an integral part of the financial statements.
Fidelity Advisor Freedom 2040 Fund Class Z
| Years ended March 31, | 2022 | 2021 | 2020 | 2019 A |
| Selected Per–Share Data | | | | |
| Net asset value, beginning of period | $17.54 | $12.08 | $14.56 | $15.85 |
| Income from Investment Operations | | | | |
| Net investment income (loss)B,C | .38 | .15 | .22 | .36 |
| Net realized and unrealized gain (loss) | .24 | 6.33 | (1.55) | (.69) |
| Total from investment operations | .62 | 6.48 | (1.33) | (.33) |
| Distributions from net investment income | (.40) | (.17) | (.23) | (.33) |
| Distributions from net realized gain | (1.38) | (.85) | (.91) | (.63) |
| Total distributions | (1.78) | (1.02) | (1.15)D | (.96) |
| Net asset value, end of period | $16.38 | $17.54 | $12.08 | $14.56 |
| Total ReturnE,F | 3.14% | 55.80% | (10.31)% | (1.30)% |
| Ratios to Average Net AssetsC,G,H | | | | |
| Expenses before reductions | .64% | .64% | .65% | .65%I,J |
| Expenses net of fee waivers, if any | .64% | .64% | .65% | .65%I,J |
| Expenses net of all reductions | .64% | .64% | .65% | .65%I,J |
| Net investment income (loss) | 2.17% | .97% | 1.52% | 5.06%I |
| Supplemental Data | | | | |
| Net assets, end of period (000 omitted) | $80,498 | $43,822 | $20,000 | $1,501 |
| Portfolio turnover rateK | 26% | 25% | 31% | 21% |
A For the period October 2, 2018 (commencement of sale of shares) through March 31, 2019.
B Calculated based on average shares outstanding during the period.
C Net investment income (loss) is affected by the timing of the declaration of dividends by any underlying mutual funds or exchange-traded funds (ETFs). Net investment income (loss) of any such underlying funds is not included in the Fund's net investment income (loss) ratio.
D Total distributions per share do not sum due to rounding.
E Total returns for periods of less than one year are not annualized.
F Total returns would have been lower if certain expenses had not been reduced during the applicable periods shown.
G Fees and expenses of any underlying mutual funds or exchange-traded funds (ETFs) are not included in the Fund's expense ratio. The Fund indirectly bears its proportionate share of these expenses. For additional expense information related to investments in Fidelity Central Funds, please refer to the "Investments in Fidelity Central Funds" note found in the Notes to Financial Statements section of the most recent Annual or Semi-Annual report.
H Expense ratios reflect operating expenses of the class. Expenses before reductions do not reflect amounts reimbursed, waived, or reduced through arrangements with the investment adviser, brokerage services, or other offset arrangements, if applicable, and do not represent the amount paid by the class during periods when reimbursements, waivers or reductions occur.
I Annualized
J On certain classes, the size and fluctuation of net assets and expense amounts may cause ratios to differ from contractual rates.
K Amount does not include the portfolio activity of any underlying mutual funds or exchange-traded funds (ETFs).
See accompanying notes which are an integral part of the financial statements.
Fidelity Advisor Freedom 2040 Fund Class Z6
| Years ended March 31, | 2022 | 2021 | 2020 | 2019 | 2018 A |
| Selected Per–Share Data | | | | | |
| Net asset value, beginning of period | $17.64 | $12.13 | $14.60 | $15.76 | $15.04 |
| Income from Investment Operations | | | | | |
| Net investment income (loss)B,C | .41 | .17 | .24 | .28 | .18 |
| Net realized and unrealized gain (loss) | .24 | 6.38 | (1.57) | .17 | 1.20 |
| Total from investment operations | .65 | 6.55 | (1.33) | .45 | 1.38 |
| Distributions from net investment income | (.41) | (.18) | (.24) | (.30) | (.23) |
| Distributions from net realized gain | (1.38) | (.85) | (.90) | (1.31) | (.42) |
| Total distributions | (1.79) | (1.04)D | (1.14) | (1.61) | (.66)D |
| Net asset value, end of period | $16.50 | $17.64 | $12.13 | $14.60 | $15.76 |
| Total ReturnE,F | 3.31% | 56.14% | (10.24)% | 3.64% | 9.12% |
| Ratios to Average Net AssetsC,G,H | | | | | |
| Expenses before reductions | .49% | .49% | .49% | .49% | .51%I,J |
| Expenses net of fee waivers, if any | .49% | .49% | .49% | .49% | .51%I,J |
| Expenses net of all reductions | .49% | .49% | .49% | .49% | .51%I,J |
| Net investment income (loss) | 2.32% | 1.12% | 1.67% | 1.87% | 1.39%I |
| Supplemental Data | | | | | |
| Net assets, end of period (000 omitted) | $200,666 | $140,291 | $57,216 | $41,066 | $11,861 |
| Portfolio turnover rateK | 26% | 25% | 31% | 21% | 23% |
A For the period June 6, 2017 (commencement of sale of shares) through March 31, 2018.
��B Calculated based on average shares outstanding during the period.
C Net investment income (loss) is affected by the timing of the declaration of dividends by any underlying mutual funds or exchange-traded funds (ETFs). Net investment income (loss) of any such underlying funds is not included in the Fund's net investment income (loss) ratio.
D Total distributions per share do not sum due to rounding.
E Total returns for periods of less than one year are not annualized.
F Total returns would have been lower if certain expenses had not been reduced during the applicable periods shown.
G Fees and expenses of any underlying mutual funds or exchange-traded funds (ETFs) are not included in the Fund's expense ratio. The Fund indirectly bears its proportionate share of these expenses. For additional expense information related to investments in Fidelity Central Funds, please refer to the "Investments in Fidelity Central Funds" note found in the Notes to Financial Statements section of the most recent Annual or Semi-Annual report.
H Expense ratios reflect operating expenses of the class. Expenses before reductions do not reflect amounts reimbursed, waived, or reduced through arrangements with the investment adviser, brokerage services, or other offset arrangements, if applicable, and do not represent the amount paid by the class during periods when reimbursements, waivers or reductions occur.
I Annualized
J On certain classes, the size and fluctuation of net assets and expense amounts may cause ratios to differ from contractual rates.
K Amount does not include the portfolio activity of any underlying mutual funds or exchange-traded funds (ETFs).
See accompanying notes which are an integral part of the financial statements.
Fidelity Advisor Freedom® 2045 Fund
Investment Summary (Unaudited)
The information in the following tables is based on the direct investments of the Fund.
Top Holdings as of March 31, 2022
| | % of fund's net assets |
| Fidelity Series Emerging Markets Opportunities Fund | 12.7 |
| Fidelity Series Large Cap Stock Fund | 9.8 |
| Fidelity Series International Value Fund | 7.5 |
| Fidelity Series Overseas Fund | 7.5 |
| Fidelity Series International Growth Fund | 7.4 |
| Fidelity Series Value Discovery Fund | 6.4 |
| Fidelity Series Stock Selector Large Cap Value Fund | 6.3 |
| Fidelity Advisor Series Equity Growth Fund | 6.2 |
| Fidelity Series Opportunistic Insights Fund | 5.8 |
| Fidelity Series Long-Term Treasury Bond Index Fund | 5.3 |
| | 74.9 |
Asset Allocation (% of fund's net assets)
| Period end |
| | Domestic Equity Funds | 50.4% |
| | International Equity Funds | 41.8% |
| | Bond Funds | 7.7% |
| | Short-Term Funds | 0.1% |

Domestic Equity Funds category includes Fidelity Series Commodity Strategy Fund which invests in commodity-related investments.
Fidelity Advisor Freedom® 2045 Fund
Schedule of Investments March 31, 2022
Showing Percentage of Net Assets
| U.S. Treasury Obligations - 0.0% | | | |
| | | Principal Amount | Value |
| U.S. Treasury Bills, yield at date of purchase 0.12% to 0.33% 4/14/22 to 5/19/22 (a) | | | |
| (Cost $779,924) | | 780,000 | 779,941 |
| | | Shares | Value |
|
| Domestic Equity Funds - 50.4% | | | |
| Fidelity Advisor Series Equity Growth Fund (b) | | 7,591,914 | $117,143,229 |
| Fidelity Advisor Series Growth Opportunities Fund (b) | | 6,569,726 | 80,347,745 |
| Fidelity Advisor Series Small Cap Fund (b) | | 4,093,185 | 53,170,477 |
| Fidelity Series All-Sector Equity Fund (b) | | 4,661,211 | 50,247,860 |
| Fidelity Series Commodity Strategy Fund (b) | | 5,451,461 | 27,856,965 |
| Fidelity Series Large Cap Stock Fund (b) | | 9,697,417 | 184,347,901 |
| Fidelity Series Large Cap Value Index Fund (b) | | 1,298,097 | 19,938,774 |
| Fidelity Series Opportunistic Insights Fund (b) | | 5,922,850 | 108,269,691 |
| Fidelity Series Small Cap Opportunities Fund (b) | | 4,819,988 | 65,648,231 |
| Fidelity Series Stock Selector Large Cap Value Fund (b) | | 8,683,107 | 117,656,095 |
| Fidelity Series Value Discovery Fund (b) | | 7,490,390 | 119,846,244 |
| TOTAL DOMESTIC EQUITY FUNDS | | | |
| (Cost $748,906,013) | | | 944,473,212 |
|
| International Equity Funds - 41.8% | | | |
| Fidelity Series Canada Fund (b) | | 3,928,836 | 60,975,539 |
| Fidelity Series Emerging Markets Fund (b) | | 2,769,202 | 25,698,190 |
| Fidelity Series Emerging Markets Opportunities Fund (b) | | 12,924,160 | 237,804,549 |
| Fidelity Series International Growth Fund (b) | | 8,407,584 | 139,397,745 |
| Fidelity Series International Small Cap Fund (b) | | 2,127,285 | 38,184,772 |
| Fidelity Series International Value Fund (b) | | 12,762,839 | 140,774,110 |
| Fidelity Series Overseas Fund (b) | | 11,106,050 | 140,158,352 |
| TOTAL INTERNATIONAL EQUITY FUNDS | | | |
| (Cost $670,311,822) | | | 782,993,257 |
|
| Bond Funds - 7.7% | | | |
| Fidelity Series 5+ Year Inflation-Protected Bond Index Fund (b) | | 195,282 | 1,874,708 |
| Fidelity Series Emerging Markets Debt Fund (b) | | 1,108,808 | 9,147,664 |
| Fidelity Series Emerging Markets Debt Local Currency Fund (b) | | 344,230 | 3,101,511 |
| Fidelity Series Floating Rate High Income Fund (b) | | 203,966 | 1,874,445 |
| Fidelity Series High Income Fund (b) | | 1,248,192 | 11,346,061 |
| Fidelity Series International Credit Fund (b) | | 79,822 | 739,147 |
| Fidelity Series Investment Grade Bond Fund (b) | | 904,413 | 9,867,145 |
| Fidelity Series Long-Term Treasury Bond Index Fund (b) | | 13,136,387 | 100,099,271 |
| Fidelity Series Real Estate Income Fund (b) | | 588,878 | 6,689,655 |
| TOTAL BOND FUNDS | | | |
| (Cost $155,576,842) | | | 144,739,607 |
|
| Short-Term Funds - 0.1% | | | |
| Fidelity Cash Central Fund 0.31% (c) | | | |
| (Cost $1,248,674) | | 1,248,428 | 1,248,678 |
| TOTAL INVESTMENT IN SECURITIES - 100.0% | | | |
| (Cost $1,576,823,275) | | | 1,874,234,695 |
| NET OTHER ASSETS (LIABILITIES) - 0.0% | | | (382,888) |
| NET ASSETS - 100% | | | $1,873,851,807 |
| Futures Contracts | | | | | |
| | Number of contracts | Expiration Date | Notional Amount | Value | Unrealized Appreciation/(Depreciation) |
| Purchased | | | | | |
| Equity Index Contracts | | | | | |
| ICE E-mini MSCI EAFE Index Contracts (United States) | 45 | June 2022 | $4,824,900 | $210,932 | $210,931 |
| ICE E-mini MSCI Emerging Markets Index Contracts (United States) | 141 | June 2022 | 7,934,775 | 123,002 | 123,002 |
|
| TOTAL PURCHASED | | | | | 333,933 |
|
| Sold | | | | | |
| Equity Index Contracts | | | | | |
| CME Micro E-mini S&P 500 Index Contracts (United States) | 42 | June 2022 | 9,514,575 | (281,173) | (281,173) |
| TOTAL FUTURES CONTRACTS | | | | | $52,760 |
The notional amount of futures purchased as a percentage of Net Assets is 0.7%
The notional amount of futures sold as a percentage of Net Assets is 0.5%
Legend
(a) Security or a portion of the security was pledged to cover margin requirements for futures contracts. At period end, the value of securities pledged amounted to $776,941.
(b) Affiliated Fund
(c) Affiliated fund that is generally available only to investment companies and other accounts managed by Fidelity Investments. The rate quoted is the annualized seven-day yield of the fund at period end. A complete unaudited listing of the fund's holdings as of its most recent quarter end is available upon request. In addition, each Fidelity Central Fund's financial statements, which are not covered by the Fund's Report of Independent Registered Public Accounting Firm, are available on the SEC's website or upon request.
Affiliated Central Funds
Fiscal year to date information regarding the Fund's investments in Fidelity Central Funds, including the ownership percentage, is presented below.
| Fund | Value, beginning of period | Purchases(a) | Sales Proceeds(a) | Dividend Income | Realized Gain/Loss | Change in Unrealized appreciation (depreciation) | Value, end of period | % ownership, end of period |
| Fidelity Cash Central Fund 0.31% | $772,532 | $6,404,771 | $5,928,625 | $577 | $-- | $-- | $1,248,678 | 0.0% |
| Total | $772,532 | $6,404,771 | $5,928,625 | $577 | $-- | $-- | $1,248,678 | |
(a) Includes the value of shares purchased or redeemed through in-kind transactions, if applicable.
Amounts in the income column in the above table include any capital gain distributions from underlying funds, which are presented in the corresponding line-item in the Statement of Operations, if applicable.
Affiliated Underlying Funds
Fiscal year to date information regarding the Fund's investments in affiliated Underlying Funds is presented below. Exchanges between classes of the same affiliated Underlying Funds may occur. If an underlying Fund changes its name, the name presented below is the name in effect at period end.
| Fund | Value, beginning of period | Purchases(a) | Sales Proceeds(a) | Dividend Income | Realized Gain (loss) | Change in Unrealized appreciation (depreciation) | Value, end of period |
| Fidelity Advisor Series Equity Growth Fund | $117,223,615 | $44,523,142 | $37,960,654 | $21,463,286 | $2,019,076 | $(8,661,950) | $117,143,229 |
| Fidelity Advisor Series Growth Opportunities Fund | 81,517,143 | 45,845,105 | 24,030,056 | 19,738,735 | (288,594) | (22,695,853) | 80,347,745 |
| Fidelity Advisor Series Small Cap Fund | 53,038,502 | 19,395,734 | 11,580,364 | 10,036,936 | 1,341,118 | (9,024,513) | 53,170,477 |
| Fidelity Series 0-5 Year Inflation-Protected Bond Index Fund | -- | 8,822,523 | 8,787,357 | 27,802 | (31,025) | -- | -- |
| Fidelity Series 5+ Year Inflation-Protected Bond Index Fund | -- | 17,484,848 | 14,952,053 | 87,619 | (601,468) | (56,619) | 1,874,708 |
| Fidelity Series All-Sector Equity Fund | 50,122,156 | 15,256,105 | 11,358,680 | 10,166,450 | 613,426 | (4,385,147) | 50,247,860 |
| Fidelity Series Canada Fund | 45,035,790 | 15,048,623 | 9,366,015 | 1,248,938 | 177,482 | 10,079,659 | 60,975,539 |
| Fidelity Series Commodity Strategy Fund | 51,391,872 | 21,461,803 | 46,838,649 | 16,717,794 | (2,109,648) | 3,951,587 | 27,856,965 |
| Fidelity Series Emerging Markets Debt Fund | 10,033,172 | 2,009,872 | 1,947,002 | 477,550 | (135,692) | (812,686) | 9,147,664 |
| Fidelity Series Emerging Markets Debt Local Currency Fund | 3,252,856 | 781,618 | 570,839 | 136,000 | (41,171) | (320,953) | 3,101,511 |
| Fidelity Series Emerging Markets Fund | 29,459,935 | 7,291,530 | 4,758,952 | 940,651 | (38,833) | (6,255,490) | 25,698,190 |
| Fidelity Series Emerging Markets Opportunities Fund | 266,044,022 | 95,845,621 | 42,305,776 | 29,715,605 | (979,816) | (80,799,502) | 237,804,549 |
| Fidelity Series Floating Rate High Income Fund | 1,933,142 | 299,028 | 358,299 | 84,869 | (12,898) | 13,472 | 1,874,445 |
| Fidelity Series Government Money Market Fund 0.31% | 12,282,467 | 824,523 | 13,106,990 | 2,750 | -- | -- | -- |
| Fidelity Series High Income Fund | 11,513,783 | 2,656,892 | 2,460,802 | 648,157 | (43,721) | (320,091) | 11,346,061 |
| Fidelity Series Inflation-Protected Bond Index Fund | 36,909,083 | 4,222,794 | 42,630,399 | 382,817 | 3,440,628 | (1,942,106) | -- |
| Fidelity Series International Credit Fund | 771,474 | 24,897 | -- | 24,897 | -- | (57,224) | 739,147 |
| Fidelity Series International Growth Fund | 126,198,384 | 40,603,602 | 14,991,445 | 11,745,560 | (174,588) | (12,238,208) | 139,397,745 |
| Fidelity Series International Small Cap Fund | 39,608,469 | 9,309,336 | 4,932,861 | 5,337,551 | 6,174 | (5,806,346) | 38,184,772 |
| Fidelity Series International Value Fund | 126,148,990 | 43,565,921 | 31,266,574 | 7,374,724 | 357,033 | 1,968,740 | 140,774,110 |
| Fidelity Series Investment Grade Bond Fund | 835,424 | 15,904,719 | 6,731,482 | 40,165 | (132,651) | (8,865) | 9,867,145 |
| Fidelity Series Large Cap Stock Fund | 183,076,757 | 37,892,556 | 42,322,337 | 17,661,752 | 946,536 | 4,754,389 | 184,347,901 |
| Fidelity Series Large Cap Value Index Fund | 19,759,191 | 4,078,253 | 4,838,608 | 1,385,976 | 245,755 | 694,183 | 19,938,774 |
| Fidelity Series Long-Term Treasury Bond Index Fund | 50,647,435 | 66,934,414 | 13,112,604 | 1,575,567 | (1,674,503) | (2,695,471) | 100,099,271 |
| Fidelity Series Opportunistic Insights Fund | 108,685,609 | 43,072,602 | 33,749,392 | 20,997,012 | 1,890,394 | (11,629,522) | 108,269,691 |
| Fidelity Series Overseas Fund | 126,407,248 | 31,608,250 | 17,055,782 | 4,344,949 | 102,812 | (904,176) | 140,158,352 |
| Fidelity Series Real Estate Income Fund | 7,079,480 | 800,890 | 1,398,259 | 289,486 | 9,287 | 198,257 | 6,689,655 |
| Fidelity Series Short-Term Credit Fund | 2,587,191 | 69,028 | 2,656,447 | 12,506 | 59,115 | (58,887) | -- |
| Fidelity Series Small Cap Opportunities Fund | 65,464,791 | 29,641,034 | 13,616,200 | 17,551,347 | (144,449) | (15,696,945) | 65,648,231 |
| Fidelity Series Stock Selector Large Cap Value Fund | 115,946,948 | 37,073,333 | 29,729,008 | 21,647,662 | 323,898 | (5,959,076) | 117,656,095 |
| Fidelity Series Value Discovery Fund | 118,692,084 | 30,991,208 | 30,791,960 | 14,392,203 | 709,592 | 245,320 | 119,846,244 |
| | $1,861,667,013 | $693,339,804 | $520,205,846 | $236,257,316 | $5,833,269 | $(168,424,023) | $1,872,206,076 |
(a) Includes the value of shares purchased or redeemed through in-kind transactions, if applicable.
Amounts in the income column in the above table include any capital gain distributions from underlying funds, which are presented in the corresponding line-item in the Statement of Operations, if applicable.
Investment Valuation
The following is a summary of the inputs used, as of March 31, 2022, involving the Fund's assets and liabilities carried at fair value. The inputs or methodology used for valuing securities may not be an indication of the risk associated with investing in those securities. For more information on valuation inputs, and their aggregation into the levels used below, please refer to the Investment Valuation section in the accompanying Notes to Financial Statements.
| | Valuation Inputs at Reporting Date: |
| Description | Total | Level 1 | Level 2 | Level 3 |
| Investments in Securities: | | | | |
| Other Short-Term Investments and Net Other Assets | $779,941 | $-- | $779,941 | $-- |
| Domestic Equity Funds | 944,473,212 | 944,473,212 | -- | -- |
| International Equity Funds | 782,993,257 | 782,993,257 | -- | -- |
| Bond Funds | 144,739,607 | 144,739,607 | -- | -- |
| Short-Term Funds | 1,248,678 | 1,248,678 | -- | -- |
| Total Investments in Securities: | $1,874,234,695 | $1,873,454,754 | $779,941 | $-- |
| Derivative Instruments: | | | | |
| Assets | | | | |
| Futures Contracts | $333,933 | $333,933 | $-- | $-- |
| Total Assets | $333,933 | $333,933 | $-- | $-- |
| Liabilities | | | | |
| Futures Contracts | $(281,173) | $(281,173) | $-- | $-- |
| Total Liabilities | $(281,173) | $(281,173) | $-- | $-- |
| Total Derivative Instruments: | $52,760 | $52,760 | $-- | $-- |
Value of Derivative Instruments
The following table is a summary of the Fund's value of derivative instruments by primary risk exposure as of March 31, 2022. For additional information on derivative instruments, please refer to the Derivative Instruments section in the accompanying Notes to Financial Statements.
| Primary Risk Exposure / Derivative Type | Value |
| | Asset | Liability |
| Equity Risk | | |
| Futures Contracts(a) | $333,933 | $(281,173) |
| Total Equity Risk | 333,933 | (281,173) |
| Total Value of Derivatives | $333,933 | $(281,173) |
(a) Reflects gross cumulative appreciation (depreciation) on futures contracts as presented in the Schedule of Investments. In the Statement of Assets and Liabilities, the period end daily variation margin is included in receivable or payable for daily variation margin on futures contracts, and the net cumulative appreciation (depreciation) is included in Total accumulated earnings (loss).
See accompanying notes which are an integral part of the financial statements.
Fidelity Advisor Freedom® 2045 Fund
Financial Statements
Statement of Assets and Liabilities
| | | March 31, 2022 |
| Assets | | |
Investment in securities, at value — See accompanying schedule:
Unaffiliated issuers (cost $779,924) | $779,941 | |
| Fidelity Central Funds (cost $1,248,674) | 1,248,678 | |
| Other affiliated issuers (cost $1,574,794,677) | 1,872,206,076 | |
| Total Investment in Securities (cost $1,576,823,275) | | $1,874,234,695 |
| Receivable for investments sold | | 28,575,869 |
| Receivable for fund shares sold | | 2,034,517 |
| Distributions receivable from Fidelity Central Funds | | 192 |
| Total assets | | 1,904,845,273 |
| Liabilities | | |
| Payable for investments purchased | $28,158,680 | |
| Payable for fund shares redeemed | 1,400,627 | |
| Accrued management fee | 1,098,854 | |
| Distribution and service plan fees payable | 249,432 | |
| Payable for daily variation margin on futures contracts | 85,873 | |
| Total liabilities | | 30,993,466 |
| Net Assets | | $1,873,851,807 |
| Net Assets consist of: | | |
| Paid in capital | | $1,458,819,967 |
| Total accumulated earnings (loss) | | 415,031,840 |
| Net Assets | | $1,873,851,807 |
| Net Asset Value and Maximum Offering Price | | |
| Class A: | | |
| Net Asset Value and redemption price per share ($604,139,768 ÷ 46,812,371 shares)(a) | | $12.91 |
| Maximum offering price per share (100/94.25 of $12.91) | | $13.70 |
| Class M: | | |
| Net Asset Value and redemption price per share ($250,719,089 ÷ 19,696,713 shares)(a) | | $12.73 |
| Maximum offering price per share (100/96.50 of $12.73) | | $13.19 |
| Class C: | | |
| Net Asset Value and offering price per share ($28,992,774 ÷ 2,330,774 shares)(a) | | $12.44 |
| Class I: | | |
| Net Asset Value, offering price and redemption price per share ($752,616,732 ÷ 57,722,689 shares) | | $13.04 |
| Class Z: | | |
| Net Asset Value, offering price and redemption price per share ($65,648,154 ÷ 5,083,476 shares) | | $12.91 |
| Class Z6: | | |
| Net Asset Value, offering price and redemption price per share ($171,735,290 ÷ 13,192,738 shares) | | $13.02 |
(a) Redemption price per share is equal to net asset value less any applicable contingent deferred sales charge.
See accompanying notes which are an integral part of the financial statements.
Statement of Operations
| | | Year ended March 31, 2022 |
| Investment Income | | |
| Dividends: | | |
| Affiliated issuers | | $55,457,165 |
| Interest | | 393 |
| Income from Fidelity Central Funds | | 577 |
| Total income | | 55,458,135 |
| Expenses | | |
| Management fee | $14,271,783 | |
| Distribution and service plan fees | 3,295,650 | |
| Independent trustees' fees and expenses | 5,912 | |
| Total expenses before reductions | 17,573,345 | |
| Expense reductions | (6) | |
| Total expenses after reductions | | 17,573,339 |
| Net investment income (loss) | | 37,884,796 |
| Realized and Unrealized Gain (Loss) | | |
| Net realized gain (loss) on: | | |
| Investment securities: | | |
| Unaffiliated issuers | 841 | |
| Affiliated issuers | 5,833,269 | |
| Futures contracts | (175,053) | |
| Capital gain distributions from underlying funds: | | |
| Affiliated issuers | 180,800,151 | |
| Total net realized gain (loss) | | 186,459,208 |
| Change in net unrealized appreciation (depreciation) on: | | |
| Investment securities: | | |
| Unaffiliated issuers | 14 | |
| Affiliated issuers | (168,424,023) | |
| Futures contracts | 52,760 | |
| Total change in net unrealized appreciation (depreciation) | | (168,371,249) |
| Net gain (loss) | | 18,087,959 |
| Net increase (decrease) in net assets resulting from operations | | $55,972,755 |
See accompanying notes which are an integral part of the financial statements.
Statement of Changes in Net Assets
| | Year ended March 31, 2022 | Year ended March 31, 2021 |
| Increase (Decrease) in Net Assets | | |
| Operations | | |
| Net investment income (loss) | $37,884,796 | $11,221,758 |
| Net realized gain (loss) | 186,459,208 | 111,214,222 |
| Change in net unrealized appreciation (depreciation) | (168,371,249) | 554,883,026 |
| Net increase (decrease) in net assets resulting from operations | 55,972,755 | 677,319,006 |
| Distributions to shareholders | (183,271,312) | (91,085,840) |
| Share transactions - net increase (decrease) | 139,336,201 | 31,384,753 |
| Total increase (decrease) in net assets | 12,037,644 | 617,617,919 |
| Net Assets | | |
| Beginning of period | 1,861,814,163 | 1,244,196,244 |
| End of period | $1,873,851,807 | $1,861,814,163 |
See accompanying notes which are an integral part of the financial statements.
Financial Highlights
Fidelity Advisor Freedom 2045 Fund Class A
| Years ended March 31, | 2022 | 2021 | 2020 | 2019 | 2018 |
| Selected Per–Share Data | | | | | |
| Net asset value, beginning of period | $13.79 | $9.43 | $11.33 | $12.21 | $11.26 |
| Income from Investment Operations | | | | | |
| Net investment income (loss)A,B | .25 | .07 | .13 | .16 | .10 |
| Net realized and unrealized gain (loss) | .18 | 4.97 | (1.22) | .13 | 1.40 |
| Total from investment operations | .43 | 5.04 | (1.09) | .29 | 1.50 |
| Distributions from net investment income | (.27) | (.10) | (.14) | (.18) | (.12) |
| Distributions from net realized gain | (1.05) | (.59) | (.67) | (.99) | (.43) |
| Total distributions | (1.31)C | (.68)C | (.81) | (1.17) | (.55) |
| Net asset value, end of period | $12.91 | $13.79 | $9.43 | $11.33 | $12.21 |
| Total ReturnD,E | 2.77% | 55.40% | (10.68)% | 3.13% | 13.44% |
| Ratios to Average Net AssetsB,F,G | | | | | |
| Expenses before reductions | 1.00% | 1.00% | 1.00% | .99%H | .87% |
| Expenses net of fee waivers, if any | 1.00% | 1.00% | 1.00% | .99%H | .87% |
| Expenses net of all reductions | 1.00% | 1.00% | 1.00% | .99%H | .87% |
| Net investment income (loss) | 1.82% | .62% | 1.19% | 1.38% | .79% |
| Supplemental Data | | | | | |
| Net assets, end of period (000 omitted) | $604,140 | $643,283 | $456,849 | $547,563 | $566,474 |
| Portfolio turnover rateI | 27% | 25% | 30% | 22% | 21% |
A Calculated based on average shares outstanding during the period.
B Net investment income (loss) is affected by the timing of the declaration of dividends by any underlying mutual funds or exchange-traded funds (ETFs). Net investment income (loss) of any such underlying funds is not included in the Fund's net investment income (loss) ratio.
C Total distributions per share do not sum due to rounding.
D Total returns would have been lower if certain expenses had not been reduced during the applicable periods shown.
E Total returns do not include the effect of the sales charges.
F Fees and expenses of any underlying mutual funds or exchange-traded funds (ETFs) are not included in the Fund's expense ratio. The Fund indirectly bears its proportionate share of these expenses. For additional expense information related to investments in Fidelity Central Funds, please refer to the "Investments in Fidelity Central Funds" note found in the Notes to Financial Statements section of the most recent Annual or Semi-Annual report.
G Expense ratios reflect operating expenses of the class. Expenses before reductions do not reflect amounts reimbursed, waived, or reduced through arrangements with the investment adviser, brokerage services, or other offset arrangements, if applicable, and do not represent the amount paid by the class during periods when reimbursements, waivers or reductions occur.
H On certain classes, the size and fluctuation of net assets and expense amounts may cause ratios to differ from contractual rates.
I Amount does not include the portfolio activity of any underlying mutual funds or exchange-traded funds (ETFs).
See accompanying notes which are an integral part of the financial statements.
Fidelity Advisor Freedom 2045 Fund Class M
| Years ended March 31, | 2022 | 2021 | 2020 | 2019 | 2018 |
| Selected Per–Share Data | | | | | |
| Net asset value, beginning of period | $13.62 | $9.34 | $11.22 | $12.12 | $11.19 |
| Income from Investment Operations | | | | | |
| Net investment income (loss)A,B | .22 | .04 | .10 | .13 | .06 |
| Net realized and unrealized gain (loss) | .18 | 4.90 | (1.20) | .12 | 1.39 |
| Total from investment operations | .40 | 4.94 | (1.10) | .25 | 1.45 |
| Distributions from net investment income | (.24) | (.08) | (.12) | (.16) | (.10) |
| Distributions from net realized gain | (1.05) | (.59) | (.67) | (.99) | (.43) |
| Total distributions | (1.29) | (.66)C | (.78)C | (1.15) | (.52)C |
| Net asset value, end of period | $12.73 | $13.62 | $9.34 | $11.22 | $12.12 |
| Total ReturnD,E | 2.54% | 54.84% | (10.80)% | 2.79% | 13.12% |
| Ratios to Average Net AssetsB,F,G | | | | | |
| Expenses before reductions | 1.25% | 1.25% | 1.25% | 1.24%H | 1.13% |
| Expenses net of fee waivers, if any | 1.25% | 1.25% | 1.25% | 1.24%H | 1.13% |
| Expenses net of all reductions | 1.25% | 1.25% | 1.25% | 1.24%H | 1.13% |
| Net investment income (loss) | 1.57% | .36% | .94% | 1.13% | .54% |
| Supplemental Data | | | | | |
| Net assets, end of period (000 omitted) | $250,719 | $258,276 | $181,179 | $210,625 | $207,442 |
| Portfolio turnover rateI | 27% | 25% | 30% | 22% | 21% |
A Calculated based on average shares outstanding during the period.
B Net investment income (loss) is affected by the timing of the declaration of dividends by any underlying mutual funds or exchange-traded funds (ETFs). Net investment income (loss) of any such underlying funds is not included in the Fund's net investment income (loss) ratio.
C Total distributions per share do not sum due to rounding.
D Total returns would have been lower if certain expenses had not been reduced during the applicable periods shown.
E Total returns do not include the effect of the sales charges.
F Fees and expenses of any underlying mutual funds or exchange-traded funds (ETFs) are not included in the Fund's expense ratio. The Fund indirectly bears its proportionate share of these expenses. For additional expense information related to investments in Fidelity Central Funds, please refer to the "Investments in Fidelity Central Funds" note found in the Notes to Financial Statements section of the most recent Annual or Semi-Annual report.
G Expense ratios reflect operating expenses of the class. Expenses before reductions do not reflect amounts reimbursed, waived, or reduced through arrangements with the investment adviser, brokerage services, or other offset arrangements, if applicable, and do not represent the amount paid by the class during periods when reimbursements, waivers or reductions occur.
H On certain classes, the size and fluctuation of net assets and expense amounts may cause ratios to differ from contractual rates.
I Amount does not include the portfolio activity of any underlying mutual funds or exchange-traded funds (ETFs).
See accompanying notes which are an integral part of the financial statements.
Fidelity Advisor Freedom 2045 Fund Class C
| Years ended March 31, | 2022 | 2021 | 2020 | 2019 | 2018 |
| Selected Per–Share Data | | | | | |
| Net asset value, beginning of period | $13.36 | $9.18 | $11.07 | $11.98 | $11.08 |
| Income from Investment Operations | | | | | |
| Net investment income (loss)A,B | .14 | (.02) | .05 | .07 | –C |
| Net realized and unrealized gain (loss) | .17 | 4.83 | (1.20) | .13 | 1.38 |
| Total from investment operations | .31 | 4.81 | (1.15) | .20 | 1.38 |
| Distributions from net investment income | (.19) | (.04) | (.08) | (.12) | (.05) |
| Distributions from net realized gain | (1.05) | (.59) | (.67) | (.99) | (.43) |
| Total distributions | (1.23)D | (.63) | (.74)D | (1.11) | (.48) |
| Net asset value, end of period | $12.44 | $13.36 | $9.18 | $11.07 | $11.98 |
| Total ReturnE,F | 1.96% | 54.24% | (11.32)% | 2.29% | 12.59% |
| Ratios to Average Net AssetsB,G,H | | | | | |
| Expenses before reductions | 1.75% | 1.75% | 1.75% | 1.74%I | 1.63% |
| Expenses net of fee waivers, if any | 1.75% | 1.75% | 1.75% | 1.74%I | 1.63% |
| Expenses net of all reductions | 1.75% | 1.75% | 1.75% | 1.74%I | 1.63% |
| Net investment income (loss) | 1.07% | (.14)% | .44% | .63% | .04% |
| Supplemental Data | | | | | |
| Net assets, end of period (000 omitted) | $28,993 | $33,637 | $22,256 | $25,383 | $30,549 |
| Portfolio turnover rateJ | 27% | 25% | 30% | 22% | 21% |
A Calculated based on average shares outstanding during the period.
B Net investment income (loss) is affected by the timing of the declaration of dividends by any underlying mutual funds or exchange-traded funds (ETFs). Net investment income (loss) of any such underlying funds is not included in the Fund's net investment income (loss) ratio.
C Amount represents less than $.005 per share.
D Total distributions per share do not sum due to rounding.
E Total returns would have been lower if certain expenses had not been reduced during the applicable periods shown.
F Total returns do not include the effect of the contingent deferred sales charge.
G Fees and expenses of any underlying mutual funds or exchange-traded funds (ETFs) are not included in the Fund's expense ratio. The Fund indirectly bears its proportionate share of these expenses. For additional expense information related to investments in Fidelity Central Funds, please refer to the "Investments in Fidelity Central Funds" note found in the Notes to Financial Statements section of the most recent Annual or Semi-Annual report.
H Expense ratios reflect operating expenses of the class. Expenses before reductions do not reflect amounts reimbursed, waived, or reduced through arrangements with the investment adviser, brokerage services, or other offset arrangements, if applicable, and do not represent the amount paid by the class during periods when reimbursements, waivers or reductions occur.
I On certain classes, the size and fluctuation of net assets and expense amounts may cause ratios to differ from contractual rates.
J Amount does not include the portfolio activity of any underlying mutual funds or exchange-traded funds (ETFs).
See accompanying notes which are an integral part of the financial statements.
Fidelity Advisor Freedom 2045 Fund Class I
| Years ended March 31, | 2022 | 2021 | 2020 | 2019 | 2018 |
| Selected Per–Share Data | | | | | |
| Net asset value, beginning of period | $13.91 | $9.50 | $11.41 | $12.29 | $11.33 |
| Income from Investment Operations | | | | | |
| Net investment income (loss)A,B | .29 | .10 | .16 | .19 | .12 |
| Net realized and unrealized gain (loss) | .18 | 5.02 | (1.23) | .13 | 1.42 |
| Total from investment operations | .47 | 5.12 | (1.07) | .32 | 1.54 |
| Distributions from net investment income | (.29) | (.12) | (.16) | (.20) | (.14) |
| Distributions from net realized gain | (1.05) | (.59) | (.68) | (.99) | (.44) |
| Total distributions | (1.34) | (.71) | (.84) | (1.20)C | (.58) |
| Net asset value, end of period | $13.04 | $13.91 | $9.50 | $11.41 | $12.29 |
| Total ReturnD | 3.02% | 55.77% | (10.46)% | 3.34% | 13.77% |
| Ratios to Average Net AssetsB,E,F | | | | | |
| Expenses before reductions | .75% | .75% | .75% | .75% | .64% |
| Expenses net of fee waivers, if any | .75% | .75% | .75% | .75% | .64% |
| Expenses net of all reductions | .75% | .75% | .75% | .75% | .64% |
| Net investment income (loss) | 2.07% | .87% | 1.44% | 1.63% | 1.03% |
| Supplemental Data | | | | | |
| Net assets, end of period (000 omitted) | $752,617 | $777,429 | $522,314 | $577,252 | $543,170 |
| Portfolio turnover rateG | 27% | 25% | 30% | 22% | 21% |
A Calculated based on average shares outstanding during the period.
B Net investment income (loss) is affected by the timing of the declaration of dividends by any underlying mutual funds or exchange-traded funds (ETFs). Net investment income (loss) of any such underlying funds is not included in the Fund's net investment income (loss) ratio.
C Total distributions per share do not sum due to rounding.
D Total returns would have been lower if certain expenses had not been reduced during the applicable periods shown.
E Fees and expenses of any underlying mutual funds or exchange-traded funds (ETFs) are not included in the Fund's expense ratio. The Fund indirectly bears its proportionate share of these expenses. For additional expense information related to investments in Fidelity Central Funds, please refer to the "Investments in Fidelity Central Funds" note found in the Notes to Financial Statements section of the most recent Annual or Semi-Annual report.
F Expense ratios reflect operating expenses of the class. Expenses before reductions do not reflect amounts reimbursed, waived, or reduced through arrangements with the investment adviser, brokerage services, or other offset arrangements, if applicable, and do not represent the amount paid by the class during periods when reimbursements, waivers or reductions occur.
G Amount does not include the portfolio activity of any underlying mutual funds or exchange-traded funds (ETFs).
See accompanying notes which are an integral part of the financial statements.
Fidelity Advisor Freedom 2045 Fund Class Z
| Years ended March 31, | 2022 | 2021 | 2020 | 2019 A |
| Selected Per–Share Data | | | | |
| Net asset value, beginning of period | $13.79 | $9.43 | $11.35 | $12.36 |
| Income from Investment Operations | | | | |
| Net investment income (loss)B,C | .30 | .12 | .17 | .20 |
| Net realized and unrealized gain (loss) | .18 | 4.96 | (1.22) | (.46) |
| Total from investment operations | .48 | 5.08 | (1.05) | (.26) |
| Distributions from net investment income | (.31) | (.14) | (.18) | (.26) |
| Distributions from net realized gain | (1.05) | (.59) | (.69) | (.49) |
| Total distributions | (1.36) | (.72)D | (.87) | (.75) |
| Net asset value, end of period | $12.91 | $13.79 | $9.43 | $11.35 |
| Total ReturnE,F | 3.12% | 55.85% | (10.33)% | (1.33)% |
| Ratios to Average Net AssetsC,G,H | | | | |
| Expenses before reductions | .64% | .64% | .65%I | .64%J |
| Expenses net of fee waivers, if any | .64% | .64% | .65%I | .64%J |
| Expenses net of all reductions | .64% | .64% | .65%I | .64%J |
| Net investment income (loss) | 2.18% | .97% | 1.54% | 3.71%J |
| Supplemental Data | | | | |
| Net assets, end of period (000 omitted) | $65,648 | $35,350 | $16,800 | $1,376 |
| Portfolio turnover rateK | 27% | 25% | 30% | 22% |
A For the period October 2, 2018 (commencement of sale of shares) through March 31, 2019.
B Calculated based on average shares outstanding during the period.
C Net investment income (loss) is affected by the timing of the declaration of dividends by any underlying mutual funds or exchange-traded funds (ETFs). Net investment income (loss) of any such underlying funds is not included in the Fund's net investment income (loss) ratio.
D Total distributions per share do not sum due to rounding.
E Total returns for periods of less than one year are not annualized.
F Total returns would have been lower if certain expenses had not been reduced during the applicable periods shown.
G Fees and expenses of any underlying mutual funds or exchange-traded funds (ETFs) are not included in the Fund's expense ratio. The Fund indirectly bears its proportionate share of these expenses. For additional expense information related to investments in Fidelity Central Funds, please refer to the "Investments in Fidelity Central Funds" note found in the Notes to Financial Statements section of the most recent Annual or Semi-Annual report.
H Expense ratios reflect operating expenses of the class. Expenses before reductions do not reflect amounts reimbursed, waived, or reduced through arrangements with the investment adviser, brokerage services, or other offset arrangements, if applicable, and do not represent the amount paid by the class during periods when reimbursements, waivers or reductions occur.
I On certain classes, the size and fluctuation of net assets and expense amounts may cause ratios to differ from contractual rates.
J Annualized
K Amount does not include the portfolio activity of any underlying mutual funds or exchange-traded funds (ETFs).
See accompanying notes which are an integral part of the financial statements.
Fidelity Advisor Freedom 2045 Fund Class Z6
| Years ended March 31, | 2022 | 2021 | 2020 | 2019 | 2018 A |
| Selected Per–Share Data | | | | | |
| Net asset value, beginning of period | $13.88 | $9.48 | $11.39 | $12.28 | $11.65 |
| Income from Investment Operations | | | | | |
| Net investment income (loss)B,C | .32 | .14 | .19 | .22 | .15 |
| Net realized and unrealized gain (loss) | .19 | 4.99 | (1.23) | .12 | .92 |
| Total from investment operations | .51 | 5.13 | (1.04) | .34 | 1.07 |
| Distributions from net investment income | (.32) | (.15) | (.19) | (.24) | (.18) |
| Distributions from net realized gain | (1.05) | (.59) | (.69) | (.99) | (.26) |
| Total distributions | (1.37) | (.73)D | (.87)D | (1.23) | (.44) |
| Net asset value, end of period | $13.02 | $13.88 | $9.48 | $11.39 | $12.28 |
| Total ReturnE,F | 3.32% | 56.12% | (10.22)% | 3.58% | 9.15% |
| Ratios to Average Net AssetsC,G,H | | | | | |
| Expenses before reductions | .49% | .49% | .49% | .50%I | .51%I,J |
| Expenses net of fee waivers, if any | .49% | .49% | .49% | .50%I | .51%I,J |
| Expenses net of all reductions | .49% | .49% | .49% | .50%I | .51%I,J |
| Net investment income (loss) | 2.33% | 1.12% | 1.70% | 1.88% | 1.50%J |
| Supplemental Data | | | | | |
| Net assets, end of period (000 omitted) | $171,735 | $113,839 | $44,798 | $31,493 | $9,112 |
| Portfolio turnover rateK | 27% | 25% | 30% | 22% | 21% |
A For the period June 6, 2017 (commencement of sale of shares) through March 31, 2018.
B Calculated based on average shares outstanding during the period.
C Net investment income (loss) is affected by the timing of the declaration of dividends by any underlying mutual funds or exchange-traded funds (ETFs). Net investment income (loss) of any such underlying funds is not included in the Fund's net investment income (loss) ratio.
D Total distributions per share do not sum due to rounding.
E Total returns for periods of less than one year are not annualized.
F Total returns would have been lower if certain expenses had not been reduced during the applicable periods shown.
G Fees and expenses of any underlying mutual funds or exchange-traded funds (ETFs) are not included in the Fund's expense ratio. The Fund indirectly bears its proportionate share of these expenses. For additional expense information related to investments in Fidelity Central Funds, please refer to the "Investments in Fidelity Central Funds" note found in the Notes to Financial Statements section of the most recent Annual or Semi-Annual report.
H Expense ratios reflect operating expenses of the class. Expenses before reductions do not reflect amounts reimbursed, waived, or reduced through arrangements with the investment adviser, brokerage services, or other offset arrangements, if applicable, and do not represent the amount paid by the class during periods when reimbursements, waivers or reductions occur.
I On certain classes, the size and fluctuation of net assets and expense amounts may cause ratios to differ from contractual rates.
J Annualized
K Amount does not include the portfolio activity of any underlying mutual funds or exchange-traded funds (ETFs).
See accompanying notes which are an integral part of the financial statements.
Fidelity Advisor Freedom® 2050 Fund
Investment Summary (Unaudited)
The information in the following tables is based on the direct investments of the Fund.
Top Holdings as of March 31, 2022
| | % of fund's net assets |
| Fidelity Series Emerging Markets Opportunities Fund | 12.7 |
| Fidelity Series Large Cap Stock Fund | 9.8 |
| Fidelity Series International Value Fund | 7.5 |
| Fidelity Series Overseas Fund | 7.5 |
| Fidelity Series International Growth Fund | 7.4 |
| Fidelity Series Value Discovery Fund | 6.4 |
| Fidelity Series Stock Selector Large Cap Value Fund | 6.3 |
| Fidelity Advisor Series Equity Growth Fund | 6.2 |
| Fidelity Series Opportunistic Insights Fund | 5.8 |
| Fidelity Series Long-Term Treasury Bond Index Fund | 5.3 |
| | 74.9 |
Asset Allocation (% of fund's net assets)
| Period end |
| | Domestic Equity Funds | 50.4% |
| | International Equity Funds | 41.8% |
| | Bond Funds | 7.7% |
| | Short-Term Funds | 0.1% |

Domestic Equity Funds category includes Fidelity Series Commodity Strategy Fund which invests in commodity-related investments.
Fidelity Advisor Freedom® 2050 Fund
Schedule of Investments March 31, 2022
Showing Percentage of Net Assets
| U.S. Treasury Obligations - 0.0% | | | |
| | | Principal Amount | Value |
| U.S. Treasury Bills, yield at date of purchase 0.12% to 0.33% 4/14/22 to 5/19/22 (a) | | | |
| (Cost $669,930) | | 670,000 | 669,946 |
| | | Shares | Value |
|
| Domestic Equity Funds - 50.4% | | | |
| Fidelity Advisor Series Equity Growth Fund (b) | | 6,444,149 | $99,433,214 |
| Fidelity Advisor Series Growth Opportunities Fund (b) | | 5,576,502 | 68,200,624 |
| Fidelity Advisor Series Small Cap Fund (b) | | 3,474,374 | 45,132,112 |
| Fidelity Series All-Sector Equity Fund (b) | | 3,956,520 | 42,651,283 |
| Fidelity Series Commodity Strategy Fund (b) | | 4,629,873 | 23,658,649 |
| Fidelity Series Large Cap Stock Fund (b) | | 8,231,334 | 156,477,660 |
| Fidelity Series Large Cap Value Index Fund (b) | | 1,101,852 | 16,924,449 |
| Fidelity Series Opportunistic Insights Fund (b) | | 5,027,423 | 91,901,300 |
| Fidelity Series Small Cap Opportunities Fund (b) | | 4,091,284 | 55,723,282 |
| Fidelity Series Stock Selector Large Cap Value Fund (b) | | 7,370,371 | 99,868,527 |
| Fidelity Series Value Discovery Fund (b) | | 6,357,976 | 101,727,609 |
| TOTAL DOMESTIC EQUITY FUNDS | | | |
| (Cost $642,362,275) | | | 801,698,709 |
|
| International Equity Funds - 41.8% | | | |
| Fidelity Series Canada Fund (b) | | 3,334,764 | 51,755,541 |
| Fidelity Series Emerging Markets Fund (b) | | 2,350,326 | 21,811,030 |
| Fidelity Series Emerging Markets Opportunities Fund (b) | | 10,970,096 | 201,849,774 |
| Fidelity Series International Growth Fund (b) | | 7,136,432 | 118,322,049 |
| Fidelity Series International Small Cap Fund (b) | | 1,805,679 | 32,411,933 |
| Fidelity Series International Value Fund (b) | | 10,833,194 | 119,490,130 |
| Fidelity Series Overseas Fund (b) | | 9,426,909 | 118,967,596 |
| TOTAL INTERNATIONAL EQUITY FUNDS | | | |
| (Cost $573,922,640) | | | 664,608,053 |
|
| Bond Funds - 7.7% | | | |
| Fidelity Series 5+ Year Inflation-Protected Bond Index Fund (b) | | 165,755 | 1,591,252 |
| Fidelity Series Emerging Markets Debt Fund (b) | | 941,461 | 7,767,052 |
| Fidelity Series Emerging Markets Debt Local Currency Fund (b) | | 292,196 | 2,632,684 |
| Fidelity Series Floating Rate High Income Fund (b) | | 173,123 | 1,590,996 |
| Fidelity Series High Income Fund (b) | | 1,059,466 | 9,630,545 |
| Fidelity Series International Credit Fund (b) | | 62,731 | 580,890 |
| Fidelity Series Investment Grade Bond Fund (b) | | 767,318 | 8,371,442 |
| Fidelity Series Long-Term Treasury Bond Index Fund (b) | | 11,149,790 | 84,961,397 |
| Fidelity Series Real Estate Income Fund (b) | | 499,778 | 5,677,483 |
| TOTAL BOND FUNDS | | | |
| (Cost $132,033,804) | | | 122,803,741 |
|
| Short-Term Funds - 0.1% | | | |
| Fidelity Cash Central Fund 0.31% (c) | | | |
| (Cost $1,098,518) | | 1,098,299 | 1,098,518 |
| TOTAL INVESTMENT IN SECURITIES - 100.0% | | | |
| (Cost $1,350,087,167) | | | 1,590,878,967 |
| NET OTHER ASSETS (LIABILITIES) - 0.0% | | | (321,106) |
| NET ASSETS - 100% | | | $1,590,557,861 |
| Futures Contracts | | | | | |
| | Number of contracts | Expiration Date | Notional Amount | Value | Unrealized Appreciation/(Depreciation) |
| Purchased | | | | | |
| Equity Index Contracts | | | | | |
| ICE E-mini MSCI EAFE Index Contracts (United States) | 38 | June 2022 | $4,074,360 | $178,527 | $178,527 |
| ICE E-mini MSCI Emerging Markets Index Contracts (United States) | 120 | June 2022 | 6,753,000 | 158,092 | 158,092 |
|
| TOTAL PURCHASED | | | | | 336,619 |
|
| Sold | | | | | |
| Equity Index Contracts | | | | | |
| CME Micro E-mini S&P 500 Index Contracts (United States) | 35 | June 2022 | 7,928,813 | (228,775) | (228,775) |
| TOTAL FUTURES CONTRACTS | | | | | $107,844 |
The notional amount of futures purchased as a percentage of Net Assets is 0.7%
The notional amount of futures sold as a percentage of Net Assets is 0.5%
Legend
(a) Security or a portion of the security was pledged to cover margin requirements for futures contracts. At period end, the value of securities pledged amounted to $657,946.
(b) Affiliated Fund
(c) Affiliated fund that is generally available only to investment companies and other accounts managed by Fidelity Investments. The rate quoted is the annualized seven-day yield of the fund at period end. A complete unaudited listing of the fund's holdings as of its most recent quarter end is available upon request. In addition, each Fidelity Central Fund's financial statements, which are not covered by the Fund's Report of Independent Registered Public Accounting Firm, are available on the SEC's website or upon request.
Affiliated Central Funds
Fiscal year to date information regarding the Fund's investments in Fidelity Central Funds, including the ownership percentage, is presented below.
| Fund | Value, beginning of period | Purchases(a) | Sales Proceeds(a) | Dividend Income | Realized Gain/Loss | Change in Unrealized appreciation (depreciation) | Value, end of period | % ownership, end of period |
| Fidelity Cash Central Fund 0.31% | $623,919 | $5,651,309 | $5,176,709 | $481 | $-- | $(1) | $1,098,518 | 0.0% |
| Total | $623,919 | $5,651,309 | $5,176,709 | $481 | $-- | $(1) | $1,098,518 | |
(a) Includes the value of shares purchased or redeemed through in-kind transactions, if applicable.
Amounts in the income column in the above table include any capital gain distributions from underlying funds, which are presented in the corresponding line-item in the Statement of Operations, if applicable.
Affiliated Underlying Funds
Fiscal year to date information regarding the Fund's investments in affiliated Underlying Funds is presented below. Exchanges between classes of the same affiliated Underlying Funds may occur. If an underlying Fund changes its name, the name presented below is the name in effect at period end.
| Fund | Value, beginning of period | Purchases(a) | Sales Proceeds(a) | Dividend Income | Realized Gain (loss) | Change in Unrealized appreciation (depreciation) | Value, end of period |
| Fidelity Advisor Series Equity Growth Fund | $97,980,503 | $38,406,633 | $31,262,336 | $18,110,460 | $1,539,951 | $(7,231,537) | $99,433,214 |
| Fidelity Advisor Series Growth Opportunities Fund | 68,135,430 | 39,231,247 | 19,703,025 | 16,656,774 | (350,712) | (19,112,316) | 68,200,624 |
| Fidelity Advisor Series Small Cap Fund | 44,331,868 | 16,777,074 | 9,463,815 | 8,469,402 | 880,300 | (7,393,315) | 45,132,112 |
| Fidelity Series 0-5 Year Inflation-Protected Bond Index Fund | -- | 7,460,230 | 7,430,453 | 23,459 | (26,285) | -- | -- |
| Fidelity Series 5+ Year Inflation-Protected Bond Index Fund | -- | 14,805,540 | 12,658,937 | 73,874 | (507,304) | (48,047) | 1,591,252 |
| Fidelity Series All-Sector Equity Fund | 41,894,296 | 13,240,192 | 9,264,743 | 8,582,967 | 352,330 | (3,570,792) | 42,651,283 |
| Fidelity Series Canada Fund | 37,642,902 | 13,131,912 | 7,647,075 | 1,054,561 | 131,573 | 8,496,229 | 51,755,541 |
| Fidelity Series Commodity Strategy Fund | 42,965,340 | 18,503,107 | 39,291,820 | 14,132,993 | (2,083,285) | 3,565,307 | 23,658,649 |
| Fidelity Series Emerging Markets Debt Fund | 8,391,006 | 1,781,688 | 1,602,784 | 402,399 | (110,715) | (692,143) | 7,767,052 |
| Fidelity Series Emerging Markets Debt Local Currency Fund | 2,723,703 | 675,391 | 459,634 | 114,824 | (34,901) | (271,875) | 2,632,684 |
| Fidelity Series Emerging Markets Fund | 24,628,787 | 6,374,445 | 3,874,066 | 794,427 | (33,004) | (5,285,132) | 21,811,030 |
| Fidelity Series Emerging Markets Opportunities Fund | 222,376,425 | 82,930,033 | 34,346,139 | 25,090,103 | (902,482) | (68,208,063) | 201,849,774 |
| Fidelity Series Floating Rate High Income Fund | 1,616,934 | 272,844 | 299,297 | 71,658 | (16,513) | 17,028 | 1,590,996 |
| Fidelity Series Government Money Market Fund 0.31% | 10,266,165 | 743,007 | 11,009,172 | 2,305 | -- | -- | -- |
| Fidelity Series High Income Fund | 9,633,461 | 2,343,866 | 2,038,436 | 546,332 | (10,639) | (297,707) | 9,630,545 |
| Fidelity Series Inflation-Protected Bond Index Fund | 30,859,443 | 3,781,237 | 35,895,961 | 323,911 | 2,840,377 | (1,585,096) | -- |
| Fidelity Series International Credit Fund | 606,296 | 19,565 | -- | 19,566 | -- | (44,971) | 580,890 |
| Fidelity Series International Growth Fund | 105,482,126 | 35,207,234 | 11,768,863 | 9,917,226 | (134,603) | (10,463,845) | 118,322,049 |
| Fidelity Series International Small Cap Fund | 33,111,302 | 8,208,044 | 3,969,653 | 4,506,142 | (21,617) | (4,916,143) | 32,411,933 |
| Fidelity Series International Value Fund | 105,445,725 | 37,789,724 | 25,659,066 | 6,226,760 | 179,508 | 1,734,239 | 119,490,130 |
| Fidelity Series Investment Grade Bond Fund | 692,033 | 13,481,997 | 5,682,932 | 33,970 | (111,781) | (7,875) | 8,371,442 |
| Fidelity Series Large Cap Stock Fund | 153,023,759 | 33,318,119 | 34,593,915 | 14,891,671 | 542,466 | 4,187,231 | 156,477,660 |
| Fidelity Series Large Cap Value Index Fund | 16,515,626 | 3,610,238 | 3,985,592 | 1,170,169 | 114,844 | 669,333 | 16,924,449 |
| Fidelity Series Long-Term Treasury Bond Index Fund | 42,343,056 | 57,140,226 | 10,806,903 | 1,328,262 | (1,360,115) | (2,354,867) | 84,961,397 |
| Fidelity Series Opportunistic Insights Fund | 90,844,117 | 37,177,185 | 27,795,860 | 17,726,543 | 1,530,879 | (9,855,021) | 91,901,300 |
| Fidelity Series Overseas Fund | 105,656,698 | 27,713,349 | 13,612,555 | 3,668,564 | 55,055 | (844,951) | 118,967,596 |
| Fidelity Series Real Estate Income Fund | 5,917,342 | 734,931 | 1,147,172 | 244,338 | 6,406 | 165,976 | 5,677,483 |
| Fidelity Series Short-Term Credit Fund | 2,162,490 | 67,746 | 2,230,420 | 10,491 | 50,020 | (49,836) | -- |
| Fidelity Series Small Cap Opportunities Fund | 54,718,283 | 25,551,987 | 11,136,945 | 14,833,931 | (255,591) | (13,154,452) | 55,723,282 |
| Fidelity Series Stock Selector Large Cap Value Fund | 96,913,735 | 32,146,761 | 24,372,870 | 18,276,199 | 209,386 | (5,028,485) | 99,868,527 |
| Fidelity Series Value Discovery Fund | 99,208,213 | 27,001,588 | 25,220,993 | 12,150,598 | 435,195 | 303,606 | 101,727,609 |
| | $1,556,087,064 | $599,627,140 | $428,231,432 | $199,454,879 | $2,908,743 | $(141,277,520) | $1,589,110,503 |
(a) Includes the value of shares purchased or redeemed through in-kind transactions, if applicable.
Amounts in the income column in the above table include any capital gain distributions from underlying funds, which are presented in the corresponding line-item in the Statement of Operations, if applicable.
Investment Valuation
The following is a summary of the inputs used, as of March 31, 2022, involving the Fund's assets and liabilities carried at fair value. The inputs or methodology used for valuing securities may not be an indication of the risk associated with investing in those securities. For more information on valuation inputs, and their aggregation into the levels used below, please refer to the Investment Valuation section in the accompanying Notes to Financial Statements.
| | Valuation Inputs at Reporting Date: |
| Description | Total | Level 1 | Level 2 | Level 3 |
| Investments in Securities: | | | | |
| Other Short-Term Investments and Net Other Assets | $669,946 | $-- | $669,946 | $-- |
| Domestic Equity Funds | 801,698,709 | 801,698,709 | -- | -- |
| International Equity Funds | 664,608,053 | 664,608,053 | -- | -- |
| Bond Funds | 122,803,741 | 122,803,741 | -- | -- |
| Short-Term Funds | 1,098,518 | 1,098,518 | -- | -- |
| Total Investments in Securities: | $1,590,878,967 | $1,590,209,021 | $669,946 | $-- |
| Derivative Instruments: | | | | |
| Assets | | | | |
| Futures Contracts | $336,619 | $336,619 | $-- | $-- |
| Total Assets | $336,619 | $336,619 | $-- | $-- |
| Liabilities | | | | |
| Futures Contracts | $(228,775) | $(228,775) | $-- | $-- |
| Total Liabilities | $(228,775) | $(228,775) | $-- | $-- |
| Total Derivative Instruments: | $107,844 | $107,844 | $-- | $-- |
Value of Derivative Instruments
The following table is a summary of the Fund's value of derivative instruments by primary risk exposure as of March 31, 2022. For additional information on derivative instruments, please refer to the Derivative Instruments section in the accompanying Notes to Financial Statements.
| Primary Risk Exposure / Derivative Type | Value |
| | Asset | Liability |
| Equity Risk | | |
| Futures Contracts(a) | $336,619 | $(228,775) |
| Total Equity Risk | 336,619 | (228,775) |
| Total Value of Derivatives | $336,619 | $(228,775) |
(a) Reflects gross cumulative appreciation (depreciation) on futures contracts as presented in the Schedule of Investments. In the Statement of Assets and Liabilities, the period end daily variation margin is included in receivable or payable for daily variation margin on futures contracts, and the net cumulative appreciation (depreciation) is included in Total accumulated earnings (loss).
See accompanying notes which are an integral part of the financial statements.
Fidelity Advisor Freedom® 2050 Fund
Financial Statements
Statement of Assets and Liabilities
| | | March 31, 2022 |
| Assets | | |
Investment in securities, at value — See accompanying schedule:
Unaffiliated issuers (cost $669,930) | $669,946 | |
| Fidelity Central Funds (cost $1,098,518) | 1,098,518 | |
| Other affiliated issuers (cost $1,348,318,719) | 1,589,110,503 | |
| Total Investment in Securities (cost $1,350,087,167) | | $1,590,878,967 |
| Receivable for investments sold | | 24,148,253 |
| Receivable for fund shares sold | | 1,991,822 |
| Distributions receivable from Fidelity Central Funds | | 167 |
| Total assets | | 1,617,019,209 |
| Liabilities | | |
| Payable for investments purchased | $23,850,600 | |
| Payable for fund shares redeemed | 1,399,917 | |
| Accrued management fee | 929,922 | |
| Distribution and service plan fees payable | 208,137 | |
| Payable for daily variation margin on futures contracts | 72,772 | |
| Total liabilities | | 26,461,348 |
| Net Assets | | $1,590,557,861 |
| Net Assets consist of: | | |
| Paid in capital | | $1,251,762,642 |
| Total accumulated earnings (loss) | | 338,795,219 |
| Net Assets | | $1,590,557,861 |
| Net Asset Value and Maximum Offering Price | | |
| Class A: | | |
| Net Asset Value and redemption price per share ($500,298,107 ÷ 38,722,920 shares)(a) | | $12.92 |
| Maximum offering price per share (100/94.25 of $12.92) | | $13.71 |
| Class M: | | |
| Net Asset Value and redemption price per share ($201,272,296 ÷ 15,733,123 shares)(a) | | $12.79 |
| Maximum offering price per share (100/96.50 of $12.79) | | $13.25 |
| Class C: | | |
| Net Asset Value and offering price per share ($29,875,498 ÷ 2,385,940 shares)(a) | | $12.52 |
| Class I: | | |
| Net Asset Value, offering price and redemption price per share ($662,945,086 ÷ 50,793,706 shares) | | $13.05 |
| Class Z: | | |
| Net Asset Value, offering price and redemption price per share ($49,713,179 ÷ 3,841,819 shares) | | $12.94 |
| Class Z6: | | |
| Net Asset Value, offering price and redemption price per share ($146,453,695 ÷ 11,238,862 shares) | | $13.03 |
(a) Redemption price per share is equal to net asset value less any applicable contingent deferred sales charge.
See accompanying notes which are an integral part of the financial statements.
Statement of Operations
| | | Year ended March 31, 2022 |
| Investment Income | | |
| Dividends: | | |
| Affiliated issuers | | $46,833,603 |
| Interest | | 335 |
| Income from Fidelity Central Funds | | 481 |
| Total income | | 46,834,419 |
| Expenses | | |
| Management fee | $12,019,900 | |
| Distribution and service plan fees | 2,710,449 | |
| Independent trustees' fees and expenses | 4,971 | |
| Total expenses before reductions | 14,735,320 | |
| Expense reductions | (8) | |
| Total expenses after reductions | | 14,735,312 |
| Net investment income (loss) | | 32,099,107 |
| Realized and Unrealized Gain (Loss) | | |
| Net realized gain (loss) on: | | |
| Investment securities: | | |
| Unaffiliated issuers | 689 | |
| Affiliated issuers | 2,908,743 | |
| Futures contracts | (136,186) | |
| Capital gain distributions from underlying funds: | | |
| Affiliated issuers | 152,621,276 | |
| Total net realized gain (loss) | | 155,394,522 |
| Change in net unrealized appreciation (depreciation) on: | | |
| Investment securities: | | |
| Unaffiliated issuers | 13 | |
| Fidelity Central Funds | (1) | |
| Other affiliated issuers | (141,277,520) | |
| Futures contracts | 107,844 | |
| Total change in net unrealized appreciation (depreciation) | | (141,169,664) |
| Net gain (loss) | | 14,224,858 |
| Net increase (decrease) in net assets resulting from operations | | $46,323,965 |
See accompanying notes which are an integral part of the financial statements.
Statement of Changes in Net Assets
| | Year ended March 31, 2022 | Year ended March 31, 2021 |
| Increase (Decrease) in Net Assets | | |
| Operations | | |
| Net investment income (loss) | $32,099,107 | $9,377,690 |
| Net realized gain (loss) | 155,394,522 | 89,564,769 |
| Change in net unrealized appreciation (depreciation) | (141,169,664) | 458,344,758 |
| Net increase (decrease) in net assets resulting from operations | 46,323,965 | 557,287,217 |
| Distributions to shareholders | (151,405,562) | (74,293,041) |
| Share transactions - net increase (decrease) | 139,447,539 | 68,265,186 |
| Total increase (decrease) in net assets | 34,365,942 | 551,259,362 |
| Net Assets | | |
| Beginning of period | 1,556,191,919 | 1,004,932,557 |
| End of period | $1,590,557,861 | $1,556,191,919 |
See accompanying notes which are an integral part of the financial statements.
Financial Highlights
Fidelity Advisor Freedom 2050 Fund Class A
| Years ended March 31, | 2022 | 2021 | 2020 | 2019 | 2018 |
| Selected Per–Share Data | | | | | |
| Net asset value, beginning of period | $13.78 | $9.43 | $11.31 | $12.17 | $11.20 |
| Income from Investment Operations | | | | | |
| Net investment income (loss)A,B | .25 | .07 | .13 | .16 | .09 |
| Net realized and unrealized gain (loss) | .18 | 4.96 | (1.21) | .13 | 1.40 |
| Total from investment operations | .43 | 5.03 | (1.08) | .29 | 1.49 |
| Distributions from net investment income | (.27) | (.10) | (.14) | (.18) | (.12) |
| Distributions from net realized gain | (1.02) | (.58) | (.66) | (.97) | (.40) |
| Total distributions | (1.29) | (.68) | (.80) | (1.15) | (.52) |
| Net asset value, end of period | $12.92 | $13.78 | $9.43 | $11.31 | $12.17 |
| Total ReturnC,D | 2.76% | 55.26% | (10.58)% | 3.08% | 13.42% |
| Ratios to Average Net AssetsB,E,F | | | | | |
| Expenses before reductions | 1.00% | 1.00% | 1.00% | .99%G | .88% |
| Expenses net of fee waivers, if any | 1.00% | 1.00% | 1.00% | .99%G | .88% |
| Expenses net of all reductions | 1.00% | 1.00% | 1.00% | .99%G | .88% |
| Net investment income (loss) | 1.83% | .62% | 1.20% | 1.38% | .79% |
| Supplemental Data | | | | | |
| Net assets, end of period (000 omitted) | $500,298 | $516,427 | $358,407 | $417,583 | $418,313 |
| Portfolio turnover rateH | 26% | 24% | 32% | 23% | 20% |
A Calculated based on average shares outstanding during the period.
B Net investment income (loss) is affected by the timing of the declaration of dividends by any underlying mutual funds or exchange-traded funds (ETFs). Net investment income (loss) of any such underlying funds is not included in the Fund's net investment income (loss) ratio.
C Total returns would have been lower if certain expenses had not been reduced during the applicable periods shown.
D Total returns do not include the effect of the sales charges.
E Fees and expenses of any underlying mutual funds or exchange-traded funds (ETFs) are not included in the Fund's expense ratio. The Fund indirectly bears its proportionate share of these expenses. For additional expense information related to investments in Fidelity Central Funds, please refer to the "Investments in Fidelity Central Funds" note found in the Notes to Financial Statements section of the most recent Annual or Semi-Annual report.
F Expense ratios reflect operating expenses of the class. Expenses before reductions do not reflect amounts reimbursed, waived, or reduced through arrangements with the investment adviser, brokerage services, or other offset arrangements, if applicable, and do not represent the amount paid by the class during periods when reimbursements, waivers or reductions occur.
G On certain classes, the size and fluctuation of net assets and expense amounts may cause ratios to differ from contractual rates.
H Amount does not include the portfolio activity of any underlying mutual funds or exchange-traded funds (ETFs).
See accompanying notes which are an integral part of the financial statements.
Fidelity Advisor Freedom 2050 Fund Class M
| Years ended March 31, | 2022 | 2021 | 2020 | 2019 | 2018 |
| Selected Per–Share Data | | | | | |
| Net asset value, beginning of period | $13.66 | $9.36 | $11.24 | $12.11 | $11.15 |
| Income from Investment Operations | | | | | |
| Net investment income (loss)A,B | .22 | .04 | .11 | .13 | .06 |
| Net realized and unrealized gain (loss) | .18 | 4.92 | (1.22) | .13 | 1.39 |
| Total from investment operations | .40 | 4.96 | (1.11) | .26 | 1.45 |
| Distributions from net investment income | (.24) | (.08) | (.11) | (.16) | (.10) |
| Distributions from net realized gain | (1.02) | (.58) | (.65) | (.97) | (.40) |
| Total distributions | (1.27)C | (.66) | (.77)C | (1.13) | (.49)C |
| Net asset value, end of period | $12.79 | $13.66 | $9.36 | $11.24 | $12.11 |
| Total ReturnD,E | 2.51% | 54.91% | (10.88)% | 2.83% | 13.16% |
| Ratios to Average Net AssetsB,F,G | | | | | |
| Expenses before reductions | 1.25% | 1.25% | 1.25% | 1.25% | 1.13% |
| Expenses net of fee waivers, if any | 1.25% | 1.25% | 1.25% | 1.25% | 1.13% |
| Expenses net of all reductions | 1.25% | 1.25% | 1.25% | 1.25% | 1.13% |
| Net investment income (loss) | 1.58% | .37% | .95% | 1.13% | .54% |
| Supplemental Data | | | | | |
| Net assets, end of period (000 omitted) | $201,272 | $205,281 | $143,526 | $172,974 | $166,634 |
| Portfolio turnover rateH | 26% | 24% | 32% | 23% | 20% |
A Calculated based on average shares outstanding during the period.
B Net investment income (loss) is affected by the timing of the declaration of dividends by any underlying mutual funds or exchange-traded funds (ETFs). Net investment income (loss) of any such underlying funds is not included in the Fund's net investment income (loss) ratio.
C Total distributions per share do not sum due to rounding.
D Total returns would have been lower if certain expenses had not been reduced during the applicable periods shown.
E Total returns do not include the effect of the sales charges.
F Fees and expenses of any underlying mutual funds or exchange-traded funds (ETFs) are not included in the Fund's expense ratio. The Fund indirectly bears its proportionate share of these expenses. For additional expense information related to investments in Fidelity Central Funds, please refer to the "Investments in Fidelity Central Funds" note found in the Notes to Financial Statements section of the most recent Annual or Semi-Annual report.
G Expense ratios reflect operating expenses of the class. Expenses before reductions do not reflect amounts reimbursed, waived, or reduced through arrangements with the investment adviser, brokerage services, or other offset arrangements, if applicable, and do not represent the amount paid by the class during periods when reimbursements, waivers or reductions occur.
H Amount does not include the portfolio activity of any underlying mutual funds or exchange-traded funds (ETFs).
See accompanying notes which are an integral part of the financial statements.
Fidelity Advisor Freedom 2050 Fund Class C
| Years ended March 31, | 2022 | 2021 | 2020 | 2019 | 2018 |
| Selected Per–Share Data | | | | | |
| Net asset value, beginning of period | $13.41 | $9.22 | $11.10 | $11.98 | $11.05 |
| Income from Investment Operations | | | | | |
| Net investment income (loss)A,B | .15 | (.01) | .05 | .07 | –C |
| Net realized and unrealized gain (loss) | .17 | 4.82 | (1.20) | .14 | 1.38 |
| Total from investment operations | .32 | 4.81 | (1.15) | .21 | 1.38 |
| Distributions from net investment income | (.19) | (.04) | (.07) | (.11) | (.06) |
| Distributions from net realized gain | (1.02) | (.58) | (.65) | (.97) | (.39) |
| Total distributions | (1.21) | (.62) | (.73)D | (1.09)D | (.45) |
| Net asset value, end of period | $12.52 | $13.41 | $9.22 | $11.10 | $11.98 |
| Total ReturnE,F | 2.01% | 54.09% | (11.32)% | 2.34% | 12.59% |
| Ratios to Average Net AssetsB,G,H | | | | | |
| Expenses before reductions | 1.75% | 1.75% | 1.75% | 1.74%I | 1.63% |
| Expenses net of fee waivers, if any | 1.75% | 1.75% | 1.75% | 1.74%I | 1.63% |
| Expenses net of all reductions | 1.75% | 1.75% | 1.75% | 1.74%I | 1.63% |
| Net investment income (loss) | 1.08% | (.13)% | .45% | .63% | .04% |
| Supplemental Data | | | | | |
| Net assets, end of period (000 omitted) | $29,875 | $33,105 | $21,457 | $26,139 | $32,763 |
| Portfolio turnover rateJ | 26% | 24% | 32% | 23% | 20% |
A Calculated based on average shares outstanding during the period.
B Net investment income (loss) is affected by the timing of the declaration of dividends by any underlying mutual funds or exchange-traded funds (ETFs). Net investment income (loss) of any such underlying funds is not included in the Fund's net investment income (loss) ratio.
C Amount represents less than $.005 per share.
D Total distributions per share do not sum due to rounding.
E Total returns would have been lower if certain expenses had not been reduced during the applicable periods shown.
F Total returns do not include the effect of the contingent deferred sales charge.
G Fees and expenses of any underlying mutual funds or exchange-traded funds (ETFs) are not included in the Fund's expense ratio. The Fund indirectly bears its proportionate share of these expenses. For additional expense information related to investments in Fidelity Central Funds, please refer to the "Investments in Fidelity Central Funds" note found in the Notes to Financial Statements section of the most recent Annual or Semi-Annual report.
H Expense ratios reflect operating expenses of the class. Expenses before reductions do not reflect amounts reimbursed, waived, or reduced through arrangements with the investment adviser, brokerage services, or other offset arrangements, if applicable, and do not represent the amount paid by the class during periods when reimbursements, waivers or reductions occur.
I On certain classes, the size and fluctuation of net assets and expense amounts may cause ratios to differ from contractual rates.
J Amount does not include the portfolio activity of any underlying mutual funds or exchange-traded funds (ETFs).
See accompanying notes which are an integral part of the financial statements.
Fidelity Advisor Freedom 2050 Fund Class I
| Years ended March 31, | 2022 | 2021 | 2020 | 2019 | 2018 |
| Selected Per–Share Data | | | | | |
| Net asset value, beginning of period | $13.90 | $9.50 | $11.39 | $12.25 | $11.27 |
| Income from Investment Operations | | | | | |
| Net investment income (loss)A,B | .29 | .11 | .16 | .19 | .12 |
| Net realized and unrealized gain (loss) | .18 | 4.99 | (1.22) | .12 | 1.41 |
| Total from investment operations | .47 | 5.10 | (1.06) | .31 | 1.53 |
| Distributions from net investment income | (.30) | (.12) | (.16) | (.20) | (.14) |
| Distributions from net realized gain | (1.02) | (.58) | (.67) | (.97) | (.41) |
| Total distributions | (1.32) | (.70) | (.83) | (1.17) | (.55) |
| Net asset value, end of period | $13.05 | $13.90 | $9.50 | $11.39 | $12.25 |
| Total ReturnC | 3.01% | 55.65% | (10.37)% | 3.30% | 13.74% |
| Ratios to Average Net AssetsB,D,E | | | | | |
| Expenses before reductions | .75% | .75% | .75% | .75% | .64% |
| Expenses net of fee waivers, if any | .75% | .75% | .75% | .75% | .64% |
| Expenses net of all reductions | .75% | .75% | .75% | .75% | .64% |
| Net investment income (loss) | 2.08% | .87% | 1.45% | 1.63% | 1.03% |
| Supplemental Data | | | | | |
| Net assets, end of period (000 omitted) | $662,945 | $675,617 | $436,294 | $488,167 | $466,677 |
| Portfolio turnover rateF | 26% | 24% | 32% | 23% | 20% |
A Calculated based on average shares outstanding during the period.
B Net investment income (loss) is affected by the timing of the declaration of dividends by any underlying mutual funds or exchange-traded funds (ETFs). Net investment income (loss) of any such underlying funds is not included in the Fund's net investment income (loss) ratio.
C Total returns would have been lower if certain expenses had not been reduced during the applicable periods shown.
D Fees and expenses of any underlying mutual funds or exchange-traded funds (ETFs) are not included in the Fund's expense ratio. The Fund indirectly bears its proportionate share of these expenses. For additional expense information related to investments in Fidelity Central Funds, please refer to the "Investments in Fidelity Central Funds" note found in the Notes to Financial Statements section of the most recent Annual or Semi-Annual report.
E Expense ratios reflect operating expenses of the class. Expenses before reductions do not reflect amounts reimbursed, waived, or reduced through arrangements with the investment adviser, brokerage services, or other offset arrangements, if applicable, and do not represent the amount paid by the class during periods when reimbursements, waivers or reductions occur.
F Amount does not include the portfolio activity of any underlying mutual funds or exchange-traded funds (ETFs).
See accompanying notes which are an integral part of the financial statements.
Fidelity Advisor Freedom 2050 Fund Class Z
| Years ended March 31, | 2022 | 2021 | 2020 | 2019 A |
| Selected Per–Share Data | | | | |
| Net asset value, beginning of period | $13.80 | $9.43 | $11.34 | $12.34 |
| Income from Investment Operations | | | | |
| Net investment income (loss)B,C | .30 | .12 | .17 | .28 |
| Net realized and unrealized gain (loss) | .18 | 4.97 | (1.22) | (.54) |
| Total from investment operations | .48 | 5.09 | (1.05) | (.26) |
| Distributions from net investment income | (.32) | (.14) | (.18) | (.25) |
| Distributions from net realized gain | (1.02) | (.58) | (.68) | (.49) |
| Total distributions | (1.34) | (.72) | (.86) | (.74) |
| Net asset value, end of period | $12.94 | $13.80 | $9.43 | $11.34 |
| Total ReturnD,E | 3.10% | 55.96% | (10.33)% | (1.34)% |
| Ratios to Average Net AssetsC,F,G | | | | |
| Expenses before reductions | .64% | .64% | .65%H | .65%H,I |
| Expenses net of fee waivers, if any | .64% | .64% | .65%H | .65%H,I |
| Expenses net of all reductions | .64% | .64% | .65%H | .65%H,I |
| Net investment income (loss) | 2.18% | .98% | 1.55% | 5.18%I |
| Supplemental Data | | | | |
| Net assets, end of period (000 omitted) | $49,713 | $26,670 | $11,414 | $650 |
| Portfolio turnover rateJ | 26% | 24% | 32% | 23% |
A For the period October 2, 2018 (commencement of sale of shares) through March 31, 2019.
B Calculated based on average shares outstanding during the period.
C Net investment income (loss) is affected by the timing of the declaration of dividends by any underlying mutual funds or exchange-traded funds (ETFs). Net investment income (loss) of any such underlying funds is not included in the Fund's net investment income (loss) ratio.
D Total returns for periods of less than one year are not annualized.
E Total returns would have been lower if certain expenses had not been reduced during the applicable periods shown.
F Fees and expenses of any underlying mutual funds or exchange-traded funds (ETFs) are not included in the Fund's expense ratio. The Fund indirectly bears its proportionate share of these expenses. For additional expense information related to investments in Fidelity Central Funds, please refer to the "Investments in Fidelity Central Funds" note found in the Notes to Financial Statements section of the most recent Annual or Semi-Annual report.
G Expense ratios reflect operating expenses of the class. Expenses before reductions do not reflect amounts reimbursed, waived, or reduced through arrangements with the investment adviser, brokerage services, or other offset arrangements, if applicable, and do not represent the amount paid by the class during periods when reimbursements, waivers or reductions occur.
H On certain classes, the size and fluctuation of net assets and expense amounts may cause ratios to differ from contractual rates.
I Annualized
J Amount does not include the portfolio activity of any underlying mutual funds or exchange-traded funds (ETFs).
See accompanying notes which are an integral part of the financial statements.
Fidelity Advisor Freedom 2050 Fund Class Z6
| Years ended March 31, | 2022 | 2021 | 2020 | 2019 | 2018 A |
| Selected Per–Share Data | | | | | |
| Net asset value, beginning of period | $13.87 | $9.48 | $11.37 | $12.24 | $11.59 |
| Income from Investment Operations | | | | | |
| Net investment income (loss)B,C | .33 | .14 | .19 | .22 | .23 |
| Net realized and unrealized gain (loss) | .18 | 4.98 | (1.22) | .12 | .83 |
| Total from investment operations | .51 | 5.12 | (1.03) | .34 | 1.06 |
| Distributions from net investment income | (.33) | (.15) | (.18) | (.24) | (.17) |
| Distributions from net realized gain | (1.02) | (.58) | (.68) | (.97) | (.24) |
| Total distributions | (1.35) | (.73) | (.86) | (1.21) | (.41) |
| Net asset value, end of period | $13.03 | $13.87 | $9.48 | $11.37 | $12.24 |
| Total ReturnD,E | 3.30% | 56.00% | (10.14)% | 3.55% | 9.15% |
| Ratios to Average Net AssetsC,F,G | | | | | |
| Expenses before reductions | .49% | .49% | .49% | .50%H | .51%H,I |
| Expenses net of fee waivers, if any | .49% | .49% | .49% | .50%H | .51%H,I |
| Expenses net of all reductions | .49% | .49% | .49% | .50%H | .51%H,I |
| Net investment income (loss) | 2.33% | 1.13% | 1.70% | 1.88% | 2.27%I |
| Supplemental Data | | | | | |
| Net assets, end of period (000 omitted) | $146,454 | $99,092 | $33,835 | $21,893 | $5,410 |
| Portfolio turnover rateJ | 26% | 24% | 32% | 23% | 20% |
A For the period June 6, 2017 (commencement of sale of shares) through March 31, 2018.
B Calculated based on average shares outstanding during the period.
C Net investment income (loss) is affected by the timing of the declaration of dividends by any underlying mutual funds or exchange-traded funds (ETFs). Net investment income (loss) of any such underlying funds is not included in the Fund's net investment income (loss) ratio.
D Total returns for periods of less than one year are not annualized.
E Total returns would have been lower if certain expenses had not been reduced during the applicable periods shown.
F Fees and expenses of any underlying mutual funds or exchange-traded funds (ETFs) are not included in the Fund's expense ratio. The Fund indirectly bears its proportionate share of these expenses. For additional expense information related to investments in Fidelity Central Funds, please refer to the "Investments in Fidelity Central Funds" note found in the Notes to Financial Statements section of the most recent Annual or Semi-Annual report.
G Expense ratios reflect operating expenses of the class. Expenses before reductions do not reflect amounts reimbursed, waived, or reduced through arrangements with the investment adviser, brokerage services, or other offset arrangements, if applicable, and do not represent the amount paid by the class during periods when reimbursements, waivers or reductions occur.
H On certain classes, the size and fluctuation of net assets and expense amounts may cause ratios to differ from contractual rates.
I Annualized
J Amount does not include the portfolio activity of any underlying mutual funds or exchange-traded funds (ETFs).
See accompanying notes which are an integral part of the financial statements.
Fidelity Advisor Freedom® 2055 Fund
Investment Summary (Unaudited)
The information in the following tables is based on the direct investments of the Fund.
Top Holdings as of March 31, 2022
| | % of fund's net assets |
| Fidelity Series Emerging Markets Opportunities Fund | 12.7 |
| Fidelity Series Large Cap Stock Fund | 9.8 |
| Fidelity Series International Value Fund | 7.5 |
| Fidelity Series Overseas Fund | 7.5 |
| Fidelity Series International Growth Fund | 7.4 |
| Fidelity Series Value Discovery Fund | 6.4 |
| Fidelity Series Stock Selector Large Cap Value Fund | 6.3 |
| Fidelity Advisor Series Equity Growth Fund | 6.2 |
| Fidelity Series Opportunistic Insights Fund | 5.8 |
| Fidelity Series Long-Term Treasury Bond Index Fund | 5.3 |
| | 74.9 |
Asset Allocation (% of fund's net assets)
| Period end |
| | Domestic Equity Funds | 50.4% |
| | International Equity Funds | 41.8% |
| | Bond Funds | 7.7% |
| | Short-Term Funds | 0.1% |

Domestic Equity Funds category includes Fidelity Series Commodity Strategy Fund which invests in commodity-related investments.
Fidelity Advisor Freedom® 2055 Fund
Schedule of Investments March 31, 2022
Showing Percentage of Net Assets
| U.S. Treasury Obligations - 0.0% | | | |
| | | Principal Amount | Value |
| U.S. Treasury Bills, yield at date of purchase 0.12% to 0.33% 4/14/22 to 5/19/22 (a) | | | |
| (Cost $409,952) | | 410,000 | 409,963 |
| | | Shares | Value |
|
| Domestic Equity Funds - 50.4% | | | |
| Fidelity Advisor Series Equity Growth Fund (b) | | 3,986,077 | $61,505,171 |
| Fidelity Advisor Series Growth Opportunities Fund (b) | | 3,449,393 | 42,186,078 |
| Fidelity Advisor Series Small Cap Fund (b) | | 2,149,092 | 27,916,699 |
| Fidelity Series All-Sector Equity Fund (b) | | 2,447,339 | 26,382,318 |
| Fidelity Series Commodity Strategy Fund (b) | | 2,866,198 | 14,646,270 |
| Fidelity Series Large Cap Stock Fund (b) | | 5,091,567 | 96,790,688 |
| Fidelity Series Large Cap Value Index Fund (b) | | 681,562 | 10,468,796 |
| Fidelity Series Opportunistic Insights Fund (b) | | 3,109,759 | 56,846,393 |
| Fidelity Series Small Cap Opportunities Fund (b) | | 2,530,696 | 34,468,083 |
| Fidelity Series Stock Selector Large Cap Value Fund (b) | | 4,559,008 | 61,774,562 |
| Fidelity Series Value Discovery Fund (b) | | 3,932,785 | 62,924,568 |
| TOTAL DOMESTIC EQUITY FUNDS | | | |
| (Cost $425,901,473) | | | 495,909,626 |
|
| International Equity Funds - 41.8% | | | |
| Fidelity Series Canada Fund (b) | | 2,063,075 | 32,018,929 |
| Fidelity Series Emerging Markets Fund (b) | | 1,454,811 | 13,500,650 |
| Fidelity Series Emerging Markets Opportunities Fund (b) | | 6,786,127 | 124,864,746 |
| Fidelity Series International Growth Fund (b) | | 4,414,592 | 73,193,940 |
| Fidelity Series International Small Cap Fund (b) | | 1,116,908 | 20,048,506 |
| Fidelity Series International Value Fund (b) | | 6,701,400 | 73,916,440 |
| Fidelity Series Overseas Fund (b) | | 5,831,470 | 73,593,153 |
| TOTAL INTERNATIONAL EQUITY FUNDS | | | |
| (Cost $370,521,861) | | | 411,136,364 |
|
| Bond Funds - 7.7% | | | |
| Fidelity Series 5+ Year Inflation-Protected Bond Index Fund (b) | | 102,524 | 984,233 |
| Fidelity Series Emerging Markets Debt Fund (b) | | 582,643 | 4,806,803 |
| Fidelity Series Emerging Markets Debt Local Currency Fund (b) | | 180,787 | 1,628,892 |
| Fidelity Series Floating Rate High Income Fund (b) | | 107,096 | 984,212 |
| Fidelity Series High Income Fund (b) | | 655,330 | 5,956,946 |
| Fidelity Series International Credit Fund (b) | | 28,651 | 265,307 |
| Fidelity Series Investment Grade Bond Fund (b) | | 476,425 | 5,197,797 |
| Fidelity Series Long-Term Treasury Bond Index Fund (b) | | 6,899,308 | 52,572,727 |
| Fidelity Series Real Estate Income Fund (b) | | 309,311 | 3,513,777 |
| TOTAL BOND FUNDS | | | |
| (Cost $81,285,399) | | | 75,910,694 |
|
| Short-Term Funds - 0.1% | | | |
| Fidelity Cash Central Fund 0.31% (c) | | | |
| (Cost $681,178) | | 681,042 | 681,178 |
| TOTAL INVESTMENT IN SECURITIES - 100.0% | | | |
| (Cost $878,799,863) | | | 984,047,825 |
| NET OTHER ASSETS (LIABILITIES) - 0.0% | | | (187,695) |
| NET ASSETS - 100% | | | $983,860,130 |
| Futures Contracts | | | | | |
| | Number of contracts | Expiration Date | Notional Amount | Value | Unrealized Appreciation/(Depreciation) |
| Purchased | | | | | |
| Equity Index Contracts | | | | | |
| ICE E-mini MSCI EAFE Index Contracts (United States) | 23 | June 2022 | $2,466,060 | $108,380 | $108,380 |
| ICE E-mini MSCI Emerging Markets Index Contracts (United States) | 74 | June 2022 | 4,164,350 | 92,877 | 92,877 |
|
| TOTAL PURCHASED | | | | | 201,257 |
|
| Sold | | | | | |
| Equity Index Contracts | | | | | |
| CME Micro E-mini S&P 500 Index Contracts (United States) | 22 | June 2022 | 4,983,825 | (146,132) | (146,132) |
| TOTAL FUTURES CONTRACTS | | | | | $55,125 |
The notional amount of futures purchased as a percentage of Net Assets is 0.7%
The notional amount of futures sold as a percentage of Net Assets is 0.5%
Legend
(a) Security or a portion of the security was pledged to cover margin requirements for futures contracts. At period end, the value of securities pledged amounted to $396,963.
(b) Affiliated Fund
(c) Affiliated fund that is generally available only to investment companies and other accounts managed by Fidelity Investments. The rate quoted is the annualized seven-day yield of the fund at period end. A complete unaudited listing of the fund's holdings as of its most recent quarter end is available upon request. In addition, each Fidelity Central Fund's financial statements, which are not covered by the Fund's Report of Independent Registered Public Accounting Firm, are available on the SEC's website or upon request.
Affiliated Central Funds
Fiscal year to date information regarding the Fund's investments in Fidelity Central Funds, including the ownership percentage, is presented below.
| Fund | Value, beginning of period | Purchases(a) | Sales Proceeds(a) | Dividend Income | Realized Gain/Loss | Change in Unrealized appreciation (depreciation) | Value, end of period | % ownership, end of period |
| Fidelity Cash Central Fund 0.31% | $373,576 | $2,855,094 | $2,547,492 | $301 | $-- | $-- | $681,178 | 0.0% |
| Total | $373,576 | $2,855,094 | $2,547,492 | $301 | $-- | $-- | $681,178 | |
(a) Includes the value of shares purchased or redeemed through in-kind transactions, if applicable.
Amounts in the income column in the above table include any capital gain distributions from underlying funds, which are presented in the corresponding line-item in the Statement of Operations, if applicable.
Affiliated Underlying Funds
Fiscal year to date information regarding the Fund's investments in affiliated Underlying Funds is presented below. Exchanges between classes of the same affiliated Underlying Funds may occur. If an underlying Fund changes its name, the name presented below is the name in effect at period end.
| Fund | Value, beginning of period | Purchases(a) | Sales Proceeds(a) | Dividend Income | Realized Gain (loss) | Change in Unrealized appreciation (depreciation) | Value, end of period |
| Fidelity Advisor Series Equity Growth Fund | $59,337,947 | $26,154,988 | $20,382,809 | $11,142,817 | $752,943 | $(4,357,898) | $61,505,171 |
| Fidelity Advisor Series Growth Opportunities Fund | 41,263,651 | 25,918,602 | 12,971,762 | 10,248,733 | (394,626) | (11,629,787) | 42,186,078 |
| Fidelity Advisor Series Small Cap Fund | 26,847,743 | 11,414,787 | 6,308,710 | 5,210,925 | 305,032 | (4,342,153) | 27,916,699 |
| Fidelity Series 0-5 Year Inflation-Protected Bond Index Fund | -- | 4,616,330 | 4,598,071 | 14,433 | (16,109) | -- | -- |
| Fidelity Series 5+ Year Inflation-Protected Bond Index Fund | -- | 9,257,339 | 7,930,773 | 45,620 | (312,601) | (29,732) | 984,233 |
| Fidelity Series All-Sector Equity Fund | 25,371,555 | 9,251,424 | 6,230,241 | 5,276,029 | (15,285) | (1,995,135) | 26,382,318 |
| Fidelity Series Canada Fund | 22,796,894 | 8,972,604 | 5,033,297 | 648,023 | 66,901 | 5,215,827 | 32,018,929 |
| Fidelity Series Commodity Strategy Fund | 26,031,766 | 12,025,858 | 24,366,608 | 8,592,212 | (1,123,658) | 2,078,912 | 14,646,270 |
| Fidelity Series Emerging Markets Debt Fund | 5,087,406 | 1,303,754 | 1,089,941 | 246,190 | (55,317) | (439,099) | 4,806,803 |
| Fidelity Series Emerging Markets Debt Local Currency Fund | 1,655,249 | 470,481 | 308,336 | 70,543 | (22,662) | (165,840) | 1,628,892 |
| Fidelity Series Emerging Markets Fund | 14,921,246 | 4,500,320 | 2,661,739 | 488,232 | (41,966) | (3,217,211) | 13,500,650 |
| Fidelity Series Emerging Markets Opportunities Fund | 134,679,611 | 56,095,886 | 23,513,567 | 15,413,737 | (874,902) | (41,522,282) | 124,864,746 |
| Fidelity Series Floating Rate High Income Fund | 979,966 | 209,881 | 205,892 | 44,037 | (1,268) | 1,525 | 984,212 |
| Fidelity Series Government Money Market Fund 0.31% | 6,217,291 | 516,143 | 6,733,434 | 1,403 | -- | -- | -- |
| Fidelity Series High Income Fund | 5,845,628 | 1,685,733 | 1,384,112 | 334,530 | (18,503) | (171,800) | 5,956,946 |
| Fidelity Series Inflation-Protected Bond Index Fund | 18,697,228 | 2,582,344 | 22,040,694 | 199,612 | 1,693,125 | (932,003) | -- |
| Fidelity Series International Credit Fund | 276,910 | 8,937 | -- | 8,936 | -- | (20,540) | 265,307 |
| Fidelity Series International Growth Fund | 63,880,580 | 24,216,100 | 8,295,493 | 6,092,260 | (201,507) | (6,405,740) | 73,193,940 |
| Fidelity Series International Small Cap Fund | 20,058,027 | 5,918,016 | 2,859,899 | 2,768,250 | (55,532) | (3,012,106) | 20,048,506 |
| Fidelity Series International Value Fund | 63,863,976 | 25,559,108 | 16,667,174 | 3,825,131 | 77,622 | 1,082,908 | 73,916,440 |
| Fidelity Series Investment Grade Bond Fund | 419,443 | 8,369,746 | 3,517,616 | 20,983 | (68,743) | (5,033) | 5,197,797 |
| Fidelity Series Large Cap Stock Fund | 92,672,429 | 23,586,429 | 22,355,588 | 9,098,499 | 285,140 | 2,602,278 | 96,790,688 |
| Fidelity Series Large Cap Value Index Fund | 10,002,007 | 2,586,422 | 2,595,465 | 718,989 | 20,005 | 455,827 | 10,468,796 |
| Fidelity Series Long-Term Treasury Bond Index Fund | 25,654,695 | 36,549,659 | 7,309,458 | 813,431 | (964,388) | (1,357,781) | 52,572,727 |
| Fidelity Series Opportunistic Insights Fund | 55,016,037 | 25,247,698 | 18,203,903 | 10,892,030 | 947,875 | (6,161,314) | 56,846,393 |
| Fidelity Series Overseas Fund | 63,986,193 | 19,650,305 | 9,465,178 | 2,253,648 | (43,675) | (534,492) | 73,593,153 |
| Fidelity Series Real Estate Income Fund | 3,583,583 | 605,607 | 779,386 | 149,382 | 4,172 | 99,801 | 3,513,777 |
| Fidelity Series Short-Term Credit Fund | 1,309,621 | 53,366 | 1,363,089 | 6,381 | 32,302 | (32,200) | -- |
| Fidelity Series Small Cap Opportunities Fund | 33,137,849 | 16,864,402 | 7,364,315 | 9,023,380 | (228,483) | (7,941,370) | 34,468,083 |
| Fidelity Series Stock Selector Large Cap Value Fund | 58,691,736 | 21,691,555 | 15,602,073 | 11,233,882 | (94,857) | (2,911,799) | 61,774,562 |
| Fidelity Series Value Discovery Fund | 60,081,315 | 18,586,148 | 16,153,658 | 7,469,292 | 153,409 | 257,354 | 62,924,568 |
| | $942,367,582 | $404,469,972 | $278,292,281 | $122,351,550 | $(195,556) | $(85,390,883) | $982,956,684 |
(a) Includes the value of shares purchased or redeemed through in-kind transactions, if applicable.
Amounts in the income column in the above table include any capital gain distributions from underlying funds, which are presented in the corresponding line-item in the Statement of Operations, if applicable.
Investment Valuation
The following is a summary of the inputs used, as of March 31, 2022, involving the Fund's assets and liabilities carried at fair value. The inputs or methodology used for valuing securities may not be an indication of the risk associated with investing in those securities. For more information on valuation inputs, and their aggregation into the levels used below, please refer to the Investment Valuation section in the accompanying Notes to Financial Statements.
| | Valuation Inputs at Reporting Date: |
| Description | Total | Level 1 | Level 2 | Level 3 |
| Investments in Securities: | | | | |
| Other Short-Term Investments and Net Other Assets | $409,963 | $-- | $409,963 | $-- |
| Domestic Equity Funds | 495,909,626 | 495,909,626 | -- | -- |
| International Equity Funds | 411,136,364 | 411,136,364 | -- | -- |
| Bond Funds | 75,910,694 | 75,910,694 | -- | -- |
| Short-Term Funds | 681,178 | 681,178 | -- | -- |
| Total Investments in Securities: | $984,047,825 | $983,637,862 | $409,963 | $-- |
| Derivative Instruments: | | | | |
| Assets | | | | |
| Futures Contracts | $201,257 | $201,257 | $-- | $-- |
| Total Assets | $201,257 | $201,257 | $-- | $-- |
| Liabilities | | | | |
| Futures Contracts | $(146,132) | $(146,132) | $-- | $-- |
| Total Liabilities | $(146,132) | $(146,132) | $-- | $-- |
| Total Derivative Instruments: | $55,125 | $55,125 | $-- | $-- |
Value of Derivative Instruments
The following table is a summary of the Fund's value of derivative instruments by primary risk exposure as of March 31, 2022. For additional information on derivative instruments, please refer to the Derivative Instruments section in the accompanying Notes to Financial Statements.
| Primary Risk Exposure / Derivative Type | Value |
| | Asset | Liability |
| Equity Risk | | |
| Futures Contracts(a) | $201,257 | $(146,132) |
| Total Equity Risk | 201,257 | (146,132) |
| Total Value of Derivatives | $201,257 | $(146,132) |
(a) Reflects gross cumulative appreciation (depreciation) on futures contracts as presented in the Schedule of Investments. In the Statement of Assets and Liabilities, the period end daily variation margin is included in receivable or payable for daily variation margin on futures contracts, and the net cumulative appreciation (depreciation) is included in Total accumulated earnings (loss).
See accompanying notes which are an integral part of the financial statements.
Fidelity Advisor Freedom® 2055 Fund
Financial Statements
Statement of Assets and Liabilities
| | | March 31, 2022 |
| Assets | | |
Investment in securities, at value — See accompanying schedule:
Unaffiliated issuers (cost $409,952) | $409,963 | |
| Fidelity Central Funds (cost $681,178) | 681,178 | |
| Other affiliated issuers (cost $877,708,733) | 982,956,684 | |
| Total Investment in Securities (cost $878,799,863) | | $984,047,825 |
| Receivable for investments sold | | 14,683,950 |
| Receivable for fund shares sold | | 1,700,784 |
| Distributions receivable from Fidelity Central Funds | | 103 |
| Total assets | | 1,000,432,662 |
| Liabilities | | |
| Payable for investments purchased | $14,932,218 | |
| Payable for fund shares redeemed | 905,693 | |
| Accrued management fee | 571,058 | |
| Distribution and service plan fees payable | 118,890 | |
| Payable for daily variation margin on futures contracts | 44,673 | |
| Total liabilities | | 16,572,532 |
| Net Assets | | $983,860,130 |
| Net Assets consist of: | | |
| Paid in capital | | $821,080,269 |
| Total accumulated earnings (loss) | | 162,779,861 |
| Net Assets | | $983,860,130 |
| Net Asset Value and Maximum Offering Price | | |
| Class A: | | |
| Net Asset Value and redemption price per share ($286,777,554 ÷ 19,752,216 shares)(a) | | $14.52 |
| Maximum offering price per share (100/94.25 of $14.52) | | $15.41 |
| Class M: | | |
| Net Asset Value and redemption price per share ($117,059,472 ÷ 8,142,591 shares)(a) | | $14.38 |
| Maximum offering price per share (100/96.50 of $14.38) | | $14.90 |
| Class C: | | |
| Net Asset Value and offering price per share ($15,942,089 ÷ 1,122,836 shares)(a) | | $14.20 |
| Class I: | | |
| Net Asset Value, offering price and redemption price per share ($428,209,401 ÷ 29,299,997 shares) | | $14.61 |
| Class Z: | | |
| Net Asset Value, offering price and redemption price per share ($31,711,821 ÷ 2,190,820 shares) | | $14.47 |
| Class Z6: | | |
| Net Asset Value, offering price and redemption price per share ($104,159,793 ÷ 7,136,567 shares) | | $14.60 |
(a) Redemption price per share is equal to net asset value less any applicable contingent deferred sales charge.
See accompanying notes which are an integral part of the financial statements.
Statement of Operations
| | | Year ended March 31, 2022 |
| Investment Income | | |
| Dividends: | | |
| Affiliated issuers | | $28,667,529 |
| Interest | | 208 |
| Income from Fidelity Central Funds | | 301 |
| Total income | | 28,668,038 |
| Expenses | | |
| Management fee | $7,338,003 | |
| Distribution and service plan fees | 1,533,776 | |
| Independent trustees' fees and expenses | 3,030 | |
| Total expenses before reductions | 8,874,809 | |
| Expense reductions | (6) | |
| Total expenses after reductions | | 8,874,803 |
| Net investment income (loss) | | 19,793,235 |
| Realized and Unrealized Gain (Loss) | | |
| Net realized gain (loss) on: | | |
| Investment securities: | | |
| Unaffiliated issuers | 358 | |
| Affiliated issuers | (195,556) | |
| Futures contracts | (70,515) | |
| Capital gain distributions from underlying funds: | | |
| Affiliated issuers | 93,684,021 | |
| Total net realized gain (loss) | | 93,418,308 |
| Change in net unrealized appreciation (depreciation) on: | | |
| Investment securities: | | |
| Unaffiliated issuers | 10 | |
| Affiliated issuers | (85,390,883) | |
| Futures contracts | 55,125 | |
| Total change in net unrealized appreciation (depreciation) | | (85,335,748) |
| Net gain (loss) | | 8,082,560 |
| Net increase (decrease) in net assets resulting from operations | | $27,875,795 |
See accompanying notes which are an integral part of the financial statements.
Statement of Changes in Net Assets
| | Year ended March 31, 2022 | Year ended March 31, 2021 |
| Increase (Decrease) in Net Assets | | |
| Operations | | |
| Net investment income (loss) | $19,793,235 | $5,785,872 |
| Net realized gain (loss) | 93,418,308 | 50,341,727 |
| Change in net unrealized appreciation (depreciation) | (85,335,748) | 274,937,564 |
| Net increase (decrease) in net assets resulting from operations | 27,875,795 | 331,065,163 |
| Distributions to shareholders | (90,652,588) | (41,079,048) |
| Share transactions - net increase (decrease) | 104,182,922 | 68,800,212 |
| Total increase (decrease) in net assets | 41,406,129 | 358,786,327 |
| Net Assets | | |
| Beginning of period | 942,454,001 | 583,667,674 |
| End of period | $983,860,130 | $942,454,001 |
See accompanying notes which are an integral part of the financial statements.
Financial Highlights
Fidelity Advisor Freedom 2055 Fund Class A
| Years ended March 31, | 2022 | 2021 | 2020 | 2019 | 2018 |
| Selected Per–Share Data | | | | | |
| Net asset value, beginning of period | $15.45 | $10.53 | $12.58 | $13.37 | $12.19 |
| Income from Investment Operations | | | | | |
| Net investment income (loss)A,B | .29 | .08 | .15 | .18 | .11 |
| Net realized and unrealized gain (loss) | .19 | 5.55 | (1.36) | .15 | 1.51 |
| Total from investment operations | .48 | 5.63 | (1.21) | .33 | 1.62 |
| Distributions from net investment income | (.30) | (.11) | (.15) | (.19) | (.13) |
| Distributions from net realized gain | (1.12) | (.59) | (.69) | (.93) | (.32) |
| Total distributions | (1.41)C | (.71)C | (.84) | (1.12) | (.44)C |
| Net asset value, end of period | $14.52 | $15.45 | $10.53 | $12.58 | $13.37 |
| Total ReturnD,E | 2.75% | 55.31% | (10.57)% | 3.08% | 13.40% |
| Ratios to Average Net AssetsB,F,G | | | | | |
| Expenses before reductions | 1.00% | 1.00% | 1.00% | .99%H | .88% |
| Expenses net of fee waivers, if any | 1.00% | 1.00% | 1.00% | .99%H | .88% |
| Expenses net of all reductions | 1.00% | 1.00% | 1.00% | .99%H | .88% |
| Net investment income (loss) | 1.83% | .63% | 1.23% | 1.41% | .81% |
| Supplemental Data | | | | | |
| Net assets, end of period (000 omitted) | $286,778 | $299,927 | $196,016 | $212,428 | $209,824 |
| Portfolio turnover rateI | 28% | 23% | 35% | 27% | 18% |
A Calculated based on average shares outstanding during the period.
B Net investment income (loss) is affected by the timing of the declaration of dividends by any underlying mutual funds or exchange-traded funds (ETFs). Net investment income (loss) of any such underlying funds is not included in the Fund's net investment income (loss) ratio.
C Total distributions per share do not sum due to rounding.
D Total returns would have been lower if certain expenses had not been reduced during the applicable periods shown.
E Total returns do not include the effect of the sales charges.
F Fees and expenses of any underlying mutual funds or exchange-traded funds (ETFs) are not included in the Fund's expense ratio. The Fund indirectly bears its proportionate share of these expenses. For additional expense information related to investments in Fidelity Central Funds, please refer to the "Investments in Fidelity Central Funds" note found in the Notes to Financial Statements section of the most recent Annual or Semi-Annual report.
G Expense ratios reflect operating expenses of the class. Expenses before reductions do not reflect amounts reimbursed, waived, or reduced through arrangements with the investment adviser, brokerage services, or other offset arrangements, if applicable, and do not represent the amount paid by the class during periods when reimbursements, waivers or reductions occur.
H On certain classes, the size and fluctuation of net assets and expense amounts may cause ratios to differ from contractual rates.
I Amount does not include the portfolio activity of any underlying mutual funds or exchange-traded funds (ETFs).
See accompanying notes which are an integral part of the financial statements.
Fidelity Advisor Freedom 2055 Fund Class M
| Years ended March 31, | 2022 | 2021 | 2020 | 2019 | 2018 |
| Selected Per–Share Data | | | | | |
| Net asset value, beginning of period | $15.32 | $10.46 | $12.51 | $13.31 | $12.14 |
| Income from Investment Operations | | | | | |
| Net investment income (loss)A,B | .24 | .05 | .12 | .15 | .07 |
| Net realized and unrealized gain (loss) | .20 | 5.50 | (1.36) | .15 | 1.52 |
| Total from investment operations | .44 | 5.55 | (1.24) | .30 | 1.59 |
| Distributions from net investment income | (.27) | (.09) | (.13) | (.18) | (.11) |
| Distributions from net realized gain | (1.12) | (.59) | (.68) | (.93) | (.31) |
| Total distributions | (1.38)C | (.69)C | (.81) | (1.10)C | (.42) |
| Net asset value, end of period | $14.38 | $15.32 | $10.46 | $12.51 | $13.31 |
| Total ReturnD,E | 2.52% | 54.88% | (10.83)% | 2.86% | 13.15% |
| Ratios to Average Net AssetsB,F,G | | | | | |
| Expenses before reductions | 1.25% | 1.25% | 1.25% | 1.25% | 1.14% |
| Expenses net of fee waivers, if any | 1.25% | 1.25% | 1.25% | 1.25% | 1.14% |
| Expenses net of all reductions | 1.25% | 1.25% | 1.25% | 1.25% | 1.14% |
| Net investment income (loss) | 1.58% | .38% | .98% | 1.16% | .56% |
| Supplemental Data | | | | | |
| Net assets, end of period (000 omitted) | $117,059 | $115,869 | $74,904 | $83,858 | $73,101 |
| Portfolio turnover rateH | 28% | 23% | 35% | 27% | 18% |
A Calculated based on average shares outstanding during the period.
B Net investment income (loss) is affected by the timing of the declaration of dividends by any underlying mutual funds or exchange-traded funds (ETFs). Net investment income (loss) of any such underlying funds is not included in the Fund's net investment income (loss) ratio.
C Total distributions per share do not sum due to rounding.
D Total returns would have been lower if certain expenses had not been reduced during the applicable periods shown.
E Total returns do not include the effect of the sales charges.
F Fees and expenses of any underlying mutual funds or exchange-traded funds (ETFs) are not included in the Fund's expense ratio. The Fund indirectly bears its proportionate share of these expenses. For additional expense information related to investments in Fidelity Central Funds, please refer to the "Investments in Fidelity Central Funds" note found in the Notes to Financial Statements section of the most recent Annual or Semi-Annual report.
G Expense ratios reflect operating expenses of the class. Expenses before reductions do not reflect amounts reimbursed, waived, or reduced through arrangements with the investment adviser, brokerage services, or other offset arrangements, if applicable, and do not represent the amount paid by the class during periods when reimbursements, waivers or reductions occur.
H Amount does not include the portfolio activity of any underlying mutual funds or exchange-traded funds (ETFs).
See accompanying notes which are an integral part of the financial statements.
Fidelity Advisor Freedom 2055 Fund Class C
| Years ended March 31, | 2022 | 2021 | 2020 | 2019 | 2018 |
| Selected Per–Share Data | | | | | |
| Net asset value, beginning of period | $15.16 | $10.38 | $12.44 | $13.26 | $12.11 |
| Income from Investment Operations | | | | | |
| Net investment income (loss)A,B | .17 | (.02) | .06 | .08 | .01 |
| Net realized and unrealized gain (loss) | .19 | 5.44 | (1.36) | .16 | 1.51 |
| Total from investment operations | .36 | 5.42 | (1.30) | .24 | 1.52 |
| Distributions from net investment income | (.21) | (.05) | (.09) | (.13) | (.06) |
| Distributions from net realized gain | (1.12) | (.59) | (.68) | (.93) | (.31) |
| Total distributions | (1.32)C | (.64) | (.76)C | (1.06) | (.37) |
| Net asset value, end of period | $14.20 | $15.16 | $10.38 | $12.44 | $13.26 |
| Total ReturnD,E | 2.03% | 54.07% | (11.29)% | 2.32% | 12.62% |
| Ratios to Average Net AssetsB,F,G | | | | | |
| Expenses before reductions | 1.75% | 1.75% | 1.75% | 1.74%H | 1.64% |
| Expenses net of fee waivers, if any | 1.75% | 1.75% | 1.75% | 1.74%H | 1.64% |
| Expenses net of all reductions | 1.75% | 1.75% | 1.75% | 1.74%H | 1.64% |
| Net investment income (loss) | 1.08% | (.12)% | .48% | .66% | .05% |
| Supplemental Data | | | | | |
| Net assets, end of period (000 omitted) | $15,942 | $16,677 | $9,928 | $10,991 | $10,685 |
| Portfolio turnover rateI | 28% | 23% | 35% | 27% | 18% |
A Calculated based on average shares outstanding during the period.
B Net investment income (loss) is affected by the timing of the declaration of dividends by any underlying mutual funds or exchange-traded funds (ETFs). Net investment income (loss) of any such underlying funds is not included in the Fund's net investment income (loss) ratio.
C Total distributions per share do not sum due to rounding.
D Total returns would have been lower if certain expenses had not been reduced during the applicable periods shown.
E Total returns do not include the effect of the contingent deferred sales charge.
F Fees and expenses of any underlying mutual funds or exchange-traded funds (ETFs) are not included in the Fund's expense ratio. The Fund indirectly bears its proportionate share of these expenses. For additional expense information related to investments in Fidelity Central Funds, please refer to the "Investments in Fidelity Central Funds" note found in the Notes to Financial Statements section of the most recent Annual or Semi-Annual report.
G Expense ratios reflect operating expenses of the class. Expenses before reductions do not reflect amounts reimbursed, waived, or reduced through arrangements with the investment adviser, brokerage services, or other offset arrangements, if applicable, and do not represent the amount paid by the class during periods when reimbursements, waivers or reductions occur.
H On certain classes, the size and fluctuation of net assets and expense amounts may cause ratios to differ from contractual rates.
I Amount does not include the portfolio activity of any underlying mutual funds or exchange-traded funds (ETFs).
See accompanying notes which are an integral part of the financial statements.
Fidelity Advisor Freedom 2055 Fund Class I
| Years ended March 31, | 2022 | 2021 | 2020 | 2019 | 2018 |
| Selected Per–Share Data | | | | | |
| Net asset value, beginning of period | $15.53 | $10.57 | $12.64 | $13.43 | $12.24 |
| Income from Investment Operations | | | | | |
| Net investment income (loss)A,B | .33 | .12 | .19 | .21 | .14 |
| Net realized and unrealized gain (loss) | .19 | 5.57 | (1.39) | .15 | 1.53 |
| Total from investment operations | .52 | 5.69 | (1.20) | .36 | 1.67 |
| Distributions from net investment income | (.33) | (.14) | (.18) | (.22) | (.16) |
| Distributions from net realized gain | (1.12) | (.59) | (.70) | (.93) | (.32) |
| Total distributions | (1.44)C | (.73) | (.87)C | (1.15) | (.48) |
| Net asset value, end of period | $14.61 | $15.53 | $10.57 | $12.64 | $13.43 |
| Total ReturnD | 3.00% | 55.72% | (10.45)% | 3.34% | 13.74% |
| Ratios to Average Net AssetsB,E,F | | | | | |
| Expenses before reductions | .75% | .75% | .75% | .75% | .64% |
| Expenses net of fee waivers, if any | .75% | .75% | .75% | .75% | .64% |
| Expenses net of all reductions | .75% | .75% | .75% | .75% | .64% |
| Net investment income (loss) | 2.08% | .88% | 1.48% | 1.66% | 1.05% |
| Supplemental Data | | | | | |
| Net assets, end of period (000 omitted) | $428,209 | $432,057 | $273,147 | $308,366 | $249,432 |
| Portfolio turnover rateG | 28% | 23% | 35% | 27% | 18% |
A Calculated based on average shares outstanding during the period.
B Net investment income (loss) is affected by the timing of the declaration of dividends by any underlying mutual funds or exchange-traded funds (ETFs). Net investment income (loss) of any such underlying funds is not included in the Fund's net investment income (loss) ratio.
C Total distributions per share do not sum due to rounding.
D Total returns would have been lower if certain expenses had not been reduced during the applicable periods shown.
E Fees and expenses of any underlying mutual funds or exchange-traded funds (ETFs) are not included in the Fund's expense ratio. The Fund indirectly bears its proportionate share of these expenses. For additional expense information related to investments in Fidelity Central Funds, please refer to the "Investments in Fidelity Central Funds" note found in the Notes to Financial Statements section of the most recent Annual or Semi-Annual report.
F Expense ratios reflect operating expenses of the class. Expenses before reductions do not reflect amounts reimbursed, waived, or reduced through arrangements with the investment adviser, brokerage services, or other offset arrangements, if applicable, and do not represent the amount paid by the class during periods when reimbursements, waivers or reductions occur.
G Amount does not include the portfolio activity of any underlying mutual funds or exchange-traded funds (ETFs).
See accompanying notes which are an integral part of the financial statements.
Fidelity Advisor Freedom 2055 Fund Class Z
| Years ended March 31, | 2022 | 2021 | 2020 | 2019 A |
| Selected Per–Share Data | | | | |
| Net asset value, beginning of period | $15.40 | $10.50 | $12.58 | $13.57 |
| Income from Investment Operations | | | | |
| Net investment income (loss)B,C | .34 | .13 | .20 | .38 |
| Net realized and unrealized gain (loss) | .20 | 5.53 | (1.36) | (.65) |
| Total from investment operations | .54 | 5.66 | (1.16) | (.27) |
| Distributions from net investment income | (.35) | (.17) | (.20) | (.28) |
| Distributions from net realized gain | (1.12) | (.59) | (.71) | (.43) |
| Total distributions | (1.47) | (.76) | (.92)D | (.72)D |
| Net asset value, end of period | $14.47 | $15.40 | $10.50 | $12.58 |
| Total ReturnE,F | 3.10% | 55.82% | (10.28)% | (1.35)% |
| Ratios to Average Net AssetsC,G,H | | | | |
| Expenses before reductions | .64% | .64% | .65%I | .65%I,J |
| Expenses net of fee waivers, if any | .64% | .64% | .65%I | .65%I,J |
| Expenses net of all reductions | .64% | .64% | .65%I | .65%I,J |
| Net investment income (loss) | 2.19% | .99% | 1.58% | 6.29%J |
| Supplemental Data | | | | |
| Net assets, end of period (000 omitted) | $31,712 | $16,623 | $5,767 | $428 |
| Portfolio turnover rateK | 28% | 23% | 35% | 27% |
A For the period October 2, 2018 (commencement of sale of shares) through March 31, 2019.
B Calculated based on average shares outstanding during the period.
C Net investment income (loss) is affected by the timing of the declaration of dividends by any underlying mutual funds or exchange-traded funds (ETFs). Net investment income (loss) of any such underlying funds is not included in the Fund's net investment income (loss) ratio.
D Total distributions per share do not sum due to rounding.
E Total returns for periods of less than one year are not annualized.
F Total returns would have been lower if certain expenses had not been reduced during the applicable periods shown.
G Fees and expenses of any underlying mutual funds or exchange-traded funds (ETFs) are not included in the Fund's expense ratio. The Fund indirectly bears its proportionate share of these expenses. For additional expense information related to investments in Fidelity Central Funds, please refer to the "Investments in Fidelity Central Funds" note found in the Notes to Financial Statements section of the most recent Annual or Semi-Annual report.
H Expense ratios reflect operating expenses of the class. Expenses before reductions do not reflect amounts reimbursed, waived, or reduced through arrangements with the investment adviser, brokerage services, or other offset arrangements, if applicable, and do not represent the amount paid by the class during periods when reimbursements, waivers or reductions occur.
I On certain classes, the size and fluctuation of net assets and expense amounts may cause ratios to differ from contractual rates.
J Annualized
K Amount does not include the portfolio activity of any underlying mutual funds or exchange-traded funds (ETFs).
See accompanying notes which are an integral part of the financial statements.
Fidelity Advisor Freedom 2055 Fund Class Z6
| Years ended March 31, | 2022 | 2021 | 2020 | 2019 | 2018 A |
| Selected Per–Share Data | | | | | |
| Net asset value, beginning of period | $15.51 | $10.55 | $12.62 | $13.42 | $12.63 |
| Income from Investment Operations | | | | | |
| Net investment income (loss)B,C | .36 | .15 | .22 | .24 | .47 |
| Net realized and unrealized gain (loss) | .21 | 5.57 | (1.38) | .15 | .69 |
| Total from investment operations | .57 | 5.72 | (1.16) | .39 | 1.16 |
| Distributions from net investment income | (.36) | (.17) | (.21) | (.26) | (.19) |
| Distributions from net realized gain | (1.12) | (.59) | (.71) | (.93) | (.18) |
| Total distributions | (1.48) | (.76) | (.91)D | (1.19) | (.37) |
| Net asset value, end of period | $14.60 | $15.51 | $10.55 | $12.62 | $13.42 |
| Total ReturnE,F | 3.30% | 56.14% | (10.22)% | 3.59% | 9.16% |
| Ratios to Average Net AssetsC,G,H | | | | | |
| Expenses before reductions | .49% | .49% | .49% | .50%I | .50%I,J |
| Expenses net of fee waivers, if any | .49% | .49% | .49% | .50%I | .50%I,J |
| Expenses net of all reductions | .49% | .49% | .49% | .50%I | .50%I,J |
| Net investment income (loss) | 2.34% | 1.14% | 1.73% | 1.91% | 4.26%J |
| Supplemental Data | | | | | |
| Net assets, end of period (000 omitted) | $104,160 | $61,302 | $23,906 | $12,968 | $3,116 |
| Portfolio turnover rateK | 28% | 23% | 35% | 27% | 18% |
A For the period June 6, 2017 (commencement of sale of shares) through March 31, 2018.
B Calculated based on average shares outstanding during the period.
C Net investment income (loss) is affected by the timing of the declaration of dividends by any underlying mutual funds or exchange-traded funds (ETFs). Net investment income (loss) of any such underlying funds is not included in the Fund's net investment income (loss) ratio.
D Total distributions per share do not sum due to rounding.
E Total returns for periods of less than one year are not annualized.
F Total returns would have been lower if certain expenses had not been reduced during the applicable periods shown.
G Fees and expenses of any underlying mutual funds or exchange-traded funds (ETFs) are not included in the Fund's expense ratio. The Fund indirectly bears its proportionate share of these expenses. For additional expense information related to investments in Fidelity Central Funds, please refer to the "Investments in Fidelity Central Funds" note found in the Notes to Financial Statements section of the most recent Annual or Semi-Annual report.
H Expense ratios reflect operating expenses of the class. Expenses before reductions do not reflect amounts reimbursed, waived, or reduced through arrangements with the investment adviser, brokerage services, or other offset arrangements, if applicable, and do not represent the amount paid by the class during periods when reimbursements, waivers or reductions occur.
I On certain classes, the size and fluctuation of net assets and expense amounts may cause ratios to differ from contractual rates.
J Annualized
K Amount does not include the portfolio activity of any underlying mutual funds or exchange-traded funds (ETFs).
See accompanying notes which are an integral part of the financial statements.
Fidelity Advisor Freedom® 2060 Fund
Investment Summary (Unaudited)
The information in the following tables is based on the direct investments of the Fund.
Top Holdings as of March 31, 2022
| | % of fund's net assets |
| Fidelity Series Emerging Markets Opportunities Fund | 12.7 |
| Fidelity Series Large Cap Stock Fund | 9.8 |
| Fidelity Series International Value Fund | 7.5 |
| Fidelity Series Overseas Fund | 7.5 |
| Fidelity Series International Growth Fund | 7.4 |
| Fidelity Series Value Discovery Fund | 6.4 |
| Fidelity Series Stock Selector Large Cap Value Fund | 6.3 |
| Fidelity Advisor Series Equity Growth Fund | 6.2 |
| Fidelity Series Opportunistic Insights Fund | 5.8 |
| Fidelity Series Long-Term Treasury Bond Index Fund | 5.3 |
| | 74.9 |
Asset Allocation (% of fund's net assets)
| Period end |
| | Domestic Equity Funds | 50.4% |
| | International Equity Funds | 41.8% |
| | Bond Funds | 7.7% |
| | Short-Term Funds | 0.1% |

Domestic Equity Funds category includes Fidelity Series Commodity Strategy Fund which invests in commodity-related investments.
Fidelity Advisor Freedom® 2060 Fund
Schedule of Investments March 31, 2022
Showing Percentage of Net Assets
| U.S. Treasury Obligations - 0.0% | | | |
| | | Principal Amount | Value |
| U.S. Treasury Bills, yield at date of purchase 0.12% to 0.17% 4/14/22 to 4/21/22 (a) | | | |
| (Cost $169,986) | | 170,000 | 169,989 |
| | | Shares | Value |
|
| Domestic Equity Funds - 50.4% | | | |
| Fidelity Advisor Series Equity Growth Fund (b) | | 1,675,920 | $25,859,450 |
| Fidelity Advisor Series Growth Opportunities Fund (b) | | 1,450,271 | 17,736,820 |
| Fidelity Advisor Series Small Cap Fund (b) | | 903,571 | 11,737,384 |
| Fidelity Series All-Sector Equity Fund (b) | | 1,028,968 | 11,092,271 |
| Fidelity Series Commodity Strategy Fund (b) | | 1,206,697 | 6,166,222 |
| Fidelity Series Large Cap Stock Fund (b) | | 2,140,713 | 40,694,947 |
| Fidelity Series Large Cap Value Index Fund (b) | | 286,561 | 4,401,581 |
| Fidelity Series Opportunistic Insights Fund (b) | | 1,307,478 | 23,900,700 |
| Fidelity Series Small Cap Opportunities Fund (b) | | 1,064,015 | 14,491,882 |
| Fidelity Series Stock Selector Large Cap Value Fund (b) | | 1,916,808 | 25,972,743 |
| Fidelity Series Value Discovery Fund (b) | | 1,653,517 | 26,456,267 |
| TOTAL DOMESTIC EQUITY FUNDS | | | |
| (Cost $189,817,680) | | | 208,510,267 |
|
| International Equity Funds - 41.8% | | | |
| Fidelity Series Canada Fund (b) | | 867,701 | 13,466,722 |
| Fidelity Series Emerging Markets Fund (b) | | 612,663 | 5,685,511 |
| Fidelity Series Emerging Markets Opportunities Fund (b) | | 2,853,673 | 52,507,578 |
| Fidelity Series International Growth Fund (b) | | 1,856,367 | 30,778,566 |
| Fidelity Series International Small Cap Fund (b) | | 469,589 | 8,429,119 |
| Fidelity Series International Value Fund (b) | | 2,817,986 | 31,082,389 |
| Fidelity Series Overseas Fund (b) | | 2,452,174 | 30,946,442 |
| TOTAL INTERNATIONAL EQUITY FUNDS | | | |
| (Cost $164,796,102) | | | 172,896,327 |
|
| Bond Funds - 7.7% | | | |
| Fidelity Series 5+ Year Inflation-Protected Bond Index Fund (b) | | 43,104 | 413,795 |
| Fidelity Series Emerging Markets Debt Fund (b) | | 245,204 | 2,022,929 |
| Fidelity Series Emerging Markets Debt Local Currency Fund (b) | | 76,016 | 684,904 |
| Fidelity Series Floating Rate High Income Fund (b) | | 45,021 | 413,744 |
| Fidelity Series High Income Fund (b) | | 275,529 | 2,504,557 |
| Fidelity Series International Credit Fund (b) | | 3,813 | 35,306 |
| Fidelity Series Investment Grade Bond Fund (b) | | 202,072 | 2,204,608 |
| Fidelity Series Long-Term Treasury Bond Index Fund (b) | | 2,903,279 | 22,122,987 |
| Fidelity Series Real Estate Income Fund (b) | | 130,130 | 1,478,278 |
| TOTAL BOND FUNDS | | | |
| (Cost $34,067,131) | | | 31,881,108 |
|
| Short-Term Funds - 0.1% | | | |
| Fidelity Cash Central Fund 0.31% (c) | | | |
| (Cost $251,164) | | 251,114 | 251,164 |
| TOTAL INVESTMENT IN SECURITIES - 100.0% | | | |
| (Cost $389,102,063) | | | 413,708,855 |
| NET OTHER ASSETS (LIABILITIES) - 0.0% | | | (41,521) |
| NET ASSETS - 100% | | | $413,667,334 |
| Futures Contracts | | | | | |
| | Number of contracts | Expiration Date | Notional Amount | Value | Unrealized Appreciation/(Depreciation) |
| Purchased | | | | | |
| Equity Index Contracts | | | | | |
| ICE E-mini MSCI EAFE Index Contracts (United States) | 10 | June 2022 | $1,072,200 | $45,293 | $45,294 |
| ICE E-mini MSCI Emerging Markets Index Contracts (United States) | 31 | June 2022 | 1,744,525 | 22,266 | 22,266 |
|
| TOTAL PURCHASED | | | | | 67,560 |
|
| Sold | | | | | |
| Equity Index Contracts | | | | | |
| CME Micro E-mini S&P 500 Index Contracts (United States) | 9 | June 2022 | 2,038,838 | (55,224) | (55,224) |
| TOTAL FUTURES CONTRACTS | | | | | $12,336 |
The notional amount of futures purchased as a percentage of Net Assets is 0.7%
The notional amount of futures sold as a percentage of Net Assets is 0.5%
Legend
(a) Security or a portion of the security was pledged to cover margin requirements for futures contracts. At period end, the value of securities pledged amounted to $160,990.
(b) Affiliated Fund
(c) Affiliated fund that is generally available only to investment companies and other accounts managed by Fidelity Investments. The rate quoted is the annualized seven-day yield of the fund at period end. A complete unaudited listing of the fund's holdings as of its most recent quarter end is available upon request. In addition, each Fidelity Central Fund's financial statements, which are not covered by the Fund's Report of Independent Registered Public Accounting Firm, are available on the SEC's website or upon request.
Affiliated Central Funds
Fiscal year to date information regarding the Fund's investments in Fidelity Central Funds, including the ownership percentage, is presented below.
| Fund | Value, beginning of period | Purchases(a) | Sales Proceeds(a) | Dividend Income | Realized Gain/Loss | Change in Unrealized appreciation (depreciation) | Value, end of period | % ownership, end of period |
| Fidelity Cash Central Fund 0.31% | $126,187 | $910,437 | $785,460 | $107 | $-- | $-- | $251,164 | 0.0% |
| Total | $126,187 | $910,437 | $785,460 | $107 | $-- | $-- | $251,164 | |
(a) Includes the value of shares purchased or redeemed through in-kind transactions, if applicable.
Amounts in the income column in the above table include any capital gain distributions from underlying funds, which are presented in the corresponding line-item in the Statement of Operations, if applicable.
Affiliated Underlying Funds
Fiscal year to date information regarding the Fund's investments in affiliated Underlying Funds is presented below. Exchanges between classes of the same affiliated Underlying Funds may occur. If an underlying Fund changes its name, the name presented below is the name in effect at period end.
| Fund | Value, beginning of period | Purchases(a) | Sales Proceeds(a) | Dividend Income | Realized Gain (loss) | Change in Unrealized appreciation (depreciation) | Value, end of period |
| Fidelity Advisor Series Equity Growth Fund | $22,089,691 | $13,481,361 | $8,036,288 | $4,524,316 | $15,490 | $(1,690,804) | $25,859,450 |
| Fidelity Advisor Series Growth Opportunities Fund | 15,361,183 | 12,466,828 | 5,084,978 | 4,159,412 | (338,540) | (4,667,673) | 17,736,820 |
| Fidelity Advisor Series Small Cap Fund | 9,994,581 | 5,965,578 | 2,507,265 | 2,115,812 | (98,715) | (1,616,795) | 11,737,384 |
| Fidelity Series 0-5 Year Inflation-Protected Bond Index Fund | -- | 1,889,757 | 1,882,402 | 5,860 | (6,483) | -- | -- |
| Fidelity Series 5+ Year Inflation-Protected Bond Index Fund | -- | 3,861,909 | 3,307,364 | 18,740 | (128,250) | (12,500) | 413,795 |
| Fidelity Series All-Sector Equity Fund | 9,445,114 | 5,039,067 | 2,489,416 | 2,152,226 | (5,321) | (897,173) | 11,092,271 |
| Fidelity Series Canada Fund | 8,486,679 | 4,857,363 | 1,976,908 | 262,709 | 10,011 | 2,089,577 | 13,466,722 |
| Fidelity Series Commodity Strategy Fund | 9,703,345 | 5,833,897 | 9,785,015 | 3,371,270 | (367,234) | 781,229 | 6,166,222 |
| Fidelity Series Emerging Markets Debt Fund | 1,898,578 | 782,520 | 451,809 | 97,585 | (17,525) | (188,835) | 2,022,929 |
| Fidelity Series Emerging Markets Debt Local Currency Fund | 622,495 | 266,942 | 126,636 | 28,576 | (9,671) | (68,226) | 684,904 |
| Fidelity Series Emerging Markets Fund | 5,561,186 | 2,485,347 | 1,037,768 | 197,977 | (31,038) | (1,292,216) | 5,685,511 |
| Fidelity Series Emerging Markets Opportunities Fund | 50,144,949 | 28,702,958 | 9,104,164 | 6,242,312 | (527,036) | (16,709,129) | 52,507,578 |
| Fidelity Series Floating Rate High Income Fund | 365,913 | 143,466 | 95,536 | 17,708 | (562) | 463 | 413,744 |
| Fidelity Series Government Money Market Fund 0.31% | 2,314,531 | 296,257 | 2,610,788 | 535 | -- | -- | -- |
| Fidelity Series High Income Fund | 2,186,733 | 985,629 | 586,250 | 133,037 | (5,646) | (75,909) | 2,504,557 |
| Fidelity Series Inflation-Protected Bond Index Fund | 6,970,932 | 1,593,606 | 8,850,727 | 81,617 | 591,248 | (305,059) | -- |
| Fidelity Series International Credit Fund | 36,850 | 1,189 | -- | 1,189 | -- | (2,733) | 35,306 |
| Fidelity Series International Growth Fund | 23,780,561 | 13,127,935 | 3,194,573 | 2,467,064 | (116,765) | (2,818,592) | 30,778,566 |
| Fidelity Series International Small Cap Fund | 7,473,111 | 3,446,118 | 1,154,293 | 1,121,352 | (71,327) | (1,264,490) | 8,429,119 |
| Fidelity Series International Value Fund | 23,780,441 | 13,403,169 | 6,482,748 | 1,549,003 | 4,847 | 376,680 | 31,082,389 |
| Fidelity Series Investment Grade Bond Fund | 156,789 | 3,525,806 | 1,447,330 | 8,648 | (27,964) | (2,693) | 2,204,608 |
| Fidelity Series Large Cap Stock Fund | 34,499,487 | 13,864,417 | 8,745,046 | 3,578,643 | (57,844) | 1,133,933 | 40,694,947 |
| Fidelity Series Large Cap Value Index Fund | 3,723,505 | 1,547,498 | 1,044,304 | 291,911 | (1,860) | 176,742 | 4,401,581 |
| Fidelity Series Long-Term Treasury Bond Index Fund | 9,559,622 | 16,443,514 | 2,839,071 | 324,128 | (354,227) | (686,851) | 22,122,987 |
| Fidelity Series Opportunistic Insights Fund | 20,480,805 | 12,959,872 | 7,184,924 | 4,420,889 | 26,508 | (2,381,561) | 23,900,700 |
| Fidelity Series Overseas Fund | 23,819,753 | 11,342,061 | 3,724,445 | 912,643 | (66,945) | (423,982) | 30,946,442 |
| Fidelity Series Real Estate Income Fund | 1,334,059 | 425,792 | 317,688 | 59,650 | (1,129) | 37,244 | 1,478,278 |
| Fidelity Series Short-Term Credit Fund | 487,301 | 41,026 | 528,351 | 2,431 | 11,264 | (11,240) | -- |
| Fidelity Series Small Cap Opportunities Fund | 12,336,220 | 8,326,485 | 2,915,728 | 3,545,079 | (204,941) | (3,050,154) | 14,491,882 |
| Fidelity Series Stock Selector Large Cap Value Fund | 21,849,485 | 11,603,100 | 6,120,317 | 4,580,812 | (169,950) | (1,189,575) | 25,972,743 |
| Fidelity Series Value Discovery Fund | 22,366,767 | 10,342,043 | 6,278,871 | 3,048,779 | (65,617) | 91,945 | 26,456,267 |
| | $350,830,666 | $209,052,510 | $109,911,003 | $49,321,913 | $(2,015,222) | $(34,668,377) | $413,287,702 |
(a) Includes the value of shares purchased or redeemed through in-kind transactions, if applicable.
Amounts in the income column in the above table include any capital gain distributions from underlying funds, which are presented in the corresponding line-item in the Statement of Operations, if applicable.
Investment Valuation
The following is a summary of the inputs used, as of March 31, 2022, involving the Fund's assets and liabilities carried at fair value. The inputs or methodology used for valuing securities may not be an indication of the risk associated with investing in those securities. For more information on valuation inputs, and their aggregation into the levels used below, please refer to the Investment Valuation section in the accompanying Notes to Financial Statements.
| | Valuation Inputs at Reporting Date: |
| Description | Total | Level 1 | Level 2 | Level 3 |
| Investments in Securities: | | | | |
| Other Short-Term Investments and Net Other Assets | $169,989 | $-- | $169,989 | $-- |
| Domestic Equity Funds | 208,510,267 | 208,510,267 | -- | -- |
| International Equity Funds | 172,896,327 | 172,896,327 | -- | -- |
| Bond Funds | 31,881,108 | 31,881,108 | -- | -- |
| Short-Term Funds | 251,164 | 251,164 | -- | -- |
| Total Investments in Securities: | $413,708,855 | $413,538,866 | $169,989 | $-- |
| Derivative Instruments: | | | | |
| Assets | | | | |
| Futures Contracts | $67,560 | $67,560 | $-- | $-- |
| Total Assets | $67,560 | $67,560 | $-- | $-- |
| Liabilities | | | | |
| Futures Contracts | $(55,224) | $(55,224) | $-- | $-- |
| Total Liabilities | $(55,224) | $(55,224) | $-- | $-- |
| Total Derivative Instruments: | $12,336 | $12,336 | $-- | $-- |
Value of Derivative Instruments
The following table is a summary of the Fund's value of derivative instruments by primary risk exposure as of March 31, 2022. For additional information on derivative instruments, please refer to the Derivative Instruments section in the accompanying Notes to Financial Statements.
| Primary Risk Exposure / Derivative Type | Value |
| | Asset | Liability |
| Equity Risk | | |
| Futures Contracts(a) | $67,560 | $(55,224) |
| Total Equity Risk | 67,560 | (55,224) |
| Total Value of Derivatives | $67,560 | $(55,224) |
(a) Reflects gross cumulative appreciation (depreciation) on futures contracts as presented in the Schedule of Investments. In the Statement of Assets and Liabilities, the period end daily variation margin is included in receivable or payable for daily variation margin on futures contracts, and the net cumulative appreciation (depreciation) is included in Total accumulated earnings (loss).
See accompanying notes which are an integral part of the financial statements.
Fidelity Advisor Freedom® 2060 Fund
Financial Statements
Statement of Assets and Liabilities
| | | March 31, 2022 |
| Assets | | |
Investment in securities, at value — See accompanying schedule:
Unaffiliated issuers (cost $169,986) | $169,989 | |
| Fidelity Central Funds (cost $251,164) | 251,164 | |
| Other affiliated issuers (cost $388,680,913) | 413,287,702 | |
| Total Investment in Securities (cost $389,102,063) | | $413,708,855 |
| Cash | | 36,542 |
| Receivable for investments sold | | 6,161,695 |
| Receivable for fund shares sold | | 1,060,059 |
| Distributions receivable from Fidelity Central Funds | | 41 |
| Total assets | | 420,967,192 |
| Liabilities | | |
| Payable for investments purchased | $6,250,502 | |
| Payable for fund shares redeemed | 743,043 | |
| Accrued management fee | 238,525 | |
| Distribution and service plan fees payable | 50,408 | |
| Payable for daily variation margin on futures contracts | 17,380 | |
| Total liabilities | | 7,299,858 |
| Net Assets | | $413,667,334 |
| Net Assets consist of: | | |
| Paid in capital | | $367,252,840 |
| Total accumulated earnings (loss) | | 46,414,494 |
| Net Assets | | $413,667,334 |
| Net Asset Value and Maximum Offering Price | | |
| Class A: | | |
| Net Asset Value and redemption price per share ($119,726,215 ÷ 9,025,815 shares)(a) | | $13.26 |
| Maximum offering price per share (100/94.25 of $13.26) | | $14.07 |
| Class M: | | |
| Net Asset Value and redemption price per share ($48,458,400 ÷ 3,668,756 shares)(a) | | $13.21 |
| Maximum offering price per share (100/96.50 of $13.21) | | $13.69 |
| Class C: | | |
| Net Asset Value and offering price per share ($8,194,775 ÷ 624,005 shares)(a) | | $13.13 |
| Class I: | | |
| Net Asset Value, offering price and redemption price per share ($177,480,639 ÷ 13,306,269 shares) | | $13.34 |
| Class Z: | | |
| Net Asset Value, offering price and redemption price per share ($14,295,913 ÷ 1,080,213 shares) | | $13.23 |
| Class Z6: | | |
| Net Asset Value, offering price and redemption price per share ($45,511,392 ÷ 3,415,696 shares) | | $13.32 |
(a) Redemption price per share is equal to net asset value less any applicable contingent deferred sales charge.
See accompanying notes which are an integral part of the financial statements.
Statement of Operations
| | | Year ended March 31, 2022 |
| Investment Income | | |
| Dividends: | | |
| Affiliated issuers | | $11,474,564 |
| Interest | | 89 |
| Income from Fidelity Central Funds | | 107 |
| Total income | | 11,474,760 |
| Expenses | | |
| Management fee | $2,902,228 | |
| Distribution and service plan fees | 612,089 | |
| Independent trustees' fees and expenses | 1,177 | |
| Total expenses before reductions | 3,515,494 | |
| Expense reductions | (2) | |
| Total expenses after reductions | | 3,515,492 |
| Net investment income (loss) | | 7,959,268 |
| Realized and Unrealized Gain (Loss) | | |
| Net realized gain (loss) on: | | |
| Investment securities: | | |
| Unaffiliated issuers | 50 | |
| Affiliated issuers | (2,015,222) | |
| Futures contracts | (51,747) | |
| Capital gain distributions from underlying funds: | | |
| Affiliated issuers | 37,847,349 | |
| Total net realized gain (loss) | | 35,780,430 |
| Change in net unrealized appreciation (depreciation) on: | | |
| Investment securities: | | |
| Unaffiliated issuers | 2 | |
| Affiliated issuers | (34,668,377) | |
| Futures contracts | 12,336 | |
| Total change in net unrealized appreciation (depreciation) | | (34,656,039) |
| Net gain (loss) | | 1,124,391 |
| Net increase (decrease) in net assets resulting from operations | | $9,083,659 |
See accompanying notes which are an integral part of the financial statements.
Statement of Changes in Net Assets
| | Year ended March 31, 2022 | Year ended March 31, 2021 |
| Increase (Decrease) in Net Assets | | |
| Operations | | |
| Net investment income (loss) | $7,959,268 | $2,051,334 |
| Net realized gain (loss) | 35,780,430 | 16,768,754 |
| Change in net unrealized appreciation (depreciation) | (34,656,039) | 95,124,069 |
| Net increase (decrease) in net assets resulting from operations | 9,083,659 | 113,944,157 |
| Distributions to shareholders | (33,222,541) | (12,480,436) |
| Share transactions - net increase (decrease) | 86,926,804 | 62,757,239 |
| Total increase (decrease) in net assets | 62,787,922 | 164,220,960 |
| Net Assets | | |
| Beginning of period | 350,879,412 | 186,658,452 |
| End of period | $413,667,334 | $350,879,412 |
See accompanying notes which are an integral part of the financial statements.
Financial Highlights
Fidelity Advisor Freedom 2060 Fund Class A
| Years ended March 31, | 2022 | 2021 | 2020 | 2019 | 2018 |
| Selected Per–Share Data | | | | | |
| Net asset value, beginning of period | $14.01 | $9.49 | $11.31 | $11.86 | $10.76 |
| Income from Investment Operations | | | | | |
| Net investment income (loss)A,B | .27 | .08 | .14 | .17 | .10 |
| Net realized and unrealized gain (loss) | .16 | 5.01 | (1.24) | .13 | 1.34 |
| Total from investment operations | .43 | 5.09 | (1.10) | .30 | 1.44 |
| Distributions from net investment income | (.25)C | (.11) | (.14) | (.17) | (.11) |
| Distributions from net realized gain | (.93)C | (.46) | (.58) | (.68) | (.23) |
| Total distributions | (1.18) | (.57) | (.72) | (.85) | (.34) |
| Net asset value, end of period | $13.26 | $14.01 | $9.49 | $11.31 | $11.86 |
| Total ReturnD,E | 2.74% | 55.28% | (10.65)% | 3.09% | 13.44% |
| Ratios to Average Net AssetsB,F,G | | | | | |
| Expenses before reductions | 1.00% | 1.00% | 1.00% | 1.00% | .91% |
| Expenses net of fee waivers, if any | 1.00% | 1.00% | 1.00% | 1.00% | .91% |
| Expenses net of all reductions | 1.00% | 1.00% | 1.00% | 1.00% | .91% |
| Net investment income (loss) | 1.87% | .65% | 1.25% | 1.48% | .84% |
| Supplemental Data | | | | | |
| Net assets, end of period (000 omitted) | $119,726 | $113,936 | $65,792 | $55,732 | $37,880 |
| Portfolio turnover rateH | 28% | 24% | 31% | 27% | 16% |
A Calculated based on average shares outstanding during the period.
B Net investment income (loss) is affected by the timing of the declaration of dividends by any underlying mutual funds or exchange-traded funds (ETFs). Net investment income (loss) of any such underlying funds is not included in the Fund's net investment income (loss) ratio.
C The amount shown reflects reclassifications related to book to tax differences that were made in the year shown.
D Total returns would have been lower if certain expenses had not been reduced during the applicable periods shown.
E Total returns do not include the effect of the sales charges.
F Fees and expenses of any underlying mutual funds or exchange-traded funds (ETFs) are not included in the Fund's expense ratio. The Fund indirectly bears its proportionate share of these expenses. For additional expense information related to investments in Fidelity Central Funds, please refer to the "Investments in Fidelity Central Funds" note found in the Notes to Financial Statements section of the most recent Annual or Semi-Annual report.
G Expense ratios reflect operating expenses of the class. Expenses before reductions do not reflect amounts reimbursed, waived, or reduced through arrangements with the investment adviser, brokerage services, or other offset arrangements, if applicable, and do not represent the amount paid by the class during periods when reimbursements, waivers or reductions occur.
H Amount does not include the portfolio activity of any underlying mutual funds or exchange-traded funds (ETFs).
See accompanying notes which are an integral part of the financial statements.
Fidelity Advisor Freedom 2060 Fund Class M
| Years ended March 31, | 2022 | 2021 | 2020 | 2019 | 2018 |
| Selected Per–Share Data | | | | | |
| Net asset value, beginning of period | $13.97 | $9.47 | $11.29 | $11.85 | $10.77 |
| Income from Investment Operations | | | | | |
| Net investment income (loss)A,B | .23 | .05 | .11 | .14 | .07 |
| Net realized and unrealized gain (loss) | .17 | 5.00 | (1.23) | .14 | 1.33 |
| Total from investment operations | .40 | 5.05 | (1.12) | .28 | 1.40 |
| Distributions from net investment income | (.23)C | (.09) | (.12) | (.16) | (.10) |
| Distributions from net realized gain | (.93)C | (.46) | (.58) | (.68) | (.22) |
| Total distributions | (1.16) | (.55) | (.70) | (.84) | (.32) |
| Net asset value, end of period | $13.21 | $13.97 | $9.47 | $11.29 | $11.85 |
| Total ReturnD,E | 2.50% | 55.00% | (10.87)% | 2.82% | 13.04% |
| Ratios to Average Net AssetsB,F,G | | | | | |
| Expenses before reductions | 1.25% | 1.25% | 1.25% | 1.25% | 1.16% |
| Expenses net of fee waivers, if any | 1.25% | 1.25% | 1.25% | 1.25% | 1.16% |
| Expenses net of all reductions | 1.25% | 1.25% | 1.25% | 1.25% | 1.16% |
| Net investment income (loss) | 1.62% | .40% | 1.00% | 1.23% | .59% |
| Supplemental Data | | | | | |
| Net assets, end of period (000 omitted) | $48,458 | $41,642 | $21,680 | $19,070 | $12,628 |
| Portfolio turnover rateH | 28% | 24% | 31% | 27% | 16% |
A Calculated based on average shares outstanding during the period.
B Net investment income (loss) is affected by the timing of the declaration of dividends by any underlying mutual funds or exchange-traded funds (ETFs). Net investment income (loss) of any such underlying funds is not included in the Fund's net investment income (loss) ratio.
C The amount shown reflects reclassifications related to book to tax differences that were made in the year shown.
D Total returns would have been lower if certain expenses had not been reduced during the applicable periods shown.
E Total returns do not include the effect of the sales charges.
F Fees and expenses of any underlying mutual funds or exchange-traded funds (ETFs) are not included in the Fund's expense ratio. The Fund indirectly bears its proportionate share of these expenses. For additional expense information related to investments in Fidelity Central Funds, please refer to the "Investments in Fidelity Central Funds" note found in the Notes to Financial Statements section of the most recent Annual or Semi-Annual report.
G Expense ratios reflect operating expenses of the class. Expenses before reductions do not reflect amounts reimbursed, waived, or reduced through arrangements with the investment adviser, brokerage services, or other offset arrangements, if applicable, and do not represent the amount paid by the class during periods when reimbursements, waivers or reductions occur.
H Amount does not include the portfolio activity of any underlying mutual funds or exchange-traded funds (ETFs).
See accompanying notes which are an integral part of the financial statements.
Fidelity Advisor Freedom 2060 Fund Class C
| Years ended March 31, | 2022 | 2021 | 2020 | 2019 | 2018 |
| Selected Per–Share Data | | | | | |
| Net asset value, beginning of period | $13.92 | $9.46 | $11.29 | $11.87 | $10.81 |
| Income from Investment Operations | | | | | |
| Net investment income (loss)A,B | .16 | (.01) | .06 | .08 | .01 |
| Net realized and unrealized gain (loss) | .16 | 4.98 | (1.24) | .14 | 1.34 |
| Total from investment operations | .32 | 4.97 | (1.18) | .22 | 1.35 |
| Distributions from net investment income | (.18)C | (.05) | (.08) | (.12) | (.07) |
| Distributions from net realized gain | (.93)C | (.46) | (.57) | (.68) | (.22) |
| Total distributions | (1.11) | (.51) | (.65) | (.80) | (.29) |
| Net asset value, end of period | $13.13 | $13.92 | $9.46 | $11.29 | $11.87 |
| Total ReturnD,E | 1.94% | 54.14% | (11.27)% | 2.33% | 12.53% |
| Ratios to Average Net AssetsB,F,G | | | | | |
| Expenses before reductions | 1.75% | 1.75% | 1.75% | 1.75% | 1.66% |
| Expenses net of fee waivers, if any | 1.75% | 1.75% | 1.75% | 1.75% | 1.66% |
| Expenses net of all reductions | 1.75% | 1.75% | 1.75% | 1.75% | 1.66% |
| Net investment income (loss) | 1.12% | (.10)% | .50% | .72% | .09% |
| Supplemental Data | | | | | |
| Net assets, end of period (000 omitted) | $8,195 | $6,948 | $4,022 | $3,723 | $2,604 |
| Portfolio turnover rateH | 28% | 24% | 31% | 27% | 16% |
A Calculated based on average shares outstanding during the period.
B Net investment income (loss) is affected by the timing of the declaration of dividends by any underlying mutual funds or exchange-traded funds (ETFs). Net investment income (loss) of any such underlying funds is not included in the Fund's net investment income (loss) ratio.
C The amount shown reflects reclassifications related to book to tax differences that were made in the year shown.
D Total returns would have been lower if certain expenses had not been reduced during the applicable periods shown.
E Total returns do not include the effect of the contingent deferred sales charge.
F Fees and expenses of any underlying mutual funds or exchange-traded funds (ETFs) are not included in the Fund's expense ratio. The Fund indirectly bears its proportionate share of these expenses. For additional expense information related to investments in Fidelity Central Funds, please refer to the "Investments in Fidelity Central Funds" note found in the Notes to Financial Statements section of the most recent Annual or Semi-Annual report.
G Expense ratios reflect operating expenses of the class. Expenses before reductions do not reflect amounts reimbursed, waived, or reduced through arrangements with the investment adviser, brokerage services, or other offset arrangements, if applicable, and do not represent the amount paid by the class during periods when reimbursements, waivers or reductions occur.
H Amount does not include the portfolio activity of any underlying mutual funds or exchange-traded funds (ETFs).
See accompanying notes which are an integral part of the financial statements.
Fidelity Advisor Freedom 2060 Fund Class I
| Years ended March 31, | 2022 | 2021 | 2020 | 2019 | 2018 |
| Selected Per–Share Data | | | | | |
| Net asset value, beginning of period | $14.09 | $9.54 | $11.36 | $11.90 | $10.80 |
| Income from Investment Operations | | | | | |
| Net investment income (loss)A,B | .30 | .11 | .17 | .20 | .13 |
| Net realized and unrealized gain (loss) | .17 | 5.03 | (1.24) | .13 | 1.33 |
| Total from investment operations | .47 | 5.14 | (1.07) | .33 | 1.46 |
| Distributions from net investment income | (.28)C | (.13) | (.16) | (.20) | (.13) |
| Distributions from net realized gain | (.94)C | (.47) | (.59) | (.68) | (.23) |
| Total distributions | (1.22) | (.59)D | (.75) | (.87)D | (.36) |
| Net asset value, end of period | $13.34 | $14.09 | $9.54 | $11.36 | $11.90 |
| Total ReturnE | 3.01% | 55.62% | (10.38)% | 3.38% | 13.63% |
| Ratios to Average Net AssetsB,F,G | | | | | |
| Expenses before reductions | .75% | .75% | .75% | .75% | .66% |
| Expenses net of fee waivers, if any | .75% | .75% | .75% | .75% | .66% |
| Expenses net of all reductions | .75% | .75% | .75% | .75% | .66% |
| Net investment income (loss) | 2.12% | .90% | 1.50% | 1.73% | 1.09% |
| Supplemental Data | | | | | |
| Net assets, end of period (000 omitted) | $177,481 | $160,415 | $87,182 | $68,445 | $43,513 |
| Portfolio turnover rateH | 28% | 24% | 31% | 27% | 16% |
A Calculated based on average shares outstanding during the period.
B Net investment income (loss) is affected by the timing of the declaration of dividends by any underlying mutual funds or exchange-traded funds (ETFs). Net investment income (loss) of any such underlying funds is not included in the Fund's net investment income (loss) ratio.
C The amount shown reflects reclassifications related to book to tax differences that were made in the year shown.
D Total distributions per share do not sum due to rounding.
E Total returns would have been lower if certain expenses had not been reduced during the applicable periods shown.
F Fees and expenses of any underlying mutual funds or exchange-traded funds (ETFs) are not included in the Fund's expense ratio. The Fund indirectly bears its proportionate share of these expenses. For additional expense information related to investments in Fidelity Central Funds, please refer to the "Investments in Fidelity Central Funds" note found in the Notes to Financial Statements section of the most recent Annual or Semi-Annual report.
G Expense ratios reflect operating expenses of the class. Expenses before reductions do not reflect amounts reimbursed, waived, or reduced through arrangements with the investment adviser, brokerage services, or other offset arrangements, if applicable, and do not represent the amount paid by the class during periods when reimbursements, waivers or reductions occur.
H Amount does not include the portfolio activity of any underlying mutual funds or exchange-traded funds (ETFs).
See accompanying notes which are an integral part of the financial statements.
Fidelity Advisor Freedom 2060 Fund Class Z
| Years ended March 31, | 2022 | 2021 | 2020 | 2019 A |
| Selected Per–Share Data | | | | |
| Net asset value, beginning of period | $14.00 | $9.49 | $11.32 | $12.10 |
| Income from Investment Operations | | | | |
| Net investment income (loss)B,C | .31 | .12 | .18 | .23 |
| Net realized and unrealized gain (loss) | .17 | 5.02 | (1.23) | (.46) |
| Total from investment operations | .48 | 5.14 | (1.05) | (.23) |
| Distributions from net investment income | (.31)D | (.16) | (.18) | (.24) |
| Distributions from net realized gain | (.94)D | (.47) | (.60) | (.31) |
| Total distributions | (1.25) | (.63) | (.78) | (.55) |
| Net asset value, end of period | $13.23 | $14.00 | $9.49 | $11.32 |
| Total ReturnE,F | 3.06% | 55.88% | (10.32)% | (1.34)% |
| Ratios to Average Net AssetsC,G,H | | | | |
| Expenses before reductions | .64% | .65% | .65%I | .64%I,J |
| Expenses net of fee waivers, if any | .64% | .65% | .65%I | .64%I,J |
| Expenses net of all reductions | .64% | .65% | .65%I | .64%I,J |
| Net investment income (loss) | 2.22% | 1.00% | 1.60% | 4.28%J |
| Supplemental Data | | | | |
| Net assets, end of period (000 omitted) | $14,296 | $5,790 | $1,514 | $284 |
| Portfolio turnover rateK | 28% | 24% | 31% | 27% |
A For the period October 2, 2018 (commencement of sale of shares) through March 31, 2019.
B Calculated based on average shares outstanding during the period.
C Net investment income (loss) is affected by the timing of the declaration of dividends by any underlying mutual funds or exchange-traded funds (ETFs). Net investment income (loss) of any such underlying funds is not included in the Fund's net investment income (loss) ratio.
D The amount shown reflects reclassifications related to book to tax differences that were made in the year shown.
E Total returns for periods of less than one year are not annualized.
F Total returns would have been lower if certain expenses had not been reduced during the applicable periods shown.
G Fees and expenses of any underlying mutual funds or exchange-traded funds (ETFs) are not included in the Fund's expense ratio. The Fund indirectly bears its proportionate share of these expenses. For additional expense information related to investments in Fidelity Central Funds, please refer to the "Investments in Fidelity Central Funds" note found in the Notes to Financial Statements section of the most recent Annual or Semi-Annual report.
H Expense ratios reflect operating expenses of the class. Expenses before reductions do not reflect amounts reimbursed, waived, or reduced through arrangements with the investment adviser, brokerage services, or other offset arrangements, if applicable, and do not represent the amount paid by the class during periods when reimbursements, waivers or reductions occur.
I On certain classes, the size and fluctuation of net assets and expense amounts may cause ratios to differ from contractual rates.
J Annualized
K Amount does not include the portfolio activity of any underlying mutual funds or exchange-traded funds (ETFs).
See accompanying notes which are an integral part of the financial statements.
Fidelity Advisor Freedom 2060 Fund Class Z6
| Years ended March 31, | 2022 | 2021 | 2020 | 2019 | 2018 A |
| Selected Per–Share Data | | | | | |
| Net asset value, beginning of period | $14.08 | $9.53 | $11.36 | $11.90 | $11.16 |
| Income from Investment Operations | | | | | |
| Net investment income (loss)B,C | .34 | .14 | .20 | .23 | .33 |
| Net realized and unrealized gain (loss) | .17 | 5.04 | (1.25) | .13 | .69 |
| Total from investment operations | .51 | 5.18 | (1.05) | .36 | 1.02 |
| Distributions from net investment income | (.32)D | (.15) | (.19) | (.22) | (.16) |
| Distributions from net realized gain | (.95)D | (.48) | (.60) | (.68) | (.13) |
| Total distributions | (1.27) | (.63) | (.78)E | (.90) | (.28)E |
| Net asset value, end of period | $13.32 | $14.08 | $9.53 | $11.36 | $11.90 |
| Total ReturnF,G | 3.23% | 56.12% | (10.24)% | 3.63% | 9.14% |
| Ratios to Average Net AssetsC,H,I | | | | | |
| Expenses before reductions | .49% | .49% | .50% | .50%J | .50%J,K |
| Expenses net of fee waivers, if any | .49% | .49% | .50% | .50%J | .50%J,K |
| Expenses net of all reductions | .49% | .49% | .50% | .50%J | .50%J,K |
| Net investment income (loss) | 2.37% | 1.15% | 1.75% | 1.98% | 3.41%K |
| Supplemental Data | | | | | |
| Net assets, end of period (000 omitted) | $45,511 | $22,148 | $6,468 | $2,493 | $802 |
| Portfolio turnover rateL | 28% | 24% | 31% | 27% | 16% |
A For the period June 6, 2017 (commencement of sale of shares) through March 31, 2018.
B Calculated based on average shares outstanding during the period.
C Net investment income (loss) is affected by the timing of the declaration of dividends by any underlying mutual funds or exchange-traded funds (ETFs). Net investment income (loss) of any such underlying funds is not included in the Fund's net investment income (loss) ratio.
D The amount shown reflects reclassifications related to book to tax differences that were made in the year shown.
E Total distributions per share do not sum due to rounding.
F Total returns for periods of less than one year are not annualized.
G Total returns would have been lower if certain expenses had not been reduced during the applicable periods shown.
H Fees and expenses of any underlying mutual funds or exchange-traded funds (ETFs) are not included in the Fund's expense ratio. The Fund indirectly bears its proportionate share of these expenses. For additional expense information related to investments in Fidelity Central Funds, please refer to the "Investments in Fidelity Central Funds" note found in the Notes to Financial Statements section of the most recent Annual or Semi-Annual report.
I Expense ratios reflect operating expenses of the class. Expenses before reductions do not reflect amounts reimbursed, waived, or reduced through arrangements with the investment adviser, brokerage services, or other offset arrangements, if applicable, and do not represent the amount paid by the class during periods when reimbursements, waivers or reductions occur.
J On certain classes, the size and fluctuation of net assets and expense amounts may cause ratios to differ from contractual rates.
K Annualized
L Amount does not include the portfolio activity of any underlying mutual funds or exchange-traded funds (ETFs).
See accompanying notes which are an integral part of the financial statements.
Fidelity Advisor Freedom® 2065 Fund
Investment Summary (Unaudited)
The information in the following tables is based on the direct investments of the Fund.
Top Holdings as of March 31, 2022
| | % of fund's net assets |
| Fidelity Series Emerging Markets Opportunities Fund | 12.9 |
| Fidelity Series Large Cap Stock Fund | 9.7 |
| Fidelity Series International Value Fund | 7.6 |
| Fidelity Series Overseas Fund | 7.5 |
| Fidelity Series International Growth Fund | 7.5 |
| Fidelity Series Value Discovery Fund | 6.3 |
| Fidelity Series Stock Selector Large Cap Value Fund | 6.2 |
| Fidelity Advisor Series Equity Growth Fund | 6.2 |
| Fidelity Series Opportunistic Insights Fund | 5.7 |
| Fidelity Series Long-Term Treasury Bond Index Fund | 5.4 |
| | 75.0 |
Asset Allocation (% of fund's net assets)
| Period end |
| | Domestic Equity Funds | 49.9% |
| | International Equity Funds | 42.3% |
| | Bond Funds | 7.8% |

Domestic Equity Funds category includes Fidelity Series Commodity Strategy Fund which invests in commodity-related investments.
Fidelity Advisor Freedom® 2065 Fund
Schedule of Investments March 31, 2022
Showing Percentage of Net Assets
| Domestic Equity Funds - 49.9% | | | |
| | | Shares | Value |
| Fidelity Advisor Series Equity Growth Fund (a) | | 217,487 | $3,355,824 |
| Fidelity Advisor Series Growth Opportunities Fund (a) | | 188,188 | 2,301,541 |
| Fidelity Advisor Series Small Cap Fund (a) | | 117,241 | 1,522,962 |
| Fidelity Series All-Sector Equity Fund (a) | | 133,523 | 1,439,375 |
| Fidelity Series Commodity Strategy Fund (a) | | 158,759 | 811,258 |
| Fidelity Series Large Cap Stock Fund (a) | | 277,716 | 5,279,380 |
| Fidelity Series Large Cap Value Index Fund (a) | | 37,207 | 571,497 |
| Fidelity Series Opportunistic Insights Fund (a) | | 169,679 | 3,101,740 |
| Fidelity Series Small Cap Opportunities Fund (a) | | 138,061 | 1,880,385 |
| Fidelity Series Stock Selector Large Cap Value Fund (a) | | 248,725 | 3,370,227 |
| Fidelity Series Value Discovery Fund (a) | | 214,539 | 3,432,621 |
| TOTAL DOMESTIC EQUITY FUNDS | | | |
| (Cost $27,197,167) | | | 27,066,810 |
|
| International Equity Funds - 42.3% | | | |
| Fidelity Series Canada Fund (a) | | 114,942 | 1,783,893 |
| Fidelity Series Emerging Markets Fund (a) | | 82,275 | 763,516 |
| Fidelity Series Emerging Markets Opportunities Fund (a) | | 380,999 | 7,010,387 |
| Fidelity Series International Growth Fund (a) | | 245,692 | 4,073,578 |
| Fidelity Series International Small Cap Fund (a) | | 62,120 | 1,115,058 |
| Fidelity Series International Value Fund (a) | | 372,901 | 4,113,099 |
| Fidelity Series Overseas Fund (a) | | 324,519 | 4,095,435 |
| TOTAL INTERNATIONAL EQUITY FUNDS | | | |
| (Cost $24,298,557) | | | 22,954,966 |
|
| Bond Funds - 7.8% | | | |
| Fidelity Series 5+ Year Inflation-Protected Bond Index Fund (a) | | 5,653 | 54,273 |
| Fidelity Series Emerging Markets Debt Fund (a) | | 33,614 | 277,311 |
| Fidelity Series Emerging Markets Debt Local Currency Fund (a) | | 9,999 | 90,087 |
| Fidelity Series Floating Rate High Income Fund (a) | | 5,902 | 54,236 |
| Fidelity Series High Income Fund (a) | | 36,120 | 328,328 |
| Fidelity Series International Credit Fund (a) | | 541 | 5,013 |
| Fidelity Series Investment Grade Bond Fund (a) | | 27,346 | 298,348 |
| Fidelity Series Long-Term Treasury Bond Index Fund (a) | | 381,697 | 2,908,529 |
| Fidelity Series Real Estate Income Fund (a) | | 17,172 | 195,074 |
| TOTAL BOND FUNDS | | | |
| (Cost $4,479,704) | | | 4,211,199 |
| TOTAL INVESTMENT IN SECURITIES - 100.0% | | | |
| (Cost $55,975,428) | | | 54,232,975 |
| NET OTHER ASSETS (LIABILITIES) - 0.0% | | | (7,119) |
| NET ASSETS - 100% | | | $54,225,856 |
Legend
(a) Affiliated Fund
Affiliated Underlying Funds
Fiscal year to date information regarding the Fund's investments in affiliated Underlying Funds is presented below. Exchanges between classes of the same affiliated Underlying Funds may occur. If an underlying Fund changes its name, the name presented below is the name in effect at period end.
| Fund | Value, beginning of period | Purchases(a) | Sales Proceeds(a) | Dividend Income | Realized Gain (loss) | Change in Unrealized appreciation (depreciation) | Value, end of period |
| Fidelity Advisor Series Equity Growth Fund | $1,644,596 | $2,731,174 | $743,404 | $488,041 | $(27,451) | $(249,091) | $3,355,824 |
| Fidelity Advisor Series Growth Opportunities Fund | 1,143,777 | 2,284,114 | 516,988 | 448,264 | (53,030) | (556,332) | 2,301,541 |
| Fidelity Advisor Series Small Cap Fund | 743,991 | 1,243,211 | 242,345 | 228,238 | (11,668) | (210,227) | 1,522,962 |
| Fidelity Series 0-5 Year Inflation-Protected Bond Index Fund | -- | 212,933 | 212,214 | 632 | (625) | -- | -- |
| Fidelity Series 5+ Year Inflation-Protected Bond Index Fund | -- | 489,546 | 419,699 | 2,083 | (14,401) | (1,173) | 54,273 |
| Fidelity Series All-Sector Equity Fund | 703,138 | 1,109,711 | 233,543 | 241,390 | (13,522) | (126,409) | 1,439,375 |
| Fidelity Series Canada Fund | 631,747 | 1,211,517 | 274,877 | 28,313 | (1,656) | 217,162 | 1,783,893 |
| Fidelity Series Commodity Strategy Fund | 724,277 | 1,076,581 | 1,054,260 | 321,325 | (32,306) | 96,966 | 811,258 |
| Fidelity Series Emerging Markets Debt Fund | 142,410 | 210,230 | 49,128 | 9,765 | (1,682) | (24,519) | 277,311 |
| Fidelity Series Emerging Markets Debt Local Currency Fund | 47,430 | 67,161 | 15,256 | 3,053 | (973) | (8,275) | 90,087 |
| Fidelity Series Emerging Markets Fund | 415,086 | 591,457 | 89,569 | 21,216 | (2,893) | (150,565) | 763,516 |
| Fidelity Series Emerging Markets Opportunities Fund | 3,734,073 | 6,072,295 | 833,377 | 667,048 | (37,000) | (1,925,604) | 7,010,387 |
| Fidelity Series Floating Rate High Income Fund | 28,127 | 38,996 | 12,739 | 1,799 | (45) | (103) | 54,236 |
| Fidelity Series Government Money Market Fund 0.31% | 172,299 | 62,131 | 234,430 | 39 | -- | -- | -- |
| Fidelity Series High Income Fund | 164,950 | 240,143 | 65,376 | 13,401 | (1,163) | (10,226) | 328,328 |
| Fidelity Series Inflation-Protected Bond Index Fund | 521,521 | 388,426 | 932,422 | 8,977 | 33,410 | (10,935) | -- |
| Fidelity Series International Credit Fund | 5,232 | 169 | -- | 169 | -- | (388) | 5,013 |
| Fidelity Series International Growth Fund | 1,770,301 | 3,245,088 | 490,507 | 263,314 | (21,375) | (429,929) | 4,073,578 |
| Fidelity Series International Small Cap Fund | 560,643 | 859,926 | 116,508 | 119,799 | (4,588) | (184,415) | 1,115,058 |
| Fidelity Series International Value Fund | 1,768,366 | 3,021,119 | 666,036 | 165,318 | (12,894) | 2,544 | 4,113,099 |
| Fidelity Series Investment Grade Bond Fund | 12,375 | 462,580 | 172,961 | 998 | (2,931) | (715) | 298,348 |
| Fidelity Series Large Cap Stock Fund | 2,568,501 | 3,631,698 | 992,387 | 344,327 | (11,677) | 83,245 | 5,279,380 |
| Fidelity Series Large Cap Value Index Fund | 277,216 | 386,488 | 102,519 | 31,673 | (1,915) | 12,227 | 571,497 |
| Fidelity Series Long-Term Treasury Bond Index Fund | 713,643 | 2,655,253 | 300,729 | 33,654 | (17,123) | (142,515) | 2,908,529 |
| Fidelity Series Opportunistic Insights Fund | 1,524,816 | 2,612,958 | 665,217 | 481,649 | (23,571) | (347,246) | 3,101,740 |
| Fidelity Series Overseas Fund | 1,773,028 | 3,016,718 | 506,788 | 97,414 | (16,507) | (171,016) | 4,095,435 |
| Fidelity Series Real Estate Income Fund | 99,307 | 133,385 | 38,809 | 6,151 | (486) | 1,677 | 195,074 |
| Fidelity Series Short-Term Credit Fund | 36,275 | 12,448 | 48,708 | 182 | 109 | (124) | -- |
| Fidelity Series Small Cap Opportunities Fund | 918,165 | 1,590,945 | 289,131 | 340,591 | (20,261) | (319,333) | 1,880,385 |
| Fidelity Series Stock Selector Large Cap Value Fund | 1,626,789 | 2,553,635 | 601,844 | 512,752 | (21,557) | (186,796) | 3,370,227 |
| Fidelity Series Value Discovery Fund | 1,665,291 | 2,463,501 | 633,313 | 343,534 | (19,116) | (43,742) | 3,432,621 |
| | $26,137,370 | $44,675,537 | $11,555,084 | $5,225,109 | $(338,897) | $(4,685,857) | $54,232,975 |
(a) Includes the value of shares purchased or redeemed through in-kind transactions, if applicable.
Amounts in the income column in the above table include any capital gain distributions from underlying funds, which are presented in the corresponding line-item in the Statement of Operations, if applicable.
Investment Valuation
The following is a summary of the inputs used, as of March 31, 2022, involving the Fund's assets and liabilities carried at fair value. The inputs or methodology used for valuing securities may not be an indication of the risk associated with investing in those securities. For more information on valuation inputs, and their aggregation into the levels used below, please refer to the Investment Valuation section in the accompanying Notes to Financial Statements.
| | Valuation Inputs at Reporting Date: |
| Description | Total | Level 1 | Level 2 | Level 3 |
| Investments in Securities: | | | | |
| Domestic Equity Funds | $27,066,810 | $27,066,810 | $-- | $-- |
| International Equity Funds | 22,954,966 | 22,954,966 | -- | -- |
| Bond Funds | 4,211,199 | 4,211,199 | -- | -- |
| Total Investments in Securities: | $54,232,975 | $54,232,975 | $-- | $-- |
See accompanying notes which are an integral part of the financial statements.
Fidelity Advisor Freedom® 2065 Fund
Financial Statements
Statement of Assets and Liabilities
| | | March 31, 2022 |
| Assets | | |
Investment in securities, at value — See accompanying schedule:
| | |
| Affiliated issuers (cost $55,975,428) | $54,232,975 | |
| Total Investment in Securities (cost $55,975,428) | | $54,232,975 |
| Cash | | 199 |
| Receivable for investments sold | | 796,526 |
| Receivable for fund shares sold | | 224,189 |
| Total assets | | 55,253,889 |
| Liabilities | | |
| Payable for investments purchased | $963,215 | |
| Payable for fund shares redeemed | 28,384 | |
| Accrued management fee | 30,429 | |
| Distribution and service plan fees payable | 6,005 | |
| Total liabilities | | 1,028,033 |
| Net Assets | | $54,225,856 |
| Net Assets consist of: | | |
| Paid in capital | | $53,544,871 |
| Total accumulated earnings (loss) | | 680,985 |
| Net Assets | | $54,225,856 |
| Net Asset Value and Maximum Offering Price | | |
| Class A: | | |
| Net Asset Value and redemption price per share ($18,134,153 ÷ 1,473,951 shares)(a) | | $12.30 |
| Maximum offering price per share (100/94.25 of $12.30) | | $13.05 |
| Class M: | | |
| Net Asset Value and redemption price per share ($4,401,933 ÷ 358,659 shares)(a) | | $12.27 |
| Maximum offering price per share (100/96.50 of $12.27) | | $12.72 |
| Class C: | | |
| Net Asset Value and offering price per share ($773,699 ÷ 63,206 shares)(a) | | $12.24 |
| Class I: | | |
| Net Asset Value, offering price and redemption price per share ($21,524,207 ÷ 1,743,751 shares) | | $12.34 |
| Class Z: | | |
| Net Asset Value, offering price and redemption price per share ($1,892,975 ÷ 152,970 shares) | | $12.37 |
| Class Z6: | | |
| Net Asset Value, offering price and redemption price per share ($7,498,889 ÷ 605,324 shares) | | $12.39 |
(a) Redemption price per share is equal to net asset value less any applicable contingent deferred sales charge.
See accompanying notes which are an integral part of the financial statements.
Statement of Operations
| | | Year ended March 31, 2022 |
| Investment Income | | |
| Dividends: | | |
| Affiliated issuers | | $1,179,539 |
| Expenses | | |
| Management fee | $287,959 | |
| Distribution and service plan fees | 54,436 | |
| Independent trustees' fees and expenses | 108 | |
| Total expenses | | 342,503 |
| Net investment income (loss) | | 837,036 |
| Realized and Unrealized Gain (Loss) | | |
| Net realized gain (loss) on: | | |
| Investment securities: | | |
| Affiliated issuers | (338,897) | |
| Capital gain distributions from underlying funds: | | |
| Affiliated issuers | 4,045,570 | |
| Total net realized gain (loss) | | 3,706,673 |
| Change in net unrealized appreciation (depreciation) on: | | |
| Investment securities: | | |
| Affiliated issuers | (4,685,857) | |
| Total change in net unrealized appreciation (depreciation) | | (4,685,857) |
| Net gain (loss) | | (979,184) |
| Net increase (decrease) in net assets resulting from operations | | $(142,148) |
See accompanying notes which are an integral part of the financial statements.
Statement of Changes in Net Assets
| | Year ended March 31, 2022 | Year ended March 31, 2021 |
| Increase (Decrease) in Net Assets | | |
| Operations | | |
| Net investment income (loss) | $837,036 | $109,261 |
| Net realized gain (loss) | 3,706,673 | 735,384 |
| Change in net unrealized appreciation (depreciation) | (4,685,857) | 4,063,179 |
| Net increase (decrease) in net assets resulting from operations | (142,148) | 4,907,824 |
| Distributions to shareholders | (2,674,101) | (354,944) |
| Share transactions - net increase (decrease) | 30,921,156 | 15,608,234 |
| Total increase (decrease) in net assets | 28,104,907 | 20,161,114 |
| Net Assets | | |
| Beginning of period | 26,120,949 | 5,959,835 |
| End of period | $54,225,856 | $26,120,949 |
See accompanying notes which are an integral part of the financial statements.
Financial Highlights
Fidelity Advisor Freedom 2065 Fund Class A
| Years ended March 31, | 2022 | 2021 | 2020 A |
| Selected Per–Share Data | | | |
| Net asset value, beginning of period | $12.77 | $8.47 | $10.00 |
| Income from Investment Operations | | | |
| Net investment income (loss)B,C | .25 | .08 | .12 |
| Net realized and unrealized gain (loss) | .14D | 4.53 | (1.48) |
| Total from investment operations | .39 | 4.61 | (1.36) |
| Distributions from net investment income | (.24) | (.10) | (.13) |
| Distributions from net realized gain | (.62) | (.21) | (.04) |
| Total distributions | (.86) | (.31) | (.17) |
| Net asset value, end of period | $12.30 | $12.77 | $8.47 |
| Total ReturnE,F | 2.75% | 55.16% | (13.92)% |
| Ratios to Average Net AssetsC,G,H | | | |
| Expenses before reductions | 1.00% | 1.00% | 1.01%I,J |
| Expenses net of fee waivers, if any | 1.00% | 1.00% | 1.01%I,J |
| Expenses net of all reductions | 1.00% | 1.00% | 1.01%I,J |
| Net investment income (loss) | 1.94% | .71% | 1.60%I |
| Supplemental Data | | | |
| Net assets, end of period (000 omitted) | $18,134 | $9,613 | $1,980 |
| Portfolio turnover rateK | 29% | 31% | 33%I |
A For the period June 28, 2019 (commencement of operations) through March 31, 2020.
B Calculated based on average shares outstanding during the period.
C Net investment income (loss) is affected by the timing of the declaration of dividends by any underlying mutual funds or exchange-traded funds (ETFs). Net investment income (loss) of any such underlying funds is not included in the Fund's net investment income (loss) ratio.
D The amount shown for a share outstanding does not correspond with the aggregate net gain (loss) on investments for the period due to the timing of sales and repurchases of shares in relation to fluctuating market values of the investments of the Fund.
E Total returns for periods of less than one year are not annualized.
F Total returns do not include the effect of the sales charges.
G Fees and expenses of any underlying mutual funds or exchange-traded funds (ETFs) are not included in the Fund's expense ratio. The Fund indirectly bears its proportionate share of these expenses.
H Expense ratios reflect operating expenses of the class. Expenses before reductions do not reflect amounts reimbursed, waived, or reduced through arrangements with the investment adviser, brokerage services, or other offset arrangements, if applicable, and do not represent the amount paid by the class during periods when reimbursements, waivers or reductions occur.
I Annualized
J On certain classes, the size and fluctuation of net assets and expense amounts may cause ratios to differ from contractual rates.
K Amount does not include the portfolio activity of any underlying mutual funds or exchange-traded funds (ETFs).
See accompanying notes which are an integral part of the financial statements.
Fidelity Advisor Freedom 2065 Fund Class M
| Years ended March 31, | 2022 | 2021 | 2020 A |
| Selected Per–Share Data | | | |
| Net asset value, beginning of period | $12.76 | $8.47 | $10.00 |
| Income from Investment Operations | | | |
| Net investment income (loss)B,C | .22 | .05 | .10 |
| Net realized and unrealized gain (loss) | .14D | 4.53 | (1.47) |
| Total from investment operations | .36 | 4.58 | (1.37) |
| Distributions from net investment income | (.24) | (.08) | (.11) |
| Distributions from net realized gain | (.61) | (.20) | (.04) |
| Total distributions | (.85) | (.29)E | (.16)E |
| Net asset value, end of period | $12.27 | $12.76 | $8.47 |
| Total ReturnF,G | 2.47% | 54.73% | (14.05)% |
| Ratios to Average Net AssetsC,H,I | | | |
| Expenses before reductions | 1.25% | 1.25% | 1.25%J |
| Expenses net of fee waivers, if any | 1.25% | 1.25% | 1.25%J |
| Expenses net of all reductions | 1.25% | 1.25% | 1.25%J |
| Net investment income (loss) | 1.69% | .46% | 1.35%J |
| Supplemental Data | | | |
| Net assets, end of period (000 omitted) | $4,402 | $1,230 | $332 |
| Portfolio turnover rateK | 29% | 31% | 33%J |
A For the period June 28, 2019 (commencement of operations) through March 31, 2020.
B Calculated based on average shares outstanding during the period.
C Net investment income (loss) is affected by the timing of the declaration of dividends by any underlying mutual funds or exchange-traded funds (ETFs). Net investment income (loss) of any such underlying funds is not included in the Fund's net investment income (loss) ratio.
D The amount shown for a share outstanding does not correspond with the aggregate net gain (loss) on investments for the period due to the timing of sales and repurchases of shares in relation to fluctuating market values of the investments of the Fund.
E Total distributions per share do not sum due to rounding.
F Total returns for periods of less than one year are not annualized.
G Total returns do not include the effect of the sales charges.
H Fees and expenses of any underlying mutual funds or exchange-traded funds (ETFs) are not included in the Fund's expense ratio. The Fund indirectly bears its proportionate share of these expenses.
I Expense ratios reflect operating expenses of the class. Expenses before reductions do not reflect amounts reimbursed, waived, or reduced through arrangements with the investment adviser, brokerage services, or other offset arrangements, if applicable, and do not represent the amount paid by the class during periods when reimbursements, waivers or reductions occur.
J Annualized
K Amount does not include the portfolio activity of any underlying mutual funds or exchange-traded funds (ETFs).
See accompanying notes which are an integral part of the financial statements.
Fidelity Advisor Freedom 2065 Fund Class C
| Years ended March 31, | 2022 | 2021 | 2020 A |
| Selected Per–Share Data | | | |
| Net asset value, beginning of period | $12.73 | $8.46 | $10.00 |
| Income from Investment Operations | | | |
| Net investment income (loss)B,C | .15 | –D | .06 |
| Net realized and unrealized gain (loss) | .14E | 4.51 | (1.47) |
| Total from investment operations | .29 | 4.51 | (1.41) |
| Distributions from net investment income | (.18) | (.04) | (.09) |
| Distributions from net realized gain | (.60) | (.20) | (.04) |
| Total distributions | (.78) | (.24) | (.13) |
| Net asset value, end of period | $12.24 | $12.73 | $8.46 |
| Total ReturnF,G | 2.00% | 53.95% | (14.38)% |
| Ratios to Average Net AssetsC,H,I | | | |
| Expenses before reductions | 1.75% | 1.75% | 1.75%J |
| Expenses net of fee waivers, if any | 1.75% | 1.75% | 1.75%J |
| Expenses net of all reductions | 1.75% | 1.75% | 1.75%J |
| Net investment income (loss) | 1.19% | (.04)% | .86%J |
| Supplemental Data | | | |
| Net assets, end of period (000 omitted) | $774 | $434 | $183 |
| Portfolio turnover rateK | 29% | 31% | 33%J |
A For the period June 28, 2019 (commencement of operations) through March 31, 2020.
B Calculated based on average shares outstanding during the period.
C Net investment income (loss) is affected by the timing of the declaration of dividends by any underlying mutual funds or exchange-traded funds (ETFs). Net investment income (loss) of any such underlying funds is not included in the Fund's net investment income (loss) ratio.
D Amount represents less than $.005 per share.
E The amount shown for a share outstanding does not correspond with the aggregate net gain (loss) on investments for the period due to the timing of sales and repurchases of shares in relation to fluctuating market values of the investments of the Fund.
F Total returns for periods of less than one year are not annualized.
G Total returns do not include the effect of the contingent deferred sales charge.
H Fees and expenses of any underlying mutual funds or exchange-traded funds (ETFs) are not included in the Fund's expense ratio. The Fund indirectly bears its proportionate share of these expenses.
I Expense ratios reflect operating expenses of the class. Expenses before reductions do not reflect amounts reimbursed, waived, or reduced through arrangements with the investment adviser, brokerage services, or other offset arrangements, if applicable, and do not represent the amount paid by the class during periods when reimbursements, waivers or reductions occur.
J Annualized
K Amount does not include the portfolio activity of any underlying mutual funds or exchange-traded funds (ETFs).
See accompanying notes which are an integral part of the financial statements.
Fidelity Advisor Freedom 2065 Fund Class I
| Years ended March 31, | 2022 | 2021 | 2020 A |
| Selected Per–Share Data | | | |
| Net asset value, beginning of period | $12.81 | $8.48 | $10.00 |
| Income from Investment Operations | | | |
| Net investment income (loss)B,C | .29 | .11 | .14 |
| Net realized and unrealized gain (loss) | .13D | 4.55 | (1.48) |
| Total from investment operations | .42 | 4.66 | (1.34) |
| Distributions from net investment income | (.26) | (.12) | (.14) |
| Distributions from net realized gain | (.63) | (.21) | (.04) |
| Total distributions | (.89) | (.33) | (.18) |
| Net asset value, end of period | $12.34 | $12.81 | $8.48 |
| Total ReturnE | 2.94% | 55.68% | (13.78)% |
| Ratios to Average Net AssetsC,F,G | | | |
| Expenses before reductions | .75% | .75% | .75%H |
| Expenses net of fee waivers, if any | .75% | .75% | .75%H |
| Expenses net of all reductions | .75% | .75% | .75%H |
| Net investment income (loss) | 2.19% | .96% | 1.85%H |
| Supplemental Data | | | |
| Net assets, end of period (000 omitted) | $21,524 | $11,782 | $2,383 |
| Portfolio turnover rateI | 29% | 31% | 33%H |
A For the period June 28, 2019 (commencement of operations) through March 31, 2020.
B Calculated based on average shares outstanding during the period.
C Net investment income (loss) is affected by the timing of the declaration of dividends by any underlying mutual funds or exchange-traded funds (ETFs). Net investment income (loss) of any such underlying funds is not included in the Fund's net investment income (loss) ratio.
D The amount shown for a share outstanding does not correspond with the aggregate net gain (loss) on investments for the period due to the timing of sales and repurchases of shares in relation to fluctuating market values of the investments of the Fund.
E Total returns for periods of less than one year are not annualized.
F Fees and expenses of any underlying mutual funds or exchange-traded funds (ETFs) are not included in the Fund's expense ratio. The Fund indirectly bears its proportionate share of these expenses.
G Expense ratios reflect operating expenses of the class. Expenses before reductions do not reflect amounts reimbursed, waived, or reduced through arrangements with the investment adviser, brokerage services, or other offset arrangements, if applicable, and do not represent the amount paid by the class during periods when reimbursements, waivers or reductions occur.
H Annualized
I Amount does not include the portfolio activity of any underlying mutual funds or exchange-traded funds (ETFs).
See accompanying notes which are an integral part of the financial statements.
Fidelity Advisor Freedom 2065 Fund Class Z
| Years ended March 31, | 2022 | 2021 | 2020 A |
| Selected Per–Share Data | | | |
| Net asset value, beginning of period | $12.84 | $8.49 | $10.00 |
| Income from Investment Operations | | | |
| Net investment income (loss)B,C | .30 | .12 | .15 |
| Net realized and unrealized gain (loss) | .13D | 4.56 | (1.48) |
| Total from investment operations | .43 | 4.68 | (1.33) |
| Distributions from net investment income | (.28) | (.12) | (.14) |
| Distributions from net realized gain | (.62) | (.20) | (.04) |
| Total distributions | (.90) | (.33)E | (.18) |
| Net asset value, end of period | $12.37 | $12.84 | $8.49 |
| Total ReturnF | 3.02% | 55.80% | (13.68)% |
| Ratios to Average Net AssetsC,G,H | | | |
| Expenses before reductions | .64% | .65%I | .64%J |
| Expenses net of fee waivers, if any | .64% | .65%I | .64%J |
| Expenses net of all reductions | .64% | .65%I | .64%J |
| Net investment income (loss) | 2.29% | 1.07% | 1.96%J |
| Supplemental Data | | | |
| Net assets, end of period (000 omitted) | $1,893 | $535 | $176 |
| Portfolio turnover rateK | 29% | 31% | 33%J |
A For the period June 28, 2019 (commencement of operations) through March 31, 2020.
B Calculated based on average shares outstanding during the period.
C Net investment income (loss) is affected by the timing of the declaration of dividends by any underlying mutual funds or exchange-traded funds (ETFs). Net investment income (loss) of any such underlying funds is not included in the Fund's net investment income (loss) ratio.
��D The amount shown for a share outstanding does not correspond with the aggregate net gain (loss) on investments for the period due to the timing of sales and repurchases of shares in relation to fluctuating market values of the investments of the Fund.
E Total distributions per share do not sum due to rounding.
F Total returns for periods of less than one year are not annualized.
G Fees and expenses of any underlying mutual funds or exchange-traded funds (ETFs) are not included in the Fund's expense ratio. The Fund indirectly bears its proportionate share of these expenses.
H Expense ratios reflect operating expenses of the class. Expenses before reductions do not reflect amounts reimbursed, waived, or reduced through arrangements with the investment adviser, brokerage services, or other offset arrangements, if applicable, and do not represent the amount paid by the class during periods when reimbursements, waivers or reductions occur.
I On certain classes, the size and fluctuation of net assets and expense amounts may cause ratios to differ from contractual rates.
J Annualized
K Amount does not include the portfolio activity of any underlying mutual funds or exchange-traded funds (ETFs).
See accompanying notes which are an integral part of the financial statements.
Fidelity Advisor Freedom 2065 Fund Class Z6
| Years ended March 31, | 2022 | 2021 | 2020 A |
| Selected Per–Share Data | | | |
| Net asset value, beginning of period | $12.85 | $8.50 | $10.00 |
| Income from Investment Operations | | | |
| Net investment income (loss)B,C | .32 | .14 | .15 |
| Net realized and unrealized gain (loss) | .14D | 4.55 | (1.47) |
| Total from investment operations | .46 | 4.69 | (1.32) |
| Distributions from net investment income | (.29) | (.13) | (.14) |
| Distributions from net realized gain | (.63) | (.21) | (.04) |
| Total distributions | (.92) | (.34) | (.18) |
| Net asset value, end of period | $12.39 | $12.85 | $8.50 |
| Total ReturnE | 3.27% | 55.97% | (13.58)% |
| Ratios to Average Net AssetsC,F,G | | | |
| Expenses before reductions | .49% | .49% | .50%H,I |
| Expenses net of fee waivers, if any | .49% | .49% | .50%H,I |
| Expenses net of all reductions | .49% | .49% | .50%H,I |
| Net investment income (loss) | 2.44% | 1.22% | 2.11%H |
| Supplemental Data | | | |
| Net assets, end of period (000 omitted) | $7,499 | $2,527 | $905 |
| Portfolio turnover rateJ | 29% | 31% | 33%H |
A For the period June 28, 2019 (commencement of operations) through March 31, 2020.
B Calculated based on average shares outstanding during the period.
C Net investment income (loss) is affected by the timing of the declaration of dividends by any underlying mutual funds or exchange-traded funds (ETFs). Net investment income (loss) of any such underlying funds is not included in the Fund's net investment income (loss) ratio.
D The amount shown for a share outstanding does not correspond with the aggregate net gain (loss) on investments for the period due to the timing of sales and repurchases of shares in relation to fluctuating market values of the investments of the Fund.
E Total returns for periods of less than one year are not annualized.
F Fees and expenses of any underlying mutual funds or exchange-traded funds (ETFs) are not included in the Fund's expense ratio. The Fund indirectly bears its proportionate share of these expenses.
G Expense ratios reflect operating expenses of the class. Expenses before reductions do not reflect amounts reimbursed, waived, or reduced through arrangements with the investment adviser, brokerage services, or other offset arrangements, if applicable, and do not represent the amount paid by the class during periods when reimbursements, waivers or reductions occur.
H Annualized
I On certain classes, the size and fluctuation of net assets and expense amounts may cause ratios to differ from contractual rates.
J Amount does not include the portfolio activity of any underlying mutual funds or exchange-traded funds (ETFs).
See accompanying notes which are an integral part of the financial statements.
Notes to Financial Statements
For the period ended March 31, 2022
1. Organization.
Fidelity Advisor Freedom Income Fund, Fidelity Advisor Freedom 2005 Fund, Fidelity Advisor Freedom 2010 Fund, Fidelity Advisor Freedom 2015 Fund, Fidelity Advisor Freedom 2020 Fund, Fidelity Advisor Freedom 2025 Fund, Fidelity Advisor Freedom 2030 Fund, Fidelity Advisor Freedom 2035 Fund, Fidelity Advisor Freedom 2040 Fund, Fidelity Advisor Freedom 2045 Fund, Fidelity Advisor Freedom 2050 Fund, Fidelity Advisor Freedom 2055 Fund, Fidelity Advisor Freedom 2060 Fund and Fidelity Advisor Freedom 2065 Fund (the Funds) are funds of Fidelity Aberdeen Street Trust (the Trust). The Trust is registered under the Investment Company Act of 1940, as amended (the 1940 Act), as an open-end management investment company organized as a Delaware statutory trust. Each Fund is authorized to issue an unlimited number of shares. Each Fund offers Class A, Class M, Class C, Class I, Class Z and Class Z6 shares, each of which has equal rights as to assets and voting privileges. Each class has exclusive voting rights with respect to matters that affect that class. Effective June 21, 2021, Class C shares will automatically convert to Class A shares after a holding period of eight years from the initial date of purchase, with certain exceptions. Prior to June 21, 2021, Class C shares automatically converted to Class A shares after a holding period of ten years from the initial date of purchase, with certain exceptions.
2. Investments in Fidelity Central Funds.
Funds may invest in Fidelity Central Funds, which are open-end investment companies generally available only to other investment companies and accounts managed by the investment adviser and its affiliates. The Schedule of Investments lists any Fidelity Central Funds held as an investment as of period end, but does not include the underlying holdings of each Fidelity Central Fund. An investing fund indirectly bears its proportionate share of the expenses of the underlying Fidelity Central Funds.
Based on its investment objective, each Fidelity Central Fund may invest or participate in various investment vehicles or strategies that are similar to those of the investing fund. These strategies are consistent with the investment objectives of the investing fund and may involve certain economic risks which may cause a decline in value of each of the Fidelity Central Funds and thus a decline in the value of the investing fund.
| Fidelity Central Fund | Investment Manager | Investment Objective | Investment Practices | Expense Ratio(a) |
| Fidelity Money Market Central Funds | Fidelity Management & Research Company LLC (FMR) | Each fund seeks to obtain a high level of current income consistent with the preservation of capital and liquidity. | Short-term Investments | Less than .005% |
(a) Expenses expressed as a percentage of average net assets and are as of each underlying Central Fund's most recent annual or semi-annual shareholder report.
A complete unaudited list of holdings for each Fidelity Central Fund is available upon request or at the Securities and Exchange Commission website at www.sec.gov. In addition, the financial statements of the Fidelity Central Funds which contain the significant accounting policies (including investment valuation policies) of those funds, and are not covered by the Report of Independent Registered Public Accounting Firm, are available on the Securities and Exchange Commission website or upon request.
3. Significant Accounting Policies.
Each Fund is an investment company and applies the accounting and reporting guidance of the Financial Accounting Standards Board (FASB) Accounting Standards Codification Topic 946 Financial Services - Investment Companies. The financial statements have been prepared in conformity with accounting principles generally accepted in the United States of America (GAAP), which require management to make certain estimates and assumptions at the date of the financial statements. Actual results could differ from those estimates. Subsequent events, if any, through the date that the financial statements were issued have been evaluated in the preparation of the financial statements. Each Fund's Schedule of Investments lists any underlying mutual funds or exchange-traded funds (ETFs) but does not include the underlying holdings of these funds. The following summarizes the significant accounting policies of each Fund:
Investment Valuation. Investments are valued as of 4:00 p.m. Eastern time on the last calendar day of the period. Each Fund uses a third party pricing vendor approved by the Board of Trustees (the Board) to value its investments. The Board of Trustees (the Board) has delegated the day to day responsibility for the valuation of each Fund's investments to the Fair Value Committee (the Committee) established by the each Fund's investment adviser. In accordance with valuation policies and procedures approved by the Board, each Fund attempts to obtain prices from one or more third party pricing vendors or brokers to value its investments. When current market prices, quotations or currency exchange rates are not readily available or reliable, investments will be fair valued in good faith by the Committee, in accordance with procedures adopted by the Board. Factors used in determining fair value vary by investment type and may include market or investment specific events, changes in interest rates and credit quality. The frequency with which these procedures are used cannot be predicted and they may be utilized to a significant extent. The Committee oversees each Fund's valuation policies and procedures and reports to the Board on the Committee's activities and fair value determinations. The Board monitors the appropriateness of the procedures used in valuing each Fund's investments and ratifies the fair value determinations of the Committee. Each Fund categorizes the inputs to valuation techniques used to value its investments into a disclosure hierarchy consisting of three levels as shown below:
- Level 1 – unadjusted quoted prices in active markets for identical investments
- Level 2 – other significant observable inputs (including quoted prices for similar investments, interest rates, prepayment speeds, etc.)
- Level 3 – unobservable inputs (including the Fund's own assumptions based on the best information available)
Valuation techniques used to value each Fund's investments by major category are as follows. Investments in open-end mutual funds are valued at their closing net asset value (NAV) each business day and are categorized as Level 1 in the hierarchy. Debt securities, including restricted securities, are valued based on evaluated prices received from third party pricing vendors or from brokers who make markets in such securities. U.S. government and government agency obligations are valued by pricing vendors who utilize matrix pricing which considers yield or price of bonds of comparable quality, coupon, maturity and type or by broker-supplied prices. When independent prices are unavailable or unreliable, debt securities may be valued utilizing pricing methodologies which consider similar factors that would be used by third party pricing vendors. Debt securities are generally categorized as Level 2 in the hierarchy but may be Level 3 depending on the circumstances. The aggregate value of investments by input level as of March 31, 2022 is included at the end of each Fund's Schedule of Investments.
Futures contracts are valued at the settlement price established each day by the board of trade or exchange on which they are traded and are categorized as Level 1 in the hierarchy.
Investment Transactions and Income. For financial reporting purposes, the Funds' investment holdings and NAV include trades executed through the end of the last business day of the period. The NAV per share for processing shareholder transactions is calculated as of the close of business of the New York Stock Exchange (NYSE), normally 4:00 p.m. Eastern time and includes trades executed through the end of the prior business day. Gains and losses on securities sold are determined on the basis of identified cost. Income and capital gain distributions from any underlying mutual funds or exchange-traded funds (ETFs) are recorded on the ex-dividend date. Distributions from any underlying mutual funds or exchange-traded funds (ETFs) that are deemed to be return of capital are recorded as a reduction of cost of investments. Interest income is accrued as earned. Interest income includes coupon interest and amortization of premium and accretion of discount on debt securities as applicable.
Class Allocations and Expenses. Investment income, realized and unrealized capital gains and losses, common expenses of a fund, and certain fund-level expense reductions, if any, are allocated daily on a pro-rata basis to each class based on the relative net assets of each class to the total net assets of a fund. Each class differs with respect to transfer agent and distribution and service plan fees incurred, as applicable. Certain expense reductions may also differ by class, if applicable. For the reporting period, the allocated portion of income and expenses to each class as a percent of its average net assets may vary due to the timing of recording these transactions in relation to fluctuating net assets of the classes. Expenses directly attributable to a fund are charged to that fund. Expenses attributable to more than one fund are allocated among the respective funds on the basis of relative net assets or other appropriate methods. Expenses included in the accompanying financial statements reflect the expenses of that fund and do not include any expenses associated with any underlying mutual funds or exchange-traded funds. Although not included in a fund's expenses, a fund indirectly bears its proportionate share of these expenses through the net asset value of each underlying mutual fund or exchange-traded fund. Expense estimates are accrued in the period to which they relate and adjustments are made when actual amounts are known.
Income Tax Information and Distributions to Shareholders. Each year, each Fund intends to qualify as a regulated investment company under Subchapter M of the Internal Revenue Code, including distributing substantially all of its taxable income and realized gains. As a result, no provision for U.S. Federal income taxes is required. As of March 31, 2022, each Fund did not have any unrecognized tax benefits in the financial statements; nor is each Fund aware of any tax positions for which it is reasonably possible that the total amounts of unrecognized tax benefits will significantly change in the next twelve months. Each Fund files a U.S. federal tax return, in addition to state and local tax returns as required. Each Fund's federal income tax returns are subject to examination by the Internal Revenue Service (IRS) for a period of three fiscal years after they are filed. State and local tax returns may be subject to examination for an additional fiscal year depending on the jurisdiction.
Distributions are declared and recorded on the ex-dividend date. Income and capital gain distributions are declared separately for each class. Income and capital gain distributions are determined in accordance with income tax regulations, which may differ from GAAP. These differences resulted in distribution reclassifications.
Capital accounts within the financial statements are adjusted for permanent book-tax differences. These adjustments have no impact on net assets or the results of operations. Capital accounts are not adjusted for temporary book-tax differences which will reverse in a subsequent period.
Book-tax differences are primarily due to the short-term gain distributions from the underlying mutual funds or exchange-traded funds (ETFs), futures contracts and losses deferred due to wash sales and excise tax regulations.
As of period end, the cost and unrealized appreciation (depreciation) in securities, and derivatives if applicable, for federal income tax purposes were as follows for each Fund:
| | Tax cost | Gross unrealized appreciation | Gross unrealized depreciation | Net unrealized appreciation (depreciation) |
| Fidelity Advisor Freedom Income Fund | $206,653,485 | $11,584,178 | $(3,629,303) | $7,954,875 |
| Fidelity Advisor Freedom 2005 Fund | 136,270,072 | 9,462,806 | (2,283,088) | 7,179,718 |
| Fidelity Advisor Freedom 2010 Fund | 309,923,230 | 29,524,058 | (5,024,056) | 24,500,002 |
| Fidelity Advisor Freedom 2015 Fund | 639,607,230 | 88,934,634 | (11,061,677) | 77,872,957 |
| Fidelity Advisor Freedom 2020 Fund | 1,620,286,656 | 252,973,373 | (40,668,195) | 212,305,178 |
| Fidelity Advisor Freedom 2025 Fund | 2,589,757,425 | 419,937,770 | (79,369,208) | 340,568,562 |
| Fidelity Advisor Freedom 2030 Fund | 2,932,736,033 | 514,430,384 | (91,774,430) | 422,655,954 |
| Fidelity Advisor Freedom 2035 Fund | 2,505,141,460 | 525,074,325 | (77,912,438) | 447,161,887 |
| Fidelity Advisor Freedom 2040 Fund | 2,212,563,737 | 523,873,009 | (61,772,531) | 462,100,478 |
| Fidelity Advisor Freedom 2045 Fund | 1,588,015,868 | 332,132,773 | (45,913,946) | 286,218,827 |
| Fidelity Advisor Freedom 2050 Fund | 1,360,244,885 | 271,800,798 | (41,166,716) | 230,634,082 |
| Fidelity Advisor Freedom 2055 Fund | 887,228,157 | 126,491,553 | (29,671,885) | 96,819,668 |
| Fidelity Advisor Freedom 2060 Fund | 393,780,721 | 37,882,864 | (17,954,730) | 19,928,134 |
| Fidelity Advisor Freedom 2065 Fund | 56,459,518 | 2,343,794 | (4,570,337) | (2,226,543) |
The tax-based components of distributable earnings as of period end were as follows for each Fund:
| | Undistributed ordinary income | Undistributed long-term capital gain | Net unrealized appreciation (depreciation) on securities and other investments |
| Fidelity Advisor Freedom Income Fund | $292,814 | $4,499,177 | $7,954,875 |
| Fidelity Advisor Freedom 2005 Fund | 203,670 | 3,511,347 | 7,179,718 |
| Fidelity Advisor Freedom 2010 Fund | 465,734 | 10,770,602 | 24,500,002 |
| Fidelity Advisor Freedom 2015 Fund | 313,337 | 29,668,246 | 77,872,957 |
| Fidelity Advisor Freedom 2020 Fund | 356,351 | 87,737,845 | 212,305,178 |
| Fidelity Advisor Freedom 2025 Fund | 2,596,959 | 144,413,076 | 340,568,562 |
| Fidelity Advisor Freedom 2030 Fund | 3,841,287 | 174,801,253 | 422,655,954 |
| Fidelity Advisor Freedom 2035 Fund | 1,374,082 | 181,893,528 | 447,161,887 |
| Fidelity Advisor Freedom 2040 Fund | 3,377,716 | 186,962,899 | 462,100,478 |
| Fidelity Advisor Freedom 2045 Fund | 2,343,653 | 129,276,643 | 286,218,827 |
| Fidelity Advisor Freedom 2050 Fund | 1,531,320 | 108,989,094 | 230,634,082 |
| Fidelity Advisor Freedom 2055 Fund | 650,776 | 66,725,899 | 96,819,668 |
| Fidelity Advisor Freedom 2060 Fund | – | 26,692,223 | 19,928,134 |
| Fidelity Advisor Freedom 2065 Fund | 74,955 | 2,901,491 | (2,226,543) |
Certain of the Funds intend to elect to defer to the next fiscal year ordinary losses recognized during the period January 1, 2022 to March 31, 2022. Loss deferrals were as follows:
| | Ordinary losses |
| Fidelity Advisor Freedom 2025 Fund | $(91,662) |
| Fidelity Advisor Freedom 2030 Fund | (871,941) |
| Fidelity Advisor Freedom 2040 Fund | (4,056,970) |
| Fidelity Advisor Freedom 2045 Fund | (2,807,283) |
| Fidelity Advisor Freedom 2050 Fund | (2,359,277) |
| Fidelity Advisor Freedom 2055 Fund | (1,416,480) |
| Fidelity Advisor Freedom 2060 Fund | (205,864) |
| Fidelity Advisor Freedom 2065 Fund | (68,918) |
The tax character of distributions paid was as follows:
| March 31, 2022 | | | |
| | Ordinary Income | Long-term Capital Gains | Total |
| Fidelity Advisor Freedom Income Fund | $6,244,115 | $5,862,541 | $12,106,656 |
| Fidelity Advisor Freedom 2005 Fund | 4,006,677 | 6,937,758 | 10,944,435 |
| Fidelity Advisor Freedom 2010 Fund | 9,883,002 | 20,880,241 | 30,763,243 |
| Fidelity Advisor Freedom 2015 Fund | 23,924,330 | 54,881,168 | 78,805,498 |
| Fidelity Advisor Freedom 2020 Fund | 66,357,591 | 143,767,914 | 210,125,505 |
| Fidelity Advisor Freedom 2025 Fund | 108,457,493 | 173,190,709 | 281,648,202 |
| Fidelity Advisor Freedom 2030 Fund | 127,126,912 | 197,972,651 | 325,099,563 |
| Fidelity Advisor Freedom 2035 Fund | 116,371,097 | 168,243,379 | 284,614,476 |
| Fidelity Advisor Freedom 2040 Fund | 110,826,445 | 158,589,931 | 269,416,376 |
| Fidelity Advisor Freedom 2045 Fund | 77,318,795 | 105,952,517 | 183,271,312 |
| Fidelity Advisor Freedom 2050 Fund | 65,580,305 | 85,825,257 | 151,405,562 |
| Fidelity Advisor Freedom 2055 Fund | 39,738,348 | 50,914,240 | 90,652,588 |
| Fidelity Advisor Freedom 2060 Fund | 15,992,188 | 17,230,353 | 33,222,541 |
| Fidelity Advisor Freedom 2065 Fund | 1,682,611 | 991,490 | 2,674,101 |
| March 31, 2021 | | | |
| | Ordinary Income | Long-term Capital Gains | Total |
| Fidelity Advisor Freedom Income Fund | $4,903,338 | $3,547,237 | $8,450,575 |
| Fidelity Advisor Freedom 2005 Fund | 3,369,244 | 4,917,972 | 8,287,216 |
| Fidelity Advisor Freedom 2010 Fund | 7,507,443 | 15,161,626 | 22,669,069 |
| Fidelity Advisor Freedom 2015 Fund | 16,439,105 | 43,621,022 | 60,060,127 |
| Fidelity Advisor Freedom 2020 Fund | 38,910,146 | 112,065,521 | 150,975,667 |
| Fidelity Advisor Freedom 2025 Fund | 51,432,326 | 135,071,926 | 186,504,252 |
| Fidelity Advisor Freedom 2030 Fund | 56,769,090 | 154,929,170 | 211,698,260 |
| Fidelity Advisor Freedom 2035 Fund | 39,667,243 | 129,573,073 | 169,240,316 |
| Fidelity Advisor Freedom 2040 Fund | 31,324,708 | 116,224,945 | 147,549,653 |
| Fidelity Advisor Freedom 2045 Fund | 22,705,866 | 68,379,974 | 91,085,840 |
| Fidelity Advisor Freedom 2050 Fund | 19,302,645 | 54,990,396 | 74,293,041 |
| Fidelity Advisor Freedom 2055 Fund | 11,788,471 | 29,290,577 | 41,079,048 |
| Fidelity Advisor Freedom 2060 Fund | 4,272,907 | 8,207,529 | 12,480,436 |
| Fidelity Advisor Freedom 2065 Fund | 234,329 | 120,615 | 354,944 |
4. Derivative Instruments.
Risk Exposures and the Use of Derivative Instruments. The Funds' investment objective allows the Funds to enter into various types of derivative contracts, including futures contracts. Derivatives are investments whose value is primarily derived from underlying assets, indices or reference rates and may be transacted on an exchange or over-the-counter (OTC). Derivatives may involve a future commitment to buy or sell a specified asset based on specified terms, to exchange future cash flows at periodic intervals based on a notional principal amount, or for one party to make one or more payments upon the occurrence of specified events in exchange for periodic payments from the other party.
The Funds used derivatives to increase returns and to manage exposure to certain risks as defined below. The success of any strategy involving derivatives depends on analysis of numerous economic factors, and if the strategies for investment do not work as intended, the Funds may not achieve their objectives.
The Funds' use of derivatives increased or decreased their exposure to the following risk:
| Equity Risk | Equity risk relates to the fluctuations in the value of financial instruments as a result of changes in market prices (other than those arising from interest rate risk or foreign exchange risk), whether caused by factors specific to an individual investment, its issuer, or all factors affecting all instruments traded in a market or market segment.
|
The Funds are also exposed to additional risks from investing in derivatives, such as liquidity risk and counterparty credit risk. Liquidity risk is the risk that the Funds will be unable to close out the derivative in the open market in a timely manner. Counterparty credit risk is the risk that the counterparty will not be able to fulfill its obligation to the Funds. Counterparty credit risk related to exchange-traded futures contracts may be mitigated by the protection provided by the exchange on which they trade.
Investing in derivatives may involve greater risks than investing in the underlying assets directly and, to varying degrees, may involve risk of loss in excess of any initial investment and collateral received and amounts recognized in the Statement of Assets and Liabilities. In addition, there may be the risk that the change in value of the derivative contract does not correspond to the change in value of the underlying instrument.
Futures Contracts. A futures contract is an agreement between two parties to buy or sell a specified underlying instrument for a fixed price at a specified future date. The Funds used futures contracts to manage their exposure to the stock market.
Upon entering into a futures contract, a fund is required to deposit either cash or securities (initial margin) with a clearing broker in an amount equal to a certain percentage of the face value of the contract. Futures contracts are marked-to-market daily and subsequent daily payments (variation margin) are made or received by a fund depending on the daily fluctuations in the value of the futures contracts and are recorded as unrealized appreciation or (depreciation). This receivable and/or payable, if any, is included in daily variation margin on futures contracts in the Statement of Assets and Liabilities. Realized gain or (loss) is recorded upon the expiration or closing of a futures contract. The net realized gain (loss) and change in net unrealized appreciation (depreciation) on futures contracts during the period is presented in the Statement of Operations.
Any open futures contracts at period end are presented in the Schedule of Investments under the caption "Futures Contracts". The notional amount at value reflects each contract's exposure to the underlying instrument or index at period end and is representative of volume of activity during the period, except for Fidelity Advisor Freedom 2010 Fund. Securities deposited to meet initial margin requirements are identified in the Schedule of Investments.
5. Purchases and Sales of Investments.
Purchases and sales of securities, other than short-term securities and in-kind transactions, as applicable, are noted in the table below.
| | Purchases ($) | Sales ($) |
| Fidelity Advisor Freedom Income Fund | 111,461,133 | 124,240,456 |
| Fidelity Advisor Freedom 2005 Fund | 69,895,814 | 81,705,808 |
| Fidelity Advisor Freedom 2010 Fund | 136,063,252 | 157,358,178 |
| Fidelity Advisor Freedom 2015 Fund | 279,007,107 | 362,605,672 |
| Fidelity Advisor Freedom 2020 Fund | 705,648,096 | 869,014,320 |
| Fidelity Advisor Freedom 2025 Fund | 1,139,899,077 | 1,121,183,743 |
| Fidelity Advisor Freedom 2030 Fund | 1,247,894,880 | 1,093,897,887 |
| Fidelity Advisor Freedom 2035 Fund | 1,061,086,997 | 842,435,819 |
| Fidelity Advisor Freedom 2040 Fund | 935,000,530 | 722,757,891 |
| Fidelity Advisor Freedom 2045 Fund | 693,339,804 | 520,205,846 |
| Fidelity Advisor Freedom 2050 Fund | 599,627,140 | 428,231,432 |
| Fidelity Advisor Freedom 2055 Fund | 404,469,972 | 278,292,281 |
| Fidelity Advisor Freedom 2060 Fund | 209,052,510 | 109,911,003 |
| Fidelity Advisor Freedom 2065 Fund | 44,675,537 | 11,555,084 |
6. Fees and Other Transactions with Affiliates.
Management Fee and Expense Contract. Fidelity Management & Research Company LLC (the investment adviser) and its affiliates provide the Funds with investment management related services. Under the management contract, each Class of each Fund pays a monthly management fee that is set at an annual rate by referring to each Fund's target date, indicated by its name, such that the management fee rate applicable to each Class of each Fund is reduced as the fund approaches, and then passes, its target date. In addition, under the management contract, the investment adviser pays all ordinary operating expenses of each Fund, except distribution and service plan fees, fees and expenses of the independent Trustees, and certain miscellaneous expenses such as proxy and shareholder meeting expenses. For each Fund, with the exception of Fidelity Advisor Freedom 2065 Fund, the management fee is reduced by an amount equal to the fees and expenses paid by each Fund to the independent Trustees. For the reporting period, the total annual management fee rate for each Class of each Fund was as follows:
| | Annual % of Class-Level Average Net Assets (Classes A, M, C, I) | Annual % of Class-Level Average Net Assets
(Classes Z, Z6) |
| Fidelity Advisor Freedom Income Fund | .465% | .415% |
| Fidelity Advisor Freedom 2005 Fund | .465% | .415% |
| Fidelity Advisor Freedom 2010 Fund | .499% | .441% |
| Fidelity Advisor Freedom 2015 Fund | .542% | .475% |
| Fidelity Advisor Freedom 2020 Fund | .584% | .510% |
| Fidelity Advisor Freedom 2025 Fund | .627% | .545% |
| Fidelity Advisor Freedom 2030 Fund | .669% | .580% |
| Fidelity Advisor Freedom 2035 Fund | .712% | .615% |
| Fidelity Advisor Freedom 2040 Fund | .746% | .643% |
| Fidelity Advisor Freedom 2045 Fund | .746% | .643% |
| Fidelity Advisor Freedom 2050 Fund | .746% | .643% |
| Fidelity Advisor Freedom 2055 Fund | .746% | .643% |
| Fidelity Advisor Freedom 2060 Fund | .746% | .643% |
| Fidelity Advisor Freedom 2065 Fund | .746% | .643% |
Under the expense contract, the investment adviser pays class-level expenses for Class Z6 of each Fund as necessary so that Class Z6 total expenses do not exceed certain amounts of Class Z6 average net assets on an annual basis with certain exceptions, as noted in the following table:
| | Annual % of Class-Level Average Net Assets (Class Z6) |
| Fidelity Advisor Freedom Income Fund | .365% |
| Fidelity Advisor Freedom 2005 Fund | .365% |
| Fidelity Advisor Freedom 2010 Fund | .381% |
| Fidelity Advisor Freedom 2015 Fund | .400% |
| Fidelity Advisor Freedom 2020 Fund | .419% |
| Fidelity Advisor Freedom 2025 Fund | .439% |
| Fidelity Advisor Freedom 2030 Fund | .458% |
| Fidelity Advisor Freedom 2035 Fund | .477% |
| Fidelity Advisor Freedom 2040 Fund | .493% |
| Fidelity Advisor Freedom 2045 Fund | .493% |
| Fidelity Advisor Freedom 2050 Fund | .493% |
| Fidelity Advisor Freedom 2055 Fund | .493% |
| Fidelity Advisor Freedom 2060 Fund | .493% |
| Fidelity Advisor Freedom 2065 Fund | .493% |
Distribution and Service Plan Fees. In accordance with Rule 12b-1 of the 1940 Act, each Fund has adopted separate Distribution and Service Plans for each class of shares. Certain classes pay Fidelity Distributors Company LLC (FDC), an affiliate of the investment adviser, separate Distribution and Service Fees, each of which is based on an annual percentage of each class' average net assets. In addition, FDC may pay financial intermediaries for selling shares of each Fund and providing shareholder support services. For the period, the Distribution and Service Fee rates, total fees and amounts retained by FDC were as follows:
| | Distribution Fee | Service Fee | Total Fees | Retained by FDC |
| Fidelity Advisor Freedom Income Fund | | | | |
| Class A | -% | .25% | $194,129 | $8,745 |
| Class M | .25% | .25% | 175,100 | 145 |
| Class C | .75% | .25% | 75,991 | 13,531 |
| | | | $445,220 | $22,421 |
| Fidelity Advisor Freedom 2005 Fund | | | | |
| Class A | -% | .25% | $177,444 | $5,056 |
| Class M | .25% | .25% | 108,046 | 643 |
| Class C | .75% | .25% | 12,752 | 941 |
| | | | $298,242 | $6,640 |
| Fidelity Advisor Freedom 2010 Fund | | | | |
| Class A | -% | .25% | $386,118 | $7,842 |
| Class M | .25% | .25% | 334,652 | 3,336 |
| Class C | .75% | .25% | 50,657 | 6,756 |
| | | | $771,427 | $17,934 |
| Fidelity Advisor Freedom 2015 Fund | | | | |
| Class A | -% | .25% | $909,152 | $20,041 |
| Class M | .25% | .25% | 633,684 | 3,308 |
| Class C | .75% | .25% | 161,197 | 16,060 |
| | | | $1,704,033 | $39,409 |
| Fidelity Advisor Freedom 2020 Fund | | | | |
| Class A | -% | .25% | $2,111,937 | $44,191 |
| Class M | .25% | .25% | 1,495,484 | 7,022 |
| Class C | .75% | .25% | 436,677 | 53,577 |
| | | | $4,044,098 | $104,790 |
| Fidelity Advisor Freedom 2025 Fund | | | | |
| Class A | -% | .25% | $3,172,864 | $102,217 |
| Class M | .25% | .25% | 2,186,860 | 6,287 |
| Class C | .75% | .25% | 540,323 | 88,075 |
| | | | $5,900,047 | $196,579 |
| Fidelity Advisor Freedom 2030 Fund | | | | |
| Class A | -% | .25% | $3,339,585 | $86,598 |
| Class M | .25% | .25% | 2,563,808 | 14,559 |
| Class C | .75% | .25% | 661,495 | 92,522 |
| | | | $6,564,888 | $193,679 |
| Fidelity Advisor Freedom 2035 Fund | | | | |
| Class A | -% | .25% | $2,893,132 | $75,062 |
| Class M | .25% | .25% | 2,195,653 | 6,955 |
| Class C | .75% | .25% | 501,009 | 83,357 |
| | | | $5,589,794 | $165,374 |
| Fidelity Advisor Freedom 2040 Fund | | | | |
| Class A | -% | .25% | $2,568,634 | $53,696 |
| Class M | .25% | .25% | 2,076,712 | 8,908 |
| Class C | .75% | .25% | 497,623 | 58,871 |
| | | | $5,142,969 | $121,475 |
| Fidelity Advisor Freedom 2045 Fund | | | | |
| Class A | -% | .25% | $1,631,762 | $40,430 |
| Class M | .25% | .25% | 1,346,056 | 4,122 |
| Class C | .75% | .25% | 317,832 | 46,471 |
| | | | $3,295,650 | $91,023 |
| Fidelity Advisor Freedom 2050 Fund | | | | |
| Class A | -% | .25% | $1,322,496 | $31,551 |
| Class M | .25% | .25% | 1,066,094 | 4,739 |
| Class C | .75% | .25% | 321,859 | 55,018 |
| | | | $2,710,449 | $91,308 |
| Fidelity Advisor Freedom 2055 Fund | | | | |
| Class A | -% | .25% | $749,755 | $16,969 |
| Class M | .25% | .25% | 614,252 | 1,323 |
| Class C | .75% | .25% | 169,769 | 29,381 |
| | | | $1,533,776 | $47,673 |
| Fidelity Advisor Freedom 2060 Fund | | | | |
| Class A | -% | .25% | $298,274 | $7,396 |
| Class M | .25% | .25% | 232,948 | 279 |
| Class C | .75% | .25% | 80,867 | 21,728 |
| | | | $612,089 | $29,403 |
| Fidelity Advisor Freedom 2065 Fund | | | | |
| Class A | -% | .25% | $34,310 | $734 |
| Class M | .25% | .25% | 14,144 | 302 |
| Class C | .75% | .25% | 5,982 | 4,865 |
| | | | $54,436 | $5,901 |
Sales Load. FDC may receive a front-end sales charge of up to 5.75% for selling Class A shares and 3.50% for selling Class M shares, some of which is paid to financial intermediaries for selling shares of each Fund. Depending on the holding period, FDC may receive contingent deferred sales charges levied on Class A, Class M and Class C redemptions. The deferred sales charges are 1.00% for Class C shares, 1.00% for certain purchases of Class A shares and .25% for certain purchases of Class M shares.
For the period, sales charge amounts retained by FDC were as follows:
| | Retained by FDC |
| Fidelity Advisor Freedom Income Fund | |
| Class A | $7,405 |
| Class M | 804 |
| Class C(a) | 505 |
| | $8,714 |
| Fidelity Advisor Freedom 2005 Fund | |
| Class A | $2,922 |
| Class M | 225 |
| Class C(a) | 22 |
| | $3,169 |
| Fidelity Advisor Freedom 2010 Fund | |
| Class A | $5,185 |
| Class M | 1,169 |
| Class C(a) | 95 |
| | $6,449 |
| Fidelity Advisor Freedom 2015 Fund | |
| Class A | $6,765 |
| Class M | 1,857 |
| Class C(a) | 1,271 |
| | $9,893 |
| Fidelity Advisor Freedom 2020 Fund | |
| Class A | $28,634 |
| Class M | 8,922 |
| Class C(a) | 1,872 |
| | $39,428 |
| Fidelity Advisor Freedom 2025 Fund | |
| Class A | $64,520 |
| Class M | 18,142 |
| Class C(a) | 4,456 |
| | $87,118 |
| Fidelity Advisor Freedom 2030 Fund | |
| Class A | $90,262 |
| Class M | 20,662 |
| Class C(a) | 3,266 |
| | $114,190 |
| Fidelity Advisor Freedom 2035 Fund | |
| Class A | $100,606 |
| Class M | 21,286 |
| Class C(a) | 4,729 |
| | $126,621 |
| Fidelity Advisor Freedom 2040 Fund | |
| Class A | $86,640 |
| Class M | 18,216 |
| Class C(a) | 4,507 |
| | $109,363 |
| Fidelity Advisor Freedom 2045 Fund | |
| Class A | $72,015 |
| Class M | 13,477 |
| Class C(a) | 3,194 |
| | $88,686 |
| Fidelity Advisor Freedom 2050 Fund | |
| Class A | $74,886 |
| Class M | 11,647 |
| Class C(a) | 3,006 |
| | $89,539 |
| Fidelity Advisor Freedom 2055 Fund | |
| Class A | $47,632 |
| Class M | 7,920 |
| Class C(a) | 2,458 |
| | $58,010 |
| Fidelity Advisor Freedom 2060 Fund | |
| Class A | $34,951 |
| Class M | 4,733 |
| Class C(a) | 1,191 |
| | $40,875 |
| Fidelity Advisor Freedom 2065 Fund | |
| Class A | $15,541 |
| Class M | 1,230 |
| Class C(a) | 112 |
| | $16,883 |
(a) When Class C shares are initially sold, FDC pays commissions from its own resources to financial intermediaries through which the sales are made.
Interfund Trades. Funds may purchase from or sell securities to other Fidelity Funds under procedures adopted by the Board. The procedures have been designed to ensure these interfund trades are executed in accordance with Rule 17a-7 of the 1940 Act. Any interfund trades are included within the respective purchases and sales amounts shown in the Purchases and Sales of Investments note. During the period there were no interfund trades.
Reallocation of Underlying Fund Investments. During the period, the investment adviser reallocated investments of the Funds. This involved taxable redemptions of the Funds' interest in Fidelity Series Inflation-Protected Bond Index Fund, ("Underlying Fund") for investments and cash and non-taxable exchanges of those investments and cash for shares of Fidelity Series 0-5 Year Inflation-Protected Bond Index Fund and Fidelity Series 5+ Year Inflation-Protected Bond Index Fund which are affiliated investment companies managed by FMR. Net realized gain (loss) on the redemptions of the Underlying Fund in connection with the reallocation is included in the accompanying Statements of Operations as "Net realized gain (loss) on Affiliated issuers."
Details of these transactions with the net related gain (loss) for the Funds are presented in the accompanying table:
| | Value of Investments and Cash reallocated ($) | Net realized Gain (Loss) on redemptions of Underlying Fund ($) |
| Fidelity Advisor Freedom Income Fund | 18,957,388 | 1,694,537 |
| Fidelity Advisor Freedom 2005 Fund | 11,474,844 | 1,085,981 |
| Fidelity Advisor Freedom 2010 Fund | 23,030,177 | 2,201,485 |
| Fidelity Advisor Freedom 2015 Fund | 43,467,087 | 4,111,441 |
| Fidelity Advisor Freedom 2020 Fund | 91,893,601 | 8,042,241 |
| Fidelity Advisor Freedom 2025 Fund | 124,166,517 | 9,056,074 |
| Fidelity Advisor Freedom 2030 Fund | 109,994,429 | 6,403,309 |
| Fidelity Advisor Freedom 2035 Fund | 27,351,772 | 1,779,843 |
| Fidelity Advisor Freedom 2040 Fund | 30,309,863 | 2,126,636 |
| Fidelity Advisor Freedom 2045 Fund | 21,195,409 | 1,418,194 |
| Fidelity Advisor Freedom 2050 Fund | 17,928,790 | 1,128,509 |
| Fidelity Advisor Freedom 2055 Fund | 10,996,868 | 656,557 |
| Fidelity Advisor Freedom 2060 Fund | 4,427,881 | 225,709 |
| Fidelity Advisor Freedom 2065 Fund | 458,298 | 12 ,635 |
7. Expense Reductions.
Through arrangements with each applicable Fund's custodian, credits realized as a result of certain uninvested cash balances were used to reduce each applicable Fund's or class' expenses. All of the applicable expense reductions are noted in the table below.
| | Custodian credits |
| Fidelity Advisor Freedom Income Fund | $7 |
| Fidelity Advisor Freedom 2005 Fund | 8 |
| Fidelity Advisor Freedom 2010 Fund | 8 |
| Fidelity Advisor Freedom 2015 Fund | 6 |
| Fidelity Advisor Freedom 2020 Fund | 4 |
| Fidelity Advisor Freedom 2025 Fund | 2 |
| Fidelity Advisor Freedom 2030 Fund | 2 |
| Fidelity Advisor Freedom 2035 Fund | 3 |
| Fidelity Advisor Freedom 2040 Fund | 4 |
| Fidelity Advisor Freedom 2045 Fund | 6 |
| Fidelity Advisor Freedom 2050 Fund | 8 |
| Fidelity Advisor Freedom 2055 Fund | 6 |
| Fidelity Advisor Freedom 2060 Fund | 2 |
8. Distributions to Shareholders.
Distributions to shareholders of each class were as follows:
| | Year ended
March 31, 2022 | Year ended
March 31, 2021 |
| Fidelity Advisor Freedom Income Fund | | |
| Distributions to shareholders | | |
| Class A | $3,806,285 | $2,503,490 |
| Class M | 1,680,370 | 1,249,086 |
| Class C | 354,845 | 240,051 |
| Class I | 4,626,656 | 3,329,671 |
| Class Z | 432,446 | 263,743 |
| Class Z6 | 1,206,054 | 864,534 |
| Total | $12,106,656 | $8,450,575 |
| Fidelity Advisor Freedom 2005 Fund | | |
| Distributions to shareholders | | |
| Class A | $4,893,849 | $3,910,338 |
| Class M | 1,453,459 | 1,097,741 |
| Class C | 74,934 | 74,180 |
| Class I | 3,644,777 | 2,832,110 |
| Class Z | 455,321 | 183,519 |
| Class Z6 | 422,095 | 189,328 |
| Total | $10,944,435 | $8,287,216 |
| Fidelity Advisor Freedom 2010 Fund | | |
| Distributions to shareholders | | |
| Class A | $12,942,091 | $10,081,398 |
| Class M | 5,540,074 | 3,927,446 |
| Class C | 425,333 | 422,688 |
| Class I | 9,711,835 | 7,177,521 |
| Class Z | 685,779 | 403,627 |
| Class Z6 | 1,458,131 | 656,389 |
| Total | $30,763,243 | $22,669,069 |
| Fidelity Advisor Freedom 2015 Fund | | |
| Distributions to shareholders | | |
| Class A | $35,089,484 | $27,672,273 |
| Class M | 12,061,077 | 9,358,350 |
| Class C | 1,554,843 | 1,416,945 |
| Class I | 24,540,604 | 18,797,442 |
| Class Z | 2,399,529 | 1,331,324 |
| Class Z6 | 3,159,961 | 1,483,793 |
| Total | $78,805,498 | $60,060,127 |
| Fidelity Advisor Freedom 2020 Fund | | |
| Distributions to shareholders | | |
| Class A | $86,282,220 | $63,719,350 |
| Class M | 29,939,249 | 21,269,262 |
| Class C | 4,479,288 | 3,397,942 |
| Class I | 73,486,234 | 53,936,603 |
| Class Z | 5,184,261 | 2,984,791 |
| Class Z6 | 10,754,253 | 5,667,719 |
| Total | $210,125,505 | $150,975,667 |
| Fidelity Advisor Freedom 2025 Fund | | |
| Distributions to shareholders | | |
| Class A | $112,906,269 | $77,221,818 |
| Class M | 38,051,486 | 25,434,147 |
| Class C | 4,740,698 | 3,452,745 |
| Class I | 104,035,173 | 69,881,034 |
| Class Z | 7,072,309 | 3,230,478 |
| Class Z6 | 14,842,267 | 7,284,030 |
| Total | $281,648,202 | $186,504,252 |
| Fidelity Advisor Freedom 2030 Fund | | |
| Distributions to shareholders | | |
| Class A | $121,306,750 | $82,817,767 |
| Class M | 45,921,993 | 30,496,305 |
| Class C | 5,999,786 | 4,109,512 |
| Class I | 125,504,164 | 82,119,171 |
| Class Z | 7,542,987 | 3,521,225 |
| Class Z6 | 18,823,883 | 8,634,280 |
| Total | $325,099,563 | $211,698,260 |
| Fidelity Advisor Freedom 2035 Fund | | |
| Distributions to shareholders | | |
| Class A | $105,176,629 | $65,732,045 |
| Class M | 39,581,594 | 24,549,717 |
| Class C | 4,598,978 | 2,900,159 |
| Class I | 111,471,958 | 67,093,888 |
| Class Z | 6,618,867 | 2,607,386 |
| Class Z6 | 17,166,450 | 6,357,121 |
| Total | $284,614,476 | $169,240,316 |
| Fidelity Advisor Freedom 2040 Fund | | |
| Distributions to shareholders | | |
| Class A | $97,724,975 | $56,937,241 |
| Class M | 38,870,682 | 22,132,767 |
| Class C | 4,823,072 | 3,098,014 |
| Class I | 106,118,735 | 57,743,231 |
| Class Z | 5,700,590 | 1,941,461 |
| Class Z6 | 16,178,322 | 5,696,939 |
| Total | $269,416,376 | $147,549,653 |
| Fidelity Advisor Freedom 2045 Fund | | |
| Distributions to shareholders | | |
| Class A | $60,682,638 | $32,635,427 |
| Class M | 24,631,095 | 12,723,832 |
| Class C | 2,953,949 | 1,535,354 |
| Class I | 77,811,429 | 38,645,051 |
| Class Z | 4,253,210 | 1,446,099 |
| Class Z6 | 12,938,991 | 4,100,077 |
| Total | $183,271,312 | $91,085,840 |
| Fidelity Advisor Freedom 2050 Fund | | |
| Distributions to shareholders | | |
| Class A | $47,964,071 | $25,881,495 |
| Class M | 19,027,598 | 10,022,376 |
| Class C | 2,876,945 | 1,485,553 |
| Class I | 67,433,812 | 32,688,315 |
| Class Z | 3,195,028 | 1,005,359 |
| Class Z6 | 10,908,108 | 3,209,943 |
| Total | $151,405,562 | $74,293,041 |
| Fidelity Advisor Freedom 2055 Fund | | |
| Distributions to shareholders | | |
| Class A | $26,515,169 | $13,547,758 |
| Class M | 10,661,468 | 5,026,455 |
| Class C | 1,450,264 | 650,918 |
| Class I | 43,134,192 | 19,340,100 |
| Class Z | 1,954,846 | 559,593 |
| Class Z6 | 6,936,649 | 1,954,224 |
| Total | $90,652,588 | $41,079,048 |
| Fidelity Advisor Freedom 2060 Fund | | |
| Distributions to shareholders | | |
| Class A | $9,707,065 | $4,221,456 |
| Class M | 3,681,352 | 1,378,867 |
| Class C | 624,766 | 232,094 |
| Class I | 15,853,518 | 5,923,577 |
| Class Z | 749,134 | 151,102 |
| Class Z6 | 2,606,706 | 573,340 |
| Total | $33,222,541 | $12,480,436 |
| Fidelity Advisor Freedom 2065 Fund | | |
| Distributions to shareholders | | |
| Class A | $910,579 | $136,992 |
| Class M | 168,886 | 17,678 |
| Class C | 34,691 | 5,872 |
| Class I | 1,189,352 | 156,022 |
| Class Z | 66,373 | 9,465 |
| Class Z6 | 304,220 | 28,915 |
| Total | $2,674,101 | $354,944 |
9. Share Transactions.
Share transactions for each class were as follows and may contain in-kind transactions, automatic conversions between classes or exchanges between affiliated funds:
| | Shares | Shares | Dollars | Dollars |
| | Year ended March 31, 2022 | Year ended March 31, 2021 | Year ended March 31, 2022 | Year ended March 31, 2021 |
| Fidelity Advisor Freedom Income Fund | | | | |
| Class A | | | | |
| Shares sold | 1,795,386 | 2,235,730 | $20,496,306 | $25,345,484 |
| Reinvestment of distributions | 323,582 | 217,623 | 3,695,390 | 2,438,663 |
| Shares redeemed | (1,558,349) | (1,903,413) | (17,817,349) | (21,519,775) |
| Net increase (decrease) | 560,619 | 549,940 | $6,374,347 | $6,264,372 |
| Class M | | | | |
| Shares sold | 603,361 | 704,662 | $6,895,580 | $7,903,432 |
| Reinvestment of distributions | 146,308 | 110,920 | 1,667,714 | 1,238,714 |
| Shares redeemed | (930,849) | (1,123,480) | (10,598,517) | (12,702,451) |
| Net increase (decrease) | (181,180) | (307,898) | $(2,035,223) | $(3,560,305) |
| Class C | | | | |
| Shares sold | 144,668 | 139,160 | $1,652,517 | $1,573,537 |
| Reinvestment of distributions | 28,922 | 20,169 | 328,255 | 224,976 |
| Shares redeemed | (300,660) | (193,677) | (3,412,688) | (2,170,624) |
| Net increase (decrease) | (127,070) | (34,348) | $(1,431,916) | $(372,111) |
| Class I | | | | |
| Shares sold | 2,184,795 | 2,421,023 | $25,184,849 | $27,237,670 |
| Reinvestment of distributions | 394,038 | 290,427 | 4,517,010 | 3,256,700 |
| Shares redeemed | (2,868,350) | (2,997,761) | (32,821,613) | (34,042,397) |
| Net increase (decrease) | (289,517) | (286,311) | $(3,119,754) | $(3,548,027) |
| Class Z | | | | |
| Shares sold | 303,202 | 821,174 | $3,472,111 | $9,249,865 |
| Reinvestment of distributions | 23,601 | 15,816 | 270,452 | 178,750 |
| Shares redeemed | (450,073) | (359,725) | (5,163,944) | (4,110,384) |
| Net increase (decrease) | (123,270) | 477,265 | $(1,421,381) | $5,318,231 |
| Class Z6 | | | | |
| Shares sold | 686,975 | 745,826 | $7,859,412 | $8,408,823 |
| Reinvestment of distributions | 105,032 | 77,081 | 1,202,861 | 864,533 |
| Shares redeemed | (1,551,252) | (793,697) | (17,703,550) | (8,838,388) |
| Net increase (decrease) | (759,245) | 29,210 | $(8,641,277) | $434,968 |
| Fidelity Advisor Freedom 2005 Fund | | | | |
| Class A | | | | |
| Shares sold | 917,559 | 1,139,535 | $10,689,695 | $13,359,648 |
| Reinvestment of distributions | 402,523 | 327,516 | 4,706,048 | 3,782,165 |
| Shares redeemed | (1,885,203) | (1,951,283) | (22,348,244) | (23,046,624) |
| Net increase (decrease) | (565,121) | (484,232) | $(6,952,501) | $(5,904,811) |
| Class M | | | | |
| Shares sold | 303,051 | 466,737 | $3,553,028 | $5,449,495 |
| Reinvestment of distributions | 124,303 | 95,054 | 1,450,918 | 1,096,045 |
| Shares redeemed | (354,805) | (831,095) | (4,217,343) | (9,660,283) |
| Net increase (decrease) | 72,549 | (269,304) | $786,603 | $(3,114,743) |
| Class C | | | | |
| Shares sold | 17,982 | 11,942 | $214,355 | $139,247 |
| Reinvestment of distributions | 6,335 | 5,961 | 74,310 | 68,876 |
| Shares redeemed | (42,957) | (55,734) | (511,116) | (664,158) |
| Net increase (decrease) | (18,640) | (37,831) | $(222,451) | $(456,035) |
| Class I | | | | |
| Shares sold | 1,077,635 | 1,700,893 | $12,846,260 | $20,150,422 |
| Reinvestment of distributions | 309,159 | 241,860 | 3,641,515 | 2,824,652 |
| Shares redeemed | (1,816,463) | (1,685,295) | (21,805,618) | (20,053,782) |
| Net increase (decrease) | (429,669) | 257,458 | $(5,317,843) | $2,921,292 |
| Class Z | | | | |
| Shares sold | 344,373 | 125,383 | $4,116,478 | $1,477,284 |
| Reinvestment of distributions | 36,151 | 15,091 | 421,535 | 175,290 |
| Shares redeemed | (191,088) | (61,170) | (2,196,417) | (726,061) |
| Net increase (decrease) | 189,436 | 79,304 | $2,341,596 | $926,513 |
| Class Z6 | | | | |
| Shares sold | 382,829 | 177,935 | $4,551,187 | $2,104,847 |
| Reinvestment of distributions | 35,915 | 16,185 | 420,149 | 189,328 |
| Shares redeemed | (269,751) | (71,513) | (3,152,643) | (849,190) |
| Net increase (decrease) | 148,993 | 122,607 | $1,818,693 | $1,444,985 |
| Fidelity Advisor Freedom 2010 Fund | | | | |
| Class A | | | | |
| Shares sold | 1,220,705 | 1,599,587 | $14,988,785 | $19,312,106 |
| Reinvestment of distributions | 1,046,478 | 838,641 | 12,728,244 | 9,924,521 |
| Shares redeemed | (3,409,250) | (4,181,719) | (42,218,089) | (50,618,551) |
| Net increase (decrease) | (1,142,067) | (1,743,491) | $(14,501,060) | $(21,381,924) |
| Class M | | | | |
| Shares sold | 583,291 | 815,263 | $7,148,676 | $9,831,807 |
| Reinvestment of distributions | 456,780 | 332,260 | 5,523,061 | 3,915,861 |
| Shares redeemed | (1,303,599) | (1,489,485) | (16,022,718) | (17,897,383) |
| Net increase (decrease) | (263,528) | (341,962) | $(3,350,981) | $(4,149,715) |
| Class C | | | | |
| Shares sold | 132,362 | 29,489 | $1,627,993 | $356,202 |
| Reinvestment of distributions | 35,194 | 35,634 | 424,926 | 415,816 |
| Shares redeemed | (312,188) | (305,795) | (3,838,821) | (3,696,596) |
| Net increase (decrease) | (144,632) | (240,672) | $(1,785,902) | $(2,924,578) |
| Class I | | | | |
| Shares sold | 1,971,932 | 1,911,784 | $24,458,666 | $23,185,948 |
| Reinvestment of distributions | 775,627 | 589,296 | 9,461,412 | 7,016,916 |
| Shares redeemed | (2,862,733) | (3,148,979) | (35,595,288) | (38,451,422) |
| Net increase (decrease) | (115,174) | (647,899) | $(1,675,210) | $(8,248,558) |
| Class Z | | | | |
| Shares sold | 245,313 | 125,517 | $2,995,729 | $1,506,454 |
| Reinvestment of distributions | 56,196 | 33,696 | 680,413 | 399,265 |
| Shares redeemed | (74,233) | (176,541) | (899,596) | (2,150,314) |
| Net increase (decrease) | 227,276 | (17,328) | $2,776,546 | $(244,595) |
| Class Z6 | | | | |
| Shares sold | 941,904 | 461,188 | $11,610,636 | $5,669,947 |
| Reinvestment of distributions | 120,149 | 55,059 | 1,456,509 | 656,389 |
| Shares redeemed | (319,341) | (268,301) | (3,947,501) | (3,214,726) |
| Net increase (decrease) | 742,712 | 247,946 | $9,119,644 | $3,111,610 |
| Fidelity Advisor Freedom 2015 Fund | | | | |
| Class A | | | | |
| Shares sold | 2,601,184 | 3,502,330 | $32,154,482 | $42,131,861 |
| Reinvestment of distributions | 2,850,580 | 2,358,486 | 34,696,319 | 27,384,704 |
| Shares redeemed | (8,395,329) | (8,885,582) | (104,109,568) | (106,445,525) |
| Net increase (decrease) | (2,943,565) | (3,024,766) | $(37,258,767) | $(36,928,960) |
| Class M | | | | |
| Shares sold | 966,016 | 1,024,650 | $11,918,447 | $12,292,161 |
| Reinvestment of distributions | 991,965 | 805,594 | 12,028,176 | 9,324,100 |
| Shares redeemed | (3,146,462) | (2,727,467) | (38,456,317) | (32,664,160) |
| Net increase (decrease) | (1,188,481) | (897,223) | $(14,509,694) | $(11,047,899) |
| Class C | | | | |
| Shares sold | 92,208 | 171,966 | $1,131,540 | $2,062,866 |
| Reinvestment of distributions | 128,707 | 122,932 | 1,554,795 | 1,411,622 |
| Shares redeemed | (764,572) | (534,156) | (9,396,197) | (6,429,579) |
| Net increase (decrease) | (543,657) | (239,258) | $(6,709,862) | $(2,955,091) |
| Class I | | | | |
| Shares sold | 3,291,469 | 3,628,024 | $41,233,735 | $43,873,324 |
| Reinvestment of distributions | 1,970,148 | 1,581,589 | 24,193,367 | 18,547,980 |
| Shares redeemed | (6,069,268) | (7,072,887) | (76,008,489) | (85,706,324) |
| Net increase (decrease) | (807,651) | (1,863,274) | $(10,581,387) | $(23,285,020) |
| Class Z | | | | |
| Shares sold | 773,674 | 507,928 | $9,535,464 | $6,111,056 |
| Reinvestment of distributions | 189,716 | 109,834 | 2,306,888 | 1,286,341 |
| Shares redeemed | (496,294) | (467,841) | (5,964,023) | (5,484,948) |
| Net increase (decrease) | 467,096 | 149,921 | $5,878,329 | $1,912,449 |
| Class Z6 | | | | |
| Shares sold | 1,269,246 | 1,604,770 | $15,692,340 | $19,826,691 |
| Reinvestment of distributions | 255,952 | 123,912 | 3,123,788 | 1,467,914 |
| Shares redeemed | (768,451) | (929,525) | (9,559,229) | (11,459,501) |
| Net increase (decrease) | 756,747 | 799,157 | $9,256,899 | $9,835,104 |
| Fidelity Advisor Freedom 2020 Fund | | | | |
| Class A | | | | |
| Shares sold | 8,001,544 | 9,431,663 | $112,003,580 | $125,196,295 |
| Reinvestment of distributions | 6,173,046 | 4,894,091 | 84,848,608 | 62,805,611 |
| Shares redeemed | (18,261,601) | (21,264,407) | (253,962,340) | (283,486,491) |
| Net increase (decrease) | (4,087,011) | (6,938,653) | $(57,110,152) | $(95,484,585) |
| Class M | | | | |
| Shares sold | 2,093,774 | 3,173,253 | $29,129,358 | $42,203,298 |
| Reinvestment of distributions | 2,171,622 | 1,651,673 | 29,821,300 | 21,168,692 |
| Shares redeemed | (5,381,594) | (6,874,405) | (74,725,835) | (91,487,432) |
| Net increase (decrease) | (1,116,198) | (2,049,479) | $(15,775,177) | $(28,115,442) |
| Class C | | | | |
| Shares sold | 463,525 | 577,220 | $6,425,966 | $7,614,882 |
| Reinvestment of distributions | 320,107 | 263,593 | 4,351,670 | 3,341,676 |
| Shares redeemed | (1,582,555) | (1,213,950) | (21,784,727) | (15,997,506) |
| Net increase (decrease) | (798,923) | (373,137) | $(11,007,091) | $(5,040,948) |
| Class I | | | | |
| Shares sold | 7,526,464 | 12,183,389 | $106,336,725 | $163,095,678 |
| Reinvestment of distributions | 5,195,518 | 4,100,188 | 72,078,630 | 53,126,318 |
| Shares redeemed | (17,080,051) | (20,178,633) | (239,924,268) | (271,153,691) |
| Net increase (decrease) | (4,358,069) | (3,895,056) | $(61,508,913) | $(54,931,695) |
| Class Z | | | | |
| Shares sold | 2,041,666 | 966,136 | $27,606,558 | $13,096,326 |
| Reinvestment of distributions | 375,167 | 226,420 | 5,155,807 | 2,932,725 |
| Shares redeemed | (1,007,552) | (813,593) | (13,906,577) | (10,921,495) |
| Net increase (decrease) | 1,409,281 | 378,963 | $18,855,788 | $5,107,556 |
| Class Z6 | | | | |
| Shares sold | 3,780,110 | 3,096,617 | $52,563,161 | $42,057,610 |
| Reinvestment of distributions | 774,842 | 429,405 | 10,680,609 | 5,599,835 |
| Shares redeemed | (2,429,057) | (1,823,031) | (34,267,030) | (24,218,192) |
| Net increase (decrease) | 2,125,895 | 1,702,991 | $28,976,740 | $23,439,253 |
| Fidelity Advisor Freedom 2025 Fund | | | | |
| Class A | | | | |
| Shares sold | 14,843,699 | 17,043,365 | $215,764,470 | $231,352,969 |
| Reinvestment of distributions | 7,769,145 | 5,898,781 | 111,559,984 | 76,586,993 |
| Shares redeemed | (23,534,135) | (25,991,947) | (341,456,717) | (352,543,272) |
| Net increase (decrease) | (921,291) | (3,049,801) | $(14,132,263) | $(44,603,310) |
| Class M | | | | |
| Shares sold | 4,555,410 | 4,717,527 | $66,179,579 | $63,842,096 |
| Reinvestment of distributions | 2,639,497 | 1,953,851 | 37,970,526 | 25,334,702 |
| Shares redeemed | (6,565,927) | (8,475,764) | (94,946,463) | (114,413,281) |
| Net increase (decrease) | 628,980 | (1,804,386) | $9,203,642 | $(25,236,483) |
| Class C | | | | |
| Shares sold | 507,178 | 690,767 | $7,204,340 | $9,279,485 |
| Reinvestment of distributions | 329,374 | 270,239 | 4,630,357 | 3,416,666 |
| Shares redeemed | (1,508,874) | (1,306,698) | (21,383,347) | (17,415,040) |
| Net increase (decrease) | (672,322) | (345,692) | $(9,548,650) | $(4,718,889) |
| Class I | | | | |
| Shares sold | 15,111,463 | 18,869,667 | $221,898,507 | $258,302,688 |
| Reinvestment of distributions | 7,011,786 | 5,226,551 | 101,838,140 | 68,666,963 |
| Shares redeemed | (24,576,851) | (24,331,686) | (358,685,175) | (331,324,363) |
| Net increase (decrease) | (2,453,602) | (235,468) | $(34,948,528) | $(4,354,712) |
| Class Z | | | | |
| Shares sold | 3,493,164 | 1,443,507 | $50,262,837 | $20,025,136 |
| Reinvestment of distributions | 489,000 | 245,518 | 7,032,045 | 3,227,375 |
| Shares redeemed | (1,157,440) | (695,804) | (16,635,267) | (9,461,355) |
| Net increase (decrease) | 2,824,724 | 993,221 | $40,659,615 | $13,791,156 |
| Class Z6 | | | | |
| Shares sold | 7,056,042 | 4,812,512 | $101,842,347 | $66,455,017 |
| Reinvestment of distributions | 1,025,564 | 548,252 | 14,821,433 | 7,262,722 |
| Shares redeemed | (3,538,893) | (2,195,854) | (52,148,192) | (30,038,236) |
| Net increase (decrease) | 4,542,713 | 3,164,910 | $64,515,588 | $43,679,503 |
| Fidelity Advisor Freedom 2030 Fund | | | | |
| Class A | | | | |
| Shares sold | 13,822,101 | 14,450,751 | $220,104,948 | $210,607,852 |
| Reinvestment of distributions | 7,599,964 | 5,898,819 | 119,751,540 | 82,034,909 |
| Shares redeemed | (19,306,197) | (23,240,151) | (307,169,091) | (340,347,964) |
| Net increase (decrease) | 2,115,868 | (2,890,581) | $32,687,397 | $(47,705,203) |
| Class M | | | | |
| Shares sold | 4,848,926 | 5,351,504 | $76,673,190 | $77,685,363 |
| Reinvestment of distributions | 2,931,924 | 2,196,766 | 45,831,859 | 30,338,954 |
| Shares redeemed | (6,748,400) | (8,158,254) | (106,326,732) | (117,825,483) |
| Net increase (decrease) | 1,032,450 | (609,984) | $16,178,317 | $(9,801,166) |
| Class C | | | | |
| Shares sold | 667,794 | 726,941 | $10,424,536 | $10,441,689 |
| Reinvestment of distributions | 390,019 | 301,248 | 5,981,415 | 4,072,149 |
| Shares redeemed | (1,431,321) | (1,197,137) | (22,099,836) | (17,207,670) |
| Net increase (decrease) | (373,508) | (168,948) | $(5,693,885) | $(2,693,832) |
| Class I | | | | |
| Shares sold | 16,865,921 | 20,320,256 | $270,400,901 | $298,795,613 |
| Reinvestment of distributions | 7,638,759 | 5,689,519 | 121,228,263 | 79,829,517 |
| Shares redeemed | (23,245,186) | (23,835,499) | (371,389,658) | (349,410,864) |
| Net increase (decrease) | 1,259,494 | 2,174,276 | $20,239,506 | $29,214,266 |
| Class Z | | | | |
| Shares sold | 3,243,909 | 1,197,642 | $50,713,338 | $17,513,265 |
| Reinvestment of distributions | 477,841 | 250,203 | 7,515,038 | 3,513,833 |
| Shares redeemed | (750,032) | (591,462) | (11,709,511) | (8,545,973) |
| Net increase (decrease) | 2,971,718 | 856,383 | $46,518,865 | $12,481,125 |
| Class Z6 | | | | |
| Shares sold | 7,111,192 | 5,238,664 | $112,484,451 | $79,128,455 |
| Reinvestment of distributions | 1,186,411 | 605,508 | 18,733,705 | 8,610,966 |
| Shares redeemed | (3,853,356) | (1,812,320) | (61,820,231) | (26,929,863) |
| Net increase (decrease) | 4,444,247 | 4,031,852 | $69,397,925 | $60,809,558 |
| Fidelity Advisor Freedom 2035 Fund | | | | |
| Class A | | | | |
| Shares sold | 12,639,290 | 12,745,894 | $203,032,281 | $180,877,431 |
| Reinvestment of distributions | 6,550,338 | 4,931,603 | 104,192,772 | 65,328,886 |
| Shares redeemed | (17,587,270) | (19,536,651) | (281,137,226) | (278,275,054) |
| Net increase (decrease) | 1,602,358 | (1,859,154) | $26,087,827 | $(32,068,737) |
| Class M | | | | |
| Shares sold | 4,595,080 | 5,027,991 | $72,829,152 | $70,690,291 |
| Reinvestment of distributions | 2,525,083 | 1,877,271 | 39,570,181 | 24,479,138 |
| Shares redeemed | (6,159,903) | (7,420,144) | (97,066,919) | (104,431,074) |
| Net increase (decrease) | 960,260 | (514,882) | $15,332,414 | $(9,261,645) |
| Class C | | | | |
| Shares sold | 571,508 | 589,666 | $8,781,884 | $8,101,471 |
| Reinvestment of distributions | 299,156 | 226,626 | 4,564,782 | 2,870,863 |
| Shares redeemed | (1,100,176) | (759,576) | (16,947,905) | (10,379,060) |
| Net increase (decrease) | (229,512) | 56,716 | $(3,601,239) | $593,274 |
| Class I | | | | |
| Shares sold | 15,108,021 | 18,572,423 | $244,137,633 | $265,452,429 |
| Reinvestment of distributions | 6,659,932 | 4,834,164 | 107,042,090 | 64,952,173 |
| Shares redeemed | (20,486,686) | (21,055,945) | (330,105,610) | (299,130,740) |
| Net increase (decrease) | 1,281,267 | 2,350,642 | $21,074,113 | $31,273,862 |
| Class Z | | | | |
| Shares sold | 3,430,032 | 1,027,427 | $53,716,746 | $14,564,561 |
| Reinvestment of distributions | 415,251 | 191,974 | 6,614,577 | 2,597,042 |
| Shares redeemed | (644,670) | (329,885) | (10,016,750) | (4,629,276) |
| Net increase (decrease) | 3,200,613 | 889,516 | $50,314,573 | $12,532,327 |
| Class Z6 | | | | |
| Shares sold | 7,378,883 | 4,805,545 | $117,971,579 | $71,285,133 |
| Reinvestment of distributions | 1,064,523 | 464,398 | 17,079,175 | 6,356,350 |
| Shares redeemed | (2,982,246) | (1,494,278) | (48,333,157) | (21,550,231) |
| Net increase (decrease) | 5,461,160 | 3,775,665 | $86,717,597 | $56,091,252 |
| Fidelity Advisor Freedom 2040 Fund | | | | |
| Class A | | | | |
| Shares sold | 9,666,804 | 11,088,110 | $170,336,699 | $168,289,951 |
| Reinvestment of distributions | 5,530,248 | 4,031,211 | 96,572,949 | 56,477,993 |
| Shares redeemed | (13,417,705) | (18,441,716) | (236,121,655) | (282,099,262) |
| Net increase (decrease) | 1,779,347 | (3,322,395) | $30,787,993 | $(57,331,318) |
| Class M | | | | |
| Shares sold | 3,504,478 | 4,007,260 | $61,132,334 | $60,718,878 |
| Reinvestment of distributions | 2,242,880 | 1,586,610 | 38,815,134 | 22,021,734 |
| Shares redeemed | (5,055,734) | (6,292,100) | (88,129,523) | (94,677,902) |
| Net increase (decrease) | 691,624 | (698,230) | $11,817,945 | $(11,937,290) |
| Class C | | | | |
| Shares sold | 342,532 | 418,741 | $5,785,079 | $6,191,883 |
| Reinvestment of distributions | 286,356 | 229,971 | 4,806,804 | 3,082,923 |
| Shares redeemed | (1,280,882) | (810,299) | (21,705,622) | (12,145,392) |
| Net increase (decrease) | (651,994) | (161,587) | $(11,113,739) | $(2,870,586) |
| Class I | | | | |
| Shares sold | 12,901,795 | 16,269,650 | $229,290,722 | $250,179,380 |
| Reinvestment of distributions | 5,806,370 | 3,936,511 | 102,366,066 | 56,008,263 |
| Shares redeemed | (17,314,005) | (19,052,246) | (304,667,629) | (292,128,846) |
| Net increase (decrease) | 1,394,160 | 1,153,915 | $26,989,159 | $14,058,797 |
| Class Z | | | | |
| Shares sold | 2,517,597 | 1,077,828 | $43,143,811 | $16,509,881 |
| Reinvestment of distributions | 325,175 | 133,713 | 5,683,696 | 1,935,717 |
| Shares redeemed | (425,531) | (369,652) | (7,272,198) | (5,689,099) |
| Net increase (decrease) | 2,417,241 | 841,889 | $41,555,309 | $12,756,499 |
| Class Z6 | | | | |
| Shares sold | 5,901,761 | 4,180,386 | $102,603,778 | $66,988,095 |
| Reinvestment of distributions | 918,701 | 390,936 | 16,155,135 | 5,694,932 |
| Shares redeemed | (2,607,021) | (1,334,628) | (46,192,189) | (20,719,533) |
| Net increase (decrease) | 4,213,441 | 3,236,694 | $72,566,724 | $51,963,494 |
| Fidelity Advisor Freedom 2045 Fund | | | | |
| Class A | | | | |
| Shares sold | 9,649,837 | 11,191,576 | $133,898,979 | $133,453,232 |
| Reinvestment of distributions | 4,387,075 | 2,950,953 | 60,377,531 | 32,543,699 |
| Shares redeemed | (13,879,621) | (15,915,683) | (191,796,789) | (191,641,624) |
| Net increase (decrease) | 157,291 | (1,773,154) | $2,479,721 | $(25,644,693) |
| Class M | | | | |
| Shares sold | 3,881,450 | 3,854,236 | $53,085,927 | $45,270,063 |
| Reinvestment of distributions | 1,812,474 | 1,170,123 | 24,625,600 | 12,709,640 |
| Shares redeemed | (4,953,325) | (5,470,768) | (67,551,694) | (63,750,883) |
| Net increase (decrease) | 740,599 | (446,409) | $10,159,833 | $(5,771,180) |
| Class C | | | | |
| Shares sold | 338,793 | 420,321 | $4,539,630 | $4,815,222 |
| Reinvestment of distributions | 221,870 | 144,445 | 2,947,984 | 1,529,287 |
| Shares redeemed | (748,315) | (470,241) | (10,031,652) | (5,458,489) |
| Net increase (decrease) | (187,652) | 94,525 | $(2,544,038) | $886,020 |
| Class I | | | | |
| Shares sold | 14,731,521 | 16,525,488 | $205,890,352 | $198,984,474 |
| Reinvestment of distributions | 5,338,558 | 3,316,272 | 74,182,170 | 37,066,639 |
| Shares redeemed | (18,238,078) | (18,908,867) | (251,890,540) | (226,787,258) |
| Net increase (decrease) | 1,832,001 | 932,893 | $28,181,982 | $9,263,855 |
| Class Z | | | | |
| Shares sold | 2,892,354 | 927,795 | $38,467,997 | $11,236,523 |
| Reinvestment of distributions | 308,832 | 127,632 | 4,253,210 | 1,444,539 |
| Shares redeemed | (680,322) | (273,947) | (9,060,906) | (3,187,870) |
| Net increase (decrease) | 2,520,864 | 781,480 | $33,660,301 | $9,493,192 |
| Class Z6 | | | | |
| Shares sold | 7,025,548 | 4,475,576 | $96,049,813 | $55,829,092 |
| Reinvestment of distributions | 930,148 | 357,495 | 12,905,402 | 4,100,077 |
| Shares redeemed | (2,962,249) | (1,357,321) | (41,556,813) | (16,771,610) |
| Net increase (decrease) | 4,993,447 | 3,475,750 | $67,398,402 | $43,157,559 |
| Fidelity Advisor Freedom 2050 Fund | | | | |
| Class A | | | | |
| Shares sold | 9,176,782 | 10,461,752 | $127,260,936 | $123,898,202 |
| Reinvestment of distributions | 3,461,784 | 2,350,241 | 47,682,530 | 25,805,835 |
| Shares redeemed | (11,390,502) | (13,356,309) | (158,037,343) | (161,529,200) |
| Net increase (decrease) | 1,248,064 | (544,316) | $16,906,123 | $(11,825,163) |
| Class M | | | | |
| Shares sold | 3,255,783 | 3,666,000 | $44,677,606 | $43,189,465 |
| Reinvestment of distributions | 1,394,626 | 922,314 | 19,025,895 | 10,007,819 |
| Shares redeemed | (3,939,776) | (4,896,373) | (54,171,513) | (57,671,647) |
| Net increase (decrease) | 710,633 | (308,059) | $9,531,988 | $(4,474,363) |
| Class C | | | | |
| Shares sold | 397,166 | 509,340 | $5,355,491 | $5,940,775 |
| Reinvestment of distributions | 213,969 | 139,713 | 2,861,315 | 1,480,154 |
| Shares redeemed | (693,023) | (508,675) | (9,354,142) | (6,064,835) |
| Net increase (decrease) | (81,888) | 140,378 | $(1,137,336) | $1,356,094 |
| Class I | | | | |
| Shares sold | 13,837,779 | 15,204,297 | $193,954,871 | $182,833,214 |
| Reinvestment of distributions | 4,642,288 | 2,813,838 | 64,556,686 | 31,355,113 |
| Shares redeemed | (16,287,591) | (15,355,290) | (225,297,053) | (184,145,720) |
| Net increase (decrease) | 2,192,476 | 2,662,845 | $33,214,504 | $30,042,607 |
| Class Z | | | | |
| Shares sold | 2,176,883 | 920,087 | $29,147,980 | $11,271,700 |
| Reinvestment of distributions | 231,494 | 88,503 | 3,194,274 | 1,004,896 |
| Shares redeemed | (499,554) | (285,489) | (6,776,658) | (3,386,319) |
| Net increase (decrease) | 1,908,823 | 723,101 | $25,565,596 | $8,890,277 |
| Class Z6 | | | | |
| Shares sold | 5,666,290 | 4,164,432 | $77,356,949 | $51,802,873 |
| Reinvestment of distributions | 784,936 | 279,485 | 10,898,640 | 3,208,831 |
| Shares redeemed | (2,354,156) | (872,299) | (32,888,925) | (10,735,970) |
| Net increase (decrease) | 4,097,070 | 3,571,618 | $55,366,664 | $44,275,734 |
| Fidelity Advisor Freedom 2055 Fund | | | | |
| Class A | | | | |
| Shares sold | 6,047,361 | 7,201,619 | $94,061,450 | $95,780,791 |
| Reinvestment of distributions | 1,699,532 | 1,100,380 | 26,282,591 | 13,481,125 |
| Shares redeemed | (7,410,663) | (7,505,755) | (116,078,823) | (102,029,481) |
| Net increase (decrease) | 336,230 | 796,244 | $4,265,218 | $7,232,435 |
| Class M | | | | |
| Shares sold | 2,048,088 | 2,323,581 | $31,591,967 | $30,661,854 |
| Reinvestment of distributions | 695,148 | 414,536 | 10,655,831 | 5,020,721 |
| Shares redeemed | (2,164,034) | (2,338,534) | (33,226,040) | (31,319,085) |
| Net increase (decrease) | 579,202 | 399,583 | $9,021,758 | $4,363,490 |
| Class C | | | | |
| Shares sold | 184,863 | 246,332 | $2,822,609 | $3,195,857 |
| Reinvestment of distributions | 95,560 | 54,530 | 1,447,609 | 649,972 |
| Shares redeemed | (257,433) | (157,772) | (3,936,635) | (2,142,717) |
| Net increase (decrease) | 22,990 | 143,090 | $333,583 | $1,703,112 |
| Class I | | | | |
| Shares sold | 9,748,871 | 9,698,105 | $152,891,293 | $129,655,186 |
| Reinvestment of distributions | 2,604,091 | 1,465,469 | 40,542,999 | 18,143,614 |
| Shares redeemed | (10,867,107) | (9,182,324) | (167,636,529) | (122,933,697) |
| Net increase (decrease) | 1,485,855 | 1,981,250 | $25,797,763 | $24,865,103 |
| Class Z | | | | |
| Shares sold | 1,329,081 | 646,572 | $19,938,182 | $8,858,276 |
| Reinvestment of distributions | 126,627 | 43,817 | 1,954,101 | 559,586 |
| Shares redeemed | (344,080) | (160,552) | (5,261,472) | (2,148,115) |
| Net increase (decrease) | 1,111,628 | 529,837 | $16,630,811 | $7,269,747 |
| Class Z6 | | | | |
| Shares sold | 4,125,096 | 2,396,671 | $62,937,893 | $33,205,378 |
| Reinvestment of distributions | 445,662 | 154,674 | 6,930,540 | 1,954,044 |
| Shares redeemed | (1,386,778) | (864,315) | (21,734,644) | (11,793,097) |
| Net increase (decrease) | 3,183,980 | 1,687,030 | $48,133,789 | $23,366,325 |
| Fidelity Advisor Freedom 2060 Fund | | | | |
| Class A | | | | |
| Shares sold | 3,681,057 | 3,931,869 | $52,208,260 | $47,411,935 |
| Reinvestment of distributions | 681,702 | 377,693 | 9,625,475 | 4,207,497 |
| Shares redeemed | (3,466,895) | (3,110,815) | (49,556,224) | (38,578,377) |
| Net increase (decrease) | 895,864 | 1,198,747 | $12,277,511 | $13,041,055 |
| Class M | | | | |
| Shares sold | 1,402,238 | 1,510,467 | $19,821,893 | $18,419,860 |
| Reinvestment of distributions | 261,610 | 124,299 | 3,681,352 | 1,378,867 |
| Shares redeemed | (976,114) | (941,887) | (13,806,821) | (11,571,055) |
| Net increase (decrease) | 687,734 | 692,879 | $9,696,424 | $8,227,672 |
| Class C | | | | |
| Shares sold | 174,681 | 169,027 | $2,453,258 | $1,992,858 |
| Reinvestment of distributions | 44,344 | 21,271 | 621,155 | 231,734 |
| Shares redeemed | (94,288) | (116,309) | (1,303,013) | (1,409,448) |
| Net increase (decrease) | 124,737 | 73,989 | $1,771,400 | $815,144 |
| Class I | | | | |
| Shares sold | 6,265,081 | 5,738,684 | $89,508,673 | $69,292,017 |
| Reinvestment of distributions | 1,051,695 | 493,664 | 14,928,853 | 5,558,415 |
| Shares redeemed | (5,396,444) | (3,989,277) | (75,963,700) | (48,515,420) |
| Net increase (decrease) | 1,920,332 | 2,243,071 | $28,473,826 | $26,335,012 |
| Class Z | | | | |
| Shares sold | 761,337 | 301,152 | $10,453,007 | $3,813,013 |
| Reinvestment of distributions | 53,093 | 12,820 | 748,976 | 151,089 |
| Shares redeemed | (147,840) | (59,901) | (2,048,091) | (725,312) |
| Net increase (decrease) | 666,590 | 254,071 | $9,153,892 | $3,238,790 |
| Class Z6 | | | | |
| Shares sold | 2,215,217 | 1,206,323 | $30,863,126 | $15,062,917 |
| Reinvestment of distributions | 183,640 | 49,814 | 2,605,912 | 573,340 |
| Shares redeemed | (556,195) | (361,627) | (7,915,287) | (4,536,691) |
| Net increase (decrease) | 1,842,662 | 894,510 | $25,553,751 | $11,099,566 |
| Fidelity Advisor Freedom 2065 Fund | | | | |
| Class A | | | | |
| Shares sold | 1,118,899 | 739,669 | $14,612,128 | $8,417,225 |
| Reinvestment of distributions | 69,461 | 12,229 | 910,391 | 136,931 |
| Shares redeemed | (466,915) | (233,138) | (6,116,986) | (2,703,211) |
| Net increase (decrease) | 721,445 | 518,760 | $9,405,533 | $5,850,945 |
| Class M | | | | |
| Shares sold | 450,420 | 77,047 | $5,901,108 | $871,743 |
| Reinvestment of distributions | 12,880 | 1,597 | 168,886 | 17,678 |
| Shares redeemed | (201,021) | (21,491) | (2,580,427) | (252,002) |
| Net increase (decrease) | 262,279 | 57,153 | $3,489,567 | $637,419 |
| Class C | | | | |
| Shares sold | 35,879 | 13,545 | $465,084 | $156,152 |
| Reinvestment of distributions | 2,656 | 556 | 34,691 | 5,871 |
| Shares redeemed | (9,375) | (1,727) | (120,185) | (18,627) |
| Net increase (decrease) | 29,160 | 12,374 | $379,590 | $143,396 |
| Class I | | | | |
| Shares sold | 1,387,882 | 908,443 | $18,214,568 | $10,525,557 |
| Reinvestment of distributions | 89,922 | 13,914 | 1,182,012 | 156,022 |
| Shares redeemed | (654,012) | (283,365) | (8,493,003) | (3,243,374) |
| Net increase (decrease) | 823,792 | 638,992 | $10,903,577 | $7,438,205 |
| Class Z | | | | |
| Shares sold | 134,242 | 24,345 | $1,725,588 | $282,306 |
| Reinvestment of distributions | 5,032 | 847 | 66,373 | 9,465 |
| Shares redeemed | (27,985) | (4,241) | (363,025) | (50,621) |
| Net increase (decrease) | 111,289 | 20,951 | $1,428,936 | $241,150 |
| Class Z6 | | | | |
| Shares sold | 543,282 | 183,979 | $7,084,877 | $2,253,917 |
| Reinvestment of distributions | 23,040 | 2,709 | 304,205 | 28,915 |
| Shares redeemed | (157,667) | (96,498) | (2,075,129) | (985,713) |
| Net increase (decrease) | 408,655 | 90,190 | $5,313,953 | $1,297,119 |
10. Other.
A fund's organizational documents provide former and current trustees and officers with a limited indemnification against liabilities arising in connection with the performance of their duties to the fund. In the normal course of business, a fund may also enter into contracts that provide general indemnifications. A fund's maximum exposure under these arrangements is unknown as this would be dependent on future claims that may be made against a fund. The risk of material loss from such claims is considered remote.
Funds do not invest in underlying mutual funds for the purpose of exercising management or control; however, investments by funds within their principal investment strategies may represent a significant portion of the underlying mutual fund's net assets. At the end of the period, certain Funds were the owners of record of 10% or more of the total outstanding shares of the following underlying mutual funds as shown below.
| Fund | Fidelity Advisor Freedom 2030 Fund | Fidelity Advisor Freedom 2035 Fund | Fidelity Advisor Freedom 2040 Fund | Fidelity Advisor Freedom 2045 Fund |
| Fidelity Advisor Series Equity Growth Fund | 13% | 15% | 16% | 11% |
| Fidelity Advisor Series Growth Opportunities Fund | 13% | 15% | 16% | 11% |
| Fidelity Advisor Series Small Cap Fund | 13% | 15% | 16% | 11% |
The Funds, in aggregate, were the owners of record of more than 20% of the total outstanding shares of the following underlying mutual funds.
| Fund | % of shares held |
| Fidelity Advisor Series Equity Growth Fund | 90% |
| Fidelity Advisor Series Growth Opportunities Fund | 90% |
| Fidelity Advisor Series Small Cap Fund | 90% |
11. Coronavirus (COVID-19) Pandemic.
An outbreak of COVID-19 first detected in China during December 2019 has since spread globally and was declared a pandemic by the World Health Organization during March 2020. Developments that disrupt global economies and financial markets, such as the COVID-19 pandemic, may magnify factors that affect the Funds' performance.
Report of Independent Registered Public Accounting Firm
To the Board of Trustees of Fidelity Aberdeen Street Trust and the Shareholders of Fidelity Advisor Freedom Income Fund, Fidelity Advisor Freedom 2005 Fund, Fidelity Advisor Freedom 2010 Fund, Fidelity Advisor Freedom 2015 Fund, Fidelity Advisor Freedom 2020 Fund, Fidelity Advisor Freedom 2025 Fund, Fidelity Advisor Freedom 2030 Fund, Fidelity Advisor Freedom 2035 Fund, Fidelity Advisor Freedom 2040 Fund, Fidelity Advisor Freedom 2045 Fund, Fidelity Advisor Freedom 2050 Fund, Fidelity Advisor Freedom 2055 Fund, Fidelity Advisor Freedom 2060 Fund and Fidelity Advisor Freedom 2065 Fund
Opinion on the Financial Statements and Financial Highlights
We have audited the accompanying statements of assets and liabilities of Fidelity Advisor Freedom Income Fund, Fidelity Advisor Freedom 2005 Fund, Fidelity Advisor Freedom 2010 Fund, Fidelity Advisor Freedom 2015 Fund, Fidelity Advisor Freedom 2020 Fund, Fidelity Advisor Freedom 2025 Fund, Fidelity Advisor Freedom 2030 Fund, Fidelity Advisor Freedom 2035 Fund, Fidelity Advisor Freedom 2040 Fund, Fidelity Advisor Freedom 2045 Fund, Fidelity Advisor Freedom 2050 Fund, Fidelity Advisor Freedom 2055 Fund, Fidelity Advisor Freedom 2060 Fund, and Fidelity Advisor Freedom 2065 Fund (the “Funds”), each a fund of Fidelity Aberdeen Street Trust, including the schedules of investments, as of March 31, 2022, the related statements of operations for the year then ended, the statements of changes in net assets for each of the two years in the period then ended, the financial highlights for each of the five years in the period then ended, except for the financial highlights for Fidelity Advisor Freedom 2065 Fund; which are for each of the two years in the period then ended and for the period from June 28, 2019 (commencement of operations) through March 31, 2020; and the related notes. In our opinion, the financial statements and financial highlights present fairly, in all material respects, the financial position of the Funds as of March 31, 2022, and the results of their operations for the year then ended, the changes in their net assets for each of the two years in the period then ended, and the financial highlights for each of the five years in the period then ended (or for the period mentioned above), in conformity with accounting principles generally accepted in the United States of America.
Basis for Opinion
These financial statements and financial highlights are the responsibility of the Funds’ management. Our responsibility is to express an opinion on the Funds’ financial statements and financial highlights based on our audits. We are a public accounting firm registered with the Public Company Accounting Oversight Board (United States) (PCAOB) and are required to be independent with respect to the Funds in accordance with the U.S. federal securities laws and the applicable rules and regulations of the Securities and Exchange Commission and the PCAOB.
We conducted our audits in accordance with the standards of the PCAOB. Those standards require that we plan and perform the audit to obtain reasonable assurance about whether the financial statements and financial highlights are free of material misstatement, whether due to error or fraud. The Funds are not required to have, nor were we engaged to perform, an audit of their internal controls over financial reporting. As part of our audits we are required to obtain an understanding of internal controls over financial reporting but not for the purpose of expressing an opinion on the effectiveness of the Funds’ internal controls over financial reporting. Accordingly, we express no such opinion.
Our audits included performing procedures to assess the risks of material misstatement of the financial statements and financial highlights, whether due to error or fraud, and performing procedures that respond to those risks. Such procedures included examining, on a test basis, evidence regarding the amounts and disclosures in the financial statements and financial highlights. Our audits also included evaluating the accounting principles used and significant estimates made by management, as well as evaluating the overall presentation of the financial statements and financial highlights. Our procedures included confirmation of securities owned as of March 31, 2022, by correspondence with the custodian and brokers; when replies were not received from brokers, we performed other auditing procedures. We believe that our audits provide a reasonable basis for our opinion.
/s/ Deloitte & Touche LLP
Boston, Massachusetts
May 12, 2022
We have served as the auditor of one or more of the Fidelity investment companies since 1999.
Trustees and Officers
The Trustees, Members of the Advisory Board (if any), and officers of the trust and funds, as applicable, are listed below. The Board of Trustees governs each fund and is responsible for protecting the interests of shareholders. The Trustees are experienced executives who meet periodically throughout the year to oversee each fund's activities, review contractual arrangements with companies that provide services to each fund, oversee management of the risks associated with such activities and contractual arrangements, and review each fund's performance. If the interests of a fund and an underlying Fidelity® fund were to diverge, a conflict of interest could arise and affect how the Trustees and Members of the Advisory Board fulfill their fiduciary duties to the affected funds. FMR has structured the funds to avoid these potential conflicts, although there may be situations where a conflict of interest is unavoidable. In such instances, FMR, the Trustees, and Members of the Advisory Board would take reasonable steps to minimize and, if possible, eliminate the conflict. Each of the Trustees oversees 292 funds.
The Trustees hold office without limit in time except that (a) any Trustee may resign; (b) any Trustee may be removed by written instrument, signed by at least two-thirds of the number of Trustees prior to such removal; (c) any Trustee who requests to be retired or who has become incapacitated by illness or injury may be retired by written instrument signed by a majority of the other Trustees; and (d) any Trustee may be removed at any special meeting of shareholders by a two-thirds vote of the outstanding voting securities of the trust. Each Trustee who is not an interested person (as defined in the 1940 Act) of the trust and the funds is referred to herein as an Independent Trustee. Each Independent Trustee shall retire not later than the last day of the calendar year in which his or her 75th birthday occurs. The Independent Trustees may waive this mandatory retirement age policy with respect to individual Trustees. Officers and Advisory Board Members hold office without limit in time, except that any officer or Advisory Board Member may resign or may be removed by a vote of a majority of the Trustees at any regular meeting or any special meeting of the Trustees. Except as indicated, each individual has held the office shown or other offices in the same company for the past five years.
Each fund’s Statement of Additional Information (SAI) includes more information about the Trustees. To request a free copy, call Fidelity at 1-877-208-0098.
Experience, Skills, Attributes, and Qualifications of the Trustees. The Governance and Nominating Committee has adopted a statement of policy that describes the experience, qualifications, attributes, and skills that are necessary and desirable for potential Independent Trustee candidates (Statement of Policy). The Board believes that each Trustee satisfied at the time he or she was initially elected or appointed a Trustee, and continues to satisfy, the standards contemplated by the Statement of Policy. The Governance and Nominating Committee also engages professional search firms to help identify potential Independent Trustee candidates who have the experience, qualifications, attributes, and skills consistent with the Statement of Policy. From time to time, additional criteria based on the composition and skills of the current Independent Trustees, as well as experience or skills that may be appropriate in light of future changes to board composition, business conditions, and regulatory or other developments, have also been considered by the professional search firms and the Governance and Nominating Committee. In addition, the Board takes into account the Trustees' commitment and participation in Board and committee meetings, as well as their leadership of standing and ad hoc committees throughout their tenure.
In determining that a particular Trustee was and continues to be qualified to serve as a Trustee, the Board has considered a variety of criteria, none of which, in isolation, was controlling. The Board believes that, collectively, the Trustees have balanced and diverse experience, qualifications, attributes, and skills, which allow the Board to operate effectively in governing each fund and protecting the interests of shareholders. Information about the specific experience, skills, attributes, and qualifications of each Trustee, which in each case led to the Board's conclusion that the Trustee should serve (or continue to serve) as a trustee of the funds, is provided below.
Board Structure and Oversight Function. Abigail P. Johnson is an interested person and currently serves as Chairman. The Trustees have determined that an interested Chairman is appropriate and benefits shareholders because an interested Chairman has a personal and professional stake in the quality and continuity of services provided to the funds. Independent Trustees exercise their informed business judgment to appoint an individual of their choosing to serve as Chairman, regardless of whether the Trustee happens to be independent or a member of management. The Independent Trustees have determined that they can act independently and effectively without having an Independent Trustee serve as Chairman and that a key structural component for assuring that they are in a position to do so is for the Independent Trustees to constitute a substantial majority for the Board. The Independent Trustees also regularly meet in executive session. Michael E. Kenneally serves as Chairman of the Independent Trustees and as such (i) acts as a liaison between the Independent Trustees and management with respect to matters important to the Independent Trustees and (ii) with management prepares agendas for Board meetings.
Fidelity® funds are overseen by different Boards of Trustees. The funds' Board oversees Fidelity's investment-grade bond, money market, asset allocation and certain equity funds, and other Boards oversee Fidelity's high income and other equity funds. The asset allocation funds may invest in Fidelity® funds that are overseen by such other Boards. The use of separate Boards, each with its own committee structure, allows the Trustees of each group of Fidelity® funds to focus on the unique issues of the funds they oversee, including common research, investment, and operational issues. On occasion, the separate Boards establish joint committees to address issues of overlapping consequences for the Fidelity® funds overseen by each Board.
The Trustees operate using a system of committees to facilitate the timely and efficient consideration of all matters of importance to the Trustees, each fund, and fund shareholders and to facilitate compliance with legal and regulatory requirements and oversight of the funds' activities and associated risks. The Board, acting through its committees, has charged FMR and its affiliates with (i) identifying events or circumstances the occurrence of which could have demonstrably adverse effects on the funds' business and/or reputation; (ii) implementing processes and controls to lessen the possibility that such events or circumstances occur or to mitigate the effects of such events or circumstances if they do occur; and (iii) creating and maintaining a system designed to evaluate continuously business and market conditions in order to facilitate the identification and implementation processes described in (i) and (ii) above. Because the day-to-day operations and activities of the funds are carried out by or through FMR, its affiliates, and other service providers, the funds' exposure to risks is mitigated but not eliminated by the processes overseen by the Trustees. While each of the Board's committees has responsibility for overseeing different aspects of the funds' activities, oversight is exercised primarily through the Operations and Audit Committees. In addition, an ad hoc Board committee of Independent Trustees has worked with FMR to enhance the Board's oversight of investment and financial risks, legal and regulatory risks, technology risks, and operational risks, including the development of additional risk reporting to the Board. Appropriate personnel, including but not limited to the funds' Chief Compliance Officer (CCO), FMR's internal auditor, the independent accountants, the funds' Treasurer and portfolio management personnel, make periodic reports to the Board's committees, as appropriate, including an annual review of Fidelity's risk management program for the Fidelity® funds. The responsibilities of each standing committee, including their oversight responsibilities, are described further under "Standing Committees of the Trustees."
Interested Trustees*:
Correspondence intended for a Trustee who is an interested person may be sent to Fidelity Investments, 245 Summer Street, Boston, Massachusetts 02210.
Name, Year of Birth; Principal Occupations and Other Relevant Experience+
Abigail P. Johnson (1961)
Year of Election or Appointment: 2009
Trustee
Chairman of the Board of Trustees
Ms. Johnson also serves as Trustee of other Fidelity® funds. Ms. Johnson serves as Chairman (2016-present), Chief Executive Officer (2014-present), and Director (2007-present) of FMR LLC (diversified financial services company), President of Fidelity Financial Services (2012-present) and President of Personal, Workplace and Institutional Services (2005-present). Ms. Johnson is Chairman and Director of Fidelity Management & Research Company LLC (investment adviser firm, 2011-present). Previously, Ms. Johnson served as Chairman and Director of FMR Co., Inc. (investment adviser firm, 2011-2019), Vice Chairman (2007-2016) and President (2013-2016) of FMR LLC, President and a Director of Fidelity Management & Research Company (2001-2005), a Trustee of other investment companies advised by Fidelity Management & Research Company, Fidelity Investments Money Management, Inc. (investment adviser firm), and FMR Co., Inc. (2001-2005), Senior Vice President of the Fidelity® funds (2001-2005), and managed a number of Fidelity® funds. Ms. Abigail P. Johnson and Mr. Arthur E. Johnson are not related.
Jennifer Toolin McAuliffe (1959)
Year of Election or Appointment: 2016
Trustee
Ms. McAuliffe also serves as Trustee of other Fidelity® funds and as Trustee of Fidelity Charitable (2020-present). Previously, Ms. McAuliffe served as Co-Head of Fixed Income of Fidelity Investments Limited (now known as FIL Limited (FIL)) (diversified financial services company), Director of Research for FIL’s credit and quantitative teams in London, Hong Kong and Tokyo and Director of Research for taxable and municipal bonds at Fidelity Investments Money Management, Inc. Ms. McAuliffe previously served as a member of the Advisory Board of certain Fidelity® funds (2016). Ms. McAuliffe was previously a lawyer at Ropes & Gray LLP and currently serves as director or trustee of several not-for-profit entities.
* Determined to be an “Interested Trustee” by virtue of, among other things, his or her affiliation with the trust or various entities under common control with FMR.
+ The information includes the Trustee's principal occupation during the last five years and other information relating to the experience, attributes, and skills relevant to the Trustee's qualifications to serve as a Trustee, which led to the conclusion that the Trustee should serve as a Trustee for each fund.
Independent Trustees:
Correspondence intended for an Independent Trustee may be sent to Fidelity Investments, P.O. Box 55235, Boston, Massachusetts 02205-5235.
Name, Year of Birth; Principal Occupations and Other Relevant Experience+
Elizabeth S. Acton (1951)
Year of Election or Appointment: 2013
Trustee
Ms. Acton also serves as Trustee of other Fidelity® funds. Prior to her retirement, Ms. Acton served as Executive Vice President, Finance (2011-2012), Executive Vice President, Chief Financial Officer (2002-2011) and Treasurer (2004-2005) of Comerica Incorporated (financial services). Prior to joining Comerica, Ms. Acton held a variety of positions at Ford Motor Company (1983-2002), including Vice President and Treasurer (2000-2002) and Executive Vice President and Chief Financial Officer of Ford Motor Credit Company (1998-2000). Ms. Acton currently serves as a member of the Board and Audit and Finance Committees of Beazer Homes USA, Inc. (homebuilding, 2012-present). Ms. Acton previously served as a member of the Advisory Board of certain Fidelity® funds (2013-2016).
Ann E. Dunwoody (1953)
Year of Election or Appointment: 2018
Trustee
General Dunwoody also serves as Trustee of other Fidelity® funds. General Dunwoody (United States Army, Retired) was the first woman in U.S. military history to achieve the rank of four-star general and prior to her retirement in 2012 held a variety of positions within the U.S. Army, including Commanding General, U.S. Army Material Command (2008-2012). General Dunwoody currently serves as President of First to Four LLC (leadership and mentoring services, 2012-present), a member of the Board and Nomination and Corporate Governance Committees of Kforce Inc. (professional staffing services, 2016-present) and a member of the Board of Automattic Inc. (software engineering, 2018-present). Previously, General Dunwoody served as a member of the Advisory Board and Nominating and Corporate Governance Committee of L3 Technologies, Inc. (communication, electronic, sensor and aerospace systems, 2013-2019) and a member of the Board and Audit and Sustainability and Corporate Responsibility Committees of Republic Services, Inc. (waste collection, disposal and recycling, 2013-2016). Ms. Dunwoody also serves on several boards for non-profit organizations, including as a member of the Board, Chair of the Nomination and Governance Committee and a member of the Audit Committee of Logistics Management Institute (consulting non-profit, 2012-present), a member of the Council of Trustees for the Association of the United States Army (advocacy non-profit, 2013-present), a member of the Board of Florida Institute of Technology (2015-present) and a member of the Board of ThanksUSA (military family education non-profit, 2014-present). General Dunwoody previously served as a member of the Advisory Board of certain Fidelity® funds (2018).
John Engler (1948)
Year of Election or Appointment: 2014
Trustee
Mr. Engler also serves as Trustee of other Fidelity® funds. Previously, Mr. Engler served as Governor of Michigan (1991-2003), President of the Business Roundtable (2011-2017) and interim President of Michigan State University (2018-2019). Mr. Engler currently serves as a member of the Board of Stride, Inc. (formerly K12 Inc.) (technology-based education company, 2012-present). Previously, Mr. Engler served as a member of the Board of Universal Forest Products (manufacturer and distributor of wood and wood-alternative products, 2003-2019) and Trustee of The Munder Funds (2003-2014). Mr. Engler previously served as a member of the Advisory Board of certain Fidelity® funds (2014-2016).
Robert F. Gartland (1951)
Year of Election or Appointment: 2010
Trustee
Mr. Gartland also serves as Trustee of other Fidelity® funds. Prior to his retirement, Mr. Gartland held a variety of positions at Morgan Stanley (financial services, 1979-2007), including Managing Director (1987-2007) and Chase Manhattan Bank (1975-1978). Mr. Gartland previously served as Chairman and an investor in Gartland & Mellina Group Corp. (consulting, 2009-2019), as a member of the Board of National Securities Clearing Corporation (1993-1996) and as Chairman of TradeWeb (2003-2004).
Arthur E. Johnson (1947)
Year of Election or Appointment: 2008
Trustee
Mr. Johnson also serves as Trustee of other Fidelity® funds. Prior to his retirement, Mr. Johnson served as Senior Vice President of Corporate Strategic Development of Lockheed Martin Corporation (defense contractor, 1999-2009). Mr. Johnson currently serves as a member of the Board of Booz Allen Hamilton (management consulting, 2011-present). Mr. Johnson previously served as a member of the Board of Eaton Corporation plc (diversified power management, 2009-2019) and a member of the Board of AGL Resources, Inc. (holding company, 2002-2016). Mr. Johnson previously served as Chairman (2018-2021) and Vice Chairman (2015-2018) of the Independent Trustees of certain Fidelity® funds. Mr. Arthur E. Johnson is not related to Ms. Abigail P. Johnson.
Michael E. Kenneally (1954)
Year of Election or Appointment: 2009
Trustee
Chairman of the Independent Trustees
Mr. Kenneally also serves as Trustee of other Fidelity® funds and was Vice Chairman (2018-2021) of the Independent Trustees of certain Fidelity® funds. Prior to retirement in 2005, he was Chairman and Global Chief Executive Officer of Credit Suisse Asset Management, the worldwide fund management and institutional investment business of Credit Suisse Group. Previously, Mr. Kenneally was an Executive Vice President and the Chief Investment Officer for Bank of America. In this role, he was responsible for the investment management, strategy and products delivered to the bank’s institutional, high-net-worth and retail clients. Earlier, Mr. Kenneally directed the organization’s equity and quantitative research groups. He began his career as a research analyst and then spent more than a dozen years as a portfolio manager for endowments, pension plans and mutual funds. He earned the Chartered Financial Analyst (CFA) designation in 1991.
Marie L. Knowles (1946)
Year of Election or Appointment: 2001
Trustee
Ms. Knowles also serves as Trustee of other Fidelity® funds. Prior to her retirement, Ms. Knowles held several positions at Atlantic Richfield Company (diversified energy), including Executive Vice President and Chief Financial Officer (1996-2000), Senior Vice President (1993-1996) and President of ARCO Transportation Company (pipeline and tanker operations, 1993-1996). Ms. Knowles currently serves as a member of the Board of the Santa Catalina Island Company (real estate, 2009-present), a member of the Investment Company Institute Board of Governors and a member of the Governing Council of the Independent Directors Council (2014-present). Ms. Knowles also serves as a member of the Advisory Board for the School of Engineering of the University of Southern California. Ms. Knowles previously served as a member of the Board of McKesson Corporation (healthcare service, 2002-2021). In addition, Ms. Knowles previously served as Chairman (2015-2018) and Vice Chairman (2012-2015) of the Independent Trustees of certain Fidelity® funds.
Mark A. Murray (1954)
Year of Election or Appointment: 2016
Trustee
Mr. Murray also serves as Trustee of other Fidelity® funds. Previously, Mr. Murray served as Co-Chief Executive Officer (2013-2016), President (2006-2013) and Vice Chairman (2013-2020) of Meijer, Inc. Mr. Murray serves as a member of the Board (2009-present) and Public Policy and Responsibility Committee (2009-present) and Chair of the Nuclear Review Committee (2019-present) of DTE Energy Company (diversified energy company). Mr. Murray previously served as a member of the Board of Spectrum Health (not-for-profit health system, 2015-2019) and as a member of the Board and Audit Committee and Chairman of the Nominating and Corporate Governance Committee of Universal Forest Products, Inc. (manufacturer and distributor of wood and wood-alternative products, 2004-2016). Mr. Murray also serves as a member of the Board of many community and professional organizations. Mr. Murray previously served as a member of the Advisory Board of certain Fidelity® funds (2016).
+ The information includes the Trustee's principal occupation during the last five years and other information relating to the experience, attributes, and skills relevant to the Trustee's qualifications to serve as a Trustee, which led to the conclusion that the Trustee should serve as a Trustee for each fund.
Advisory Board Members and Officers:
Correspondence intended for an officer may be sent to Fidelity Investments, 245 Summer Street, Boston, Massachusetts 02210. Officers appear below in alphabetical order.
Name, Year of Birth; Principal Occupation
Robert W. Helm (1957)
Year of Election or Appointment: 2021
Member of the Advisory Board
Mr. Helm also serves as a Member of the Advisory Board of other Fidelity® funds. Mr. Helm was formerly Deputy Chairman (2003-2020), partner (1991-2020) and an associate (1984-1991) of Dechert LLP (formerly Dechert Price & Rhoads). Mr. Helm currently serves on boards and committees of several not-for-profit organizations.
Craig S. Brown (1977)
Year of Election or Appointment: 2019
Assistant Treasurer
Mr. Brown also serves as an officer of other funds. Mr. Brown serves as Assistant Treasurer of FIMM, LLC (2021-present) and is an employee of Fidelity Investments (2013-present).
John J. Burke III (1964)
Year of Election or Appointment: 2018
Chief Financial Officer
Mr. Burke also serves as Chief Financial Officer of other funds. Mr. Burke serves as Head of Investment Operations for Fidelity Fund and Investment Operations (2018-present) and is an employee of Fidelity Investments (1998-present). Previously Mr. Burke served as head of Asset Management Investment Operations (2012-2018).
David J. Carter (1973)
Year of Election or Appointment: 2020
Assistant Secretary
Mr. Carter also serves as Assistant Secretary of other funds. Mr. Carter serves as Senior Vice President, Deputy General Counsel (2022-present) and is an employee of Fidelity Investments (2005-present).
Jonathan Davis (1968)
Year of Election or Appointment: 2010
Assistant Treasurer
Mr. Davis also serves as an officer of other funds. Mr. Davis serves as Assistant Treasurer of FIMM, LLC (2021-present), FMR Capital, Inc. (2017-present), FD Funds GP LLC (2021-present), FD Funds Holding LLC (2021-present), and FD Funds Management LLC (2021-present); and is an employee of Fidelity Investments. Previously, Mr. Davis served as Vice President and Associate General Counsel of FMR LLC (diversified financial services company, 2003-2010).
Laura M. Del Prato (1964)
Year of Election or Appointment: 2018
President and Treasurer
Ms. Del Prato also serves as an officer of other funds. Ms. Del Prato serves as Assistant Treasurer of FIMM, LLC (2021-present) and is an employee of Fidelity Investments (2017-present). Previously, Ms. Del Prato served as President and Treasurer of The North Carolina Capital Management Trust: Cash Portfolio and Term Portfolio (2018-2020). Prior to joining Fidelity Investments, Ms. Del Prato served as a Managing Director and Treasurer of the JPMorgan Mutual Funds (2014-2017). Prior to JPMorgan, Ms. Del Prato served as a partner at Cohen Fund Audit Services (accounting firm, 2012-2013) and KPMG LLP (accounting firm, 2004-2012).
Colm A. Hogan (1973)
Year of Election or Appointment: 2016
Assistant Treasurer
Mr. Hogan also serves as an officer of other funds. Mr. Hogan serves as Assistant Treasurer of FIMM, LLC (2021-present) and FMR Capital, Inc. (2017-present) and is an employee of Fidelity Investments (2005-present). Previously, Mr. Hogan served as Deputy Treasurer of certain Fidelity® funds (2016-2020) and Assistant Treasurer of certain Fidelity® funds (2016-2018).
Cynthia Lo Bessette (1969)
Year of Election or Appointment: 2019
Secretary and Chief Legal Officer (CLO)
Ms. Lo Bessette also serves as an officer of other funds. Ms. Lo Bessette serves as CLO, Secretary, and Senior Vice President of Fidelity Management & Research Company LLC (investment adviser firm, 2019-present); CLO of Fidelity Management & Research (Hong Kong) Limited, FMR Investment Management (UK) Limited, and Fidelity Management & Research (Japan) Limited (investment adviser firms, 2019-present); Secretary of FD Funds GP LLC (2021-present), FD Funds Holding LLC (2021-present), and FD Funds Management LLC (2021-present); and Assistant Secretary of FIMM, LLC (2019-present). She is a Senior Vice President and Deputy General Counsel of FMR LLC (diversified financial services company, 2019-present), and is an employee of Fidelity Investments. Previously, Ms. Lo Bessette served as CLO, Secretary, and Senior Vice President of FMR Co., Inc. (investment adviser firm, 2019); Secretary of Fidelity SelectCo, LLC and Fidelity Investments Money Management, Inc. (investment adviser firms, 2019). Prior to joining Fidelity Investments, Ms. Lo Bessette was Executive Vice President, General Counsel (2016-2019) and Senior Vice President, Deputy General Counsel (2015-2016) of OppenheimerFunds (investment management company) and Deputy Chief Legal Officer (2013-2015) of Jennison Associates LLC (investment adviser firm).
Chris Maher (1972)
Year of Election or Appointment: 2013
Assistant Treasurer
Mr. Maher also serves as an officer of other funds. Mr. Maher serves as Assistant Treasurer of FIMM, LLC (2021-present) and FMR Capital, Inc. (2017-present), and is an employee of Fidelity Investments (2008-present). Previously, Mr. Maher served as Assistant Treasurer of certain funds (2013-2020); Vice President of Asset Management Compliance (2013), Vice President of the Program Management Group of FMR (investment adviser firm, 2010-2013), and Vice President of Valuation Oversight (2008-2010).
Kenneth B. Robins (1969)
Year of Election or Appointment: 2020
Chief Compliance Officer
Mr. Robins also serves as an officer of other funds. Mr. Robins serves as Compliance Officer of Fidelity Management & Research Company LLC (investment adviser firm, 2016-present) and is an employee of Fidelity Investments (2004-present). Previously, Mr. Robins served as Compliance Officer of FMR Co., Inc. (investment adviser firm, 2016-2019), as Executive Vice President of Fidelity Investments Money Management, Inc. (investment adviser firm, 2013-2016) and served in other fund officer roles.
Brett Segaloff (1972)
Year of Election or Appointment: 2021
Anti-Money Laundering (AML) Officer
Mr. Segaloff also serves as an AML Officer of other funds and other related entities. He is Director, Anti-Money Laundering (2007-present) of FMR LLC (diversified financial services company) and is an employee of Fidelity Investments (1996-present).
Stacie M. Smith (1974)
Year of Election or Appointment: 2013
Assistant Treasurer
Ms. Smith also serves as an officer of other funds. Ms. Smith serves as Assistant Treasurer of FIMM, LLC (2021-present) and FMR Capital, Inc. (2017-present), is an employee of Fidelity Investments (2009-present), and has served in other fund officer roles. Prior to joining Fidelity Investments, Ms. Smith served as Senior Audit Manager of Ernst & Young LLP (accounting firm, 1996-2009). Previously, Ms. Smith served as Assistant Treasurer (2013-2019) and Deputy Treasurer (2013-2016) of certain Fidelity® funds.
Jim Wegmann (1979)
Year of Election or Appointment: 2021
Deputy Treasurer
Mr. Wegmann also serves as an officer of other funds. Mr. Wegmann serves as Assistant Treasurer of FIMM, LLC (2021-present) and is an employee of Fidelity Investments (2011-present). Previously, Mr. Wegmann served as Assistant Treasurer of certain Fidelity® funds (2019-2021).
Vadim Zlotnikov (1962)
Year of Election or Appointment: 2019
Vice President
Mr. Zlotnikov also serves as Vice President of other funds. Mr. Zlotnikov serves as President and Director of Fidelity Diversifying Solutions LLC (investment adviser firm, 2021-present), President and Director of FIAM LLC (investment adviser firm, 2020-present), and is an employee of Fidelity Investments (2018-present). Previously, Mr. Zlotnikov served as President and Chief Investment Officer of Global Asset Allocation (2018-2020). Prior to joining Fidelity Investments, Mr. Zlotnikov served as Co-Head of Multi-Asset Solutions, Chief Market Strategist, and CIO of Systematic Strategies with AllianceBernstein (investment adviser firm, 2002-2018).
Shareholder Expense Example
As a shareholder, you incur two types of costs: (1) transaction costs, which may include sales charges (loads) on purchase payments or redemption proceeds, as applicable and (2) ongoing costs, which generally include management fees, distribution and/or service (12b-1) fees and other Fund expenses. This Example is intended to help you understand your ongoing costs (in dollars) of investing in a fund and to compare these costs with the ongoing costs of investing in other mutual funds.
The Example is based on an investment of $1,000 invested at the beginning of the period and held for the entire period (October 1, 2021 to March 31, 2022).
Actual Expenses
The first line of the accompanying table provides information about actual account values and actual expenses. You may use the information in this line, together with the amount you invested, to estimate the expenses that you paid over the period. Simply divide your account value by $1,000.00 (for example, an $8,600 account value divided by $1,000.00 = 8.6), then multiply the result by the number in the first line for a class/Fund under the heading entitled "Expenses Paid During Period" to estimate the expenses you paid on your account during this period. If any fund is a shareholder of any underlying mutual funds or exchange-traded funds (ETFs) (the Underlying Funds), such fund indirectly bears its proportional share of the expenses of the Underlying Funds in addition to the direct expenses incurred presented in the table. These fees and expenses are not included in the annualized expense ratio used to calculate the expense estimate in the table below.
Hypothetical Example for Comparison Purposes
The second line of the accompanying table provides information about hypothetical account values and hypothetical expenses based on the actual expense ratio and an assumed rate of return of 5% per year before expenses, which is not the actual return. The hypothetical account values and expenses may not be used to estimate the actual ending account balance or expenses you paid for the period. You may use this information to compare the ongoing costs of investing in the Fund and other funds. To do so, compare this 5% hypothetical example with the 5% hypothetical examples that appear in the shareholder reports of the other funds. If any fund is a shareholder of any Underlying Funds, such fund indirectly bears its proportional share of the expenses of the Underlying Funds in addition to the direct expenses as presented in the table. These fees and expenses are not included in the annualized expense ratio used to calculate the expense estimate in the table below.
Please note that the expenses shown in the table are meant to highlight your ongoing costs only and do not reflect any transaction costs. Therefore, the second line of the table is useful in comparing ongoing costs only, and will not help you determine the relative total costs of owning different funds. In addition, if these transactional costs were included, your costs would have been higher.
| | Annualized Expense Ratio-A | Beginning
Account Value
October 1, 2021 | Ending
Account Value
March 31, 2022 | Expenses Paid
During Period-B
October 1, 2021
to March 31, 2022 |
| Fidelity Advisor Freedom Income Fund | | | | |
| Class A | .72% | | | |
| Actual | | $1,000.00 | $965.80 | $3.53 |
| Hypothetical-C | | $1,000.00 | $1,021.34 | $3.63 |
| Class M | .97% | | | |
| Actual | | $1,000.00 | $963.90 | $4.75 |
| Hypothetical-C | | $1,000.00 | $1,020.09 | $4.89 |
| Class C | 1.47% | | | |
| Actual | | $1,000.00 | $961.60 | $7.19 |
| Hypothetical-C | | $1,000.00 | $1,017.60 | $7.39 |
| Class I | .47% | | | |
| Actual | | $1,000.00 | $966.20 | $2.30 |
| Hypothetical-C | | $1,000.00 | $1,022.59 | $2.37 |
| Class Z | .41% | | | |
| Actual | | $1,000.00 | $966.50 | $2.01 |
| Hypothetical-C | | $1,000.00 | $1,022.89 | $2.07 |
| Class Z6 | .36% | | | |
| Actual | | $1,000.00 | $966.80 | $1.77 |
| Hypothetical-C | | $1,000.00 | $1,023.14 | $1.82 |
| Fidelity Advisor Freedom 2005 Fund | | | | |
| Class A | .72% | | | |
| Actual | | $1,000.00 | $965.20 | $3.53 |
| Hypothetical-C | | $1,000.00 | $1,021.34 | $3.63 |
| Class M | .96% | | | |
| Actual | | $1,000.00 | $964.40 | $4.70 |
| Hypothetical-C | | $1,000.00 | $1,020.14 | $4.84 |
| Class C | 1.46% | | | |
| Actual | | $1,000.00 | $962.00 | $7.14 |
| Hypothetical-C | | $1,000.00 | $1,017.65 | $7.34 |
| Class I | .47% | | | |
| Actual | | $1,000.00 | $966.60 | $2.30 |
| Hypothetical-C | | $1,000.00 | $1,022.59 | $2.37 |
| Class Z | .42% | | | |
| Actual | | $1,000.00 | $967.00 | $2.06 |
| Hypothetical-C | | $1,000.00 | $1,022.84 | $2.12 |
| Class Z6 | .36% | | | |
| Actual | | $1,000.00 | $967.30 | $1.77 |
| Hypothetical-C | | $1,000.00 | $1,023.14 | $1.82 |
| Fidelity Advisor Freedom 2010 Fund | | | | |
| Class A | .75% | | | |
| Actual | | $1,000.00 | $966.20 | $3.68 |
| Hypothetical-C | | $1,000.00 | $1,021.19 | $3.78 |
| Class M | 1.00% | | | |
| Actual | | $1,000.00 | $965.10 | $4.90 |
| Hypothetical-C | | $1,000.00 | $1,019.95 | $5.04 |
| Class C | 1.50% | | | |
| Actual | | $1,000.00 | $962.70 | $7.34 |
| Hypothetical-C | | $1,000.00 | $1,017.45 | $7.54 |
| Class I | .50% | | | |
| Actual | | $1,000.00 | $966.90 | $2.45 |
| Hypothetical-C | | $1,000.00 | $1,022.44 | $2.52 |
| Class Z | .44% | | | |
| Actual | | $1,000.00 | $966.60 | $2.16 |
| Hypothetical-C | | $1,000.00 | $1,022.74 | $2.22 |
| Class Z6 | .38% | | | |
| Actual | | $1,000.00 | $967.40 | $1.86 |
| Hypothetical-C | | $1,000.00 | $1,023.04 | $1.92 |
| Fidelity Advisor Freedom 2015 Fund | | | | |
| Class A | .79% | | | |
| Actual | | $1,000.00 | $966.00 | $3.87 |
| Hypothetical-C | | $1,000.00 | $1,020.99 | $3.98 |
| Class M | 1.04% | | | |
| Actual | | $1,000.00 | $964.90 | $5.09 |
| Hypothetical-C | | $1,000.00 | $1,019.75 | $5.24 |
| Class C | 1.54% | | | |
| Actual | | $1,000.00 | $962.50 | $7.53 |
| Hypothetical-C | | $1,000.00 | $1,017.25 | $7.75 |
| Class I | .54% | | | |
| Actual | | $1,000.00 | $967.70 | $2.65 |
| Hypothetical-C | | $1,000.00 | $1,022.24 | $2.72 |
| Class Z | .47% | | | |
| Actual | | $1,000.00 | $967.60 | $2.31 |
| Hypothetical-C | | $1,000.00 | $1,022.59 | $2.37 |
| Class Z6 | .40% | | | |
| Actual | | $1,000.00 | $967.50 | $1.96 |
| Hypothetical-C | | $1,000.00 | $1,022.94 | $2.02 |
| Fidelity Advisor Freedom 2020 Fund | | | | |
| Class A | .83% | | | |
| Actual | | $1,000.00 | $965.60 | $4.07 |
| Hypothetical-C | | $1,000.00 | $1,020.79 | $4.18 |
| Class M | 1.08% | | | |
| Actual | | $1,000.00 | $964.40 | $5.29 |
| Hypothetical-C | | $1,000.00 | $1,019.55 | $5.44 |
| Class C | 1.58% | | | |
| Actual | | $1,000.00 | $962.40 | $7.73 |
| Hypothetical-C | | $1,000.00 | $1,017.05 | $7.95 |
| Class I | .58% | | | |
| Actual | | $1,000.00 | $967.20 | $2.84 |
| Hypothetical-C | | $1,000.00 | $1,022.04 | $2.92 |
| Class Z | .51% | | | |
| Actual | | $1,000.00 | $967.10 | $2.50 |
| Hypothetical-C | | $1,000.00 | $1,022.39 | $2.57 |
| Class Z6 | .42% | | | |
| Actual | | $1,000.00 | $968.00 | $2.06 |
| Hypothetical-C | | $1,000.00 | $1,022.84 | $2.12 |
| Fidelity Advisor Freedom 2025 Fund | | | | |
| Class A | .88% | | | |
| Actual | | $1,000.00 | $966.80 | $4.32 |
| Hypothetical-C | | $1,000.00 | $1,020.54 | $4.43 |
| Class M | 1.13% | | | |
| Actual | | $1,000.00 | $965.70 | $5.54 |
| Hypothetical-C | | $1,000.00 | $1,019.30 | $5.69 |
| Class C | 1.63% | | | |
| Actual | | $1,000.00 | $963.40 | $7.98 |
| Hypothetical-C | | $1,000.00 | $1,016.80 | $8.20 |
| Class I | .63% | | | |
| Actual | | $1,000.00 | $968.30 | $3.09 |
| Hypothetical-C | | $1,000.00 | $1,021.79 | $3.18 |
| Class Z | .54% | | | |
| Actual | | $1,000.00 | $967.90 | $2.65 |
| Hypothetical-C | | $1,000.00 | $1,022.24 | $2.72 |
| Class Z6 | .44% | | | |
| Actual | | $1,000.00 | $968.60 | $2.16 |
| Hypothetical-C | | $1,000.00 | $1,022.74 | $2.22 |
| Fidelity Advisor Freedom 2030 Fund | | | | |
| Class A | .92% | | | |
| Actual | | $1,000.00 | $968.00 | $4.51 |
| Hypothetical-C | | $1,000.00 | $1,020.34 | $4.63 |
| Class M | 1.17% | | | |
| Actual | | $1,000.00 | $966.60 | $5.74 |
| Hypothetical-C | | $1,000.00 | $1,019.10 | $5.89 |
| Class C | 1.67% | | | |
| Actual | | $1,000.00 | $964.70 | $8.18 |
| Hypothetical-C | | $1,000.00 | $1,016.60 | $8.40 |
| Class I | .67% | | | |
| Actual | | $1,000.00 | $969.60 | $3.29 |
| Hypothetical-C | | $1,000.00 | $1,021.59 | $3.38 |
| Class Z | .58% | | | |
| Actual | | $1,000.00 | $969.30 | $2.85 |
| Hypothetical-C | | $1,000.00 | $1,022.04 | $2.92 |
| Class Z6 | .46% | | | |
| Actual | | $1,000.00 | $970.00 | $2.26 |
| Hypothetical-C | | $1,000.00 | $1,022.64 | $2.32 |
| Fidelity Advisor Freedom 2035 Fund | | | | |
| Class A | .96% | | | |
| Actual | | $1,000.00 | $972.60 | $4.72 |
| Hypothetical-C | | $1,000.00 | $1,020.14 | $4.84 |
| Class M | 1.21% | | | |
| Actual | | $1,000.00 | $971.10 | $5.95 |
| Hypothetical-C | | $1,000.00 | $1,018.90 | $6.09 |
| Class C | 1.71% | | | |
| Actual | | $1,000.00 | $968.40 | $8.39 |
| Hypothetical-C | | $1,000.00 | $1,016.40 | $8.60 |
| Class I | .71% | | | |
| Actual | | $1,000.00 | $973.60 | $3.49 |
| Hypothetical-C | | $1,000.00 | $1,021.39 | $3.58 |
| Class Z | .61% | | | |
| Actual | | $1,000.00 | $974.10 | $3.00 |
| Hypothetical-C | | $1,000.00 | $1,021.89 | $3.07 |
| Class Z6 | .48% | | | |
| Actual | | $1,000.00 | $974.40 | $2.36 |
| Hypothetical-C | | $1,000.00 | $1,022.54 | $2.42 |
| Fidelity Advisor Freedom 2040 Fund | | | | |
| Class A | 1.00% | | | |
| Actual | | $1,000.00 | $977.00 | $4.93 |
| Hypothetical-C | | $1,000.00 | $1,019.95 | $5.04 |
| Class M | 1.25% | | | |
| Actual | | $1,000.00 | $976.10 | $6.16 |
| Hypothetical-C | | $1,000.00 | $1,018.70 | $6.29 |
| Class C | 1.75% | | | |
| Actual | | $1,000.00 | $973.10 | $8.61 |
| Hypothetical-C | | $1,000.00 | $1,016.21 | $8.80 |
| Class I | .75% | | | |
| Actual | | $1,000.00 | $978.10 | $3.70 |
| Hypothetical-C | | $1,000.00 | $1,021.19 | $3.78 |
| Class Z | .64% | | | |
| Actual | | $1,000.00 | $978.70 | $3.16 |
| Hypothetical-C | | $1,000.00 | $1,021.74 | $3.23 |
| Class Z6 | .49% | | | |
| Actual | | $1,000.00 | $979.50 | $2.42 |
| Hypothetical-C | | $1,000.00 | $1,022.49 | $2.47 |
| Fidelity Advisor Freedom 2045 Fund | | | | |
| Class A | 1.00% | | | |
| Actual | | $1,000.00 | $977.30 | $4.93 |
| Hypothetical-C | | $1,000.00 | $1,019.95 | $5.04 |
| Class M | 1.25% | | | |
| Actual | | $1,000.00 | $975.90 | $6.16 |
| Hypothetical-C | | $1,000.00 | $1,018.70 | $6.29 |
| Class C | 1.75% | | | |
| Actual | | $1,000.00 | $973.10 | $8.61 |
| Hypothetical-C | | $1,000.00 | $1,016.21 | $8.80 |
| Class I | .75% | | | |
| Actual | | $1,000.00 | $978.00 | $3.70 |
| Hypothetical-C | | $1,000.00 | $1,021.19 | $3.78 |
| Class Z | .64% | | | |
| Actual | | $1,000.00 | $978.50 | $3.16 |
| Hypothetical-C | | $1,000.00 | $1,021.74 | $3.23 |
| Class Z6 | .49% | | | |
| Actual | | $1,000.00 | $979.40 | $2.42 |
| Hypothetical-C | | $1,000.00 | $1,022.49 | $2.47 |
| Fidelity Advisor Freedom 2050 Fund | | | | |
| Class A | 1.00% | | | |
| Actual | | $1,000.00 | $977.10 | $4.93 |
| Hypothetical-C | | $1,000.00 | $1,019.95 | $5.04 |
| Class M | 1.25% | | | |
| Actual | | $1,000.00 | $975.70 | $6.16 |
| Hypothetical-C | | $1,000.00 | $1,018.70 | $6.29 |
| Class C | 1.75% | | | |
| Actual | | $1,000.00 | $972.90 | $8.61 |
| Hypothetical-C | | $1,000.00 | $1,016.21 | $8.80 |
| Class I | .75% | | | |
| Actual | | $1,000.00 | $977.80 | $3.70 |
| Hypothetical-C | | $1,000.00 | $1,021.19 | $3.78 |
| Class Z | .64% | | | |
| Actual | | $1,000.00 | $979.00 | $3.16 |
| Hypothetical-C | | $1,000.00 | $1,021.74 | $3.23 |
| Class Z6 | .49% | | | |
| Actual | | $1,000.00 | $979.10 | $2.42 |
| Hypothetical-C | | $1,000.00 | $1,022.49 | $2.47 |
| Fidelity Advisor Freedom 2055 Fund | | | | |
| Class A | 1.00% | | | |
| Actual | | $1,000.00 | $976.90 | $4.93 |
| Hypothetical-C | | $1,000.00 | $1,019.95 | $5.04 |
| Class M | 1.25% | | | |
| Actual | | $1,000.00 | $976.30 | $6.16 |
| Hypothetical-C | | $1,000.00 | $1,018.70 | $6.29 |
| Class C | 1.75% | | | |
| Actual | | $1,000.00 | $973.50 | $8.61 |
| Hypothetical-C | | $1,000.00 | $1,016.21 | $8.80 |
| Class I | .75% | | | |
| Actual | | $1,000.00 | $977.80 | $3.70 |
| Hypothetical-C | | $1,000.00 | $1,021.19 | $3.78 |
| Class Z | .64% | | | |
| Actual | | $1,000.00 | $978.30 | $3.16 |
| Hypothetical-C | | $1,000.00 | $1,021.74 | $3.23 |
| Class Z6 | .49% | | | |
| Actual | | $1,000.00 | $979.90 | $2.42 |
| Hypothetical-C | | $1,000.00 | $1,022.49 | $2.47 |
| Fidelity Advisor Freedom 2060 Fund | | | | |
| Class A | 1.00% | | | |
| Actual | | $1,000.00 | $976.40 | $4.93 |
| Hypothetical-C | | $1,000.00 | $1,019.95 | $5.04 |
| Class M | 1.25% | | | |
| Actual | | $1,000.00 | $975.50 | $6.16 |
| Hypothetical-C | | $1,000.00 | $1,018.70 | $6.29 |
| Class C | 1.75% | | | |
| Actual | | $1,000.00 | $972.70 | $8.61 |
| Hypothetical-C | | $1,000.00 | $1,016.21 | $8.80 |
| Class I | .75% | | | |
| Actual | | $1,000.00 | $978.50 | $3.70 |
| Hypothetical-C | | $1,000.00 | $1,021.19 | $3.78 |
| Class Z | .64% | | | |
| Actual | | $1,000.00 | $978.30 | $3.16 |
| Hypothetical-C | | $1,000.00 | $1,021.74 | $3.23 |
| Class Z6 | .49% | | | |
| Actual | | $1,000.00 | $979.20 | $2.42 |
| Hypothetical-C | | $1,000.00 | $1,022.49 | $2.47 |
| Fidelity Advisor Freedom 2065 Fund | | | | |
| Class A | 1.00% | | | |
| Actual | | $1,000.00 | $976.40 | $4.93 |
| Hypothetical-C | | $1,000.00 | $1,019.95 | $5.04 |
| Class M | 1.25% | | | |
| Actual | | $1,000.00 | $975.10 | $6.16 |
| Hypothetical-C | | $1,000.00 | $1,018.70 | $6.29 |
| Class C | 1.75% | | | |
| Actual | | $1,000.00 | $973.00 | $8.61 |
| Hypothetical-C | | $1,000.00 | $1,016.21 | $8.80 |
| Class I | .75% | | | |
| Actual | | $1,000.00 | $977.70 | $3.70 |
| Hypothetical-C | | $1,000.00 | $1,021.19 | $3.78 |
| Class Z | .64% | | | |
| Actual | | $1,000.00 | $978.00 | $3.16 |
| Hypothetical-C | | $1,000.00 | $1,021.74 | $3.23 |
| Class Z6 | .49% | | | |
| Actual | | $1,000.00 | $979.20 | $2.42 |
| Hypothetical-C | | $1,000.00 | $1,022.49 | $2.47 |
A Annualized expense ratio reflects expenses net of applicable fee waivers.
B Expenses are equal to the annualized expense ratio, multiplied by the average account value over the period, multiplied by 182/ 365 (to reflect the one-half year period). The fees and expenses of any Underlying Funds are not included in each annualized expense ratio.
C 5% return per year before expenses
Distributions (Unaudited)
The dividend and capital gains distributions for the fund(s) are available on Fidelity.com or Institutional.Fidelity.com.
The funds hereby designate as capital gain dividend the amounts noted below for the taxable year ended March 31, 2022, or, if subsequently determined to be different, the net capital gain of such year.
| Fidelity Advisor Freedom Income Fund | $6,774,546 |
| Fidelity Advisor Freedom 2005 Fund | $6,352,413 |
| Fidelity Advisor Freedom 2010 Fund | $18,283,137 |
| Fidelity Advisor Freedom 2015 Fund | $49,436,189 |
| Fidelity Advisor Freedom 2020 Fund | $134,378,196 |
| Fidelity Advisor Freedom 2025 Fund | $190,526,836 |
| Fidelity Advisor Freedom 2030 Fund | $226,016,105 |
| Fidelity Advisor Freedom 2035 Fund | $219,664,564 |
| Fidelity Advisor Freedom 2040 Fund | $219,499,000 |
| Fidelity Advisor Freedom 2045 Fund | $151,127,237 |
| Fidelity Advisor Freedom 2050 Fund | $126,495,475 |
| Fidelity Advisor Freedom 2055 Fund | $77,093,818 |
| Fidelity Advisor Freedom 2060 Fund | $30,340,587 |
| Fidelity Advisor Freedom 2065 Fund | $3,218,656 |
|
A percentage of the dividends distributed during the fiscal year for the following funds were derived from interest on U.S. Government securities which is generally exempt from state income tax:
| Fidelity Advisor Freedom Income Fund | 20.75% |
| Fidelity Advisor Freedom 2005 Fund | 18.74% |
| Fidelity Advisor Freedom 2010 Fund | 14.02% |
| Fidelity Advisor Freedom 2015 Fund | 10.71% |
| Fidelity Advisor Freedom 2020 Fund | 8.22% |
| Fidelity Advisor Freedom 2025 Fund | 6.79% |
| Fidelity Advisor Freedom 2030 Fund | 5.58% |
| Fidelity Advisor Freedom 2035 Fund | 2.58% |
| Fidelity Advisor Freedom 2040 Fund | 1.90% |
| Fidelity Advisor Freedom 2045 Fund | 1.88% |
| Fidelity Advisor Freedom 2050 Fund | 1.88% |
| Fidelity Advisor Freedom 2055 Fund | 1.87% |
| Fidelity Advisor Freedom 2060 Fund | 1.84% |
| Fidelity Advisor Freedom 2065 Fund | 1.74% |
|
A percentage of the dividends distributed during the fiscal year for the following funds qualify for the dividends–received deduction for corporate shareholders:
| | Class A | Class M | Class C | Class I | Class Z | Class Z6 |
| Fidelity Advisor Freedom Income Fund | | | | | | |
| April 2021 | – | – | – | 0% | 0% | 0% |
| May 2021 | 0% | 0% | 0% | 0% | 0% | 0% |
| June 2021 | 8% | – | – | 2% | 2% | 2% |
| July 2021 | 5% | – | – | 2% | 2% | 2% |
| August 2021 | 5% | – | – | 2% | 2% | 2% |
| September 2021 | 4% | 7% | – | 2% | 2% | 2% |
| October 2021 | 3% | 3% | 3% | 3% | 3% | 3% |
| November 2021 | 5% | – | – | 2% | 2% | 2% |
| December 2021 | 3% | 3% | 3% | 3% | 3% | 3% |
| February 2022 | 12% | – | – | 4% | 4% | 3% |
| March 2022 | – | – | – | 6% | 4% | 4% |
| Fidelity Advisor Freedom 2005 Fund | | | | | | |
| May 2021 | 4% | 34% | – | 2% | 2% | 2% |
| December 2021 | 4% | 4% | 5% | 3% | 3% | 3% |
| Fidelity Advisor Freedom 2010 Fund | | | | | | |
| May 2021 | 12% | – | – | 5% | 4% | 4% |
| December 2021 | 6% | 6% | 7% | 5% | 5% | 5% |
| Fidelity Advisor Freedom 2015 Fund | | | | | | |
| May 2021 | 96% | – | – | 11% | 8% | 7% |
| December 2021 | 7% | 8% | 9% | 7% | 6% | 6% |
| Fidelity Advisor Freedom 2020 Fund | | | | | | |
| May 2021 | – | – | – | 100% | 97% | 54% |
| December 2021 | 8% | 9% | 10% | 8% | 8% | 7% |
| Fidelity Advisor Freedom 2025 Fund | | | | | | |
| May 2021 | – | – | – | – | – | – |
| December 2021 | 9% | 10% | 11% | 9% | 8% | 8% |
| Fidelity Advisor Freedom 2030 Fund | | | | | | |
| May 2021 | – | – | – | – | – | – |
| December 2021 | 10% | 10% | 12% | 9% | 9% | 9% |
| Fidelity Advisor Freedom 2035 Fund | | | | | | |
| May 2021 | – | – | – | – | – | – |
| December 2021 | 12% | 13% | 14% | 12% | 11% | 11% |
| Fidelity Advisor Freedom 2040 Fund | | | | | | |
| May 2021 | – | – | – | – | – | – |
| December 2021 | 14% | 14% | 16% | 13% | 12% | 12% |
| Fidelity Advisor Freedom 2045 Fund | | | | | | |
| May 2021 | – | – | – | – | – | – |
| December 2021 | 14% | 14% | 16% | 13% | 12% | 12% |
| Fidelity Advisor Freedom 2050 Fund | | | | | | |
| May 2021 | – | – | – | – | – | – |
| December 2021 | 14% | 14% | 16% | 13% | 12% | 12% |
| Fidelity Advisor Freedom 2055 Fund | | | | | | |
| May 2021 | – | – | – | – | – | – |
| December 2021 | 14% | 15% | 16% | 13% | 13% | 12% |
| Fidelity Advisor Freedom 2060 Fund | | | | | | |
| May 2021 | 50% | – | – | 14% | 10% | 9% |
| December 2021 | 14% | 15% | 16% | 13% | 13% | 13% |
| Fidelity Advisor Freedom 2065 Fund | | | | | | |
| May 2021 | 11% | 34% | – | 7% | 7% | 5% |
| December 2021 | 14% | 14% | 16% | 13% | 13% | 13% |
|
A percentage of the dividends distributed during the fiscal year for the following funds may be taken into account as a dividend for purposes of the maximum rate under section 1(h)(11) of the Internal Revenue Code.
| | Class A | Class M | Class C | Class I | Class Z | Class Z6 |
| Fidelity Advisor Freedom Income Fund | | | | | | |
| April 2021 | – | – | – | 0% | 0% | 0% |
| May 2021 | 2% | 2% | 2% | 2% | 2% | 2% |
| June 2021 | 31% | – | – | 8% | 8% | 8% |
| July 2021 | 19% | – | – | 10% | 8% | 8% |
| August 2021 | 18% | – | – | 9% | 9% | 8% |
| September 2021 | 14% | 27% | – | 9% | 8% | 7% |
| October 2021 | 11% | 12% | 12% | 11% | 11% | 11% |
| November 2021 | 18% | – | – | 9% | 9% | 8% |
| December 2021 | 11% | 12% | 13% | 11% | 11% | 11% |
| Fidelity Advisor Freedom 2005 Fund | | | | | | |
| May 2021 | 5% | 39% | – | 3% | 3% | 2% |
| December 2021 | 13% | 14% | 18% | 12% | 11% | 11% |
| Fidelity Advisor Freedom 2010 Fund | | | | | | |
| May 2021 | 13% | – | – | 6% | 5% | 5% |
| December 2021 | 16% | 17% | 21% | 15% | 15% | 14% |
| Fidelity Advisor Freedom 2015 Fund | | | | | | |
| May 2021 | 100% | – | – | 13% | 10% | 9% |
| December 2021 | 18% | 20% | 24% | 17% | 17% | 16% |
| Fidelity Advisor Freedom 2020 Fund | | | | | | |
| May 2021 | – | – | – | 100% | 100% | 59% |
| December 2021 | 21% | 22% | 26% | 19% | 19% | 19% |
| Fidelity Advisor Freedom 2025 Fund | | | | | | |
| May 2021 | – | – | – | – | – | – |
| December 2021 | 22% | 23% | 27% | 21% | 20% | 20% |
| Fidelity Advisor Freedom 2030 Fund | | | | | | |
| May 2021 | – | – | – | – | – | – |
| December 2021 | 24% | 25% | 28% | 22% | 22% | 21% |
| Fidelity Advisor Freedom 2035 Fund | | | | | | |
| May 2021 | – | – | – | – | – | – |
| December 2021 | 28% | 30% | 33% | 27% | 26% | 25% |
| Fidelity Advisor Freedom 2040 Fund | | | | | | |
| May 2021 | – | – | – | – | – | – |
| December 2021 | 30% | 32% | 36% | 29% | 28% | 27% |
| Fidelity Advisor Freedom 2045 Fund | | | | | | |
| May 2021 | – | – | – | – | – | – |
| December 2021 | 31% | 32% | 36% | 29% | 28% | 28% |
| Fidelity Advisor Freedom 2050 Fund | | | | | | |
| May 2021 | – | – | – | – | – | – |
| December 2021 | 31% | 32% | 36% | 29% | 28% | 28% |
| Fidelity Advisor Freedom 2055 Fund | | | | | | |
| May 2021 | – | – | – | – | – | – |
| December 2021 | 31% | 33% | 36% | 30% | 29% | 28% |
| Fidelity Advisor Freedom 2060 Fund | | | | | | |
| May 2021 | 44% | – | – | 13% | 10% | 8% |
| December 2021 | 32% | 33% | 37% | 30% | 29% | 28% |
| Fidelity Advisor Freedom 2065 Fund | | | | | | |
| May 2021 | 11% | 35% | – | 7% | 7% | 6% |
| December 2021 | 32% | 32% | 37% | 31% | 30% | 29% |
|
A percentage of the dividends distributed during the fiscal year for the following funds qualify as a section 199A dividend:
| | Class A | Class M | Class C | Class I | Class Z | Class Z6 |
| Fidelity Advisor Freedom Income Fund | | | | | | |
| April 2021 | – | – | – | 0% | 0% | 0% |
| May 2021 | 1% | 1% | 1% | 1% | 1% | 1% |
| June 2021 | 1% | – | – | 1% | 1% | 1% |
| July 2021 | 1% | – | – | 1% | 1% | 1% |
| August 2021 | 1% | – | – | 1% | 1% | 1% |
| September 2021 | 1% | 1% | – | 1% | 1% | 1% |
| October 2021 | 1% | 1% | 1% | 1% | 1% | 1% |
| November 2021 | 1% | – | – | 1% | 1% | 1% |
| December 2021 | 1% | 1% | 1% | 1% | 1% | 1% |
| February 2022 | 6% | – | – | 2% | 2% | 2% |
| March 2022 | – | – | – | 3% | 2% | 2% |
| Fidelity Advisor Freedom 2005 Fund | | | | | | |
| May 2021 | 1% | 1% | – | 1% | 1% | 1% |
| December 2021 | 1% | 1% | 1% | 1% | 1% | 1% |
| Fidelity Advisor Freedom 2010 Fund | | | | | | |
| May 2021 | 1% | – | – | 1% | 1% | 1% |
| December 2021 | 1% | 1% | 1% | 1% | 1% | 1% |
| Fidelity Advisor Freedom 2015 Fund | | | | | | |
| May 2021 | – | – | – | 1% | 1% | 1% |
| December 2021 | 1% | 1% | 1% | 1% | 1% | 1% |
| Fidelity Advisor Freedom 2020 Fund | | | | | | |
| May 2021 | – | – | – | – | – | 1% |
| December 2021 | 1% | 1% | 1% | 1% | 1% | 1% |
| Fidelity Advisor Freedom 2025 Fund | | | | | | |
| May 2021 | – | – | – | – | – | – |
| December 2021 | 1% | 1% | 1% | 1% | 1% | 1% |
| Fidelity Advisor Freedom 2030 Fund | | | | | | |
| May 2021 | – | – | – | – | – | – |
| December 2021 | 1% | 1% | 1% | 1% | 1% | 1% |
| Fidelity Advisor Freedom 2035 Fund | | | | | | |
| May 2021 | – | – | – | – | – | – |
| December 2021 | 1% | 1% | 1% | 1% | 1% | 1% |
| Fidelity Advisor Freedom 2040 Fund | | | | | | |
| May 2021 | – | – | – | – | – | – |
| December 2021 | 1% | 1% | 1% | 1% | 1% | 1% |
| Fidelity Advisor Freedom 2045 Fund | | | | | | |
| May 2021 | – | – | – | – | – | – |
| December 2021 | 1% | 1% | 1% | 1% | 1% | 1% |
| Fidelity Advisor Freedom 2050 Fund | | | | | | |
| May 2021 | – | – | – | – | – | – |
| December 2021 | 1% | 1% | 1% | 1% | 1% | 1% |
| Fidelity Advisor Freedom 2055 Fund | | | | | | |
| May 2021 | – | – | – | – | – | – |
| December 2021 | 1% | 1% | 1% | 1% | 1% | 1% |
| Fidelity Advisor Freedom 2060 Fund | | | | | | |
| May 2021 | 1% | – | – | 1% | 1% | 1% |
| December 2021 | 1% | 1% | 1% | 1% | 1% | 1% |
| Fidelity Advisor Freedom 2065 Fund | | | | | | |
| May 2021 | 1% | 1% | – | 1% | 1% | 1% |
| December 2021 | 1% | 1% | 1% | 1% | 1% | 1% |
|
The funds will notify shareholders in January 2023 of amounts for use in preparing 2022 income tax returns.
Liquidity Risk Management Program
The Securities and Exchange Commission adopted Rule 22e-4 under the Investment Company Act of 1940 (the Liquidity Rule) to promote effective liquidity risk management throughout the open-end investment company industry, thereby reducing the risk that funds will be unable to meet their redemption obligations and mitigating dilution of the interests of fund shareholders.
The Funds have adopted and implemented a liquidity risk management program pursuant to the Liquidity Rule (the Program) effective December 1, 2018. The Program is reasonably designed to assess and manage each Fund’s liquidity risk and to comply with the requirements of the Liquidity Rule. Each Fund’s Board of Trustees (the Board) has designated each Fund’s investment adviser as administrator of the Program. The Fidelity advisers have established a Liquidity Risk Management Committee (the LRM Committee) to manage the Program for each of the Fidelity Funds. The LRM Committee monitors the adequacy and effectiveness of implementation of the Program and on a periodic basis assesses each Fund’s liquidity risk based on a variety of factors including (1) the Fund’s investment strategy, (2) portfolio liquidity and cash flow projections during normal and reasonably foreseeable stressed conditions, (3) shareholder redemptions, (4) borrowings and other funding sources and (5) in the case of exchange-traded funds, certain additional factors including the effect of the Fund’s prices and spreads, market participants, and basket compositions on the overall liquidity of the Fund’s portfolio, as applicable.
In accordance with the Program, each of the Fund’s portfolio investments is classified into one of four liquidity categories described below based on a determination of a reasonable expectation for how long it would take to convert the investment to cash (or sell or dispose of the investment) without significantly changing its market value.
- Highly liquid investments – cash or convertible to cash within three business days or less
- Moderately liquid investments – convertible to cash in three to seven calendar days
- Less liquid investments – can be sold or disposed of, but not settled, within seven calendar days
- Illiquid investments – cannot be sold or disposed of within seven calendar days
Liquidity classification determinations take into account a variety of factors including various market, trading and investment-specific considerations, as well as market depth, and generally utilize analysis from a third-party liquidity metrics service.
The Liquidity Rule places a 15% limit on a fund’s illiquid investments and requires funds that do not primarily hold assets that are highly liquid investments to determine and maintain a minimum percentage of the fund’s net assets to be invested in highly liquid investments (highly liquid investment minimum or HLIM). The Program includes provisions reasonably designed to comply with the 15% limit on illiquid investments and for determining, periodically reviewing and complying with the HLIM requirement as applicable.
At a recent meeting of the Fund’s Board of Trustees, the LRM Committee provided a written report to the Board pertaining to the operation, adequacy, and effectiveness of implementation of the Program for the annual period from December 1, 2020 through November 30, 2021. The report concluded that the Program has been implemented and is operating effectively and is reasonably designed to assess and manage the Fund’s liquidity risk.

AFF-ANN-0522
1.792114.119
Fidelity Freedom® Funds - Income, 2005, 2010, 2015, 2020, 2025, 2030, 2035, 2040, 2045, 2050, 2055, 2060, 2065
Annual Report
March 31, 2022
Contents
To view a fund's proxy voting guidelines and proxy voting record for the 12-month period ended June 30, visit http://www.fidelity.com/proxyvotingresults or visit the Securities and Exchange Commission's (SEC) web site at http://www.sec.gov.
You may also call 1-800-544-8544 if you’re an individual investing directly with Fidelity, call 1-800-835-5092 if you’re a plan sponsor or participant with Fidelity as your recordkeeper or call 1-877-208-0098 on institutional accounts or if you’re an advisor or invest through one to request a free copy of the proxy voting guidelines.
Standard & Poor's, S&P and S&P 500 are registered service marks of The McGraw-Hill Companies, Inc. and have been licensed for use by Fidelity Distributors Corporation.
Other third-party marks appearing herein are the property of their respective owners.
All other marks appearing herein are registered or unregistered trademarks or service marks of FMR LLC or an affiliated company. © 2022 FMR LLC. All rights reserved.
This report and the financial statements contained herein are submitted for the general information of the shareholders of the Funds. This report is not authorized for distribution to prospective investors in the Funds unless preceded or accompanied by an effective prospectus.
A fund files its complete schedule of portfolio holdings with the SEC for the first and third quarters of each fiscal year on Form N-PORT. Forms N-PORT are available on the SEC’s web site at http://www.sec.gov. A fund's Forms N-PORT may be reviewed and copied at the SEC’s Public Reference Room in Washington, DC. Information regarding the operation of the SEC's Public Reference Room may be obtained by calling 1-800-SEC-0330.
For a complete list of a fund's portfolio holdings, view the most recent holdings listing, semiannual report, or annual report on Fidelity's web site at http://www.fidelity.com, http://www.institutional.fidelity.com, or http://www.401k.com, as applicable.
NOT FDIC INSURED •MAY LOSE VALUE •NO BANK GUARANTEE
Neither the Funds nor Fidelity Distributors Corporation is a bank.
Note to Shareholders:
Early in 2020, the outbreak and spread of COVID-19 emerged as a public health emergency that had a major influence on financial markets, primarily based on its impact on the global economy and corporate earnings. On March 11, 2020, the World Health Organization declared the COVID-19 outbreak a pandemic, citing sustained risk of further global spread. The pandemic prompted a number of measures to limit the spread of COVID-19, including travel and border restrictions, quarantines, and restrictions on large gatherings. In turn, these resulted in lower consumer activity, diminished demand for a wide range of products and services, disruption in manufacturing and supply chains, and – given the wide variability in outcomes regarding the outbreak – significant market uncertainty and volatility. To help stem the turmoil, the U.S. government took unprecedented action – in concert with the U.S. Federal Reserve and central banks around the world – to help support consumers, businesses, and the broader economy, and to limit disruption to the financial system.
In general, the overall impact of the pandemic lessened in 2021, amid a resilient economy and widespread distribution of three COVID-19 vaccines granted emergency use authorization from the U.S. Food and Drug Administration (FDA) early in the year. Still, the situation remains dynamic, and the extent and duration of its influence on financial markets and the economy is highly uncertain, due in part to a recent spike in cases based on highly contagious variants of the coronavirus.
Extreme events such as the COVID-19 crisis are exogenous shocks that can have significant adverse effects on mutual funds and their investments. Although multiple asset classes may be affected by market disruption, the duration and impact may not be the same for all types of assets. Fidelity is committed to helping you stay informed amid news about COVID-19 and during increased market volatility, and we continue to take extra steps to be responsive to customer needs. We encourage you to visit us online, where we offer ongoing updates, commentary, and analysis on the markets and our funds.
Fidelity Freedom® Income Fund
Performance: The Bottom Line
Average annual total return reflects the change in the value of an investment, assuming reinvestment of distributions from dividend income and capital gains (the profits earned upon the sale of securities that have grown in value, if any) and assuming a constant rate of performance each year. The hypothetical investment and the average annual total returns do not reflect the deduction of taxes that a shareholder would pay on fund distributions or the redemption of fund shares. During periods of reimbursement by Fidelity, a fund’s total return will be greater than it would be had the reimbursement not occurred. How a fund did yesterday is no guarantee of how it will do tomorrow.
Average Annual Total Returns
| Periods ended March 31, 2022 | Past 1 year | Past 5 years | Past 10 years |
| Fidelity Freedom® Income Fund | (0.76)% | 4.31% | 4.02% |
| Class K | (0.72)% | 4.35% | 4.04% |
| Class K6 | (0.64)% | 4.40% | 4.06% |
Prior to June 1, 2017, the fund operated under a different pricing structure. The fund’s historical performance prior to June 1, 2017 does not reflect the fund’s current pricing structure.
The initial offering of Class K6 shares took place on June 7, 2017. Returns prior to June 7, 2017 are those of Fidelity Freedom® Income Fund, the original class of the fund.
The initial offering of Class K shares took place on July 20, 2017. Returns prior to July 20, 2017 are those of Fidelity Freedom® Income Fund, the original class of the fund.
$10,000 Over 10 Years
Let's say hypothetically that $10,000 was invested in Fidelity Freedom® Income Fund, a class of the fund, on March 31, 2012.
The chart shows how the value of your investment would have changed, and also shows how the Bloomberg U.S. Aggregate Bond Index performed over the same period.
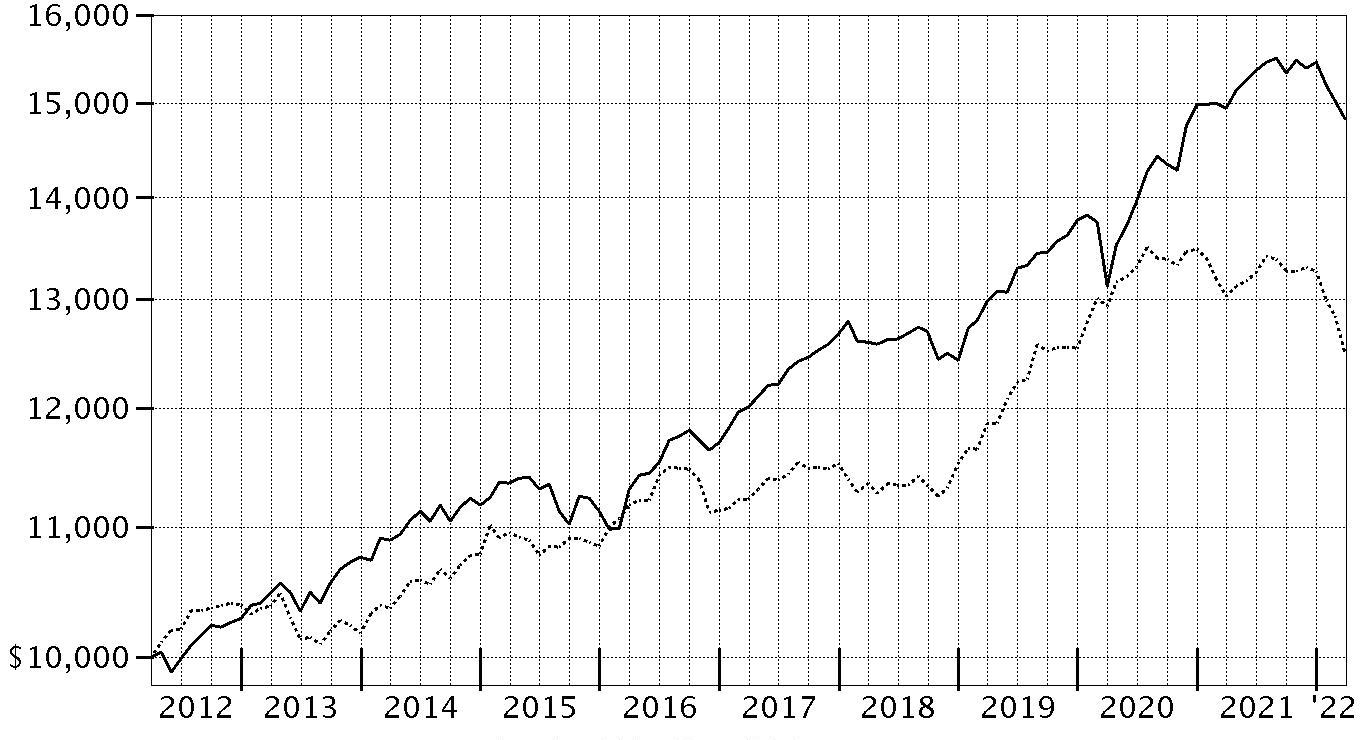
| Period Ending Values |
| $14,828 | Fidelity Freedom® Income Fund |
| $12,480 | Bloomberg U.S. Aggregate Bond Index |
Effective August 24, 2021, all Bloomberg Barclays Indices were re-branded as Bloomberg Indices.
Fidelity Freedom® 2005 Fund
Performance: The Bottom Line
Average annual total return reflects the change in the value of an investment, assuming reinvestment of distributions from dividend income and capital gains (the profits earned upon the sale of securities that have grown in value, if any) and assuming a constant rate of performance each year. The hypothetical investment and the average annual total returns do not reflect the deduction of taxes that a shareholder would pay on fund distributions or the redemption of fund shares. During periods of reimbursement by Fidelity, a fund’s total return will be greater than it would be had the reimbursement not occurred. How a fund did yesterday is no guarantee of how it will do tomorrow.
Average Annual Total Returns
| Periods ended March 31, 2022 | Past 1 year | Past 5 years | Past 10 years |
| Fidelity Freedom® 2005 Fund | (0.53)% | 5.01% | 4.94% |
| Class K | (0.49)% | 5.05% | 4.96% |
| Class K6 | (0.48)% | 5.10% | 4.98% |
Prior to June 1, 2017, the fund operated under a different pricing structure. The fund’s historical performance prior to June 1, 2017 does not reflect the fund’s current pricing structure.
The initial offering of Class K6 shares took place on June 7, 2017. Returns prior to June 7, 2017 are those of Fidelity Freedom® 2005 Fund, the original class of the fund.
The initial offering of Class K shares took place on July 20, 2017. Returns prior to July 20, 2017 are those of Fidelity Freedom® 2005 Fund, the original class of the fund.
$10,000 Over 10 Years
Let's say hypothetically that $10,000 was invested in Fidelity Freedom® 2005 Fund, a class of the fund, on March 31, 2012.
The chart shows how the value of your investment would have changed, and also shows how the Bloomberg U.S. Aggregate Bond Index performed over the same period.

| Period Ending Values |
| $16,189 | Fidelity Freedom® 2005 Fund |
| $12,480 | Bloomberg U.S. Aggregate Bond Index |
Effective August 24, 2021, all Bloomberg Barclays Indices were re-branded as Bloomberg Indices.
Fidelity Freedom® 2010 Fund
Performance: The Bottom Line
Average annual total return reflects the change in the value of an investment, assuming reinvestment of distributions from dividend income and capital gains (the profits earned upon the sale of securities that have grown in value, if any) and assuming a constant rate of performance each year. The hypothetical investment and the average annual total returns do not reflect the deduction of taxes that a shareholder would pay on fund distributions or the redemption of fund shares. During periods of reimbursement by Fidelity, a fund’s total return will be greater than it would be had the reimbursement not occurred. How a fund did yesterday is no guarantee of how it will do tomorrow.
Average Annual Total Returns
| Periods ended March 31, 2022 | Past 1 year | Past 5 years | Past 10 years |
| Fidelity Freedom® 2010 Fund | (0.17)% | 5.93% | 5.88% |
| Class K | (0.07)% | 6.00% | 5.92% |
| Class K6 | (0.02)% | 6.06% | 5.94% |
Prior to June 1, 2017, the fund operated under a different pricing structure. The fund’s historical performance prior to June 1, 2017 does not reflect the fund’s current pricing structure.
The initial offering of Class K6 shares took place on June 7, 2017. Returns prior to June 7, 2017 are those of Fidelity Freedom® 2010 Fund, the original class of the fund.
The initial offering of Class K shares took place on July 20, 2017. Returns prior to July 20, 2017 are those of Fidelity Freedom® 2010 Fund, the original class of the fund.
$10,000 Over 10 Years
Let's say hypothetically that $10,000 was invested in Fidelity Freedom® 2010 Fund, a class of the fund, on March 31, 2012.
The chart shows how the value of your investment would have changed, and also shows how the Bloomberg U.S. Aggregate Bond Index performed over the same period.
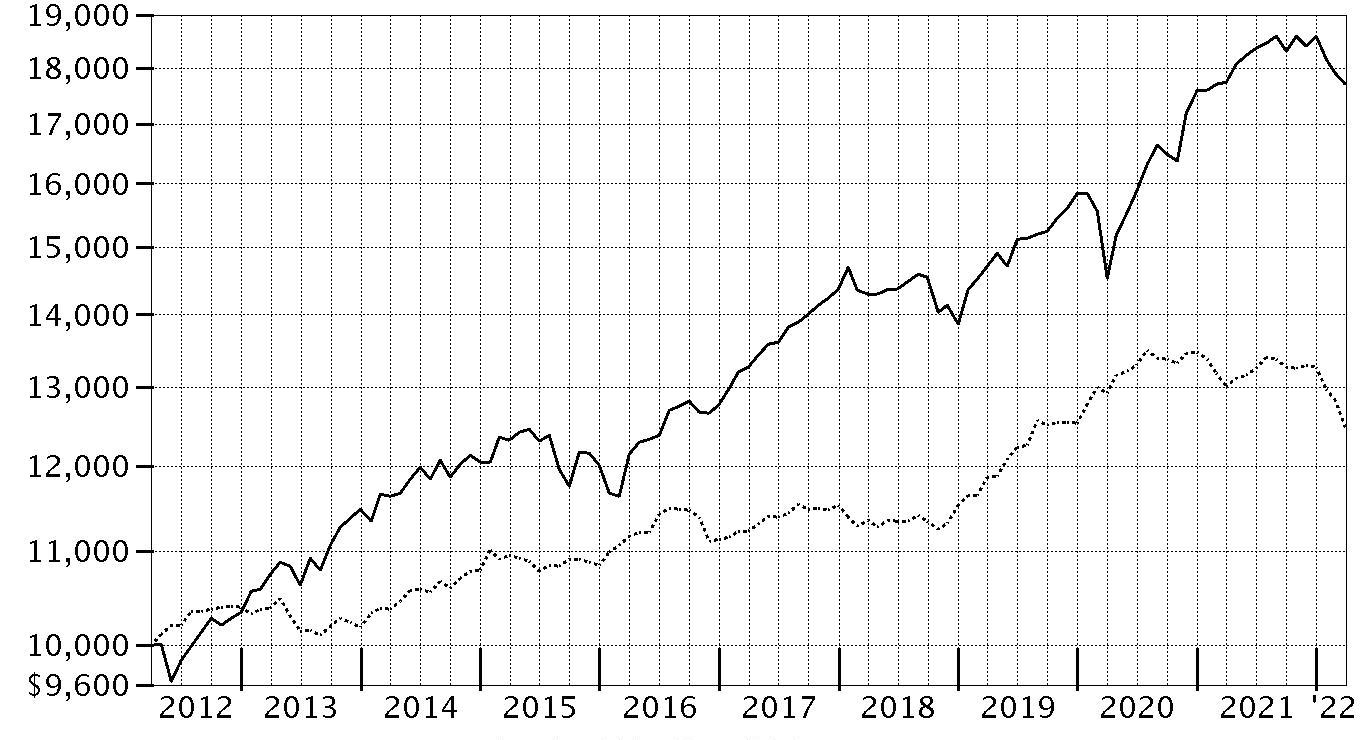
| Period Ending Values |
| $17,704 | Fidelity Freedom® 2010 Fund |
| $12,480 | Bloomberg U.S. Aggregate Bond Index |
Effective August 24, 2021, all Bloomberg Barclays Indices were re-branded as Bloomberg Indices.
Fidelity Freedom® 2015 Fund
Performance: The Bottom Line
Average annual total return reflects the change in the value of an investment, assuming reinvestment of distributions from dividend income and capital gains (the profits earned upon the sale of securities that have grown in value, if any) and assuming a constant rate of performance each year. The hypothetical investment and the average annual total returns do not reflect the deduction of taxes that a shareholder would pay on fund distributions or the redemption of fund shares. During periods of reimbursement by Fidelity, a fund’s total return will be greater than it would be had the reimbursement not occurred. How a fund did yesterday is no guarantee of how it will do tomorrow.
Average Annual Total Returns
| Periods ended March 31, 2022 | Past 1 year | Past 5 years | Past 10 years |
| Fidelity Freedom® 2015 Fund | 0.19% | 6.84% | 6.55% |
| Class K | 0.31% | 6.90% | 6.58% |
| Class K6 | 0.43% | 7.00% | 6.63% |
Prior to June 1, 2017, the fund operated under a different pricing structure. The fund’s historical performance prior to June 1, 2017 does not reflect the fund’s current pricing structure.
The initial offering of Class K6 shares took place on June 7, 2017. Returns prior to June 7, 2017 are those of Fidelity Freedom® 2015 Fund, the original class of the fund.
The initial offering of Class K shares took place on July 20, 2017. Returns prior to July 20, 2017 are those of Fidelity Freedom® 2015 Fund, the original class of the fund.
$10,000 Over 10 Years
Let's say hypothetically that $10,000 was invested in Fidelity Freedom® 2015 Fund, a class of the fund, on March 31, 2012.
The chart shows how the value of your investment would have changed, and also shows how the Bloomberg U.S. Aggregate Bond Index performed over the same period.
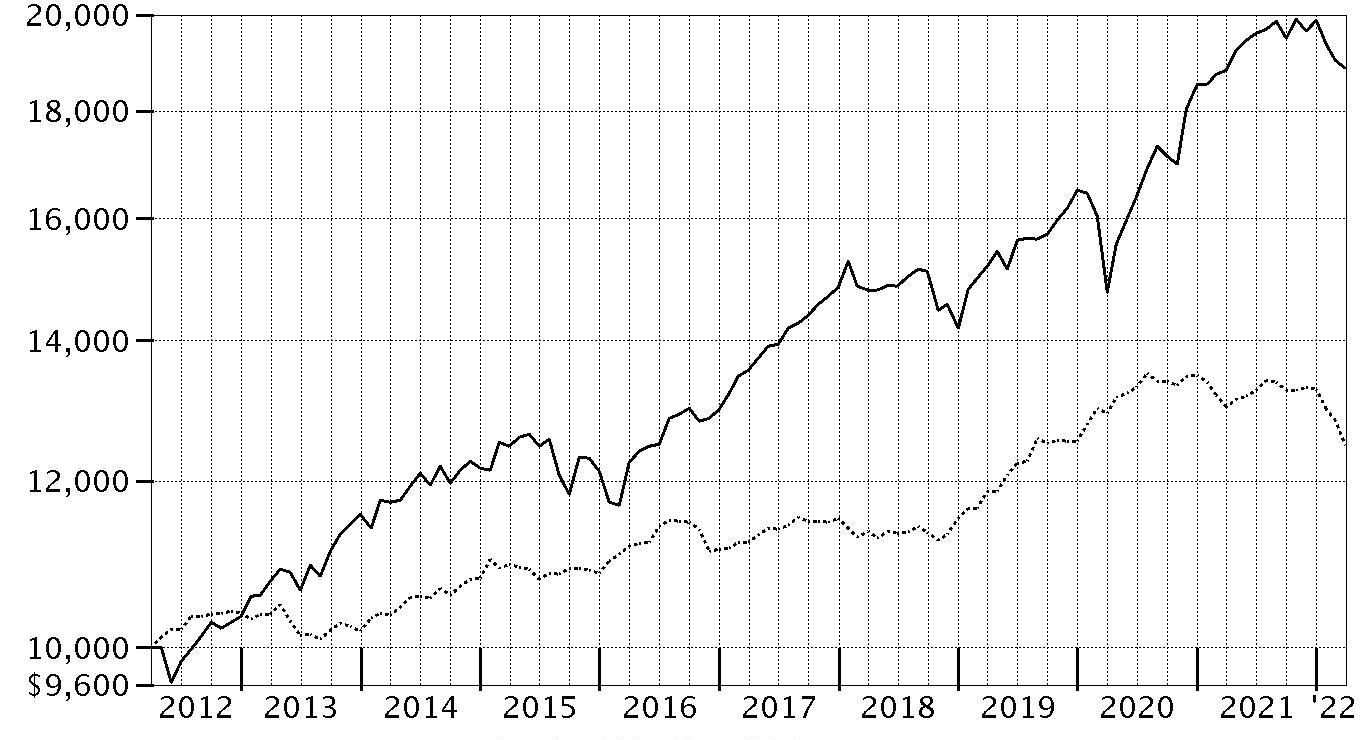
| Period Ending Values |
| $18,858 | Fidelity Freedom® 2015 Fund |
| $12,480 | Bloomberg U.S. Aggregate Bond Index |
Effective August 24, 2021, all Bloomberg Barclays Indices were re-branded as Bloomberg Indices.
Fidelity Freedom® 2020 Fund
Performance: The Bottom Line
Average annual total return reflects the change in the value of an investment, assuming reinvestment of distributions from dividend income and capital gains (the profits earned upon the sale of securities that have grown in value, if any) and assuming a constant rate of performance each year. The hypothetical investment and the average annual total returns do not reflect the deduction of taxes that a shareholder would pay on fund distributions or the redemption of fund shares. During periods of reimbursement by Fidelity, a fund’s total return will be greater than it would be had the reimbursement not occurred. How a fund did yesterday is no guarantee of how it will do tomorrow.
Average Annual Total Returns
| Periods ended March 31, 2022 | Past 1 year | Past 5 years | Past 10 years |
| Fidelity Freedom® 2020 Fund | 0.66% | 7.63% | 7.17% |
| Class K | 0.70% | 7.71% | 7.21% |
| Class K6 | 0.77% | 7.81% | 7.26% |
Prior to June 1, 2017, the fund operated under a different pricing structure. The fund’s historical performance prior to June 1, 2017 does not reflect the fund’s current pricing structure.
The initial offering of Class K6 shares took place on June 7, 2017. Returns prior to June 7, 2017 are those of Fidelity Freedom® 2020 Fund, the original class of the fund.
The initial offering of Class K shares took place on July 20, 2017. Returns prior to July 20, 2017 are those of Fidelity Freedom® 2020 Fund, the original class of the fund.
$10,000 Over 10 Years
Let's say hypothetically that $10,000 was invested in Fidelity Freedom® 2020 Fund, a class of the fund, on March 31, 2012.
The chart shows how the value of your investment would have changed, and also shows how the Bloomberg U.S. Aggregate Bond Index and the S&P 500 Index performed over the same period.
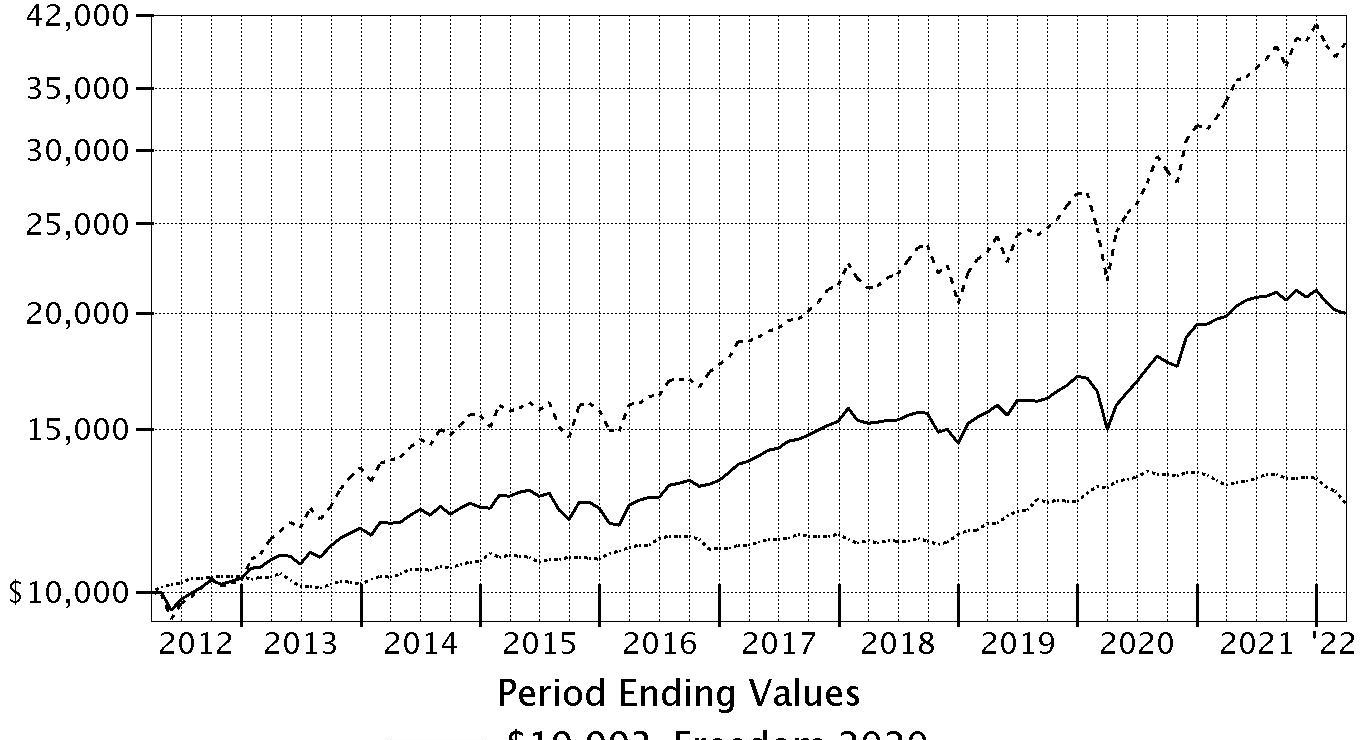
| Period Ending Values |
| $19,993 | Fidelity Freedom® 2020 Fund |
| $12,480 | Bloomberg U.S. Aggregate Bond Index |
| $39,197 | S&P 500® Index |
Effective August 24, 2021, all Bloomberg Barclays Indices were re-branded as Bloomberg Indices.
Effective October 1, 2021, the fund’s benchmark changed from the S&P 500 Index to the Bloomberg U.S. Aggregate Bond Index.
Fidelity Freedom® 2025 Fund
Performance: The Bottom Line
Average annual total return reflects the change in the value of an investment, assuming reinvestment of distributions from dividend income and capital gains (the profits earned upon the sale of securities that have grown in value, if any) and assuming a constant rate of performance each year. The hypothetical investment and the average annual total returns do not reflect the deduction of taxes that a shareholder would pay on fund distributions or the redemption of fund shares. During periods of reimbursement by Fidelity, a fund’s total return will be greater than it would be had the reimbursement not occurred. How a fund did yesterday is no guarantee of how it will do tomorrow.
Average Annual Total Returns
| Periods ended March 31, 2022 | Past 1 year | Past 5 years | Past 10 years |
| Fidelity Freedom® 2025 Fund | 0.99% | 8.24% | 7.88% |
| Class K | 1.04% | 8.32% | 7.92% |
| Class K6 | 1.19% | 8.46% | 7.99% |
Prior to June 1, 2017, the fund operated under a different pricing structure. The fund’s historical performance prior to June 1, 2017 does not reflect the fund’s current pricing structure.
The initial offering of Class K6 shares took place on June 7, 2017. Returns prior to June 7, 2017 are those of Fidelity Freedom® 2025 Fund, the original class of the fund.
The initial offering of Class K shares took place on July 20, 2017. Returns prior to July 20, 2017 are those of Fidelity Freedom® 2025 Fund, the original class of the fund.
$10,000 Over 10 Years
Let's say hypothetically that $10,000 was invested in Fidelity Freedom® 2025 Fund, a class of the fund, on March 31, 2012.
The chart shows how the value of your investment would have changed, and also shows how the S&P 500® Index performed over the same period.
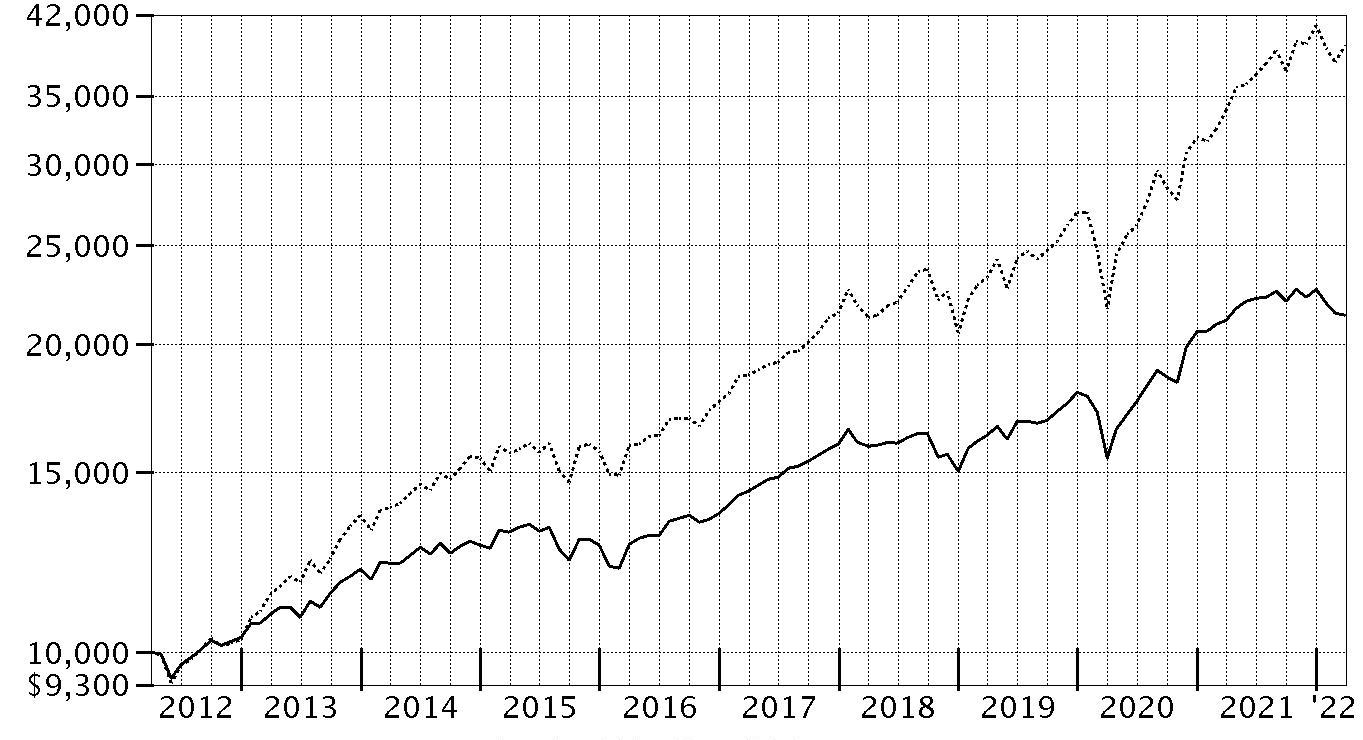
| Period Ending Values |
| $21,350 | Fidelity Freedom® 2025 Fund |
| $39,197 | S&P 500® Index |
Fidelity Freedom® 2030 Fund
Performance: The Bottom Line
Average annual total return reflects the change in the value of an investment, assuming reinvestment of distributions from dividend income and capital gains (the profits earned upon the sale of securities that have grown in value, if any) and assuming a constant rate of performance each year. The hypothetical investment and the average annual total returns do not reflect the deduction of taxes that a shareholder would pay on fund distributions or the redemption of fund shares. During periods of reimbursement by Fidelity, a fund’s total return will be greater than it would be had the reimbursement not occurred. How a fund did yesterday is no guarantee of how it will do tomorrow.
Average Annual Total Returns
| Periods ended March 31, 2022 | Past 1 year | Past 5 years | Past 10 years |
| Fidelity Freedom® 2030 Fund | 1.41% | 9.19% | 8.65% |
| Class K | 1.52% | 9.29% | 8.70% |
| Class K6 | 1.64% | 9.43% | 8.77% |
Prior to June 1, 2017, the fund operated under a different pricing structure. The fund’s historical performance prior to June 1, 2017 does not reflect the fund’s current pricing structure.
The initial offering of Class K6 shares took place on June 7, 2017. Returns prior to June 7, 2017 are those of Fidelity Freedom® 2030 Fund, the original class of the fund.
The initial offering of Class K shares took place on July 20, 2017. Returns prior to July 20, 2017 are those of Fidelity Freedom® 2030 Fund, the original class of the fund.
$10,000 Over 10 Years
Let's say hypothetically that $10,000 was invested in Fidelity Freedom® 2030 Fund, a class of the fund, on March 31, 2012.
The chart shows how the value of your investment would have changed, and also shows how the S&P 500® Index performed over the same period.
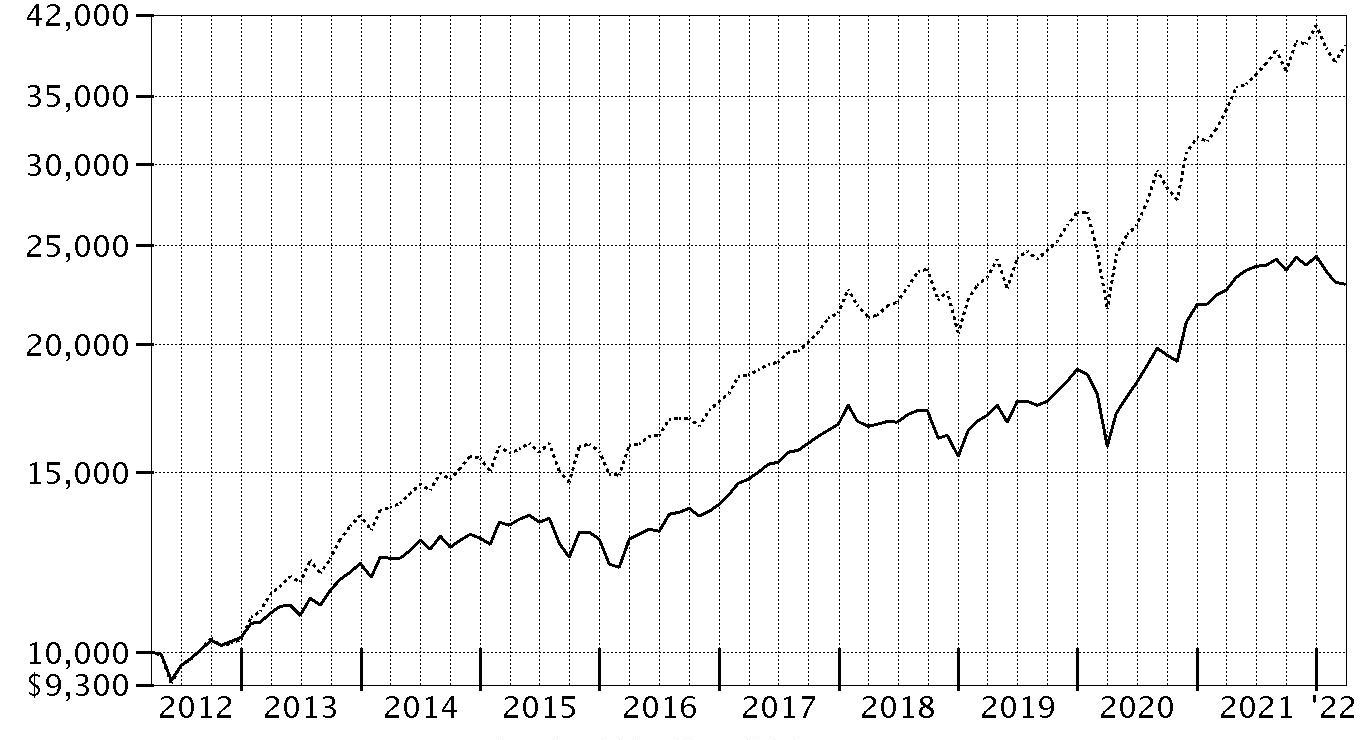
| Period Ending Values |
| $22,933 | Fidelity Freedom® 2030 Fund |
| $39,197 | S&P 500® Index |
Fidelity Freedom® 2035 Fund
Performance: The Bottom Line
Average annual total return reflects the change in the value of an investment, assuming reinvestment of distributions from dividend income and capital gains (the profits earned upon the sale of securities that have grown in value, if any) and assuming a constant rate of performance each year. The hypothetical investment and the average annual total returns do not reflect the deduction of taxes that a shareholder would pay on fund distributions or the redemption of fund shares. During periods of reimbursement by Fidelity, a fund’s total return will be greater than it would be had the reimbursement not occurred. How a fund did yesterday is no guarantee of how it will do tomorrow.
Average Annual Total Returns
| Periods ended March 31, 2022 | Past 1 year | Past 5 years | Past 10 years |
| Fidelity Freedom® 2035 Fund | 2.38% | 10.41% | 9.59% |
| Class K | 2.49% | 10.50% | 9.63% |
| Class K6 | 2.60% | 10.67% | 9.72% |
Prior to June 1, 2017, the fund operated under a different pricing structure. The fund’s historical performance prior to June 1, 2017 does not reflect the fund’s current pricing structure.
The initial offering of Class K6 shares took place on June 7, 2017. Returns prior to June 7, 2017 are those of Fidelity Freedom® 2035 Fund, the original class of the fund.
The initial offering of Class K shares took place on July 20, 2017. Returns prior to July 20, 2017 are those of Fidelity Freedom® 2035 Fund, the original class of the fund.
$10,000 Over 10 Years
Let's say hypothetically that $10,000 was invested in Fidelity Freedom® 2035 Fund, a class of the fund, on March 31, 2012.
The chart shows how the value of your investment would have changed, and also shows how the S&P 500® Index performed over the same period.

| Period Ending Values |
| $24,981 | Fidelity Freedom® 2035 Fund |
| $39,197 | S&P 500® Index |
Fidelity Freedom® 2040 Fund
Performance: The Bottom Line
Average annual total return reflects the change in the value of an investment, assuming reinvestment of distributions from dividend income and capital gains (the profits earned upon the sale of securities that have grown in value, if any) and assuming a constant rate of performance each year. The hypothetical investment and the average annual total returns do not reflect the deduction of taxes that a shareholder would pay on fund distributions or the redemption of fund shares. During periods of reimbursement by Fidelity, a fund’s total return will be greater than it would be had the reimbursement not occurred. How a fund did yesterday is no guarantee of how it will do tomorrow.
Average Annual Total Returns
| Periods ended March 31, 2022 | Past 1 year | Past 5 years | Past 10 years |
| Fidelity Freedom® 2040 Fund | 3.14% | 11.07% | 9.95% |
| Class K | 3.36% | 11.19% | 10.01% |
| Class K6 | 3.47% | 11.33% | 10.08% |
Prior to June 1, 2017, the fund operated under a different pricing structure. The fund’s historical performance prior to June 1, 2017 does not reflect the fund’s current pricing structure.
The initial offering of Class K6 shares took place on June 7, 2017. Returns prior to June 7, 2017 are those of Fidelity Freedom® 2040 Fund, the original class of the fund.
The initial offering of Class K shares took place on July 20, 2017. Returns prior to July 20, 2017 are those of Fidelity Freedom® 2040 Fund, the original class of the fund.
$10,000 Over 10 Years
Let's say hypothetically that $10,000 was invested in Fidelity Freedom® 2040 Fund, a class of the fund, on March 31, 2012.
The chart shows how the value of your investment would have changed, and also shows how the S&P 500® Index performed over the same period.

| Period Ending Values |
| $25,814 | Fidelity Freedom® 2040 Fund |
| $39,197 | S&P 500® Index |
Fidelity Freedom® 2045 Fund
Performance: The Bottom Line
Average annual total return reflects the change in the value of an investment, assuming reinvestment of distributions from dividend income and capital gains (the profits earned upon the sale of securities that have grown in value, if any) and assuming a constant rate of performance each year. The hypothetical investment and the average annual total returns do not reflect the deduction of taxes that a shareholder would pay on fund distributions or the redemption of fund shares. During periods of reimbursement by Fidelity, a fund’s total return will be greater than it would be had the reimbursement not occurred. How a fund did yesterday is no guarantee of how it will do tomorrow.
Average Annual Total Returns
| Periods ended March 31, 2022 | Past 1 year | Past 5 years | Past 10 years |
| Fidelity Freedom® 2045 Fund | 3.19% | 11.06% | 10.00% |
| Class K | 3.32% | 11.19% | 10.06% |
| Class K6 | 3.44% | 11.33% | 10.13% |
Prior to June 1, 2017, the fund operated under a different pricing structure. The fund’s historical performance prior to June 1, 2017 does not reflect the fund’s current pricing structure.
The initial offering of Class K6 shares took place on June 7, 2017. Returns prior to June 7, 2017 are those of Fidelity Freedom® 2045 Fund, the original class of the fund.
The initial offering of Class K shares took place on July 20, 2017. Returns prior to July 20, 2017 are those of Fidelity Freedom® 2045 Fund, the original class of the fund.
$10,000 Over 10 Years
Let's say hypothetically that $10,000 was invested in Fidelity Freedom® 2045 Fund, a class of the fund, on March 31, 2012.
The chart shows how the value of your investment would have changed, and also shows how the S&P 500® Index performed over the same period.
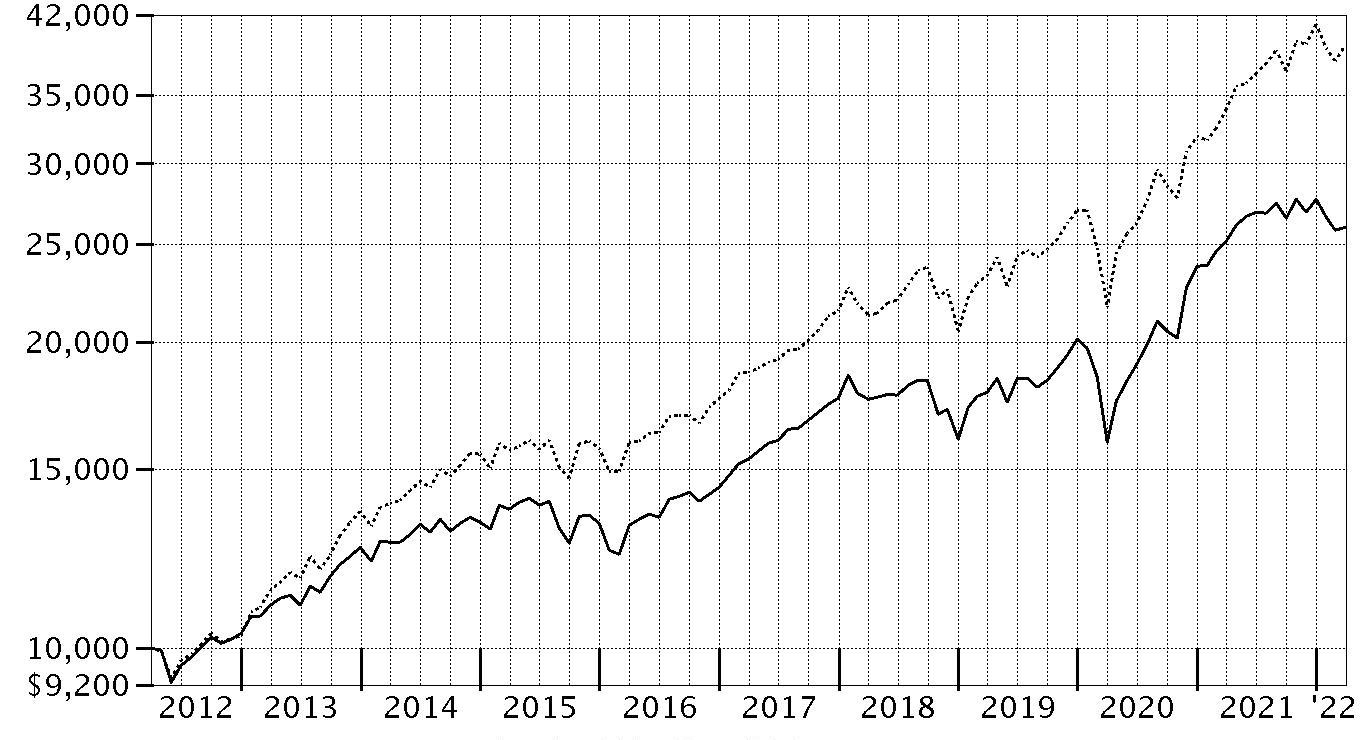
| Period Ending Values |
| $25,939 | Fidelity Freedom® 2045 Fund |
| $39,197 | S&P 500® Index |
Fidelity Freedom® 2050 Fund
Performance: The Bottom Line
Average annual total return reflects the change in the value of an investment, assuming reinvestment of distributions from dividend income and capital gains (the profits earned upon the sale of securities that have grown in value, if any) and assuming a constant rate of performance each year. The hypothetical investment and the average annual total returns do not reflect the deduction of taxes that a shareholder would pay on fund distributions or the redemption of fund shares. During periods of reimbursement by Fidelity, a fund’s total return will be greater than it would be had the reimbursement not occurred. How a fund did yesterday is no guarantee of how it will do tomorrow.
Average Annual Total Returns
| Periods ended March 31, 2022 | Past 1 year | Past 5 years | Past 10 years |
| Fidelity Freedom® 2050 Fund | 3.20% | 11.08% | 10.02% |
| Class K | 3.26% | 11.18% | 10.07% |
| Class K6 | 3.43% | 11.34% | 10.15% |
Prior to June 1, 2017, the fund operated under a different pricing structure. The fund’s historical performance prior to June 1, 2017 does not reflect the fund’s current pricing structure.
The initial offering of Class K6 shares took place on June 7, 2017. Returns prior to June 7, 2017 are those of Fidelity Freedom® 2050 Fund, the original class of the fund.
The initial offering of Class K shares took place on July 20, 2017. Returns prior to July 20, 2017 are those of Fidelity Freedom® 2050 Fund, the original class of the fund.
$10,000 Over 10 Years
Let's say hypothetically that $10,000 was invested in Fidelity Freedom® 2050 Fund, a class of the fund, on March 31, 2012.
The chart shows how the value of your investment would have changed, and also shows how the S&P 500® Index performed over the same period.
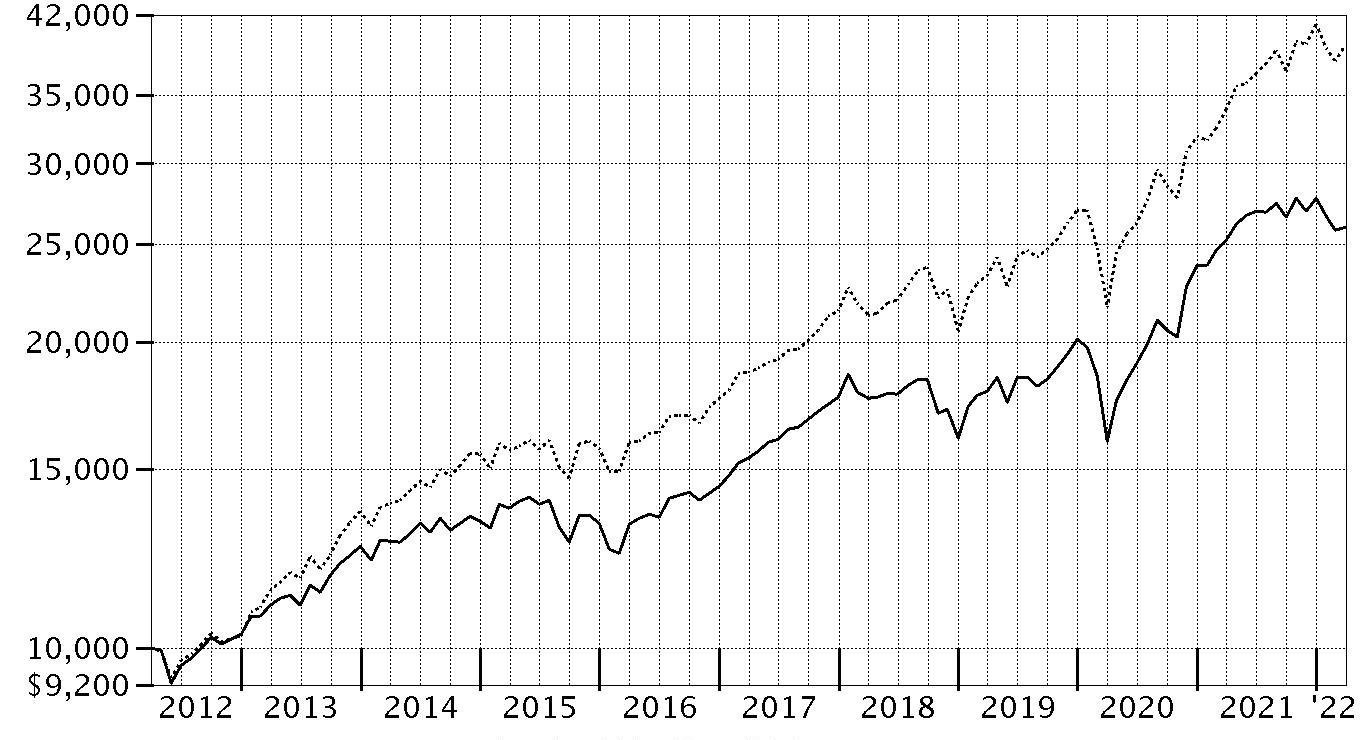
| Period Ending Values |
| $25,987 | Fidelity Freedom® 2050 Fund |
| $39,197 | S&P 500® Index |
Fidelity Freedom® 2055 Fund
Performance: The Bottom Line
Average annual total return reflects the change in the value of an investment, assuming reinvestment of distributions from dividend income and capital gains (the profits earned upon the sale of securities that have grown in value, if any) and assuming a constant rate of performance each year. The hypothetical investment and the average annual total returns do not reflect the deduction of taxes that a shareholder would pay on fund distributions or the redemption of fund shares. During periods of reimbursement by Fidelity, a fund’s total return will be greater than it would be had the reimbursement not occurred. How a fund did yesterday is no guarantee of how it will do tomorrow.
Average Annual Total Returns
| Periods ended March 31, 2022 | Past 1 year | Past 5 years | Past 10 years |
| Fidelity Freedom® 2055 Fund | 3.21% | 11.07% | 10.09% |
| Class K | 3.33% | 11.18% | 10.14% |
| Class K6 | 3.51% | 11.33% | 10.22% |
Prior to June 1, 2017, the fund operated under a different pricing structure. The fund’s historical performance prior to June 1, 2017 does not reflect the fund’s current pricing structure.
The initial offering of Class K6 shares took place on June 7, 2017. Returns prior to June 7, 2017 are those of Fidelity Freedom® 2055 Fund, the original class of the fund.
The initial offering of Class K shares took place on July 20, 2017. Returns prior to July 20, 2017 are those of Fidelity Freedom® 2055 Fund, the original class of the fund.
$10,000 Over Life of Fund
Let's say hypothetically that $10,000 was invested in Fidelity Freedom® 2055 Fund, a class of the fund, on March 31, 2012.
The chart shows how the value of your investment would have changed, and also shows how the S&P 500® Index performed over the same period.
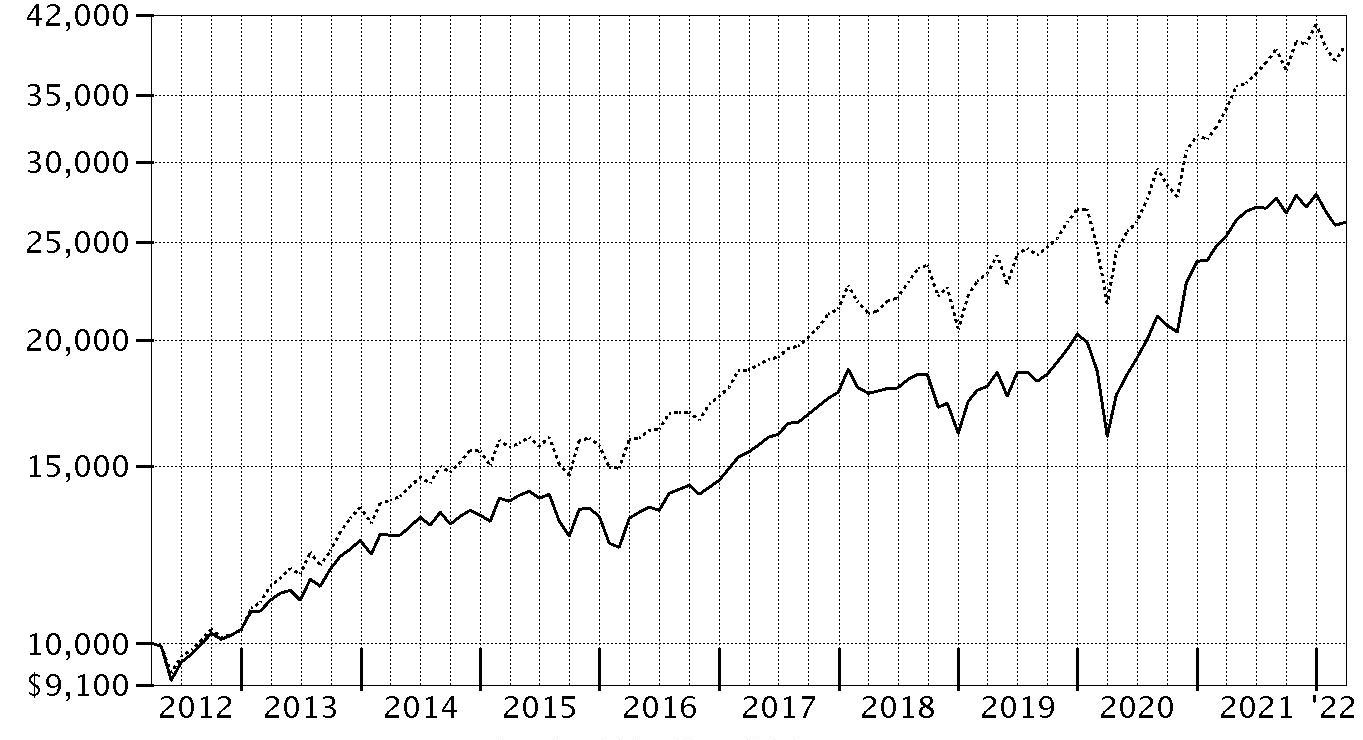
| Period Ending Values |
| $26,146 | Fidelity Freedom® 2055 Fund |
| $39,197 | S&P 500® Index |
Fidelity Freedom® 2060 Fund
Performance: The Bottom Line
Average annual total return reflects the change in the value of an investment, assuming reinvestment of distributions from dividend income and capital gains (the profits earned upon the sale of securities that have grown in value, if any) and assuming a constant rate of performance each year. The hypothetical investment and the average annual total returns do not reflect the deduction of taxes that a shareholder would pay on fund distributions or the redemption of fund shares. During periods of reimbursement by Fidelity, a fund’s total return will be greater than it would be had the reimbursement not occurred. How a fund did yesterday is no guarantee of how it will do tomorrow.
Average Annual Total Returns
| Periods ended March 31, 2022 | Past 1 year | Past 5 years | Life of FundA |
| Fidelity Freedom® 2060 Fund | 3.21% | 11.07% | 9.52% |
| Class K | 3.35% | 11.19% | 9.60% |
| Class K6 | 3.51% | 11.34% | 9.70% |
A From August 5, 2014
Prior to June 1, 2017, the fund operated under a different pricing structure. The fund’s historical performance prior to June 1, 2017 does not reflect the fund’s current pricing structure.
The initial offering of Class K6 shares took place on June 7, 2017. Returns prior to June 7, 2017 are those of Fidelity Freedom® 2060 Fund, the original class of the fund.
The initial offering of Class K shares took place on July 20, 2017. Returns prior to July 20, 2017 are those of Fidelity Freedom® 2060 Fund, the original class of the fund.
$10,000 Over Life of Fund
Let's say hypothetically that $10,000 was invested in Fidelity Freedom® 2060 Fund, a class of the fund, on August 5, 2014, when the fund started.
The chart shows how the value of your investment would have changed, and also shows how the S&P 500® Index performed over the same period.
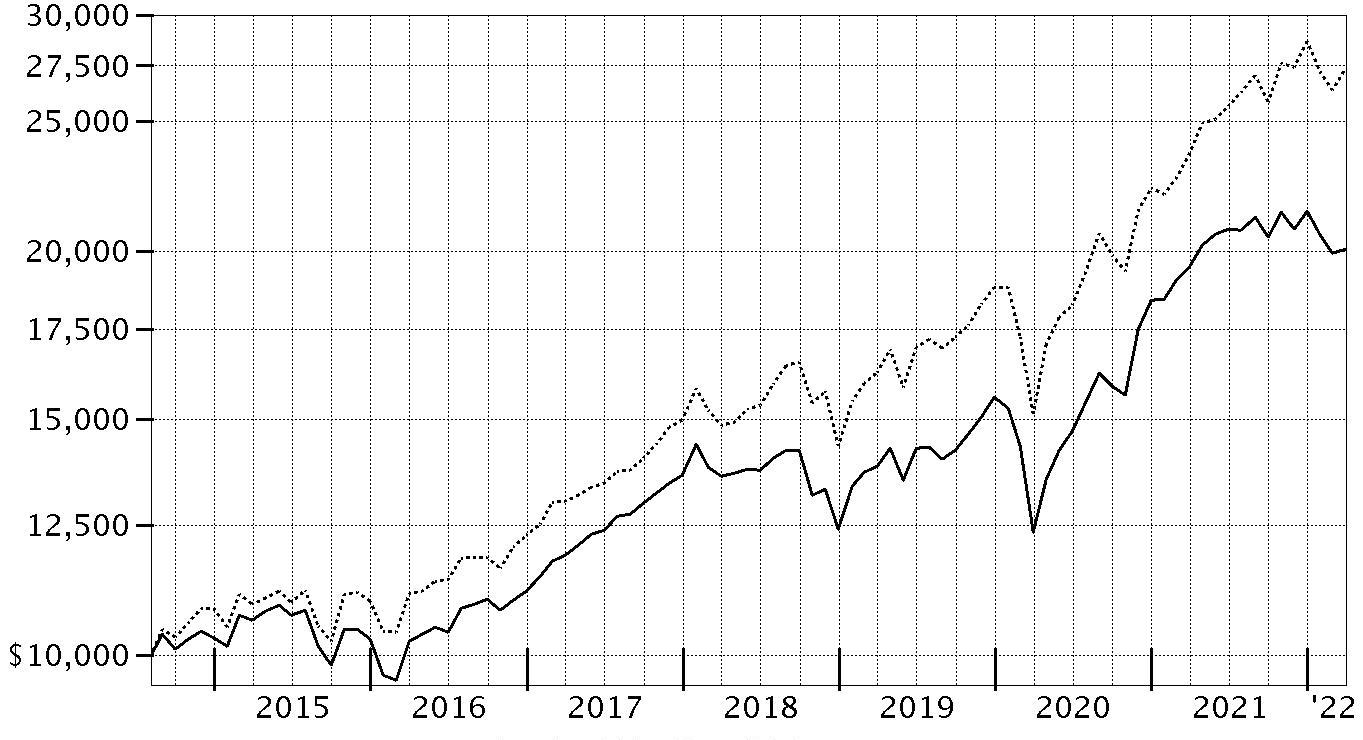
| Period Ending Values |
| $20,071 | Fidelity Freedom® 2060 Fund |
| $27,342 | S&P 500® Index |
Fidelity Freedom® 2065 Fund
Performance: The Bottom Line
Average annual total return reflects the change in the value of an investment, assuming reinvestment of distributions from dividend income and capital gains (the profits earned upon the sale of securities that have grown in value, if any) and assuming a constant rate of performance each year. The hypothetical investment and the average annual total returns do not reflect the deduction of taxes that a shareholder would pay on fund distributions or the redemption of fund shares. During periods of reimbursement by Fidelity, a fund’s total return will be greater than it would be had the reimbursement not occurred. How a fund did yesterday is no guarantee of how it will do tomorrow.
Average Annual Total Returns
| Periods ended March 31, 2022 | Past 1 year | Life of FundA |
| Fidelity Freedom® 2065 Fund | 3.25% | 13.16% |
| Class K | 3.30% | 13.27% |
| Class K6 | 3.43% | 13.43% |
A From June 28, 2019
$10,000 Over Life of Fund
Let's say hypothetically that $10,000 was invested in Fidelity Freedom® 2065 Fund, a class of the fund, on June 28, 2019, when the fund started.
The chart shows how the value of your investment would have changed, and also shows how the S&P 500® Index performed over the same period.

| Period Ending Values |
| $14,049 | Fidelity Freedom® 2065 Fund |
| $16,126 | S&P 500® Index |
Management's Discussion of Fund Performance
Market Recap: For the 12 months ending March 31, 2022, global financial markets were influenced by the reopening of businesses, an improved outlook for global economic growth, and fiscal and monetary stimulus. Strong corporate earnings growth amid ongoing midcycle economic expansion in several countries provided support for risk assets. However, as the calendar turned, investors grappled with soaring inflation, increasing bond yields, supply constraint and disruption, and Russia’s invasion of Ukraine, which led to surging commodity prices.
International equities returned -1.33% the past 12 months, according to the MSCI ACWI (All Country World Index) ex USA Index. By region, emerging markets (-11%) lagged most, followed by Japan (-6%). Conversely, Canada (+21%) topped the broader index by a wide margin. The U.K. (+15%), Asia Pacific ex Japan (+3%) and Europe ex U.K. (+1%) also outperformed. By sector, consumer discretionary (-21%) and communication services (-16%) fared worst. In contrast, energy (+24%) notably outperformed due to rising prices for oil and natural gas. Materials and financials each gained about 10%.
U.S. stocks gained 11.67% for the 12 months, as measured by the Dow Jones U.S. Total Stock Market Index. Among sectors, energy (+64%) led the way. Real estate (+20%), utilities (+19%) and information technology (+16%) also showed strength. In contrast, communication services (-3%) notably lagged. Small-cap stocks widely trailed larger-caps, while value outpaced growth, except among large-caps. Commodities rose 49.25%, per the Bloomberg Commodity Index Total Return.
U.S. taxable investment-grade bonds returned -4.15%, according to the Bloomberg U.S. Aggregate Bond Index, amid rising market interest rates and inflation. In December, the U.S. Federal Reserve said it was time to retire the term “transitory” in describing U.S. inflation and raised prospects for three quarter-point rate hikes in 2022. Corporate bonds (-4.16%) trailed U.S. Treasuries (-3.67%). Commercial mortgage-backed securities (-4.46%) and agencies (-3.94%) also lost ground. Outside the index, Treasury Inflation-Protected Securities (+4.29%) and leveraged loans (+3.38%) gained, but other non-core groups declined, such as emerging-markets debt (-6.18%) and U.S. corporate high-yield bonds (-0.30%).
Comments from Co-Portfolio Managers Andrew Dierdorf and Brett Sumsion: For the fiscal year, the shares of each Fidelity Freedom
® Fund posted a return ranging from -0.76% for Fidelity Freedom Income Fund to 3.25% for Fidelity Freedom 2065 Fund. Each Fund underperformed its Composite index the past 12 months. Security selection among the underlying investment portfolios was the primary relative detractor, whereas active asset allocation contributed. Specifically, investments in underlying emerging-markets equity funds detracted most. In this asset class, Fidelity
® Series Emerging-Markets Opportunities Fund (-19.20%) lagged the -11.36% result of its benchmark, the MSCI Emerging Markets Index. Underlying investments in U.S. equities also held back the Funds' performance versus Composites. Specifically, Fidelity
®Series Growth Company Fund (+7.53%) hurt most, as the fund trailed the 12.86% advance of its benchmark, the Russell 3000
® Growth Index. An investment in Fidelity
® Series Blue Chip Growth Fund (+3.25%) also detracted, given the fund trailed the 14.98% gain of its benchmark, the Russell 1000
® Growth Index. Conversely, investments in non-U.S. developed-markets equities and investment-grade bonds lifted the Funds' relative performance the past year. In terms of active asset allocation, a non-Composite allocation to commodities added relative value, given the 48.79% return for Fidelity
® Series Commodity Strategy Fund. Underweighting investment-grade bonds also contributed versus Composites, as this asset class lagged many others in which the Funds invest. In contrast, positioning in equities detracted from the Funds' relative results. Lastly, an outsized allocation to emerging-markets equities hurt, as did an underweighting in strong-performing U.S. equities.
The views expressed above reflect those of the portfolio manager(s) only through the end of the period as stated on the cover of this report and do not necessarily represent the views of Fidelity or any other person in the Fidelity organization. Any such views are subject to change at any time based upon market or other conditions and Fidelity disclaims any responsibility to update such views. These views may not be relied on as investment advice and, because investment decisions for a Fidelity fund are based on numerous factors, may not be relied on as an indication of trading intent on behalf of any Fidelity fund.
Fidelity Freedom® Income Fund
Investment Summary (Unaudited)
The information in the following tables is based on the direct investments of the Fund.
Top Holdings as of March 31, 2022
| | % of fund's net assets |
| Fidelity Series Investment Grade Bond Fund | 39.6 |
| Fidelity Series 0-5 Year Inflation-Protected Bond Index Fund | 15.9 |
| Fidelity Series Government Money Market Fund 0.31% | 10.0 |
| Fidelity Series Emerging Markets Opportunities Fund | 5.4 |
| Fidelity Series Long-Term Treasury Bond Index Fund | 3.6 |
| Fidelity Series International Developed Markets Bond Index Fund | 3.1 |
| Fidelity Series Short-Term Credit Fund | 2.5 |
| Fidelity Series International Value Fund | 2.0 |
| Fidelity Series Inflation-Protected Bond Index Fund | 2.0 |
| Fidelity Series Overseas Fund | 2.0 |
| | 86.1 |
Asset Allocation (% of fund's net assets)
| Period end |
| | Domestic Equity Funds | 7.8% |
| | International Equity Funds | 13.4% |
| | Bond Funds | 66.2% |
| | Short-Term Funds | 12.6% |

Domestic Equity Funds category includes Fidelity Series Commodity Strategy Fund which invests in commodity-related investments.
Fidelity Freedom® Income Fund
Schedule of Investments March 31, 2022
Showing Percentage of Net Assets
| U.S. Treasury Obligations - 0.0% | | | |
| | | Principal Amount | Value |
| U.S. Treasury Bills, yield at date of purchase 0.18% to 0.38% 4/28/22 to 6/9/22 (a) | | | |
| (Cost $1,059,337) | | 1,060,000 | 1,059,323 |
| | | Shares | Value |
|
| Domestic Equity Funds - 7.8% | | | |
| Fidelity Series All-Sector Equity Fund (b) | | 680,767 | $7,338,669 |
| Fidelity Series Blue Chip Growth Fund (b) | | 838,690 | 12,051,981 |
| Fidelity Series Commodity Strategy Fund (b) | | 8,395,655 | 42,901,796 |
| Fidelity Series Growth Company Fund (b) | | 1,651,348 | 30,038,017 |
| Fidelity Series Intrinsic Opportunities Fund (b) | | 1,502,248 | 29,549,224 |
| Fidelity Series Large Cap Stock Fund (b) | | 1,405,344 | 26,715,585 |
| Fidelity Series Large Cap Value Index Fund (b) | | 654,586 | 10,054,443 |
| Fidelity Series Opportunistic Insights Fund (b) | | 841,758 | 15,387,331 |
| Fidelity Series Small Cap Discovery Fund (b) | | 247,427 | 3,313,051 |
| Fidelity Series Small Cap Opportunities Fund (b) | | 798,086 | 10,869,932 |
| Fidelity Series Stock Selector Large Cap Value Fund (b) | | 1,660,372 | 22,498,045 |
| Fidelity Series Value Discovery Fund (b) | | 1,069,682 | 17,114,908 |
| TOTAL DOMESTIC EQUITY FUNDS | | | |
| (Cost $155,496,812) | | | 227,832,982 |
|
| International Equity Funds - 13.4% | | | |
| Fidelity Series Canada Fund (b) | | 1,612,086 | 25,019,580 |
| Fidelity Series Emerging Markets Fund (b) | | 1,894,548 | 17,581,404 |
| Fidelity Series Emerging Markets Opportunities Fund (b) | | 8,608,285 | 158,392,451 |
| Fidelity Series International Growth Fund (b) | | 3,459,488 | 57,358,305 |
| Fidelity Series International Small Cap Fund (b) | | 882,361 | 15,838,374 |
| Fidelity Series International Value Fund (b) | | 5,252,749 | 57,937,817 |
| Fidelity Series Overseas Fund (b) | | 4,570,351 | 57,677,833 |
| TOTAL INTERNATIONAL EQUITY FUNDS | | | |
| (Cost $322,046,724) | | | 389,805,764 |
|
| Bond Funds - 66.2% | | | |
| Fidelity Series 0-5 Year Inflation-Protected Bond Index Fund (b) | | 46,069,162 | 462,073,693 |
| Fidelity Series 5+ Year Inflation-Protected Bond Index Fund (b) | | 298,964 | 2,870,052 |
| Fidelity Series Emerging Markets Debt Fund (b) | | 1,793,840 | 14,799,181 |
| Fidelity Series Emerging Markets Debt Local Currency Fund (b) | | 544,079 | 4,902,152 |
| Fidelity Series Floating Rate High Income Fund (b) | | 319,650 | 2,937,579 |
| Fidelity Series High Income Fund (b) | | 1,914,200 | 17,400,076 |
| Fidelity Series Inflation-Protected Bond Index Fund (b) | | 5,698,294 | 57,837,687 |
| Fidelity Series International Credit Fund (b) | | 231,461 | 2,143,327 |
| Fidelity Series International Developed Markets Bond Index Fund (b) | | 9,532,734 | 88,940,411 |
| Fidelity Series Investment Grade Bond Fund (b) | | 105,559,897 | 1,151,658,480 |
| Fidelity Series Long-Term Treasury Bond Index Fund (b) | | 13,958,243 | 106,361,810 |
| Fidelity Series Real Estate Income Fund (b) | | 932,069 | 10,588,308 |
| TOTAL BOND FUNDS | | | |
| (Cost $1,927,083,076) | | | 1,922,512,756 |
|
| Short-Term Funds - 12.6% | | | |
| Fidelity Cash Central Fund 0.31% (c) | | 938,977 | 939,165 |
| Fidelity Series Government Money Market Fund 0.31% (b)(d) | | 291,427,485 | 291,427,485 |
| Fidelity Series Short-Term Credit Fund (b) | | 7,486,666 | 72,994,989 |
| TOTAL SHORT-TERM FUNDS | | | |
| (Cost $366,721,399) | | | 365,361,639 |
| TOTAL INVESTMENT IN SECURITIES - 100.0% | | | |
| (Cost $2,772,407,348) | | | 2,906,572,464 |
| NET OTHER ASSETS (LIABILITIES) - 0.0% | | | (185,255) |
| NET ASSETS - 100% | | | $2,906,387,209 |
| Futures Contracts | | | | | |
| | Number of contracts | Expiration Date | Notional Amount | Value | Unrealized Appreciation/(Depreciation) |
| Purchased | | | | | |
| Equity Index Contracts | | | | | |
| ICE E-mini MSCI EAFE Index Contracts (United States) | 63 | June 2022 | $6,754,860 | $349,722 | $349,722 |
| ICE E-mini MSCI Emerging Markets Index Contracts (United States) | 142 | June 2022 | 7,991,050 | 484,206 | 484,206 |
| TOTAL PURCHASED | | | | | $833,928 |
| Sold | | | | | |
| Equity Index Contracts | | | | | |
| CME Micro E-mini S&P 500 Index Contracts (United States) | 70 | June 2022 | 15,857,625 | (176,168) | (176,168) |
| TOTAL FUTURES CONTRACTS | | | | | $657,760 |
The notional amount of futures purchased as a percentage of Net Assets is 0.5%
The notional amount of futures sold as a percentage of Net Assets is 0.5%
Legend
(a) Security or a portion of the security was pledged to cover margin requirements for futures contracts. At period end, the value of securities pledged amounted to $1,012,357.
(b) Affiliated Fund
(c) Affiliated fund that is generally available only to investment companies and other accounts managed by Fidelity Investments. The rate quoted is the annualized seven-day yield of the fund at period end. A complete unaudited listing of the fund's holdings as of its most recent quarter end is available upon request. In addition, each Fidelity Central Fund's financial statements, which are not covered by the Fund's Report of Independent Registered Public Accounting Firm, are available on the SEC's website or upon request.
(d) The rate quoted is the annualized seven-day yield of the fund at period end.
Affiliated Central Funds
Fiscal year to date information regarding the Fund's investments in Fidelity Central Funds, including the ownership percentage, is presented below.
| Fund | Value, beginning of period | Purchases | Sales Proceeds | Dividend Income | Realized Gain/Loss | Change in Unrealized appreciation (depreciation) | Value, end of period | % ownership, end of period |
| Fidelity Cash Central Fund 0.31% | $1,884,807 | $8,835,116 | $9,780,758 | $1,201 | $-- | $-- | $939,165 | 0.0% |
| Total | $1,884,807 | $8,835,116 | $9,780,758 | $1,201 | $-- | $-- | $939,165 | |
Amounts in the income column in the above table include any capital gain distributions from underlying funds, which are presented in the corresponding line-item in the Statement of Operations, if applicable.
Affiliated Underlying Funds
Fiscal year to date information regarding the Fund's investments in affiliated Underlying Funds is presented below. Exchanges between classes of the same affiliated Underlying Funds may occur. If an underlying Fund changes its name, the name presented below is the name in effect at period end.
| Fund | Value, beginning of period | Purchases(a) | Sales Proceeds(a) | Dividend Income | Realized Gain (loss) | Change in Unrealized appreciation (depreciation) | Value, end of period |
| Fidelity Series 0-5 Year Inflation-Protected Bond Index Fund | $-- | $481,458,267 | $18,249,665 | $1,794,703 | $(19,505) | $(848,209) | $462,073,693 |
| Fidelity Series 5+ Year Inflation-Protected Bond Index Fund | -- | 85,930,068 | 82,508,245 | 220,756 | (551,766) | (5) | 2,870,052 |
| Fidelity Series All-Sector Equity Fund | 8,543,965 | 2,274,317 | 3,009,718 | 1,527,823 | 548,915 | (1,018,810) | 7,338,669 |
| Fidelity Series Blue Chip Growth Fund | 13,557,862 | 6,215,092 | 5,770,845 | 2,682,516 | 874,943 | (2,825,071) | 12,051,981 |
| Fidelity Series Canada Fund | 16,957,854 | 8,227,333 | 4,253,315 | 531,343 | 276,995 | 3,810,713 | 25,019,580 |
| Fidelity Series Commodity Strategy Fund | 91,083,601 | 28,741,554 | 80,634,155 | 26,834,479 | (1,051,897) | 4,762,693 | 42,901,796 |
| Fidelity Series Emerging Markets Debt Fund | 17,676,887 | 1,571,065 | 2,980,046 | 769,037 | (216,269) | (1,252,456) | 14,799,181 |
| Fidelity Series Emerging Markets Debt Local Currency Fund | 5,754,943 | 750,424 | 1,044,021 | 213,373 | (28,836) | (530,358) | 4,902,152 |
| Fidelity Series Emerging Markets Fund | 23,215,427 | 5,209,467 | 6,765,001 | 610,425 | 769,854 | (4,848,343) | 17,581,404 |
| Fidelity Series Emerging Markets Opportunities Fund | 213,137,273 | 67,024,901 | 67,917,981 | 19,953,164 | 10,210,234 | (64,061,976) | 158,392,451 |
| Fidelity Series Floating Rate High Income Fund | 3,560,227 | 178,914 | 805,283 | 141,999 | (57,486) | 61,207 | 2,937,579 |
| Fidelity Series Government Money Market Fund 0.31% | 638,049,691 | 25,776,920 | 372,399,126 | 433,491 | -- | -- | 291,427,485 |
| Fidelity Series Growth Company Fund | 34,620,342 | 18,477,340 | 17,172,390 | 9,135,314 | 2,340,807 | (8,228,082) | 30,038,017 |
| Fidelity Series High Income Fund | 20,992,703 | 1,284,346 | 4,313,398 | 1,070,696 | (28,882) | (534,693) | 17,400,076 |
| Fidelity Series Inflation-Protected Bond Index Fund | 397,991,268 | 20,021,275 | 361,742,799 | 15,838,655 | 34,035,974 | (32,468,031) | 57,837,687 |
| Fidelity Series International Credit Fund | 2,237,066 | 72,193 | -- | 72,194 | -- | (165,932) | 2,143,327 |
| Fidelity Series International Developed Markets Bond Index Fund | -- | 96,643,298 | 3,714,452 | 30,788 | (46,451) | (3,941,984) | 88,940,411 |
| Fidelity Series International Growth Fund | 47,520,417 | 29,889,311 | 14,184,921 | 4,954,630 | 93,936 | (5,960,438) | 57,358,305 |
| Fidelity Series International Small Cap Fund | 15,057,805 | 6,510,337 | 3,051,693 | 2,278,953 | 355,467 | (3,033,542) | 15,838,374 |
| Fidelity Series International Value Fund | 47,467,627 | 25,626,867 | 15,798,857 | 3,105,878 | 763,050 | (120,870) | 57,937,817 |
| Fidelity Series Intrinsic Opportunities Fund | 34,718,116 | 9,025,105 | 11,420,366 | 5,677,721 | 1,195,022 | (3,968,653) | 29,549,224 |
| Fidelity Series Investment Grade Bond Fund | 1,278,690,480 | 123,840,322 | 187,961,200 | 27,678,578 | (2,015,697) | (60,895,425) | 1,151,658,480 |
| Fidelity Series Large Cap Stock Fund | 30,352,675 | 4,474,277 | 9,156,869 | 2,645,368 | 1,891,246 | (845,744) | 26,715,585 |
| Fidelity Series Large Cap Value Index Fund | 11,188,318 | 1,352,192 | 3,040,240 | 691,912 | 481,462 | 72,711 | 10,054,443 |
| Fidelity Series Long-Term Treasury Bond Index Fund | 89,744,924 | 44,444,413 | 25,575,507 | 2,201,779 | (1,685,638) | (566,382) | 106,361,810 |
| Fidelity Series Opportunistic Insights Fund | 17,722,342 | 6,572,702 | 7,670,683 | 3,101,655 | 1,615,226 | (2,852,256) | 15,387,331 |
| Fidelity Series Overseas Fund | 47,599,899 | 26,590,211 | 15,562,231 | 1,841,560 | 992,466 | (1,942,512) | 57,677,833 |
| Fidelity Series Real Estate Income Fund | 12,626,216 | 589,763 | 3,019,098 | 464,978 | 323,715 | 67,712 | 10,588,308 |
| Fidelity Series Short-Term Credit Fund | 134,334,117 | 14,070,150 | 71,221,746 | 2,112,156 | (151,982) | (4,035,550) | 72,994,989 |
| Fidelity Series Small Cap Discovery Fund | 3,798,755 | 755,298 | 1,007,726 | 610,782 | 130,712 | (363,988) | 3,313,051 |
| Fidelity Series Small Cap Opportunities Fund | 12,704,610 | 5,122,872 | 4,294,019 | 3,064,998 | 616,859 | (3,280,390) | 10,869,932 |
| Fidelity Series Stock Selector Large Cap Value Fund | 25,655,317 | 5,925,586 | 8,194,259 | 4,244,460 | 1,072,598 | (1,961,197) | 22,498,045 |
| Fidelity Series Value Discovery Fund | 19,730,847 | 3,386,370 | 6,295,576 | 2,117,890 | 1,082,308 | (789,041) | 17,114,908 |
| | $3,316,291,574 | $1,158,032,550 | $1,420,735,431 | $148,654,054 | $53,817,380 | $(202,564,902) | $2,904,573,976 |
(a) Includes the value of shares purchased or redeemed through in-kind transactions, if applicable.
Amounts in the income column in the above table include any capital gain distributions from underlying funds, which are presented in the corresponding line-item in the Statement of Operations, if applicable.
Investment Valuation
The following is a summary of the inputs used, as of March 31, 2022, involving the Fund's assets and liabilities carried at fair value. The inputs or methodology used for valuing securities may not be an indication of the risk associated with investing in those securities. For more information on valuation inputs, and their aggregation into the levels used below, please refer to the Investment Valuation section in the accompanying Notes to Financial Statements.
| | Valuation Inputs at Reporting Date: |
| Description | Total | Level 1 | Level 2 | Level 3 |
| Investments in Securities: | | | | |
| Other Short-Term Investments | $1,059,323 | $-- | $1,059,323 | $-- |
| Domestic Equity Funds | 227,832,982 | 227,832,982 | -- | -- |
| International Equity Funds | 389,805,764 | 389,805,764 | -- | -- |
| Bond Funds | 1,922,512,756 | 1,922,512,756 | -- | -- |
| Short-Term Funds | 365,361,639 | 365,361,639 | -- | -- |
| Total Investments in Securities: | $2,906,572,464 | $2,905,513,141 | $1,059,323 | $-- |
| Derivative Instruments: | | | | |
| Assets | | | | |
| Futures Contracts | $833,928 | $833,928 | $-- | $-- |
| Total Assets | $833,928 | $833,928 | $-- | $-- |
| Liabilities | | | | |
| Futures Contracts | $(176,168) | $(176,168) | $-- | $-- |
| Total Liabilities | $(176,168) | $(176,168) | $-- | $-- |
| Total Derivative Instruments: | $657,760 | $657,760 | $-- | $-- |
Value of Derivative Instruments
The following table is a summary of the Fund's value of derivative instruments by primary risk exposure as of March 31, 2022. For additional information on derivative instruments, please refer to the Derivative Instruments section in the accompanying Notes to Financial Statements.
| Primary Risk Exposure / Derivative Type | Value |
| | Asset | Liability |
| Equity Risk | | |
| Futures Contracts(a) | $833,928 | $(176,168) |
| Total Equity Risk | 833,928 | (176,168) |
| Total Value of Derivatives | $833,928 | $(176,168) |
(a) Reflects gross cumulative appreciation (depreciation) on futures contracts as presented in the Schedule of Investments. In the Statement of Assets and Liabilities, the period end daily variation margin is included in receivable or payable for daily variation margin on futures contracts, and the net cumulative appreciation (depreciation) is included in Total accumulated earnings (loss).
See accompanying notes which are an integral part of the financial statements.
Fidelity Freedom® Income Fund
Financial Statements
Statement of Assets and Liabilities
| | | March 31, 2022 |
| Assets | | |
Investment in securities, at value — See accompanying schedule:
Unaffiliated issuers (cost $1,059,337) | $1,059,323 | |
| Fidelity Central Funds (cost $939,158) | 939,165 | |
| Other affiliated issuers (cost $2,770,408,853) | 2,904,573,976 | |
| Total Investment in Securities (cost $2,772,407,348) | | $2,906,572,464 |
| Receivable for investments sold | | 85,083,452 |
| Receivable for fund shares sold | | 1,290,911 |
| Distributions receivable from Fidelity Central Funds | | 129 |
| Total assets | | 2,992,946,956 |
| Liabilities | | |
| Payable for investments purchased | $82,896,328 | |
| Payable for fund shares redeemed | 2,457,435 | |
| Accrued management fee | 1,076,825 | |
| Payable for daily variation margin on futures contracts | 129,159 | |
| Total liabilities | | 86,559,747 |
| Net Assets | | $2,906,387,209 |
| Net Assets consist of: | | |
| Paid in capital | | $2,715,323,516 |
| Total accumulated earnings (loss) | | 191,063,693 |
| Net Assets | | $2,906,387,209 |
| Net Asset Value and Maximum Offering Price | | |
| Fidelity Freedom Income Fund: | | |
| Net Asset Value, offering price and redemption price per share ($1,851,041,728 ÷ 162,840,535 shares) | | $11.37 |
| Class K: | | |
| Net Asset Value, offering price and redemption price per share ($780,948,910 ÷ 68,824,023 shares) | | $11.35 |
| Class K6: | | |
| Net Asset Value, offering price and redemption price per share ($274,396,571 ÷ 24,199,156 shares) | | $11.34 |
See accompanying notes which are an integral part of the financial statements.
Statement of Operations
| | | Year ended March 31, 2022 |
| Investment Income | | |
| Dividends: | | |
| Affiliated issuers | | $89,177,251 |
| Interest | | 455 |
| Income from Fidelity Central Funds | | 1,201 |
| Total income | | 89,178,907 |
| Expenses | | |
| Management fee | $14,053,077 | |
| Independent trustees' fees and expenses | 9,803 | |
| Total expenses before reductions | 14,062,880 | |
| Expense reductions | (4) | |
| Total expenses after reductions | | 14,062,876 |
| Net investment income (loss) | | 75,116,031 |
| Realized and Unrealized Gain (Loss) | | |
| Net realized gain (loss) on: | | |
| Investment securities: | | |
| Unaffiliated issuers | 83 | |
| Affiliated issuers | 53,817,380 | |
| Futures contracts | 294,119 | |
| Capital gain distributions from underlying funds: | | |
| Affiliated issuers | 59,476,803 | |
| Total net realized gain (loss) | | 113,588,385 |
| Change in net unrealized appreciation (depreciation) on: | | |
| Investment securities: | | |
| Unaffiliated issuers | (49) | |
| Affiliated issuers | (202,564,902) | |
| Futures contracts | 657,760 | |
| Total change in net unrealized appreciation (depreciation) | | (201,907,191) |
| Net gain (loss) | | (88,318,806) |
| Net increase (decrease) in net assets resulting from operations | | $(13,202,775) |
See accompanying notes which are an integral part of the financial statements.
Statement of Changes in Net Assets
| | Year ended March 31, 2022 | Year ended March 31, 2021 |
| Increase (Decrease) in Net Assets | | |
| Operations | | |
| Net investment income (loss) | $75,116,031 | $35,143,837 |
| Net realized gain (loss) | 113,588,385 | 126,058,774 |
| Change in net unrealized appreciation (depreciation) | (201,907,191) | 257,140,260 |
| Net increase (decrease) in net assets resulting from operations | (13,202,775) | 418,342,871 |
| Distributions to shareholders | (189,462,492) | (142,317,786) |
| Share transactions - net increase (decrease) | (209,118,449) | (45,161,621) |
| Total increase (decrease) in net assets | (411,783,716) | 230,863,464 |
| Net Assets | | |
| Beginning of period | 3,318,170,925 | 3,087,307,461 |
| End of period | $2,906,387,209 | $3,318,170,925 |
See accompanying notes which are an integral part of the financial statements.
Financial Highlights
Fidelity Freedom Income Fund
| Years ended March 31, | 2022 | 2021 | 2020 | 2019 | 2018 |
| Selected Per–Share Data | | | | | |
| Net asset value, beginning of period | $12.16 | $11.15 | $11.44 | $11.69 | $11.57 |
| Income from Investment Operations | | | | | |
| Net investment income (loss)A,B | .28 | .13 | .22 | .23 | .18 |
| Net realized and unrealized gain (loss) | (.35) | 1.40 | (.09) | .11 | .38 |
| Total from investment operations | (.07) | 1.53 | .13 | .34 | .56 |
| Distributions from net investment income | (.29) | (.13) | (.23) | (.23) | (.19) |
| Distributions from net realized gain | (.44) | (.39) | (.20) | (.36) | (.25) |
| Total distributions | (.72)C | (.52) | (.42)C | (.59) | (.44) |
| Net asset value, end of period | $11.37 | $12.16 | $11.15 | $11.44 | $11.69 |
| Total ReturnD | (.76)% | 13.92% | 1.05% | 3.08% | 4.86% |
| Ratios to Average Net AssetsB,E,F | | | | | |
| Expenses before reductions | .46%G | .47% | .47% | .46%G | .39% |
| Expenses net of fee waivers, if any | .46%G | .47% | .47% | .46%G | .39% |
| Expenses net of all reductions | .46%G | .47% | .47% | .46%G | .39% |
| Net investment income (loss) | 2.34% | 1.05% | 1.90% | 2.02% | 1.57% |
| Supplemental Data | | | | | |
| Net assets, end of period (000 omitted) | $1,851,042 | $2,031,257 | $1,839,153 | $1,978,263 | $2,111,741 |
| Portfolio turnover rateH | 36% | 21% | 17% | 22% | 17%I |
A Calculated based on average shares outstanding during the period.
B Net investment income (loss) is affected by the timing of the declaration of dividends by any underlying mutual funds or exchange-traded funds (ETFs). Net investment income (loss) of any such underlying funds is not included in the Fund's net investment income (loss) ratio.
C Total distributions per share do not sum due to rounding.
D Total returns would have been lower if certain expenses had not been reduced during the applicable periods shown.
E Fees and expenses of any underlying mutual funds or exchange-traded funds (ETFs) are not included in the Fund's expense ratio. The Fund indirectly bears its proportionate share of these expenses. For additional expense information related to investments in Fidelity Central Funds, please refer to the "Investments in Fidelity Central Funds" note found in the Notes to Financial Statements section of the most recent Annual or Semi-Annual report.
F Expense ratios reflect operating expenses of the class. Expenses before reductions do not reflect amounts reimbursed, waived, or reduced through arrangements with the investment adviser, brokerage services, or other offset arrangements, if applicable, and do not represent the amount paid by the class during periods when reimbursements, waivers or reductions occur.
G On certain classes, the size and fluctuation of net assets and expense amounts may cause ratios to differ from contractual rates.
H Amount does not include the portfolio activity of any underlying mutual funds or exchange-traded funds (ETFs).
I The portfolio turnover rate does not include the assets acquired in the merger.
See accompanying notes which are an integral part of the financial statements.
Fidelity Freedom Income Fund Class K
| Years ended March 31, | 2022 | 2021 | 2020 | 2019 | 2018 A |
| Selected Per–Share Data | | | | | |
| Net asset value, beginning of period | $12.14 | $11.13 | $11.42 | $11.68 | $11.76 |
| Income from Investment Operations | | | | | |
| Net investment income (loss)B,C | .29 | .13 | .23 | .24 | .19 |
| Net realized and unrealized gain (loss) | (.35) | 1.41 | (.09) | .09 | .05 |
| Total from investment operations | (.06) | 1.54 | .14 | .33 | .24 |
| Distributions from net investment income | (.29) | (.14) | (.23) | (.24) | (.16) |
| Distributions from net realized gain | (.44) | (.39) | (.20) | (.36) | (.17) |
| Total distributions | (.73) | (.53) | (.43) | (.59)D | (.32)D |
| Net asset value, end of period | $11.35 | $12.14 | $11.13 | $11.42 | $11.68 |
| Total ReturnE,F | (.72)% | 14.02% | 1.12% | 3.04% | 2.06% |
| Ratios to Average Net AssetsC,G,H | | | | | |
| Expenses before reductions | .41%I | .41% | .41% | .41%I | .42%J |
| Expenses net of fee waivers, if any | .41%I | .41% | .41% | .41%I | .42%J |
| Expenses net of all reductions | .41%I | .41% | .41% | .41%I | .42%J |
| Net investment income (loss) | 2.39% | 1.10% | 1.95% | 2.07% | 2.32%J |
| Supplemental Data | | | | | |
| Net assets, end of period (000 omitted) | $780,949 | $1,043,133 | $1,048,404 | $1,236,535 | $1,568,576 |
| Portfolio turnover rateK | 36% | 21% | 17% | 22% | 17%L |
A For the period July 20, 2017 (commencement of sale of shares) through March 31, 2018.
B Calculated based on average shares outstanding during the period.
C Net investment income (loss) is affected by the timing of the declaration of dividends by any underlying mutual funds or exchange-traded funds (ETFs). Net investment income (loss) of any such underlying funds is not included in the Fund's net investment income (loss) ratio.
D Total distributions per share do not sum due to rounding.
E Total returns for periods of less than one year are not annualized.
F Total returns would have been lower if certain expenses had not been reduced during the applicable periods shown.
G Fees and expenses of any underlying mutual funds or exchange-traded funds (ETFs) are not included in the Fund's expense ratio. The Fund indirectly bears its proportionate share of these expenses. For additional expense information related to investments in Fidelity Central Funds, please refer to the "Investments in Fidelity Central Funds" note found in the Notes to Financial Statements section of the most recent Annual or Semi-Annual report.
H Expense ratios reflect operating expenses of the class. Expenses before reductions do not reflect amounts reimbursed, waived, or reduced through arrangements with the investment adviser, brokerage services, or other offset arrangements, if applicable, and do not represent the amount paid by the class during periods when reimbursements, waivers or reductions occur.
I On certain classes, the size and fluctuation of net assets and expense amounts may cause ratios to differ from contractual rates.
J Annualized
K Amount does not include the portfolio activity of any underlying mutual funds or exchange-traded funds (ETFs).
L The portfolio turnover rate does not include the assets acquired in the merger.
See accompanying notes which are an integral part of the financial statements.
Fidelity Freedom Income Fund Class K6
| Years ended March 31, | 2022 | 2021 | 2020 | 2019 | 2018 A |
| Selected Per–Share Data | | | | | |
| Net asset value, beginning of period | $12.13 | $11.13 | $11.42 | $11.68 | $11.68 |
| Income from Investment Operations | | | | | |
| Net investment income (loss)B,C | .29 | .14 | .23 | .24 | .18 |
| Net realized and unrealized gain (loss) | (.34) | 1.40 | (.08) | .11 | .15 |
| Total from investment operations | (.05) | 1.54 | .15 | .35 | .33 |
| Distributions from net investment income | (.30) | (.15) | (.24) | (.25) | (.17) |
| Distributions from net realized gain | (.44) | (.39) | (.20) | (.36) | (.17) |
| Total distributions | (.74) | (.54) | (.44) | (.61) | (.33)D |
| Net asset value, end of period | $11.34 | $12.13 | $11.13 | $11.42 | $11.68 |
| Total ReturnE,F | (.64)% | 13.97% | 1.18% | 3.16% | 2.86% |
| Ratios to Average Net AssetsC,G,H | | | | | |
| Expenses before reductions | .37% | .37% | .37% | .37% | .37%I |
| Expenses net of fee waivers, if any | .37% | .37% | .37% | .37% | .37%I |
| Expenses net of all reductions | .37% | .37% | .37% | .37% | .37%I |
| Net investment income (loss) | 2.44% | 1.15% | 2.00% | 2.12% | 1.91%I |
| Supplemental Data | | | | | |
| Net assets, end of period (000 omitted) | $274,397 | $243,781 | $199,750 | $167,422 | $39,253 |
| Portfolio turnover rateJ | 36% | 21% | 17% | 22% | 17%K |
A For the period June 7, 2017 (commencement of sale of shares) through March 31, 2018.
B Calculated based on average shares outstanding during the period.
C Net investment income (loss) is affected by the timing of the declaration of dividends by any underlying mutual funds or exchange-traded funds (ETFs). Net investment income (loss) of any such underlying funds is not included in the Fund's net investment income (loss) ratio.
D Total distributions per share do not sum due to rounding.
E Total returns for periods of less than one year are not annualized.
F Total returns would have been lower if certain expenses had not been reduced during the applicable periods shown.
G Fees and expenses of any underlying mutual funds or exchange-traded funds (ETFs) are not included in the Fund's expense ratio. The Fund indirectly bears its proportionate share of these expenses. For additional expense information related to investments in Fidelity Central Funds, please refer to the "Investments in Fidelity Central Funds" note found in the Notes to Financial Statements section of the most recent Annual or Semi-Annual report.
H Expense ratios reflect operating expenses of the class. Expenses before reductions do not reflect amounts reimbursed, waived, or reduced through arrangements with the investment adviser, brokerage services, or other offset arrangements, if applicable, and do not represent the amount paid by the class during periods when reimbursements, waivers or reductions occur.
I Annualized
J Amount does not include the portfolio activity of any underlying mutual funds or exchange-traded funds (ETFs).
K The portfolio turnover rate does not include the assets acquired in the merger.
See accompanying notes which are an integral part of the financial statements.
Fidelity Freedom® 2005 Fund
Investment Summary (Unaudited)
The information in the following tables is based on the direct investments of the Fund.
Top Holdings as of March 31, 2022
| | % of fund's net assets |
| Fidelity Series Investment Grade Bond Fund | 38.6 |
| Fidelity Series 0-5 Year Inflation-Protected Bond Index Fund | 14.6 |
| Fidelity Series Government Money Market Fund 0.31% | 9.4 |
| Fidelity Series Emerging Markets Opportunities Fund | 5.7 |
| Fidelity Series Long-Term Treasury Bond Index Fund | 3.7 |
| Fidelity Series International Developed Markets Bond Index Fund | 3.1 |
| Fidelity Series Short-Term Credit Fund | 2.4 |
| Fidelity Series International Value Fund | 2.2 |
| Fidelity Series Overseas Fund | 2.2 |
| Fidelity Series International Growth Fund | 2.2 |
| | 84.1 |
Asset Allocation (% of fund's net assets)
| Period end |
| | Domestic Equity Funds | 9.4% |
| | International Equity Funds | 14.4% |
| | Bond Funds | 64.4% |
| | Short-Term Funds | 11.8% |

Domestic Equity Funds category includes Fidelity Series Commodity Strategy Fund which invests in commodity-related investments.
Fidelity Freedom® 2005 Fund
Schedule of Investments March 31, 2022
Showing Percentage of Net Assets
| U.S. Treasury Obligations - 0.0% | | | |
| | | Principal Amount | Value |
| U.S. Treasury Bills, yield at date of purchase 0.18% to 0.38% 4/28/22 to 6/9/22 (a) | | | |
| (Cost $349,790) | | 350,000 | 349,788 |
| | | Shares | Value |
|
| Domestic Equity Funds - 9.4% | | | |
| Fidelity Series All-Sector Equity Fund (b) | | 270,482 | $2,915,792 |
| Fidelity Series Blue Chip Growth Fund (b) | | 333,281 | 4,789,252 |
| Fidelity Series Commodity Strategy Fund (b) | | 2,689,232 | 13,741,976 |
| Fidelity Series Growth Company Fund (b) | | 656,088 | 11,934,245 |
| Fidelity Series Intrinsic Opportunities Fund (b) | | 590,432 | 11,613,800 |
| Fidelity Series Large Cap Stock Fund (b) | | 558,332 | 10,613,894 |
| Fidelity Series Large Cap Value Index Fund (b) | | 260,041 | 3,994,232 |
| Fidelity Series Opportunistic Insights Fund (b) | | 334,429 | 6,113,361 |
| Fidelity Series Small Cap Discovery Fund (b) | | 98,321 | 1,316,515 |
| Fidelity Series Small Cap Opportunities Fund (b) | | 317,116 | 4,319,120 |
| Fidelity Series Stock Selector Large Cap Value Fund (b) | | 659,730 | 8,939,336 |
| Fidelity Series Value Discovery Fund (b) | | 425,012 | 6,800,190 |
| TOTAL DOMESTIC EQUITY FUNDS | | | |
| (Cost $59,431,859) | | | 87,091,713 |
|
| International Equity Funds - 14.4% | | | |
| Fidelity Series Canada Fund (b) | | 569,414 | 8,837,313 |
| Fidelity Series Emerging Markets Fund (b) | | 635,433 | 5,896,823 |
| Fidelity Series Emerging Markets Opportunities Fund (b) | | 2,887,307 | 53,126,445 |
| Fidelity Series International Growth Fund (b) | | 1,216,609 | 20,171,385 |
| Fidelity Series International Small Cap Fund (b) | | 308,122 | 5,530,790 |
| Fidelity Series International Value Fund (b) | | 1,847,367 | 20,376,457 |
| Fidelity Series Overseas Fund (b) | | 1,607,322 | 20,284,401 |
| TOTAL INTERNATIONAL EQUITY FUNDS | | | |
| (Cost $109,106,637) | | | 134,223,614 |
|
| Bond Funds - 64.4% | | | |
| Fidelity Series 0-5 Year Inflation-Protected Bond Index Fund (b) | | 13,513,141 | 135,536,804 |
| Fidelity Series 5+ Year Inflation-Protected Bond Index Fund (b) | | 696,957 | 6,690,790 |
| Fidelity Series Emerging Markets Debt Fund (b) | | 572,045 | 4,719,375 |
| Fidelity Series Emerging Markets Debt Local Currency Fund (b) | | 174,097 | 1,568,618 |
| Fidelity Series Floating Rate High Income Fund (b) | | 102,391 | 940,974 |
| Fidelity Series High Income Fund (b) | | 613,133 | 5,573,379 |
| Fidelity Series Inflation-Protected Bond Index Fund (b) | | 1,743,270 | 17,694,190 |
| Fidelity Series International Credit Fund (b) | | 63,048 | 583,824 |
| Fidelity Series International Developed Markets Bond Index Fund (b) | | 3,063,320 | 28,580,774 |
| Fidelity Series Investment Grade Bond Fund (b) | | 32,928,173 | 359,246,365 |
| Fidelity Series Long-Term Treasury Bond Index Fund (b) | | 4,543,499 | 34,621,461 |
| Fidelity Series Real Estate Income Fund (b) | | 298,811 | 3,394,488 |
| TOTAL BOND FUNDS | | | |
| (Cost $617,476,268) | | | 599,151,042 |
|
| Short-Term Funds - 11.8% | | | |
| Fidelity Cash Central Fund 0.31% (c) | | 363,633 | 363,706 |
| Fidelity Series Government Money Market Fund 0.31% (b)(d) | | 87,525,442 | 87,525,442 |
| Fidelity Series Short-Term Credit Fund (b) | | 2,248,494 | 21,922,817 |
| TOTAL SHORT-TERM FUNDS | | | |
| (Cost $110,273,158) | | | 109,811,965 |
| TOTAL INVESTMENT IN SECURITIES - 100.0% | | | |
| (Cost $896,637,712) | | | 930,628,122 |
| NET OTHER ASSETS (LIABILITIES) - 0.0% | | | (60,333) |
| NET ASSETS - 100% | | | $930,567,789 |
| Futures Contracts | | | | | |
| | Number of contracts | Expiration Date | Notional Amount | Value | Unrealized Appreciation/(Depreciation) |
| Purchased | | | | | |
| Equity Index Contracts | | | | | |
| ICE E-mini MSCI EAFE Index Contracts (United States) | 20 | June 2022 | $2,144,400 | $108,194 | $108,194 |
| ICE E-mini MSCI Emerging Markets Index Contracts (United States) | 46 | June 2022 | 2,588,650 | 156,912 | 156,912 |
| TOTAL PURCHASED | | | | | $265,106 |
| Sold | | | | | |
| Equity Index Contracts | | | | | |
| CME Micro E-mini S&P 500 Index Contracts (United States) | 22 | June 2022 | 4,983,825 | (52,824) | (52,824) |
| TOTAL FUTURES CONTRACTS | | | | | $212,282 |
The notional amount of futures purchased as a percentage of Net Assets is 0.5%
The notional amount of futures sold as a percentage of Net Assets is 0.5%
For the period, the average monthly notional amount at value for futures contracts in the aggregate was $1,408,828.
Legend
(a) Security or a portion of the security was pledged to cover margin requirements for futures contracts. At period end, the value of securities pledged amounted to $349,788.
(b) Affiliated Fund
(c) Affiliated fund that is generally available only to investment companies and other accounts managed by Fidelity Investments. The rate quoted is the annualized seven-day yield of the fund at period end. A complete unaudited listing of the fund's holdings as of its most recent quarter end is available upon request. In addition, each Fidelity Central Fund's financial statements, which are not covered by the Fund's Report of Independent Registered Public Accounting Firm, are available on the SEC's website or upon request.
(d) The rate quoted is the annualized seven-day yield of the fund at period end.
Affiliated Central Funds
Fiscal year to date information regarding the Fund's investments in Fidelity Central Funds, including the ownership percentage, is presented below.
| Fund | Value, beginning of period | Purchases | Sales Proceeds | Dividend Income | Realized Gain/Loss | Change in Unrealized appreciation (depreciation) | Value, end of period | % ownership, end of period |
| Fidelity Cash Central Fund 0.31% | $744,074 | $2,566,245 | $2,946,613 | $401 | $-- | $-- | $363,706 | 0.0% |
| Total | $744,074 | $2,566,245 | $2,946,613 | $401 | $-- | $-- | $363,706 | |
Amounts in the income column in the above table include any capital gain distributions from underlying funds, which are presented in the corresponding line-item in the Statement of Operations, if applicable.
Affiliated Underlying Funds
Fiscal year to date information regarding the Fund's investments in affiliated Underlying Funds is presented below. Exchanges between classes of the same affiliated Underlying Funds may occur. If an underlying Fund changes its name, the name presented below is the name in effect at period end.
| Fund | Value, beginning of period | Purchases(a) | Sales Proceeds(a) | Dividend Income | Realized Gain (loss) | Change in Unrealized appreciation (depreciation) | Value, end of period |
| Fidelity Series 0-5 Year Inflation-Protected Bond Index Fund | $-- | $141,518,471 | $5,646,697 | $510,199 | $(5,480) | $(253,531) | $135,536,804 |
| Fidelity Series 5+ Year Inflation-Protected Bond Index Fund | -- | 28,033,921 | 20,922,567 | 97,595 | (338,652) | (81,912) | 6,690,790 |
| Fidelity Series All-Sector Equity Fund | 3,900,019 | 943,925 | 1,774,977 | 623,724 | 160,958 | (314,133) | 2,915,792 |
| Fidelity Series Blue Chip Growth Fund | 6,189,024 | 2,435,458 | 3,080,153 | 1,123,627 | 639,654 | (1,394,731) | 4,789,252 |
| Fidelity Series Canada Fund | 6,754,581 | 2,766,470 | 2,201,462 | 189,097 | 162,806 | 1,354,918 | 8,837,313 |
| Fidelity Series Commodity Strategy Fund | 29,598,209 | 9,587,819 | 26,745,366 | 8,456,553 | (154,681) | 1,455,995 | 13,741,976 |
| Fidelity Series Emerging Markets Debt Fund | 5,721,042 | 637,987 | 1,175,776 | 244,372 | (88,156) | (375,722) | 4,719,375 |
| Fidelity Series Emerging Markets Debt Local Currency Fund | 1,868,386 | 288,113 | 412,034 | 67,580 | (8,739) | (167,108) | 1,568,618 |
| Fidelity Series Emerging Markets Fund | 8,111,803 | 1,737,239 | 2,575,893 | 205,671 | 304,743 | (1,681,069) | 5,896,823 |
| Fidelity Series Emerging Markets Opportunities Fund | 74,413,071 | 22,855,016 | 26,118,742 | 6,694,884 | 4,290,327 | (22,313,227) | 53,126,445 |
| Fidelity Series Floating Rate High Income Fund | 1,152,223 | 81,250 | 293,757 | 44,927 | (20,845) | 22,103 | 940,974 |
| Fidelity Series Government Money Market Fund 0.31% | 188,976,392 | 11,594,719 | 113,045,669 | 127,660 | -- | -- | 87,525,442 |
| Fidelity Series Growth Company Fund | 15,804,841 | 7,416,084 | 9,105,332 | 3,728,119 | 2,204,928 | (4,386,276) | 11,934,245 |
| Fidelity Series High Income Fund | 6,797,750 | 551,550 | 1,602,725 | 338,406 | (38,410) | (134,786) | 5,573,379 |
| Fidelity Series Inflation-Protected Bond Index Fund | 121,133,026 | 7,638,451 | 111,550,797 | 4,751,830 | 9,161,582 | (8,688,072) | 17,694,190 |
| Fidelity Series International Credit Fund | 609,358 | 19,665 | -- | 19,665 | -- | (45,199) | 583,824 |
| Fidelity Series International Developed Markets Bond Index Fund | -- | 31,100,007 | 1,237,172 | 9,927 | (17,657) | (1,264,404) | 28,580,774 |
| Fidelity Series International Growth Fund | 18,928,030 | 9,792,505 | 6,687,656 | 1,759,899 | 455,136 | (2,316,630) | 20,171,385 |
| Fidelity Series International Small Cap Fund | 5,997,388 | 2,070,243 | 1,653,862 | 808,632 | 193,593 | (1,076,572) | 5,530,790 |
| Fidelity Series International Value Fund | 18,906,898 | 8,726,673 | 7,583,555 | 1,103,980 | 373,735 | (47,294) | 20,376,457 |
| Fidelity Series Intrinsic Opportunities Fund | 15,846,757 | 3,504,177 | 6,637,354 | 2,374,411 | 1,561,130 | (2,660,910) | 11,613,800 |
| Fidelity Series Investment Grade Bond Fund | 399,415,672 | 50,263,414 | 70,969,764 | 8,514,753 | (1,078,287) | (18,384,670) | 359,246,365 |
| Fidelity Series Large Cap Stock Fund | 13,854,228 | 1,899,055 | 5,638,312 | 1,115,001 | 1,294,422 | (795,499) | 10,613,894 |
| Fidelity Series Large Cap Value Index Fund | 5,106,767 | 522,312 | 1,893,337 | 283,239 | 440,023 | (181,533) | 3,994,232 |
| Fidelity Series Long-Term Treasury Bond Index Fund | 29,149,903 | 15,566,583 | 9,338,357 | 704,607 | (717,989) | (38,679) | 34,621,461 |
| Fidelity Series Opportunistic Insights Fund | 8,090,455 | 2,546,057 | 4,126,298 | 1,266,877 | 1,272,794 | (1,669,647) | 6,113,361 |
| Fidelity Series Overseas Fund | 18,959,926 | 8,608,683 | 7,172,606 | 654,131 | 564,676 | (676,278) | 20,284,401 |
| Fidelity Series Real Estate Income Fund | 4,102,779 | 276,621 | 1,112,709 | 147,125 | 88,862 | 38,935 | 3,394,488 |
| Fidelity Series Short-Term Credit Fund | 39,775,353 | 5,062,710 | 21,677,588 | 619,320 | (56,284) | (1,181,374) | 21,922,817 |
| Fidelity Series Small Cap Discovery Fund | 1,733,878 | 342,950 | 668,698 | 261,977 | 110,421 | (202,036) | 1,316,515 |
| Fidelity Series Small Cap Opportunities Fund | 5,799,007 | 2,081,184 | 2,470,017 | 1,287,332 | 422,051 | (1,513,105) | 4,319,120 |
| Fidelity Series Stock Selector Large Cap Value Fund | 11,710,240 | 2,393,785 | 4,891,840 | 1,727,007 | 935,076 | (1,207,925) | 8,939,336 |
| Fidelity Series Value Discovery Fund | 9,006,001 | 1,342,123 | 3,733,226 | 861,569 | 952,494 | (767,202) | 6,800,190 |
| | $1,077,413,007 | $384,205,220 | $483,744,298 | $50,723,696 | $23,064,231 | $(70,947,573) | $929,914,628 |
(a) Includes the value of shares purchased or redeemed through in-kind transactions, if applicable.
Amounts in the income column in the above table include any capital gain distributions from underlying funds, which are presented in the corresponding line-item in the Statement of Operations, if applicable.
Investment Valuation
The following is a summary of the inputs used, as of March 31, 2022, involving the Fund's assets and liabilities carried at fair value. The inputs or methodology used for valuing securities may not be an indication of the risk associated with investing in those securities. For more information on valuation inputs, and their aggregation into the levels used below, please refer to the Investment Valuation section in the accompanying Notes to Financial Statements.
| | Valuation Inputs at Reporting Date: |
| Description | Total | Level 1 | Level 2 | Level 3 |
| Investments in Securities: | | | | |
| Other Short-Term Investments | $349,788 | $-- | $349,788 | $-- |
| Domestic Equity Funds | 87,091,713 | 87,091,713 | -- | -- |
| International Equity Funds | 134,223,614 | 134,223,614 | -- | -- |
| Bond Funds | 599,151,042 | 599,151,042 | -- | -- |
| Short-Term Funds | 109,811,965 | 109,811,965 | -- | -- |
| Total Investments in Securities: | $930,628,122 | $930,278,334 | $349,788 | $-- |
| Derivative Instruments: | | | | |
| Assets | | | | |
| Futures Contracts | $265,106 | $265,106 | $-- | $-- |
| Total Assets | $265,106 | $265,106 | $-- | $-- |
| Liabilities | | | | |
| Futures Contracts | $(52,824) | $(52,824) | $-- | $-- |
| Total Liabilities | $(52,824) | $(52,824) | $-- | $-- |
| Total Derivative Instruments: | $212,282 | $212,282 | $-- | $-- |
Value of Derivative Instruments
The following table is a summary of the Fund's value of derivative instruments by primary risk exposure as of March 31, 2022. For additional information on derivative instruments, please refer to the Derivative Instruments section in the accompanying Notes to Financial Statements.
| Primary Risk Exposure / Derivative Type | Value |
| | Asset | Liability |
| Equity Risk | | |
| Futures Contracts(a) | $265,106 | $(52,824) |
| Total Equity Risk | 265,106 | (52,824) |
| Total Value of Derivatives | $265,106 | $(52,824) |
(a) Reflects gross cumulative appreciation (depreciation) on futures contracts as presented in the Schedule of Investments. In the Statement of Assets and Liabilities, the period end daily variation margin is included in receivable or payable for daily variation margin on futures contracts, and the net cumulative appreciation (depreciation) is included in Total accumulated earnings (loss).
See accompanying notes which are an integral part of the financial statements.
Fidelity Freedom® 2005 Fund
Financial Statements
Statement of Assets and Liabilities
| | | March 31, 2022 |
| Assets | | |
Investment in securities, at value — See accompanying schedule:
Unaffiliated issuers (cost $349,790) | $349,788 | |
| Fidelity Central Funds (cost $363,706) | 363,706 | |
| Other affiliated issuers (cost $895,924,216) | 929,914,628 | |
| Total Investment in Securities (cost $896,637,712) | | $930,628,122 |
| Receivable for investments sold | | 27,307,676 |
| Receivable for fund shares sold | | 475,002 |
| Distributions receivable from Fidelity Central Funds | | 49 |
| Other receivables | | 1 |
| Total assets | | 958,410,850 |
| Liabilities | | |
| Payable for investments purchased | $26,561,003 | |
| Payable for fund shares redeemed | 895,421 | |
| Accrued management fee | 343,043 | |
| Payable for daily variation margin on futures contracts | 43,594 | |
| Total liabilities | | 27,843,061 |
| Net Assets | | $930,567,789 |
| Net Assets consist of: | | |
| Paid in capital | | $875,927,905 |
| Total accumulated earnings (loss) | | 54,639,884 |
| Net Assets | | $930,567,789 |
| Net Asset Value and Maximum Offering Price | | |
| Fidelity Freedom 2005 Fund: | | |
| Net Asset Value, offering price and redemption price per share ($549,383,363 ÷ 45,529,538 shares) | | $12.07 |
| Class K: | | |
| Net Asset Value, offering price and redemption price per share ($283,366,263 ÷ 23,522,167 shares) | | $12.05 |
| Class K6: | | |
| Net Asset Value, offering price and redemption price per share ($97,818,163 ÷ 8,144,198 shares) | | $12.01 |
See accompanying notes which are an integral part of the financial statements.
Statement of Operations
| | | Year ended March 31, 2022 |
| Investment Income | | |
| Dividends: | | |
| Affiliated issuers | | $28,279,910 |
| Interest | | 156 |
| Income from Fidelity Central Funds | | 401 |
| Total income | | 28,280,467 |
| Expenses | | |
| Management fee | $4,450,994 | |
| Independent trustees' fees and expenses | 3,130 | |
| Total expenses before reductions | 4,454,124 | |
| Expense reductions | (6) | |
| Total expenses after reductions | | 4,454,118 |
| Net investment income (loss) | | 23,826,349 |
| Realized and Unrealized Gain (Loss) | | |
| Net realized gain (loss) on: | | |
| Investment securities: | | |
| Unaffiliated issuers | 30 | |
| Affiliated issuers | 23,064,231 | |
| Futures contracts | 143,960 | |
| Capital gain distributions from underlying funds: | | |
| Affiliated issuers | 22,443,786 | |
| Total net realized gain (loss) | | 45,652,007 |
| Change in net unrealized appreciation (depreciation) on: | | |
| Investment securities: | | |
| Unaffiliated issuers | (13) | |
| Affiliated issuers | (70,947,573) | |
| Futures contracts | 212,282 | |
| Total change in net unrealized appreciation (depreciation) | | (70,735,304) |
| Net gain (loss) | | (25,083,297) |
| Net increase (decrease) in net assets resulting from operations | | $(1,256,948) |
See accompanying notes which are an integral part of the financial statements.
Statement of Changes in Net Assets
| | Year ended March 31, 2022 | Year ended March 31, 2021 |
| Increase (Decrease) in Net Assets | | |
| Operations | | |
| Net investment income (loss) | $23,826,349 | $11,512,158 |
| Net realized gain (loss) | 45,652,007 | 46,415,469 |
| Change in net unrealized appreciation (depreciation) | (70,735,304) | 100,776,421 |
| Net increase (decrease) in net assets resulting from operations | (1,256,948) | 158,704,048 |
| Distributions to shareholders | (73,429,776) | (46,360,027) |
| Share transactions - net increase (decrease) | (73,013,845) | 27,604,219 |
| Total increase (decrease) in net assets | (147,700,569) | 139,948,240 |
| Net Assets | | |
| Beginning of period | 1,078,268,358 | 938,320,118 |
| End of period | $930,567,789 | $1,078,268,358 |
See accompanying notes which are an integral part of the financial statements.
Financial Highlights
Fidelity Freedom 2005 Fund
| Years ended March 31, | 2022 | 2021 | 2020 | 2019 | 2018 |
| Selected Per–Share Data | | | | | |
| Net asset value, beginning of period | $13.06 | $11.68 | $12.20 | $12.50 | $12.20 |
| Income from Investment Operations | | | | | |
| Net investment income (loss)A,B | .30 | .14 | .23 | .24 | .19 |
| Net realized and unrealized gain (loss) | (.33) | 1.81 | (.19) | .11 | .59 |
| Total from investment operations | (.03) | 1.95 | .04 | .35 | .78 |
| Distributions from net investment income | (.31) | (.15) | (.24) | (.24) | (.18) |
| Distributions from net realized gain | (.64) | (.42) | (.31) | (.41) | (.30) |
| Total distributions | (.96)C | (.57) | (.56)C | (.65) | (.48) |
| Net asset value, end of period | $12.07 | $13.06 | $11.68 | $12.20 | $12.50 |
| Total ReturnD | (.53)% | 16.89% | .12% | 3.03% | 6.43% |
| Ratios to Average Net AssetsB,E,F | | | | | |
| Expenses before reductions | .47% | .47% | .47% | .48% | .41% |
| Expenses net of fee waivers, if any | .47% | .47% | .47% | .48% | .41% |
| Expenses net of all reductions | .47% | .47% | .47% | .48% | .41% |
| Net investment income (loss) | 2.33% | 1.07% | 1.89% | 1.98% | 1.52% |
| Supplemental Data | | | | | |
| Net assets, end of period (000 omitted) | $549,383 | $629,098 | $530,872 | $563,036 | $590,056 |
| Portfolio turnover rateG | 38% | 27% | 24% | 26% | 23%H |
A Calculated based on average shares outstanding during the period.
B Net investment income (loss) is affected by the timing of the declaration of dividends by any underlying mutual funds or exchange-traded funds (ETFs). Net investment income (loss) of any such underlying funds is not included in the Fund's net investment income (loss) ratio.
C Total distributions per share do not sum due to rounding.
D Total returns would have been lower if certain expenses had not been reduced during the applicable periods shown.
E Fees and expenses of any underlying mutual funds or exchange-traded funds (ETFs) are not included in the Fund's expense ratio. The Fund indirectly bears its proportionate share of these expenses. For additional expense information related to investments in Fidelity Central Funds, please refer to the "Investments in Fidelity Central Funds" note found in the Notes to Financial Statements section of the most recent Annual or Semi-Annual report.
F Expense ratios reflect operating expenses of the class. Expenses before reductions do not reflect amounts reimbursed, waived, or reduced through arrangements with the investment adviser, brokerage services, or other offset arrangements, if applicable, and do not represent the amount paid by the class during periods when reimbursements, waivers or reductions occur.
G Amount does not include the portfolio activity of any underlying mutual funds or exchange-traded funds (ETFs).
H The portfolio turnover rate does not include the assets acquired in the merger.
See accompanying notes which are an integral part of the financial statements.
Fidelity Freedom 2005 Fund Class K
| Years ended March 31, | 2022 | 2021 | 2020 | 2019 | 2018 A |
| Selected Per–Share Data | | | | | |
| Net asset value, beginning of period | $13.04 | $11.66 | $12.18 | $12.49 | $12.48 |
| Income from Investment Operations | | | | | |
| Net investment income (loss)B,C | .31 | .14 | .24 | .25 | .21 |
| Net realized and unrealized gain (loss) | (.34) | 1.82 | (.19) | .10 | .15 |
| Total from investment operations | (.03) | 1.96 | .05 | .35 | .36 |
| Distributions from net investment income | (.32) | (.16) | (.25) | (.24) | (.16) |
| Distributions from net realized gain | (.64) | (.42) | (.31) | (.41) | (.19) |
| Total distributions | (.96) | (.58) | (.57)D | (.66)D | (.35) |
| Net asset value, end of period | $12.05 | $13.04 | $11.66 | $12.18 | $12.49 |
| Total ReturnE,F | (.49)% | 16.99% | .18% | 3.00% | 2.89% |
| Ratios to Average Net AssetsC,G,H | | | | | |
| Expenses before reductions | .41% | .42% | .42% | .43% | .44%I |
| Expenses net of fee waivers, if any | .41% | .42% | .42% | .43% | .44%I |
| Expenses net of all reductions | .41% | .42% | .42% | .43% | .44%I |
| Net investment income (loss) | 2.38% | 1.12% | 1.94% | 2.03% | 2.37%I |
| Supplemental Data | | | | | |
| Net assets, end of period (000 omitted) | $283,366 | $356,835 | $338,902 | $357,174 | $422,622 |
| Portfolio turnover rateJ | 38% | 27% | 24% | 26% | 23%K |
A For the period July 20, 2017 (commencement of sale of shares) through March 31, 2018.
B Calculated based on average shares outstanding during the period.
C Net investment income (loss) is affected by the timing of the declaration of dividends by any underlying mutual funds or exchange-traded funds (ETFs). Net investment income (loss) of any such underlying funds is not included in the Fund's net investment income (loss) ratio.
D Total distributions per share do not sum due to rounding.
E Total returns for periods of less than one year are not annualized.
F Total returns would have been lower if certain expenses had not been reduced during the applicable periods shown.
G Fees and expenses of any underlying mutual funds or exchange-traded funds (ETFs) are not included in the Fund's expense ratio. The Fund indirectly bears its proportionate share of these expenses. For additional expense information related to investments in Fidelity Central Funds, please refer to the "Investments in Fidelity Central Funds" note found in the Notes to Financial Statements section of the most recent Annual or Semi-Annual report.
H Expense ratios reflect operating expenses of the class. Expenses before reductions do not reflect amounts reimbursed, waived, or reduced through arrangements with the investment adviser, brokerage services, or other offset arrangements, if applicable, and do not represent the amount paid by the class during periods when reimbursements, waivers or reductions occur.
I Annualized
J Amount does not include the portfolio activity of any underlying mutual funds or exchange-traded funds (ETFs).
K The portfolio turnover rate does not include the assets acquired in the merger.
See accompanying notes which are an integral part of the financial statements.
Fidelity Freedom 2005 Fund Class K6
| Years ended March 31, | 2022 | 2021 | 2020 | 2019 | 2018 A |
| Selected Per–Share Data | | | | | |
| Net asset value, beginning of period | $13.01 | $11.64 | $12.17 | $12.49 | $12.36 |
| Income from Investment Operations | | | | | |
| Net investment income (loss)B,C | .31 | .15 | .25 | .25 | .20 |
| Net realized and unrealized gain (loss) | (.34) | 1.81 | (.20) | .11 | .29 |
| Total from investment operations | (.03) | 1.96 | .05 | .36 | .49 |
| Distributions from net investment income | (.33) | (.17) | (.27) | (.27) | (.16) |
| Distributions from net realized gain | (.64) | (.42) | (.31) | (.41) | (.19) |
| Total distributions | (.97) | (.59) | (.58) | (.68) | (.36)D |
| Net asset value, end of period | $12.01 | $13.01 | $11.64 | $12.17 | $12.49 |
| Total ReturnE,F | (.48)% | 17.02% | .22% | 3.15% | 3.92% |
| Ratios to Average Net AssetsC,G,H | | | | | |
| Expenses before reductions | .37% | .37% | .37% | .38%I | .38%J |
| Expenses net of fee waivers, if any | .37% | .37% | .37% | .38%I | .38%J |
| Expenses net of all reductions | .37% | .37% | .37% | .38%I | .38%J |
| Net investment income (loss) | 2.43% | 1.17% | 1.99% | 2.08% | 1.93%J |
| Supplemental Data | | | | | |
| Net assets, end of period (000 omitted) | $97,818 | $92,336 | $68,546 | $41,670 | $9,983 |
| Portfolio turnover rateK | 38% | 27% | 24% | 26% | 23%L |
A For the period June 7, 2017 (commencement of sale of shares) through March 31, 2018.
B Calculated based on average shares outstanding during the period.
C Net investment income (loss) is affected by the timing of the declaration of dividends by any underlying mutual funds or exchange-traded funds (ETFs). Net investment income (loss) of any such underlying funds is not included in the Fund's net investment income (loss) ratio.
D Total distributions per share do not sum due to rounding.
E Total returns for periods of less than one year are not annualized.
F Total returns would have been lower if certain expenses had not been reduced during the applicable periods shown.
G Fees and expenses of any underlying mutual funds or exchange-traded funds (ETFs) are not included in the Fund's expense ratio. The Fund indirectly bears its proportionate share of these expenses. For additional expense information related to investments in Fidelity Central Funds, please refer to the "Investments in Fidelity Central Funds" note found in the Notes to Financial Statements section of the most recent Annual or Semi-Annual report.
H Expense ratios reflect operating expenses of the class. Expenses before reductions do not reflect amounts reimbursed, waived, or reduced through arrangements with the investment adviser, brokerage services, or other offset arrangements, if applicable, and do not represent the amount paid by the class during periods when reimbursements, waivers or reductions occur.
I On certain classes, the size and fluctuation of net assets and expense amounts may cause ratios to differ from contractual rates.
J Annualized
K Amount does not include the portfolio activity of any underlying mutual funds or exchange-traded funds (ETFs).
L The portfolio turnover rate does not include the assets acquired in the merger.
See accompanying notes which are an integral part of the financial statements.
Fidelity Freedom® 2010 Fund
Investment Summary (Unaudited)
The information in the following tables is based on the direct investments of the Fund.
Top Holdings as of March 31, 2022
| | % of fund's net assets |
| Fidelity Series Investment Grade Bond Fund | 35.1 |
| Fidelity Series 0-5 Year Inflation-Protected Bond Index Fund | 10.1 |
| Fidelity Series Government Money Market Fund 0.31% | 7.0 |
| Fidelity Series Emerging Markets Opportunities Fund | 6.6 |
| Fidelity Series Long-Term Treasury Bond Index Fund | 3.9 |
| Fidelity Series International Developed Markets Bond Index Fund | 3.0 |
| Fidelity Series International Value Fund | 2.9 |
| Fidelity Series Overseas Fund | 2.9 |
| Fidelity Series International Growth Fund | 2.9 |
| Fidelity Series 5+ Year Inflation-Protected Bond Index Fund | 2.8 |
| | 77.2 |
Asset Allocation (% of fund's net assets)
| Period end |
| | Domestic Equity Funds | 14.7% |
| | International Equity Funds | 18.0% |
| | Bond Funds | 58.4% |
| | Short-Term Funds | 8.9% |

Domestic Equity Funds category includes Fidelity Series Commodity Strategy Fund which invests in commodity-related investments.
Fidelity Freedom® 2010 Fund
Schedule of Investments March 31, 2022
Showing Percentage of Net Assets
| U.S. Treasury Obligations - 0.0% | | | |
| | | Principal Amount | Value |
| U.S. Treasury Bills, yield at date of purchase 0.17% to 0.38% 4/21/22 to 6/9/22 (a) | | | |
| (Cost $1,729,093) | | 1,730,000 | 1,729,091 |
| | | Shares | Value |
|
| Domestic Equity Funds - 14.7% | | | |
| Fidelity Series All-Sector Equity Fund (b) | | 2,354,319 | $25,379,563 |
| Fidelity Series Blue Chip Growth Fund (b) | | 2,900,945 | 41,686,587 |
| Fidelity Series Commodity Strategy Fund (b) | | 13,939,690 | 71,231,816 |
| Fidelity Series Growth Company Fund (b) | | 5,709,797 | 103,861,204 |
| Fidelity Series Intrinsic Opportunities Fund (b) | | 5,049,620 | 99,326,020 |
| Fidelity Series Large Cap Stock Fund (b) | | 4,858,887 | 92,367,449 |
| Fidelity Series Large Cap Value Index Fund (b) | | 2,263,472 | 34,766,933 |
| Fidelity Series Opportunistic Insights Fund (b) | | 2,911,080 | 53,214,540 |
| Fidelity Series Small Cap Discovery Fund (b) | | 855,710 | 11,457,958 |
| Fidelity Series Small Cap Opportunities Fund (b) | | 2,760,073 | 37,592,192 |
| Fidelity Series Stock Selector Large Cap Value Fund (b) | | 5,742,145 | 77,806,062 |
| Fidelity Series Value Discovery Fund (b) | | 3,699,271 | 59,188,328 |
| TOTAL DOMESTIC EQUITY FUNDS | | | |
| (Cost $474,041,701) | | | 707,878,652 |
|
| International Equity Funds - 18.0% | | | |
| Fidelity Series Canada Fund (b) | | 3,862,337 | 59,943,474 |
| Fidelity Series Emerging Markets Fund (b) | | 3,815,725 | 35,409,926 |
| Fidelity Series Emerging Markets Opportunities Fund (b) | | 17,339,150 | 319,040,360 |
| Fidelity Series International Growth Fund (b) | | 8,296,952 | 137,563,466 |
| Fidelity Series International Small Cap Fund (b) | | 2,119,548 | 38,045,891 |
| Fidelity Series International Value Fund (b) | | 12,597,711 | 138,952,756 |
| Fidelity Series Overseas Fund (b) | | 10,961,118 | 138,329,304 |
| TOTAL INTERNATIONAL EQUITY FUNDS | | | |
| (Cost $680,180,242) | | | 867,285,177 |
|
| Bond Funds - 58.4% | | | |
| Fidelity Series 0-5 Year Inflation-Protected Bond Index Fund (b) | | 48,459,528 | 486,049,066 |
| Fidelity Series 5+ Year Inflation-Protected Bond Index Fund (b) | | 14,170,832 | 136,039,987 |
| Fidelity Series Emerging Markets Debt Fund (b) | | 2,950,651 | 24,342,875 |
| Fidelity Series Emerging Markets Debt Local Currency Fund (b) | | 900,346 | 8,112,120 |
| Fidelity Series Floating Rate High Income Fund (b) | | 530,768 | 4,877,760 |
| Fidelity Series High Income Fund (b) | | 3,178,443 | 28,892,048 |
| Fidelity Series Inflation-Protected Bond Index Fund (b) | | 7,619,792 | 77,340,890 |
| Fidelity Series International Credit Fund (b) | | 424,268 | 3,928,718 |
| Fidelity Series International Developed Markets Bond Index Fund (b) | | 15,780,738 | 147,234,284 |
| Fidelity Series Investment Grade Bond Fund (b) | | 154,992,222 | 1,690,965,140 |
| Fidelity Series Long-Term Treasury Bond Index Fund (b) | | 24,762,745 | 188,692,115 |
| Fidelity Series Real Estate Income Fund (b) | | 1,543,170 | 17,530,411 |
| TOTAL BOND FUNDS | | | |
| (Cost $2,905,441,718) | | | 2,814,005,414 |
|
| Short-Term Funds - 8.9% | | | |
| Fidelity Cash Central Fund 0.31% (c) | | 2,321,945 | 2,322,409 |
| Fidelity Series Government Money Market Fund 0.31% (b)(d) | | 339,130,442 | 339,130,442 |
| Fidelity Series Short-Term Credit Fund (b) | | 8,712,270 | 84,944,631 |
| TOTAL SHORT-TERM FUNDS | | | |
| (Cost $428,153,794) | | | 426,397,482 |
| TOTAL INVESTMENT IN SECURITIES - 100.0% | | | |
| (Cost $4,489,546,548) | | | 4,817,295,816 |
| NET OTHER ASSETS (LIABILITIES) - 0.0% | | | (373,804) |
| NET ASSETS - 100% | | | $4,816,922,012 |
| Futures Contracts | | | | | |
| | Number of contracts | Expiration Date | Notional Amount | Value | Unrealized Appreciation/(Depreciation) |
| Purchased | | | | | |
| Equity Index Contracts | | | | | |
| ICE E-mini MSCI EAFE Index Contracts (United States) | 105 | June 2022 | $11,258,100 | $639,996 | $639,996 |
| ICE E-mini MSCI Emerging Markets Index Contracts (United States) | 237 | June 2022 | 13,337,175 | 747,754 | 747,754 |
| TOTAL PURCHASED | | | | | $1,387,750 |
| Sold | | | | | |
| Equity Index Contracts | | | | | |
| CME Micro E-mini S&P 500 Index Contracts (United States) | 115 | June 2022 | 26,051,813 | (66,797) | (66,797) |
| TOTAL FUTURES CONTRACTS | | | | | $1,320,953 |
The notional amount of futures purchased as a percentage of Net Assets is 0.5%
The notional amount of futures sold as a percentage of Net Assets is 0.5%
For the period, the average monthly notional amount at value for futures contracts in the aggregate was $7,678,409.
Legend
(a) Security or a portion of the security was pledged to cover margin requirements for futures contracts. At period end, the value of securities pledged amounted to $1,562,206.
(b) Affiliated Fund
(c) Affiliated fund that is generally available only to investment companies and other accounts managed by Fidelity Investments. The rate quoted is the annualized seven-day yield of the fund at period end. A complete unaudited listing of the fund's holdings as of its most recent quarter end is available upon request. In addition, each Fidelity Central Fund's financial statements, which are not covered by the Fund's Report of Independent Registered Public Accounting Firm, are available on the SEC's website or upon request.
(d) The rate quoted is the annualized seven-day yield of the fund at period end.
Affiliated Central Funds
Fiscal year to date information regarding the Fund's investments in Fidelity Central Funds, including the ownership percentage, is presented below.
| Fund | Value, beginning of period | Purchases | Sales Proceeds | Dividend Income | Realized Gain/Loss | Change in Unrealized appreciation (depreciation) | Value, end of period | % ownership, end of period |
| Fidelity Cash Central Fund 0.31% | $4,295,661 | $20,425,306 | $22,398,559 | $2,390 | $94 | $(93) | $2,322,409 | 0.0% |
| Total | $4,295,661 | $20,425,306 | $22,398,559 | $2,390 | $94 | $(93) | $2,322,409 | |
Amounts in the income column in the above table include any capital gain distributions from underlying funds, which are presented in the corresponding line-item in the Statement of Operations, if applicable.
Affiliated Underlying Funds
Fiscal year to date information regarding the Fund's investments in affiliated Underlying Funds is presented below. Exchanges between classes of the same affiliated Underlying Funds may occur. If an underlying Fund changes its name, the name presented below is the name in effect at period end.
| Fund | Value, beginning of period | Purchases(a) | Sales Proceeds(a) | Dividend Income | Realized Gain (loss) | Change in Unrealized appreciation (depreciation) | Value, end of period |
| Fidelity Series 0-5 Year Inflation-Protected Bond Index Fund | $-- | $507,839,916 | $20,581,934 | $1,858,655 | $(24,182) | $(908,017) | $486,049,066 |
| Fidelity Series 5+ Year Inflation-Protected Bond Index Fund | -- | 170,830,083 | 28,735,267 | 920,083 | (1,114,334) | (4,940,495) | 136,039,987 |
| Fidelity Series All-Sector Equity Fund | 32,410,531 | 7,226,040 | 12,802,829 | 5,409,039 | 1,189,518 | (2,643,697) | 25,379,563 |
| Fidelity Series Blue Chip Growth Fund | 51,431,612 | 19,783,213 | 22,760,229 | 9,748,801 | 2,843,954 | (9,611,963) | 41,686,587 |
| Fidelity Series Canada Fund | 48,634,875 | 15,390,811 | 14,733,906 | 1,303,094 | 939,492 | 9,712,202 | 59,943,474 |
| Fidelity Series Commodity Strategy Fund | 153,314,305 | 47,900,998 | 136,011,083 | 44,965,629 | (2,834,137) | 8,861,733 | 71,231,816 |
| Fidelity Series Emerging Markets Debt Fund | 29,464,295 | 2,967,131 | 5,648,284 | 1,284,324 | (437,029) | (2,003,238) | 24,342,875 |
| Fidelity Series Emerging Markets Debt Local Currency Fund | 9,656,836 | 1,315,242 | 1,933,057 | 355,331 | (56,742) | (870,159) | 8,112,120 |
| Fidelity Series Emerging Markets Fund | 48,314,413 | 8,951,698 | 13,390,982 | 1,272,445 | 1,475,180 | (9,940,383) | 35,409,926 |
| Fidelity Series Emerging Markets Opportunities Fund | 441,066,223 | 124,032,297 | 135,402,388 | 40,893,007 | 21,685,323 | (132,341,095) | 319,040,360 |
| Fidelity Series Floating Rate High Income Fund | 5,935,721 | 270,992 | 1,335,518 | 235,237 | (95,049) | 101,614 | 4,877,760 |
| Fidelity Series Government Money Market Fund 0.31% | 786,773,183 | 39,438,220 | 487,080,961 | 528,981 | -- | -- | 339,130,442 |
| Fidelity Series Growth Company Fund | 131,328,256 | 60,930,664 | 68,938,505 | 32,231,526 | 13,995,161 | (33,454,372) | 103,861,204 |
| Fidelity Series High Income Fund | 35,028,537 | 1,993,143 | 7,192,917 | 1,780,548 | (51,707) | (885,008) | 28,892,048 |
| Fidelity Series Inflation-Protected Bond Index Fund | 541,960,921 | 30,576,036 | 497,890,253 | 21,180,700 | 44,275,346 | (41,581,160) | 77,340,890 |
| Fidelity Series International Credit Fund | 4,100,541 | 132,331 | -- | 132,331 | -- | (304,154) | 3,928,718 |
| Fidelity Series International Developed Markets Bond Index Fund | -- | 160,246,307 | 6,404,148 | 51,833 | (95,307) | (6,512,568) | 147,234,284 |
| Fidelity Series International Growth Fund | 136,287,006 | 54,964,974 | 41,604,079 | 12,125,087 | 1,103,236 | (13,187,671) | 137,563,466 |
| Fidelity Series International Small Cap Fund | 43,185,359 | 9,901,286 | 9,285,039 | 5,547,372 | 1,716,402 | (7,472,117) | 38,045,891 |
| Fidelity Series International Value Fund | 136,135,624 | 48,519,100 | 48,194,712 | 7,606,344 | 2,417,381 | 75,363 | 138,952,756 |
| Fidelity Series Intrinsic Opportunities Fund | 131,704,442 | 27,008,926 | 49,497,414 | 20,655,152 | 11,145,240 | (21,035,174) | 99,326,020 |
| Fidelity Series Investment Grade Bond Fund | 1,874,217,150 | 224,735,417 | 315,858,550 | 40,689,728 | (4,055,931) | (88,072,946) | 1,690,965,140 |
| Fidelity Series Large Cap Stock Fund | 115,140,392 | 13,511,905 | 40,300,165 | 9,654,440 | 12,968,773 | (8,953,456) | 92,367,449 |
| Fidelity Series Large Cap Value Index Fund | 42,442,922 | 3,132,051 | 12,932,215 | 2,458,876 | 3,500,515 | (1,376,340) | 34,766,933 |
| Fidelity Series Long-Term Treasury Bond Index Fund | 151,065,548 | 87,159,009 | 44,908,076 | 3,778,043 | (3,247,674) | (1,376,692) | 188,692,115 |
| Fidelity Series Opportunistic Insights Fund | 67,233,767 | 20,099,927 | 30,441,098 | 10,907,012 | 8,575,987 | (12,254,043) | 53,214,540 |
| Fidelity Series Overseas Fund | 136,515,566 | 46,451,329 | 44,593,932 | 4,494,950 | 3,353,279 | (3,396,938) | 138,329,304 |
| Fidelity Series Real Estate Income Fund | 21,227,426 | 910,449 | 5,273,507 | 776,862 | 584,418 | 81,625 | 17,530,411 |
| Fidelity Series Short-Term Credit Fund | 165,002,037 | 17,145,104 | 92,153,584 | 2,586,471 | (262,554) | (4,786,372) | 84,944,631 |
| Fidelity Series Small Cap Discovery Fund | 14,409,248 | 2,594,217 | 4,717,845 | 2,257,097 | 716,124 | (1,543,786) | 11,457,958 |
| Fidelity Series Small Cap Opportunities Fund | 48,190,572 | 16,796,892 | 17,770,227 | 11,189,063 | 2,735,171 | (12,360,216) | 37,592,192 |
| Fidelity Series Stock Selector Large Cap Value Fund | 97,326,116 | 17,772,809 | 34,617,163 | 15,025,853 | 6,425,036 | (9,100,736) | 77,806,062 |
| Fidelity Series Value Discovery Fund | 74,848,814 | 9,422,932 | 26,490,565 | 7,484,450 | 7,047,474 | (5,640,327) | 59,188,328 |
| | $5,574,352,238 | $1,799,951,449 | $2,279,480,432 | $321,388,364 | $136,418,364 | $(417,720,586) | $4,813,244,316 |
(a) Includes the value of shares purchased or redeemed through in-kind transactions, if applicable.
Amounts in the income column in the above table include any capital gain distributions from underlying funds, which are presented in the corresponding line-item in the Statement of Operations, if applicable.
Investment Valuation
The following is a summary of the inputs used, as of March 31, 2022, involving the Fund's assets and liabilities carried at fair value. The inputs or methodology used for valuing securities may not be an indication of the risk associated with investing in those securities. For more information on valuation inputs, and their aggregation into the levels used below, please refer to the Investment Valuation section in the accompanying Notes to Financial Statements.
| | Valuation Inputs at Reporting Date: |
| Description | Total | Level 1 | Level 2 | Level 3 |
| Investments in Securities: | | | | |
| Other Short-Term Investments | $1,729,091 | $-- | $1,729,091 | $-- |
| Domestic Equity Funds | 707,878,652 | 707,878,652 | -- | -- |
| International Equity Funds | 867,285,177 | 867,285,177 | -- | -- |
| Bond Funds | 2,814,005,414 | 2,814,005,414 | -- | -- |
| Short-Term Funds | 426,397,482 | 426,397,482 | -- | -- |
| Total Investments in Securities: | $4,817,295,816 | $4,815,566,725 | $1,729,091 | $-- |
| Derivative Instruments: | | | | |
| Assets | | | | |
| Futures Contracts | $1,387,750 | $1,387,750 | $-- | $-- |
| Total Assets | $1,387,750 | $1,387,750 | $-- | $-- |
| Liabilities | | | | |
| Futures Contracts | $(66,797) | $(66,797) | $-- | $-- |
| Total Liabilities | $(66,797) | $(66,797) | $-- | $-- |
| Total Derivative Instruments: | $1,320,953 | $1,320,953 | $-- | $-- |
Value of Derivative Instruments
The following table is a summary of the Fund's value of derivative instruments by primary risk exposure as of March 31, 2022. For additional information on derivative instruments, please refer to the Derivative Instruments section in the accompanying Notes to Financial Statements.
| Primary Risk Exposure / Derivative Type | Value |
| | Asset | Liability |
| Equity Risk | | |
| Futures Contracts(a) | $1,387,750 | $(66,797) |
| Total Equity Risk | 1,387,750 | (66,797) |
| Total Value of Derivatives | $1,387,750 | $(66,797) |
(a) Reflects gross cumulative appreciation (depreciation) on futures contracts as presented in the Schedule of Investments. In the Statement of Assets and Liabilities, the period end daily variation margin is included in receivable or payable for daily variation margin on futures contracts, and the net cumulative appreciation (depreciation) is included in Total accumulated earnings (loss).
See accompanying notes which are an integral part of the financial statements.
Fidelity Freedom® 2010 Fund
Financial Statements
Statement of Assets and Liabilities
| | | March 31, 2022 |
| Assets | | |
Investment in securities, at value — See accompanying schedule:
Unaffiliated issuers (cost $1,729,093) | $1,729,091 | |
| Fidelity Central Funds (cost $2,322,293) | 2,322,409 | |
| Other affiliated issuers (cost $4,485,495,162) | 4,813,244,316 | |
| Total Investment in Securities (cost $4,489,546,548) | | $4,817,295,816 |
| Receivable for investments sold | | 118,483,775 |
| Receivable for fund shares sold | | 1,961,570 |
| Distributions receivable from Fidelity Central Funds | | 311 |
| Total assets | | 4,937,741,472 |
| Liabilities | | |
| Payable for investments purchased | $116,383,659 | |
| Payable for fund shares redeemed | 2,231,290 | |
| Accrued management fee | 1,924,112 | |
| Payable for daily variation margin on futures contracts | 280,399 | |
| Total liabilities | | 120,819,460 |
| Net Assets | | $4,816,922,012 |
| Net Assets consist of: | | |
| Paid in capital | | $4,342,160,288 |
| Total accumulated earnings (loss) | | 474,761,724 |
| Net Assets | | $4,816,922,012 |
| Net Asset Value and Maximum Offering Price | | |
| Fidelity Freedom 2010 Fund: | | |
| Net Asset Value, offering price and redemption price per share ($3,401,088,791 ÷ 227,022,454 shares) | | $14.98 |
| Class K: | | |
| Net Asset Value, offering price and redemption price per share ($1,085,374,701 ÷ 72,468,239 shares) | | $14.98 |
| Class K6: | | |
| Net Asset Value, offering price and redemption price per share ($330,458,520 ÷ 22,167,470 shares) | | $14.91 |
See accompanying notes which are an integral part of the financial statements.
Statement of Operations
| | | Year ended March 31, 2022 |
| Investment Income | | |
| Dividends: | | |
| Affiliated issuers | | $150,389,180 |
| Interest | | 808 |
| Income from Fidelity Central Funds | | 2,390 |
| Total income | | 150,392,378 |
| Expenses | | |
| Management fee | $25,449,409 | |
| Independent trustees' fees and expenses | 16,438 | |
| Total expenses before reductions | 25,465,847 | |
| Expense reductions | (2) | |
| Total expenses after reductions | | 25,465,845 |
| Net investment income (loss) | | 124,926,533 |
| Realized and Unrealized Gain (Loss) | | |
| Net realized gain (loss) on: | | |
| Investment securities: | | |
| Unaffiliated issuers | 761 | |
| Fidelity Central Funds | 94 | |
| Other affiliated issuers | 136,418,364 | |
| Futures contracts | 1,026,108 | |
| Capital gain distributions from underlying funds: | | |
| Affiliated issuers | 170,999,184 | |
| Total net realized gain (loss) | | 308,444,511 |
| Change in net unrealized appreciation (depreciation) on: | | |
| Investment securities: | | |
| Unaffiliated issuers | (57) | |
| Fidelity Central Funds | (93) | |
| Other affiliated issuers | (417,720,586) | |
| Futures contracts | 1,320,953 | |
| Total change in net unrealized appreciation (depreciation) | | (416,399,783) |
| Net gain (loss) | | (107,955,272) |
| Net increase (decrease) in net assets resulting from operations | | $16,971,261 |
See accompanying notes which are an integral part of the financial statements.
Statement of Changes in Net Assets
| | Year ended March 31, 2022 | Year ended March 31, 2021 |
| Increase (Decrease) in Net Assets | | |
| Operations | | |
| Net investment income (loss) | $124,926,533 | $59,645,681 |
| Net realized gain (loss) | 308,444,511 | 336,501,220 |
| Change in net unrealized appreciation (depreciation) | (416,399,783) | 664,809,268 |
| Net increase (decrease) in net assets resulting from operations | 16,971,261 | 1,060,956,169 |
| Distributions to shareholders | (472,366,663) | (330,175,332) |
| Share transactions - net increase (decrease) | (306,895,879) | (125,322,115) |
| Total increase (decrease) in net assets | (762,291,281) | 605,458,722 |
| Net Assets | | |
| Beginning of period | 5,579,213,293 | 4,973,754,571 |
| End of period | $4,816,922,012 | $5,579,213,293 |
See accompanying notes which are an integral part of the financial statements.
Financial Highlights
Fidelity Freedom 2010 Fund
| Years ended March 31, | 2022 | 2021 | 2020 | 2019 | 2018 |
| Selected Per–Share Data | | | | | |
| Net asset value, beginning of period | $16.42 | $14.31 | $15.35 | $15.98 | $15.56 |
| Income from Investment Operations | | | | | |
| Net investment income (loss)A,B | .38 | .17 | .29 | .29 | .24 |
| Net realized and unrealized gain (loss) | (.35) | 2.92 | (.43) | .12 | .95 |
| Total from investment operations | .03 | 3.09 | (.14) | .41 | 1.19 |
| Distributions from net investment income | (.39) | (.20) | (.31) | (.30) | (.23) |
| Distributions from net realized gain | (1.07) | (.78) | (.60) | (.74) | (.54) |
| Total distributions | (1.47)C | (.98) | (.90)C | (1.04) | (.77) |
| Net asset value, end of period | $14.98 | $16.42 | $14.31 | $15.35 | $15.98 |
| Total ReturnD | (.17)% | 22.04% | (1.25)% | 2.89% | 7.74% |
| Ratios to Average Net AssetsB,E,F | | | | | |
| Expenses before reductions | .50% | .51% | .52% | .52%G | .44% |
| Expenses net of fee waivers, if any | .50% | .51% | .52% | .52%G | .44% |
| Expenses net of all reductions | .50% | .51% | .52% | .52%G | .44% |
| Net investment income (loss) | 2.32% | 1.08% | 1.84% | 1.90% | 1.47% |
| Supplemental Data | | | | | |
| Net assets, end of period (000 omitted) | $3,401,089 | $3,814,845 | $3,284,758 | $3,724,077 | $4,038,370 |
| Portfolio turnover rateH | 34% | 24% | 18% | 20% | 19%I |
A Calculated based on average shares outstanding during the period.
B Net investment income (loss) is affected by the timing of the declaration of dividends by any underlying mutual funds or exchange-traded funds (ETFs). Net investment income (loss) of any such underlying funds is not included in the Fund's net investment income (loss) ratio.
C Total distributions per share do not sum due to rounding.
D Total returns would have been lower if certain expenses had not been reduced during the applicable periods shown.
E Fees and expenses of any underlying mutual funds or exchange-traded funds (ETFs) are not included in the Fund's expense ratio. The Fund indirectly bears its proportionate share of these expenses. For additional expense information related to investments in Fidelity Central Funds, please refer to the "Investments in Fidelity Central Funds" note found in the Notes to Financial Statements section of the most recent Annual or Semi-Annual report.
F Expense ratios reflect operating expenses of the class. Expenses before reductions do not reflect amounts reimbursed, waived, or reduced through arrangements with the investment adviser, brokerage services, or other offset arrangements, if applicable, and do not represent the amount paid by the class during periods when reimbursements, waivers or reductions occur.
G On certain classes, the size and fluctuation of net assets and expense amounts may cause ratios to differ from contractual rates.
H Amount does not include the portfolio activity of any underlying mutual funds or exchange-traded funds (ETFs).
I The portfolio turnover rate does not include the assets acquired in the merger.
See accompanying notes which are an integral part of the financial statements.
Fidelity Freedom 2010 Fund Class K
| Years ended March 31, | 2022 | 2021 | 2020 | 2019 | 2018 A |
| Selected Per–Share Data | | | | | |
| Net asset value, beginning of period | $16.41 | $14.30 | $15.34 | $15.97 | $15.96 |
| Income from Investment Operations | | | | | |
| Net investment income (loss)B,C | .39 | .18 | .30 | .30 | .27 |
| Net realized and unrealized gain (loss) | (.35) | 2.92 | (.43) | .12 | .31 |
| Total from investment operations | .04 | 3.10 | (.13) | .42 | .58 |
| Distributions from net investment income | (.40) | (.20) | (.31) | (.31) | (.22) |
| Distributions from net realized gain | (1.07) | (.78) | (.60) | (.74) | (.35) |
| Total distributions | (1.47) | (.99)D | (.91) | (1.05) | (.57) |
| Net asset value, end of period | $14.98 | $16.41 | $14.30 | $15.34 | $15.97 |
| Total ReturnE,F | (.07)% | 22.11% | (1.21)% | 2.95% | 3.59% |
| Ratios to Average Net AssetsC,G,H | | | | | |
| Expenses before reductions | .44% | .45% | .45% | .46% | .47%I |
| Expenses net of fee waivers, if any | .44% | .45% | .45% | .46% | .47%I |
| Expenses net of all reductions | .44% | .45% | .45% | .46% | .47%I |
| Net investment income (loss) | 2.38% | 1.14% | 1.91% | 1.96% | 2.42%I |
| Supplemental Data | | | | | |
| Net assets, end of period (000 omitted) | $1,085,375 | $1,444,009 | $1,431,597 | $1,909,779 | $2,396,182 |
| Portfolio turnover rateJ | 34% | 24% | 18% | 20% | 19%K |
A For the period July 20, 2017 (commencement of sale of shares) through March 31, 2018.
B Calculated based on average shares outstanding during the period.
C Net investment income (loss) is affected by the timing of the declaration of dividends by any underlying mutual funds or exchange-traded funds (ETFs). Net investment income (loss) of any such underlying funds is not included in the Fund's net investment income (loss) ratio.
D Total distributions per share do not sum due to rounding.
E Total returns for periods of less than one year are not annualized.
F Total returns would have been lower if certain expenses had not been reduced during the applicable periods shown.
G Fees and expenses of any underlying mutual funds or exchange-traded funds (ETFs) are not included in the Fund's expense ratio. The Fund indirectly bears its proportionate share of these expenses. For additional expense information related to investments in Fidelity Central Funds, please refer to the "Investments in Fidelity Central Funds" note found in the Notes to Financial Statements section of the most recent Annual or Semi-Annual report.
H Expense ratios reflect operating expenses of the class. Expenses before reductions do not reflect amounts reimbursed, waived, or reduced through arrangements with the investment adviser, brokerage services, or other offset arrangements, if applicable, and do not represent the amount paid by the class during periods when reimbursements, waivers or reductions occur.
I Annualized
J Amount does not include the portfolio activity of any underlying mutual funds or exchange-traded funds (ETFs).
K The portfolio turnover rate does not include the assets acquired in the merger.
See accompanying notes which are an integral part of the financial statements.
Fidelity Freedom 2010 Fund Class K6
| Years ended March 31, | 2022 | 2021 | 2020 | 2019 | 2018 A |
| Selected Per–Share Data | | | | | |
| Net asset value, beginning of period | $16.35 | $14.25 | $15.30 | $15.97 | $15.77 |
| Income from Investment Operations | | | | | |
| Net investment income (loss)B,C | .39 | .19 | .30 | .31 | .27 |
| Net realized and unrealized gain (loss) | (.34) | 2.91 | (.42) | .11 | .50 |
| Total from investment operations | .05 | 3.10 | (.12) | .42 | .77 |
| Distributions from net investment income | (.42) | (.22) | (.34) | (.35) | (.22) |
| Distributions from net realized gain | (1.07) | (.78) | (.60) | (.74) | (.35) |
| Total distributions | (1.49) | (1.00) | (.93)D | (1.09) | (.57) |
| Net asset value, end of period | $14.91 | $16.35 | $14.25 | $15.30 | $15.97 |
| Total ReturnE,F | (.02)% | 22.23% | (1.14)% | 2.96% | 4.89% |
| Ratios to Average Net AssetsC,G,H | | | | | |
| Expenses before reductions | .38% | .38% | .39% | .39% | .40%I |
| Expenses net of fee waivers, if any | .38% | .38% | .39% | .39% | .40%I |
| Expenses net of all reductions | .38% | .38% | .39% | .39% | .40%I |
| Net investment income (loss) | 2.44% | 1.20% | 1.97% | 2.03% | 2.07%I |
| Supplemental Data | | | | | |
| Net assets, end of period (000 omitted) | $330,459 | $320,359 | $257,400 | $213,620 | $59,797 |
| Portfolio turnover rateJ | 34% | 24% | 18% | 20% | 19%K |
A For the period June 7, 2017 (commencement of sale of shares) through March 31, 2018.
B Calculated based on average shares outstanding during the period.
C Net investment income (loss) is affected by the timing of the declaration of dividends by any underlying mutual funds or exchange-traded funds (ETFs). Net investment income (loss) of any such underlying funds is not included in the Fund's net investment income (loss) ratio.
D Total distributions per share do not sum due to rounding.
E Total returns for periods of less than one year are not annualized.
F Total returns would have been lower if certain expenses had not been reduced during the applicable periods shown.
G Fees and expenses of any underlying mutual funds or exchange-traded funds (ETFs) are not included in the Fund's expense ratio. The Fund indirectly bears its proportionate share of these expenses. For additional expense information related to investments in Fidelity Central Funds, please refer to the "Investments in Fidelity Central Funds" note found in the Notes to Financial Statements section of the most recent Annual or Semi-Annual report.
H Expense ratios reflect operating expenses of the class. Expenses before reductions do not reflect amounts reimbursed, waived, or reduced through arrangements with the investment adviser, brokerage services, or other offset arrangements, if applicable, and do not represent the amount paid by the class during periods when reimbursements, waivers or reductions occur.
I Annualized
J Amount does not include the portfolio activity of any underlying mutual funds or exchange-traded funds (ETFs).
K The portfolio turnover rate does not include the assets acquired in the merger.
See accompanying notes which are an integral part of the financial statements.
Fidelity Freedom® 2015 Fund
Investment Summary (Unaudited)
The information in the following tables is based on the direct investments of the Fund.
Top Holdings as of March 31, 2022
| | % of fund's net assets |
| Fidelity Series Investment Grade Bond Fund | 31.6 |
| Fidelity Series Emerging Markets Opportunities Fund | 7.6 |
| Fidelity Series 0-5 Year Inflation-Protected Bond Index Fund | 5.6 |
| Fidelity Series 5+ Year Inflation-Protected Bond Index Fund | 4.8 |
| Fidelity Series Government Money Market Fund 0.31% | 4.5 |
| Fidelity Series Long-Term Treasury Bond Index Fund | 4.1 |
| Fidelity Series International Value Fund | 3.6 |
| Fidelity Series Overseas Fund | 3.6 |
| Fidelity Series International Growth Fund | 3.6 |
| Fidelity Series International Developed Markets Bond Index Fund | 3.1 |
| | 72.1 |
Asset Allocation (% of fund's net assets)
| Period end |
| | Domestic Equity Funds | 20.2% |
| | International Equity Funds | 21.7% |
| | Bond Funds | 52.4% |
| | Short-Term Funds | 5.7% |

Domestic Equity Funds category includes Fidelity Series Commodity Strategy Fund which invests in commodity-related investments.
Fidelity Freedom® 2015 Fund
Schedule of Investments March 31, 2022
Showing Percentage of Net Assets
| U.S. Treasury Obligations - 0.0% | | | |
| | | Principal Amount | Value |
| U.S. Treasury Bills, yield at date of purchase 0.17% to 0.38% 4/21/22 to 6/9/22 (a) | | | |
| (Cost $2,768,627) | | 2,770,000 | 2,768,619 |
| | | Shares | Value |
|
| Domestic Equity Funds - 20.2% | | | |
| Fidelity Series All-Sector Equity Fund (b) | | 4,971,392 | $53,591,604 |
| Fidelity Series Blue Chip Growth Fund (b) | | 6,124,536 | 88,009,589 |
| Fidelity Series Commodity Strategy Fund (b) | | 20,823,742 | 106,409,323 |
| Fidelity Series Growth Company Fund (b) | | 12,056,714 | 219,311,620 |
| Fidelity Series Intrinsic Opportunities Fund (b) | | 10,634,629 | 209,183,146 |
| Fidelity Series Large Cap Stock Fund (b) | | 10,259,817 | 195,039,129 |
| Fidelity Series Large Cap Value Index Fund (b) | | 4,779,615 | 73,414,879 |
| Fidelity Series Opportunistic Insights Fund (b) | | 6,147,157 | 112,370,035 |
| Fidelity Series Small Cap Discovery Fund (b) | | 1,806,897 | 24,194,354 |
| Fidelity Series Small Cap Opportunities Fund (b) | | 5,828,135 | 79,379,204 |
| Fidelity Series Stock Selector Large Cap Value Fund (b) | | 12,125,069 | 164,294,684 |
| Fidelity Series Value Discovery Fund (b) | | 7,811,532 | 124,984,516 |
| TOTAL DOMESTIC EQUITY FUNDS | | | |
| (Cost $969,224,430) | | | 1,450,182,083 |
|
| International Equity Funds - 21.7% | | | |
| Fidelity Series Canada Fund (b) | | 7,178,717 | 111,413,681 |
| Fidelity Series Emerging Markets Fund (b) | | 6,495,208 | 60,275,531 |
| Fidelity Series Emerging Markets Opportunities Fund (b) | | 29,516,702 | 543,107,325 |
| Fidelity Series International Growth Fund (b) | | 15,425,783 | 255,759,481 |
| Fidelity Series International Small Cap Fund (b) | | 3,942,142 | 70,761,452 |
| Fidelity Series International Value Fund (b) | | 23,420,998 | 258,333,603 |
| Fidelity Series Overseas Fund (b) | | 20,378,984 | 257,182,773 |
| TOTAL INTERNATIONAL EQUITY FUNDS | | | |
| (Cost $1,211,107,567) | | | 1,556,833,846 |
|
| Bond Funds - 52.4% | | | |
| Fidelity Series 0-5 Year Inflation-Protected Bond Index Fund (b) | | 40,241,559 | 403,622,833 |
| Fidelity Series 5+ Year Inflation-Protected Bond Index Fund (b) | | 36,284,704 | 348,333,155 |
| Fidelity Series Emerging Markets Debt Fund (b) | | 4,392,246 | 36,236,031 |
| Fidelity Series Emerging Markets Debt Local Currency Fund (b) | | 1,341,225 | 12,084,433 |
| Fidelity Series Floating Rate High Income Fund (b) | | 792,841 | 7,286,212 |
| Fidelity Series High Income Fund (b) | | 4,787,678 | 43,519,997 |
| Fidelity Series Inflation-Protected Bond Index Fund (b) | | 9,477,449 | 96,196,107 |
| Fidelity Series International Credit Fund (b) | | 645,122 | 5,973,826 |
| Fidelity Series International Developed Markets Bond Index Fund (b) | | 23,670,904 | 220,849,536 |
| Fidelity Series Investment Grade Bond Fund (b) | | 207,916,909 | 2,268,373,481 |
| Fidelity Series Long-Term Treasury Bond Index Fund (b) | | 38,841,407 | 295,971,520 |
| Fidelity Series Real Estate Income Fund (b) | | 2,298,277 | 26,108,428 |
| TOTAL BOND FUNDS | | | |
| (Cost $3,874,468,777) | | | 3,764,555,559 |
|
| Short-Term Funds - 5.7% | | | |
| Fidelity Cash Central Fund 0.31% (c) | | 3,775,185 | 3,775,940 |
| Fidelity Series Government Money Market Fund 0.31% (b)(d) | | 326,177,576 | 326,177,576 |
| Fidelity Series Short-Term Credit Fund (b) | | 8,380,507 | 81,709,941 |
| TOTAL SHORT-TERM FUNDS | | | |
| (Cost $413,496,690) | | | 411,663,457 |
| TOTAL INVESTMENT IN SECURITIES - 100.0% | | | |
| (Cost $6,471,066,091) | | | 7,186,003,564 |
| NET OTHER ASSETS (LIABILITIES) - 0.0% | | | (572,860) |
| NET ASSETS - 100% | | | $7,185,430,704 |
| Futures Contracts | | | | | |
| | Number of contracts | Expiration Date | Notional Amount | Value | Unrealized Appreciation/(Depreciation) |
| Purchased | | | | | |
| Equity Index Contracts | | | | | |
| ICE E-mini MSCI EAFE Index Contracts (United States) | 151 | June 2022 | $16,190,220 | $915,829 | $915,829 |
| ICE E-mini MSCI Emerging Markets Index Contracts (United States) | 368 | June 2022 | 20,709,200 | 1,063,395 | 1,063,395 |
| TOTAL PURCHASED | | | | | $1,979,224 |
| Sold | | | | | |
| Equity Index Contracts | | | | | |
| CME Micro E-mini S&P 500 Index Contracts (United States) | 175 | June 2022 | 39,644,063 | (7,596) | (7,596) |
| TOTAL FUTURES CONTRACTS | | | | | $1,971,628 |
The notional amount of futures purchased as a percentage of Net Assets is 0.5%
The notional amount of futures sold as a percentage of Net Assets is 0.6%
Legend
(a) Security or a portion of the security was pledged to cover margin requirements for futures contracts. At period end, the value of securities pledged amounted to $2,160,785.
(b) Affiliated Fund
(c) Affiliated fund that is generally available only to investment companies and other accounts managed by Fidelity Investments. The rate quoted is the annualized seven-day yield of the fund at period end. A complete unaudited listing of the fund's holdings as of its most recent quarter end is available upon request. In addition, each Fidelity Central Fund's financial statements, which are not covered by the Fund's Report of Independent Registered Public Accounting Firm, are available on the SEC's website or upon request.
(d) The rate quoted is the annualized seven-day yield of the fund at period end.
Affiliated Central Funds
Fiscal year to date information regarding the Fund's investments in Fidelity Central Funds, including the ownership percentage, is presented below.
| Fund | Value, beginning of period | Purchases | Sales Proceeds | Dividend Income | Realized Gain/Loss | Change in Unrealized appreciation (depreciation) | Value, end of period | % ownership, end of period |
| Fidelity Cash Central Fund 0.31% | $6,988,999 | $28,439,676 | $31,652,735 | $3,847 | $153 | $(153) | $3,775,940 | 0.0% |
| Total | $6,988,999 | $28,439,676 | $31,652,735 | $3,847 | $153 | $(153) | $3,775,940 | |
Amounts in the income column in the above table include any capital gain distributions from underlying funds, which are presented in the corresponding line-item in the Statement of Operations, if applicable.
Affiliated Underlying Funds
Fiscal year to date information regarding the Fund's investments in affiliated Underlying Funds is presented below. Exchanges between classes of the same affiliated Underlying Funds may occur. If an underlying Fund changes its name, the name presented below is the name in effect at period end.
| Fund | Value, beginning of period | Purchases(a) | Sales Proceeds(a) | Dividend Income | Realized Gain (loss) | Change in Unrealized appreciation (depreciation) | Value, end of period |
| Fidelity Series 0-5 Year Inflation-Protected Bond Index Fund | $-- | $423,553,548 | $18,947,053 | $1,539,677 | $(4,684) | $(749,749) | $403,622,833 |
| Fidelity Series 5+ Year Inflation-Protected Bond Index Fund | -- | 397,801,121 | 34,754,350 | 2,099,274 | (919,088) | (13,794,528) | 348,333,155 |
| Fidelity Series All-Sector Equity Fund | 67,122,546 | 15,493,184 | 25,812,717 | 11,362,282 | 3,263,516 | (6,474,925) | 53,591,604 |
| Fidelity Series Blue Chip Growth Fund | 106,511,925 | 41,556,399 | 45,754,228 | 20,317,944 | 4,477,200 | (18,781,707) | 88,009,589 |
| Fidelity Series Canada Fund | 93,550,247 | 25,107,496 | 27,297,903 | 2,429,119 | 1,571,090 | 18,482,751 | 111,413,681 |
| Fidelity Series Commodity Strategy Fund | 229,947,348 | 72,886,720 | 205,390,581 | 67,369,022 | (5,375,627) | 14,341,463 | 106,409,323 |
| Fidelity Series Emerging Markets Debt Fund | 43,966,996 | 5,234,296 | 9,309,623 | 1,922,865 | (755,189) | (2,900,449) | 36,236,031 |
| Fidelity Series Emerging Markets Debt Local Currency Fund | 14,464,721 | 2,135,601 | 3,130,245 | 532,113 | (94,398) | (1,291,246) | 12,084,433 |
| Fidelity Series Emerging Markets Fund | 81,890,440 | 15,264,956 | 22,329,870 | 2,193,504 | 2,521,795 | (17,071,790) | 60,275,531 |
| Fidelity Series Emerging Markets Opportunities Fund | 746,832,186 | 203,273,218 | 217,120,624 | 69,873,823 | 34,871,721 | (224,749,176) | 543,107,325 |
| Fidelity Series Floating Rate High Income Fund | 8,858,462 | 438,173 | 2,019,717 | 349,742 | (142,706) | 152,000 | 7,286,212 |
| Fidelity Series Government Money Market Fund 0.31% | 892,734,677 | 56,030,596 | 622,587,697 | 575,787 | -- | -- | 326,177,576 |
| Fidelity Series Growth Company Fund | 271,937,390 | 126,298,240 | 137,953,415 | 66,975,392 | 25,485,261 | (66,455,856) | 219,311,620 |
| Fidelity Series High Income Fund | 52,304,464 | 3,267,122 | 10,637,908 | 2,652,214 | (175,983) | (1,237,698) | 43,519,997 |
| Fidelity Series Inflation-Protected Bond Index Fund | 705,040,505 | 45,382,294 | 658,821,700 | 26,549,727 | 57,397,428 | (52,802,420) | 96,196,107 |
| Fidelity Series International Credit Fund | 6,235,092 | 201,216 | -- | 201,216 | -- | (462,482) | 5,973,826 |
| Fidelity Series International Developed Markets Bond Index Fund | -- | 241,047,656 | 10,330,566 | 76,180 | (149,971) | (9,717,583) | 220,849,536 |
| Fidelity Series International Growth Fund | 262,153,029 | 90,918,510 | 75,592,660 | 22,532,145 | 1,263,374 | (22,982,772) | 255,759,481 |
| Fidelity Series International Small Cap Fund | 83,072,296 | 15,549,915 | 17,356,601 | 10,278,263 | 4,526,025 | (15,030,183) | 70,761,452 |
| Fidelity Series International Value Fund | 261,861,757 | 80,526,905 | 89,011,318 | 14,134,883 | 4,755,439 | 200,820 | 258,333,603 |
| Fidelity Series Intrinsic Opportunities Fund | 272,770,236 | 59,178,934 | 101,810,507 | 43,168,906 | 20,934,780 | (41,890,297) | 209,183,146 |
| Fidelity Series Investment Grade Bond Fund | 2,499,373,727 | 363,346,973 | 470,940,817 | 54,296,947 | (6,603,800) | (116,802,602) | 2,268,373,481 |
| Fidelity Series Large Cap Stock Fund | 238,464,957 | 29,777,360 | 81,343,386 | 20,161,612 | 24,914,901 | (16,774,703) | 195,039,129 |
| Fidelity Series Large Cap Value Index Fund | 87,903,646 | 7,525,395 | 26,348,666 | 5,171,358 | 6,393,561 | (2,059,057) | 73,414,879 |
| Fidelity Series Long-Term Treasury Bond Index Fund | 226,426,299 | 149,028,409 | 71,323,473 | 5,755,146 | (5,322,296) | (2,837,419) | 295,971,520 |
| Fidelity Series Opportunistic Insights Fund | 139,229,148 | 40,771,478 | 59,683,408 | 22,664,472 | 15,769,628 | (23,716,811) | 112,370,035 |
| Fidelity Series Overseas Fund | 262,591,530 | 74,897,964 | 80,903,713 | 8,345,484 | 6,641,135 | (6,044,143) | 257,182,773 |
| Fidelity Series Real Estate Income Fund | 31,836,532 | 1,493,179 | 8,213,866 | 1,163,595 | 892,117 | 100,466 | 26,108,428 |
| Fidelity Series Short-Term Credit Fund | 186,921,427 | 19,918,934 | 119,799,435 | 2,841,994 | (180,865) | (5,150,120) | 81,709,941 |
| Fidelity Series Small Cap Discovery Fund | 29,841,945 | 5,658,613 | 9,549,595 | 4,698,950 | 1,322,914 | (3,079,523) | 24,194,354 |
| Fidelity Series Small Cap Opportunities Fund | 99,802,515 | 34,534,739 | 34,623,183 | 23,371,421 | 5,410,154 | (25,745,021) | 79,379,204 |
| Fidelity Series Stock Selector Large Cap Value Fund | 201,570,139 | 39,316,832 | 70,641,497 | 31,589,878 | 12,417,907 | (18,368,697) | 164,294,684 |
| Fidelity Series Value Discovery Fund | 155,017,330 | 21,341,771 | 54,098,617 | 15,745,342 | 13,501,031 | (10,776,999) | 124,984,516 |
| | $8,360,233,512 | $2,708,757,747 | $3,423,438,939 | $562,940,277 | $228,606,370 | $(694,470,456) | $7,179,459,005 |
(a) Includes the value of shares purchased or redeemed through in-kind transactions, if applicable.
Amounts in the income column in the above table include any capital gain distributions from underlying funds, which are presented in the corresponding line-item in the Statement of Operations, if applicable.
Investment Valuation
The following is a summary of the inputs used, as of March 31, 2022, involving the Fund's assets and liabilities carried at fair value. The inputs or methodology used for valuing securities may not be an indication of the risk associated with investing in those securities. For more information on valuation inputs, and their aggregation into the levels used below, please refer to the Investment Valuation section in the accompanying Notes to Financial Statements.
| | Valuation Inputs at Reporting Date: |
| Description | Total | Level 1 | Level 2 | Level 3 |
| Investments in Securities: | | | | |
| Other Short-Term Investments | $2,768,619 | $-- | $2,768,619 | $-- |
| Domestic Equity Funds | 1,450,182,083 | 1,450,182,083 | -- | -- |
| International Equity Funds | 1,556,833,846 | 1,556,833,846 | -- | -- |
| Bond Funds | 3,764,555,559 | 3,764,555,559 | -- | -- |
| Short-Term Funds | 411,663,457 | 411,663,457 | -- | -- |
| Total Investments in Securities: | $7,186,003,564 | $7,183,234,945 | $2,768,619 | $-- |
| Derivative Instruments: | | | | |
| Assets | | | | |
| Futures Contracts | $1,979,224 | $1,979,224 | $-- | $-- |
| Total Assets | $1,979,224 | $1,979,224 | $-- | $-- |
| Liabilities | | | | |
| Futures Contracts | $(7,596) | $(7,596) | $-- | $-- |
| Total Liabilities | $(7,596) | $(7,596) | $-- | $-- |
| Total Derivative Instruments: | $1,971,628 | $1,971,628 | $-- | $-- |
Value of Derivative Instruments
The following table is a summary of the Fund's value of derivative instruments by primary risk exposure as of March 31, 2022. For additional information on derivative instruments, please refer to the Derivative Instruments section in the accompanying Notes to Financial Statements.
| Primary Risk Exposure / Derivative Type | Value |
| | Asset | Liability |
| Equity Risk | | |
| Futures Contracts(a) | $1,979,224 | $(7,596) |
| Total Equity Risk | 1,979,224 | (7,596) |
| Total Value of Derivatives | $1,979,224 | $(7,596) |
(a) Reflects gross cumulative appreciation (depreciation) on futures contracts as presented in the Schedule of Investments. In the Statement of Assets and Liabilities, the period end daily variation margin is included in receivable or payable for daily variation margin on futures contracts, and the net cumulative appreciation (depreciation) is included in Total accumulated earnings (loss).
See accompanying notes which are an integral part of the financial statements.
Fidelity Freedom® 2015 Fund
Financial Statements
Statement of Assets and Liabilities
| | | March 31, 2022 |
| Assets | | |
Investment in securities, at value — See accompanying schedule:
Unaffiliated issuers (cost $2,768,627) | $2,768,619 | |
| Fidelity Central Funds (cost $3,775,750) | 3,775,940 | |
| Other affiliated issuers (cost $6,464,521,714) | 7,179,459,005 | |
| Total Investment in Securities (cost $6,471,066,091) | | $7,186,003,564 |
| Receivable for investments sold | | 161,972,092 |
| Receivable for fund shares sold | | 2,388,685 |
| Distributions receivable from Fidelity Central Funds | | 505 |
| Other receivables | | 9,036 |
| Total assets | | 7,350,373,882 |
| Liabilities | | |
| Payable for investments purchased | $154,123,348 | |
| Payable for fund shares redeemed | 7,327,426 | |
| Accrued management fee | 3,058,406 | |
| Payable for daily variation margin on futures contracts | 424,962 | |
| Other payables and accrued expenses | 9,036 | |
| Total liabilities | | 164,943,178 |
| Net Assets | | $7,185,430,704 |
| Net Assets consist of: | | |
| Paid in capital | | $6,200,314,087 |
| Total accumulated earnings (loss) | | 985,116,617 |
| Net Assets | | $7,185,430,704 |
| Net Asset Value and Maximum Offering Price | | |
| Fidelity Freedom 2015 Fund: | | |
| Net Asset Value, offering price and redemption price per share ($4,530,089,777 ÷ 366,081,287 shares) | | $12.37 |
| Class K: | | |
| Net Asset Value, offering price and redemption price per share ($1,988,709,890 ÷ 160,877,764 shares) | | $12.36 |
| Class K6: | | |
| Net Asset Value, offering price and redemption price per share ($666,631,037 ÷ 54,129,840 shares) | | $12.32 |
See accompanying notes which are an integral part of the financial statements.
Statement of Operations
| | | Year ended March 31, 2022 |
| Investment Income | | |
| Dividends: | | |
| Affiliated issuers | | $227,077,335 |
| Interest | | 1,273 |
| Income from Fidelity Central Funds | | 3,847 |
| Total income | | 227,082,455 |
| Expenses | | |
| Management fee | $40,655,888 | |
| Independent trustees' fees and expenses | 24,598 | |
| Total expenses before reductions | 40,680,486 | |
| Expense reductions | (1) | |
| Total expenses after reductions | | 40,680,485 |
| Net investment income (loss) | | 186,401,970 |
| Realized and Unrealized Gain (Loss) | | |
| Net realized gain (loss) on: | | |
| Investment securities: | | |
| Unaffiliated issuers | 1,089 | |
| Fidelity Central Funds | 153 | |
| Other affiliated issuers | 228,606,370 | |
| Futures contracts | 2,307,373 | |
| Capital gain distributions from underlying funds: | | |
| Affiliated issuers | 335,862,942 | |
| Total net realized gain (loss) | | 566,777,927 |
| Change in net unrealized appreciation (depreciation) on: | | |
| Investment securities: | | |
| Unaffiliated issuers | (91) | |
| Fidelity Central Funds | (153) | |
| Other affiliated issuers | (694,470,456) | |
| Futures contracts | 1,971,628 | |
| Total change in net unrealized appreciation (depreciation) | | (692,499,072) |
| Net gain (loss) | | (125,721,145) |
| Net increase (decrease) in net assets resulting from operations | | $60,680,825 |
See accompanying notes which are an integral part of the financial statements.
Statement of Changes in Net Assets
| | Year ended March 31, 2022 | Year ended March 31, 2021 |
| Increase (Decrease) in Net Assets | | |
| Operations | | |
| Net investment income (loss) | $186,401,970 | $88,950,049 |
| Net realized gain (loss) | 566,777,927 | 583,868,523 |
| Change in net unrealized appreciation (depreciation) | (692,499,072) | 1,228,902,770 |
| Net increase (decrease) in net assets resulting from operations | 60,680,825 | 1,901,721,342 |
| Distributions to shareholders | (808,778,100) | (559,387,838) |
| Share transactions - net increase (decrease) | (434,660,945) | (234,210,686) |
| Total increase (decrease) in net assets | (1,182,758,220) | 1,108,122,818 |
| Net Assets | | |
| Beginning of period | 8,368,188,924 | 7,260,066,106 |
| End of period | $7,185,430,704 | $8,368,188,924 |
See accompanying notes which are an integral part of the financial statements.
Financial Highlights
Fidelity Freedom 2015 Fund
| Years ended March 31, | 2022 | 2021 | 2020 | 2019 | 2018 |
| Selected Per–Share Data | | | | | |
| Net asset value, beginning of period | $13.69 | $11.53 | $12.68 | $13.33 | $12.82 |
| Income from Investment Operations | | | | | |
| Net investment income (loss)A,B | .31 | .14 | .23 | .23 | .19 |
| Net realized and unrealized gain (loss) | (.23) | 2.94 | (.52) | .08 | .97 |
| Total from investment operations | .08 | 3.08 | (.29) | .31 | 1.16 |
| Distributions from net investment income | (.33) | (.16) | (.24) | (.24) | (.19) |
| Distributions from net realized gain | (1.08) | (.76) | (.62) | (.73) | (.46) |
| Total distributions | (1.40)C | (.92) | (.86) | (.96)C | (.65) |
| Net asset value, end of period | $12.37 | $13.69 | $11.53 | $12.68 | $13.33 |
| Total ReturnD | .19% | 27.45% | (2.80)% | 2.74% | 9.15% |
| Ratios to Average Net AssetsB,E,F | | | | | |
| Expenses before reductions | .54% | .55% | .56% | .57% | .48% |
| Expenses net of fee waivers, if any | .54% | .55% | .56% | .57% | .48% |
| Expenses net of all reductions | .54% | .55% | .56% | .57% | .48% |
| Net investment income (loss) | 2.31% | 1.07% | 1.80% | 1.82% | 1.40% |
| Supplemental Data | | | | | |
| Net assets, end of period (000 omitted) | $4,530,090 | $5,028,435 | $4,174,065 | $4,946,449 | $5,380,580 |
| Portfolio turnover rateG | 34% | 26% | 21% | 19% | 23%H |
A Calculated based on average shares outstanding during the period.
B Net investment income (loss) is affected by the timing of the declaration of dividends by any underlying mutual funds or exchange-traded funds (ETFs). Net investment income (loss) of any such underlying funds is not included in the Fund's net investment income (loss) ratio.
C Total distributions per share do not sum due to rounding.
D Total returns would have been lower if certain expenses had not been reduced during the applicable periods shown.
E Fees and expenses of any underlying mutual funds or exchange-traded funds (ETFs) are not included in the Fund's expense ratio. The Fund indirectly bears its proportionate share of these expenses. For additional expense information related to investments in Fidelity Central Funds, please refer to the "Investments in Fidelity Central Funds" note found in the Notes to Financial Statements section of the most recent Annual or Semi-Annual report.
F Expense ratios reflect operating expenses of the class. Expenses before reductions do not reflect amounts reimbursed, waived, or reduced through arrangements with the investment adviser, brokerage services, or other offset arrangements, if applicable, and do not represent the amount paid by the class during periods when reimbursements, waivers or reductions occur.
G Amount does not include the portfolio activity of any underlying mutual funds or exchange-traded funds (ETFs).
H The portfolio turnover rate does not include the assets acquired in the merger.
See accompanying notes which are an integral part of the financial statements.
Fidelity Freedom 2015 Fund Class K
| Years ended March 31, | 2022 | 2021 | 2020 | 2019 | 2018 A |
| Selected Per–Share Data | | | | | |
| Net asset value, beginning of period | $13.67 | $11.52 | $12.66 | $13.31 | $13.21 |
| Income from Investment Operations | | | | | |
| Net investment income (loss)B,C | .32 | .15 | .24 | .24 | .22 |
| Net realized and unrealized gain (loss) | (.22) | 2.93 | (.51) | .08 | .34 |
| Total from investment operations | .10 | 3.08 | (.27) | .32 | .56 |
| Distributions from net investment income | (.33) | (.17) | (.25) | (.25) | (.18) |
| Distributions from net realized gain | (1.08) | (.76) | (.62) | (.73) | (.29) |
| Total distributions | (1.41) | (.93) | (.87) | (.97)D | (.46)D |
| Net asset value, end of period | $12.36 | $13.67 | $11.52 | $12.66 | $13.31 |
| Total ReturnE,F | .31% | 27.45% | (2.67)% | 2.80% | 4.25% |
| Ratios to Average Net AssetsC,G,H | | | | | |
| Expenses before reductions | .48% | .48% | .49% | .50% | .51%I,J |
| Expenses net of fee waivers, if any | .48% | .48% | .49% | .50% | .51%I,J |
| Expenses net of all reductions | .48% | .48% | .49% | .50% | .51%I,J |
| Net investment income (loss) | 2.37% | 1.14% | 1.87% | 1.89% | 2.39%I |
| Supplemental Data | | | | | |
| Net assets, end of period (000 omitted) | $1,988,710 | $2,592,940 | $2,524,326 | $3,471,921 | $4,624,065 |
| Portfolio turnover rateK | 34% | 26% | 21% | 19% | 23%L |
A For the period July 20, 2017 (commencement of sale of shares) through March 31, 2018.
B Calculated based on average shares outstanding during the period.
C Net investment income (loss) is affected by the timing of the declaration of dividends by any underlying mutual funds or exchange-traded funds (ETFs). Net investment income (loss) of any such underlying funds is not included in the Fund's net investment income (loss) ratio.
D Total distributions per share do not sum due to rounding.
E Total returns for periods of less than one year are not annualized.
F Total returns would have been lower if certain expenses had not been reduced during the applicable periods shown.
G Fees and expenses of any underlying mutual funds or exchange-traded funds (ETFs) are not included in the Fund's expense ratio. The Fund indirectly bears its proportionate share of these expenses. For additional expense information related to investments in Fidelity Central Funds, please refer to the "Investments in Fidelity Central Funds" note found in the Notes to Financial Statements section of the most recent Annual or Semi-Annual report.
H Expense ratios reflect operating expenses of the class. Expenses before reductions do not reflect amounts reimbursed, waived, or reduced through arrangements with the investment adviser, brokerage services, or other offset arrangements, if applicable, and do not represent the amount paid by the class during periods when reimbursements, waivers or reductions occur.
I Annualized
J On certain classes, the size and fluctuation of net assets and expense amounts may cause ratios to differ from contractual rates.
K Amount does not include the portfolio activity of any underlying mutual funds or exchange-traded funds (ETFs).
L The portfolio turnover rate does not include the assets acquired in the merger.
See accompanying notes which are an integral part of the financial statements.
Fidelity Freedom 2015 Fund Class K6
| Years ended March 31, | 2022 | 2021 | 2020 | 2019 | 2018 A |
| Selected Per–Share Data | | | | | |
| Net asset value, beginning of period | $13.63 | $11.49 | $12.64 | $13.32 | $13.03 |
| Income from Investment Operations | | | | | |
| Net investment income (loss)B,C | .33 | .16 | .25 | .25 | .21 |
| Net realized and unrealized gain (loss) | (.22) | 2.92 | (.51) | .08 | .55 |
| Total from investment operations | .11 | 3.08 | (.26) | .33 | .76 |
| Distributions from net investment income | (.35) | (.18) | (.27) | (.28) | (.18) |
| Distributions from net realized gain | (1.08) | (.76) | (.62) | (.73) | (.29) |
| Total distributions | (1.42)D | (.94) | (.89) | (1.01) | (.47) |
| Net asset value, end of period | $12.32 | $13.63 | $11.49 | $12.64 | $13.32 |
| Total ReturnE,F | .43% | 27.58% | (2.61)% | 2.87% | 5.80% |
| Ratios to Average Net AssetsC,G,H | | | | | |
| Expenses before reductions | .40% | .40% | .41% | .41% | .42%I |
| Expenses net of fee waivers, if any | .40% | .40% | .41% | .41% | .42%I |
| Expenses net of all reductions | .40% | .40% | .41% | .41% | .42%I |
| Net investment income (loss) | 2.45% | 1.22% | 1.95% | 1.97% | 1.88%I |
| Supplemental Data | | | | | |
| Net assets, end of period (000 omitted) | $666,631 | $746,814 | $561,675 | $488,156 | $114,268 |
| Portfolio turnover rateJ | 34% | 26% | 21% | 19% | 23%K |
A For the period June 7, 2017 (commencement of sale of shares) through March 31, 2018.
B Calculated based on average shares outstanding during the period.
C Net investment income (loss) is affected by the timing of the declaration of dividends by any underlying mutual funds or exchange-traded funds (ETFs). Net investment income (loss) of any such underlying funds is not included in the Fund's net investment income (loss) ratio.
D Total distributions per share do not sum due to rounding.
E Total returns for periods of less than one year are not annualized.
F Total returns would have been lower if certain expenses had not been reduced during the applicable periods shown.
G Fees and expenses of any underlying mutual funds or exchange-traded funds (ETFs) are not included in the Fund's expense ratio. The Fund indirectly bears its proportionate share of these expenses. For additional expense information related to investments in Fidelity Central Funds, please refer to the "Investments in Fidelity Central Funds" note found in the Notes to Financial Statements section of the most recent Annual or Semi-Annual report.
H Expense ratios reflect operating expenses of the class. Expenses before reductions do not reflect amounts reimbursed, waived, or reduced through arrangements with the investment adviser, brokerage services, or other offset arrangements, if applicable, and do not represent the amount paid by the class during periods when reimbursements, waivers or reductions occur.
I Annualized
J Amount does not include the portfolio activity of any underlying mutual funds or exchange-traded funds (ETFs).
K The portfolio turnover rate does not include the assets acquired in the merger.
See accompanying notes which are an integral part of the financial statements.
Fidelity Freedom® 2020 Fund
Investment Summary (Unaudited)
The information in the following tables is based on the direct investments of the Fund.
Top Holdings as of March 31, 2022
| | % of fund's net assets |
| Fidelity Series Investment Grade Bond Fund | 27.9 |
| Fidelity Series Emerging Markets Opportunities Fund | 8.5 |
| Fidelity Series 5+ Year Inflation-Protected Bond Index Fund | 6.9 |
| Fidelity Series International Value Fund | 4.3 |
| Fidelity Series Long-Term Treasury Bond Index Fund | 4.3 |
| Fidelity Series Overseas Fund | 4.3 |
| Fidelity Series International Growth Fund | 4.3 |
| Fidelity Series Growth Company Fund | 4.0 |
| Fidelity Series Intrinsic Opportunities Fund | 3.7 |
| Fidelity Series Large Cap Stock Fund | 3.5 |
| | 71.7 |
Asset Allocation (% of fund's net assets)
| Period end |
| | Domestic Equity Funds | 25.7% |
| | International Equity Funds | 25.4% |
| | Bond Funds | 46.3% |
| | Short-Term Funds | 2.6% |

Domestic Equity Funds category includes Fidelity Series Commodity Strategy Fund which invests in commodity-related investments.
Fidelity Freedom® 2020 Fund
Schedule of Investments March 31, 2022
Showing Percentage of Net Assets
| U.S. Treasury Obligations - 0.0% | | | |
| | | Principal Amount | Value |
| U.S. Treasury Bills, yield at date of purchase 0.17% to 0.38% 4/21/22 to 6/9/22 (a) | | | |
| (Cost $8,955,707) | | 8,960,000 | 8,955,688 |
| | | Shares | Value |
|
| Domestic Equity Funds - 25.7% | | | |
| Fidelity Series All-Sector Equity Fund (b) | | 19,738,832 | $212,784,609 |
| Fidelity Series Blue Chip Growth Fund (b) | | 24,314,090 | 349,393,472 |
| Fidelity Series Commodity Strategy Fund (b) | | 63,864,232 | 326,346,227 |
| Fidelity Series Growth Company Fund (b) | | 47,871,545 | 870,783,396 |
| Fidelity Series Intrinsic Opportunities Fund (b) | | 41,935,711 | 824,875,443 |
| Fidelity Series Large Cap Stock Fund (b) | | 40,736,657 | 774,403,850 |
| Fidelity Series Large Cap Value Index Fund (b) | | 18,977,669 | 291,496,998 |
| Fidelity Series Opportunistic Insights Fund (b) | | 24,408,269 | 446,183,157 |
| Fidelity Series Small Cap Discovery Fund (b) | | 7,174,266 | 96,063,424 |
| Fidelity Series Small Cap Opportunities Fund (b) | | 23,140,394 | 315,172,162 |
| Fidelity Series Stock Selector Large Cap Value Fund (b) | | 48,142,850 | 652,335,617 |
| Fidelity Series Value Discovery Fund (b) | | 31,016,250 | 496,259,993 |
| TOTAL DOMESTIC EQUITY FUNDS | | | |
| (Cost $3,800,023,034) | | | 5,656,098,348 |
|
| International Equity Funds - 25.4% | | | |
| Fidelity Series Canada Fund (b) | | 26,477,135 | 410,925,140 |
| Fidelity Series Emerging Markets Fund (b) | | 22,382,927 | 207,713,565 |
| Fidelity Series Emerging Markets Opportunities Fund (b) | | 101,711,936 | 1,871,499,618 |
| Fidelity Series International Growth Fund (b) | | 56,575,536 | 938,022,383 |
| Fidelity Series International Small Cap Fund (b) | | 14,431,595 | 259,047,128 |
| Fidelity Series International Value Fund (b) | | 86,047,435 | 949,103,204 |
| Fidelity Series Overseas Fund (b) | | 74,872,657 | 944,892,935 |
| TOTAL INTERNATIONAL EQUITY FUNDS | | | |
| (Cost $4,350,100,311) | | | 5,581,203,973 |
|
| Bond Funds - 46.3% | | | |
| Fidelity Series 0-5 Year Inflation-Protected Bond Index Fund (b) | | 24,265,031 | 243,378,266 |
| Fidelity Series 5+ Year Inflation-Protected Bond Index Fund (b) | | 158,356,724 | 1,520,224,548 |
| Fidelity Series Emerging Markets Debt Fund (b) | | 13,630,884 | 112,454,792 |
| Fidelity Series Emerging Markets Debt Local Currency Fund (b) | | 4,101,450 | 36,954,064 |
| Fidelity Series Floating Rate High Income Fund (b) | | 2,424,986 | 22,285,625 |
| Fidelity Series High Income Fund (b) | | 14,652,516 | 133,191,371 |
| Fidelity Series Inflation-Protected Bond Index Fund (b) | | 23,653,781 | 240,085,881 |
| Fidelity Series International Credit Fund (b) | | 2,190,850 | 20,287,275 |
| Fidelity Series International Developed Markets Bond Index Fund (b) | | 72,231,183 | 673,916,940 |
| Fidelity Series Investment Grade Bond Fund (b) | | 563,747,492 | 6,150,485,142 |
| Fidelity Series Long-Term Treasury Bond Index Fund (b) | | 124,488,136 | 948,599,599 |
| Fidelity Series Real Estate Income Fund (b) | | 7,128,645 | 80,981,409 |
| TOTAL BOND FUNDS | | | |
| (Cost $10,569,041,613) | | | 10,182,844,912 |
|
| Short-Term Funds - 2.6% | | | |
| Fidelity Cash Central Fund 0.31% (c) | | 15,443,951 | 15,447,040 |
| Fidelity Series Government Money Market Fund 0.31% (b)(d) | | 448,766,444 | 448,766,444 |
| Fidelity Series Short-Term Credit Fund (b) | | 11,532,167 | 112,438,631 |
| TOTAL SHORT-TERM FUNDS | | | |
| (Cost $579,079,534) | | | 576,652,115 |
| TOTAL INVESTMENT IN SECURITIES - 100.0% | | | |
| (Cost $19,307,200,199) | | | 22,005,755,036 |
| NET OTHER ASSETS (LIABILITIES) - 0.0% | | | (1,980,628) |
| NET ASSETS - 100% | | | $22,003,774,408 |
| Futures Contracts | | | | | |
| | Number of contracts | Expiration Date | Notional Amount | Value | Unrealized Appreciation/(Depreciation) |
| Purchased | | | | | |
| Equity Index Contracts | | | | | |
| ICE E-mini MSCI EAFE Index Contracts (United States) | 452 | June 2022 | $48,463,440 | $2,755,028 | $2,755,028 |
| ICE E-mini MSCI Emerging Markets Index Contracts (United States) | 1,172 | June 2022 | 65,954,300 | 3,091,216 | 3,091,216 |
| TOTAL PURCHASED | | | | | $ 5,846,244 |
| Sold | | | | | |
| Equity Index Contracts | | | | | |
| CME Micro E-mini S&P 500 Index Contracts (United States) | 528 | June 2022 | 119,611,800 | 95,369 | 95,369 |
| TOTAL FUTURES CONTRACTS | | | | | $5,941,613 |
The notional amount of futures purchased as a percentage of Net Assets is 0.5%
The notional amount of futures sold as a percentage of Net Assets is 0.5%
Legend
(a) Security or a portion of the security was pledged to cover margin requirements for futures contracts. At period end, the value of securities pledged amounted to $6,305,306.
(b) Affiliated Fund
(c) Affiliated fund that is generally available only to investment companies and other accounts managed by Fidelity Investments. The rate quoted is the annualized seven-day yield of the fund at period end. A complete unaudited listing of the fund's holdings as of its most recent quarter end is available upon request. In addition, each Fidelity Central Fund's financial statements, which are not covered by the Fund's Report of Independent Registered Public Accounting Firm, are available on the SEC's website or upon request.
(d) The rate quoted is the annualized seven-day yield of the fund at period end.
Affiliated Central Funds
Fiscal year to date information regarding the Fund's investments in Fidelity Central Funds, including the ownership percentage, is presented below.
| Fund | Value, beginning of period | Purchases | Sales Proceeds | Dividend Income | Realized Gain/Loss | Change in Unrealized appreciation (depreciation) | Value, end of period | % ownership, end of period |
| Fidelity Cash Central Fund 0.31% | $28,085,985 | $86,925,989 | $99,564,935 | $11,690 | $-- | $1 | $15,447,040 | 0.0% |
| Total | $28,085,985 | $86,925,989 | $99,564,935 | $11,690 | $-- | $1 | $15,447,040 | |
Amounts in the income column in the above table include any capital gain distributions from underlying funds, which are presented in the corresponding line-item in the Statement of Operations, if applicable.
Affiliated Underlying Funds
Fiscal year to date information regarding the Fund's investments in affiliated Underlying Funds is presented below. Exchanges between classes of the same affiliated Underlying Funds may occur. If an underlying Fund changes its name, the name presented below is the name in effect at period end.
| Fund | Value, beginning of period | Purchases(a) | Sales Proceeds(a) | Dividend Income | Realized Gain (loss) | Change in Unrealized appreciation (depreciation) | Value, end of period |
| Fidelity Series 0-5 Year Inflation-Protected Bond Index Fund | $-- | $476,469,337 | $232,354,494 | $1,067,779 | $(665,310) | $87,703 | $243,378,266 |
| Fidelity Series 5+ Year Inflation-Protected Bond Index Fund | -- | 1,720,774,566 | 138,342,903 | 8,654,413 | (3,228,707) | (58,978,408) | 1,520,224,548 |
| Fidelity Series All-Sector Equity Fund | 267,552,400 | 59,647,541 | 101,509,733 | 45,257,227 | 12,816,071 | (25,721,670) | 212,784,609 |
| Fidelity Series Blue Chip Growth Fund | 424,519,598 | 165,710,929 | 184,177,653 | 80,858,883 | 15,847,026 | (72,506,428) | 349,393,472 |
| Fidelity Series Canada Fund | 356,967,222 | 82,747,430 | 103,553,879 | 8,976,036 | 5,912,306 | 68,852,061 | 410,925,140 |
| Fidelity Series Commodity Strategy Fund | 722,563,061 | 223,379,180 | 647,037,435 | 208,892,634 | (17,703,085) | 45,144,506 | 326,346,227 |
| Fidelity Series Emerging Markets Debt Fund | 137,745,234 | 15,339,540 | 29,202,328 | 5,996,450 | (2,499,940) | (8,927,714) | 112,454,792 |
| Fidelity Series Emerging Markets Debt Local Currency Fund | 45,232,590 | 6,860,563 | 10,872,938 | 1,645,913 | (341,910) | (3,924,241) | 36,954,064 |
| Fidelity Series Emerging Markets Fund | 285,942,410 | 48,354,246 | 76,393,421 | 7,639,429 | 9,483,813 | (59,673,483) | 207,713,565 |
| Fidelity Series Emerging Markets Opportunities Fund | 2,606,073,878 | 662,125,732 | 737,720,099 | 243,058,163 | 114,046,071 | (773,025,964) | 1,871,499,618 |
| Fidelity Series Floating Rate High Income Fund | 27,690,771 | 1,179,254 | 6,615,520 | 1,075,169 | (487,405) | 518,525 | 22,285,625 |
| Fidelity Series Government Money Market Fund 0.31% | 1,944,701,355 | 113,053,030 | 1,608,987,941 | 1,121,284 | -- | -- | 448,766,444 |
| Fidelity Series Growth Company Fund | 1,083,608,135 | 491,481,139 | 543,461,034 | 265,700,563 | 99,802,953 | (260,647,797) | 870,783,396 |
| Fidelity Series High Income Fund | 163,567,784 | 10,917,300 | 36,962,603 | 8,206,544 | (311,076) | (4,020,034) | 133,191,371 |
| Fidelity Series Inflation-Protected Bond Index Fund | 1,882,482,550 | 123,073,689 | 1,781,265,920 | 67,150,688 | 152,200,781 | (136,405,219) | 240,085,881 |
| Fidelity Series International Credit Fund | 21,174,543 | 683,334 | -- | 683,334 | -- | (1,570,602) | 20,287,275 |
| Fidelity Series International Developed Markets Bond Index Fund | -- | 738,173,081 | 34,302,716 | 230,686 | (475,111) | (29,478,314) | 673,916,940 |
| Fidelity Series International Growth Fund | 1,000,332,240 | 290,560,672 | 275,395,212 | 83,210,825 | 8,809,025 | (86,284,342) | 938,022,383 |
| Fidelity Series International Small Cap Fund | 317,007,679 | 46,591,968 | 66,867,614 | 37,864,801 | 19,784,615 | (57,469,520) | 259,047,128 |
| Fidelity Series International Value Fund | 999,223,799 | 263,675,808 | 333,635,815 | 52,199,894 | 18,512,721 | 1,326,691 | 949,103,204 |
| Fidelity Series Intrinsic Opportunities Fund | 1,087,297,100 | 246,342,916 | 424,732,750 | 171,835,916 | 83,707,320 | (167,739,143) | 824,875,443 |
| Fidelity Series Investment Grade Bond Fund | 6,865,225,081 | 1,120,044,859 | 1,502,334,633 | 147,158,818 | (19,767,756) | (312,682,409) | 6,150,485,142 |
| Fidelity Series Large Cap Stock Fund | 950,543,675 | 123,068,379 | 331,247,685 | 80,033,723 | 75,670,374 | (43,630,893) | 774,403,850 |
| Fidelity Series Large Cap Value Index Fund | 350,395,752 | 25,813,151 | 101,836,845 | 20,623,085 | 23,850,515 | (6,725,575) | 291,496,998 |
| Fidelity Series Long-Term Treasury Bond Index Fund | 710,546,169 | 505,672,044 | 240,114,469 | 18,112,683 | (17,934,563) | (9,569,582) | 948,599,599 |
| Fidelity Series Opportunistic Insights Fund | 554,942,168 | 154,414,110 | 231,052,412 | 90,172,095 | 57,705,580 | (89,826,289) | 446,183,157 |
| Fidelity Series Overseas Fund | 1,002,002,952 | 233,046,163 | 295,036,934 | 30,819,660 | 31,170,267 | (26,289,513) | 944,892,935 |
| Fidelity Series Real Estate Income Fund | 99,977,363 | 3,995,870 | 26,026,087 | 3,601,459 | 2,839,417 | 194,846 | 80,981,409 |
| Fidelity Series Short-Term Credit Fund | 405,961,739 | 37,514,063 | 321,375,463 | 5,680,800 | 18,969 | (9,680,677) | 112,438,631 |
| Fidelity Series Small Cap Discovery Fund | 118,953,675 | 21,020,883 | 36,903,874 | 18,689,490 | 5,363,921 | (12,371,181) | 96,063,424 |
| Fidelity Series Small Cap Opportunities Fund | 397,851,709 | 135,218,948 | 136,846,026 | 93,017,724 | 20,076,156 | (101,128,625) | 315,172,162 |
| Fidelity Series Stock Selector Large Cap Value Fund | 803,489,378 | 150,914,254 | 278,108,903 | 125,732,626 | 48,865,105 | (72,824,217) | 652,335,617 |
| Fidelity Series Value Discovery Fund | 617,915,215 | 81,829,375 | 214,172,793 | 62,665,942 | 54,361,887 | (43,673,691) | 496,259,993 |
| | $26,251,487,225 | $8,379,693,354 | $11,088,448,132 | $1,997,634,736 | $797,430,030 | $(2,358,651,199) | $21,981,352,308 |
(a) Includes the value of shares purchased or redeemed through in-kind transactions, if applicable.
Amounts in the income column in the above table include any capital gain distributions from underlying funds, which are presented in the corresponding line-item in the Statement of Operations, if applicable.
Investment Valuation
The following is a summary of the inputs used, as of March 31, 2022, involving the Fund's assets and liabilities carried at fair value. The inputs or methodology used for valuing securities may not be an indication of the risk associated with investing in those securities. For more information on valuation inputs, and their aggregation into the levels used below, please refer to the Investment Valuation section in the accompanying Notes to Financial Statements.
| | Valuation Inputs at Reporting Date: |
| Description | Total | Level 1 | Level 2 | Level 3 |
| Investments in Securities: | | | | |
| Other Short-Term Investments | $8,955,688 | $-- | $8,955,688 | $-- |
| Domestic Equity Funds | 5,656,098,348 | 5,656,098,348 | -- | -- |
| International Equity Funds | 5,581,203,973 | 5,581,203,973 | -- | -- |
| Bond Funds | 10,182,844,912 | 10,182,844,912 | -- | -- |
| Short-Term Funds | 576,652,115 | 576,652,115 | -- | -- |
| Total Investments in Securities: | $22,005,755,036 | $21,996,799,348 | $8,955,688 | $-- |
| Derivative Instruments: | | | | |
| Assets | | | | |
| Futures Contracts | $5,941,613 | $5,941,613 | $-- | $-- |
| Total Assets | $5,941,613 | $5,941,613 | $-- | $-- |
| Total Derivative Instruments: | $5,941,613 | $5,941,613 | $-- | $-- |
Value of Derivative Instruments
The following table is a summary of the Fund's value of derivative instruments by primary risk exposure as of March 31, 2022. For additional information on derivative instruments, please refer to the Derivative Instruments section in the accompanying Notes to Financial Statements.
| Primary Risk Exposure / Derivative Type | Value |
| | Asset | Liability |
| Equity Risk | | |
| Futures Contracts(a) | $5,941,613 | $0 |
| Total Equity Risk | 5,941,613 | 0 |
| Total Value of Derivatives | $5,941,613 | $0 |
(a) Reflects gross cumulative appreciation (depreciation) on futures contracts as presented in the Schedule of Investments. In the Statement of Assets and Liabilities, the period end daily variation margin is included in receivable or payable for daily variation margin on futures contracts, and the net cumulative appreciation (depreciation) is included in Total accumulated earnings (loss).
See accompanying notes which are an integral part of the financial statements.
Fidelity Freedom® 2020 Fund
Financial Statements
Statement of Assets and Liabilities
| | | March 31, 2022 |
| Assets | | |
Investment in securities, at value — See accompanying schedule:
Unaffiliated issuers (cost $8,955,707) | $8,955,688 | |
| Fidelity Central Funds (cost $15,446,178) | 15,447,040 | |
| Other affiliated issuers (cost $19,282,798,314) | 21,981,352,308 | |
| Total Investment in Securities (cost $19,307,200,199) | | $22,005,755,036 |
| Receivable for investments sold | | 467,077,873 |
| Receivable for fund shares sold | | 12,335,460 |
| Distributions receivable from Fidelity Central Funds | | 2,107 |
| Other receivables | | 330,553 |
| Total assets | | 22,485,501,029 |
| Liabilities | | |
| Payable for investments purchased | $445,541,960 | |
| Payable for fund shares redeemed | 24,455,703 | |
| Accrued management fee | 9,895,797 | |
| Payable for daily variation margin on futures contracts | 1,502,608 | |
| Other payables and accrued expenses | 330,553 | |
| Total liabilities | | 481,726,621 |
| Net Assets | | $22,003,774,408 |
| Net Assets consist of: | | |
| Paid in capital | | $18,301,454,775 |
| Total accumulated earnings (loss) | | 3,702,319,633 |
| Net Assets | | $22,003,774,408 |
| Net Asset Value and Maximum Offering Price | | |
| Fidelity Freedom 2020 Fund: | | |
| Net Asset Value, offering price and redemption price per share ($12,039,705,981 ÷ 766,112,162 shares) | | $15.72 |
| Class K: | | |
| Net Asset Value, offering price and redemption price per share ($7,535,844,736 ÷ 479,739,801 shares) | | $15.71 |
| Class K6: | | |
| Net Asset Value, offering price and redemption price per share ($2,428,223,691 ÷ 155,147,063 shares) | | $15.65 |
See accompanying notes which are an integral part of the financial statements.
Statement of Operations
| | | Year ended March 31, 2022 |
| Investment Income | | |
| Dividends: | | |
| Affiliated issuers | | $709,718,528 |
| Interest | | 4,149 |
| Income from Fidelity Central Funds | | 11,690 |
| Total income | | 709,734,367 |
| Expenses | | |
| Management fee | $133,336,349 | |
| Independent trustees' fees and expenses | 76,475 | |
| Total expenses | | 133,412,824 |
| Net investment income (loss) | | 576,321,543 |
| Realized and Unrealized Gain (Loss) | | |
| Net realized gain (loss) on: | | |
| Investment securities: | | |
| Unaffiliated issuers | 6,448 | |
| Affiliated issuers | 797,430,030 | |
| Futures contracts | 7,209,091 | |
| Capital gain distributions from underlying funds: | | |
| Affiliated issuers | 1,287,916,208 | |
| Total net realized gain (loss) | | 2,092,561,777 |
| Change in net unrealized appreciation (depreciation) on: | | |
| Investment securities: | | |
| Unaffiliated issuers | (180) | |
| Fidelity Central Funds | 1 | |
| Other affiliated issuers | (2,358,651,199) | |
| Futures contracts | 5,941,613 | |
| Total change in net unrealized appreciation (depreciation) | | (2,352,709,765) |
| Net gain (loss) | | (260,147,988) |
| Net increase (decrease) in net assets resulting from operations | | $316,173,555 |
See accompanying notes which are an integral part of the financial statements.
Statement of Changes in Net Assets
| | Year ended March 31, 2022 | Year ended March 31, 2021 |
| Increase (Decrease) in Net Assets | | |
| Operations | | |
| Net investment income (loss) | $576,321,543 | $281,631,969 |
| Net realized gain (loss) | 2,092,561,777 | 1,983,298,678 |
| Change in net unrealized appreciation (depreciation) | (2,352,709,765) | 4,686,682,800 |
| Net increase (decrease) in net assets resulting from operations | 316,173,555 | 6,951,613,447 |
| Distributions to shareholders | (2,804,931,957) | (1,787,675,107) |
| Share transactions - net increase (decrease) | (1,799,559,611) | (1,420,683,946) |
| Total increase (decrease) in net assets | (4,288,318,013) | 3,743,254,394 |
| Net Assets | | |
| Beginning of period | 26,292,092,421 | 22,548,838,027 |
| End of period | $22,003,774,408 | $26,292,092,421 |
See accompanying notes which are an integral part of the financial statements.
Financial Highlights
Fidelity Freedom 2020 Fund
| Years ended March 31, | 2022 | 2021 | 2020 | 2019 | 2018 |
| Selected Per–Share Data | | | | | |
| Net asset value, beginning of period | $17.53 | $14.21 | $15.83 | $16.51 | $15.70 |
| Income from Investment Operations | | | | | |
| Net investment income (loss)A,B | .39 | .18 | .28 | .28 | .22 |
| Net realized and unrealized gain (loss) | (.19) | 4.32 | (.84) | .10 | 1.34 |
| Total from investment operations | .20 | 4.50 | (.56) | .38 | 1.56 |
| Distributions from net investment income | (.42) | (.20) | (.30) | (.28) | (.22) |
| Distributions from net realized gain | (1.59) | (.98) | (.76) | (.78) | (.52) |
| Total distributions | (2.01) | (1.18) | (1.06) | (1.06) | (.75)C |
| Net asset value, end of period | $15.72 | $17.53 | $14.21 | $15.83 | $16.51 |
| Total ReturnD | .66% | 32.56% | (4.15)% | 2.66% | 10.01% |
| Ratios to Average Net AssetsB,E,F | | | | | |
| Expenses before reductions | .58%G | .59% | .60% | .61% | .52% |
| Expenses net of fee waivers, if any | .58%G | .59% | .60% | .61% | .52% |
| Expenses net of all reductions | .58%G | .59% | .60% | .61% | .52% |
| Net investment income (loss) | 2.29% | 1.07% | 1.76% | 1.76% | 1.34% |
| Supplemental Data | | | | | |
| Net assets, end of period (000 omitted) | $12,039,706 | $13,282,370 | $10,620,621 | $12,395,049 | $12,916,078 |
| Portfolio turnover rateH | 34% | 26% | 23% | 19% | 21%I |
A Calculated based on average shares outstanding during the period.
B Net investment income (loss) is affected by the timing of the declaration of dividends by any underlying mutual funds or exchange-traded funds (ETFs). Net investment income (loss) of any such underlying funds is not included in the Fund's net investment income (loss) ratio.
C Total distributions per share do not sum due to rounding.
D Total returns would have been lower if certain expenses had not been reduced during the applicable periods shown.
E Fees and expenses of any underlying mutual funds or exchange-traded funds (ETFs) are not included in the Fund's expense ratio. The Fund indirectly bears its proportionate share of these expenses. For additional expense information related to investments in Fidelity Central Funds, please refer to the "Investments in Fidelity Central Funds" note found in the Notes to Financial Statements section of the most recent Annual or Semi-Annual report.
F Expense ratios reflect operating expenses of the class. Expenses before reductions do not reflect amounts reimbursed, waived, or reduced through arrangements with the investment adviser, brokerage services, or other offset arrangements, if applicable, and do not represent the amount paid by the class during periods when reimbursements, waivers or reductions occur.
G On certain classes, the size and fluctuation of net assets and expense amounts may cause ratios to differ from contractual rates.
H Amount does not include the portfolio activity of any underlying mutual funds or exchange-traded funds (ETFs).
I The portfolio turnover rate does not include the assets acquired in the merger.
See accompanying notes which are an integral part of the financial statements.
Fidelity Freedom 2020 Fund Class K
| Years ended March 31, | 2022 | 2021 | 2020 | 2019 | 2018 A |
| Selected Per–Share Data | | | | | |
| Net asset value, beginning of period | $17.52 | $14.20 | $15.81 | $16.49 | $16.24 |
| Income from Investment Operations | | | | | |
| Net investment income (loss)B,C | .41 | .19 | .29 | .29 | .27 |
| Net realized and unrealized gain (loss) | (.20) | 4.32 | (.83) | .10 | .50 |
| Total from investment operations | .21 | 4.51 | (.54) | .39 | .77 |
| Distributions from net investment income | (.42) | (.21) | (.31) | (.29) | (.21) |
| Distributions from net realized gain | (1.59) | (.98) | (.76) | (.78) | (.31) |
| Total distributions | (2.02)D | (1.19) | (1.07) | (1.07) | (.52) |
| Net asset value, end of period | $15.71 | $17.52 | $14.20 | $15.81 | $16.49 |
| Total ReturnE,F | .70% | 32.66% | (4.04)% | 2.73% | 4.73% |
| Ratios to Average Net AssetsC,G,H | | | | | |
| Expenses before reductions | .51% | .52% | .52% | .53% | .54%I |
| Expenses net of fee waivers, if any | .51% | .52% | .52% | .53% | .54%I |
| Expenses net of all reductions | .51% | .52% | .52% | .53% | .54%I |
| Net investment income (loss) | 2.36% | 1.15% | 1.84% | 1.84% | 2.34%I |
| Supplemental Data | | | | | |
| Net assets, end of period (000 omitted) | $7,535,845 | $10,341,455 | $9,840,293 | $13,509,101 | $16,611,072 |
| Portfolio turnover rateJ | 34% | 26% | 23% | 19% | 21%K |
A For the period July 20, 2017 (commencement of sale of shares) through March 31, 2018.
B Calculated based on average shares outstanding during the period.
C Net investment income (loss) is affected by the timing of the declaration of dividends by any underlying mutual funds or exchange-traded funds (ETFs). Net investment income (loss) of any such underlying funds is not included in the Fund's net investment income (loss) ratio.
D Total distributions per share do not sum due to rounding.
E Total returns for periods of less than one year are not annualized.
F Total returns would have been lower if certain expenses had not been reduced during the applicable periods shown.
G Fees and expenses of any underlying mutual funds or exchange-traded funds (ETFs) are not included in the Fund's expense ratio. The Fund indirectly bears its proportionate share of these expenses. For additional expense information related to investments in Fidelity Central Funds, please refer to the "Investments in Fidelity Central Funds" note found in the Notes to Financial Statements section of the most recent Annual or Semi-Annual report.
H Expense ratios reflect operating expenses of the class. Expenses before reductions do not reflect amounts reimbursed, waived, or reduced through arrangements with the investment adviser, brokerage services, or other offset arrangements, if applicable, and do not represent the amount paid by the class during periods when reimbursements, waivers or reductions occur.
I Annualized
J Amount does not include the portfolio activity of any underlying mutual funds or exchange-traded funds (ETFs).
K The portfolio turnover rate does not include the assets acquired in the merger.
See accompanying notes which are an integral part of the financial statements.
Fidelity Freedom 2020 Fund Class K6
| Years ended March 31, | 2022 | 2021 | 2020 | 2019 | 2018 A |
| Selected Per–Share Data | | | | | |
| Net asset value, beginning of period | $17.47 | $14.16 | $15.78 | $16.50 | $16.00 |
| Income from Investment Operations | | | | | |
| Net investment income (loss)B,C | .42 | .20 | .31 | .30 | .24 |
| Net realized and unrealized gain (loss) | (.20) | 4.32 | (.83) | .10 | .79 |
| Total from investment operations | .22 | 4.52 | (.52) | .40 | 1.03 |
| Distributions from net investment income | (.45) | (.23) | (.34) | (.34) | (.22) |
| Distributions from net realized gain | (1.59) | (.98) | (.76) | (.78) | (.31) |
| Total distributions | (2.04) | (1.21) | (1.10) | (1.12) | (.53) |
| Net asset value, end of period | $15.65 | $17.47 | $14.16 | $15.78 | $16.50 |
| Total ReturnD,E | .77% | 32.85% | (3.96)% | 2.80% | 6.40% |
| Ratios to Average Net AssetsC,F,G | | | | | |
| Expenses before reductions | .42% | .42% | .43% | .43% | .44%H |
| Expenses net of fee waivers, if any | .42% | .42% | .43% | .43% | .44%H |
| Expenses net of all reductions | .42% | .42% | .43% | .43% | .44%H |
| Net investment income (loss) | 2.46% | 1.24% | 1.93% | 1.94% | 1.79%H |
| Supplemental Data | | | | | |
| Net assets, end of period (000 omitted) | $2,428,224 | $2,668,267 | $2,087,924 | $1,831,743 | $474,981 |
| Portfolio turnover rateI | 34% | 26% | 23% | 19% | 21%J |
A For the period June 7, 2017 (commencement of sale of shares) through March 31, 2018.
B Calculated based on average shares outstanding during the period.
C Net investment income (loss) is affected by the timing of the declaration of dividends by any underlying mutual funds or exchange-traded funds (ETFs). Net investment income (loss) of any such underlying funds is not included in the Fund's net investment income (loss) ratio.
D Total returns for periods of less than one year are not annualized.
E Total returns would have been lower if certain expenses had not been reduced during the applicable periods shown.
F Fees and expenses of any underlying mutual funds or exchange-traded funds (ETFs) are not included in the Fund's expense ratio. The Fund indirectly bears its proportionate share of these expenses. For additional expense information related to investments in Fidelity Central Funds, please refer to the "Investments in Fidelity Central Funds" note found in the Notes to Financial Statements section of the most recent Annual or Semi-Annual report.
G Expense ratios reflect operating expenses of the class. Expenses before reductions do not reflect amounts reimbursed, waived, or reduced through arrangements with the investment adviser, brokerage services, or other offset arrangements, if applicable, and do not represent the amount paid by the class during periods when reimbursements, waivers or reductions occur.
H Annualized
I Amount does not include the portfolio activity of any underlying mutual funds or exchange-traded funds (ETFs).
J The portfolio turnover rate does not include the assets acquired in the merger.
See accompanying notes which are an integral part of the financial statements.
Fidelity Freedom® 2025 Fund
Investment Summary (Unaudited)
The information in the following tables is based on the direct investments of the Fund.
Top Holdings as of March 31, 2022
| | % of fund's net assets |
| Fidelity Series Investment Grade Bond Fund | 24.7 |
| Fidelity Series Emerging Markets Opportunities Fund | 9.2 |
| Fidelity Series 5+ Year Inflation-Protected Bond Index Fund | 5.9 |
| Fidelity Series International Value Fund | 4.8 |
| Fidelity Series Overseas Fund | 4.8 |
| Fidelity Series International Growth Fund | 4.8 |
| Fidelity Series Long-Term Treasury Bond Index Fund | 4.7 |
| Fidelity Series Growth Company Fund | 4.6 |
| Fidelity Series Intrinsic Opportunities Fund | 4.4 |
| Fidelity Series Large Cap Stock Fund | 4.1 |
| | 72.0 |
Asset Allocation (% of fund's net assets)
| Period end |
| | Domestic Equity Funds | 29.7% |
| | International Equity Funds | 28.0% |
| | Bond Funds | 41.0% |
| | Short-Term Funds | 1.2% |
| | Short-Term Investments | 0.1% |

Domestic Equity Funds category includes Fidelity Series Commodity Strategy Fund which invests in commodity-related investments.
Fidelity Freedom® 2025 Fund
Schedule of Investments March 31, 2022
Showing Percentage of Net Assets
| U.S. Treasury Obligations - 0.1% | | | |
| | | Principal Amount | Value |
| U.S. Treasury Bills, yield at date of purchase 0.17% to 0.38% 4/21/22 to 6/9/22 (a) | | | |
| (Cost $11,474,710) | | 11,480,000 | 11,474,719 |
| | | Shares | Value |
|
| Domestic Equity Funds - 29.7% | | | |
| Fidelity Series All-Sector Equity Fund (b) | | 29,905,285 | $322,378,969 |
| Fidelity Series Blue Chip Growth Fund (b) | | 36,834,720 | 529,314,920 |
| Fidelity Series Commodity Strategy Fund (b) | | 83,066,490 | 424,469,766 |
| Fidelity Series Growth Company Fund (b) | | 72,528,377 | 1,319,291,184 |
| Fidelity Series Intrinsic Opportunities Fund (b) | | 63,353,552 | 1,246,164,372 |
| Fidelity Series Large Cap Stock Fund (b) | | 61,718,275 | 1,173,264,400 |
| Fidelity Series Large Cap Value Index Fund (b) | | 28,753,340 | 441,651,298 |
| Fidelity Series Opportunistic Insights Fund (b) | | 36,978,594 | 675,968,695 |
| Fidelity Series Small Cap Discovery Fund (b) | | 10,869,232 | 145,539,018 |
| Fidelity Series Small Cap Opportunities Fund (b) | | 35,058,157 | 477,492,105 |
| Fidelity Series Stock Selector Large Cap Value Fund (b) | | 72,938,247 | 988,313,245 |
| Fidelity Series Value Discovery Fund (b) | | 46,991,194 | 751,859,102 |
| TOTAL DOMESTIC EQUITY FUNDS | | | |
| (Cost $5,945,161,429) | | | 8,495,707,074 |
|
| International Equity Funds - 28.0% | | | |
| Fidelity Series Canada Fund (b) | | 38,178,279 | 592,526,886 |
| Fidelity Series Emerging Markets Fund (b) | | 31,425,497 | 291,628,611 |
| Fidelity Series Emerging Markets Opportunities Fund (b) | | 142,820,528 | 2,627,897,710 |
| Fidelity Series International Growth Fund (b) | | 82,171,378 | 1,362,401,445 |
| Fidelity Series International Small Cap Fund (b) | | 20,829,010 | 373,880,732 |
| Fidelity Series International Value Fund (b) | | 125,312,144 | 1,382,192,947 |
| Fidelity Series Overseas Fund (b) | | 108,988,320 | 1,375,432,600 |
| TOTAL INTERNATIONAL EQUITY FUNDS | | | |
| (Cost $6,530,971,599) | | | 8,005,960,931 |
|
| Bond Funds - 41.0% | | | |
| Fidelity Series 5+ Year Inflation-Protected Bond Index Fund (b) | | 175,035,353 | 1,680,339,392 |
| Fidelity Series Emerging Markets Debt Fund (b) | | 17,737,243 | 146,332,253 |
| Fidelity Series Emerging Markets Debt Local Currency Fund (b) | | 5,320,794 | 47,940,358 |
| Fidelity Series Floating Rate High Income Fund (b) | | 3,147,200 | 28,922,765 |
| Fidelity Series High Income Fund (b) | | 18,980,606 | 172,533,708 |
| Fidelity Series Inflation-Protected Bond Index Fund (b) | | 25,206,854 | 255,849,564 |
| Fidelity Series International Credit Fund (b) | | 1,883,007 | 17,436,644 |
| Fidelity Series International Developed Markets Bond Index Fund (b) | | 92,962,343 | 867,338,660 |
| Fidelity Series Investment Grade Bond Fund (b) | | 646,472,893 | 7,053,019,265 |
| Fidelity Series Long-Term Treasury Bond Index Fund (b) | | 177,007,206 | 1,348,794,911 |
| Fidelity Series Real Estate Income Fund (b) | | 9,245,711 | 105,031,277 |
| TOTAL BOND FUNDS | | | |
| (Cost $12,259,397,561) | | | 11,723,538,797 |
|
| Short-Term Funds - 1.2% | | | |
| Fidelity Cash Central Fund 0.31% (c) | | 21,151,008 | 21,155,238 |
| Fidelity Series Government Money Market Fund 0.31% (b)(d) | | 265,311,330 | 265,311,330 |
| Fidelity Series Short-Term Credit Fund (b) | | 6,820,125 | 66,496,221 |
| TOTAL SHORT-TERM FUNDS | | | |
| (Cost $354,279,719) | | | 352,962,789 |
| TOTAL INVESTMENT IN SECURITIES - 100.0% | | | |
| (Cost $25,101,285,018) | | | 28,589,644,310 |
| NET OTHER ASSETS (LIABILITIES) - 0.0% | | | (2,577,787) |
| NET ASSETS - 100% | | | $28,587,066,523 |
| Futures Contracts | | | | | |
| | Number of contracts | Expiration Date | Notional Amount | Value | Unrealized Appreciation/(Depreciation) |
| Purchased | | | | | |
| Equity Index Contracts | | | | | |
| ICE E-mini MSCI EAFE Index Contracts (United States) | 715 | June 2022 | $76,662,300 | $4,336,097 | $4,336,097 |
| ICE E-mini MSCI Emerging Markets Index Contracts (United States) | 1,525 | June 2022 | 85,819,375 | 3,635,811 | 3,635,811 |
| TOTAL PURCHASED | | | | | $7,971,908 |
| Sold | | | | | |
| Equity Index Contracts | | | | | |
| CME Micro E-mini S&P 500 Index Contracts (United States) | 684 | June 2022 | 154,951,650 | 104,340 | 104,340 |
| TOTAL FUTURES CONTRACTS | | | | | $8,076,248 |
The notional amount of futures purchased as a percentage of Net Assets is 0.6%
The notional amount of futures sold as a percentage of Net Assets is 0.5%
Legend
(a) Security or a portion of the security was pledged to cover margin requirements for futures contracts. At period end, the value of securities pledged amounted to $8,078,738.
(b) Affiliated Fund
(c) Affiliated fund that is generally available only to investment companies and other accounts managed by Fidelity Investments. The rate quoted is the annualized seven-day yield of the fund at period end. A complete unaudited listing of the fund's holdings as of its most recent quarter end is available upon request. In addition, each Fidelity Central Fund's financial statements, which are not covered by the Fund's Report of Independent Registered Public Accounting Firm, are available on the SEC's website or upon request.
(d) The rate quoted is the annualized seven-day yield of the fund at period end.
Affiliated Central Funds
Fiscal year to date information regarding the Fund's investments in Fidelity Central Funds, including the ownership percentage, is presented below.
| Fund | Value, beginning of period | Purchases | Sales Proceeds | Dividend Income | Realized Gain/Loss | Change in Unrealized appreciation (depreciation) | Value, end of period | % ownership, end of period |
| Fidelity Cash Central Fund 0.31% | $28,912,328 | $107,250,791 | $115,007,880 | $13,828 | $-- | $(1) | $21,155,238 | 0.0% |
| Total | $28,912,328 | $107,250,791 | $115,007,880 | $13,828 | $-- | $(1) | $21,155,238 | |
Amounts in the income column in the above table include any capital gain distributions from underlying funds, which are presented in the corresponding line-item in the Statement of Operations, if applicable.
Affiliated Underlying Funds
Fiscal year to date information regarding the Fund's investments in affiliated Underlying Funds is presented below. Exchanges between classes of the same affiliated Underlying Funds may occur. If an underlying Fund changes its name, the name presented below is the name in effect at period end.
| Fund | Value, beginning of period | Purchases(a) | Sales Proceeds(a) | Dividend Income | Realized Gain (loss) | Change in Unrealized appreciation (depreciation) | Value, end of period |
| Fidelity Series 0-5 Year Inflation-Protected Bond Index Fund | $-- | $475,754,456 | $475,659,776 | $428,667 | $(30,833) | $-- | $-- |
| Fidelity Series 5+ Year Inflation-Protected Bond Index Fund | -- | 1,863,756,970 | 115,399,731 | 9,069,742 | (3,462,546) | (64,555,301) | 1,680,339,392 |
| Fidelity Series All-Sector Equity Fund | 373,996,174 | 92,384,566 | 122,956,452 | 66,731,596 | 10,537,191 | (31,582,510) | 322,378,969 |
| Fidelity Series Blue Chip Growth Fund | 593,373,948 | 252,649,178 | 231,811,777 | 116,784,224 | 14,556,230 | (99,452,659) | 529,314,920 |
| Fidelity Series Canada Fund | 487,124,446 | 113,903,230 | 113,130,959 | 12,677,638 | 4,791,127 | 99,839,042 | 592,526,886 |
| Fidelity Series Commodity Strategy Fund | 876,371,037 | 289,517,400 | 776,408,969 | 260,725,886 | (26,849,152) | 61,839,450 | 424,469,766 |
| Fidelity Series Emerging Markets Debt Fund | 169,652,000 | 19,735,182 | 28,318,708 | 7,523,418 | (968,234) | (13,767,987) | 146,332,253 |
| Fidelity Series Emerging Markets Debt Local Currency Fund | 54,654,587 | 9,724,073 | 10,965,515 | 2,082,787 | (363,136) | (5,109,651) | 47,940,358 |
| Fidelity Series Emerging Markets Fund | 373,036,953 | 71,287,137 | 83,796,623 | 10,457,758 | 9,111,651 | (78,010,507) | 291,628,611 |
| Fidelity Series Emerging Markets Opportunities Fund | 3,386,134,233 | 939,159,631 | 792,683,614 | 331,638,691 | 109,402,554 | (1,014,115,094) | 2,627,897,710 |
| Fidelity Series Floating Rate High Income Fund | 33,491,745 | 1,894,739 | 6,491,262 | 1,341,567 | (392,452) | 419,995 | 28,922,765 |
| Fidelity Series Government Money Market Fund 0.31% | 1,545,838,489 | 122,497,894 | 1,403,025,053 | 877,531 | -- | -- | 265,311,330 |
| Fidelity Series Growth Company Fund�� | 1,514,433,220 | 739,178,115 | 691,055,841 | 387,082,586 | 78,741,269 | (322,005,579) | 1,319,291,184 |
| Fidelity Series High Income Fund | 197,692,649 | 18,257,303 | 37,731,101 | 10,312,528 | 103,911 | (5,789,054) | 172,533,708 |
| Fidelity Series Inflation-Protected Bond Index Fund | 2,019,229,305 | 157,293,614 | 1,938,908,432 | 71,892,629 | 146,800,020 | (128,564,943) | 255,849,564 |
| Fidelity Series International Credit Fund | 18,199,239 | 587,317 | -- | 587,317 | -- | (1,349,912) | 17,436,644 |
| Fidelity Series International Developed Markets Bond Index Fund | -- | 930,976,308 | 25,543,640 | 289,603 | (342,496) | (37,751,512) | 867,338,660 |
| Fidelity Series International Growth Fund | 1,366,793,221 | 404,756,412 | 293,265,494 | 117,368,063 | 6,483,834 | (122,366,528) | 1,362,401,445 |
| Fidelity Series International Small Cap Fund | 433,456,349 | 65,013,614 | 69,144,673 | 53,369,038 | 15,689,426 | (71,133,984) | 373,880,732 |
| Fidelity Series International Value Fund | 1,366,241,845 | 371,571,810 | 381,157,325 | 73,627,263 | 13,937,553 | 11,599,064 | 1,382,192,947 |
| Fidelity Series Intrinsic Opportunities Fund | 1,519,919,126 | 375,703,221 | 525,560,751 | 248,328,526 | 39,144,011 | (163,041,235) | 1,246,164,372 |
| Fidelity Series Investment Grade Bond Fund | 7,505,361,568 | 1,339,440,490 | 1,410,771,746 | 165,004,946 | (24,735,589) | (356,275,458) | 7,053,019,265 |
| Fidelity Series Large Cap Stock Fund | 1,328,740,760 | 199,401,389 | 398,946,752 | 115,334,323 | 70,213,985 | (26,144,982) | 1,173,264,400 |
| Fidelity Series Large Cap Value Index Fund | 489,810,691 | 42,908,430 | 114,684,583 | 30,284,820 | 17,946,514 | 5,670,246 | 441,651,298 |
| Fidelity Series Long-Term Treasury Bond Index Fund | 863,539,638 | 785,364,454 | 251,406,141 | 23,563,306 | (25,831,450) | (22,871,590) | 1,348,794,911 |
| Fidelity Series Opportunistic Insights Fund | 775,717,652 | 238,499,463 | 285,681,922 | 132,328,576 | 47,221,725 | (99,788,223) | 675,968,695 |
| Fidelity Series Overseas Fund | 1,369,071,240 | 324,330,178 | 318,207,601 | 43,470,742 | 27,380,321 | (27,141,538) | 1,375,432,600 |
| Fidelity Series Real Estate Income Fund | 121,136,230 | 6,524,492 | 26,177,529 | 4,521,628 | 724,404 | 2,823,680 | 105,031,277 |
| Fidelity Series Short-Term Credit Fund | 322,261,040 | 31,436,252 | 279,691,839 | 4,533,139 | (1,082,437) | (6,426,795) | 66,496,221 |
| Fidelity Series Small Cap Discovery Fund | 166,279,781 | 31,942,586 | 42,228,602 | 26,792,968 | 4,993,625 | (15,448,372) | 145,539,018 |
| Fidelity Series Small Cap Opportunities Fund | 556,195,886 | 202,028,933 | 162,508,120 | 134,122,249 | 16,757,401 | (134,981,995) | 477,492,105 |
| Fidelity Series Stock Selector Large Cap Value Fund | 1,123,186,860 | 233,524,944 | 328,842,047 | 185,138,040 | 40,701,115 | (80,257,627) | 988,313,245 |
| Fidelity Series Value Discovery Fund | 863,775,612 | 128,568,290 | 252,823,835 | 92,362,838 | 48,937,592 | (36,598,557) | 751,859,102 |
| | $31,814,715,524 | $10,879,572,071 | $11,994,986,413 | $2,740,654,633 | $640,117,134 | $(2,782,340,116) | $28,557,014,353 |
(a) Includes the value of shares purchased or redeemed through in-kind transactions, if applicable.
Amounts in the income column in the above table include any capital gain distributions from underlying funds, which are presented in the corresponding line-item in the Statement of Operations, if applicable.
Investment Valuation
The following is a summary of the inputs used, as of March 31, 2022, involving the Fund's assets and liabilities carried at fair value. The inputs or methodology used for valuing securities may not be an indication of the risk associated with investing in those securities. For more information on valuation inputs, and their aggregation into the levels used below, please refer to the Investment Valuation section in the accompanying Notes to Financial Statements.
| | Valuation Inputs at Reporting Date: |
| Description | Total | Level 1 | Level 2 | Level 3 |
| Investments in Securities: | | | | |
| Other Short-Term Investments | $11,474,719 | $-- | $11,474,719 | $-- |
| Domestic Equity Funds | 8,495,707,074 | 8,495,707,074 | -- | -- |
| International Equity Funds | 8,005,960,931 | 8,005,960,931 | -- | -- |
| Bond Funds | 11,723,538,797 | 11,723,538,797 | -- | -- |
| Short-Term Funds | 352,962,789 | 352,962,789 | -- | -- |
| Total Investments in Securities: | $28,589,644,310 | $28,578,169,591 | $11,474,719 | $-- |
| Derivative Instruments: | | | | |
| Assets | | | | |
| Futures Contracts | $8,076,248 | $8,076,248 | $-- | $-- |
| Total Assets | $8,076,248 | $8,076,248 | $-- | $-- |
| Total Derivative Instruments: | $8,076,248 | $8,076,248 | $-- | $-- |
Value of Derivative Instruments
The following table is a summary of the Fund's value of derivative instruments by primary risk exposure as of March 31, 2022. For additional information on derivative instruments, please refer to the Derivative Instruments section in the accompanying Notes to Financial Statements.
| Primary Risk Exposure / Derivative Type | Value |
| | Asset | Liability |
| Equity Risk | | |
| Futures Contracts(a) | $8,076,248 | $0 |
| Total Equity Risk | 8,076,248 | 0 |
| Total Value of Derivatives | $8,076,248 | $0 |
(a) Reflects gross cumulative appreciation (depreciation) on futures contracts as presented in the Schedule of Investments. In the Statement of Assets and Liabilities, the period end daily variation margin is included in receivable or payable for daily variation margin on futures contracts, and the net cumulative appreciation (depreciation) is included in Total accumulated earnings (loss).
See accompanying notes which are an integral part of the financial statements.
Fidelity Freedom® 2025 Fund
Financial Statements
Statement of Assets and Liabilities
| | | March 31, 2022 |
| Assets | | |
Investment in securities, at value — See accompanying schedule:
Unaffiliated issuers (cost $11,474,710) | $11,474,719 | |
| Fidelity Central Funds (cost $21,154,143) | 21,155,238 | |
| Other affiliated issuers (cost $25,068,656,165) | 28,557,014,353 | |
| Total Investment in Securities (cost $25,101,285,018) | | $28,589,644,310 |
| Receivable for investments sold | | 584,040,953 |
| Receivable for fund shares sold | | 23,798,323 |
| Distributions receivable from Fidelity Central Funds | | 2,931 |
| Other receivables | | 332,134 |
| Total assets | | 29,197,818,651 |
| Liabilities | | |
| Payable for investments purchased | $562,628,492 | |
| Payable for fund shares redeemed | 32,453,830 | |
| Accrued management fee | 13,404,997 | |
| Payable for daily variation margin on futures contracts | 1,932,675 | |
| Other payables and accrued expenses | 332,134 | |
| Total liabilities | | 610,752,128 |
| Net Assets | | $28,587,066,523 |
| Net Assets consist of: | | |
| Paid in capital | | $23,809,101,478 |
| Total accumulated earnings (loss) | | 4,777,965,045 |
| Net Assets | | $28,587,066,523 |
| Net Asset Value and Maximum Offering Price | | |
| Fidelity Freedom 2025 Fund: | | |
| Net Asset Value, offering price and redemption price per share ($13,230,185,772 ÷ 913,029,018 shares) | | $14.49 |
| Class K: | | |
| Net Asset Value, offering price and redemption price per share ($11,140,241,442 ÷ 769,736,990 shares) | | $14.47 |
| Class K6: | | |
| Net Asset Value, offering price and redemption price per share ($4,216,639,309 ÷ 292,081,025 shares) | | $14.44 |
See accompanying notes which are an integral part of the financial statements.
Statement of Operations
| | | Year ended March 31, 2022 |
| Investment Income | | |
| Dividends: | | |
| Affiliated issuers | | $896,029,384 |
| Interest | | 5,518 |
| Income from Fidelity Central Funds | | 13,828 |
| Total income | | 896,048,730 |
| Expenses | | |
| Management fee | $175,320,047 | |
| Independent trustees' fees and expenses | 94,542 | |
| Total expenses | | 175,414,589 |
| Net investment income (loss) | | 720,634,141 |
| Realized and Unrealized Gain (Loss) | | |
| Net realized gain (loss) on: | | |
| Investment securities: | | |
| Unaffiliated issuers | 6,612 | |
| Affiliated issuers | 640,117,134 | |
| Futures contracts | 5,762,194 | |
| Capital gain distributions from underlying funds: | | |
| Affiliated issuers | 1,844,625,249 | |
| Total net realized gain (loss) | | 2,490,511,189 |
| Change in net unrealized appreciation (depreciation) on: | | |
| Investment securities: | | |
| Unaffiliated issuers | (223) | |
| Fidelity Central Funds | (1) | |
| Other affiliated issuers | (2,782,340,116) | |
| Futures contracts | 8,076,248 | |
| Total change in net unrealized appreciation (depreciation) | | (2,774,264,092) |
| Net gain (loss) | | (283,752,903) |
| Net increase (decrease) in net assets resulting from operations | | $436,881,238 |
See accompanying notes which are an integral part of the financial statements.
Statement of Changes in Net Assets
| | Year ended March 31, 2022 | Year ended March 31, 2021 |
| Increase (Decrease) in Net Assets | | |
| Operations | | |
| Net investment income (loss) | $720,634,141 | $324,034,338 |
| Net realized gain (loss) | 2,490,511,189 | 1,971,837,182 |
| Change in net unrealized appreciation (depreciation) | (2,774,264,092) | 6,353,655,497 |
| Net increase (decrease) in net assets resulting from operations | 436,881,238 | 8,649,527,017 |
| Distributions to shareholders | (3,056,045,161) | (1,735,084,866) |
| Share transactions - net increase (decrease) | (652,205,596) | 670,689,979 |
| Total increase (decrease) in net assets | (3,271,369,519) | 7,585,132,130 |
| Net Assets | | |
| Beginning of period | 31,858,436,042 | 24,273,303,912 |
| End of period | $28,587,066,523 | $31,858,436,042 |
See accompanying notes which are an integral part of the financial statements.
Financial Highlights
Fidelity Freedom 2025 Fund
| Years ended March 31, | 2022 | 2021 | 2020 | 2019 | 2018 |
| Selected Per–Share Data | | | | | |
| Net asset value, beginning of period | $15.86 | $12.34 | $13.84 | $14.35 | $13.50 |
| Income from Investment Operations | | | | | |
| Net investment income (loss)A,B | .36 | .16 | .24 | .24 | .18 |
| Net realized and unrealized gain (loss) | (.13) | 4.25 | (.87) | .08 | 1.26 |
| Total from investment operations | .23 | 4.41 | (.63) | .32 | 1.44 |
| Distributions from net investment income | (.37) | (.17) | (.25) | (.23) | (.18) |
| Distributions from net realized gain | (1.22) | (.72) | (.63) | (.59) | (.41) |
| Total distributions | (1.60)C | (.89) | (.87)C | (.83)C | (.59) |
| Net asset value, end of period | $14.49 | $15.86 | $12.34 | $13.84 | $14.35 |
| Total ReturnD | .99% | 36.58% | (5.17)% | 2.53% | 10.81% |
| Ratios to Average Net AssetsB,E,F | | | | | |
| Expenses before reductions | .63% | .64% | .64% | .65% | .56%G |
| Expenses net of fee waivers, if any | .63% | .64% | .64% | .65% | .56%G |
| Expenses net of all reductions | .63% | .64% | .64% | .65% | .56%G |
| Net investment income (loss) | 2.28% | 1.07% | 1.72% | 1.70% | 1.28% |
| Supplemental Data | | | | | |
| Net assets, end of period (000 omitted) | $13,230,186 | $13,719,791 | $9,905,175 | $10,953,002 | $10,923,217 |
| Portfolio turnover rateH | 35% | 26% | 29% | 19% | 18%I |
A Calculated based on average shares outstanding during the period.
B Net investment income (loss) is affected by the timing of the declaration of dividends by any underlying mutual funds or exchange-traded funds (ETFs). Net investment income (loss) of any such underlying funds is not included in the Fund's net investment income (loss) ratio.
C Total distributions per share do not sum due to rounding.
D Total returns would have been lower if certain expenses had not been reduced during the applicable periods shown.
E Fees and expenses of any underlying mutual funds or exchange-traded funds (ETFs) are not included in the Fund's expense ratio. The Fund indirectly bears its proportionate share of these expenses. For additional expense information related to investments in Fidelity Central Funds, please refer to the "Investments in Fidelity Central Funds" note found in the Notes to Financial Statements section of the most recent Annual or Semi-Annual report.
F Expense ratios reflect operating expenses of the class. Expenses before reductions do not reflect amounts reimbursed, waived, or reduced through arrangements with the investment adviser, brokerage services, or other offset arrangements, if applicable, and do not represent the amount paid by the class during periods when reimbursements, waivers or reductions occur.
G On certain classes, the size and fluctuation of net assets and expense amounts may cause ratios to differ from contractual rates.
H Amount does not include the portfolio activity of any underlying mutual funds or exchange-traded funds (ETFs).
I The portfolio turnover rate does not include the assets acquired in the merger.
See accompanying notes which are an integral part of the financial statements.
Fidelity Freedom 2025 Fund Class K
| Years ended March 31, | 2022 | 2021 | 2020 | 2019 | 2018 A |
| Selected Per–Share Data | | | | | |
| Net asset value, beginning of period | $15.84 | $12.32 | $13.82 | $14.33 | $14.02 |
| Income from Investment Operations | | | | | |
| Net investment income (loss)B,C | .37 | .17 | .25 | .25 | .23 |
| Net realized and unrealized gain (loss) | (.14) | 4.25 | (.87) | .08 | .50 |
| Total from investment operations | .23 | 4.42 | (.62) | .33 | .73 |
| Distributions from net investment income | (.38) | (.18) | (.26) | (.24) | (.18) |
| Distributions from net realized gain | (1.22) | (.72) | (.63) | (.59) | (.24) |
| Total distributions | (1.60) | (.90) | (.88)D | (.84)D | (.42) |
| Net asset value, end of period | $14.47 | $15.84 | $12.32 | $13.82 | $14.33 |
| Total ReturnE,F | 1.04% | 36.74% | (5.11)% | 2.61% | 5.18% |
| Ratios to Average Net AssetsC,G,H | | | | | |
| Expenses before reductions | .55% | .55% | .56% | .57% | .58%I,J |
| Expenses net of fee waivers, if any | .55% | .55% | .56% | .57% | .58%I,J |
| Expenses net of all reductions | .55% | .55% | .56% | .57% | .58%I,J |
| Net investment income (loss) | 2.36% | 1.15% | 1.81% | 1.79% | 2.28%I |
| Supplemental Data | | | | | |
| Net assets, end of period (000 omitted) | $11,140,241 | $13,839,951 | $11,470,984 | $13,768,298 | $15,743,238 |
| Portfolio turnover rateK | 35% | 26% | 29% | 19% | 18%L |
A For the period July 20, 2017 (commencement of sale of shares) through March 31, 2018.
B Calculated based on average shares outstanding during the period.
C Net investment income (loss) is affected by the timing of the declaration of dividends by any underlying mutual funds or exchange-traded funds (ETFs). Net investment income (loss) of any such underlying funds is not included in the Fund's net investment income (loss) ratio.
D Total distributions per share do not sum due to rounding.
E Total returns for periods of less than one year are not annualized.
F Total returns would have been lower if certain expenses had not been reduced during the applicable periods shown.
G Fees and expenses of any underlying mutual funds or exchange-traded funds (ETFs) are not included in the Fund's expense ratio. The Fund indirectly bears its proportionate share of these expenses. For additional expense information related to investments in Fidelity Central Funds, please refer to the "Investments in Fidelity Central Funds" note found in the Notes to Financial Statements section of the most recent Annual or Semi-Annual report.
H Expense ratios reflect operating expenses of the class. Expenses before reductions do not reflect amounts reimbursed, waived, or reduced through arrangements with the investment adviser, brokerage services, or other offset arrangements, if applicable, and do not represent the amount paid by the class during periods when reimbursements, waivers or reductions occur.
I Annualized
J On certain classes, the size and fluctuation of net assets and expense amounts may cause ratios to differ from contractual rates.
K Amount does not include the portfolio activity of any underlying mutual funds or exchange-traded funds (ETFs).
L The portfolio turnover rate does not include the assets acquired in the merger.
See accompanying notes which are an integral part of the financial statements.
Fidelity Freedom 2025 Fund Class K6
| Years ended March 31, | 2022 | 2021 | 2020 | 2019 | 2018 A |
| Selected Per–Share Data | | | | | |
| Net asset value, beginning of period | $15.81 | $12.30 | $13.81 | $14.35 | $13.80 |
| Income from Investment Operations | | | | | |
| Net investment income (loss)B,C | .39 | .18 | .27 | .26 | .21 |
| Net realized and unrealized gain (loss) | (.13) | 4.25 | (.87) | .08 | .76 |
| Total from investment operations | .26 | 4.43 | (.60) | .34 | .97 |
| Distributions from net investment income | (.40) | (.20) | (.28) | (.29) | (.19) |
| Distributions from net realized gain | (1.22) | (.72) | (.63) | (.59) | (.24) |
| Total distributions | (1.63)D | (.92) | (.91) | (.88) | (.42)D |
| Net asset value, end of period | $14.44 | $15.81 | $12.30 | $13.81 | $14.35 |
| Total ReturnE,F | 1.19% | 36.91% | (5.02)% | 2.73% | 7.02% |
| Ratios to Average Net AssetsC,G,H | | | | | |
| Expenses before reductions | .44% | .44% | .45% | .45% | .46%I,J |
| Expenses net of fee waivers, if any | .44% | .44% | .45% | .45% | .46%I,J |
| Expenses net of all reductions | .44% | .44% | .45% | .45% | .46%I,J |
| Net investment income (loss) | 2.46% | 1.26% | 1.92% | 1.90% | 1.78%I |
| Supplemental Data | | | | | |
| Net assets, end of period (000 omitted) | $4,216,639 | $4,298,694 | $2,897,146 | $2,419,859 | $625,475 |
| Portfolio turnover rateK | 35% | 26% | 29% | 19% | 18%L |
A For the period June 7, 2017 (commencement of sale of shares) through March 31, 2018.
B Calculated based on average shares outstanding during the period.
C Net investment income (loss) is affected by the timing of the declaration of dividends by any underlying mutual funds or exchange-traded funds (ETFs). Net investment income (loss) of any such underlying funds is not included in the Fund's net investment income (loss) ratio.
D Total distributions per share do not sum due to rounding.
E Total returns for periods of less than one year are not annualized.
F Total returns would have been lower if certain expenses had not been reduced during the applicable periods shown.
G Fees and expenses of any underlying mutual funds or exchange-traded funds (ETFs) are not included in the Fund's expense ratio. The Fund indirectly bears its proportionate share of these expenses. For additional expense information related to investments in Fidelity Central Funds, please refer to the "Investments in Fidelity Central Funds" note found in the Notes to Financial Statements section of the most recent Annual or Semi-Annual report.
H Expense ratios reflect operating expenses of the class. Expenses before reductions do not reflect amounts reimbursed, waived, or reduced through arrangements with the investment adviser, brokerage services, or other offset arrangements, if applicable, and do not represent the amount paid by the class during periods when reimbursements, waivers or reductions occur.
I Annualized
J On certain classes, the size and fluctuation of net assets and expense amounts may cause ratios to differ from contractual rates.
K Amount does not include the portfolio activity of any underlying mutual funds or exchange-traded funds (ETFs).
L The portfolio turnover rate does not include the assets acquired in the merger.
See accompanying notes which are an integral part of the financial statements.
Fidelity Freedom® 2030 Fund
Investment Summary (Unaudited)
The information in the following tables is based on the direct investments of the Fund.
Top Holdings as of March 31, 2022
| | % of fund's net assets |
| Fidelity Series Investment Grade Bond Fund | 21.9 |
| Fidelity Series Emerging Markets Opportunities Fund | 9.9 |
| Fidelity Series International Value Fund | 5.3 |
| Fidelity Series Overseas Fund | 5.3 |
| Fidelity Series International Growth Fund | 5.3 |
| Fidelity Series Growth Company Fund | 5.3 |
| Fidelity Series Long-Term Treasury Bond Index Fund | 5.1 |
| Fidelity Series Intrinsic Opportunities Fund | 5.0 |
| Fidelity Series Large Cap Stock Fund | 4.7 |
| Fidelity Series Stock Selector Large Cap Value Fund | 3.9 |
| | 71.7 |
Asset Allocation (% of fund's net assets)
| Period end |
| | Domestic Equity Funds | 33.7% |
| | International Equity Funds | 30.6% |
| | Bond Funds | 35.1% |
| | Short-Term Funds | 0.6% |

Domestic Equity Funds category includes Fidelity Series Commodity Strategy Fund which invests in commodity-related investments.
Fidelity Freedom® 2030 Fund
Schedule of Investments March 31, 2022
Showing Percentage of Net Assets
| U.S. Treasury Obligations - 0.0% | | | |
| | | Principal Amount | Value |
| U.S. Treasury Bills, yield at date of purchase 0.17% to 0.38% 4/21/22 to 6/9/22 (a) | | | |
| (Cost $14,624,915) | | 14,630,000 | 14,625,003 |
| | | Shares | Value |
|
| Domestic Equity Funds - 33.7% | | | |
| Fidelity Series All-Sector Equity Fund (b) | | 43,489,876 | $468,820,867 |
| Fidelity Series Blue Chip Growth Fund (b) | | 53,564,693 | 769,724,642 |
| Fidelity Series Commodity Strategy Fund (b) | | 106,061,802 | 541,975,807 |
| Fidelity Series Growth Company Fund (b) | | 105,474,937 | 1,918,589,106 |
| Fidelity Series Intrinsic Opportunities Fund (b) | | 92,044,466 | 1,810,514,645 |
| Fidelity Series Large Cap Stock Fund (b) | | 89,755,455 | 1,706,251,208 |
| Fidelity Series Large Cap Value Index Fund (b) | | 41,813,423 | 642,254,176 |
| Fidelity Series Opportunistic Insights Fund (b) | | 53,775,617 | 983,018,276 |
| Fidelity Series Small Cap Discovery Fund (b) | | 15,767,574 | 211,127,819 |
| Fidelity Series Small Cap Opportunities Fund (b) | | 50,982,787 | 694,385,560 |
| Fidelity Series Stock Selector Large Cap Value Fund (b) | | 106,070,135 | 1,437,250,323 |
| Fidelity Series Value Discovery Fund (b) | | 68,337,365 | 1,093,397,839 |
| TOTAL DOMESTIC EQUITY FUNDS | | | |
| (Cost $8,646,606,937) | | | 12,277,310,268 |
|
| International Equity Funds - 30.6% | | | |
| Fidelity Series Canada Fund (b) | | 54,027,981 | 838,514,271 |
| Fidelity Series Emerging Markets Fund (b) | | 43,001,988 | 399,058,446 |
| Fidelity Series Emerging Markets Opportunities Fund (b) | | 195,429,422 | 3,595,901,366 |
| Fidelity Series International Growth Fund (b) | | 115,910,108 | 1,921,789,584 |
| Fidelity Series International Small Cap Fund (b) | | 29,430,232 | 528,272,673 |
| Fidelity Series International Value Fund (b) | | 176,388,247 | 1,945,562,363 |
| Fidelity Series Overseas Fund (b) | | 153,205,464 | 1,933,452,952 |
| TOTAL INTERNATIONAL EQUITY FUNDS | | | |
| (Cost $9,227,676,776) | | | 11,162,551,655 |
|
| Bond Funds - 35.1% | | | |
| Fidelity Series 5+ Year Inflation-Protected Bond Index Fund (b) | | 99,404,020 | 954,278,596 |
| Fidelity Series Emerging Markets Debt Fund (b) | | 22,661,860 | 186,960,349 |
| Fidelity Series Emerging Markets Debt Local Currency Fund (b) | | 6,774,032 | 61,034,033 |
| Fidelity Series Floating Rate High Income Fund (b) | | 4,009,760 | 36,849,698 |
| Fidelity Series High Income Fund (b) | | 24,306,510 | 220,946,180 |
| Fidelity Series Inflation-Protected Bond Index Fund (b) | | 23,995,629 | 243,555,639 |
| Fidelity Series International Credit Fund (b) | | 1,843,705 | 17,072,710 |
| Fidelity Series International Developed Markets Bond Index Fund (b) | | 118,110,297 | 1,101,969,074 |
| Fidelity Series Investment Grade Bond Fund (b) | | 732,347,040 | 7,989,906,197 |
| Fidelity Series Long-Term Treasury Bond Index Fund (b) | | 242,099,850 | 1,844,800,860 |
| Fidelity Series Real Estate Income Fund (b) | | 11,778,580 | 133,804,664 |
| TOTAL BOND FUNDS | | | |
| (Cost $13,417,069,302) | | | 12,791,178,000 |
|
| Short-Term Funds - 0.6% | | | |
| Fidelity Cash Central Fund 0.31% (c) | | 32,220,859 | 32,227,303 |
| Fidelity Series Government Money Market Fund 0.31% (b)(d) | | 147,269,053 | 147,269,053 |
| Fidelity Series Short-Term Credit Fund (b) | | 3,785,650 | 36,910,085 |
| TOTAL SHORT-TERM FUNDS | | | |
| (Cost $216,781,074) | | | 216,406,441 |
| TOTAL INVESTMENT IN SECURITIES - 100.0% | | | |
| (Cost $31,522,759,004) | | | 36,462,071,367 |
| NET OTHER ASSETS (LIABILITIES) - 0.0% | | | (3,024,955) |
| NET ASSETS - 100% | | | $36,459,046,412 |
| Futures Contracts | | | | | |
| | Number of contracts | Expiration Date | Notional Amount | Value | Unrealized Appreciation/(Depreciation) |
| Purchased | | | | | |
| Equity Index Contracts | | | | | |
| ICE E-mini MSCI EAFE Index Contracts (United States) | 983 | June 2022 | $105,397,260 | $5,393,636 | $5,393,636 |
| ICE E-mini MSCI Emerging Markets Index Contracts (United States) | 2,010 | June 2022 | 113,112,750 | 4,059,869 | 4,059,869 |
| TOTAL PURCHASED | | | | | $9,453,505 |
| Sold | | | | | |
| Equity Index Contracts | | | | | |
| CME Micro E-mini S&P 500 Index Contracts (United States) | 878 | June 2022 | 198,899,925 | (41,536) | (41,536) |
| TOTAL FUTURES CONTRACTS | | | | | $9,411,969 |
The notional amount of futures purchased as a percentage of Net Assets is 0.6%
The notional amount of futures sold as a percentage of Net Assets is 0.5%
Legend
(a) Security or a portion of the security was pledged to cover margin requirements for futures contracts. At period end, the value of securities pledged amounted to $9,912,323.
(b) Affiliated Fund
(c) Affiliated fund that is generally available only to investment companies and other accounts managed by Fidelity Investments. The rate quoted is the annualized seven-day yield of the fund at period end. A complete unaudited listing of the fund's holdings as of its most recent quarter end is available upon request. In addition, each Fidelity Central Fund's financial statements, which are not covered by the Fund's Report of Independent Registered Public Accounting Firm, are available on the SEC's website or upon request.
(d) The rate quoted is the annualized seven-day yield of the fund at period end.
Affiliated Central Funds
Fiscal year to date information regarding the Fund's investments in Fidelity Central Funds, including the ownership percentage, is presented below.
| Fund | Value, beginning of period | Purchases | Sales Proceeds | Dividend Income | Realized Gain/Loss | Change in Unrealized appreciation (depreciation) | Value, end of period | % ownership, end of period |
| Fidelity Cash Central Fund 0.31% | $32,263,632 | $139,250,027 | $139,286,355 | $16,992 | $-- | $(1) | $32,227,303 | 0.0% |
| Total | $32,263,632 | $139,250,027 | $139,286,355 | $16,992 | $-- | $(1) | $32,227,303 | |
Amounts in the income column in the above table include any capital gain distributions from underlying funds, which are presented in the corresponding line-item in the Statement of Operations, if applicable.
Affiliated Underlying Funds
Fiscal year to date information regarding the Fund's investments in affiliated Underlying Funds is presented below. Exchanges between classes of the same affiliated Underlying Funds may occur. If an underlying Fund changes its name, the name presented below is the name in effect at period end.
| Fund | Value, beginning of period | Purchases(a) | Sales Proceeds(a) | Dividend Income | Realized Gain (loss) | Change in Unrealized appreciation (depreciation) | Value, end of period |
| Fidelity Series 0-5 Year Inflation-Protected Bond Index Fund | $-- | $452,854,617 | $452,391,142 | $540,161 | $(383,056) | $-- | $-- |
| Fidelity Series 5+ Year Inflation-Protected Bond Index Fund | -- | 1,075,096,475 | 77,692,962 | 5,740,350 | (2,923,329) | (40,201,588) | 954,278,596 |
| Fidelity Series All-Sector Equity Fund | 527,639,381 | 132,951,587 | 160,728,141 | 95,926,658 | 14,434,349 | (45,476,309) | 468,820,867 |
| Fidelity Series Blue Chip Growth Fund | 837,134,932 | 363,907,099 | 310,335,181 | 166,871,311 | 19,787,054 | (140,769,262) | 769,724,642 |
| Fidelity Series Canada Fund | 675,170,929 | 159,461,756 | 142,043,432 | 17,642,044 | 5,250,920 | 140,674,098 | 838,514,271 |
| Fidelity Series Commodity Strategy Fund | 1,073,075,098 | 371,960,880 | 946,292,358 | 326,437,312 | (35,521,875) | 78,754,062 | 541,975,807 |
| Fidelity Series Emerging Markets Debt Fund | 208,698,503 | 26,990,615 | 29,951,291 | 9,438,195 | (796,450) | (17,981,028) | 186,960,349 |
| Fidelity Series Emerging Markets Debt Local Currency Fund | 66,798,128 | 13,018,356 | 11,831,945 | 2,626,275 | (398,960) | (6,551,546) | 61,034,033 |
| Fidelity Series Emerging Markets Fund | 492,455,215 | 100,172,603 | 99,740,769 | 14,199,411 | 10,425,076 | (104,253,679) | 399,058,446 |
| Fidelity Series Emerging Markets Opportunities Fund | 4,462,399,709 | 1,286,838,605 | 924,763,461 | 448,891,245 | 121,520,863 | (1,350,094,350) | 3,595,901,366 |
| Fidelity Series Floating Rate High Income Fund | 40,872,287 | 2,714,124 | 6,763,753 | 1,673,459 | (338,170) | 365,210 | 36,849,698 |
| Fidelity Series Government Money Market Fund 0.31% | 683,176,701 | 179,800,658 | 715,708,306 | 444,039 | -- | -- | 147,269,053 |
| Fidelity Series Growth Company Fund | 2,136,378,862 | 1,066,371,650 | 936,385,459 | 551,183,975 | 99,997,806 | (447,773,753) | 1,918,589,106 |
| Fidelity Series High Income Fund | 241,124,219 | 27,778,727 | 40,635,408 | 12,956,970 | (220,128) | (7,101,230) | 220,946,180 |
| Fidelity Series Inflation-Protected Bond Index Fund | 2,174,980,779 | 197,928,546 | 2,152,024,050 | 76,657,781 | 136,259,981 | (113,589,617) | 243,555,639 |
| Fidelity Series International Credit Fund | 17,819,388 | 575,059 | -- | 575,059 | -- | (1,321,737) | 17,072,710 |
| Fidelity Series International Developed Markets Bond Index Fund | -- | 1,171,208,815 | 20,970,250 | 365,196 | (286,589) | (47,982,902) | 1,101,969,074 |
| Fidelity Series International Growth Fund | 1,892,005,436 | 533,998,768 | 341,753,352 | 163,215,599 | 8,848,175 | (171,309,443) | 1,921,789,584 |
| Fidelity Series International Small Cap Fund | 599,597,928 | 90,209,528 | 83,502,288 | 74,520,776 | 20,339,417 | (98,371,912) | 528,272,673 |
| Fidelity Series International Value Fund | 1,889,904,130 | 502,211,100 | 481,807,632 | 102,391,059 | 16,753,891 | 18,500,874 | 1,945,562,363 |
| Fidelity Series Intrinsic Opportunities Fund | 2,144,293,474 | 546,079,086 | 701,332,882 | 354,859,325 | 40,421,926 | (218,946,959) | 1,810,514,645 |
| Fidelity Series Investment Grade Bond Fund | 8,031,966,369 | 1,734,302,921 | 1,343,652,281 | 182,858,199 | (24,178,489) | (408,532,323) | 7,989,906,197 |
| Fidelity Series Large Cap Stock Fund | 1,874,589,275 | 299,453,997 | 529,538,815 | 164,817,260 | 80,999,967 | (19,253,216) | 1,706,251,208 |
| Fidelity Series Large Cap Value Index Fund | 691,023,398 | 64,372,047 | 146,412,547 | 43,485,541 | 20,803,275 | 12,468,003 | 642,254,176 |
| Fidelity Series Long-Term Treasury Bond Index Fund | 1,057,382,556 | 1,136,559,733 | 274,968,203 | 30,494,361 | (33,092,267) | (41,080,959) | 1,844,800,860 |
| Fidelity Series Opportunistic Insights Fund | 1,094,396,388 | 343,987,690 | 378,453,143 | 189,889,269 | 56,419,754 | (133,332,413) | 983,018,276 |
| Fidelity Series Overseas Fund | 1,895,157,947 | 419,745,304 | 380,530,529 | 60,472,847 | 34,667,478 | (35,587,248) | 1,933,452,952 |
| Fidelity Series Real Estate Income Fund | 148,166,727 | 9,379,793 | 28,001,991 | 5,678,534 | 691,291 | 3,568,844 | 133,804,664 |
| Fidelity Series Short-Term Credit Fund | 140,351,391 | 44,821,534 | 144,113,393 | 2,313,583 | (2,485,531) | (1,663,916) | 36,910,085 |
| Fidelity Series Small Cap Discovery Fund | 234,588,618 | 46,944,160 | 55,263,229 | 38,261,841 | 6,308,039 | (21,449,769) | 211,127,819 |
| Fidelity Series Small Cap Opportunities Fund | 784,734,018 | 289,214,045 | 210,121,252 | 191,558,584 | 20,175,188 | (189,616,439) | 694,385,560 |
| Fidelity Series Stock Selector Large Cap Value Fund | 1,584,584,818 | 354,062,956 | 441,894,398 | 265,888,153 | 48,402,100 | (107,905,153) | 1,437,250,323 |
| Fidelity Series Value Discovery Fund | 1,218,611,413 | 188,888,984 | 330,355,926 | 132,696,017 | 56,689,250 | (40,435,882) | 1,093,397,839 |
| | $38,919,078,017 | $13,233,861,818 | $12,899,959,769 | $3,735,570,389 | $718,570,956 | $(3,556,251,542) | $36,415,219,061 |
(a) Includes the value of shares purchased or redeemed through in-kind transactions, if applicable.
Amounts in the income column in the above table include any capital gain distributions from underlying funds, which are presented in the corresponding line-item in the Statement of Operations, if applicable.
Investment Valuation
The following is a summary of the inputs used, as of March 31, 2022, involving the Fund's assets and liabilities carried at fair value. The inputs or methodology used for valuing securities may not be an indication of the risk associated with investing in those securities. For more information on valuation inputs, and their aggregation into the levels used below, please refer to the Investment Valuation section in the accompanying Notes to Financial Statements.
| | Valuation Inputs at Reporting Date: |
| Description | Total | Level 1 | Level 2 | Level 3 |
| Investments in Securities: | | | | |
| Other Short-Term Investments | $14,625,003 | $-- | $14,625,003 | $-- |
| Domestic Equity Funds | 12,277,310,268 | 12,277,310,268 | -- | -- |
| International Equity Funds | 11,162,551,655 | 11,162,551,655 | -- | -- |
| Bond Funds | 12,791,178,000 | 12,791,178,000 | -- | -- |
| Short-Term Funds | 216,406,441 | 216,406,441 | -- | -- |
| Total Investments in Securities: | $36,462,071,367 | $36,447,446,364 | $14,625,003 | $-- |
| Derivative Instruments: | | | | |
| Assets | | | | |
| Futures Contracts | $9,453,505 | $9,453,505 | $-- | $-- |
| Total Assets | $9,453,505 | $9,453,505 | $-- | $-- |
| Liabilities | | | | |
| Futures Contracts | $(41,536) | $(41,536) | $-- | $-- |
| Total Liabilities | $(41,536) | $(41,536) | $-- | $-- |
| Total Derivative Instruments: | $9,411,969 | $9,411,969 | $-- | $-- |
Value of Derivative Instruments
The following table is a summary of the Fund's value of derivative instruments by primary risk exposure as of March 31, 2022. For additional information on derivative instruments, please refer to the Derivative Instruments section in the accompanying Notes to Financial Statements.
| Primary Risk Exposure / Derivative Type | Value |
| | Asset | Liability |
| Equity Risk | | |
| Futures Contracts(a) | $9,453,505 | $(41,536) |
| Total Equity Risk | 9,453,505 | (41,536) |
| Total Value of Derivatives | $9,453,505 | $(41,536) |
(a) Reflects gross cumulative appreciation (depreciation) on futures contracts as presented in the Schedule of Investments. In the Statement of Assets and Liabilities, the period end daily variation margin is included in receivable or payable for daily variation margin on futures contracts, and the net cumulative appreciation (depreciation) is included in Total accumulated earnings (loss).
See accompanying notes which are an integral part of the financial statements.
Fidelity Freedom® 2030 Fund
Financial Statements
Statement of Assets and Liabilities
| | | March 31, 2022 |
| Assets | | |
Investment in securities, at value — See accompanying schedule:
Unaffiliated issuers (cost $14,624,915) | $14,625,003 | |
| Fidelity Central Funds (cost $32,226,198) | 32,227,303 | |
| Other affiliated issuers (cost $31,475,907,891) | 36,415,219,061 | |
| Total Investment in Securities (cost $31,522,759,004) | | $36,462,071,367 |
| Receivable for investments sold | | 642,811,059 |
| Receivable for fund shares sold | | 30,823,018 |
| Distributions receivable from Fidelity Central Funds | | 4,626 |
| Other receivables | | 329,685 |
| Total assets | | 37,136,039,755 |
| Liabilities | | |
| Payable for investments purchased | $622,351,845 | |
| Payable for fund shares redeemed | 34,085,006 | |
| Accrued management fee | 18,067,165 | |
| Payable for daily variation margin on futures contracts | 2,159,642 | |
| Other payables and accrued expenses | 329,685 | |
| Total liabilities | | 676,993,343 |
| Net Assets | | $36,459,046,412 |
| Net Assets consist of: | | |
| Paid in capital | | $29,780,739,477 |
| Total accumulated earnings (loss) | | 6,678,306,935 |
| Net Assets | | $36,459,046,412 |
| Net Asset Value and Maximum Offering Price | | |
| Fidelity Freedom 2030 Fund: | | |
| Net Asset Value, offering price and redemption price per share ($16,667,165,438 ÷ 916,661,880 shares) | | $18.18 |
| Class K: | | |
| Net Asset Value, offering price and redemption price per share ($14,350,455,881 ÷ 789,656,100 shares) | | $18.17 |
| Class K6: | | |
| Net Asset Value, offering price and redemption price per share ($5,441,425,093 ÷ 300,305,440 shares) | | $18.12 |
See accompanying notes which are an integral part of the financial statements.
Statement of Operations
| | | Year ended March 31, 2022 |
| Investment Income | | |
| Dividends: | | |
| Affiliated issuers | | $1,131,911,279 |
| Interest | | 7,216 |
| Income from Fidelity Central Funds | | 16,992 |
| Total income | | 1,131,935,487 |
| Expenses | | |
| Management fee | $233,352,278 | |
| Independent trustees' fees and expenses | 117,735 | |
| Total expenses | | 233,470,013 |
| Net investment income (loss) | | 898,465,474 |
| Realized and Unrealized Gain (Loss) | | |
| Net realized gain (loss) on: | | |
| Investment securities: | | |
| Unaffiliated issuers | 9,997 | |
| Affiliated issuers | 718,570,956 | |
| Futures contracts | 5,916,485 | |
| Capital gain distributions from underlying funds: | | |
| Affiliated issuers | 2,603,659,110 | |
| Total net realized gain (loss) | | 3,328,156,548 |
| Change in net unrealized appreciation (depreciation) on: | | |
| Investment securities: | | |
| Unaffiliated issuers | (147) | |
| Fidelity Central Funds | (1) | |
| Other affiliated issuers | (3,556,251,542) | |
| Futures contracts | 9,411,969 | |
| Total change in net unrealized appreciation (depreciation) | | (3,546,839,721) |
| Net gain (loss) | | (218,683,173) |
| Net increase (decrease) in net assets resulting from operations | | $679,782,301 |
See accompanying notes which are an integral part of the financial statements.
Statement of Changes in Net Assets
| | Year ended March 31, 2022 | Year ended March 31, 2021 |
| Increase (Decrease) in Net Assets | | |
| Operations | | |
| Net investment income (loss) | $898,465,474 | $391,114,008 |
| Net realized gain (loss) | 3,328,156,548 | 2,615,189,676 |
| Change in net unrealized appreciation (depreciation) | (3,546,839,721) | 8,699,215,999 |
| Net increase (decrease) in net assets resulting from operations | 679,782,301 | 11,705,519,683 |
| Distributions to shareholders | (4,024,014,410) | (2,280,507,233) |
| Share transactions - net increase (decrease) | 832,976,200 | 1,011,204,435 |
| Total increase (decrease) in net assets | (2,511,255,909) | 10,436,216,885 |
| Net Assets | | |
| Beginning of period | 38,970,302,321 | 28,534,085,436 |
| End of period | $36,459,046,412 | $38,970,302,321 |
See accompanying notes which are an integral part of the financial statements.
Financial Highlights
Fidelity Freedom 2030 Fund
| Years ended March 31, | 2022 | 2021 | 2020 | 2019 | 2018 |
| Selected Per–Share Data | | | | | |
| Net asset value, beginning of period | $19.92 | $14.98 | $17.20 | $18.00 | $16.72 |
| Income from Investment Operations | | | | | |
| Net investment income (loss)A,B | .45 | .19 | .29 | .28 | .21 |
| Net realized and unrealized gain (loss) | (.08) | 5.95 | (1.30) | .07 | 1.90 |
| Total from investment operations | .37 | 6.14 | (1.01) | .35 | 2.11 |
| Distributions from net investment income | (.46) | (.21) | (.30) | (.28) | (.22) |
| Distributions from net realized gain | (1.65) | (1.00) | (.92) | (.87) | (.61) |
| Total distributions | (2.11) | (1.20)C | (1.21)C | (1.15) | (.83) |
| Net asset value, end of period | $18.18 | $19.92 | $14.98 | $17.20 | $18.00 |
| Total ReturnD | 1.41% | 42.14% | (6.69)% | 2.32% | 12.78% |
| Ratios to Average Net AssetsB,E,F | | | | | |
| Expenses before reductions | .67% | .68% | .69% | .69%G | .59% |
| Expenses net of fee waivers, if any | .67% | .68% | .69% | .69%G | .59% |
| Expenses net of all reductions | .67% | .68% | .69% | .69%G | .59% |
| Net investment income (loss) | 2.26% | 1.06% | 1.68% | 1.61% | 1.20% |
| Supplemental Data | | | | | |
| Net assets, end of period (000 omitted) | $16,667,165 | $16,799,087 | $11,724,021 | $12,905,055 | $12,684,794 |
| Portfolio turnover rateH | 33% | 26% | 31% | 18% | 18%I |
A Calculated based on average shares outstanding during the period.
B Net investment income (loss) is affected by the timing of the declaration of dividends by any underlying mutual funds or exchange-traded funds (ETFs). Net investment income (loss) of any such underlying funds is not included in the Fund's net investment income (loss) ratio.
C Total distributions per share do not sum due to rounding.
D Total returns would have been lower if certain expenses had not been reduced during the applicable periods shown.
E Fees and expenses of any underlying mutual funds or exchange-traded funds (ETFs) are not included in the Fund's expense ratio. The Fund indirectly bears its proportionate share of these expenses. For additional expense information related to investments in Fidelity Central Funds, please refer to the "Investments in Fidelity Central Funds" note found in the Notes to Financial Statements section of the most recent Annual or Semi-Annual report.
F Expense ratios reflect operating expenses of the class. Expenses before reductions do not reflect amounts reimbursed, waived, or reduced through arrangements with the investment adviser, brokerage services, or other offset arrangements, if applicable, and do not represent the amount paid by the class during periods when reimbursements, waivers or reductions occur.
G On certain classes, the size and fluctuation of net assets and expense amounts may cause ratios to differ from contractual rates.
H Amount does not include the portfolio activity of any underlying mutual funds or exchange-traded funds (ETFs).
I The portfolio turnover rate does not include the assets acquired in the merger.
See accompanying notes which are an integral part of the financial statements.
Fidelity Freedom 2030 Fund Class K
| Years ended March 31, | 2022 | 2021 | 2020 | 2019 | 2018 A |
| Selected Per–Share Data | | | | | |
| Net asset value, beginning of period | $19.90 | $14.97 | $17.18 | $17.98 | $17.47 |
| Income from Investment Operations | | | | | |
| Net investment income (loss)B,C | .47 | .21 | .30 | .30 | .28 |
| Net realized and unrealized gain (loss) | (.08) | 5.94 | (1.29) | .06 | .81 |
| Total from investment operations | .39 | 6.15 | (.99) | .36 | 1.09 |
| Distributions from net investment income | (.47) | (.22) | (.31) | (.29) | (.24) |
| Distributions from net realized gain | (1.65) | (1.00) | (.92) | (.87) | (.35) |
| Total distributions | (2.12) | (1.22) | (1.22)D | (1.16) | (.58)D |
| Net asset value, end of period | $18.17 | $19.90 | $14.97 | $17.18 | $17.98 |
| Total ReturnE,F | 1.52% | 42.20% | (6.57)% | 2.40% | 6.24% |
| Ratios to Average Net AssetsC,G,H | | | | | |
| Expenses before reductions | .58% | .59% | .59% | .60% | .62%I,J |
| Expenses net of fee waivers, if any | .58% | .59% | .59% | .60% | .62%I,J |
| Expenses net of all reductions | .58% | .59% | .59% | .60% | .62%I,J |
| Net investment income (loss) | 2.35% | 1.15% | 1.77% | 1.70% | 2.23%I |
| Supplemental Data | | | | | |
| Net assets, end of period (000 omitted) | $14,350,456 | $17,173,513 | $13,601,568 | $16,527,856 | $18,414,961 |
| Portfolio turnover rateK | 33% | 26% | 31% | 18% | 18%L |
A For the period July 20, 2017 (commencement of sale of shares) through March 31, 2018.
B Calculated based on average shares outstanding during the period.
C Net investment income (loss) is affected by the timing of the declaration of dividends by any underlying mutual funds or exchange-traded funds (ETFs). Net investment income (loss) of any such underlying funds is not included in the Fund's net investment income (loss) ratio.
D Total distributions per share do not sum due to rounding.
E Total returns for periods of less than one year are not annualized.
F Total returns would have been lower if certain expenses had not been reduced during the applicable periods shown.
G Fees and expenses of any underlying mutual funds or exchange-traded funds (ETFs) are not included in the Fund's expense ratio. The Fund indirectly bears its proportionate share of these expenses. For additional expense information related to investments in Fidelity Central Funds, please refer to the "Investments in Fidelity Central Funds" note found in the Notes to Financial Statements section of the most recent Annual or Semi-Annual report.
H Expense ratios reflect operating expenses of the class. Expenses before reductions do not reflect amounts reimbursed, waived, or reduced through arrangements with the investment adviser, brokerage services, or other offset arrangements, if applicable, and do not represent the amount paid by the class during periods when reimbursements, waivers or reductions occur.
I Annualized
J On certain classes, the size and fluctuation of net assets and expense amounts may cause ratios to differ from contractual rates.
K Amount does not include the portfolio activity of any underlying mutual funds or exchange-traded funds (ETFs).
L The portfolio turnover rate does not include the assets acquired in the merger.
See accompanying notes which are an integral part of the financial statements.
Fidelity Freedom 2030 Fund Class K6
| Years ended March 31, | 2022 | 2021 | 2020 | 2019 | 2018 A |
| Selected Per–Share Data | | | | | |
| Net asset value, beginning of period | $19.86 | $14.94 | $17.17 | $18.00 | $17.15 |
| Income from Investment Operations | | | | | |
| Net investment income (loss)B,C | .49 | .23 | .33 | .31 | .26 |
| Net realized and unrealized gain (loss) | (.07) | 5.94 | (1.30) | .08 | 1.18 |
| Total from investment operations | .42 | 6.17 | (.97) | .39 | 1.44 |
| Distributions from net investment income | (.50) | (.25) | (.34) | (.33) | (.24) |
| Distributions from net realized gain | (1.66) | (1.00) | (.92) | (.89) | (.35) |
| Total distributions | (2.16) | (1.25) | (1.26) | (1.22) | (.59) |
| Net asset value, end of period | $18.12 | $19.86 | $14.94 | $17.17 | $18.00 |
| Total ReturnD,E | 1.64% | 42.45% | (6.52)% | 2.57% | 8.35% |
| Ratios to Average Net AssetsC,F,G | | | | | |
| Expenses before reductions | .46% | .46% | .47% | .47% | .48%H,I |
| Expenses net of fee waivers, if any | .46% | .46% | .47% | .47% | .48%H,I |
| Expenses net of all reductions | .46% | .46% | .47% | .47% | .48%H,I |
| Net investment income (loss) | 2.47% | 1.28% | 1.90% | 1.83% | 1.76%H |
| Supplemental Data | | | | | |
| Net assets, end of period (000 omitted) | $5,441,425 | $4,997,702 | $3,208,497 | $2,637,856 | $821,874 |
| Portfolio turnover rateJ | 33% | 26% | 31% | 18% | 18%K |
A For the period June 7, 2017 (commencement of sale of shares) through March 31, 2018.
B Calculated based on average shares outstanding during the period.
C Net investment income (loss) is affected by the timing of the declaration of dividends by any underlying mutual funds or exchange-traded funds (ETFs). Net investment income (loss) of any such underlying funds is not included in the Fund's net investment income (loss) ratio.
D Total returns for periods of less than one year are not annualized.
E Total returns would have been lower if certain expenses had not been reduced during the applicable periods shown.
F Fees and expenses of any underlying mutual funds or exchange-traded funds (ETFs) are not included in the Fund's expense ratio. The Fund indirectly bears its proportionate share of these expenses. For additional expense information related to investments in Fidelity Central Funds, please refer to the "Investments in Fidelity Central Funds" note found in the Notes to Financial Statements section of the most recent Annual or Semi-Annual report.
G Expense ratios reflect operating expenses of the class. Expenses before reductions do not reflect amounts reimbursed, waived, or reduced through arrangements with the investment adviser, brokerage services, or other offset arrangements, if applicable, and do not represent the amount paid by the class during periods when reimbursements, waivers or reductions occur.
H Annualized
I On certain classes, the size and fluctuation of net assets and expense amounts may cause ratios to differ from contractual rates.
J Amount does not include the portfolio activity of any underlying mutual funds or exchange-traded funds (ETFs).
K The portfolio turnover rate does not include the assets acquired in the merger.
See accompanying notes which are an integral part of the financial statements.
Fidelity Freedom® 2035 Fund
Investment Summary (Unaudited)
The information in the following tables is based on the direct investments of the Fund.
Top Holdings as of March 31, 2022
| | % of fund's net assets |
| Fidelity Series Investment Grade Bond Fund | 11.8 |
| Fidelity Series Emerging Markets Opportunities Fund | 11.4 |
| Fidelity Series Growth Company Fund | 6.7 |
| Fidelity Series International Value Fund | 6.5 |
| Fidelity Series Overseas Fund | 6.4 |
| Fidelity Series International Growth Fund | 6.4 |
| Fidelity Series Intrinsic Opportunities Fund | 6.3 |
| Fidelity Series Large Cap Stock Fund | 6.0 |
| Fidelity Series Long-Term Treasury Bond Index Fund | 5.3 |
| Fidelity Series Stock Selector Large Cap Value Fund | 5.0 |
| | 71.8 |
Asset Allocation (% of fund's net assets)
| Period end |
| | Domestic Equity Funds | 42.6% |
| | International Equity Funds | 36.6% |
| | Bond Funds | 20.7% |
| | Short-Term Funds | 0.1% |

Domestic Equity Funds category includes Fidelity Series Commodity Strategy Fund which invests in commodity-related investments.
Fidelity Freedom® 2035 Fund
Schedule of Investments March 31, 2022
Showing Percentage of Net Assets
| U.S. Treasury Obligations - 0.0% | | | |
| | | Principal Amount | Value |
| U.S. Treasury Bills, yield at date of purchase 0.17% 4/21/22 (a) | | | |
| (Cost $9,559,124) | | 9,560,000 | 9,559,349 |
| | | Shares | Value |
|
| Domestic Equity Funds - 42.6% | | | |
| Fidelity Series All-Sector Equity Fund (b) | | 41,989,323 | $452,644,898 |
| Fidelity Series Blue Chip Growth Fund (b) | | 51,713,057 | 743,116,631 |
| Fidelity Series Commodity Strategy Fund (b) | | 80,480,993 | 411,257,876 |
| Fidelity Series Growth Company Fund (b) | | 101,833,388 | 1,852,349,334 |
| Fidelity Series Intrinsic Opportunities Fund (b) | | 88,455,957 | 1,739,928,680 |
| Fidelity Series Large Cap Stock Fund (b) | | 86,657,243 | 1,647,354,196 |
| Fidelity Series Large Cap Value Index Fund (b) | | 40,369,806 | 620,080,218 |
| Fidelity Series Opportunistic Insights Fund (b) | | 51,916,480 | 949,033,246 |
| Fidelity Series Small Cap Discovery Fund (b) | | 15,171,970 | 203,152,679 |
| Fidelity Series Small Cap Opportunities Fund (b) | | 49,222,191 | 670,406,240 |
| Fidelity Series Stock Selector Large Cap Value Fund (b) | | 102,406,601 | 1,387,609,440 |
| Fidelity Series Value Discovery Fund (b) | | 65,977,900 | 1,055,646,397 |
| TOTAL DOMESTIC EQUITY FUNDS | | | |
| (Cost $8,532,493,668) | | | 11,732,579,835 |
|
| International Equity Funds - 36.6% | | | |
| Fidelity Series Canada Fund (b) | | 49,776,799 | 772,535,919 |
| Fidelity Series Emerging Markets Fund (b) | | 37,519,181 | 348,177,997 |
| Fidelity Series Emerging Markets Opportunities Fund (b) | | 170,527,263 | 3,137,701,639 |
| Fidelity Series International Growth Fund (b) | | 106,679,125 | 1,768,739,893 |
| Fidelity Series International Small Cap Fund (b) | | 27,052,974 | 485,600,878 |
| Fidelity Series International Value Fund (b) | | 161,953,569 | 1,786,347,865 |
| Fidelity Series Overseas Fund (b) | | 140,926,743 | 1,778,495,495 |
| TOTAL INTERNATIONAL EQUITY FUNDS | | | |
| (Cost $8,505,002,236) | | | 10,077,599,686 |
|
| Bond Funds - 20.7% | | | |
| Fidelity Series 5+ Year Inflation-Protected Bond Index Fund (b) | | 2,861,642 | 27,471,766 |
| Fidelity Series Emerging Markets Debt Fund (b) | | 17,101,526 | 141,087,586 |
| Fidelity Series Emerging Markets Debt Local Currency Fund (b) | | 5,090,385 | 45,864,369 |
| Fidelity Series Floating Rate High Income Fund (b) | | 3,016,196 | 27,718,837 |
| Fidelity Series High Income Fund (b) | | 18,315,058 | 166,483,874 |
| Fidelity Series International Credit Fund (b) | | 1,227,803 | 11,369,458 |
| Fidelity Series International Developed Markets Bond Index Fund (b) | | 48,931,575 | 456,531,592 |
| Fidelity Series Investment Grade Bond Fund (b) | | 298,504,613 | 3,256,685,329 |
| Fidelity Series Long-Term Treasury Bond Index Fund (b) | | 191,952,583 | 1,462,678,682 |
| Fidelity Series Real Estate Income Fund (b) | | 8,868,414 | 100,745,186 |
| TOTAL BOND FUNDS | | | |
| (Cost $6,047,006,817) | | | 5,696,636,679 |
|
| Short-Term Funds - 0.1% | | | |
| Fidelity Cash Central Fund 0.31% (c) | | | |
| (Cost $26,071,874) | | 26,067,023 | 26,072,237 |
| TOTAL INVESTMENT IN SECURITIES - 100.0% | | | |
| (Cost $23,120,133,719) | | | 27,542,447,786 |
| NET OTHER ASSETS (LIABILITIES) - 0.0% | | | (2,225,299) |
| NET ASSETS - 100% | | | $27,540,222,487 |
| Futures Contracts | | | | | |
| | Number of contracts | Expiration Date | Notional Amount | Value | Unrealized Appreciation/(Depreciation) |
| Purchased | | | | | |
| Equity Index Contracts | | | | | |
| ICE E-mini MSCI EAFE Index Contracts (United States) | 753 | June 2022 | $80,736,660 | $3,310,179 | $3,310,179 |
| ICE E-mini MSCI Emerging Markets Index Contracts (United States) | 1,570 | June 2022 | 88,351,750 | 2,268,615 | 2,268,615 |
| TOTAL PURCHASED | | | | | $5,578,794 |
| Sold | | | | | |
| Equity Index Contracts | | | | | |
| CME Micro E-mini S&P 500 Index Contracts (United States) | 649 | June 2022 | 147,022,838 | (1,583,722) | (1,583,722) |
| TOTAL FUTURES CONTRACTS | | | | | $3,995,072 |
The notional amount of futures purchased as a percentage of Net Assets is 0.6%
The notional amount of futures sold as a percentage of Net Assets is 0.5%
Legend
(a) Security or a portion of the security was pledged to cover margin requirements for futures contracts. At period end, the value of securities pledged amounted to $8,293,436.
(b) Affiliated Fund
(c) Affiliated fund that is generally available only to investment companies and other accounts managed by Fidelity Investments. The rate quoted is the annualized seven-day yield of the fund at period end. A complete unaudited listing of the fund's holdings as of its most recent quarter end is available upon request. In addition, each Fidelity Central Fund's financial statements, which are not covered by the Fund's Report of Independent Registered Public Accounting Firm, are available on the SEC's website or upon request.
Affiliated Central Funds
Fiscal year to date information regarding the Fund's investments in Fidelity Central Funds, including the ownership percentage, is presented below.
| Fund | Value, beginning of period | Purchases | Sales Proceeds | Dividend Income | Realized Gain/Loss | Change in Unrealized appreciation (depreciation) | Value, end of period | % ownership, end of period |
| Fidelity Cash Central Fund 0.31% | $20,209,863 | $106,210,222 | $100,347,848 | $10,927 | $-- | $-- | $26,072,237 | 0.1% |
| Total | $20,209,863 | $106,210,222 | $100,347,848 | $10,927 | $-- | $-- | $26,072,237 | |
Amounts in the income column in the above table include any capital gain distributions from underlying funds, which are presented in the corresponding line-item in the Statement of Operations, if applicable.
Affiliated Underlying Funds
Fiscal year to date information regarding the Fund's investments in affiliated Underlying Funds is presented below. Exchanges between classes of the same affiliated Underlying Funds may occur. If an underlying Fund changes its name, the name presented below is the name in effect at period end.
| Fund | Value, beginning of period | Purchases(a) | Sales Proceeds(a) | Dividend Income | Realized Gain (loss) | Change in Unrealized appreciation (depreciation) | Value, end of period |
| Fidelity Series 0-5 Year Inflation-Protected Bond Index Fund | $-- | $94,631,239 | $94,133,562 | $402,758 | $(437,714) | $-- | $-- |
| Fidelity Series 5+ Year Inflation-Protected Bond Index Fund | -- | 238,738,172 | 201,612,206 | 1,341,369 | (8,824,545) | (829,657) | 27,471,764 |
| Fidelity Series All-Sector Equity Fund | 498,332,105 | 131,886,261 | 147,048,209 | 92,082,556 | 10,484,478 | (41,009,737) | 452,644,898 |
| Fidelity Series Blue Chip Growth Fund | 790,586,328 | 359,040,334 | 289,190,511 | 160,333,145 | 15,766,430 | (133,085,950) | 743,116,631 |
| Fidelity Series Canada Fund | 620,064,288 | 146,610,501 | 127,791,885 | 16,136,337 | 5,033,026 | 128,619,989 | 772,535,919 |
| Fidelity Series Commodity Strategy Fund | 796,193,554 | 291,123,165 | 707,211,738 | 244,346,511 | (27,271,130) | 58,424,025 | 411,257,876 |
| Fidelity Series Emerging Markets Debt Fund | 155,059,322 | 26,221,724 | 26,029,634 | 7,058,828 | (981,668) | (13,182,158) | 141,087,586 |
| Fidelity Series Emerging Markets Debt Local Currency Fund | 49,865,203 | 11,085,695 | 9,804,832 | 1,963,523 | (395,692) | (4,886,005) | 45,864,369 |
| Fidelity Series Emerging Markets Fund | 420,498,040 | 90,139,417 | 80,695,151 | 12,369,186 | 6,198,849 | (87,963,158) | 348,177,997 |
| Fidelity Series Emerging Markets Opportunities Fund | 3,803,752,964 | 1,141,794,974 | 739,785,590 | 388,837,780 | 74,007,871 | (1,142,068,580) | 3,137,701,639 |
| Fidelity Series Floating Rate High Income Fund | 30,025,987 | 5,428,518 | 7,745,621 | 1,257,454 | (400,007) | 409,960 | 27,718,837 |
| Fidelity Series Government Money Market Fund 0.31% | 190,570,103 | 11,036,733 | 201,606,829 | 51,504 | (7) | -- | -- |
| Fidelity Series Growth Company Fund | 2,017,702,801 | 1,032,187,816 | 867,636,684 | 521,587,835 | 72,861,103 | (402,765,702) | 1,852,349,334 |
| Fidelity Series High Income Fund | 177,433,089 | 32,300,676 | 37,785,024 | 9,671,641 | (115,014) | (5,349,853) | 166,483,874 |
| Fidelity Series Inflation-Protected Bond Index Fund | 577,049,573 | 42,215,708 | 641,678,545 | 5,406,690 | 53,105,206 | (30,691,942) | -- |
| Fidelity Series International Credit Fund | 11,866,704 | 382,956 | -- | 382,956 | -- | (880,202) | 11,369,458 |
| Fidelity Series International Developed Markets Bond Index Fund | -- | 483,267,622 | 7,611,554 | 132,470 | (100,189) | (19,024,287) | 456,531,592 |
| Fidelity Series International Growth Fund | 1,737,532,532 | 457,628,214 | 278,903,935 | 148,812,269 | 7,136,890 | (154,653,808) | 1,768,739,893 |
| Fidelity Series International Small Cap Fund | 544,024,154 | 93,915,664 | 81,015,025 | 67,833,938 | 13,861,421 | (85,185,336) | 485,600,878 |
| Fidelity Series International Value Fund | 1,736,400,806 | 443,342,449 | 426,079,153 | 93,355,578 | 10,834,133 | 21,849,630 | 1,786,347,865 |
| Fidelity Series Intrinsic Opportunities Fund | 2,025,282,454 | 523,133,981 | 634,587,417 | 340,827,494 | 20,185,715 | (194,086,053) | 1,739,928,680 |
| Fidelity Series Investment Grade Bond Fund | 2,936,866,713 | 1,087,421,543 | 593,132,904 | 70,439,371 | (13,670,062) | (160,799,959) | 3,256,685,331 |
| Fidelity Series Large Cap Stock Fund | 1,770,521,782 | 295,066,175 | 475,837,986 | 157,451,078 | 51,924,415 | 5,679,810 | 1,647,354,196 |
| Fidelity Series Large Cap Value Index Fund | 652,667,781 | 78,302,398 | 142,067,712 | 41,722,979 | 16,180,286 | 14,997,465 | 620,080,218 |
| Fidelity Series Long-Term Treasury Bond Index Fund | 784,569,941 | 954,382,428 | 213,553,649 | 23,242,346 | (29,917,481) | (32,802,557) | 1,462,678,682 |
| Fidelity Series Opportunistic Insights Fund | 1,033,552,678 | 340,551,448 | 349,500,738 | 181,971,652 | 28,525,586 | (104,095,728) | 949,033,246 |
| Fidelity Series Overseas Fund | 1,740,416,996 | 346,703,648 | 308,461,340 | 55,116,517 | 25,161,960 | (25,325,769) | 1,778,495,495 |
| Fidelity Series Real Estate Income Fund | 109,837,753 | 10,171,815 | 22,324,431 | 4,250,285 | 56,399 | 3,003,650 | 100,745,186 |
| Fidelity Series Short-Term Credit Fund | 40,139,745 | 1,536,958 | 41,513,840 | 267,851 | 930,899 | (1,093,762) | -- |
| Fidelity Series Small Cap Discovery Fund | 221,562,014 | 47,137,199 | 50,897,894 | 36,513,917 | 5,344,189 | (19,992,829) | 203,152,679 |
| Fidelity Series Small Cap Opportunities Fund | 741,131,347 | 283,072,891 | 190,350,636 | 184,086,018 | 13,977,243 | (177,424,605) | 670,406,240 |
| Fidelity Series Stock Selector Large Cap Value Fund | 1,496,642,642 | 344,673,323 | 394,771,233 | 254,819,586 | 28,771,956 | (87,707,248) | 1,387,609,440 |
| Fidelity Series Value Discovery Fund | 1,150,972,470 | 200,251,190 | 309,687,033 | 127,203,420 | 36,116,436 | (22,006,666) | 1,055,646,397 |
| | $28,861,121,869 | $9,645,382,835 | $8,700,052,501 | $3,251,276,842 | $414,350,982 | $(2,713,927,022) | $27,506,816,200 |
(a) Includes the value of shares purchased or redeemed through in-kind transactions, if applicable.
Amounts in the income column in the above table include any capital gain distributions from underlying funds, which are presented in the corresponding line-item in the Statement of Operations, if applicable.
Investment Valuation
The following is a summary of the inputs used, as of March 31, 2022, involving the Fund's assets and liabilities carried at fair value. The inputs or methodology used for valuing securities may not be an indication of the risk associated with investing in those securities. For more information on valuation inputs, and their aggregation into the levels used below, please refer to the Investment Valuation section in the accompanying Notes to Financial Statements.
| | Valuation Inputs at Reporting Date: |
| Description | Total | Level 1 | Level 2 | Level 3 |
| Investments in Securities: | | | | |
| Other Short-Term Investments | $9,559,349 | $-- | $9,559,349 | $-- |
| Domestic Equity Funds | 11,732,579,835 | 11,732,579,835 | -- | -- |
| International Equity Funds | 10,077,599,686 | 10,077,599,686 | -- | -- |
| Bond Funds | 5,696,636,679 | 5,696,636,679 | -- | -- |
| Short-Term Funds | 26,072,237 | 26,072,237 | -- | -- |
| Total Investments in Securities: | $27,542,447,786 | $27,532,888,437 | $9,559,349 | $-- |
| Derivative Instruments: | | | | |
| Assets | | | | |
| Futures Contracts | $5,578,794 | $5,578,794 | $-- | $-- |
| Total Assets | $5,578,794 | $5,578,794 | $-- | $-- |
| Liabilities | | | | |
| Futures Contracts | $(1,583,722) | $(1,583,722) | $-- | $-- |
| Total Liabilities | $(1,583,722) | $(1,583,722) | $-- | $-- |
| Total Derivative Instruments: | $3,995,072 | $3,995,072 | $-- | $-- |
Value of Derivative Instruments
The following table is a summary of the Fund's value of derivative instruments by primary risk exposure as of March 31, 2022. For additional information on derivative instruments, please refer to the Derivative Instruments section in the accompanying Notes to Financial Statements.
| Primary Risk Exposure / Derivative Type | Value |
| | Asset | Liability |
| Equity Risk | | |
| Futures Contracts(a) | $5,578,794 | $(1,583,722) |
| Total Equity Risk | 5,578,794 | (1,583,722) |
| Total Value of Derivatives | $5,578,794 | $(1,583,722) |
(a) Reflects gross cumulative appreciation (depreciation) on futures contracts as presented in the Schedule of Investments. In the Statement of Assets and Liabilities, the period end daily variation margin is included in receivable or payable for daily variation margin on futures contracts, and the net cumulative appreciation (depreciation) is included in Total accumulated earnings (loss).
See accompanying notes which are an integral part of the financial statements.
Fidelity Freedom® 2035 Fund
Financial Statements
Statement of Assets and Liabilities
| | | March 31, 2022 |
| Assets | | |
Investment in securities, at value — See accompanying schedule:
Unaffiliated issuers (cost $9,559,124) | $9,559,349 | |
| Fidelity Central Funds (cost $26,071,874) | 26,072,237 | |
| Other affiliated issuers (cost $23,084,502,721) | 27,506,816,200 | |
| Total Investment in Securities (cost $23,120,133,719) | | $27,542,447,786 |
| Receivable for investments sold | | 506,075,542 |
| Receivable for fund shares sold | | 27,355,939 |
| Distributions receivable from Fidelity Central Funds | | 3,831 |
| Other receivables | | 164,480 |
| Total assets | | 28,076,047,578 |
| Liabilities | | |
| Payable for investments purchased | $493,503,986 | |
| Payable for fund shares redeemed | 26,355,771 | |
| Accrued management fee | 14,227,607 | |
| Payable for daily variation margin on futures contracts | 1,573,247 | |
| Other payables and accrued expenses | 164,480 | |
| Total liabilities | | 535,825,091 |
| Net Assets | | $27,540,222,487 |
| Net Assets consist of: | | |
| Paid in capital | | $21,618,526,344 |
| Total accumulated earnings (loss) | | 5,921,696,143 |
| Net Assets | | $27,540,222,487 |
| Net Asset Value and Maximum Offering Price | | |
| Fidelity Freedom 2035 Fund: | | |
| Net Asset Value, offering price and redemption price per share ($11,630,509,075 ÷ 732,028,746 shares) | | $15.89 |
| Class K: | | |
| Net Asset Value, offering price and redemption price per share ($11,216,391,924 ÷ 706,564,920 shares) | | $15.87 |
| Class K6: | | |
| Net Asset Value, offering price and redemption price per share ($4,693,321,488 ÷ 296,279,403 shares) | | $15.84 |
See accompanying notes which are an integral part of the financial statements.
Statement of Operations
| | | Year ended March 31, 2022 |
| Investment Income | | |
| Dividends: | | |
| Affiliated issuers | | $821,939,246 |
| Interest | | 5,468 |
| Income from Fidelity Central Funds | | 10,927 |
| Total income | | 821,955,641 |
| Expenses | | |
| Management fee | $182,915,632 | |
| Independent trustees' fees and expenses | 87,626 | |
| Total expenses | | 183,003,258 |
| Net investment income (loss) | | 638,952,383 |
| Realized and Unrealized Gain (Loss) | | |
| Net realized gain (loss) on: | | |
| Investment securities: | | |
| Unaffiliated issuers | 18,962 | |
| Affiliated issuers | 414,350,982 | |
| Futures contracts | 3,159,822 | |
| Capital gain distributions from underlying funds: | | |
| Affiliated issuers | 2,429,337,596 | |
| Total net realized gain (loss) | | 2,846,867,362 |
| Change in net unrealized appreciation (depreciation) on: | | |
| Investment securities: | | |
| Unaffiliated issuers | 158 | |
| Affiliated issuers | (2,713,927,022) | |
| Futures contracts | 3,995,072 | |
| Total change in net unrealized appreciation (depreciation) | | (2,709,931,792) |
| Net gain (loss) | | 136,935,570 |
| Net increase (decrease) in net assets resulting from operations | | $775,887,953 |
See accompanying notes which are an integral part of the financial statements.
Statement of Changes in Net Assets
| | Year ended March 31, 2022 | Year ended March 31, 2021 |
| Increase (Decrease) in Net Assets | | |
| Operations | | |
| Net investment income (loss) | $638,952,383 | $274,858,567 |
| Net realized gain (loss) | 2,846,867,362 | 1,932,764,844 |
| Change in net unrealized appreciation (depreciation) | (2,709,931,792) | 7,732,814,566 |
| Net increase (decrease) in net assets resulting from operations | 775,887,953 | 9,940,437,977 |
| Distributions to shareholders | (3,186,981,326) | (1,587,673,472) |
| Share transactions - net increase (decrease) | 1,059,713,495 | 903,730,590 |
| Total increase (decrease) in net assets | (1,351,379,878) | 9,256,495,095 |
| Net Assets | | |
| Beginning of period | 28,891,602,365 | 19,635,107,270 |
| End of period | $27,540,222,487 | $28,891,602,365 |
See accompanying notes which are an integral part of the financial statements.
Financial Highlights
Fidelity Freedom 2035 Fund
| Years ended March 31, | 2022 | 2021 | 2020 | 2019 | 2018 |
| Selected Per–Share Data | | | | | |
| Net asset value, beginning of period | $17.36 | $12.21 | $14.42 | $15.20 | $13.88 |
| Income from Investment Operations | | | | | |
| Net investment income (loss)A,B | .37 | .16 | .23 | .21 | .16 |
| Net realized and unrealized gain (loss) | .13 | 5.97 | (1.42) | .01 | 1.81 |
| Total from investment operations | .50 | 6.13 | (1.19) | .22 | 1.97 |
| Distributions from net investment income | (.39) | (.18) | (.23) | (.22) | (.17) |
| Distributions from net realized gain | (1.58) | (.81) | (.79) | (.78) | (.47) |
| Total distributions | (1.97) | (.98)C | (1.02) | (1.00) | (.65)C |
| Net asset value, end of period | $15.89 | $17.36 | $12.21 | $14.42 | $15.20 |
| Total ReturnD | 2.38% | 51.68% | (9.25)% | 1.85% | 14.32% |
| Ratios to Average Net AssetsB,E,F | | | | | |
| Expenses before reductions | .71%G | .72% | .73% | .74% | .63%G |
| Expenses net of fee waivers, if any | .71%G | .72% | .73% | .74% | .63%G |
| Expenses net of all reductions | .71%G | .72% | .73% | .74% | .63%G |
| Net investment income (loss) | 2.14% | 1.02% | 1.57% | 1.41% | 1.06% |
| Supplemental Data | | | | | |
| Net assets, end of period (000 omitted) | $11,630,509 | $11,467,913 | $7,408,043 | $8,247,886 | $8,050,659 |
| Portfolio turnover rateH | 30% | 24% | 31% | 18% | 17%I |
A Calculated based on average shares outstanding during the period.
B Net investment income (loss) is affected by the timing of the declaration of dividends by any underlying mutual funds or exchange-traded funds (ETFs). Net investment income (loss) of any such underlying funds is not included in the Fund's net investment income (loss) ratio.
C Total distributions per share do not sum due to rounding.
D Total returns would have been lower if certain expenses had not been reduced during the applicable periods shown.
E Fees and expenses of any underlying mutual funds or exchange-traded funds (ETFs) are not included in the Fund's expense ratio. The Fund indirectly bears its proportionate share of these expenses. For additional expense information related to investments in Fidelity Central Funds, please refer to the "Investments in Fidelity Central Funds" note found in the Notes to Financial Statements section of the most recent Annual or Semi-Annual report.
F Expense ratios reflect operating expenses of the class. Expenses before reductions do not reflect amounts reimbursed, waived, or reduced through arrangements with the investment adviser, brokerage services, or other offset arrangements, if applicable, and do not represent the amount paid by the class during periods when reimbursements, waivers or reductions occur.
G On certain classes, the size and fluctuation of net assets and expense amounts may cause ratios to differ from contractual rates.
H Amount does not include the portfolio activity of any underlying mutual funds or exchange-traded funds (ETFs).
I The portfolio turnover rate does not include the assets acquired in the merger.
See accompanying notes which are an integral part of the financial statements.
Fidelity Freedom 2035 Fund Class K
| Years ended March 31, | 2022 | 2021 | 2020 | 2019 | 2018 A |
| Selected Per–Share Data | | | | | |
| Net asset value, beginning of period | $17.33 | $12.19 | $14.40 | $15.18 | $14.60 |
| Income from Investment Operations | | | | | |
| Net investment income (loss)B,C | .39 | .17 | .24 | .22 | .22 |
| Net realized and unrealized gain (loss) | .13 | 5.96 | (1.42) | .01 | .82 |
| Total from investment operations | .52 | 6.13 | (1.18) | .23 | 1.04 |
| Distributions from net investment income | (.40) | (.19) | (.24) | (.23) | (.19) |
| Distributions from net realized gain | (1.58) | (.81) | (.79) | (.78) | (.26) |
| Total distributions | (1.98) | (.99)D | (1.03) | (1.01) | (.46)D |
| Net asset value, end of period | $15.87 | $17.33 | $12.19 | $14.40 | $15.18 |
| Total ReturnE,F | 2.49% | 51.80% | (9.19)% | 1.95% | 7.09% |
| Ratios to Average Net AssetsC,G,H | | | | | |
| Expenses before reductions | .61%I | .62% | .63% | .64% | .65%I,J |
| Expenses net of fee waivers, if any | .61%I | .62% | .63% | .64% | .65%I,J |
| Expenses net of all reductions | .61%I | .62% | .63% | .64% | .65%I,J |
| Net investment income (loss) | 2.23% | 1.12% | 1.67% | 1.51% | 2.07%J |
| Supplemental Data | | | | | |
| Net assets, end of period (000 omitted) | $11,216,392 | $13,070,819 | $9,620,448 | $11,661,819 | $12,979,898 |
| Portfolio turnover rateK | 30% | 24% | 31% | 18% | 17%L |
A For the period July 20, 2017 (commencement of sale of shares) through March 31, 2018.
B Calculated based on average shares outstanding during the period.
C Net investment income (loss) is affected by the timing of the declaration of dividends by any underlying mutual funds or exchange-traded funds (ETFs). Net investment income (loss) of any such underlying funds is not included in the Fund's net investment income (loss) ratio.
D Total distributions per share do not sum due to rounding.
E Total returns for periods of less than one year are not annualized.
F Total returns would have been lower if certain expenses had not been reduced during the applicable periods shown.
G Fees and expenses of any underlying mutual funds or exchange-traded funds (ETFs) are not included in the Fund's expense ratio. The Fund indirectly bears its proportionate share of these expenses. For additional expense information related to investments in Fidelity Central Funds, please refer to the "Investments in Fidelity Central Funds" note found in the Notes to Financial Statements section of the most recent Annual or Semi-Annual report.
H Expense ratios reflect operating expenses of the class. Expenses before reductions do not reflect amounts reimbursed, waived, or reduced through arrangements with the investment adviser, brokerage services, or other offset arrangements, if applicable, and do not represent the amount paid by the class during periods when reimbursements, waivers or reductions occur.
I On certain classes, the size and fluctuation of net assets and expense amounts may cause ratios to differ from contractual rates.
J Annualized
K Amount does not include the portfolio activity of any underlying mutual funds or exchange-traded funds (ETFs).
L The portfolio turnover rate does not include the assets acquired in the merger.
See accompanying notes which are an integral part of the financial statements.
Fidelity Freedom 2035 Fund Class K6
| Years ended March 31, | 2022 | 2021 | 2020 | 2019 | 2018 A |
| Selected Per–Share Data | | | | | |
| Net asset value, beginning of period | $17.31 | $12.17 | $14.39 | $15.20 | $14.30 |
| Income from Investment Operations | | | | | |
| Net investment income (loss)B,C | .41 | .19 | .26 | .24 | .20 |
| Net realized and unrealized gain (loss) | .12 | 5.97 | (1.42) | .01 | 1.16 |
| Total from investment operations | .53 | 6.16 | (1.16) | .25 | 1.36 |
| Distributions from net investment income | (.43) | (.21) | (.26) | (.27) | (.20) |
| Distributions from net realized gain | (1.58) | (.82) | (.80) | (.79) | (.26) |
| Total distributions | (2.00)D | (1.02)D | (1.06) | (1.06) | (.46) |
| Net asset value, end of period | $15.84 | $17.31 | $12.17 | $14.39 | $15.20 |
| Total ReturnE,F | 2.60% | 52.14% | (9.08)% | 2.10% | 9.50% |
| Ratios to Average Net AssetsC,G,H | | | | | |
| Expenses before reductions | .48% | .48% | .49% | .49% | .50%I,J |
| Expenses net of fee waivers, if any | .48% | .48% | .49% | .49% | .50%I,J |
| Expenses net of all reductions | .48% | .48% | .49% | .49% | .50%I,J |
| Net investment income (loss) | 2.37% | 1.26% | 1.82% | 1.65% | 1.61%I |
| Supplemental Data | | | | | |
| Net assets, end of period (000 omitted) | $4,693,321 | $4,352,870 | $2,606,617 | $2,217,206 | $712,276 |
| Portfolio turnover rateK | 30% | 24% | 31% | 18% | 17%L |
A For the period June 7, 2017 (commencement of sale of shares) through March 31, 2018.
B Calculated based on average shares outstanding during the period.
C Net investment income (loss) is affected by the timing of the declaration of dividends by any underlying mutual funds or exchange-traded funds (ETFs). Net investment income (loss) of any such underlying funds is not included in the Fund's net investment income (loss) ratio.
D Total distributions per share do not sum due to rounding.
E Total returns for periods of less than one year are not annualized.
F Total returns would have been lower if certain expenses had not been reduced during the applicable periods shown.
G Fees and expenses of any underlying mutual funds or exchange-traded funds (ETFs) are not included in the Fund's expense ratio. The Fund indirectly bears its proportionate share of these expenses. For additional expense information related to investments in Fidelity Central Funds, please refer to the "Investments in Fidelity Central Funds" note found in the Notes to Financial Statements section of the most recent Annual or Semi-Annual report.
H Expense ratios reflect operating expenses of the class. Expenses before reductions do not reflect amounts reimbursed, waived, or reduced through arrangements with the investment adviser, brokerage services, or other offset arrangements, if applicable, and do not represent the amount paid by the class during periods when reimbursements, waivers or reductions occur.
I Annualized
J On certain classes, the size and fluctuation of net assets and expense amounts may cause ratios to differ from contractual rates.
K Amount does not include the portfolio activity of any underlying mutual funds or exchange-traded funds (ETFs).
L The portfolio turnover rate does not include the assets acquired in the merger.
See accompanying notes which are an integral part of the financial statements.
Fidelity Freedom® 2040 Fund
Investment Summary (Unaudited)
The information in the following tables is based on the direct investments of the Fund.
Top Holdings as of March 31, 2022
| | % of fund's net assets |
| Fidelity Series Emerging Markets Opportunities Fund | 12.6 |
| Fidelity Series Growth Company Fund | 7.9 |
| Fidelity Series Intrinsic Opportunities Fund | 7.5 |
| Fidelity Series International Value Fund | 7.4 |
| Fidelity Series Overseas Fund | 7.4 |
| Fidelity Series International Growth Fund | 7.4 |
| Fidelity Series Large Cap Stock Fund | 7.0 |
| Fidelity Series Stock Selector Large Cap Value Fund | 5.9 |
| Fidelity Series Long-Term Treasury Bond Index Fund | 5.3 |
| Fidelity Series Value Discovery Fund | 4.5 |
| | 72.9 |
Asset Allocation (% of fund's net assets)
| Period end |
| | Domestic Equity Funds | 49.9% |
| | International Equity Funds | 41.4% |
| | Bond Funds | 8.5% |
| | Short-Term Funds | 0.1% |
| | Short-Term Investments | 0.1% |

Domestic Equity Funds category includes Fidelity Series Commodity Strategy Fund which invests in commodity-related investments.
Fidelity Freedom® 2040 Fund
Schedule of Investments March 31, 2022
Showing Percentage of Net Assets
| U.S. Treasury Obligations - 0.1% | | | |
| | | Principal Amount | Value |
| U.S. Treasury Bills, yield at date of purchase 0.12% to 0.17% 4/14/22 to 4/21/22 (a) | | | |
| (Cost $14,258,776) | | 14,260,000 | 14,259,058 |
| | | Shares | Value |
|
| Domestic Equity Funds - 49.9% | | | |
| Fidelity Series All-Sector Equity Fund (b) | | 50,109,890 | $540,184,615 |
| Fidelity Series Blue Chip Growth Fund (b) | | 61,710,705 | 886,782,833 |
| Fidelity Series Commodity Strategy Fund (b) | | 80,861,822 | 413,203,908 |
| Fidelity Series Growth Company Fund (b) | | 121,524,434 | 2,210,529,456 |
| Fidelity Series Intrinsic Opportunities Fund (b) | | 105,773,652 | 2,080,567,734 |
| Fidelity Series Large Cap Stock Fund (b) | | 103,413,688 | 1,965,894,214 |
| Fidelity Series Large Cap Value Index Fund (b) | | 48,178,973 | 740,029,020 |
| Fidelity Series Opportunistic Insights Fund (b) | | 61,952,450 | 1,132,490,794 |
| Fidelity Series Small Cap Discovery Fund (b) | | 17,974,266 | 240,675,419 |
| Fidelity Series Small Cap Opportunities Fund (b) | | 58,739,253 | 800,028,623 |
| Fidelity Series Stock Selector Large Cap Value Fund (b) | | 122,205,044 | 1,655,878,341 |
| Fidelity Series Value Discovery Fund (b) | | 78,736,015 | 1,259,776,239 |
| TOTAL DOMESTIC EQUITY FUNDS | | | |
| (Cost $10,275,566,270) | | | 13,926,041,196 |
|
| International Equity Funds - 41.4% | | | |
| Fidelity Series Canada Fund (b) | | 57,945,883 | 899,320,097 |
| Fidelity Series Emerging Markets Fund (b) | | 41,061,759 | 381,053,128 |
| Fidelity Series Emerging Markets Opportunities Fund (b) | | 191,142,616 | 3,517,024,138 |
| Fidelity Series International Growth Fund (b) | | 124,017,821 | 2,056,215,468 |
| Fidelity Series International Small Cap Fund (b) | | 31,380,587 | 563,281,544 |
| Fidelity Series International Value Fund (b) | | 188,263,164 | 2,076,542,702 |
| Fidelity Series Overseas Fund (b) | | 163,818,079 | 2,067,384,156 |
| TOTAL INTERNATIONAL EQUITY FUNDS | | | |
| (Cost $9,853,655,309) | | | 11,560,821,233 |
|
| Bond Funds - 8.5% | | | |
| Fidelity Series 5+ Year Inflation-Protected Bond Index Fund (b) | | 2,907,192 | 27,909,039 |
| Fidelity Series Emerging Markets Debt Fund (b) | | 16,998,377 | 140,236,608 |
| Fidelity Series Emerging Markets Debt Local Currency Fund (b) | | 5,130,423 | 46,225,110 |
| Fidelity Series Floating Rate High Income Fund (b) | | 3,039,792 | 27,935,687 |
| Fidelity Series High Income Fund (b) | | 18,717,904 | 170,145,746 |
| Fidelity Series International Credit Fund (b) | | 1,193,577 | 11,052,520 |
| Fidelity Series International Developed Markets Bond Index Fund (b) | | 489,793 | 4,569,771 |
| Fidelity Series Investment Grade Bond Fund (b) | | 32,659,858 | 356,319,055 |
| Fidelity Series Long-Term Treasury Bond Index Fund (b) | | 195,485,642 | 1,489,600,593 |
| Fidelity Series Real Estate Income Fund (b) | | 8,964,935 | 101,841,659 |
| TOTAL BOND FUNDS | | | |
| (Cost $2,546,520,248) | | | 2,375,835,788 |
|
| Short-Term Funds - 0.1% | | | |
| Fidelity Cash Central Fund 0.31% (c) | | | |
| (Cost $22,630,571) | | 22,626,462 | 22,630,988 |
| TOTAL INVESTMENT IN SECURITIES - 100.0% | | | |
| (Cost $22,712,631,174) | | | 27,899,588,263 |
| NET OTHER ASSETS (LIABILITIES) - 0.0% | | | (1,767,328) |
| NET ASSETS - 100% | | | $27,897,820,935 |
| Futures Contracts | | | | | |
| | Number of contracts | Expiration Date | Notional Amount | Value | Unrealized Appreciation/(Depreciation) |
| Purchased | | | | | |
| Equity Index Contracts | | | | | |
| ICE E-mini MSCI EAFE Index Contracts (United States) | 663 | June 2022 | $71,086,860 | $3,026,186 | $3,026,186 |
| ICE E-mini MSCI Emerging Markets Index Contracts (United States) | 2,035 | June 2022 | 114,519,625 | 2,331,484 | 2,331,484 |
| TOTAL PURCHASED | | | | | $5,357,670 |
| Sold | | | | | |
| Equity Index Contracts | | | | | |
| CME Micro E-mini S&P 500 Index Contracts (United States) | 685 | June 2022 | 155,178,188 | (3,538,893) | (3,538,893) |
| TOTAL FUTURES CONTRACTS | | | | | $1,818,777 |
The notional amount of futures purchased as a percentage of Net Assets is 0.7%
The notional amount of futures sold as a percentage of Net Assets is 0.6%
Legend
(a) Security or a portion of the security was pledged to cover margin requirements for futures contracts. At period end, the value of securities pledged amounted to $8,565,417.
(b) Affiliated Fund
(c) Affiliated fund that is generally available only to investment companies and other accounts managed by Fidelity Investments. The rate quoted is the annualized seven-day yield of the fund at period end. A complete unaudited listing of the fund's holdings as of its most recent quarter end is available upon request. In addition, each Fidelity Central Fund's financial statements, which are not covered by the Fund's Report of Independent Registered Public Accounting Firm, are available on the SEC's website or upon request.
Affiliated Central Funds
Fiscal year to date information regarding the Fund's investments in Fidelity Central Funds, including the ownership percentage, is presented below.
| Fund | Value, beginning of period | Purchases | Sales Proceeds | Dividend Income | Realized Gain/Loss | Change in Unrealized appreciation (depreciation) | Value, end of period | % ownership, end of period |
| Fidelity Cash Central Fund 0.31% | $11,494,556 | $107,329,510 | $96,193,078 | $10,505 | $-- | $-- | $22,630,988 | 0.0% |
| Total | $11,494,556 | $107,329,510 | $96,193,078 | $10,505 | $-- | $-- | $22,630,988 | |
Amounts in the income column in the above table include any capital gain distributions from underlying funds, which are presented in the corresponding line-item in the Statement of Operations, if applicable.
Affiliated Underlying Funds
Fiscal year to date information regarding the Fund's investments in affiliated Underlying Funds is presented below. Exchanges between classes of the same affiliated Underlying Funds may occur. If an underlying Fund changes its name, the name presented below is the name in effect at period end.
| Fund | Value, beginning of period | Purchases(a) | Sales Proceeds(a) | Dividend Income | Realized Gain (loss) | Change in Unrealized appreciation (depreciation) | Value, end of period |
| Fidelity Series 0-5 Year Inflation-Protected Bond Index Fund | $-- | $128,622,012 | $128,104,400 | $408,166 | $(456,844) | $-- | $-- |
| Fidelity Series 5+ Year Inflation-Protected Bond Index Fund | -- | 250,827,123 | 213,183,294 | 1,286,049 | (8,891,799) | (842,991) | 27,909,039 |
| Fidelity Series All-Sector Equity Fund | 573,944,243 | 149,639,715 | 145,892,202 | 108,876,277 | 10,974,433 | (48,481,574) | 540,184,615 |
| Fidelity Series Blue Chip Growth Fund | 910,539,429 | 424,934,233 | 308,616,183 | 188,697,848 | 15,050,662 | (155,125,308) | 886,782,833 |
| Fidelity Series Canada Fund | 704,757,720 | 174,830,964 | 133,545,619 | 18,315,875 | 4,855,469 | 148,421,563 | 899,320,097 |
| Fidelity Series Commodity Strategy Fund | 804,669,530 | 290,280,502 | 712,281,943 | 247,740,827 | (29,377,408) | 59,913,227 | 413,203,908 |
| Fidelity Series Emerging Markets Debt Fund | 157,199,368 | 22,611,904 | 25,477,182 | 7,128,037 | (1,224,667) | (12,872,815) | 140,236,608 |
| Fidelity Series Emerging Markets Debt Local Currency Fund | 51,094,033 | 9,487,181 | 9,115,759 | 1,994,211 | (421,866) | (4,818,479) | 46,225,110 |
| Fidelity Series Emerging Markets Fund | 461,198,780 | 92,266,861 | 80,198,589 | 13,782,420 | 4,403,812 | (96,617,736) | 381,053,128 |
| Fidelity Series Emerging Markets Opportunities Fund | 4,163,415,643 | 1,287,050,508 | 735,795,464 | 435,241,498 | 54,623,658 | (1,252,270,207) | 3,517,024,138 |
| Fidelity Series Floating Rate High Income Fund | 30,146,999 | 3,097,168 | 5,325,349 | 1,253,255 | (250,872) | 267,741 | 27,935,687 |
| Fidelity Series Government Money Market Fund 0.31% | 192,203,651 | 17,748,995 | 209,952,646 | 41,777 | -- | -- | -- |
| Fidelity Series Growth Company Fund | 2,323,775,741 | 1,214,509,923 | 932,899,281 | 614,417,876 | 71,509,984 | (466,366,911) | 2,210,529,456 |
| Fidelity Series High Income Fund | 180,560,165 | 24,672,983 | 29,712,718 | 9,690,127 | (307,939) | (5,066,745) | 170,145,746 |
| Fidelity Series Inflation-Protected Bond Index Fund | 577,866,254 | 47,194,804 | 647,627,499 | 5,606,628 | 52,476,330 | (29,909,889) | -- |
| Fidelity Series International Credit Fund | 11,535,904 | 372,281 | -- | 372,281 | -- | (855,665) | 11,052,520 |
| Fidelity Series International Developed Markets Bond Index Fund | -- | 5,035,108 | 286,671 | 2,051 | (3,415) | (175,251) | 4,569,771 |
| Fidelity Series International Growth Fund | 1,974,852,247 | 504,565,151 | 250,345,795 | 171,672,642 | 2,531,019 | (175,387,154) | 2,056,215,468 |
| Fidelity Series International Small Cap Fund | 620,028,461 | 109,639,730 | 84,082,318 | 78,124,504 | 8,732,064 | (91,036,393) | 563,281,544 |
| Fidelity Series International Value Fund | 1,974,264,607 | 518,809,154 | 453,038,349 | 107,784,136 | 9,003,485 | 27,503,805 | 2,076,542,702 |
| Fidelity Series Intrinsic Opportunities Fund | 2,332,742,578 | 641,198,300 | 685,632,185 | 401,225,381 | 10,696,897 | (218,437,856) | 2,080,567,734 |
| Fidelity Series Investment Grade Bond Fund | 11,978,817 | 442,544,554 | 86,981,072 | 1,647,055 | (935,695) | (10,287,549) | 356,319,055 |
| Fidelity Series Large Cap Stock Fund | 2,039,274,385 | 331,882,007 | 470,819,755 | 184,986,555 | 39,291,232 | 26,266,345 | 1,965,894,214 |
| Fidelity Series Large Cap Value Index Fund | 751,745,003 | 99,515,252 | 146,797,537 | 49,301,087 | 12,602,121 | 22,964,181 | 740,029,020 |
| Fidelity Series Long-Term Treasury Bond Index Fund | 792,952,982 | 975,215,679 | 214,648,495 | 23,438,080 | (30,067,133) | (33,852,440) | 1,489,600,593 |
| Fidelity Series Opportunistic Insights Fund | 1,190,385,340 | 405,455,578 | 371,025,928 | 214,995,438 | 29,442,363 | (121,766,559) | 1,132,490,794 |
| Fidelity Series Overseas Fund | 1,978,115,516 | 378,349,895 | 285,956,891 | 63,506,829 | 14,049,651 | (17,174,015) | 2,067,384,156 |
| Fidelity Series Real Estate Income Fund | 110,784,694 | 7,813,974 | 19,943,975 | 4,284,354 | 146,962 | 3,040,004 | 101,841,659 |
| Fidelity Series Short-Term Credit Fund | 40,486,799 | 1,898,507 | 42,386,663 | 189,506 | 893,552 | (892,195) | -- |
| Fidelity Series Small Cap Discovery Fund | 255,189,289 | 55,501,409 | 52,505,093 | 42,797,581 | 5,042,865 | (22,553,051) | 240,675,419 |
| Fidelity Series Small Cap Opportunities Fund | 853,415,979 | 324,224,935 | 184,316,026 | 216,547,706 | 10,383,262 | (203,679,527) | 800,028,623 |
| Fidelity Series Stock Selector Large Cap Value Fund | 1,723,856,427 | 424,369,001 | 419,346,561 | 301,353,165 | 24,061,309 | (97,061,835) | 1,655,878,341 |
| Fidelity Series Value Discovery Fund | 1,325,695,634 | 250,772,280 | 330,513,453 | 150,441,497 | 30,875,585 | (17,053,807) | 1,259,776,239 |
| | $29,118,676,218 | $9,614,937,671 | $8,416,354,895 | $3,667,150,719 | $339,709,077 | $(2,794,209,086) | $27,862,698,217 |
(a) Includes the value of shares purchased or redeemed through in-kind transactions, if applicable.
Amounts in the income column in the above table include any capital gain distributions from underlying funds, which are presented in the corresponding line-item in the Statement of Operations, if applicable.
Investment Valuation
The following is a summary of the inputs used, as of March 31, 2022, involving the Fund's assets and liabilities carried at fair value. The inputs or methodology used for valuing securities may not be an indication of the risk associated with investing in those securities. For more information on valuation inputs, and their aggregation into the levels used below, please refer to the Investment Valuation section in the accompanying Notes to Financial Statements.
| | Valuation Inputs at Reporting Date: |
| Description | Total | Level 1 | Level 2 | Level 3 |
| Investments in Securities: | | | | |
| Other Short-Term Investments | $14,259,058 | $-- | $14,259,058 | $-- |
| Domestic Equity Funds | 13,926,041,196 | 13,926,041,196 | -- | -- |
| International Equity Funds | 11,560,821,233 | 11,560,821,233 | -- | -- |
| Bond Funds | 2,375,835,788 | 2,375,835,788 | -- | -- |
| Short-Term Funds | 22,630,988 | 22,630,988 | -- | -- |
| Total Investments in Securities: | $27,899,588,263 | $27,885,329,205 | $14,259,058 | $-- |
| Derivative Instruments: | | | | |
| Assets | | | | |
| Futures Contracts | $5,357,670 | $5,357,670 | $-- | $-- |
| Total Assets | $5,357,670 | $5,357,670 | $-- | $-- |
| Liabilities | | | | |
| Futures Contracts | $(3,538,893) | $(3,538,893) | $-- | $-- |
| Total Liabilities | $(3,538,893) | $(3,538,893) | $-- | $-- |
| Total Derivative Instruments: | $1,818,777 | $1,818,777 | $-- | $-- |
Value of Derivative Instruments
The following table is a summary of the Fund's value of derivative instruments by primary risk exposure as of March 31, 2022. For additional information on derivative instruments, please refer to the Derivative Instruments section in the accompanying Notes to Financial Statements.
| Primary Risk Exposure / Derivative Type | Value |
| | Asset | Liability |
| Equity Risk | | |
| Futures Contracts(a) | $5,357,670 | $(3,538,893) |
| Total Equity Risk | 5,357,670 | (3,538,893) |
| Total Value of Derivatives | $5,357,670 | $(3,538,893) |
(a) Reflects gross cumulative appreciation (depreciation) on futures contracts as presented in the Schedule of Investments. In the Statement of Assets and Liabilities, the period end daily variation margin is included in receivable or payable for daily variation margin on futures contracts, and the net cumulative appreciation (depreciation) is included in Total accumulated earnings (loss).
See accompanying notes which are an integral part of the financial statements.
Fidelity Freedom® 2040 Fund
Financial Statements
Statement of Assets and Liabilities
| | | March 31, 2022 |
| Assets | | |
Investment in securities, at value — See accompanying schedule:
Unaffiliated issuers (cost $14,258,776) | $14,259,058 | |
| Fidelity Central Funds (cost $22,630,571) | 22,630,988 | |
| Other affiliated issuers (cost $22,675,741,827) | 27,862,698,217 | |
| Total Investment in Securities (cost $22,712,631,174) | | $27,899,588,263 |
| Receivable for investments sold | | 441,459,861 |
| Receivable for fund shares sold | | 28,584,987 |
| Distributions receivable from Fidelity Central Funds | | 3,457 |
| Other receivables | | 142,228 |
| Total assets | | 28,369,778,796 |
| Liabilities | | |
| Payable for investments purchased | $427,475,435 | |
| Payable for fund shares redeemed | 28,213,889 | |
| Accrued management fee | 15,005,902 | |
| Payable for daily variation margin on futures contracts | 1,120,407 | |
| Other payables and accrued expenses | 142,228 | |
| Total liabilities | | 471,957,861 |
| Net Assets | | $27,897,820,935 |
| Net Assets consist of: | | |
| Paid in capital | | $20,988,190,162 |
| Total accumulated earnings (loss) | | 6,909,630,773 |
| Net Assets | | $27,897,820,935 |
| Net Asset Value and Maximum Offering Price | | |
| Fidelity Freedom 2040 Fund: | | |
| Net Asset Value, offering price and redemption price per share ($11,819,798,617 ÷ 1,035,533,027 shares) | | $11.41 |
| Class K: | | |
| Net Asset Value, offering price and redemption price per share ($11,362,815,785 ÷ 995,126,399 shares) | | $11.42 |
| Class K6: | | |
| Net Asset Value, offering price and redemption price per share ($4,715,206,533 ÷ 414,588,306 shares) | | $11.37 |
See accompanying notes which are an integral part of the financial statements.
Statement of Operations
| | | Year ended March 31, 2022 |
| Investment Income | | |
| Dividends: | | |
| Affiliated issuers | | $830,416,818 |
| Interest | | 6,778 |
| Income from Fidelity Central Funds | | 10,505 |
| Total income | | 830,434,101 |
| Expenses | | |
| Management fee | $193,998,389 | |
| Independent trustees' fees and expenses | 88,772 | |
| Total expenses before reductions | 194,087,161 | |
| Expense reductions | (2) | |
| Total expenses after reductions | | 194,087,159 |
| Net investment income (loss) | | 636,346,942 |
| Realized and Unrealized Gain (Loss) | | |
| Net realized gain (loss) on: | | |
| Investment securities: | | |
| Unaffiliated issuers | 20,043 | |
| Affiliated issuers | 339,709,077 | |
| Futures contracts | 963,033 | |
| Capital gain distributions from underlying funds: | | |
| Affiliated issuers | 2,836,733,901 | |
| Total net realized gain (loss) | | 3,177,426,054 |
| Change in net unrealized appreciation (depreciation) on: | | |
| Investment securities: | | |
| Unaffiliated issuers | 214 | |
| Affiliated issuers | (2,794,209,086) | |
| Futures contracts | 1,818,777 | |
| Total change in net unrealized appreciation (depreciation) | | (2,792,390,095) |
| Net gain (loss) | | 385,035,959 |
| Net increase (decrease) in net assets resulting from operations | | $1,021,382,901 |
See accompanying notes which are an integral part of the financial statements.
Statement of Changes in Net Assets
| | Year ended March 31, 2022 | Year ended March 31, 2021 |
| Increase (Decrease) in Net Assets | | |
| Operations | | |
| Net investment income (loss) | $636,346,942 | $257,448,605 |
| Net realized gain (loss) | 3,177,426,054 | 1,963,562,242 |
| Change in net unrealized appreciation (depreciation) | (2,792,390,095) | 8,625,456,449 |
| Net increase (decrease) in net assets resulting from operations | 1,021,382,901 | 10,846,467,296 |
| Distributions to shareholders | (3,362,328,295) | (1,531,402,987) |
| Share transactions - net increase (decrease) | 1,097,523,194 | 473,223,214 |
| Total increase (decrease) in net assets | (1,243,422,200) | 9,788,287,523 |
| Net Assets | | |
| Beginning of period | 29,141,243,135 | 19,352,955,612 |
| End of period | $27,897,820,935 | $29,141,243,135 |
See accompanying notes which are an integral part of the financial statements.
Financial Highlights
Fidelity Freedom 2040 Fund
| Years ended March 31, | 2022 | 2021 | 2020 | 2019 | 2018 |
| Selected Per–Share Data | | | | | |
| Net asset value, beginning of period | $12.43 | $8.40 | $10.09 | $10.67 | $9.74 |
| Income from Investment Operations | | | | | |
| Net investment income (loss)A,B | .26 | .10 | .15 | .14 | .11 |
| Net realized and unrealized gain (loss) | .19 | 4.60 | (1.13) | –C | 1.29 |
| Total from investment operations | .45 | 4.70 | (.98) | .14 | 1.40 |
| Distributions from net investment income | (.28) | (.12) | (.16) | (.15) | (.12) |
| Distributions from net realized gain | (1.20) | (.54) | (.55) | (.57) | (.35) |
| Total distributions | (1.47)D | (.67)D | (.71) | (.72) | (.47) |
| Net asset value, end of period | $11.41 | $12.43 | $8.40 | $10.09 | $10.67 |
| Total ReturnE | 3.14% | 57.59% | (10.80)% | 1.79% | 14.52% |
| Ratios to Average Net AssetsB,F,G | | | | | |
| Expenses before reductions | .75% | .75% | .75% | .75% | .63%H |
| Expenses net of fee waivers, if any | .75% | .75% | .75% | .75% | .63%H |
| Expenses net of all reductions | .75% | .75% | .75% | .75% | .63%H |
| Net investment income (loss) | 2.09% | .95% | 1.52% | 1.36% | 1.04% |
| Supplemental Data | | | | | |
| Net assets, end of period (000 omitted) | $11,819,799 | $11,610,621 | $7,378,482 | $8,404,848 | $8,285,660 |
| Portfolio turnover rateI | 29% | 22% | 28% | 17% | 16%J |
A Calculated based on average shares outstanding during the period.
B Net investment income (loss) is affected by the timing of the declaration of dividends by any underlying mutual funds or exchange-traded funds (ETFs). Net investment income (loss) of any such underlying funds is not included in the Fund's net investment income (loss) ratio.
C Amount represents less than $.005 per share.
D Total distributions per share do not sum due to rounding.
E Total returns would have been lower if certain expenses had not been reduced during the applicable periods shown.
F Fees and expenses of any underlying mutual funds or exchange-traded funds (ETFs) are not included in the Fund's expense ratio. The Fund indirectly bears its proportionate share of these expenses. For additional expense information related to investments in Fidelity Central Funds, please refer to the "Investments in Fidelity Central Funds" note found in the Notes to Financial Statements section of the most recent Annual or Semi-Annual report.
G Expense ratios reflect operating expenses of the class. Expenses before reductions do not reflect amounts reimbursed, waived, or reduced through arrangements with the investment adviser, brokerage services, or other offset arrangements, if applicable, and do not represent the amount paid by the class during periods when reimbursements, waivers or reductions occur.
H On certain classes, the size and fluctuation of net assets and expense amounts may cause ratios to differ from contractual rates.
I Amount does not include the portfolio activity of any underlying mutual funds or exchange-traded funds (ETFs).
J The portfolio turnover rate does not include the assets acquired in the merger.
See accompanying notes which are an integral part of the financial statements.
Fidelity Freedom 2040 Fund Class K
| Years ended March 31, | 2022 | 2021 | 2020 | 2019 | 2018 A |
| Selected Per–Share Data | | | | | |
| Net asset value, beginning of period | $12.42 | $8.39 | $10.08 | $10.66 | $10.25 |
| Income from Investment Operations | | | | | |
| Net investment income (loss)B,C | .27 | .11 | .16 | .15 | .15 |
| Net realized and unrealized gain (loss) | .21 | 4.59 | (1.13) | –D | .59 |
| Total from investment operations | .48 | 4.70 | (.97) | .15 | .74 |
| Distributions from net investment income | (.28) | (.13) | (.17) | (.16) | (.14) |
| Distributions from net realized gain | (1.20) | (.54) | (.55) | (.57) | (.19) |
| Total distributions | (1.48) | (.67) | (.72) | (.73) | (.33) |
| Net asset value, end of period | $11.42 | $12.42 | $8.39 | $10.08 | $10.66 |
| Total ReturnE,F | 3.36% | 57.77% | (10.76)% | 1.87% | 7.21% |
| Ratios to Average Net AssetsC,G,H | | | | | |
| Expenses before reductions | .64%I | .64% | .64% | .64% | .65%I,J |
| Expenses net of fee waivers, if any | .64%I | .64% | .64% | .64% | .65%I,J |
| Expenses net of all reductions | .64%I | .64% | .64% | .64% | .65%I,J |
| Net investment income (loss) | 2.20% | 1.05% | 1.62% | 1.46% | 2.06%J |
| Supplemental Data | | | | | |
| Net assets, end of period (000 omitted) | $11,362,816 | $13,396,654 | $9,581,184 | $11,994,623 | $13,434,642 |
| Portfolio turnover rateK | 29% | 22% | 28% | 17% | 16%L |
A For the period July 20, 2017 (commencement of sale of shares) through March 31, 2018.
B Calculated based on average shares outstanding during the period.
C Net investment income (loss) is affected by the timing of the declaration of dividends by any underlying mutual funds or exchange-traded funds (ETFs). Net investment income (loss) of any such underlying funds is not included in the Fund's net investment income (loss) ratio.
D Amount represents less than $.005 per share.
E Total returns for periods of less than one year are not annualized.
F Total returns would have been lower if certain expenses had not been reduced during the applicable periods shown.
G Fees and expenses of any underlying mutual funds or exchange-traded funds (ETFs) are not included in the Fund's expense ratio. The Fund indirectly bears its proportionate share of these expenses. For additional expense information related to investments in Fidelity Central Funds, please refer to the "Investments in Fidelity Central Funds" note found in the Notes to Financial Statements section of the most recent Annual or Semi-Annual report.
H Expense ratios reflect operating expenses of the class. Expenses before reductions do not reflect amounts reimbursed, waived, or reduced through arrangements with the investment adviser, brokerage services, or other offset arrangements, if applicable, and do not represent the amount paid by the class during periods when reimbursements, waivers or reductions occur.
I On certain classes, the size and fluctuation of net assets and expense amounts may cause ratios to differ from contractual rates.
J Annualized
K Amount does not include the portfolio activity of any underlying mutual funds or exchange-traded funds (ETFs).
L The portfolio turnover rate does not include the assets acquired in the merger.
See accompanying notes which are an integral part of the financial statements.
Fidelity Freedom 2040 Fund Class K6
| Years ended March 31, | 2022 | 2021 | 2020 | 2019 | 2018 A |
| Selected Per–Share Data | | | | | |
| Net asset value, beginning of period | $12.38 | $8.37 | $10.06 | $10.66 | $10.03 |
| Income from Investment Operations | | | | | |
| Net investment income (loss)B,C | .29 | .13 | .18 | .16 | .13 |
| Net realized and unrealized gain (loss) | .20 | 4.57 | (1.13) | .01 | .83 |
| Total from investment operations | .49 | 4.70 | (.95) | .17 | .96 |
| Distributions from net investment income | (.31) | (.15) | (.18) | (.19) | (.14) |
| Distributions from net realized gain | (1.20) | (.55) | (.56) | (.58) | (.19) |
| Total distributions | (1.50)D | (.69)D | (.74) | (.77) | (.33) |
| Net asset value, end of period | $11.37 | $12.38 | $8.37 | $10.06 | $10.66 |
| Total ReturnE,F | 3.47% | 57.95% | (10.58)% | 2.06% | 9.60% |
| Ratios to Average Net AssetsC,G,H | | | | | |
| Expenses before reductions | .49%I | .49% | .49% | .50%I | .50%I,J |
| Expenses net of fee waivers, if any | .49%I | .49% | .49% | .50%I | .50%I,J |
| Expenses net of all reductions | .49%I | .49% | .49% | .50%I | .50%I,J |
| Net investment income (loss) | 2.35% | 1.20% | 1.77% | 1.61% | 1.55%J |
| Supplemental Data | | | | | |
| Net assets, end of period (000 omitted) | $4,715,207 | $4,133,969 | $2,393,289 | $2,035,487 | $652,451 |
| Portfolio turnover rateK | 29% | 22% | 28% | 17% | 16%L |
A For the period June 7, 2017 (commencement of sale of shares) through March 31, 2018.
B Calculated based on average shares outstanding during the period.
C Net investment income (loss) is affected by the timing of the declaration of dividends by any underlying mutual funds or exchange-traded funds (ETFs). Net investment income (loss) of any such underlying funds is not included in the Fund's net investment income (loss) ratio.
D Total distributions per share do not sum due to rounding.
E Total returns for periods of less than one year are not annualized.
F Total returns would have been lower if certain expenses had not been reduced during the applicable periods shown.
G Fees and expenses of any underlying mutual funds or exchange-traded funds (ETFs) are not included in the Fund's expense ratio. The Fund indirectly bears its proportionate share of these expenses. For additional expense information related to investments in Fidelity Central Funds, please refer to the "Investments in Fidelity Central Funds" note found in the Notes to Financial Statements section of the most recent Annual or Semi-Annual report.
H Expense ratios reflect operating expenses of the class. Expenses before reductions do not reflect amounts reimbursed, waived, or reduced through arrangements with the investment adviser, brokerage services, or other offset arrangements, if applicable, and do not represent the amount paid by the class during periods when reimbursements, waivers or reductions occur.
I On certain classes, the size and fluctuation of net assets and expense amounts may cause ratios to differ from contractual rates.
J Annualized
K Amount does not include the portfolio activity of any underlying mutual funds or exchange-traded funds (ETFs).
L The portfolio turnover rate does not include the assets acquired in the merger.
See accompanying notes which are an integral part of the financial statements.
Fidelity Freedom® 2045 Fund
Investment Summary (Unaudited)
The information in the following tables is based on the direct investments of the Fund.
Top Holdings as of March 31, 2022
| | % of fund's net assets |
| Fidelity Series Emerging Markets Opportunities Fund | 12.7 |
| Fidelity Series Growth Company Fund | 8.0 |
| Fidelity Series Intrinsic Opportunities Fund | 7.5 |
| Fidelity Series International Value Fund | 7.5 |
| Fidelity Series Overseas Fund | 7.5 |
| Fidelity Series International Growth Fund | 7.4 |
| Fidelity Series Large Cap Stock Fund | 7.1 |
| Fidelity Series Stock Selector Large Cap Value Fund | 6.0 |
| Fidelity Series Long-Term Treasury Bond Index Fund | 5.3 |
| Fidelity Series Value Discovery Fund | 4.6 |
| | 73.6 |
Asset Allocation (% of fund's net assets)
| Period end |
| | Domestic Equity Funds | 50.4% |
| | International Equity Funds | 41.8% |
| | Bond Funds | 7.7% |
| | Short-Term Funds | 0.1% |

Domestic Equity Funds category includes Fidelity Series Commodity Strategy Fund which invests in commodity-related investments.
Fidelity Freedom® 2045 Fund
Schedule of Investments March 31, 2022
Showing Percentage of Net Assets
| U.S. Treasury Obligations - 0.0% | | | |
| | | Principal Amount | Value |
| U.S. Treasury Bills, yield at date of purchase 0.12% to 0.17% 4/14/22 to 4/21/22 (a) | | | |
| (Cost $9,929,168) | | 9,930,000 | 9,929,351 |
| | | Shares | Value |
|
| Domestic Equity Funds - 50.4% | | | |
| Fidelity Series All-Sector Equity Fund (b) | | 33,650,457 | $362,751,926 |
| Fidelity Series Blue Chip Growth Fund (b) | | 41,442,285 | 595,525,642 |
| Fidelity Series Commodity Strategy Fund (b) | | 53,702,919 | 274,421,918 |
| Fidelity Series Growth Company Fund (b) | | 81,608,731 | 1,484,462,815 |
| Fidelity Series Intrinsic Opportunities Fund (b) | | 70,924,216 | 1,395,079,324 |
| Fidelity Series Large Cap Stock Fund (b) | | 69,445,863 | 1,320,165,861 |
| Fidelity Series Large Cap Value Index Fund (b) | | 32,354,230 | 496,960,975 |
| Fidelity Series Opportunistic Insights Fund (b) | | 41,602,953 | 760,501,976 |
| Fidelity Series Small Cap Discovery Fund (b) | | 12,052,696 | 161,385,604 |
| Fidelity Series Small Cap Opportunities Fund (b) | | 39,444,961 | 537,240,371 |
| Fidelity Series Stock Selector Large Cap Value Fund (b) | | 82,064,152 | 1,111,969,263 |
| Fidelity Series Value Discovery Fund (b) | | 52,873,599 | 845,977,580 |
| TOTAL DOMESTIC EQUITY FUNDS | | | |
| (Cost $7,116,308,017) | | | 9,346,443,255 |
|
| International Equity Funds - 41.8% | | | |
| Fidelity Series Canada Fund (b) | | 38,815,426 | 602,415,414 |
| Fidelity Series Emerging Markets Fund (b) | | 27,268,866 | 253,055,079 |
| Fidelity Series Emerging Markets Opportunities Fund (b) | | 127,748,536 | 2,350,573,070 |
| Fidelity Series International Growth Fund (b) | | 83,114,991 | 1,378,046,548 |
| Fidelity Series International Small Cap Fund (b) | | 21,039,112 | 377,652,063 |
| Fidelity Series International Value Fund (b) | | 126,168,614 | 1,391,639,810 |
| Fidelity Series Overseas Fund (b) | | 109,789,726 | 1,385,546,342 |
| TOTAL INTERNATIONAL EQUITY FUNDS | | | |
| (Cost $6,691,138,654) | | | 7,738,928,326 |
|
| Bond Funds - 7.7% | | | |
| Fidelity Series 5+ Year Inflation-Protected Bond Index Fund (b) | | 1,931,515 | 18,542,547 |
| Fidelity Series Emerging Markets Debt Fund (b) | | 10,981,069 | 90,593,819 |
| Fidelity Series Emerging Markets Debt Local Currency Fund (b) | | 3,407,134 | 30,698,280 |
| Fidelity Series Floating Rate High Income Fund (b) | | 2,018,655 | 18,551,441 |
| Fidelity Series High Income Fund (b) | | 12,190,467 | 110,811,348 |
| Fidelity Series International Credit Fund (b) | | 710,147 | 6,575,960 |
| Fidelity Series Investment Grade Bond Fund (b) | | 8,715,565 | 95,086,811 |
| Fidelity Series Long-Term Treasury Bond Index Fund (b) | | 129,589,386 | 987,471,120 |
| Fidelity Series Real Estate Income Fund (b) | | 5,833,096 | 66,263,976 |
| TOTAL BOND FUNDS | | | |
| (Cost $1,528,782,099) | | | 1,424,595,302 |
|
| Short-Term Funds - 0.1% | | | |
| Fidelity Cash Central Fund 0.31% (c) | | | |
| (Cost $13,840,493) | | 13,838,004 | 13,840,771 |
| TOTAL INVESTMENT IN SECURITIES - 100.0% | | | |
| (Cost $15,359,998,431) | | | 18,533,737,005 |
| NET OTHER ASSETS (LIABILITIES) - 0.0% | | | (1,249,759) |
| NET ASSETS - 100% | | | $18,532,487,246 |
| Futures Contracts | | | | | |
| | Number of contracts | Expiration Date | Notional Amount | Value | Unrealized Appreciation/(Depreciation) |
| Purchased | | | | | |
| Equity Index Contracts | | | | | |
| ICE E-mini MSCI EAFE Index Contracts (United States) | 460 | June 2022 | $49,321,200 | $1,972,131 | $1,972,132 |
| ICE E-mini MSCI Emerging Markets Index Contracts (United States) | 1,436 | June 2022 | 80,810,900 | 2,062,436 | 2,062,435 |
| TOTAL PURCHASED | | | | | $4,034,567 |
| Sold | | | | | |
| Equity Index Contracts | | | | | |
| Chicago Mercantile Exchange, Inc. | 445 | June 2022 | 100,809,188 | (2,379,593) | (2,379,593) |
| TOTAL FUTURES CONTRACTS | | | | | $1,654,974 |
The notional amount of futures purchased as a percentage of Net Assets is 0.7%
The notional amount of futures sold as a percentage of Net Assets is 0.5%
Legend
(a) Security or a portion of the security was pledged to cover margin requirements for futures contracts. At period end, the value of securities pledged amounted to $6,115,586.
(b) Affiliated Fund
(c) Affiliated fund that is generally available only to investment companies and other accounts managed by Fidelity Investments. The rate quoted is the annualized seven-day yield of the fund at period end. A complete unaudited listing of the fund's holdings as of its most recent quarter end is available upon request. In addition, each Fidelity Central Fund's financial statements, which are not covered by the Fund's Report of Independent Registered Public Accounting Firm, are available on the SEC's website or upon request.
Affiliated Central Funds
Fiscal year to date information regarding the Fund's investments in Fidelity Central Funds, including the ownership percentage, is presented below.
| Fund | Value, beginning of period | Purchases | Sales Proceeds | Dividend Income | Realized Gain/Loss | Change in Unrealized appreciation (depreciation) | Value, end of period | % ownership, end of period |
| Fidelity Cash Central Fund 0.31% | $7,703,860 | $68,631,168 | $62,494,257 | $6,642 | $-- | $-- | $13,840,771 | 0.0% |
| Total | $7,703,860 | $68,631,168 | $62,494,257 | $6,642 | $-- | $-- | $13,840,771 | |
Amounts in the income column in the above table include any capital gain distributions from underlying funds, which are presented in the corresponding line-item in the Statement of Operations, if applicable.
Affiliated Underlying Funds
Fiscal year to date information regarding the Fund's investments in affiliated Underlying Funds is presented below. Exchanges between classes of the same affiliated Underlying Funds may occur. If an underlying Fund changes its name, the name presented below is the name in effect at period end.
| Fund | Value, beginning of period | Purchases(a) | Sales Proceeds(a) | Dividend Income | Realized Gain (loss) | Change in Unrealized appreciation (depreciation) | Value, end of period |
| Fidelity Series 0-5 Year Inflation-Protected Bond Index Fund | $-- | $84,856,891 | $84,516,060 | $268,739 | $(300,804) | $-- | $-- |
| Fidelity Series 5+ Year Inflation-Protected Bond Index Fund | -- | 166,644,082 | 141,682,268 | 846,227 | (5,859,307) | (559,960) | 18,542,547 |
| Fidelity Series All-Sector Equity Fund | 378,738,471 | 107,268,466 | 98,143,385 | 72,129,608 | 6,513,535 | (31,625,161) | 362,751,926 |
| Fidelity Series Blue Chip Growth Fund | 600,853,021 | 294,896,130 | 207,372,128 | 124,298,054 | 9,981,977 | (102,833,358) | 595,525,642 |
| Fidelity Series Canada Fund | 465,061,710 | 128,307,962 | 92,346,411 | 12,093,272 | 3,171,167 | 98,220,986 | 602,415,414 |
| Fidelity Series Commodity Strategy Fund | 531,057,951 | 199,546,481 | 477,027,687 | 163,111,777 | (18,249,028) | 39,094,201 | 274,421,918 |
| Fidelity Series Emerging Markets Debt Fund | 103,767,500 | 16,149,404 | 20,218,306 | 4,667,402 | (845,565) | (8,259,214) | 90,593,819 |
| Fidelity Series Emerging Markets Debt Local Currency Fund | 33,749,871 | 6,885,653 | 6,489,062 | 1,313,225 | (273,321) | (3,174,861) | 30,698,280 |
| Fidelity Series Emerging Markets Fund | 304,374,578 | 66,384,261 | 56,886,973 | 9,092,467 | 3,217,846 | (64,034,633) | 253,055,079 |
| Fidelity Series Emerging Markets Opportunities Fund | 2,747,435,467 | 907,404,475 | 514,252,616 | 287,207,059 | 34,915,807 | (824,930,063) | 2,350,573,070 |
| Fidelity Series Floating Rate High Income Fund | 19,860,408 | 2,417,794 | 3,737,947 | 825,927 | (109,931) | 121,117 | 18,551,441 |
| Fidelity Series Government Money Market Fund 0.31% | 126,836,215 | 6,609,621 | 133,445,836 | 27,245 | -- | -- | -- |
| Fidelity Series Growth Company Fund | 1,533,427,331 | 838,658,787 | 625,186,466 | 405,982,022 | 45,545,055 | (307,981,892) | 1,484,462,815 |
| Fidelity Series High Income Fund | 119,216,722 | 18,056,276 | 22,941,489 | 6,358,251 | (160,665) | (3,359,496) | 110,811,348 |
| Fidelity Series Inflation-Protected Bond Index Fund | 381,467,514 | 34,994,752 | 431,261,482 | 3,683,502 | 34,050,057 | (19,250,841) | -- |
| Fidelity Series International Credit Fund | 6,863,561 | 221,497 | -- | 221,497 | -- | (509,098) | 6,575,960 |
| Fidelity Series International Growth Fund | 1,303,179,667 | 368,893,414 | 178,672,753 | 113,438,443 | 3,513,680 | (118,867,460) | 1,378,046,548 |
| Fidelity Series International Small Cap Fund | 409,181,533 | 84,099,245 | 60,874,567 | 51,601,897 | 4,941,341 | (59,695,489) | 377,652,063 |
| Fidelity Series International Value Fund | 1,302,824,858 | 376,897,831 | 312,297,273 | 71,225,312 | 6,136,553 | 18,077,841 | 1,391,639,810 |
| Fidelity Series Intrinsic Opportunities Fund | 1,539,354,207 | 453,424,067 | 461,233,707 | 264,338,417 | 8,829,336 | (145,294,579) | 1,395,079,324 |
| Fidelity Series Investment Grade Bond Fund | 8,058,650 | 150,994,818 | 62,592,841 | 386,076 | (1,280,968) | (92,848) | 95,086,811 |
| Fidelity Series Large Cap Stock Fund | 1,345,695,611 | 247,014,442 | 315,874,473 | 121,721,102 | 20,760,274 | 22,570,007 | 1,320,165,861 |
| Fidelity Series Large Cap Value Index Fund | 496,069,152 | 76,023,206 | 98,538,356 | 32,604,669 | 8,309,513 | 15,097,460 | 496,960,975 |
| Fidelity Series Long-Term Treasury Bond Index Fund | 523,327,304 | 652,769,038 | 147,091,285 | 15,378,461 | (20,607,174) | (20,926,763) | 987,471,120 |
| Fidelity Series Opportunistic Insights Fund | 785,520,418 | 287,459,871 | 250,582,203 | 142,169,684 | 19,474,788 | (81,370,898) | 760,501,976 |
| Fidelity Series Overseas Fund | 1,305,332,238 | 286,722,673 | 203,270,353 | 41,964,366 | 8,621,279 | (11,859,495) | 1,385,546,342 |
| Fidelity Series Real Estate Income Fund | 73,105,509 | 6,553,819 | 15,519,987 | 2,816,241 | 107,520 | 2,017,115 | 66,263,976 |
| Fidelity Series Short-Term Credit Fund | 26,716,767 | 820,117 | 27,539,491 | 124,064 | 596,070 | (593,463) | -- |
| Fidelity Series Small Cap Discovery Fund | 168,396,737 | 39,726,221 | 35,176,394 | 28,166,154 | 3,520,022 | (15,080,982) | 161,385,604 |
| Fidelity Series Small Cap Opportunities Fund | 563,158,273 | 225,152,369 | 123,769,818 | 142,590,510 | 6,790,042 | (134,090,495) | 537,240,371 |
| Fidelity Series Stock Selector Large Cap Value Fund | 1,137,556,561 | 306,159,819 | 282,839,879 | 199,638,845 | 14,562,154 | (63,469,392) | 1,111,969,263 |
| Fidelity Series Value Discovery Fund | 874,813,304 | 183,454,933 | 220,956,678 | 99,699,919 | 15,486,217 | (6,820,196) | 845,977,580 |
| | $19,215,001,109 | $6,625,468,415 | $5,712,338,174 | $2,419,990,434 | $211,357,470 | $(1,829,481,910) | $18,509,966,883 |
(a) Includes the value of shares purchased or redeemed through in-kind transactions, if applicable.
Amounts in the income column in the above table include any capital gain distributions from underlying funds, which are presented in the corresponding line-item in the Statement of Operations, if applicable.
Investment Valuation
The following is a summary of the inputs used, as of March 31, 2022, involving the Fund's assets and liabilities carried at fair value. The inputs or methodology used for valuing securities may not be an indication of the risk associated with investing in those securities. For more information on valuation inputs, and their aggregation into the levels used below, please refer to the Investment Valuation section in the accompanying Notes to Financial Statements.
| | Valuation Inputs at Reporting Date: |
| Description | Total | Level 1 | Level 2 | Level 3 |
| Investments in Securities: | | | | |
| Other Short-Term Investments | $9,929,351 | $-- | $9,929,351 | $-- |
| Domestic Equity Funds | 9,346,443,255 | 9,346,443,255 | -- | -- |
| International Equity Funds | 7,738,928,326 | 7,738,928,326 | -- | -- |
| Bond Funds | 1,424,595,302 | 1,424,595,302 | -- | -- |
| Short-Term Funds | 13,840,771 | 13,840,771 | -- | -- |
| Total Investments in Securities: | $18,533,737,005 | $18,523,807,654 | $9,929,351 | $-- |
| Derivative Instruments: | | | | |
| Assets | | | | |
| Futures Contracts | $4,034,567 | $4,034,567 | $-- | $-- |
| Total Assets | $4,034,567 | $4,034,567 | $-- | $-- |
| Liabilities | | | | |
| Futures Contracts | $(2,379,593) | $(2,379,593) | $-- | $-- |
| Total Liabilities | $(2,379,593) | $(2,379,593) | $-- | $-- |
| Total Derivative Instruments: | $1,654,974 | $1,654,974 | $-- | $-- |
Value of Derivative Instruments
The following table is a summary of the Fund's value of derivative instruments by primary risk exposure as of March 31, 2022. For additional information on derivative instruments, please refer to the Derivative Instruments section in the accompanying Notes to Financial Statements.
| Primary Risk Exposure / Derivative Type | Value |
| | Asset | Liability |
| Equity Risk | | |
| Futures Contracts(a) | $4,034,567 | $(2,379,593) |
| Total Equity Risk | 4,034,567 | (2,379,593) |
| Total Value of Derivatives | $4,034,567 | $(2,379,593) |
(a) Reflects gross cumulative appreciation (depreciation) on futures contracts as presented in the Schedule of Investments. In the Statement of Assets and Liabilities, the period end daily variation margin is included in receivable or payable for daily variation margin on futures contracts, and the net cumulative appreciation (depreciation) is included in Total accumulated earnings (loss).
See accompanying notes which are an integral part of the financial statements.
Fidelity Freedom® 2045 Fund
Financial Statements
Statement of Assets and Liabilities
| | | March 31, 2022 |
| Assets | | |
Investment in securities, at value — See accompanying schedule:
Unaffiliated issuers (cost $9,929,168) | $9,929,351 | |
| Fidelity Central Funds (cost $13,840,493) | 13,840,771 | |
| Other affiliated issuers (cost $15,336,228,770) | 18,509,966,883 | |
| Total Investment in Securities (cost $15,359,998,431) | | $18,533,737,005 |
| Receivable for investments sold | | 272,667,595 |
| Receivable for fund shares sold | | 25,039,553 |
| Distributions receivable from Fidelity Central Funds | | 2,096 |
| Other receivables | | 128,831 |
| Total assets | | 18,831,575,080 |
| Liabilities | | |
| Payable for investments purchased | $269,778,391 | |
| Payable for fund shares redeemed | 18,558,931 | |
| Accrued management fee | 9,795,696 | |
| Payable for daily variation margin on futures contracts | 825,985 | |
| Other payables and accrued expenses | 128,831 | |
| Total liabilities | | 299,087,834 |
| Net Assets | | $18,532,487,246 |
| Net Assets consist of: | | |
| Paid in capital | | $14,236,340,274 |
| Total accumulated earnings (loss) | | 4,296,146,972 |
| Net Assets | | $18,532,487,246 |
| Net Asset Value and Maximum Offering Price | | |
| Fidelity Freedom 2045 Fund: | | |
| Net Asset Value, offering price and redemption price per share ($6,683,616,784 ÷ 511,206,161 shares) | | $13.07 |
| Class K: | | |
| Net Asset Value, offering price and redemption price per share ($8,267,189,537 ÷ 632,710,073 shares) | | $13.07 |
| Class K6: | | |
| Net Asset Value, offering price and redemption price per share ($3,581,680,925 ÷ 275,051,390 shares) | | $13.02 |
See accompanying notes which are an integral part of the financial statements.
Statement of Operations
| | | Year ended March 31, 2022 |
| Investment Income | | |
| Dividends: | | |
| Affiliated issuers | | $546,964,640 |
| Interest | | 4,573 |
| Income from Fidelity Central Funds | | 6,642 |
| Total income | | 546,975,855 |
| Expenses | | |
| Management fee | $125,822,619 | |
| Independent trustees' fees and expenses | 58,384 | |
| Total expenses before reductions | 125,881,003 | |
| Expense reductions | (13) | |
| Total expenses after reductions | | 125,880,990 |
| Net investment income (loss) | | 421,094,865 |
| Realized and Unrealized Gain (Loss) | | |
| Net realized gain (loss) on: | | |
| Investment securities: | | |
| Unaffiliated issuers | 12,100 | |
| Affiliated issuers | 211,357,470 | |
| Futures contracts | (438,751) | |
| Capital gain distributions from underlying funds: | | |
| Affiliated issuers | 1,873,025,794 | |
| Total net realized gain (loss) | | 2,083,956,613 |
| Change in net unrealized appreciation (depreciation) on: | | |
| Investment securities: | | |
| Unaffiliated issuers | 138 | |
| Affiliated issuers | (1,829,481,910) | |
| Futures contracts | 1,654,974 | |
| Total change in net unrealized appreciation (depreciation) | | (1,827,826,798) |
| Net gain (loss) | | 256,129,815 |
| Net increase (decrease) in net assets resulting from operations | | $677,224,680 |
See accompanying notes which are an integral part of the financial statements.
Statement of Changes in Net Assets
| | Year ended March 31, 2022 | Year ended March 31, 2021 |
| Increase (Decrease) in Net Assets | | |
| Operations | | |
| Net investment income (loss) | $421,094,865 | $170,879,884 |
| Net realized gain (loss) | 2,083,956,613 | 1,198,195,727 |
| Change in net unrealized appreciation (depreciation) | (1,827,826,798) | 5,684,857,584 |
| Net increase (decrease) in net assets resulting from operations | 677,224,680 | 7,053,933,195 |
| Distributions to shareholders | (2,197,883,066) | (888,134,747) |
| Share transactions - net increase (decrease) | 823,160,733 | 661,817,893 |
| Total increase (decrease) in net assets | (697,497,653) | 6,827,616,341 |
| Net Assets | | |
| Beginning of period | 19,229,984,899 | 12,402,368,558 |
| End of period | $18,532,487,246 | $19,229,984,899 |
See accompanying notes which are an integral part of the financial statements.
Financial Highlights
Fidelity Freedom 2045 Fund
| Years ended March 31, | 2022 | 2021 | 2020 | 2019 | 2018 |
| Selected Per–Share Data | | | | | |
| Net asset value, beginning of period | $14.22 | $9.54 | $11.44 | $12.09 | $11.00 |
| Income from Investment Operations | | | | | |
| Net investment income (loss)A,B | .30 | .12 | .17 | .16 | .12 |
| Net realized and unrealized gain (loss) | .22 | 5.23 | (1.29) | (.01) | 1.46 |
| Total from investment operations | .52 | 5.35 | (1.12) | .15 | 1.58 |
| Distributions from net investment income | (.32) | (.14) | (.18) | (.17) | (.13) |
| Distributions from net realized gain | (1.36) | (.53) | (.61) | (.63) | (.35) |
| Total distributions | (1.67)C | (.67) | (.78)C | (.80) | (.49)C |
| Net asset value, end of period | $13.07 | $14.22 | $9.54 | $11.44 | $12.09 |
| Total ReturnD | 3.19% | 57.65% | (10.80)% | 1.72% | 14.48% |
| Ratios to Average Net AssetsB,E,F | | | | | |
| Expenses before reductions | .75% | .75% | .75% | .75% | .63%G |
| Expenses net of fee waivers, if any | .75% | .75% | .75% | .75% | .63%G |
| Expenses net of all reductions | .75% | .75% | .75% | .75% | .63%G |
| Net investment income (loss) | 2.10% | .96% | 1.52% | 1.37% | 1.04% |
| Supplemental Data | | | | | |
| Net assets, end of period (000 omitted) | $6,683,617 | $6,499,049 | $3,945,874 | $4,345,914 | $4,144,152 |
| Portfolio turnover rateH | 30% | 21% | 28% | 18% | 17%I |
A Calculated based on average shares outstanding during the period.
B Net investment income (loss) is affected by the timing of the declaration of dividends by any underlying mutual funds or exchange-traded funds (ETFs). Net investment income (loss) of any such underlying funds is not included in the Fund's net investment income (loss) ratio.
C Total distributions per share do not sum due to rounding.
D Total returns would have been lower if certain expenses had not been reduced during the applicable periods shown.
E Fees and expenses of any underlying mutual funds or exchange-traded funds (ETFs) are not included in the Fund's expense ratio. The Fund indirectly bears its proportionate share of these expenses. For additional expense information related to investments in Fidelity Central Funds, please refer to the "Investments in Fidelity Central Funds" note found in the Notes to Financial Statements section of the most recent Annual or Semi-Annual report.
F Expense ratios reflect operating expenses of the class. Expenses before reductions do not reflect amounts reimbursed, waived, or reduced through arrangements with the investment adviser, brokerage services, or other offset arrangements, if applicable, and do not represent the amount paid by the class during periods when reimbursements, waivers or reductions occur.
G On certain classes, the size and fluctuation of net assets and expense amounts may cause ratios to differ from contractual rates.
H Amount does not include the portfolio activity of any underlying mutual funds or exchange-traded funds (ETFs).
I The portfolio turnover rate does not include the assets acquired in the merger.
See accompanying notes which are an integral part of the financial statements.
Fidelity Freedom 2045 Fund Class K
| Years ended March 31, | 2022 | 2021 | 2020 | 2019 | 2018 A |
| Selected Per–Share Data | | | | | |
| Net asset value, beginning of period | $14.21 | $9.53 | $11.43 | $12.08 | $11.59 |
| Income from Investment Operations | | | | | |
| Net investment income (loss)B,C | .31 | .13 | .18 | .17 | .17 |
| Net realized and unrealized gain (loss) | .23 | 5.23 | (1.29) | (.01) | .67 |
| Total from investment operations | .54 | 5.36 | (1.11) | .16 | .84 |
| Distributions from net investment income | (.32) | (.15) | (.19) | (.18) | (.15) |
| Distributions from net realized gain | (1.36) | (.53) | (.61) | (.63) | (.19) |
| Total distributions | (1.68) | (.68) | (.79)D | (.81) | (.35)D |
| Net asset value, end of period | $13.07 | $14.21 | $9.53 | $11.43 | $12.08 |
| Total ReturnE,F | 3.32% | 57.85% | (10.74)% | 1.83% | 7.21% |
| Ratios to Average Net AssetsC,G,H | | | | | |
| Expenses before reductions | .64%I | .64% | .64% | .64% | .65%I,J |
| Expenses net of fee waivers, if any | .64%I | .64% | .64% | .64% | .65%I,J |
| Expenses net of all reductions | .64%I | .64% | .64% | .64% | .65%I,J |
| Net investment income (loss) | 2.20% | 1.06% | 1.62% | 1.47% | 2.05%J |
| Supplemental Data | | | | | |
| Net assets, end of period (000 omitted) | $8,267,190 | $9,496,661 | $6,636,812 | $7,982,073 | $8,748,416 |
| Portfolio turnover rateK | 30% | 21% | 28% | 18% | 17%L |
A For the period July 20, 2017 (commencement of sale of shares) through March 31, 2018.
B Calculated based on average shares outstanding during the period.
C Net investment income (loss) is affected by the timing of the declaration of dividends by any underlying mutual funds or exchange-traded funds (ETFs). Net investment income (loss) of any such underlying funds is not included in the Fund's net investment income (loss) ratio.
D Total distributions per share do not sum due to rounding.
E Total returns for periods of less than one year are not annualized.
F Total returns would have been lower if certain expenses had not been reduced during the applicable periods shown.
G Fees and expenses of any underlying mutual funds or exchange-traded funds (ETFs) are not included in the Fund's expense ratio. The Fund indirectly bears its proportionate share of these expenses. For additional expense information related to investments in Fidelity Central Funds, please refer to the "Investments in Fidelity Central Funds" note found in the Notes to Financial Statements section of the most recent Annual or Semi-Annual report.
H Expense ratios reflect operating expenses of the class. Expenses before reductions do not reflect amounts reimbursed, waived, or reduced through arrangements with the investment adviser, brokerage services, or other offset arrangements, if applicable, and do not represent the amount paid by the class during periods when reimbursements, waivers or reductions occur.
I On certain classes, the size and fluctuation of net assets and expense amounts may cause ratios to differ from contractual rates.
J Annualized
K Amount does not include the portfolio activity of any underlying mutual funds or exchange-traded funds (ETFs).
L The portfolio turnover rate does not include the assets acquired in the merger.
See accompanying notes which are an integral part of the financial statements.
Fidelity Freedom 2045 Fund Class K6
| | March 31, | March 31, | | | |
| Years ended March 31, | 2022 | 2021 | 2020 | 2019 | 2018 A |
| Selected Per–Share Data | | | | | |
| Net asset value, beginning of period | $14.17 | $9.51 | $11.41 | $12.09 | $11.34 |
| Income from Investment Operations | | | | | |
| Net investment income (loss)B,C | .33 | .15 | .20 | .18 | .14 |
| Net realized and unrealized gain (loss) | .23 | 5.22 | (1.28) | (.01) | .96 |
| Total from investment operations | .56 | 5.37 | (1.08) | .17 | 1.10 |
| Distributions from net investment income | (.35) | (.17) | (.20) | (.21) | (.16) |
| Distributions from net realized gain | (1.36) | (.54) | (.61) | (.64) | (.19) |
| Total distributions | (1.71) | (.71) | (.82)D | (.85) | (.35) |
| Net asset value, end of period | $13.02 | $14.17 | $9.51 | $11.41 | $12.09 |
| Total ReturnE,F | 3.44% | 58.05% | (10.57)% | 1.95% | 9.70% |
| Ratios to Average Net AssetsC,G,H | | | | | |
| Expenses before reductions | .49%I | .49% | .49% | .50% | .50%I,J |
| Expenses net of fee waivers, if any | .49%I | .49% | .49% | .50% | .50%I,J |
| Expenses net of all reductions | .49%I | .49% | .49% | .50% | .50%I,J |
| Net investment income (loss) | 2.35% | 1.21% | 1.77% | 1.62% | 1.45%J |
| Supplemental Data | | | | | |
| Net assets, end of period (000 omitted) | $3,581,681 | $3,234,275 | $1,819,682 | $1,485,505 | $412,758 |
| Portfolio turnover rateK | 30% | 21% | 28% | 18% | 17%L |
A For the period June 7, 2017 (commencement of sale of shares) through March 31, 2018.
B Calculated based on average shares outstanding during the period.
C Net investment income (loss) is affected by the timing of the declaration of dividends by any underlying mutual funds or exchange-traded funds (ETFs). Net investment income (loss) of any such underlying funds is not included in the Fund's net investment income (loss) ratio.
D Total distributions per share do not sum due to rounding.
E Total returns for periods of less than one year are not annualized.
F Total returns would have been lower if certain expenses had not been reduced during the applicable periods shown.
G Fees and expenses of any underlying mutual funds or exchange-traded funds (ETFs) are not included in the Fund's expense ratio. The Fund indirectly bears its proportionate share of these expenses. For additional expense information related to investments in Fidelity Central Funds, please refer to the "Investments in Fidelity Central Funds" note found in the Notes to Financial Statements section of the most recent Annual or Semi-Annual report.
H Expense ratios reflect operating expenses of the class. Expenses before reductions do not reflect amounts reimbursed, waived, or reduced through arrangements with the investment adviser, brokerage services, or other offset arrangements, if applicable, and do not represent the amount paid by the class during periods when reimbursements, waivers or reductions occur.
I On certain classes, the size and fluctuation of net assets and expense amounts may cause ratios to differ from contractual rates.
J Annualized
K Amount does not include the portfolio activity of any underlying mutual funds or exchange-traded funds (ETFs).
L The portfolio turnover rate does not include the assets acquired in the merger.
See accompanying notes which are an integral part of the financial statements.
Fidelity Freedom® 2050 Fund
Investment Summary (Unaudited)
The information in the following tables is based on the direct investments of the Fund.
Top Holdings as of March 31, 2022
| | % of fund's net assets |
| Fidelity Series Emerging Markets Opportunities Fund | 12.7 |
| Fidelity Series Growth Company Fund | 8.0 |
| Fidelity Series Intrinsic Opportunities Fund | 7.5 |
| Fidelity Series International Value Fund | 7.5 |
| Fidelity Series Overseas Fund | 7.5 |
| Fidelity Series International Growth Fund | 7.4 |
| Fidelity Series Large Cap Stock Fund | 7.1 |
| Fidelity Series Stock Selector Large Cap Value Fund | 6.0 |
| Fidelity Series Long-Term Treasury Bond Index Fund | 5.3 |
| Fidelity Series Value Discovery Fund | 4.6 |
| | 73.6 |
Asset Allocation (% of fund's net assets)
| Period end |
| | Domestic Equity Funds | 50.4% |
| | International Equity Funds | 41.8% |
| | Bond Funds | 7.7% |
| | Short-Term Funds | 0.1% |

Domestic Equity Funds category includes Fidelity Series Commodity Strategy Fund which invests in commodity-related investments.
Fidelity Freedom® 2050 Fund
Schedule of Investments March 31, 2022
Showing Percentage of Net Assets
| U.S. Treasury Obligations - 0.0% | | | |
| | | Principal Amount | Value |
| U.S. Treasury Bills, yield at date of purchase 0.12% to 0.17% 4/14/22 to 4/21/22 (a) | | | |
| (Cost $8,809,263) | | 8,810,000 | 8,809,424 |
| | | Shares | Value |
|
| Domestic Equity Funds - 50.4% | | | |
| Fidelity Series All-Sector Equity Fund (b) | | 30,144,262 | $324,955,142 |
| Fidelity Series Blue Chip Growth Fund (b) | | 37,124,605 | 533,480,569 |
| Fidelity Series Commodity Strategy Fund (b) | | 48,116,390 | 245,874,752 |
| Fidelity Series Growth Company Fund (b) | | 73,105,821 | 1,329,794,891 |
| Fidelity Series Intrinsic Opportunities Fund (b) | | 63,534,325 | 1,249,720,181 |
| Fidelity Series Large Cap Stock Fund (b) | | 62,210,023 | 1,182,612,530 |
| Fidelity Series Large Cap Value Index Fund (b) | | 28,982,770 | 445,175,347 |
| Fidelity Series Opportunistic Insights Fund (b) | | 37,268,212 | 681,262,909 |
| Fidelity Series Small Cap Discovery Fund (b) | | 10,801,011 | 144,625,544 |
| Fidelity Series Small Cap Opportunities Fund (b) | | 35,335,019 | 481,262,957 |
| Fidelity Series Stock Selector Large Cap Value Fund (b) | | 73,513,552 | 996,108,623 |
| Fidelity Series Value Discovery Fund (b) | | 47,364,213 | 757,827,406 |
| TOTAL DOMESTIC EQUITY FUNDS | | | |
| (Cost $6,452,585,460) | | | 8,372,700,851 |
|
| International Equity Funds - 41.8% | | | |
| Fidelity Series Canada Fund (b) | | 34,771,902 | 539,659,919 |
| Fidelity Series Emerging Markets Fund (b) | | 24,432,306 | 226,731,802 |
| Fidelity Series Emerging Markets Opportunities Fund (b) | | 114,438,433 | 2,105,667,175 |
| Fidelity Series International Growth Fund (b) | | 74,455,695 | 1,234,475,425 |
| Fidelity Series International Small Cap Fund (b) | | 18,846,896 | 338,301,784 |
| Fidelity Series International Value Fund (b) | | 113,023,714 | 1,246,651,570 |
| Fidelity Series Overseas Fund (b) | | 98,351,238 | 1,241,192,630 |
| TOTAL INTERNATIONAL EQUITY FUNDS | | | |
| (Cost $6,038,692,417) | | | 6,932,680,305 |
|
| Bond Funds - 7.7% | | | |
| Fidelity Series 5+ Year Inflation-Protected Bond Index Fund (b) | | 1,730,254 | 16,610,435 |
| Fidelity Series Emerging Markets Debt Fund (b) | | 9,838,121 | 81,164,497 |
| Fidelity Series Emerging Markets Debt Local Currency Fund (b) | | 3,052,195 | 27,500,274 |
| Fidelity Series Floating Rate High Income Fund (b) | | 1,808,282 | 16,618,111 |
| Fidelity Series High Income Fund (b) | | 10,925,509 | 99,312,874 |
| Fidelity Series International Credit Fund (b) | | 600,393 | 5,559,641 |
| Fidelity Series Investment Grade Bond Fund (b) | | 7,812,195 | 85,231,051 |
| Fidelity Series Long-Term Treasury Bond Index Fund (b) | | 116,093,723 | 884,634,166 |
| Fidelity Series Real Estate Income Fund (b) | | 5,225,273 | 59,359,102 |
| TOTAL BOND FUNDS | | | |
| (Cost $1,368,989,751) | | | 1,275,990,151 |
|
| Short-Term Funds - 0.1% | | | |
| Fidelity Cash Central Fund 0.31% (c) | | | |
| (Cost $12,448,616) | | 12,446,368 | 12,448,858 |
| TOTAL INVESTMENT IN SECURITIES - 100.0% | | | |
| (Cost $13,881,525,507) | | | 16,602,629,589 |
| NET OTHER ASSETS (LIABILITIES) - 0.0% | | | (1,113,289) |
| NET ASSETS - 100% | | | $16,601,516,300 |
| Futures Contracts | | | | | |
| | Number of contracts | Expiration Date | Notional Amount | Value | Unrealized Appreciation/(Depreciation) |
| Purchased | | | | | |
| Equity Index Contracts | | | | | |
| ICE E-mini MSCI EAFE Index Contracts (United States) | 412 | June 2022 | $44,174,640 | $1,761,739 | $1,761,738 |
| ICE E-mini MSCI Emerging Markets Index Contracts (United States) | 1,286 | June 2022 | 72,369,650 | 1,823,033 | 1,823,033 |
| TOTAL PURCHASED | | | | | $3,584,771 |
| Sold | | | | | |
| Equity Index Contracts | | | | | |
| CME Micro E-mini S&P 500 Index Contracts (United States) | 399 | June 2022 | 90,388,463 | (2,124,899) | (2,124,899) |
| TOTAL FUTURES CONTRACTS | | | | | $1,459,872 |
The notional amount of futures purchased as a percentage of Net Assets is 0.7%
The notional amount of futures sold as a percentage of Net Assets is 0.5%
Legend
(a) Security or a portion of the security was pledged to cover margin requirements for futures contracts. At period end, the value of securities pledged amounted to $5,447,634.
(b) Affiliated Fund
(c) Affiliated fund that is generally available only to investment companies and other accounts managed by Fidelity Investments. The rate quoted is the annualized seven-day yield of the fund at period end. A complete unaudited listing of the fund's holdings as of its most recent quarter end is available upon request. In addition, each Fidelity Central Fund's financial statements, which are not covered by the Fund's Report of Independent Registered Public Accounting Firm, are available on the SEC's website or upon request.
Affiliated Central Funds
Fiscal year to date information regarding the Fund's investments in Fidelity Central Funds, including the ownership percentage, is presented below.
| Fund | Value, beginning of period | Purchases | Sales Proceeds | Dividend Income | Realized Gain/Loss | Change in Unrealized appreciation (depreciation) | Value, end of period | % ownership, end of period |
| Fidelity Cash Central Fund 0.31% | $6,663,962 | $61,134,445 | $55,349,549 | $5,874 | $-- | $-- | $12,448,858 | 0.0% |
| Total | $6,663,962 | $61,134,445 | $55,349,549 | $5,874 | $-- | $-- | $12,448,858 | |
Amounts in the income column in the above table include any capital gain distributions from underlying funds, which are presented in the corresponding line-item in the Statement of Operations, if applicable.
Affiliated Underlying Funds
Fiscal year to date information regarding the Fund's investments in affiliated Underlying Funds is presented below. Exchanges between classes of the same affiliated Underlying Funds may occur. If an underlying Fund changes its name, the name presented below is the name in effect at period end.
| Fund | Value, beginning of period | Purchases(a) | Sales Proceeds(a) | Dividend Income | Realized Gain (loss) | Change in Unrealized appreciation (depreciation) | Value, end of period |
| Fidelity Series 0-5 Year Inflation-Protected Bond Index Fund | $-- | $75,678,027 | $75,374,809 | $239,493 | $(267,547) | $-- | $-- |
| Fidelity Series 5+ Year Inflation-Protected Bond Index Fund | -- | 148,711,847 | 126,377,463 | 754,680 | (5,222,429) | (501,520) | 16,610,435 |
| Fidelity Series All-Sector Equity Fund | 333,498,446 | 98,679,096 | 84,366,928 | 64,320,426 | 4,793,902 | (27,649,374) | 324,955,142 |
| Fidelity Series Blue Chip Growth Fund | 529,081,371 | 267,039,490 | 179,719,078 | 110,044,607 | 8,445,960 | (91,367,174) | 533,480,569 |
| Fidelity Series Canada Fund | 409,510,603 | 118,988,338 | 78,746,317 | 10,774,466 | 2,467,029 | 87,440,266 | 539,659,919 |
| Fidelity Series Commodity Strategy Fund | 467,648,075 | 180,460,406 | 421,138,026 | 144,235,385 | (16,529,123) | 35,433,420 | 245,874,752 |
| Fidelity Series Emerging Markets Debt Fund | 91,385,124 | 15,356,329 | 17,430,615 | 4,140,301 | (784,900) | (7,361,441) | 81,164,497 |
| Fidelity Series Emerging Markets Debt Local Currency Fund | 29,730,839 | 6,412,146 | 5,563,041 | 1,169,897 | (254,367) | (2,825,303) | 27,500,274 |
| Fidelity Series Emerging Markets Fund | 268,029,768 | 61,432,635 | 48,496,709 | 8,101,358 | 2,601,434 | (56,835,326) | 226,731,802 |
| Fidelity Series Emerging Markets Opportunities Fund | 2,419,270,312 | 834,245,123 | 443,475,990 | 255,863,381 | 27,288,057 | (731,660,327) | 2,105,667,175 |
| Fidelity Series Floating Rate High Income Fund | 17,531,037 | 2,317,326 | 3,238,039 | 733,765 | (91,748) | 99,535 | 16,618,111 |
| Fidelity Series Government Money Market Fund 0.31% | 111,685,041 | 6,074,168 | 117,759,209 | 24,017 | -- | -- | -- |
| Fidelity Series Growth Company Fund | 1,350,259,645 | 760,000,036 | 544,070,805 | 361,801,978 | 37,147,479 | (273,541,464) | 1,329,794,891 |
| Fidelity Series High Income Fund | 105,001,630 | 17,303,439 | 19,824,727 | 5,642,528 | (180,750) | (2,986,718) | 99,312,874 |
| Fidelity Series Inflation-Protected Bond Index Fund | 336,054,789 | 32,833,575 | 381,925,459 | 3,285,602 | 29,884,980 | (16,847,885) | -- |
| Fidelity Series International Credit Fund | 5,802,793 | 187,265 | -- | 187,265 | -- | (430,417) | 5,559,641 |
| Fidelity Series International Growth Fund | 1,147,514,808 | 342,793,322 | 151,222,201 | 101,057,918 | 1,472,730 | (106,083,234) | 1,234,475,425 |
| Fidelity Series International Small Cap Fund | 360,316,787 | 78,143,887 | 50,713,750 | 45,968,942 | 3,731,585 | (53,176,725) | 338,301,784 |
| Fidelity Series International Value Fund | 1,147,213,405 | 347,443,926 | 268,735,589 | 63,451,807 | 5,083,206 | 15,646,622 | 1,246,651,570 |
| Fidelity Series Intrinsic Opportunities Fund | 1,355,478,802 | 416,160,260 | 400,764,555 | 234,106,362 | 5,900,674 | (127,055,000) | 1,249,720,181 |
| Fidelity Series Investment Grade Bond Fund | 7,122,862 | 136,453,012 | 57,112,889 | 345,148 | (1,145,985) | (85,949) | 85,231,051 |
| Fidelity Series Large Cap Stock Fund | 1,184,952,768 | 231,801,104 | 272,090,875 | 107,826,302 | 16,579,756 | 21,369,777 | 1,182,612,530 |
| Fidelity Series Large Cap Value Index Fund | 436,813,818 | 73,136,661 | 85,271,505 | 29,057,401 | 6,157,840 | 14,338,533 | 445,175,347 |
| Fidelity Series Long-Term Treasury Bond Index Fund | 460,841,160 | 588,911,370 | 127,569,553 | 13,654,477 | (17,703,267) | (19,845,544) | 884,634,166 |
| Fidelity Series Opportunistic Insights Fund | 691,690,531 | 262,781,419 | 216,835,635 | 126,705,732 | 16,862,299 | (73,235,705) | 681,262,909 |
| Fidelity Series Overseas Fund | 1,149,409,869 | 269,478,700 | 172,913,451 | 37,384,339 | 6,639,415 | (11,421,903) | 1,241,192,630 |
| Fidelity Series Real Estate Income Fund | 64,373,083 | 6,455,730 | 13,319,097 | 2,500,346 | 79,647 | 1,769,739 | 59,359,102 |
| Fidelity Series Short-Term Credit Fund | 23,525,503 | 763,928 | 24,291,726 | 109,454 | 528,787 | (526,492) | -- |
| Fidelity Series Small Cap Discovery Fund | 148,281,900 | 37,033,936 | 30,372,624 | 24,926,192 | 2,900,095 | (13,217,763) | 144,625,544 |
| Fidelity Series Small Cap Opportunities Fund | 495,889,650 | 205,215,436 | 106,846,653 | 126,148,463 | 5,031,571 | (118,027,047) | 481,262,957 |
| Fidelity Series Stock Selector Large Cap Value Fund | 1,001,675,540 | 284,926,998 | 245,865,139 | 178,013,666 | 10,849,972 | (55,478,748) | 996,108,623 |
| Fidelity Series Value Discovery Fund | 770,316,992 | 172,878,893 | 192,353,155 | 88,912,506 | 10,434,265 | (3,449,589) | 757,827,406 |
| | $16,919,906,951 | $6,080,097,828 | $4,963,785,612 | $2,151,488,204 | $162,700,567 | $(1,617,512,756) | $16,581,371,307 |
(a) Includes the value of shares purchased or redeemed through in-kind transactions, if applicable.
Amounts in the income column in the above table include any capital gain distributions from underlying funds, which are presented in the corresponding line-item in the Statement of Operations, if applicable.
Investment Valuation
The following is a summary of the inputs used, as of March 31, 2022, involving the Fund's assets and liabilities carried at fair value. The inputs or methodology used for valuing securities may not be an indication of the risk associated with investing in those securities. For more information on valuation inputs, and their aggregation into the levels used below, please refer to the Investment Valuation section in the accompanying Notes to Financial Statements.
| | Valuation Inputs at Reporting Date: |
| Description | Total | Level 1 | Level 2 | Level 3 |
| Investments in Securities: | | | | |
| Other Short-Term Investments | $8,809,424 | $-- | $8,809,424 | $-- |
| Domestic Equity Funds | 8,372,700,851 | 8,372,700,851 | -- | -- |
| International Equity Funds | 6,932,680,305 | 6,932,680,305 | -- | -- |
| Bond Funds | 1,275,990,151 | 1,275,990,151 | -- | -- |
| Short-Term Funds | 12,448,858 | 12,448,858 | -- | -- |
| Total Investments in Securities: | $16,602,629,589 | $16,593,820,165 | $8,809,424 | $-- |
| Derivative Instruments: | | | | |
| Assets | | | | |
| Futures Contracts | $3,584,771 | $3,584,771 | $-- | $-- |
| Total Assets | $3,584,771 | $3,584,771 | $-- | $-- |
| Liabilities | | | | |
| Futures Contracts | $(2,124,899) | $(2,124,899) | $-- | $-- |
| Total Liabilities | $(2,124,899) | $(2,124,899) | $-- | $-- |
| Total Derivative Instruments: | $1,459,872 | $1,459,872 | $-- | $-- |
Value of Derivative Instruments
The following table is a summary of the Fund's value of derivative instruments by primary risk exposure as of March 31, 2022. For additional information on derivative instruments, please refer to the Derivative Instruments section in the accompanying Notes to Financial Statements.
| Primary Risk Exposure / Derivative Type | Value |
| | Asset | Liability |
| Equity Risk | | |
| Futures Contracts(a) | $3,584,771 | $(2,124,899) |
| Total Equity Risk | 3,584,771 | (2,124,899) |
| Total Value of Derivatives | $3,584,771 | $(2,124,899) |
(a) Reflects gross cumulative appreciation (depreciation) on futures contracts as presented in the Schedule of Investments. In the Statement of Assets and Liabilities, the period end daily variation margin is included in receivable or payable for daily variation margin on futures contracts, and the net cumulative appreciation (depreciation) is included in Total accumulated earnings (loss).
See accompanying notes which are an integral part of the financial statements.
Fidelity Freedom® 2050 Fund
Financial Statements
Statement of Assets and Liabilities
| | | March 31, 2022 |
| Assets | | |
Investment in securities, at value — See accompanying schedule:
Unaffiliated issuers (cost $8,809,263) | $8,809,424 | |
| Fidelity Central Funds (cost $12,448,616) | 12,448,858 | |
| Other affiliated issuers (cost $13,860,267,628) | 16,581,371,307 | |
| Total Investment in Securities (cost $13,881,525,507) | | $16,602,629,589 |
| Receivable for investments sold | | 244,233,037 |
| Receivable for fund shares sold | | 25,077,283 |
| Distributions receivable from Fidelity Central Funds | | 1,886 |
| Other receivables | | 78,631 |
| Total assets | | 16,872,020,426 |
| Liabilities | | |
| Payable for investments purchased | $241,261,593 | |
| Payable for fund shares redeemed | 19,681,876 | |
| Accrued management fee | 8,747,103 | |
| Payable for daily variation margin on futures contracts | 734,923 | |
| Other payables and accrued expenses | 78,631 | |
| Total liabilities | | 270,504,126 |
| Net Assets | | $16,601,516,300 |
| Net Assets consist of: | | |
| Paid in capital | | $12,896,022,091 |
| Total accumulated earnings (loss) | | 3,705,494,209 |
| Net Assets | | $16,601,516,300 |
| Net Asset Value and Maximum Offering Price | | |
| Fidelity Freedom 2050 Fund: | | |
| Net Asset Value, offering price and redemption price per share ($5,676,101,756 ÷ 429,933,498 shares) | | $13.20 |
| Class K: | | |
| Net Asset Value, offering price and redemption price per share ($7,763,504,918 ÷ 588,417,751 shares) | | $13.19 |
| Class K6: | | |
| Net Asset Value, offering price and redemption price per share ($3,161,909,626 ÷ 240,015,010 shares) | | $13.17 |
See accompanying notes which are an integral part of the financial statements.
Statement of Operations
| | | Year ended March 31, 2022 |
| Investment Income | | |
| Dividends: | | |
| Affiliated issuers | | $485,886,019 |
| Interest | | 4,051 |
| Income from Fidelity Central Funds | | 5,874 |
| Total income | | 485,895,944 |
| Expenses | | |
| Management fee | $111,409,528 | |
| Independent trustees' fees and expenses | 51,657 | |
| Total expenses before reductions | 111,461,185 | |
| Expense reductions | (9) | |
| Total expenses after reductions | | 111,461,176 |
| Net investment income (loss) | | 374,434,768 |
| Realized and Unrealized Gain (Loss) | | |
| Net realized gain (loss) on: | | |
| Investment securities: | | |
| Unaffiliated issuers | 10,330 | |
| Affiliated issuers | 162,700,567 | |
| Futures contracts | (446,284) | |
| Capital gain distributions from underlying funds: | | |
| Affiliated issuers | 1,665,602,185 | |
| Total net realized gain (loss) | | 1,827,866,798 |
| Change in net unrealized appreciation (depreciation) on: | | |
| Investment securities: | | |
| Unaffiliated issuers | 121 | |
| Affiliated issuers | (1,617,512,756) | |
| Futures contracts | 1,459,872 | |
| Total change in net unrealized appreciation (depreciation) | | (1,616,052,763) |
| Net gain (loss) | | 211,814,035 |
| Net increase (decrease) in net assets resulting from operations | | $586,248,803 |
See accompanying notes which are an integral part of the financial statements.
Statement of Changes in Net Assets
| | Year ended March 31, 2022 | Year ended March 31, 2021 |
| Increase (Decrease) in Net Assets | | |
| Operations | | |
| Net investment income (loss) | $374,434,768 | $149,713,179 |
| Net realized gain (loss) | 1,827,866,798 | 1,030,408,809 |
| Change in net unrealized appreciation (depreciation) | (1,616,052,763) | 4,998,115,959 |
| Net increase (decrease) in net assets resulting from operations | 586,248,803 | 6,178,237,947 |
| Distributions to shareholders | (1,916,924,784) | (765,799,605) |
| Share transactions - net increase (decrease) | 999,220,120 | 708,288,076 |
| Total increase (decrease) in net assets | (331,455,861) | 6,120,726,418 |
| Net Assets | | |
| Beginning of period | 16,932,972,161 | 10,812,245,743 |
| End of period | $16,601,516,300 | $16,932,972,161 |
See accompanying notes which are an integral part of the financial statements.
Financial Highlights
Fidelity Freedom 2050 Fund
| Years ended March 31, | 2022 | 2021 | 2020 | 2019 | 2018 |
| Selected Per–Share Data | | | | | |
| Net asset value, beginning of period | $14.33 | $9.61 | $11.52 | $12.16 | $11.05 |
| Income from Investment Operations | | | | | |
| Net investment income (loss)A,B | .30 | .12 | .18 | .16 | .12 |
| Net realized and unrealized gain (loss) | .23 | 5.27 | (1.30) | –C | 1.48 |
| Total from investment operations | .53 | 5.39 | (1.12) | .16 | 1.60 |
| Distributions from net investment income | (.32) | (.14) | (.18) | (.17) | (.14) |
| Distributions from net realized gain | (1.34) | (.53) | (.60) | (.63) | (.35) |
| Total distributions | (1.66) | (.67) | (.79)D | (.80) | (.49) |
| Net asset value, end of period | $13.20 | $14.33 | $9.61 | $11.52 | $12.16 |
| Total ReturnE | 3.20% | 57.62% | (10.80)% | 1.73% | 14.59% |
| Ratios to Average Net AssetsB,F,G | | | | | |
| Expenses before reductions | .75% | .75% | .75% | .75% | .63%H |
| Expenses net of fee waivers, if any | .75% | .75% | .75% | .75% | .63%H |
| Expenses net of all reductions | .75% | .75% | .75% | .75% | .63%H |
| Net investment income (loss) | 2.10% | .96% | 1.53% | 1.37% | 1.04% |
| Supplemental Data | | | | | |
| Net assets, end of period (000 omitted) | $5,676,102 | $5,495,177 | $3,373,190 | $3,679,538 | $3,452,997 |
| Portfolio turnover rateI | 29% | 21% | 27% | 18% | 16%J |
A Calculated based on average shares outstanding during the period.
B Net investment income (loss) is affected by the timing of the declaration of dividends by any underlying mutual funds or exchange-traded funds (ETFs). Net investment income (loss) of any such underlying funds is not included in the Fund's net investment income (loss) ratio.
C Amount represents less than $.005 per share.
D Total distributions per share do not sum due to rounding.
E Total returns would have been lower if certain expenses had not been reduced during the applicable periods shown.
F Fees and expenses of any underlying mutual funds or exchange-traded funds (ETFs) are not included in the Fund's expense ratio. The Fund indirectly bears its proportionate share of these expenses. For additional expense information related to investments in Fidelity Central Funds, please refer to the "Investments in Fidelity Central Funds" note found in the Notes to Financial Statements section of the most recent Annual or Semi-Annual report.
G Expense ratios reflect operating expenses of the class. Expenses before reductions do not reflect amounts reimbursed, waived, or reduced through arrangements with the investment adviser, brokerage services, or other offset arrangements, if applicable, and do not represent the amount paid by the class during periods when reimbursements, waivers or reductions occur.
H On certain classes, the size and fluctuation of net assets and expense amounts may cause ratios to differ from contractual rates.
I Amount does not include the portfolio activity of any underlying mutual funds or exchange-traded funds (ETFs).
J The portfolio turnover rate does not include the assets acquired in the merger.
See accompanying notes which are an integral part of the financial statements.
Fidelity Freedom 2050 Fund Class K
| Years ended March 31, | 2022 | 2021 | 2020 | 2019 | 2018 A |
| Selected Per–Share Data | | | | | |
| Net asset value, beginning of period | $14.32 | $9.60 | $11.50 | $12.14 | $11.65 |
| Income from Investment Operations | | | | | |
| Net investment income (loss)B,C | .32 | .13 | .19 | .17 | .17 |
| Net realized and unrealized gain (loss) | .22 | 5.27 | (1.29) | –D | .67 |
| Total from investment operations | .54 | 5.40 | (1.10) | .17 | .84 |
| Distributions from net investment income | (.33) | (.15) | (.19) | (.18) | (.15) |
| Distributions from net realized gain | (1.34) | (.53) | (.61) | (.63) | (.19) |
| Total distributions | (1.67) | (.68) | (.80) | (.81) | (.35)E |
| Net asset value, end of period | $13.19 | $14.32 | $9.60 | $11.50 | $12.14 |
| Total ReturnF,G | 3.26% | 57.78% | (10.66)% | 1.82% | 7.18% |
| Ratios to Average Net AssetsC,H,I | | | | | |
| Expenses before reductions | .64%J | .64% | .64% | .64% | .65%J,K |
| Expenses net of fee waivers, if any | .64%J | .64% | .64% | .64% | .65%J,K |
| Expenses net of all reductions | .64%J | .64% | .64% | .64% | .65%J,K |
| Net investment income (loss) | 2.20% | 1.06% | 1.63% | 1.48% | 2.04%K |
| Supplemental Data | | | | | |
| Net assets, end of period (000 omitted) | $7,763,505 | $8,727,043 | $5,952,708 | $6,982,416 | $7,475,339 |
| Portfolio turnover rateL | 29% | 21% | 27% | 18% | 16%M |
A For the period July 20, 2017 (commencement of sale of shares) through March 31, 2018.
B Calculated based on average shares outstanding during the period.
C Net investment income (loss) is affected by the timing of the declaration of dividends by any underlying mutual funds or exchange-traded funds (ETFs). Net investment income (loss) of any such underlying funds is not included in the Fund's net investment income (loss) ratio.
D Amount represents less than $.005 per share.
E Total distributions per share do not sum due to rounding.
F Total returns for periods of less than one year are not annualized.
G Total returns would have been lower if certain expenses had not been reduced during the applicable periods shown.
H Fees and expenses of any underlying mutual funds or exchange-traded funds (ETFs) are not included in the Fund's expense ratio. The Fund indirectly bears its proportionate share of these expenses. For additional expense information related to investments in Fidelity Central Funds, please refer to the "Investments in Fidelity Central Funds" note found in the Notes to Financial Statements section of the most recent Annual or Semi-Annual report.
I Expense ratios reflect operating expenses of the class. Expenses before reductions do not reflect amounts reimbursed, waived, or reduced through arrangements with the investment adviser, brokerage services, or other offset arrangements, if applicable, and do not represent the amount paid by the class during periods when reimbursements, waivers or reductions occur.
J On certain classes, the size and fluctuation of net assets and expense amounts may cause ratios to differ from contractual rates.
K Annualized
L Amount does not include the portfolio activity of any underlying mutual funds or exchange-traded funds (ETFs).
M The portfolio turnover rate does not include the assets acquired in the merger.
See accompanying notes which are an integral part of the financial statements.
Fidelity Freedom 2050 Fund Class K6
| Years ended March 31, | 2022 | 2021 | 2020 | 2019 | 2018 A |
| Selected Per–Share Data | | | | | |
| Net asset value, beginning of period | $14.30 | $9.59 | $11.49 | $12.15 | $11.40 |
| Income from Investment Operations | | | | | |
| Net investment income (loss)B,C | .34 | .15 | .20 | .19 | .14 |
| Net realized and unrealized gain (loss) | .22 | 5.26 | (1.28) | (.01) | .96 |
| Total from investment operations | .56 | 5.41 | (1.08) | .18 | 1.10 |
| Distributions from net investment income | (.35) | (.17) | (.21) | (.21) | (.16) |
| Distributions from net realized gain | (1.34) | (.53) | (.61) | (.63) | (.19) |
| Total distributions | (1.69) | (.70) | (.82) | (.84) | (.35) |
| Net asset value, end of period | $13.17 | $14.30 | $9.59 | $11.49 | $12.15 |
| Total ReturnD,E | 3.43% | 57.97% | (10.49)% | 1.96% | 9.65% |
| Ratios to Average Net AssetsC,F,G | | | | | |
| Expenses before reductions | .49%H | .49% | .49% | .50%H | .50%H,I |
| Expenses net of fee waivers, if any | .49%H | .49% | .49% | .50%H | .50%H,I |
| Expenses net of all reductions | .49%H | .49% | .49% | .50%H | .50%H,I |
| Net investment income (loss) | 2.35% | 1.21% | 1.78% | 1.62% | 1.42%I |
| Supplemental Data | | | | | |
| Net assets, end of period (000 omitted) | $3,161,910 | $2,710,752 | $1,486,348 | $1,184,606 | $327,591 |
| Portfolio turnover rateJ | 29% | 21% | 27% | 18% | 16%K |
A For the period June 7, 2017 (commencement of sale of shares) through March 31, 2018.
B Calculated based on average shares outstanding during the period.
C Net investment income (loss) is affected by the timing of the declaration of dividends by any underlying mutual funds or exchange-traded funds (ETFs). Net investment income (loss) of any such underlying funds is not included in the Fund's net investment income (loss) ratio.
D Total returns for periods of less than one year are not annualized.
E Total returns would have been lower if certain expenses had not been reduced during the applicable periods shown.
F Fees and expenses of any underlying mutual funds or exchange-traded funds (ETFs) are not included in the Fund's expense ratio. The Fund indirectly bears its proportionate share of these expenses. For additional expense information related to investments in Fidelity Central Funds, please refer to the "Investments in Fidelity Central Funds" note found in the Notes to Financial Statements section of the most recent Annual or Semi-Annual report.
G Expense ratios reflect operating expenses of the class. Expenses before reductions do not reflect amounts reimbursed, waived, or reduced through arrangements with the investment adviser, brokerage services, or other offset arrangements, if applicable, and do not represent the amount paid by the class during periods when reimbursements, waivers or reductions occur.
H On certain classes, the size and fluctuation of net assets and expense amounts may cause ratios to differ from contractual rates.
I Annualized
J Amount does not include the portfolio activity of any underlying mutual funds or exchange-traded funds (ETFs).
K The portfolio turnover rate does not include the assets acquired in the merger.
See accompanying notes which are an integral part of the financial statements.
Fidelity Freedom® 2055 Fund
Investment Summary (Unaudited)
The information in the following tables is based on the direct investments of the Fund.
Top Holdings as of March 31, 2022
| | % of fund's net assets |
| Fidelity Series Emerging Markets Opportunities Fund | 12.7 |
| Fidelity Series Growth Company Fund | 8.0 |
| Fidelity Series Intrinsic Opportunities Fund | 7.5 |
| Fidelity Series International Value Fund | 7.5 |
| Fidelity Series Overseas Fund | 7.5 |
| Fidelity Series International Growth Fund | 7.4 |
| Fidelity Series Large Cap Stock Fund | 7.1 |
| Fidelity Series Stock Selector Large Cap Value Fund | 6.0 |
| Fidelity Series Long-Term Treasury Bond Index Fund | 5.3 |
| Fidelity Series Value Discovery Fund | 4.6 |
| | 73.6 |
Asset Allocation (% of fund's net assets)
| Period end |
| | Domestic Equity Funds | 50.4% |
| | International Equity Funds | 41.8% |
| | Bond Funds | 7.7% |
| | Short-Term Funds | 0.1% |

Domestic Equity Funds category includes Fidelity Series Commodity Strategy Fund which invests in commodity-related investments.
Fidelity Freedom® 2055 Fund
Schedule of Investments March 31, 2022
Showing Percentage of Net Assets
| U.S. Treasury Obligations - 0.0% | | | |
| | | Principal Amount | Value |
| U.S. Treasury Bills, yield at date of purchase 0.12% to 0.17% 4/14/22 to 4/21/22 (a) | | | |
| (Cost $4,579,614) | | 4,580,000 | 4,579,700 |
| | | Shares | Value |
|
| Domestic Equity Funds - 50.4% | | | |
| Fidelity Series All-Sector Equity Fund (b) | | 16,063,504 | $173,164,572 |
| Fidelity Series Blue Chip Growth Fund (b) | | 19,783,744 | 284,292,395 |
| Fidelity Series Commodity Strategy Fund (b) | | 25,665,171 | 131,149,026 |
| Fidelity Series Growth Company Fund (b) | | 38,957,736 | 708,641,226 |
| Fidelity Series Intrinsic Opportunities Fund (b) | | 33,860,844 | 666,042,808 |
| Fidelity Series Large Cap Stock Fund (b) | | 33,151,282 | 630,205,870 |
| Fidelity Series Large Cap Value Index Fund (b) | | 15,443,872 | 237,217,869 |
| Fidelity Series Opportunistic Insights Fund (b) | | 19,860,072 | 363,042,115 |
| Fidelity Series Small Cap Discovery Fund (b) | | 5,762,446 | 77,159,153 |
| Fidelity Series Small Cap Opportunities Fund (b) | | 18,829,582 | 256,458,904 |
| Fidelity Series Stock Selector Large Cap Value Fund (b) | | 39,173,914 | 530,806,532 |
| Fidelity Series Value Discovery Fund (b) | | 25,239,379 | 403,830,059 |
| TOTAL DOMESTIC EQUITY FUNDS | | | |
| (Cost $3,753,433,305) | | | 4,462,010,529 |
|
| International Equity Funds - 41.8% | | | |
| Fidelity Series Canada Fund (b) | | 18,532,241 | 287,620,378 |
| Fidelity Series Emerging Markets Fund (b) | | 13,023,076 | 120,854,150 |
| Fidelity Series Emerging Markets Opportunities Fund (b) | | 60,989,744 | 1,122,211,280 |
| Fidelity Series International Growth Fund (b) | | 39,679,059 | 657,878,795 |
| Fidelity Series International Small Cap Fund (b) | | 10,043,225 | 180,275,889 |
| Fidelity Series International Value Fund (b) | | 60,232,653 | 664,366,166 |
| Fidelity Series Overseas Fund (b) | | 52,413,342 | 661,456,379 |
| TOTAL INTERNATIONAL EQUITY FUNDS | | | |
| (Cost $3,367,908,125) | | | 3,694,663,037 |
|
| Bond Funds - 7.7% | | | |
| Fidelity Series 5+ Year Inflation-Protected Bond Index Fund (b) | | 921,997 | 8,851,170 |
| Fidelity Series Emerging Markets Debt Fund (b) | | 5,245,011 | 43,271,340 |
| Fidelity Series Emerging Markets Debt Local Currency Fund (b) | | 1,626,496 | 14,654,728 |
| Fidelity Series Floating Rate High Income Fund (b) | | 963,571 | 8,855,214 |
| Fidelity Series High Income Fund (b) | | 5,839,631 | 53,082,250 |
| Fidelity Series International Credit Fund (b) | | 202,875 | 1,878,624 |
| Fidelity Series Investment Grade Bond Fund (b) | | 4,178,093 | 45,582,996 |
| Fidelity Series Long-Term Treasury Bond Index Fund (b) | | 61,886,264 | 471,573,334 |
| Fidelity Series Real Estate Income Fund (b) | | 2,784,312 | 31,629,782 |
| TOTAL BOND FUNDS | | | |
| (Cost $728,817,638) | | | 679,379,438 |
|
| Short-Term Funds - 0.1% | | | |
| Fidelity Cash Central Fund 0.31% (c) | | | |
| (Cost $6,693,751) | | 6,692,532 | 6,693,870 |
| TOTAL INVESTMENT IN SECURITIES - 100.0% | | | |
| (Cost $7,861,432,433) | | | 8,847,326,574 |
| NET OTHER ASSETS (LIABILITIES) - 0.0% | | | (583,915) |
| NET ASSETS - 100% | | | $8,846,742,659 |
| Futures Contracts | | | | | |
| | Number of contracts | Expiration Date | Notional Amount | Value | Unrealized Appreciation/(Depreciation) |
| Purchased | | | | | |
| Equity Index Contracts | | | | | |
| ICE E-mini MSCI EAFE Index Contracts (United States) | 218 | June 2022 | $23,373,960 | $929,395 | $929,396 |
| ICE E-mini MSCI Emerging Markets Index Contracts (United States) | 682 | June 2022 | 38,379,550 | 917,601 | 917,601 |
| TOTAL PURCHASED | | | | | $1,846,997 |
| Sold | | | | | |
| Equity Index Contracts | | | | | |
| CME Micro E-mini S&P 500 Index Contracts (United States) | 213 | June 2022 | 48,252,488 | (1,111,107) | (1,111,107) |
| TOTAL FUTURES CONTRACTS | | | | | $735,890 |
The notional amount of futures purchased as a percentage of Net Assets is 0.7%
The notional amount of futures sold as a percentage of Net Assets is 0.5%
Legend
(a) Security or a portion of the security was pledged to cover margin requirements for futures contracts. At period end, the value of securities pledged amounted to $2,841,811.
(b) Affiliated Fund
(c) Affiliated fund that is generally available only to investment companies and other accounts managed by Fidelity Investments. The rate quoted is the annualized seven-day yield of the fund at period end. A complete unaudited listing of the fund's holdings as of its most recent quarter end is available upon request. In addition, each Fidelity Central Fund's financial statements, which are not covered by the Fund's Report of Independent Registered Public Accounting Firm, are available on the SEC's website or upon request.
Affiliated Central Funds
Fiscal year to date information regarding the Fund's investments in Fidelity Central Funds, including the ownership percentage, is presented below.
| Fund | Value, beginning of period | Purchases | Sales Proceeds | Dividend Income | Realized Gain/Loss | Change in Unrealized appreciation (depreciation) | Value, end of period | % ownership, end of period |
| Fidelity Cash Central Fund 0.31% | $3,684,383 | $38,769,933 | $35,760,446 | $2,986 | $-- | $-- | $6,693,870 | 0.0% |
| Total | $3,684,383 | $38,769,933 | $35,760,446 | $2,986 | $-- | $-- | $6,693,870 | |
Amounts in the income column in the above table include any capital gain distributions from underlying funds, which are presented in the corresponding line-item in the Statement of Operations, if applicable.
Affiliated Underlying Funds
Fiscal year to date information regarding the Fund's investments in affiliated Underlying Funds is presented below. Exchanges between classes of the same affiliated Underlying Funds may occur. If an underlying Fund changes its name, the name presented below is the name in effect at period end.
| Fund | Value, beginning of period | Purchases(a) | Sales Proceeds(a) | Dividend Income | Realized Gain (loss) | Change in Unrealized appreciation (depreciation) | Value, end of period |
| Fidelity Series 0-5 Year Inflation-Protected Bond Index Fund | $-- | $39,879,506 | $39,721,313 | $125,607 | $(139,485) | $-- | $-- |
| Fidelity Series 5+ Year Inflation-Protected Bond Index Fund | -- | 79,030,940 | 67,167,574 | 398,141 | (2,744,977) | (267,219) | 8,851,170 |
| Fidelity Series All-Sector Equity Fund | 169,529,154 | 59,964,527 | 43,745,642 | 33,817,860 | (320,539) | (12,262,928) | 173,164,572 |
| Fidelity Series Blue Chip Growth Fund | 268,949,843 | 151,900,209 | 92,527,797 | 57,123,374 | 4,490,815 | (48,520,675) | 284,292,395 |
| Fidelity Series Canada Fund | 208,170,665 | 73,239,656 | 40,469,306 | 5,649,530 | 947,476 | 45,731,887 | 287,620,378 |
| Fidelity Series Commodity Strategy Fund | 237,805,122 | 102,747,073 | 219,402,024 | 74,762,911 | (9,092,092) | 19,090,947 | 131,149,026 |
| Fidelity Series Emerging Markets Debt Fund | 46,496,716 | 10,411,937 | 9,307,217 | 2,151,776 | (293,911) | (4,036,185) | 43,271,340 |
| Fidelity Series Emerging Markets Debt Local Currency Fund | 15,155,047 | 4,061,133 | 2,928,281 | 613,194 | (146,240) | (1,486,931) | 14,654,728 |
| Fidelity Series Emerging Markets Fund | 136,293,715 | 38,416,153 | 25,358,676 | 4,249,395 | 890,507 | (29,387,549) | 120,854,150 |
| Fidelity Series Emerging Markets Opportunities Fund | 1,229,870,619 | 491,367,028 | 228,903,139 | 134,107,552 | 7,547,302 | (377,670,530) | 1,122,211,280 |
| Fidelity Series Floating Rate High Income Fund | 8,900,484 | 1,725,330 | 1,772,814 | 384,389 | 611 | 1,603 | 8,855,214 |
| Fidelity Series Government Money Market Fund 0.31% | 56,774,094 | 3,995,425 | 60,769,519 | 12,296 | -- | -- | -- |
| Fidelity Series Growth Company Fund | 686,378,848 | 430,359,993 | 280,960,563 | 189,753,571 | 15,436,783 | (142,573,835) | 708,641,226 |
| Fidelity Series High Income Fund | 53,460,742 | 12,116,039 | 10,792,819 | 2,936,440 | (99,352) | (1,602,360) | 53,082,250 |
| Fidelity Series Inflation-Protected Bond Index Fund | 170,995,799 | 21,991,812 | 199,616,406 | 1,734,010 | 14,801,902 | (8,173,107) | -- |
| Fidelity Series International Credit Fund | 1,960,786 | 63,278 | -- | 63,278 | -- | (145,440) | 1,878,624 |
| Fidelity Series International Growth Fund | 583,321,985 | 210,565,260 | 78,745,566 | 52,965,782 | 342,199 | (57,605,083) | 657,878,795 |
| Fidelity Series International Small Cap Fund | 183,201,891 | 49,746,366 | 25,920,222 | 24,094,403 | 337,767 | (27,089,913) | 180,275,889 |
| Fidelity Series International Value Fund | 583,208,942 | 210,267,801 | 139,029,304 | 33,255,716 | 1,690,192 | 8,228,535 | 664,366,166 |
| Fidelity Series Intrinsic Opportunities Fund | 689,049,233 | 245,014,694 | 204,604,435 | 121,584,617 | (360,251) | (63,056,433) | 666,042,808 |
| Fidelity Series Investment Grade Bond Fund | 3,695,040 | 73,039,474 | 30,502,363 | 182,758 | (600,746) | (48,409) | 45,582,996 |
| Fidelity Series Large Cap Stock Fund | 602,360,701 | 149,012,328 | 140,220,736 | 55,903,601 | 7,043,454 | 12,010,123 | 630,205,870 |
| Fidelity Series Large Cap Value Index Fund | 222,051,467 | 49,237,329 | 44,412,722 | 15,248,949 | 1,893,033 | 8,448,762 | 237,217,869 |
| Fidelity Series Long-Term Treasury Bond Index Fund | 234,347,727 | 324,099,354 | 66,229,533 | 7,109,637 | (8,466,252) | (12,177,962) | 471,573,334 |
| Fidelity Series Opportunistic Insights Fund | 351,611,195 | 154,118,036 | 111,543,377 | 66,472,415 | 8,011,406 | (39,155,145) | 363,042,115 |
| Fidelity Series Overseas Fund | 584,283,758 | 171,754,341 | 89,657,385 | 19,593,808 | 2,540,682 | (7,465,017) | 661,456,379 |
| Fidelity Series Real Estate Income Fund | 32,723,293 | 4,940,189 | 6,946,208 | 1,302,995 | 13,732 | 898,776 | 31,629,782 |
| Fidelity Series Short-Term Credit Fund | 11,958,990 | 436,756 | 12,396,849 | 56,016 | 276,268 | (275,165) | -- |
| Fidelity Series Small Cap Discovery Fund | 75,377,936 | 22,811,509 | 15,609,286 | 12,852,936 | 978,931 | (6,399,937) | 77,159,153 |
| Fidelity Series Small Cap Opportunities Fund | 252,078,397 | 119,180,490 | 55,893,950 | 65,407,987 | 727,235 | (59,633,268) | 256,458,904 |
| Fidelity Series Stock Selector Large Cap Value Fund | 509,196,016 | 174,054,629 | 127,771,890 | 93,574,426 | 2,087,808 | (26,760,031) | 530,806,532 |
| Fidelity Series Value Discovery Fund | 391,585,133 | 109,207,218 | 99,666,498 | 46,758,193 | 3,735,182 | (1,030,976) | 403,830,059 |
| | $8,600,793,338�� | $3,588,755,813 | $2,572,593,414 | $1,124,247,563 | $51,529,440 | $(832,413,465) | $8,836,053,004 |
(a) Includes the value of shares purchased or redeemed through in-kind transactions, if applicable.
Amounts in the income column in the above table include any capital gain distributions from underlying funds, which are presented in the corresponding line-item in the Statement of Operations, if applicable.
Investment Valuation
The following is a summary of the inputs used, as of March 31, 2022, involving the Fund's assets and liabilities carried at fair value. The inputs or methodology used for valuing securities may not be an indication of the risk associated with investing in those securities. For more information on valuation inputs, and their aggregation into the levels used below, please refer to the Investment Valuation section in the accompanying Notes to Financial Statements.
| | Valuation Inputs at Reporting Date: |
| Description | Total | Level 1 | Level 2 | Level 3 |
| Investments in Securities: | | | | |
| Other Short-Term Investments | $4,579,700 | $-- | $4,579,700 | $-- |
| Domestic Equity Funds | 4,462,010,529 | 4,462,010,529 | -- | -- |
| International Equity Funds | 3,694,663,037 | 3,694,663,037 | -- | -- |
| Bond Funds | 679,379,438 | 679,379,438 | -- | -- |
| Short-Term Funds | 6,693,870 | 6,693,870 | -- | -- |
| Total Investments in Securities: | $8,847,326,574 | $8,842,746,874 | $4,579,700 | $-- |
| Derivative Instruments: | | | | |
| Assets | | | | |
| Futures Contracts | $1,846,997 | $1,846,997 | $-- | $-- |
| Total Assets | $1,846,997 | $1,846,997 | $-- | $-- |
| Liabilities | | | | |
| Futures Contracts | $(1,111,107) | $(1,111,107) | $-- | $-- |
| Total Liabilities | $(1,111,107) | $(1,111,107) | $-- | $-- |
| Total Derivative Instruments: | $735,890 | $735,890 | $-- | $-- |
Value of Derivative Instruments
The following table is a summary of the Fund's value of derivative instruments by primary risk exposure as of March 31, 2022. For additional information on derivative instruments, please refer to the Derivative Instruments section in the accompanying Notes to Financial Statements.
| Primary Risk Exposure / Derivative Type | Value |
| | Asset | Liability |
| Equity Risk | | |
| Futures Contracts(a) | $1,846,997 | $(1,111,107) |
| Total Equity Risk | 1,846,997 | (1,111,107) |
| Total Value of Derivatives | $1,846,997 | $(1,111,107) |
(a) Reflects gross cumulative appreciation (depreciation) on futures contracts as presented in the Schedule of Investments. In the Statement of Assets and Liabilities, the period end daily variation margin is included in receivable or payable for daily variation margin on futures contracts, and the net cumulative appreciation (depreciation) is included in Total accumulated earnings (loss).
See accompanying notes which are an integral part of the financial statements.
Fidelity Freedom® 2055 Fund
Financial Statements
Statement of Assets and Liabilities
| | | March 31, 2022 |
| Assets | | |
Investment in securities, at value — See accompanying schedule:
Unaffiliated issuers (cost $4,579,614) | $4,579,700 | |
| Fidelity Central Funds (cost $6,693,751) | 6,693,870 | |
| Other affiliated issuers (cost $7,850,159,068) | 8,836,053,004 | |
| Total Investment in Securities (cost $7,861,432,433) | | $8,847,326,574 |
| Receivable for investments sold | | 128,690,276 |
| Receivable for fund shares sold | | 18,161,157 |
| Distributions receivable from Fidelity Central Funds | | 1,016 |
| Total assets | | 8,994,179,023 |
| Liabilities | | |
| Payable for investments purchased | $129,225,158 | |
| Payable for fund shares redeemed | 13,209,369 | |
| Accrued management fee | 4,617,676 | |
| Payable for daily variation margin on futures contracts | 384,161 | |
| Total liabilities | | 147,436,364 |
| Net Assets | | $8,846,742,659 |
| Net Assets consist of: | | |
| Paid in capital | | $7,364,123,658 |
| Total accumulated earnings (loss) | | 1,482,619,001 |
| Net Assets | | $8,846,742,659 |
| Net Asset Value and Maximum Offering Price | | |
| Fidelity Freedom 2055 Fund: | | |
| Net Asset Value, offering price and redemption price per share ($2,747,697,414 ÷ 180,297,416 shares) | | $15.24 |
| Class K: | | |
| Net Asset Value, offering price and redemption price per share ($4,350,521,927 ÷ 285,435,525 shares) | | $15.24 |
| Class K6: | | |
| Net Asset Value, offering price and redemption price per share ($1,748,523,318 ÷ 114,894,081 shares) | | $15.22 |
See accompanying notes which are an integral part of the financial statements.
Statement of Operations
| | | Year ended March 31, 2022 |
| Investment Income | | |
| Dividends: | | |
| Affiliated issuers | | $253,548,074 |
| Interest | | 2,113 |
| Income from Fidelity Central Funds | | 2,986 |
| Total income | | 253,553,173 |
| Expenses | | |
| Management fee | $57,517,906 | |
| Independent trustees' fees and expenses | 26,635 | |
| Total expenses before reductions | 57,544,541 | |
| Expense reductions | (7) | |
| Total expenses after reductions | | 57,544,534 |
| Net investment income (loss) | | 196,008,639 |
| Realized and Unrealized Gain (Loss) | | |
| Net realized gain (loss) on: | | |
| Investment securities: | | |
| Unaffiliated issuers | 4,226 | |
| Affiliated issuers | 51,529,440 | |
| Futures contracts | (203,808) | |
| Capital gain distributions from underlying funds: | | |
| Affiliated issuers | 870,699,489 | |
| Total net realized gain (loss) | | 922,029,347 |
| Change in net unrealized appreciation (depreciation) on: | | |
| Investment securities: | | |
| Unaffiliated issuers | 66 | |
| Affiliated issuers | (832,413,465) | |
| Futures contracts | 735,890 | |
| Total change in net unrealized appreciation (depreciation) | | (831,677,509) |
| Net gain (loss) | | 90,351,838 |
| Net increase (decrease) in net assets resulting from operations | | $286,360,477 |
See accompanying notes which are an integral part of the financial statements.
Statement of Changes in Net Assets
| | Year ended March 31, 2022 | Year ended March 31, 2021 |
| Increase (Decrease) in Net Assets | | |
| Operations | | |
| Net investment income (loss) | $196,008,639 | $75,498,841 |
| Net realized gain (loss) | 922,029,347 | 472,399,259 |
| Change in net unrealized appreciation (depreciation) | (831,677,509) | 2,509,420,003 |
| Net increase (decrease) in net assets resulting from operations | 286,360,477 | 3,057,318,103 |
| Distributions to shareholders | (951,977,956) | (325,870,637) |
| Share transactions - net increase (decrease) | 909,068,394 | 641,326,242 |
| Total increase (decrease) in net assets | 243,450,915 | 3,372,773,708 |
| Net Assets | | |
| Beginning of period | 8,603,291,744 | 5,230,518,036 |
| End of period | $8,846,742,659 | $8,603,291,744 |
See accompanying notes which are an integral part of the financial statements.
Financial Highlights
Fidelity Freedom 2055 Fund
| Years ended March 31, | 2022 | 2021 | 2020 | 2019 | 2018 |
| Selected Per–Share Data | | | | | |
| Net asset value, beginning of period | $16.46 | $10.95 | $13.10 | $13.70 | $12.41 |
| Income from Investment Operations | | | | | |
| Net investment income (loss)A,B | .35 | .14 | .20 | .19 | .14 |
| Net realized and unrealized gain (loss) | .25 | 6.02 | (1.49) | –C | 1.64 |
| Total from investment operations | .60 | 6.16 | (1.29) | .19 | 1.78 |
| Distributions from net investment income | (.37) | (.16) | (.20) | (.19) | (.15) |
| Distributions from net realized gain | (1.46) | (.50) | (.66) | (.60) | (.34) |
| Total distributions | (1.82)D | (.65)D | (.86) | (.79) | (.49) |
| Net asset value, end of period | $15.24 | $16.46 | $10.95 | $13.10 | $13.70 |
| Total ReturnE | 3.21% | 57.70% | (10.85)% | 1.73% | 14.49% |
| Ratios to Average Net AssetsB,F,G | | | | | |
| Expenses before reductions | .75% | .75% | .75% | .75% | .64%H |
| Expenses net of fee waivers, if any | .75% | .75% | .75% | .75% | .64%H |
| Expenses net of all reductions | .75% | .75% | .75% | .75% | .64%H |
| Net investment income (loss) | 2.12% | .97% | 1.54% | 1.40% | 1.06% |
| Supplemental Data | | | | | |
| Net assets, end of period (000 omitted) | $2,747,697 | $2,561,622 | $1,500,450 | $1,490,393 | $1,265,311 |
| Portfolio turnover rateI | 29% | 21% | 25% | 18% | 15%J |
A Calculated based on average shares outstanding during the period.
B Net investment income (loss) is affected by the timing of the declaration of dividends by any underlying mutual funds or exchange-traded funds (ETFs). Net investment income (loss) of any such underlying funds is not included in the Fund's net investment income (loss) ratio.
C Amount represents less than $.005 per share.
D Total distributions per share do not sum due to rounding.
E Total returns would have been lower if certain expenses had not been reduced during the applicable periods shown.
F Fees and expenses of any underlying mutual funds or exchange-traded funds (ETFs) are not included in the Fund's expense ratio. The Fund indirectly bears its proportionate share of these expenses. For additional expense information related to investments in Fidelity Central Funds, please refer to the "Investments in Fidelity Central Funds" note found in the Notes to Financial Statements section of the most recent Annual or Semi-Annual report.
G Expense ratios reflect operating expenses of the class. Expenses before reductions do not reflect amounts reimbursed, waived, or reduced through arrangements with the investment adviser, brokerage services, or other offset arrangements, if applicable, and do not represent the amount paid by the class during periods when reimbursements, waivers or reductions occur.
H On certain classes, the size and fluctuation of net assets and expense amounts may cause ratios to differ from contractual rates.
I Amount does not include the portfolio activity of any underlying mutual funds or exchange-traded funds (ETFs).
J The portfolio turnover rate does not include the assets acquired in the merger.
See accompanying notes which are an integral part of the financial statements.
Fidelity Freedom 2055 Fund Class K
| Years ended March 31, | 2022 | 2021 | 2020 | 2019 | 2018 A |
| Selected Per–Share Data | | | | | |
| Net asset value, beginning of period | $16.45 | $10.95 | $13.09 | $13.69 | $13.11 |
| Income from Investment Operations | | | | | |
| Net investment income (loss)B,C | .37 | .15 | .21 | .20 | .19 |
| Net realized and unrealized gain (loss) | .25 | 6.01 | (1.48) | –D | .76 |
| Total from investment operations | .62 | 6.16 | (1.27) | .20 | .95 |
| Distributions from net investment income | (.38) | (.17) | (.21) | (.20) | (.17) |
| Distributions from net realized gain | (1.46) | (.50) | (.66) | (.60) | (.20) |
| Total distributions | (1.83)E | (.66)E | (.87) | (.80) | (.37) |
| Net asset value, end of period | $15.24 | $16.45 | $10.95 | $13.09 | $13.69 |
| Total ReturnF,G | 3.33% | 57.70% | (10.70)% | 1.84% | 7.26% |
| Ratios to Average Net AssetsC,H,I | | | | | |
| Expenses before reductions | .64%J | .64% | .64% | .64% | .65%J,K |
| Expenses net of fee waivers, if any | .64%J | .64% | .64% | .64% | .65%J,K |
| Expenses net of all reductions | .64%J | .64% | .64% | .64% | .65%J,K |
| Net investment income (loss) | 2.22% | 1.07% | 1.64% | 1.50% | 2.01%K |
| Supplemental Data | | | | | |
| Net assets, end of period (000 omitted) | $4,350,522 | $4,567,253 | $2,984,272 | $3,138,528 | $2,992,599 |
| Portfolio turnover rateL | 29% | 21% | 25% | 18% | 15%M |
A For the period July 20, 2017 (commencement of sale of shares) through March 31, 2018.
B Calculated based on average shares outstanding during the period.
C Net investment income (loss) is affected by the timing of the declaration of dividends by any underlying mutual funds or exchange-traded funds (ETFs). Net investment income (loss) of any such underlying funds is not included in the Fund's net investment income (loss) ratio.
D Amount represents less than $.005 per share.
E Total distributions per share do not sum due to rounding.
F Total returns for periods of less than one year are not annualized.
G Total returns would have been lower if certain expenses had not been reduced during the applicable periods shown.
H Fees and expenses of any underlying mutual funds or exchange-traded funds (ETFs) are not included in the Fund's expense ratio. The Fund indirectly bears its proportionate share of these expenses. For additional expense information related to investments in Fidelity Central Funds, please refer to the "Investments in Fidelity Central Funds" note found in the Notes to Financial Statements section of the most recent Annual or Semi-Annual report.
I Expense ratios reflect operating expenses of the class. Expenses before reductions do not reflect amounts reimbursed, waived, or reduced through arrangements with the investment adviser, brokerage services, or other offset arrangements, if applicable, and do not represent the amount paid by the class during periods when reimbursements, waivers or reductions occur.
J On certain classes, the size and fluctuation of net assets and expense amounts may cause ratios to differ from contractual rates.
K Annualized
L Amount does not include the portfolio activity of any underlying mutual funds or exchange-traded funds (ETFs).
M The portfolio turnover rate does not include the assets acquired in the merger.
See accompanying notes which are an integral part of the financial statements.
Fidelity Freedom 2055 Fund Class K6
| Years ended March 31, | 2022 | 2021 | 2020 | 2019 | 2018 A |
| Selected Per–Share Data | | | | | |
| Net asset value, beginning of period | $16.43 | $10.93 | $13.08 | $13.70 | $12.83 |
| Income from Investment Operations | | | | | |
| Net investment income (loss)B,C | .39 | .17 | .23 | .21 | .16 |
| Net realized and unrealized gain (loss) | .26 | 6.01 | (1.48) | –D | 1.09 |
| Total from investment operations | .65 | 6.18 | (1.25) | .21 | 1.25 |
| Distributions from net investment income | (.40) | (.19) | (.23) | (.23) | (.17) |
| Distributions from net realized gain | (1.46) | (.50) | (.67) | (.60) | (.20) |
| Total distributions | (1.86) | (.68)E | (.90) | (.83) | (.38)E |
| Net asset value, end of period | $15.22 | $16.43 | $10.93 | $13.08 | $13.70 |
| Total ReturnF,G | 3.51% | 58.01% | (10.61)% | 1.97% | 9.70% |
| Ratios to Average Net AssetsC,H,I | | | | | |
| Expenses before reductions | .49%J | .49% | .49% | .50%J | .50%J,K |
| Expenses net of fee waivers, if any | .49%J | .49% | .49% | .50%J | .50%J,K |
| Expenses net of all reductions | .49%J | .49% | .49% | .50%J | .50%J,K |
| Net investment income (loss) | 2.37% | 1.22% | 1.79% | 1.65% | 1.43%K |
| Supplemental Data | | | | | |
| Net assets, end of period (000 omitted) | $1,748,523 | $1,474,416 | $745,795 | $541,624 | $135,481 |
| Portfolio turnover rateL | 29% | 21% | 25% | 18% | 15%M |
A For the period June 7, 2017 (commencement of sale of shares) through March 31, 2018.
B Calculated based on average shares outstanding during the period.
C Net investment income (loss) is affected by the timing of the declaration of dividends by any underlying mutual funds or exchange-traded funds (ETFs). Net investment income (loss) of any such underlying funds is not included in the Fund's net investment income (loss) ratio.
D Amount represents less than $.005 per share.
E Total distributions per share do not sum due to rounding.
F Total returns for periods of less than one year are not annualized.
G Total returns would have been lower if certain expenses had not been reduced during the applicable periods shown.
H Fees and expenses of any underlying mutual funds or exchange-traded funds (ETFs) are not included in the Fund's expense ratio. The Fund indirectly bears its proportionate share of these expenses. For additional expense information related to investments in Fidelity Central Funds, please refer to the "Investments in Fidelity Central Funds" note found in the Notes to Financial Statements section of the most recent Annual or Semi-Annual report.
I Expense ratios reflect operating expenses of the class. Expenses before reductions do not reflect amounts reimbursed, waived, or reduced through arrangements with the investment adviser, brokerage services, or other offset arrangements, if applicable, and do not represent the amount paid by the class during periods when reimbursements, waivers or reductions occur.
J On certain classes, the size and fluctuation of net assets and expense amounts may cause ratios to differ from contractual rates.
K Annualized
L Amount does not include the portfolio activity of any underlying mutual funds or exchange-traded funds (ETFs).
M The portfolio turnover rate does not include the assets acquired in the merger.
See accompanying notes which are an integral part of the financial statements.
Fidelity Freedom® 2060 Fund
Investment Summary (Unaudited)
The information in the following tables is based on the direct investments of the Fund.
Top Holdings as of March 31, 2022
| | % of fund's net assets |
| Fidelity Series Emerging Markets Opportunities Fund | 12.7 |
| Fidelity Series Growth Company Fund | 8.0 |
| Fidelity Series Intrinsic Opportunities Fund | 7.5 |
| Fidelity Series International Value Fund | 7.5 |
| Fidelity Series Overseas Fund | 7.5 |
| Fidelity Series International Growth Fund | 7.4 |
| Fidelity Series Large Cap Stock Fund | 7.1 |
| Fidelity Series Stock Selector Large Cap Value Fund | 6.0 |
| Fidelity Series Long-Term Treasury Bond Index Fund | 5.3 |
| Fidelity Series Value Discovery Fund | 4.6 |
| | 73.6 |
Asset Allocation (% of fund's net assets)
| Period end |
| | Domestic Equity Funds | 50.4% |
| | International Equity Funds | 41.8% |
| | Bond Funds | 7.7% |
| | Short-Term Funds | 0.1% |

Domestic Equity Funds category includes Fidelity Series Commodity Strategy Fund which invests in commodity-related investments.
Fidelity Freedom® 2060 Fund
Schedule of Investments March 31, 2022
Showing Percentage of Net Assets
| U.S. Treasury Obligations - 0.0% | | | |
| | | Principal Amount | Value |
| U.S. Treasury Bills, yield at date of purchase 0.12% to 0.17% 4/14/22 to 4/21/22 (a) | | | |
| (Cost $2,119,834) | | 2,120,000 | 2,119,865 |
| | | Shares | Value |
|
| Domestic Equity Funds - 50.4% | | | |
| Fidelity Series All-Sector Equity Fund (b) | | 6,644,904 | $71,632,070 |
| Fidelity Series Blue Chip Growth Fund (b) | | 8,184,372 | 117,609,421 |
| Fidelity Series Commodity Strategy Fund (b) | | 10,627,682 | 54,307,455 |
| Fidelity Series Growth Company Fund (b) | | 16,116,038 | 293,150,735 |
| Fidelity Series Intrinsic Opportunities Fund (b) | | 14,007,884 | 275,535,074 |
| Fidelity Series Large Cap Stock Fund (b) | | 13,713,870 | 260,700,664 |
| Fidelity Series Large Cap Value Index Fund (b) | | 6,388,340 | 98,124,897 |
| Fidelity Series Opportunistic Insights Fund (b) | | 8,215,023 | 150,170,612 |
| Fidelity Series Small Cap Discovery Fund (b) | | 2,389,662 | 31,997,569 |
| Fidelity Series Small Cap Opportunities Fund (b) | | 7,789,123 | 106,087,853 |
| Fidelity Series Stock Selector Large Cap Value Fund (b) | | 16,204,398 | 219,569,592 |
| Fidelity Series Value Discovery Fund (b) | | 10,440,277 | 167,044,439 |
| TOTAL DOMESTIC EQUITY FUNDS | | | |
| (Cost $1,665,221,847) | | | 1,845,930,381 |
|
| International Equity Funds - 41.8% | | | |
| Fidelity Series Canada Fund (b) | | 7,667,623 | 119,001,508 |
| Fidelity Series Emerging Markets Fund (b) | | 5,390,605 | 50,024,818 |
| Fidelity Series Emerging Markets Opportunities Fund (b) | | 25,232,336 | 464,274,981 |
| Fidelity Series International Growth Fund (b) | | 16,415,212 | 272,164,209 |
| Fidelity Series International Small Cap Fund (b) | | 4,154,425 | 74,571,934 |
| Fidelity Series International Value Fund (b) | | 24,918,117 | 274,846,826 |
| Fidelity Series Overseas Fund (b) | | 21,683,261 | 273,642,751 |
| TOTAL INTERNATIONAL EQUITY FUNDS | | | |
| (Cost $1,465,844,417) | | | 1,528,527,027 |
|
| Bond Funds - 7.7% | | | |
| Fidelity Series 5+ Year Inflation-Protected Bond Index Fund (b) | | 381,383 | 3,661,274 |
| Fidelity Series Emerging Markets Debt Fund (b) | | 2,172,019 | 17,919,154 |
| Fidelity Series Emerging Markets Debt Local Currency Fund (b) | | 672,862 | 6,062,490 |
| Fidelity Series Floating Rate High Income Fund (b) | | 398,605 | 3,663,182 |
| Fidelity Series High Income Fund (b) | | 2,424,877 | 22,042,135 |
| Fidelity Series International Credit Fund (b) | | 29,758 | 275,559 |
| Fidelity Series Investment Grade Bond Fund (b) | | 1,736,369 | 18,943,784 |
| Fidelity Series Long-Term Treasury Bond Index Fund (b) | | 25,611,413 | 195,158,968 |
| Fidelity Series Real Estate Income Fund (b) | | 1,152,046 | 13,087,241 |
| TOTAL BOND FUNDS | | | |
| (Cost $300,406,069) | | | 280,813,787 |
|
| Short-Term Funds - 0.1% | | | |
| Fidelity Cash Central Fund 0.31% (c) | | | |
| (Cost $2,437,675) | | 2,437,225 | 2,437,712 |
| TOTAL INVESTMENT IN SECURITIES - 100.0% | | | |
| (Cost $3,436,029,842) | | | 3,659,828,772 |
| NET OTHER ASSETS (LIABILITIES) - 0.0% | | | (235,550) |
| NET ASSETS - 100% | | | $3,659,593,222 |
| Futures Contracts | | | | | |
| | Number of contracts | Expiration Date | Notional Amount | Value | Unrealized Appreciation/(Depreciation) |
| Purchased | | | | | |
| Equity Index Contracts | | | | | |
| ICE E-mini MSCI EAFE Index Contracts (United States) | 89 | June 2022 | $9,542,580 | $290,976 | $290,976 |
| ICE E-mini MSCI Emerging Markets Index Contracts (United States) | 281 | June 2022 | 15,813,275 | 354,960 | 354,960 |
| TOTAL PURCHASED | | | | | $645,936 |
| Sold | | | | | |
| Equity Index Contracts | | | | | |
| CME Micro E-mini S&P 500 Index Contracts (United States) | 89 | June 2022 | 20,161,838 | (454,314) | (454,314) |
| TOTAL FUTURES CONTRACTS | | | | | $191,622 |
The notional amount of futures purchased as a percentage of Net Assets is 0.7%
The notional amount of futures sold as a percentage of Net Assets is 0.6%
Legend
(a) Security or a portion of the security was pledged to cover margin requirements for futures contracts. At period end, the value of securities pledged amounted to $1,142,931.
(b) Affiliated Fund
(c) Affiliated fund that is generally available only to investment companies and other accounts managed by Fidelity Investments. The rate quoted is the annualized seven-day yield of the fund at period end. A complete unaudited listing of the fund's holdings as of its most recent quarter end is available upon request. In addition, each Fidelity Central Fund's financial statements, which are not covered by the Fund's Report of Independent Registered Public Accounting Firm, are available on the SEC's website or upon request.
Affiliated Central Funds
Fiscal year to date information regarding the Fund's investments in Fidelity Central Funds, including the ownership percentage, is presented below.
| Fund | Value, beginning of period | Purchases | Sales Proceeds | Dividend Income | Realized Gain/Loss | Change in Unrealized appreciation (depreciation) | Value, end of period | % ownership, end of period |
| Fidelity Cash Central Fund 0.31% | $1,156,736 | $15,063,829 | $13,782,854 | $1,083 | $-- | $1 | $2,437,712 | 0.0% |
| Total | $1,156,736 | $15,063,829 | $13,782,854 | $1,083 | $-- | $1 | $2,437,712 | |
Amounts in the income column in the above table include any capital gain distributions from underlying funds, which are presented in the corresponding line-item in the Statement of Operations, if applicable.
Affiliated Underlying Funds
Fiscal year to date information regarding the Fund's investments in affiliated Underlying Funds is presented below. Exchanges between classes of the same affiliated Underlying Funds may occur. If an underlying Fund changes its name, the name presented below is the name in effect at period end.
| Fund | Value, beginning of period | Purchases(a) | Sales Proceeds(a) | Dividend Income | Realized Gain (loss) | Change in Unrealized appreciation (depreciation) | Value, end of period |
| Fidelity Series 0-5 Year Inflation-Protected Bond Index Fund | $-- | $16,058,332 | $15,996,274 | $49,866 | $(54,631) | $-- | $-- |
| Fidelity Series 5+ Year Inflation-Protected Bond Index Fund | -- | 32,486,322 | 27,618,748 | 159,186 | (1,095,789) | (110,511) | 3,661,274 |
| Fidelity Series All-Sector Equity Fund | 61,974,277 | 31,189,993 | 15,987,512 | 13,521,561 | (108,544) | (5,436,144) | 71,632,070 |
| Fidelity Series Blue Chip Growth Fund | 98,319,479 | 70,933,498 | 33,687,021 | 22,154,905 | 173,792 | (18,130,327) | 117,609,421 |
| Fidelity Series Canada Fund | 76,101,144 | 39,430,375 | 14,703,194 | 2,241,467 | 34,134 | 18,139,049 | 119,001,508 |
| Fidelity Series Commodity Strategy Fund | 87,009,427 | 48,234,841 | 85,022,967 | 28,880,247 | (2,288,929) | 6,375,083 | 54,307,455 |
| Fidelity Series Emerging Markets Debt Fund | 17,020,992 | 6,208,746 | 3,530,562 | 838,183 | (168,615) | (1,611,407) | 17,919,154 |
| Fidelity Series Emerging Markets Debt Local Currency Fund | 5,578,196 | 2,219,545 | 1,069,618 | 243,151 | (62,708) | (602,925) | 6,062,490 |
| Fidelity Series Emerging Markets Fund | 49,863,873 | 20,748,844 | 9,177,146 | 1,686,718 | 285 | (11,411,038) | 50,024,818 |
| Fidelity Series Emerging Markets Opportunities Fund | 449,650,914 | 244,284,088 | 81,588,767 | 53,177,193 | (387,519) | (147,683,735) | 464,274,981 |
| Fidelity Series Floating Rate High Income Fund | 3,270,149 | 1,107,540 | 713,380 | 151,265 | (8,841) | 7,714 | 3,663,182 |
| Fidelity Series Government Money Market Fund 0.31% | 20,754,237 | 2,265,856 | 23,020,093 | 4,611 | -- | -- | -- |
| Fidelity Series Growth Company Fund | 250,917,244 | 199,395,026 | 104,017,470 | 75,337,487 | 2,185,163 | (55,329,228) | 293,150,735 |
| Fidelity Series High Income Fund | 19,601,276 | 7,275,788 | 4,124,110 | 1,145,133 | (31,160) | (679,659) | 22,042,135 |
| Fidelity Series Inflation-Protected Bond Index Fund | 62,660,351 | 12,866,075 | 77,981,850 | 693,710 | 5,037,662 | (2,582,238) | -- |
| Fidelity Series International Credit Fund | 287,610 | 9,282 | -- | 9,282 | -- | (21,333) | 275,559 |
| Fidelity Series International Growth Fund | 213,242,533 | 110,510,771 | 26,622,600 | 21,001,153 | (240,740) | (24,725,755) | 272,164,209 |
| Fidelity Series International Small Cap Fund | 67,009,481 | 27,876,118 | 8,903,215 | 9,553,535 | 7,435 | (11,417,885) | 74,571,934 |
| Fidelity Series International Value Fund | 213,237,689 | 109,313,427 | 50,700,911 | 13,185,877 | (28,069) | 3,024,690 | 274,846,826 |
| Fidelity Series Intrinsic Opportunities Fund | 251,897,810 | 122,292,729 | 73,424,146 | 47,212,957 | (1,418,644) | (23,812,675) | 275,535,074 |
| Fidelity Series Investment Grade Bond Fund | 1,342,213 | 30,147,724 | 12,283,480 | 73,452 | (236,267) | (26,406) | 18,943,784 |
| Fidelity Series Large Cap Stock Fund | 220,205,711 | 84,467,941 | 50,745,058 | 21,616,145 | 883,604 | 5,888,466 | 260,700,664 |
| Fidelity Series Large Cap Value Index Fund | 81,175,981 | 29,571,567 | 16,339,012 | 6,065,125 | 320,481 | 3,395,880 | 98,124,897 |
| Fidelity Series Long-Term Treasury Bond Index Fund | 85,714,612 | 142,649,792 | 24,186,774 | 2,782,957 | (3,084,236) | (5,934,426) | 195,158,968 |
| Fidelity Series Opportunistic Insights Fund | 128,538,017 | 76,651,125 | 41,262,993 | 26,428,237 | 948,325 | (14,703,862) | 150,170,612 |
| Fidelity Series Overseas Fund | 213,593,299 | 94,462,775 | 30,228,271 | 7,769,042 | 249,174 | (4,434,226) | 273,642,751 |
| Fidelity Series Real Estate Income Fund | 11,962,599 | 3,366,934 | 2,553,728 | 511,188 | (11,426) | 322,862 | 13,087,241 |
| Fidelity Series Short-Term Credit Fund | 4,369,718 | 319,367 | 4,689,373 | 20,990 | 93,821 | (93,533) | -- |
| Fidelity Series Small Cap Discovery Fund | 27,556,071 | 12,247,446 | 5,606,115 | 4,934,173 | 183,424 | (2,383,257) | 31,997,569 |
| Fidelity Series Small Cap Opportunities Fund | 92,151,690 | 57,540,721 | 20,455,348 | 25,300,806 | (692,067) | (22,457,143) | 106,087,853 |
| Fidelity Series Stock Selector Large Cap Value Fund | 186,148,436 | 92,231,087 | 47,792,572 | 37,399,166 | (546,849) | (10,470,510) | 219,569,592 |
| Fidelity Series Value Discovery Fund | 143,152,660 | 60,825,563 | 37,092,486 | 18,710,007 | 440,551 | (281,849) | 167,044,439 |
| | $3,144,307,689 | $1,789,189,238 | $951,124,794 | $442,858,775 | $92,817 | $(327,186,328) | $3,655,271,195 |
(a) Includes the value of shares purchased or redeemed through in-kind transactions, if applicable.
Amounts in the income column in the above table include any capital gain distributions from underlying funds, which are presented in the corresponding line-item in the Statement of Operations, if applicable.
Investment Valuation
The following is a summary of the inputs used, as of March 31, 2022, involving the Fund's assets and liabilities carried at fair value. The inputs or methodology used for valuing securities may not be an indication of the risk associated with investing in those securities. For more information on valuation inputs, and their aggregation into the levels used below, please refer to the Investment Valuation section in the accompanying Notes to Financial Statements.
| | Valuation Inputs at Reporting Date: |
| Description | Total | Level 1 | Level 2 | Level 3 |
| Investments in Securities: | | | | |
| Other Short-Term Investments | $2,119,865 | $-- | $2,119,865 | $-- |
| Domestic Equity Funds | 1,845,930,381 | 1,845,930,381 | -- | -- |
| International Equity Funds | 1,528,527,027 | 1,528,527,027 | -- | -- |
| Bond Funds | 280,813,787 | 280,813,787 | -- | -- |
| Short-Term Funds | 2,437,712 | 2,437,712 | -- | -- |
| Total Investments in Securities: | $3,659,828,772 | $3,657,708,907 | $2,119,865 | $-- |
| Derivative Instruments: | | | | |
| Assets | | | | |
| Futures Contracts | $645,936 | $645,936 | $-- | $-- |
| Total Assets | $645,936 | $645,936 | $-- | $-- |
| Liabilities | | | | |
| Futures Contracts | $(454,314) | $(454,314) | $-- | $-- |
| Total Liabilities | $(454,314) | $(454,314) | $-- | $-- |
| Total Derivative Instruments: | $191,622 | $191,622 | $-- | $-- |
Value of Derivative Instruments
The following table is a summary of the Fund's value of derivative instruments by primary risk exposure as of March 31, 2022. For additional information on derivative instruments, please refer to the Derivative Instruments section in the accompanying Notes to Financial Statements.
| Primary Risk Exposure / Derivative Type | Value |
| | Asset | Liability |
| Equity Risk | | |
| Futures Contracts(a) | $645,936 | $(454,314) |
| Total Equity Risk | 645,936 | (454,314) |
| Total Value of Derivatives | $645,936 | $(454,314) |
(a) Reflects gross cumulative appreciation (depreciation) on futures contracts as presented in the Schedule of Investments. In the Statement of Assets and Liabilities, the period end daily variation margin is included in receivable or payable for daily variation margin on futures contracts, and the net cumulative appreciation (depreciation) is included in Total accumulated earnings (loss).
See accompanying notes which are an integral part of the financial statements.
Fidelity Freedom® 2060 Fund
Financial Statements
Statement of Assets and Liabilities
| | | March 31, 2022 |
| Assets | | |
Investment in securities, at value — See accompanying schedule:
Unaffiliated issuers (cost $2,119,834) | $2,119,865 | |
| Fidelity Central Funds (cost $2,437,675) | 2,437,712 | |
| Other affiliated issuers (cost $3,431,472,333) | 3,655,271,195 | |
| Total Investment in Securities (cost $3,436,029,842) | | $3,659,828,772 |
| Receivable for investments sold | | 51,829,412 |
| Receivable for fund shares sold | | 11,896,940 |
| Distributions receivable from Fidelity Central Funds | | 372 |
| Other receivables | | 1 |
| Total assets | | 3,723,555,497 |
| Liabilities | | |
| Payable for investments purchased | $54,276,955 | |
| Payable for fund shares redeemed | 7,642,843 | |
| Accrued management fee | 1,888,678 | |
| Payable for daily variation margin on futures contracts | 153,799 | |
| Total liabilities | | 63,962,275 |
| Net Assets | | $3,659,593,222 |
| Net Assets consist of: | | |
| Paid in capital | | $3,248,316,647 |
| Total accumulated earnings (loss) | | 411,276,575 |
| Net Assets | | $3,659,593,222 |
| Net Asset Value and Maximum Offering Price | | |
| Fidelity Freedom 2060 Fund: | | |
| Net Asset Value, offering price and redemption price per share ($1,070,581,166 ÷ 76,914,032 shares) | | $13.92 |
| Class K: | | |
| Net Asset Value, offering price and redemption price per share ($1,829,607,947 ÷ 131,483,200 shares) | | $13.92 |
| Class K6: | | |
| Net Asset Value, offering price and redemption price per share ($759,404,109 ÷ 54,608,061 shares) | | $13.91 |
See accompanying notes which are an integral part of the financial statements.
Statement of Operations
| | | Year ended March 31, 2022 |
| Investment Income | | |
| Dividends: | | |
| Affiliated issuers | | $99,529,127 |
| Interest | | 891 |
| Income from Fidelity Central Funds | | 1,083 |
| Total income | | 99,531,101 |
| Expenses | | |
| Management fee | $22,277,037 | |
| Independent trustees' fees and expenses | 10,162 | |
| Total expenses before reductions | 22,287,199 | |
| Expense reductions | (1) | |
| Total expenses after reductions | | 22,287,198 |
| Net investment income (loss) | | 77,243,903 |
| Realized and Unrealized Gain (Loss) | | |
| Net realized gain (loss) on: | | |
| Investment securities: | | |
| Unaffiliated issuers | 849 | |
| Affiliated issuers | 92,817 | |
| Futures contracts | (140,587) | |
| Capital gain distributions from underlying funds: | | |
| Affiliated issuers | 343,329,648 | |
| Total net realized gain (loss) | | 343,282,727 |
| Change in net unrealized appreciation (depreciation) on: | | |
| Investment securities: | | |
| Unaffiliated issuers | 24 | |
| Fidelity Central Funds | 1 | |
| Other affiliated issuers | (327,186,328) | |
| Futures contracts | 191,622 | |
| Total change in net unrealized appreciation (depreciation) | | (326,994,681) |
| Net gain (loss) | | 16,288,046 |
| Net increase (decrease) in net assets resulting from operations | | $93,531,949 |
See accompanying notes which are an integral part of the financial statements.
Statement of Changes in Net Assets
| | Year ended March 31, 2022 | Year ended March 31, 2021 |
| Increase (Decrease) in Net Assets | | |
| Operations | | |
| Net investment income (loss) | $77,243,903 | $25,946,111 |
| Net realized gain (loss) | 343,282,727 | 148,518,160 |
| Change in net unrealized appreciation (depreciation) | (326,994,681) | 840,190,684 |
| Net increase (decrease) in net assets resulting from operations | 93,531,949 | 1,014,654,955 |
| Distributions to shareholders | (338,468,682) | (98,835,588) |
| Share transactions - net increase (decrease) | 759,476,755 | 613,987,503 |
| Total increase (decrease) in net assets | 514,540,022 | 1,529,806,870 |
| Net Assets | | |
| Beginning of period | 3,145,053,200 | 1,615,246,330 |
| End of period | $3,659,593,222 | $3,145,053,200 |
See accompanying notes which are an integral part of the financial statements.
Financial Highlights
Fidelity Freedom 2060 Fund
| Years ended March 31, | 2022 | 2021 | 2020 | 2019 | 2018 |
| Selected Per–Share Data | | | | | |
| Net asset value, beginning of period | $14.89 | $9.87 | $11.76 | $12.20 | $11.01 |
| Income from Investment Operations | | | | | |
| Net investment income (loss)A,B | .32 | .13 | .19 | .17 | .13 |
| Net realized and unrealized gain (loss) | .22 | 5.43 | (1.34) | .01 | 1.46 |
| Total from investment operations | .54 | 5.56 | (1.15) | .18 | 1.59 |
| Distributions from net investment income | (.33) | (.15) | (.19) | (.16) | (.13) |
| Distributions from net realized gain | (1.18) | (.39) | (.55) | (.45) | (.26) |
| Total distributions | (1.51) | (.54) | (.74) | (.62)C | (.40)C |
| Net asset value, end of period | $13.92 | $14.89 | $9.87 | $11.76 | $12.20 |
| Total ReturnD | 3.21% | 57.57% | (10.80)% | 1.78% | 14.50% |
| Ratios to Average Net AssetsB,E,F | | | | | |
| Expenses before reductions | .75% | .75% | .75% | .75% | .66%G |
| Expenses net of fee waivers, if any | .75% | .75% | .75% | .75% | .66%G |
| Expenses net of all reductions | .75% | .75% | .75% | .75% | .66%G |
| Net investment income (loss) | 2.14% | .99% | 1.59% | 1.46% | 1.09% |
| Supplemental Data | | | | | |
| Net assets, end of period (000 omitted) | $1,070,581 | $891,301 | $451,002 | $367,472 | $241,896 |
| Portfolio turnover rateH | 28% | 18% | 25% | 16% | 11%I |
A Calculated based on average shares outstanding during the period.
B Net investment income (loss) is affected by the timing of the declaration of dividends by any underlying mutual funds or exchange-traded funds (ETFs). Net investment income (loss) of any such underlying funds is not included in the Fund's net investment income (loss) ratio.
C Total distributions per share do not sum due to rounding.
D Total returns would have been lower if certain expenses had not been reduced during the applicable periods shown.
E Fees and expenses of any underlying mutual funds or exchange-traded funds (ETFs) are not included in the Fund's expense ratio. The Fund indirectly bears its proportionate share of these expenses. For additional expense information related to investments in Fidelity Central Funds, please refer to the "Investments in Fidelity Central Funds" note found in the Notes to Financial Statements section of the most recent Annual or Semi-Annual report.
F Expense ratios reflect operating expenses of the class. Expenses before reductions do not reflect amounts reimbursed, waived, or reduced through arrangements with the investment adviser, brokerage services, or other offset arrangements, if applicable, and do not represent the amount paid by the class during periods when reimbursements, waivers or reductions occur.
G On certain classes, the size and fluctuation of net assets and expense amounts may cause ratios to differ from contractual rates.
H Amount does not include the portfolio activity of any underlying mutual funds or exchange-traded funds (ETFs).
I The portfolio turnover rate does not include the assets acquired in the merger.
See accompanying notes which are an integral part of the financial statements.
Fidelity Freedom 2060 Fund Class K
| Years ended March 31, | 2022 | 2021 | 2020 | 2019 | 2018 A |
| Selected Per–Share Data | | | | | |
| Net asset value, beginning of period | $14.88 | $9.86 | $11.74 | $12.19 | $11.65 |
| Income from Investment Operations | | | | | |
| Net investment income (loss)B,C | .34 | .14 | .20 | .19 | .16 |
| Net realized and unrealized gain (loss) | .22 | 5.43 | (1.34) | (.01) | .68 |
| Total from investment operations | .56 | 5.57 | (1.14) | .18 | .84 |
| Distributions from net investment income | (.34) | (.15) | (.19) | (.17) | (.15) |
| Distributions from net realized gain | (1.18) | (.39) | (.55) | (.45) | (.15) |
| Total distributions | (1.52) | (.55)D | (.74) | (.63)D | (.30) |
| Net asset value, end of period | $13.92 | $14.88 | $9.86 | $11.74 | $12.19 |
| Total ReturnE,F | 3.35% | 57.77% | (10.66)% | 1.80% | 7.19% |
| Ratios to Average Net AssetsC,G,H | | | | | |
| Expenses before reductions | .64%I | .64% | .64% | .64% | .65%I,J |
| Expenses net of fee waivers, if any | .64%I | .64% | .64% | .64% | .65%I,J |
| Expenses net of all reductions | .64%I | .64% | .64% | .64% | .65%I,J |
| Net investment income (loss) | 2.24% | 1.09% | 1.69% | 1.57% | 1.92%J |
| Supplemental Data | | | | | |
| Net assets, end of period (000 omitted) | $1,829,608 | $1,714,287 | $933,551 | $784,848 | $549,158 |
| Portfolio turnover rateK | 28% | 18% | 25% | 16% | 11%L |
A For the period July 20, 2017 (commencement of sale of shares) through March 31, 2018.
B Calculated based on average shares outstanding during the period.
C Net investment income (loss) is affected by the timing of the declaration of dividends by any underlying mutual funds or exchange-traded funds (ETFs). Net investment income (loss) of any such underlying funds is not included in the Fund's net investment income (loss) ratio.
D Total distributions per share do not sum due to rounding.
E Total returns for periods of less than one year are not annualized.
F Total returns would have been lower if certain expenses had not been reduced during the applicable periods shown.
G Fees and expenses of any underlying mutual funds or exchange-traded funds (ETFs) are not included in the Fund's expense ratio. The Fund indirectly bears its proportionate share of these expenses. For additional expense information related to investments in Fidelity Central Funds, please refer to the "Investments in Fidelity Central Funds" note found in the Notes to Financial Statements section of the most recent Annual or Semi-Annual report.
H Expense ratios reflect operating expenses of the class. Expenses before reductions do not reflect amounts reimbursed, waived, or reduced through arrangements with the investment adviser, brokerage services, or other offset arrangements, if applicable, and do not represent the amount paid by the class during periods when reimbursements, waivers or reductions occur.
I On certain classes, the size and fluctuation of net assets and expense amounts may cause ratios to differ from contractual rates.
J Annualized
K Amount does not include the portfolio activity of any underlying mutual funds or exchange-traded funds (ETFs).
L The portfolio turnover rate does not include the assets acquired in the merger.
See accompanying notes which are an integral part of the financial statements.
Fidelity Freedom 2060 Fund Class K6
| Years ended March 31, | 2022 | 2021 | 2020 | 2019 | 2018 A |
| Selected Per–Share Data | | | | | |
| Net asset value, beginning of period | $14.87 | $9.85 | $11.75 | $12.20 | $11.40 |
| Income from Investment Operations | | | | | |
| Net investment income (loss)B,C | .36 | .16 | .22 | .20 | .14 |
| Net realized and unrealized gain (loss) | .22 | 5.43 | (1.35) | –D | .96 |
| Total from investment operations | .58 | 5.59 | (1.13) | .20 | 1.10 |
| Distributions from net investment income | (.36) | (.17) | (.21) | (.20) | (.15) |
| Distributions from net realized gain | (1.18) | (.40) | (.56) | (.45) | (.15) |
| Total distributions | (1.54) | (.57) | (.77) | (.65) | (.30) |
| Net asset value, end of period | $13.91 | $14.87 | $9.85 | $11.75 | $12.20 |
| Total ReturnE,F | 3.51% | 58.07% | (10.65)% | 2.05% | 9.65% |
| Ratios to Average Net AssetsC,G,H | | | | | |
| Expenses before reductions | .49%I | .49% | .49% | .50%I | .50%I,J |
| Expenses net of fee waivers, if any | .49%I | .49% | .49% | .50%I | .50%I,J |
| Expenses net of all reductions | .49%I | .49% | .49% | .50%I | .50%I,J |
| Net investment income (loss) | 2.39% | 1.24% | 1.84% | 1.71% | 1.44%J |
| Supplemental Data | | | | | |
| Net assets, end of period (000 omitted) | $759,404 | $539,465 | $230,693 | $136,574 | $26,888 |
| Portfolio turnover rateK | 28% | 18% | 25% | 16% | 11%L |
A For the period June 7, 2017 (commencement of sale of shares) through March 31, 2018.
B Calculated based on average shares outstanding during the period.
C Net investment income (loss) is affected by the timing of the declaration of dividends by any underlying mutual funds or exchange-traded funds (ETFs). Net investment income (loss) of any such underlying funds is not included in the Fund's net investment income (loss) ratio.
D Amount represents less than $.005 per share.
E Total returns for periods of less than one year are not annualized.
F Total returns would have been lower if certain expenses had not been reduced during the applicable periods shown.
G Fees and expenses of any underlying mutual funds or exchange-traded funds (ETFs) are not included in the Fund's expense ratio. The Fund indirectly bears its proportionate share of these expenses. For additional expense information related to investments in Fidelity Central Funds, please refer to the "Investments in Fidelity Central Funds" note found in the Notes to Financial Statements section of the most recent Annual or Semi-Annual report.
H Expense ratios reflect operating expenses of the class. Expenses before reductions do not reflect amounts reimbursed, waived, or reduced through arrangements with the investment adviser, brokerage services, or other offset arrangements, if applicable, and do not represent the amount paid by the class during periods when reimbursements, waivers or reductions occur.
I On certain classes, the size and fluctuation of net assets and expense amounts may cause ratios to differ from contractual rates.
J Annualized
K Amount does not include the portfolio activity of any underlying mutual funds or exchange-traded funds (ETFs).
L The portfolio turnover rate does not include the assets acquired in the merger.
See accompanying notes which are an integral part of the financial statements.
Fidelity Freedom® 2065 Fund
Investment Summary (Unaudited)
The information in the following tables is based on the direct investments of the Fund.
Top Holdings as of March 31, 2022
| | % of fund's net assets |
| Fidelity Series Emerging Markets Opportunities Fund | 12.7 |
| Fidelity Series Growth Company Fund | 8.0 |
| Fidelity Series Intrinsic Opportunities Fund | 7.5 |
| Fidelity Series International Value Fund | 7.5 |
| Fidelity Series Overseas Fund | 7.5 |
| Fidelity Series International Growth Fund | 7.4 |
| Fidelity Series Large Cap Stock Fund | 7.1 |
| Fidelity Series Stock Selector Large Cap Value Fund | 6.0 |
| Fidelity Series Long-Term Treasury Bond Index Fund | 5.3 |
| Fidelity Series Value Discovery Fund | 4.6 |
| | 73.6 |
Asset Allocation (% of fund's net assets)
| Period end |
| | Domestic Equity Funds | 50.4% |
| | International Equity Funds | 41.8% |
| | Bond Funds | 7.7% |
| | Short-Term Funds | 0.1% |

Domestic Equity Funds category includes Fidelity Series Commodity Strategy Fund which invests in commodity-related investments.
Fidelity Freedom® 2065 Fund
Schedule of Investments March 31, 2022
Showing Percentage of Net Assets
| U.S. Treasury Obligations - 0.0% | | | |
| | | Principal Amount | Value |
| U.S. Treasury Bills, yield at date of purchase 0.12% to 0.17% 4/14/22 to 4/21/22 (a) | | | |
| (Cost $199,984) | | 200,000 | 199,987 |
| | | Shares | Value |
|
| Domestic Equity Funds - 50.4% | | | |
| Fidelity Series All-Sector Equity Fund (b) | | 840,253 | $9,057,923 |
| Fidelity Series Blue Chip Growth Fund (b) | | 1,034,845 | 14,870,729 |
| Fidelity Series Commodity Strategy Fund (b) | | 1,347,420 | 6,885,317 |
| Fidelity Series Growth Company Fund (b) | | 2,037,864 | 37,068,741 |
| Fidelity Series Intrinsic Opportunities Fund (b) | | 1,772,471 | 34,864,497 |
| Fidelity Series Large Cap Stock Fund (b) | | 1,734,100 | 32,965,244 |
| Fidelity Series Large Cap Value Index Fund (b) | | 807,882 | 12,409,062 |
| Fidelity Series Opportunistic Insights Fund (b) | | 1,038,833 | 18,989,860 |
| Fidelity Series Small Cap Discovery Fund (b) | | 300,664 | 4,025,885 |
| Fidelity Series Small Cap Opportunities Fund (b) | | 984,905 | 13,414,400 |
| Fidelity Series Stock Selector Large Cap Value Fund (b) | | 2,049,128 | 27,765,681 |
| Fidelity Series Value Discovery Fund (b) | | 1,320,310 | 21,124,962 |
| TOTAL DOMESTIC EQUITY FUNDS | | | |
| (Cost $233,285,853) | | | 233,442,301 |
|
| International Equity Funds - 41.8% | | | |
| Fidelity Series Canada Fund (b) | | 969,718 | 15,050,020 |
| Fidelity Series Emerging Markets Fund (b) | | 683,057 | 6,338,766 |
| Fidelity Series Emerging Markets Opportunities Fund (b) | | 3,190,712 | 58,709,094 |
| Fidelity Series International Growth Fund (b) | | 2,075,895 | 34,418,337 |
| Fidelity Series International Small Cap Fund (b) | | 525,302 | 9,429,169 |
| Fidelity Series International Value Fund (b) | | 3,150,872 | 34,754,122 |
| Fidelity Series Overseas Fund (b) | | 2,741,992 | 34,603,934 |
| TOTAL INTERNATIONAL EQUITY FUNDS | | | |
| (Cost $204,847,998) | | | 193,303,442 |
|
| Bond Funds - 7.7% | | | |
| Fidelity Series 5+ Year Inflation-Protected Bond Index Fund (b) | | 48,208 | 462,794 |
| Fidelity Series Emerging Markets Debt Fund (b) | | 275,369 | 2,271,793 |
| Fidelity Series Emerging Markets Debt Local Currency Fund (b) | | 85,013 | 765,966 |
| Fidelity Series Floating Rate High Income Fund (b) | | 50,328 | 462,515 |
| Fidelity Series High Income Fund (b) | | 307,408 | 2,794,343 |
| Fidelity Series International Credit Fund (b) | | 4,757 | 44,051 |
| Fidelity Series Investment Grade Bond Fund (b) | | 220,622 | 2,406,991 |
| Fidelity Series Long-Term Treasury Bond Index Fund (b) | | 3,238,062 | 24,674,029 |
| Fidelity Series Real Estate Income Fund (b) | | 143,225 | 1,627,039 |
| TOTAL BOND FUNDS | | | |
| (Cost $37,743,213) | | | 35,509,521 |
|
| Short-Term Funds - 0.1% | | | |
| Fidelity Cash Central Fund 0.31% (c) | | | |
| (Cost $322,925) | | 322,860 | 322,925 |
| TOTAL INVESTMENT IN SECURITIES - 100.0% | | | |
| (Cost $476,399,973) | | | 462,778,176 |
| NET OTHER ASSETS (LIABILITIES) - 0.0% | | | (31,241) |
| NET ASSETS - 100% | | | $462,746,935 |
| Futures Contracts | | | | | |
| | Number of contracts | Expiration Date | Notional Amount | Value | Unrealized Appreciation/(Depreciation) |
| Purchased | | | | | |
| Equity Index Contracts | | | | | |
| ICE E-mini MSCI EAFE Index Contracts (United States) | 11 | June 2022 | $1,179,420 | $45,291 | $45,291 |
| ICE E-mini MSCI Emerging Markets Index Contracts (United States) | 35 | June 2022 | 1,969,625 | 26,326 | 26,326 |
| TOTAL PURCHASED | | | | | $71,617 |
| Sold | | | | | |
| Equity Index Contracts | | | | | |
| CME Micro E-mini S&P 500 Index Contracts (United States) | 11 | June 2022 | 2,491,913 | (48,689) | (48,689) |
| TOTAL FUTURES CONTRACTS | | | | | $22,928 |
The notional amount of futures purchased as a percentage of Net Assets is 0.7%
The notional amount of futures sold as a percentage of Net Assets is 0.5%
Legend
(a) Security or a portion of the security was pledged to cover margin requirements for futures contracts. At period end, the value of securities pledged amounted to $199,987.
(b) Affiliated Fund
(c) Affiliated fund that is generally available only to investment companies and other accounts managed by Fidelity Investments. The rate quoted is the annualized seven-day yield of the fund at period end. A complete unaudited listing of the fund's holdings as of its most recent quarter end is available upon request. In addition, each Fidelity Central Fund's financial statements, which are not covered by the Fund's Report of Independent Registered Public Accounting Firm, are available on the SEC's website or upon request.
Affiliated Central Funds
Fiscal year to date information regarding the Fund's investments in Fidelity Central Funds, including the ownership percentage, is presented below.
| Fund | Value, beginning of period | Purchases | Sales Proceeds | Dividend Income | Realized Gain/Loss | Change in Unrealized appreciation (depreciation) | Value, end of period | % ownership, end of period |
| Fidelity Cash Central Fund 0.31% | $-- | $972,281 | $649,356 | $163 | $-- | $-- | $322,925 | 0.0% |
| Total | $-- | $972,281 | $649,356 | $163 | $-- | $-- | $322,925 | |
Amounts in the income column in the above table include any capital gain distributions from underlying funds, which are presented in the corresponding line-item in the Statement of Operations, if applicable.
Affiliated Underlying Funds
Fiscal year to date information regarding the Fund's investments in affiliated Underlying Funds is presented below. Exchanges between classes of the same affiliated Underlying Funds may occur. If an underlying Fund changes its name, the name presented below is the name in effect at period end.
| Fund | Value, beginning of period | Purchases(a) | Sales Proceeds(a) | Dividend Income | Realized Gain (loss) | Change in Unrealized appreciation (depreciation) | Value, end of period |
| Fidelity Series 0-5 Year Inflation-Protected Bond Index Fund | $-- | $1,787,935 | $1,781,645 | $5,337 | $(5,495) | $-- | $-- |
| Fidelity Series 5+ Year Inflation-Protected Bond Index Fund | -- | 3,890,575 | 3,292,427 | 17,100 | (125,714) | (9,640) | 462,794 |
| Fidelity Series All-Sector Equity Fund | 4,442,088 | 6,593,842 | 1,146,441 | 1,488,015 | (57,434) | (774,132) | 9,057,923 |
| Fidelity Series Blue Chip Growth Fund | 7,047,212 | 12,592,636 | 2,713,496 | 2,119,894 | (105,811) | (1,949,812) | 14,870,729 |
| Fidelity Series Canada Fund | 5,454,318 | 8,990,983 | 1,201,706 | 237,602 | (11,470) | 1,817,895 | 15,050,020 |
| Fidelity Series Commodity Strategy Fund | 6,243,904 | 8,507,793 | 8,427,120 | 2,692,981 | (288,914) | 849,654 | 6,885,317 |
| Fidelity Series Emerging Markets Debt Fund | 1,223,719 | 1,540,824 | 276,834 | 82,211 | (11,979) | (203,937) | 2,271,793 |
| Fidelity Series Emerging Markets Debt Local Currency Fund | 403,663 | 532,188 | 92,820 | 25,821 | (7,626) | (69,439) | 765,966 |
| Fidelity Series Emerging Markets Fund | 3,577,752 | 4,676,928 | 647,391 | 178,826 | (21,687) | (1,246,836) | 6,338,766 |
| Fidelity Series Emerging Markets Opportunities Fund | 32,230,875 | 48,519,277 | 5,678,779 | 5,647,022 | (225,669) | (16,136,610) | 58,709,094 |
| Fidelity Series Floating Rate High Income Fund | 238,877 | 285,777 | 61,014 | 14,893 | (57) | (1,068) | 462,515 |
| Fidelity Series Government Money Market Fund 0.31% | 1,487,481 | 647,624 | 2,135,105 | 371 | -- | -- | -- |
| Fidelity Series Growth Company Fund | 17,985,145 | 34,261,750 | 8,373,817 | 8,065,916 | (613,153) | (6,191,184) | 37,068,741 |
| Fidelity Series High Income Fund | 1,412,507 | 1,838,722 | 365,860 | 112,702 | (6,661) | (84,365) | 2,794,343 |
| Fidelity Series Inflation-Protected Bond Index Fund | 4,487,492 | 3,052,801 | 7,730,952 | 72,201 | 269,216 | (78,557) | -- |
| Fidelity Series International Credit Fund | 45,977 | 1,484 | -- | 1,484 | -- | (3,410) | 44,051 |
| Fidelity Series International Growth Fund | 15,284,146 | 24,519,765 | 1,742,313 | 2,230,864 | (61,469) | (3,581,792) | 34,418,337 |
| Fidelity Series International Small Cap Fund | 4,806,934 | 6,792,335 | 605,718 | 1,014,823 | (13,022) | (1,551,360) | 9,429,169 |
| Fidelity Series International Value Fund | 15,287,661 | 23,628,099 | 4,075,013 | 1,400,629 | (58,368) | (28,257) | 34,754,122 |
| Fidelity Series Intrinsic Opportunities Fund | 18,055,480 | 26,368,336 | 6,868,993 | 4,545,440 | (407,306) | (2,283,020) | 34,864,497 |
| Fidelity Series Investment Grade Bond Fund | 95,319 | 3,683,544 | 1,341,778 | 7,404 | (23,900) | (6,194) | 2,406,991 |
| Fidelity Series Large Cap Stock Fund | 15,783,653 | 20,639,729 | 3,858,474 | 2,061,264 | (108,883) | 509,219 | 32,965,244 |
| Fidelity Series Large Cap Value Index Fund | 5,818,518 | 7,420,304 | 1,062,670 | 652,487 | (15,433) | 248,343 | 12,409,062 |
| Fidelity Series Long-Term Treasury Bond Index Fund | 6,150,093 | 21,706,373 | 1,878,557 | 278,759 | (238,610) | (1,065,270) | 24,674,029 |
| Fidelity Series Opportunistic Insights Fund | 9,213,137 | 14,985,811 | 3,134,866 | 2,839,333 | (88,782) | (1,985,440) | 18,989,860 |
| Fidelity Series Overseas Fund | 15,309,254 | 22,629,522 | 1,914,586 | 825,321 | (22,512) | (1,397,744) | 34,603,934 |
| Fidelity Series Real Estate Income Fund | 857,406 | 979,801 | 222,093 | 51,514 | (2,714) | 14,639 | 1,627,039 |
| Fidelity Series Short-Term Credit Fund | 313,186 | 98,771 | 411,927 | 1,709 | 295 | (325) | -- |
| Fidelity Series Small Cap Discovery Fund | 1,975,125 | 2,721,897 | 415,617 | 454,735 | (16,500) | (239,020) | 4,025,885 |
| Fidelity Series Small Cap Opportunities Fund | 6,604,903 | 10,617,186 | 1,458,872 | 2,388,704 | (149,530) | (2,199,287) | 13,414,400 |
| Fidelity Series Stock Selector Large Cap Value Fund | 13,342,731 | 19,706,687 | 3,587,309 | 4,110,054 | (203,226) | (1,493,202) | 27,765,681 |
| Fidelity Series Value Discovery Fund | 10,260,844 | 13,965,192 | 2,732,497 | 2,066,168 | (72,973) | (295,604) | 21,124,962 |
| | $225,439,400 | $358,184,491 | $79,236,690 | $45,691,584 | $(2,695,387) | $(39,435,755) | $462,255,264 |
(a) Includes the value of shares purchased or redeemed through in-kind transactions, if applicable.
Amounts in the income column in the above table include any capital gain distributions from underlying funds, which are presented in the corresponding line-item in the Statement of Operations, if applicable.
Investment Valuation
The following is a summary of the inputs used, as of March 31, 2022, involving the Fund's assets and liabilities carried at fair value. The inputs or methodology used for valuing securities may not be an indication of the risk associated with investing in those securities. For more information on valuation inputs, and their aggregation into the levels used below, please refer to the Investment Valuation section in the accompanying Notes to Financial Statements.
| | Valuation Inputs at Reporting Date: |
| Description | Total | Level 1 | Level 2 | Level 3 |
| Investments in Securities: | | | | |
| Other Short-Term Investments | $199,987 | $-- | $199,987 | $-- |
| Domestic Equity Funds | 233,442,301 | 233,442,301 | -- | -- |
| International Equity Funds | 193,303,442 | 193,303,442 | -- | -- |
| Bond Funds | 35,509,521 | 35,509,521 | -- | -- |
| Short-Term Funds | 322,925 | 322,925 | -- | -- |
| Total Investments in Securities: | $462,778,176 | $462,578,189 | $199,987 | $-- |
| Derivative Instruments: | | | | |
| Assets | | | | |
| Futures Contracts | $71,617 | $71,617 | $-- | $-- |
| Total Assets | $71,617 | $71,617 | $-- | $-- |
| Liabilities | | | | |
| Futures Contracts | $(48,689) | $(48,689) | $-- | $-- |
| Total Liabilities | $(48,689) | $(48,689) | $-- | $-- |
| Total Derivative Instruments: | $22,928 | $22,928 | $-- | $-- |
Value of Derivative Instruments
The following table is a summary of the Fund's value of derivative instruments by primary risk exposure as of March 31, 2022. For additional information on derivative instruments, please refer to the Derivative Instruments section in the accompanying Notes to Financial Statements.
| Primary Risk Exposure / Derivative Type | Value |
| | Asset | Liability |
| Equity Risk | | |
| Futures Contracts(a) | $71,617 | $(48,689) |
| Total Equity Risk | 71,617 | (48,689) |
| Total Value of Derivatives | $71,617 | $(48,689) |
(a) Reflects gross cumulative appreciation (depreciation) on futures contracts as presented in the Schedule of Investments. In the Statement of Assets and Liabilities, the period end daily variation margin is included in receivable or payable for daily variation margin on futures contracts, and the net cumulative appreciation (depreciation) is included in Total accumulated earnings (loss).
See accompanying notes which are an integral part of the financial statements.
Fidelity Freedom® 2065 Fund
Financial Statements
Statement of Assets and Liabilities
| | | March 31, 2022 |
| Assets | | |
Investment in securities, at value — See accompanying schedule:
Unaffiliated issuers (cost $199,984) | $199,987 | |
| Fidelity Central Funds (cost $322,925) | 322,925 | |
| Other affiliated issuers (cost $475,877,064) | 462,255,264 | |
| Total Investment in Securities (cost $476,399,973) | | $462,778,176 |
| Receivable for investments sold | | 5,008,652 |
| Receivable for fund shares sold | | 4,817,064 |
| Distributions receivable from Fidelity Central Funds | | 45 |
| Total assets | | 472,603,937 |
| Liabilities | | |
| Payable for investments purchased | $8,462,252 | |
| Payable for fund shares redeemed | 1,141,579 | |
| Accrued management fee | 231,970 | |
| Payable for daily variation margin on futures contracts | 21,201 | |
| Total liabilities | | 9,857,002 |
| Net Assets | | $462,746,935 |
| Net Assets consist of: | | |
| Paid in capital | | $456,465,910 |
| Total accumulated earnings (loss) | | 6,281,025 |
| Net Assets | | $462,746,935 |
| Net Asset Value and Maximum Offering Price | | |
| Fidelity Freedom 2065 Fund: | | |
| Net Asset Value, offering price and redemption price per share ($143,463,242 ÷ 11,450,108 shares) | | $12.53 |
| Class K: | | |
| Net Asset Value, offering price and redemption price per share ($213,090,874 ÷ 16,989,505 shares) | | $12.54 |
| Class K6: | | |
| Net Asset Value, offering price and redemption price per share ($106,192,819 ÷ 8,451,696 shares) | | $12.56 |
See accompanying notes which are an integral part of the financial statements.
Statement of Operations
| | | Year ended March 31, 2022 |
| Investment Income | | |
| Dividends: | | |
| Affiliated issuers | | $10,085,177 |
| Interest | | 90 |
| Income from Fidelity Central Funds | | 163 |
| Total income | | 10,085,430 |
| Expenses | | |
| Management fee | $2,183,089 | |
| Independent trustees' fees and expenses | 916 | |
| Total expenses before reductions | 2,184,005 | |
| Expense reductions | (4) | |
| Total expenses after reductions | | 2,184,001 |
| Net investment income (loss) | | 7,901,429 |
| Realized and Unrealized Gain (Loss) | | |
| Net realized gain (loss) on: | | |
| Investment securities: | | |
| Affiliated issuers | (2,695,387) | |
| Futures contracts | (29,518) | |
| Capital gain distributions from underlying funds: | | |
| Affiliated issuers | 35,606,407 | |
| Total net realized gain (loss) | | 32,881,502 |
| Change in net unrealized appreciation (depreciation) on: | | |
| Investment securities: | | |
| Unaffiliated issuers | 3 | |
| Affiliated issuers | (39,435,755) | |
| Futures contracts | 22,928 | |
| Total change in net unrealized appreciation (depreciation) | | (39,412,824) |
| Net gain (loss) | | (6,531,322) |
| Net increase (decrease) in net assets resulting from operations | | $1,370,107 |
See accompanying notes which are an integral part of the financial statements.
Statement of Changes in Net Assets
| | Year ended March 31, 2022 | Year ended March 31, 2021 |
| Increase (Decrease) in Net Assets | | |
| Operations | | |
| Net investment income (loss) | $7,901,429 | $1,291,880 |
| Net realized gain (loss) | 32,881,502 | 7,115,316 |
| Change in net unrealized appreciation (depreciation) | (39,412,824) | 33,319,597 |
| Net increase (decrease) in net assets resulting from operations | 1,370,107 | 41,726,793 |
| Distributions to shareholders | (26,514,383) | (2,946,544) |
| Share transactions - net increase (decrease) | 262,447,810 | 146,850,140 |
| Total increase (decrease) in net assets | 237,303,534 | 185,630,389 |
| Net Assets | | |
| Beginning of period | 225,443,401 | 39,813,012 |
| End of period | $462,746,935 | $225,443,401 |
See accompanying notes which are an integral part of the financial statements.
Financial Highlights
Fidelity Freedom 2065 Fund
| Years ended March 31, | 2022 | 2021 | 2020 A |
| Selected Per–Share Data | | | |
| Net asset value, beginning of period | $13.10 | $8.52 | $10.00 |
| Income from Investment Operations | | | |
| Net investment income (loss)B,C | .30 | .12 | .13 |
| Net realized and unrealized gain (loss) | .17D | 4.74 | (1.46) |
| Total from investment operations | .47 | 4.86 | (1.33) |
| Distributions from net investment income | (.28) | (.13) | (.12) |
| Distributions from net realized gain | (.76) | (.15) | (.03) |
| Total distributions | (1.04) | (.28) | (.15) |
| Net asset value, end of period | $12.53 | $13.10 | $8.52 |
| Total ReturnE,F | 3.25% | 57.49% | (13.60)% |
| Ratios to Average Net AssetsB,G,H | | | |
| Expenses before reductions | .75% | .75% | .76%I,J |
| Expenses net of fee waivers, if any | .75% | .75% | .76%I,J |
| Expenses net of all reductions | .75% | .75% | .76%I,J |
| Net investment income (loss) | 2.24% | 1.07% | 1.71%I |
| Supplemental Data | | | |
| Net assets, end of period (000 omitted) | $143,463 | $68,876 | $13,332 |
| Portfolio turnover rateK | 23% | 13% | 33%I |
A For the period June 28, 2019 (commencement of operations) through March 31, 2020.
B Net investment income (loss) is affected by the timing of the declaration of dividends by any underlying mutual funds or exchange-traded funds (ETFs). Net investment income (loss) of any such underlying funds is not included in the Fund's net investment income (loss) ratio.
C Calculated based on average shares outstanding during the period.
D The amount shown for a share outstanding does not correspond with the aggregate net gain (loss) on investments for the period due to the timing of sales and repurchases of shares in relation to fluctuating market values of the investments of the Fund.
E Total returns for periods of less than one year are not annualized.
F Total returns would have been lower if certain expenses had not been reduced during the applicable periods shown.
G Fees and expenses of any underlying mutual funds or exchange-traded funds (ETFs) are not included in the Fund's expense ratio. The Fund indirectly bears its proportionate share of these expenses. For additional expense information related to investments in Fidelity Central Funds, please refer to the "Investments in Fidelity Central Funds" note found in the Notes to Financial Statements section of the most recent Annual or Semi-Annual report.
H Expense ratios reflect operating expenses of the class. Expenses before reductions do not reflect amounts reimbursed, waived, or reduced through arrangements with the investment adviser, brokerage services, or other offset arrangements, if applicable, and do not represent the amount paid by the class during periods when reimbursements, waivers or reductions occur.
I Annualized
J On certain classes, the size and fluctuation of net assets and expense amounts may cause ratios to differ from contractual rates.
K Amount does not include the portfolio activity of any underlying mutual funds or exchange-traded funds (ETFs).
See accompanying notes which are an integral part of the financial statements.
Fidelity Freedom 2065 Fund Class K
| Years ended March 31, | 2022 | 2021 | 2020 A |
| Selected Per–Share Data | | | |
| Net asset value, beginning of period | $13.11 | $8.52 | $10.00 |
| Income from Investment Operations | | | |
| Net investment income (loss)B,C | .31 | .14 | .13 |
| Net realized and unrealized gain (loss) | .17D | 4.74 | (1.45) |
| Total from investment operations | .48 | 4.88 | (1.32) |
| Distributions from net investment income | (.29) | (.13) | (.13) |
| Distributions from net realized gain | (.76) | (.16) | (.03) |
| Total distributions | (1.05) | (.29) | (.16) |
| Net asset value, end of period | $12.54 | $13.11 | $8.52 |
| Total ReturnE,F | 3.30% | 57.72% | (13.55)% |
| Ratios to Average Net AssetsC,G,H | | | |
| Expenses before reductions | .64%I | .64% | .65%I,J |
| Expenses net of fee waivers, if any | .64%I | .64% | .65%I,J |
| Expenses net of all reductions | .64%I | .64% | .65%I,J |
| Net investment income (loss) | 2.34% | 1.18% | 1.81%J |
| Supplemental Data | | | |
| Net assets, end of period (000 omitted) | $213,091 | $113,107 | $20,387 |
| Portfolio turnover rateK | 23% | 13% | 33%J |
A For the period June 28, 2019 (commencement of operations) through March 31, 2020.
B Calculated based on average shares outstanding during the period.
C Net investment income (loss) is affected by the timing of the declaration of dividends by any underlying mutual funds or exchange-traded funds (ETFs). Net investment income (loss) of any such underlying funds is not included in the Fund's net investment income (loss) ratio.
D The amount shown for a share outstanding does not correspond with the aggregate net gain (loss) on investments for the period due to the timing of sales and repurchases of shares in relation to fluctuating market values of the investments of the Fund.
E Total returns for periods of less than one year are not annualized.
F Total returns would have been lower if certain expenses had not been reduced during the applicable periods shown.
G Fees and expenses of any underlying mutual funds or exchange-traded funds (ETFs) are not included in the Fund's expense ratio. The Fund indirectly bears its proportionate share of these expenses. For additional expense information related to investments in Fidelity Central Funds, please refer to the "Investments in Fidelity Central Funds" note found in the Notes to Financial Statements section of the most recent Annual or Semi-Annual report.
H Expense ratios reflect operating expenses of the class. Expenses before reductions do not reflect amounts reimbursed, waived, or reduced through arrangements with the investment adviser, brokerage services, or other offset arrangements, if applicable, and do not represent the amount paid by the class during periods when reimbursements, waivers or reductions occur.
I On certain classes, the size and fluctuation of net assets and expense amounts may cause ratios to differ from contractual rates.
J Annualized
K Amount does not include the portfolio activity of any underlying mutual funds or exchange-traded funds (ETFs).
See accompanying notes which are an integral part of the financial statements.
See accompanying notes which are an integral part of the financial statements.
Fidelity Freedom 2065 Fund Class K6
| Years ended March 31, | 2022 | 2021 | 2020 A |
| Selected Per–Share Data | | | |
| Net asset value, beginning of period | $13.13 | $8.53 | $10.00 |
| Income from Investment Operations | | | |
| Net investment income (loss)B,C | .33 | .15 | .15 |
| Net realized and unrealized gain (loss) | .17D | 4.75 | (1.46) |
| Total from investment operations | .50 | 4.90 | (1.31) |
| Distributions from net investment income | (.31) | (.14) | (.13) |
| Distributions from net realized gain | (.76) | (.16) | (.03) |
| Total distributions | (1.07) | (.30) | (.16) |
| Net asset value, end of period | $12.56 | $13.13 | $8.53 |
| Total ReturnE,F | 3.43% | 57.93% | (13.43)% |
| Ratios to Average Net AssetsC,G,H | | | |
| Expenses before reductions | .49%I | .49% | .50%I,J |
| Expenses net of fee waivers, if any | .49%I | .49% | .50%I,J |
| Expenses net of all reductions | .49%I | .49% | .50%I,J |
| Net investment income (loss) | 2.49% | 1.33% | 1.97%J |
| Supplemental Data | | | |
| Net assets, end of period (000 omitted) | $106,193 | $43,461 | $6,094 |
| Portfolio turnover rateK | 23% | 13% | 33%J |
A For the period June 28, 2019 (commencement of operations) through March 31, 2020.
B Calculated based on average shares outstanding during the period.
C Net investment income (loss) is affected by the timing of the declaration of dividends by any underlying mutual funds or exchange-traded funds (ETFs). Net investment income (loss) of any such underlying funds is not included in the Fund's net investment income (loss) ratio.
D The amount shown for a share outstanding does not correspond with the aggregate net gain (loss) on investments for the period due to the timing of sales and repurchases of shares in relation to fluctuating market values of the investments of the Fund.
E Total returns for periods of less than one year are not annualized.
F Total returns would have been lower if certain expenses had not been reduced during the applicable periods shown.
G Fees and expenses of any underlying mutual funds or exchange-traded funds (ETFs) are not included in the Fund's expense ratio. The Fund indirectly bears its proportionate share of these expenses. For additional expense information related to investments in Fidelity Central Funds, please refer to the "Investments in Fidelity Central Funds" note found in the Notes to Financial Statements section of the most recent Annual or Semi-Annual report.
H Expense ratios reflect operating expenses of the class. Expenses before reductions do not reflect amounts reimbursed, waived, or reduced through arrangements with the investment adviser, brokerage services, or other offset arrangements, if applicable, and do not represent the amount paid by the class during periods when reimbursements, waivers or reductions occur.
I On certain classes, the size and fluctuation of net assets and expense amounts may cause ratios to differ from contractual rates.
J Annualized
K Amount does not include the portfolio activity of any underlying mutual funds or exchange-traded funds (ETFs).
See accompanying notes which are an integral part of the financial statements.
Notes to Financial Statements
For the period ended March 31, 2022
1. Organization.
Fidelity Freedom Income Fund, Fidelity Freedom 2005 Fund, Fidelity Freedom 2010 Fund, Fidelity Freedom 2015 Fund, Fidelity Freedom 2020 Fund, Fidelity Freedom 2025 Fund, Fidelity Freedom 2030 Fund, Fidelity Freedom 2035 Fund, Fidelity Freedom 2040 Fund, Fidelity Freedom 2045 Fund, Fidelity Freedom 2050 Fund, Fidelity Freedom 2055 Fund, Fidelity Freedom 2060 Fund and Fidelity Freedom 2065 Fund (the Funds) are funds of Fidelity Aberdeen Street Trust (the Trust). The Trust is registered under the Investment Company Act of 1940, as amended (the 1940 Act), as an open-end management investment company organized as a Delaware statutory trust. Each Fund is authorized to issue an unlimited number of shares. Each Fund offers Fidelity Freedom, Class K and Class K6 shares, each of which has equal rights as to assets and voting privileges. Each class has exclusive voting rights with respect to matters that affect that class.
2. Investments in Fidelity Central Funds.
Funds may invest in Fidelity Central Funds, which are open-end investment companies generally available only to other investment companies and accounts managed by the investment adviser and its affiliates. The Schedule of Investments lists any Fidelity Central Funds held as an investment as of period end, but does not include the underlying holdings of each Fidelity Central Fund. An investing fund indirectly bears its proportionate share of the expenses of the underlying Fidelity Central Funds.
Based on its investment objective, each Fidelity Central Fund may invest or participate in various investment vehicles or strategies that are similar to those of the investing fund. These strategies are consistent with the investment objectives of the investing fund and may involve certain economic risks which may cause a decline in value of each of the Fidelity Central Funds and thus a decline in the value of the investing fund.
| Fidelity Central Fund | Investment Manager | Investment Objective | Investment Practices | Expense Ratio(a) |
Fidelity Money Market Central Funds
| Fidelity Management & Research Company LLC (FMR) | Each fund seeks to obtain a high level of current income consistent with the preservation of capital and liquidity. | Short-term Investments | Less than .005% |
(a) Expenses expressed as a percentage of average net assets and are as of each underlying Central Fund's most recent annual or semi-annual shareholder report.
A complete unaudited list of holdings for each Fidelity Central Fund is available upon request or at the Securities and Exchange Commission website at www.sec.gov. In addition, the financial statements of the Fidelity Central Funds which contain the significant accounting policies (including investment valuation policies) of those funds, and are not covered by the Report of Independent Registered Public Accounting Firm, are available on the Securities and Exchange Commission website or upon request.
3. Significant Accounting Policies.
Each Fund is an investment company and applies the accounting and reporting guidance of the Financial Accounting Standards Board (FASB) Accounting Standards Codification Topic 946 Financial Services - Investment Companies. The financial statements have been prepared in conformity with accounting principles generally accepted in the United States of America (GAAP), which require management to make certain estimates and assumptions at the date of the financial statements. Actual results could differ from those estimates. Subsequent events, if any, through the date that the financial statements were issued have been evaluated in the preparation of the financial statements. Each Fund's Schedule of Investments lists any underlying mutual funds or exchange-traded funds (ETFs) but does not include the underlying holdings of these funds. The following summarizes the significant accounting policies of each Fund:
Investment Valuation. Investments are valued as of 4:00 p.m. Eastern time on the last calendar day of the period. The Board of Trustees (the Board) has delegated the day to day responsibility for the valuation of each Fund's investments to the Fair Value Committee (the Committee) established by the each Fund's investment adviser. In accordance with valuation policies and procedures approved by the Board, each Fund attempts to obtain prices from one or more third party pricing vendors or brokers to value its investments. When current market prices, quotations or currency exchange rates are not readily available or reliable, investments will be fair valued in good faith by the Committee, in accordance with procedures adopted by the Board. Factors used in determining fair value vary by investment type and may include market or investment specific events, changes in interest rates and credit quality. The frequency with which these procedures are used cannot be predicted and they may be utilized to a significant extent. The Committee oversees each Fund's valuation policies and procedures and reports to the Board on the Committee's activities and fair value determinations. The Board monitors the appropriateness of the procedures used in valuing each Fund's investments and ratifies the fair value determinations of the Committee. Each Fund categorizes the inputs to valuation techniques used to value its investments into a disclosure hierarchy consisting of three levels as shown below:
- Level 1 – unadjusted quoted prices in active markets for identical investments
- Level 2 – other significant observable inputs (including quoted prices for similar investments, interest rates, prepayment speeds, etc.)
- Level 3 – unobservable inputs (including the Fund's own assumptions based on the best information available)
Valuation techniques used to value each Fund's investments by major category are as follows. Investments in open-end mutual funds are valued at their closing net asset value (NAV) each business day and are categorized as Level 1 in the hierarchy. Debt securities, including restricted securities, are valued based on evaluated prices received from third party pricing vendors or from brokers who make markets in such securities. U.S. government and government agency obligations are valued by pricing vendors who utilize matrix pricing which considers yield or price of bonds of comparable quality, coupon, maturity and type or by broker-supplied prices. When independent prices are unavailable or unreliable, debt securities may be valued utilizing pricing methodologies which consider similar factors that would be used by third party pricing vendors. Debt securities are generally categorized as Level 2 in the hierarchy but may be Level 3 depending on the circumstances. Futures contracts are valued at the settlement price established each day by the board of trade or exchange on which they are traded and are categorized as Level 1 in the hierarchy. The aggregate value of investments by input level as of March 31, 2022 is included at the end of each Fund's Schedule of Investments.
Investment Transactions and Income. For financial reporting purposes, the Funds' investment holdings and NAV include trades executed through the end of the last business day of the period. The NAV per share for processing shareholder transactions is calculated as of the close of business of the New York Stock Exchange (NYSE), normally 4:00 p.m. Eastern time and includes trades executed through the end of the prior business day. Gains and losses on securities sold are determined on the basis of identified cost. Income and capital gain distributions from any underlying mutual funds or exchange-traded funds (ETFs) are recorded on the ex-dividend date. Distributions from any underlying mutual funds or exchange-traded funds (ETFs) that are deemed to be return of capital are recorded as a reduction of cost of investments. Interest income is accrued as earned. Interest income includes coupon interest and amortization of premium and accretion of discount on debt securities as applicable.
Class Allocations and Expenses. Investment income, realized and unrealized capital gains and losses, common expenses of a fund, and certain fund-level expense reductions, if any, are allocated daily on a pro-rata basis to each class based on the relative net assets of each class to the total net assets of a fund. Each class differs with respect to transfer agent and distribution and service plan fees incurred, as applicable. Certain expense reductions may also differ by class, if applicable. For the reporting period, the allocated portion of income and expenses to each class as a percent of its average net assets may vary due to the timing of recording these transactions in relation to fluctuating net assets of the classes. Expenses directly attributable to a fund are charged to that fund. Expenses attributable to more than one fund are allocated among the respective funds on the basis of relative net assets or other appropriate methods. Expenses included in the accompanying financial statements reflect the expenses of that fund and do not include any expenses associated with any underlying mutual funds or exchange-traded funds. Although not included in a fund's expenses, a fund indirectly bears its proportionate share of these expenses through the net asset value of each underlying mutual fund or exchange-traded fund. Expense estimates are accrued in the period to which they relate and adjustments are made when actual amounts are known.
Deferred Trustee Compensation. Under a Deferred Compensation Plan (the Plan) for certain Funds, certain independent Trustees have elected to defer receipt of a portion of their annual compensation. Deferred amounts are invested in affiliated mutual funds, are marked-to-market and remain in a fund until distributed in accordance with the Plan. The investment of deferred amounts and the offsetting payable to the Trustees presented below are included in the accompanying Statement of Assets and Liabilities in other receivables and other payables and accrued expenses, as applicable.
| Fidelity Freedom 2015 Fund | $9,036 |
| Fidelity Freedom 2020 Fund | 330,553 |
| Fidelity Freedom 2025 Fund | 332,134 |
| Fidelity Freedom 2030 Fund | 329,685 |
| Fidelity Freedom 2035 Fund | 164,480 |
| Fidelity Freedom 2040 Fund | 142,141 |
| Fidelity Freedom 2045 Fund | 128,831 |
| Fidelity Freedom 2050 Fund | 78,631 |
Income Tax Information and Distributions to Shareholders. Each year, each Fund intends to qualify as a regulated investment company under Subchapter M of the Internal Revenue Code, including distributing substantially all of its taxable income and realized gains. As a result, no provision for U.S. Federal income taxes is required. As of March 31, 2022, each Fund did not have any unrecognized tax benefits in the financial statements; nor is each Fund aware of any tax positions for which it is reasonably possible that the total amounts of unrecognized tax benefits will significantly change in the next twelve months. Each Fund files a U.S. federal tax return, in addition to state and local tax returns as required. Each Fund's federal income tax returns are subject to examination by the Internal Revenue Service (IRS) for a period of three fiscal years after they are filed. State and local tax returns may be subject to examination for an additional fiscal year depending on the jurisdiction. Foreign taxes are provided for based on each Fund's understanding of the tax rules and rates that exist in the foreign markets in which it invests.
Distributions are declared and recorded on the ex-dividend date. Income and capital gain distributions are declared separately for each class. Income and capital gain distributions are determined in accordance with income tax regulations, which may differ from GAAP.
Capital accounts within the financial statements are adjusted for permanent book-tax differences. These adjustments have no impact on net assets or the results of operations. Capital accounts are not adjusted for temporary book-tax differences which will reverse in a subsequent period.
Book-tax differences are primarily due to the short-term gain distributions from the Underlying Funds, futures contracts, deferred trustees compensation and losses deferred due to wash sales and excise tax regulations.
As of period end, the cost and unrealized appreciation (depreciation) in securities, and derivatives if applicable, for federal income tax purposes were as follows for each Fund:
| | Tax cost | Gross unrealized appreciation | Gross unrealized depreciation | Net unrealized appreciation (depreciation) |
| Fidelity Freedom Income Fund | $2,778,648,736 | $173,685,746 | $(45,762,018) | $127,923,728 |
| Fidelity Freedom 2005 Fund | 899,912,731 | 55,965,826 | (25,250,435) | 30,715,391 |
| Fidelity Freedom 2010 Fund | 4,504,925,722 | 436,381,222 | (124,011,128) | 312,370,094 |
| Fidelity Freedom 2015 Fund | 6,496,778,312 | 858,926,919 | (169,701,667) | 689,225,252 |
| Fidelity Freedom 2020 Fund | 19,388,071,047 | 3,175,396,602 | (557,712,613) | 2,617,683,989 |
| Fidelity Freedom 2025 Fund | 25,204,935,416 | 4,194,741,113 | (810,032,219) | 3,384,708,894 |
| Fidelity Freedom 2030 Fund | 31,651,678,032 | 5,827,124,257 | (1,016,730,922) | 4,810,393,335 |
| Fidelity Freedom 2035 Fund | 23,227,904,872 | 5,031,699,307 | (717,156,393) | 4,314,542,914 |
| Fidelity Freedom 2040 Fund | 22,818,105,941 | 5,690,289,468 | (608,807,146) | 5,081,482,322 |
| Fidelity Freedom 2045 Fund | 15,433,560,935 | 3,517,057,475 | (416,881,405) | 3,100,176,070 |
| Fidelity Freedom 2050 Fund | 13,950,788,176 | 3,042,367,173 | (390,525,760) | 2,651,841,413 |
| Fidelity Freedom 2055 Fund | 7,912,773,343 | 1,190,014,648 | (255,461,417) | 934,553,231 |
| Fidelity Freedom 2060 Fund | 3,463,120,720 | 344,593,838 | (147,885,786) | 196,708,052 |
| Fidelity Freedom 2065 Fund | 479,507,558 | 21,464,450 | (38,193,832) | (16,729,382) |
The tax-based components of distributable earnings as of period end were as follows for each Fund:
| | Undistributed ordinary income | Undistributed long-term capital gain | Net unrealized appreciation (depreciation) on securities and other investments |
| Fidelity Freedom Income Fund | $3,120,210 | $60,019,755 | $127,923,728 |
| Fidelity Freedom 2005 Fund | 1,631,127 | 22,293,366 | 30,715,391 |
| Fidelity Freedom 2010 Fund | 8,417,851 | 153,973,778 | 312,370,094 |
| Fidelity Freedom 2015 Fund | 11,169,467 | 284,721,898 | 689,225,252 |
| Fidelity Freedom 2020 Fund | 32,464,205 | 1,052,171,440 | 2,617,683,989 |
| Fidelity Freedom 2025 Fund | 46,046,356 | 1,347,209,798 | 3,384,708,894 |
| Fidelity Freedom 2030 Fund | 55,963,801 | 1,811,949,799 | 4,810,393,335 |
| Fidelity Freedom 2035 Fund | 51,227,133 | 1,563,515,075 | 4,314,542,914 |
| Fidelity Freedom 2040 Fund | 43,671,053 | 1,809,466,765 | 5,081,482,322 |
| Fidelity Freedom 2045 Fund | 27,418,077 | 1,185,113,507 | 3,100,176,070 |
| Fidelity Freedom 2050 Fund | 17,709,482 | 1,050,679,958 | 2,651,841,413 |
| Fidelity Freedom 2055 Fund | 3,949,809 | 551,793,661 | 934,553,231 |
| Fidelity Freedom 2060 Fund | – | 217,585,352 | 196,708,052 |
| Fidelity Freedom 2065 Fund | 354,637 | 23,011,491 | (16,729,382) |
Certain of the Funds intend to elect to defer to the next fiscal year ordinary losses recognized during January 1, 2022 to March 31, 2022. Loss deferrals were as follows:
| | Ordinary Losses |
| Fidelity Freedom 2035 Fund | (7,588,978) |
| Fidelity Freedom 2040 Fund | (24,989,365) |
| Fidelity Freedom 2045 Fund | (16,560,681) |
| Fidelity Freedom 2050 Fund | (14,736,643) |
| Fidelity Freedom 2055 Fund | (7,677,700) |
| Fidelity Freedom 2060 Fund | (3,016,829) |
| Fidelity Freedom 2065 Fund | (355,722) |
The tax character of distributions paid was as follows:
| March 31, 2022 | | | | | |
| | Ordinary Income | Long-term Capital Gains | Total |
| Fidelity Freedom Income Fund | $83,951,349 | $105,511,143 | $189,462,492 |
| Fidelity Freedom 2005 Fund | 27,526,784 | 45,902,992 | 73,429,776 |
| Fidelity Freedom 2010 Fund | 157,230,462 | 315,136,201 | 472,366,663 |
| Fidelity Freedom 2015 Fund | 253,066,686 | 555,711,414 | 808,778,100 |
| Fidelity Freedom 2020 Fund | 839,910,846 | 1,965,021,111 | 2,804,931,957 |
| Fidelity Freedom 2025 Fund | 1,105,695,299 | 1,950,349,862 | 3,056,045,161 |
| Fidelity Freedom 2030 Fund | 1,443,884,477 | 2,580,129,933 | 4,024,014,410 |
| Fidelity Freedom 2035 Fund | 1,137,247,716 | 2,049,733,610 | 3,186,981,326 |
| Fidelity Freedom 2040 Fund | 1,210,574,904 | 2,151,753,391 | 3,362,328,295 |
| Fidelity Freedom 2045 Fund | 799,431,585 | 1,398,451,481 | 2,197,883,066 |
| Fidelity Freedom 2050 Fund | 705,916,503 | 1,211,008,281 | 1,916,924,784 |
| Fidelity Freedom 2055 Fund | 365,529,445 | 586,448,511 | 951,977,956 |
| Fidelity Freedom 2060 Fund | 140,601,538 | 197,867,144 | 338,468,682 |
| Fidelity Freedom 2065 Fund | 14,011,229 | 12,503,154 | 26,514,383 |
| March 31, 2021 | | | | | |
| | Ordinary Income | Long-term Capital Gains | Total |
| Fidelity Freedom Income Fund | $71,312,815 | $71,004,971 | $142,317,786 |
| Fidelity Freedom 2005 Fund | 23,003,522 | 23,356,505 | 46,360,027 |
| Fidelity Freedom 2010 Fund | 116,009,370 | 214,165,962 | 330,175,332 |
| Fidelity Freedom 2015 Fund | 165,709,981 | 393,677,857 | 559,387,838 |
| Fidelity Freedom 2020 Fund | 487,538,847 | 1,300,136,260 | 1,787,675,107 |
| Fidelity Freedom 2025 Fund | 532,995,959 | 1,202,088,907 | 1,735,084,866 |
| Fidelity Freedom 2030 Fund | 640,118,252 | 1,640,388,981 | 2,280,507,233 |
| Fidelity Freedom 2035 Fund | 395,174,007 | 1,192,499,465 | 1,587,673,472 |
| Fidelity Freedom 2040 Fund | 358,962,734 | 1,172,440,253 | 1,531,402,987 |
| Fidelity Freedom 2045 Fund | 235,522,935 | 652,611,812 | 888,134,747 |
| Fidelity Freedom 2050 Fund | 204,407,623 | 561,391,982 | 765,799,605 |
| Fidelity Freedom 2055 Fund | 100,721,959 | 225,148,678 | 325,870,637 |
| Fidelity Freedom 2060 Fund | 35,889,709 | 62,945,879 | 98,835,588 |
| Fidelity Freedom 2065 Fund | 1,907,572 | 1,038,972 | 2,946,544 |
4. Derivative Instruments.
Risk Exposures and the Use of Derivative Instruments. The Funds' investment objective allows the Funds to enter into various types of derivative contracts, including futures contracts. Derivatives are investments whose value is primarily derived from underlying assets, indices or reference rates and may be transacted on an exchange or over-the-counter (OTC). Derivatives may involve a future commitment to buy or sell a specified asset based on specified terms, to exchange future cash flows at periodic intervals based on a notional principal amount, or for one party to make one or more payments upon the occurrence of specified events in exchange for periodic payments from the other party.
The Funds used derivatives to increase returns and to manage exposure to certain risks as defined below. The success of any strategy involving derivatives depends on analysis of numerous economic factors, and if the strategies for investment do not work as intended, the Funds may not achieve their objectives.
The Funds' use of derivatives increased or decreased their exposure to the following risk:
| Equity Risk | Equity risk relates to the fluctuations in the value of financial instruments as a result of changes in market prices (other than those arising from interest rate risk or foreign exchange risk), whether caused by factors specific to an individual investment, its issuer, or all factors affecting all instruments traded in a market or market segment.
|
The Funds are also exposed to additional risks from investing in derivatives, such as liquidity risk and counterparty credit risk. Liquidity risk is the risk that the Funds will be unable to close out the derivative in the open market in a timely manner. Counterparty credit risk is the risk that the counterparty will not be able to fulfill its obligation to the Funds. Counterparty credit risk related to exchange-traded futures contracts may be mitigated by the protection provided by the exchange on which they trade.
Investing in derivatives may involve greater risks than investing in the underlying assets directly and, to varying degrees, may involve risk of loss in excess of any initial investment and collateral received and amounts recognized in the Statement of Assets and Liabilities. In addition, there may be the risk that the change in value of the derivative contract does not correspond to the change in value of the underlying instrument.
Futures Contracts. A futures contract is an agreement between two parties to buy or sell a specified underlying instrument for a fixed price at a specified future date. The Funds used futures contracts to manage their exposure to the stock market.
Upon entering into a futures contract, a fund is required to deposit either cash or securities (initial margin) with a clearing broker in an amount equal to a certain percentage of the face value of the contract. Futures contracts are marked-to-market daily and subsequent daily payments (variation margin) are made or received by a fund depending on the daily fluctuations in the value of the futures contracts and are recorded as unrealized appreciation or (depreciation). This receivable and/or payable, if any, is included in daily variation margin on futures contracts in the Statement of Assets and Liabilities. Realized gain or (loss) is recorded upon the expiration or closing of a futures contract. The net realized gain (loss) and change in net unrealized appreciation (depreciation) on futures contracts during the period is presented in the Statement of Operations.
Any open futures contracts at period end are presented in the Schedule of Investments under the caption "Futures Contracts". The notional amount at value reflects each contract's exposure to the underlying instrument or index at period end and is representative of volume of activity during the period. Securities deposited to meet initial margin requirements are identified in the Schedule of Investments.
5. Purchases and Sales of Investments.
Purchases and sales of securities, other than short-term securities, U.S. government securities and in-kind transactions, as applicable, are noted in the table below.
| | Purchases ($) | Sales ($) |
| Fidelity Freedom Income Fund | 1,158,032,550 | 1,420,735,431 |
| Fidelity Freedom 2005 Fund | 384,205,220 | 483,744,298 |
| Fidelity Freedom 2010 Fund | 1,799,951,449 | 2,279,480,432 |
| Fidelity Freedom 2015 Fund | 2,708,757,747 | 3,423,438,939 |
| Fidelity Freedom 2020 Fund | 8,379,693,354 | 11,088,448,132 |
| Fidelity Freedom 2025 Fund | 10,879,572,071 | 11,994,986,413 |
| Fidelity Freedom 2030 Fund | 13,233,861,818 | 12,899,959,769 |
| Fidelity Freedom 2035 Fund | 9,645,382,835 | 8,700,052,501 |
| Fidelity Freedom 2040 Fund | 9,614,937,671 | 8,416,354,895 |
| Fidelity Freedom 2045 Fund | 6,625,468,415 | 5,712,338,174 |
| Fidelity Freedom 2050 Fund | 6,080,097,828 | 4,963,785,612 |
| Fidelity Freedom 2055 Fund | 3,588,755,813 | 2,572,593,414 |
| Fidelity Freedom 2060 Fund | 1,789,189,238 | 951,124,794 |
| Fidelity Freedom 2065 Fund | 358,184,491 | 79,236,690 |
6. Fees and Other Transactions with Affiliates.
Management Fee and Expense Contract. Fidelity Management & Research Company LLC (the investment adviser) and its affiliates provide the Funds with investment management related services. Under the management contract, each Class of each Fund pays a monthly management fee that is set at an annual rate by referring to each Fund's target date, indicated by its name, such that the management fee rate applicable to each Class of each Fund is reduced as the fund approaches, and then passes, its target date. In addition, under the management contract, the investment adviser pays all ordinary operating expenses of each Fund, except fees and expenses of the independent Trustees, and certain miscellaneous expenses such as proxy and shareholder meeting expenses. For each Fund, with the exception of Fidelity Freedom 2065 Fund, the management fee is reduced by an amount equal to the fees and expenses paid by each Fund to the independent Trustees. For the reporting period, the total annual management fee rate for each Class of each Fund was as follows:
| | Annual % of Class-Level Average Net Assets (Fidelity Freedom Class) | Annual % of Class-Level Average Net Assets
(Classes K, K6) |
| Fidelity Freedom Income Fund | .465% | .415% |
| Fidelity Freedom 2005 Fund | .465% | .415% |
| Fidelity Freedom 2010 Fund | .499% | .441% |
| Fidelity Freedom 2015 Fund | .542% | .475% |
| Fidelity Freedom 2020 Fund | .584% | .510% |
| Fidelity Freedom 2025 Fund | .627% | .545% |
| Fidelity Freedom 2030 Fund | .669% | .580% |
| Fidelity Freedom 2035 Fund | .712% | .615% |
| Fidelity Freedom 2040 Fund | .746% | .643% |
| Fidelity Freedom 2045 Fund | .746% | .643% |
| Fidelity Freedom 2050 Fund | .746% | .643% |
| Fidelity Freedom 2055 Fund | .746% | .643% |
| Fidelity Freedom 2060 Fund | .746% | .643% |
| Fidelity Freedom 2065 Fund | .746% | .643% |
Under the expense contract, the investment adviser pays class-level expenses for Class K6 of each Fund as necessary so that Class K6 total expenses do not exceed certain amounts of Class K6 average net assets on an annual basis with certain exceptions, as noted in the following table:
| | Annual % of Class-Level Average Net Assets (Class K6) |
| Fidelity Freedom Income Fund | .365% |
| Fidelity Freedom 2005 Fund | .365% |
| Fidelity Freedom 2010 Fund | .381% |
| Fidelity Freedom 2015 Fund | .400% |
| Fidelity Freedom 2020 Fund | .419% |
| Fidelity Freedom 2025 Fund | .439% |
| Fidelity Freedom 2030 Fund | .458% |
| Fidelity Freedom 2035 Fund | .477% |
| Fidelity Freedom 2040 Fund | .493% |
| Fidelity Freedom 2045 Fund | .493% |
| Fidelity Freedom 2050 Fund | .493% |
| Fidelity Freedom 2055 Fund | .493% |
| Fidelity Freedom 2060 Fund | .493% |
| Fidelity Freedom 2065 Fund | .493% |
Interfund Trades. Funds may purchase from or sell securities to other Fidelity Funds under procedures adopted by the Board. The procedures have been designed to ensure these interfund trades are executed in accordance with Rule 17a-7 of the 1940 Act. Any interfund trades are included within the respective purchases and sales amounts shown in the Purchases and Sales of Investments note. During the period there were no interfund trades.
Reallocation of Underlying Fund Investments. During the period, the investment adviser reallocated investments of the Funds. This involved taxable redemptions of the Funds' interest in Fidelity Series Inflation-Protected Bond Index Fund, ("Underlying Fund") for investments and cash and non-taxable exchanges of those investments and cash for shares of Fidelity Series 0-5 Year Inflation-Protected Bond Index Fund and Fidelity Series 5+ Year Inflation-Protected Bond Index Fund which are affiliated investment companies managed by FMR. Net realized gain (loss) on the redemptions of the Underlying Fund in connection with the reallocation is included in the accompanying Statements of Operations as "Net realized gain (loss) on Affiliated issuers."
Details of these transactions with the net related gain (loss) for the Funds are presented in the accompanying table:
| | Value of Investments and Cash reallocated ($) | Net realized Gain (Loss) on redemptions of Underlying Fund ($) |
| Fidelity Freedom Income Fund | 250,821,171 | 24,603,804 |
| Fidelity Freedom 2005 Fund | 74,082,513 | 6,544,098 |
| Fidelity Freedom 2010 Fund | 335,213,796 | 31,210,825 |
| Fidelity Freedom 2015 Fund | 427,651,235 | 38,619,356 |
| Fidelity Freedom 2020 Fund | 1,099,689,093 | 96,828,036 |
| Fidelity Freedom 2025 Fund | 1,205,199,986 | 86,145,299 |
| Fidelity Freedom 2030 Fund | 1,200,095,146 | 71,446,057 |
| Fidelity Freedom 2035 Fund | 248,686,136 | 16,792,714 |
| Fidelity Freedom 2040 Fund | 309,932,637 | 22,435,835 |
| Fidelity Freedom 2045 Fund | 203,889,206 | 14,311,889 |
| Fidelity Freedom 2050 Fund | 181,324,282 | 12,387,316 |
| Fidelity Freedom 2055 Fund | 94,965,361 | 5,715,892 |
| Fidelity Freedom 2060 Fund | 37,533,221 | 1,930,411 |
| Fidelity Freedom 2065 Fund | 3,812,883 | 95,641 |
7. Expense Reductions.
Through arrangements with each applicable Fund's custodian, credits realized as a result of certain uninvested cash balances were used to reduce each applicable Fund's or class' expenses. All of the applicable expense reductions are noted in the table below.
| | Custodian credits |
| Fidelity Freedom Income Fund | $4 |
| Fidelity Freedom 2005 Fund | 6 |
| Fidelity Freedom 2010 Fund | 2 |
| Fidelity Freedom 2015 Fund | 1 |
| Fidelity Freedom 2040 Fund | 2 |
| Fidelity Freedom 2045 Fund | 13 |
| Fidelity Freedom 2050 Fund | 9 |
| Fidelity Freedom 2055 Fund | 7 |
| Fidelity Freedom 2060 Fund | 1 |
| Fidelity Freedom 2065 Fund | 4 |
8. Distributions to Shareholders.
Distributions to shareholders of each class were as follows:
| | Year ended
March 31, 2022 | Year ended
March 31, 2021 |
| Fidelity Freedom Income Fund | | |
| Distributions to shareholders | | |
| Fidelity Freedom Income Fund | $118,991,291 | $85,036,870 |
| Class K | 53,741,112 | 47,068,955 |
| Class K6 | 16,730,089 | 10,211,961 |
| Total | $189,462,492 | $142,317,786 |
| Fidelity Freedom 2005 Fund | | |
| Distributions to shareholders | | |
| Fidelity Freedom 2005 Fund | $43,610,827 | $25,990,849 |
| Class K | 22,894,594 | 16,551,868 |
| Class K6 | 6,924,355 | 3,817,310 |
| Total | $73,429,776 | $46,360,027 |
| Fidelity Freedom 2010 Fund | | |
| Distributions to shareholders | | |
| Fidelity Freedom 2010 Fund | $330,780,379 | $220,059,856 |
| Class K | 111,484,456 | 91,748,163 |
| Class K6 | 30,101,828 | 18,367,313 |
| Total | $472,366,663 | $330,175,332 |
| Fidelity Freedom 2015 Fund | | |
| Distributions to shareholders | | |
| Fidelity Freedom 2015 Fund | $503,185,276 | $323,873,976 |
| Class K | 233,539,531 | 187,564,926 |
| Class K6 | 72,053,293 | 47,948,936 |
| Total | $808,778,100 | $559,387,838 |
| Fidelity Freedom 2020 Fund | | |
| Distributions to shareholders | | |
| Fidelity Freedom 2020 Fund | $1,497,733,718 | $855,393,315 |
| Class K | 1,021,296,577 | 752,564,869 |
| Class K6 | 285,901,662 | 179,716,923 |
| Total | $2,804,931,957 | $1,787,675,107 |
| Fidelity Freedom 2025 Fund | | |
| Distributions to shareholders | | |
| Fidelity Freedom 2025 Fund | $1,390,020,443 | $704,972,948 |
| Class K | 1,249,727,943 | 801,066,260 |
| Class K6 | 416,296,775 | 229,045,658 |
| Total | $3,056,045,161 | $1,735,084,866 |
| Fidelity Freedom 2030 Fund | | |
| Distributions to shareholders | | |
| Fidelity Freedom 2030 Fund | $1,815,146,825 | $939,854,666 |
| Class K | 1,663,191,130 | 1,055,755,784 |
| Class K6 | 545,676,455 | 284,896,783 |
| Total | $4,024,014,410 | $2,280,507,233 |
| Fidelity Freedom 2035 Fund | | |
| Distributions to shareholders | | |
| Fidelity Freedom 2035 Fund | $1,330,916,494 | $596,190,670 |
| Class K | 1,359,767,518 | 758,932,410 |
| Class K6 | 496,297,314 | 232,550,392 |
| Total | $3,186,981,326 | $1,587,673,472 |
| Fidelity Freedom 2040 Fund | | |
| Distributions to shareholders | | |
| Fidelity Freedom 2040 Fund | $1,408,661,493 | $583,860,791 |
| Class K | 1,440,225,207 | 737,443,903 |
| Class K6 | 513,441,595 | 210,098,293 |
| Total | $3,362,328,295 | $1,531,402,987 |
| Fidelity Freedom 2045 Fund | | |
| Distributions to shareholders | | |
| Fidelity Freedom 2045 Fund | $784,616,906 | $280,540,287 |
| Class K | 1,029,356,352 | 463,825,379 |
| Class K6 | 383,909,808 | 143,769,081 |
| Total | $2,197,883,066 | $888,134,747 |
| Fidelity Freedom 2050 Fund | | |
| Distributions to shareholders | | |
| Fidelity Freedom 2050 Fund | $652,636,167 | $237,431,913 |
| Class K | 942,334,414 | 411,733,439 |
| Class K6 | 321,954,203 | 116,634,253 |
| Total | $1,916,924,784 | $765,799,605 |
| Fidelity Freedom 2055 Fund | | |
| Distributions to shareholders | | |
| Fidelity Freedom 2055 Fund | $296,345,760 | $92,585,422 |
| Class K | 491,336,374 | 181,353,194 |
| Class K6 | 164,295,822 | 51,932,021 |
| Total | $951,977,956 | $325,870,637 |
| Fidelity Freedom 2060 Fund | | |
| Distributions to shareholders | | |
| Fidelity Freedom 2060 Fund | $99,642,740 | $26,889,141 |
| Class K | 178,794,880 | 56,244,575 |
| Class K6 | 60,031,062 | 15,701,872 |
| Total | $338,468,682 | $98,835,588 |
| Fidelity Freedom 2065 Fund | | |
| Distributions to shareholders | | |
| Fidelity Freedom 2065 Fund | $8,437,371 | $904,197 |
| Class K | 12,631,428 | 1,507,870 |
| Class K6 | 5,445,584 | 534,477 |
| Total | $26,514,383 | $2,946,544 |
9. Share Transactions.
Share transactions for each class were as follows and may contain in-kind transactions, automatic conversions between classes or exchanges between affiliated funds:
| | Shares | Shares | Dollars | Dollars |
| | Year ended March 31, 2022 | Year endedMarch 31, 2021 | Year ended March 31, 2022 | Year endedMarch 31, 2021 |
| Fidelity Freedom Income Fund | | | | |
| Fidelity Freedom Income Fund | | | | |
| Shares sold | 22,119,285 | 31,164,338 | $267,213,144 | $374,531,405 |
| Reinvestment of distributions | 9,637,846 | 7,001,613 | 115,877,879 | 83,147,746 |
| Shares redeemed | (35,979,473) | (36,010,413) | (433,357,462) | (431,019,214) |
| Net increase (decrease) | (4,222,342) | 2,155,538 | $(50,266,439) | $26,659,937 |
| Class K | | | | |
| Shares sold | 16,680,046 | 25,686,249 | $200,717,690 | $307,049,507 |
| Reinvestment of distributions | 4,472,952 | 3,972,133 | 53,703,106 | 47,050,348 |
| Shares redeemed | (38,281,310) | (37,861,740) | (462,940,655) | (451,620,927) |
| Net increase (decrease) | (17,128,312) | (8,203,358) | $(208,519,859) | $(97,521,072) |
| Class K6 | | | | |
| Shares sold | 13,137,196 | 8,530,893 | $158,945,851 | $102,309,883 |
| Reinvestment of distributions | 1,395,523 | 860,536 | 16,730,089 | 10,211,961 |
| Shares redeemed | (10,427,151) | (7,244,034) | (126,008,091) | (86,822,330) |
| Net increase (decrease) | 4,105,568 | 2,147,395 | $49,667,849 | $25,699,514 |
| Fidelity Freedom 2005 Fund | | | | |
| Fidelity Freedom 2005 Fund | | | | |
| Shares sold | 4,884,825 | 11,500,610 | $63,417,362 | $147,671,059 |
| Reinvestment of distributions | 3,373,635 | 2,029,580 | 42,938,081 | 25,654,554 |
| Shares redeemed | (10,902,120) | (10,800,390) | (141,393,321) | (138,461,321) |
| Net increase (decrease) | (2,643,660) | 2,729,800 | $(35,037,878) | $34,864,292 |
| Class K | | | | |
| Shares sold | 7,655,725 | 11,640,211 | $98,017,800 | $147,069,138 |
| Reinvestment of distributions | 1,801,026 | 1,312,734 | 22,894,594 | 16,551,868 |
| Shares redeemed | (13,304,194) | (14,638,197) | (172,074,021) | (186,198,235) |
| Net increase (decrease) | (3,847,443) | (1,685,252) | $(51,161,627) | $(22,577,229) |
| Class K6 | | | | |
| Shares sold | 4,791,804 | 3,998,110 | $61,935,555 | $50,692,389 |
| Reinvestment of distributions | 547,203 | 302,076 | 6,924,355 | 3,817,310 |
| Shares redeemed | (4,293,740) | (3,089,579) | (55,674,250) | (39,192,543) |
| Net increase (decrease) | 1,045,267 | 1,210,607�� | $13,185,660 | $15,317,156 |
| Fidelity Freedom 2010 Fund | | | | |
| Fidelity Freedom 2010 Fund | | | | |
| Shares sold | 11,443,611 | 25,337,398 | $185,302,616 | $406,499,604 |
| Reinvestment of distributions | 20,338,393 | 13,798,998 | 323,454,735 | 215,480,168 |
| Shares redeemed | (37,100,208) | (36,380,079) | (599,475,508) | (578,016,747) |
| Net increase (decrease) | (5,318,204) | 2,756,317 | $(90,718,157) | $43,963,025 |
| Class K | | | | |
| Shares sold | 12,207,765 | 14,541,138 | $196,166,118 | $229,705,543 |
| Reinvestment of distributions | 7,009,249 | 5,892,820 | 111,484,456 | 91,748,164 |
| Shares redeemed | (34,740,922) | (32,567,182) | (564,437,012) | (515,115,278) |
| Net increase (decrease) | (15,523,908) | (12,133,224) | $(256,786,438) | $(193,661,571) |
| Class K6 | | | | |
| Shares sold | 9,752,068 | 7,454,131 | $156,988,522 | $118,779,596 |
| Reinvestment of distributions | 1,904,870 | 1,179,442 | 30,101,828 | 18,367,313 |
| Shares redeemed | (9,083,534) | (7,099,734) | (146,481,634) | (112,770,478) |
| Net increase (decrease) | 2,573,404 | 1,533,839 | $40,608,716 | $24,376,431 |
| Fidelity Freedom 2015 Fund | | | | |
| Fidelity Freedom 2015 Fund | | | | |
| Shares sold | 31,636,405 | 53,916,620 | $426,444,682 | $712,539,975 |
| Reinvestment of distributions | 37,389,668 | 25,059,163 | 493,791,207 | 319,660,991 |
| Shares redeemed | (70,309,859) | (73,496,968) | (943,909,675) | (956,484,715) |
| Net increase (decrease) | (1,283,786) | 5,478,815 | $(23,673,786) | $75,716,251 |
| Class K | | | | |
| Shares sold | 28,366,240 | 27,461,789 | $378,836,651 | $356,911,518 |
| Reinvestment of distributions | 17,696,986 | 14,748,644 | 233,539,531 | 187,564,925 |
| Shares redeemed | (74,854,158) | (71,683,768) | (1,011,157,920) | (930,116,535) |
| Net increase (decrease) | (28,790,932) | (29,473,335) | $(398,781,738) | $(385,640,092) |
| Class K6 | | | | |
| Shares sold | 21,362,273 | 18,811,966 | $288,820,573 | $245,126,067 |
| Reinvestment of distributions | 5,487,844 | 3,760,022 | 72,053,293 | 47,948,936 |
| Shares redeemed | (27,510,463) | (16,659,731) | (373,079,287) | (217,361,848) |
| Net increase (decrease) | (660,346) | 5,912,257 | $(12,205,421) | $75,713,155 |
| Fidelity Freedom 2020 Fund | | | | |
| Fidelity Freedom 2020 Fund | | | | |
| Shares sold | 100,889,192 | 156,559,208 | $1,740,420,595 | $2,617,346,260 |
| Reinvestment of distributions | 86,630,804 | 52,465,114 | 1,460,883,797 | 844,596,826 |
| Shares redeemed | (179,040,643) | (198,728,102) | (3,071,539,860) | (3,265,405,195) |
| Net increase (decrease) | 8,479,353 | 10,296,220 | $129,764,532 | $196,537,891 |
| Class K | | | | |
| Shares sold | 79,327,683 | 100,937,518 | $1,358,428,900 | $1,652,612,571 |
| Reinvestment of distributions | 60,534,219 | 46,920,875 | 1,021,184,649 | 752,519,883 |
| Shares redeemed | (250,445,089) | (250,592,644) | (4,330,562,063) | (4,108,783,899) |
| Net increase (decrease) | (110,583,187) | (102,734,251) | $(1,950,948,514) | $(1,703,651,445) |
| Class K6 | | | | |
| Shares sold | 65,420,870 | 53,711,108 | $1,127,778,622 | $890,607,711 |
| Reinvestment of distributions | 17,045,976 | 11,175,514 | 285,901,662 | 179,716,923 |
| Shares redeemed | (80,065,800) | (59,540,884) | (1,392,055,913) | (983,895,026) |
| Net increase (decrease) | 2,401,046 | 5,345,738 | $21,624,371 | $86,429,608 |
| Fidelity Freedom 2025 Fund | | | | |
| Fidelity Freedom 2025 Fund | | | | |
| Shares sold | 165,275,251 | 210,337,805 | $2,610,131,603 | $3,149,497,251 |
| Reinvestment of distributions | 88,008,649 | 48,505,977 | 1,365,336,639 | 698,301,471 |
| Shares redeemed | (205,066,644) | (196,693,866) | (3,225,566,161) | (2,878,418,032) |
| Net increase (decrease) | 48,217,256 | 62,149,916 | $749,902,081 | $969,380,690 |
| Class K | | | | |
| Shares sold | 159,149,482 | 182,126,282 | $2,498,462,611 | $2,666,904,348 |
| Reinvestment of distributions | 80,648,053 | 55,805,130 | 1,249,414,473 | 800,942,777 |
| Shares redeemed | (343,733,044) | (295,182,498) | (5,441,416,390) | (4,304,180,205) |
| Net increase (decrease) | (103,935,509) | (57,251,086) | $(1,693,539,306) | $(836,333,080) |
| Class K6 | | | | |
| Shares sold | 113,877,509 | 94,729,160 | $1,791,545,487 | $1,404,293,318 |
| Reinvestment of distributions | 26,968,555 | 15,887,217 | 416,296,775 | 229,045,657 |
| Shares redeemed | (120,631,642) | (74,204,850) | (1,916,410,633) | (1,095,696,606) |
| Net increase (decrease) | 20,214,422 | 36,411,527 | $291,431,629 | $537,642,369 |
| Fidelity Freedom 2030 Fund | | | | |
| Fidelity Freedom 2030 Fund | | | | |
| Shares sold | 133,595,046 | 173,411,890 | $2,654,181,525 | $3,216,373,537 |
| Reinvestment of distributions | 91,762,119 | 52,410,618 | 1,788,110,990 | 930,668,891 |
| Shares redeemed | (152,007,544) | (164,912,233) | (3,008,304,048) | (2,993,567,133) |
| Net increase (decrease) | 73,349,621 | 60,910,275 | $1,433,988,467 | $1,153,475,295 |
| Class K | | | | |
| Shares sold | 142,180,700 | 155,368,244 | $2,805,538,559 | $2,817,242,675 |
| Reinvestment of distributions | 85,379,317 | 59,622,779 | 1,662,884,419 | 1,055,636,740 |
| Shares redeemed | (300,736,782) | (260,764,551) | (5,999,095,370) | (4,691,208,655) |
| Net increase (decrease) | (73,176,765) | (45,773,528) | $(1,530,672,392) | $(818,329,240) |
| Class K6 | | | | |
| Shares sold | 118,508,960 | 83,168,181 | $2,343,787,146 | $1,536,798,281 |
| Reinvestment of distributions | 28,137,244 | 16,003,724 | 545,676,455 | 284,896,783 |
| Shares redeemed | (97,990,956) | (62,222,431) | (1,959,803,476) | (1,145,636,684) |
| Net increase (decrease) | 48,655,248 | 36,949,474 | $929,660,125 | $676,058,380 |
| Fidelity Freedom 2035 Fund | | | | |
| Fidelity Freedom 2035 Fund | | | | |
| Shares sold | 113,455,720 | 143,182,206 | $1,968,630,651 | $2,261,194,436 |
| Reinvestment of distributions | 77,128,510 | 39,628,198 | 1,315,370,749 | 591,728,084 |
| Shares redeemed | (119,246,911) | (129,049,743) | (2,068,492,213) | (1,977,602,251) |
| Net increase (decrease) | 71,337,319 | 53,760,661 | $1,215,509,187 | $875,320,269 |
| Class K | | | | |
| Shares sold | 138,509,224 | 147,842,978 | $2,391,096,357 | $2,260,213,524 |
| Reinvestment of distributions | 79,808,534 | 50,990,578 | 1,359,680,905 | 758,909,161 |
| Shares redeemed | (265,777,119) | (234,136,246) | (4,649,995,558) | (3,571,499,917) |
| Net increase (decrease) | (47,459,361) | (35,302,690) | $(899,218,296) | $(552,377,232) |
| Class K6 | | | | |
| Shares sold | 108,871,298 | 80,094,228 | $1,885,798,374 | $1,254,281,237 |
| Reinvestment of distributions | 29,216,531 | 15,511,106 | 496,297,314 | 232,550,392 |
| Shares redeemed | (93,333,642) | (58,219,476) | (1,638,673,084) | (906,044,076) |
| Net increase (decrease) | 44,754,187 | 37,385,858 | $743,422,604 | $580,787,553 |
| Fidelity Freedom 2040 Fund | | | | |
| Fidelity Freedom 2040 Fund | | | | |
| Shares sold | 144,914,050 | 178,108,225 | $1,808,070,884 | $1,975,797,076 |
| Reinvestment of distributions | 113,389,482 | 55,500,372 | 1,388,923,509 | 578,162,864 |
| Shares redeemed | (157,003,598) | (178,100,857) | (1,957,034,768) | (1,919,969,505) |
| Net increase (decrease) | 101,299,934 | 55,507,740 | $1,239,959,625 | $633,990,435 |
| Class K | | | | |
| Shares sold | 177,104,925 | 194,916,567 | $2,197,442,572 | $2,094,984,471 |
| Reinvestment of distributions | 117,577,057 | 71,038,067 | 1,440,201,658 | 737,436,312 |
| Shares redeemed | (377,794,576) | (329,404,938) | (4,755,909,005) | (3,513,599,136) |
| Net increase (decrease) | (83,112,594) | (63,450,304) | $(1,118,264,775) | $(681,178,353) |
| Class K6 | | | | |
| Shares sold | 163,741,876 | 105,216,070 | $2,038,251,213 | $1,163,959,609 |
| Reinvestment of distributions | 42,115,101 | 20,093,501 | 513,441,595 | 210,098,293 |
| Shares redeemed | (125,083,975) | (77,466,294) | (1,575,864,464) | (853,646,770) |
| Net increase (decrease) | 80,773,002 | 47,843,277 | $975,828,344 | $520,411,132 |
| Fidelity Freedom 2045 Fund | | | | |
| Fidelity Freedom 2045 Fund | | | | |
| Shares sold | 91,104,445 | 113,233,317 | $1,299,799,946 | $1,435,097,348 |
| Reinvestment of distributions | 55,188,275 | 23,501,888 | 774,085,743 | 277,774,070 |
| Shares redeemed | (92,060,326) | (93,248,351) | (1,316,821,262) | (1,146,724,485) |
| Net increase (decrease) | 54,232,394 | 43,486,854 | $757,064,427 | $566,146,933 |
| Class K | | | | |
| Shares sold | 129,603,483 | 139,887,703 | $1,839,866,004 | $1,708,586,045 |
| Reinvestment of distributions | 73,437,119 | 39,359,151 | 1,029,308,656 | 463,816,140 |
| Shares redeemed | (238,834,004) | (207,058,952) | (3,442,233,635) | (2,538,068,424) |
| Net increase (decrease) | (35,793,402) | (27,812,098) | $(573,058,975) | $(365,666,239) |
| Class K6 | | | | |
| Shares sold | 109,099,983 | 75,625,592 | $1,553,372,462 | $954,196,507 |
| Reinvestment of distributions | 27,517,155 | 12,109,027 | 383,909,808 | 143,769,081 |
| Shares redeemed | (89,870,054) | (50,788,422) | (1,298,126,989) | (636,628,389) |
| Net increase (decrease) | 46,747,084 | 36,946,197 | $639,155,281 | $461,337,199 |
| Fidelity Freedom 2050 Fund | | | | |
| Fidelity Freedom 2050 Fund | | | | |
| Shares sold | 83,090,795 | 97,188,366 | $1,195,087,164 | $1,232,319,301 |
| Reinvestment of distributions | 45,388,770 | 19,700,871 | 642,458,392 | 234,240,349 |
| Shares redeemed | (82,022,643) | (84,416,356) | (1,182,000,294) | (1,045,778,100) |
| Net increase (decrease) | 46,456,922 | 32,472,881 | $655,545,262 | $420,781,550 |
| Class K | | | | |
| Shares sold | 125,609,161 | 139,683,126 | $1,799,974,225 | $1,716,878,084 |
| Reinvestment of distributions | 66,634,241 | 34,728,101 | 942,315,016 | 411,729,817 |
| Shares redeemed | (213,468,368) | (185,066,773) | (3,096,075,637) | (2,274,261,301) |
| Net increase (decrease) | (21,224,966) | (10,655,546) | $(353,786,396) | $(145,653,400) |
| Class K6 | | | | |
| Shares sold | 103,765,008 | 69,193,076 | $1,488,418,420 | $880,114,497 |
| Reinvestment of distributions | 22,812,162 | 9,720,979 | 321,954,203 | 116,634,253 |
| Shares redeemed | (76,162,066) | (44,382,561) | (1,112,911,369) | (563,588,824) |
| Net increase (decrease) | 50,415,104 | 34,531,494 | $697,461,254 | $433,159,926 |
| Fidelity Freedom 2055 Fund | | | | |
| Fidelity Freedom 2055 Fund | | | | |
| Shares sold | 48,944,593 | 52,805,481 | $809,607,355 | $761,731,307 |
| Reinvestment of distributions | 17,819,643 | 6,721,582 | 290,755,908 | 90,846,223 |
| Shares redeemed | (42,105,665) | (40,859,659) | (698,242,837) | (579,328,173) |
| Net increase (decrease) | 24,658,571 | 18,667,404 | $402,120,426 | $273,249,357 |
| Class K | | | | |
| Shares sold | 78,791,763 | 83,301,521 | $1,300,207,031 | $1,172,257,484 |
| Reinvestment of distributions | 30,116,057 | 13,427,938 | 491,325,051 | 181,351,366 |
| Shares redeemed | (101,055,238) | (91,774,264) | (1,685,810,073) | (1,295,402,712) |
| Net increase (decrease) | 7,852,582 | 4,955,195 | $105,722,009 | $58,206,138 |
| Class K6 | | | | |
| Shares sold | 53,056,696 | 38,693,453 | $875,120,348 | $562,128,294 |
| Reinvestment of distributions | 10,089,839 | 3,793,080 | 164,295,822 | 51,932,021 |
| Shares redeemed | (37,974,925) | (20,992,833) | (638,190,211) | (304,189,568) |
| Net increase (decrease) | 25,171,610 | 21,493,700 | $401,225,959 | $309,870,747 |
| Fidelity Freedom 2060 Fund | | | | |
| Fidelity Freedom 2060 Fund | | | | |
| Shares sold | 30,895,112 | 28,395,866 | $464,438,162 | $369,913,649 |
| Reinvestment of distributions | 6,541,056 | 2,120,404 | 97,295,738 | 26,051,613 |
| Shares redeemed | (20,384,158) | (16,364,695) | (307,750,600) | (210,471,664) |
| Net increase (decrease) | 17,052,010 | 14,151,575 | $253,983,300 | $185,493,598 |
| Class K | | | | |
| Shares sold | 52,258,699 | 51,760,589 | $783,831,053 | $660,133,323 |
| Reinvestment of distributions | 12,027,251 | 4,584,224 | 178,787,491 | 56,243,271 |
| Shares redeemed | (48,018,862) | (35,827,657) | (726,660,382) | (457,361,287) |
| Net increase (decrease) | 16,267,088 | 20,517,156 | $235,958,162 | $259,015,307 |
| Class K6 | | | | |
| Shares sold | 31,341,471 | 19,827,127 | $469,274,637 | $261,235,975 |
| Reinvestment of distributions | 4,041,952 | 1,264,771 | 60,031,062 | 15,701,872 |
| Shares redeemed | (17,051,658) | (8,227,265) | (259,770,406) | (107,459,249) |
| Net increase (decrease) | 18,331,765 | 12,864,633 | $269,535,293 | $169,478,598 |
| Fidelity Freedom 2065 Fund | | | | |
| Fidelity Freedom 2065 Fund | | | | |
| Shares sold | 8,615,473 | 5,092,491 | $115,509,721 | $59,756,931 |
| Reinvestment of distributions | 613,946 | 75,246 | 8,202,794 | 895,713 |
| Shares redeemed | (3,035,183) | (1,476,729) | (40,814,756) | (17,228,130) |
| Net increase (decrease) | 6,194,236 | 3,691,008 | $82,897,760 | $43,424,514 |
| Class K | | | | |
| Shares sold | 14,515,549 | 8,930,502 | $194,247,221 | $103,562,991 |
| Reinvestment of distributions | 944,722 | 126,887 | 12,631,428 | 1,507,870 |
| Shares redeemed | (7,097,895) | (2,822,817) | (95,900,283) | (32,250,996) |
| Net increase (decrease) | 8,362,376 | 6,234,572 | $110,978,366 | $72,819,865 |
| Class K6 | | | | |
| Shares sold | 7,203,870 | 3,313,867 | $96,427,860 | $38,913,937 |
| Reinvestment of distributions | 406,566 | 44,809 | 5,445,584 | 534,477 |
| Shares redeemed | (2,468,943) | (762,998) | (33,301,760) | (8,842,653) |
| Net increase (decrease) | 5,141,493 | 2,595,678 | $68,571,684 | $30,605,761 |
10. Other.
A fund's organizational documents provide former and current trustees and officers with a limited indemnification against liabilities arising in connection with the performance of their duties to the fund. In the normal course of business, a fund may also enter into contracts that provide general indemnifications. A fund's maximum exposure under these arrangements is unknown as this would be dependent on future claims that may be made against a fund. The risk of material loss from such claims is considered remote.
Funds do not invest in underlying mutual funds for the purpose of exercising management or control; however, investments by funds within their principal investment strategies may represent a significant portion of the underlying mutual fund's net assets. At the end of the period, certain Funds were the owners of record of 10% or more of the total outstanding shares of the following underlying mutual funds as shown below.
| Fund | Fidelity Freedom 2020 Fund | Fidelity Freedom 2025 Fund | Fidelity Freedom 2030 Fund | Fidelity Freedom 2035 Fund | Fidelity Freedom 2040 Fund | Fidelity Freedom 2045 Fund | Fidelity Freedom 2050 Fund |
| Fidelity Series 5+ Year Inflation-Protected Bond Index Fund | 19% | 22% | 12% | –% | –% | –% | –% |
| Fidelity Series All-Sector Equity Fund | –% | –% | 13% | 13% | 15% | 10% | –% |
| Fidelity Series Blue Chip Growth Fund | –% | –% | 12% | 12% | 14% | –% | –% |
| Fidelity Series Canada Fund | –% | –% | 13% | 12% | 14% | –% | –% |
| Fidelity Series Commodity Strategy Fund | –% | 11% | 14% | 11% | 11% | –% | –% |
| Fidelity Series Emerging Markets Debt Fund | –% | 11% | 14% | 11% | 11% | –% | –% |
| Fidelity Series Emerging Markets Debt Local Currency Fund | –% | 11% | 14% | 11% | 11% | –% | –% |
| Fidelity Series Emerging Markets Fund | –% | –% | 13% | 12% | 13% | –% | –% |
| Fidelity Series Emerging Markets Opportunities Fund | –% | –% | 13% | 12% | 13% | –% | –% |
| Fidelity Series Floating Rate High Income Fund | –% | 11% | 14% | 11% | 11% | –% | –% |
| Fidelity Series Government Money Market Fund | 11% | –% | –% | –% | –% | –% | –% |
| Fidelity Series Growth Company Fund | –% | 10% | 15% | 14% | 17% | 12% | 10% |
| Fidelity Series High Income Fund | –% | 11% | 14% | 11% | 11% | –% | –% |
| Fidelity Series Inflation-Protected Bond Index Fund | 12% | 13% | 12% | –% | –% | –% | –% |
| Fidelity Series International Credit Fund | 18% | 15% | 15% | –% | –% | –% | –% |
| Fidelity Series International Developed Markets Bond Index Fund | –% | 12% | 15% | –% | –% | –% | –% |
| Fidelity Series International Growth Fund | –% | –% | 13% | 12% | 14% | –% | –% |
| Fidelity Series International Small Cap Fund | –% | –% | 13% | 12% | 14% | –% | –% |
| Fidelity Series International Value Fund | –% | –% | 13% | 12% | 14% | –% | –% |
| Fidelity Series Intrinsic Opportunities Fund | –% | 10% | 15% | 14% | 17% | 12% | 10% |
| Fidelity Series Investment Grade Bond Fund | 16% | 18% | 20% | –% | –% | –% | –% |
| Fidelity Series Large Cap Stock Fund | –% | –% | 12% | 12% | 14% | –% | –% |
| Fidelity Series Large Cap Value Index Fund | –% | –% | 11% | 10% | 13% | –% | –% |
| Fidelity Series Long-Term Treasury Bond Index Fund | –% | –% | 11% | –% | –% | –% | –% |
| Fidelity Series Opportunistic Insights Fund | –% | –% | 13% | 13% | 15% | 10% | –% |
| Fidelity Series Overseas Fund | –% | –% | 13% | 12% | 14% | –% | –% |
| Fidelity Series Real Estate Income Fund | –% | 11% | 14% | 11% | 11% | –% | –% |
| Fidelity Series Short-Term Credit Fund | 11% | –% | –% | –% | –% | –% | –% |
| Fidelity Series Small Cap Discovery Fund | –% | 10% | 15% | 14% | 17% | 11% | 10% |
| Fidelity Series Small Cap Opportunities Fund | –% | –% | 12% | 12% | 14% | –% | –% |
| Fidelity Series Stock Selector Large Cap Value Fund | –% | –% | 13% | 13% | 16% | 10% | –% |
| Fidelity Series Value Discovery Fund | –% | –% | 12% | 12% | 14% | –% | –% |
The Funds, in aggregate, were the owners of record of more than 20% of the total outstanding shares of the following underlying mutual funds.
| Fund | % of shares held |
| Fidelity Series 0-5 Year Inflation-Protected Bond Index Fund | 31% |
| Fidelity Series 5+ Year Inflation-Protected Bond Index Fund | 61% |
| Fidelity Series All-Sector Equity Fund | 84% |
| Fidelity Series Blue Chip Growth Fund | 80% |
| Fidelity Series Canada Fund | 82% |
| Fidelity Series Commodity Strategy Fund | 80% |
| Fidelity Series Emerging Markets Debt Fund | 80% |
| Fidelity Series Emerging Markets Debt Local Currency Fund | 80% |
| Fidelity Series Emerging Markets Fund | 81% |
| Fidelity Series Emerging Markets Opportunities Fund | 81% |
| Fidelity Series Floating Rate High Income Fund | 80% |
| Fidelity Series Government Money Market Fund | 48% |
| Fidelity Series Growth Company Fund | 97% |
| Fidelity Series High Income Fund | 80% |
| Fidelity Series Inflation-Protected Bond Index Fund | 50% |
| Fidelity Series International Credit Fund | 91% |
| Fidelity Series International Developed Markets Bond Index Fund | 49% |
| Fidelity Series International Growth Fund | 82% |
| Fidelity Series International Small Cap Fund | 82% |
| Fidelity Series International Value Fund | 82% |
| Fidelity Series Intrinsic Opportunities Fund | 97% |
| Fidelity Series Investment Grade Bond Fund | 78% |
| Fidelity Series Large Cap Stock Fund | 80% |
| Fidelity Series Large Cap Value Index Fund | 70% |
| Fidelity Series Long-Term Treasury Bond Index Fund | 59% |
| Fidelity Series Opportunistic Insights Fund | 84% |
| Fidelity Series Overseas Fund | 82% |
| Fidelity Series Real Estate Income Fund | 80% |
| Fidelity Series Short-Term Credit Fund | 47% |
| Fidelity Series Small Cap Discovery Fund | 97% |
| Fidelity Series Small Cap Opportunities Fund | 80% |
| Fidelity Series Stock Selector Large Cap Value Fund | 87% |
| Fidelity Series Value Discovery Fund | 79% |
11. Coronavirus (COVID-19) Pandemic.
An outbreak of COVID-19 first detected in China during December 2019 has since spread globally and was declared a pandemic by the World Health Organization during March 2020. Developments that disrupt global economies and financial markets, such as the COVID-19 pandemic, may magnify factors that affect the Funds' performance.
Report of Independent Registered Public Accounting Firm
To the Board of Trustees of Fidelity Aberdeen Street Trust and Shareholders of Fidelity Freedom Income Fund, Fidelity Freedom 2005 Fund, Fidelity Freedom 2010 Fund, Fidelity Freedom 2015 Fund, Fidelity Freedom 2020 Fund, Fidelity Freedom 2025 Fund, Fidelity Freedom 2030 Fund, Fidelity Freedom 2035 Fund, Fidelity Freedom 2040 Fund, Fidelity Freedom 2045 Fund, Fidelity Freedom 2050 Fund, Fidelity Freedom 2055 Fund, Fidelity Freedom 2060 Fund and Fidelity Freedom 2065 Fund
Opinions on the Financial Statements
We have audited the accompanying statements of assets and liabilities, including the schedules of investments, of Fidelity Freedom Income Fund, Fidelity Freedom 2005 Fund, Fidelity Freedom 2010 Fund, Fidelity Freedom 2015 Fund, Fidelity Freedom 2020 Fund, Fidelity Freedom 2025 Fund, Fidelity Freedom 2030 Fund, Fidelity Freedom 2035 Fund, Fidelity Freedom 2040 Fund, Fidelity Freedom 2045 Fund, Fidelity Freedom 2050 Fund, Fidelity Freedom 2055 Fund, Fidelity Freedom 2060 Fund and Fidelity Freedom 2065 Fund (fourteen of the funds constituting Fidelity Aberdeen Street Trust, hereafter collectively referred to as the “Funds”) as of March 31, 2022, the related statements of operations for the year ended March 31, 2022, the statements of changes in net assets for each of the two years in the period ended March 31, 2022, including the related notes, and the financial highlights for each of the periods indicated therein (collectively referred to as the “financial statements”). In our opinion, the financial statements present fairly, in all material respects, the financial position of each of the Funds as of March 31, 2022, the results of each of their operations for the year then ended, the changes in each of their net assets for each of the two years in the period ended March 31, 2022, and each of the financial highlights for each of the periods indicated therein, in conformity with accounting principles generally accepted in the United States of America.
Basis for Opinions
These financial statements are the responsibility of the Funds’ management. Our responsibility is to express an opinion on the Funds’ financial statements based on our audits. We are a public accounting firm registered with the Public Company Accounting Oversight Board (United States) (PCAOB) and are required to be independent with respect to the Funds in accordance with the U.S. federal securities laws and the applicable rules and regulations of the Securities and Exchange Commission and the PCAOB.
We conducted our audits of these financial statements in accordance with the standards of the PCAOB. Those standards require that we plan and perform the audit to obtain reasonable assurance about whether the financial statements are free of material misstatement, whether due to error or fraud.
Our audits included performing procedures to assess the risks of material misstatement of the financial statements, whether due to error or fraud, and performing procedures that respond to those risks. Such procedures included examining, on a test basis, evidence regarding the amounts and disclosures in the financial statements. Our audits also included evaluating the accounting principles used and significant estimates made by management, as well as evaluating the overall presentation of the financial statements. Our procedures included confirmation of securities owned as of March 31, 2022 by correspondence with the custodian and brokers; when replies were not received from brokers, we performed other auditing procedures. We believe that our audits provide a reasonable basis for our opinions.
/s/ PricewaterhouseCoopers LLP
Boston, Massachusetts
May 10, 2022
We have served as the auditor of one or more investment companies in the Fidelity group of funds since 1932.
Trustees and Officers
The Trustees, Members of the Advisory Board (if any), and officers of the trust and funds, as applicable, are listed below. The Board of Trustees governs each fund and is responsible for protecting the interests of shareholders. The Trustees are experienced executives who meet periodically throughout the year to oversee each fund's activities, review contractual arrangements with companies that provide services to each fund, oversee management of the risks associated with such activities and contractual arrangements, and review each fund's performance. If the interests of a fund and an underlying Fidelity® fund were to diverge, a conflict of interest could arise and affect how the Trustees and Members of the Advisory Board fulfill their fiduciary duties to the affected funds. FMR has structured the funds to avoid these potential conflicts, although there may be situations where a conflict of interest is unavoidable. In such instances, FMR, the Trustees, and Members of the Advisory Board would take reasonable steps to minimize and, if possible, eliminate the conflict. Each of the Trustees oversees 292 funds.
The Trustees hold office without limit in time except that (a) any Trustee may resign; (b) any Trustee may be removed by written instrument, signed by at least two-thirds of the number of Trustees prior to such removal; (c) any Trustee who requests to be retired or who has become incapacitated by illness or injury may be retired by written instrument signed by a majority of the other Trustees; and (d) any Trustee may be removed at any special meeting of shareholders by a two-thirds vote of the outstanding voting securities of the trust. Each Trustee who is not an interested person (as defined in the 1940 Act) of the trust and the funds is referred to herein as an Independent Trustee. Each Independent Trustee shall retire not later than the last day of the calendar year in which his or her 75th birthday occurs. The Independent Trustees may waive this mandatory retirement age policy with respect to individual Trustees. Officers and Advisory Board Members hold office without limit in time, except that any officer or Advisory Board Member may resign or may be removed by a vote of a majority of the Trustees at any regular meeting or any special meeting of the Trustees. Except as indicated, each individual has held the office shown or other offices in the same company for the past five years.
Each fund's Statement of Additional Information (SAI) includes more information about the Trustees. To request a free copy, call Fidelity at 1-800-544-8544 if you’re an individual investing directly with Fidelity, call 1-800-835-5092 if you’re a plan sponsor or participant with Fidelity as your recordkeeper or call 1-877-208-0098 on institutional accounts or if you’re an advisor or invest through one.
Experience, Skills, Attributes, and Qualifications of the Trustees. The Governance and Nominating Committee has adopted a statement of policy that describes the experience, qualifications, attributes, and skills that are necessary and desirable for potential Independent Trustee candidates (Statement of Policy). The Board believes that each Trustee satisfied at the time he or she was initially elected or appointed a Trustee, and continues to satisfy, the standards contemplated by the Statement of Policy. The Governance and Nominating Committee also engages professional search firms to help identify potential Independent Trustee candidates who have the experience, qualifications, attributes, and skills consistent with the Statement of Policy. From time to time, additional criteria based on the composition and skills of the current Independent Trustees, as well as experience or skills that may be appropriate in light of future changes to board composition, business conditions, and regulatory or other developments, have also been considered by the professional search firms and the Governance and Nominating Committee. In addition, the Board takes into account the Trustees' commitment and participation in Board and committee meetings, as well as their leadership of standing and ad hoc committees throughout their tenure.
In determining that a particular Trustee was and continues to be qualified to serve as a Trustee, the Board has considered a variety of criteria, none of which, in isolation, was controlling. The Board believes that, collectively, the Trustees have balanced and diverse experience, qualifications, attributes, and skills, which allow the Board to operate effectively in governing each fund and protecting the interests of shareholders. Information about the specific experience, skills, attributes, and qualifications of each Trustee, which in each case led to the Board's conclusion that the Trustee should serve (or continue to serve) as a trustee of the funds, is provided below.
Board Structure and Oversight Function. Abigail P. Johnson is an interested person and currently serves as Chairman. The Trustees have determined that an interested Chairman is appropriate and benefits shareholders because an interested Chairman has a personal and professional stake in the quality and continuity of services provided to the funds. Independent Trustees exercise their informed business judgment to appoint an individual of their choosing to serve as Chairman, regardless of whether the Trustee happens to be independent or a member of management. The Independent Trustees have determined that they can act independently and effectively without having an Independent Trustee serve as Chairman and that a key structural component for assuring that they are in a position to do so is for the Independent Trustees to constitute a substantial majority for the Board. The Independent Trustees also regularly meet in executive session. Michael E. Kenneally serves as Chairman of the Independent Trustees and as such (i) acts as a liaison between the Independent Trustees and management with respect to matters important to the Independent Trustees and (ii) with management prepares agendas for Board meetings.
Fidelity® funds are overseen by different Boards of Trustees. The funds' Board oversees Fidelity's investment-grade bond, money market, asset allocation and certain equity funds, and other Boards oversee Fidelity's high income and other equity funds. The asset allocation funds may invest in Fidelity® funds that are overseen by such other Boards. The use of separate Boards, each with its own committee structure, allows the Trustees of each group of Fidelity® funds to focus on the unique issues of the funds they oversee, including common research, investment, and operational issues. On occasion, the separate Boards establish joint committees to address issues of overlapping consequences for the Fidelity® funds overseen by each Board.
The Trustees operate using a system of committees to facilitate the timely and efficient consideration of all matters of importance to the Trustees, each fund, and fund shareholders and to facilitate compliance with legal and regulatory requirements and oversight of the funds' activities and associated risks. The Board, acting through its committees, has charged FMR and its affiliates with (i) identifying events or circumstances the occurrence of which could have demonstrably adverse effects on the funds' business and/or reputation; (ii) implementing processes and controls to lessen the possibility that such events or circumstances occur or to mitigate the effects of such events or circumstances if they do occur; and (iii) creating and maintaining a system designed to evaluate continuously business and market conditions in order to facilitate the identification and implementation processes described in (i) and (ii) above. Because the day-to-day operations and activities of the funds are carried out by or through FMR, its affiliates, and other service providers, the funds' exposure to risks is mitigated but not eliminated by the processes overseen by the Trustees. While each of the Board's committees has responsibility for overseeing different aspects of the funds' activities, oversight is exercised primarily through the Operations and Audit Committees. In addition, an ad hoc Board committee of Independent Trustees has worked with FMR to enhance the Board's oversight of investment and financial risks, legal and regulatory risks, technology risks, and operational risks, including the development of additional risk reporting to the Board. Appropriate personnel, including but not limited to the funds' Chief Compliance Officer (CCO), FMR's internal auditor, the independent accountants, the funds' Treasurer and portfolio management personnel, make periodic reports to the Board's committees, as appropriate, including an annual review of Fidelity's risk management program for the Fidelity® funds. The responsibilities of each standing committee, including their oversight responsibilities, are described further under "Standing Committees of the Trustees."
Interested Trustees*:
Correspondence intended for a Trustee who is an interested person may be sent to Fidelity Investments, 245 Summer Street, Boston, Massachusetts 02210.
Name, Year of Birth; Principal Occupations and Other Relevant Experience+
Abigail P. Johnson (1961)
Year of Election or Appointment: 2009
Trustee
Chairman of the Board of Trustees
Ms. Johnson also serves as Trustee of other Fidelity® funds. Ms. Johnson serves as Chairman (2016-present), Chief Executive Officer (2014-present), and Director (2007-present) of FMR LLC (diversified financial services company), President of Fidelity Financial Services (2012-present) and President of Personal, Workplace and Institutional Services (2005-present). Ms. Johnson is Chairman and Director of Fidelity Management & Research Company LLC (investment adviser firm, 2011-present). Previously, Ms. Johnson served as Chairman and Director of FMR Co., Inc. (investment adviser firm, 2011-2019), Vice Chairman (2007-2016) and President (2013-2016) of FMR LLC, President and a Director of Fidelity Management & Research Company (2001-2005), a Trustee of other investment companies advised by Fidelity Management & Research Company, Fidelity Investments Money Management, Inc. (investment adviser firm), and FMR Co., Inc. (2001-2005), Senior Vice President of the Fidelity® funds (2001-2005), and managed a number of Fidelity® funds. Ms. Abigail P. Johnson and Mr. Arthur E. Johnson are not related.
Jennifer Toolin McAuliffe (1959)
Year of Election or Appointment: 2016
Trustee
Ms. McAuliffe also serves as Trustee of other Fidelity® funds and as Trustee of Fidelity Charitable (2020-present). Previously, Ms. McAuliffe served as Co-Head of Fixed Income of Fidelity Investments Limited (now known as FIL Limited (FIL)) (diversified financial services company), Director of Research for FIL’s credit and quantitative teams in London, Hong Kong and Tokyo and Director of Research for taxable and municipal bonds at Fidelity Investments Money Management, Inc. Ms. McAuliffe previously served as a member of the Advisory Board of certain Fidelity® funds (2016). Ms. McAuliffe was previously a lawyer at Ropes & Gray LLP and currently serves as director or trustee of several not-for-profit entities.
* Determined to be an “Interested Trustee” by virtue of, among other things, his or her affiliation with the trust or various entities under common control with FMR.
+ The information includes the Trustee's principal occupation during the last five years and other information relating to the experience, attributes, and skills relevant to the Trustee's qualifications to serve as a Trustee, which led to the conclusion that the Trustee should serve as a Trustee for each fund.
Independent Trustees:
Correspondence intended for an Independent Trustee may be sent to Fidelity Investments, P.O. Box 55235, Boston, Massachusetts 02205-5235.
Name, Year of Birth; Principal Occupations and Other Relevant Experience+
Elizabeth S. Acton (1951)
Year of Election or Appointment: 2013
Trustee
Ms. Acton also serves as Trustee of other Fidelity® funds. Prior to her retirement, Ms. Acton served as Executive Vice President, Finance (2011-2012), Executive Vice President, Chief Financial Officer (2002-2011) and Treasurer (2004-2005) of Comerica Incorporated (financial services). Prior to joining Comerica, Ms. Acton held a variety of positions at Ford Motor Company (1983-2002), including Vice President and Treasurer (2000-2002) and Executive Vice President and Chief Financial Officer of Ford Motor Credit Company (1998-2000). Ms. Acton currently serves as a member of the Board and Audit and Finance Committees of Beazer Homes USA, Inc. (homebuilding, 2012-present). Ms. Acton previously served as a member of the Advisory Board of certain Fidelity® funds (2013-2016).
Ann E. Dunwoody (1953)
Year of Election or Appointment: 2018
Trustee
General Dunwoody also serves as Trustee of other Fidelity® funds. General Dunwoody (United States Army, Retired) was the first woman in U.S. military history to achieve the rank of four-star general and prior to her retirement in 2012 held a variety of positions within the U.S. Army, including Commanding General, U.S. Army Material Command (2008-2012). General Dunwoody currently serves as President of First to Four LLC (leadership and mentoring services, 2012-present), a member of the Board and Nomination and Corporate Governance Committees of Kforce Inc. (professional staffing services, 2016-present) and a member of the Board of Automattic Inc. (software engineering, 2018-present). Previously, General Dunwoody served as a member of the Advisory Board and Nominating and Corporate Governance Committee of L3 Technologies, Inc. (communication, electronic, sensor and aerospace systems, 2013-2019) and a member of the Board and Audit and Sustainability and Corporate Responsibility Committees of Republic Services, Inc. (waste collection, disposal and recycling, 2013-2016). Ms. Dunwoody also serves on several boards for non-profit organizations, including as a member of the Board, Chair of the Nomination and Governance Committee and a member of the Audit Committee of Logistics Management Institute (consulting non-profit, 2012-present), a member of the Council of Trustees for the Association of the United States Army (advocacy non-profit, 2013-present), a member of the Board of Florida Institute of Technology (2015-present) and a member of the Board of ThanksUSA (military family education non-profit, 2014-present). General Dunwoody previously served as a member of the Advisory Board of certain Fidelity® funds (2018).
John Engler (1948)
Year of Election or Appointment: 2014
Trustee
Mr. Engler also serves as Trustee of other Fidelity® funds. Previously, Mr. Engler served as Governor of Michigan (1991-2003), President of the Business Roundtable (2011-2017) and interim President of Michigan State University (2018-2019). Mr. Engler currently serves as a member of the Board of Stride, Inc. (formerly K12 Inc.) (technology-based education company, 2012-present). Previously, Mr. Engler served as a member of the Board of Universal Forest Products (manufacturer and distributor of wood and wood-alternative products, 2003-2019) and Trustee of The Munder Funds (2003-2014). Mr. Engler previously served as a member of the Advisory Board of certain Fidelity® funds (2014-2016).
Robert F. Gartland (1951)
Year of Election or Appointment: 2010
Trustee
Mr. Gartland also serves as Trustee of other Fidelity® funds. Prior to his retirement, Mr. Gartland held a variety of positions at Morgan Stanley (financial services, 1979-2007), including Managing Director (1987-2007) and Chase Manhattan Bank (1975-1978). Mr. Gartland previously served as Chairman and an investor in Gartland & Mellina Group Corp. (consulting, 2009-2019), as a member of the Board of National Securities Clearing Corporation (1993-1996) and as Chairman of TradeWeb (2003-2004).
Arthur E. Johnson (1947)
Year of Election or Appointment: 2008
Trustee
Mr. Johnson also serves as Trustee of other Fidelity® funds. Prior to his retirement, Mr. Johnson served as Senior Vice President of Corporate Strategic Development of Lockheed Martin Corporation (defense contractor, 1999-2009). Mr. Johnson currently serves as a member of the Board of Booz Allen Hamilton (management consulting, 2011-present). Mr. Johnson previously served as a member of the Board of Eaton Corporation plc (diversified power management, 2009-2019) and a member of the Board of AGL Resources, Inc. (holding company, 2002-2016). Mr. Johnson previously served as Chairman (2018-2021) and Vice Chairman (2015-2018) of the Independent Trustees of certain Fidelity® funds. Mr. Arthur E. Johnson is not related to Ms. Abigail P. Johnson.
Michael E. Kenneally (1954)
Year of Election or Appointment: 2009
Trustee
Chairman of the Independent Trustees
Mr. Kenneally also serves as Trustee of other Fidelity® funds and was Vice Chairman (2018-2021) of the Independent Trustees of certain Fidelity® funds. Prior to retirement in 2005, he was Chairman and Global Chief Executive Officer of Credit Suisse Asset Management, the worldwide fund management and institutional investment business of Credit Suisse Group. Previously, Mr. Kenneally was an Executive Vice President and the Chief Investment Officer for Bank of America. In this role, he was responsible for the investment management, strategy and products delivered to the bank’s institutional, high-net-worth and retail clients. Earlier, Mr. Kenneally directed the organization’s equity and quantitative research groups. He began his career as a research analyst and then spent more than a dozen years as a portfolio manager for endowments, pension plans and mutual funds. He earned the Chartered Financial Analyst (CFA) designation in 1991.
Marie L. Knowles (1946)
Year of Election or Appointment: 2001
Trustee
Ms. Knowles also serves as Trustee of other Fidelity® funds. Prior to her retirement, Ms. Knowles held several positions at Atlantic Richfield Company (diversified energy), including Executive Vice President and Chief Financial Officer (1996-2000), Senior Vice President (1993-1996) and President of ARCO Transportation Company (pipeline and tanker operations, 1993-1996). Ms. Knowles currently serves as a member of the Board of the Santa Catalina Island Company (real estate, 2009-present), a member of the Investment Company Institute Board of Governors and a member of the Governing Council of the Independent Directors Council (2014-present). Ms. Knowles also serves as a member of the Advisory Board for the School of Engineering of the University of Southern California. Ms. Knowles previously served as a member of the Board of McKesson Corporation (healthcare service, 2002-2021). In addition, Ms. Knowles previously served as Chairman (2015-2018) and Vice Chairman (2012-2015) of the Independent Trustees of certain Fidelity® funds.
Mark A. Murray (1954)
Year of Election or Appointment: 2016
Trustee
Mr. Murray also serves as Trustee of other Fidelity® funds. Previously, Mr. Murray served as Co-Chief Executive Officer (2013-2016), President (2006-2013) and Vice Chairman (2013-2020) of Meijer, Inc. Mr. Murray serves as a member of the Board (2009-present) and Public Policy and Responsibility Committee (2009-present) and Chair of the Nuclear Review Committee (2019-present) of DTE Energy Company (diversified energy company). Mr. Murray previously served as a member of the Board of Spectrum Health (not-for-profit health system, 2015-2019) and as a member of the Board and Audit Committee and Chairman of the Nominating and Corporate Governance Committee of Universal Forest Products, Inc. (manufacturer and distributor of wood and wood-alternative products, 2004-2016). Mr. Murray also serves as a member of the Board of many community and professional organizations. Mr. Murray previously served as a member of the Advisory Board of certain Fidelity® funds (2016).
+ The information includes the Trustee's principal occupation during the last five years and other information relating to the experience, attributes, and skills relevant to the Trustee's qualifications to serve as a Trustee, which led to the conclusion that the Trustee should serve as a Trustee for each fund.
Advisory Board Members and Officers:
Correspondence intended for an officer may be sent to Fidelity Investments, 245 Summer Street, Boston, Massachusetts 02210. Officers appear below in alphabetical order.
Name, Year of Birth; Principal Occupation
Robert W. Helm (1957)
Year of Election or Appointment: 2021
Member of the Advisory Board
Mr. Helm also serves as a Member of the Advisory Board of other Fidelity® funds. Mr. Helm was formerly Deputy Chairman (2003-2020), partner (1991-2020) and an associate (1984-1991) of Dechert LLP (formerly Dechert Price & Rhoads). Mr. Helm currently serves on boards and committees of several not-for-profit organizations.
Craig S. Brown (1977)
Year of Election or Appointment: 2019
Assistant Treasurer
Mr. Brown also serves as an officer of other funds. Mr. Brown serves as Assistant Treasurer of FIMM, LLC (2021-present) and is an employee of Fidelity Investments (2013-present).
John J. Burke III (1964)
Year of Election or Appointment: 2018
Chief Financial Officer
Mr. Burke also serves as Chief Financial Officer of other funds. Mr. Burke serves as Head of Investment Operations for Fidelity Fund and Investment Operations (2018-present) and is an employee of Fidelity Investments (1998-present). Previously Mr. Burke served as head of Asset Management Investment Operations (2012-2018).
David J. Carter (1973)
Year of Election or Appointment: 2020
Assistant Secretary
Mr. Carter also serves as Assistant Secretary of other funds. Mr. Carter serves as Senior Vice President, Deputy General Counsel (2022-present) and is an employee of Fidelity Investments (2005-present).
Jonathan Davis (1968)
Year of Election or Appointment: 2010
Assistant Treasurer
Mr. Davis also serves as an officer of other funds. Mr. Davis serves as Assistant Treasurer of FIMM, LLC (2021-present), FMR Capital, Inc. (2017-present), FD Funds GP LLC (2021-present), FD Funds Holding LLC (2021-present), and FD Funds Management LLC (2021-present); and is an employee of Fidelity Investments. Previously, Mr. Davis served as Vice President and Associate General Counsel of FMR LLC (diversified financial services company, 2003-2010).
Laura M. Del Prato (1964)
Year of Election or Appointment: 2018
President and Treasurer
Ms. Del Prato also serves as an officer of other funds. Ms. Del Prato serves as Assistant Treasurer of FIMM, LLC (2021-present) and is an employee of Fidelity Investments (2017-present). Previously, Ms. Del Prato served as President and Treasurer of The North Carolina Capital Management Trust: Cash Portfolio and Term Portfolio (2018-2020). Prior to joining Fidelity Investments, Ms. Del Prato served as a Managing Director and Treasurer of the JPMorgan Mutual Funds (2014-2017). Prior to JPMorgan, Ms. Del Prato served as a partner at Cohen Fund Audit Services (accounting firm, 2012-2013) and KPMG LLP (accounting firm, 2004-2012).
Colm A. Hogan (1973)
Year of Election or Appointment: 2016
Assistant Treasurer
Mr. Hogan also serves as an officer of other funds. Mr. Hogan serves as Assistant Treasurer of FIMM, LLC (2021-present) and FMR Capital, Inc. (2017-present) and is an employee of Fidelity Investments (2005-present). Previously, Mr. Hogan served as Deputy Treasurer of certain Fidelity® funds (2016-2020) and Assistant Treasurer of certain Fidelity® funds (2016-2018).
Cynthia Lo Bessette (1969)
Year of Election or Appointment: 2019
Secretary and Chief Legal Officer (CLO)
Ms. Lo Bessette also serves as an officer of other funds. Ms. Lo Bessette serves as CLO, Secretary, and Senior Vice President of Fidelity Management & Research Company LLC (investment adviser firm, 2019-present); CLO of Fidelity Management & Research (Hong Kong) Limited, FMR Investment Management (UK) Limited, and Fidelity Management & Research (Japan) Limited (investment adviser firms, 2019-present); Secretary of FD Funds GP LLC (2021-present), FD Funds Holding LLC (2021-present), and FD Funds Management LLC (2021-present); and Assistant Secretary of FIMM, LLC (2019-present). She is a Senior Vice President and Deputy General Counsel of FMR LLC (diversified financial services company, 2019-present), and is an employee of Fidelity Investments. Previously, Ms. Lo Bessette served as CLO, Secretary, and Senior Vice President of FMR Co., Inc. (investment adviser firm, 2019); Secretary of Fidelity SelectCo, LLC and Fidelity Investments Money Management, Inc. (investment adviser firms, 2019). Prior to joining Fidelity Investments, Ms. Lo Bessette was Executive Vice President, General Counsel (2016-2019) and Senior Vice President, Deputy General Counsel (2015-2016) of OppenheimerFunds (investment management company) and Deputy Chief Legal Officer (2013-2015) of Jennison Associates LLC (investment adviser firm).
Chris Maher (1972)
Year of Election or Appointment: 2013
Assistant Treasurer
Mr. Maher also serves as an officer of other funds. Mr. Maher serves as Assistant Treasurer of FIMM, LLC (2021-present) and FMR Capital, Inc. (2017-present), and is an employee of Fidelity Investments (2008-present). Previously, Mr. Maher served as Assistant Treasurer of certain funds (2013-2020); Vice President of Asset Management Compliance (2013), Vice President of the Program Management Group of FMR (investment adviser firm, 2010-2013), and Vice President of Valuation Oversight (2008-2010).
Kenneth B. Robins (1969)
Year of Election or Appointment: 2020
Chief Compliance Officer
Mr. Robins also serves as an officer of other funds. Mr. Robins serves as Compliance Officer of Fidelity Management & Research Company LLC (investment adviser firm, 2016-present) and is an employee of Fidelity Investments (2004-present). Previously, Mr. Robins served as Compliance Officer of FMR Co., Inc. (investment adviser firm, 2016-2019), as Executive Vice President of Fidelity Investments Money Management, Inc. (investment adviser firm, 2013-2016) and served in other fund officer roles.
Brett Segaloff (1972)
Year of Election or Appointment: 2021
Anti-Money Laundering (AML) Officer
Mr. Segaloff also serves as an AML Officer of other funds and other related entities. He is Director, Anti-Money Laundering (2007-present) of FMR LLC (diversified financial services company) and is an employee of Fidelity Investments (1996-present).
Stacie M. Smith (1974)
Year of Election or Appointment: 2013
Assistant Treasurer
Ms. Smith also serves as an officer of other funds. Ms. Smith serves as Assistant Treasurer of FIMM, LLC (2021-present) and FMR Capital, Inc. (2017-present), is an employee of Fidelity Investments (2009-present), and has served in other fund officer roles. Prior to joining Fidelity Investments, Ms. Smith served as Senior Audit Manager of Ernst & Young LLP (accounting firm, 1996-2009). Previously, Ms. Smith served as Assistant Treasurer (2013-2019) and Deputy Treasurer (2013-2016) of certain Fidelity® funds.
Jim Wegmann (1979)
Year of Election or Appointment: 2021
Deputy Treasurer
Mr. Wegmann also serves as an officer of other funds. Mr. Wegmann serves as Assistant Treasurer of FIMM, LLC (2021-present) and is an employee of Fidelity Investments (2011-present). Previously, Mr. Wegmann served as Assistant Treasurer of certain Fidelity® funds (2019-2021).
Vadim Zlotnikov (1962)
Year of Election or Appointment: 2019
Vice President
Mr. Zlotnikov also serves as Vice President of other funds. Mr. Zlotnikov serves as President and Director of Fidelity Diversifying Solutions LLC (investment adviser firm, 2021-present), President and Director of FIAM LLC (investment adviser firm, 2020-present), and is an employee of Fidelity Investments (2018-present). Previously, Mr. Zlotnikov served as President and Chief Investment Officer of Global Asset Allocation (2018-2020). Prior to joining Fidelity Investments, Mr. Zlotnikov served as Co-Head of Multi-Asset Solutions, Chief Market Strategist, and CIO of Systematic Strategies with AllianceBernstein (investment adviser firm, 2002-2018).
Shareholder Expense Example
As a shareholder, you incur two types of costs: (1) transaction costs, which may include sales charges (loads) on purchase payments or redemption proceeds, as applicable and (2) ongoing costs, which generally include management fees, distribution and/or service (12b-1) fees and other Fund expenses. This Example is intended to help you understand your ongoing costs (in dollars) of investing in a fund and to compare these costs with the ongoing costs of investing in other mutual funds.
The Example is based on an investment of $1,000 invested at the beginning of the period and held for the entire period (October 1, 2021 to March 31, 2022).
Actual Expenses
The first line of the accompanying table provides information about actual account values and actual expenses. You may use the information in this line, together with the amount you invested, to estimate the expenses that you paid over the period. Simply divide your account value by $1,000.00 (for example, an $8,600 account value divided by $1,000.00 = 8.6), then multiply the result by the number in the first line for a class/Fund under the heading entitled "Expenses Paid During Period" to estimate the expenses you paid on your account during this period. If any fund is a shareholder of any underlying mutual funds or exchange-traded funds (ETFs) (the Underlying Funds), such fund indirectly bears its proportional share of the expenses of the Underlying Funds in addition to the direct expenses incurred presented in the table. These fees and expenses are not included in the annualized expense ratio used to calculate the expense estimate in the table below.
Hypothetical Example for Comparison Purposes
The second line of the accompanying table provides information about hypothetical account values and hypothetical expenses based on the actual expense ratio and an assumed rate of return of 5% per year before expenses, which is not the actual return. The hypothetical account values and expenses may not be used to estimate the actual ending account balance or expenses you paid for the period. You may use this information to compare the ongoing costs of investing in the Fund and other funds. To do so, compare this 5% hypothetical example with the 5% hypothetical examples that appear in the shareholder reports of the other funds. If any fund is a shareholder of any Underlying Funds, such fund indirectly bears its proportional share of the expenses of the Underlying Funds in addition to the direct expenses as presented in the table. These fees and expenses are not included in the annualized expense ratio used to calculate the expense estimate in the table below.
Please note that the expenses shown in the table are meant to highlight your ongoing costs only and do not reflect any transaction costs. Therefore, the second line of the table is useful in comparing ongoing costs only, and will not help you determine the relative total costs of owning different funds. In addition, if these transactional costs were included, your costs would have been higher.
| | Annualized Expense Ratio-A | Beginning
Account Value
October 1, 2021 | Ending
Account Value
March 31, 2022 | Expenses Paid
During Period-B
October 1, 2021
to March 31, 2022 |
| Fidelity Freedom Income Fund | | | | |
| Fidelity Freedom Income Fund | .46% | | | |
| Actual | | $1,000.00 | $967.00 | $2.26 |
| Hypothetical-C | | $1,000.00 | $1,022.64 | $2.32 |
| Class K | .41% | | | |
| Actual | | $1,000.00 | $967.00 | $2.01 |
| Hypothetical-C | | $1,000.00 | $1,022.89 | $2.07 |
| Class K6 | .36% | | | |
| Actual | | $1,000.00 | $967.40 | $1.77 |
| Hypothetical-C | | $1,000.00 | $1,023.14 | $1.82 |
| Fidelity Freedom 2005 Fund | | | | |
| Fidelity Freedom 2005 Fund | .47% | | | |
| Actual | | $1,000.00 | $967.60 | $2.31 |
| Hypothetical-C | | $1,000.00 | $1,022.59 | $2.37 |
| Class K | .41% | | | |
| Actual | | $1,000.00 | $967.80 | $2.01 |
| Hypothetical-C | | $1,000.00 | $1,022.89 | $2.07 |
| Class K6 | .37% | | | |
| Actual | | $1,000.00 | $967.80 | $1.82 |
| Hypothetical-C | | $1,000.00 | $1,023.09 | $1.87 |
| Fidelity Freedom 2010 Fund | | | | |
| Fidelity Freedom 2010 Fund | .50% | | | |
| Actual | | $1,000.00 | $967.00 | $2.45 |
| Hypothetical-C | | $1,000.00 | $1,022.44 | $2.52 |
| Class K | .44% | | | |
| Actual | | $1,000.00 | $967.80 | $2.16 |
| Hypothetical-C | | $1,000.00 | $1,022.74 | $2.22 |
| Class K6 | .38% | | | |
| Actual | | $1,000.00 | $968.00 | $1.86 |
| Hypothetical-C | | $1,000.00 | $1,023.04 | $1.92 |
| Fidelity Freedom 2015 Fund | | | | |
| Fidelity Freedom 2015 Fund | .54% | | | |
| Actual | | $1,000.00 | $967.30 | $2.65 |
| Hypothetical-C | | $1,000.00 | $1,022.24 | $2.72 |
| Class K | .48% | | | |
| Actual | | $1,000.00 | $967.60 | $2.35 |
| Hypothetical-C | | $1,000.00 | $1,022.54 | $2.42 |
| Class K6 | .40% | | | |
| Actual | | $1,000.00 | $968.40 | $1.96 |
| Hypothetical-C | | $1,000.00 | $1,022.94 | $2.02 |
| Fidelity Freedom 2020 Fund | | | | |
| Fidelity Freedom 2020 Fund | .58% | | | |
| Actual | | $1,000.00 | $968.40 | $2.85 |
| Hypothetical-C | | $1,000.00 | $1,022.04 | $2.92 |
| Class K | .51% | | | |
| Actual | | $1,000.00 | $968.10 | $2.50 |
| Hypothetical-C | | $1,000.00 | $1,022.39 | $2.57 |
| Class K6 | .42% | | | |
| Actual | | $1,000.00 | $968.50 | $2.06 |
| Hypothetical-C | | $1,000.00 | $1,022.84 | $2.12 |
| Fidelity Freedom 2025 Fund | | | | |
| Fidelity Freedom 2025 Fund | .63% | | | |
| Actual | | $1,000.00 | $968.70 | $3.09 |
| Hypothetical-C | | $1,000.00 | $1,021.79 | $3.18 |
| Class K | .55% | | | |
| Actual | | $1,000.00 | $969.00 | $2.70 |
| Hypothetical-C | | $1,000.00 | $1,022.19 | $2.77 |
| Class K6 | .44% | | | |
| Actual | | $1,000.00 | $969.60 | $2.16 |
| Hypothetical-C | | $1,000.00 | $1,022.74 | $2.22 |
| Fidelity Freedom 2030 Fund | | | | |
| Fidelity Freedom 2030 Fund | .67% | | | |
| Actual | | $1,000.00 | $970.00 | $3.29 |
| Hypothetical-C | | $1,000.00 | $1,021.59 | $3.38 |
| Class K | .58% | | | |
| Actual | | $1,000.00 | $970.40 | $2.85 |
| Hypothetical-C | | $1,000.00 | $1,022.04 | $2.92 |
| Class K6 | .46% | | | |
| Actual | | $1,000.00 | $971.30 | $2.26 |
| Hypothetical-C | | $1,000.00 | $1,022.64 | $2.32 |
| Fidelity Freedom 2035 Fund | | | | |
| Fidelity Freedom 2035 Fund | .71% | | | |
| Actual | | $1,000.00 | $974.90 | $3.50 |
| Hypothetical-C | | $1,000.00 | $1,021.39 | $3.58 |
| Class K | .62% | | | |
| Actual | | $1,000.00 | $974.70 | $3.05 |
| Hypothetical-C | | $1,000.00 | $1,021.84 | $3.13 |
| Class K6 | .48% | | | |
| Actual | | $1,000.00 | $975.70 | $2.36 |
| Hypothetical-C | | $1,000.00 | $1,022.54 | $2.42 |
| Fidelity Freedom 2040 Fund | | | | |
| Fidelity Freedom 2040 Fund | .75% | | | |
| Actual | | $1,000.00 | $979.30 | $3.70 |
| Hypothetical-C | | $1,000.00 | $1,021.19 | $3.78 |
| Class K | .64% | | | |
| Actual | | $1,000.00 | $979.70 | $3.16 |
| Hypothetical-C | | $1,000.00 | $1,021.74 | $3.23 |
| Class K6 | .49% | | | |
| Actual | | $1,000.00 | $980.50 | $2.42 |
| Hypothetical-C | | $1,000.00 | $1,022.49 | $2.47 |
| Fidelity Freedom 2045 Fund | | | | |
| Fidelity Freedom 2045 Fund | .75% | | | |
| Actual | | $1,000.00 | $979.00 | $3.70 |
| Hypothetical-C | | $1,000.00 | $1,021.19 | $3.78 |
| Class K | .64% | | | |
| Actual | | $1,000.00 | $980.10 | $3.16 |
| Hypothetical-C | | $1,000.00 | $1,021.74 | $3.23 |
| Class K6 | .49% | | | |
| Actual | | $1,000.00 | $980.40 | $2.42 |
| Hypothetical-C | | $1,000.00 | $1,022.49 | $2.47 |
| Fidelity Freedom 2050 Fund | | | | |
| Fidelity Freedom 2050 Fund | .75% | | | |
| Actual | | $1,000.00 | $979.10 | $3.70 |
| Hypothetical-C | | $1,000.00 | $1,021.19 | $3.78 |
| Class K | .64% | | | |
| Actual | | $1,000.00 | $979.70 | $3.16 |
| Hypothetical-C | | $1,000.00 | $1,021.74 | $3.23 |
| Class K6 | .49% | | | |
| Actual | | $1,000.00 | $980.50 | $2.42 |
| Hypothetical-C | | $1,000.00 | $1,022.49 | $2.47 |
| Fidelity Freedom 2055 Fund | | | | |
| Fidelity Freedom 2055 Fund | .75% | | | |
| Actual | | $1,000.00 | $979.30 | $3.70 |
| Hypothetical-C | | $1,000.00 | $1,021.19 | $3.78 |
| Class K | .64% | | | |
| Actual | | $1,000.00 | $979.90 | $3.16 |
| Hypothetical-C | | $1,000.00 | $1,021.74 | $3.23 |
| Class K6 | .49% | | | |
| Actual | | $1,000.00 | $980.90 | $2.42 |
| Hypothetical-C | | $1,000.00 | $1,022.49 | $2.47 |
| Fidelity Freedom 2060 Fund | | | | |
| Fidelity Freedom 2060 Fund | .75% | | | |
| Actual | | $1,000.00 | $979.90 | $3.70 |
| Hypothetical-C | | $1,000.00 | $1,021.19 | $3.78 |
| Class K | .64% | | | |
| Actual | | $1,000.00 | $980.50 | $3.16 |
| Hypothetical-C | | $1,000.00 | $1,021.74 | $3.23 |
| Class K6 | .49% | | | |
| Actual | | $1,000.00 | $980.70 | $2.42 |
| Hypothetical-C | | $1,000.00 | $1,022.49 | $2.47 |
| Fidelity Freedom 2065 Fund | | | | |
| Fidelity Freedom 2065 Fund | .75% | | | |
| Actual | | $1,000.00 | $979.50 | $3.70 |
| Hypothetical-C | | $1,000.00 | $1,021.19 | $3.78 |
| Class K | .64% | | | |
| Actual | | $1,000.00 | $980.00 | $3.16 |
| Hypothetical-C | | $1,000.00 | $1,021.74 | $3.23 |
| Class K6 | .49% | | | |
| Actual | | $1,000.00 | $980.60 | $2.42 |
| Hypothetical-C | | $1,000.00 | $1,022.49 | $2.47 |
A Annualized expense ratio reflects expenses net of applicable fee waivers.
B Expenses are equal to the annualized expense ratio, multiplied by the average account value over the period, multiplied by 182/ 365 (to reflect the one-half year period). The fees and expenses of any Underlying Funds are not included in each annualized expense ratio.
C 5% return per year before expenses
Distributions (Unaudited)
The dividend and capital gains distributions for the fund(s) are available on Fidelity.com or Institutional.Fidelity.com.
The funds hereby designate as capital gain dividend the amounts noted below for the taxable year ended March 31, 2022, or, if subsequently determined to be different, the net capital gain of such year.
| Fidelity Freedom Income Fund | $108,630,304 |
| Fidelity Freedom 2005 Fund | $43,428,172 |
| Fidelity Freedom 2010 Fund | $284,341,423 |
| Fidelity Freedom 2015 Fund | $513,942,695 |
| Fidelity Freedom 2020 Fund | $1,867,419,686 |
| Fidelity Freedom 2025 Fund | $2,136,578,377 |
| Fidelity Freedom 2030 Fund | $2,814,487,828 |
| Fidelity Freedom 2035 Fund | $2,361,176,306 |
| Fidelity Freedom 2040 Fund | $2,617,837,981 |
| Fidelity Freedom 2045 Fund | $1,716,503,150 |
| Fidelity Freedom 2050 Fund | $1,509,847,483 |
| Fidelity Freedom 2055 Fund | $768,912,114 |
| Fidelity Freedom 2060 Fund | $292,785,941 |
| Fidelity Freedom 2065 Fund | $29,399,458 |
|
A percentage of the dividends distributed during the fiscal year for the following funds were derived from interest on U.S. Government securities which is generally exempt from state income tax
| Fidelity Freedom Income Fund | 20.42% |
| Fidelity Freedom 2005 Fund | 18.24% |
| Fidelity Freedom 2010 Fund | 13.53% |
| Fidelity Freedom 2015 Fund | 10.26% |
| Fidelity Freedom 2020 Fund | 7.86% |
| Fidelity Freedom 2025 Fund | 6.49% |
| Fidelity Freedom 2030 Fund | 5.33% |
| Fidelity Freedom 2035 Fund | 2.46% |
| Fidelity Freedom 2040 Fund | 1.80% |
| Fidelity Freedom 2045 Fund | 1.79% |
| Fidelity Freedom 2050 Fund | 1.78% |
| Fidelity Freedom 2055 Fund | 1.78% |
| Fidelity Freedom 2060 Fund | 1.76% |
| Fidelity Freedom 2065 Fund | 1.65% |
|
A percentage of the dividends distributed during the fiscal year for the following funds qualify for the dividends–received deduction for corporate shareholders:
| | Retail | Class K | Class K6 |
| Fidelity Freedom Income Fund | | | |
| April 2021 | 0% | 0% | 0% |
| May 2021 | 2% | 1% | 1% |
| June 2021 | 3% | 3% | 2% |
| July 2021 | 3% | 3% | 2% |
| August 2021 | 3% | 2% | 2% |
| September 2021 | 3% | 3% | 2% |
| October 2021 | 3% | 3% | 3% |
| November 2021 | 3% | 3% | 2% |
| December 2021 | 3% | 3% | 3% |
| February 2022 | 4% | 2% | 2% |
| March 2022 | 3% | 3% | 3% |
| Fidelity Freedom 2005 Fund | | | |
| May 2021 | 2% | 2% | 2% |
| December 2021 | 3% | 3% | 3% |
| Fidelity Freedom 2010 Fund | | | |
| May 2021 | 4% | 4% | 3% |
| December 2021 | 5% | 5% | 5% |
| Fidelity Freedom 2015 Fund | | | |
| May 2021 | 7% | 7% | 5% |
| December 2021 | 6% | 6% | 6% |
| Fidelity Freedom 2020 Fund | | | |
| May 2021 | 13% | 10% | 8% |
| December 2021 | 7% | 7% | 7% |
| Fidelity Freedom 2025 Fund | | | |
| May 2021 | 22% | 17% | 12% |
| December 2021 | 8% | 8% | 8% |
| Fidelity Freedom 2030 Fund | | | |
| May 2021 | 92% | 46% | 20% |
| December 2021 | 9% | 9% | 8% |
| Fidelity Freedom 2035 Fund | | | |
| May 2021 | – | – | – |
| December 2021 | 10% | 10% | 10% |
| Fidelity Freedom 2040 Fund | | | |
| May 2021 | – | – | – |
| December 2021 | 12% | 12% | 11% |
| Fidelity Freedom 2045 Fund | | | |
| May 2021 | – | – | – |
| December 2021 | 12% | 12% | 11% |
| Fidelity Freedom 2050 Fund | | | |
| May 2021 | – | – | – |
| December 2021 | 12% | 12% | 11% |
| Fidelity Freedom 2055 Fund | | | |
| May 2021 | – | – | – |
| December 2021 | 12% | 12% | 11% |
| Fidelity Freedom 2060 Fund | | | |
| May 2021 | – | – | – |
| December 2021 | 12% | 12% | 12% |
| Fidelity Freedom 2065 Fund | | | |
| May 2021 | – | – | – |
| December 2021 | 13% | 12% | 12% |
|
A percentage of the dividends distributed during the fiscal year for the following funds may be taken into account as a dividend for purposes of the maximum rate under section 1(h)(11) of the Internal Revenue Code.
| | Retail | Class K | Class K6 |
| Fidelity Freedom Income Fund | | | |
| April 2021 | 0% | 0% | 0% |
| May 2021 | 7% | 6% | 5% |
| June 2021 | 11% | 11% | 9% |
| July 2021 | 11% | 11% | 9% |
| August 2021 | 12% | 10% | 9% |
| September 2021 | 11% | 11% | 9% |
| October 2021 | 11% | 11% | 11% |
| November 2021 | 11% | 11% | 9% |
| December 2021 | 11% | 11% | 11% |
| February 2022 | 0% | 0% | 0% |
| March 2022 | 0% | 0% | 0% |
| Fidelity Freedom 2005 Fund | | | |
| May 2021 | 3% | 3% | 2% |
| December 2021 | 12% | 12% | 12% |
| Fidelity Freedom 2010 Fund | | | |
| May 2021 | 5% | 5% | 4% |
| December 2021 | 15% | 15% | 14% |
| Fidelity Freedom 2015 Fund | | | |
| May 2021 | 8% | 8% | 6% |
| December 2021 | 18% | 17% | 17% |
| Fidelity Freedom 2020 Fund | | | |
| May 2021 | 14% | 12% | 9% |
| December 2021 | 20% | 20% | 19% |
| Fidelity Freedom 2025 Fund | | | |
| May 2021 | 24% | 18% | 13% |
| December 2021 | 21% | 21% | 20% |
| Fidelity Freedom 2030 Fund | | | |
| May 2021 | 94% | 47% | 21% |
| December 2021 | 23% | 22% | 22% |
| Fidelity Freedom 2035 Fund | | | |
| May 2021 | – | – | – |
| December 2021 | 26% | 26% | 25% |
| Fidelity Freedom 2040 Fund | | | |
| May 2021 | – | – | – |
| December 2021 | 29% | 28% | 27% |
| Fidelity Freedom 2045 Fund | | | |
| May 2021 | – | – | – |
| December 2021 | 29% | 28% | 27% |
| Fidelity Freedom 2050 Fund | | | |
| May 2021 | – | – | – |
| December 2021 | 29% | 29% | 27% |
| Fidelity Freedom 2055 Fund | | | |
| May 2021 | – | – | – |
| December 2021 | 29% | 29% | 28% |
| Fidelity Freedom 2060 Fund | | | |
| May 2021 | – | – | – |
| December 2021 | 30% | 30% | 29% |
| Fidelity Freedom 2065 Fund | | | |
| May 2021 | – | – | – |
| December 2021 | 31% | 31% | 30% |
|
A percentage of the dividends distributed during the fiscal year for the following funds qualify as a section 199A dividend:
| | Retail | Class K | Class K6 |
| Fidelity Freedom Income Fund | | | |
| April 2021 | 0% | 0% | 0% |
| May 2021 | 1% | 1% | 1% |
| June 2021 | 1% | 1% | 1% |
| July 2021 | 1% | 1% | 1% |
| August 2021 | 1% | 1% | 1% |
| September 2021 | 1% | 1% | 1% |
| October 2021 | 1% | 1% | 1% |
| November 2021 | 1% | 1% | 1% |
| December 2021 | 1% | 1% | 1% |
| February 2022 | 3% | 2% | 2% |
| March 2022 | 2% | 2% | 2% |
| Fidelity Freedom 2005 Fund | | | |
| May 2021 | 1% | 1% | 1% |
| December 2021 | 1% | 1% | 1% |
| Fidelity Freedom 2010 Fund | | | |
| May 2021 | 1% | 1% | 1% |
| December 2021 | 1% | 1% | 1% |
| Fidelity Freedom 2015 Fund | | | |
| May 2021 | 1% | 1% | 1% |
| December 2021 | 1% | 1% | 1% |
| Fidelity Freedom 2020 Fund | | | |
| May 2021 | 1% | 1% | 1% |
| December 2021 | 1% | 1% | 1% |
| Fidelity Freedom 2025 Fund | | | |
| May 2021 | 1% | 1% | 1% |
| December 2021 | 1% | 1% | 1% |
| Fidelity Freedom 2030 Fund | | | |
| May 2021 | 1% | 1% | 1% |
| December 2021 | 1% | 1% | 1% |
| Fidelity Freedom 2035 Fund | | | |
| May 2021 | – | – | – |
| December 2021 | 1% | 1% | 1% |
| Fidelity Freedom 2040 Fund | | | |
| May 2021 | – | – | – |
| December 2021 | 1% | 1% | 1% |
| Fidelity Freedom 2045 Fund | | | |
| May 2021 | – | – | – |
| December 2021 | 1% | 1% | 1% |
| Fidelity Freedom 2050 Fund | | | |
| May 2021 | – | – | – |
| December 2021 | 1% | 1% | 1% |
| Fidelity Freedom 2055 Fund | | | |
| May 2021 | – | – | – |
| December 2021 | 1% | 1% | 1% |
| Fidelity Freedom 2060 Fund | | | |
| May 2021 | – | – | – |
| December 2021 | 1% | 1% | 1% |
| Fidelity Freedom 2065 Fund | | | |
| May 2021 | – | – | – |
| December 2021 | 1% | 1% | 1% |
|
The funds will notify shareholders in January 2023 of amounts for use in preparing 2022 income tax returns.
Liquidity Risk Management Program
The Securities and Exchange Commission adopted Rule 22e-4 under the Investment Company Act of 1940 (the Liquidity Rule) to promote effective liquidity risk management throughout the open-end investment company industry, thereby reducing the risk that funds will be unable to meet their redemption obligations and mitigating dilution of the interests of fund shareholders.
The Funds have adopted and implemented a liquidity risk management program pursuant to the Liquidity Rule (the Program) effective December 1, 2018. The Program is reasonably designed to assess and manage each Fund’s liquidity risk and to comply with the requirements of the Liquidity Rule. Each Fund’s Board of Trustees (the Board) has designated each Fund’s investment adviser as administrator of the Program. The Fidelity advisers have established a Liquidity Risk Management Committee (the LRM Committee) to manage the Program for each of the Fidelity Funds. The LRM Committee monitors the adequacy and effectiveness of implementation of the Program and on a periodic basis assesses each Fund’s liquidity risk based on a variety of factors including (1) the Fund’s investment strategy, (2) portfolio liquidity and cash flow projections during normal and reasonably foreseeable stressed conditions, (3) shareholder redemptions, (4) borrowings and other funding sources and (5) in the case of exchange-traded funds, certain additional factors including the effect of the Fund’s prices and spreads, market participants, and basket compositions on the overall liquidity of the Fund’s portfolio, as applicable.
In accordance with the Program, each of the Fund’s portfolio investments is classified into one of four liquidity categories described below based on a determination of a reasonable expectation for how long it would take to convert the investment to cash (or sell or dispose of the investment) without significantly changing its market value.
- Highly liquid investments – cash or convertible to cash within three business days or less
- Moderately liquid investments – convertible to cash in three to seven calendar days
- Less liquid investments – can be sold or disposed of, but not settled, within seven calendar days
- Illiquid investments – cannot be sold or disposed of within seven calendar days
Liquidity classification determinations take into account a variety of factors including various market, trading and investment-specific considerations, as well as market depth, and generally utilize analysis from a third-party liquidity metrics service.
The Liquidity Rule places a 15% limit on a fund’s illiquid investments and requires funds that do not primarily hold assets that are highly liquid investments to determine and maintain a minimum percentage of the fund’s net assets to be invested in highly liquid investments (highly liquid investment minimum or HLIM). The Program includes provisions reasonably designed to comply with the 15% limit on illiquid investments and for determining, periodically reviewing and complying with the HLIM requirement as applicable.
At a recent meeting of the Fund’s Board of Trustees, the LRM Committee provided a written report to the Board pertaining to the operation, adequacy, and effectiveness of implementation of the Program for the annual period from December 1, 2020 through November 30, 2021. The report concluded that the Program has been implemented and is operating effectively and is reasonably designed to assess and manage the Fund’s liquidity risk.
FF-ANN-0522
1.702316.124
Fidelity Freedom® Blend Funds - Income, 2005, 2010, 2015, 2020, 2025, 2030, 2035, 2040, 2045, 2050, 2055, 2060, 2065
Annual Report
March 31, 2022
Includes Fidelity and Fidelity Advisor share classes
Contents
To view a fund's proxy voting guidelines and proxy voting record for the 12-month period ended June 30, visit http://www.fidelity.com/proxyvotingresults or visit the Securities and Exchange Commission's (SEC) web site at http://www.sec.gov.
You may also call 1-800-544-8544 if you’re an individual investing directly with Fidelity, call 1-800-835-5092 if you’re a plan sponsor or participant with Fidelity as your recordkeeper or call 1-877-208-0098 on institutional accounts or if you’re an advisor or invest through one to request a free copy of the proxy voting guidelines.
Standard & Poor's, S&P and S&P 500 are registered service marks of The McGraw-Hill Companies, Inc. and have been licensed for use by Fidelity Distributors Corporation.
Other third-party marks appearing herein are the property of their respective owners.
All other marks appearing herein are registered or unregistered trademarks or service marks of FMR LLC or an affiliated company. © 2022 FMR LLC. All rights reserved.
This report and the financial statements contained herein are submitted for the general information of the shareholders of the Funds. This report is not authorized for distribution to prospective investors in the Funds unless preceded or accompanied by an effective prospectus.
A fund files its complete schedule of portfolio holdings with the SEC for the first and third quarters of each fiscal year on Form N-PORT. Forms N-PORT are available on the SEC’s web site at http://www.sec.gov. A fund's Forms N-PORT may be reviewed and copied at the SEC’s Public Reference Room in Washington, DC. Information regarding the operation of the SEC's Public Reference Room may be obtained by calling 1-800-SEC-0330.
For a complete list of a fund's portfolio holdings, view the most recent holdings listing, semiannual report, or annual report on Fidelity's web site at http://www.fidelity.com, http://www.institutional.fidelity.com, or http://www.401k.com, as applicable.
NOT FDIC INSURED •MAY LOSE VALUE •NO BANK GUARANTEE
Neither the Funds nor Fidelity Distributors Corporation is a bank.
Note to Shareholders:
Early in 2020, the outbreak and spread of COVID-19 emerged as a public health emergency that had a major influence on financial markets, primarily based on its impact on the global economy and corporate earnings. On March 11, 2020, the World Health Organization declared the COVID-19 outbreak a pandemic, citing sustained risk of further global spread. The pandemic prompted a number of measures to limit the spread of COVID-19, including travel and border restrictions, quarantines, and restrictions on large gatherings. In turn, these resulted in lower consumer activity, diminished demand for a wide range of products and services, disruption in manufacturing and supply chains, and – given the wide variability in outcomes regarding the outbreak – significant market uncertainty and volatility. To help stem the turmoil, the U.S. government took unprecedented action – in concert with the U.S. Federal Reserve and central banks around the world – to help support consumers, businesses, and the broader economy, and to limit disruption to the financial system.
In general, the overall impact of the pandemic lessened in 2021, amid a resilient economy and widespread distribution of three COVID-19 vaccines granted emergency use authorization from the U.S. Food and Drug Administration (FDA) early in the year. Still, the situation remains dynamic, and the extent and duration of its influence on financial markets and the economy is highly uncertain, due in part to a recent spike in cases based on highly contagious variants of the coronavirus.
Extreme events such as the COVID-19 crisis are exogenous shocks that can have significant adverse effects on mutual funds and their investments. Although multiple asset classes may be affected by market disruption, the duration and impact may not be the same for all types of assets. Fidelity is committed to helping you stay informed amid news about COVID-19 and during increased market volatility, and we continue to take extra steps to be responsive to customer needs. We encourage you to visit us online, where we offer ongoing updates, commentary, and analysis on the markets and our funds.
Fidelity Freedom® Blend Income Fund
Performance: The Bottom Line
Average annual total return reflects the change in the value of an investment, assuming reinvestment of distributions from dividend income and capital gains (the profits earned upon the sale of securities that have grown in value, if any) and assuming a constant rate of performance each year. The hypothetical investment and the average annual total returns do not reflect the deduction of taxes that a shareholder would pay on fund distributions or the redemption of fund shares. During periods of reimbursement by Fidelity, a fund’s total return will be greater than it would be had the reimbursement not occurred. How a fund did yesterday is no guarantee of how it will do tomorrow.
Average Annual Total Returns
| Periods ended March 31, 2022 | Past 1 year | Life of fundA |
| Class A (incl. 5.75% sales charge) | (6.98)% | 2.12% |
| Class M (incl. 3.50% sales charge) | (4.96)% | 2.55% |
| Class C (incl. contingent deferred sales charge) | (2.98)% | 3.05% |
| Fidelity Freedom® Blend Income Fund | (1.01)% | 4.10% |
| Class K | (0.99)% | 4.20% |
| Class K6 | (0.81)% | 4.31% |
| Class I | (1.06)% | 4.10% |
| Premier Class | (0.85)% | 4.30% |
| Class Z | (0.97)% | 4.20% |
| Class Z6 | (0.85)% | 4.31% |
A From August 31, 2018
Class C shares' contingent deferred sales charges included in the past one year and life of fund total return figures are 1% and 0%, respectively.
The initial offering of Premier Class took place on April 6, 2021. Returns prior to April 6, 2021 are those of Class K6.
$10,000 Over Life of Fund
Let's say hypothetically that $10,000 was invested in Fidelity Freedom® Blend Income Fund, a class of the fund, on August 31, 2018, when the fund started.
The chart shows how the value of your investment would have changed, and also shows how the Bloomberg U.S. Aggregate Bond Index performed over the same period.
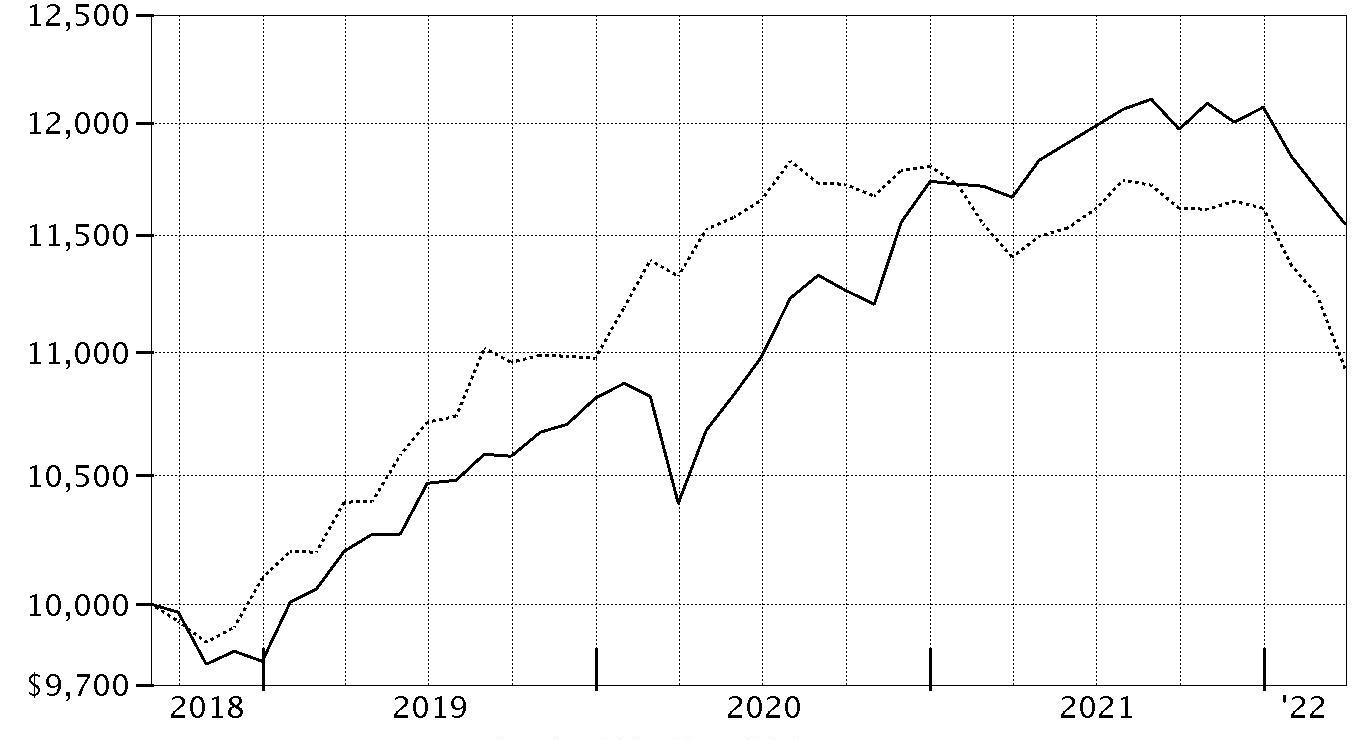
| Period Ending Values |
| $11,550 | Fidelity Freedom® Blend Income Fund |
| $10,931 | Bloomberg U.S. Aggregate Bond Index |
Effective August 24, 2021, all Bloomberg Barclays Indices were re-branded as Bloomberg Indices.
Fidelity Freedom® Blend 2005 Fund
Performance: The Bottom Line
Average annual total return reflects the change in the value of an investment, assuming reinvestment of distributions from dividend income and capital gains (the profits earned upon the sale of securities that have grown in value, if any) and assuming a constant rate of performance each year. The hypothetical investment and the average annual total returns do not reflect the deduction of taxes that a shareholder would pay on fund distributions or the redemption of fund shares. During periods of reimbursement by Fidelity, a fund’s total return will be greater than it would be had the reimbursement not occurred. How a fund did yesterday is no guarantee of how it will do tomorrow.
Average Annual Total Returns
| Periods ended March 31, 2022 | Past 1 year | Life of fundA |
| Class A (incl. 5.75% sales charge) | (6.76)% | 2.58% |
| Class M (incl. 3.50% sales charge) | (4.77)% | 3.00% |
| Class C (incl. contingent deferred sales charge) | (2.80)% | 3.51% |
| Fidelity Freedom® Blend 2005 Fund | (0.85)% | 4.55% |
| Class K | (0.75)% | 4.66% |
| Class K6 | (0.62)% | 4.77% |
| Class I | (0.83)% | 4.57% |
| Premier Class | (0.63)% | 4.77% |
| Class Z | (0.73)% | 4.67% |
| Class Z6 | (0.65)% | 4.76% |
A From August 31, 2018
Class C shares' contingent deferred sales charges included in the past one year and life of fund total return figures are 1% and 0%, respectively.
The initial offering of Premier Class took place on April 6, 2021. Returns prior to April 6, 2021 are those of Class K6.
$10,000 Over Life of Fund
Let's say hypothetically that $10,000 was invested in Fidelity Freedom® Blend 2005 Fund, a class of the fund, on August 31, 2018, when the fund started.
The chart shows how the value of your investment would have changed, and also shows how the Bloomberg U.S. Aggregate Bond Index performed over the same period.
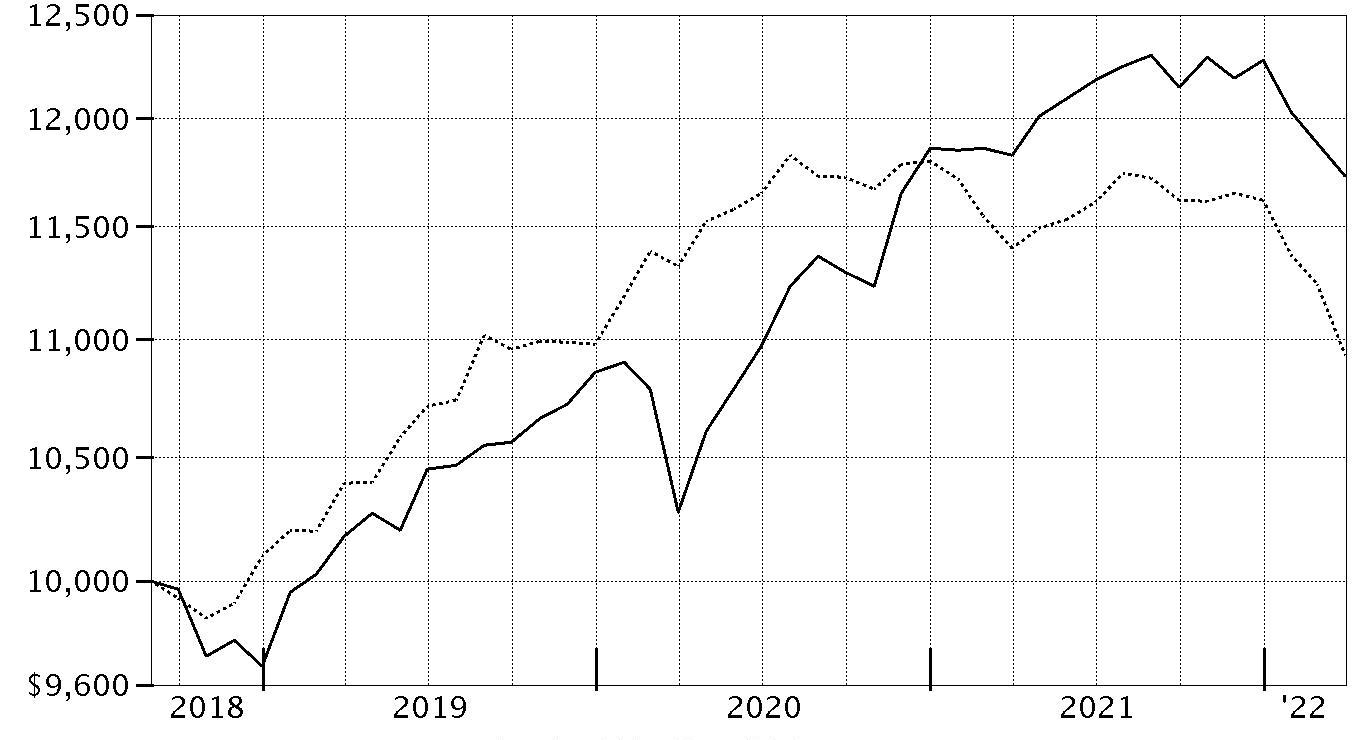
| Period Ending Values |
| $11,729 | Fidelity Freedom® Blend 2005 Fund |
| $10,931 | Bloomberg U.S. Aggregate Bond Index |
Effective August 24, 2021, all Bloomberg Barclays Indices were re-branded as Bloomberg Indices.
Fidelity Freedom® Blend 2010 Fund
Performance: The Bottom Line
Average annual total return reflects the change in the value of an investment, assuming reinvestment of distributions from dividend income and capital gains (the profits earned upon the sale of securities that have grown in value, if any) and assuming a constant rate of performance each year. The hypothetical investment and the average annual total returns do not reflect the deduction of taxes that a shareholder would pay on fund distributions or the redemption of fund shares. During periods of reimbursement by Fidelity, a fund’s total return will be greater than it would be had the reimbursement not occurred. How a fund did yesterday is no guarantee of how it will do tomorrow.
Average Annual Total Returns
| Periods ended March 31, 2022 | Past 1 year | Life of fundA |
| Class A (incl. 5.75% sales charge) | (6.42)% | 3.40% |
| Class M (incl. 3.50% sales charge) | (4.40)% | 3.83% |
| Class C (incl. contingent deferred sales charge) | (2.33)% | 4.35% |
| Fidelity Freedom® Blend 2010 Fund | (0.42)% | 5.40% |
| Class K | (0.28)% | 5.51% |
| Class K6 | (0.27)% | 5.60% |
| Class I | (0.45)% | 5.39% |
| Premier Class | (0.26)% | 5.60% |
| Class Z | (0.38)% | 5.49% |
| Class Z6 | (0.22)% | 5.60% |
A From August 31, 2018
Class C shares' contingent deferred sales charges included in the past one year and life of fund total return figures are 1% and 0%, respectively.
The initial offering of Premier Class took place on April 6, 2021. Returns prior to April 6, 2021 are those of Class K6.
$10,000 Over Life of Fund
Let's say hypothetically that $10,000 was invested in Fidelity Freedom® Blend 2010 Fund, a class of the fund, on August 31, 2018, when the fund started.
The chart shows how the value of your investment would have changed, and also shows how the Bloomberg U.S. Aggregate Bond Index performed over the same period.
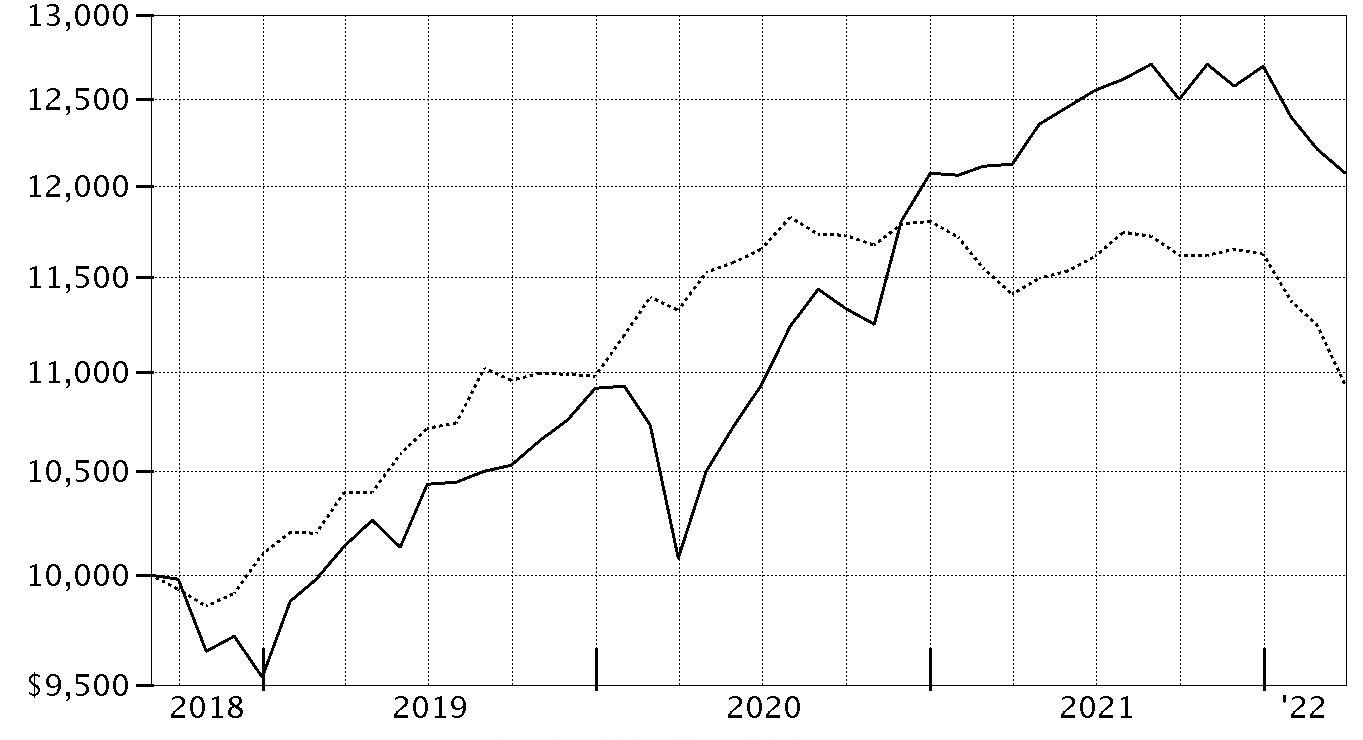
| Period Ending Values |
| $12,073 | Fidelity Freedom® Blend 2010 Fund |
| $10,931 | Bloomberg U.S. Aggregate Bond Index |
Effective August 24, 2021, all Bloomberg Barclays Indices were re-branded as Bloomberg Indices.
Fidelity Freedom® Blend 2015 Fund
Performance: The Bottom Line
Average annual total return reflects the change in the value of an investment, assuming reinvestment of distributions from dividend income and capital gains (the profits earned upon the sale of securities that have grown in value, if any) and assuming a constant rate of performance each year. The hypothetical investment and the average annual total returns do not reflect the deduction of taxes that a shareholder would pay on fund distributions or the redemption of fund shares. During periods of reimbursement by Fidelity, a fund’s total return will be greater than it would be had the reimbursement not occurred. How a fund did yesterday is no guarantee of how it will do tomorrow.
Average Annual Total Returns
| Periods ended March 31, 2022 | Past 1 year | Life of fundA |
| Class A (incl. 5.75% sales charge) | (5.96)% | 4.22% |
| Class M (incl. 3.50% sales charge) | (3.89)% | 4.67% |
| Class C (incl. contingent deferred sales charge) | (1.87)% | 5.19% |
| Fidelity Freedom® Blend 2015 Fund | 0.03% | 6.23% |
| Class K | 0.16% | 6.35% |
| Class K6 | 0.28% | 6.45% |
| Class I | (0.03)% | 6.23% |
| Premier Class | 0.33% | 6.47% |
| Class Z | 0.13% | 6.35% |
| Class Z6 | 0.27% | 6.45% |
A From August 31, 2018
Class C shares' contingent deferred sales charges included in the past one year and life of fund total return figures are 1% and 0%, respectively.
The initial offering of Premier Class took place on April 6, 2021. Returns prior to April 6, 2021 are those of Class K6.
$10,000 Over Life of Fund
Let's say hypothetically that $10,000 was invested in Fidelity Freedom® Blend 2015 Fund, a class of the fund, on August 31, 2018, when the fund started.
The chart shows how the value of your investment would have changed, and also shows how the Bloomberg U.S. Aggregate Bond Index performed over the same period.
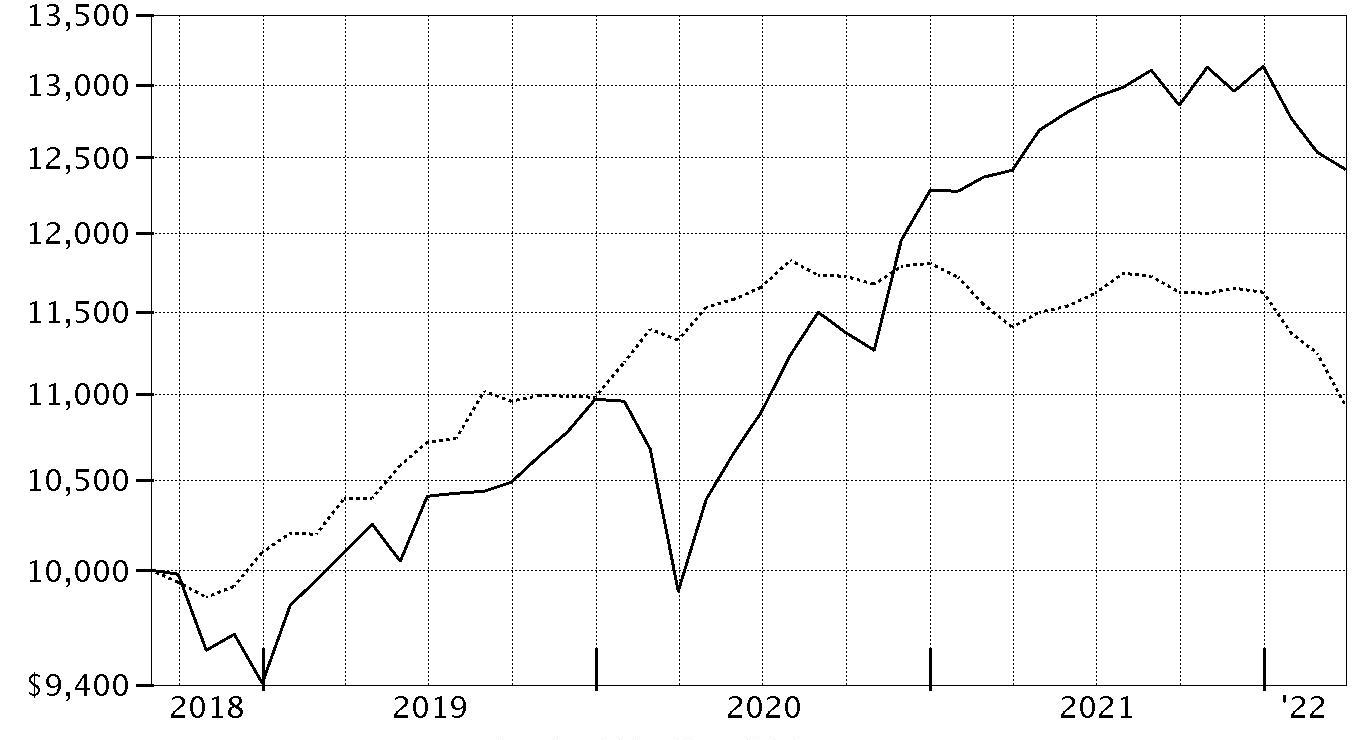
| Period Ending Values |
| $12,417 | Fidelity Freedom® Blend 2015 Fund |
| $10,931 | Bloomberg U.S. Aggregate Bond Index |
Effective August 24, 2021, all Bloomberg Barclays Indices were re-branded as Bloomberg Indices.
Fidelity Freedom® Blend 2020 Fund
Performance: The Bottom Line
Average annual total return reflects the change in the value of an investment, assuming reinvestment of distributions from dividend income and capital gains (the profits earned upon the sale of securities that have grown in value, if any) and assuming a constant rate of performance each year. The hypothetical investment and the average annual total returns do not reflect the deduction of taxes that a shareholder would pay on fund distributions or the redemption of fund shares. During periods of reimbursement by Fidelity, a fund’s total return will be greater than it would be had the reimbursement not occurred. How a fund did yesterday is no guarantee of how it will do tomorrow.
Average Annual Total Returns
| Periods ended March 31, 2022 | Past 1 year | Life of fundA |
| Class A (incl. 5.75% sales charge) | (5.57)% | 5.01% |
| Class M (incl. 3.50% sales charge) | (3.57)% | 5.46% |
| Class C (incl. contingent deferred sales charge) | (1.49)% | 5.96% |
| Fidelity Freedom® Blend 2020 Fund | 0.45% | 7.03% |
| Class K | 0.57% | 7.16% |
| Class K6 | 0.68% | 7.26% |
| Class I | 0.51% | 7.05% |
| Premier Class | 0.75% | 7.28% |
| Class Z | 0.55% | 7.14% |
| Class Z6 | 0.63% | 7.24% |
A From August 31, 2018
Class C shares' contingent deferred sales charges included in the past one year and life of fund total return figures are 1% and 0%, respectively.
The initial offering of Premier Class took place on April 6, 2021. Returns prior to April 6, 2021 are those of Class K6.
$10,000 Over Life of Fund
Let's say hypothetically that $10,000 was invested in Fidelity Freedom® Blend 2020 Fund, a class of the fund, on August 31, 2018, when the fund started.
The chart shows how the value of your investment would have changed, and also shows how the Bloomberg U.S. Aggregate Bond Index and S&P 500 Index performed over the same period.
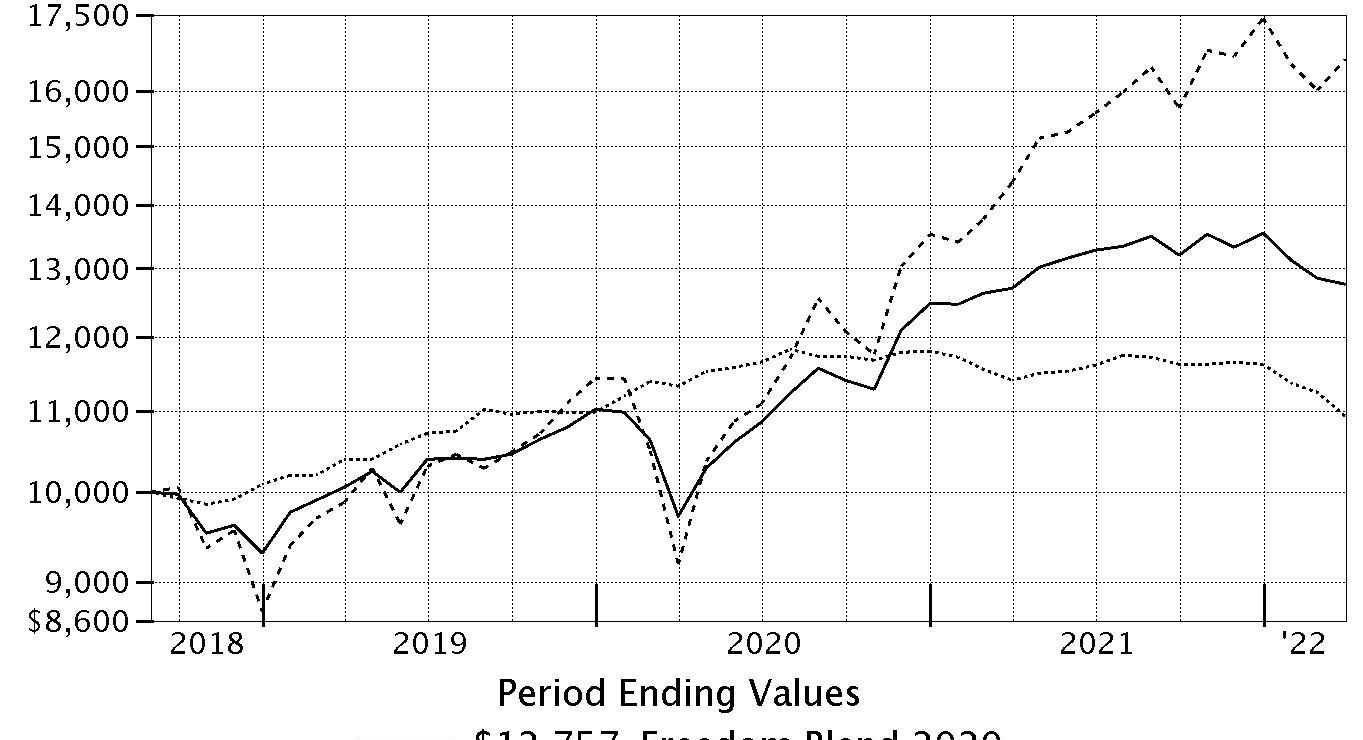
| Period Ending Values |
| $12,757 | Fidelity Freedom® Blend 2020 Fund |
| $10,931 | Bloomberg U.S. Aggregate Bond Index |
| $16,625 | S&P 500 Index |
Effective August 24, 2021, all Bloomberg Barclays Indices were re-branded as Bloomberg Indices.
Effective October 1, 2021, the fund’s benchmark changed from the S&P 500 Index to the Bloomberg U.S. Aggregate Bond Index.
Fidelity Freedom® Blend 2025 Fund
Performance: The Bottom Line
Average annual total return reflects the change in the value of an investment, assuming reinvestment of distributions from dividend income and capital gains (the profits earned upon the sale of securities that have grown in value, if any) and assuming a constant rate of performance each year. The hypothetical investment and the average annual total returns do not reflect the deduction of taxes that a shareholder would pay on fund distributions or the redemption of fund shares. During periods of reimbursement by Fidelity, a fund’s total return will be greater than it would be had the reimbursement not occurred. How a fund did yesterday is no guarantee of how it will do tomorrow.
Average Annual Total Returns
| Periods ended March 31, 2022 | Past 1 year | Life of fundA |
| Class A (incl. 5.75% sales charge) | (5.20)% | 5.64% |
| Class M (incl. 3.50% sales charge) | (3.19)% | 6.06% |
| Class C (incl. contingent deferred sales charge) | (1.10)% | 6.60% |
| Fidelity Freedom® Blend 2025 Fund | 0.79% | 7.67% |
| Class K | 0.90% | 7.77% |
| Class K6 | 1.05% | 7.88% |
| Class I | 0.80% | 7.66% |
| Premier Class | 1.09% | 7.89% |
| Class Z | 1.01% | 7.79% |
| Class Z6 | 1.03% | 7.88% |
A From August 31, 2018
Class C shares' contingent deferred sales charges included in the past one year and life of fund total return figures are 1% and 0%, respectively.
The initial offering of Premier Class took place on April 6, 2021. Returns prior to April 6, 2021 are those of Class K6.
$10,000 Over Life of Fund
Let's say hypothetically that $10,000 was invested in Fidelity Freedom® Blend 2025 Fund, a class of the fund, on August 31, 2018, when the fund started.
The chart shows how the value of your investment would have changed, and also shows how the S&P 500® Index performed over the same period.
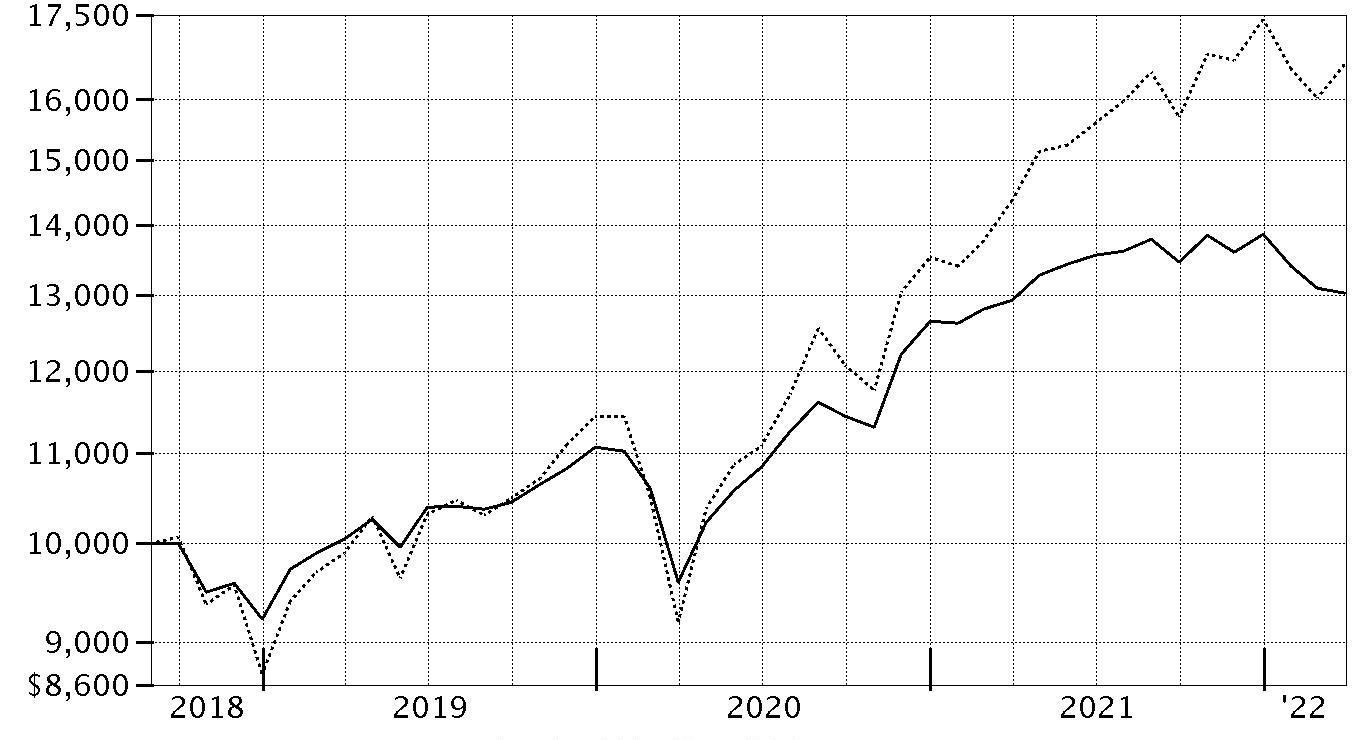
| Period Ending Values |
| $13,030 | Fidelity Freedom® Blend 2025 Fund |
| $16,625 | S&P 500® Index |
Fidelity Freedom® Blend 2030 Fund
Performance: The Bottom Line
Average annual total return reflects the change in the value of an investment, assuming reinvestment of distributions from dividend income and capital gains (the profits earned upon the sale of securities that have grown in value, if any) and assuming a constant rate of performance each year. The hypothetical investment and the average annual total returns do not reflect the deduction of taxes that a shareholder would pay on fund distributions or the redemption of fund shares. During periods of reimbursement by Fidelity, a fund’s total return will be greater than it would be had the reimbursement not occurred. How a fund did yesterday is no guarantee of how it will do tomorrow.
Average Annual Total Returns
| Periods ended March 31, 2022 | Past 1 year | Life of fundA |
| Class A (incl. 5.75% sales charge) | (4.76)% | 6.29% |
| Class M (incl. 3.50% sales charge) | (2.74)% | 6.72% |
| Class C (incl. contingent deferred sales charge) | (0.59)% | 7.26% |
| Fidelity Freedom® Blend 2030 Fund | 1.37% | 8.35% |
| Class K | 1.43% | 8.46% |
| Class K6 | 1.56% | 8.56% |
| Class I | 1.35% | 8.35% |
| Premier Class | 1.63% | 8.58% |
| Class Z | 1.44% | 8.45% |
| Class Z6 | 1.48% | 8.55% |
A From August 31, 2018
Class C shares' contingent deferred sales charges included in the past one year and life of fund total return figures are 1% and 0%, respectively.
The initial offering of Premier Class took place on April 6, 2021. Returns prior to April 6, 2021 are those of Class K6.
$10,000 Over Life of Fund
Let's say hypothetically that $10,000 was invested in Fidelity Freedom® Blend 2030 Fund, a class of the fund, on August 31, 2018, when the fund started.
The chart shows how the value of your investment would have changed, and also shows how the S&P 500® Index performed over the same period.
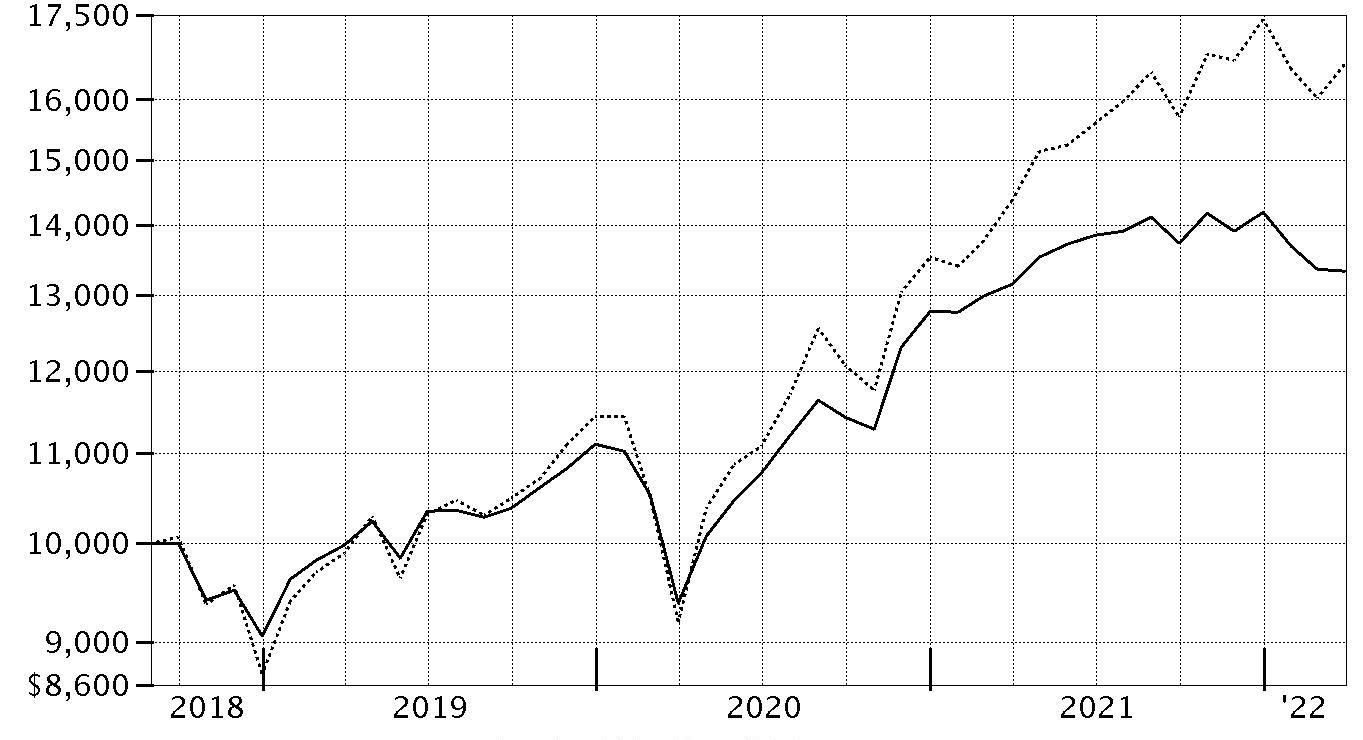
| Period Ending Values |
| $13,329 | Fidelity Freedom® Blend 2030 Fund |
| $16,625 | S&P 500® Index |
Fidelity Freedom® Blend 2035 Fund
Performance: The Bottom Line
Average annual total return reflects the change in the value of an investment, assuming reinvestment of distributions from dividend income and capital gains (the profits earned upon the sale of securities that have grown in value, if any) and assuming a constant rate of performance each year. The hypothetical investment and the average annual total returns do not reflect the deduction of taxes that a shareholder would pay on fund distributions or the redemption of fund shares. During periods of reimbursement by Fidelity, a fund’s total return will be greater than it would be had the reimbursement not occurred. How a fund did yesterday is no guarantee of how it will do tomorrow.
Average Annual Total Returns
| Periods ended March 31, 2022 | Past 1 year | Life of fundA |
| Class A (incl. 5.75% sales charge) | (3.68)% | 7.51% |
| Class M (incl. 3.50% sales charge) | (1.57)% | 7.96% |
| Class C (incl. contingent deferred sales charge) | 0.41% | 8.47% |
| Fidelity Freedom® Blend 2035 Fund | 2.48% | 9.57% |
| Class K | 2.55% | 9.68% |
| Class K6 | 2.62% | 9.79% |
| Class I | 2.47% | 9.57% |
| Premier Class | 2.64% | 9.80% |
| Class Z | 2.58% | 9.68% |
| Class Z6 | 2.69% | 9.79% |
A From August 31, 2018
Class C shares' contingent deferred sales charges included in the past one year and life of fund total return figures are 1% and 0%, respectively.
The initial offering of Premier Class took place on April 6, 2021. Returns prior to April 6, 2021 are those of Class K6.
$10,000 Over Life of Fund
Let's say hypothetically that $10,000 was invested in Fidelity Freedom® Blend 2035 Fund, a class of the fund, on August 31, 2018, when the fund started.
The chart shows how the value of your investment would have changed, and also shows how the S&P 500® Index performed over the same period.
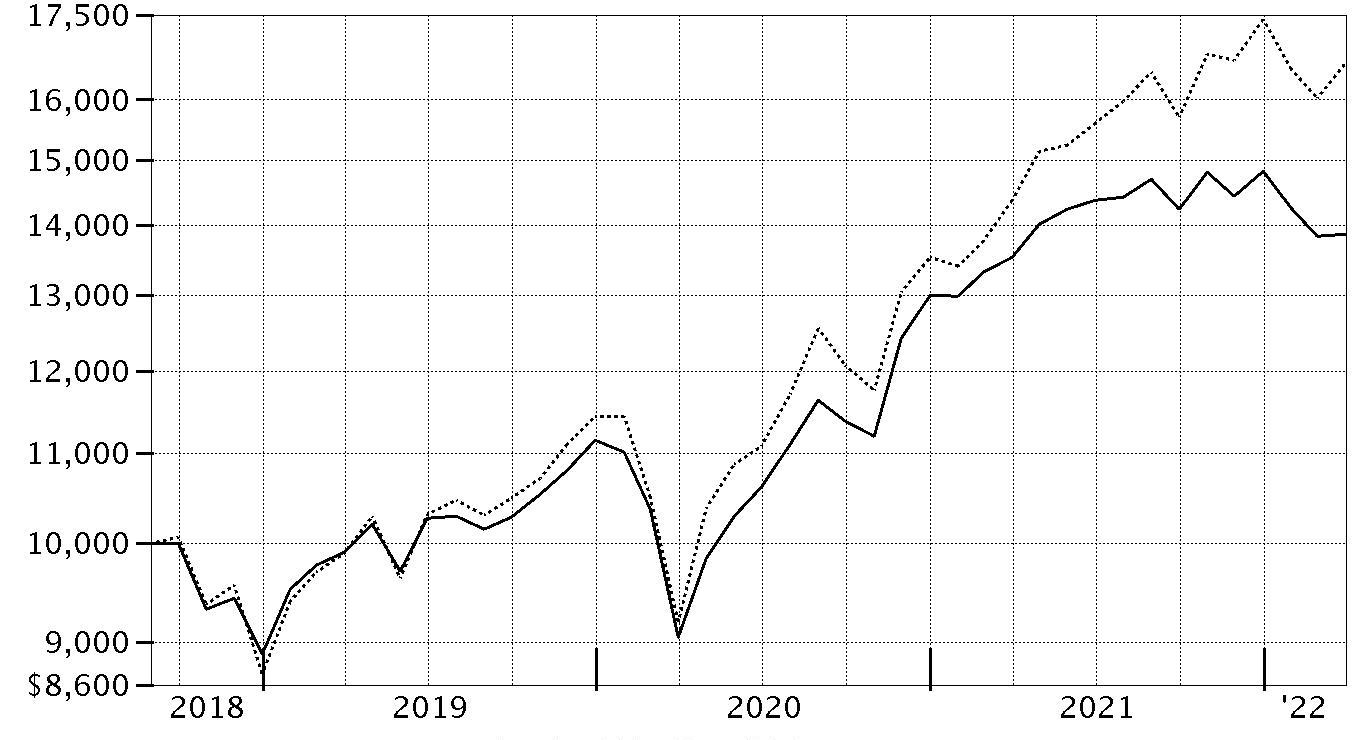
| Period Ending Values |
| $13,877 | Fidelity Freedom® Blend 2035 Fund |
| $16,625 | S&P 500® Index |
Fidelity Freedom® Blend 2040 Fund
Performance: The Bottom Line
Average annual total return reflects the change in the value of an investment, assuming reinvestment of distributions from dividend income and capital gains (the profits earned upon the sale of securities that have grown in value, if any) and assuming a constant rate of performance each year. The hypothetical investment and the average annual total returns do not reflect the deduction of taxes that a shareholder would pay on fund distributions or the redemption of fund shares. During periods of reimbursement by Fidelity, a fund’s total return will be greater than it would be had the reimbursement not occurred. How a fund did yesterday is no guarantee of how it will do tomorrow.
Average Annual Total Returns
| Periods ended March 31, 2022 | Past 1 year | Life of fundA |
| Class A (incl. 5.75% sales charge) | (2.95)% | 8.31% |
| Class M (incl. 3.50% sales charge) | (0.87)% | 8.74% |
| Class C (incl. contingent deferred sales charge) | 1.24% | 9.29% |
| Fidelity Freedom® Blend 2040 Fund | 3.27% | 10.40% |
| Class K | 3.39% | 10.51% |
| Class K6 | 3.46% | 10.62% |
| Class I | 3.23% | 10.39% |
| Premier Class | 3.49% | 10.63% |
| Class Z | 3.38% | 10.51% |
| Class Z6 | 3.46% | 10.62% |
A From August 31, 2018
Class C shares' contingent deferred sales charges included in the past one year and life of fund total return figures are 1% and 0%, respectively.
The initial offering of Premier Class took place on April 6, 2021. Returns prior to April 6, 2021 are those of Class K6.
$10,000 Over Life of Fund
Let's say hypothetically that $10,000 was invested in Fidelity Freedom® Blend 2040 Fund, a class of the fund, on August 31, 2018, when the fund started.
The chart shows how the value of your investment would have changed, and also shows how the S&P 500® Index performed over the same period.
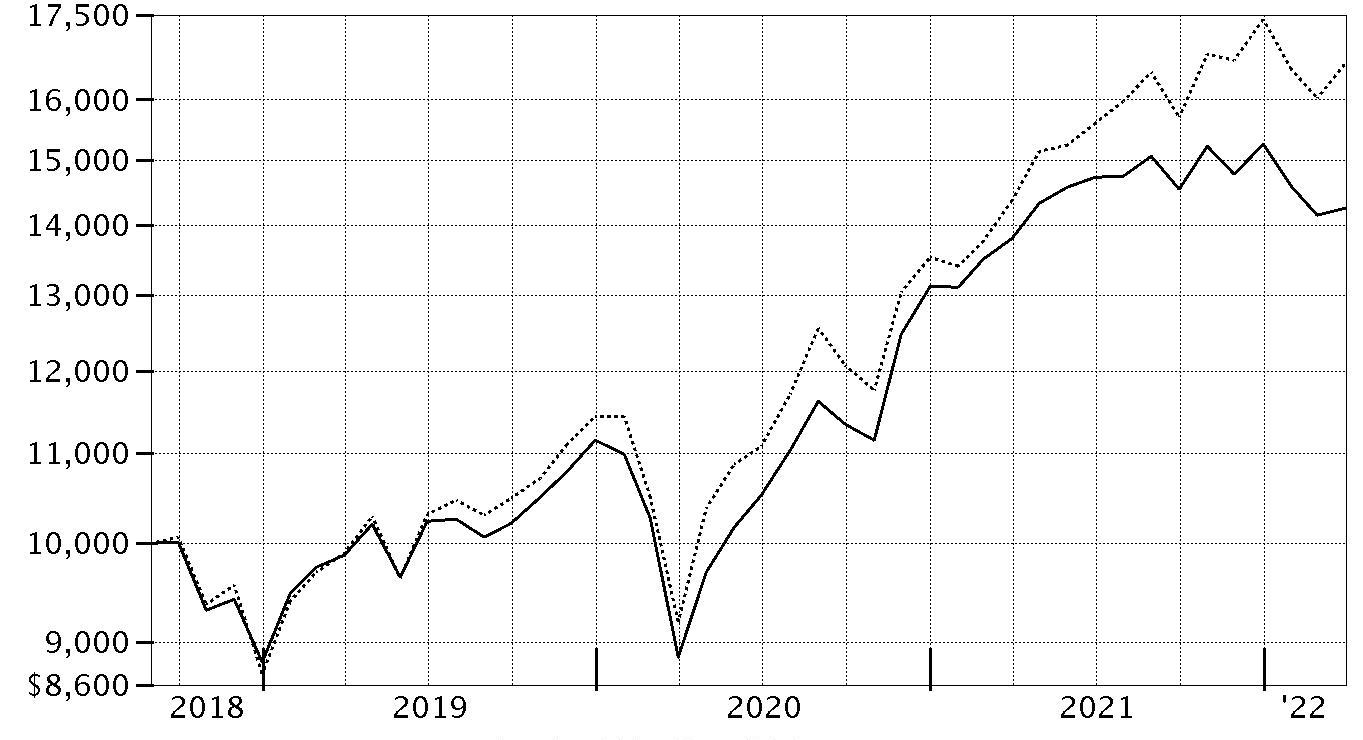
| Period Ending Values |
| $14,255 | Fidelity Freedom® Blend 2040 Fund |
| $16,625 | S&P 500® Index |
Fidelity Freedom® Blend 2045 Fund
Performance: The Bottom Line
Average annual total return reflects the change in the value of an investment, assuming reinvestment of distributions from dividend income and capital gains (the profits earned upon the sale of securities that have grown in value, if any) and assuming a constant rate of performance each year. The hypothetical investment and the average annual total returns do not reflect the deduction of taxes that a shareholder would pay on fund distributions or the redemption of fund shares. During periods of reimbursement by Fidelity, a fund’s total return will be greater than it would be had the reimbursement not occurred. How a fund did yesterday is no guarantee of how it will do tomorrow.
Average Annual Total Returns
| Periods ended March 31, 2022 | Past 1 year | Life of fundA |
| Class A (incl. 5.75% sales charge) | (2.90)% | 8.29% |
| Class M (incl. 3.50% sales charge) | (0.82)% | 8.73% |
| Class C (incl. contingent deferred sales charge) | 1.27% | 9.27% |
| Fidelity Freedom® Blend 2045 Fund | 3.27% | 10.38% |
| Class K | 3.35% | 10.49% |
| Class K6 | 3.51% | 10.61% |
| Class I | 3.28% | 10.38% |
| Premier Class | 3.54% | 10.62% |
| Class Z | 3.37% | 10.49% |
| Class Z6 | 3.50% | 10.61% |
A From August 31, 2018
Class C shares' contingent deferred sales charges included in the past one year and life of fund total return figures are 1% and 0%, respectively.
The initial offering of Premier Class took place on April 6, 2021. Returns prior to April 6, 2021 are those of Class K6.
$10,000 Over Life of Fund
Let's say hypothetically that $10,000 was invested in Fidelity Freedom® Blend 2045 Fund, a class of the fund, on August 31, 2018, when the fund started.
The chart shows how the value of your investment would have changed, and also shows how the S&P 500® Index performed over the same period.

| Period Ending Values |
| $14,246 | Fidelity Freedom® Blend 2045 Fund |
| $16,625 | S&P 500® Index |
Fidelity Freedom® Blend 2050 Fund
Performance: The Bottom Line
Average annual total return reflects the change in the value of an investment, assuming reinvestment of distributions from dividend income and capital gains (the profits earned upon the sale of securities that have grown in value, if any) and assuming a constant rate of performance each year. The hypothetical investment and the average annual total returns do not reflect the deduction of taxes that a shareholder would pay on fund distributions or the redemption of fund shares. During periods of reimbursement by Fidelity, a fund’s total return will be greater than it would be had the reimbursement not occurred. How a fund did yesterday is no guarantee of how it will do tomorrow.
Average Annual Total Returns
| Periods ended March 31, 2022 | Past 1 year | Life of fundA |
| Class A (incl. 5.75% sales charge) | (2.95)% | 8.29% |
| Class M (incl. 3.50% sales charge) | (0.83)% | 8.72% |
| Class C (incl. contingent deferred sales charge) | 1.40% | 9.29% |
| Fidelity Freedom® Blend 2050 Fund | 3.30% | 10.38% |
| Class K | 3.43% | 10.50% |
| Class K6 | 3.52% | 10.59% |
| Class I | 3.27% | 10.37% |
| Premier Class | 3.61% | 10.62% |
| Class Z | 3.40% | 10.50% |
| Class Z6 | 3.48% | 10.59% |
A From August 31, 2018
Class C shares' contingent deferred sales charges included in the past one year and life of fund total return figures are 1% and 0%, respectively.
The initial offering of Premier Class took place on April 6, 2021. Returns prior to April 6, 2021 are those of Class K6.
$10,000 Over Life of Fund
Let's say hypothetically that $10,000 was invested in Fidelity Freedom® Blend 2050 Fund, a class of the fund, on August 31, 2018, when the fund started.
The chart shows how the value of your investment would have changed, and also shows how the S&P 500® Index performed over the same period.

| Period Ending Values |
| $14,247 | Fidelity Freedom® Blend 2050 Fund |
| $16,625 | S&P 500® Index |
Fidelity Freedom® Blend 2055 Fund
Performance: The Bottom Line
Average annual total return reflects the change in the value of an investment, assuming reinvestment of distributions from dividend income and capital gains (the profits earned upon the sale of securities that have grown in value, if any) and assuming a constant rate of performance each year. The hypothetical investment and the average annual total returns do not reflect the deduction of taxes that a shareholder would pay on fund distributions or the redemption of fund shares. During periods of reimbursement by Fidelity, a fund’s total return will be greater than it would be had the reimbursement not occurred. How a fund did yesterday is no guarantee of how it will do tomorrow.
Average Annual Total Returns
| Periods ended March 31, 2022 | Past 1 year | Life of fundA |
| Class A (incl. 5.75% sales charge) | (2.83)% | 8.32% |
| Class M (incl. 3.50% sales charge) | (0.87)% | 8.74% |
| Class C (incl. contingent deferred sales charge) | 1.36% | 9.30% |
| Fidelity Freedom® Blend 2055 Fund | 3.36% | 10.40% |
| Class K | 3.43% | 10.52% |
| Class K6 | 3.60% | 10.63% |
| Class I | 3.32% | 10.40% |
| Premier Class | 3.55% | 10.62% |
| Class Z | 3.41% | 10.51% |
| Class Z6 | 3.52% | 10.61% |
A From August 31, 2018
Class C shares' contingent deferred sales charges included in the past one year and life of fund total return figures are 1% and 0%, respectively.
The initial offering of Premier Class took place on April 6, 2021. Returns prior to April 6, 2021 are those of Class K6.
$10,000 Over Life of Fund
Let's say hypothetically that $10,000 was invested in Fidelity Freedom® Blend 2055 Fund, a class of the fund, on August 31, 2018, when the fund started.
The chart shows how the value of your investment would have changed, and also shows how the S&P 500® Index performed over the same period.

| Period Ending Values |
| $14,257 | Fidelity Freedom® Blend 2055 Fund |
| $16,625 | S&P 500® Index |
Fidelity Freedom® Blend 2060 Fund
Performance: The Bottom Line
Average annual total return reflects the change in the value of an investment, assuming reinvestment of distributions from dividend income and capital gains (the profits earned upon the sale of securities that have grown in value, if any) and assuming a constant rate of performance each year. The hypothetical investment and the average annual total returns do not reflect the deduction of taxes that a shareholder would pay on fund distributions or the redemption of fund shares. During periods of reimbursement by Fidelity, a fund’s total return will be greater than it would be had the reimbursement not occurred. How a fund did yesterday is no guarantee of how it will do tomorrow.
Average Annual Total Returns
| Periods ended March 31, 2022 | Past 1 year | Life of fundA |
| Class A (incl. 5.75% sales charge) | (2.85)% | 8.29% |
| Class M (incl. 3.50% sales charge) | (0.80)% | 8.74% |
| Class C (incl. contingent deferred sales charge) | 1.35% | 9.27% |
| Fidelity Freedom® Blend 2060 Fund | 3.31% | 10.38% |
| Class K | 3.38% | 10.49% |
| Class K6 | 3.49% | 10.60% |
| Class I | 3.33% | 10.37% |
| Premier Class | 3.56% | 10.62% |
| Class Z | 3.38% | 10.49% |
| Class Z6 | 3.53% | 10.59% |
A From August 31, 2018
Class C shares' contingent deferred sales charges included in the past one year and life of fund total return figures are 1% and 0%, respectively.
The initial offering of Premier Class took place on April 6, 2021. Returns prior to April 6, 2021 are those of Class K6.
$10,000 Over Life of Fund
Let's say hypothetically that $10,000 was invested in Fidelity Freedom® Blend 2060 Fund, a class of the fund, on August 31, 2018, when the fund started.
The chart shows how the value of your investment would have changed, and also shows how the S&P 500® Index performed over the same period.

| Period Ending Values |
| $14,244 | Fidelity Freedom® Blend 2060 Fund |
| $16,625 | S&P 500® Index |
Fidelity Freedom® Blend 2065 Fund
Performance: The Bottom Line
Average annual total return reflects the change in the value of an investment, assuming reinvestment of distributions from dividend income and capital gains (the profits earned upon the sale of securities that have grown in value, if any) and assuming a constant rate of performance each year. The hypothetical investment and the average annual total returns do not reflect the deduction of taxes that a shareholder would pay on fund distributions or the redemption of fund shares. During periods of reimbursement by Fidelity, a fund’s total return will be greater than it would be had the reimbursement not occurred. How a fund did yesterday is no guarantee of how it will do tomorrow.
Average Annual Total Returns
| Periods ended March 31, 2022 | Past 1 year | Life of fundA |
| Class A (incl. 5.75% sales charge) | (2.82)% | 10.20% |
| Class M (incl. 3.50% sales charge) | (0.84)% | 10.84% |
| Class C (incl. contingent deferred sales charge) | 1.25% | 11.73% |
| Fidelity Freedom® Blend 2065 Fund | 3.34% | 12.88% |
| Class K | 3.47% | 12.99% |
| Class K6 | 3.50% | 13.08% |
| Class I | 3.37% | 12.88% |
| Premier Class | 3.60% | 13.12% |
| Class Z | 3.43% | 12.99% |
| Class Z6 | 3.58% | 13.10% |
A From June 28, 2019
Class C shares' contingent deferred sales charges included in the past one year and life of fund total return figures are 1% and 0%, respectively.
The initial offering of Premier Class took place on April 6, 2021. Returns prior to April 6, 2021 are those of Class K6.
$10,000 Over Life of Fund
Let's say hypothetically that $10,000 was invested in Fidelity Freedom® Blend 2065 Fund, a class of the fund, on June 28, 2019, when the fund started.
The chart shows how the value of your investment would have changed, and also shows how the S&P 500® Index performed over the same period.
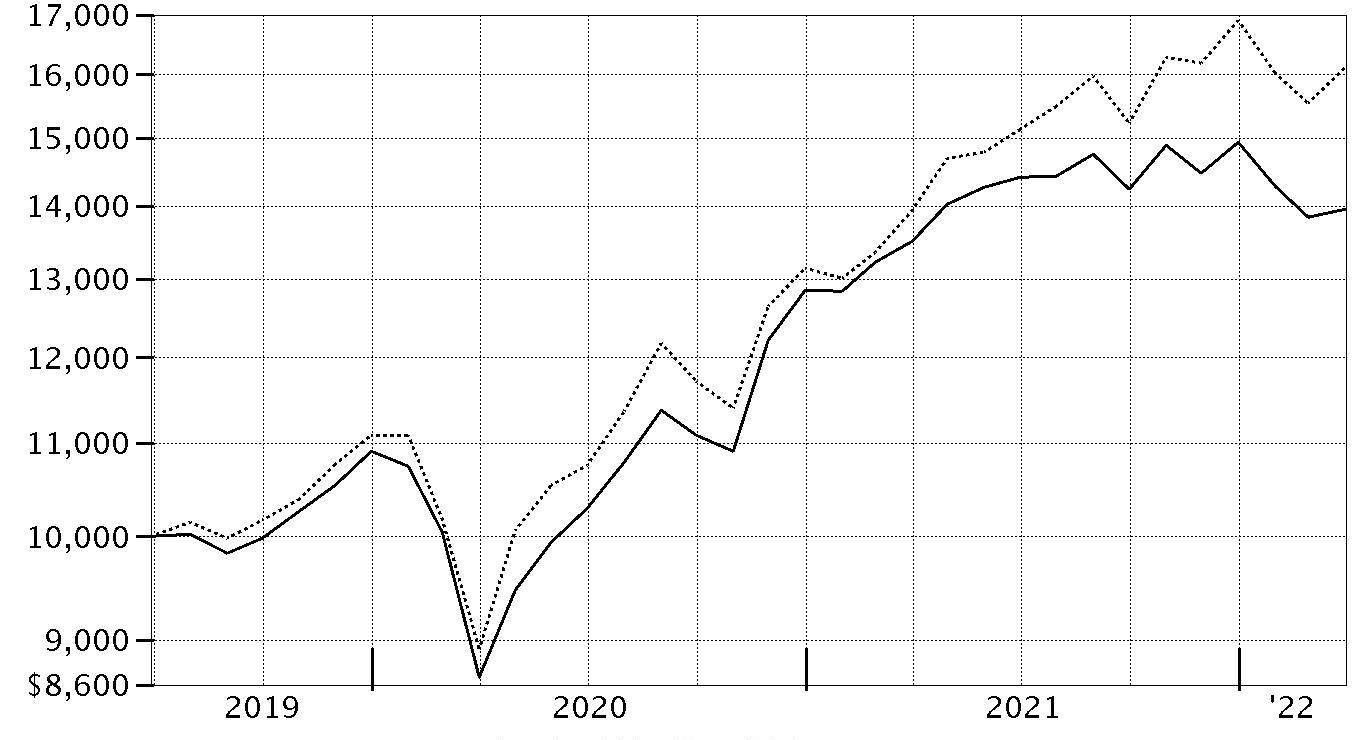
| Period Ending Values |
| $13,953 | Fidelity Freedom® Blend 2065 Fund |
| $16,126 | S&P 500® Index |
Management's Discussion of Fund Performance
Market Recap: For the 12 months ending March 31, 2022, global financial markets were influenced by the reopening of businesses, an improved outlook for global economic growth, and fiscal and monetary stimulus. Strong corporate earnings growth amid ongoing midcycle economic expansion in several countries provided support for risk assets. However, as the calendar turned, investors grappled with soaring inflation, increasing bond yields, supply constraint and disruption, and Russia’s invasion of Ukraine, which led to surging commodity prices.
International equities returned (-1.33%) the past 12 months, according to the MSCI ACWI (All Country World Index) ex USA Index. By region, emerging markets (-11%) lagged most, followed by Japan (-6%). Conversely, Canada (+21%) topped the broader index by a wide margin. The U.K. (+15%), Asia Pacific ex Japan (+3%) and Europe ex U.K. (+1%) also outperformed. By sector, consumer discretionary (-21%) and communication services (-16%) fared worst. In contrast, energy (+24%) notably outperformed due to rising prices for oil and natural gas. Materials and financials each gained about 10%.
U.S. stocks gained 11.67% for the 12 months, as measured by the Dow Jones U.S. Total Stock Market Index. Among sectors, energy (+64%) led the way. Real estate (+20%), utilities (+19%) and information technology (+16%) also showed strength. In contrast, communication services (-3%) notably lagged. Small-cap stocks widely trailed larger-caps, while value outpaced growth, except among large-caps. Commodities rose 49.25%, per the Bloomberg Commodity Index Total Return.
U.S. taxable investment-grade bonds returned -4.15%, according to the Bloomberg U.S. Aggregate Bond Index, amid rising market interest rates and inflation. In December, the U.S. Federal Reserve said it was time to retire the term “transitory” in describing U.S. inflation and raised prospects for three quarter-point rate hikes in 2022. Corporate bonds (-4.16%) trailed U.S. Treasuries (-3.67%). Commercial mortgage-backed securities (-4.46%) and agencies (-3.94%) also lost ground. Outside the index, Treasury Inflation-Protected Securities (+4.29%) and leveraged loans (+3.38%) gained, but other non-core groups declined, such as emerging-markets debt (-6.18%) and U.S. corporate high-yield bonds (-0.30%).
Comments from Co-Portfolio Managers Andrew Dierdorf and Brett Sumsion: For the fiscal year, returns for the Freedom Blend Funds' share classes (excluding sales charges, if applicable) ranged from roughly -1% for income-oriented Funds – earmarked for investors with a shorter retirement-savings horizon – to about 3% for the equity-oriented Funds, suited to investors with a longer retirement-savings horizon. Each Fund underperformed its Composite index the past 12 months. Security selection among the underlying investment portfolios was the primary relative detractor, whereas active asset allocation contributed. Specifically, investments in underlying emerging-markets equity funds detracted most. In this asset class, Fidelity
® Series Emerging Markets Opportunities Fund (-19.20%) underperformed the -11.36% result of its benchmark, the MSCI Emerging Markets Index. Underlying investments in U.S. equities also held back the Funds' performance versus Composites. Specifically, Fidelity
® Series Blue Chip Growth Fund (+3.25%) detracted, given it trailed the +14.98% gain of its benchmark, the Russell 1000
® Growth Index. Conversely, investments in non-U.S. developed-markets equities and investment-grade bonds lifted the Funds' relative performance the past year. In terms of active asset allocation, a non-Composite allocation to commodities added relative value, given the 48.79% return for Fidelity
® Series Commodity Strategy Fund. Underweighting investment-grade bonds also contributed, as this asset class lagged many others in which the Funds invest. In contrast, positioning in equities detracted from the Funds' relative results. An outsized allocation to emerging-markets equities hurt, as did an underweighting in strong-performing U.S. equities.
The views expressed above reflect those of the portfolio manager(s) only through the end of the period as stated on the cover of this report and do not necessarily represent the views of Fidelity or any other person in the Fidelity organization. Any such views are subject to change at any time based upon market or other conditions and Fidelity disclaims any responsibility to update such views. These views may not be relied on as investment advice and, because investment decisions for a Fidelity fund are based on numerous factors, may not be relied on as an indication of trading intent on behalf of any Fidelity fund.
Fidelity Freedom® Blend Income Fund
Investment Summary (Unaudited)
The information in the following tables is based on the direct investments of the Fund.
Top Holdings as of March 31, 2022
| | % of fund's net assets |
| Fidelity Series 0-5 Year Inflation-Protected Bond Index Fund | 15.9 |
| Fidelity Series Investment Grade Bond Fund | 11.9 |
| Fidelity Series Government Bond Index Fund | 11.3 |
| Fidelity Series Investment Grade Securitized Fund | 8.3 |
| Fidelity Series Corporate Bond Fund | 8.1 |
| Fidelity Series Treasury Bill Index Fund | 7.5 |
| Fidelity Series Emerging Markets Opportunities Fund | 5.5 |
| Fidelity Series Long-Term Treasury Bond Index Fund | 3.7 |
| Fidelity Series International Developed Markets Bond Index Fund | 3.1 |
| Fidelity Series Short-Term Credit Fund | 2.5 |
| | 77.8 |
Asset Allocation (% of fund's net assets)
| Period end |
| | Domestic Equity Funds | 7.8% |
| | International Equity Funds | 13.4% |
| | Bond Funds | 66.2% |
| | Short-Term Funds | 12.5% |
| | Short-Term Investments | 0.1% |

Percentages are adjusted for the effect of futures contracts and swaps, if applicable.
Domestic Equity Funds category includes Fidelity Series Commodity Strategy Fund which invests in commodity-related investments.
Fidelity Freedom® Blend Income Fund
Schedule of Investments March 31, 2022
Showing Percentage of Net Assets
| U.S. Treasury Obligations - 0.1% | | | |
| | | Principal Amount | Value |
| U.S. Treasury Bills, yield at date of purchase 0.18% to 0.38% 4/28/22 to 6/9/22 (a) | | | |
| (Cost $49,976) | | 50,000 | 49,977 |
| | | Shares | Value |
|
| Domestic Equity Funds - 7.8% | | | |
| Fidelity Series Blue Chip Growth Fund (b) | | 86,189 | $1,238,536 |
| Fidelity Series Commodity Strategy Fund (b) | | 256,950 | 1,313,014 |
| Fidelity Series Large Cap Growth Index Fund (b) | | 44,331 | 780,226 |
| Fidelity Series Large Cap Stock Fund (b) | | 45,802 | 870,703 |
| Fidelity Series Large Cap Value Index Fund (b) | | 108,514 | 1,666,777 |
| Fidelity Series Small Cap Opportunities Fund (b) | | 30,760 | 418,957 |
| Fidelity Series Value Discovery Fund (b) | | 38,517 | 616,269 |
| TOTAL DOMESTIC EQUITY FUNDS | | | |
| (Cost $5,849,098) | | | 6,904,482 |
|
| International Equity Funds - 13.4% | | | |
| Fidelity Series Canada Fund (b) | | 49,467 | 767,722 |
| Fidelity Series Emerging Markets Fund (b) | | 57,974 | 537,999 |
| Fidelity Series Emerging Markets Opportunities Fund (b) | | 263,465 | 4,847,748 |
| Fidelity Series International Growth Fund (b) | | 92,803 | 1,538,669 |
| Fidelity Series International Index Fund (b) | | 56,997 | 652,041 |
| Fidelity Series International Small Cap Fund (b) | | 27,034 | 485,267 |
| Fidelity Series International Value Fund (b) | | 140,914 | 1,554,286 |
| Fidelity Series Overseas Fund (b) | | 122,604 | 1,547,268 |
| TOTAL INTERNATIONAL EQUITY FUNDS | | | |
| (Cost $11,954,228) | | | 11,931,000 |
|
| Bond Funds - 66.2% | | | |
| Fidelity Series 0-5 Year Inflation-Protected Bond Index Fund (b) | | 1,411,221 | 14,154,543 |
| Fidelity Series 5+ Year Inflation-Protected Bond Index Fund (b) | | 9,150 | 87,838 |
| Fidelity Series Corporate Bond Fund (b) | | 712,039 | 7,191,598 |
| Fidelity Series Emerging Markets Debt Fund (b) | | 54,728 | 451,509 |
| Fidelity Series Emerging Markets Debt Local Currency Fund (b) | | 16,647 | 149,989 |
| Fidelity Series Floating Rate High Income Fund (b) | | 9,783 | 89,908 |
| Fidelity Series Government Bond Index Fund (b) | | 1,008,036 | 10,060,203 |
| Fidelity Series High Income Fund (b) | | 58,580 | 532,491 |
| Fidelity Series Inflation-Protected Bond Index Fund (b) | | 174,394 | 1,770,102 |
| Fidelity Series International Developed Markets Bond Index Fund (b) | | 300,144 | 2,800,346 |
| Fidelity Series Investment Grade Bond Fund (b) | | 969,869 | 10,581,267 |
| Fidelity Series Investment Grade Securitized Fund (b) | | 762,629 | 7,412,749 |
| Fidelity Series Long-Term Treasury Bond Index Fund (b) | | 428,866 | 3,267,960 |
| Fidelity Series Real Estate Income Fund (b) | | 28,695 | 325,971 |
| TOTAL BOND FUNDS | | | |
| (Cost $61,220,379) | | | 58,876,474 |
|
| Short-Term Funds - 12.5% | | | |
| Fidelity Cash Central Fund 0.31% (c) | | 2,602 | 2,602 |
| Fidelity Series Government Money Market Fund 0.31% (b)(d) | | 2,229,807 | 2,229,807 |
| Fidelity Series Short-Term Credit Fund (b) | | 229,133 | 2,234,044 |
| Fidelity Series Treasury Bill Index Fund (b) | | 669,670 | 6,690,003 |
| TOTAL SHORT-TERM FUNDS | | | |
| (Cost $11,217,017) | | | 11,156,456 |
| TOTAL INVESTMENT IN SECURITIES - 100.0% | | | |
| (Cost $90,290,698) | | | 88,918,389 |
| NET OTHER ASSETS (LIABILITIES) - 0.0% | | | 13,677 |
| NET ASSETS - 100% | | | $88,932,066 |
| Futures Contracts | | | | | |
| | Number of contracts | Expiration Date | Notional Amount | Value | Unrealized Appreciation/(Depreciation) |
| Purchased | | | | | |
| Equity Index Contracts | | | | | |
| ICE E-mini MSCI EAFE Index Contracts (United States) | 2 | June 2022 | $214,440 | $12,190 | $12,190 |
| ICE E-mini MSCI Emerging Markets Index Contracts (United States) | 4 | June 2022 | 225,100 | 16,999 | 16,999 |
| Sold | | | | | |
| Equity Index Contracts | | | | | |
| CME Micro E-mini S&P 500 Index Contracts (United States) | 2 | June 2022 | 453,075 | (15,561) | (15,561) |
| TOTAL FUTURES CONTRACTS | | | | | $13,628 |
The notional amount of futures purchased as a percentage of Net Assets is 0.5%
The notional amount of futures sold as a percentage of Net Assets is 0.5%
Legend
(a) Security or a portion of the security was pledged to cover margin requirements for futures contracts. At period end, the value of securities pledged amounted to $49,977.
(b) Affiliated Fund
(c) Affiliated fund that is generally available only to investment companies and other accounts managed by Fidelity Investments. The rate quoted is the annualized seven-day yield of the fund at period end. A complete unaudited listing of the fund's holdings as of its most recent quarter end is available upon request. In addition, each Fidelity Central Fund's financial statements, which are not covered by the Fund's Report of Independent Registered Public Accounting Firm, are available on the SEC's website or upon request.
(d) The rate quoted is the annualized seven-day yield of the fund at period end.
Affiliated Central Funds
Fiscal year to date information regarding the Fund's investments in Fidelity Central Funds, including the ownership percentage, is presented below.
| Fund | Value, beginning of period | Purchases | Sales Proceeds | Dividend Income | Realized Gain/Loss | Change in Unrealized appreciation (depreciation) | Value, end of period | % ownership, end of period |
| Fidelity Cash Central Fund 0.31% | $49 | $151,126 | $148,573 | $2 | $-- | $-- | $2,602 | 0.0% |
| Total | $49 | $151,126 | $148,573 | $2 | $-- | $-- | $2,602 | |
Amounts in the income column in the above table include any capital gain distributions from underlying funds, which are presented in the corresponding line-item in the Statement of Operations, if applicable.
Affiliated Underlying Funds
Fiscal year to date information regarding the Fund's investments in affiliated Underlying Funds is presented below. Exchanges between classes of the same affiliated Underlying Funds may occur. If an underlying Fund changes its name, the name presented below is the name in effect at period end.
| Affiliate | Value, beginning of period | Purchases(a) | Sales Proceeds(a) | Dividend Income | Realized Gain (loss) | Change in Unrealized appreciation (depreciation) | Value, end of period |
| Fidelity Series 0-5 Year Inflation-Protected Bond Index Fund | $-- | $15,431,582 | $1,242,590 | $52,133 | $(1,583) | $(25,105) | $14,154,543 |
| Fidelity Series 5+ Year Inflation-Protected Bond Index Fund | -- | 2,589,879 | 2,486,403 | 6,407 | (15,357) | (281) | 87,838 |
| Fidelity Series Blue Chip Growth Fund | 892,970 | 1,329,852 | 751,171 | 258,309 | (20,895) | (212,220) | 1,238,536 |
| Fidelity Series Canada Fund | 317,176 | 541,861 | 194,017 | 15,443 | (393) | 103,095 | 767,722 |
| Fidelity Series Commodity Strategy Fund | 1,724,256 | 2,022,927 | 2,481,749 | 729,813 | (75,486) | 123,066 | 1,313,014 |
| Fidelity Series Corporate Bond Fund | 5,247,396 | 4,680,414 | 2,176,559 | 197,522 | (24,164) | (535,489) | 7,191,598 |
| Fidelity Series Emerging Markets Debt Fund | 339,733 | 304,841 | 144,901 | 20,464 | (3,363) | (44,801) | 451,509 |
| Fidelity Series Emerging Markets Debt Local Currency Fund | 113,537 | 101,638 | 46,839 | 6,172 | (1,041) | (17,306) | 149,989 |
| Fidelity Series Emerging Markets Fund | 444,602 | 450,296 | 230,410 | 17,782 | (7,342) | (119,147) | 537,999 |
| Fidelity Series Emerging Markets Opportunities Fund | 3,997,024 | 4,547,098 | 2,059,842 | 577,254 | (105,775) | (1,530,757) | 4,847,748 |
| Fidelity Series Floating Rate High Income Fund | 68,439 | 58,427 | 36,804 | 3,826 | (24) | (130) | 89,908 |
| Fidelity Series Government Bond Index Fund | 6,469,567 | 6,415,200 | 2,301,015 | 97,810 | (30,351) | (493,198) | 10,060,203 |
| Fidelity Series Government Money Market Fund 0.31% | 4,686,510 | 2,586,457 | 5,043,160 | 3,217 | -- | -- | 2,229,807 |
| Fidelity Series High Income Fund | 394,272 | 346,136 | 188,197 | 28,326 | (2,262) | (17,458) | 532,491 |
| Fidelity Series Inflation-Protected Bond Index Fund | 7,443,571 | 5,339,657 | 10,935,925 | 462,982 | 331,712 | (408,913) | 1,770,102 |
| Fidelity Series International Developed Markets Bond Index Fund | -- | 3,173,026 | 246,932 | 943 | (5,085) | (120,663) | 2,800,346 |
| Fidelity Series International Growth Fund | 780,015 | 1,411,077 | 453,585 | 125,851 | (12,744) | (186,094) | 1,538,669 |
| Fidelity Series International Index Fund | 325,642 | 538,739 | 178,427 | 16,598 | (2,895) | (31,018) | 652,041 |
| Fidelity Series International Small Cap Fund | 281,307 | 434,811 | 133,785 | 65,839 | (5,942) | (91,124) | 485,267 |
| Fidelity Series International Value Fund | 779,121 | 1,318,515 | 532,560 | 78,949 | (4,215) | (6,575) | 1,554,286 |
| Fidelity Series Investment Grade Bond Fund | 7,180,846 | 6,628,229 | 2,601,360 | 220,174 | (23,415) | (603,033) | 10,581,267 |
| Fidelity Series Investment Grade Securitized Fund | 5,031,089 | 4,579,322 | 1,762,238 | 60,648 | (15,276) | (420,148) | 7,412,749 |
| Fidelity Series Large Cap Growth Index Fund | 563,503 | 620,082 | 476,292 | 24,839 | 10,141 | 62,792 | 780,226 |
| Fidelity Series Large Cap Stock Fund | 615,159 | 686,247 | 441,983 | 77,377 | (3,772) | 15,052 | 870,703 |
| Fidelity Series Large Cap Value Index Fund | 1,174,946 | 1,345,686 | 901,565 | 114,693 | (3,637) | 51,347 | 1,666,777 |
| Fidelity Series Long-Term Treasury Bond Index Fund | 1,699,334 | 2,609,246 | 915,224 | 58,188 | (54,759) | (70,637) | 3,267,960 |
| Fidelity Series Overseas Fund | 781,330 | 1,323,227 | 482,670 | 46,726 | (3,711) | (70,908) | 1,547,268 |
| Fidelity Series Real Estate Income Fund | 236,145 | 201,927 | 117,097 | 12,991 | (446) | 5,442 | 325,971 |
| Fidelity Series Short-Term Credit Fund | 2,311,484 | 2,301,781 | 2,257,022 | 54,310 | (33,263) | (88,936) | 2,234,044 |
| Fidelity Series Small Cap Opportunities Fund | 297,236 | 423,514 | 204,475 | 103,966 | (10,542) | (86,776) | 418,957 |
| Fidelity Series Treasury Bill Index Fund | 7,446,826 | 7,315,236 | 8,063,839 | 8,311 | (4,557) | (3,663) | 6,690,003 |
| Fidelity Series Value Discovery Fund | 434,135 | 507,032 | 316,663 | 73,259 | (2,826) | (5,409) | 616,269 |
| Total | $62,077,171 | $82,163,962 | $50,405,299 | $3,621,122 | $(133,268) | $(4,828,995) | $88,865,810 |
(a) Includes the value of shares purchased or redeemed through in-kind transactions, if applicable.
Amounts in the income column in the above table include any capital gain distributions from underlying funds, which are presented in the corresponding line-item in the Statement of Operations, if applicable.
Investment Valuation
The following is a summary of the inputs used, as of March 31, 2022, involving the Fund's assets and liabilities carried at fair value. The inputs or methodology used for valuing securities may not be an indication of the risk associated with investing in those securities. For more information on valuation inputs, and their aggregation into the levels used below, please refer to the Investment Valuation section in the accompanying Notes to Financial Statements.
| | Valuation Inputs at Reporting Date: |
| Description | Total | Level 1 | Level 2 | Level 3 |
| Investments in Securities: | | | | |
| Other Short-Term Investments and Net Other Assets | $49,977 | $-- | $49,977 | $-- |
| Domestic Equity Funds | 6,904,482 | 6,904,482 | -- | -- |
| International Equity Funds | 11,931,000 | 11,931,000 | -- | -- |
| Bond Funds | 58,876,474 | 58,876,474 | -- | -- |
| Short-Term Funds | 11,156,456 | 11,156,456 | -- | -- |
| Total Investments in Securities: | $88,918,389 | $88,868,412 | $49,977 | $-- |
| Derivative Instruments: | | | | |
| Assets | | | | |
| Futures Contracts | $29,189 | $29,189 | $-- | $-- |
| Total Assets | $29,189 | $29,189 | $-- | $-- |
| Liabilities | | | | |
| Futures Contracts | $(15,561) | $(15,561) | $-- | $-- |
| Total Liabilities | $(15,561) | $(15,561) | $-- | $-- |
| Total Derivative Instruments: | $13,628 | $13,628 | $-- | $-- |
Value of Derivative Instruments
The following table is a summary of the Fund's value of derivative instruments by primary risk exposure as of March 31, 2022. For additional information on derivative instruments, please refer to the Derivative Instruments section in the accompanying Notes to Financial Statements.
| Primary Risk Exposure / Derivative Type | Value |
| | Asset | Liability |
| Equity Risk | | |
| Futures Contracts(a) | $29,189 | $(15,561) |
| Total Equity Risk | 29,189 | (15,561) |
| Total Value of Derivatives | $29,189 | $(15,561) |
(a) Reflects gross cumulative appreciation (depreciation) on futures contracts as presented in the Schedule of Investments. In the Statement of Assets and Liabilities, the period end daily variation margin is included in receivable or payable for daily variation margin on futures contracts, and the net cumulative appreciation (depreciation) is included in Total accumulated earnings (loss).
See accompanying notes which are an integral part of the financial statements.
Fidelity Freedom® Blend Income Fund
Financial Statements
Statement of Assets and Liabilities
| | | March 31, 2022 |
| Assets | | |
Investment in securities, at value — See accompanying schedule:
Unaffiliated issuers (cost $49,976) | $49,977 | |
| Fidelity Central Funds (cost $2,602) | 2,602 | |
| Other affiliated issuers (cost $90,238,120) | 88,865,810 | |
| Total Investment in Securities (cost $90,290,698) | | $88,918,389 |
| Cash | | 18,284 |
| Receivable for investments sold | | 2,723,592 |
| Receivable for fund shares sold | | 27,076 |
| Distributions receivable from Fidelity Central Funds | | 1 |
| Total assets | | 91,687,342 |
| Liabilities | | |
| Payable for investments purchased | $2,643,685 | |
| Payable for fund shares redeemed | 87,083 | |
| Accrued management fee | 20,999 | |
| Distribution and service plan fees payable | 1,050 | |
| Payable for daily variation margin on futures contracts | 2,459 | |
| Total liabilities | | 2,755,276 |
| Net Assets | | $88,932,066 |
| Net Assets consist of: | | |
| Paid in capital | | $89,936,226 |
| Total accumulated earnings (loss) | | (1,004,160) |
| Net Assets | | $88,932,066 |
| Net Asset Value and Maximum Offering Price | | |
| Class A: | | |
| Net Asset Value and redemption price per share ($2,623,495 ÷ 252,417 shares)(a) | | $10.39 |
| Maximum offering price per share (100/94.25 of $10.39) | | $11.02 |
| Class M: | | |
| Net Asset Value and redemption price per share ($138,959 ÷ 13,387 shares)(a) | | $10.38 |
| Maximum offering price per share (100/96.50 of $10.38) | | $10.76 |
| Class C: | | |
| Net Asset Value and offering price per share ($518,055 ÷ 50,426 shares)(a) | | $10.27 |
| Fidelity Freedom Blend Income Fund: | | |
| Net Asset Value, offering price and redemption price per share ($5,423,829 ÷ 521,199 shares) | | $10.41 |
| Class K: | | |
| Net Asset Value, offering price and redemption price per share ($1,069,039 ÷ 102,687 shares) | | $10.41 |
| Class K6: | | |
| Net Asset Value, offering price and redemption price per share ($35,898,574 ÷ 3,446,461 shares) | | $10.42 |
| Class I: | | |
| Net Asset Value, offering price and redemption price per share ($2,511,933 ÷ 241,358 shares) | | $10.41 |
| Class Z: | | |
| Net Asset Value, offering price and redemption price per share ($1,179,778 ÷ 113,333 shares) | | $10.41 |
| Class Z6: | | |
| Net Asset Value, offering price and redemption price per share ($16,067,762 ÷ 1,542,491 shares) | | $10.42 |
| Premier Class: | | |
| Net Asset Value, offering price and redemption price per share ($23,500,642 ÷ 2,257,917 shares) | | $10.41 |
(a) Redemption price per share is equal to net asset value less any applicable contingent deferred sales charge.
See accompanying notes which are an integral part of the financial statements.
Statement of Operations
| | | Year ended March 31, 2022 |
| Investment Income | | |
| Dividends: | | |
| Affiliated issuers | | $2,283,689 |
| Interest | | 14 |
| Income from Fidelity Central Funds | | 2 |
| Total income | | 2,283,705 |
| Expenses | | |
| Management fee | $236,859 | |
| Distribution and service plan fees | 12,911 | |
| Independent trustees' fees and expenses | 241 | |
| Total expenses | | 250,011 |
| Net investment income (loss) | | 2,033,694 |
| Realized and Unrealized Gain (Loss) | | |
| Net realized gain (loss) on: | | |
| Investment securities: | | |
| Affiliated issuers | (133,268) | |
| Futures contracts | (8,292) | |
| Capital gain distributions from underlying funds: | | |
| Affiliated issuers | 1,337,433 | |
| Total net realized gain (loss) | | 1,195,873 |
| Change in net unrealized appreciation (depreciation) on: | | |
| Investment securities: | | |
| Unaffiliated issuers | 1 | |
| Affiliated issuers | (4,828,995) | |
| Futures contracts | 13,628 | |
| Total change in net unrealized appreciation (depreciation) | | (4,815,366) |
| Net gain (loss) | | (3,619,493) |
| Net increase (decrease) in net assets resulting from operations | | $(1,585,799) |
See accompanying notes which are an integral part of the financial statements.
Statement of Changes in Net Assets
| | Year ended March 31, 2022 | Year ended March 31, 2021 |
| Increase (Decrease) in Net Assets | | |
| Operations | | |
| Net investment income (loss) | $2,033,694 | $599,024 |
| Net realized gain (loss) | 1,195,873 | 1,323,853 |
| Change in net unrealized appreciation (depreciation) | (4,815,366) | 4,176,622 |
| Net increase (decrease) in net assets resulting from operations | (1,585,799) | 6,099,499 |
| Distributions to shareholders | (3,306,345) | (1,527,679) |
| Share transactions - net increase (decrease) | 31,763,019 | 13,875,323 |
| Total increase (decrease) in net assets | 26,870,875 | 18,447,143 |
| Net Assets | | |
| Beginning of period | 62,061,191 | 43,614,048 |
| End of period | $88,932,066 | $62,061,191 |
See accompanying notes which are an integral part of the financial statements.
Financial Highlights
Fidelity Freedom Blend Income Fund Class A
| Years ended March 31, | 2022 | 2021 | 2020 | 2019 A |
| Selected Per–Share Data | | | | |
| Net asset value, beginning of period | $10.92 | $9.98 | $10.03 | $10.00 |
| Income from Investment Operations | | | | |
| Net investment income (loss)B,C | .20 | .07 | .16 | .11 |
| Net realized and unrealized gain (loss) | (.33) | 1.12 | .01D | .08 |
| Total from investment operations | (.13) | 1.19 | .17 | .19 |
| Distributions from net investment income | (.21) | (.08) | (.15) | (.11) |
| Distributions from net realized gain | (.19) | (.17) | (.07) | (.05) |
| Total distributions | (.40) | (.25) | (.22) | (.16) |
| Net asset value, end of period | $10.39 | $10.92 | $9.98 | $10.03 |
| Total ReturnE,F | (1.30)% | 11.94% | 1.60% | 1.91% |
| Ratios to Average Net AssetsC,G,H | | | | |
| Expenses before reductions | .71% | .71% | .71% | .71%I |
| Expenses net of fee waivers, if any | .71% | .71% | .71% | .71%I |
| Expenses net of all reductions | .71% | .71% | .71% | .71%I |
| Net investment income (loss) | 1.79% | .67% | 1.55% | 1.95%I |
| Supplemental Data | | | | |
| Net assets, end of period (000 omitted) | $2,623 | $1,423 | $699 | $107 |
| Portfolio turnover rateJ | 62% | 49% | 44% | 48%I |
A For the period August 31, 2018 (commencement of operations) through March 31, 2019.
B Calculated based on average shares outstanding during the period.
C Net investment income (loss) is affected by the timing of the declaration of dividends by any underlying mutual funds or exchange-traded funds (ETFs). Net investment income (loss) of any such underlying funds is not included in the Fund's net investment income (loss) ratio.
D The amount shown for a share outstanding does not correspond with the aggregate net gain (loss) on investments for the period due to the timing of sales and repurchases of shares in relation to fluctuating market values of the investments of the Fund.
E Total returns for periods of less than one year are not annualized.
F Total returns do not include the effect of the sales charges.
G Fees and expenses of any underlying mutual funds or exchange-traded funds (ETFs) are not included in the Fund's expense ratio. The Fund indirectly bears its proportionate share of these expenses. For additional expense information related to investments in Fidelity Central Funds, please refer to the "Investments in Fidelity Central Funds" note found in the Notes to Financial Statements section of the most recent Annual or Semi-Annual report.
H Expense ratios reflect operating expenses of the class. Expenses before reductions do not reflect amounts reimbursed, waived, or reduced through arrangements with the investment adviser, brokerage services, or other offset arrangements, if applicable, and do not represent the amount paid by the class during periods when reimbursements, waivers or reductions occur.
I Annualized
J Amount does not include the portfolio activity of any underlying mutual funds or exchange-traded funds (ETFs).
See accompanying notes which are an integral part of the financial statements.
Fidelity Freedom Blend Income Fund Class M
| Years ended March 31, | 2022 | 2021 | 2020 | 2019 A |
| Selected Per–Share Data | | | | |
| Net asset value, beginning of period | $10.92 | $9.98 | $10.03 | $10.00 |
| Income from Investment Operations | | | | |
| Net investment income (loss)B,C | .17 | .05 | .13 | .10 |
| Net realized and unrealized gain (loss) | (.32) | 1.11 | .01D | .07 |
| Total from investment operations | (.15) | 1.16 | .14 | .17 |
| Distributions from net investment income | (.20) | (.05) | (.12) | (.09) |
| Distributions from net realized gain | (.19) | (.17) | (.07) | (.05) |
| Total distributions | (.39) | (.22) | (.19) | (.14) |
| Net asset value, end of period | $10.38 | $10.92 | $9.98 | $10.03 |
| Total ReturnE,F,G | (1.51)% | 11.65% | 1.35% | 1.76% |
| Ratios to Average Net AssetsC,H,I | | | | |
| Expenses before reductions | .96% | .96% | .96% | .96%J |
| Expenses net of fee waivers, if any | .96% | .96% | .96% | .96%J |
| Expenses net of all reductions | .96% | .96% | .96% | .96%J |
| Net investment income (loss) | 1.54% | .42% | 1.30% | 1.70%J |
| Supplemental Data | | | | |
| Net assets, end of period (000 omitted) | $139 | $195 | $156 | $102 |
| Portfolio turnover rateK | 62% | 49% | 44% | 48%J |
A For the period August 31, 2018 (commencement of operations) through March 31, 2019.
B Calculated based on average shares outstanding during the period.
C Net investment income (loss) is affected by the timing of the declaration of dividends by any underlying mutual funds or exchange-traded funds (ETFs). Net investment income (loss) of any such underlying funds is not included in the Fund's net investment income (loss) ratio.
D The amount shown for a share outstanding does not correspond with the aggregate net gain (loss) on investments for the period due to the timing of sales and repurchases of shares in relation to fluctuating market values of the investments of the Fund.
E Total returns for periods of less than one year are not annualized.
F Total returns would have been lower if certain expenses had not been reduced during the applicable periods shown.
G Total returns do not include the effect of the sales charges.
H Fees and expenses of any underlying mutual funds or exchange-traded funds (ETFs) are not included in the Fund's expense ratio. The Fund indirectly bears its proportionate share of these expenses. For additional expense information related to investments in Fidelity Central Funds, please refer to the "Investments in Fidelity Central Funds" note found in the Notes to Financial Statements section of the most recent Annual or Semi-Annual report.
I Expense ratios reflect operating expenses of the class. Expenses before reductions do not reflect amounts reimbursed, waived, or reduced through arrangements with the investment adviser, brokerage services, or other offset arrangements, if applicable, and do not represent the amount paid by the class during periods when reimbursements, waivers or reductions occur.
J Annualized
K Amount does not include the portfolio activity of any underlying mutual funds or exchange-traded funds (ETFs).
See accompanying notes which are an integral part of the financial statements.
Fidelity Freedom Blend Income Fund Class C
| Years ended March 31, | 2022 | 2021 | 2020 | 2019 A |
| Selected Per–Share Data | | | | |
| Net asset value, beginning of period | $10.85 | $9.95 | $10.01 | $10.00 |
| Income from Investment Operations | | | | |
| Net investment income (loss)B,C | .11 | (.01) | .08 | .07 |
| Net realized and unrealized gain (loss) | (.31) | 1.11 | .01D | .07 |
| Total from investment operations | (.20) | 1.10 | .09 | .14 |
| Distributions from net investment income | (.18) | (.03) | (.08) | (.08) |
| Distributions from net realized gain | (.19) | (.17) | (.07) | (.05) |
| Total distributions | (.38)E | (.20) | (.15) | (.13) |
| Net asset value, end of period | $10.27 | $10.85 | $9.95 | $10.01 |
| Total ReturnF,G | (2.04)% | 11.10% | .85%�� | 1.45% |
| Ratios to Average Net AssetsC,H,I | | | | |
| Expenses before reductions | 1.46% | 1.46% | 1.46% | 1.47%J,K |
| Expenses net of fee waivers, if any | 1.46% | 1.46% | 1.46% | 1.47%J,K |
| Expenses net of all reductions | 1.46% | 1.46% | 1.46% | 1.47%J,K |
| Net investment income (loss) | 1.04% | (.09)% | .81% | 1.19%J |
| Supplemental Data | | | | |
| Net assets, end of period (000 omitted) | $518 | $711 | $228 | $123 |
| Portfolio turnover rateL | 62% | 49% | 44% | 48%J |
A For the period August 31, 2018 (commencement of operations) through March 31, 2019.
B Calculated based on average shares outstanding during the period.
C Net investment income (loss) is affected by the timing of the declaration of dividends by any underlying mutual funds or exchange-traded funds (ETFs). Net investment income (loss) of any such underlying funds is not included in the Fund's net investment income (loss) ratio.
D The amount shown for a share outstanding does not correspond with the aggregate net gain (loss) on investments for the period due to the timing of sales and repurchases of shares in relation to fluctuating market values of the investments of the Fund.
E Total distributions per share do not sum due to rounding.
F Total returns for periods of less than one year are not annualized.
G Total returns do not include the effect of the contingent deferred sales charge.
H Fees and expenses of any underlying mutual funds or exchange-traded funds (ETFs) are not included in the Fund's expense ratio. The Fund indirectly bears its proportionate share of these expenses. For additional expense information related to investments in Fidelity Central Funds, please refer to the "Investments in Fidelity Central Funds" note found in the Notes to Financial Statements section of the most recent Annual or Semi-Annual report.
I Expense ratios reflect operating expenses of the class. Expenses before reductions do not reflect amounts reimbursed, waived, or reduced through arrangements with the investment adviser, brokerage services, or other offset arrangements, if applicable, and do not represent the amount paid by the class during periods when reimbursements, waivers or reductions occur.
J Annualized
K On certain classes, the size and fluctuation of net assets and expense amounts may cause ratios to differ from contractual rates.
L Amount does not include the portfolio activity of any underlying mutual funds or exchange-traded funds (ETFs).
See accompanying notes which are an integral part of the financial statements.
Fidelity Freedom Blend Income Fund
| Years ended March 31, | 2022 | 2021 | 2020 | 2019 A |
| Selected Per–Share Data | | | | |
| Net asset value, beginning of period | $10.93 | $9.98 | $10.03 | $10.00 |
| Income from Investment Operations | | | | |
| Net investment income (loss)B,C | .22 | .10 | .18 | .13 |
| Net realized and unrealized gain (loss) | (.31) | 1.12 | .01D | .07 |
| Total from investment operations | (.09) | 1.22 | .19 | .20 |
| Distributions from net investment income | (.23) | (.10) | (.17) | (.12) |
| Distributions from net realized gain | (.19) | (.17) | (.07) | (.05) |
| Total distributions | (.43)E | (.27) | (.24) | (.17) |
| Net asset value, end of period | $10.41 | $10.93 | $9.98 | $10.03 |
| Total ReturnF | (1.01)% | 12.29% | 1.83% | 2.04% |
| Ratios to Average Net AssetsC,G,H | | | | |
| Expenses before reductions | .46% | .46% | .46% | .46%I |
| Expenses net of fee waivers, if any | .46% | .46% | .46% | .46%I |
| Expenses net of all reductions | .46% | .46% | .46% | .46%I |
| Net investment income (loss) | 2.04% | .92% | 1.80% | 2.20%I |
| Supplemental Data | | | | |
| Net assets, end of period (000 omitted) | $5,424 | $5,977 | $2,729 | $378 |
| Portfolio turnover rateJ | 62% | 49% | 44% | 48%I |
A For the period August 31, 2018 (commencement of operations) through March 31, 2019.
B Calculated based on average shares outstanding during the period.
C Net investment income (loss) is affected by the timing of the declaration of dividends by any underlying mutual funds or exchange-traded funds (ETFs). Net investment income (loss) of any such underlying funds is not included in the Fund's net investment income (loss) ratio.
D The amount shown for a share outstanding does not correspond with the aggregate net gain (loss) on investments for the period due to the timing of sales and repurchases of shares in relation to fluctuating market values of the investments of the Fund.
E Total distributions per share do not sum due to rounding.
F Total returns for periods of less than one year are not annualized.
G Fees and expenses of any underlying mutual funds or exchange-traded funds (ETFs) are not included in the Fund's expense ratio. The Fund indirectly bears its proportionate share of these expenses. For additional expense information related to investments in Fidelity Central Funds, please refer to the "Investments in Fidelity Central Funds" note found in the Notes to Financial Statements section of the most recent Annual or Semi-Annual report.
H Expense ratios reflect operating expenses of the class. Expenses before reductions do not reflect amounts reimbursed, waived, or reduced through arrangements with the investment adviser, brokerage services, or other offset arrangements, if applicable, and do not represent the amount paid by the class during periods when reimbursements, waivers or reductions occur.
I Annualized
J Amount does not include the portfolio activity of any underlying mutual funds or exchange-traded funds (ETFs).
See accompanying notes which are an integral part of the financial statements.
Fidelity Freedom Blend Income Fund Class K
| Years ended March 31, | 2022 | 2021 | 2020 | 2019 A |
| Selected Per–Share Data | | | | |
| Net asset value, beginning of period | $10.94 | $9.99 | $10.04 | $10.00 |
| Income from Investment Operations | | | | |
| Net investment income (loss)B,C | .23 | .11 | .20 | .13 |
| Net realized and unrealized gain (loss) | (.32) | 1.12 | –D | .08 |
| Total from investment operations | (.09) | 1.23 | .20 | .21 |
| Distributions from net investment income | (.25) | (.11) | (.18) | (.12) |
| Distributions from net realized gain | (.19) | (.17) | (.07) | (.05) |
| Total distributions | (.44) | (.28) | (.25) | (.17) |
| Net asset value, end of period | $10.41 | $10.94 | $9.99 | $10.04 |
| Total ReturnE | (.99)% | 12.37% | 1.90% | 2.20% |
| Ratios to Average Net AssetsC,F,G | | | | |
| Expenses before reductions | .36% | .36% | .36% | .36%H |
| Expenses net of fee waivers, if any | .36% | .36% | .36% | .36%H |
| Expenses net of all reductions | .36% | .36% | .36% | .36%H |
| Net investment income (loss) | 2.14% | 1.02% | 1.90% | 2.30%H |
| Supplemental Data | | | | |
| Net assets, end of period (000 omitted) | $1,069 | $564 | $404 | $102 |
| Portfolio turnover rateI | 62% | 49% | 44% | 48%H |
A For the period August 31, 2018 (commencement of operations) through March 31, 2019.
B Calculated based on average shares outstanding during the period.
C Net investment income (loss) is affected by the timing of the declaration of dividends by any underlying mutual funds or exchange-traded funds (ETFs). Net investment income (loss) of any such underlying funds is not included in the Fund's net investment income (loss) ratio.
D Amount represents less than $.005 per share.
E Total returns for periods of less than one year are not annualized.
F Fees and expenses of any underlying mutual funds or exchange-traded funds (ETFs) are not included in the Fund's expense ratio. The Fund indirectly bears its proportionate share of these expenses. For additional expense information related to investments in Fidelity Central Funds, please refer to the "Investments in Fidelity Central Funds" note found in the Notes to Financial Statements section of the most recent Annual or Semi-Annual report.
G Expense ratios reflect operating expenses of the class. Expenses before reductions do not reflect amounts reimbursed, waived, or reduced through arrangements with the investment adviser, brokerage services, or other offset arrangements, if applicable, and do not represent the amount paid by the class during periods when reimbursements, waivers or reductions occur.
H Annualized
I Amount does not include the portfolio activity of any underlying mutual funds or exchange-traded funds (ETFs).
See accompanying notes which are an integral part of the financial statements.
Fidelity Freedom Blend Income Fund Class K6
| Years ended March 31, | 2022 | 2021 | 2020 | 2019 A |
| Selected Per–Share Data | | | | |
| Net asset value, beginning of period | $10.94 | $9.99 | $10.04 | $10.00 |
| Income from Investment Operations | | | | |
| Net investment income (loss)B,C | .25 | .12 | .21 | .14 |
| Net realized and unrealized gain (loss) | (.32) | 1.12 | –D | .08 |
| Total from investment operations | (.07) | 1.24 | .21 | .22 |
| Distributions from net investment income | (.26) | (.12) | (.19) | (.13) |
| Distributions from net realized gain | (.19) | (.17) | (.07) | (.05) |
| Total distributions | (.45) | (.29) | (.26) | (.18) |
| Net asset value, end of period | $10.42 | $10.94 | $9.99 | $10.04 |
| Total ReturnE | (.81)% | 12.50% | 1.97% | 2.24% |
| Ratios to Average Net AssetsC,F,G | | | | |
| Expenses before reductions | .26% | .26% | .26% | .26%H |
| Expenses net of fee waivers, if any | .26% | .26% | .26% | .26%H |
| Expenses net of all reductions | .26% | .26% | .26% | .26%H |
| Net investment income (loss) | 2.24% | 1.12% | 2.00% | 2.39%H |
| Supplemental Data | | | | |
| Net assets, end of period (000 omitted) | $35,899 | $51,220 | $38,898 | $1,658 |
| Portfolio turnover rateI | 62% | 49% | 44% | 48%H |
A For the period August 31, 2018 (commencement of operations) through March 31, 2019.
B Calculated based on average shares outstanding during the period.
C Net investment income (loss) is affected by the timing of the declaration of dividends by any underlying mutual funds or exchange-traded funds (ETFs). Net investment income (loss) of any such underlying funds is not included in the Fund's net investment income (loss) ratio.
D Amount represents less than $.005 per share.
E Total returns for periods of less than one year are not annualized.
F Fees and expenses of any underlying mutual funds or exchange-traded funds (ETFs) are not included in the Fund's expense ratio. The Fund indirectly bears its proportionate share of these expenses. For additional expense information related to investments in Fidelity Central Funds, please refer to the "Investments in Fidelity Central Funds" note found in the Notes to Financial Statements section of the most recent Annual or Semi-Annual report.
G Expense ratios reflect operating expenses of the class. Expenses before reductions do not reflect amounts reimbursed, waived, or reduced through arrangements with the investment adviser, brokerage services, or other offset arrangements, if applicable, and do not represent the amount paid by the class during periods when reimbursements, waivers or reductions occur.
H Annualized
I Amount does not include the portfolio activity of any underlying mutual funds or exchange-traded funds (ETFs).
See accompanying notes which are an integral part of the financial statements.
Fidelity Freedom Blend Income Fund Class I
| Years ended March 31, | 2022 | 2021 | 2020 | 2019 A |
| Selected Per–Share Data | | | | |
| Net asset value, beginning of period | $10.94 | $9.99 | $10.04 | $10.00 |
| Income from Investment Operations | | | | |
| Net investment income (loss)B,C | .22 | .10 | .19 | .13 |
| Net realized and unrealized gain (loss) | (.32) | 1.13 | (.01) | .08 |
| Total from investment operations | (.10) | 1.23 | .18 | .21 |
| Distributions from net investment income | (.24) | (.11) | (.17) | (.12) |
| Distributions from net realized gain | (.19) | (.17) | (.07) | (.05) |
| Total distributions | (.43) | (.28) | (.23)D | (.17) |
| Net asset value, end of period | $10.41 | $10.94 | $9.99 | $10.04 |
| Total ReturnE | (1.06)% | 12.32% | 1.76% | 2.14% |
| Ratios to Average Net AssetsC,F,G | | | | |
| Expenses before reductions | .46% | .46% | .46% | .46%H |
| Expenses net of fee waivers, if any | .46% | .46% | .46% | .46%H |
| Expenses net of all reductions | .46% | .46% | .46% | .46%H |
| Net investment income (loss) | 2.04% | .92% | 1.80% | 2.20%H |
| Supplemental Data | | | | |
| Net assets, end of period (000 omitted) | $2,512 | $749 | $242 | $102 |
| Portfolio turnover rateI | 62% | 49% | 44% | 48%H |
A For the period August 31, 2018 (commencement of operations) through March 31, 2019.
B Calculated based on average shares outstanding during the period.
C Net investment income (loss) is affected by the timing of the declaration of dividends by any underlying mutual funds or exchange-traded funds (ETFs). Net investment income (loss) of any such underlying funds is not included in the Fund's net investment income (loss) ratio.
D Total distributions per share do not sum due to rounding.
E Total returns for periods of less than one year are not annualized.
F Fees and expenses of any underlying mutual funds or exchange-traded funds (ETFs) are not included in the Fund's expense ratio. The Fund indirectly bears its proportionate share of these expenses. For additional expense information related to investments in Fidelity Central Funds, please refer to the "Investments in Fidelity Central Funds" note found in the Notes to Financial Statements section of the most recent Annual or Semi-Annual report.
G Expense ratios reflect operating expenses of the class. Expenses before reductions do not reflect amounts reimbursed, waived, or reduced through arrangements with the investment adviser, brokerage services, or other offset arrangements, if applicable, and do not represent the amount paid by the class during periods when reimbursements, waivers or reductions occur.
H Annualized
I Amount does not include the portfolio activity of any underlying mutual funds or exchange-traded funds (ETFs).
See accompanying notes which are an integral part of the financial statements.
Fidelity Freedom Blend Income Fund Premier Class
| Years ended March 31, | 2022 A |
| Selected Per–Share Data | |
| Net asset value, beginning of period | $11.01 |
| Income from Investment Operations | |
| Net investment income (loss)B,C | .37 |
| Net realized and unrealized gain (loss) | (.52) |
| Total from investment operations | (.15) |
| Distributions from net investment income | (.26) |
| Distributions from net realized gain | (.19) |
| Total distributions | (.45) |
| Net asset value, end of period | $10.41 |
| Total ReturnD | (1.52)% |
| Ratios to Average Net AssetsC,E,F | |
| Expenses before reductions | .24%G |
| Expenses net of fee waivers, if any | .24%G |
| Expenses net of all reductions | .24%G |
| Net investment income (loss) | 3.43%G |
| Supplemental Data | |
| Net assets, end of period (000 omitted) | $23,501 |
| Portfolio turnover rateH | 62% |
A For the period April 6, 2021 (commencement of sale of shares) through March 31, 2022.
B Calculated based on average shares outstanding during the period.
C Net investment income (loss) is affected by the timing of the declaration of dividends by any underlying mutual funds or exchange-traded funds (ETFs). Net investment income (loss) of any such underlying funds is not included in the Fund's net investment income (loss) ratio.
D Total returns for periods of less than one year are not annualized.
E Fees and expenses of any underlying mutual funds or exchange-traded funds (ETFs) are not included in the Fund's expense ratio. The Fund indirectly bears its proportionate share of these expenses. For additional expense information related to investments in Fidelity Central Funds, please refer to the "Investments in Fidelity Central Funds" note found in the Notes to Financial Statements section of the most recent Annual or Semi-Annual report.
F Expense ratios reflect operating expenses of the class. Expenses before reductions do not reflect amounts reimbursed, waived, or reduced through arrangements with the investment adviser, brokerage services, or other offset arrangements, if applicable, and do not represent the amount paid by the class during periods when reimbursements, waivers or reductions occur.
G Annualized
H Amount does not include the portfolio activity of any underlying mutual funds or exchange-traded funds (ETFs).
See accompanying notes which are an integral part of the financial statements.
Fidelity Freedom Blend Income Fund Class Z
| Years ended March 31, | 2022 | 2021 | 2020 | 2019 A |
| Selected Per–Share Data | | | | |
| Net asset value, beginning of period | $10.94 | $9.99 | $10.04 | $10.00 |
| Income from Investment Operations | | | | |
| Net investment income (loss)B,C | .23 | .11 | .20 | .13 |
| Net realized and unrealized gain (loss) | (.32) | 1.12 | (.01) | .08 |
| Total from investment operations | (.09) | 1.23 | .19 | .21 |
| Distributions from net investment income | (.25) | (.11) | (.18) | (.12) |
| Distributions from net realized gain | (.19) | (.17) | (.07) | (.05) |
| Total distributions | (.44) | (.28) | (.24)D | (.17) |
| Net asset value, end of period | $10.41 | $10.94 | $9.99 | $10.04 |
| Total ReturnE | (.97)% | 12.41% | 1.86% | 2.20% |
| Ratios to Average Net AssetsC,F,G | | | | |
| Expenses before reductions | .36% | .36% | .36% | .36%H |
| Expenses net of fee waivers, if any | .36% | .36% | .36% | .36%H |
| Expenses net of all reductions | .36% | .36% | .36% | .36%H |
| Net investment income (loss) | 2.14% | 1.02% | 1.90% | 2.30%H |
| Supplemental Data | | | | |
| Net assets, end of period (000 omitted) | $1,180 | $1,026 | $104 | $102 |
| Portfolio turnover rateI | 62% | 49% | 44% | 48%H |
A For the period August 31, 2018 (commencement of operations) through March 31, 2019.
B Calculated based on average shares outstanding during the period.
C Net investment income (loss) is affected by the timing of the declaration of dividends by any underlying mutual funds or exchange-traded funds (ETFs). Net investment income (loss) of any such underlying funds is not included in the Fund's net investment income (loss) ratio.
D Total distributions per share do not sum due to rounding.
E Total returns for periods of less than one year are not annualized.
F Fees and expenses of any underlying mutual funds or exchange-traded funds (ETFs) are not included in the Fund's expense ratio. The Fund indirectly bears its proportionate share of these expenses. For additional expense information related to investments in Fidelity Central Funds, please refer to the "Investments in Fidelity Central Funds" note found in the Notes to Financial Statements section of the most recent Annual or Semi-Annual report.
G Expense ratios reflect operating expenses of the class. Expenses before reductions do not reflect amounts reimbursed, waived, or reduced through arrangements with the investment adviser, brokerage services, or other offset arrangements, if applicable, and do not represent the amount paid by the class during periods when reimbursements, waivers or reductions occur.
H Annualized
I Amount does not include the portfolio activity of any underlying mutual funds or exchange-traded funds (ETFs).
See accompanying notes which are an integral part of the financial statements.
Fidelity Freedom Blend Income Fund Class Z6
| Years ended March 31, | 2022 | 2021 | 2020 | 2019 A |
| Selected Per–Share Data | | | | |
| Net asset value, beginning of period | $10.95 | $10.00 | $10.04 | $10.00 |
| Income from Investment Operations | | | | |
| Net investment income (loss)B,C | .24 | .12 | .21 | .14 |
| Net realized and unrealized gain (loss) | (.32) | 1.12 | –D | .08 |
| Total from investment operations | (.08) | 1.24 | .21 | .22 |
| Distributions from net investment income | (.26) | (.12) | (.18) | (.13) |
| Distributions from net realized gain | (.19) | (.17) | (.07) | (.05) |
| Total distributions | (.45) | (.29) | (.25) | (.18) |
| Net asset value, end of period | $10.42 | $10.95 | $10.00 | $10.04 |
| Total ReturnE | (.85)% | 12.47% | 2.04% | 2.23% |
| Ratios to Average Net AssetsC,F,G | | | | |
| Expenses before reductions | .26% | .26% | .26% | .26%H |
| Expenses net of fee waivers, if any | .26% | .26% | .26% | .26%H |
| Expenses net of all reductions | .26% | .26% | .26% | .26%H |
| Net investment income (loss) | 2.24% | 1.12% | 2.00% | 2.40%H |
| Supplemental Data | | | | |
| Net assets, end of period (000 omitted) | $16,068 | $196 | $154 | $102 |
| Portfolio turnover rateI | 62% | 49% | 44% | 48%H |
A For the period August 31, 2018 (commencement of operations) through March 31, 2019.
B Calculated based on average shares outstanding during the period.
C Net investment income (loss) is affected by the timing of the declaration of dividends by any underlying mutual funds or exchange-traded funds (ETFs). Net investment income (loss) of any such underlying funds is not included in the Fund's net investment income (loss) ratio.
D Amount represents less than $.005 per share.
E Total returns for periods of less than one year are not annualized.
F Fees and expenses of any underlying mutual funds or exchange-traded funds (ETFs) are not included in the Fund's expense ratio. The Fund indirectly bears its proportionate share of these expenses. For additional expense information related to investments in Fidelity Central Funds, please refer to the "Investments in Fidelity Central Funds" note found in the Notes to Financial Statements section of the most recent Annual or Semi-Annual report.
G Expense ratios reflect operating expenses of the class. Expenses before reductions do not reflect amounts reimbursed, waived, or reduced through arrangements with the investment adviser, brokerage services, or other offset arrangements, if applicable, and do not represent the amount paid by the class during periods when reimbursements, waivers or reductions occur.
H Annualized
I Amount does not include the portfolio activity of any underlying mutual funds or exchange-traded funds (ETFs).
See accompanying notes which are an integral part of the financial statements.
Fidelity Freedom® Blend 2005 Fund
Investment Summary (Unaudited)
The information in the following tables is based on the direct investments of the Fund.
Top Holdings as of March 31, 2022
| | % of fund's net assets |
| Fidelity Series 0-5 Year Inflation-Protected Bond Index Fund | 14.6 |
| Fidelity Series Investment Grade Bond Fund | 11.6 |
| Fidelity Series Government Bond Index Fund | 11.0 |
| Fidelity Series Investment Grade Securitized Fund | 8.1 |
| Fidelity Series Corporate Bond Fund | 7.9 |
| Fidelity Series Treasury Bill Index Fund | 7.1 |
| Fidelity Series Emerging Markets Opportunities Fund | 5.9 |
| Fidelity Series Long-Term Treasury Bond Index Fund | 3.7 |
| Fidelity Series International Developed Markets Bond Index Fund | 3.2 |
| Fidelity Series Short-Term Credit Fund | 2.4 |
| | 75.5 |
Asset Allocation (% of fund's net assets)
| Period end |
| | Domestic Equity Funds | 8.8% |
| | International Equity Funds | 14.9% |
| | Bond Funds | 64.5% |
| | Short-Term Funds | 11.8% |

Domestic Equity Funds category includes Fidelity Series Commodity Strategy Fund which invests in commodity-related investments.
Fidelity Freedom® Blend 2005 Fund
Schedule of Investments March 31, 2022
Showing Percentage of Net Assets
| Domestic Equity Funds - 8.8% | | | |
| | | Shares | Value |
| Fidelity Series Blue Chip Growth Fund (a) | | 28,329 | $407,093 |
| Fidelity Series Commodity Strategy Fund (a) | | 72,791 | 371,961 |
| Fidelity Series Large Cap Growth Index Fund (a) | | 14,577 | 256,557 |
| Fidelity Series Large Cap Stock Fund (a) | | 15,056 | 286,208 |
| Fidelity Series Large Cap Value Index Fund (a) | | 35,702 | 548,387 |
| Fidelity Series Small Cap Opportunities Fund (a) | | 10,117 | 137,799 |
| Fidelity Series Value Discovery Fund (a) | | 12,662 | 202,595 |
| TOTAL DOMESTIC EQUITY FUNDS | | | |
| (Cost $1,741,829) | | | 2,210,600 |
|
| International Equity Funds - 14.9% | | | |
| Fidelity Series Canada Fund (a) | | 15,907 | 246,872 |
| Fidelity Series Emerging Markets Fund (a) | | 17,856 | 165,705 |
| Fidelity Series Emerging Markets Opportunities Fund (a) | | 81,124 | 1,492,686 |
| Fidelity Series International Growth Fund (a) | | 29,726 | 492,862 |
| Fidelity Series International Index Fund (a) | | 18,338 | 209,786 |
| Fidelity Series International Small Cap Fund (a) | | 8,550 | 153,475 |
| Fidelity Series International Value Fund (a) | | 45,136 | 497,852 |
| Fidelity Series Overseas Fund (a) | | 39,269 | 495,581 |
| TOTAL INTERNATIONAL EQUITY FUNDS | | | |
| (Cost $3,568,646) | | | 3,754,819 |
|
| Bond Funds - 64.5% | | | |
| Fidelity Series 0-5 Year Inflation-Protected Bond Index Fund (a) | | 366,154 | 3,672,524 |
| Fidelity Series 5+ Year Inflation-Protected Bond Index Fund (a) | | 18,856 | 181,022 |
| Fidelity Series Corporate Bond Fund (a) | | 196,363 | 1,983,265 |
| Fidelity Series Emerging Markets Debt Fund (a) | | 15,749 | 129,929 |
| Fidelity Series Emerging Markets Debt Local Currency Fund (a) | | 4,702 | 42,364 |
| Fidelity Series Floating Rate High Income Fund (a) | | 2,769 | 25,451 |
| Fidelity Series Government Bond Index Fund (a) | | 277,968 | 2,774,121 |
| Fidelity Series High Income Fund (a) | | 16,645 | 151,304 |
| Fidelity Series Inflation-Protected Bond Index Fund (a) | | 47,142 | 478,486 |
| Fidelity Series International Developed Markets Bond Index Fund (a) | | 85,278 | 795,641 |
| Fidelity Series Investment Grade Bond Fund (a) | | 267,443 | 2,917,804 |
| Fidelity Series Investment Grade Securitized Fund (a) | | 210,315 | 2,044,258 |
| Fidelity Series Long-Term Treasury Bond Index Fund (a) | | 123,790 | 943,277 |
| Fidelity Series Real Estate Income Fund (a) | | 8,193 | 93,070 |
| TOTAL BOND FUNDS | | | |
| (Cost $16,836,565) | | | 16,232,516 |
|
| Short-Term Funds - 11.8% | | | |
| Fidelity Series Government Money Market Fund 0.31% (a)(b) | | 591,814 | 591,814 |
| Fidelity Series Short-Term Credit Fund (a) | | 60,814 | 592,940 |
| Fidelity Series Treasury Bill Index Fund (a) | | 177,736 | 1,775,587 |
| TOTAL SHORT-TERM FUNDS | | | |
| (Cost $2,975,389) | | | 2,960,341 |
| TOTAL INVESTMENT IN SECURITIES - 100.0% | | | |
| (Cost $25,122,429) | | | 25,158,276 |
| NET OTHER ASSETS (LIABILITIES) - 0.0% | | | (437) |
| NET ASSETS - 100% | | | $25,157,839 |
Legend
(a) Affiliated Fund
(b) The rate quoted is the annualized seven-day yield of the fund at period end.
Affiliated Central Funds
Fiscal year to date information regarding the Fund's investments in Fidelity Central Funds, including the ownership percentage, is presented below.
| Fund | Value, beginning of period | Purchases | Sales Proceeds | Dividend Income | Realized Gain/Loss | Change in Unrealized appreciation (depreciation) | Value, end of period | % ownership, end of period |
| Fidelity Cash Central Fund 0.31% | $49 | $100,242 | $100,291 | $-- | $-- | $-- | $-- | 0.0% |
| Total | $49 | $100,242 | $100,291 | $-- | $-- | $-- | $-- | |
Amounts in the income column in the above table include any capital gain distributions from underlying funds, which are presented in the corresponding line-item in the Statement of Operations, if applicable.
Affiliated Underlying Funds
Fiscal year to date information regarding the Fund's investments in affiliated Underlying Funds is presented below. Exchanges between classes of the same affiliated Underlying Funds may occur. If an underlying Fund changes its name, the name presented below is the name in effect at period end.
| Affiliate | Value, beginning of period | Purchases(a) | Sales Proceeds(a) | Dividend Income | Realized Gain (loss) | Change in Unrealized appreciation (depreciation) | Value, end of period |
| Fidelity Series 0-5 Year Inflation-Protected Bond Index Fund | $-- | $4,239,639 | $559,005 | $14,395 | $(1,840) | $(4,133) | $3,672,524 |
| Fidelity Series 5+ Year Inflation-Protected Bond Index Fund | -- | 833,796 | 642,076 | 2,755 | (8,943) | (1,755) | 181,022 |
| Fidelity Series Blue Chip Growth Fund | 476,733 | 419,205 | 405,384 | 107,556 | (1,527) | (81,934) | 407,093 |
| Fidelity Series Canada Fund | 147,790 | 145,441 | 84,933 | 5,334 | 1,594 | 36,980 | 246,872 |
| Fidelity Series Commodity Strategy Fund | 655,440 | 475,142 | 779,532 | 230,014 | (12,871) | 33,782 | 371,961 |
| Fidelity Series Corporate Bond Fund | 1,917,388 | 973,666 | 755,617 | 60,237 | (14,849) | (137,323) | 1,983,265 |
| Fidelity Series Emerging Markets Debt Fund | 129,119 | 65,820 | 51,306 | 6,471 | (1,330) | (12,374) | 129,929 |
| Fidelity Series Emerging Markets Debt Local Currency Fund | 43,159 | 21,776 | 17,267 | 1,896 | (610) | (4,694) | 42,364 |
| Fidelity Series Emerging Markets Fund | 181,564 | 112,919 | 89,600 | 5,815 | (1,227) | (37,951) | 165,705 |
| Fidelity Series Emerging Markets Opportunities Fund | 1,632,306 | 1,254,047 | 884,731 | 187,921 | (9,724) | (499,212) | 1,492,686 |
| Fidelity Series Floating Rate High Income Fund | 26,011 | 12,228 | 12,780 | 1,207 | (11) | 3 | 25,451 |
| Fidelity Series Government Bond Index Fund | 2,364,080 | 1,384,432 | 833,199 | 29,783 | (18,469) | (122,723) | 2,774,121 |
| Fidelity Series Government Money Market Fund 0.31% | 1,625,448 | 430,106 | 1,463,740 | 941 | -- | -- | 591,814 |
| Fidelity Series High Income Fund | 149,847 | 73,757 | 66,801 | 8,933 | (922) | (4,577) | 151,304 |
| Fidelity Series Inflation-Protected Bond Index Fund | 2,650,228 | 989,394 | 3,153,212 | 133,248 | 137,127 | (145,051) | 478,486 |
| Fidelity Series International Developed Markets Bond Index Fund | -- | 957,039 | 124,860 | 294 | (2,180) | (34,358) | 795,641 |
| Fidelity Series International Growth Fund | 363,454 | 398,032 | 212,053 | 43,407 | (6,526) | (50,045) | 492,862 |
| Fidelity Series International Index Fund | 151,737 | 148,338 | 81,880 | 5,738 | (558) | (7,851) | 209,786 |
| Fidelity Series International Small Cap Fund | 131,074 | 113,873 | 62,674 | 22,667 | (1,993) | (26,805) | 153,475 |
| Fidelity Series International Value Fund | 363,042 | 362,991 | 230,169 | 27,230 | (20) | 2,008 | 497,852 |
| Fidelity Series Investment Grade Bond Fund | 2,623,900 | 1,396,176 | 931,460 | 67,034 | (18,669) | (152,143) | 2,917,804 |
| Fidelity Series Investment Grade Securitized Fund | 1,838,406 | 963,192 | 635,576 | 17,980 | (9,620) | (112,144) | 2,044,258 |
| Fidelity Series Large Cap Growth Index Fund | 300,850 | 187,880 | 271,107 | 9,991 | 31,514 | 7,420 | 256,557 |
| Fidelity Series Large Cap Stock Fund | 328,463 | 185,057 | 237,428 | 31,999 | 11,050 | (934) | 286,208 |
| Fidelity Series Large Cap Value Index Fund | 627,382 | 388,858 | 496,476 | 45,050 | 19,208 | 9,415 | 548,387 |
| Fidelity Series Long-Term Treasury Bond Index Fund | 645,904 | 662,744 | 336,174 | 18,542 | (23,560) | (5,637) | 943,277 |
| Fidelity Series Overseas Fund | 364,074 | 366,005 | 221,130 | 16,078 | 1,496 | (14,864) | 495,581 |
| Fidelity Series Real Estate Income Fund | 89,763 | 42,222 | 41,285 | 4,006 | 26 | 2,344 | 93,070 |
| Fidelity Series Short-Term Credit Fund | 801,629 | 494,672 | 669,263 | 15,931 | (,8522) | (25,576) | 592,940 |
| Fidelity Series Small Cap Opportunities Fund | 158,699 | 131,894 | 113,964 | 43,573 | (1,784) | (37,046) | 137,799 |
| Fidelity Series Treasury Bill Index Fund | 2,578,151 | 1,553,197 | 2,353,574 | 2,355 | (949) | (1,238) | 1,775,587 |
| Fidelity Series Value Discovery Fund | 231,808 | 134,170 | 165,097 | 28,304 | 6,799 | (5,085) | 202,595 |
| Total | $23,597,449 | $19,917,708 | $16,983,353 | $1,196,685 | $62,110 | $(1,433,501) | $25,158,276 |
(a) Includes the value of shares purchased or redeemed through in-kind transactions, if applicable.
Amounts in the income column in the above table include any capital gain distributions from underlying funds, which are presented in the corresponding line-item in the Statement of Operations, if applicable.
Investment Valuation
The following is a summary of the inputs used, as of March 31, 2022, involving the Fund's assets and liabilities carried at fair value. The inputs or methodology used for valuing securities may not be an indication of the risk associated with investing in those securities. For more information on valuation inputs, and their aggregation into the levels used below, please refer to the Investment Valuation section in the accompanying Notes to Financial Statements.
| | Valuation Inputs at Reporting Date: |
| Description | Total | Level 1 | Level 2 | Level 3 |
| Investments in Securities: | | | | |
| Domestic Equity Funds | $2,210,600 | $2,210,600 | $-- | $-- |
| International Equity Funds | 3,754,819 | 3,754,819 | -- | -- |
| Bond Funds | 16,232,516 | 16,232,516 | -- | -- |
| Short-Term Funds | 2,960,341 | 2,960,341 | -- | -- |
| Total Investments in Securities: | $25,158,276 | $25,158,276 | $-- | $-- |
See accompanying notes which are an integral part of the financial statements.
Fidelity Freedom® Blend 2005 Fund
Financial Statements
Statement of Assets and Liabilities
| | | March 31, 2022 |
| Assets | | |
Investment in securities, at value — See accompanying schedule:
| | |
| Affiliated issuers (cost $25,122,429) | $25,158,276 | |
| Total Investment in Securities (cost $25,122,429) | | $25,158,276 |
| Cash | | 242 |
| Receivable for investments sold | | 798,699 |
| Receivable for fund shares sold | | 10,991 |
| Total assets | | 25,968,208 |
| Liabilities | | |
| Payable for investments purchased | $673,228 | |
| Payable for fund shares redeemed | 130,776 | |
| Accrued management fee | 5,985 | |
| Distribution and service plan fees payable | 380 | |
| Total liabilities | | 810,369 |
| Net Assets | | $25,157,839 |
| Net Assets consist of: | | |
| Paid in capital | | $24,951,636 |
| Total accumulated earnings (loss) | | 206,203 |
| Net Assets | | $25,157,839 |
| Net Asset Value and Maximum Offering Price | | |
| Class A: | | |
| Net Asset Value and redemption price per share ($400,725 ÷ 38,372 shares)(a) | | $10.44 |
| Maximum offering price per share (100/94.25 of $10.44) | | $11.08 |
| Class M: | | |
| Net Asset Value and redemption price per share ($132,509 ÷ 12,714 shares)(a) | | $10.42 |
| Maximum offering price per share (100/96.50 of $10.42) | | $10.80 |
| Class C: | | |
| Net Asset Value and offering price per share ($273,753 ÷ 26,420 shares)(a) | | $10.36 |
| Fidelity Freedom Blend 2005 Fund: | | |
| Net Asset Value, offering price and redemption price per share ($1,756,901 ÷ 168,095 shares) | | $10.45 |
| Class K: | | |
| Net Asset Value, offering price and redemption price per share ($413,591 ÷ 39,539 shares) | | $10.46 |
| Class K6: | | |
| Net Asset Value, offering price and redemption price per share ($9,529,465 ÷ 909,560 shares) | | $10.48 |
| Class I: | | |
| Net Asset Value, offering price and redemption price per share ($597,687 ÷ 57,216 shares) | | $10.45 |
| Class Z: | | |
| Net Asset Value, offering price and redemption price per share ($153,263 ÷ 14,629 shares) | | $10.48 |
| Class Z6: | | |
| Net Asset Value, offering price and redemption price per share ($2,238,483 ÷ 213,739 shares) | | $10.47 |
| Premier Class: | | |
| Net Asset Value, offering price and redemption price per share ($9,661,462 ÷ 923,443 shares) | | $10.46 |
(a) Redemption price per share is equal to net asset value less any applicable contingent deferred sales charge.
See accompanying notes which are an integral part of the financial statements.
Statement of Operations
| | | Year ended March 31, 2022 |
| Investment Income | | |
| Dividends: | | |
| Affiliated issuers | | $715,412 |
| Expenses | | |
| Management fee | $75,401 | |
| Distribution and service plan fees | 5,182 | |
| Independent trustees' fees and expenses | 78 | |
| Total expenses | | 80,661 |
| Net investment income (loss) | | 634,751 |
| Realized and Unrealized Gain (Loss) | | |
| Net realized gain (loss) on: | | |
| Investment securities: | | |
| Affiliated issuers | 62,110 | |
| Capital gain distributions from underlying funds: | | |
| Affiliated issuers | 481,273 | |
| Total net realized gain (loss) | | 543,383 |
| Change in net unrealized appreciation (depreciation) on: | | |
| Investment securities: | | |
| Affiliated issuers | (1,433,501) | |
| Total change in net unrealized appreciation (depreciation) | | (1,433,501) |
| Net gain (loss) | | (890,118) |
| Net increase (decrease) in net assets resulting from operations | | $(255,367) |
See accompanying notes which are an integral part of the financial statements.
Statement of Changes in Net Assets
| | Year ended March 31, 2022 | Year ended March 31, 2021 |
| Increase (Decrease) in Net Assets | | |
| Operations | | |
| Net investment income (loss) | $634,751 | $219,639 |
| Net realized gain (loss) | 543,383 | 663,962 |
| Change in net unrealized appreciation (depreciation) | (1,433,501) | 1,798,696 |
| Net increase (decrease) in net assets resulting from operations | (255,367) | 2,682,297 |
| Distributions to shareholders | (1,227,422) | (648,692) |
| Share transactions - net increase (decrease) | 3,048,977 | 6,720,025 |
| Total increase (decrease) in net assets | 1,566,188 | 8,753,630 |
| Net Assets | | |
| Beginning of period | 23,591,651 | 14,838,021 |
| End of period | $25,157,839 | $23,591,651 |
See accompanying notes which are an integral part of the financial statements.
Financial Highlights
Fidelity Freedom Blend 2005 Fund Class A
| Years ended March 31, | 2022 | 2021 | 2020 | 2019 A |
| Selected Per–Share Data | | | | |
| Net asset value, beginning of period | $11.02 | $9.85 | $9.99 | $10.00 |
| Income from Investment Operations | | | | |
| Net investment income (loss)B,C | .19 | .07 | .16 | .11 |
| Net realized and unrealized gain (loss) | (.29) | 1.39 | (.08) | .04 |
| Total from investment operations | (.10) | 1.46 | .08 | .15 |
| Distributions from net investment income | (.22) | (.07) | (.13) | (.10) |
| Distributions from net realized gain | (.27) | (.21) | (.09) | (.07) |
| Total distributions | (.48)D | (.29)D | (.22) | (.16)D |
| Net asset value, end of period | $10.44 | $11.02 | $9.85 | $9.99 |
| Total ReturnE,F | (1.07)% | 14.84% | .68% | 1.62% |
| Ratios to Average Net AssetsC,G,H | | | | |
| Expenses before reductions | .71% | .71% | .71% | .71%I |
| Expenses net of fee waivers, if any | .71% | .71% | .71% | .71%I |
| Expenses net of all reductions | .71% | .71% | .71% | .71%I |
| Net investment income (loss) | 1.69% | .67% | 1.56% | 1.88%I |
| Supplemental Data | | | | |
| Net assets, end of period (000 omitted) | $401 | $351 | $263 | $187 |
| Portfolio turnover rateJ | 65% | 45% | 64% | 11%I |
A For the period August 31, 2018 (commencement of operations) through March 31, 2019.
B Calculated based on average shares outstanding during the period.
C Net investment income (loss) is affected by the timing of the declaration of dividends by any underlying mutual funds or exchange-traded funds (ETFs). Net investment income (loss) of any such underlying funds is not included in the Fund's net investment income (loss) ratio.
D Total distributions per share do not sum due to rounding.
E Total returns for periods of less than one year are not annualized.
F Total returns do not include the effect of the sales charges.
G Fees and expenses of any underlying mutual funds or exchange-traded funds (ETFs) are not included in the Fund's expense ratio. The Fund indirectly bears its proportionate share of these expenses.
H Expense ratios reflect operating expenses of the class. Expenses before reductions do not reflect amounts reimbursed, waived, or reduced through arrangements with the investment adviser, brokerage services, or other offset arrangements, if applicable, and do not represent the amount paid by the class during periods when reimbursements, waivers or reductions occur.
I Annualized
J Amount does not include the portfolio activity of any underlying mutual funds or exchange-traded funds (ETFs).
See accompanying notes which are an integral part of the financial statements.
Fidelity Freedom Blend 2005 Fund Class M
| Years ended March 31, | 2022 | 2021 | 2020 | 2019 A |
| Selected Per–Share Data | | | | |
| Net asset value, beginning of period | $11.02 | $9.85 | $9.99 | $10.00 |
| Income from Investment Operations | | | | |
| Net investment income (loss)B,C | .16 | .05 | .13 | .09 |
| Net realized and unrealized gain (loss) | (.28) | 1.38 | (.07) | .05 |
| Total from investment operations | (.12) | 1.43 | .06 | .14 |
| Distributions from net investment income | (.21) | (.05) | (.11) | (.08) |
| Distributions from net realized gain | (.26) | (.21) | (.09) | (.07) |
| Total distributions | (.48)D | (.26) | (.20) | (.15) |
| Net asset value, end of period | $10.42 | $11.02 | $9.85 | $9.99 |
| Total ReturnE,F | (1.32)% | 14.58% | .45% | 1.43% |
| Ratios to Average Net AssetsC,G,H | | | | |
| Expenses before reductions | .96% | .96% | .96% | .96%I |
| Expenses net of fee waivers, if any | .96% | .96% | .96% | .96%I |
| Expenses net of all reductions | .96% | .96% | .96% | .96%I |
| Net investment income (loss) | 1.44% | .43% | 1.31% | 1.63%I |
| Supplemental Data | | | | |
| Net assets, end of period (000 omitted) | $133 | $148 | $108 | $101 |
| Portfolio turnover rateJ | 65% | 45% | 64% | 11%I |
A For the period August 31, 2018 (commencement of operations) through March 31, 2019.
B Calculated based on average shares outstanding during the period.
C Net investment income (loss) is affected by the timing of the declaration of dividends by any underlying mutual funds or exchange-traded funds (ETFs). Net investment income (loss) of any such underlying funds is not included in the Fund's net investment income (loss) ratio.
D Total distributions per share do not sum due to rounding.
E Total returns for periods of less than one year are not annualized.
F Total returns do not include the effect of the sales charges.
G Fees and expenses of any underlying mutual funds or exchange-traded funds (ETFs) are not included in the Fund's expense ratio. The Fund indirectly bears its proportionate share of these expenses.
H Expense ratios reflect operating expenses of the class. Expenses before reductions do not reflect amounts reimbursed, waived, or reduced through arrangements with the investment adviser, brokerage services, or other offset arrangements, if applicable, and do not represent the amount paid by the class during periods when reimbursements, waivers or reductions occur.
I Annualized
J Amount does not include the portfolio activity of any underlying mutual funds or exchange-traded funds (ETFs).
See accompanying notes which are an integral part of the financial statements.
Fidelity Freedom Blend 2005 Fund Class C
| Years ended March 31, | 2022 | 2021 | 2020 | 2019 A |
| Selected Per–Share Data | | | | |
| Net asset value, beginning of period | $10.94 | $9.81 | $9.98 | $10.00 |
| Income from Investment Operations | | | | |
| Net investment income (loss)B,C | .10 | (.01) | .08 | .06 |
| Net realized and unrealized gain (loss) | (.28) | 1.38 | (.08) | .05 |
| Total from investment operations | (.18) | 1.37 | – | .11 |
| Distributions from net investment income | (.15) | (.03) | (.08) | (.06) |
| Distributions from net realized gain | (.25) | (.21) | (.09) | (.07) |
| Total distributions | (.40) | (.24) | (.17) | (.13) |
| Net asset value, end of period | $10.36 | $10.94 | $9.81 | $9.98 |
| Total ReturnD,E | (1.85)% | 14.06% | (.07)% | 1.15% |
| Ratios to Average Net AssetsC,F,G | | | | |
| Expenses before reductions | 1.46% | 1.46% | 1.46% | 1.46%H |
| Expenses net of fee waivers, if any | 1.46% | 1.46% | 1.46% | 1.46%H |
| Expenses net of all reductions | 1.46% | 1.46% | 1.46% | 1.46%H |
| Net investment income (loss) | .94% | (.08)% | .81% | 1.13%H |
| Supplemental Data | | | | |
| Net assets, end of period (000 omitted) | $274 | $320 | $256 | $101 |
| Portfolio turnover rateI | 65% | 45% | 64% | 11%H |
A For the period August 31, 2018 (commencement of operations) through March 31, 2019.
B Calculated based on average shares outstanding during the period.
C Net investment income (loss) is affected by the timing of the declaration of dividends by any underlying mutual funds or exchange-traded funds (ETFs). Net investment income (loss) of any such underlying funds is not included in the Fund's net investment income (loss) ratio.
D Total returns for periods of less than one year are not annualized.
E Total returns do not include the effect of the contingent deferred sales charge.
F Fees and expenses of any underlying mutual funds or exchange-traded funds (ETFs) are not included in the Fund's expense ratio. The Fund indirectly bears its proportionate share of these expenses.
G Expense ratios reflect operating expenses of the class. Expenses before reductions do not reflect amounts reimbursed, waived, or reduced through arrangements with the investment adviser, brokerage services, or other offset arrangements, if applicable, and do not represent the amount paid by the class during periods when reimbursements, waivers or reductions occur.
H Annualized
I Amount does not include the portfolio activity of any underlying mutual funds or exchange-traded funds (ETFs).
See accompanying notes which are an integral part of the financial statements.
Fidelity Freedom Blend 2005 Fund
| Years ended March 31, | 2022 | 2021 | 2020 | 2019 A |
| Selected Per–Share Data | | | | |
| Net asset value, beginning of period | $11.03 | $9.87 | $10.01 | $10.00 |
| Income from Investment Operations | | | | |
| Net investment income (loss)B,C | .22 | .10 | .19 | .12 |
| Net realized and unrealized gain (loss) | (.29) | 1.39 | (.08) | .05 |
| Total from investment operations | (.07) | 1.49 | .11 | .17 |
| Distributions from net investment income | (.24) | (.11) | (.15) | (.10) |
| Distributions from net realized gain | (.27) | (.21) | (.10) | (.07) |
| Total distributions | (.51) | (.33)D | (.25) | (.16)D |
| Net asset value, end of period | $10.45 | $11.03 | $9.87 | $10.01 |
| Total ReturnE | (.85)% | 15.13% | .94% | 1.80% |
| Ratios to Average Net AssetsC,F,G | | | | |
| Expenses before reductions | .46% | .46% | .46% | .46%H |
| Expenses net of fee waivers, if any | .46% | .46% | .46% | .46%H |
| Expenses net of all reductions | .46% | .46% | .46% | .46%H |
| Net investment income (loss) | 1.94% | .92% | 1.81% | 2.13%H |
| Supplemental Data | | | | |
| Net assets, end of period (000 omitted) | $1,757 | $2,030 | $1,126 | $111 |
| Portfolio turnover rateI | 65% | 45% | 64% | 11%H |
A For the period August 31, 2018 (commencement of operations) through March 31, 2019.
B Calculated based on average shares outstanding during the period.
C Net investment income (loss) is affected by the timing of the declaration of dividends by any underlying mutual funds or exchange-traded funds (ETFs). Net investment income (loss) of any such underlying funds is not included in the Fund's net investment income (loss) ratio.
D Total distributions per share do not sum due to rounding.
E Total returns for periods of less than one year are not annualized.
F Fees and expenses of any underlying mutual funds or exchange-traded funds (ETFs) are not included in the Fund's expense ratio. The Fund indirectly bears its proportionate share of these expenses.
G Expense ratios reflect operating expenses of the class. Expenses before reductions do not reflect amounts reimbursed, waived, or reduced through arrangements with the investment adviser, brokerage services, or other offset arrangements, if applicable, and do not represent the amount paid by the class during periods when reimbursements, waivers or reductions occur.
H Annualized
I Amount does not include the portfolio activity of any underlying mutual funds or exchange-traded funds (ETFs).
See accompanying notes which are an integral part of the financial statements.
Fidelity Freedom Blend 2005 Fund Class K
| Years ended March 31, | 2022 | 2021 | 2020 | 2019 A |
| Selected Per–Share Data | | | | |
| Net asset value, beginning of period | $11.04 | $9.88 | $10.01 | $10.00 |
| Income from Investment Operations | | | | |
| Net investment income (loss)B,C | .23 | .11 | .20 | .13 |
| Net realized and unrealized gain (loss) | (.29) | 1.39 | (.08) | .04 |
| Total from investment operations | (.06) | 1.50 | .12 | .17 |
| Distributions from net investment income | (.25) | (.13) | (.16) | (.10) |
| Distributions from net realized gain | (.27) | (.21) | (.09) | (.07) |
| Total distributions | (.52) | (.34) | (.25) | (.16)D |
| Net asset value, end of period | $10.46 | $11.04 | $9.88 | $10.01 |
| Total ReturnE | (.75)% | 15.26% | 1.06% | 1.83% |
| Ratios to Average Net AssetsC,F,G | | | | |
| Expenses before reductions | .36% | .36% | .36% | .36%H |
| Expenses net of fee waivers, if any | .36% | .36% | .36% | .36%H |
| Expenses net of all reductions | .36% | .36% | .36% | .36%H |
| Net investment income (loss) | 2.04% | 1.02% | 1.91% | 2.23%H |
| Supplemental Data | | | | |
| Net assets, end of period (000 omitted) | $414 | $459 | $178 | $102 |
| Portfolio turnover rateI | 65% | 45% | 64% | 11%H |
A For the period August 31, 2018 (commencement of operations) through March 31, 2019.
B Calculated based on average shares outstanding during the period.
C Net investment income (loss) is affected by the timing of the declaration of dividends by any underlying mutual funds or exchange-traded funds (ETFs). Net investment income (loss) of any such underlying funds is not included in the Fund's net investment income (loss) ratio.
D Total distributions per share do not sum due to rounding.
E Total returns for periods of less than one year are not annualized.
F Fees and expenses of any underlying mutual funds or exchange-traded funds (ETFs) are not included in the Fund's expense ratio. The Fund indirectly bears its proportionate share of these expenses.
G Expense ratios reflect operating expenses of the class. Expenses before reductions do not reflect amounts reimbursed, waived, or reduced through arrangements with the investment adviser, brokerage services, or other offset arrangements, if applicable, and do not represent the amount paid by the class during periods when reimbursements, waivers or reductions occur.
H Annualized
I Amount does not include the portfolio activity of any underlying mutual funds or exchange-traded funds (ETFs).
See accompanying notes which are an integral part of the financial statements.
Fidelity Freedom Blend 2005 Fund Class K6
| Years ended March 31, | 2022 | 2021 | 2020 | 2019 A |
| Selected Per–Share Data | | | | |
| Net asset value, beginning of period | $11.05 | $9.88 | $10.01 | $10.00 |
| Income from Investment Operations | | | | |
| Net investment income (loss)B,C | .24 | .12 | .21 | .13 |
| Net realized and unrealized gain (loss) | (.29) | 1.39 | (.08) | .05 |
| Total from investment operations | (.05) | 1.51 | .13 | .18 |
| Distributions from net investment income | (.26) | (.13) | (.17) | (.10) |
| Distributions from net realized gain | (.27) | (.21) | (.10) | (.07) |
| Total distributions | (.52)D | (.34) | (.26)D | (.17) |
| Net asset value, end of period | $10.48 | $11.05 | $9.88 | $10.01 |
| Total ReturnE | (.62)% | 15.38% | 1.19% | 1.86% |
| Ratios to Average Net AssetsC,F,G | | | | |
| Expenses before reductions | .26% | .26% | .26% | .26%H |
| Expenses net of fee waivers, if any | .26% | .26% | .26% | .26%H |
| Expenses net of all reductions | .26% | .26% | .26% | .26%H |
| Net investment income (loss) | 2.14% | 1.12% | 2.01% | 2.32%H |
| Supplemental Data | | | | |
| Net assets, end of period (000 omitted) | $9,529 | $19,122 | $12,005 | $1,177 |
| Portfolio turnover rateI | 65% | 45% | 64% | 11%H |
A For the period August 31, 2018 (commencement of operations) through March 31, 2019.
B Calculated based on average shares outstanding during the period.
C Net investment income (loss) is affected by the timing of the declaration of dividends by any underlying mutual funds or exchange-traded funds (ETFs). Net investment income (loss) of any such underlying funds is not included in the Fund's net investment income (loss) ratio.
D Total distributions per share do not sum due to rounding.
E Total returns for periods of less than one year are not annualized.
F Fees and expenses of any underlying mutual funds or exchange-traded funds (ETFs) are not included in the Fund's expense ratio. The Fund indirectly bears its proportionate share of these expenses.
G Expense ratios reflect operating expenses of the class. Expenses before reductions do not reflect amounts reimbursed, waived, or reduced through arrangements with the investment adviser, brokerage services, or other offset arrangements, if applicable, and do not represent the amount paid by the class during periods when reimbursements, waivers or reductions occur.
H Annualized
I Amount does not include the portfolio activity of any underlying mutual funds or exchange-traded funds (ETFs).
See accompanying notes which are an integral part of the financial statements.
Fidelity Freedom Blend 2005 Fund Class I
| Years ended March 31, | 2022 | 2021 | 2020 | 2019 A |
| Selected Per–Share Data | | | | |
| Net asset value, beginning of period | $11.03 | $9.86 | $10.01 | $10.00 |
| Income from Investment Operations | | | | |
| Net investment income (loss)B,C | .22 | .10 | .19 | .12 |
| Net realized and unrealized gain (loss) | (.29) | 1.40 | (.09) | .05 |
| Total from investment operations | (.07) | 1.50 | .10 | .17 |
| Distributions from net investment income | (.24) | (.11) | (.16) | (.10) |
| Distributions from net realized gain | (.27) | (.21) | (.09) | (.07) |
| Total distributions | (.51) | (.33)D | (.25) | (.16)D |
| Net asset value, end of period | $10.45 | $11.03 | $9.86 | $10.01 |
| Total ReturnE | (.83)% | 15.24% | .86% | 1.80% |
| Ratios to Average Net AssetsC,F,G | | | | |
| Expenses before reductions | .46% | .46% | .46% | .46%H |
| Expenses net of fee waivers, if any | .46% | .46% | .46% | .46%H |
| Expenses net of all reductions | .46% | .46% | .46% | .46%H |
| Net investment income (loss) | 1.94% | .92% | 1.81% | 2.13%H |
| Supplemental Data | | | | |
| Net assets, end of period (000 omitted) | $598 | $853 | $691 | $102 |
| Portfolio turnover rateI | 65% | 45% | 64% | 11%H |
A For the period August 31, 2018 (commencement of operations) through March 31, 2019.
B Calculated based on average shares outstanding during the period.
C Net investment income (loss) is affected by the timing of the declaration of dividends by any underlying mutual funds or exchange-traded funds (ETFs). Net investment income (loss) of any such underlying funds is not included in the Fund's net investment income (loss) ratio.
D Total distributions per share do not sum due to rounding.
E Total returns for periods of less than one year are not annualized.
F Fees and expenses of any underlying mutual funds or exchange-traded funds (ETFs) are not included in the Fund's expense ratio. The Fund indirectly bears its proportionate share of these expenses.
G Expense ratios reflect operating expenses of the class. Expenses before reductions do not reflect amounts reimbursed, waived, or reduced through arrangements with the investment adviser, brokerage services, or other offset arrangements, if applicable, and do not represent the amount paid by the class during periods when reimbursements, waivers or reductions occur.
H Annualized
I Amount does not include the portfolio activity of any underlying mutual funds or exchange-traded funds (ETFs).
See accompanying notes which are an integral part of the financial statements.
Fidelity Freedom Blend 2005 Fund Premier Class
| Years ended March 31, | 2022 A |
| Selected Per–Share Data | |
| Net asset value, beginning of period | $11.14 |
| Income from Investment Operations | |
| Net investment income (loss)B,C | .37 |
| Net realized and unrealized gain (loss) | (.51) |
| Total from investment operations | (.14) |
| Distributions from net investment income | (.28) |
| Distributions from net realized gain | (.27) |
| Total distributions | (.54)D |
| Net asset value, end of period | $10.46 |
| Total ReturnE | (1.43)% |
| Ratios to Average Net AssetsC,F,G | |
| Expenses before reductions | .24%H |
| Expenses net of fee waivers, if any | .24%H |
| Expenses net of all reductions | .24%H |
| Net investment income (loss) | 3.39%H |
| Supplemental Data | |
| Net assets, end of period (000 omitted) | $9,661 |
| Portfolio turnover rateI | 65% |
A For the period April 6, 2021 (commencement of sale of shares) through March 31, 2022.
B Calculated based on average shares outstanding during the period.
C Net investment income (loss) is affected by the timing of the declaration of dividends by any underlying mutual funds or exchange-traded funds (ETFs). Net investment income (loss) of any such underlying funds is not included in the Fund's net investment income (loss) ratio.
D Total distributions per share do not sum due to rounding.
E Total returns for periods of less than one year are not annualized.
F Fees and expenses of any underlying mutual funds or exchange-traded funds (ETFs) are not included in the Fund's expense ratio. The Fund indirectly bears its proportionate share of these expenses.
G Expense ratios reflect operating expenses of the class. Expenses before reductions do not reflect amounts reimbursed, waived, or reduced through arrangements with the investment adviser, brokerage services, or other offset arrangements, if applicable, and do not represent the amount paid by the class during periods when reimbursements, waivers or reductions occur.
H Annualized
I Amount does not include the portfolio activity of any underlying mutual funds or exchange-traded funds (ETFs).
See accompanying notes which are an integral part of the financial statements.
Fidelity Freedom Blend 2005 Fund Class Z
| Years ended March 31, | 2022 | 2021 | 2020 | 2019 A |
| Selected Per–Share Data | | | | |
| Net asset value, beginning of period | $11.06 | $9.88 | $10.01 | $10.00 |
| Income from Investment Operations | | | | |
| Net investment income (loss)B,C | .23 | .11 | .20 | .13 |
| Net realized and unrealized gain (loss) | (.29) | 1.40 | (.09) | .04 |
| Total from investment operations | (.06) | 1.51 | .11 | .17 |
| Distributions from net investment income | (.26) | (.11) | (.15) | (.10) |
| Distributions from net realized gain | (.27) | (.21) | (.09) | (.07) |
| Total distributions | (.52)D | (.33)D | (.24) | (.16)D |
| Net asset value, end of period | $10.48 | $11.06 | $9.88 | $10.01 |
| Total ReturnE | (.73)% | 15.34% | 1.01% | 1.83% |
| Ratios to Average Net AssetsC,F,G | | | | |
| Expenses before reductions | .36% | .36% | .36% | .36%H |
| Expenses net of fee waivers, if any | .36% | .36% | .36% | .36%H |
| Expenses net of all reductions | .36% | .36% | .36% | .36%H |
| Net investment income (loss) | 2.04% | 1.02% | 1.91% | 2.23%H |
| Supplemental Data | | | | |
| Net assets, end of period (000 omitted) | $153 | $184 | $103 | $102 |
| Portfolio turnover rateI | 65% | 45% | 64% | 11%H |
A For the period August 31, 2018 (commencement of operations) through March 31, 2019.
B Calculated based on average shares outstanding during the period.
C Net investment income (loss) is affected by the timing of the declaration of dividends by any underlying mutual funds or exchange-traded funds (ETFs). Net investment income (loss) of any such underlying funds is not included in the Fund's net investment income (loss) ratio.
D Total distributions per share do not sum due to rounding.
E Total returns for periods of less than one year are not annualized.
F Fees and expenses of any underlying mutual funds or exchange-traded funds (ETFs) are not included in the Fund's expense ratio. The Fund indirectly bears its proportionate share of these expenses.
G Expense ratios reflect operating expenses of the class. Expenses before reductions do not reflect amounts reimbursed, waived, or reduced through arrangements with the investment adviser, brokerage services, or other offset arrangements, if applicable, and do not represent the amount paid by the class during periods when reimbursements, waivers or reductions occur.
H Annualized
I Amount does not include the portfolio activity of any underlying mutual funds or exchange-traded funds (ETFs).
See accompanying notes which are an integral part of the financial statements.
Fidelity Freedom Blend 2005 Fund Class Z6
| Years ended March 31, | 2022 | 2021 | 2020 | 2019 A |
| Selected Per–Share Data | | | | |
| Net asset value, beginning of period | $11.06 | $9.88 | $10.01 | $10.00 |
| Income from Investment Operations | | | | |
| Net investment income (loss)B,C | .24 | .12 | .21 | .13 |
| Net realized and unrealized gain (loss) | (.29) | 1.40 | (.09) | .05 |
| Total from investment operations | (.05) | 1.52 | .12 | .18 |
| Distributions from net investment income | (.27) | (.12) | (.16) | (.10) |
| Distributions from net realized gain | (.27) | (.21) | (.10) | (.07) |
| Total distributions | (.54) | (.34)D | (.25)D | (.17) |
| Net asset value, end of period | $10.47 | $11.06 | $9.88 | $10.01 |
| Total ReturnE | (.65)% | 15.45% | 1.11% | 1.86% |
| Ratios to Average Net AssetsC,F,G | | | | |
| Expenses before reductions | .26% | .26% | .26% | .26%H |
| Expenses net of fee waivers, if any | .26% | .26% | .26% | .26%H |
| Expenses net of all reductions | .26% | .26% | .26% | .26%H |
| Net investment income (loss) | 2.14% | 1.12% | 2.01% | 2.33%H |
| Supplemental Data | | | | |
| Net assets, end of period (000 omitted) | $2,238 | $125 | $107 | $102 |
| Portfolio turnover rateI | 65% | 45% | 64% | 11%H |
A For the period August 31, 2018 (commencement of operations) through March 31, 2019.
B Calculated based on average shares outstanding during the period.
C Net investment income (loss) is affected by the timing of the declaration of dividends by any underlying mutual funds or exchange-traded funds (ETFs). Net investment income (loss) of any such underlying funds is not included in the Fund's net investment income (loss) ratio.
D Total distributions per share do not sum due to rounding.
E Total returns for periods of less than one year are not annualized.
F Fees and expenses of any underlying mutual funds or exchange-traded funds (ETFs) are not included in the Fund's expense ratio. The Fund indirectly bears its proportionate share of these expenses.
G Expense ratios reflect operating expenses of the class. Expenses before reductions do not reflect amounts reimbursed, waived, or reduced through arrangements with the investment adviser, brokerage services, or other offset arrangements, if applicable, and do not represent the amount paid by the class during periods when reimbursements, waivers or reductions occur.
H Annualized
I Amount does not include the portfolio activity of any underlying mutual funds or exchange-traded funds (ETFs).
See accompanying notes which are an integral part of the financial statements.
Fidelity Freedom® Blend 2010 Fund
Investment Summary (Unaudited)
The information in the following tables is based on the direct investments of the Fund.
Top Holdings as of March 31, 2022
| | % of fund's net assets |
| Fidelity Series Investment Grade Bond Fund | 10.5 |
| Fidelity Series 0-5 Year Inflation-Protected Bond Index Fund | 10.1 |
| Fidelity Series Government Bond Index Fund | 10.0 |
| Fidelity Series Investment Grade Securitized Fund | 7.4 |
| Fidelity Series Corporate Bond Fund | 7.2 |
| Fidelity Series Emerging Markets Opportunities Fund | 6.6 |
| Fidelity Series Treasury Bill Index Fund | 5.3 |
| Fidelity Series Long-Term Treasury Bond Index Fund | 3.9 |
| Fidelity Series Large Cap Value Index Fund | 3.9 |
| Fidelity Series International Developed Markets Bond Index Fund | 3.2 |
| | 68.1 |
Asset Allocation (% of fund's net assets)
| Period end |
| | Domestic Equity Funds | 14.6% |
| | International Equity Funds | 18.0% |
| | Bond Funds | 58.5% |
| | Short-Term Funds | 8.8% |
| | Short-Term Investments | 0.1% |
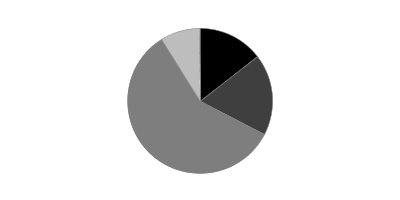
Percentages are adjusted for the effect of futures contracts and swaps, if applicable.
Domestic Equity Funds category includes Fidelity Series Commodity Strategy Fund which invests in commodity-related investments.
Fidelity Freedom® Blend 2010 Fund
Schedule of Investments March 31, 2022
Showing Percentage of Net Assets
| U.S. Treasury Obligations - 0.1% | | | |
| | | Principal Amount | Value |
| U.S. Treasury Bills, yield at date of purchase 0.17% to 0.5% 4/21/22 to 6/23/22 (a) | | | |
| (Cost $49,972) | | 50,000 | 49,974 |
| | | Shares | Value |
|
| Domestic Equity Funds - 14.6% | | | |
| Fidelity Series Blue Chip Growth Fund (b) | | 180,347 | $2,591,585 |
| Fidelity Series Commodity Strategy Fund (b) | | 258,139 | 1,319,090 |
| Fidelity Series Large Cap Growth Index Fund (b) | | 92,764 | 1,632,645 |
| Fidelity Series Large Cap Stock Fund (b) | | 95,843 | 1,821,976 |
| Fidelity Series Large Cap Value Index Fund (b) | | 227,057 | 3,487,599 |
| Fidelity Series Small Cap Opportunities Fund (b) | | 64,370 | 876,716 |
| Fidelity Series Value Discovery Fund (b) | | 80,592 | 1,289,471 |
| TOTAL DOMESTIC EQUITY FUNDS | | | |
| (Cost $10,617,113) | | | 13,019,082 |
|
| International Equity Funds - 18.0% | | | |
| Fidelity Series Canada Fund (b) | | 71,892 | 1,115,757 |
| Fidelity Series Emerging Markets Fund (b) | | 70,651 | 655,643 |
| Fidelity Series Emerging Markets Opportunities Fund (b) | | 321,093 | 5,908,109 |
| Fidelity Series International Growth Fund (b) | | 134,672 | 2,232,866 |
| Fidelity Series International Index Fund (b) | | 82,858 | 947,893 |
| Fidelity Series International Small Cap Fund (b) | | 39,031 | 700,599 |
| Fidelity Series International Value Fund (b) | | 204,472 | 2,255,330 |
| Fidelity Series Overseas Fund (b) | | 177,913 | 2,245,263 |
| TOTAL INTERNATIONAL EQUITY FUNDS | | | |
| (Cost $15,266,607) | | | 16,061,460 |
|
| Bond Funds - 58.5% | | | |
| Fidelity Series 0-5 Year Inflation-Protected Bond Index Fund (b) | | 898,754 | 9,014,498 |
| Fidelity Series 5+ Year Inflation-Protected Bond Index Fund (b) | | 262,402 | 2,519,057 |
| Fidelity Series Corporate Bond Fund (b) | | 632,543 | 6,388,688 |
| Fidelity Series Emerging Markets Debt Fund (b) | | 54,873 | 452,700 |
| Fidelity Series Emerging Markets Debt Local Currency Fund (b) | | 16,640 | 149,927 |
| Fidelity Series Floating Rate High Income Fund (b) | | 9,828 | 90,320 |
| Fidelity Series Government Bond Index Fund (b) | | 895,619 | 8,938,273 |
| Fidelity Series High Income Fund (b) | | 58,845 | 534,905 |
| Fidelity Series Inflation-Protected Bond Index Fund (b) | | 141,099 | 1,432,158 |
| Fidelity Series International Developed Markets Bond Index Fund (b) | | 301,547 | 2,813,429 |
| Fidelity Series Investment Grade Bond Fund (b) | | 861,700 | 9,401,145 |
| Fidelity Series Investment Grade Securitized Fund (b) | | 677,524 | 6,585,538 |
| Fidelity Series Long-Term Treasury Bond Index Fund (b) | | 460,407 | 3,508,301 |
| Fidelity Series Real Estate Income Fund (b) | | 28,488 | 323,625 |
| TOTAL BOND FUNDS | | | |
| (Cost $54,298,384) | | | 52,152,564 |
|
| Short-Term Funds - 8.8% | | | |
| Fidelity Cash Central Fund 0.31% (c) | | 8,018 | 8,020 |
| Fidelity Series Government Money Market Fund 0.31% (b)(d) | | 1,569,920 | 1,569,920 |
| Fidelity Series Short-Term Credit Fund (b) | | 161,324 | 1,572,911 |
| Fidelity Series Treasury Bill Index Fund (b) | | 471,489 | 4,710,177 |
| TOTAL SHORT-TERM FUNDS | | | |
| (Cost $7,899,287) | | | 7,861,028 |
| TOTAL INVESTMENT IN SECURITIES - 100.0% | | | |
| (Cost $88,131,363) | | | 89,144,108 |
| NET OTHER ASSETS (LIABILITIES) - 0.0% | | | 17,222 |
| NET ASSETS - 100% | | | $89,161,330 |
| Futures Contracts | | | | | |
| | Number of contracts | Expiration Date | Notional Amount | Value | Unrealized Appreciation/(Depreciation) |
| Purchased | | | | | |
| Equity Index Contracts | | | | | |
| ICE E-mini MSCI EAFE Index Contracts (United States) | 2 | June 2022 | $214,440 | $12,190 | $12,190 |
| ICE E-mini MSCI Emerging Markets Index Contracts (United States) | 4 | June 2022 | 225,100 | 16,999 | 16,999 |
| Sold | | | | | |
| Equity Index Contracts | | | | | |
| CME Micro E-mini S&P 500 Index Contracts (United States) | 2 | June 2022 | 453,075 | (2,827) | (2,827) |
| TOTAL FUTURES CONTRACTS | | | | | $26,362 |
The notional amount of futures purchased as a percentage of Net Assets is 0.5%
The notional amount of futures sold as a percentage of Net Assets is 0.5%
Legend
(a) Security or a portion of the security was pledged to cover margin requirements for futures contracts. At period end, the value of securities pledged amounted to $49,974.
(b) Affiliated Fund
(c) Affiliated fund that is generally available only to investment companies and other accounts managed by Fidelity Investments. The rate quoted is the annualized seven-day yield of the fund at period end. A complete unaudited listing of the fund's holdings as of its most recent quarter end is available upon request. In addition, each Fidelity Central Fund's financial statements, which are not covered by the Fund's Report of Independent Registered Public Accounting Firm, are available on the SEC's website or upon request.
(d) The rate quoted is the annualized seven-day yield of the fund at period end.
Affiliated Central Funds
Fiscal year to date information regarding the Fund's investments in Fidelity Central Funds, including the ownership percentage, is presented below.
| Fund | Value, beginning of period | Purchases | Sales Proceeds | Dividend Income | Realized Gain/Loss | Change in Unrealized appreciation (depreciation) | Value, end of period | % ownership, end of period |
| Fidelity Cash Central Fund 0.31% | $49 | $151,110 | $143,139 | $3 | $-- | $-- | $8,020 | 0.0% |
| Total | $49 | $151,110 | $143,139 | $3 | $-- | $-- | $8,020 | |
Amounts in the income column in the above table include any capital gain distributions from underlying funds, which are presented in the corresponding line-item in the Statement of Operations, if applicable.
Affiliated Underlying Funds
Fiscal year to date information regarding the Fund's investments in affiliated Underlying Funds is presented below. Exchanges between classes of the same affiliated Underlying Funds may occur. If an underlying Fund changes its name, the name presented below is the name in effect at period end.
| Affiliate | Value, beginning of period | Purchases(a) | Sales Proceeds(a) | Dividend Income | Realized Gain (loss) | Change in Unrealized appreciation (depreciation) | Value, end of period |
| Fidelity Series 0-5 Year Inflation-Protected Bond Index Fund | $-- | $9,819,414 | $786,657 | $32,387 | $333 | $(13,770) | $9,014,498 |
| Fidelity Series 5+ Year Inflation-Protected Bond Index Fund | -- | 3,318,160 | 691,794 | 16,132 | (19,947) | (87,362) | 2,519,057 |
| Fidelity Series Blue Chip Growth Fund | 2,620,975 | 2,058,111 | 1,608,724 | 574,688 | 28,444 | (507,221) | 2,591,585 |
| Fidelity Series Canada Fund | 704,113 | 526,567 | 291,033 | 22,676 | 6,082 | 170,028 | 1,115,757 |
| Fidelity Series Commodity Strategy Fund | 2,243,914 | 1,459,388 | 2,488,841 | 752,595 | (31,686) | 136,315 | 1,319,090 |
| Fidelity Series Corporate Bond Fund | 5,953,279 | 2,698,937 | 1,782,156 | 184,018 | (26,198) | (455,174) | 6,388,688 |
| Fidelity Series Emerging Markets Debt Fund | 442,073 | 190,345 | 131,901 | 21,822 | (3,308) | (44,509) | 452,700 |
| Fidelity Series Emerging Markets Debt Local Currency Fund | 147,754 | 64,945 | 45,117 | 6,138 | (1,316) | (16,339) | 149,927 |
| Fidelity Series Emerging Markets Fund | 711,666 | 361,976 | 260,826 | 22,133 | 5,309 | (162,482) | 655,643 |
| Fidelity Series Emerging Markets Opportunities Fund | 6,398,084 | 4,085,256 | 2,559,332 | 706,852 | 56,041 | (2,071,940) | 5,908,109 |
| Fidelity Series Floating Rate High Income Fund | 89,055 | 36,268 | 34,932 | 4,062 | (78) | 7 | 90,320 |
| Fidelity Series Government Bond Index Fund | 7,340,181 | 3,859,087 | 1,815,207 | 91,348 | (21,697) | (424,091) | 8,938,273 |
| Fidelity Series Government Money Market Fund 0.31% | 4,478,499 | 914,626 | 3,823,205 | 2,517 | -- | -- | 1,569,920 |
| Fidelity Series High Income Fund | 513,041 | 214,121 | 172,238 | 30,031 | (3,472) | (16,547) | 534,905 |
| Fidelity Series Inflation-Protected Bond Index Fund | 7,854,184 | 2,441,636 | 8,853,011 | 375,006 | 465,699 | (476,350) | 1,432,158 |
| Fidelity Series International Developed Markets Bond Index Fund | -- | 3,187,611 | 246,834 | 948 | (5,026) | (122,322) | 2,813,429 |
| Fidelity Series International Growth Fund | 1,731,600 | 1,490,308 | 740,732 | 184,052 | (10,698) | (237,612) | 2,232,866 |
| Fidelity Series International Index Fund | 722,922 | 541,817 | 277,888 | 24,396 | (2,626) | (36,332) | 947,893 |
| Fidelity Series International Small Cap Fund | 624,488 | 399,366 | 196,084 | 95,840 | (6,856) | (120,315) | 700,599 |
| Fidelity Series International Value Fund | 1,729,670 | 1,318,767 | 800,501 | 115,459 | (3,285) | 10,679 | 2,255,330 |
| Fidelity Series Investment Grade Bond Fund | 8,146,939 | 3,831,656 | 2,039,048 | 205,011 | (22,470) | (515,932) | 9,401,145 |
| Fidelity Series Investment Grade Securitized Fund | 5,708,020 | 2,669,521 | 1,405,546 | 55,255 | (13,717) | (372,740) | 6,585,538 |
| Fidelity Series Large Cap Growth Index Fund | 1,654,159 | 872,263 | 1,087,164 | 53,607 | 115,624 | 77,763 | 1,632,645 |
| Fidelity Series Large Cap Stock Fund | 1,806,229 | 848,129 | 888,110 | 170,021 | 25,254 | 30,474 | 1,821,976 |
| Fidelity Series Large Cap Value Index Fund | 3,450,090 | 1,707,449 | 1,827,356 | 242,539 | 26,539 | 130,877 | 3,487,599 |
| Fidelity Series Long-Term Treasury Bond Index Fund | 2,211,381 | 2,290,608 | 872,500 | 63,550 | (82,606) | (38,582) | 3,508,301 |
| Fidelity Series Overseas Fund | 1,734,545 | 1,361,791 | 784,752 | 68,170 | 10,991 | (77,312) | 2,245,263 |
| Fidelity Series Real Estate Income Fund | 307,305 | 114,186 | 105,736 | 12,984 | (528) | 8,398 | 323,625 |
| Fidelity Series Short-Term Credit Fund | 2,208,841 | 1,150,094 | 1,695,552 | 42,257 | (19,776) | (70,696) | 1,572,911 |
| Fidelity Series Small Cap Opportunities Fund | 872,624 | 663,917 | 446,917 | 232,930 | (2,001) | (210,907) | 876,716 |
| Fidelity Series Treasury Bill Index Fund | 7,116,302 | 3,641,183 | 6,041,345 | 6,293 | (2,011) | (3,952) | 4,710,177 |
| Fidelity Series Value Discovery Fund | 1,274,789 | 663,314 | 655,708 | 155,019 | 15,953 | (8,877) | 1,289,471 |
| Total | $80,796,722 | $58,800,817 | $45,456,747 | $4,570,736 | $476,967 | $(5,526,823) | $89,086,114 |
(a) Includes the value of shares purchased or redeemed through in-kind transactions, if applicable.
Amounts in the income column in the above table include any capital gain distributions from underlying funds, which are presented in the corresponding line-item in the Statement of Operations, if applicable.
Investment Valuation
The following is a summary of the inputs used, as of March 31, 2022, involving the Fund's assets and liabilities carried at fair value. The inputs or methodology used for valuing securities may not be an indication of the risk associated with investing in those securities. For more information on valuation inputs, and their aggregation into the levels used below, please refer to the Investment Valuation section in the accompanying Notes to Financial Statements.
| | Valuation Inputs at Reporting Date: |
| Description | Total | Level 1 | Level 2 | Level 3 |
| Investments in Securities: | | | | |
| Other Short-Term Investments and Net Other Assets | $49,974 | $-- | $49,974 | $-- |
| Domestic Equity Funds | 13,019,082 | 13,019,082 | -- | -- |
| International Equity Funds | 16,061,460 | 16,061,460 | -- | -- |
| Bond Funds | 52,152,564 | 52,152,564 | -- | -- |
| Short-Term Funds | 7,861,028 | 7,861,028 | -- | -- |
| Total Investments in Securities: | $89,144,108 | $89,094,134 | $49,974 | $-- |
| Derivative Instruments: | | | | |
| Assets | | | | |
| Futures Contracts | $29,189 | $29,189 | $-- | $-- |
| Total Assets | $29,189 | $29,189 | $-- | $-- |
| Liabilities | | | | |
| Futures Contracts | $(2,827) | $(2,827) | $-- | $-- |
| Total Liabilities | $(2,827) | $(2,827) | $-- | $-- |
| Total Derivative Instruments: | $26,362 | $26,362 | $-- | $-- |
Value of Derivative Instruments
The following table is a summary of the Fund's value of derivative instruments by primary risk exposure as of March 31, 2022. For additional information on derivative instruments, please refer to the Derivative Instruments section in the accompanying Notes to Financial Statements.
| Primary Risk Exposure / Derivative Type | Value |
| | Asset | Liability |
| Equity Risk | | |
| Futures Contracts(a) | $29,189 | $(2,827) |
| Total Equity Risk | 29,189 | (2,827) |
| Total Value of Derivatives | $29,189 | $(2,827) |
(a) Reflects gross cumulative appreciation (depreciation) on futures contracts as presented in the Schedule of Investments. In the Statement of Assets and Liabilities, the period end daily variation margin is included in receivable or payable for daily variation margin on futures contracts, and the net cumulative appreciation (depreciation) is included in Total accumulated earnings (loss).
See accompanying notes which are an integral part of the financial statements.
Fidelity Freedom® Blend 2010 Fund
Financial Statements
Statement of Assets and Liabilities
| | | March 31, 2022 |
| Assets | | |
Investment in securities, at value — See accompanying schedule:
Unaffiliated issuers (cost $49,972) | $49,974 | |
| Fidelity Central Funds (cost $8,020) | 8,020 | |
| Other affiliated issuers (cost $88,073,371) | 89,086,114 | |
| Total Investment in Securities (cost $88,131,363) | | $89,144,108 |
| Cash | | 23,182 |
| Receivable for investments sold | | 2,316,092 |
| Receivable for fund shares sold | | 33,224 |
| Distributions receivable from Fidelity Central Funds | | 2 |
| Total assets | | 91,516,608 |
| Liabilities | | |
| Payable for investments purchased | $2,255,838 | |
| Payable for fund shares redeemed | 73,041 | |
| Accrued management fee | 21,572 | |
| Distribution and service plan fees payable | 546 | |
| Payable for daily variation margin on futures contracts | 4,281 | |
| Total liabilities | | 2,355,278 |
| Net Assets | | $89,161,330 |
| Net Assets consist of: | | |
| Paid in capital | | $87,250,927 |
| Total accumulated earnings (loss) | | 1,910,403 |
| Net Assets | | $89,161,330 |
| Net Asset Value and Maximum Offering Price | | |
| Class A: | | |
| Net Asset Value and redemption price per share ($693,821 ÷ 66,052 shares)(a) | | $10.50 |
| Maximum offering price per share (100/94.25 of $10.50) | | $11.14 |
| Class M: | | |
| Net Asset Value and redemption price per share ($358,883 ÷ 34,149 shares)(a) | | $10.51 |
| Maximum offering price per share (100/96.50 of $10.51) | | $10.89 |
| Class C: | | |
| Net Asset Value and offering price per share ($287,978 ÷ 27,665 shares)(a) | | $10.41 |
| Fidelity Freedom Blend 2010 Fund: | | |
| Net Asset Value, offering price and redemption price per share ($5,344,104 ÷ 508,007 shares) | | $10.52 |
| Class K: | | |
| Net Asset Value, offering price and redemption price per share ($6,842,503 ÷ 648,842 shares) | | $10.55 |
| Class K6: | | |
| Net Asset Value, offering price and redemption price per share ($35,745,380 ÷ 3,380,619 shares) | | $10.57 |
| Class I: | | |
| Net Asset Value, offering price and redemption price per share ($1,155,585 ÷ 109,810 shares) | | $10.52 |
| Class Z: | | |
| Net Asset Value, offering price and redemption price per share ($143,960 ÷ 13,627 shares) | | $10.56 |
| Class Z6: | | |
| Net Asset Value, offering price and redemption price per share ($5,902,568 ÷ 558,875 shares) | | $10.56 |
| Premier Class: | | |
| Net Asset Value, offering price and redemption price per share ($32,686,548 ÷ 3,096,809 shares) | | $10.55 |
(a) Redemption price per share is equal to net asset value less any applicable contingent deferred sales charge.
See accompanying notes which are an integral part of the financial statements.
Statement of Operations
| | | Year ended March 31, 2022 |
| Investment Income | | |
| Dividends: | | |
| Affiliated issuers | | $2,384,833 |
| Interest | | 2 |
| Income from Fidelity Central Funds | | 3 |
| Total income | | 2,384,838 |
| Expenses | | |
| Management fee | $260,715 | |
| Distribution and service plan fees | 6,346 | |
| Independent trustees' fees and expenses | 265 | |
| Total expenses | | 267,326 |
| Net investment income (loss) | | 2,117,512 |
| Realized and Unrealized Gain (Loss) | | |
| Net realized gain (loss) on: | | |
| Investment securities: | | |
| Affiliated issuers | 476,967 | |
| Futures contracts | (14,642) | |
| Capital gain distributions from underlying funds: | | |
| Affiliated issuers | 2,185,903 | |
| Total net realized gain (loss) | | 2,648,228 |
| Change in net unrealized appreciation (depreciation) on: | | |
| Investment securities: | | |
| Unaffiliated issuers | 2 | |
| Affiliated issuers | (5,526,823) | |
| Futures contracts | 26,362 | |
| Total change in net unrealized appreciation (depreciation) | | (5,500,459) |
| Net gain (loss) | | (2,852,231) |
| Net increase (decrease) in net assets resulting from operations | | $(734,719) |
See accompanying notes which are an integral part of the financial statements.
Statement of Changes in Net Assets
| | Year ended March 31, 2022 | Year ended March 31, 2021 |
| Increase (Decrease) in Net Assets | | |
| Operations | | |
| Net investment income (loss) | $2,117,512 | $867,962 |
| Net realized gain (loss) | 2,648,228 | 3,061,112 |
| Change in net unrealized appreciation (depreciation) | (5,500,459) | 9,299,154 |
| Net increase (decrease) in net assets resulting from operations | (734,719) | 13,228,228 |
| Distributions to shareholders | (5,252,026) | (2,725,154) |
| Share transactions - net increase (decrease) | 14,371,562 | 12,198,204 |
| Total increase (decrease) in net assets | 8,384,817 | 22,701,278 |
| Net Assets | | |
| Beginning of period | 80,776,513 | 58,075,235 |
| End of period | $89,161,330 | $80,776,513 |
See accompanying notes which are an integral part of the financial statements.
Financial Highlights
Fidelity Freedom Blend 2010 Fund Class A
| Years ended March 31, | 2022 | 2021 | 2020 | 2019 A |
| Selected Per–Share Data | | | | |
| Net asset value, beginning of period | $11.19 | $9.65 | $9.93 | $10.00 |
| Income from Investment Operations | | | | |
| Net investment income (loss)B,C | .18 | .08 | .16 | .10 |
| Net realized and unrealized gain (loss) | (.23) | 1.83 | (.22) | .01 |
| Total from investment operations | (.05) | 1.91 | (.06) | .11 |
| Distributions from net investment income | (.22) | (.11) | (.12) | (.11) |
| Distributions from net realized gain | (.42) | (.26) | (.09) | (.08) |
| Total distributions | (.64) | (.37) | (.22)D | (.18)D |
| Net asset value, end of period | $10.50 | $11.19 | $9.65 | $9.93 |
| Total ReturnE,F,G | (.71)% | 19.96% | (.82)% | 1.24% |
| Ratios to Average Net AssetsC,H,I | | | | |
| Expenses before reductions | .72% | .72% | .72% | .72%J |
| Expenses net of fee waivers, if any | .72% | .72% | .72% | .72%J |
| Expenses net of all reductions | .72% | .72% | .72% | .72%J |
| Net investment income (loss) | 1.57% | .74% | 1.60% | 1.81%J |
| Supplemental Data | | | | |
| Net assets, end of period (000 omitted) | $694 | $931 | $190 | $166 |
| Portfolio turnover rateK | 51% | 37% | 42% | 98%J |
A For the period August 31, 2018 (commencement of operations) through March 31, 2019.
B Calculated based on average shares outstanding during the period.
C Net investment income (loss) is affected by the timing of the declaration of dividends by any underlying mutual funds or exchange-traded funds (ETFs). Net investment income (loss) of any such underlying funds is not included in the Fund's net investment income (loss) ratio.
D Total distributions per share do not sum due to rounding.
E Total returns for periods of less than one year are not annualized.
F Total returns would have been lower if certain expenses had not been reduced during the applicable periods shown.
G Total returns do not include the effect of the sales charges.
H Fees and expenses of any underlying mutual funds or exchange-traded funds (ETFs) are not included in the Fund's expense ratio. The Fund indirectly bears its proportionate share of these expenses. For additional expense information related to investments in Fidelity Central Funds, please refer to the "Investments in Fidelity Central Funds" note found in the Notes to Financial Statements section of the most recent Annual or Semi-Annual report.
I Expense ratios reflect operating expenses of the class. Expenses before reductions do not reflect amounts reimbursed, waived, or reduced through arrangements with the investment adviser, brokerage services, or other offset arrangements, if applicable, and do not represent the amount paid by the class during periods when reimbursements, waivers or reductions occur.
J Annualized
K Amount does not include the portfolio activity of any underlying mutual funds or exchange-traded funds (ETFs).
See accompanying notes which are an integral part of the financial statements.
Fidelity Freedom Blend 2010 Fund Class M
| Years ended March 31, | 2022 | 2021 | 2020 | 2019 A |
| Selected Per–Share Data | | | | |
| Net asset value, beginning of period | $11.19 | $9.63 | $9.92 | $10.00 |
| Income from Investment Operations | | | | |
| Net investment income (loss)B,C | .15 | .05 | .14 | .09 |
| Net realized and unrealized gain (loss) | (.23) | 1.84 | (.23) | –D |
| Total from investment operations | (.08) | 1.89 | (.09) | .09 |
| Distributions from net investment income | (.19) | (.07) | (.11) | (.10) |
| Distributions from net realized gain | (.41) | (.26) | (.09) | (.08) |
| Total distributions | (.60) | (.33) | (.20) | (.17)E |
| Net asset value, end of period | $10.51 | $11.19 | $9.63 | $9.92 |
| Total ReturnF,G | (.93)% | 19.76% | (1.07)% | 1.03% |
| Ratios to Average Net AssetsC,H,I | | | | |
| Expenses before reductions | .97% | .97% | .97% | .97%J |
| Expenses net of fee waivers, if any | .97% | .97% | .97% | .97%J |
| Expenses net of all reductions | .97% | .97% | .97% | .97%J |
| Net investment income (loss) | 1.32% | .49% | 1.35% | 1.56%J |
| Supplemental Data | | | | |
| Net assets, end of period (000 omitted) | $359 | $379 | $259 | $126 |
| Portfolio turnover rateK | 51% | 37% | 42% | 98%J |
A For the period August 31, 2018 (commencement of operations) through March 31, 2019.
B Calculated based on average shares outstanding during the period.
C Net investment income (loss) is affected by the timing of the declaration of dividends by any underlying mutual funds or exchange-traded funds (ETFs). Net investment income (loss) of any such underlying funds is not included in the Fund's net investment income (loss) ratio.
D Amount represents less than $.005 per share.
E Total distributions per share do not sum due to rounding.
F Total returns for periods of less than one year are not annualized.
G Total returns do not include the effect of the sales charges.
H Fees and expenses of any underlying mutual funds or exchange-traded funds (ETFs) are not included in the Fund's expense ratio. The Fund indirectly bears its proportionate share of these expenses. For additional expense information related to investments in Fidelity Central Funds, please refer to the "Investments in Fidelity Central Funds" note found in the Notes to Financial Statements section of the most recent Annual or Semi-Annual report.
I Expense ratios reflect operating expenses of the class. Expenses before reductions do not reflect amounts reimbursed, waived, or reduced through arrangements with the investment adviser, brokerage services, or other offset arrangements, if applicable, and do not represent the amount paid by the class during periods when reimbursements, waivers or reductions occur.
J Annualized
K Amount does not include the portfolio activity of any underlying mutual funds or exchange-traded funds (ETFs).
See accompanying notes which are an integral part of the financial statements.
Fidelity Freedom Blend 2010 Fund Class C
| Years ended March 31, | 2022 | 2021 | 2020 | 2019 A |
| Selected Per–Share Data | | | | |
| Net asset value, beginning of period | $11.13 | $9.61 | $9.92 | $10.00 |
| Income from Investment Operations | | | | |
| Net investment income (loss)B,C | .09 | –D | .09 | .06 |
| Net realized and unrealized gain (loss) | (.22) | 1.82 | (.23) | .01 |
| Total from investment operations | (.13) | 1.82 | (.14) | .07 |
| Distributions from net investment income | (.18) | (.05) | (.07) | (.08) |
| Distributions from net realized gain | (.41) | (.25) | (.09) | (.08) |
| Total distributions | (.59) | (.30) | (.17)E | (.15)E |
| Net asset value, end of period | $10.41 | $11.13 | $9.61 | $9.92 |
| Total ReturnF,G | (1.39)% | 19.05% | (1.57)% | .81% |
| Ratios to Average Net AssetsC,H,I | | | | |
| Expenses before reductions | 1.47% | 1.47% | 1.47% | 1.47%J |
| Expenses net of fee waivers, if any | 1.47% | 1.47% | 1.47% | 1.47%J |
| Expenses net of all reductions | 1.47% | 1.47% | 1.47% | 1.47%J |
| Net investment income (loss) | .82% | (.02)% | .85% | 1.06%J |
| Supplemental Data | | | | |
| Net assets, end of period (000 omitted) | $288 | $240 | $117 | $101 |
| Portfolio turnover rateK | 51% | 37% | 42% | 98%J |
A For the period August 31, 2018 (commencement of operations) through March 31, 2019.
B Calculated based on average shares outstanding during the period.
C Net investment income (loss) is affected by the timing of the declaration of dividends by any underlying mutual funds or exchange-traded funds (ETFs). Net investment income (loss) of any such underlying funds is not included in the Fund's net investment income (loss) ratio.
D Amount represents less than $.005 per share.
E Total distributions per share do not sum due to rounding.
F Total returns for periods of less than one year are not annualized.
G Total returns do not include the effect of the contingent deferred sales charge.
H Fees and expenses of any underlying mutual funds or exchange-traded funds (ETFs) are not included in the Fund's expense ratio. The Fund indirectly bears its proportionate share of these expenses. For additional expense information related to investments in Fidelity Central Funds, please refer to the "Investments in Fidelity Central Funds" note found in the Notes to Financial Statements section of the most recent Annual or Semi-Annual report.
I Expense ratios reflect operating expenses of the class. Expenses before reductions do not reflect amounts reimbursed, waived, or reduced through arrangements with the investment adviser, brokerage services, or other offset arrangements, if applicable, and do not represent the amount paid by the class during periods when reimbursements, waivers or reductions occur.
J Annualized
K Amount does not include the portfolio activity of any underlying mutual funds or exchange-traded funds (ETFs).
See accompanying notes which are an integral part of the financial statements.
Fidelity Freedom Blend 2010 Fund
| Years ended March 31, | 2022 | 2021 | 2020 | 2019 A |
| Selected Per–Share Data | | | | |
| Net asset value, beginning of period | $11.21 | $9.65 | $9.94 | $10.00 |
| Income from Investment Operations | | | | |
| Net investment income (loss)B,C | .20 | .11 | .19 | .12 |
| Net realized and unrealized gain (loss) | (.22) | 1.83 | (.23) | .01 |
| Total from investment operations | (.02) | 1.94 | (.04) | .13 |
| Distributions from net investment income | (.25) | (.12) | (.16) | (.11) |
| Distributions from net realized gain | (.42) | (.26) | (.10) | (.08) |
| Total distributions | (.67) | (.38) | (.25)D | (.19) |
| Net asset value, end of period | $10.52 | $11.21 | $9.65 | $9.94 |
| Total ReturnE | (.42)% | 20.28% | (.56)% | 1.37% |
| Ratios to Average Net AssetsC,F,G | | | | |
| Expenses before reductions | .47% | .47% | .47% | .47%H |
| Expenses net of fee waivers, if any | .47% | .47% | .47% | .47%H |
| Expenses net of all reductions | .47% | .47% | .47% | .47%H |
| Net investment income (loss) | 1.82% | .99% | 1.85% | 2.06%H |
| Supplemental Data | | | | |
| Net assets, end of period (000 omitted) | $5,344 | $4,499 | $2,197 | $148 |
| Portfolio turnover rateI | 51% | 37% | 42% | 98%H |
A For the period August 31, 2018 (commencement of operations) through March 31, 2019.
B Calculated based on average shares outstanding during the period.
C Net investment income (loss) is affected by the timing of the declaration of dividends by any underlying mutual funds or exchange-traded funds (ETFs). Net investment income (loss) of any such underlying funds is not included in the Fund's net investment income (loss) ratio.
D Total distributions per share do not sum due to rounding.
E Total returns for periods of less than one year are not annualized.
F Fees and expenses of any underlying mutual funds or exchange-traded funds (ETFs) are not included in the Fund's expense ratio. The Fund indirectly bears its proportionate share of these expenses. For additional expense information related to investments in Fidelity Central Funds, please refer to the "Investments in Fidelity Central Funds" note found in the Notes to Financial Statements section of the most recent Annual or Semi-Annual report.
G Expense ratios reflect operating expenses of the class. Expenses before reductions do not reflect amounts reimbursed, waived, or reduced through arrangements with the investment adviser, brokerage services, or other offset arrangements, if applicable, and do not represent the amount paid by the class during periods when reimbursements, waivers or reductions occur.
H Annualized
I Amount does not include the portfolio activity of any underlying mutual funds or exchange-traded funds (ETFs).
See accompanying notes which are an integral part of the financial statements.
Fidelity Freedom Blend 2010 Fund Class K
| Years ended March 31, | 2022 | 2021 | 2020 | 2019 A |
| Selected Per–Share Data | | | | |
| Net asset value, beginning of period | $11.23 | $9.66 | $9.94 | $10.00 |
| Income from Investment Operations | | | | |
| Net investment income (loss)B,C | .22 | .12 | .20 | .12 |
| Net realized and unrealized gain (loss) | (.22) | 1.84 | (.22) | .01 |
| Total from investment operations | – | 1.96 | (.02) | .13 |
| Distributions from net investment income | (.26) | (.13) | (.16) | (.11) |
| Distributions from net realized gain | (.42) | (.26) | (.09) | (.08) |
| Total distributions | (.68) | (.39) | (.26)D | (.19) |
| Net asset value, end of period | $10.55 | $11.23 | $9.66 | $9.94 |
| Total ReturnE | (.28)% | 20.40% | (.43)% | 1.38% |
| Ratios to Average Net AssetsC,F,G | | | | |
| Expenses before reductions | .37% | .37% | .37% | .37%H |
| Expenses net of fee waivers, if any | .37% | .37% | .37% | .37%H |
| Expenses net of all reductions | .37% | .37% | .37% | .37%H |
| Net investment income (loss) | 1.92% | 1.09% | 1.95% | 2.16%H |
| Supplemental Data | | | | |
| Net assets, end of period (000 omitted) | $6,843 | $7,725 | $6,317 | $101 |
| Portfolio turnover rateI | 51% | 37% | 42% | 98%H |
A For the period August 31, 2018 (commencement of operations) through March 31, 2019.
B Calculated based on average shares outstanding during the period.
C Net investment income (loss) is affected by the timing of the declaration of dividends by any underlying mutual funds or exchange-traded funds (ETFs). Net investment income (loss) of any such underlying funds is not included in the Fund's net investment income (loss) ratio.
D Total distributions per share do not sum due to rounding.
E Total returns for periods of less than one year are not annualized.
F Fees and expenses of any underlying mutual funds or exchange-traded funds (ETFs) are not included in the Fund's expense ratio. The Fund indirectly bears its proportionate share of these expenses. For additional expense information related to investments in Fidelity Central Funds, please refer to the "Investments in Fidelity Central Funds" note found in the Notes to Financial Statements section of the most recent Annual or Semi-Annual report.
G Expense ratios reflect operating expenses of the class. Expenses before reductions do not reflect amounts reimbursed, waived, or reduced through arrangements with the investment adviser, brokerage services, or other offset arrangements, if applicable, and do not represent the amount paid by the class during periods when reimbursements, waivers or reductions occur.
H Annualized
I Amount does not include the portfolio activity of any underlying mutual funds or exchange-traded funds (ETFs).
See accompanying notes which are an integral part of the financial statements.
Fidelity Freedom Blend 2010 Fund Class K6
| Years ended March 31, | 2022 | 2021 | 2020 | 2019 A |
| Selected Per–Share Data | | | | |
| Net asset value, beginning of period | $11.25 | $9.67 | $9.95 | $10.00 |
| Income from Investment Operations | | | | |
| Net investment income (loss)B,C | .23 | .13 | .21 | .13 |
| Net realized and unrealized gain (loss) | (.23) | 1.85 | (.23) | .01 |
| Total from investment operations | – | 1.98 | (.02) | .14 |
| Distributions from net investment income | (.26) | (.14) | (.16) | (.11) |
| Distributions from net realized gain | (.42) | (.26) | (.10) | (.08) |
| Total distributions | (.68) | (.40) | (.26) | (.19) |
| Net asset value, end of period | $10.57 | $11.25 | $9.67 | $9.95 |
| Total ReturnD | (.27)% | 20.60% | (.44)% | 1.52% |
| Ratios to Average Net AssetsC,E,F | | | | |
| Expenses before reductions | .27% | .27% | .27% | .28%G,H |
| Expenses net of fee waivers, if any | .27% | .27% | .27% | .28%G,H |
| Expenses net of all reductions | .27% | .27% | .27% | .28%G,H |
| Net investment income (loss) | 2.02% | 1.19% | 2.05% | 2.26%G |
| Supplemental Data | | | | |
| Net assets, end of period (000 omitted) | $35,745 | $64,959 | $48,155 | $1,697 |
| Portfolio turnover rateI | 51% | 37% | 42% | 98%G |
A For the period August 31, 2018 (commencement of operations) through March 31, 2019.
B Calculated based on average shares outstanding during the period.
C Net investment income (loss) is affected by the timing of the declaration of dividends by any underlying mutual funds or exchange-traded funds (ETFs). Net investment income (loss) of any such underlying funds is not included in the Fund's net investment income (loss) ratio.
D Total returns for periods of less than one year are not annualized.
E Fees and expenses of any underlying mutual funds or exchange-traded funds (ETFs) are not included in the Fund's expense ratio. The Fund indirectly bears its proportionate share of these expenses. For additional expense information related to investments in Fidelity Central Funds, please refer to the "Investments in Fidelity Central Funds" note found in the Notes to Financial Statements section of the most recent Annual or Semi-Annual report.
F Expense ratios reflect operating expenses of the class. Expenses before reductions do not reflect amounts reimbursed, waived, or reduced through arrangements with the investment adviser, brokerage services, or other offset arrangements, if applicable, and do not represent the amount paid by the class during periods when reimbursements, waivers or reductions occur.
G Annualized
H On certain classes, the size and fluctuation of net assets and expense amounts may cause ratios to differ from contractual rates.
I Amount does not include the portfolio activity of any underlying mutual funds or exchange-traded funds (ETFs).
See accompanying notes which are an integral part of the financial statements.
Fidelity Freedom Blend 2010 Fund Class I
| Years ended March 31, | 2022 | 2021 | 2020 | 2019 A |
| Selected Per–Share Data | | | | |
| Net asset value, beginning of period | $11.22 | $9.66 | $9.94 | $10.00 |
| Income from Investment Operations | | | | |
| Net investment income (loss)B,C | .20 | .11 | .19 | .12 |
| Net realized and unrealized gain (loss) | (.22) | 1.83 | (.22) | –D |
| Total from investment operations | (.02) | 1.94 | (.03) | .12 |
| Distributions from net investment income | (.26) | (.12) | (.15) | (.11) |
| Distributions from net realized gain | (.42) | (.26) | (.09) | (.08) |
| Total distributions | (.68) | (.38) | (.25)E | (.18)E |
| Net asset value, end of period | $10.52 | $11.22 | $9.66 | $9.94 |
| Total ReturnF | (.45)% | 20.25% | (.53)% | 1.35% |
| Ratios to Average Net AssetsC,G,H | | | | |
| Expenses before reductions | .47% | .47% | .47% | .47%I |
| Expenses net of fee waivers, if any | .47% | .47% | .47% | .47%I |
| Expenses net of all reductions | .47% | .47% | .47% | .47%I |
| Net investment income (loss) | 1.82% | .99% | 1.85% | 2.06%I |
| Supplemental Data | | | | |
| Net assets, end of period (000 omitted) | $1,156 | $914 | $453 | $101 |
| Portfolio turnover rateJ | 51% | 37% | 42% | 98%I |
A For the period August 31, 2018 (commencement of operations) through March 31, 2019.
B Calculated based on average shares outstanding during the period.
C Net investment income (loss) is affected by the timing of the declaration of dividends by any underlying mutual funds or exchange-traded funds (ETFs). Net investment income (loss) of any such underlying funds is not included in the Fund's net investment income (loss) ratio.
D Amount represents less than $.005 per share.
E Total distributions per share do not sum due to rounding.
F Total returns for periods of less than one year are not annualized.
G Fees and expenses of any underlying mutual funds or exchange-traded funds (ETFs) are not included in the Fund's expense ratio. The Fund indirectly bears its proportionate share of these expenses. For additional expense information related to investments in Fidelity Central Funds, please refer to the "Investments in Fidelity Central Funds" note found in the Notes to Financial Statements section of the most recent Annual or Semi-Annual report.
H Expense ratios reflect operating expenses of the class. Expenses before reductions do not reflect amounts reimbursed, waived, or reduced through arrangements with the investment adviser, brokerage services, or other offset arrangements, if applicable, and do not represent the amount paid by the class during periods when reimbursements, waivers or reductions occur.
I Annualized
J Amount does not include the portfolio activity of any underlying mutual funds or exchange-traded funds (ETFs).
See accompanying notes which are an integral part of the financial statements.
Fidelity Freedom Blend 2010 Fund Premier Class
| Years ended March 31, | 2022 A |
| Selected Per–Share Data | |
| Net asset value, beginning of period | $11.36 |
| Income from Investment Operations | |
| Net investment income (loss)B,C | .39 |
| Net realized and unrealized gain (loss) | (.50) |
| Total from investment operations | (.11) |
| Distributions from net investment income | (.28) |
| Distributions from net realized gain | (.42) |
| Total distributions | (.70) |
| Net asset value, end of period | $10.55 |
| Total ReturnD | (1.23)% |
| Ratios to Average Net AssetsC,E,F | |
| Expenses before reductions | .25%G |
| Expenses net of fee waivers, if any | .25%G |
| Expenses net of all reductions | .25%G |
| Net investment income (loss) | 3.49%G |
| Supplemental Data | |
| Net assets, end of period (000 omitted) | $32,687 |
| Portfolio turnover rateH | 51% |
A For the period April 6, 2021 (commencement of sale of shares) through March 31, 2022.
B Calculated based on average shares outstanding during the period.
C Net investment income (loss) is affected by the timing of the declaration of dividends by any underlying mutual funds or exchange-traded funds (ETFs). Net investment income (loss) of any such underlying funds is not included in the Fund's net investment income (loss) ratio.
D Total returns for periods of less than one year are not annualized.
E Fees and expenses of any underlying mutual funds or exchange-traded funds (ETFs) are not included in the Fund's expense ratio. The Fund indirectly bears its proportionate share of these expenses. For additional expense information related to investments in Fidelity Central Funds, please refer to the "Investments in Fidelity Central Funds" note found in the Notes to Financial Statements section of the most recent Annual or Semi-Annual report.
F Expense ratios reflect operating expenses of the class. Expenses before reductions do not reflect amounts reimbursed, waived, or reduced through arrangements with the investment adviser, brokerage services, or other offset arrangements, if applicable, and do not represent the amount paid by the class during periods when reimbursements, waivers or reductions occur.
G Annualized
H Amount does not include the portfolio activity of any underlying mutual funds or exchange-traded funds (ETFs).
See accompanying notes which are an integral part of the financial statements.
Fidelity Freedom Blend 2010 Fund Class Z
| Years ended March 31, | 2022 | 2021 | 2020 | 2019 A |
| Selected Per–Share Data | | | | |
| Net asset value, beginning of period | $11.25 | $9.68 | $9.94 | $10.00 |
| Income from Investment Operations | | | | |
| Net investment income (loss)B,C | .22 | .12 | .20 | .12 |
| Net realized and unrealized gain (loss) | (.23) | 1.84 | (.22) | .01 |
| Total from investment operations | (.01) | 1.96 | (.02) | .13 |
| Distributions from net investment income | (.26) | (.13) | (.15) | (.11) |
| Distributions from net realized gain | (.42) | (.26) | (.09) | (.08) |
| Total distributions | (.68) | (.39) | (.24) | (.19) |
| Net asset value, end of period | $10.56 | $11.25 | $9.68 | $9.94 |
| Total ReturnD | (.38)% | 20.42% | (.40)% | 1.38% |
| Ratios to Average Net AssetsC,E,F | | | | |
| Expenses before reductions | .37% | .37% | .37% | .37%G |
| Expenses net of fee waivers, if any | .37% | .37% | .37% | .37%G |
| Expenses net of all reductions | .37% | .37% | .37% | .37%G |
| Net investment income (loss) | 1.92% | 1.09% | 1.95% | 2.16%G |
| Supplemental Data | | | | |
| Net assets, end of period (000 omitted) | $144 | $247 | $101 | $101 |
| Portfolio turnover rateH | 51% | 37% | 42% | 98%G |
A For the period August 31, 2018 (commencement of operations) through March 31, 2019.
B Calculated based on average shares outstanding during the period.
C Net investment income (loss) is affected by the timing of the declaration of dividends by any underlying mutual funds or exchange-traded funds (ETFs). Net investment income (loss) of any such underlying funds is not included in the Fund's net investment income (loss) ratio.
D Total returns for periods of less than one year are not annualized.
E Fees and expenses of any underlying mutual funds or exchange-traded funds (ETFs) are not included in the Fund's expense ratio. The Fund indirectly bears its proportionate share of these expenses. For additional expense information related to investments in Fidelity Central Funds, please refer to the "Investments in Fidelity Central Funds" note found in the Notes to Financial Statements section of the most recent Annual or Semi-Annual report.
F Expense ratios reflect operating expenses of the class. Expenses before reductions do not reflect amounts reimbursed, waived, or reduced through arrangements with the investment adviser, brokerage services, or other offset arrangements, if applicable, and do not represent the amount paid by the class during periods when reimbursements, waivers or reductions occur.
G Annualized
H Amount does not include the portfolio activity of any underlying mutual funds or exchange-traded funds (ETFs).
See accompanying notes which are an integral part of the financial statements.
Fidelity Freedom Blend 2010 Fund Class Z6
| Years ended March 31, | 2022 | 2021 | 2020 | 2019 A |
| Selected Per–Share Data | | | | |
| Net asset value, beginning of period | $11.25 | $9.68 | $9.95 | $10.00 |
| Income from Investment Operations | | | | |
| Net investment income (loss)B,C | .22 | .13 | .21 | .13 |
| Net realized and unrealized gain (loss) | (.22) | 1.84 | (.23) | .01 |
| Total from investment operations | – | 1.97 | (.02) | .14 |
| Distributions from net investment income | (.28) | (.14) | (.15) | (.11) |
| Distributions from net realized gain | (.42) | (.26) | (.09) | (.08) |
| Total distributions | (.69)D | (.40) | (.25)D | (.19) |
| Net asset value, end of period | $10.56 | $11.25 | $9.68 | $9.95 |
| Total ReturnE | (.22)% | 20.55% | (.43)% | 1.52% |
| Ratios to Average Net AssetsC,F,G | | | | |
| Expenses before reductions | .27% | .27% | .27% | .27%H |
| Expenses net of fee waivers, if any | .27% | .27% | .27% | .27%H |
| Expenses net of all reductions | .27% | .27% | .27% | .27%H |
| Net investment income (loss) | 2.02% | 1.19% | 2.05% | 2.26%H |
| Supplemental Data | | | | |
| Net assets, end of period (000 omitted) | $5,903 | $882 | $287 | $101 |
| Portfolio turnover rateI | 51% | 37% | 42% | 98%H |
A For the period August 31, 2018 (commencement of operations) through March 31, 2019.
B Calculated based on average shares outstanding during the period.
C Net investment income (loss) is affected by the timing of the declaration of dividends by any underlying mutual funds or exchange-traded funds (ETFs). Net investment income (loss) of any such underlying funds is not included in the Fund's net investment income (loss) ratio.
D Total distributions per share do not sum due to rounding.
E Total returns for periods of less than one year are not annualized.
F Fees and expenses of any underlying mutual funds or exchange-traded funds (ETFs) are not included in the Fund's expense ratio. The Fund indirectly bears its proportionate share of these expenses. For additional expense information related to investments in Fidelity Central Funds, please refer to the "Investments in Fidelity Central Funds" note found in the Notes to Financial Statements section of the most recent Annual or Semi-Annual report.
G Expense ratios reflect operating expenses of the class. Expenses before reductions do not reflect amounts reimbursed, waived, or reduced through arrangements with the investment adviser, brokerage services, or other offset arrangements, if applicable, and do not represent the amount paid by the class during periods when reimbursements, waivers or reductions occur.
H Annualized
I Amount does not include the portfolio activity of any underlying mutual funds or exchange-traded funds (ETFs).
See accompanying notes which are an integral part of the financial statements.
Fidelity Freedom® Blend 2015 Fund
Investment Summary (Unaudited)
The information in the following tables is based on the direct investments of the Fund.
Top Holdings as of March 31, 2022
| | % of fund's net assets |
| Fidelity Series Investment Grade Bond Fund | 9.5 |
| Fidelity Series Government Bond Index Fund | 9.0 |
| Fidelity Series Emerging Markets Opportunities Fund | 7.6 |
| Fidelity Series Investment Grade Securitized Fund | 6.6 |
| Fidelity Series Corporate Bond Fund | 6.5 |
| Fidelity Series 0-5 Year Inflation-Protected Bond Index Fund | 5.6 |
| Fidelity Series Large Cap Value Index Fund | 5.5 |
| Fidelity Series 5+ Year Inflation-Protected Bond Index Fund | 4.9 |
| Fidelity Series Long-Term Treasury Bond Index Fund | 4.1 |
| Fidelity Series Blue Chip Growth Fund | 4.1 |
| | 63.4 |
Asset Allocation (% of fund's net assets)
| Period end |
| | Domestic Equity Funds | 20.1% |
| | International Equity Funds | 21.7% |
| | Bond Funds | 52.5% |
| | Short-Term Funds | 5.7% |

Percentages are adjusted for the effect of futures contracts and swaps, if applicable.
Domestic Equity Funds category includes Fidelity Series Commodity Strategy Fund which invests in commodity-related investments.
Fidelity Freedom® Blend 2015 Fund
Schedule of Investments March 31, 2022
Showing Percentage of Net Assets
| U.S. Treasury Obligations - 0.0% | | | |
| | | Principal Amount | Value |
| U.S. Treasury Bills, yield at date of purchase 0.11% to 0.5% 4/14/22 to 6/23/22 (a) | | | |
| (Cost $119,951) | | 120,000 | 119,954 |
| | | Shares | Value |
|
| Domestic Equity Funds - 20.1% | | | |
| Fidelity Series Blue Chip Growth Fund (b) | | 726,160 | $10,434,924 |
| Fidelity Series Commodity Strategy Fund (b) | | 735,402 | 3,757,905 |
| Fidelity Series Large Cap Growth Index Fund (b) | | 373,519 | 6,573,941 |
| Fidelity Series Large Cap Stock Fund (b) | | 385,914 | 7,336,228 |
| Fidelity Series Large Cap Value Index Fund (b) | | 914,264 | 14,043,100 |
| Fidelity Series Small Cap Opportunities Fund (b) | | 259,183 | 3,530,075 |
| Fidelity Series Value Discovery Fund (b) | | 324,509 | 5,192,137 |
| TOTAL DOMESTIC EQUITY FUNDS | | | |
| (Cost $41,456,459) | | | 50,868,310 |
|
| International Equity Funds - 21.7% | | | |
| Fidelity Series Canada Fund (b) | | 254,415 | 3,948,525 |
| Fidelity Series Emerging Markets Fund (b) | | 229,321 | 2,128,098 |
| Fidelity Series Emerging Markets Opportunities Fund (b) | | 1,042,273 | 19,177,820 |
| Fidelity Series International Growth Fund (b) | | 477,432 | 7,915,824 |
| Fidelity Series International Index Fund (b) | | 293,124 | 3,353,334 |
| Fidelity Series International Small Cap Fund (b) | | 139,140 | 2,497,565 |
| Fidelity Series International Value Fund (b) | | 724,891 | 7,995,544 |
| Fidelity Series Overseas Fund (b) | | 630,727 | 7,959,772 |
| TOTAL INTERNATIONAL EQUITY FUNDS | | | |
| (Cost $51,306,190) | | | 54,976,482 |
|
| Bond Funds - 52.5% | | | |
| Fidelity Series 0-5 Year Inflation-Protected Bond Index Fund (b) | | 1,424,704 | 14,289,777 |
| Fidelity Series 5+ Year Inflation-Protected Bond Index Fund (b) | | 1,285,161 | 12,337,542 |
| Fidelity Series Corporate Bond Fund (b) | | 1,618,180 | 16,343,617 |
| Fidelity Series Emerging Markets Debt Fund (b) | | 154,345 | 1,273,349 |
| Fidelity Series Emerging Markets Debt Local Currency Fund (b) | | 47,257 | 425,781 |
| Fidelity Series Floating Rate High Income Fund (b) | | 27,916 | 256,546 |
| Fidelity Series Government Bond Index Fund (b) | | 2,291,041 | 22,864,587 |
| Fidelity Series High Income Fund (b) | | 167,640 | 1,523,847 |
| Fidelity Series Inflation-Protected Bond Index Fund (b) | | 334,673 | 3,396,929 |
| Fidelity Series International Developed Markets Bond Index Fund (b) | | 862,478 | 8,046,924 |
| Fidelity Series Investment Grade Bond Fund (b) | | 2,204,280 | 24,048,695 |
| Fidelity Series Investment Grade Securitized Fund (b) | | 1,733,234 | 16,847,038 |
| Fidelity Series Long-Term Treasury Bond Index Fund (b) | | 1,376,431 | 10,488,406 |
| Fidelity Series Real Estate Income Fund (b) | | 81,194 | 922,369 |
| TOTAL BOND FUNDS | | | |
| (Cost $138,327,342) | | | 133,065,407 |
|
| Short-Term Funds - 5.7% | | | |
| Fidelity Cash Central Fund 0.31% (c) | | 94,741 | 94,760 |
| Fidelity Series Government Money Market Fund 0.31% (b)(d) | | 2,879,510 | 2,879,510 |
| Fidelity Series Short-Term Credit Fund (b) | | 295,917 | 2,885,193 |
| Fidelity Series Treasury Bill Index Fund (b) | | 864,805 | 8,639,404 |
| TOTAL SHORT-TERM FUNDS | | | |
| (Cost $14,558,741) | | | 14,498,867 |
| TOTAL INVESTMENT IN SECURITIES - 100.0% | | | |
| (Cost $245,768,683) | | | 253,529,020 |
| NET OTHER ASSETS (LIABILITIES) - 0.0% | | | 5,524 |
| NET ASSETS - 100% | | | $253,534,544 |
| Futures Contracts | | | | | |
| | Number of contracts | Expiration Date | Notional Amount | Value | Unrealized Appreciation/(Depreciation) |
| Purchased | | | | | |
| Equity Index Contracts | | | | | |
| ICE E-mini MSCI EAFE Index Contracts (United States) | 5 | June 2022 | $536,100 | $30,476 | $30,476 |
| ICE E-mini MSCI Emerging Markets Index Contracts (United States) | 13 | June 2022 | 731,575 | 42,198 | 42,198 |
| Sold | | | | | |
| Equity Index Contracts | | | | | |
| CME Micro E-mini S&P 500 Index Contracts (United States) | 5 | June 2022 | 1,132,688 | (23,588) | (23,588) |
| TOTAL FUTURES CONTRACTS | | | | | $49,086 |
The notional amount of futures purchased as a percentage of Net Assets is 0.5%
The notional amount of futures sold as a percentage of Net Assets is 0.4%
For the period, the average monthly notional amount at value for futures contracts in the aggregate was $277,123.
Legend
(a) Security or a portion of the security was pledged to cover margin requirements for futures contracts. At period end, the value of securities pledged amounted to $119,954.
(b) Affiliated Fund
(c) Affiliated fund that is generally available only to investment companies and other accounts managed by Fidelity Investments. The rate quoted is the annualized seven-day yield of the fund at period end. A complete unaudited listing of the fund's holdings as of its most recent quarter end is available upon request. In addition, each Fidelity Central Fund's financial statements, which are not covered by the Fund's Report of Independent Registered Public Accounting Firm, are available on the SEC's website or upon request.
(d) The rate quoted is the annualized seven-day yield of the fund at period end.
Affiliated Central Funds
Fiscal year to date information regarding the Fund's investments in Fidelity Central Funds, including the ownership percentage, is presented below.
| Fund | Value, beginning of period | Purchases | Sales Proceeds | Dividend Income | Realized Gain/Loss | Change in Unrealized appreciation (depreciation) | Value, end of period | % ownership, end of period |
| Fidelity Cash Central Fund 0.31% | $49 | $439,102 | $344,391 | $26 | $-- | $-- | $94,760 | 0.0% |
| Total | $49 | $439,102 | $344,391 | $26 | $-- | $-- | $94,760 | |
Amounts in the income column in the above table include any capital gain distributions from underlying funds, which are presented in the corresponding line-item in the Statement of Operations, if applicable.
Affiliated Underlying Funds
Fiscal year to date information regarding the Fund's investments in affiliated Underlying Funds is presented below. Exchanges between classes of the same affiliated Underlying Funds may occur. If an underlying Fund changes its name, the name presented below is the name in effect at period end.
| Affiliate | Value, beginning of period | Purchases(a) | Sales Proceeds(a) | Dividend Income | Realized Gain (loss) | Change in Unrealized appreciation (depreciation) | Value, end of period |
| Fidelity Series 0-5 Year Inflation-Protected Bond Index Fund | $-- | $15,061,632 | $740,509 | $52,793 | $(1,009) | $(22,477) | $14,289,777 |
| Fidelity Series 5+ Year Inflation-Protected Bond Index Fund | -- | 14,129,277 | 1,290,319 | 71,921 | (32,637) | (468,779) | 12,337,542 |
| Fidelity Series Blue Chip Growth Fund | 10,538,662 | 7,752,830 | 5,987,001 | 2,446,087 | 85,299 | (1,954,866) | 10,434,924 |
| Fidelity Series Canada Fund | 2,629,993 | 1,551,420 | 874,842 | 83,531 | 22,390 | 619,564 | 3,948,525 |
| Fidelity Series Commodity Strategy Fund | 6,535,073 | 4,128,380 | 7,067,734 | 2,315,852 | (274,175) | 436,361 | 3,757,905 |
| Fidelity Series Corporate Bond Fund | 15,418,584 | 6,372,223 | 4,258,040 | 486,340 | (45,669) | (1,143,481) | 16,343,617 |
| Fidelity Series Emerging Markets Debt Fund | 1,287,450 | 463,626 | 343,647 | 64,653 | (9,813) | (124,267) | 1,273,349 |
| Fidelity Series Emerging Markets Debt Local Currency Fund | 430,310 | 162,539 | 114,973 | 18,184 | (4,790) | (47,305) | 425,781 |
| Fidelity Series Emerging Markets Fund | 2,339,706 | 1,080,563 | 766,661 | 75,513 | (14,634) | (510,876) | 2,128,098 |
| Fidelity Series Emerging Markets Opportunities Fund | 21,034,347 | 12,310,272 | 7,427,077 | 2,389,564 | (241,091) | (6,498,631) | 19,177,820 |
| Fidelity Series Floating Rate High Income Fund | 259,363 | 91,371 | 94,218 | 12,055 | (118) | 148 | 256,546 |
| Fidelity Series Government Bond Index Fund | 19,011,061 | 8,922,857 | 3,950,787 | 240,923 | (52,407) | (1,066,137) | 22,864,587 |
| Fidelity Series Government Money Market Fund 0.31% | 9,871,751 | 1,950,234 | 8,942,475 | 5,441 | -- | -- | 2,879,510 |
| Fidelity Series High Income Fund | 1,494,141 | 544,950 | 463,890 | 89,058 | (3,509) | (47,845) | 1,523,847 |
| Fidelity Series Inflation-Protected Bond Index Fund | 19,841,396 | 5,972,251 | 22,469,960 | 912,344 | 1,359,599 | (1,306,357) | 3,396,929 |
| Fidelity Series International Developed Markets Bond Index Fund | -- | 8,815,339 | 408,198 | 2,784 | (6,073) | (354,144) | 8,046,924 |
| Fidelity Series International Growth Fund | 6,467,869 | 4,596,655 | 2,363,202 | 676,585 | 468 | (785,966) | 7,915,824 |
| Fidelity Series International Index Fund | 2,700,250 | 1,603,634 | 832,416 | 89,878 | 6,337 | (124,471) | 3,353,334 |
| Fidelity Series International Small Cap Fund | 2,332,675 | 1,170,432 | 592,074 | 351,476 | 14,105 | (427,573) | 2,497,565 |
| Fidelity Series International Value Fund | 6,460,634 | 4,080,913 | 2,603,153 | 424,433 | 2,905 | 54,245 | 7,995,544 |
| Fidelity Series Investment Grade Bond Fund | 21,100,306 | 8,994,187 | 4,697,852 | 541,021 | (49,887) | (1,298,059) | 24,048,695 |
| Fidelity Series Investment Grade Securitized Fund | 14,783,685 | 6,173,811 | 3,136,591 | 143,489 | (29,340) | (944,527) | 16,847,038 |
| Fidelity Series Large Cap Growth Index Fund | 6,651,630 | 3,088,342 | 4,066,810 | 222,462 | 460,986 | 439,793 | 6,573,941 |
| Fidelity Series Large Cap Stock Fund | 7,264,082 | 3,277,047 | 3,409,968 | 729,425 | 72,062 | 133,005 | 7,336,228 |
| Fidelity Series Large Cap Value Index Fund | 13,875,418 | 6,299,298 | 6,795,485 | 1,003,309 | 128,645 | 535,224 | 14,043,100 |
| Fidelity Series Long-Term Treasury Bond Index Fund | 6,440,306 | 6,723,735 | 2,331,866 | 191,669 | (184,275) | (159,494) | 10,488,406 |
| Fidelity Series Overseas Fund | 6,478,848 | 4,122,163 | 2,524,361 | 250,589 | 99,878 | (216,756) | 7,959,772 |
| Fidelity Series Real Estate Income Fund | 894,973 | 282,571 | 281,459 | 39,361 | 2,022 | 24,262 | 922,369 |
| Fidelity Series Short-Term Credit Fund | 4,868,840 | 2,321,708 | 4,120,453 | 92,449 | (42,441) | (142,461) | 2,885,193 |
| Fidelity Series Small Cap Opportunities Fund | 3,509,200 | 2,505,559 | 1,596,732 | 995,949 | (47,735) | (840,217) | 3,530,075 |
| Fidelity Series Treasury Bill Index Fund | 15,686,127 | 7,378,639 | 14,413,979 | 13,162 | (1,023) | (10,360) | 8,639,404 |
| Fidelity Series Value Discovery Fund | 5,126,868 | 2,487,932 | 2,456,481 | 636,148 | 69,348 | (35,530) | 5,192,137 |
| Total | $235,333,548 | $154,416,390 | $121,423,213 | $15,668,448 | $1,283,418 | $(16,287,977) | $253,314,306 |
(a) Includes the value of shares purchased or redeemed through in-kind transactions, if applicable.
Amounts in the income column in the above table include any capital gain distributions from underlying funds, which are presented in the corresponding line-item in the Statement of Operations, if applicable.
Investment Valuation
The following is a summary of the inputs used, as of March 31, 2022, involving the Fund's assets and liabilities carried at fair value. The inputs or methodology used for valuing securities may not be an indication of the risk associated with investing in those securities. For more information on valuation inputs, and their aggregation into the levels used below, please refer to the Investment Valuation section in the accompanying Notes to Financial Statements.
| | Valuation Inputs at Reporting Date: |
| Description | Total | Level 1 | Level 2 | Level 3 |
| Investments in Securities: | | | | |
| Other Short-Term Investments and Net Other Assets | $119,954 | $-- | $119,954 | $-- |
| Domestic Equity Funds | 50,868,310 | 50,868,310 | -- | -- |
| International Equity Funds | 54,976,482 | 54,976,482 | -- | -- |
| Bond Funds | 133,065,407 | 133,065,407 | -- | -- |
| Short-Term Funds | 14,498,867 | 14,498,867 | -- | -- |
| Total Investments in Securities: | $253,529,020 | $253,409,066 | $119,954 | $-- |
| Derivative Instruments: | | | | |
| Assets | | | | |
| Futures Contracts | $72,674 | $72,674 | $-- | $-- |
| Total Assets | $72,674 | $72,674 | $-- | $-- |
| Liabilities | | | | |
| Futures Contracts | $(23,588) | $(23,588) | $-- | $-- |
| Total Liabilities | $(23,588) | $(23,588) | $-- | $-- |
| Total Derivative Instruments: | $49,086 | $49,086 | $-- | $-- |
Value of Derivative Instruments
The following table is a summary of the Fund's value of derivative instruments by primary risk exposure as of March 31, 2022. For additional information on derivative instruments, please refer to the Derivative Instruments section in the accompanying Notes to Financial Statements.
| Primary Risk Exposure / Derivative Type | Value |
| | Asset | Liability |
| Equity Risk | | |
| Futures Contracts(a) | $72,674 | $(23,588) |
| Total Equity Risk | 72,674 | (23,588) |
| Total Value of Derivatives | $72,674 | $(23,588) |
(a) Reflects gross cumulative appreciation (depreciation) on futures contracts as presented in the Schedule of Investments. In the Statement of Assets and Liabilities, the period end daily variation margin is included in receivable or payable for daily variation margin on futures contracts, and the net cumulative appreciation (depreciation) is included in Total accumulated earnings (loss).
See accompanying notes which are an integral part of the financial statements.
Fidelity Freedom® Blend 2015 Fund
Financial Statements
Statement of Assets and Liabilities
| | | March 31, 2022 |
| Assets | | |
Investment in securities, at value — See accompanying schedule:
Unaffiliated issuers (cost $119,951) | $119,954 | |
| Fidelity Central Funds (cost $94,760) | 94,760 | |
| Other affiliated issuers (cost $245,553,972) | 253,314,306 | |
| Total Investment in Securities (cost $245,768,683) | | $253,529,020 |
| Cash | | 20,222 |
| Receivable for investments sold | | 6,503,261 |
| Receivable for fund shares sold | | 150,023 |
| Distributions receivable from Fidelity Central Funds | | 17 |
| Total assets | | 260,202,543 |
| Liabilities | | |
| Payable for investments purchased | $5,706,749 | |
| Payable for fund shares redeemed | 889,108 | |
| Accrued management fee | 60,635 | |
| Distribution and service plan fees payable | 970 | |
| Payable for daily variation margin on futures contracts | 10,537 | |
| Total liabilities | | 6,667,999 |
| Net Assets | | $253,534,544 |
| Net Assets consist of: | | |
| Paid in capital | | $242,137,643 |
| Total accumulated earnings (loss) | | 11,396,901 |
| Net Assets | | $253,534,544 |
| Net Asset Value and Maximum Offering Price | | |
| Class A: | | |
| Net Asset Value and redemption price per share ($700,712 ÷ 66,013 shares)(a) | | $10.61 |
| Maximum offering price per share (100/94.25 of $10.61) | | $11.26 |
| Class M: | | |
| Net Asset Value and redemption price per share ($627,158 ÷ 59,129 shares)(a) | | $10.61 |
| Maximum offering price per share (100/96.50 of $10.61) | | $10.99 |
| Class C: | | |
| Net Asset Value and offering price per share ($605,713 ÷ 57,652 shares)(a) | | $10.51 |
| Fidelity Freedom Blend 2015 Fund: | | |
| Net Asset Value, offering price and redemption price per share ($13,189,169 ÷ 1,240,313 shares) | | $10.63 |
| Class K: | | |
| Net Asset Value, offering price and redemption price per share ($7,338,285 ÷ 688,601 shares) | | $10.66 |
| Class K6: | | |
| Net Asset Value, offering price and redemption price per share ($85,898,728 ÷ 8,033,793 shares) | | $10.69 |
| Class I: | | |
| Net Asset Value, offering price and redemption price per share ($5,024,581 ÷ 472,470 shares) | | $10.63 |
| Class Z: | | |
| Net Asset Value, offering price and redemption price per share ($124,668 ÷ 11,675 shares) | | $10.68 |
| Class Z6: | | |
| Net Asset Value, offering price and redemption price per share ($29,532,244 ÷ 2,770,272 shares) | | $10.66 |
| Premier Class: | | |
| Net Asset Value, offering price and redemption price per share ($110,493,286 ÷ 10,358,908 shares) | | $10.67 |
(a) Redemption price per share is equal to net asset value less any applicable contingent deferred sales charge.
See accompanying notes which are an integral part of the financial statements.
Statement of Operations
| | | Year ended March 31, 2022 |
| Investment Income | | |
| Dividends: | | |
| Affiliated issuers | | $7,247,228 |
| Interest | | 27 |
| Income from Fidelity Central Funds | | 26 |
| Total income | | 7,247,281 |
| Expenses | | |
| Management fee | $766,695 | |
| Distribution and service plan fees | 14,300 | |
| Independent trustees' fees and expenses | 789 | |
| Total expenses | | 781,784 |
| Net investment income (loss) | | 6,465,497 |
| Realized and Unrealized Gain (Loss) | | |
| Net realized gain (loss) on: | | |
| Investment securities: | | |
| Affiliated issuers | 1,283,418 | |
| Futures contracts | (41,068) | |
| Capital gain distributions from underlying funds: | | |
| Affiliated issuers | 8,421,220 | |
| Total net realized gain (loss) | | 9,663,570 |
| Change in net unrealized appreciation (depreciation) on: | | |
| Investment securities: | | |
| Unaffiliated issuers | 3 | |
| Affiliated issuers | (16,287,977) | |
| Futures contracts | 49,086 | |
| Total change in net unrealized appreciation (depreciation) | | (16,238,888) |
| Net gain (loss) | | (6,575,318) |
| Net increase (decrease) in net assets resulting from operations | | $(109,821) |
See accompanying notes which are an integral part of the financial statements.
Statement of Changes in Net Assets
| | Year ended March 31, 2022 | Year ended March 31, 2021 |
| Increase (Decrease) in Net Assets | | |
| Operations | | |
| Net investment income (loss) | $6,465,497 | $2,673,274 |
| Net realized gain (loss) | 9,663,570 | 10,611,106 |
| Change in net unrealized appreciation (depreciation) | (16,238,888) | 36,083,385 |
| Net increase (decrease) in net assets resulting from operations | (109,821) | 49,367,765 |
| Distributions to shareholders | (17,571,412) | (9,449,814) |
| Share transactions - net increase (decrease) | 35,940,896 | 12,988,414 |
| Total increase (decrease) in net assets | 18,259,663 | 52,906,365 |
| Net Assets | | |
| Beginning of period | 235,274,881 | 182,368,516 |
| End of period | $253,534,544 | $235,274,881 |
See accompanying notes which are an integral part of the financial statements.
Financial Highlights
Fidelity Freedom Blend 2015 Fund Class A
| Years ended March 31, | 2022 | 2021 | 2020 | 2019 A |
| Selected Per–Share Data | | | | |
| Net asset value, beginning of period | $11.36 | $9.43 | $9.91 | $10.00 |
| Income from Investment Operations | | | | |
| Net investment income (loss)B,C | .18 | .08 | .16 | .07 |
| Net realized and unrealized gain (loss) | (.17) | 2.28 | (.37) | –D |
| Total from investment operations | .01 | 2.36 | (.21) | .07 |
| Distributions from net investment income | (.24) | (.11) | (.15) | (.09) |
| Distributions from net realized gain | (.52) | (.33) | (.12) | (.07) |
| Total distributions | (.76) | (.43)E | (.27) | (.16) |
| Net asset value, end of period | $10.61 | $11.36 | $9.43 | $9.91 |
| Total ReturnF,G | (.22)% | 25.27% | (2.38)% | .85% |
| Ratios to Average Net AssetsC,H,I | | | | |
| Expenses before reductions | .73% | .73% | .73% | .74%J |
| Expenses net of fee waivers, if any | .73% | .73% | .73% | .74%J |
| Expenses net of all reductions | .73% | .73% | .73% | .74%J |
| Net investment income (loss) | 1.54% | .77% | 1.58% | 1.24%J |
| Supplemental Data | | | | |
| Net assets, end of period (000 omitted) | $701 | $626 | $346 | $195 |
| Portfolio turnover rateK | 47% | 43% | 40% | 52%J |
A For the period August 31, 2018 (commencement of operations) through March 31, 2019.
B Calculated based on average shares outstanding during the period.
C Net investment income (loss) is affected by the timing of the declaration of dividends by any underlying mutual funds or exchange-traded funds (ETFs). Net investment income (loss) of any such underlying funds is not included in the Fund's net investment income (loss) ratio.
��D Amount represents less than $.005 per share.
E Total distributions per share do not sum due to rounding.
F Total returns for periods of less than one year are not annualized.
G Total returns do not include the effect of the sales charges.
H Fees and expenses of any underlying mutual funds or exchange-traded funds (ETFs) are not included in the Fund's expense ratio. The Fund indirectly bears its proportionate share of these expenses. For additional expense information related to investments in Fidelity Central Funds, please refer to the "Investments in Fidelity Central Funds" note found in the Notes to Financial Statements section of the most recent Annual or Semi-Annual report.
I Expense ratios reflect operating expenses of the class. Expenses before reductions do not reflect amounts reimbursed, waived, or reduced through arrangements with the investment adviser, brokerage services, or other offset arrangements, if applicable, and do not represent the amount paid by the class during periods when reimbursements, waivers or reductions occur.
J Annualized
K Amount does not include the portfolio activity of any underlying mutual funds or exchange-traded funds (ETFs).
See accompanying notes which are an integral part of the financial statements.
Fidelity Freedom Blend 2015 Fund Class M
| Years ended March 31, | 2022 | 2021 | 2020 | 2019 A |
| Selected Per–Share Data | | | | |
| Net asset value, beginning of period | $11.35 | $9.44 | $9.90 | $10.00 |
| Income from Investment Operations | | | | |
| Net investment income (loss)B,C | .15 | .06 | .14 | .06 |
| Net realized and unrealized gain (loss) | (.16) | 2.27 | (.36) | –D |
| Total from investment operations | (.01) | 2.33 | (.22) | .06 |
| Distributions from net investment income | (.21) | (.09) | (.12) | (.09) |
| Distributions from net realized gain | (.52) | (.33) | (.12) | (.07) |
| Total distributions | (.73) | (.42) | (.24) | (.16) |
| Net asset value, end of period | $10.61 | $11.35 | $9.44 | $9.90 |
| Total ReturnE,F | (.40)% | 24.86% | (2.50)% | .67% |
| Ratios to Average Net AssetsC,G,H | | | | |
| Expenses before reductions | .98% | .98% | .98% | .99%I |
| Expenses net of fee waivers, if any | .98% | .98% | .98% | .99%I |
| Expenses net of all reductions | .98% | .98% | .98% | .99%I |
| Net investment income (loss) | 1.29% | .52% | 1.33% | .99%I |
| Supplemental Data | | | | |
| Net assets, end of period (000 omitted) | $627 | $696 | $107 | $101 |
| Portfolio turnover rateJ | 47% | 43% | 40% | 52%I |
A For the period August 31, 2018 (commencement of operations) through March 31, 2019.
B Calculated based on average shares outstanding during the period.
C Net investment income (loss) is affected by the timing of the declaration of dividends by any underlying mutual funds or exchange-traded funds (ETFs). Net investment income (loss) of any such underlying funds is not included in the Fund's net investment income (loss) ratio.
D Amount represents less than $.005 per share.
E Total returns for periods of less than one year are not annualized.
F Total returns do not include the effect of the sales charges.
G Fees and expenses of any underlying mutual funds or exchange-traded funds (ETFs) are not included in the Fund's expense ratio. The Fund indirectly bears its proportionate share of these expenses. For additional expense information related to investments in Fidelity Central Funds, please refer to the "Investments in Fidelity Central Funds" note found in the Notes to Financial Statements section of the most recent Annual or Semi-Annual report.
H Expense ratios reflect operating expenses of the class. Expenses before reductions do not reflect amounts reimbursed, waived, or reduced through arrangements with the investment adviser, brokerage services, or other offset arrangements, if applicable, and do not represent the amount paid by the class during periods when reimbursements, waivers or reductions occur.
I Annualized
J Amount does not include the portfolio activity of any underlying mutual funds or exchange-traded funds (ETFs).
See accompanying notes which are an integral part of the financial statements.
Fidelity Freedom Blend 2015 Fund Class C
| Years ended March 31, | 2022 | 2021 | 2020 | 2019 A |
| Selected Per–Share Data | | | | |
| Net asset value, beginning of period | $11.28 | $9.39 | $9.87 | $10.00 |
| Income from Investment Operations | | | | |
| Net investment income (loss)B,C | .09 | –D | .08 | .03 |
| Net realized and unrealized gain (loss) | (.16) | 2.26 | (.36) | –D |
| Total from investment operations | (.07) | 2.26 | (.28) | .03 |
| Distributions from net investment income | (.18) | (.05) | (.08) | (.09) |
| Distributions from net realized gain | (.52) | (.33) | (.12) | (.07) |
| Total distributions | (.70) | (.37)E | (.20) | (.16) |
| Net asset value, end of period | $10.51 | $11.28 | $9.39 | $9.87 |
| Total ReturnF,G | (.94)% | 24.28% | (3.04)% | .43% |
| Ratios to Average Net AssetsC,H,I | | | | |
| Expenses before reductions | 1.48% | 1.48% | 1.48% | 1.50%J,K |
| Expenses net of fee waivers, if any | 1.48% | 1.48% | 1.48% | 1.50%J,K |
| Expenses net of all reductions | 1.48% | 1.48% | 1.48% | 1.50%J,K |
| Net investment income (loss) | .79% | .02% | .83% | .48%J |
| Supplemental Data | | | | |
| Net assets, end of period (000 omitted) | $606 | $763 | $467 | $144 |
| Portfolio turnover rateL | 47% | 43% | 40% | 52%J |
A For the period August 31, 2018 (commencement of operations) through March 31, 2019.
B Calculated based on average shares outstanding during the period.
C Net investment income (loss) is affected by the timing of the declaration of dividends by any underlying mutual funds or exchange-traded funds (ETFs). Net investment income (loss) of any such underlying funds is not included in the Fund's net investment income (loss) ratio.
D Amount represents less than $.005 per share.
E Total distributions per share do not sum due to rounding.
F Total returns for periods of less than one year are not annualized.
G Total returns do not include the effect of the contingent deferred sales charge.
H Fees and expenses of any underlying mutual funds or exchange-traded funds (ETFs) are not included in the Fund's expense ratio. The Fund indirectly bears its proportionate share of these expenses. For additional expense information related to investments in Fidelity Central Funds, please refer to the "Investments in Fidelity Central Funds" note found in the Notes to Financial Statements section of the most recent Annual or Semi-Annual report.
I Expense ratios reflect operating expenses of the class. Expenses before reductions do not reflect amounts reimbursed, waived, or reduced through arrangements with the investment adviser, brokerage services, or other offset arrangements, if applicable, and do not represent the amount paid by the class during periods when reimbursements, waivers or reductions occur.
J Annualized
K On certain classes, the size and fluctuation of net assets and expense amounts may cause ratios to differ from contractual rates.
L Amount does not include the portfolio activity of any underlying mutual funds or exchange-traded funds (ETFs).
See accompanying notes which are an integral part of the financial statements.
Fidelity Freedom Blend 2015 Fund
| Years ended March 31, | 2022 | 2021 | 2020 | 2019 A |
| Selected Per–Share Data | | | | |
| Net asset value, beginning of period | $11.37 | $9.44 | $9.91 | $10.00 |
| Income from Investment Operations | | | | |
| Net investment income (loss)B,C | .20 | .11 | .19 | .08 |
| Net realized and unrealized gain (loss) | (.16) | 2.27 | (.37) | .01 |
| Total from investment operations | .04 | 2.38 | (.18) | .09 |
| Distributions from net investment income | (.26) | (.13) | (.17) | (.11) |
| Distributions from net realized gain | (.52) | (.33) | (.12) | (.07) |
| Total distributions | (.78) | (.45)D | (.29) | (.18) |
| Net asset value, end of period | $10.63 | $11.37 | $9.44 | $9.91 |
| Total ReturnE | .03% | 25.50% | (2.09)% | 1.02% |
| Ratios to Average Net AssetsC,F,G | | | | |
| Expenses before reductions | .48% | .48% | .49%H | .49%I |
| Expenses net of fee waivers, if any | .48% | .48% | .49%H | .49%I�� |
| Expenses net of all reductions | .48% | .48% | .49%H | .49%I |
| Net investment income (loss) | 1.79% | 1.02% | 1.83% | 1.49%I |
| Supplemental Data | | | | |
| Net assets, end of period (000 omitted) | $13,189 | $11,995 | $8,440 | $468 |
| Portfolio turnover rateJ | 47% | 43% | 40% | 52%I |
A For the period August 31, 2018 (commencement of operations) through March 31, 2019.
B Calculated based on average shares outstanding during the period.
C Net investment income (loss) is affected by the timing of the declaration of dividends by any underlying mutual funds or exchange-traded funds (ETFs). Net investment income (loss) of any such underlying funds is not included in the Fund's net investment income (loss) ratio.
D Total distributions per share do not sum due to rounding.
E Total returns for periods of less than one year are not annualized.
F Fees and expenses of any underlying mutual funds or exchange-traded funds (ETFs) are not included in the Fund's expense ratio. The Fund indirectly bears its proportionate share of these expenses. For additional expense information related to investments in Fidelity Central Funds, please refer to the "Investments in Fidelity Central Funds" note found in the Notes to Financial Statements section of the most recent Annual or Semi-Annual report.
G Expense ratios reflect operating expenses of the class. Expenses before reductions do not reflect amounts reimbursed, waived, or reduced through arrangements with the investment adviser, brokerage services, or other offset arrangements, if applicable, and do not represent the amount paid by the class during periods when reimbursements, waivers or reductions occur.
H On certain classes, the size and fluctuation of net assets and expense amounts may cause ratios to differ from contractual rates.
I Annualized
J Amount does not include the portfolio activity of any underlying mutual funds or exchange-traded funds (ETFs).
See accompanying notes which are an integral part of the financial statements.
Fidelity Freedom Blend 2015 Fund Class K
| Years ended March 31, | 2022 | 2021 | 2020 | 2019 A |
| Selected Per–Share Data | | | | |
| Net asset value, beginning of period | $11.40 | $9.45 | $9.92 | $10.00 |
| Income from Investment Operations | | | | |
| Net investment income (loss)B,C | .22 | .12 | .20 | .09 |
| Net realized and unrealized gain (loss) | (.17) | 2.29 | (.37) | –D |
| Total from investment operations | .05 | 2.41 | (.17) | .09 |
| Distributions from net investment income | (.28) | (.13) | (.18) | (.11) |
| Distributions from net realized gain | (.52) | (.33) | (.12) | (.07) |
| Total distributions | (.79)E | (.46) | (.30) | (.17)E |
| Net asset value, end of period | $10.66 | $11.40 | $9.45 | $9.92 |
| Total ReturnF | .16% | 25.74% | (2.03)% | 1.07% |
| Ratios to Average Net AssetsC,G,H | | | | |
| Expenses before reductions | .38% | .38% | .38% | .39%I |
| Expenses net of fee waivers, if any | .38% | .38% | .38% | .39%I |
| Expenses net of all reductions | .38% | .38% | .38% | .39%I |
| Net investment income (loss) | 1.89% | 1.12% | 1.93% | 1.59%I |
| Supplemental Data | | | | |
| Net assets, end of period (000 omitted) | $7,338 | $5,237 | $6,147 | $101 |
| Portfolio turnover rateJ | 47% | 43% | 40% | 52%I |
A For the period August 31, 2018 (commencement of operations) through March 31, 2019.
B Calculated based on average shares outstanding during the period.
C Net investment income (loss) is affected by the timing of the declaration of dividends by any underlying mutual funds or exchange-traded funds (ETFs). Net investment income (loss) of any such underlying funds is not included in the Fund's net investment income (loss) ratio.
D Amount represents less than $.005 per share.
E Total distributions per share do not sum due to rounding.
F Total returns for periods of less than one year are not annualized.
G Fees and expenses of any underlying mutual funds or exchange-traded funds (ETFs) are not included in the Fund's expense ratio. The Fund indirectly bears its proportionate share of these expenses. For additional expense information related to investments in Fidelity Central Funds, please refer to the "Investments in Fidelity Central Funds" note found in the Notes to Financial Statements section of the most recent Annual or Semi-Annual report.
H Expense ratios reflect operating expenses of the class. Expenses before reductions do not reflect amounts reimbursed, waived, or reduced through arrangements with the investment adviser, brokerage services, or other offset arrangements, if applicable, and do not represent the amount paid by the class during periods when reimbursements, waivers or reductions occur.
I Annualized
J Amount does not include the portfolio activity of any underlying mutual funds or exchange-traded funds (ETFs).
See accompanying notes which are an integral part of the financial statements.
Fidelity Freedom Blend 2015 Fund Class K6
| Years ended March 31, | 2022 | 2021 | 2020 | 2019 A |
| Selected Per–Share Data | | | | |
| Net asset value, beginning of period | $11.41 | $9.47 | $9.92 | $10.00 |
| Income from Investment Operations | | | | |
| Net investment income (loss)B,C | .23 | .13 | .21 | .09 |
| Net realized and unrealized gain (loss) | (.16) | 2.28 | (.37) | .01D |
| Total from investment operations | .07 | 2.41 | (.16) | .10 |
| Distributions from net investment income | (.27) | (.14) | (.17) | (.11) |
| Distributions from net realized gain | (.52) | (.33) | (.12) | (.07) |
| Total distributions | (.79) | (.47) | (.29) | (.18) |
| Net asset value, end of period | $10.69 | $11.41 | $9.47 | $9.92 |
| Total ReturnE | .28% | 25.71% | (1.86)% | 1.12% |
| Ratios to Average Net AssetsC,F,G | | | | |
| Expenses before reductions | .28% | .28% | .28% | .30%H,I |
| Expenses net of fee waivers, if any | .28% | .28% | .28% | .30%H,I |
| Expenses net of all reductions | .28% | .28% | .28% | .30%H,I |
| Net investment income (loss) | 1.99% | 1.22% | 2.03% | 1.68%H |
| Supplemental Data | | | | |
| Net assets, end of period (000 omitted) | $85,899 | $208,674 | $162,504 | $8,164 |
| Portfolio turnover rateJ | 47% | 43% | 40% | 52%H |
A For the period August 31, 2018 (commencement of operations) through March 31, 2019.
B Calculated based on average shares outstanding during the period.
C Net investment income (loss) is affected by the timing of the declaration of dividends by any underlying mutual funds or exchange-traded funds (ETFs). Net investment income (loss) of any such underlying funds is not included in the Fund's net investment income (loss) ratio.
D Amount represents less than $.005 per share.
E Total returns for periods of less than one year are not annualized.
F Fees and expenses of any underlying mutual funds or exchange-traded funds (ETFs) are not included in the Fund's expense ratio. The Fund indirectly bears its proportionate share of these expenses. For additional expense information related to investments in Fidelity Central Funds, please refer to the "Investments in Fidelity Central Funds" note found in the Notes to Financial Statements section of the most recent Annual or Semi-Annual report.
G Expense ratios reflect operating expenses of the class. Expenses before reductions do not reflect amounts reimbursed, waived, or reduced through arrangements with the investment adviser, brokerage services, or other offset arrangements, if applicable, and do not represent the amount paid by the class during periods when reimbursements, waivers or reductions occur.
H Annualized
I On certain classes, the size and fluctuation of net assets and expense amounts may cause ratios to differ from contractual rates.
J Amount does not include the portfolio activity of any underlying mutual funds or exchange-traded funds (ETFs).
See accompanying notes which are an integral part of the financial statements.
Fidelity Freedom Blend 2015 Fund Class I
| Years ended March 31, | 2022 | 2021 | 2020 | 2019 A |
| Selected Per–Share Data | | | | |
| Net asset value, beginning of period | $11.38 | $9.44 | $9.92 | $10.00 |
| Income from Investment Operations | | | | |
| Net investment income (loss)B,C | .20 | .11 | .19 | .08 |
| Net realized and unrealized gain (loss) | (.17) | 2.28 | (.37) | .01 |
| Total from investment operations | .03 | 2.39 | (.18) | .09 |
| Distributions from net investment income | (.26) | (.12) | (.18) | (.10) |
| Distributions from net realized gain | (.52) | (.33) | (.12) | (.07) |
| Total distributions | (.78) | (.45) | (.30) | (.17) |
| Net asset value, end of period | $10.63 | $11.38 | $9.44 | $9.92 |
| Total ReturnD | (.03)% | 25.55% | (2.09)% | 1.04% |
| Ratios to Average Net AssetsC,E,F | | | | |
| Expenses before reductions | .48% | .48% | .48% | .49%G |
| Expenses net of fee waivers, if any | .48% | .48% | .48% | .49%G |
| Expenses net of all reductions | .48% | .48% | .48% | .49%G |
| Net investment income (loss) | 1.79% | 1.02% | 1.83% | 1.49%G |
| Supplemental Data | | | | |
| Net assets, end of period (000 omitted) | $5,025 | $5,420 | $3,592 | $101 |
| Portfolio turnover rateH | 47% | 43% | 40% | 52%G |
A For the period August 31, 2018 (commencement of operations) through March 31, 2019.
B Calculated based on average shares outstanding during the period.
C Net investment income (loss) is affected by the timing of the declaration of dividends by any underlying mutual funds or exchange-traded funds (ETFs). Net investment income (loss) of any such underlying funds is not included in the Fund's net investment income (loss) ratio.
D Total returns for periods of less than one year are not annualized.
E Fees and expenses of any underlying mutual funds or exchange-traded funds (ETFs) are not included in the Fund's expense ratio. The Fund indirectly bears its proportionate share of these expenses. For additional expense information related to investments in Fidelity Central Funds, please refer to the "Investments in Fidelity Central Funds" note found in the Notes to Financial Statements section of the most recent Annual or Semi-Annual report.
F Expense ratios reflect operating expenses of the class. Expenses before reductions do not reflect amounts reimbursed, waived, or reduced through arrangements with the investment adviser, brokerage services, or other offset arrangements, if applicable, and do not represent the amount paid by the class during periods when reimbursements, waivers or reductions occur.
G Annualized
H Amount does not include the portfolio activity of any underlying mutual funds or exchange-traded funds (ETFs).
See accompanying notes which are an integral part of the financial statements.
Fidelity Freedom Blend 2015 Fund Premier Class
| Years ended March 31, | 2022 A |
| Selected Per–Share Data | |
| Net asset value, beginning of period | $11.55 |
| Income from Investment Operations | |
| Net investment income (loss)B,C | .40 |
| Net realized and unrealized gain (loss) | (.47) |
| Total from investment operations | (.07) |
| Distributions from net investment income | (.30) |
| Distributions from net realized gain | (.52) |
| Total distributions | (.81)D |
| Net asset value, end of period | $10.67 |
| Total ReturnE | (.88)% |
| Ratios to Average Net AssetsC,F,G | |
| Expenses before reductions | .25%H |
| Expenses net of fee waivers, if any | .25%H |
| Expenses net of all reductions | .25%H |
| Net investment income (loss) | 3.58%H |
| Supplemental Data | |
| Net assets, end of period (000 omitted) | $110,493 |
| Portfolio turnover rateI | 47% |
A For the period April 6, 2021 (commencement of sale of shares) through March 31, 2022.
B Calculated based on average shares outstanding during the period.
C Net investment income (loss) is affected by the timing of the declaration of dividends by any underlying mutual funds or exchange-traded funds (ETFs). Net investment income (loss) of any such underlying funds is not included in the Fund's net investment income (loss) ratio.
D Total distributions per share do not sum due to rounding.
E Total returns for periods of less than one year are not annualized.
F Fees and expenses of any underlying mutual funds or exchange-traded funds (ETFs) are not included in the Fund's expense ratio. The Fund indirectly bears its proportionate share of these expenses. For additional expense information related to investments in Fidelity Central Funds, please refer to the "Investments in Fidelity Central Funds" note found in the Notes to Financial Statements section of the most recent Annual or Semi-Annual report.
G Expense ratios reflect operating expenses of the class. Expenses before reductions do not reflect amounts reimbursed, waived, or reduced through arrangements with the investment adviser, brokerage services, or other offset arrangements, if applicable, and do not represent the amount paid by the class during periods when reimbursements, waivers or reductions occur.
H Annualized
I Amount does not include the portfolio activity of any underlying mutual funds or exchange-traded funds (ETFs).
See accompanying notes which are an integral part of the financial statements.
Fidelity Freedom Blend 2015 Fund Class Z
| Years ended March 31, | 2022 | 2021 | 2020 | 2019 A |
| Selected Per–Share Data | | | | |
| Net asset value, beginning of period | $11.42 | $9.47 | $9.92 | $10.00 |
| Income from Investment Operations | | | | |
| Net investment income (loss)B,C | .22 | .12 | .20 | .09 |
| Net realized and unrealized gain (loss) | (.17) | 2.29 | (.37) | –D |
| Total from investment operations | .05 | 2.41 | (.17) | .09 |
| Distributions from net investment income | (.27) | (.13) | (.16) | (.11) |
| Distributions from net realized gain | (.52) | (.33) | (.12) | (.07) |
| Total distributions | (.79) | (.46) | (.28) | (.17)E |
| Net asset value, end of period | $10.68 | $11.42 | $9.47 | $9.92 |
| Total ReturnF | .13% | 25.70% | (1.99)% | 1.07% |
| Ratios to Average Net AssetsC,G,H | | | | |
| Expenses before reductions | .38% | .38% | .38% | .39%I |
| Expenses net of fee waivers, if any | .38% | .38% | .38% | .39%I |
| Expenses net of all reductions | .38% | .38% | .38% | .39%I |
| Net investment income (loss) | 1.89% | 1.12% | 1.93% | 1.59%I |
| Supplemental Data | | | | |
| Net assets, end of period (000 omitted) | $125 | $124 | $99 | $101 |
| Portfolio turnover rateJ | 47% | 43% | 40% | 52%I |
A For the period August 31, 2018 (commencement of operations) through March 31, 2019.
B Calculated based on average shares outstanding during the period.
C Net investment income (loss) is affected by the timing of the declaration of dividends by any underlying mutual funds or exchange-traded funds (ETFs). Net investment income (loss) of any such underlying funds is not included in the Fund's net investment income (loss) ratio.
D Amount represents less than $.005 per share.
E Total distributions per share do not sum due to rounding.
F Total returns for periods of less than one year are not annualized.
G Fees and expenses of any underlying mutual funds or exchange-traded funds (ETFs) are not included in the Fund's expense ratio. The Fund indirectly bears its proportionate share of these expenses. For additional expense information related to investments in Fidelity Central Funds, please refer to the "Investments in Fidelity Central Funds" note found in the Notes to Financial Statements section of the most recent Annual or Semi-Annual report.
H Expense ratios reflect operating expenses of the class. Expenses before reductions do not reflect amounts reimbursed, waived, or reduced through arrangements with the investment adviser, brokerage services, or other offset arrangements, if applicable, and do not represent the amount paid by the class during periods when reimbursements, waivers or reductions occur.
I Annualized
J Amount does not include the portfolio activity of any underlying mutual funds or exchange-traded funds (ETFs).
See accompanying notes which are an integral part of the financial statements.
Fidelity Freedom Blend 2015 Fund Class Z6
| Years ended March 31, | 2022 | 2021 | 2020 | 2019 A |
| Selected Per–Share Data | | | | |
| Net asset value, beginning of period | $11.40 | $9.46 | $9.92 | $10.00 |
| Income from Investment Operations | | | | |
| Net investment income (loss)B,C | .22 | .13 | .21 | .10 |
| Net realized and unrealized gain (loss) | (.15) | 2.29 | (.37) | – |
| Total from investment operations | .07 | 2.42 | (.16) | .10 |
| Distributions from net investment income | (.29) | (.15) | (.18) | (.11) |
| Distributions from net realized gain | (.52) | (.33) | (.12) | (.07) |
| Total distributions | (.81) | (.48) | (.30) | (.18) |
| Net asset value, end of period | $10.66 | $11.40 | $9.46 | $9.92 |
| Total ReturnD | .27% | 25.84% | (1.95)% | 1.12% |
| Ratios to Average Net AssetsC,E,F | | | | |
| Expenses before reductions | .28% | .28% | .28% | .29%G |
| Expenses net of fee waivers, if any | .28% | .28% | .28% | .29%G |
| Expenses net of all reductions | .28% | .28% | .28% | .29%G |
| Net investment income (loss) | 1.99% | 1.22% | 2.03% | 1.69%G |
| Supplemental Data | | | | |
| Net assets, end of period (000 omitted) | $29,532 | $1,740 | $667 | $101 |
| Portfolio turnover rateH | 47% | 43% | 40% | 52%G |
A For the period August 31, 2018 (commencement of operations) through March 31, 2019.
B Calculated based on average shares outstanding during the period.
C Net investment income (loss) is affected by the timing of the declaration of dividends by any underlying mutual funds or exchange-traded funds (ETFs). Net investment income (loss) of any such underlying funds is not included in the Fund's net investment income (loss) ratio.
D Total returns for periods of less than one year are not annualized.
E Fees and expenses of any underlying mutual funds or exchange-traded funds (ETFs) are not included in the Fund's expense ratio. The Fund indirectly bears its proportionate share of these expenses. For additional expense information related to investments in Fidelity Central Funds, please refer to the "Investments in Fidelity Central Funds" note found in the Notes to Financial Statements section of the most recent Annual or Semi-Annual report.
F Expense ratios reflect operating expenses of the class. Expenses before reductions do not reflect amounts reimbursed, waived, or reduced through arrangements with the investment adviser, brokerage services, or other offset arrangements, if applicable, and do not represent the amount paid by the class during periods when reimbursements, waivers or reductions occur.
G Annualized
H Amount does not include the portfolio activity of any underlying mutual funds or exchange-traded funds (ETFs).
See accompanying notes which are an integral part of the financial statements.
Fidelity Freedom® Blend 2020 Fund
Investment Summary (Unaudited)
The information in the following tables is based on the direct investments of the Fund.
Top Holdings as of March 31, 2022
| | % of fund's net assets |
| Fidelity Series Emerging Markets Opportunities Fund | 8.5 |
| Fidelity Series Investment Grade Bond Fund | 8.4 |
| Fidelity Series Government Bond Index Fund | 8.0 |
| Fidelity Series Large Cap Value Index Fund | 7.2 |
| Fidelity Series 5+ Year Inflation-Protected Bond Index Fund | 6.9 |
| Fidelity Series Investment Grade Securitized Fund | 5.9 |
| Fidelity Series Corporate Bond Fund | 5.7 |
| Fidelity Series Blue Chip Growth Fund | 5.3 |
| Fidelity Series Long-Term Treasury Bond Index Fund | 4.3 |
| Fidelity Series International Value Fund | 3.8 |
| | 64.0 |
Asset Allocation (% of fund's net assets)
| Period end |
| | Domestic Equity Funds | 25.6% |
| | International Equity Funds | 25.3% |
| | Bond Funds | 46.4% |
| | Short-Term Funds | 2.6% |
| | Short-Term Investments | 0.1% |

Percentages are adjusted for the effect of futures contracts and swaps, if applicable.
Domestic Equity Funds category includes Fidelity Series Commodity Strategy Fund which invests in commodity-related investments.
Fidelity Freedom® Blend 2020 Fund
Schedule of Investments March 31, 2022
Showing Percentage of Net Assets
| U.S. Treasury Obligations - 0.1% | | | |
| | | Principal Amount | Value |
| U.S. Treasury Bills, yield at date of purchase 0.12% to 0.39% 4/14/22 to 6/9/22 (a) | | | |
| (Cost $379,878) | | 380,000 | 379,891 |
| | | Shares | Value |
|
| Domestic Equity Funds - 25.6% | | | |
| Fidelity Series Blue Chip Growth Fund (b) | | 3,028,719 | $43,522,692 |
| Fidelity Series Commodity Strategy Fund (b) | | 2,369,127 | 12,106,241 |
| Fidelity Series Large Cap Growth Index Fund (b) | | 1,557,949 | 27,419,894 |
| Fidelity Series Large Cap Stock Fund (b) | | 1,609,578 | 30,598,070 |
| Fidelity Series Large Cap Value Index Fund (b) | | 3,813,198 | 58,570,718 |
| Fidelity Series Small Cap Opportunities Fund (b) | | 1,080,964 | 14,722,732 |
| Fidelity Series Value Discovery Fund (b) | | 1,353,454 | 21,655,267 |
| TOTAL DOMESTIC EQUITY FUNDS | | | |
| (Cost $171,326,632) | | | 208,595,614 |
|
| International Equity Funds - 25.3% | | | |
| Fidelity Series Canada Fund (b) | | 974,577 | 15,125,428 |
| Fidelity Series Emerging Markets Fund (b) | | 830,045 | 7,702,820 |
| Fidelity Series Emerging Markets Opportunities Fund (b) | | 3,772,735 | 69,418,322 |
| Fidelity Series International Growth Fund (b) | | 1,834,574 | 30,417,235 |
| Fidelity Series International Index Fund (b) | | 1,121,399 | 12,828,800 |
| Fidelity Series International Small Cap Fund (b) | | 532,303 | 9,554,843 |
| Fidelity Series International Value Fund (b) | | 2,797,483 | 30,856,233 |
| Fidelity Series Overseas Fund (b) | | 2,434,150 | 30,718,970 |
| TOTAL INTERNATIONAL EQUITY FUNDS | | | |
| (Cost $193,199,666) | | | 206,622,651 |
|
| Bond Funds - 46.4% | | | |
| Fidelity Series 0-5 Year Inflation-Protected Bond Index Fund (b) | | 911,856 | 9,145,917 |
| Fidelity Series 5+ Year Inflation-Protected Bond Index Fund (b) | | 5,899,343 | 56,633,688 |
| Fidelity Series Corporate Bond Fund (b) | | 4,611,523 | 46,576,379 |
| Fidelity Series Emerging Markets Debt Fund (b) | | 488,326 | 4,028,694 |
| Fidelity Series Emerging Markets Debt Local Currency Fund (b) | | 151,651 | 1,366,372 |
| Fidelity Series Floating Rate High Income Fund (b) | | 89,616 | 823,575 |
| Fidelity Series Government Bond Index Fund (b) | | 6,529,066 | 65,160,081 |
| Fidelity Series High Income Fund (b) | | 540,087 | 4,909,390 |
| Fidelity Series Inflation-Protected Bond Index Fund (b) | | 877,395 | 8,905,559 |
| Fidelity Series International Developed Markets Bond Index Fund (b) | | 2,786,326 | 25,996,419 |
| Fidelity Series Investment Grade Bond Fund (b) | | 6,281,670 | 68,533,019 |
| Fidelity Series Investment Grade Securitized Fund (b) | | 4,939,521 | 48,012,139 |
| Fidelity Series Long-Term Treasury Bond Index Fund (b) | | 4,649,783 | 35,431,350 |
| Fidelity Series Real Estate Income Fund (b) | | 260,448 | 2,958,695 |
| TOTAL BOND FUNDS | | | |
| (Cost $395,798,210) | | | 378,481,277 |
|
| Short-Term Funds - 2.6% | | | |
| Fidelity Cash Central Fund 0.31% (c) | | 529,828 | 529,934 |
| Fidelity Series Government Money Market Fund 0.31% (b)(d) | | 4,161,117 | 4,161,117 |
| Fidelity Series Short-Term Credit Fund (b) | | 427,723 | 4,170,295 |
| Fidelity Series Treasury Bill Index Fund (b) | | 1,249,735 | 12,484,851 |
| TOTAL SHORT-TERM FUNDS | | | |
| (Cost $21,431,291) | | | 21,346,197 |
| TOTAL INVESTMENT IN SECURITIES - 100.0% | | | |
| (Cost $782,135,677) | | | 815,425,630 |
| NET OTHER ASSETS (LIABILITIES) - 0.0% | | | (54,398) |
| NET ASSETS - 100% | | | $815,371,232 |
| Futures Contracts | | | | | |
| | Number of contracts | Expiration Date | Notional Amount | Value | Unrealized Appreciation/(Depreciation) |
| Purchased | | | | | |
| Equity Index Contracts | | | | | |
| ICE E-mini MSCI EAFE Index Contracts (United States) | 20 | June 2022 | $2,144,400 | $121,904 | $121,904 |
| ICE E-mini MSCI Emerging Markets Index Contracts (United States) | 43 | June 2022 | 2,419,825 | 135,426 | 135,426 |
| Sold | | | | | |
| Equity Index Contracts | | | | | |
| CME Micro E-mini S&P 500 Index Contracts (United States) | 16 | June 2022 | 3,624,600 | (85,262) | (85,262) |
| TOTAL FUTURES CONTRACTS | | | | | $172,068 |
The notional amount of futures purchased as a percentage of Net Assets is 0.6%
The notional amount of futures sold as a percentage of Net Assets is 0.4%
For the period, the average monthly notional amount at value for futures contracts in the aggregate was $1,041,868.
Legend
(a) Security or a portion of the security was pledged to cover margin requirements for futures contracts. At period end, the value of securities pledged amounted to $379,891.
(b) Affiliated Fund
(c) Affiliated fund that is generally available only to investment companies and other accounts managed by Fidelity Investments. The rate quoted is the annualized seven-day yield of the fund at period end. A complete unaudited listing of the fund's holdings as of its most recent quarter end is available upon request. In addition, each Fidelity Central Fund's financial statements, which are not covered by the Fund's Report of Independent Registered Public Accounting Firm, are available on the SEC's website or upon request.
(d) The rate quoted is the annualized seven-day yield of the fund at period end.
Affiliated Central Funds
Fiscal year to date information regarding the Fund's investments in Fidelity Central Funds, including the ownership percentage, is presented below.
| Fund | Value, beginning of period | Purchases | Sales Proceeds | Dividend Income | Realized Gain/Loss | Change in Unrealized appreciation (depreciation) | Value, end of period | % ownership, end of period |
| Fidelity Cash Central Fund 0.31% | $-- | $1,661,747 | $1,131,813 | $116 | $-- | $-- | $529,934 | 0.0% |
| Total | $-- | $1,661,747 | $1,131,813 | $116 | $-- | $-- | $529,934 | |
Amounts in the income column in the above table include any capital gain distributions from underlying funds, which are presented in the corresponding line-item in the Statement of Operations, if applicable.
Affiliated Underlying Funds
Fiscal year to date information regarding the Fund's investments in affiliated Underlying Funds is presented below. Exchanges between classes of the same affiliated Underlying Funds may occur. If an underlying Fund changes its name, the name presented below is the name in effect at period end.
| Affiliate | Value, beginning of period | Purchases(a) | Sales Proceeds(a) | Dividend Income | Realized Gain (loss) | Change in Unrealized appreciation (depreciation) | Value, end of period |
| Fidelity Series 0-5 Year Inflation-Protected Bond Index Fund | $-- | $17,792,661 | $8,623,200 | $38,095 | $(22,913) | $5,042 | $9,145,917 |
| Fidelity Series 5+ Year Inflation-Protected Bond Index Fund | -- | 63,865,983 | 4,981,909 | 309,648 | (123,222) | (2,127,164) | 56,633,688 |
| Fidelity Series Blue Chip Growth Fund | 43,379,480 | 29,370,124 | 21,286,844 | 9,902,962 | 49,948 | (7,990,016) | 43,522,692 |
| Fidelity Series Canada Fund | 10,364,641 | 5,424,184 | 3,155,490 | 321,883 | 47,883 | 2,444,210 | 15,125,428 |
| Fidelity Series Commodity Strategy Fund | 21,195,466 | 12,311,105 | 22,115,947 | 7,278,103 | (718,667) | 1,434,284 | 12,106,241 |
| Fidelity Series Corporate Bond Fund | 43,748,916 | 17,316,786 | 11,059,599 | 1,356,751 | (161,679) | (3,268,045) | 46,576,379 |
| Fidelity Series Emerging Markets Debt Fund | 4,175,479 | 1,319,276 | 1,034,784 | 205,721 | (36,740) | (394,537) | 4,028,694 |
| Fidelity Series Emerging Markets Debt Local Currency Fund | 1,395,685 | 468,682 | 333,961 | 58,690 | (13,083) | (150,951) | 1,366,372 |
| Fidelity Series Emerging Markets Fund | 8,431,739 | 3,483,337 | 2,324,814 | 274,366 | (32,215) | (1,855,227) | 7,702,820 |
| Fidelity Series Emerging Markets Opportunities Fund | 75,801,658 | 40,115,873 | 22,216,118 | 8,673,092 | (392,138) | (23,890,953) | 69,418,322 |
| Fidelity Series Floating Rate High Income Fund | 841,193 | 269,088 | 286,682 | 38,394 | (592) | 568 | 823,575 |
| Fidelity Series Government Bond Index Fund | 53,943,973 | 25,067,843 | 10,632,836 | 672,309 | (178,399) | (3,040,500) | 65,160,081 |
| Fidelity Series Government Money Market Fund 0.31% | 22,226,804 | 3,452,248 | 21,517,935 | 10,965 | -- | -- | 4,161,117 |
| Fidelity Series High Income Fund | 4,845,795 | 1,563,652 | 1,327,604 | 284,484 | (16,303) | (156,150) | 4,909,390 |
| Fidelity Series Inflation-Protected Bond Index Fund | 54,821,488 | 14,141,612 | 60,260,186 | 2,419,300 | 3,420,801 | (3,218,156) | 8,905,559 |
| Fidelity Series International Developed Markets Bond Index Fund | -- | 28,403,610 | 1,244,612 | 8,829 | (17,942) | (1,144,637) | 25,996,419 |
| Fidelity Series International Growth Fund | 25,489,613 | 16,168,389 | 8,169,252 | 2,606,298 | (97,961) | (2,973,554) | 30,417,235 |
| Fidelity Series International Index Fund | 10,641,626 | 5,421,858 | 2,787,943 | 346,292 | (46,264) | (400,477) | 12,828,800 |
| Fidelity Series International Small Cap Fund | 9,193,285 | 3,922,712 | 1,939,353 | 1,354,961 | (52,420) | (1,569,381) | 9,554,843 |
| Fidelity Series International Value Fund | 25,461,214 | 14,220,989 | 9,096,095 | 1,634,974 | (46,823) | 316,948 | 30,856,233 |
| Fidelity Series Investment Grade Bond Fund | 59,871,280 | 25,134,790 | 12,603,247 | 1,510,504 | (186,015) | (3,683,789) | 68,533,019 |
| Fidelity Series Investment Grade Securitized Fund | 41,948,596 | 17,457,862 | 8,620,456 | 403,864 | (88,077) | (2,685,786) | 48,012,139 |
| Fidelity Series Large Cap Growth Index Fund | 27,381,134 | 11,510,535 | 14,911,060 | 916,832 | 1,370,497 | 2,068,788 | 27,419,894 |
| Fidelity Series Large Cap Stock Fund | 29,905,279 | 12,623,783 | 12,787,925 | 2,982,514 | 213,973 | 642,960 | 30,598,070 |
| Fidelity Series Large Cap Value Index Fund | 57,124,220 | 23,258,677 | 24,482,938 | 4,174,762 | 314,380 | 2,356,379 | 58,570,718 |
| Fidelity Series Long-Term Treasury Bond Index Fund | 20,887,980 | 22,854,314 | 6,977,625 | 622,483 | (593,856) | (739,463) | 35,431,350 |
| Fidelity Series Overseas Fund | 25,532,703 | 14,358,389 | 8,672,248 | 965,332 | 227,806 | (727,680) | 30,718,970 |
| Fidelity Series Real Estate Income Fund | 2,902,692 | 810,269 | 835,150 | 125,432 | (213) | 81,097 | 2,958,695 |
| Fidelity Series Short-Term Credit Fund | 10,962,432 | 4,276,025 | 10,725,207 | 187,724 | (74,057) | (268,898) | 4,170,295 |
| Fidelity Series Small Cap Opportunities Fund | 14,446,187 | 9,553,053 | 5,646,523 | 4,021,610 | (230,888) | (3,399,097) | 14,722,732 |
| Fidelity Series Treasury Bill Index Fund | 35,318,191 | 13,609,088 | 36,422,423 | 25,140 | (910) | (19,095) | 12,484,851 |
| Fidelity Series Value Discovery Fund | 21,106,888 | 9,459,448 | 9,031,875 | 2,652,126 | 186,956 | (66,150) | 21,655,267 |
| Total | $763,345,637 | $469,006,245 | $366,111,841 | $56,384,440 | $2,700,867 | $(54,419,430) | $814,515,805 |
(a) Includes the value of shares purchased or redeemed through in-kind transactions, if applicable.
Amounts in the income column in the above table include any capital gain distributions from underlying funds, which are presented in the corresponding line-item in the Statement of Operations, if applicable.
Investment Valuation
The following is a summary of the inputs used, as of March 31, 2022, involving the Fund's assets and liabilities carried at fair value. The inputs or methodology used for valuing securities may not be an indication of the risk associated with investing in those securities. For more information on valuation inputs, and their aggregation into the levels used below, please refer to the Investment Valuation section in the accompanying Notes to Financial Statements.
| | Valuation Inputs at Reporting Date: |
| Description | Total | Level 1 | Level 2 | Level 3 |
| Investments in Securities: | | | | |
| Other Short-Term Investments and Net Other Assets | $379,891 | $-- | $379,891 | $-- |
| Domestic Equity Funds | 208,595,614 | 208,595,614 | -- | -- |
| International Equity Funds | 206,622,651 | 206,622,651 | -- | -- |
| Bond Funds | 378,481,277 | 378,481,277 | -- | -- |
| Short-Term Funds | 21,346,197 | 21,346,197 | -- | -- |
| Total Investments in Securities: | $815,425,630 | $815,045,739 | $379,891 | $-- |
| Derivative Instruments: | | | | |
| Assets | | | | |
| Futures Contracts | $257,330 | $257,330 | $-- | $-- |
| Total Assets | $257,330 | $257,330 | $-- | $-- |
| Liabilities | | | | |
| Futures Contracts | $(85,262) | $(85,262) | $-- | $-- |
| Total Liabilities | $(85,262) | $(85,262) | $-- | $-- |
| Total Derivative Instruments: | $172,068 | $172,068 | $-- | $-- |
Value of Derivative Instruments
The following table is a summary of the Fund's value of derivative instruments by primary risk exposure as of March 31, 2022. For additional information on derivative instruments, please refer to the Derivative Instruments section in the accompanying Notes to Financial Statements.
| Primary Risk Exposure / Derivative Type | Value |
| | Asset | Liability |
| Equity Risk | | |
| Futures Contracts(a) | $257,330 | $(85,262) |
| Total Equity Risk | 257,330 | (85,262) |
| Total Value of Derivatives | $257,330 | $(85,262) |
(a) Reflects gross cumulative appreciation (depreciation) on futures contracts as presented in the Schedule of Investments. In the Statement of Assets and Liabilities, the period end daily variation margin is included in receivable or payable for daily variation margin on futures contracts, and the net cumulative appreciation (depreciation) is included in Total accumulated earnings (loss).
See accompanying notes which are an integral part of the financial statements.
Fidelity Freedom® Blend 2020 Fund
Financial Statements
Statement of Assets and Liabilities
| | | March 31, 2022 |
| Assets | | |
Investment in securities, at value — See accompanying schedule:
Unaffiliated issuers (cost $379,878) | $379,891 | |
| Fidelity Central Funds (cost $529,934) | 529,934 | |
| Other affiliated issuers (cost $781,225,865) | 814,515,805 | |
| Total Investment in Securities (cost $782,135,677) | | $815,425,630 |
| Cash | | 1 |
| Receivable for investments sold | | 19,928,635 |
| Receivable for fund shares sold | | 832,592 |
| Distributions receivable from Fidelity Central Funds | | 77 |
| Total assets | | 836,186,935 |
| Liabilities | | |
| Payable for investments purchased | $17,906,561 | |
| Payable for fund shares redeemed | 2,661,691 | |
| Accrued management fee | 203,822 | |
| Distribution and service plan fees payable | 2,841 | |
| Payable for daily variation margin on futures contracts | 40,788 | |
| Total liabilities | | 20,815,703 |
| Net Assets | | $815,371,232 |
| Net Assets consist of: | | |
| Paid in capital | | $769,284,702 |
| Total accumulated earnings (loss) | | 46,086,530 |
| Net Assets | | $815,371,232 |
| Net Asset Value and Maximum Offering Price | | |
| Class A: | | |
| Net Asset Value and redemption price per share ($5,799,770 ÷ 533,882 shares)(a) | | $10.86 |
| Maximum offering price per share (100/94.25 of $10.86) | | $11.52 |
| Class M: | | |
| Net Asset Value and redemption price per share ($1,434,062 ÷ 132,192 shares)(a) | | $10.85 |
| Maximum offering price per share (100/96.50 of $10.85) | | $11.24 |
| Class C: | | |
| Net Asset Value and offering price per share ($1,315,501 ÷ 122,091 shares)(a) | | $10.77 |
| Fidelity Freedom Blend 2020 Fund: | | |
| Net Asset Value, offering price and redemption price per share ($60,069,918 ÷ 5,519,219 shares) | | $10.88 |
| Class K: | | |
| Net Asset Value, offering price and redemption price per share ($23,620,526 ÷ 2,163,781 shares) | | $10.92 |
| Class K6: | | |
| Net Asset Value, offering price and redemption price per share ($296,601,274 ÷ 27,060,822 shares) | | $10.96 |
| Class I: | | |
| Net Asset Value, offering price and redemption price per share ($9,094,879 ÷ 834,768 shares) | | $10.90 |
| Class Z: | | |
| Net Asset Value, offering price and redemption price per share ($740,185 ÷ 67,696 shares) | | $10.93 |
| Class Z6: | | |
| Net Asset Value, offering price and redemption price per share ($52,551,734 ÷ 4,806,409 shares) | | $10.93 |
| Premier Class: | | |
| Net Asset Value, offering price and redemption price per share ($364,143,383 ÷ 33,290,345 shares) | | $10.94 |
(a) Redemption price per share is equal to net asset value less any applicable contingent deferred sales charge.
See accompanying notes which are an integral part of the financial statements.
Statement of Operations
| | | Year ended March 31, 2022 |
| Investment Income | | |
| Dividends: | | |
| Affiliated issuers | | $23,479,951 |
| Interest | | 104 |
| Income from Fidelity Central Funds | | 116 |
| Total income | | 23,480,171 |
| Expenses | | |
| Management fee | $2,518,828 | |
| Distribution and service plan fees | 32,224 | |
| Independent trustees' fees and expenses | 2,507 | |
| Total expenses | | 2,553,559 |
| Net investment income (loss) | | 20,926,612 |
| Realized and Unrealized Gain (Loss) | | |
| Net realized gain (loss) on: | | |
| Investment securities: | | |
| Affiliated issuers | 2,700,867 | |
| Futures contracts | (160,385) | |
| Capital gain distributions from underlying funds: | | |
| Affiliated issuers | 32,904,489 | |
| Total net realized gain (loss) | | 35,444,971 |
| Change in net unrealized appreciation (depreciation) on: | | |
| Investment securities: | | |
| Unaffiliated issuers | 13 | |
| Affiliated issuers | (54,419,430) | |
| Futures contracts | 172,068 | |
| Total change in net unrealized appreciation (depreciation) | | (54,247,349) |
| Net gain (loss) | | (18,802,378) |
| Net increase (decrease) in net assets resulting from operations | | $2,124,234 |
See accompanying notes which are an integral part of the financial statements.
Statement of Changes in Net Assets
| | Year ended March 31, 2022 | Year ended March 31, 2021 |
| Increase (Decrease) in Net Assets | | |
| Operations | | |
| Net investment income (loss) | $20,926,612 | $8,595,610 |
| Net realized gain (loss) | 35,444,971 | 35,440,691 |
| Change in net unrealized appreciation (depreciation) | (54,247,349) | 132,351,594 |
| Net increase (decrease) in net assets resulting from operations | 2,124,234 | 176,387,895 |
| Distributions to shareholders | (59,532,715) | (31,508,612) |
| Share transactions - net increase (decrease) | 109,626,571 | 89,637,657 |
| Total increase (decrease) in net assets | 52,218,090 | 234,516,940 |
| Net Assets | | |
| Beginning of period | 763,153,142 | 528,636,202 |
| End of period | $815,371,232 | $763,153,142 |
See accompanying notes which are an integral part of the financial statements.
Financial Highlights
Fidelity Freedom Blend 2020 Fund Class A
| Years ended March 31, | 2022 | 2021 | 2020 | 2019 A |
| Selected Per–Share Data | | | | |
| Net asset value, beginning of period | $11.61 | $9.30 | $9.92 | $10.00 |
| Income from Investment Operations | | | | |
| Net investment income (loss)B,C | .18 | .09 | .16 | .05 |
| Net realized and unrealized gain (loss) | (.12) | 2.70 | (.49) | (.01) |
| Total from investment operations | .06 | 2.79 | (.33) | .04 |
| Distributions from net investment income | (.25) | (.11) | (.15) | (.07) |
| Distributions from net realized gain | (.56) | (.37) | (.14) | (.05) |
| Total distributions | (.81) | (.48) | (.29) | (.12) |
| Net asset value, end of period | $10.86 | $11.61 | $9.30 | $9.92 |
| Total ReturnD,E,F | .19% | 30.27% | (3.65)% | .55% |
| Ratios to Average Net AssetsC,G,H | | | | |
| Expenses before reductions | .74% | .74% | .75% | .77%I,J |
| Expenses net of fee waivers, if any | .74% | .74% | .75% | .77%I,J |
| Expenses net of all reductions | .74% | .74% | .75% | .77%I,J |
| Net investment income (loss) | 1.50% | .82% | 1.57% | .81%I |
| Supplemental Data | | | | |
| Net assets, end of period (000 omitted) | $5,800 | $3,303 | $1,422 | $894 |
| Portfolio turnover rateK | 44% | 37% | 40% | 78%I |
A For the period August 31, 2018 (commencement of operations) through March 31, 2019.
B Calculated based on average shares outstanding during the period.
C Net investment income (loss) is affected by the timing of the declaration of dividends by any underlying mutual funds or exchange-traded funds (ETFs). Net investment income (loss) of any such underlying funds is not included in the Fund's net investment income (loss) ratio.
D Total returns for periods of less than one year are not annualized.
E Total returns would have been lower if certain expenses had not been reduced during the applicable periods shown.
F Total returns do not include the effect of the sales charges.
G Fees and expenses of any underlying mutual funds or exchange-traded funds (ETFs) are not included in the Fund's expense ratio. The Fund indirectly bears its proportionate share of these expenses. For additional expense information related to investments in Fidelity Central Funds, please refer to the "Investments in Fidelity Central Funds" note found in the Notes to Financial Statements section of the most recent Annual or Semi-Annual report.
H Expense ratios reflect operating expenses of the class. Expenses before reductions do not reflect amounts reimbursed, waived, or reduced through arrangements with the investment adviser, brokerage services, or other offset arrangements, if applicable, and do not represent the amount paid by the class during periods when reimbursements, waivers or reductions occur.
I Annualized
J On certain classes, the size and fluctuation of net assets and expense amounts may cause ratios to differ from contractual rates.
K Amount does not include the portfolio activity of any underlying mutual funds or exchange-traded funds (ETFs).
See accompanying notes which are an integral part of the financial statements.
Fidelity Freedom Blend 2020 Fund Class M
| Years ended March 31, | 2022 | 2021 | 2020 | 2019 A |
| Selected Per–Share Data | | | | |
| Net asset value, beginning of period | $11.60 | $9.29 | $9.92 | $10.00 |
| Income from Investment Operations | | | | |
| Net investment income (loss)B,C | .15 | .06 | .13 | .03 |
| Net realized and unrealized gain (loss) | (.12) | 2.71 | (.48) | (.01) |
| Total from investment operations | .03 | 2.77 | (.35) | .02 |
| Distributions from net investment income | (.22) | (.10) | (.14) | (.05) |
| Distributions from net realized gain | (.56) | (.37) | (.14) | (.05) |
| Total distributions | (.78) | (.46)D | (.28) | (.10) |
| Net asset value, end of period | $10.85 | $11.60 | $9.29 | $9.92 |
| Total ReturnE,F | (.07)% | 30.14% | (3.91)% | .33% |
| Ratios to Average Net AssetsC,G,H | | | | |
| Expenses before reductions | .99% | .99% | 1.00% | 1.00%I |
| Expenses net of fee waivers, if any | .99% | .99% | 1.00% | 1.00%I |
| Expenses net of all reductions | .99% | .99% | 1.00% | 1.00%I |
| Net investment income (loss) | 1.25% | .56% | 1.32% | .58%I |
| Supplemental Data | | | | |
| Net assets, end of period (000 omitted) | $1,434 | $1,433 | $267 | $107 |
| Portfolio turnover rateJ | 44% | 37% | 40% | 78%I |
A For the period August 31, 2018 (commencement of operations) through March 31, 2019.
B Calculated based on average shares outstanding during the period.
C Net investment income (loss) is affected by the timing of the declaration of dividends by any underlying mutual funds or exchange-traded funds (ETFs). Net investment income (loss) of any such underlying funds is not included in the Fund's net investment income (loss) ratio.
D Total distributions per share do not sum due to rounding.
E Total returns for periods of less than one year are not annualized.
F Total returns do not include the effect of the sales charges.
G Fees and expenses of any underlying mutual funds or exchange-traded funds (ETFs) are not included in the Fund's expense ratio. The Fund indirectly bears its proportionate share of these expenses. For additional expense information related to investments in Fidelity Central Funds, please refer to the "Investments in Fidelity Central Funds" note found in the Notes to Financial Statements section of the most recent Annual or Semi-Annual report.
H Expense ratios reflect operating expenses of the class. Expenses before reductions do not reflect amounts reimbursed, waived, or reduced through arrangements with the investment adviser, brokerage services, or other offset arrangements, if applicable, and do not represent the amount paid by the class during periods when reimbursements, waivers or reductions occur.
I Annualized
J Amount does not include the portfolio activity of any underlying mutual funds or exchange-traded funds (ETFs).
See accompanying notes which are an integral part of the financial statements.
Fidelity Freedom Blend 2020 Fund Class C
| Years ended March 31, | 2022 | 2021 | 2020 | 2019 A |
| Selected Per–Share Data | | | | |
| Net asset value, beginning of period | $11.54 | $9.26 | $9.90 | $10.00 |
| Income from Investment Operations | | | | |
| Net investment income (loss)B,C | .09 | .01 | .08 | –D |
| Net realized and unrealized gain (loss) | (.11) | 2.69 | (.49) | –D |
| Total from investment operations | (.02) | 2.70 | (.41) | –D |
| Distributions from net investment income | (.19) | (.05) | (.09) | (.05) |
| Distributions from net realized gain | (.56) | (.36) | (.14) | (.05) |
| Total distributions | (.75) | (.42)E | (.23) | (.10) |
| Net asset value, end of period | $10.77 | $11.54 | $9.26 | $9.90 |
| Total ReturnF,G,H | (.56)% | 29.38% | (4.42)% | .08% |
| Ratios to Average Net AssetsC,I,J | | | | |
| Expenses before reductions | 1.49% | 1.49% | 1.50% | 1.52%K,L |
| Expenses net of fee waivers, if any | 1.49% | 1.49% | 1.50% | 1.52%K,L |
| Expenses net of all reductions | 1.49% | 1.48% | 1.50% | 1.52%K,L |
| Net investment income (loss) | .75% | .08% | .82% | .06%K |
| Supplemental Data | | | | |
| Net assets, end of period (000 omitted) | $1,316 | $1,027 | $413 | $385 |
| Portfolio turnover rateM | 44% | 37% | 40% | 78%K |
A For the period August 31, 2018 (commencement of operations) through March 31, 2019.
B Calculated based on average shares outstanding during the period.
C Net investment income (loss) is affected by the timing of the declaration of dividends by any underlying mutual funds or exchange-traded funds (ETFs). Net investment income (loss) of any such underlying funds is not included in the Fund's net investment income (loss) ratio.
D Amount represents less than $.005 per share.
E Total distributions per share do not sum due to rounding.
F Total returns for periods of less than one year are not annualized.
G Total returns would have been lower if certain expenses had not been reduced during the applicable periods shown.
H Total returns do not include the effect of the contingent deferred sales charge.
I Fees and expenses of any underlying mutual funds or exchange-traded funds (ETFs) are not included in the Fund's expense ratio. The Fund indirectly bears its proportionate share of these expenses. For additional expense information related to investments in Fidelity Central Funds, please refer to the "Investments in Fidelity Central Funds" note found in the Notes to Financial Statements section of the most recent Annual or Semi-Annual report.
J Expense ratios reflect operating expenses of the class. Expenses before reductions do not reflect amounts reimbursed, waived, or reduced through arrangements with the investment adviser, brokerage services, or other offset arrangements, if applicable, and do not represent the amount paid by the class during periods when reimbursements, waivers or reductions occur.
K Annualized
L On certain classes, the size and fluctuation of net assets and expense amounts may cause ratios to differ from contractual rates.
M Amount does not include the portfolio activity of any underlying mutual funds or exchange-traded funds (ETFs).
See accompanying notes which are an integral part of the financial statements.
Fidelity Freedom Blend 2020 Fund
| Years ended March 31, | 2022 | 2021 | 2020 | 2019 A |
| Selected Per–Share Data | | | | |
| Net asset value, beginning of period | $11.63 | $9.31 | $9.92 | $10.00 |
| Income from Investment Operations | | | | |
| Net investment income (loss)B,C | .20 | .12 | .18 | .06 |
| Net realized and unrealized gain (loss) | (.11) | 2.70 | (.48) | (.01) |
| Total from investment operations | .09 | 2.82 | (.30) | .05 |
| Distributions from net investment income | (.28) | (.13) | (.17) | (.08) |
| Distributions from net realized gain | (.57) | (.37) | (.14) | (.05) |
| Total distributions | (.84)D | (.50) | (.31) | (.13) |
| Net asset value, end of period | $10.88 | $11.63 | $9.31 | $9.92 |
| Total ReturnE | .45% | 30.61% | (3.38)% | .63% |
| Ratios to Average Net AssetsC,F,G | | | | |
| Expenses before reductions | .49% | .49% | .51%H | .50%I |
| Expenses net of fee waivers, if any | .49% | .49% | .51%H | .50%I |
| Expenses net of all reductions | .49% | .49% | .51%H | .50%I |
| Net investment income (loss) | 1.75% | 1.07% | 1.81% | 1.08%I |
| Supplemental Data | | | | |
| Net assets, end of period (000 omitted) | $60,070 | $33,411 | $19,124 | $1,168 |
| Portfolio turnover rateJ | 44% | 37% | 40% | 78%I |
A For the period August 31, 2018 (commencement of operations) through March 31, 2019.
B Calculated based on average shares outstanding during the period.
C Net investment income (loss) is affected by the timing of the declaration of dividends by any underlying mutual funds or exchange-traded funds (ETFs). Net investment income (loss) of any such underlying funds is not included in the Fund's net investment income (loss) ratio.
D Total distributions per share do not sum due to rounding.
E Total returns for periods of less than one year are not annualized.
F Fees and expenses of any underlying mutual funds or exchange-traded funds (ETFs) are not included in the Fund's expense ratio. The Fund indirectly bears its proportionate share of these expenses. For additional expense information related to investments in Fidelity Central Funds, please refer to the "Investments in Fidelity Central Funds" note found in the Notes to Financial Statements section of the most recent Annual or Semi-Annual report.
G Expense ratios reflect operating expenses of the class. Expenses before reductions do not reflect amounts reimbursed, waived, or reduced through arrangements with the investment adviser, brokerage services, or other offset arrangements, if applicable, and do not represent the amount paid by the class during periods when reimbursements, waivers or reductions occur.
H On certain classes, the size and fluctuation of net assets and expense amounts may cause ratios to differ from contractual rates.
I Annualized
J Amount does not include the portfolio activity of any underlying mutual funds or exchange-traded funds (ETFs).
See accompanying notes which are an integral part of the financial statements.
Fidelity Freedom Blend 2020 Fund Class K
| Years ended March 31, | 2022 | 2021 | 2020 | 2019 A |
| Selected Per–Share Data | | | | |
| Net asset value, beginning of period | $11.66 | $9.32 | $9.94 | $10.00 |
| Income from Investment Operations | | | | |
| Net investment income (loss)B,C | .22 | .13 | .20 | .07 |
| Net realized and unrealized gain (loss) | (.11) | 2.71 | (.49) | (.01) |
| Total from investment operations | .11 | 2.84 | (.29) | .06 |
| Distributions from net investment income | (.28) | (.14) | (.19) | (.07) |
| Distributions from net realized gain | (.57) | (.37) | (.14) | (.05) |
| Total distributions | (.85) | (.50)D | (.33) | (.12) |
| Net asset value, end of period | $10.92 | $11.66 | $9.32 | $9.94 |
| Total ReturnE | .57% | 30.84% | (3.35)% | .73% |
| Ratios to Average Net AssetsC,F,G | | | | |
| Expenses before reductions | .39% | .39% | .40% | .40%H |
| Expenses net of fee waivers, if any | .39% | .39% | .40% | .40%H |
| Expenses net of all reductions | .39% | .39% | .40% | .40%H |
| Net investment income (loss) | 1.85% | 1.17% | 1.92% | 1.18%H |
| Supplemental Data | | | | |
| Net assets, end of period (000 omitted) | $23,621 | $26,939 | $23,420 | $101 |
| Portfolio turnover rateI | 44% | 37% | 40% | 78%H |
A For the period August 31, 2018 (commencement of operations) through March 31, 2019.
B Calculated based on average shares outstanding during the period.
C Net investment income (loss) is affected by the timing of the declaration of dividends by any underlying mutual funds or exchange-traded funds (ETFs). Net investment income (loss) of any such underlying funds is not included in the Fund's net investment income (loss) ratio.
D Total distributions per share do not sum due to rounding.
E Total returns for periods of less than one year are not annualized.
F Fees and expenses of any underlying mutual funds or exchange-traded funds (ETFs) are not included in the Fund's expense ratio. The Fund indirectly bears its proportionate share of these expenses. For additional expense information related to investments in Fidelity Central Funds, please refer to the "Investments in Fidelity Central Funds" note found in the Notes to Financial Statements section of the most recent Annual or Semi-Annual report.
G Expense ratios reflect operating expenses of the class. Expenses before reductions do not reflect amounts reimbursed, waived, or reduced through arrangements with the investment adviser, brokerage services, or other offset arrangements, if applicable, and do not represent the amount paid by the class during periods when reimbursements, waivers or reductions occur.
H Annualized
I Amount does not include the portfolio activity of any underlying mutual funds or exchange-traded funds (ETFs).
See accompanying notes which are an integral part of the financial statements.
Fidelity Freedom Blend 2020 Fund Class K6
| Years ended March 31, | 2022 | 2021 | 2020 | 2019 A |
| Selected Per–Share Data | | | | |
| Net asset value, beginning of period | $11.68 | $9.34 | $9.94 | $10.00 |
| Income from Investment Operations | | | | |
| Net investment income (loss)B,C | .23 | .14 | .21 | .07 |
| Net realized and unrealized gain (loss) | (.11) | 2.71 | (.49) | –D |
| Total from investment operations | .12 | 2.85 | (.28) | .07 |
| Distributions from net investment income | (.28) | (.15) | (.18) | (.08) |
| Distributions from net realized gain | (.57) | (.37) | (.14) | (.05) |
| Total distributions | (.84)E | (.51)E | (.32) | (.13) |
| Net asset value, end of period | $10.96 | $11.68 | $9.34 | $9.94 |
| Total ReturnF,G | .68% | 30.88% | (3.21)% | .77% |
| Ratios to Average Net AssetsC,H,I | | | | |
| Expenses before reductions | .29% | .29% | .30% | .31%J,K |
| Expenses net of fee waivers, if any | .29% | .29% | .30% | .31%J,K |
| Expenses net of all reductions | .29% | .29% | .30% | .31%J,K |
| Net investment income (loss) | 1.95% | 1.27% | 2.02% | 1.27%J |
| Supplemental Data | | | | |
| Net assets, end of period (000 omitted) | $296,601 | $684,575 | $476,911 | $21,065 |
| Portfolio turnover rateL | 44% | 37% | 40% | 78%J |
A For the period August 31, 2018 (commencement of operations) through March 31, 2019.
B Calculated based on average shares outstanding during the period.
C Net investment income (loss) is affected by the timing of the declaration of dividends by any underlying mutual funds or exchange-traded funds (ETFs). Net investment income (loss) of any such underlying funds is not included in the Fund's net investment income (loss) ratio.
D Amount represents less than $.005 per share.
E Total distributions per share do not sum due to rounding.
F Total returns for periods of less than one year are not annualized.
G Total returns would have been lower if certain expenses had not been reduced during the applicable periods shown.
H Fees and expenses of any underlying mutual funds or exchange-traded funds (ETFs) are not included in the Fund's expense ratio. The Fund indirectly bears its proportionate share of these expenses. For additional expense information related to investments in Fidelity Central Funds, please refer to the "Investments in Fidelity Central Funds" note found in the Notes to Financial Statements section of the most recent Annual or Semi-Annual report.
I Expense ratios reflect operating expenses of the class. Expenses before reductions do not reflect amounts reimbursed, waived, or reduced through arrangements with the investment adviser, brokerage services, or other offset arrangements, if applicable, and do not represent the amount paid by the class during periods when reimbursements, waivers or reductions occur.
J Annualized
K On certain classes, the size and fluctuation of net assets and expense amounts may cause ratios to differ from contractual rates.
L Amount does not include the portfolio activity of any underlying mutual funds or exchange-traded funds (ETFs).
See accompanying notes which are an integral part of the financial statements.
Fidelity Freedom Blend 2020 Fund Class I
| Years ended March 31, | 2022 | 2021 | 2020 | 2019 A |
| Selected Per–Share Data | | | | |
| Net asset value, beginning of period | $11.64 | $9.31 | $9.94 | $10.00 |
| Income from Investment Operations | | | | |
| Net investment income (loss)B,C | .21 | .12 | .19 | .06 |
| Net realized and unrealized gain (loss) | (.11) | 2.71 | (.50) | –D |
| Total from investment operations | .10 | 2.83 | (.31) | .06 |
| Distributions from net investment income | (.28) | (.13) | (.18) | (.07) |
| Distributions from net realized gain | (.57) | (.37) | (.14) | (.05) |
| Total distributions | (.84)E | (.50) | (.32) | (.12) |
| Net asset value, end of period | $10.90 | $11.64 | $9.31 | $9.94 |
| Total ReturnF | .51% | 30.71% | (3.50)% | .69% |
| Ratios to Average Net AssetsC,G,H | | | | |
| Expenses before reductions | .49% | .49% | .51%I | .50%J |
| Expenses net of fee waivers, if any | .49% | .49% | .51%I | .50%J |
| Expenses net of all reductions | .49% | .49% | .51%I | .50%J |
| Net investment income (loss) | 1.75% | 1.07% | 1.81% | 1.08%J |
| Supplemental Data | | | | |
| Net assets, end of period (000 omitted) | $9,095 | $8,555 | $5,169 | $121 |
| Portfolio turnover rateK | 44% | 37% | 40% | 78%J |
A For the period August 31, 2018 (commencement of operations) through March 31, 2019.
B Calculated based on average shares outstanding during the period.
C Net investment income (loss) is affected by the timing of the declaration of dividends by any underlying mutual funds or exchange-traded funds (ETFs). Net investment income (loss) of any such underlying funds is not included in the Fund's net investment income (loss) ratio.
D Amount represents less than $.005 per share.
E Total distributions per share do not sum due to rounding.
F Total returns for periods of less than one year are not annualized.
G Fees and expenses of any underlying mutual funds or exchange-traded funds (ETFs) are not included in the Fund's expense ratio. The Fund indirectly bears its proportionate share of these expenses. For additional expense information related to investments in Fidelity Central Funds, please refer to the "Investments in Fidelity Central Funds" note found in the Notes to Financial Statements section of the most recent Annual or Semi-Annual report.
H Expense ratios reflect operating expenses of the class. Expenses before reductions do not reflect amounts reimbursed, waived, or reduced through arrangements with the investment adviser, brokerage services, or other offset arrangements, if applicable, and do not represent the amount paid by the class during periods when reimbursements, waivers or reductions occur.
I On certain classes, the size and fluctuation of net assets and expense amounts may cause ratios to differ from contractual rates.
J Annualized
K Amount does not include the portfolio activity of any underlying mutual funds or exchange-traded funds (ETFs).
See accompanying notes which are an integral part of the financial statements.
Fidelity Freedom Blend 2020 Fund Premier Class
| Years ended March 31, | 2022 A |
| Selected Per–Share Data | |
| Net asset value, beginning of period | $11.85 |
| Income from Investment Operations | |
| Net investment income (loss)B,C | .43 |
| Net realized and unrealized gain (loss) | (.47) |
| Total from investment operations | (.04) |
| Distributions from net investment income | (.31) |
| Distributions from net realized gain | (.57) |
| Total distributions | (.87)D |
| Net asset value, end of period | $10.94 |
| Total ReturnE | (.69)% |
| Ratios to Average Net AssetsC,F,G | |
| Expenses before reductions | .26%H |
| Expenses net of fee waivers, if any | .26%H |
| Expenses net of all reductions | .26%H |
| Net investment income (loss) | 3.69%H |
| Supplemental Data | |
| Net assets, end of period (000 omitted) | $364,143 |
| Portfolio turnover rateI | 44% |
A For the period April 6, 2021 (commencement of sale of shares) through March 31, 2022.
B Calculated based on average shares outstanding during the period.
C Net investment income (loss) is affected by the timing of the declaration of dividends by any underlying mutual funds or exchange-traded funds (ETFs). Net investment income (loss) of any such underlying funds is not included in the Fund's net investment income (loss) ratio.
D Total distributions per share do not sum due to rounding.
E Total returns for periods of less than one year are not annualized.
F Fees and expenses of any underlying mutual funds or exchange-traded funds (ETFs) are not included in the Fund's expense ratio. The Fund indirectly bears its proportionate share of these expenses. For additional expense information related to investments in Fidelity Central Funds, please refer to the "Investments in Fidelity Central Funds" note found in the Notes to Financial Statements section of the most recent Annual or Semi-Annual report.
G Expense ratios reflect operating expenses of the class. Expenses before reductions do not reflect amounts reimbursed, waived, or reduced through arrangements with the investment adviser, brokerage services, or other offset arrangements, if applicable, and do not represent the amount paid by the class during periods when reimbursements, waivers or reductions occur.
H Annualized
I Amount does not include the portfolio activity of any underlying mutual funds or exchange-traded funds (ETFs).
See accompanying notes which are an integral part of the financial statements.
Fidelity Freedom Blend 2020 Fund Class Z
| Years ended March 31, | 2022 | 2021 | 2020 | 2019 A |
| Selected Per–Share Data | | | | |
| Net asset value, beginning of period | $11.68 | $9.34 | $9.94 | $10.00 |
| Income from Investment Operations | | | | |
| Net investment income (loss)B,C | .22 | .13 | .20 | .07 |
| Net realized and unrealized gain (loss) | (.11) | 2.71 | (.50) | (.01) |
| Total from investment operations | .11 | 2.84 | (.30) | .06 |
| Distributions from net investment income | (.29) | (.14) | (.17) | (.07) |
| Distributions from net realized gain | (.57) | (.37) | (.14) | (.05) |
| Total distributions | (.86) | (.50)D | (.30)D | (.12) |
| Net asset value, end of period | $10.93 | $11.68 | $9.34 | $9.94 |
| Total ReturnE | .55% | 30.77% | (3.35)% | .73% |
| Ratios to Average Net AssetsC,F,G | | | | |
| Expenses before reductions | .39% | .39% | .40% | .40%H |
| Expenses net of fee waivers, if any | .39% | .39% | .40% | .40%H |
| Expenses net of all reductions | .39% | .39% | .40% | .40%H |
| Net investment income (loss) | 1.85% | 1.17% | 1.92% | 1.18%H |
| Supplemental Data | | | | |
| Net assets, end of period (000 omitted) | $740 | $158 | $121 | $101 |
| Portfolio turnover rateI | 44% | 37% | 40% | 78%H |
A For the period August 31, 2018 (commencement of operations) through March 31, 2019.
B Calculated based on average shares outstanding during the period.
C Net investment income (loss) is affected by the timing of the declaration of dividends by any underlying mutual funds or exchange-traded funds (ETFs). Net investment income (loss) of any such underlying funds is not included in the Fund's net investment income (loss) ratio.
D Total distributions per share do not sum due to rounding.
E Total returns for periods of less than one year are not annualized.
F Fees and expenses of any underlying mutual funds or exchange-traded funds (ETFs) are not included in the Fund's expense ratio. The Fund indirectly bears its proportionate share of these expenses. For additional expense information related to investments in Fidelity Central Funds, please refer to the "Investments in Fidelity Central Funds" note found in the Notes to Financial Statements section of the most recent Annual or Semi-Annual report.
G Expense ratios reflect operating expenses of the class. Expenses before reductions do not reflect amounts reimbursed, waived, or reduced through arrangements with the investment adviser, brokerage services, or other offset arrangements, if applicable, and do not represent the amount paid by the class during periods when reimbursements, waivers or reductions occur.
H Annualized
I Amount does not include the portfolio activity of any underlying mutual funds or exchange-traded funds (ETFs).
See accompanying notes which are an integral part of the financial statements.
Fidelity Freedom Blend 2020 Fund Class Z6
| Years ended March 31, | 2022 | 2021 | 2020 | 2019 A |
| Selected Per–Share Data | | | | |
| Net asset value, beginning of period | $11.68 | $9.34 | $9.94 | $10.00 |
| Income from Investment Operations | | | | |
| Net investment income (loss)B,C | .23 | .14 | .20 | .07 |
| Net realized and unrealized gain (loss) | (.11) | 2.71 | (.48) | –D |
| Total from investment operations | .12 | 2.85 | (.28) | .07 |
| Distributions from net investment income | (.30) | (.15) | (.18) | (.08) |
| Distributions from net realized gain | (.57) | (.37) | (.14) | (.05) |
| Total distributions | (.87) | (.51)E | (.32) | (.13) |
| Net asset value, end of period | $10.93 | $11.68 | $9.34 | $9.94 |
| Total ReturnF | .63% | 30.88% | (3.19)% | .77% |
| Ratios to Average Net AssetsC,G,H | | | | |
| Expenses before reductions | .29% | .29% | .31%I | .30%J |
| Expenses net of fee waivers, if any | .29% | .29% | .31%I | .30%J |
| Expenses net of all reductions | .29% | .29% | .31%I | .30%J |
| Net investment income (loss) | 1.95% | 1.27% | 2.01% | 1.28%J |
| Supplemental Data | | | | |
| Net assets, end of period (000 omitted) | $52,552 | $3,752 | $1,790 | $101 |
| Portfolio turnover rateK | 44% | 37% | 40% | 78%J |
A For the period August 31, 2018 (commencement of operations) through March 31, 2019.
B Calculated based on average shares outstanding during the period.
C Net investment income (loss) is affected by the timing of the declaration of dividends by any underlying mutual funds or exchange-traded funds (ETFs). Net investment income (loss) of any such underlying funds is not included in the Fund's net investment income (loss) ratio.
D Amount represents less than $.005 per share.
E Total distributions per share do not sum due to rounding.
F Total returns for periods of less than one year are not annualized.
G Fees and expenses of any underlying mutual funds or exchange-traded funds (ETFs) are not included in the Fund's expense ratio. The Fund indirectly bears its proportionate share of these expenses. For additional expense information related to investments in Fidelity Central Funds, please refer to the "Investments in Fidelity Central Funds" note found in the Notes to Financial Statements section of the most recent Annual or Semi-Annual report.
H Expense ratios reflect operating expenses of the class. Expenses before reductions do not reflect amounts reimbursed, waived, or reduced through arrangements with the investment adviser, brokerage services, or other offset arrangements, if applicable, and do not represent the amount paid by the class during periods when reimbursements, waivers or reductions occur.
I On certain classes, the size and fluctuation of net assets and expense amounts may cause ratios to differ from contractual rates.
J Annualized
K Amount does not include the portfolio activity of any underlying mutual funds or exchange-traded funds (ETFs).
See accompanying notes which are an integral part of the financial statements.
Fidelity Freedom® Blend 2025 Fund
Investment Summary (Unaudited)
The information in the following tables is based on the direct investments of the Fund.
Top Holdings as of March 31, 2022
| | % of fund's net assets |
| Fidelity Series Emerging Markets Opportunities Fund | 9.2 |
| Fidelity Series Large Cap Value Index Fund | 8.4 |
| Fidelity Series Investment Grade Bond Fund | 7.4 |
| Fidelity Series Government Bond Index Fund | 7.1 |
| Fidelity Series Blue Chip Growth Fund | 6.2 |
| Fidelity Series 5+ Year Inflation-Protected Bond Index Fund | 5.9 |
| Fidelity Series Investment Grade Securitized Fund | 5.2 |
| Fidelity Series Corporate Bond Fund | 5.0 |
| Fidelity Series Long-Term Treasury Bond Index Fund | 4.7 |
| Fidelity Series Large Cap Stock Fund | 4.4 |
| | 63.5 |
Asset Allocation (% of fund's net assets)
| Period end |
| | Domestic Equity Funds | 29.6% |
| | International Equity Funds | 28.0% |
| | Bond Funds | 41.1% |
| | Short-Term Funds | 1.2% |
| | Short-Term Investments | 0.1% |

Percentages are adjusted for the effect of futures contracts and swaps, if applicable.
Domestic Equity Funds category includes Fidelity Series Commodity Strategy Fund which invests in commodity-related investments.
Fidelity Freedom® Blend 2025 Fund
Schedule of Investments March 31, 2022
Showing Percentage of Net Assets
| U.S. Treasury Obligations - 0.1% | | | |
| | | Principal Amount | Value |
| U.S. Treasury Bills, yield at date of purchase 0.12% to 0.5% 4/14/22 to 6/23/22 (a) | | | |
| (Cost $719,770) | | 720,000 | 719,797 |
| | | Shares | Value |
|
| Domestic Equity Funds - 29.6% | | | |
| Fidelity Series Blue Chip Growth Fund (b) | | 6,471,307 | $92,992,682 |
| Fidelity Series Commodity Strategy Fund (b) | | 4,345,501 | 22,205,513 |
| Fidelity Series Large Cap Growth Index Fund (b) | | 3,328,960 | 58,589,695 |
| Fidelity Series Large Cap Stock Fund (b) | | 3,439,049 | 65,376,329 |
| Fidelity Series Large Cap Value Index Fund (b) | | 8,147,529 | 125,146,053 |
| Fidelity Series Small Cap Opportunities Fund (b) | | 2,309,562 | 31,456,232 |
| Fidelity Series Value Discovery Fund (b) | | 2,891,805 | 46,268,874 |
| TOTAL DOMESTIC EQUITY FUNDS | | | |
| (Cost $376,327,044) | | | 442,035,378 |
|
| International Equity Funds - 28.0% | | | |
| Fidelity Series Canada Fund (b) | | 2,009,792 | 31,191,964 |
| Fidelity Series Emerging Markets Fund (b) | | 1,643,514 | 15,251,806 |
| Fidelity Series Emerging Markets Opportunities Fund (b) | | 7,470,664 | 137,460,211 |
| Fidelity Series International Growth Fund (b) | | 3,770,095 | 62,508,182 |
| Fidelity Series International Index Fund (b) | | 2,314,239 | 26,474,889 |
| Fidelity Series International Small Cap Fund (b) | | 1,097,674 | 19,703,247 |
| Fidelity Series International Value Fund (b) | | 5,728,408 | 63,184,340 |
| Fidelity Series Overseas Fund (b) | | 4,986,721 | 62,932,419 |
| TOTAL INTERNATIONAL EQUITY FUNDS | | | |
| (Cost $405,432,482) | | | 418,707,058 |
|
| Bond Funds - 41.1% | | | |
| Fidelity Series 5+ Year Inflation-Protected Bond Index Fund (b) | | 9,199,327 | 88,313,540 |
| Fidelity Series Corporate Bond Fund (b) | | 7,457,324 | 75,318,971 |
| Fidelity Series Emerging Markets Debt Fund (b) | | 894,178 | 7,376,970 |
| Fidelity Series Emerging Markets Debt Local Currency Fund (b) | | 277,461 | 2,499,926 |
| Fidelity Series Floating Rate High Income Fund (b) | | 163,933 | 1,506,542 |
| Fidelity Series Government Bond Index Fund (b) | | 10,559,964 | 105,388,442 |
| Fidelity Series High Income Fund (b) | | 990,522 | 9,003,844 |
| Fidelity Series Inflation-Protected Bond Index Fund (b) | | 1,295,132 | 13,145,591 |
| Fidelity Series International Developed Markets Bond Index Fund (b) | | 5,005,376 | 46,700,158 |
| Fidelity Series Investment Grade Bond Fund (b) | | 10,159,987 | 110,845,459 |
| Fidelity Series Investment Grade Securitized Fund (b) | | 7,987,637 | 77,639,832 |
| Fidelity Series Long-Term Treasury Bond Index Fund (b) | | 9,314,447 | 70,976,087 |
| Fidelity Series Real Estate Income Fund (b) | | 476,749 | 5,415,869 |
| TOTAL BOND FUNDS | | | |
| (Cost $646,574,754) | | | 614,131,231 |
|
| Short-Term Funds - 1.2% | | | |
| Fidelity Cash Central Fund 0.31% (c) | | 897,289 | 897,468 |
| Fidelity Series Government Money Market Fund 0.31% (b)(d) | | 3,469,402 | 3,469,402 |
| Fidelity Series Short-Term Credit Fund (b) | | 356,732 | 3,478,139 |
| Fidelity Series Treasury Bill Index Fund (b) | | 1,041,981 | 10,409,392 |
| TOTAL SHORT-TERM FUNDS | | | |
| (Cost $18,323,842) | | | 18,254,401 |
| TOTAL INVESTMENT IN SECURITIES - 100.0% | | | |
| (Cost $1,447,377,892) | | | 1,493,847,865 |
| NET OTHER ASSETS (LIABILITIES) - 0.0% | | | (102,440) |
| NET ASSETS - 100% | | | $1,493,745,425 |
| Futures Contracts | | | | | |
| | Number of contracts | Expiration Date | Notional Amount | Value | Unrealized Appreciation/(Depreciation) |
| Purchased | | | | | |
| Equity Index Contracts | | | | | |
| ICE E-mini MSCI EAFE Index Contracts (United States) | 36 | June 2022 | $3,859,920 | $219,427 | $219,427 |
| ICE E-mini MSCI Emerging Markets Index Contracts (United States) | 78 | June 2022 | 4,389,450 | 227,063 | 227,063 |
| Sold | | | | | |
| Equity Index Contracts | | | | | |
| CME Micro E-mini S&P 500 Index Contracts (United States) | 29 | June 2022 | 6,569,588 | (172,472) | (172,472) |
| TOTAL FUTURES CONTRACTS | | | | | $274,018 |
The notional amount of futures purchased as a percentage of Net Assets is 0.6%
The notional amount of futures sold as a percentage of Net Assets is 0.4%
For the period, the average monthly notional amount at value for futures contracts in the aggregate was $2,028,631
Legend
(a) Security or a portion of the security was pledged to cover margin requirements for futures contracts. At period end, the value of securities pledged amounted to $719,797.
(b) Affiliated Fund
(c) Affiliated fund that is generally available only to investment companies and other accounts managed by Fidelity Investments. The rate quoted is the annualized seven-day yield of the fund at period end. A complete unaudited listing of the fund's holdings as of its most recent quarter end is available upon request. In addition, each Fidelity Central Fund's financial statements, which are not covered by the Fund's Report of Independent Registered Public Accounting Firm, are available on the SEC's website or upon request.
(d) The rate quoted is the annualized seven-day yield of the fund at period end.
Affiliated Central Funds
Fiscal year to date information regarding the Fund's investments in Fidelity Central Funds, including the ownership percentage, is presented below.
| Fund | Value, beginning of period | Purchases | Sales Proceeds | Dividend Income | Realized Gain/Loss | Change in Unrealized appreciation (depreciation) | Value, end of period | % ownership, end of period |
| Fidelity Cash Central Fund 0.31% | $1,308 | $3,128,781 | $2,232,621 | $211 | $-- | $-- | $897,468 | 0.0% |
| Total | $1,308 | $3,128,781 | $2,232,621 | $211 | $-- | $-- | $897,468 | |
Amounts in the income column in the above table include any capital gain distributions from underlying funds, which are presented in the corresponding line-item in the Statement of Operations, if applicable.
Affiliated Underlying Funds
Fiscal year to date information regarding the Fund's investments in affiliated Underlying Funds is presented below. Exchanges between classes of the same affiliated Underlying Funds may occur. If an underlying Fund changes its name, the name presented below is the name in effect at period end.
| Affiliate | Value, beginning of period | Purchases(a) | Sales Proceeds(a) | Dividend Income | Realized Gain (loss) | Change in Unrealized appreciation (depreciation) | Value, end of period |
| Fidelity Series 0-5 Year Inflation-Protected Bond Index Fund | $-- | $24,044,478 | $24,042,706 | $21,194 | $1,383 | $-- | $-- |
| Fidelity Series 5+ Year Inflation-Protected Bond Index Fund | -- | 96,475,314 | 4,735,588 | 449,965 | (168,291) | (3,257,895) | 88,313,540 |
| Fidelity Series Blue Chip Growth Fund | 76,811,051 | 64,909,131 | 32,080,664 | 19,448,865 | (693,586) | (15,953,250) | 92,992,682 |
| Fidelity Series Canada Fund | 17,952,376 | 12,155,994 | 3,616,919 | 628,740 | (1,608) | 4,702,121 | 31,191,964 |
| Fidelity Series Commodity Strategy Fund | 32,532,549 | 23,733,369 | 35,234,816 | 12,317,716 | (1,296,164) | 2,470,575 | 22,205,513 |
| Fidelity Series Corporate Bond Fund | 60,573,797 | 32,462,704 | 12,124,258 | 2,070,073 | (212,502) | (5,380,770) | 75,318,971 |
| Fidelity Series Emerging Markets Debt Fund | 6,408,716 | 2,897,208 | 1,144,911 | 349,734 | (35,080) | (748,963) | 7,376,970 |
| Fidelity Series Emerging Markets Debt Local Currency Fund | 2,142,253 | 1,017,890 | 363,893 | 102,780 | (22,384) | (273,940) | 2,499,926 |
| Fidelity Series Emerging Markets Fund | 13,871,365 | 7,624,922 | 2,633,826 | 519,275 | (63,367) | (3,547,288) | 15,251,806 |
| Fidelity Series Emerging Markets Opportunities Fund | 124,703,347 | 85,778,559 | 26,605,688 | 16,378,796 | (1,251,520) | (45,164,487) | 137,460,211 |
| Fidelity Series Floating Rate High Income Fund | 1,291,097 | 587,880 | 370,984 | 65,290 | (495) | (956) | 1,506,542 |
| Fidelity Series Government Bond Index Fund | 74,691,874 | 45,874,091 | 9,940,555 | 1,026,120 | (300,297) | (4,936,671) | 105,388,442 |
| Fidelity Series Government Money Market Fund 0.31% | 22,389,485 | 5,418,755 | 24,338,838 | 11,557 | -- | -- | 3,469,402 |
| Fidelity Series High Income Fund | 7,437,420 | 3,423,508 | 1,531,546 | 485,758 | (32,729) | (292,809) | 9,003,844 |
| Fidelity Series Inflation-Protected Bond Index Fund | 74,431,031 | 26,902,666 | 88,327,737 | 3,600,680 | 3,786,437 | (3,646,806) | 13,145,591 |
| Fidelity Series International Developed Markets Bond Index Fund | -- | 49,539,792 | 805,260 | 14,940 | (14,897) | (2,019,477) | 46,700,158 |
| Fidelity Series International Growth Fund | 44,150,005 | 34,502,239 | 9,452,021 | 5,087,303 | (166,198) | (6,525,843) | 62,508,182 |
| Fidelity Series International Index Fund | 18,432,181 | 11,988,348 | 2,903,964 | 676,447 | (63,147) | (978,529) | 26,474,889 |
| Fidelity Series International Small Cap Fund | 15,923,704 | 8,819,670 | 1,612,791 | 2,643,126 | (93,121) | (3,334,215) | 19,703,247 |
| Fidelity Series International Value Fund | 44,100,749 | 30,546,439 | 11,686,406 | 3,191,342 | (196,678) | 420,236 | 63,184,340 |
| Fidelity Series Investment Grade Bond Fund | 82,897,779 | 46,955,718 | 12,729,166 | 2,307,069 | (282,537) | (5,996,335) | 110,845,459 |
| Fidelity Series Investment Grade Securitized Fund | 58,082,631 | 32,284,664 | 8,293,923 | 627,860 | (138,835) | (4,294,705) | 77,639,832 |
| Fidelity Series Large Cap Growth Index Fund | 48,484,457 | 27,087,969 | 23,115,457 | 1,838,678 | 440,345 | 5,692,381 | 58,589,695 |
| Fidelity Series Large Cap Stock Fund | 52,956,119 | 29,895,125 | 18,815,440 | 5,859,813 | (203,264) | 1,543,789 | 65,376,329 |
| Fidelity Series Large Cap Value Index Fund | 101,155,964 | 54,857,346 | 35,372,847 | 8,487,399 | (247,709) | 4,753,299 | 125,146,053 |
| Fidelity Series Long-Term Treasury Bond Index Fund | 32,060,417 | 50,221,183 | 8,085,354 | 1,106,249 | (779,155) | (2,441,004) | 70,976,087 |
| Fidelity Series Overseas Fund | 44,224,368 | 30,746,497 | 10,370,099 | 1,884,230 | -9,849 | (1,658,498) | 62,932,419 |
| Fidelity Series Real Estate Income Fund | 4,455,269 | 1,806,200 | 956,279 | 216,287 | (7,367) | 118,046 | 5,415,869 |
| Fidelity Series Short-Term Credit Fund | 11,042,683 | 5,442,404 | 12,643,358 | 202,047 | (156,995) | (206,595) | 3,478,139 |
| Fidelity Series Small Cap Opportunities Fund | 25,581,041 | 21,065,264 | 7,914,210 | 7,876,301 | (595,412) | (6,680,451) | 31,456,232 |
| Fidelity Series Treasury Bill Index Fund | 35,576,683 | 17,360,591 | 42,507,517 | 26,154 | (23,660) | 3,295 | 10,409,392 |
| Fidelity Series Value Discovery Fund | 37,376,039 | 22,014,124 | 12,951,869 | 5,429,308 | (78,040) | (91,380) | 46,268,874 |
| Total | $1,171,736,450 | $908,440,042 | $487,308,890 | $104,951,096 | $(2,906,722) | $(97,727,125) | $1,492,230,600 |
(a) Includes the value of shares purchased or redeemed through in-kind transactions, if applicable.
Amounts in the income column in the above table include any capital gain distributions from underlying funds, which are presented in the corresponding line-item in the Statement of Operations, if applicable.
Investment Valuation
The following is a summary of the inputs used, as of March 31, 2022, involving the Fund's assets and liabilities carried at fair value. The inputs or methodology used for valuing securities may not be an indication of the risk associated with investing in those securities. For more information on valuation inputs, and their aggregation into the levels used below, please refer to the Investment Valuation section in the accompanying Notes to Financial Statements.
| | Valuation Inputs at Reporting Date: |
| Description | Total | Level 1 | Level 2 | Level 3 |
| Investments in Securities: | | | | |
| Other Short-Term Investments and Net Other Assets | $719,797 | $-- | $719,797 | $-- |
| Domestic Equity Funds | 442,035,378 | 442,035,378 | -- | -- |
| International Equity Funds | 418,707,058 | 418,707,058 | -- | -- |
| Bond Funds | 614,131,231 | 614,131,231 | -- | -- |
| Short-Term Funds | 18,254,401 | 18,254,401 | -- | -- |
| Total Investments in Securities: | $1,493,847,865 | $1,493,128,068 | $719,797 | $-- |
| Derivative Instruments: | | | | |
| Assets | | | | |
| Futures Contracts | $446,490 | $446,490 | $-- | $-- |
| Total Assets | $446,490 | $446,490 | $-- | $-- |
| Liabilities | | | | |
| Futures Contracts | $(172,472) | $(172,472) | $-- | $-- |
| Total Liabilities | $(172,472) | $(172,472) | $-- | $-- |
| Total Derivative Instruments: | $274,018 | $274,018 | $-- | $-- |
Value of Derivative Instruments
The following table is a summary of the Fund's value of derivative instruments by primary risk exposure as of March 31, 2022. For additional information on derivative instruments, please refer to the Derivative Instruments section in the accompanying Notes to Financial Statements.
| Primary Risk Exposure / Derivative Type | Value |
| | Asset | Liability |
| Equity Risk | | |
| Futures Contracts(a) | $446,490 | $(172,472) |
| Total Equity Risk | 446,490 | (172,472) |
| Total Value of Derivatives | $446,490 | $(172,472) |
(a) Reflects gross cumulative appreciation (depreciation) on futures contracts as presented in the Schedule of Investments. In the Statement of Assets and Liabilities, the period end daily variation margin is included in receivable or payable for daily variation margin on futures contracts, and the net cumulative appreciation (depreciation) is included in Total accumulated earnings (loss).
See accompanying notes which are an integral part of the financial statements.
Fidelity Freedom® Blend 2025 Fund
Financial Statements
Statement of Assets and Liabilities
| | | March 31, 2022 |
| Assets | | |
Investment in securities, at value — See accompanying schedule:
Unaffiliated issuers (cost $719,770) | $719,797 | |
| Fidelity Central Funds (cost $897,468) | 897,468 | |
| Other affiliated issuers (cost $1,445,760,654) | 1,492,230,600 | |
| Total Investment in Securities (cost $1,447,377,892) | | $1,493,847,865 |
| Receivable for investments sold | | 36,452,956 |
| Receivable for fund shares sold | | 1,614,258 |
| Distributions receivable from Fidelity Central Funds | | 134 |
| Total assets | | 1,531,915,213 |
| Liabilities | | |
| Payable for investments purchased | $31,848,705 | |
| Payable for fund shares redeemed | 5,863,810 | |
| Accrued management fee | 374,609 | |
| Distribution and service plan fees payable | 3,855 | |
| Payable for daily variation margin on futures contracts | 78,809 | |
| Total liabilities | | 38,169,788 |
| Net Assets | | $1,493,745,425 |
| Net Assets consist of: | | |
| Paid in capital | | $1,424,983,487 |
| Total accumulated earnings (loss) | | 68,761,938 |
| Net Assets | | $1,493,745,425 |
| Net Asset Value and Maximum Offering Price | | |
| Class A: | | |
| Net Asset Value and redemption price per share ($7,622,346 ÷ 689,889 shares)(a) | | $11.05 |
| Maximum offering price per share (100/94.25 of $11.05) | | $11.72 |
| Class M: | | |
| Net Asset Value and redemption price per share ($2,248,907 ÷ 202,533 shares)(a) | | $11.10 |
| Maximum offering price per share (100/96.50 of $11.10) | | $11.50 |
| Class C: | | |
| Net Asset Value and offering price per share ($1,695,876 ÷ 154,770 shares)(a) | | $10.96 |
| Fidelity Freedom Blend 2025 Fund: | | |
| Net Asset Value, offering price and redemption price per share ($93,024,964 ÷ 8,410,114 shares) | | $11.06 |
| Class K: | | |
| Net Asset Value, offering price and redemption price per share ($36,356,526 ÷ 3,277,182 shares) | | $11.09 |
| Class K6: | | |
| Net Asset Value, offering price and redemption price per share ($585,570,276 ÷ 52,597,187 shares) | | $11.13 |
| Class I: | | |
| Net Asset Value, offering price and redemption price per share ($26,357,161 ÷ 2,380,212 shares) | | $11.07 |
| Class Z: | | |
| Net Asset Value, offering price and redemption price per share ($2,226,236 ÷ 200,446 shares) | | $11.11 |
| Class Z6: | | |
| Net Asset Value, offering price and redemption price per share ($125,633,103 ÷ 11,315,560 shares) | | $11.10 |
| Premier Class: | | |
| Net Asset Value, offering price and redemption price per share ($613,010,030 ÷ 55,184,289 shares) | | $11.11 |
(a) Redemption price per share is equal to net asset value less any applicable contingent deferred sales charge.
See accompanying notes which are an integral part of the financial statements.
Statement of Operations
| | | Year ended March 31, 2022 |
| Investment Income | | |
| Dividends: | | |
| Affiliated issuers | | $40,829,690 |
| Interest | | 212 |
| Income from Fidelity Central Funds | | 211 |
| Total income | | 40,830,113 |
| Expenses | | |
| Management fee | $4,360,541 | |
| Distribution and service plan fees | 43,329 | |
| Independent trustees' fees and expenses | 4,158 | |
| Total expenses | | 4,408,028 |
| Net investment income (loss) | | 36,422,085 |
| Realized and Unrealized Gain (Loss) | | |
| Net realized gain (loss) on: | | |
| Investment securities: | | |
| Affiliated issuers | (2,906,722) | |
| Futures contracts | (360,189) | |
| Capital gain distributions from underlying funds: | | |
| Affiliated issuers | 64,121,406 | |
| Total net realized gain (loss) | | 60,854,495 |
| Change in net unrealized appreciation (depreciation) on: | | |
| Investment securities: | | |
| Unaffiliated issuers | 27 | |
| Affiliated issuers | (97,727,125) | |
| Futures contracts | 274,018 | |
| Total change in net unrealized appreciation (depreciation) | | (97,453,080) |
| Net gain (loss) | | (36,598,585) |
| Net increase (decrease) in net assets resulting from operations | | $(176,500) |
See accompanying notes which are an integral part of the financial statements.
Statement of Changes in Net Assets
| | Year ended March 31, 2022 | Year ended March 31, 2021 |
| Increase (Decrease) in Net Assets | | |
| Operations | | |
| Net investment income (loss) | $36,422,085 | $12,594,230 |
| Net realized gain (loss) | 60,854,495 | 49,362,857 |
| Change in net unrealized appreciation (depreciation) | (97,453,080) | 212,792,542 |
| Net increase (decrease) in net assets resulting from operations | (176,500) | 274,749,629 |
| Distributions to shareholders | (95,733,101) | (45,065,213) |
| Share transactions - net increase (decrease) | 418,228,992 | 257,943,636 |
| Total increase (decrease) in net assets | 322,319,391 | 487,628,052 |
| Net Assets | | |
| Beginning of period | 1,171,426,034 | 683,797,982 |
| End of period | $1,493,745,425 | $1,171,426,034 |
See accompanying notes which are an integral part of the financial statements.
Financial Highlights
Fidelity Freedom Blend 2025 Fund Class A
| Years ended March 31, | 2022 | 2021 | 2020 | 2019 A |
| Selected Per–Share Data | | | | |
| Net asset value, beginning of period | $11.71 | $9.09 | $9.82 | $10.00 |
| Income from Investment Operations | | | | |
| Net investment income (loss)B,C | .19 | .09 | .16 | .03 |
| Net realized and unrealized gain (loss) | (.08) | 3.01 | (.58) | (.02) |
| Total from investment operations | .11 | 3.10 | (.42) | .01 |
| Distributions from net investment income | (.25) | (.11) | (.15) | (.11) |
| Distributions from net realized gain | (.52) | (.36) | (.15) | (.08) |
| Total distributions | (.77) | (.48)D | (.31)D | (.19) |
| Net asset value, end of period | $11.05 | $11.71 | $9.09 | $9.82 |
| Total ReturnE,F,G | .59% | 34.40% | (4.73)% | .29% |
| Ratios to Average Net AssetsC,H,I | | | | |
| Expenses before reductions | .75% | .76% | .76% | .76%J |
| Expenses net of fee waivers, if any | .75% | .76% | .76% | .76%J |
| Expenses net of all reductions | .75% | .76% | .76% | .76%J |
| Net investment income (loss) | 1.63% | .85% | 1.56% | .58%J |
| Supplemental Data | | | | |
| Net assets, end of period (000 omitted) | $7,622 | $3,751 | $1,706 | $168 |
| Portfolio turnover rateK | 34% | 31% | 34% | 23%J |
A For the period August 31, 2018 (commencement of operations) through March 31, 2019.
B Calculated based on average shares outstanding during the period.
C Net investment income (loss) is affected by the timing of the declaration of dividends by any underlying mutual funds or exchange-traded funds (ETFs). Net investment income (loss) of any such underlying funds is not included in the Fund's net investment income (loss) ratio.
D Total distributions per share do not sum due to rounding.
E Total returns for periods of less than one year are not annualized.
F Total returns would have been lower if certain expenses had not been reduced during the applicable periods shown.
G Total returns do not include the effect of the sales charges.
H Fees and expenses of any underlying mutual funds or exchange-traded funds (ETFs) are not included in the Fund's expense ratio. The Fund indirectly bears its proportionate share of these expenses. For additional expense information related to investments in Fidelity Central Funds, please refer to the "Investments in Fidelity Central Funds" note found in the Notes to Financial Statements section of the most recent Annual or Semi-Annual report.
I Expense ratios reflect operating expenses of the class. Expenses before reductions do not reflect amounts reimbursed, waived, or reduced through arrangements with the investment adviser, brokerage services, or other offset arrangements, if applicable, and do not represent the amount paid by the class during periods when reimbursements, waivers or reductions occur.
J Annualized
K Amount does not include the portfolio activity of any underlying mutual funds or exchange-traded funds (ETFs).
See accompanying notes which are an integral part of the financial statements.
Fidelity Freedom Blend 2025 Fund Class M
| Years ended March 31, | 2022 | 2021 | 2020 | 2019 A |
| Selected Per–Share Data | | | | |
| Net asset value, beginning of period | $11.77 | $9.13 | $9.82 | $10.00 |
| Income from Investment Operations | | | | |
| Net investment income (loss)B,C | .16 | .07 | .13 | .02 |
| Net realized and unrealized gain (loss) | (.08) | 3.00 | (.58) | (.02) |
| Total from investment operations | .08 | 3.07 | (.45) | – |
| Distributions from net investment income | (.24) | (.07) | (.08) | (.10) |
| Distributions from net realized gain | (.51) | (.36) | (.15) | (.08) |
| Total distributions | (.75) | (.43) | (.24)D | (.18) |
| Net asset value, end of period | $11.10 | $11.77 | $9.13 | $9.82 |
| Total ReturnE,F,G | .32% | 33.97% | (4.94)% | .16% |
| Ratios to Average Net AssetsC,H,I | | | | |
| Expenses before reductions | 1.00% | 1.01% | 1.02%J | 1.02%J,K |
| Expenses net of fee waivers, if any | 1.00% | 1.01% | 1.02%J | 1.02%J,K |
| Expenses net of all reductions | 1.00% | 1.01% | 1.02%J | 1.02%J,K |
| Net investment income (loss) | 1.38% | .60% | 1.31% | .32%K |
| Supplemental Data | | | | |
| Net assets, end of period (000 omitted) | $2,249 | $1,838 | $886 | $746 |
| Portfolio turnover rateL | 34% | 31% | 34% | 23%K |
A For the period August 31, 2018 (commencement of operations) through March 31, 2019.
B Calculated based on average shares outstanding during the period.
C Net investment income (loss) is affected by the timing of the declaration of dividends by any underlying mutual funds or exchange-traded funds (ETFs). Net investment income (loss) of any such underlying funds is not included in the Fund's net investment income (loss) ratio.
D Total distributions per share do not sum due to rounding.
E Total returns for periods of less than one year are not annualized.
F Total returns would have been lower if certain expenses had not been reduced during the applicable periods shown.
G Total returns do not include the effect of the sales charges.
H Fees and expenses of any underlying mutual funds or exchange-traded funds (ETFs) are not included in the Fund's expense ratio. The Fund indirectly bears its proportionate share of these expenses. For additional expense information related to investments in Fidelity Central Funds, please refer to the "Investments in Fidelity Central Funds" note found in the Notes to Financial Statements section of the most recent Annual or Semi-Annual report.
I Expense ratios reflect operating expenses of the class. Expenses before reductions do not reflect amounts reimbursed, waived, or reduced through arrangements with the investment adviser, brokerage services, or other offset arrangements, if applicable, and do not represent the amount paid by the class during periods when reimbursements, waivers or reductions occur.
J On certain classes, the size and fluctuation of net assets and expense amounts may cause ratios to differ from contractual rates.
K Annualized
L Amount does not include the portfolio activity of any underlying mutual funds or exchange-traded funds (ETFs).
See accompanying notes which are an integral part of the financial statements.
Fidelity Freedom Blend 2025 Fund Class C
| Years ended March 31, | 2022 | 2021 | 2020 | 2019 A |
| Selected Per–Share Data | | | | |
| Net asset value, beginning of period | $11.64 | $9.05 | $9.81 | $10.00 |
| Income from Investment Operations | | | | |
| Net investment income (loss)B,C | .10 | .01 | .08 | (.01) |
| Net realized and unrealized gain (loss) | (.08) | 2.98 | (.58) | (.02) |
| Total from investment operations | .02 | 2.99 | (.50) | (.03) |
| Distributions from net investment income | (.19) | (.05) | (.11) | (.09) |
| Distributions from net realized gain | (.51) | (.36) | (.15) | (.08) |
| Total distributions | (.70) | (.40)D | (.26) | (.16)D |
| Net asset value, end of period | $10.96 | $11.64 | $9.05 | $9.81 |
| Total ReturnE,F,G | (.16)% | 33.37% | (5.45)% | (.12)% |
| Ratios to Average Net AssetsC,H,I | | | | |
| Expenses before reductions | 1.50% | 1.51% | 1.51% | 1.51%J |
| Expenses net of fee waivers, if any | 1.50% | 1.51% | 1.51% | 1.51%J |
| Expenses net of all reductions | 1.50% | 1.51% | 1.51% | 1.51%J |
| Net investment income (loss) | .88% | .10% | .81% | (.17)%J |
| Supplemental Data | | | | |
| Net assets, end of period (000 omitted) | $1,696 | $1,273 | $472 | $298 |
| Portfolio turnover rateK | 34% | 31% | 34% | 23%J |
A For the period August 31, 2018 (commencement of operations) through March 31, 2019.
B Calculated based on average shares outstanding during the period.
C Net investment income (loss) is affected by the timing of the declaration of dividends by any underlying mutual funds or exchange-traded funds (ETFs). Net investment income (loss) of any such underlying funds is not included in the Fund's net investment income (loss) ratio.
D Total distributions per share do not sum due to rounding.
E Total returns for periods of less than one year are not annualized.
F Total returns would have been lower if certain expenses had not been reduced during the applicable periods shown.
G Total returns do not include the effect of the contingent deferred sales charge.
H Fees and expenses of any underlying mutual funds or exchange-traded funds (ETFs) are not included in the Fund's expense ratio. The Fund indirectly bears its proportionate share of these expenses. For additional expense information related to investments in Fidelity Central Funds, please refer to the "Investments in Fidelity Central Funds" note found in the Notes to Financial Statements section of the most recent Annual or Semi-Annual report.
I Expense ratios reflect operating expenses of the class. Expenses before reductions do not reflect amounts reimbursed, waived, or reduced through arrangements with the investment adviser, brokerage services, or other offset arrangements, if applicable, and do not represent the amount paid by the class during periods when reimbursements, waivers or reductions occur.
J Annualized
K Amount does not include the portfolio activity of any underlying mutual funds or exchange-traded funds (ETFs).
See accompanying notes which are an integral part of the financial statements.
Fidelity Freedom Blend 2025 Fund
| Years ended March 31, | 2022 | 2021 | 2020 | 2019 A |
| Selected Per–Share Data | | | | |
| Net asset value, beginning of period | $11.73 | $9.10 | $9.82 | $10.00 |
| Income from Investment Operations | | | | |
| Net investment income (loss)B,C | .22 | .12 | .18 | .05 |
| Net realized and unrealized gain (loss) | (.09) | 3.01 | (.57) | (.03) |
| Total from investment operations | .13 | 3.13 | (.39) | .02 |
| Distributions from net investment income | (.28) | (.14) | (.17) | (.13) |
| Distributions from net realized gain | (.53) | (.36) | (.15) | (.08) |
| Total distributions | (.80)D | (.50) | (.33)D | (.20)D |
| Net asset value, end of period | $11.06 | $11.73 | $9.10 | $9.82 |
| Total ReturnE,F | .79% | 34.74% | (4.45)% | .42% |
| Ratios to Average Net AssetsC,G,H | | | | |
| Expenses before reductions | .50% | .51% | .52%I | .52%I,J |
| Expenses net of fee waivers, if any | .50% | .51% | .52%I | .52%I,J |
| Expenses net of all reductions | .50% | .51% | .52%I | .52%I,J |
| Net investment income (loss) | 1.88% | 1.10% | 1.80% | .83%J |
| Supplemental Data | | | | |
| Net assets, end of period (000 omitted) | $93,025 | $43,207 | $21,223 | $1,621 |
| Portfolio turnover rateK | 34% | 31% | 34% | 23%J |
A For the period August 31, 2018 (commencement of operations) through March 31, 2019.
B Calculated based on average shares outstanding during the period.
C Net investment income (loss) is affected by the timing of the declaration of dividends by any underlying mutual funds or exchange-traded funds (ETFs). Net investment income (loss) of any such underlying funds is not included in the Fund's net investment income (loss) ratio.
D Total distributions per share do not sum due to rounding.
E Total returns for periods of less than one year are not annualized.
F Total returns would have been lower if certain expenses had not been reduced during the applicable periods shown.
G Fees and expenses of any underlying mutual funds or exchange-traded funds (ETFs) are not included in the Fund's expense ratio. The Fund indirectly bears its proportionate share of these expenses. For additional expense information related to investments in Fidelity Central Funds, please refer to the "Investments in Fidelity Central Funds" note found in the Notes to Financial Statements section of the most recent Annual or Semi-Annual report.
H Expense ratios reflect operating expenses of the class. Expenses before reductions do not reflect amounts reimbursed, waived, or reduced through arrangements with the investment adviser, brokerage services, or other offset arrangements, if applicable, and do not represent the amount paid by the class during periods when reimbursements, waivers or reductions occur.
I On certain classes, the size and fluctuation of net assets and expense amounts may cause ratios to differ from contractual rates.
J Annualized
K Amount does not include the portfolio activity of any underlying mutual funds or exchange-traded funds (ETFs).
See accompanying notes which are an integral part of the financial statements.
Fidelity Freedom Blend 2025 Fund Class K
| Years ended March 31, | 2022 | 2021 | 2020 | 2019 A |
| Selected Per–Share Data | | | | |
| Net asset value, beginning of period | $11.75 | $9.11 | $9.83 | $10.00 |
| Income from Investment Operations | | | | |
| Net investment income (loss)B,C | .24 | .13 | .20 | .05 |
| Net realized and unrealized gain (loss) | (.09) | 3.01 | (.58) | (.02) |
| Total from investment operations | .15 | 3.14 | (.38) | .03 |
| Distributions from net investment income | (.28) | (.14) | (.18) | (.12) |
| Distributions from net realized gain | (.53) | (.36) | (.15) | (.08) |
| Total distributions | (.81) | (.50) | (.34)D | (.20) |
| Net asset value, end of period | $11.09 | $11.75 | $9.11 | $9.83 |
| Total ReturnE,F | .90% | 34.83% | (4.34)% | .47% |
| Ratios to Average Net AssetsC,G,H | | | | |
| Expenses before reductions | .40% | .41% | .41% | .41%I |
| Expenses net of fee waivers, if any | .40% | .41% | .41% | .41%I |
| Expenses net of all reductions | .40% | .41% | .41% | .41%I |
| Net investment income (loss) | 1.98% | 1.20% | 1.91% | .93%I |
| Supplemental Data | | | | |
| Net assets, end of period (000 omitted) | $36,357 | $31,964 | $24,031 | $101 |
| Portfolio turnover rateJ | 34% | 31% | 34% | 23%I |
A For the period August 31, 2018 (commencement of operations) through March 31, 2019.
B Calculated based on average shares outstanding during the period.
C Net investment income (loss) is affected by the timing of the declaration of dividends by any underlying mutual funds or exchange-traded funds (ETFs). Net investment income (loss) of any such underlying funds is not included in the Fund's net investment income (loss) ratio.
D Total distributions per share do not sum due to rounding.
E Total returns for periods of less than one year are not annualized.
F Total returns would have been lower if certain expenses had not been reduced during the applicable periods shown.
G Fees and expenses of any underlying mutual funds or exchange-traded funds (ETFs) are not included in the Fund's expense ratio. The Fund indirectly bears its proportionate share of these expenses. For additional expense information related to investments in Fidelity Central Funds, please refer to the "Investments in Fidelity Central Funds" note found in the Notes to Financial Statements section of the most recent Annual or Semi-Annual report.
H Expense ratios reflect operating expenses of the class. Expenses before reductions do not reflect amounts reimbursed, waived, or reduced through arrangements with the investment adviser, brokerage services, or other offset arrangements, if applicable, and do not represent the amount paid by the class during periods when reimbursements, waivers or reductions occur.
I Annualized
J Amount does not include the portfolio activity of any underlying mutual funds or exchange-traded funds (ETFs).
See accompanying notes which are an integral part of the financial statements.
Fidelity Freedom Blend 2025 Fund Class K6
| Years ended March 31, | 2022 | 2021 | 2020 | 2019 A |
| Selected Per–Share Data | | | | |
| Net asset value, beginning of period | $11.77 | $9.13 | $9.84 | $10.00 |
| Income from Investment Operations | | | | |
| Net investment income (loss)B,C | .25 | .14 | .21 | .06 |
| Net realized and unrealized gain (loss) | (.09) | 3.01 | (.59) | (.02) |
| Total from investment operations | .16 | 3.15 | (.38) | .04 |
| Distributions from net investment income | (.28) | (.15) | (.18) | (.12) |
| Distributions from net realized gain | (.53) | (.36) | (.16) | (.08) |
| Total distributions | (.80)D | (.51) | (.33)D | (.20) |
| Net asset value, end of period | $11.13 | $11.77 | $9.13 | $9.84 |
| Total ReturnE,F | 1.05% | 34.86% | (4.28)% | .60% |
| Ratios to Average Net AssetsC,G,H | | | | |
| Expenses before reductions | .30% | .31% | .31% | .32%I,J |
| Expenses net of fee waivers, if any | .30% | .31% | .31% | .32%I,J |
| Expenses net of all reductions | .30% | .31% | .31% | .32%I,J |
| Net investment income (loss) | 2.08% | 1.30% | 2.01% | 1.02%I |
| Supplemental Data | | | | |
| Net assets, end of period (000 omitted) | $585,570 | $1,055,963 | $623,940 | $40,828 |
| Portfolio turnover rateK | 34% | 31% | 34% | 23%I |
A For the period August 31, 2018 (commencement of operations) through March 31, 2019.
B Calculated based on average shares outstanding during the period.
C Net investment income (loss) is affected by the timing of the declaration of dividends by any underlying mutual funds or exchange-traded funds (ETFs). Net investment income (loss) of any such underlying funds is not included in the Fund's net investment income (loss) ratio.
D Total distributions per share do not sum due to rounding.
E Total returns for periods of less than one year are not annualized.
F Total returns would have been lower if certain expenses had not been reduced during the applicable periods shown.
G Fees and expenses of any underlying mutual funds or exchange-traded funds (ETFs) are not included in the Fund's expense ratio. The Fund indirectly bears its proportionate share of these expenses. For additional expense information related to investments in Fidelity Central Funds, please refer to the "Investments in Fidelity Central Funds" note found in the Notes to Financial Statements section of the most recent Annual or Semi-Annual report.
H Expense ratios reflect operating expenses of the class. Expenses before reductions do not reflect amounts reimbursed, waived, or reduced through arrangements with the investment adviser, brokerage services, or other offset arrangements, if applicable, and do not represent the amount paid by the class during periods when reimbursements, waivers or reductions occur.
I Annualized
J On certain classes, the size and fluctuation of net assets and expense amounts may cause ratios to differ from contractual rates.
K Amount does not include the portfolio activity of any underlying mutual funds or exchange-traded funds (ETFs).
See accompanying notes which are an integral part of the financial statements.
Fidelity Freedom Blend 2025 Fund Class I
| Years ended March 31, | 2022 | 2021 | 2020 | 2019 A |
| Selected Per–Share Data | | | | |
| Net asset value, beginning of period | $11.73 | $9.10 | $9.83 | $10.00 |
| Income from Investment Operations | | | | |
| Net investment income (loss)B,C | .22 | .12 | .18 | .05 |
| Net realized and unrealized gain (loss) | (.08) | 3.00 | (.57) | (.02) |
| Total from investment operations | .14 | 3.12 | (.39) | .03 |
| Distributions from net investment income | (.27) | (.13) | (.18) | (.12) |
| Distributions from net realized gain | (.53) | (.36) | (.15) | (.08) |
| Total distributions | (.80) | (.49) | (.34)D | (.20) |
| Net asset value, end of period | $11.07 | $11.73 | $9.10 | $9.83 |
| Total ReturnE,F | .80% | 34.69% | (4.46)% | .43% |
| Ratios to Average Net AssetsC,G,H | | | | |
| Expenses before reductions | .50% | .51% | .51% | .51%I |
| Expenses net of fee waivers, if any | .50% | .51% | .51% | .51%I |
| Expenses net of all reductions | .50% | .51% | .51% | .51%I |
| Net investment income (loss) | 1.88% | 1.10% | 1.81% | .83%I |
| Supplemental Data | | | | |
| Net assets, end of period (000 omitted) | $26,357 | $24,503 | $7,685 | $100 |
| Portfolio turnover rateJ | 34% | 31% | 34% | 23%I |
A For the period August 31, 2018 (commencement of operations) through March 31, 2019.
B Calculated based on average shares outstanding during the period.
C Net investment income (loss) is affected by the timing of the declaration of dividends by any underlying mutual funds or exchange-traded funds (ETFs). Net investment income (loss) of any such underlying funds is not included in the Fund's net investment income (loss) ratio.
D Total distributions per share do not sum due to rounding.
E Total returns for periods of less than one year are not annualized.
F Total returns would have been lower if certain expenses had not been reduced during the applicable periods shown.
G Fees and expenses of any underlying mutual funds or exchange-traded funds (ETFs) are not included in the Fund's expense ratio. The Fund indirectly bears its proportionate share of these expenses. For additional expense information related to investments in Fidelity Central Funds, please refer to the "Investments in Fidelity Central Funds" note found in the Notes to Financial Statements section of the most recent Annual or Semi-Annual report.
H Expense ratios reflect operating expenses of the class. Expenses before reductions do not reflect amounts reimbursed, waived, or reduced through arrangements with the investment adviser, brokerage services, or other offset arrangements, if applicable, and do not represent the amount paid by the class during periods when reimbursements, waivers or reductions occur.
I Annualized
J Amount does not include the portfolio activity of any underlying mutual funds or exchange-traded funds (ETFs).
See accompanying notes which are an integral part of the financial statements.
Fidelity Freedom Blend 2025 Fund Premier Class
| Years ended March 31, | 2022 A |
| Selected Per–Share Data | |
| Net asset value, beginning of period | $11.95 |
| Income from Investment Operations | |
| Net investment income (loss)B,C | .44 |
| Net realized and unrealized gain (loss) | (.45) |
| Total from investment operations | (.01) |
| Distributions from net investment income | (.31) |
| Distributions from net realized gain | (.53) |
| Total distributions | (.83)D |
| Net asset value, end of period | $11.11 |
| Total ReturnE,F | (.43)% |
| Ratios to Average Net AssetsC,G,H | |
| Expenses before reductions | .26%I |
| Expenses net of fee waivers, if any | .26%I |
| Expenses net of all reductions | .26%I |
| Net investment income (loss) | 3.72%I |
| Supplemental Data | |
| Net assets, end of period (000 omitted) | $613,010 |
| Portfolio turnover rateJ | 34% |
A For the period April 6, 2021 (commencement of sale of shares) through March 31, 2022.
B Calculated based on average shares outstanding during the period.
C Net investment income (loss) is affected by the timing of the declaration of dividends by any underlying mutual funds or exchange-traded funds (ETFs). Net investment income (loss) of any such underlying funds is not included in the Fund's net investment income (loss) ratio.
D Total distributions per share do not sum due to rounding.
E Total returns for periods of less than one year are not annualized.
F Total returns would have been lower if certain expenses had not been reduced during the applicable periods shown.
G Fees and expenses of any underlying mutual funds or exchange-traded funds (ETFs) are not included in the Fund's expense ratio. The Fund indirectly bears its proportionate share of these expenses. For additional expense information related to investments in Fidelity Central Funds, please refer to the "Investments in Fidelity Central Funds" note found in the Notes to Financial Statements section of the most recent Annual or Semi-Annual report.
H Expense ratios reflect operating expenses of the class. Expenses before reductions do not reflect amounts reimbursed, waived, or reduced through arrangements with the investment adviser, brokerage services, or other offset arrangements, if applicable, and do not represent the amount paid by the class during periods when reimbursements, waivers or reductions occur.
I Annualized
J Amount does not include the portfolio activity of any underlying mutual funds or exchange-traded funds (ETFs).
See accompanying notes which are an integral part of the financial statements.
Fidelity Freedom Blend 2025 Fund Class Z
| Years ended March 31, | 2022 | 2021 | 2020 | 2019 A |
| Selected Per–Share Data | | | | |
| Net asset value, beginning of period | $11.77 | $9.13 | $9.83 | $10.00 |
| Income from Investment Operations | | | | |
| Net investment income (loss)B,C | .23 | .13 | .20 | .05 |
| Net realized and unrealized gain (loss) | (.07) | 3.01 | (.58) | (.02) |
| Total from investment operations | .16 | 3.14 | (.38) | .03 |
| Distributions from net investment income | (.30) | (.13) | (.17) | (.12) |
| Distributions from net realized gain | (.53) | (.36) | (.15) | (.08) |
| Total distributions | (.82)D | (.50)D | (.32) | (.20) |
| Net asset value, end of period | $11.11 | $11.77 | $9.13 | $9.83 |
| Total ReturnE,F | 1.01% | 34.72% | (4.30)% | .47% |
| Ratios to Average Net AssetsC,G,H | | | | |
| Expenses before reductions | .40% | .41% | .41% | .41%I |
| Expenses net of fee waivers, if any | .40% | .41% | .41% | .41%I |
| Expenses net of all reductions | .40% | .41% | .41% | .41%I |
| Net investment income (loss) | 1.97% | 1.20% | 1.91% | .93%I |
| Supplemental Data | | | | |
| Net assets, end of period (000 omitted) | $2,226 | $130 | $96 | $101 |
| Portfolio turnover rateJ | 34% | 31% | 34% | 23%I |
A For the period August 31, 2018 (commencement of operations) through March 31, 2019.
B Calculated based on average shares outstanding during the period.
C Net investment income (loss) is affected by the timing of the declaration of dividends by any underlying mutual funds or exchange-traded funds (ETFs). Net investment income (loss) of any such underlying funds is not included in the Fund's net investment income (loss) ratio.
D Total distributions per share do not sum due to rounding.
E Total returns for periods of less than one year are not annualized.
F Total returns would have been lower if certain expenses had not been reduced during the applicable periods shown.
G Fees and expenses of any underlying mutual funds or exchange-traded funds (ETFs) are not included in the Fund's expense ratio. The Fund indirectly bears its proportionate share of these expenses. For additional expense information related to investments in Fidelity Central Funds, please refer to the "Investments in Fidelity Central Funds" note found in the Notes to Financial Statements section of the most recent Annual or Semi-Annual report.
H Expense ratios reflect operating expenses of the class. Expenses before reductions do not reflect amounts reimbursed, waived, or reduced through arrangements with the investment adviser, brokerage services, or other offset arrangements, if applicable, and do not represent the amount paid by the class during periods when reimbursements, waivers or reductions occur.
I Annualized
J Amount does not include the portfolio activity of any underlying mutual funds or exchange-traded funds (ETFs).
See accompanying notes which are an integral part of the financial statements.
Fidelity Freedom Blend 2025 Fund Class Z6
| Years ended March 31, | 2022 | 2021 | 2020 | 2019 A |
| Selected Per–Share Data | | | | |
| Net asset value, beginning of period | $11.76 | $9.12 | $9.84 | $10.00 |
| Income from Investment Operations | | | | |
| Net investment income (loss)B,C | .24 | .14 | .20 | .06 |
| Net realized and unrealized gain (loss) | (.08) | 3.01 | (.58) | (.02) |
| Total from investment operations | .16 | 3.15 | (.38) | .04 |
| Distributions from net investment income | (.30) | (.15) | (.18) | (.12) |
| Distributions from net realized gain | (.53) | (.36) | (.15) | (.08) |
| Total distributions | (.82)D | (.51) | (.34)D | (.20) |
| Net asset value, end of period | $11.10 | $11.76 | $9.12 | $9.84 |
| Total ReturnE,F | 1.03% | 34.98% | (4.35)% | .60% |
| Ratios to Average Net AssetsC,G,H | | | | |
| Expenses before reductions | .30% | .31% | .32%I | .31%J |
| Expenses net of fee waivers, if any | .30% | .31% | .32%I | .31%J |
| Expenses net of all reductions | .30% | .31% | .32%I | .31%J |
| Net investment income (loss) | 2.08% | 1.30% | 2.01% | 1.03%J |
| Supplemental Data | | | | |
| Net assets, end of period (000 omitted) | $125,633 | $8,797 | $3,760 | $104 |
| Portfolio turnover rateK | 34% | 31% | 34% | 23%J |
A For the period August 31, 2018 (commencement of operations) through March 31, 2019.
B Calculated based on average shares outstanding during the period.
C Net investment income (loss) is affected by the timing of the declaration of dividends by any underlying mutual funds or exchange-traded funds (ETFs). Net investment income (loss) of any such underlying funds is not included in the Fund's net investment income (loss) ratio.
D Total distributions per share do not sum due to rounding.
E Total returns for periods of less than one year are not annualized.
F Total returns would have been lower if certain expenses had not been reduced during the applicable periods shown.
G Fees and expenses of any underlying mutual funds or exchange-traded funds (ETFs) are not included in the Fund's expense ratio. The Fund indirectly bears its proportionate share of these expenses. For additional expense information related to investments in Fidelity Central Funds, please refer to the "Investments in Fidelity Central Funds" note found in the Notes to Financial Statements section of the most recent Annual or Semi-Annual report.
H Expense ratios reflect operating expenses of the class. Expenses before reductions do not reflect amounts reimbursed, waived, or reduced through arrangements with the investment adviser, brokerage services, or other offset arrangements, if applicable, and do not represent the amount paid by the class during periods when reimbursements, waivers or reductions occur.
I On certain classes, the size and fluctuation of net assets and expense amounts may cause ratios to differ from contractual rates.
J Annualized
K Amount does not include the portfolio activity of any underlying mutual funds or exchange-traded funds (ETFs).
See accompanying notes which are an integral part of the financial statements.
Fidelity Freedom® Blend 2030 Fund
Investment Summary (Unaudited)
The information in the following tables is based on the direct investments of the Fund.
Top Holdings as of March 31, 2022
| | % of fund's net assets |
| Fidelity Series Emerging Markets Opportunities Fund | 9.9 |
| Fidelity Series Large Cap Value Index Fund | 9.5 |
| Fidelity Series Blue Chip Growth Fund | 7.1 |
| Fidelity Series Investment Grade Bond Fund | 6.6 |
| Fidelity Series Government Bond Index Fund | 6.3 |
| Fidelity Series Long-Term Treasury Bond Index Fund | 5.1 |
| Fidelity Series Large Cap Stock Fund | 5.0 |
| Fidelity Series International Value Fund | 4.7 |
| Fidelity Series Overseas Fund | 4.6 |
| Fidelity Series International Growth Fund | 4.6 |
| | 63.4 |
Asset Allocation (% of fund's net assets)
| Period end |
| | Domestic Equity Funds | 33.5% |
| | International Equity Funds | 30.7% |
| | Bond Funds | 35.2% |
| | Short-Term Funds | 0.6% |

Percentages are adjusted for the effect of futures contracts and swaps, if applicable.
Domestic Equity Funds category includes Fidelity Series Commodity Strategy Fund which invests in commodity-related investments.
Fidelity Freedom® Blend 2030 Fund
Schedule of Investments March 31, 2022
Showing Percentage of Net Assets
| U.S. Treasury Obligations - 0.0% | | | |
| | | Principal Amount | Value |
| U.S. Treasury Bills, yield at date of purchase 0.12% to 0.5% 4/14/22 to 6/23/22 (a) | | | |
| (Cost $809,745) | | 810,000 | 809,780 |
| | | Shares | Value |
|
| Domestic Equity Funds - 33.5% | | | |
| Fidelity Series Blue Chip Growth Fund (b) | | 8,065,270 | $115,897,931 |
| Fidelity Series Commodity Strategy Fund (b) | | 4,754,921 | 24,297,644 |
| Fidelity Series Large Cap Growth Index Fund (b) | | 4,149,080 | 73,023,807 |
| Fidelity Series Large Cap Stock Fund (b) | | 4,286,101 | 81,478,786 |
| Fidelity Series Large Cap Value Index Fund (b) | | 10,154,331 | 155,970,524 |
| Fidelity Series Small Cap Opportunities Fund (b) | | 2,878,349 | 39,203,110 |
| Fidelity Series Value Discovery Fund (b) | | 3,604,078 | 57,665,247 |
| TOTAL DOMESTIC EQUITY FUNDS | | | |
| (Cost $470,658,773) | | | 547,537,049 |
|
| International Equity Funds - 30.7% | | | |
| Fidelity Series Canada Fund (b) | | 2,433,183 | 37,762,995 |
| Fidelity Series Emerging Markets Fund (b) | | 1,927,319 | 17,885,519 |
| Fidelity Series Emerging Markets Opportunities Fund (b) | | 8,760,780 | 161,198,355 |
| Fidelity Series International Growth Fund (b) | | 4,561,649 | 75,632,140 |
| Fidelity Series International Index Fund (b) | | 2,802,122 | 32,056,281 |
| Fidelity Series International Small Cap Fund (b) | | 1,327,022 | 23,820,045 |
| Fidelity Series International Value Fund (b) | | 6,925,529 | 76,388,582 |
| Fidelity Series Overseas Fund (b) | | 6,026,204 | 76,050,698 |
| TOTAL INTERNATIONAL EQUITY FUNDS | | | |
| (Cost $488,574,220) | | | 500,794,615 |
|
| Bond Funds - 35.2% | | | |
| Fidelity Series 5+ Year Inflation-Protected Bond Index Fund (b) | | 4,438,511 | 42,609,709 |
| Fidelity Series Corporate Bond Fund (b) | | 7,238,172 | 73,105,535 |
| Fidelity Series Emerging Markets Debt Fund (b) | | 975,907 | 8,051,232 |
| Fidelity Series Emerging Markets Debt Local Currency Fund (b) | | 302,603 | 2,726,452 |
| Fidelity Series Floating Rate High Income Fund (b) | | 178,885 | 1,643,955 |
| Fidelity Series Government Bond Index Fund (b) | | 10,251,590 | 102,310,865 |
| Fidelity Series High Income Fund (b) | | 1,083,660 | 9,850,469 |
| Fidelity Series Inflation-Protected Bond Index Fund (b) | | 1,112,583 | 11,292,720 |
| Fidelity Series International Developed Markets Bond Index Fund (b) | | 5,417,135 | 50,541,874 |
| Fidelity Series Investment Grade Bond Fund (b) | | 9,863,330 | 107,608,927 |
| Fidelity Series Investment Grade Securitized Fund (b) | | 7,753,518 | 75,364,191 |
| Fidelity Series Long-Term Treasury Bond Index Fund (b) | | 10,901,379 | 83,068,505 |
| Fidelity Series Real Estate Income Fund (b) | | 519,685 | 5,903,622 |
| TOTAL BOND FUNDS | | | |
| (Cost $606,883,489) | | | 574,078,056 |
|
| Short-Term Funds - 0.6% | | | |
| Fidelity Cash Central Fund 0.31% (c) | | 1,096,496 | 1,096,716 |
| Fidelity Series Government Money Market Fund 0.31% (b)(d) | | 1,650,374 | 1,650,374 |
| Fidelity Series Short-Term Credit Fund (b) | | 169,691 | 1,654,488 |
| Fidelity Series Treasury Bill Index Fund (b) | | 495,663 | 4,951,676 |
| TOTAL SHORT-TERM FUNDS | | | |
| (Cost $9,399,260) | | | 9,353,254 |
| TOTAL INVESTMENT IN SECURITIES - 100.0% | | | |
| (Cost $1,576,325,487) | | | 1,632,572,754 |
| NET OTHER ASSETS (LIABILITIES) - 0.0% | | | (102,249) |
| NET ASSETS - 100% | | | $1,632,470,505 |
| Futures Contracts | | | | | |
| | Number of contracts | Expiration Date | Notional Amount | Value | Unrealized Appreciation/(Depreciation) |
| Purchased | | | | | |
| Equity Index Contracts | | | | | |
| ICE E-mini MSCI EAFE Index Contracts (United States) | 38 | June 2022 | $4,074,360 | $229,344 | $229,344 |
| ICE E-mini MSCI Emerging Markets Index Contracts (United States) | 88 | June 2022 | 4,952,200 | 229,779 | 229,779 |
| Sold | | | | | |
| Equity Index Contracts | | | | | |
| CME Micro E-mini S&P 500 Index Contracts (United States) | 32 | June 2022 | 7,249,200 | (244,845) | (244,845) |
| TOTAL FUTURES CONTRACTS | | | | | $214,278 |
The notional amount of futures purchased as a percentage of Net Assets is 0.5%
The notional amount of futures sold as a percentage of Net Assets is 0.4%
For the period, the average monthly notional amount at value for futures contracts in the aggregate was $2,319,314
Legend
(a) Security or a portion of the security was pledged to cover margin requirements for futures contracts. At period end, the value of securities pledged amounted to $809,780.
(b) Affiliated Fund
(c) Affiliated fund that is generally available only to investment companies and other accounts managed by Fidelity Investments. The rate quoted is the annualized seven-day yield of the fund at period end. A complete unaudited listing of the fund's holdings as of its most recent quarter end is available upon request. In addition, each Fidelity Central Fund's financial statements, which are not covered by the Fund's Report of Independent Registered Public Accounting Firm, are available on the SEC's website or upon request.
(d) The rate quoted is the annualized seven-day yield of the fund at period end.
Affiliated Central Funds
Fiscal year to date information regarding the Fund's investments in Fidelity Central Funds, including the ownership percentage, is presented below.
| Fund | Value, beginning of period | Purchases | Sales Proceeds | Dividend Income | Realized Gain/Loss | Change in Unrealized appreciation (depreciation) | Value, end of period | % ownership, end of period |
| Fidelity Cash Central Fund 0.31% | $-- | $3,814,607 | $2,717,891 | $266 | $-- | $-- | $1,096,716 | 0.0% |
| Total | $-- | $3,814,607 | $2,717,891 | $266 | $-- | $-- | $1,096,716 | |
Amounts in the income column in the above table include any capital gain distributions from underlying funds, which are presented in the corresponding line-item in the Statement of Operations, if applicable.
Affiliated Underlying Funds
Fiscal year to date information regarding the Fund's investments in affiliated Underlying Funds is presented below. Exchanges between classes of the same affiliated Underlying Funds may occur. If an underlying Fund changes its name, the name presented below is the name in effect at period end.
| Affiliate | Value, beginning of period | Purchases(a) | Sales Proceeds(a) | Dividend Income | Realized Gain (loss) | Change in Unrealized appreciation (depreciation) | Value, end of period |
| Fidelity Series 0-5 Year Inflation-Protected Bond Index Fund | $-- | $18,735,138 | $18,714,721 | $22,607 | $(17,050) | $-- | $-- |
| Fidelity Series 5+ Year Inflation-Protected Bond Index Fund | -- | 47,300,594 | 2,832,658 | 241,931 | (135,666) | (1,722,561) | 42,609,709 |
| Fidelity Series Blue Chip Growth Fund | 92,596,178 | 79,452,314 | 35,634,921 | 23,454,835 | (929,380) | (19,586,260) | 115,897,931 |
| Fidelity Series Canada Fund | 21,216,497 | 14,645,962 | 3,675,663 | 741,422 | (40,091) | 5,616,290 | 37,762,995 |
| Fidelity Series Commodity Strategy Fund | 33,996,737 | 25,718,553 | 36,786,620 | 13,010,947 | (1,187,878) | 2,556,852 | 24,297,644 |
| Fidelity Series Corporate Bond Fund | 55,381,263 | 32,929,470 | 9,776,808 | 1,940,944 | (227,372) | (5,201,018) | 73,105,535 |
| Fidelity Series Emerging Markets Debt Fund | 6,696,956 | 3,245,086 | 1,044,597 | 370,542 | (37,256) | (808,957) | 8,051,232 |
| Fidelity Series Emerging Markets Debt Local Currency Fund | 2,238,647 | 1,130,132 | 325,659 | 109,796 | (24,905) | (291,763) | 2,726,452 |
| Fidelity Series Emerging Markets Fund | 15,614,686 | 8,783,168 | 2,369,375 | 596,944 | (53,737) | (4,089,223) | 17,885,519 |
| Fidelity Series Emerging Markets Opportunities Fund | 140,373,700 | 98,937,894 | 24,841,160 | 18,781,147 | (918,634) | (52,353,445) | 161,198,355 |
| Fidelity Series Floating Rate High Income Fund | 1,349,167 | 657,253 | 360,696 | 69,156 | (719) | (1,050) | 1,643,955 |
| Fidelity Series Government Bond Index Fund | 68,292,325 | 47,066,265 | 7,968,398 | 962,764 | (336,287) | (4,743,040) | 102,310,865 |
| Fidelity Series Government Money Market Fund 0.31% | 8,486,392 | 4,249,581 | 11,085,599 | 4,914 | -- | -- | 1,650,374 |
| Fidelity Series High Income Fund | 7,771,857 | 3,861,836 | 1,425,366 | 515,236 | (36,280) | (321,578) | 9,850,469 |
| Fidelity Series Inflation-Protected Bond Index Fund | 68,608,157 | 25,883,125 | 83,438,373 | 3,253,487 | 3,059,961 | (2,820,150) | 11,292,720 |
| Fidelity Series International Developed Markets Bond Index Fund | -- | 53,046,661 | 322,211 | 15,820 | (5,486) | (2,177,090) | 50,541,874 |
| Fidelity Series International Growth Fund | 52,177,340 | 40,351,300 | 8,860,625 | 5,994,251 | (144,443) | (7,891,432) | 75,632,140 |
| Fidelity Series International Index Fund | 21,783,604 | 14,157,877 | 2,638,144 | 797,641 | (79,662) | (1,167,394) | 32,056,281 |
| Fidelity Series International Small Cap Fund | 18,819,110 | 10,281,169 | 1,187,853 | 3,113,898 | (66,555) | (4,025,826) | 23,820,045 |
| Fidelity Series International Value Fund | 52,120,226 | 35,712,389 | 11,730,076 | 3,760,362 | (214,112) | 500,155 | 76,388,582 |
| Fidelity Series Investment Grade Bond Fund | 75,793,550 | 48,135,596 | 10,245,907 | 2,164,919 | (315,838) | (5,758,474) | 107,608,927 |
| Fidelity Series Investment Grade Securitized Fund | 53,105,731 | 33,220,990 | 6,702,367 | 594,630 | (150,820) | (4,109,343) | 75,364,191 |
| Fidelity Series Large Cap Growth Index Fund | 58,447,110 | 32,954,181 | 25,528,759 | 2,223,907 | 350,558 | 6,800,717 | 73,023,807 |
| Fidelity Series Large Cap Stock Fund | 63,830,907 | 37,241,373 | 21,217,960 | 7,055,795 | (365,701) | 1,990,167 | 81,478,786 |
| Fidelity Series Large Cap Value Index Fund | 121,928,363 | 67,661,293 | 38,983,567 | 10,322,052 | (428,328) | 5,792,763 | 155,970,524 |
| Fidelity Series Long-Term Treasury Bond Index Fund | 33,502,947 | 60,769,196 | 7,133,542 | 1,213,897 | (773,990) | (3,296,106) | 83,068,505 |
| Fidelity Series Overseas Fund | 52,265,601 | 35,569,522 | 9,675,957 | 2,220,166 | 5,398 | (2,113,866) | 76,050,698 |
| Fidelity Series Real Estate Income Fund | 4,655,742 | 2,017,554 | 878,673 | 229,712 | (10,418) | 119,417 | 5,903,622 |
| Fidelity Series Short-Term Credit Fund | 4,185,662 | 3,206,818 | 5,572,166 | 87,647 | (106,113) | (59,713) | 1,654,488 |
| Fidelity Series Small Cap Opportunities Fund | 30,829,968 | 25,785,162 | 8,564,768 | 9,494,420 | (586,062) | (8,261,190) | 39,203,110 |
| Fidelity Series Treasury Bill Index Fund | 13,484,702 | 10,236,283 | 18,759,978 | 11,354 | (16,012) | 6,681 | 4,951,676 |
| Fidelity Series Value Discovery Fund | 45,052,585 | 27,235,002 | 14,364,733 | 6,624,321 | (172,220) | (85,387) | 57,665,247 |
| Total | $1,224,605,710 | $950,178,737 | $432,647,900 | $120,001,464 | $(3,965,098) | $(107,501,824) | $1,630,666,258 |
(a) Includes the value of shares purchased or redeemed through in-kind transactions, if applicable.
Amounts in the income column in the above table include any capital gain distributions from underlying funds, which are presented in the corresponding line-item in the Statement of Operations, if applicable.
Investment Valuation
The following is a summary of the inputs used, as of March 31, 2022, involving the Fund's assets and liabilities carried at fair value. The inputs or methodology used for valuing securities may not be an indication of the risk associated with investing in those securities. For more information on valuation inputs, and their aggregation into the levels used below, please refer to the Investment Valuation section in the accompanying Notes to Financial Statements.
| | Valuation Inputs at Reporting Date: |
| Description | Total | Level 1 | Level 2 | Level 3 |
| Investments in Securities: | | | | |
| Other Short-Term Investments and Net Other Assets | $809,780 | $-- | $809,780 | $-- |
| Domestic Equity Funds | 547,537,049 | 547,537,049 | -- | -- |
| International Equity Funds | 500,794,615 | 500,794,615 | -- | -- |
| Bond Funds | 574,078,056 | 574,078,056 | -- | -- |
| Short-Term Funds | 9,353,254 | 9,353,254 | -- | -- |
| Total Investments in Securities: | $1,632,572,754 | $1,631,762,974 | $809,780 | $-- |
| Derivative Instruments: | | | | |
| Assets | | | | |
| Futures Contracts | $459,123 | $459,123 | $-- | $-- |
| Total Assets | $459,123 | $459,123 | $-- | $-- |
| Liabilities | | | | |
| Futures Contracts | $(244,845) | $(244,845) | $-- | $-- |
| Total Liabilities | $(244,845) | $(244,845) | $-- | $-- |
| Total Derivative Instruments: | $214,278 | $214,278 | $-- | $-- |
Value of Derivative Instruments
The following table is a summary of the Fund's value of derivative instruments by primary risk exposure as of March 31, 2022. For additional information on derivative instruments, please refer to the Derivative Instruments section in the accompanying Notes to Financial Statements.
| Primary Risk Exposure / Derivative Type | Value |
| | Asset | Liability |
| Equity Risk | | |
| Futures Contracts(a) | $459,123 | $(244,845) |
| Total Equity Risk | 459,123 | (244,845) |
| Total Value of Derivatives | $459,123 | $(244,845) |
(a) Reflects gross cumulative appreciation (depreciation) on futures contracts as presented in the Schedule of Investments. In the Statement of Assets and Liabilities, the period end daily variation margin is included in receivable or payable for daily variation margin on futures contracts, and the net cumulative appreciation (depreciation) is included in Total accumulated earnings (loss).
See accompanying notes which are an integral part of the financial statements.
Fidelity Freedom® Blend 2030 Fund
Financial Statements
Statement of Assets and Liabilities
| | | March 31, 2022 |
| Assets | | |
Investment in securities, at value — See accompanying schedule:
Unaffiliated issuers (cost $809,745) | $809,780 | |
| Fidelity Central Funds (cost $1,096,716) | 1,096,716 | |
| Other affiliated issuers (cost $1,574,419,026) | 1,630,666,258 | |
| Total Investment in Securities (cost $1,576,325,487) | | $1,632,572,754 |
| Cash | | 925 |
| Receivable for investments sold | | 34,996,150 |
| Receivable for fund shares sold | | 1,556,001 |
| Distributions receivable from Fidelity Central Funds | | 174 |
| Total assets | | 1,669,126,004 |
| Liabilities | | |
| Payable for investments purchased | $30,674,983 | |
| Payable for fund shares redeemed | 5,472,771 | |
| Accrued management fee | 426,929 | |
| Distribution and service plan fees payable | 5,791 | |
| Payable for daily variation margin on futures contracts | 75,025 | |
| Total liabilities | | 36,655,499 |
| Net Assets | | $1,632,470,505 |
| Net Assets consist of: | | |
| Paid in capital | | $1,550,664,083 |
| Total accumulated earnings (loss) | | 81,806,422 |
| Net Assets | | $1,632,470,505 |
| Net Asset Value and Maximum Offering Price | | |
| Class A: | | |
| Net Asset Value and redemption price per share ($9,929,963 ÷ 893,533 shares)(a) | | $11.11 |
| Maximum offering price per share (100/94.25 of $11.11) | | $11.79 |
| Class M: | | |
| Net Asset Value and redemption price per share ($2,725,942 ÷ 245,497 shares)(a) | | $11.10 |
| Maximum offering price per share (100/96.50 of $11.10) | | $11.50 |
| Class C: | | |
| Net Asset Value and offering price per share ($3,241,896 ÷ 294,137 shares)(a) | | $11.02 |
| Fidelity Freedom Blend 2030 Fund: | | |
| Net Asset Value, offering price and redemption price per share ($91,427,801 ÷ 8,202,705 shares) | | $11.15 |
| Class K: | | |
| Net Asset Value, offering price and redemption price per share ($48,881,924 ÷ 4,373,226 shares) | | $11.18 |
| Class K6: | | |
| Net Asset Value, offering price and redemption price per share ($613,817,212 ÷ 54,711,915 shares) | | $11.22 |
| Class I: | | |
| Net Asset Value, offering price and redemption price per share ($37,047,448 ÷ 3,320,405 shares) | | $11.16 |
| Class Z: | | |
| Net Asset Value, offering price and redemption price per share ($5,100,803 ÷ 455,872 shares) | | $11.19 |
| Class Z6: | | |
| Net Asset Value, offering price and redemption price per share ($105,355,469 ÷ 9,412,599 shares) | | $11.19 |
| Premier Class: | | |
| Net Asset Value, offering price and redemption price per share ($714,942,047 ÷ 63,855,506 shares) | | $11.20 |
(a) Redemption price per share is equal to net asset value less any applicable contingent deferred sales charge.
See accompanying notes which are an integral part of the financial statements.
Statement of Operations
| | | Year ended March 31, 2022 |
| Investment Income | | |
| Dividends: | | |
| Affiliated issuers | | $43,846,851 |
| Interest | | 245 |
| Income from Fidelity Central Funds | | 266 |
| Total income | | 43,847,362 |
| Expenses | | |
| Management fee | $4,871,139 | |
| Distribution and service plan fees | 66,979 | |
| Independent trustees' fees and expenses | 4,376 | |
| Total expenses | | 4,942,494 |
| Net investment income (loss) | | 38,904,868 |
| Realized and Unrealized Gain (Loss) | | |
| Net realized gain (loss) on: | | |
| Investment securities: | | |
| Affiliated issuers | (3,965,098) | |
| Futures contracts | (389,316) | |
| Capital gain distributions from underlying funds: | | |
| Affiliated issuers | 76,154,613 | |
| Total net realized gain (loss) | | 71,800,199 |
| Change in net unrealized appreciation (depreciation) on: | | |
| Investment securities: | | |
| Unaffiliated issuers | 35 | |
| Affiliated issuers | (107,501,824) | |
| Futures contracts | 214,278 | |
| Total change in net unrealized appreciation (depreciation) | | (107,287,511) |
| Net gain (loss) | | (35,487,312) |
| Net increase (decrease) in net assets resulting from operations | | $3,417,556 |
See accompanying notes which are an integral part of the financial statements.
Statement of Changes in Net Assets
| | Year ended March 31, 2022 | Year ended March 31, 2021 |
| Increase (Decrease) in Net Assets | | |
| Operations | | |
| Net investment income (loss) | $38,904,868 | $13,126,475 |
| Net realized gain (loss) | 71,800,199 | 52,112,651 |
| Change in net unrealized appreciation (depreciation) | (107,287,511) | 247,544,865 |
| Net increase (decrease) in net assets resulting from operations | 3,417,556 | 312,783,991 |
| Distributions to shareholders | (107,024,448) | (48,584,327) |
| Share transactions - net increase (decrease) | 511,806,513 | 287,249,253 |
| Total increase (decrease) in net assets | 408,199,621 | 551,448,917 |
| Net Assets | | |
| Beginning of period | 1,224,270,884 | 672,821,967 |
| End of period | $1,632,470,505 | $1,224,270,884 |
See accompanying notes which are an integral part of the financial statements.
Financial Highlights
Fidelity Freedom Blend 2030 Fund Class A
| Years ended March 31, | 2022 | 2021 | 2020 | 2019 A |
| Selected Per–Share Data | | | | |
| Net asset value, beginning of period | $11.76 | $8.81 | $9.68 | $10.00 |
| Income from Investment Operations | | | | |
| Net investment income (loss)B,C | .19 | .10 | .16 | .02 |
| Net realized and unrealized gain (loss) | (.02) | 3.36 | (.70) | (.09) |
| Total from investment operations | .17 | 3.46 | (.54) | (.07) |
| Distributions from net investment income | (.26) | (.12) | (.16) | (.13) |
| Distributions from net realized gain | (.56) | (.39) | (.17) | (.12) |
| Total distributions | (.82) | (.51) | (.33) | (.25) |
| Net asset value, end of period | $11.11 | $11.76 | $8.81 | $9.68 |
| Total ReturnD,E | 1.05% | 39.73% | (6.09)% | (.45)% |
| Ratios to Average Net AssetsC,F,G | | | | |
| Expenses before reductions | .77% | .77% | .77% | .78%H,I |
| Expenses net of fee waivers, if any | .77% | .77% | .77% | .78%H,I |
| Expenses net of all reductions | .77% | .77% | .77% | .78%H,I |
| Net investment income (loss) | 1.59% | .88% | 1.56% | .39%H |
| Supplemental Data | | | | |
| Net assets, end of period (000 omitted) | $9,930 | $5,650 | $1,516 | $348 |
| Portfolio turnover rateJ | 29% | 30% | 31% | 29%H |
A For the period August 31, 2018 (commencement of operations) through March 31, 2019.
B Calculated based on average shares outstanding during the period.
C Net investment income (loss) is affected by the timing of the declaration of dividends by any underlying mutual funds or exchange-traded funds (ETFs). Net investment income (loss) of any such underlying funds is not included in the Fund's net investment income (loss) ratio.
D Total returns for periods of less than one year are not annualized.
E Total returns do not include the effect of the sales charges.
F Fees and expenses of any underlying mutual funds or exchange-traded funds (ETFs) are not included in the Fund's expense ratio. The Fund indirectly bears its proportionate share of these expenses. For additional expense information related to investments in Fidelity Central Funds, please refer to the "Investments in Fidelity Central Funds" note found in the Notes to Financial Statements section of the most recent Annual or Semi-Annual report.
G Expense ratios reflect operating expenses of the class. Expenses before reductions do not reflect amounts reimbursed, waived, or reduced through arrangements with the investment adviser, brokerage services, or other offset arrangements, if applicable, and do not represent the amount paid by the class during periods when reimbursements, waivers or reductions occur.
H Annualized
I On certain classes, the size and fluctuation of net assets and expense amounts may cause ratios to differ from contractual rates.
J Amount does not include the portfolio activity of any underlying mutual funds or exchange-traded funds (ETFs).
See accompanying notes which are an integral part of the financial statements.
Fidelity Freedom Blend 2030 Fund Class M
| Years ended March 31, | 2022 | 2021 | 2020 | 2019 A |
| Selected Per–Share Data | | | | |
| Net asset value, beginning of period | $11.76 | $8.79 | $9.68 | $10.00 |
| Income from Investment Operations | | | | |
| Net investment income (loss)B,C | .16 | .07 | .13 | .01 |
| Net realized and unrealized gain (loss) | (.02) | 3.37 | (.70) | (.09) |
| Total from investment operations | .14 | 3.44 | (.57) | (.08) |
| Distributions from net investment income | (.24) | (.09) | (.15) | (.12) |
| Distributions from net realized gain | (.56) | (.38) | (.17) | (.12) |
| Total distributions | (.80) | (.47) | (.32) | (.24) |
| Net asset value, end of period | $11.10 | $11.76 | $8.79 | $9.68 |
| Total ReturnD,E,F | .78% | 39.53% | (6.44)% | (.56)% |
| Ratios to Average Net AssetsC,G,H | | | | |
| Expenses before reductions | 1.02% | 1.02% | 1.02% | 1.02%I |
| Expenses net of fee waivers, if any | 1.02% | 1.02% | 1.02% | 1.02%I |
| Expenses net of all reductions | 1.02% | 1.02% | 1.02% | 1.02%I |
| Net investment income (loss) | 1.34% | .64% | 1.32% | .15%I |
| Supplemental Data | | | | |
| Net assets, end of period (000 omitted) | $2,726 | $2,306 | $976 | $170 |
| Portfolio turnover rateJ | 29% | 30% | 31% | 29%I |
A For the period August 31, 2018 (commencement of operations) through March 31, 2019.
B Calculated based on average shares outstanding during the period.
C Net investment income (loss) is affected by the timing of the declaration of dividends by any underlying mutual funds or exchange-traded funds (ETFs). Net investment income (loss) of any such underlying funds is not included in the Fund's net investment income (loss) ratio.
D Total returns for periods of less than one year are not annualized.
E Total returns would have been lower if certain expenses had not been reduced during the applicable periods shown.
F Total returns do not include the effect of the sales charges.
G Fees and expenses of any underlying mutual funds or exchange-traded funds (ETFs) are not included in the Fund's expense ratio. The Fund indirectly bears its proportionate share of these expenses. For additional expense information related to investments in Fidelity Central Funds, please refer to the "Investments in Fidelity Central Funds" note found in the Notes to Financial Statements section of the most recent Annual or Semi-Annual report.
H Expense ratios reflect operating expenses of the class. Expenses before reductions do not reflect amounts reimbursed, waived, or reduced through arrangements with the investment adviser, brokerage services, or other offset arrangements, if applicable, and do not represent the amount paid by the class during periods when reimbursements, waivers or reductions occur.
I Annualized
J Amount does not include the portfolio activity of any underlying mutual funds or exchange-traded funds (ETFs).
See accompanying notes which are an integral part of the financial statements.
Fidelity Freedom Blend 2030 Fund Class C
| Years ended March 31, | 2022 | 2021 | 2020 | 2019 A |
| Selected Per–Share Data | | | | |
| Net asset value, beginning of period | $11.68 | $8.77 | $9.66 | $10.00 |
| Income from Investment Operations | | | | |
| Net investment income (loss)B,C | .10 | .01 | .08 | (.02) |
| Net realized and unrealized gain (loss) | (.02) | 3.35 | (.71) | (.08) |
| Total from investment operations | .08 | 3.36 | (.63) | (.10) |
| Distributions from net investment income | (.19) | (.06) | (.09) | (.12) |
| Distributions from net realized gain | (.55) | (.39) | (.17) | (.12) |
| Total distributions | (.74) | (.45) | (.26) | (.24) |
| Net asset value, end of period | $11.02 | $11.68 | $8.77 | $9.66 |
| Total ReturnD,E,F | .35% | 38.75% | (6.94)% | (.81)% |
| Ratios to Average Net AssetsC,G,H | | | | |
| Expenses before reductions | 1.52% | 1.52% | 1.51%I | 1.52%J |
| Expenses net of fee waivers, if any | 1.52% | 1.52% | 1.51%I | 1.52%J |
| Expenses net of all reductions | 1.52% | 1.52% | 1.51%I | 1.52%J |
| Net investment income (loss) | .84% | .13% | .82% | (.35)%J |
| Supplemental Data | | | | |
| Net assets, end of period (000 omitted) | $3,242 | $3,003 | $987 | $259 |
| Portfolio turnover rateK | 29% | 30% | 31% | 29%J |
A For the period August 31, 2018 (commencement of operations) through March 31, 2019.
B Calculated based on average shares outstanding during the period.
C Net investment income (loss) is affected by the timing of the declaration of dividends by any underlying mutual funds or exchange-traded funds (ETFs). Net investment income (loss) of any such underlying funds is not included in the Fund's net investment income (loss) ratio.
D Total returns for periods of less than one year are not annualized.
E Total returns would have been lower if certain expenses had not been reduced during the applicable periods shown.
F Total returns do not include the effect of the contingent deferred sales charge.
G Fees and expenses of any underlying mutual funds or exchange-traded funds (ETFs) are not included in the Fund's expense ratio. The Fund indirectly bears its proportionate share of these expenses. For additional expense information related to investments in Fidelity Central Funds, please refer to the "Investments in Fidelity Central Funds" note found in the Notes to Financial Statements section of the most recent Annual or Semi-Annual report.
H Expense ratios reflect operating expenses of the class. Expenses before reductions do not reflect amounts reimbursed, waived, or reduced through arrangements with the investment adviser, brokerage services, or other offset arrangements, if applicable, and do not represent the amount paid by the class during periods when reimbursements, waivers or reductions occur.
I On certain classes, the size and fluctuation of net assets and expense amounts may cause ratios to differ from contractual rates.
J Annualized
K Amount does not include the portfolio activity of any underlying mutual funds or exchange-traded funds (ETFs).
See accompanying notes which are an integral part of the financial statements.
Fidelity Freedom Blend 2030 Fund
| Years ended March 31, | 2022 | 2021 | 2020 | 2019 A |
| Selected Per–Share Data | | | | |
| Net asset value, beginning of period | $11.80 | $8.82 | $9.69 | $10.00 |
| Income from Investment Operations | | | | |
| Net investment income (loss)B,C | .22 | .12 | .18 | .04 |
| Net realized and unrealized gain (loss) | (.01) | 3.38 | (.70) | (.09) |
| Total from investment operations | .21 | 3.50 | (.52) | (.05) |
| Distributions from net investment income | (.29) | (.13) | (.18) | (.14) |
| Distributions from net realized gain | (.57) | (.39) | (.17) | (.12) |
| Total distributions | (.86) | (.52) | (.35) | (.26) |
| Net asset value, end of period | $11.15 | $11.80 | $8.82 | $9.69 |
| Total ReturnD | 1.37% | 40.16% | (5.94)% | (.26)% |
| Ratios to Average Net AssetsC,E,F | | | | |
| Expenses before reductions | .52% | .52% | .53%G | .52%H |
| Expenses net of fee waivers, if any | .52% | .52% | .53%G | .52%H |
| Expenses net of all reductions | .52% | .52% | .53%G | .52%H |
| Net investment income (loss) | 1.84% | 1.14% | 1.81% | .65%H |
| Supplemental Data | | | | |
| Net assets, end of period (000 omitted) | $91,428 | $32,244 | $17,917 | $762 |
| Portfolio turnover rateI | 29% | 30% | 31% | 29%H |
A For the period August 31, 2018 (commencement of operations) through March 31, 2019.
B Calculated based on average shares outstanding during the period.
C Net investment income (loss) is affected by the timing of the declaration of dividends by any underlying mutual funds or exchange-traded funds (ETFs). Net investment income (loss) of any such underlying funds is not included in the Fund's net investment income (loss) ratio.
D Total returns for periods of less than one year are not annualized.
E Fees and expenses of any underlying mutual funds or exchange-traded funds (ETFs) are not included in the Fund's expense ratio. The Fund indirectly bears its proportionate share of these expenses. For additional expense information related to investments in Fidelity Central Funds, please refer to the "Investments in Fidelity Central Funds" note found in the Notes to Financial Statements section of the most recent Annual or Semi-Annual report.
F Expense ratios reflect operating expenses of the class. Expenses before reductions do not reflect amounts reimbursed, waived, or reduced through arrangements with the investment adviser, brokerage services, or other offset arrangements, if applicable, and do not represent the amount paid by the class during periods when reimbursements, waivers or reductions occur.
G On certain classes, the size and fluctuation of net assets and expense amounts may cause ratios to differ from contractual rates.
H Annualized
I Amount does not include the portfolio activity of any underlying mutual funds or exchange-traded funds (ETFs).
See accompanying notes which are an integral part of the financial statements.
Fidelity Freedom Blend 2030 Fund Class K
| Years ended March 31, | 2022 | 2021 | 2020 | 2019 A |
| Selected Per–Share Data | | | | |
| Net asset value, beginning of period | $11.82 | $8.83 | $9.70 | $10.00 |
| Income from Investment Operations | | | | |
| Net investment income (loss)B,C | .23 | .13 | .20 | .04 |
| Net realized and unrealized gain (loss) | (.02) | 3.39 | (.71) | (.08) |
| Total from investment operations | .21 | 3.52 | (.51) | (.04) |
| Distributions from net investment income | (.28) | (.14) | (.19) | (.14) |
| Distributions from net realized gain | (.57) | (.39) | (.17) | (.12) |
| Total distributions | (.85) | (.53) | (.36) | (.26) |
| Net asset value, end of period | $11.18 | $11.82 | $8.83 | $9.70 |
| Total ReturnD | 1.43% | 40.29% | (5.86)% | (.15)% |
| Ratios to Average Net AssetsC,E,F | | | | |
| Expenses before reductions | .42% | .42% | .42% | .42%G |
| Expenses net of fee waivers, if any | .42% | .42% | .42% | .42%G |
| Expenses net of all reductions | .42% | .42% | .42% | .42%G |
| Net investment income (loss) | 1.94% | 1.24% | 1.91% | .75%G |
| Supplemental Data | | | | |
| Net assets, end of period (000 omitted) | $48,882 | $31,624 | $21,646 | $100 |
| Portfolio turnover rateH | 29% | 30% | 31% | 29%G |
A For the period August 31, 2018 (commencement of operations) through March 31, 2019.
B Calculated based on average shares outstanding during the period.
C Net investment income (loss) is affected by the timing of the declaration of dividends by any underlying mutual funds or exchange-traded funds (ETFs). Net investment income (loss) of any such underlying funds is not included in the Fund's net investment income (loss) ratio.
D Total returns for periods of less than one year are not annualized.
E Fees and expenses of any underlying mutual funds or exchange-traded funds (ETFs) are not included in the Fund's expense ratio. The Fund indirectly bears its proportionate share of these expenses. For additional expense information related to investments in Fidelity Central Funds, please refer to the "Investments in Fidelity Central Funds" note found in the Notes to Financial Statements section of the most recent Annual or Semi-Annual report.
F Expense ratios reflect operating expenses of the class. Expenses before reductions do not reflect amounts reimbursed, waived, or reduced through arrangements with the investment adviser, brokerage services, or other offset arrangements, if applicable, and do not represent the amount paid by the class during periods when reimbursements, waivers or reductions occur.
G Annualized
H Amount does not include the portfolio activity of any underlying mutual funds or exchange-traded funds (ETFs).
See accompanying notes which are an integral part of the financial statements.
Fidelity Freedom Blend 2030 Fund Class K6
| Years ended March 31, | 2022 | 2021 | 2020 | 2019 A |
| Selected Per–Share Data | | | | |
| Net asset value, beginning of period | $11.84 | $8.85 | $9.70 | $10.00 |
| Income from Investment Operations | | | | |
| Net investment income (loss)B,C | .25 | .14 | .20 | .05 |
| Net realized and unrealized gain (loss) | (.02) | 3.39 | (.70) | (.09) |
| Total from investment operations | .23 | 3.53 | (.50) | (.04) |
| Distributions from net investment income | (.28) | (.15) | (.18) | (.14) |
| Distributions from net realized gain | (.57) | (.39) | (.17) | (.12) |
| Total distributions | (.85) | (.54) | (.35) | (.26) |
| Net asset value, end of period | $11.22 | $11.84 | $8.85 | $9.70 |
| Total ReturnD,E | 1.56% | 40.33% | (5.71)% | (.11)% |
| Ratios to Average Net AssetsC,F,G | | | | |
| Expenses before reductions | .32% | .32% | .32% | .33%H,I |
| Expenses net of fee waivers, if any | .32% | .32% | .32% | .33%H,I |
| Expenses net of all reductions | .32% | .32% | .32% | .33%H,I |
| Net investment income (loss) | 2.04% | 1.34% | 2.02% | .84%H |
| Supplemental Data | | | | |
| Net assets, end of period (000 omitted) | $613,817 | $1,111,589 | $615,185 | $21,781 |
| Portfolio turnover rateJ | 29% | 30% | 31% | 29%H |
A For the period August 31, 2018 (commencement of operations) through March 31, 2019.
B Calculated based on average shares outstanding during the period.
C Net investment income (loss) is affected by the timing of the declaration of dividends by any underlying mutual funds or exchange-traded funds (ETFs). Net investment income (loss) of any such underlying funds is not included in the Fund's net investment income (loss) ratio.
D Total returns for periods of less than one year are not annualized.
E Total returns would have been lower if certain expenses had not been reduced during the applicable periods shown.
F Fees and expenses of any underlying mutual funds or exchange-traded funds (ETFs) are not included in the Fund's expense ratio. The Fund indirectly bears its proportionate share of these expenses. For additional expense information related to investments in Fidelity Central Funds, please refer to the "Investments in Fidelity Central Funds" note found in the Notes to Financial Statements section of the most recent Annual or Semi-Annual report.
G Expense ratios reflect operating expenses of the class. Expenses before reductions do not reflect amounts reimbursed, waived, or reduced through arrangements with the investment adviser, brokerage services, or other offset arrangements, if applicable, and do not represent the amount paid by the class during periods when reimbursements, waivers or reductions occur.
H Annualized
I On certain classes, the size and fluctuation of net assets and expense amounts may cause ratios to differ from contractual rates.
J Amount does not include the portfolio activity of any underlying mutual funds or exchange-traded funds (ETFs).
See accompanying notes which are an integral part of the financial statements.
Fidelity Freedom Blend 2030 Fund Class I
| Years ended March 31, | 2022 | 2021 | 2020 | 2019 A |
| Selected Per–Share Data | | | | |
| Net asset value, beginning of period | $11.80 | $8.82 | $9.69 | $10.00 |
| Income from Investment Operations | | | | |
| Net investment income (loss)B,C | .22 | .12 | .18 | .04 |
| Net realized and unrealized gain (loss) | (.02) | 3.38 | (.70) | (.10) |
| Total from investment operations | .20 | 3.50 | (.52) | (.06) |
| Distributions from net investment income | (.28) | (.13) | (.18) | (.14) |
| Distributions from net realized gain | (.57) | (.39) | (.17) | (.12) |
| Total distributions | (.84)D | (.52) | (.35) | (.25)D |
| Net asset value, end of period | $11.16 | $11.80 | $8.82 | $9.69 |
| Total ReturnE | 1.35% | 40.19% | (5.92)% | (.29)% |
| Ratios to Average Net AssetsC,F,G | | | | |
| Expenses before reductions | .52% | .52% | .53%H | .52%I |
| Expenses net of fee waivers, if any | .52% | .52% | .53%H | .52%I |
| Expenses net of all reductions | .52% | .52% | .53%H | .52%I |
| Net investment income (loss) | 1.84% | 1.14% | 1.81% | .65%I |
| Supplemental Data | | | | |
| Net assets, end of period (000 omitted) | $37,047 | $30,890 | $10,530 | $100 |
| Portfolio turnover rateJ | 29% | 30% | 31% | 29%I |
A For the period August 31, 2018 (commencement of operations) through March 31, 2019.
B Calculated based on average shares outstanding during the period.
C Net investment income (loss) is affected by the timing of the declaration of dividends by any underlying mutual funds or exchange-traded funds (ETFs). Net investment income (loss) of any such underlying funds is not included in the Fund's net investment income (loss) ratio.
D Total distributions per share do not sum due to rounding.
E Total returns for periods of less than one year are not annualized.
F Fees and expenses of any underlying mutual funds or exchange-traded funds (ETFs) are not included in the Fund's expense ratio. The Fund indirectly bears its proportionate share of these expenses. For additional expense information related to investments in Fidelity Central Funds, please refer to the "Investments in Fidelity Central Funds" note found in the Notes to Financial Statements section of the most recent Annual or Semi-Annual report.
G Expense ratios reflect operating expenses of the class. Expenses before reductions do not reflect amounts reimbursed, waived, or reduced through arrangements with the investment adviser, brokerage services, or other offset arrangements, if applicable, and do not represent the amount paid by the class during periods when reimbursements, waivers or reductions occur.
H On certain classes, the size and fluctuation of net assets and expense amounts may cause ratios to differ from contractual rates.
I Annualized
J Amount does not include the portfolio activity of any underlying mutual funds or exchange-traded funds (ETFs).
See accompanying notes which are an integral part of the financial statements.
Fidelity Freedom Blend 2030 Fund Premier Class
| Years ended March 31, | 2022 A |
| Selected Per–Share Data | |
| Net asset value, beginning of period | $12.04 |
| Income from Investment Operations | |
| Net investment income (loss)B,C | .45 |
| Net realized and unrealized gain (loss) | (.41) |
| Total from investment operations | .04 |
| Distributions from net investment income | (.31) |
| Distributions from net realized gain | (.57) |
| Total distributions | (.88) |
| Net asset value, end of period | $11.20 |
| Total ReturnD | (.06)% |
| Ratios to Average Net AssetsC,E,F | |
| Expenses before reductions | .27%G |
| Expenses net of fee waivers, if any | .27%G |
| Expenses net of all reductions | .27%G |
| Net investment income (loss) | 3.76%G |
| Supplemental Data | |
| Net assets, end of period (000 omitted) | $714,942 |
| Portfolio turnover rateH | 29% |
A For the period April 6, 2021 (commencement of sale of shares) through March 31, 2022.
B Calculated based on average shares outstanding during the period.
C Net investment income (loss) is affected by the timing of the declaration of dividends by any underlying mutual funds or exchange-traded funds (ETFs). Net investment income (loss) of any such underlying funds is not included in the Fund's net investment income (loss) ratio.
D Total returns for periods of less than one year are not annualized.
E Fees and expenses of any underlying mutual funds or exchange-traded funds (ETFs) are not included in the Fund's expense ratio. The Fund indirectly bears its proportionate share of these expenses. For additional expense information related to investments in Fidelity Central Funds, please refer to the "Investments in Fidelity Central Funds" note found in the Notes to Financial Statements section of the most recent Annual or Semi-Annual report.
F Expense ratios reflect operating expenses of the class. Expenses before reductions do not reflect amounts reimbursed, waived, or reduced through arrangements with the investment adviser, brokerage services, or other offset arrangements, if applicable, and do not represent the amount paid by the class during periods when reimbursements, waivers or reductions occur.
G Annualized
H Amount does not include the portfolio activity of any underlying mutual funds or exchange-traded funds (ETFs).
See accompanying notes which are an integral part of the financial statements.
Fidelity Freedom Blend 2030 Fund Class Z
| Years ended March 31, | 2022 | 2021 | 2020 | 2019 A |
| Selected Per–Share Data | | | | |
| Net asset value, beginning of period | $11.84 | $8.85 | $9.70 | $10.00 |
| Income from Investment Operations | | | | |
| Net investment income (loss)B,C | .23 | .13 | .19 | .04 |
| Net realized and unrealized gain (loss) | (.01) | 3.39 | (.70) | (.08) |
| Total from investment operations | .22 | 3.52 | (.51) | (.04) |
| Distributions from net investment income | (.30) | (.14) | (.17) | (.14) |
| Distributions from net realized gain | (.57) | (.39) | (.17) | (.12) |
| Total distributions | (.87) | (.53) | (.34) | (.26) |
| Net asset value, end of period | $11.19 | $11.84 | $8.85 | $9.70 |
| Total ReturnD | 1.44% | 40.22% | (5.83)% | (.15)% |
| Ratios to Average Net AssetsC,E,F | | | | |
| Expenses before reductions | .42% | .42% | .42% | .42%G |
| Expenses net of fee waivers, if any | .42% | .42% | .42% | .42%G |
| Expenses net of all reductions | .42% | .42% | .42% | .42%G |
| Net investment income (loss) | 1.94% | 1.24% | 1.92% | .75%G |
| Supplemental Data | | | | |
| Net assets, end of period (000 omitted) | $5,101 | $290 | $141 | $100 |
| Portfolio turnover rateH | 29% | 30% | 31% | 29%G |
A For the period August 31, 2018 (commencement of operations) through March 31, 2019.
B Calculated based on average shares outstanding during the period.
C Net investment income (loss) is affected by the timing of the declaration of dividends by any underlying mutual funds or exchange-traded funds (ETFs). Net investment income (loss) of any such underlying funds is not included in the Fund's net investment income (loss) ratio.
D Total returns for periods of less than one year are not annualized.
E Fees and expenses of any underlying mutual funds or exchange-traded funds (ETFs) are not included in the Fund's expense ratio. The Fund indirectly bears its proportionate share of these expenses. For additional expense information related to investments in Fidelity Central Funds, please refer to the "Investments in Fidelity Central Funds" note found in the Notes to Financial Statements section of the most recent Annual or Semi-Annual report.
F Expense ratios reflect operating expenses of the class. Expenses before reductions do not reflect amounts reimbursed, waived, or reduced through arrangements with the investment adviser, brokerage services, or other offset arrangements, if applicable, and do not represent the amount paid by the class during periods when reimbursements, waivers or reductions occur.
G Annualized
H Amount does not include the portfolio activity of any underlying mutual funds or exchange-traded funds (ETFs).
See accompanying notes which are an integral part of the financial statements.
Fidelity Freedom Blend 2030 Fund Class Z6
| Years ended March 31, | 2022 | 2021 | 2020 | 2019 A |
| Selected Per–Share Data | | | | |
| Net asset value, beginning of period | $11.84 | $8.85 | $9.70 | $10.00 |
| Income from Investment Operations | | | | |
| Net investment income (loss)B,C | .24 | .15 | .19 | .05 |
| Net realized and unrealized gain (loss) | (.02) | 3.38 | (.69) | (.09) |
| Total from investment operations | .22 | 3.53 | (.50) | (.04) |
| Distributions from net investment income | (.30) | (.15) | (.18) | (.14) |
| Distributions from net realized gain | (.57) | (.39) | (.17) | (.12) |
| Total distributions | (.87) | (.54) | (.35) | (.26) |
| Net asset value, end of period | $11.19 | $11.84 | $8.85 | $9.70 |
| Total ReturnD | 1.48% | 40.39% | (5.72)% | (.11)% |
| Ratios to Average Net AssetsC,E,F | | | | |
| Expenses before reductions | .32% | .32% | .33%G | .32%H |
| Expenses net of fee waivers, if any | .32% | .32% | .33%G | .32%H |
| Expenses net of all reductions | .32% | .32% | .33%G | .32%H |
| Net investment income (loss) | 2.04% | 1.34% | 2.01% | .85%H |
| Supplemental Data | | | | |
| Net assets, end of period (000 omitted) | $105,355 | $6,674 | $3,925 | $368 |
| Portfolio turnover rateI | 29% | 30% | 31% | 29%H |
A For the period August 31, 2018 (commencement of operations) through March 31, 2019.
B Calculated based on average shares outstanding during the period.
C Net investment income (loss) is affected by the timing of the declaration of dividends by any underlying mutual funds or exchange-traded funds (ETFs). Net investment income (loss) of any such underlying funds is not included in the Fund's net investment income (loss) ratio.
D Total returns for periods of less than one year are not annualized.
E Fees and expenses of any underlying mutual funds or exchange-traded funds (ETFs) are not included in the Fund's expense ratio. The Fund indirectly bears its proportionate share of these expenses. For additional expense information related to investments in Fidelity Central Funds, please refer to the "Investments in Fidelity Central Funds" note found in the Notes to Financial Statements section of the most recent Annual or Semi-Annual report.
F Expense ratios reflect operating expenses of the class. Expenses before reductions do not reflect amounts reimbursed, waived, or reduced through arrangements with the investment adviser, brokerage services, or other offset arrangements, if applicable, and do not represent the amount paid by the class during periods when reimbursements, waivers or reductions occur.
G On certain classes, the size and fluctuation of net assets and expense amounts may cause ratios to differ from contractual rates.
H Annualized
I Amount does not include the portfolio activity of any underlying mutual funds or exchange-traded funds (ETFs).
See accompanying notes which are an integral part of the financial statements.
Fidelity Freedom® Blend 2035 Fund
Investment Summary (Unaudited)
The information in the following tables is based on the direct investments of the Fund.
Top Holdings as of March 31, 2022
| | % of fund's net assets |
| Fidelity Series Large Cap Value Index Fund | 12.2 |
| Fidelity Series Emerging Markets Opportunities Fund | 11.4 |
| Fidelity Series Blue Chip Growth Fund | 9.1 |
| Fidelity Series Large Cap Stock Fund | 6.4 |
| Fidelity Series Large Cap Growth Index Fund | 5.7 |
| Fidelity Series International Value Fund | 5.7 |
| Fidelity Series Overseas Fund | 5.7 |
| Fidelity Series International Growth Fund | 5.6 |
| Fidelity Series Long-Term Treasury Bond Index Fund | 5.3 |
| Fidelity Series Value Discovery Fund | 4.5 |
| | 71.6 |
Asset Allocation (% of fund's net assets)
| Period end |
| | Domestic Equity Funds | 42.5% |
| | International Equity Funds | 36.6% |
| | Bond Funds | 20.8% |
| | Short-Term Investments | 0.1% |

Percentages are adjusted for the effect of futures contracts and swaps, if applicable.
Domestic Equity Funds category includes Fidelity Series Commodity Strategy Fund which invests in commodity-related investments.
Fidelity Freedom® Blend 2035 Fund
Schedule of Investments March 31, 2022
Showing Percentage of Net Assets
| U.S. Treasury Obligations - 0.1% | | | |
| | | Principal Amount | Value |
| U.S. Treasury Bills, yield at date of purchase 0.12% to 0.55% 4/14/22 to 6/30/22 (a) | | | |
| (Cost $949,663) | | 950,000 | 949,720 |
| | | Shares | Value |
|
| Domestic Equity Funds - 42.5% | | | |
| Fidelity Series Blue Chip Growth Fund (b) | | 10,202,695 | $146,612,731 |
| Fidelity Series Commodity Strategy Fund (b) | | 4,699,910 | 24,016,541 |
| Fidelity Series Large Cap Growth Index Fund (b) | | 5,248,931 | 92,381,182 |
| Fidelity Series Large Cap Stock Fund (b) | | 5,421,948 | 103,071,235 |
| Fidelity Series Large Cap Value Index Fund (b) | | 12,845,284 | 197,303,568 |
| Fidelity Series Small Cap Opportunities Fund (b) | | 3,640,998 | 49,590,392 |
| Fidelity Series Value Discovery Fund (b) | | 4,559,170 | 72,946,725 |
| TOTAL DOMESTIC EQUITY FUNDS | | | |
| (Cost $599,903,755) | | | 685,922,374 |
|
| International Equity Funds - 36.6% | | | |
| Fidelity Series Canada Fund (b) | | 2,935,314 | 45,556,069 |
| Fidelity Series Emerging Markets Fund (b) | | 2,151,002 | 19,961,302 |
| Fidelity Series Emerging Markets Opportunities Fund (b) | | 9,989,549 | 183,807,703 |
| Fidelity Series International Growth Fund (b) | | 5,499,859 | 91,187,663 |
| Fidelity Series International Index Fund (b) | | 3,381,284 | 38,681,887 |
| Fidelity Series International Small Cap Fund (b) | | 1,596,558 | 28,658,219 |
| Fidelity Series International Value Fund (b) | | 8,348,982 | 92,089,274 |
| Fidelity Series Overseas Fund (b) | | 7,264,984 | 91,684,093 |
| TOTAL INTERNATIONAL EQUITY FUNDS | | | |
| (Cost $584,167,446) | | | 591,626,210 |
|
| Bond Funds - 20.8% | | | |
| Fidelity Series 5+ Year Inflation-Protected Bond Index Fund (b) | | 168,142 | 1,614,162 |
| Fidelity Series Corporate Bond Fund (b) | | 3,872,495 | 39,112,203 |
| Fidelity Series Emerging Markets Debt Fund (b) | | 960,233 | 7,921,924 |
| Fidelity Series Emerging Markets Debt Local Currency Fund (b) | | 297,621 | 2,681,570 |
| Fidelity Series Floating Rate High Income Fund (b) | | 176,271 | 1,619,932 |
| Fidelity Series Government Bond Index Fund (b) | | 5,489,611 | 54,786,316 |
| Fidelity Series High Income Fund (b) | | 1,075,165 | 9,773,253 |
| Fidelity Series International Developed Markets Bond Index Fund (b) | | 3,015,876 | 28,138,125 |
| Fidelity Series Investment Grade Bond Fund (b) | | 5,281,957 | 57,626,153 |
| Fidelity Series Investment Grade Securitized Fund (b) | | 4,148,997 | 40,328,249 |
| Fidelity Series Long-Term Treasury Bond Index Fund (b) | | 11,359,712 | 86,561,007 |
| Fidelity Series Real Estate Income Fund (b) | | 511,164 | 5,806,825 |
| TOTAL BOND FUNDS | | | |
| (Cost $358,061,173) | | | 335,969,719 |
|
| Short-Term Funds - 0.0% | | | |
| Fidelity Cash Central Fund 0.31% (c) | | | |
| (Cost $847,166) | | 846,996 | 847,166 |
| TOTAL INVESTMENT IN SECURITIES - 100.0% | | | |
| (Cost $1,543,929,203) | | | 1,615,315,189 |
| NET OTHER ASSETS (LIABILITIES) - 0.0% | | | (90,174) |
| NET ASSETS - 100% | | | $1,615,225,015 |
| Futures Contracts | | | | | |
| | Number of contracts | Expiration Date | Notional Amount | Value | Unrealized Appreciation/(Depreciation) |
| Purchased | | | | | |
| Equity Index Contracts | | | | | |
| ICE E-mini MSCI EAFE Index Contracts (United States) | 35 | June 2022 | $3,752,700 | $211,816 | $211,816 |
| ICE E-mini MSCI Emerging Markets Index Contracts (United States) | 106 | June 2022 | 5,965,150 | 204,087 | 204,087 |
| Sold | | | | | |
| Equity Index Contracts | | | | | |
| CME Micro E-mini S&P 500 Index Contracts (United States) | 31 | June 2022 | 7,022,663 | (365,579) | (365,579) |
| TOTAL FUTURES CONTRACTS | | | | | $50,324 |
The notional amount of futures purchased as a percentage of Net Assets is 0.6%
The notional amount of futures sold as a percentage of Net Assets is 0.4%
Legend
(a) Security or a portion of the security was pledged to cover margin requirements for futures contracts. At period end, the value of securities pledged amounted to $949,720.
(b) Affiliated Fund
(c) Affiliated fund that is generally available only to investment companies and other accounts managed by Fidelity Investments. The rate quoted is the annualized seven-day yield of the fund at period end. A complete unaudited listing of the fund's holdings as of its most recent quarter end is available upon request. In addition, each Fidelity Central Fund's financial statements, which are not covered by the Fund's Report of Independent Registered Public Accounting Firm, are available on the SEC's website or upon request.
Affiliated Central Funds
Fiscal year to date information regarding the Fund's investments in Fidelity Central Funds, including the ownership percentage, is presented below.
| Fund | Value, beginning of period | Purchases | Sales Proceeds | Dividend Income | Realized Gain/Loss | Change in Unrealized appreciation (depreciation) | Value, end of period | % ownership, end of period |
| Fidelity Cash Central Fund 0.31% | $49 | $3,191,851 | $2,344,734 | $249 | $-- | $-- | $847,166 | 0.0% |
| Total | $49 | $3,191,851 | $2,344,734 | $249 | $-- | $-- | $847,166 | |
Amounts in the income column in the above table include any capital gain distributions from underlying funds, which are presented in the corresponding line-item in the Statement of Operations, if applicable.
Affiliated Underlying Funds
Fiscal year to date information regarding the Fund's investments in affiliated Underlying Funds is presented below. Exchanges between classes of the same affiliated Underlying Funds may occur. If an underlying Fund changes its name, the name presented below is the name in effect at period end.
| Affiliate | Value, beginning of period | Purchases(a) | Sales Proceeds(a) | Dividend Income | Realized Gain (loss) | Change in Unrealized appreciation (depreciation) | Value, end of period |
| Fidelity Series 0-5 Year Inflation-Protected Bond Index Fund | $-- | $5,285,524 | $5,258,511 | $21,972 | $(23,741) | $-- | $-- |
| Fidelity Series 5+ Year Inflation-Protected Bond Index Fund | -- | 13,720,432 | 11,572,922 | 74,950 | (489,455) | (43,893) | 1,614,162 |
| Fidelity Series Blue Chip Growth Fund | 111,516,752 | 99,615,595 | 38,614,619 | 29,104,876 | (1,282,064) | (24,622,933) | 146,612,731 |
| Fidelity Series Canada Fund | 24,847,683 | 18,459,934 | 4,347,233 | 881,705 | (59,068) | 6,654,753 | 45,556,069 |
| Fidelity Series Commodity Strategy Fund | 32,134,732 | 25,914,252 | 35,386,815 | 12,511,837 | (1,027,259) | 2,381,631 | 24,016,541 |
| Fidelity Series Corporate Bond Fund | 25,844,512 | 22,180,633 | 6,058,947 | 969,594 | (145,712) | (2,708,283) | 39,112,203 |
| Fidelity Series Emerging Markets Debt Fund | 6,331,097 | 3,431,781 | 1,011,817 | 357,905 | (37,750) | (791,387) | 7,921,924 |
| Fidelity Series Emerging Markets Debt Local Currency Fund | 2,116,222 | 1,193,034 | 318,050 | 106,872 | (27,802) | (281,834) | 2,681,570 |
| Fidelity Series Emerging Markets Fund | 16,970,367 | 9,796,212 | 2,104,100 | 675,932 | (61,070) | (4,640,107) | 19,961,302 |
| Fidelity Series Emerging Markets Opportunities Fund | 152,559,057 | 113,054,777 | 21,440,104 | 21,186,641 | (752,528) | (59,613,499) | 183,807,703 |
| Fidelity Series Floating Rate High Income Fund | 1,275,463 | 693,457 | 346,918 | 66,806 | (837) | (1,233) | 1,619,932 |
| Fidelity Series Government Bond Index Fund | 31,875,644 | 31,081,590 | 5,493,124 | 481,463 | (213,789) | (2,464,005) | 54,786,316 |
| Fidelity Series Government Money Market Fund 0.31% | 2,999,304 | 554,694 | 3,553,998 | 755 | -- | -- | -- |
| Fidelity Series High Income Fund | 7,347,150 | 4,148,021 | 1,378,417 | 496,949 | (30,127) | (313,374) | 9,773,253 |
| Fidelity Series Inflation-Protected Bond Index Fund | 23,123,548 | 7,942,020 | 32,037,091 | 307,817 | 2,010,368 | (1,038,845) | -- |
| Fidelity Series International Developed Markets Bond Index Fund | -- | 29,365,585 | 72,052 | 7,508 | (1,656) | (1,153,752) | 28,138,125 |
| Fidelity Series International Growth Fund | 61,107,700 | 47,287,655 | 7,524,433 | 7,114,847 | 12,320 | (9,695,579) | 91,187,663 |
| Fidelity Series International Index Fund | 25,512,221 | 17,107,477 | 2,416,688 | 948,619 | (101,659) | (1,419,464) | 38,681,887 |
| Fidelity Series International Small Cap Fund | 22,040,930 | 12,758,135 | 1,231,479 | 3,693,100 | (108,069) | (4,801,298) | 28,658,219 |
| Fidelity Series International Value Fund | 61,041,103 | 42,948,067 | 12,185,791 | 4,463,396 | (242,830) | 528,725 | 92,089,274 |
| Fidelity Series Investment Grade Bond Fund | 35,374,026 | 32,587,127 | 7,145,619 | 1,083,718 | (208,076) | (2,981,305) | 57,626,153 |
| Fidelity Series Investment Grade Securitized Fund | 24,786,379 | 22,345,450 | 4,592,300 | 301,935 | (105,997) | (2,105,283) | 40,328,249 |
| Fidelity Series Large Cap Growth Index Fund | 70,393,671 | 41,116,692 | 27,710,458 | 2,769,161 | 240,421 | 8,340,856 | 92,381,182 |
| Fidelity Series Large Cap Stock Fund | 76,883,581 | 46,334,703 | 22,070,207 | 8,701,595 | (500,453) | 2,423,611 | 103,071,235 |
| Fidelity Series Large Cap Value Index Fund | 146,863,528 | 85,243,329 | 41,117,855 | 12,888,907 | (628,088) | 6,942,654 | 197,303,568 |
| Fidelity Series Long-Term Treasury Bond Index Fund | 31,673,562 | 65,417,251 | 6,105,204 | 1,201,340 | (737,813) | (3,686,789) | 86,561,007 |
| Fidelity Series Overseas Fund | 61,210,465 | 41,896,274 | 8,770,809 | 2,635,192 | 5,020 | (2,656,857) | 91,684,093 |
| Fidelity Series Real Estate Income Fund | 4,401,433 | 2,152,646 | 846,700 | 222,699 | (11,589) | 111,035 | 5,806,825 |
| Fidelity Series Short-Term Credit Fund | 1,479,747 | 419,873 | 1,890,860 | 12,155 | 12,630 | (21,390) | -- |
| Fidelity Series Small Cap Opportunities Fund | 37,132,221 | 32,652,083 | 9,144,599 | 11,773,477 | (671,477) | (10,377,836) | 49,590,392 |
| Fidelity Series Treasury Bill Index Fund | 4,765,756 | 1,390,827 | 6,156,583 | 1,205 | 1,514 | (1,514) | -- |
| Fidelity Series Value Discovery Fund | 54,265,924 | 35,336,460 | 16,147,833 | 8,289,544 | (283,994) | (223,832) | 72,946,725 |
| Total | $1,157,873,778 | $913,431,590 | $344,052,136 | $133,354,472 | $(5,470,630) | $(108,261,027) | $1,613,518,303 |
(a) Includes the value of shares purchased or redeemed through in-kind transactions, if applicable.
Amounts in the income column in the above table include any capital gain distributions from underlying funds, which are presented in the corresponding line-item in the Statement of Operations, if applicable.
Investment Valuation
The following is a summary of the inputs used, as of March 31, 2022, involving the Fund's assets and liabilities carried at fair value. The inputs or methodology used for valuing securities may not be an indication of the risk associated with investing in those securities. For more information on valuation inputs, and their aggregation into the levels used below, please refer to the Investment Valuation section in the accompanying Notes to Financial Statements.
| | Valuation Inputs at Reporting Date: |
| Description | Total | Level 1 | Level 2 | Level 3 |
| Investments in Securities: | | | | |
| Other Short-Term Investments and Net Other Assets | $949,720 | $-- | $949,720 | $-- |
| Domestic Equity Funds | 685,922,374 | 685,922,374 | -- | -- |
| International Equity Funds | 591,626,210 | 591,626,210 | -- | -- |
| Bond Funds | 335,969,719 | 335,969,719 | -- | -- |
| Short-Term Funds | 847,166 | 847,166 | -- | -- |
| Total Investments in Securities: | $1,615,315,189 | $1,614,365,469 | $949,720 | $-- |
| Derivative Instruments: | | | | |
| Assets | | | | |
| Futures Contracts | $415,903 | $415,903 | $-- | $-- |
| Total Assets | $415,903 | $415,903 | $-- | $-- |
| Liabilities | | | | |
| Futures Contracts | $(365,579) | $(365,579) | $-- | $-- |
| Total Liabilities | $(365,579) | $(365,579) | $-- | $-- |
| Total Derivative Instruments: | $50,324 | $50,324 | $-- | $-- |
Value of Derivative Instruments
The following table is a summary of the Fund's value of derivative instruments by primary risk exposure as of March 31, 2022. For additional information on derivative instruments, please refer to the Derivative Instruments section in the accompanying Notes to Financial Statements.
| Primary Risk Exposure / Derivative Type | Value |
| | Asset | Liability |
| Equity Risk | | |
| Futures Contracts(a) | $415,903 | $(365,579) |
| Total Equity Risk | 415,903 | (365,579) |
| Total Value of Derivatives | $415,903 | $(365,579) |
(a) Reflects gross cumulative appreciation (depreciation) on futures contracts as presented in the Schedule of Investments. In the Statement of Assets and Liabilities, the period end daily variation margin is included in receivable or payable for daily variation margin on futures contracts, and the net cumulative appreciation (depreciation) is included in Total accumulated earnings (loss).
See accompanying notes which are an integral part of the financial statements.
Fidelity Freedom® Blend 2035 Fund
Financial Statements
Statement of Assets and Liabilities
| | | March 31, 2022 |
| Assets | | |
Investment in securities, at value — See accompanying schedule:
Unaffiliated issuers (cost $949,663) | $949,720 | |
| Fidelity Central Funds (cost $847,166) | 847,166 | |
| Other affiliated issuers (cost $1,542,132,374) | 1,613,518,303 | |
| Total Investment in Securities (cost $1,543,929,203) | | $1,615,315,189 |
| Receivable for investments sold | | 37,153,308 |
| Receivable for fund shares sold | | 2,182,365 |
| Distributions receivable from Fidelity Central Funds | | 148 |
| Total assets | | 1,654,651,010 |
| Liabilities | | |
| Payable for investments purchased | $32,983,562 | |
| Payable for fund shares redeemed | 5,943,321 | |
| Accrued management fee | 430,027 | |
| Distribution and service plan fees payable | 3,576 | |
| Payable for daily variation margin on futures contracts | 65,509 | |
| Total liabilities | | 39,425,995 |
| Net Assets | | $1,615,225,015 |
| Net Assets consist of: | | |
| Paid in capital | | $1,513,760,308 |
| Total accumulated earnings (loss) | | 101,464,707 |
| Net Assets | | $1,615,225,015 |
| Net Asset Value and Maximum Offering Price | | |
| Class A: | | |
| Net Asset Value and redemption price per share ($6,186,040 ÷ 541,650 shares)(a) | | $11.42 |
| Maximum offering price per share (100/94.25 of $11.42) | | $12.12 |
| Class M: | | |
| Net Asset Value and redemption price per share ($1,912,547 ÷ 167,968 shares)(a) | | $11.39 |
| Maximum offering price per share (100/96.50 of $11.39) | | $11.80 |
| Class C: | | |
| Net Asset Value and offering price per share ($1,958,398 ÷ 173,236 shares)(a) | | $11.30 |
| Fidelity Freedom Blend 2035 Fund: | | |
| Net Asset Value, offering price and redemption price per share ($109,568,740 ÷ 9,569,224 shares) | | $11.45 |
| Class K: | | |
| Net Asset Value, offering price and redemption price per share ($35,990,728 ÷ 3,134,894 shares) | | $11.48 |
| Class K6: | | |
| Net Asset Value, offering price and redemption price per share ($562,283,603 ÷ 48,763,316 shares) | | $11.53 |
| Class I: | | |
| Net Asset Value, offering price and redemption price per share ($24,435,967 ÷ 2,132,291 shares) | | $11.46 |
| Class Z: | | |
| Net Asset Value, offering price and redemption price per share ($1,262,165 ÷ 109,843 shares) | | $11.49 |
| Class Z6: | | |
| Net Asset Value, offering price and redemption price per share ($121,517,981 ÷ 10,576,378 shares) | | $11.49 |
| Premier Class: | | |
| Net Asset Value, offering price and redemption price per share ($750,108,846 ÷ 65,200,902 shares) | | $11.50 |
(a) Redemption price per share is equal to net asset value less any applicable contingent deferred sales charge.
See accompanying notes which are an integral part of the financial statements.
Statement of Operations
| | | Year ended March 31, 2022 |
| Investment Income | | |
| Dividends: | | |
| Affiliated issuers | | $41,890,372 |
| Interest | | 286 |
| Income from Fidelity Central Funds | | 249 |
| Total income | | 41,890,907 |
| Expenses | | |
| Management fee | $4,802,121 | |
| Distribution and service plan fees | 34,497 | |
| Independent trustees' fees and expenses | 4,206 | |
| Total expenses | | 4,840,824 |
| Net investment income (loss) | | 37,050,083 |
| Realized and Unrealized Gain (Loss) | | |
| Net realized gain (loss) on: | | |
| Investment securities: | | |
| Affiliated issuers | (5,470,630) | |
| Futures contracts | (479,515) | |
| Capital gain distributions from underlying funds: | | |
| Affiliated issuers | 91,464,100 | |
| Total net realized gain (loss) | | 85,513,955 |
| Change in net unrealized appreciation (depreciation) on: | | |
| Investment securities: | | |
| Unaffiliated issuers | 57 | |
| Affiliated issuers | (108,261,027) | |
| Futures contracts | 50,324 | |
| Total change in net unrealized appreciation (depreciation) | | (108,210,646) |
| Net gain (loss) | | (22,696,691) |
| Net increase (decrease) in net assets resulting from operations | | $14,353,392 |
See accompanying notes which are an integral part of the financial statements.
Statement of Changes in Net Assets
| | Year ended March 31, 2022 | Year ended March 31, 2021 |
| Increase (Decrease) in Net Assets | | |
| Operations | | |
| Net investment income (loss) | $37,050,083 | $12,370,558 |
| Net realized gain (loss) | 85,513,955 | 53,062,335 |
| Change in net unrealized appreciation (depreciation) | (108,210,646) | 278,697,327 |
| Net increase (decrease) in net assets resulting from operations | 14,353,392 | 344,130,220 |
| Distributions to shareholders | (114,488,945) | (48,036,223) |
| Share transactions - net increase (decrease) | 557,806,218 | 248,796,115 |
| Total increase (decrease) in net assets | 457,670,665 | 544,890,112 |
| Net Assets | | |
| Beginning of period | 1,157,554,350 | 612,664,238 |
| End of period | $1,615,225,015 | $1,157,554,350 |
See accompanying notes which are an integral part of the financial statements.
Financial Highlights
Fidelity Freedom Blend 2035 Fund Class A
| Years ended March 31, | 2022 | 2021 | 2020 | 2019 A |
| Selected Per–Share Data | | | | |
| Net asset value, beginning of period | $12.05 | $8.46 | $9.60 | $10.00 |
| Income from Investment Operations | | | | |
| Net investment income (loss)B,C | .18 | .10 | .15 | –D |
| Net realized and unrealized gain (loss) | .14 | 4.03 | (.94) | (.15) |
| Total from investment operations | .32 | 4.13 | (.79) | (.15) |
| Distributions from net investment income | (.28) | (.12) | (.17) | (.14) |
| Distributions from net realized gain | (.67) | (.42) | (.19) | (.12) |
| Total distributions | (.95) | (.54) | (.35)E | (.25)E |
| Net asset value, end of period | $11.42 | $12.05 | $8.46 | $9.60 |
| Total ReturnF,G,H | 2.19% | 49.46% | (8.89)% | (1.18)% |
| Ratios to Average Net AssetsC,I,J | | | | |
| Expenses before reductions | .78% | .78% | .78% | .79%K,L |
| Expenses net of fee waivers, if any | .78% | .78% | .78% | .79%K,L |
| Expenses net of all reductions | .78% | .78% | .78% | .79%K,L |
| Net investment income (loss) | 1.46% | .92% | 1.52% | .09%K |
| Supplemental Data | | | | |
| Net assets, end of period (000 omitted) | $6,186 | $2,089 | $790 | $357 |
| Portfolio turnover rateM | 24% | 27% | 31% | 16%K |
A For the period August 31, 2018 (commencement of operations) through March 31, 2019.
B Calculated based on average shares outstanding during the period.
C Net investment income (loss) is affected by the timing of the declaration of dividends by any underlying mutual funds or exchange-traded funds (ETFs). Net investment income (loss) of any such underlying funds is not included in the Fund's net investment income (loss) ratio.
D Amount represents less than $.005 per share.
E Total distributions per share do not sum due to rounding.
F Total returns for periods of less than one year are not annualized.
G Total returns would have been lower if certain expenses had not been reduced during the applicable periods shown.
H Total returns do not include the effect of the sales charges.
I Fees and expenses of any underlying mutual funds or exchange-traded funds (ETFs) are not included in the Fund's expense ratio. The Fund indirectly bears its proportionate share of these expenses. For additional expense information related to investments in Fidelity Central Funds, please refer to the "Investments in Fidelity Central Funds" note found in the Notes to Financial Statements section of the most recent Annual or Semi-Annual report.
J Expense ratios reflect operating expenses of the class. Expenses before reductions do not reflect amounts reimbursed, waived, or reduced through arrangements with the investment adviser, brokerage services, or other offset arrangements, if applicable, and do not represent the amount paid by the class during periods when reimbursements, waivers or reductions occur.
K Annualized
L On certain classes, the size and fluctuation of net assets and expense amounts may cause ratios to differ from contractual rates.
M Amount does not include the portfolio activity of any underlying mutual funds or exchange-traded funds (ETFs).
See accompanying notes which are an integral part of the financial statements.
Fidelity Freedom Blend 2035 Fund Class M
| Years ended March 31, | 2022 | 2021 | 2020 | 2019 A |
| Selected Per–Share Data | | | | |
| Net asset value, beginning of period | $12.01 | $8.46 | $9.59 | $10.00 |
| Income from Investment Operations | | | | |
| Net investment income (loss)B,C | .15 | .07 | .13 | (.01) |
| Net realized and unrealized gain (loss) | .14 | 4.02 | (.94) | (.15) |
| Total from investment operations | .29 | 4.09 | (.81) | (.16) |
| Distributions from net investment income | (.24) | (.12) | (.14) | (.13) |
| Distributions from net realized gain | (.67) | (.41) | (.19) | (.12) |
| Total distributions | (.91) | (.54)D | (.32)D | (.25) |
| Net asset value, end of period | $11.39 | $12.01 | $8.46 | $9.59 |
| Total ReturnE,F | 2.00% | 48.92% | (9.06)% | (1.30)% |
| Ratios to Average Net AssetsC,G,H | | | | |
| Expenses before reductions | 1.03% | 1.03% | 1.03% | 1.03%I |
| Expenses net of fee waivers, if any | 1.03% | 1.03% | 1.03% | 1.03%I |
| Expenses net of all reductions | 1.03% | 1.03% | 1.03% | 1.03%I |
| Net investment income (loss) | 1.21% | .67% | 1.27% | (.16)%I |
| Supplemental Data | | | | |
| Net assets, end of period (000 omitted) | $1,913 | $887 | $291 | $177 |
| Portfolio turnover rateJ | 24% | 27% | 31% | 16%I |
A For the period August 31, 2018 (commencement of operations) through March 31, 2019.
B Calculated based on average shares outstanding during the period.
C Net investment income (loss) is affected by the timing of the declaration of dividends by any underlying mutual funds or exchange-traded funds (ETFs). Net investment income (loss) of any such underlying funds is not included in the Fund's net investment income (loss) ratio.
D Total distributions per share do not sum due to rounding.
E Total returns for periods of less than one year are not annualized.
F Total returns do not include the effect of the sales charges.
G Fees and expenses of any underlying mutual funds or exchange-traded funds (ETFs) are not included in the Fund's expense ratio. The Fund indirectly bears its proportionate share of these expenses. For additional expense information related to investments in Fidelity Central Funds, please refer to the "Investments in Fidelity Central Funds" note found in the Notes to Financial Statements section of the most recent Annual or Semi-Annual report.
H Expense ratios reflect operating expenses of the class. Expenses before reductions do not reflect amounts reimbursed, waived, or reduced through arrangements with the investment adviser, brokerage services, or other offset arrangements, if applicable, and do not represent the amount paid by the class during periods when reimbursements, waivers or reductions occur.
I Annualized
J Amount does not include the portfolio activity of any underlying mutual funds or exchange-traded funds (ETFs).
See accompanying notes which are an integral part of the financial statements.
Fidelity Freedom Blend 2035 Fund Class C
| Years ended March 31, | 2022 | 2021 | 2020 | 2019 A |
| Selected Per–Share Data | | | | |
| Net asset value, beginning of period | $11.96 | $8.44 | $9.59 | $10.00 |
| Income from Investment Operations | | | | |
| Net investment income (loss)B,C | .09 | .02 | .08 | (.04) |
| Net realized and unrealized gain (loss) | .12 | 4.00 | (.94) | (.14) |
| Total from investment operations | .21 | 4.02 | (.86) | (.18) |
| Distributions from net investment income | (.21) | (.09) | (.10) | (.11) |
| Distributions from net realized gain | (.67) | (.41) | (.19) | (.12) |
| Total distributions | (.87)D | (.50) | (.29) | (.23) |
| Net asset value, end of period | $11.30 | $11.96 | $8.44 | $9.59 |
| Total ReturnE,F | 1.36% | 48.25% | (9.54)% | (1.56)% |
| Ratios to Average Net AssetsC,G,H | | | | |
| Expenses before reductions | 1.53% | 1.54%I | 1.53% | 1.54%I,J |
| Expenses net of fee waivers, if any | 1.53% | 1.54%I | 1.53% | 1.54%I,J |
| Expenses net of all reductions | 1.53% | 1.54%I | 1.53% | 1.54%I,J |
| Net investment income (loss) | .71% | .16% | .77% | (.67)%J |
| Supplemental Data | | | | |
| Net assets, end of period (000 omitted) | $1,958 | $1,362 | $274 | $207 |
| Portfolio turnover rateK | 24% | 27% | 31% | 16%J |
A For the period August 31, 2018 (commencement of operations) through March 31, 2019.
B Calculated based on average shares outstanding during the period.
C Net investment income (loss) is affected by the timing of the declaration of dividends by any underlying mutual funds or exchange-traded funds (ETFs). Net investment income (loss) of any such underlying funds is not included in the Fund's net investment income (loss) ratio.
D Total distributions per share do not sum due to rounding.
E Total returns for periods of less than one year are not annualized.
F Total returns do not include the effect of the contingent deferred sales charge.
G Fees and expenses of any underlying mutual funds or exchange-traded funds (ETFs) are not included in the Fund's expense ratio. The Fund indirectly bears its proportionate share of these expenses. For additional expense information related to investments in Fidelity Central Funds, please refer to the "Investments in Fidelity Central Funds" note found in the Notes to Financial Statements section of the most recent Annual or Semi-Annual report.
H Expense ratios reflect operating expenses of the class. Expenses before reductions do not reflect amounts reimbursed, waived, or reduced through arrangements with the investment adviser, brokerage services, or other offset arrangements, if applicable, and do not represent the amount paid by the class during periods when reimbursements, waivers or reductions occur.
I On certain classes, the size and fluctuation of net assets and expense amounts may cause ratios to differ from contractual rates.
J Annualized
K Amount does not include the portfolio activity of any underlying mutual funds or exchange-traded funds (ETFs).
See accompanying notes which are an integral part of the financial statements.
Fidelity Freedom Blend 2035 Fund
| Years ended March 31, | 2022 | 2021 | 2020 | 2019 A |
| Selected Per–Share Data | | | | |
| Net asset value, beginning of period | $12.07 | $8.48 | $9.61 | $10.00 |
| Income from Investment Operations | | | | |
| Net investment income (loss)B,C | .21 | .13 | .17 | .02 |
| Net realized and unrealized gain (loss) | .14 | 4.03 | (.94) | (.15) |
| Total from investment operations | .35 | 4.16 | (.77) | (.13) |
| Distributions from net investment income | (.30) | (.14) | (.18) | (.15) |
| Distributions from net realized gain | (.68) | (.43) | (.19) | (.12) |
| Total distributions | (.97)D | (.57) | (.36)D | (.26)D |
| Net asset value, end of period | $11.45 | $12.07 | $8.48 | $9.61 |
| Total ReturnE | 2.48% | 49.72% | (8.68)% | (.96)% |
| Ratios to Average Net AssetsC,F,G | | | | |
| Expenses before reductions | .53% | .53% | .54%H | .53%I |
| Expenses net of fee waivers, if any | .53% | .53% | .54%H | .53%I |
| Expenses net of all reductions | .53% | .53% | .54%H | .53%I |
| Net investment income (loss) | 1.71% | 1.17% | 1.76% | .34%I |
| Supplemental Data | | | | |
| Net assets, end of period (000 omitted) | $109,569 | $37,661 | $14,672 | $984 |
| Portfolio turnover rateJ | 24% | 27% | 31% | 16%I |
A For the period August 31, 2018 (commencement of operations) through March 31, 2019.
B Calculated based on average shares outstanding during the period.
C Net investment income (loss) is affected by the timing of the declaration of dividends by any underlying mutual funds or exchange-traded funds (ETFs). Net investment income (loss) of any such underlying funds is not included in the Fund's net investment income (loss) ratio.
D Total distributions per share do not sum due to rounding.
E Total returns for periods of less than one year are not annualized.
F Fees and expenses of any underlying mutual funds or exchange-traded funds (ETFs) are not included in the Fund's expense ratio. The Fund indirectly bears its proportionate share of these expenses. For additional expense information related to investments in Fidelity Central Funds, please refer to the "Investments in Fidelity Central Funds" note found in the Notes to Financial Statements section of the most recent Annual or Semi-Annual report.
G Expense ratios reflect operating expenses of the class. Expenses before reductions do not reflect amounts reimbursed, waived, or reduced through arrangements with the investment adviser, brokerage services, or other offset arrangements, if applicable, and do not represent the amount paid by the class during periods when reimbursements, waivers or reductions occur.
H On certain classes, the size and fluctuation of net assets and expense amounts may cause ratios to differ from contractual rates.
I Annualized
J Amount does not include the portfolio activity of any underlying mutual funds or exchange-traded funds (ETFs).
See accompanying notes which are an integral part of the financial statements.
Fidelity Freedom Blend 2035 Fund Class K
| Years ended March 31, | 2022 | 2021 | 2020 | 2019 A |
| Selected Per–Share Data | | | | |
| Net asset value, beginning of period | $12.09 | $8.48 | $9.61 | $10.00 |
| Income from Investment Operations | | | | |
| Net investment income (loss)B,C | .22 | .14 | .19 | .02 |
| Net realized and unrealized gain (loss) | .14 | 4.04 | (.94) | (.15) |
| Total from investment operations | .36 | 4.18 | (.75) | (.13) |
| Distributions from net investment income | (.29) | (.14) | (.19) | (.15) |
| Distributions from net realized gain | (.68) | (.43) | (.19) | (.12) |
| Total distributions | (.97) | (.57) | (.38) | (.26)D |
| Net asset value, end of period | $11.48 | $12.09 | $8.48 | $9.61 |
| Total ReturnE | 2.55% | 49.96% | (8.56)% | (.97)% |
| Ratios to Average Net AssetsC,F,G | | | | |
| Expenses before reductions | .43% | .43% | .43% | .43%H |
| Expenses net of fee waivers, if any | .43% | .43% | .43% | .43%H |
| Expenses net of all reductions | .43% | .43% | .43% | .43%H |
| Net investment income (loss) | 1.81% | 1.27% | 1.87% | .44%H |
| Supplemental Data | | | | |
| Net assets, end of period (000 omitted) | $35,991 | $24,728 | $16,000 | $99 |
| Portfolio turnover rateI | 24% | 27% | 31% | 16%H |
A For the period August 31, 2018 (commencement of operations) through March 31, 2019.
B Calculated based on average shares outstanding during the period.
C Net investment income (loss) is affected by the timing of the declaration of dividends by any underlying mutual funds or exchange-traded funds (ETFs). Net investment income (loss) of any such underlying funds is not included in the Fund's net investment income (loss) ratio.
D Total distributions per share do not sum due to rounding.
E Total returns for periods of less than one year are not annualized.
F Fees and expenses of any underlying mutual funds or exchange-traded funds (ETFs) are not included in the Fund's expense ratio. The Fund indirectly bears its proportionate share of these expenses. For additional expense information related to investments in Fidelity Central Funds, please refer to the "Investments in Fidelity Central Funds" note found in the Notes to Financial Statements section of the most recent Annual or Semi-Annual report.
G Expense ratios reflect operating expenses of the class. Expenses before reductions do not reflect amounts reimbursed, waived, or reduced through arrangements with the investment adviser, brokerage services, or other offset arrangements, if applicable, and do not represent the amount paid by the class during periods when reimbursements, waivers or reductions occur.
H Annualized
I Amount does not include the portfolio activity of any underlying mutual funds or exchange-traded funds (ETFs).
See accompanying notes which are an integral part of the financial statements.
Fidelity Freedom Blend 2035 Fund Class K6
| Years ended March 31, | 2022 | 2021 | 2020 | 2019 A |
| Selected Per–Share Data | | | | |
| Net asset value, beginning of period | $12.12 | $8.50 | $9.61 | $10.00 |
| Income from Investment Operations | | | | |
| Net investment income (loss)B,C | .24 | .15 | .20 | .03 |
| Net realized and unrealized gain (loss) | .13 | 4.04 | (.94) | (.15) |
| Total from investment operations | .37 | 4.19 | (.74) | (.12) |
| Distributions from net investment income | (.28) | (.15) | (.18) | (.15) |
| Distributions from net realized gain | (.68) | (.43) | (.19) | (.12) |
| Total distributions | (.96) | (.57)D | (.37) | (.27) |
| Net asset value, end of period | $11.53 | $12.12 | $8.50 | $9.61 |
| Total ReturnE | 2.62% | 50.08% | (8.41)% | (.93)% |
| Ratios to Average Net AssetsC,F,G | | | | |
| Expenses before reductions | .33% | .33% | .33% | .34%H,I |
| Expenses net of fee waivers, if any | .33% | .33% | .33% | .34%H,I |
| Expenses net of all reductions | .33% | .33% | .33% | .34%H,I |
| Net investment income (loss) | 1.91% | 1.37% | 1.97% | .54%H |
| Supplemental Data | | | | |
| Net assets, end of period (000 omitted) | $562,284 | $1,067,514 | $572,455 | $22,910 |
| Portfolio turnover rateJ | 24% | 27% | 31% | 16%H |
A For the period August 31, 2018 (commencement of operations) through March 31, 2019.
B Calculated based on average shares outstanding during the period.
C Net investment income (loss) is affected by the timing of the declaration of dividends by any underlying mutual funds or exchange-traded funds (ETFs). Net investment income (loss) of any such underlying funds is not included in the Fund's net investment income (loss) ratio.
D Total distributions per share do not sum due to rounding.
E Total returns for periods of less than one year are not annualized.
F Fees and expenses of any underlying mutual funds or exchange-traded funds (ETFs) are not included in the Fund's expense ratio. The Fund indirectly bears its proportionate share of these expenses. For additional expense information related to investments in Fidelity Central Funds, please refer to the "Investments in Fidelity Central Funds" note found in the Notes to Financial Statements section of the most recent Annual or Semi-Annual report.
G Expense ratios reflect operating expenses of the class. Expenses before reductions do not reflect amounts reimbursed, waived, or reduced through arrangements with the investment adviser, brokerage services, or other offset arrangements, if applicable, and do not represent the amount paid by the class during periods when reimbursements, waivers or reductions occur.
H Annualized
I On certain classes, the size and fluctuation of net assets and expense amounts may cause ratios to differ from contractual rates.
J Amount does not include the portfolio activity of any underlying mutual funds or exchange-traded funds (ETFs).
See accompanying notes which are an integral part of the financial statements.
Fidelity Freedom Blend 2035 Fund Class I
| Years ended March 31, | 2022 | 2021 | 2020 | 2019 A |
| Selected Per–Share Data | | | | |
| Net asset value, beginning of period | $12.07 | $8.48 | $9.61 | $10.00 |
| Income from Investment Operations | | | | |
| Net investment income (loss)B,C | .21 | .13 | .18 | .02 |
| Net realized and unrealized gain (loss) | .14 | 4.02 | (.94) | (.15) |
| Total from investment operations | .35 | 4.15 | (.76) | (.13) |
| Distributions from net investment income | (.28) | (.13) | (.19) | (.14) |
| Distributions from net realized gain | (.68) | (.43) | (.19) | (.12) |
| Total distributions | (.96) | (.56) | (.37)D | (.26) |
| Net asset value, end of period | $11.46 | $12.07 | $8.48 | $9.61 |
| Total ReturnE | 2.47% | 49.67% | (8.60)% | (1.01)% |
| Ratios to Average Net AssetsC,F,G | | | | |
| Expenses before reductions | .53% | .53% | .54%H | .53%I |
| Expenses net of fee waivers, if any | .53% | .53% | .54%H | .53%I |
| Expenses net of all reductions | .53% | .53% | .54%H | .53%I |
| Net investment income (loss) | 1.71% | 1.17% | 1.76% | .34%I |
| Supplemental Data | | | | |
| Net assets, end of period (000 omitted) | $24,436 | $17,238 | $5,807 | $108 |
| Portfolio turnover rateJ | 24% | 27% | 31% | 16%I |
A For the period August 31, 2018 (commencement of operations) through March 31, 2019.
B Calculated based on average shares outstanding during the period.
C Net investment income (loss) is affected by the timing of the declaration of dividends by any underlying mutual funds or exchange-traded funds (ETFs). Net investment income (loss) of any such underlying funds is not included in the Fund's net investment income (loss) ratio.
D Total distributions per share do not sum due to rounding.
E Total returns for periods of less than one year are not annualized.
F Fees and expenses of any underlying mutual funds or exchange-traded funds (ETFs) are not included in the Fund's expense ratio. The Fund indirectly bears its proportionate share of these expenses. For additional expense information related to investments in Fidelity Central Funds, please refer to the "Investments in Fidelity Central Funds" note found in the Notes to Financial Statements section of the most recent Annual or Semi-Annual report.
G Expense ratios reflect operating expenses of the class. Expenses before reductions do not reflect amounts reimbursed, waived, or reduced through arrangements with the investment adviser, brokerage services, or other offset arrangements, if applicable, and do not represent the amount paid by the class during periods when reimbursements, waivers or reductions occur.
H On certain classes, the size and fluctuation of net assets and expense amounts may cause ratios to differ from contractual rates.
I Annualized
J Amount does not include the portfolio activity of any underlying mutual funds or exchange-traded funds (ETFs).
See accompanying notes which are an integral part of the financial statements.
Fidelity Freedom Blend 2035 Fund Premier Class
| Years ended March 31, | 2022 A |
| Selected Per–Share Data | |
| Net asset value, beginning of period | $12.36 |
| Income from Investment Operations | |
| Net investment income (loss)B,C | .46 |
| Net realized and unrealized gain (loss) | (.33) |
| Total from investment operations | .13 |
| Distributions from net investment income | (.31) |
| Distributions from net realized gain | (.68) |
| Total distributions | (.99) |
| Net asset value, end of period | $11.50 |
| Total ReturnD | .65% |
| Ratios to Average Net AssetsC,E,F | |
| Expenses before reductions | .28%G |
| Expenses net of fee waivers, if any | .28%G |
| Expenses net of all reductions | .28%G |
| Net investment income (loss) | 3.75%G |
| Supplemental Data | |
| Net assets, end of period (000 omitted) | $750,109 |
| Portfolio turnover rateH | 24% |
A For the period April 6, 2021 (commencement of sale of shares) through March 31, 2022.
B Calculated based on average shares outstanding during the period.
C Net investment income (loss) is affected by the timing of the declaration of dividends by any underlying mutual funds or exchange-traded funds (ETFs). Net investment income (loss) of any such underlying funds is not included in the Fund's net investment income (loss) ratio.
D Total returns for periods of less than one year are not annualized.
E Fees and expenses of any underlying mutual funds or exchange-traded funds (ETFs) are not included in the Fund's expense ratio. The Fund indirectly bears its proportionate share of these expenses. For additional expense information related to investments in Fidelity Central Funds, please refer to the "Investments in Fidelity Central Funds" note found in the Notes to Financial Statements section of the most recent Annual or Semi-Annual report.
F Expense ratios reflect operating expenses of the class. Expenses before reductions do not reflect amounts reimbursed, waived, or reduced through arrangements with the investment adviser, brokerage services, or other offset arrangements, if applicable, and do not represent the amount paid by the class during periods when reimbursements, waivers or reductions occur.
G Annualized
H Amount does not include the portfolio activity of any underlying mutual funds or exchange-traded funds (ETFs).
See accompanying notes which are an integral part of the financial statements.
Fidelity Freedom Blend 2035 Fund Class Z
| Years ended March 31, | 2022 | 2021 | 2020 | 2019 A |
| Selected Per–Share Data | | | | |
| Net asset value, beginning of period | $12.10 | $8.49 | $9.61 | $10.00 |
| Income from Investment Operations | | | | |
| Net investment income (loss)B,C | .22 | .14 | .19 | .02 |
| Net realized and unrealized gain (loss) | .14 | 4.03 | (.94) | (.15) |
| Total from investment operations | .36 | 4.17 | (.75) | (.13) |
| Distributions from net investment income | (.29) | (.14) | (.18) | (.15) |
| Distributions from net realized gain | (.69) | (.43) | (.19) | (.12) |
| Total distributions | (.97)D | (.56)D | (.37) | (.26)D |
| Net asset value, end of period | $11.49 | $12.10 | $8.49 | $9.61 |
| Total ReturnE | 2.58% | 49.87% | (8.52)% | (.97)% |
| Ratios to Average Net AssetsC,F,G | | | | |
| Expenses before reductions | .43% | .43% | .43% | .43%H |
| Expenses net of fee waivers, if any | .43% | .43% | .43% | .43%H |
| Expenses net of all reductions | .43% | .43% | .43% | .43%H |
| Net investment income (loss) | 1.81% | 1.27% | 1.87% | .44%H |
| Supplemental Data | | | | |
| Net assets, end of period (000 omitted) | $1,262 | $345 | $228 | $103 |
| Portfolio turnover rateI | 24% | 27% | 31% | 16%H |
A For the period August 31, 2018 (commencement of operations) through March 31, 2019.
B Calculated based on average shares outstanding during the period.
C Net investment income (loss) is affected by the timing of the declaration of dividends by any underlying mutual funds or exchange-traded funds (ETFs). Net investment income (loss) of any such underlying funds is not included in the Fund's net investment income (loss) ratio.
D Total distributions per share do not sum due to rounding.
E Total returns for periods of less than one year are not annualized.
F Fees and expenses of any underlying mutual funds or exchange-traded funds (ETFs) are not included in the Fund's expense ratio. The Fund indirectly bears its proportionate share of these expenses. For additional expense information related to investments in Fidelity Central Funds, please refer to the "Investments in Fidelity Central Funds" note found in the Notes to Financial Statements section of the most recent Annual or Semi-Annual report.
G Expense ratios reflect operating expenses of the class. Expenses before reductions do not reflect amounts reimbursed, waived, or reduced through arrangements with the investment adviser, brokerage services, or other offset arrangements, if applicable, and do not represent the amount paid by the class during periods when reimbursements, waivers or reductions occur.
H Annualized
I Amount does not include the portfolio activity of any underlying mutual funds or exchange-traded funds (ETFs).
See accompanying notes which are an integral part of the financial statements.
Fidelity Freedom Blend 2035 Fund Class Z6
| Years ended March 31, | 2022 | 2021 | 2020 | 2019 A |
| Selected Per–Share Data | | | | |
| Net asset value, beginning of period | $12.10 | $8.50 | $9.62 | $10.00 |
| Income from Investment Operations | | | | |
| Net investment income (loss)B,C | .23 | .15 | .18 | .03 |
| Net realized and unrealized gain (loss) | .15 | 4.03 | (.93) | (.14) |
| Total from investment operations | .38 | 4.18 | (.75) | (.11) |
| Distributions from net investment income | (.31) | (.15) | (.19) | (.15) |
| Distributions from net realized gain | (.68) | (.43) | (.19) | (.12) |
| Total distributions | (.99) | (.58) | (.37)D | (.27) |
| Net asset value, end of period | $11.49 | $12.10 | $8.50 | $9.62 |
| Total ReturnE | 2.69% | 49.96% | (8.48)% | (.83)% |
| Ratios to Average Net AssetsC,F,G | | | | |
| Expenses before reductions | .33% | .33% | .34%H | .33%I |
| Expenses net of fee waivers, if any | .33% | .33% | .34%H | .33%I |
| Expenses net of all reductions | .33% | .33% | .34%H | .33%I |
| Net investment income (loss) | 1.91% | 1.37% | 1.96% | .54%I |
| Supplemental Data | | | | |
| Net assets, end of period (000 omitted) | $121,518 | $5,730 | $2,148 | $99 |
| Portfolio turnover rateJ | 24% | 27% | 31% | 16%I |
A For the period August 31, 2018 (commencement of operations) through March 31, 2019.
B Calculated based on average shares outstanding during the period.
C Net investment income (loss) is affected by the timing of the declaration of dividends by any underlying mutual funds or exchange-traded funds (ETFs). Net investment income (loss) of any such underlying funds is not included in the Fund's net investment income (loss) ratio.
D Total distributions per share do not sum due to rounding.
E Total returns for periods of less than one year are not annualized.
F Fees and expenses of any underlying mutual funds or exchange-traded funds (ETFs) are not included in the Fund's expense ratio. The Fund indirectly bears its proportionate share of these expenses. For additional expense information related to investments in Fidelity Central Funds, please refer to the "Investments in Fidelity Central Funds" note found in the Notes to Financial Statements section of the most recent Annual or Semi-Annual report.
G Expense ratios reflect operating expenses of the class. Expenses before reductions do not reflect amounts reimbursed, waived, or reduced through arrangements with the investment adviser, brokerage services, or other offset arrangements, if applicable, and do not represent the amount paid by the class during periods when reimbursements, waivers or reductions occur.
H On certain classes, the size and fluctuation of net assets and expense amounts may cause ratios to differ from contractual rates.
I Annualized
J Amount does not include the portfolio activity of any underlying mutual funds or exchange-traded funds (ETFs).
See accompanying notes which are an integral part of the financial statements.
Fidelity Freedom® Blend 2040 Fund
Investment Summary (Unaudited)
The information in the following tables is based on the direct investments of the Fund.
Top Holdings as of March 31, 2022
| | % of fund's net assets |
| Fidelity Series Large Cap Value Index Fund | 14.4 |
| Fidelity Series Emerging Markets Opportunities Fund | 12.6 |
| Fidelity Series Blue Chip Growth Fund | 10.7 |
| Fidelity Series Large Cap Stock Fund | 7.5 |
| Fidelity Series Large Cap Growth Index Fund | 6.8 |
| Fidelity Series International Value Fund | 6.5 |
| Fidelity Series Overseas Fund | 6.5 |
| Fidelity Series International Growth Fund | 6.5 |
| Fidelity Series Long-Term Treasury Bond Index Fund | 5.4 |
| Fidelity Series Value Discovery Fund | 5.3 |
| | 82.2 |
Asset Allocation (% of fund's net assets)
| Period end |
| | Domestic Equity Funds | 49.8% |
| | International Equity Funds | 41.5% |
| | Bond Funds | 8.6% |
| | Short-Term Investments | 0.1% |

Percentages are adjusted for the effect of futures contracts and swaps, if applicable.
Domestic Equity Funds category includes Fidelity Series Commodity Strategy Fund which invests in commodity-related investments.
Fidelity Freedom® Blend 2040 Fund
Schedule of Investments March 31, 2022
Showing Percentage of Net Assets
| U.S. Treasury Obligations - 0.1% | | | |
| | | Principal Amount | Value |
| U.S. Treasury Bills, yield at date of purchase 0.12% to 0.5% 4/14/22 to 6/23/22 (a) | | | |
| (Cost $949,671) | | 950,000 | 949,722 |
| | | Shares | Value |
|
| Domestic Equity Funds - 49.8% | | | |
| Fidelity Series Blue Chip Growth Fund (b) | | 10,862,916 | $156,100,099 |
| Fidelity Series Commodity Strategy Fund (b) | | 4,222,953 | 21,579,291 |
| Fidelity Series Large Cap Growth Index Fund (b) | | 5,589,043 | 98,367,156 |
| Fidelity Series Large Cap Stock Fund (b) | | 5,772,642 | 109,737,921 |
| Fidelity Series Large Cap Value Index Fund (b) | | 13,676,222 | 210,066,769 |
| Fidelity Series Small Cap Opportunities Fund (b) | | 3,876,231 | 52,794,262 |
| Fidelity Series Value Discovery Fund (b) | | 4,854,072 | 77,665,155 |
| TOTAL DOMESTIC EQUITY FUNDS | | | |
| (Cost $641,738,524) | | | 726,310,653 |
|
| International Equity Funds - 41.5% | | | |
| Fidelity Series Canada Fund (b) | | 3,045,506 | 47,266,246 |
| Fidelity Series Emerging Markets Fund (b) | | 2,166,087 | 20,101,290 |
| Fidelity Series Emerging Markets Opportunities Fund (b) | | 10,020,544 | 184,378,002 |
| Fidelity Series International Growth Fund (b) | | 5,702,241 | 94,543,150 |
| Fidelity Series International Index Fund (b) | | 3,509,344 | 40,146,894 |
| Fidelity Series International Small Cap Fund (b) | | 1,645,014 | 29,528,005 |
| Fidelity Series International Value Fund (b) | | 8,655,702 | 95,472,395 |
| Fidelity Series Overseas Fund (b) | | 7,532,439 | 95,059,376 |
| TOTAL INTERNATIONAL EQUITY FUNDS | | | |
| (Cost $601,248,983) | | | 606,495,358 |
|
| Bond Funds - 8.6% | | | |
| Fidelity Series 5+ Year Inflation-Protected Bond Index Fund (b) | | 152,341 | 1,462,469 |
| Fidelity Series Corporate Bond Fund (b) | | 381,977 | 3,857,970 |
| Fidelity Series Emerging Markets Debt Fund (b) | | 863,202 | 7,121,414 |
| Fidelity Series Emerging Markets Debt Local Currency Fund (b) | | 267,460 | 2,409,816 |
| Fidelity Series Floating Rate High Income Fund (b) | | 158,574 | 1,457,292 |
| Fidelity Series Government Bond Index Fund (b) | | 549,249 | 5,481,503 |
| Fidelity Series High Income Fund (b) | | 973,512 | 8,849,227 |
| Fidelity Series International Developed Markets Bond Index Fund (b) | | 121,492 | 1,133,523 |
| Fidelity Series Investment Grade Bond Fund (b) | | 529,003 | 5,771,418 |
| Fidelity Series Investment Grade Securitized Fund (b) | | 410,318 | 3,988,293 |
| Fidelity Series Long-Term Treasury Bond Index Fund (b) | | 10,299,528 | 78,482,402 |
| Fidelity Series Real Estate Income Fund (b) | | 459,107 | 5,215,457 |
| TOTAL BOND FUNDS | | | |
| (Cost $134,025,758) | | | 125,230,784 |
|
| Short-Term Funds - 0.0% | | | |
| Fidelity Cash Central Fund 0.31% (c) | | | |
| (Cost $703,501) | | 703,361 | 703,501 |
| TOTAL INVESTMENT IN SECURITIES - 100.0% | | | |
| (Cost $1,378,666,437) | | | 1,459,690,018 |
| NET OTHER ASSETS (LIABILITIES) - 0.0% | | | (63,726) |
| NET ASSETS - 100% | | | $1,459,626,292 |
| Futures Contracts | | | | | |
| | Number of contracts | Expiration Date | Notional Amount | Value | Unrealized Appreciation/(Depreciation) |
| Purchased | | | | | |
| Equity Index Contracts | | | | | |
| ICE E-mini MSCI EAFE Index Contracts (United States) | 27 | June 2022 | $2,894,940 | $164,570 | $164,570 |
| ICE E-mini MSCI Emerging Markets Index Contracts (United States) | 100 | June 2022 | 5,627,500 | 148,288 | 148,288 |
| Sold | | | | | |
| Equity Index Contracts | | | | | |
| CME Micro E-mini S&P 500 Index Contracts (United States) | 28 | June 2022 | 6,343,050 | (358,587) | (358,587) |
| TOTAL FUTURES CONTRACTS | | | | | $(45,729) |
The notional amount of futures purchased as a percentage of Net Assets is 0.6%
The notional amount of futures sold as a percentage of Net Assets is 0.4%
Legend
(a) Security or a portion of the security was pledged to cover margin requirements for futures contracts. At period end, the value of securities pledged amounted to $949,722.
(b) Affiliated Fund
(c) Affiliated fund that is generally available only to investment companies and other accounts managed by Fidelity Investments. The rate quoted is the annualized seven-day yield of the fund at period end. A complete unaudited listing of the fund's holdings as of its most recent quarter end is available upon request. In addition, each Fidelity Central Fund's financial statements, which are not covered by the Fund's Report of Independent Registered Public Accounting Firm, are available on the SEC's website or upon request.
Affiliated Central Funds
Fiscal year to date information regarding the Fund's investments in Fidelity Central Funds, including the ownership percentage, is presented below.
| Fund | Value, beginning of period | Purchases | Sales Proceeds | Dividend Income | Realized Gain/Loss | Change in Unrealized appreciation (depreciation) | Value, end of period | % ownership, end of period |
| Fidelity Cash Central Fund 0.31% | $-- | $3,083,355 | $2,379,854 | $236 | $-- | $-- | $703,501 | 0.0% |
| Total | $-- | $3,083,355 | $2,379,854 | $236 | $-- | $-- | $703,501 | |
Amounts in the income column in the above table include any capital gain distributions from underlying funds, which are presented in the corresponding line-item in the Statement of Operations, if applicable.
Affiliated Underlying Funds
Fiscal year to date information regarding the Fund's investments in affiliated Underlying Funds is presented below. Exchanges between classes of the same affiliated Underlying Funds may occur. If an underlying Fund changes its name, the name presented below is the name in effect at period end.
| Affiliate | Value, beginning of period | Purchases(a) | Sales Proceeds(a) | Dividend Income | Realized Gain (loss) | Change in Unrealized appreciation (depreciation) | Value, end of period |
| Fidelity Series 0-5 Year Inflation-Protected Bond Index Fund | $-- | $5,462,702 | $5,434,999 | $19,448 | $(24,807) | $-- | $-- |
| Fidelity Series 5+ Year Inflation-Protected Bond Index Fund | -- | 13,149,742 | 11,188,273 | 81,689 | (459,110) | (39,890) | 1,462,469 |
| Fidelity Series Blue Chip Growth Fund | 115,064,605 | 102,738,970 | 34,598,337 | 29,998,806 | (1,081,413) | (26,023,726) | 156,100,099 |
| Fidelity Series Canada Fund | 25,304,685 | 19,859,944 | 4,619,119 | 885,183 | (60,489) | 6,781,225 | 47,266,246 |
| Fidelity Series Commodity Strategy Fund | 29,033,424 | 22,727,639 | 31,478,893 | 11,083,879 | (854,124) | 2,151,245 | 21,579,291 |
| Fidelity Series Corporate Bond Fund | 114,625 | 4,720,604 | 825,689 | 21,823 | (10,373) | (141,197) | 3,857,970 |
| Fidelity Series Emerging Markets Debt Fund | 5,721,650 | 3,178,658 | 1,038,765 | 319,619 | (38,859) | (701,270) | 7,121,414 |
| Fidelity Series Emerging Markets Debt Local Currency Fund | 1,912,521 | 1,077,200 | 305,764 | 94,897 | (25,156) | (248,985) | 2,409,816 |
| Fidelity Series Emerging Markets Fund | 16,638,463 | 10,030,631 | 1,943,706 | 658,566 | (47,763) | (4,576,335) | 20,101,290 |
| Fidelity Series Emerging Markets Opportunities Fund | 149,580,233 | 113,223,353 | 19,112,681 | 20,729,631 | (640,053) | (58,672,850) | 184,378,002 |
| Fidelity Series Floating Rate High Income Fund | 1,152,680 | 637,564 | 331,202 | 59,672 | (835) | (915) | 1,457,292 |
| Fidelity Series Government Bond Index Fund | 140,347 | 6,801,211 | 1,301,292 | 10,934 | (12,994) | (145,769) | 5,481,503 |
| Fidelity Series Government Money Market Fund 0.31% | 2,710,652 | 500,582 | 3,211,234 | 549 | -- | -- | -- |
| Fidelity Series High Income Fund | 6,639,688 | 3,933,037 | 1,420,037 | 438,650 | (29,357) | (274,104) | 8,849,227 |
| Fidelity Series Inflation-Protected Bond Index Fund | 20,897,886 | 6,673,124 | 28,468,544 | 254,402 | 1,804,824 | (907,290) | -- |
| Fidelity Series International Developed Markets Bond Index Fund | -- | 1,174,392 | 3,011 | 6 | (76) | (37,782) | 1,133,523 |
| Fidelity Series International Growth Fund | 62,345,828 | 48,449,889 | 6,413,094 | 7,166,947 | 34,935 | (9,874,408) | 94,543,150 |
| Fidelity Series International Index Fund | 25,982,313 | 17,930,030 | 2,225,217 | 952,235 | (95,461) | (1,444,771) | 40,146,894 |
| Fidelity Series International Small Cap Fund | 22,289,484 | 13,464,147 | 1,255,127 | 3,717,766 | (47,447) | (4,923,052) | 29,528,005 |
| Fidelity Series International Value Fund | 62,209,570 | 45,044,918 | 12,114,200 | 4,499,810 | (246,444) | 578,551 | 95,472,395 |
| Fidelity Series Investment Grade Bond Fund | 157,899 | 7,261,933 | 1,475,150 | 25,806 | (13,504) | (159,760) | 5,771,418 |
| Fidelity Series Investment Grade Securitized Fund | 109,909 | 4,768,337 | 786,447 | 9,990 | (6,321) | (97,185) | 3,988,293 |
| Fidelity Series Large Cap Growth Index Fund | 72,637,944 | 41,764,414 | 24,707,718 | 2,857,912 | 7,791 | 8,664,725 | 98,367,156 |
| Fidelity Series Large Cap Stock Fund | 79,346,798 | 47,165,081 | 18,752,928 | 8,982,074 | (462,493) | 2,441,463 | 109,737,921 |
| Fidelity Series Large Cap Value Index Fund | 151,569,490 | 85,926,998 | 33,947,875 | 13,342,558 | (692,667) | 7,210,823 | 210,066,769 |
| Fidelity Series Long-Term Treasury Bond Index Fund | 28,625,097 | 59,398,003 | 5,549,627 | 1,068,846 | (611,082) | (3,379,989) | 78,482,402 |
| Fidelity Series Overseas Fund | 62,336,403 | 42,111,721 | 6,642,993 | 2,651,342 | 24,073 | (2,769,828) | 95,059,376 |
| Fidelity Series Real Estate Income Fund | 3,977,790 | 1,992,354 | 843,849 | 198,261 | (11,791) | 100,953 | 5,215,457 |
| Fidelity Series Short-Term Credit Fund | 1,337,314 | 387,088 | 1,723,577 | 6,985 | 18,497 | (19,322) | -- |
| Fidelity Series Small Cap Opportunities Fund | 38,321,805 | 33,431,111 | 7,508,518 | 12,128,870 | (694,352) | (10,755,784) | 52,794,262 |
| Fidelity Series Treasury Bill Index Fund | 4,307,063 | 1,302,905 | 5,609,968 | 864 | 1,372 | (1,372) | -- |
| Fidelity Series Value Discovery Fund | 56,003,861 | 36,503,672 | 14,284,649 | 8,612,802 | (293,641) | (264,088) | 77,665,155 |
| Total | $1,046,470,027 | $802,791,954 | $289,122,483 | $130,880,822 | $(4,569,120) | $(97,530,687) | $1,458,036,795 |
(a) Includes the value of shares purchased or redeemed through in-kind transactions, if applicable.
Amounts in the income column in the above table include any capital gain distributions from underlying funds, which are presented in the corresponding line-item in the Statement of Operations, if applicable.
Investment Valuation
The following is a summary of the inputs used, as of March 31, 2022, involving the Fund's assets and liabilities carried at fair value. The inputs or methodology used for valuing securities may not be an indication of the risk associated with investing in those securities. For more information on valuation inputs, and their aggregation into the levels used below, please refer to the Investment Valuation section in the accompanying Notes to Financial Statements.
| | Valuation Inputs at Reporting Date: |
| Description | Total | Level 1 | Level 2 | Level 3 |
| Investments in Securities: | | | | |
| Other Short-Term Investments and Net Other Assets | $949,722 | $-- | $949,722 | $-- |
| Domestic Equity Funds | 726,310,653 | 726,310,653 | -- | -- |
| International Equity Funds | 606,495,358 | 606,495,358 | -- | -- |
| Bond Funds | 125,230,784 | 125,230,784 | -- | -- |
| Short-Term Funds | 703,501 | 703,501 | -- | -- |
| Total Investments in Securities: | $1,459,690,018 | $1,458,740,296 | $949,722 | $-- |
| Derivative Instruments: | | | | |
| Assets | | | | |
| Futures Contracts | $312,858 | $312,858 | $-- | $-- |
| Total Assets | $312,858 | $312,858 | $-- | $-- |
| Liabilities | | | | |
| Futures Contracts | $(358,587) | $(358,587) | $-- | $-- |
| Total Liabilities | $(358,587) | $(358,587) | $-- | $-- |
| Total Derivative Instruments: | $(45,729) | $(45,729) | $-- | $-- |
Value of Derivative Instruments
The following table is a summary of the Fund's value of derivative instruments by primary risk exposure as of March 31, 2022. For additional information on derivative instruments, please refer to the Derivative Instruments section in the accompanying Notes to Financial Statements.
| Primary Risk Exposure / Derivative Type | Value |
| | Asset | Liability |
| Equity Risk | | |
| Futures Contracts(a) | $312,858 | $(358,587) |
| Total Equity Risk | 312,858 | (358,587) |
| Total Value of Derivatives | $312,858 | $(358,587) |
(a) Reflects gross cumulative appreciation (depreciation) on futures contracts as presented in the Schedule of Investments. In the Statement of Assets and Liabilities, the period end daily variation margin is included in receivable or payable for daily variation margin on futures contracts, and the net cumulative appreciation (depreciation) is included in Total accumulated earnings (loss).
See accompanying notes which are an integral part of the financial statements.
Fidelity Freedom® Blend 2040 Fund
Financial Statements
Statement of Assets and Liabilities
| | | March 31, 2022 |
| Assets | | |
Investment in securities, at value — See accompanying schedule:
Unaffiliated issuers (cost $949,671) | $949,722 | |
| Fidelity Central Funds (cost $703,501) | 703,501 | |
| Other affiliated issuers (cost $1,377,013,265) | 1,458,036,795 | |
| Total Investment in Securities (cost $1,378,666,437) | | $1,459,690,018 |
| Cash | | 13,115 |
| Receivable for investments sold | | 30,711,349 |
| Receivable for fund shares sold | | 1,549,588 |
| Distributions receivable from Fidelity Central Funds | | 132 |
| Receivable for daily variation margin on futures contracts | | 14,751 |
| Total assets | | 1,491,978,953 |
| Liabilities | | |
| Payable for investments purchased | $27,919,843 | |
| Payable for fund shares redeemed | 3,959,904 | |
| Accrued management fee | 398,605 | |
| Distribution and service plan fees payable | 3,488 | |
| Payable for daily variation margin on futures contracts | 70,821 | |
| Total liabilities | | 32,352,661 |
| Net Assets | | $1,459,626,292 |
| Net Assets consist of: | | |
| Paid in capital | | $1,347,245,485 |
| Total accumulated earnings (loss) | | 112,380,807 |
| Net Assets | | $1,459,626,292 |
| Net Asset Value and Maximum Offering Price | | |
| Class A: | | |
| Net Asset Value and redemption price per share ($5,919,762 ÷ 509,392 shares)(a) | | $11.62 |
| Maximum offering price per share (100/94.25 of $11.62) | | $12.33 |
| Class M: | | |
| Net Asset Value and redemption price per share ($1,380,806 ÷ 118,839 shares)(a) | | $11.62 |
| Maximum offering price per share (100/96.50 of $11.62) | | $12.04 |
| Class C: | | |
| Net Asset Value and offering price per share ($2,207,340 ÷ 191,910 shares)(a) | | $11.50 |
| Fidelity Freedom Blend 2040 Fund: | | |
| Net Asset Value, offering price and redemption price per share ($117,037,450 ÷ 10,038,441 shares) | | $11.66 |
| Class K: | | |
| Net Asset Value, offering price and redemption price per share ($27,424,297 ÷ 2,344,184 shares) | | $11.70 |
| Class K6: | | |
| Net Asset Value, offering price and redemption price per share ($509,486,441 ÷ 43,367,607 shares) | | $11.75 |
| Class I: | | |
| Net Asset Value, offering price and redemption price per share ($19,663,826 ÷ 1,684,487 shares) | | $11.67 |
| Class Z: | | |
| Net Asset Value, offering price and redemption price per share ($3,617,619 ÷ 308,744 shares) | | $11.72 |
| Class Z6: | | |
| Net Asset Value, offering price and redemption price per share ($84,246,258 ÷ 7,189,493 shares) | | $11.72 |
| Premier Class: | | |
| Net Asset Value, offering price and redemption price per share ($688,642,493 ÷ 58,738,443 shares) | | $11.72 |
(a) Redemption price per share is equal to net asset value less any applicable contingent deferred sales charge.
See accompanying notes which are an integral part of the financial statements.
Statement of Operations
| | | Year ended March 31, 2022 |
| Investment Income | | |
| Dividends: | | |
| Affiliated issuers | | $37,744,956 |
| Interest | | 272 |
| Income from Fidelity Central Funds | | 236 |
| Total income | | 37,745,464 |
| Expenses | | |
| Management fee | $4,422,588 | |
| Distribution and service plan fees | 35,098 | |
| Independent trustees' fees and expenses | 3,757 | |
| Total expenses | | 4,461,443 |
| Net investment income (loss) | | 33,284,021 |
| Realized and Unrealized Gain (Loss) | | |
| Net realized gain (loss) on: | | |
| Investment securities: | | |
| Affiliated issuers | (4,569,120) | |
| Futures contracts | (533,424) | |
| Capital gain distributions from underlying funds: | | |
| Affiliated issuers | 93,135,866 | |
| Total net realized gain (loss) | | 88,033,322 |
| Change in net unrealized appreciation (depreciation) on: | | |
| Investment securities: | | |
| Unaffiliated issuers | 51 | |
| Affiliated issuers | (97,530,687) | |
| Futures contracts | (45,729) | |
| Total change in net unrealized appreciation (depreciation) | | (97,576,365) |
| Net gain (loss) | | (9,543,043) |
| Net increase (decrease) in net assets resulting from operations | | $23,740,978 |
See accompanying notes which are an integral part of the financial statements.
Statement of Changes in Net Assets
| | Year ended March 31, 2022 | Year ended March 31, 2021 |
| Increase (Decrease) in Net Assets | | |
| Operations | | |
| Net investment income (loss) | $33,284,021 | $10,820,997 |
| Net realized gain (loss) | 88,033,322 | 49,506,774 |
| Change in net unrealized appreciation (depreciation) | (97,576,365) | 277,724,909 |
| Net increase (decrease) in net assets resulting from operations | 23,740,978 | 338,052,680 |
| Distributions to shareholders | (111,042,886) | (43,566,869) |
| Share transactions - net increase (decrease) | 500,754,122 | 203,854,475 |
| Total increase (decrease) in net assets | 413,452,214 | 498,340,286 |
| Net Assets | | |
| Beginning of period | 1,046,174,078 | 547,833,792 |
| End of period | $1,459,626,292 | $1,046,174,078 |
See accompanying notes which are an integral part of the financial statements.
Financial Highlights
Fidelity Freedom Blend 2040 Fund Class A
| Years ended March 31, | 2022 | 2021 | 2020 | 2019 A |
| Selected Per–Share Data | | | | |
| Net asset value, beginning of period | $12.24 | $8.27 | $9.55 | $10.00 |
| Income from Investment Operations | | | | |
| Net investment income (loss)B,C | .17 | .10 | .15 | –D |
| Net realized and unrealized gain (loss) | .25 | 4.43 | (1.09) | (.17) |
| Total from investment operations | .42 | 4.53 | (.94) | (.17) |
| Distributions from net investment income | (.28) | (.13) | (.17) | (.14) |
| Distributions from net realized gain | (.76) | (.43) | (.17) | (.14) |
| Total distributions | (1.04) | (.56) | (.34) | (.28) |
| Net asset value, end of period | $11.62 | $12.24 | $8.27 | $9.55 |
| Total ReturnE,F | 2.97% | 55.55% | (10.57)% | (1.39)% |
| Ratios to Average Net AssetsC,G,H | | | | |
| Expenses before reductions | .79% | .79% | .79% | .80%I,J |
| Expenses net of fee waivers, if any | .79% | .79% | .79% | .80%I,J |
| Expenses net of all reductions | .79% | .79% | .79% | .80%I,J |
| Net investment income (loss) | 1.39% | .89% | 1.48% | .01%I |
| Supplemental Data | | | | |
| Net assets, end of period (000 omitted) | $5,920 | $2,843 | $695 | $255 |
| Portfolio turnover rateK | 22% | 23% | 27% | 17%I |
A For the period August 31, 2018 (commencement of operations) through March 31, 2019.
B Calculated based on average shares outstanding during the period.
C Net investment income (loss) is affected by the timing of the declaration of dividends by any underlying mutual funds or exchange-traded funds (ETFs). Net investment income (loss) of any such underlying funds is not included in the Fund's net investment income (loss) ratio.
D Amount represents less than $.005 per share.
E Total returns for periods of less than one year are not annualized.
F Total returns do not include the effect of the sales charges.
G Fees and expenses of any underlying mutual funds or exchange-traded funds (ETFs) are not included in the Fund's expense ratio. The Fund indirectly bears its proportionate share of these expenses. For additional expense information related to investments in Fidelity Central Funds, please refer to the "Investments in Fidelity Central Funds" note found in the Notes to Financial Statements section of the most recent Annual or Semi-Annual report.
H Expense ratios reflect operating expenses of the class. Expenses before reductions do not reflect amounts reimbursed, waived, or reduced through arrangements with the investment adviser, brokerage services, or other offset arrangements, if applicable, and do not represent the amount paid by the class during periods when reimbursements, waivers or reductions occur.
I Annualized
J On certain classes, the size and fluctuation of net assets and expense amounts may cause ratios to differ from contractual rates.
K Amount does not include the portfolio activity of any underlying mutual funds or exchange-traded funds (ETFs).
See accompanying notes which are an integral part of the financial statements.
Fidelity Freedom Blend 2040 Fund Class M
| Years ended March 31, | 2022 | 2021 | 2020 | 2019 A |
| Selected Per–Share Data | | | | |
| Net asset value, beginning of period | $12.24 | $8.28 | $9.55 | $10.00 |
| Income from Investment Operations | | | | |
| Net investment income (loss)B,C | .14 | .07 | .12 | (.01) |
| Net realized and unrealized gain (loss) | .25 | 4.43 | (1.08) | (.18) |
| Total from investment operations | .39 | 4.50 | (.96) | (.19) |
| Distributions from net investment income | (.25) | (.11) | (.14) | (.12) |
| Distributions from net realized gain | (.76) | (.43) | (.17) | (.14) |
| Total distributions | (1.01) | (.54) | (.31) | (.26) |
| Net asset value, end of period | $11.62 | $12.24 | $8.28 | $9.55 |
| Total ReturnD,E | 2.72% | 55.06% | (10.74)% | (1.59)% |
| Ratios to Average Net AssetsC,F,G | | | | |
| Expenses before reductions | 1.04% | 1.04% | 1.04% | 1.04%H |
| Expenses net of fee waivers, if any | 1.04% | 1.04% | 1.04% | 1.04%H |
| Expenses net of all reductions | 1.04% | 1.04% | 1.04% | 1.04%H |
| Net investment income (loss) | 1.14% | .64% | 1.23% | (.23)%H |
| Supplemental Data | | | | |
| Net assets, end of period (000 omitted) | $1,381 | $853 | $318 | $131 |
| Portfolio turnover rateI | 22% | 23% | 27% | 17%H |
A For the period August 31, 2018 (commencement of operations) through March 31, 2019.
B Calculated based on average shares outstanding during the period.
C Net investment income (loss) is affected by the timing of the declaration of dividends by any underlying mutual funds or exchange-traded funds (ETFs). Net investment income (loss) of any such underlying funds is not included in the Fund's net investment income (loss) ratio.
D Total returns for periods of less than one year are not annualized.
E Total returns do not include the effect of the sales charges.
F Fees and expenses of any underlying mutual funds or exchange-traded funds (ETFs) are not included in the Fund's expense ratio. The Fund indirectly bears its proportionate share of these expenses. For additional expense information related to investments in Fidelity Central Funds, please refer to the "Investments in Fidelity Central Funds" note found in the Notes to Financial Statements section of the most recent Annual or Semi-Annual report.
G Expense ratios reflect operating expenses of the class. Expenses before reductions do not reflect amounts reimbursed, waived, or reduced through arrangements with the investment adviser, brokerage services, or other offset arrangements, if applicable, and do not represent the amount paid by the class during periods when reimbursements, waivers or reductions occur.
H Annualized
I Amount does not include the portfolio activity of any underlying mutual funds or exchange-traded funds (ETFs).
See accompanying notes which are an integral part of the financial statements.
Fidelity Freedom Blend 2040 Fund Class C
| Years ended March 31, | 2022 | 2021 | 2020 | 2019 A |
| Selected Per–Share Data | | | | |
| Net asset value, beginning of period | $12.15 | $8.25 | $9.54 | $10.00 |
| Income from Investment Operations | | | | |
| Net investment income (loss)B,C | .08 | .02 | .07 | (.04) |
| Net realized and unrealized gain (loss) | .24 | 4.39 | (1.07) | (.18) |
| Total from investment operations | .32 | 4.41 | (1.00) | (.22) |
| Distributions from net investment income | (.21) | (.09) | (.12) | (.11) |
| Distributions from net realized gain | (.76) | (.43) | (.17) | (.14) |
| Total distributions | (.97) | (.51)D | (.29) | (.24)D |
| Net asset value, end of period | $11.50 | $12.15 | $8.25 | $9.54 |
| Total ReturnE,F | 2.19% | 54.23% | (11.10)% | (1.88)% |
| Ratios to Average Net AssetsC,G,H | | | | |
| Expenses before reductions | 1.54% | 1.55% | 1.54% | 1.55%I,J |
| Expenses net of fee waivers, if any | 1.54% | 1.55% | 1.54% | 1.55%I,J |
| Expenses net of all reductions | 1.54% | 1.55% | 1.54% | 1.55%I,J |
| Net investment income (loss) | .64% | .14% | .73% | (.74)%I |
| Supplemental Data | | | | |
| Net assets, end of period (000 omitted) | $2,207 | $1,451 | $357 | $208 |
| Portfolio turnover rateK | 22% | 23% | 27% | 17%I |
A For the period August 31, 2018 (commencement of operations) through March 31, 2019.
B Calculated based on average shares outstanding during the period.
C Net investment income (loss) is affected by the timing of the declaration of dividends by any underlying mutual funds or exchange-traded funds (ETFs). Net investment income (loss) of any such underlying funds is not included in the Fund's net investment income (loss) ratio.
D Total distributions per share do not sum due to rounding.
E Total returns for periods of less than one year are not annualized.
F Total returns do not include the effect of the contingent deferred sales charge.
G Fees and expenses of any underlying mutual funds or exchange-traded funds (ETFs) are not included in the Fund's expense ratio. The Fund indirectly bears its proportionate share of these expenses. For additional expense information related to investments in Fidelity Central Funds, please refer to the "Investments in Fidelity Central Funds" note found in the Notes to Financial Statements section of the most recent Annual or Semi-Annual report.
H Expense ratios reflect operating expenses of the class. Expenses before reductions do not reflect amounts reimbursed, waived, or reduced through arrangements with the investment adviser, brokerage services, or other offset arrangements, if applicable, and do not represent the amount paid by the class during periods when reimbursements, waivers or reductions occur.
I Annualized
J On certain classes, the size and fluctuation of net assets and expense amounts may cause ratios to differ from contractual rates.
K Amount does not include the portfolio activity of any underlying mutual funds or exchange-traded funds (ETFs).
See accompanying notes which are an integral part of the financial statements.
Fidelity Freedom Blend 2040 Fund
| Years ended March 31, | 2022 | 2021 | 2020 | 2019 A |
| Selected Per–Share Data | | | | |
| Net asset value, beginning of period | $12.28 | $8.29 | $9.55 | $10.00 |
| Income from Investment Operations | | | | |
| Net investment income (loss)B,C | .20 | .12 | .16 | .01 |
| Net realized and unrealized gain (loss) | .26 | 4.44 | (1.06) | (.18) |
| Total from investment operations | .46 | 4.56 | (.90) | (.17) |
| Distributions from net investment income | (.31) | (.14) | (.18) | (.14) |
| Distributions from net realized gain | (.77) | (.44) | (.17) | (.14) |
| Total distributions | (1.08) | (.57)D | (.36)D | (.28) |
| Net asset value, end of period | $11.66 | $12.28 | $8.29 | $9.55 |
| Total ReturnE | 3.27% | 55.89% | (10.24)% | (1.35)% |
| Ratios to Average Net AssetsC,F,G | | | | |
| Expenses before reductions | .54% | .54% | .55%H | .54%I |
| Expenses net of fee waivers, if any | .54% | .54% | .55%H | .54%I |
| Expenses net of all reductions | .54% | .54% | .55%H | .54%I |
| Net investment income (loss) | 1.64% | 1.14% | 1.72% | .27%I |
| Supplemental Data | | | | |
| Net assets, end of period (000 omitted) | $117,037 | $33,442 | $15,147 | $590 |
| Portfolio turnover rateJ | 22% | 23% | 27% | 17%I |
A For the period August 31, 2018 (commencement of operations) through March 31, 2019.
B Calculated based on average shares outstanding during the period.
C Net investment income (loss) is affected by the timing of the declaration of dividends by any underlying mutual funds or exchange-traded funds (ETFs). Net investment income (loss) of any such underlying funds is not included in the Fund's net investment income (loss) ratio.
D Total distributions per share do not sum due to rounding.
E Total returns for periods of less than one year are not annualized.
F Fees and expenses of any underlying mutual funds or exchange-traded funds (ETFs) are not included in the Fund's expense ratio. The Fund indirectly bears its proportionate share of these expenses. For additional expense information related to investments in Fidelity Central Funds, please refer to the "Investments in Fidelity Central Funds" note found in the Notes to Financial Statements section of the most recent Annual or Semi-Annual report.
G Expense ratios reflect operating expenses of the class. Expenses before reductions do not reflect amounts reimbursed, waived, or reduced through arrangements with the investment adviser, brokerage services, or other offset arrangements, if applicable, and do not represent the amount paid by the class during periods when reimbursements, waivers or reductions occur.
H On certain classes, the size and fluctuation of net assets and expense amounts may cause ratios to differ from contractual rates.
I Annualized
J Amount does not include the portfolio activity of any underlying mutual funds or exchange-traded funds (ETFs).
See accompanying notes which are an integral part of the financial statements.
Fidelity Freedom Blend 2040 Fund Class K
| Years ended March 31, | 2022 | 2021 | 2020 | 2019 A |
| Selected Per–Share Data | | | | |
| Net asset value, beginning of period | $12.30 | $8.30 | $9.57 | $10.00 |
| Income from Investment Operations | | | | |
| Net investment income (loss)B,C | .22 | .13 | .18 | .02 |
| Net realized and unrealized gain (loss) | .26 | 4.45 | (1.08) | (.17) |
| Total from investment operations | .48 | 4.58 | (.90) | (.15) |
| Distributions from net investment income | (.30) | (.14) | (.19) | (.14) |
| Distributions from net realized gain | (.77) | (.43) | (.17) | (.14) |
| Total distributions | (1.08)D | (.58)D | (.37)D | (.28) |
| Net asset value, end of period | $11.70 | $12.30 | $8.30 | $9.57 |
| Total ReturnE | 3.39% | 55.97% | (10.22)% | (1.19)% |
| Ratios to Average Net AssetsC,F,G | | | | |
| Expenses before reductions | .44% | .44% | .44% | .44%H |
| Expenses net of fee waivers, if any | .44% | .44% | .44% | .44%H |
| Expenses net of all reductions | .44% | .44% | .44% | .44%H |
| Net investment income (loss) | 1.74% | 1.24% | 1.83% | .37%H |
| Supplemental Data | | | | |
| Net assets, end of period (000 omitted) | $27,424 | $19,429 | $15,212 | $99 |
| Portfolio turnover rateI | 22% | 23% | 27% | 17%H |
A For the period August 31, 2018 (commencement of operations) through March 31, 2019.
B Calculated based on average shares outstanding during the period.
C Net investment income (loss) is affected by the timing of the declaration of dividends by any underlying mutual funds or exchange-traded funds (ETFs). Net investment income (loss) of any such underlying funds is not included in the Fund's net investment income (loss) ratio.
D Total distributions per share do not sum due to rounding.
E Total returns for periods of less than one year are not annualized.
F Fees and expenses of any underlying mutual funds or exchange-traded funds (ETFs) are not included in the Fund's expense ratio. The Fund indirectly bears its proportionate share of these expenses. For additional expense information related to investments in Fidelity Central Funds, please refer to the "Investments in Fidelity Central Funds" note found in the Notes to Financial Statements section of the most recent Annual or Semi-Annual report.
G Expense ratios reflect operating expenses of the class. Expenses before reductions do not reflect amounts reimbursed, waived, or reduced through arrangements with the investment adviser, brokerage services, or other offset arrangements, if applicable, and do not represent the amount paid by the class during periods when reimbursements, waivers or reductions occur.
H Annualized
I Amount does not include the portfolio activity of any underlying mutual funds or exchange-traded funds (ETFs).
See accompanying notes which are an integral part of the financial statements.
Fidelity Freedom Blend 2040 Fund Class K6
| Years ended March 31, | 2022 | 2021 | 2020 | 2019 A |
| Selected Per–Share Data | | | | |
| Net asset value, beginning of period | $12.33 | $8.32 | $9.57 | $10.00 |
| Income from Investment Operations | | | | |
| Net investment income (loss)B,C | .23 | .15 | .19 | .02 |
| Net realized and unrealized gain (loss) | .25 | 4.45 | (1.08) | (.17) |
| Total from investment operations | .48 | 4.60 | (.89) | (.15) |
| Distributions from net investment income | (.29) | (.15) | (.18) | (.14) |
| Distributions from net realized gain | (.78) | (.44) | (.18) | (.14) |
| Total distributions | (1.06)D | (.59) | (.36) | (.28) |
| Net asset value, end of period | $11.75 | $12.33 | $8.32 | $9.57 |
| Total ReturnE,F | 3.46% | 56.11% | (10.07)% | (1.14)% |
| Ratios to Average Net AssetsC,G,H | | | | |
| Expenses before reductions | .34% | .34% | .34% | .35%I,J |
| Expenses net of fee waivers, if any | .34% | .34% | .34% | .35%I,J |
| Expenses net of all reductions | .34% | .34% | .34% | .35%I,J |
| Net investment income (loss) | 1.84% | 1.34% | 1.93% | .46%I |
| Supplemental Data | | | | |
| Net assets, end of period (000 omitted) | $509,486 | $972,867 | $510,439 | $14,956 |
| Portfolio turnover rateK | 22% | 23% | 27% | 17%I |
A For the period August 31, 2018 (commencement of operations) through March 31, 2019.
B Calculated based on average shares outstanding during the period.
C Net investment income (loss) is affected by the timing of the declaration of dividends by any underlying mutual funds or exchange-traded funds (ETFs). Net investment income (loss) of any such underlying funds is not included in the Fund's net investment income (loss) ratio.
D Total distributions per share do not sum due to rounding.
E Total returns for periods of less than one year are not annualized.
F Total returns would have been lower if certain expenses had not been reduced during the applicable periods shown.
G Fees and expenses of any underlying mutual funds or exchange-traded funds (ETFs) are not included in the Fund's expense ratio. The Fund indirectly bears its proportionate share of these expenses. For additional expense information related to investments in Fidelity Central Funds, please refer to the "Investments in Fidelity Central Funds" note found in the Notes to Financial Statements section of the most recent Annual or Semi-Annual report.
H Expense ratios reflect operating expenses of the class. Expenses before reductions do not reflect amounts reimbursed, waived, or reduced through arrangements with the investment adviser, brokerage services, or other offset arrangements, if applicable, and do not represent the amount paid by the class during periods when reimbursements, waivers or reductions occur.
I Annualized
J On certain classes, the size and fluctuation of net assets and expense amounts may cause ratios to differ from contractual rates.
K Amount does not include the portfolio activity of any underlying mutual funds or exchange-traded funds (ETFs).
See accompanying notes which are an integral part of the financial statements.
Fidelity Freedom Blend 2040 Fund Class I
| Years ended March 31, | 2022 | 2021 | 2020 | 2019 A |
| Selected Per–Share Data | | | | |
| Net asset value, beginning of period | $12.28 | $8.30 | $9.56 | $10.00 |
| Income from Investment Operations | | | | |
| Net investment income (loss)B,C | .21 | .12 | .17 | .01 |
| Net realized and unrealized gain (loss) | .25 | 4.44 | (1.07) | (.18) |
| Total from investment operations | .46 | 4.56 | (.90) | (.17) |
| Distributions from net investment income | (.30) | (.14) | (.19) | (.14) |
| Distributions from net realized gain | (.77) | (.44) | (.17) | (.14) |
| Total distributions | (1.07) | (.58) | (.36) | (.27)D |
| Net asset value, end of period | $11.67 | $12.28 | $8.30 | $9.56 |
| Total ReturnE | 3.23% | 55.73% | (10.17)% | (1.33)% |
| Ratios to Average Net AssetsC,F,G | | | | |
| Expenses before reductions | .54% | .54% | .55%H | .54%I |
| Expenses net of fee waivers, if any | .54% | .54% | .55%H | .54%I |
| Expenses net of all reductions | .54% | .54% | .55%H | .54%I |
| Net investment income (loss) | 1.64% | 1.14% | 1.73% | .27%I |
| Supplemental Data | | | | |
| Net assets, end of period (000 omitted) | $19,664 | $11,759 | $4,049 | $100 |
| Portfolio turnover rateJ | 22% | 23% | 27% | 17%I |
A For the period August 31, 2018 (commencement of operations) through March 31, 2019.
B Calculated based on average shares outstanding during the period.
C Net investment income (loss) is affected by the timing of the declaration of dividends by any underlying mutual funds or exchange-traded funds (ETFs). Net investment income (loss) of any such underlying funds is not included in the Fund's net investment income (loss) ratio.
D Total distributions per share do not sum due to rounding.
E Total returns for periods of less than one year are not annualized.
F Fees and expenses of any underlying mutual funds or exchange-traded funds (ETFs) are not included in the Fund's expense ratio. The Fund indirectly bears its proportionate share of these expenses. For additional expense information related to investments in Fidelity Central Funds, please refer to the "Investments in Fidelity Central Funds" note found in the Notes to Financial Statements section of the most recent Annual or Semi-Annual report.
G Expense ratios reflect operating expenses of the class. Expenses before reductions do not reflect amounts reimbursed, waived, or reduced through arrangements with the investment adviser, brokerage services, or other offset arrangements, if applicable, and do not represent the amount paid by the class during periods when reimbursements, waivers or reductions occur.
H On certain classes, the size and fluctuation of net assets and expense amounts may cause ratios to differ from contractual rates.
I Annualized
J Amount does not include the portfolio activity of any underlying mutual funds or exchange-traded funds (ETFs).
See accompanying notes which are an integral part of the financial statements.
Fidelity Freedom Blend 2040 Fund Premier Class
| Years ended March 31, | 2022 A |
| Selected Per–Share Data | |
| Net asset value, beginning of period | $12.60 |
| Income from Investment Operations | |
| Net investment income (loss)B,C | .48 |
| Net realized and unrealized gain (loss) | (.26) |
| Total from investment operations | .22 |
| Distributions from net investment income | (.33) |
| Distributions from net realized gain | (.78) |
| Total distributions | (1.10)D |
| Net asset value, end of period | $11.72 |
| Total ReturnE | 1.28% |
| Ratios to Average Net AssetsC,F,G | |
| Expenses before reductions | .29%H |
| Expenses net of fee waivers, if any | .29%H |
| Expenses net of all reductions | .29%H |
| Net investment income (loss) | 3.87%H |
| Supplemental Data | |
| Net assets, end of period (000 omitted) | $688,642 |
| Portfolio turnover rateI | 22% |
A For the period April 6, 2021 (commencement of sale of shares) through March 31, 2022.
B Calculated based on average shares outstanding during the period.
C Net investment income (loss) is affected by the timing of the declaration of dividends by any underlying mutual funds or exchange-traded funds (ETFs). Net investment income (loss) of any such underlying funds is not included in the Fund's net investment income (loss) ratio.
D Total distributions per share do not sum due to rounding.
E Total returns for periods of less than one year are not annualized.
F Fees and expenses of any underlying mutual funds or exchange-traded funds (ETFs) are not included in the Fund's expense ratio. The Fund indirectly bears its proportionate share of these expenses. For additional expense information related to investments in Fidelity Central Funds, please refer to the "Investments in Fidelity Central Funds" note found in the Notes to Financial Statements section of the most recent Annual or Semi-Annual report.
G Expense ratios reflect operating expenses of the class. Expenses before reductions do not reflect amounts reimbursed, waived, or reduced through arrangements with the investment adviser, brokerage services, or other offset arrangements, if applicable, and do not represent the amount paid by the class during periods when reimbursements, waivers or reductions occur.
H Annualized
I Amount does not include the portfolio activity of any underlying mutual funds or exchange-traded funds (ETFs).
See accompanying notes which are an integral part of the financial statements.
Fidelity Freedom Blend 2040 Fund Class Z
| Years ended March 31, | 2022 | 2021 | 2020 | 2019 A |
| Selected Per–Share Data | | | | |
| Net asset value, beginning of period | $12.33 | $8.32 | $9.57 | $10.00 |
| Income from Investment Operations | | | | |
| Net investment income (loss)B,C | .22 | .13 | .18 | .02 |
| Net realized and unrealized gain (loss) | .26 | 4.45 | (1.08) | (.17) |
| Total from investment operations | .48 | 4.58 | (.90) | (.15) |
| Distributions from net investment income | (.30) | (.14) | (.17) | (.14) |
| Distributions from net realized gain | (.78) | (.43) | (.17) | (.14) |
| Total distributions | (1.09)D | (.57) | (.35)D | (.28) |
| Net asset value, end of period | $11.72 | $12.33 | $8.32 | $9.57 |
| Total ReturnE | 3.38% | 55.93% | (10.17)% | (1.19)% |
| Ratios to Average Net AssetsC,F,G | | | | |
| Expenses before reductions | .44% | .44% | .44% | .44%H |
| Expenses net of fee waivers, if any | .44% | .44% | .44% | .44%H |
| Expenses net of all reductions | .44% | .44% | .44% | .44%H |
| Net investment income (loss) | 1.74% | 1.24% | 1.83% | .37%H |
| Supplemental Data | | | | |
| Net assets, end of period (000 omitted) | $3,618 | $138 | $89 | $99 |
| Portfolio turnover rateI | 22% | 23% | 27% | 17%H |
A For the period August 31, 2018 (commencement of operations) through March 31, 2019.
B Calculated based on average shares outstanding during the period.
C Net investment income (loss) is affected by the timing of the declaration of dividends by any underlying mutual funds or exchange-traded funds (ETFs). Net investment income (loss) of any such underlying funds is not included in the Fund's net investment income (loss) ratio.
D Total distributions per share do not sum due to rounding.
E Total returns for periods of less than one year are not annualized.
F Fees and expenses of any underlying mutual funds or exchange-traded funds (ETFs) are not included in the Fund's expense ratio. The Fund indirectly bears its proportionate share of these expenses. For additional expense information related to investments in Fidelity Central Funds, please refer to the "Investments in Fidelity Central Funds" note found in the Notes to Financial Statements section of the most recent Annual or Semi-Annual report.
G Expense ratios reflect operating expenses of the class. Expenses before reductions do not reflect amounts reimbursed, waived, or reduced through arrangements with the investment adviser, brokerage services, or other offset arrangements, if applicable, and do not represent the amount paid by the class during periods when reimbursements, waivers or reductions occur.
H Annualized
I Amount does not include the portfolio activity of any underlying mutual funds or exchange-traded funds (ETFs).
See accompanying notes which are an integral part of the financial statements.
Fidelity Freedom Blend 2040 Fund Class Z6
| Years ended March 31, | 2022 | 2021 | 2020 | 2019 A |
| Selected Per–Share Data | | | | |
| Net asset value, beginning of period | $12.33 | $8.32 | $9.57 | $10.00 |
| Income from Investment Operations | | | | |
| Net investment income (loss)B,C | .23 | .15 | .18 | .03 |
| Net realized and unrealized gain (loss) | .26 | 4.46 | (1.08) | (.18) |
| Total from investment operations | .49 | 4.61 | (.90) | (.15) |
| Distributions from net investment income | (.32) | (.16) | (.18) | (.14) |
| Distributions from net realized gain | (.78) | (.44) | (.17) | (.14) |
| Total distributions | (1.10) | (.60) | (.35) | (.28) |
| Net asset value, end of period | $11.72 | $12.33 | $8.32 | $9.57 |
| Total ReturnD | 3.46% | 56.23% | (10.14)% | (1.14)% |
| Ratios to Average Net AssetsC,E,F | | | | |
| Expenses before reductions | .34% | .34% | .35%G | .34%H |
| Expenses net of fee waivers, if any | .34% | .34% | .35%G | .34%H |
| Expenses net of all reductions | .34% | .34% | .35%G | .34%H |
| Net investment income (loss) | 1.84% | 1.34% | 1.92% | .47%H |
| Supplemental Data | | | | |
| Net assets, end of period (000 omitted) | $84,246 | $3,391 | $1,528 | $256 |
| Portfolio turnover rateI | 22% | 23% | 27% | 17%H |
A For the period August 31, 2018 (commencement of operations) through March 31, 2019.
B Calculated based on average shares outstanding during the period.
C Net investment income (loss) is affected by the timing of the declaration of dividends by any underlying mutual funds or exchange-traded funds (ETFs). Net investment income (loss) of any such underlying funds is not included in the Fund's net investment income (loss) ratio.
D Total returns for periods of less than one year are not annualized.
E Fees and expenses of any underlying mutual funds or exchange-traded funds (ETFs) are not included in the Fund's expense ratio. The Fund indirectly bears its proportionate share of these expenses. For additional expense information related to investments in Fidelity Central Funds, please refer to the "Investments in Fidelity Central Funds" note found in the Notes to Financial Statements section of the most recent Annual or Semi-Annual report.
F Expense ratios reflect operating expenses of the class. Expenses before reductions do not reflect amounts reimbursed, waived, or reduced through arrangements with the investment adviser, brokerage services, or other offset arrangements, if applicable, and do not represent the amount paid by the class during periods when reimbursements, waivers or reductions occur.
G On certain classes, the size and fluctuation of net assets and expense amounts may cause ratios to differ from contractual rates.
H Annualized
I Amount does not include the portfolio activity of any underlying mutual funds or exchange-traded funds (ETFs).
See accompanying notes which are an integral part of the financial statements.
Fidelity Freedom® Blend 2045 Fund
Investment Summary (Unaudited)
The information in the following tables is based on the direct investments of the Fund.
Top Holdings as of March 31, 2022
| | % of fund's net assets |
| Fidelity Series Large Cap Value Index Fund | 14.5 |
| Fidelity Series Emerging Markets Opportunities Fund | 12.7 |
| Fidelity Series Blue Chip Growth Fund | 10.8 |
| Fidelity Series Large Cap Stock Fund | 7.6 |
| Fidelity Series Large Cap Growth Index Fund | 6.8 |
| Fidelity Series International Value Fund | 6.6 |
| Fidelity Series Overseas Fund | 6.6 |
| Fidelity Series International Growth Fund | 6.5 |
| Fidelity Series Value Discovery Fund | 5.4 |
| Fidelity Series Long-Term Treasury Bond Index Fund | 5.4 |
| | 82.9 |
Asset Allocation (% of fund's net assets)
| Period end |
| | Domestic Equity Funds | 50.3% |
| | International Equity Funds | 41.9% |
| | Bond Funds | 7.7% |
| | Short-Term Investments | 0.1% |

Percentages are adjusted for the effect of futures contracts and swaps, if applicable.
Domestic Equity Funds category includes Fidelity Series Commodity Strategy Fund which invests in commodity-related investments.
Fidelity Freedom® Blend 2045 Fund
Schedule of Investments March 31, 2022
Showing Percentage of Net Assets
| U.S. Treasury Obligations - 0.1% | | | |
| | | Principal Amount | Value |
| U.S. Treasury Bills, yield at date of purchase 0.12% to 0.5% 4/14/22 to 6/23/22 (a) | | | |
| (Cost $849,682) | | 850,000 | 849,726 |
| | | Shares | Value |
|
| Domestic Equity Funds - 50.3% | | | |
| Fidelity Series Blue Chip Growth Fund (b) | | 9,484,793 | $136,296,481 |
| Fidelity Series Commodity Strategy Fund (b) | | 3,650,155 | 18,652,293 |
| Fidelity Series Large Cap Growth Index Fund (b) | | 4,880,123 | 85,890,167 |
| Fidelity Series Large Cap Stock Fund (b) | | 5,040,214 | 95,814,463 |
| Fidelity Series Large Cap Value Index Fund (b) | | 11,941,107 | 183,415,410 |
| Fidelity Series Small Cap Opportunities Fund (b) | | 3,384,337 | 46,094,675 |
| Fidelity Series Value Discovery Fund (b) | | 4,238,216 | 67,811,448 |
| TOTAL DOMESTIC EQUITY FUNDS | | | |
| (Cost $562,609,985) | | | 633,974,937 |
|
| International Equity Funds - 41.9% | | | |
| Fidelity Series Canada Fund (b) | | 2,652,940 | 41,173,625 |
| Fidelity Series Emerging Markets Fund (b) | | 1,874,534 | 17,395,680 |
| Fidelity Series Emerging Markets Opportunities Fund (b) | | 8,713,229 | 160,323,422 |
| Fidelity Series International Growth Fund (b) | | 4,968,970 | 82,385,518 |
| Fidelity Series International Index Fund (b) | | 3,056,656 | 34,968,147 |
| Fidelity Series International Small Cap Fund (b) | | 1,431,233 | 25,690,627 |
| Fidelity Series International Value Fund (b) | | 7,542,539 | 83,194,205 |
| Fidelity Series Overseas Fund (b) | | 6,563,721 | 82,834,157 |
| TOTAL INTERNATIONAL EQUITY FUNDS | | | |
| (Cost $524,625,238) | | | 527,965,381 |
|
| Bond Funds - 7.7% | | | |
| Fidelity Series 5+ Year Inflation-Protected Bond Index Fund (b) | | 131,589 | 1,263,256 |
| Fidelity Series Corporate Bond Fund (b) | | 133,341 | 1,346,748 |
| Fidelity Series Emerging Markets Debt Fund (b) | | 745,337 | 6,149,031 |
| Fidelity Series Emerging Markets Debt Local Currency Fund (b) | | 230,905 | 2,080,455 |
| Fidelity Series Floating Rate High Income Fund (b) | | 136,892 | 1,258,035 |
| Fidelity Series Government Bond Index Fund (b) | | 198,006 | 1,976,097 |
| Fidelity Series High Income Fund (b) | | 840,899 | 7,643,774 |
| Fidelity Series Investment Grade Bond Fund (b) | | 191,314 | 2,087,232 |
| Fidelity Series Investment Grade Securitized Fund (b) | | 143,612 | 1,395,912 |
| Fidelity Series Long-Term Treasury Bond Index Fund (b) | | 8,871,616 | 67,601,717 |
| Fidelity Series Real Estate Income Fund (b) | | 396,079 | 4,499,453 |
| TOTAL BOND FUNDS | | | |
| (Cost $104,421,402) | | | 97,301,710 |
|
| Short-Term Funds - 0.0% | | | |
| Fidelity Cash Central Fund 0.31% (c) | | | |
| (Cost $530,452) | | 530,345 | 530,452 |
| TOTAL INVESTMENT IN SECURITIES - 100.0% | | | |
| (Cost $1,193,036,759) | | | 1,260,622,206 |
| NET OTHER ASSETS (LIABILITIES) - 0.0% | | | (62,031) |
| NET ASSETS - 100% | | | $1,260,560,175 |
| Futures Contracts | | | | | |
| | Number of contracts | Expiration Date | Notional Amount | Value | Unrealized Appreciation/(Depreciation) |
| Purchased | | | | | |
| Equity Index Contracts | | | | | |
| ICE E-mini MSCI EAFE Index Contracts (United States) | 25 | June 2022 | $2,680,500 | $152,380 | $152,380 |
| ICE E-mini MSCI Emerging Markets Index Contracts (United States) | 89 | June 2022 | 5,008,475 | 149,599 | 149,599 |
| Sold | | | | | |
| Equity Index Contracts | | | | | |
| CME Micro E-mini S&P 500 Index Contracts (United States) | 25 | June 2022 | 5,663,438 | (320,622) | (320,622) |
| TOTAL FUTURES CONTRACTS | | | | | $(18,643) |
The notional amount of futures purchased as a percentage of Net Assets is 0.6%
The notional amount of futures sold as a percentage of Net Assets is 0.4%
For the period, the average monthly notional amount at value for futures contracts in the aggregate was $2,313,693
Legend
(a) Security or a portion of the security was pledged to cover margin requirements for futures contracts. At period end, the value of securities pledged amounted to $849,726.
(b) Affiliated Fund
(c) Affiliated fund that is generally available only to investment companies and other accounts managed by Fidelity Investments. The rate quoted is the annualized seven-day yield of the fund at period end. A complete unaudited listing of the fund's holdings as of its most recent quarter end is available upon request. In addition, each Fidelity Central Fund's financial statements, which are not covered by the Fund's Report of Independent Registered Public Accounting Firm, are available on the SEC's website or upon request.
Affiliated Central Funds
Fiscal year to date information regarding the Fund's investments in Fidelity Central Funds, including the ownership percentage, is presented below.
| Fund | Value, beginning of period | Purchases | Sales Proceeds | Dividend Income | Realized Gain/Loss | Change in Unrealized appreciation (depreciation) | Value, end of period | % ownership, end of period |
| Fidelity Cash Central Fund 0.31% | $-- | $2,298,765 | $1,768,313 | $190 | $-- | $-- | $530,452 | 0.0% |
| Total | $-- | $2,298,765 | $1,768,313 | $190 | $-- | $-- | $530,452 | |
Amounts in the income column in the above table include any capital gain distributions from underlying funds, which are presented in the corresponding line-item in the Statement of Operations, if applicable.
Affiliated Underlying Funds
Fiscal year to date information regarding the Fund's investments in affiliated Underlying Funds is presented below. Exchanges between classes of the same affiliated Underlying Funds may occur. If an underlying Fund changes its name, the name presented below is the name in effect at period end.
| Affiliate | Value, beginning of period | Purchases(a) | Sales Proceeds(a) | Dividend Income | Realized Gain (loss) | Change in Unrealized appreciation (depreciation) | Value, end of period |
| Fidelity Series 0-5 Year Inflation-Protected Bond Index Fund | $-- | $5,538,580 | $5,518,129 | $16,965 | $(17,925) | $-- | $-- |
| Fidelity Series 5+ Year Inflation-Protected Bond Index Fund | -- | 11,317,810 | 9,644,299 | 55,223 | (372,094) | (38,161) | 1,263,256 |
| Fidelity Series Blue Chip Growth Fund | 98,109,560 | 90,697,642 | 28,670,402 | 26,383,590 | (961,107) | (22,879,212) | 136,296,481 |
| Fidelity Series Canada Fund | 21,576,071 | 17,520,809 | 3,767,952 | 775,817 | (49,958) | 5,894,655 | 41,173,625 |
| Fidelity Series Commodity Strategy Fund | 24,755,229 | 20,152,162 | 27,234,172 | 9,754,445 | (890,309) | 1,869,383 | 18,652,293 |
| Fidelity Series Corporate Bond Fund | 97,731 | 2,014,719 | 742,016 | 6,664 | (19,337) | (4,349) | 1,346,748 |
| Fidelity Series Emerging Markets Debt Fund | 4,878,628 | 2,783,435 | 870,836 | 278,072 | (33,893) | (608,303) | 6,149,031 |
| Fidelity Series Emerging Markets Debt Local Currency Fund | 1,630,700 | 944,397 | 254,781 | 82,951 | (21,637) | (218,224) | 2,080,455 |
| Fidelity Series Emerging Markets Fund | 14,186,827 | 8,879,302 | 1,642,017 | 577,462 | (47,362) | (3,981,070) | 17,395,680 |
| Fidelity Series Emerging Markets Opportunities Fund | 127,540,316 | 100,599,965 | 16,075,578 | 18,160,590 | (593,901) | (51,147,380) | 160,323,422 |
| Fidelity Series Floating Rate High Income Fund | 982,840 | 556,746 | 280,194 | 51,925 | (528) | (829) | 1,258,035 |
| Fidelity Series Government Bond Index Fund | 119,850 | 3,152,725 | 1,270,797 | 3,208 | (21,529) | (4,152) | 1,976,097 |
| Fidelity Series Government Money Market Fund 0.31% | 2,311,226 | 382,615 | 2,693,841 | 472 | -- | -- | -- |
| Fidelity Series High Income Fund | 5,661,375 | 3,461,927 | 1,217,249 | 381,567 | (24,540) | (237,739) | 7,643,774 |
| Fidelity Series Inflation-Protected Bond Index Fund | 17,818,592 | 6,262,853 | 24,828,766 | 247,821 | 1,518,445 | (771,124) | -- |
| Fidelity Series International Growth Fund | 53,160,536 | 42,703,318 | 4,872,126 | 6,286,315 | 89,990 | (8,696,200) | 82,385,518 |
| Fidelity Series International Index Fund | 22,153,774 | 15,871,252 | 1,707,406 | 834,559 | (71,757) | (1,277,716) | 34,968,147 |
| Fidelity Series International Small Cap Fund | 19,006,573 | 11,980,503 | 955,216 | 3,259,401 | (26,759) | (4,314,474) | 25,690,627 |
| Fidelity Series International Value Fund | 53,039,664 | 40,118,175 | 10,264,695 | 3,947,069 | (192,724) | 493,785 | 83,194,205 |
| Fidelity Series Investment Grade Bond Fund | 134,456 | 3,405,799 | 1,425,928 | 8,432 | (22,300) | (4,795) | 2,087,232 |
| Fidelity Series Investment Grade Securitized Fund | 93,712 | 2,038,935 | 723,476 | 2,564 | (9,787) | (3,472) | 1,395,912 |
| Fidelity Series Large Cap Growth Index Fund | 61,934,791 | 36,850,368 | 20,432,883 | 2,502,846 | 47,919 | 7,489,972 | 85,890,167 |
| Fidelity Series Large Cap Stock Fund | 67,655,175 | 41,692,285 | 15,170,776 | 7,902,478 | (423,975) | 2,061,754 | 95,814,463 |
| Fidelity Series Large Cap Value Index Fund | 129,236,009 | 76,191,995 | 27,622,033 | 11,691,392 | (522,214) | 6,131,653 | 183,415,410 |
| Fidelity Series Long-Term Treasury Bond Index Fund | 24,407,341 | 51,429,541 | 4,809,269 | 927,030 | (470,496) | (2,955,400) | 67,601,717 |
| Fidelity Series Overseas Fund | 53,150,937 | 37,726,173 | 5,667,904 | 2,325,550 | 18,022 | (2,393,071) | 82,834,157 |
| Fidelity Series Real Estate Income Fund | 3,391,662 | 1,745,796 | 714,587 | 173,651 | (9,807) | 86,389 | 4,499,453 |
| Fidelity Series Short-Term Credit Fund | 1,140,277 | 275,329 | 1,415,169 | 5,971 | 15,802 | (16,239) | -- |
| Fidelity Series Small Cap Opportunities Fund | 32,675,014 | 29,153,899 | 5,681,554 | 10,670,302 | (501,938) | (9,550,746) | 46,094,675 |
| Fidelity Series Treasury Bill Index Fund | 3,672,409 | 935,918 | 4,608,334 | 714 | 1,126 | (1,119) | -- |
| Fidelity Series Value Discovery Fund | 47,751,795 | 31,648,427 | 11,052,144 | 7,532,318 | (247,856) | (288,774) | 67,811,448 |
| Total | $892,273,070 | $698,033,400 | $241,834,529 | $114,847,364 | $(3,862,429) | $(85,364,958) | $1,259,242,028 |
(a) Includes the value of shares purchased or redeemed through in-kind transactions, if applicable.
Amounts in the income column in the above table include any capital gain distributions from underlying funds, which are presented in the corresponding line-item in the Statement of Operations, if applicable.
Investment Valuation
The following is a summary of the inputs used, as of March 31, 2022, involving the Fund's assets and liabilities carried at fair value. The inputs or methodology used for valuing securities may not be an indication of the risk associated with investing in those securities. For more information on valuation inputs, and their aggregation into the levels used below, please refer to the Investment Valuation section in the accompanying Notes to Financial Statements.
| | Valuation Inputs at Reporting Date: |
| Description | Total | Level 1 | Level 2 | Level 3 |
| Investments in Securities: | | | | |
| Other Short-Term Investments and Net Other Assets | $849,726 | $-- | $849,726 | $-- |
| Domestic Equity Funds | 633,974,937 | 633,974,937 | -- | -- |
| International Equity Funds | 527,965,381 | 527,965,381 | -- | -- |
| Bond Funds | 97,301,710 | 97,301,710 | -- | -- |
| Short-Term Funds | 530,452 | 530,452 | -- | -- |
| Total Investments in Securities: | $1,260,622,206 | $1,259,772,480 | $849,726 | $-- |
| Derivative Instruments: | | | | |
| Assets | | | | |
| Futures Contracts | $301,979 | $301,979 | $-- | $-- |
| Total Assets | $301,979 | $301,979 | $-- | $-- |
| Liabilities | | | | |
| Futures Contracts | $(320,622) | $(320,622) | $-- | $-- |
| Total Liabilities | $(320,622) | $(320,622) | $-- | $-- |
| Total Derivative Instruments: | $(18,643) | $(18,643) | $-- | $-- |
Value of Derivative Instruments
The following table is a summary of the Fund's value of derivative instruments by primary risk exposure as of March 31, 2022. For additional information on derivative instruments, please refer to the Derivative Instruments section in the accompanying Notes to Financial Statements.
| Primary Risk Exposure / Derivative Type | Value |
| | Asset | Liability |
| Equity Risk | | |
| Futures Contracts(a) | $301,979 | $(320,622) |
| Total Equity Risk | 301,979 | (320,622) |
| Total Value of Derivatives | $301,979 | $(320,622) |
(a) Reflects gross cumulative appreciation (depreciation) on futures contracts as presented in the Schedule of Investments. In the Statement of Assets and Liabilities, the period end daily variation margin is included in receivable or payable for daily variation margin on futures contracts, and the net cumulative appreciation (depreciation) is included in Total accumulated earnings (loss).
See accompanying notes which are an integral part of the financial statements.
Fidelity Freedom® Blend 2045 Fund
Financial Statements
Statement of Assets and Liabilities
| | | March 31, 2022 |
| Assets | | |
Investment in securities, at value — See accompanying schedule:
Unaffiliated issuers (cost $849,682) | $849,726 | |
| Fidelity Central Funds (cost $530,452) | 530,452 | |
| Other affiliated issuers (cost $1,191,656,625) | 1,259,242,028 | |
| Total Investment in Securities (cost $1,193,036,759) | | $1,260,622,206 |
| Cash | | 10,350 |
| Receivable for investments sold | | 24,752,028 |
| Receivable for fund shares sold | | 1,698,334 |
| Distributions receivable from Fidelity Central Funds | | 104 |
| Receivable for daily variation margin on futures contracts | | 11,090 |
| Total assets | | 1,287,094,112 |
| Liabilities | | |
| Payable for investments purchased | $24,223,470 | |
| Payable for fund shares redeemed | 1,904,412 | |
| Accrued management fee | 337,103 | |
| Distribution and service plan fees payable | 3,617 | |
| Payable for daily variation margin on futures contracts | 65,335 | |
| Total liabilities | | 26,533,937 |
| Net Assets | | $1,260,560,175 |
| Net Assets consist of: | | |
| Paid in capital | | $1,165,311,843 |
| Total accumulated earnings (loss) | | 95,248,332 |
| Net Assets | | $1,260,560,175 |
| Net Asset Value and Maximum Offering Price | | |
| Class A: | | |
| Net Asset Value and redemption price per share ($3,781,936 ÷ 324,811 shares)(a) | | $11.64 |
| Maximum offering price per share (100/94.25 of $11.64) | | $12.35 |
| Class M: | | |
| Net Asset Value and redemption price per share ($2,547,176 ÷ 219,332 shares)(a) | | $11.61 |
| Maximum offering price per share (100/96.50 of $11.61) | | $12.03 |
| Class C: | | |
| Net Asset Value and offering price per share ($2,380,082 ÷ 206,902 shares)(a) | | $11.50 |
| Fidelity Freedom Blend 2045 Fund: | | |
| Net Asset Value, offering price and redemption price per share ($63,196,247 ÷ 5,414,679 shares) | | $11.67 |
| Class K: | | |
| Net Asset Value, offering price and redemption price per share ($24,151,650 ÷ 2,065,392 shares) | | $11.69 |
| Class K6: | | |
| Net Asset Value, offering price and redemption price per share ($445,959,127 ÷ 37,957,217 shares) | | $11.75 |
| Class I: | | |
| Net Asset Value, offering price and redemption price per share ($17,038,175 ÷ 1,459,949 shares) | | $11.67 |
| Class Z: | | |
| Net Asset Value, offering price and redemption price per share ($2,778,875 ÷ 237,263 shares) | | $11.71 |
| Class Z6: | | |
| Net Asset Value, offering price and redemption price per share ($72,838,347 ÷ 6,221,370 shares) | | $11.71 |
| Premier Class: | | |
| Net Asset Value, offering price and redemption price per share ($625,888,560 ÷ 53,396,008 shares) | | $11.72 |
(a) Redemption price per share is equal to net asset value less any applicable contingent deferred sales charge.
See accompanying notes which are an integral part of the financial statements.
Statement of Operations
| | | Year ended March 31, 2022 |
| Investment Income | | |
| Dividends: | | |
| Affiliated issuers | | $33,087,935 |
| Interest | | 240 |
| Income from Fidelity Central Funds | | 190 |
| Total income | | 33,088,365 |
| Expenses | | |
| Management fee | $3,811,189 | |
| Distribution and service plan fees | 38,105 | |
| Independent trustees' fees and expenses | 3,265 | |
| Total expenses | | 3,852,559 |
| Net investment income (loss) | | 29,235,806 |
| Realized and Unrealized Gain (Loss) | | |
| Net realized gain (loss) on: | | |
| Investment securities: | | |
| Affiliated issuers | (3,862,429) | |
| Futures contracts | (508,552) | |
| Capital gain distributions from underlying funds: | | |
| Affiliated issuers | 81,759,429 | |
| Total net realized gain (loss) | | 77,388,448 |
| Change in net unrealized appreciation (depreciation) on: | | |
| Investment securities: | | |
| Unaffiliated issuers | 44 | |
| Affiliated issuers | (85,364,958) | |
| Futures contracts | (18,643) | |
| Total change in net unrealized appreciation (depreciation) | | (85,383,557) |
| Net gain (loss) | | (7,995,109) |
| Net increase (decrease) in net assets resulting from operations | | $21,240,697 |
See accompanying notes which are an integral part of the financial statements.
Statement of Changes in Net Assets
| | Year ended March 31, 2022 | Year ended March 31, 2021 |
| Increase (Decrease) in Net Assets | | |
| Operations | | |
| Net investment income (loss) | $29,235,806 | $9,221,720 |
| Net realized gain (loss) | 77,388,448 | 42,311,069 |
| Change in net unrealized appreciation (depreciation) | (85,383,557) | 237,376,660 |
| Net increase (decrease) in net assets resulting from operations | 21,240,697 | 288,909,449 |
| Distributions to shareholders | (96,950,487) | (37,152,164) |
| Share transactions - net increase (decrease) | 444,226,581 | 173,605,835 |
| Total increase (decrease) in net assets | 368,516,791 | 425,363,120 |
| Net Assets | | |
| Beginning of period | 892,043,384 | 466,680,264 |
| End of period | $1,260,560,175 | $892,043,384 |
See accompanying notes which are an integral part of the financial statements.
Financial Highlights
Fidelity Freedom Blend 2045 Fund Class A
| Years ended March 31, | 2022 | 2021 | 2020 | 2019 A |
| Selected Per–Share Data | | | | |
| Net asset value, beginning of period | $12.26 | $8.29 | $9.55 | $10.00 |
| Income from Investment Operations | | | | |
| Net investment income (loss)B,C | .17 | .10 | .15 | .03 |
| Net realized and unrealized gain (loss) | .26 | 4.42 | (1.07) | (.22) |
| Total from investment operations | .43 | 4.52 | (.92) | (.19) |
| Distributions from net investment income | (.28) | (.12) | (.17) | (.15) |
| Distributions from net realized gain | (.77) | (.43) | (.17) | (.11) |
| Total distributions | (1.05) | (.55) | (.34) | (.26) |
| Net asset value, end of period | $11.64 | $12.26 | $8.29 | $9.55 |
| Total ReturnD,E | 3.02% | 55.30% | (10.38)% | (1.56)% |
| Ratios to Average Net AssetsC,F,G | | | | |
| Expenses before reductions | .79% | .79% | .79% | .79%H |
| Expenses net of fee waivers, if any | .79% | .79% | .79% | .79%H |
| Expenses net of all reductions | .79% | .79% | .79% | .79%H |
| Net investment income (loss) | 1.38% | .89% | 1.49% | .64%H |
| Supplemental Data | | | | |
| Net assets, end of period (000 omitted) | $3,782 | $1,963 | $835 | $253 |
| Portfolio turnover rateI | 21% | 23% | 27% | 19%H |
A For the period August 31, 2018 (commencement of operations) through March 31, 2019.
B Calculated based on average shares outstanding during the period.
C Net investment income (loss) is affected by the timing of the declaration of dividends by any underlying mutual funds or exchange-traded funds (ETFs). Net investment income (loss) of any such underlying funds is not included in the Fund's net investment income (loss) ratio.
D Total returns for periods of less than one year are not annualized.
E Total returns do not include the effect of the sales charges.
F Fees and expenses of any underlying mutual funds or exchange-traded funds (ETFs) are not included in the Fund's expense ratio. The Fund indirectly bears its proportionate share of these expenses. For additional expense information related to investments in Fidelity Central Funds, please refer to the "Investments in Fidelity Central Funds" note found in the Notes to Financial Statements section of the most recent Annual or Semi-Annual report.
G Expense ratios reflect operating expenses of the class. Expenses before reductions do not reflect amounts reimbursed, waived, or reduced through arrangements with the investment adviser, brokerage services, or other offset arrangements, if applicable, and do not represent the amount paid by the class during periods when reimbursements, waivers or reductions occur.
H Annualized
I Amount does not include the portfolio activity of any underlying mutual funds or exchange-traded funds (ETFs).
See accompanying notes which are an integral part of the financial statements.
Fidelity Freedom Blend 2045 Fund Class M
| Years ended March 31, | 2022 | 2021 | 2020 | 2019 A |
| Selected Per–Share Data | | | | |
| Net asset value, beginning of period | $12.23 | $8.27 | $9.54 | $10.00 |
| Income from Investment Operations | | | | |
| Net investment income (loss)B,C | .14 | .07 | .12 | .02 |
| Net realized and unrealized gain (loss) | .26 | 4.42 | (1.08) | (.22) |
| Total from investment operations | .40 | 4.49 | (.96) | (.20) |
| Distributions from net investment income | (.25) | (.10) | (.14) | (.15) |
| Distributions from net realized gain | (.77) | (.43) | (.17) | (.11) |
| Total distributions | (1.02) | (.53) | (.31) | (.26) |
| Net asset value, end of period | $11.61 | $12.23 | $8.27 | $9.54 |
| Total ReturnD,E,F | 2.78% | 55.04% | (10.71)% | (1.68)% |
| Ratios to Average Net AssetsC,G,H | | | | |
| Expenses before reductions | 1.04% | 1.04% | 1.05%I | 1.04%J |
| Expenses net of fee waivers, if any | 1.04% | 1.04% | 1.05%I | 1.04%J |
| Expenses net of all reductions | 1.04% | 1.04% | 1.05%I | 1.04%J |
| Net investment income (loss) | 1.13% | .64% | 1.23% | .39%J |
| Supplemental Data | | | | |
| Net assets, end of period (000 omitted) | $2,547 | $1,787 | $1,120 | $160 |
| Portfolio turnover rateK | 21% | 23% | 27% | 19%J |
A For the period August 31, 2018 (commencement of operations) through March 31, 2019.
B Calculated based on average shares outstanding during the period.
C Net investment income (loss) is affected by the timing of the declaration of dividends by any underlying mutual funds or exchange-traded funds (ETFs). Net investment income (loss) of any such underlying funds is not included in the Fund's net investment income (loss) ratio.
D Total returns for periods of less than one year are not annualized.
E Total returns would have been lower if certain expenses had not been reduced during the applicable periods shown.
F Total returns do not include the effect of the sales charges.
G Fees and expenses of any underlying mutual funds or exchange-traded funds (ETFs) are not included in the Fund's expense ratio. The Fund indirectly bears its proportionate share of these expenses. For additional expense information related to investments in Fidelity Central Funds, please refer to the "Investments in Fidelity Central Funds" note found in the Notes to Financial Statements section of the most recent Annual or Semi-Annual report.
H Expense ratios reflect operating expenses of the class. Expenses before reductions do not reflect amounts reimbursed, waived, or reduced through arrangements with the investment adviser, brokerage services, or other offset arrangements, if applicable, and do not represent the amount paid by the class during periods when reimbursements, waivers or reductions occur.
I On certain classes, the size and fluctuation of net assets and expense amounts may cause ratios to differ from contractual rates.
J Annualized
K Amount does not include the portfolio activity of any underlying mutual funds or exchange-traded funds (ETFs).
See accompanying notes which are an integral part of the financial statements.
Fidelity Freedom Blend 2045 Fund Class C
| Years ended March 31, | 2022 | 2021 | 2020 | 2019 A |
| Selected Per–Share Data | | | | |
| Net asset value, beginning of period | $12.16 | $8.26 | $9.54 | $10.00 |
| Income from Investment Operations | | | | |
| Net investment income (loss)B,C | .08 | .02 | .07 | (.01) |
| Net realized and unrealized gain (loss) | .25 | 4.40 | (1.08) | (.21) |
| Total from investment operations | .33 | 4.42 | (1.01) | (.22) |
| Distributions from net investment income | (.22) | (.09) | (.10) | (.13) |
| Distributions from net realized gain | (.77) | (.42) | (.17) | (.11) |
| Total distributions | (.99) | (.52)D | (.27) | (.24) |
| Net asset value, end of period | $11.50 | $12.16 | $8.26 | $9.54 |
| Total ReturnE,F | 2.21% | 54.21% | (11.14)% | (1.91)% |
| Ratios to Average Net AssetsC,G,H | | | | |
| Expenses before reductions | 1.54% | 1.54% | 1.54% | 1.55%I,J |
| Expenses net of fee waivers, if any | 1.54% | 1.54% | 1.54% | 1.55%I,J |
| Expenses net of all reductions | 1.54% | 1.54% | 1.54% | 1.55%I,J |
| Net investment income (loss) | .63% | .14% | .74% | (.12)%I |
| Supplemental Data | | | | |
| Net assets, end of period (000 omitted) | $2,380 | $1,151 | $261 | $157 |
| Portfolio turnover rateK | 21% | 23% | 27% | 19%I |
A For the period August 31, 2018 (commencement of operations) through March 31, 2019.
B Calculated based on average shares outstanding during the period.
C Net investment income (loss) is affected by the timing of the declaration of dividends by any underlying mutual funds or exchange-traded funds (ETFs). Net investment income (loss) of any such underlying funds is not included in the Fund's net investment income (loss) ratio.
D Total distributions per share do not sum due to rounding.
E Total returns for periods of less than one year are not annualized.
F Total returns do not include the effect of the contingent deferred sales charge.
G Fees and expenses of any underlying mutual funds or exchange-traded funds (ETFs) are not included in the Fund's expense ratio. The Fund indirectly bears its proportionate share of these expenses. For additional expense information related to investments in Fidelity Central Funds, please refer to the "Investments in Fidelity Central Funds" note found in the Notes to Financial Statements section of the most recent Annual or Semi-Annual report.
H Expense ratios reflect operating expenses of the class. Expenses before reductions do not reflect amounts reimbursed, waived, or reduced through arrangements with the investment adviser, brokerage services, or other offset arrangements, if applicable, and do not represent the amount paid by the class during periods when reimbursements, waivers or reductions occur.
I Annualized
J On certain classes, the size and fluctuation of net assets and expense amounts may cause ratios to differ from contractual rates.
K Amount does not include the portfolio activity of any underlying mutual funds or exchange-traded funds (ETFs).
See accompanying notes which are an integral part of the financial statements.
Fidelity Freedom Blend 2045 Fund
| Years ended March 31, | 2022 | 2021 | 2020 | 2019 A |
| Selected Per–Share Data | | | | |
| Net asset value, beginning of period | $12.29 | $8.30 | $9.56 | $10.00 |
| Income from Investment Operations | | | | |
| Net investment income (loss)B,C | .20 | .12 | .16 | .05 |
| Net realized and unrealized gain (loss) | .26 | 4.44 | (1.07) | (.22) |
| Total from investment operations | .46 | 4.56 | (.91) | (.17) |
| Distributions from net investment income | (.31) | (.14) | (.18) | (.16) |
| Distributions from net realized gain | (.77) | (.44) | (.17) | (.11) |
| Total distributions | (1.08) | (.57)D | (.35) | (.27) |
| Net asset value, end of period | $11.67 | $12.29 | $8.30 | $9.56 |
| Total ReturnE | 3.27% | 55.82% | (10.29)% | (1.31)% |
| Ratios to Average Net AssetsC,F,G | | | | |
| Expenses before reductions | .54% | .54% | .56%H | .55%H,I |
| Expenses net of fee waivers, if any | .54% | .54% | .56%H | .55%H,I |
| Expenses net of all reductions | .54% | .54% | .56%H | .55%H,I |
| Net investment income (loss) | 1.63% | 1.14% | 1.72% | .88%I |
| Supplemental Data | | | | |
| Net assets, end of period (000 omitted) | $63,196 | $23,283 | $10,682 | $748 |
| Portfolio turnover rateJ | 21% | 23% | 27% | 19%I |
A For the period August 31, 2018 (commencement of operations) through March 31, 2019.
B Calculated based on average shares outstanding during the period.
C Net investment income (loss) is affected by the timing of the declaration of dividends by any underlying mutual funds or exchange-traded funds (ETFs). Net investment income (loss) of any such underlying funds is not included in the Fund's net investment income (loss) ratio.
D Total distributions per share do not sum due to rounding.
E Total returns for periods of less than one year are not annualized.
F Fees and expenses of any underlying mutual funds or exchange-traded funds (ETFs) are not included in the Fund's expense ratio. The Fund indirectly bears its proportionate share of these expenses. For additional expense information related to investments in Fidelity Central Funds, please refer to the "Investments in Fidelity Central Funds" note found in the Notes to Financial Statements section of the most recent Annual or Semi-Annual report.
G Expense ratios reflect operating expenses of the class. Expenses before reductions do not reflect amounts reimbursed, waived, or reduced through arrangements with the investment adviser, brokerage services, or other offset arrangements, if applicable, and do not represent the amount paid by the class during periods when reimbursements, waivers or reductions occur.
H On certain classes, the size and fluctuation of net assets and expense amounts may cause ratios to differ from contractual rates.
I Annualized
J Amount does not include the portfolio activity of any underlying mutual funds or exchange-traded funds (ETFs).
See accompanying notes which are an integral part of the financial statements.
Fidelity Freedom Blend 2045 Fund Class K
| Years ended March 31, | 2022 | 2021 | 2020 | 2019 A |
| Selected Per–Share Data | | | | |
| Net asset value, beginning of period | $12.30 | $8.30 | $9.56 | $10.00 |
| Income from Investment Operations | | | | |
| Net investment income (loss)B,C | .22 | .13 | .18 | .05 |
| Net realized and unrealized gain (loss) | .25 | 4.45 | (1.07) | (.22) |
| Total from investment operations | .47 | 4.58 | (.89) | (.17) |
| Distributions from net investment income | (.31) | (.15) | (.19) | (.16) |
| Distributions from net realized gain | (.77) | (.43) | (.17) | (.11) |
| Total distributions | (1.08) | (.58) | (.37)D | (.27) |
| Net asset value, end of period | $11.69 | $12.30 | $8.30 | $9.56 |
| Total ReturnE | 3.35% | 56.03% | (10.14)% | (1.35)% |
| Ratios to Average Net AssetsC,F,G | | | | |
| Expenses before reductions | .44% | .44% | .44% | .44%H |
| Expenses net of fee waivers, if any | .44% | .44% | .44% | .44%H |
| Expenses net of all reductions | .44% | .44% | .44% | .44%H |
| Net investment income (loss) | 1.73% | 1.24% | 1.84% | .99%H |
| Supplemental Data | | | | |
| Net assets, end of period (000 omitted) | $24,152 | $20,125 | $13,473 | $99 |
| Portfolio turnover rateI | 21% | 23% | 27% | 19%H |
A For the period August 31, 2018 (commencement of operations) through March 31, 2019.
B Calculated based on average shares outstanding during the period.
C Net investment income (loss) is affected by the timing of the declaration of dividends by any underlying mutual funds or exchange-traded funds (ETFs). Net investment income (loss) of any such underlying funds is not included in the Fund's net investment income (loss) ratio.
D Total distributions per share do not sum due to rounding.
E Total returns for periods of less than one year are not annualized.
F Fees and expenses of any underlying mutual funds or exchange-traded funds (ETFs) are not included in the Fund's expense ratio. The Fund indirectly bears its proportionate share of these expenses. For additional expense information related to investments in Fidelity Central Funds, please refer to the "Investments in Fidelity Central Funds" note found in the Notes to Financial Statements section of the most recent Annual or Semi-Annual report.
G Expense ratios reflect operating expenses of the class. Expenses before reductions do not reflect amounts reimbursed, waived, or reduced through arrangements with the investment adviser, brokerage services, or other offset arrangements, if applicable, and do not represent the amount paid by the class during periods when reimbursements, waivers or reductions occur.
H Annualized
I Amount does not include the portfolio activity of any underlying mutual funds or exchange-traded funds (ETFs).
See accompanying notes which are an integral part of the financial statements.
Fidelity Freedom Blend 2045 Fund Class K6
| Years ended March 31, | 2022 | 2021 | 2020 | 2019 A |
| Selected Per–Share Data | | | | |
| Net asset value, beginning of period | $12.33 | $8.32 | $9.57 | $10.00 |
| Income from Investment Operations | | | | |
| Net investment income (loss)B,C | .23 | .15 | .19 | .06 |
| Net realized and unrealized gain (loss) | .26 | 4.45 | (1.08) | (.22) |
| Total from investment operations | .49 | 4.60 | (.89) | (.16) |
| Distributions from net investment income | (.29) | (.15) | (.18) | (.16) |
| Distributions from net realized gain | (.78) | (.44) | (.17) | (.11) |
| Total distributions | (1.07) | (.59) | (.36)D | (.27) |
| Net asset value, end of period | $11.75 | $12.33 | $8.32 | $9.57 |
| Total ReturnE | 3.51% | 56.12% | (10.10)% | (1.21)% |
| Ratios to Average Net AssetsC,F,G | | | | |
| Expenses before reductions | .34% | .34% | .34% | .35%H,I |
| Expenses net of fee waivers, if any | .34% | .34% | .34% | .35%H,I |
| Expenses net of all reductions | .34% | .34% | .34% | .35%H,I |
| Net investment income (loss) | 1.83% | 1.34% | 1.94% | 1.08%H |
| Supplemental Data | | | | |
| Net assets, end of period (000 omitted) | $445,959 | $828,827 | $435,714 | $8,306 |
| Portfolio turnover rateJ | 21% | 23% | 27% | 19%H |
A For the period August 31, 2018 (commencement of operations) through March 31, 2019.
B Calculated based on average shares outstanding during the period.
C Net investment income (loss) is affected by the timing of the declaration of dividends by any underlying mutual funds or exchange-traded funds (ETFs). Net investment income (loss) of any such underlying funds is not included in the Fund's net investment income (loss) ratio.
D Total distributions per share do not sum due to rounding.
E Total returns for periods of less than one year are not annualized.
F Fees and expenses of any underlying mutual funds or exchange-traded funds (ETFs) are not included in the Fund's expense ratio. The Fund indirectly bears its proportionate share of these expenses. For additional expense information related to investments in Fidelity Central Funds, please refer to the "Investments in Fidelity Central Funds" note found in the Notes to Financial Statements section of the most recent Annual or Semi-Annual report.
G Expense ratios reflect operating expenses of the class. Expenses before reductions do not reflect amounts reimbursed, waived, or reduced through arrangements with the investment adviser, brokerage services, or other offset arrangements, if applicable, and do not represent the amount paid by the class during periods when reimbursements, waivers or reductions occur.
H Annualized
I On certain classes, the size and fluctuation of net assets and expense amounts may cause ratios to differ from contractual rates.
J Amount does not include the portfolio activity of any underlying mutual funds or exchange-traded funds (ETFs).
See accompanying notes which are an integral part of the financial statements.
Fidelity Freedom Blend 2045 Fund Class I
| Years ended March 31, | 2022 | 2021 | 2020 | 2019 A |
| Selected Per–Share Data | | | | |
| Net asset value, beginning of period | $12.28 | $8.30 | $9.56 | $10.00 |
| Income from Investment Operations | | | | |
| Net investment income (loss)B,C | .21 | .12 | .17 | .05 |
| Net realized and unrealized gain (loss) | .25 | 4.44 | (1.07) | (.22) |
| Total from investment operations | .46 | 4.56 | (.90) | (.17) |
| Distributions from net investment income | (.30) | (.14) | (.19) | (.16) |
| Distributions from net realized gain | (.77) | (.44) | (.17) | (.11) |
| Total distributions | (1.07) | (.58) | (.36) | (.27) |
| Net asset value, end of period | $11.67 | $12.28 | $8.30 | $9.56 |
| Total ReturnD | 3.28% | 55.74% | (10.18)% | (1.38)% |
| Ratios to Average Net AssetsC,E,F | | | | |
| Expenses before reductions | .54% | .54% | .55%G | .54%H |
| Expenses net of fee waivers, if any | .54% | .54% | .55%G | .54%H |
| Expenses net of all reductions | .54% | .54% | .55%G | .54%H |
| Net investment income (loss) | 1.63% | 1.14% | 1.74% | .89%H |
| Supplemental Data | | | | |
| Net assets, end of period (000 omitted) | $17,038 | $10,354 | $3,395 | $99 |
| Portfolio turnover rateI | 21% | 23% | 27% | 19%H |
A For the period August 31, 2018 (commencement of operations) through March 31, 2019.
B Calculated based on average shares outstanding during the period.
C Net investment income (loss) is affected by the timing of the declaration of dividends by any underlying mutual funds or exchange-traded funds (ETFs). Net investment income (loss) of any such underlying funds is not included in the Fund's net investment income (loss) ratio.
D Total returns for periods of less than one year are not annualized.
E Fees and expenses of any underlying mutual funds or exchange-traded funds (ETFs) are not included in the Fund's expense ratio. The Fund indirectly bears its proportionate share of these expenses. For additional expense information related to investments in Fidelity Central Funds, please refer to the "Investments in Fidelity Central Funds" note found in the Notes to Financial Statements section of the most recent Annual or Semi-Annual report.
F Expense ratios reflect operating expenses of the class. Expenses before reductions do not reflect amounts reimbursed, waived, or reduced through arrangements with the investment adviser, brokerage services, or other offset arrangements, if applicable, and do not represent the amount paid by the class during periods when reimbursements, waivers or reductions occur.
G On certain classes, the size and fluctuation of net assets and expense amounts may cause ratios to differ from contractual rates.
H Annualized
I Amount does not include the portfolio activity of any underlying mutual funds or exchange-traded funds (ETFs).
See accompanying notes which are an integral part of the financial statements.
Fidelity Freedom Blend 2045 Fund Premier Class
| Years ended March 31, | 2022 A |
| Selected Per–Share Data | |
| Net asset value, beginning of period | $12.60 |
| Income from Investment Operations | |
| Net investment income (loss)B,C | .48 |
| Net realized and unrealized gain (loss) | (.25) |
| Total from investment operations | .23 |
| Distributions from net investment income | (.33) |
| Distributions from net realized gain | (.78) |
| Total distributions | (1.11) |
| Net asset value, end of period | $11.72 |
| Total ReturnD | 1.32% |
| Ratios to Average Net AssetsC,E,F | |
| Expenses before reductions | .29%G |
| Expenses net of fee waivers, if any | .29%G |
| Expenses net of all reductions | .29%G |
| Net investment income (loss) | 3.87%G |
| Supplemental Data | |
| Net assets, end of period (000 omitted) | $625,889 |
| Portfolio turnover rateH | 21% |
A For the period April 6, 2021 (commencement of sale of shares) through March 31, 2022.
B Calculated based on average shares outstanding during the period.
C Net investment income (loss) is affected by the timing of the declaration of dividends by any underlying mutual funds or exchange-traded funds (ETFs). Net investment income (loss) of any such underlying funds is not included in the Fund's net investment income (loss) ratio.
D Total returns for periods of less than one year are not annualized.
E Fees and expenses of any underlying mutual funds or exchange-traded funds (ETFs) are not included in the Fund's expense ratio. The Fund indirectly bears its proportionate share of these expenses. For additional expense information related to investments in Fidelity Central Funds, please refer to the "Investments in Fidelity Central Funds" note found in the Notes to Financial Statements section of the most recent Annual or Semi-Annual report.
F Expense ratios reflect operating expenses of the class. Expenses before reductions do not reflect amounts reimbursed, waived, or reduced through arrangements with the investment adviser, brokerage services, or other offset arrangements, if applicable, and do not represent the amount paid by the class during periods when reimbursements, waivers or reductions occur.
G Annualized
H Amount does not include the portfolio activity of any underlying mutual funds or exchange-traded funds (ETFs).
See accompanying notes which are an integral part of the financial statements.
Fidelity Freedom Blend 2045 Fund Class Z
| Years ended March 31, | 2022 | 2021 | 2020 | 2019 A |
| Selected Per–Share Data | | | | |
| Net asset value, beginning of period | $12.33 | $8.32 | $9.56 | $10.00 |
| Income from Investment Operations | | | | |
| Net investment income (loss)B,C | .22 | .13 | .18 | .05 |
| Net realized and unrealized gain (loss) | .25 | 4.46 | (1.08) | (.22) |
| Total from investment operations | .47 | 4.59 | (.90) | (.17) |
| Distributions from net investment income | (.31) | (.14) | (.17) | (.16) |
| Distributions from net realized gain | (.79) | (.43) | (.17) | (.11) |
| Total distributions | (1.09)D | (.58)D | (.34) | (.27) |
| Net asset value, end of period | $11.71 | $12.33 | $8.32 | $9.56 |
| Total ReturnE | 3.37% | 55.96% | (10.10)% | (1.35)% |
| Ratios to Average Net AssetsC,F,G | | | | |
| Expenses before reductions | .44% | .44% | .44% | .44%H |
| Expenses net of fee waivers, if any | .44% | .44% | .44% | .44%H |
| Expenses net of all reductions | .44% | .44% | .44% | .44%H |
| Net investment income (loss) | 1.73% | 1.24% | 1.84% | .99%H |
| Supplemental Data | | | | |
| Net assets, end of period (000 omitted) | $2,779 | $329 | $92 | $99 |
| Portfolio turnover rateI | 21% | 23% | 27% | 19%H |
A For the period August 31, 2018 (commencement of operations) through March 31, 2019.
B Calculated based on average shares outstanding during the period.
C Net investment income (loss) is affected by the timing of the declaration of dividends by any underlying mutual funds or exchange-traded funds (ETFs). Net investment income (loss) of any such underlying funds is not included in the Fund's net investment income (loss) ratio.
D Total distributions per share do not sum due to rounding.
E Total returns for periods of less than one year are not annualized.
F Fees and expenses of any underlying mutual funds or exchange-traded funds (ETFs) are not included in the Fund's expense ratio. The Fund indirectly bears its proportionate share of these expenses. For additional expense information related to investments in Fidelity Central Funds, please refer to the "Investments in Fidelity Central Funds" note found in the Notes to Financial Statements section of the most recent Annual or Semi-Annual report.
G Expense ratios reflect operating expenses of the class. Expenses before reductions do not reflect amounts reimbursed, waived, or reduced through arrangements with the investment adviser, brokerage services, or other offset arrangements, if applicable, and do not represent the amount paid by the class during periods when reimbursements, waivers or reductions occur.
H Annualized
I Amount does not include the portfolio activity of any underlying mutual funds or exchange-traded funds (ETFs).
See accompanying notes which are an integral part of the financial statements.
Fidelity Freedom Blend 2045 Fund Class Z6
| Years ended March 31, | 2022 | 2021 | 2020 | 2019 A |
| Selected Per–Share Data | | | | |
| Net asset value, beginning of period | $12.32 | $8.32 | $9.57 | $10.00 |
| Income from Investment Operations | | | | |
| Net investment income (loss)B,C | .23 | .15 | .18 | .06 |
| Net realized and unrealized gain (loss) | .26 | 4.45 | (1.07) | (.22) |
| Total from investment operations | .49 | 4.60 | (.89) | (.16) |
| Distributions from net investment income | (.32) | (.16) | (.19) | (.16) |
| Distributions from net realized gain | (.78) | (.44) | (.17) | (.11) |
| Total distributions | (1.10) | (.60) | (.36) | (.27) |
| Net asset value, end of period | $11.71 | $12.32 | $8.32 | $9.57 |
| Total ReturnD | 3.50% | 56.16% | (10.10)% | (1.21)% |
| Ratios to Average Net AssetsC,E,F | | | | |
| Expenses before reductions | .34% | .34% | .35%G | .34%H |
| Expenses net of fee waivers, if any | .34% | .34% | .35%G | .34%H |
| Expenses net of all reductions | .34% | .34% | .35%G | .34%H |
| Net investment income (loss) | 1.83% | 1.34% | 1.94% | 1.09%H |
| Supplemental Data | | | | |
| Net assets, end of period (000 omitted) | $72,838 | $4,223 | $1,108 | $99 |
| Portfolio turnover rateI | 21% | 23% | 27% | 19%H |
A For the period August 31, 2018 (commencement of operations) through March 31, 2019.
B Calculated based on average shares outstanding during the period.
C Net investment income (loss) is affected by the timing of the declaration of dividends by any underlying mutual funds or exchange-traded funds (ETFs). Net investment income (loss) of any such underlying funds is not included in the Fund's net investment income (loss) ratio.
D Total returns for periods of less than one year are not annualized.
E Fees and expenses of any underlying mutual funds or exchange-traded funds (ETFs) are not included in the Fund's expense ratio. The Fund indirectly bears its proportionate share of these expenses. For additional expense information related to investments in Fidelity Central Funds, please refer to the "Investments in Fidelity Central Funds" note found in the Notes to Financial Statements section of the most recent Annual or Semi-Annual report.
F Expense ratios reflect operating expenses of the class. Expenses before reductions do not reflect amounts reimbursed, waived, or reduced through arrangements with the investment adviser, brokerage services, or other offset arrangements, if applicable, and do not represent the amount paid by the class during periods when reimbursements, waivers or reductions occur.
G On certain classes, the size and fluctuation of net assets and expense amounts may cause ratios to differ from contractual rates.
H Annualized
I Amount does not include the portfolio activity of any underlying mutual funds or exchange-traded funds (ETFs).
See accompanying notes which are an integral part of the financial statements.
Fidelity Freedom® Blend 2050 Fund
Investment Summary (Unaudited)
The information in the following tables is based on the direct investments of the Fund.
Top Holdings as of March 31, 2022
| | % of fund's net assets |
| Fidelity Series Large Cap Value Index Fund | 14.5 |
| Fidelity Series Emerging Markets Opportunities Fund | 12.7 |
| Fidelity Series Blue Chip Growth Fund | 10.8 |
| Fidelity Series Large Cap Stock Fund | 7.6 |
| Fidelity Series Large Cap Growth Index Fund | 6.8 |
| Fidelity Series International Value Fund | 6.6 |
| Fidelity Series Overseas Fund | 6.6 |
| Fidelity Series International Growth Fund | 6.5 |
| Fidelity Series Value Discovery Fund | 5.4 |
| Fidelity Series Long-Term Treasury Bond Index Fund | 5.4 |
| | 82.9 |
Asset Allocation (% of fund's net assets)
| Period end |
| | Domestic Equity Funds | 50.3% |
| | International Equity Funds | 41.9% |
| | Bond Funds | 7.7% |
| | Short-Term Investments | 0.1% |

Percentages are adjusted for the effect of futures contracts and swaps, if applicable.
Domestic Equity Funds category includes Fidelity Series Commodity Strategy Fund which invests in commodity-related investments.
Fidelity Freedom® Blend 2050 Fund
Schedule of Investments March 31, 2022
Showing Percentage of Net Assets
| U.S. Treasury Obligations - 0.1% | | | |
| | | Principal Amount | Value |
| U.S. Treasury Bills, yield at date of purchase 0.12% to 0.5% 4/14/22 to 6/23/22 (a) | | | |
| (Cost $709,741) | | 710,000 | 709,775 |
| | | Shares | Value |
|
| Domestic Equity Funds - 50.3% | | | |
| Fidelity Series Blue Chip Growth Fund (b) | | 7,968,578 | $114,508,461 |
| Fidelity Series Commodity Strategy Fund (b) | | 3,068,727 | 15,681,196 |
| Fidelity Series Large Cap Growth Index Fund (b) | | 4,100,017 | 72,160,302 |
| Fidelity Series Large Cap Stock Fund (b) | | 4,234,497 | 80,497,782 |
| Fidelity Series Large Cap Value Index Fund (b) | | 10,032,264 | 154,095,566 |
| Fidelity Series Small Cap Opportunities Fund (b) | | 2,843,314 | 38,725,938 |
| Fidelity Series Value Discovery Fund (b) | | 3,560,709 | 56,971,338 |
| TOTAL DOMESTIC EQUITY FUNDS | | | |
| (Cost $473,202,025) | | | 532,640,583 |
|
| International Equity Funds - 41.9% | | | |
| Fidelity Series Canada Fund (b) | | 2,229,214 | 34,597,406 |
| Fidelity Series Emerging Markets Fund (b) | | 1,576,417 | 14,629,146 |
| Fidelity Series Emerging Markets Opportunities Fund (b) | | 7,321,092 | 134,708,093 |
| Fidelity Series International Growth Fund (b) | | 4,174,976 | 69,221,096 |
| Fidelity Series International Index Fund (b) | | 2,568,518 | 29,383,849 |
| Fidelity Series International Small Cap Fund (b) | | 1,202,421 | 21,583,450 |
| Fidelity Series International Value Fund (b) | | 6,337,289 | 69,900,297 |
| Fidelity Series Overseas Fund (b) | | 5,514,910 | 69,598,166 |
| TOTAL INTERNATIONAL EQUITY FUNDS | | | |
| (Cost $441,752,679) | | | 443,621,503 |
|
| Bond Funds - 7.7% | | | |
| Fidelity Series 5+ Year Inflation-Protected Bond Index Fund (b) | | 110,551 | 1,061,285 |
| Fidelity Series Corporate Bond Fund (b) | | 112,737 | 1,138,644 |
| Fidelity Series Emerging Markets Debt Fund (b) | | 626,537 | 5,168,930 |
| Fidelity Series Emerging Markets Debt Local Currency Fund (b) | | 194,052 | 1,748,411 |
| Fidelity Series Floating Rate High Income Fund (b) | | 115,034 | 1,057,166 |
| Fidelity Series Government Bond Index Fund (b) | | 167,072 | 1,667,383 |
| Fidelity Series High Income Fund (b) | | 706,478 | 6,421,886 |
| Fidelity Series Investment Grade Bond Fund (b) | | 161,389 | 1,760,754 |
| Fidelity Series Investment Grade Securitized Fund (b) | | 121,395 | 1,179,957 |
| Fidelity Series Long-Term Treasury Bond Index Fund (b) | | 7,457,084 | 56,822,979 |
| Fidelity Series Real Estate Income Fund (b) | | 332,953 | 3,782,343 |
| TOTAL BOND FUNDS | | | |
| (Cost $87,733,910) | | | 81,809,738 |
|
| Short-Term Funds - 0.0% | | | |
| Fidelity Cash Central Fund 0.31% (c) | | | |
| (Cost $439,721) | | 439,633 | 439,721 |
| TOTAL INVESTMENT IN SECURITIES - 100.0% | | | |
| (Cost $1,003,838,076) | | | 1,059,221,320 |
| NET OTHER ASSETS (LIABILITIES) - 0.0% | | | (53,063) |
| NET ASSETS - 100% | | | $1,059,168,257 |
| Futures Contracts | | | | | |
| | Number of contracts | Expiration Date | Notional Amount | Value | Unrealized Appreciation/(Depreciation) |
| Purchased | | | | | |
| Equity Index Contracts | | | | | |
| ICE E-mini MSCI EAFE Index Contracts (United States) | 21 | June 2022 | $2,251,620 | $127,999 | $127,999 |
| ICE E-mini MSCI Emerging Markets Index Contracts (United States) | 74 | June 2022 | 4,164,350 | 124,162 | 124,162 |
| Sold | | | | | |
| Equity Index Contracts | | | | | |
| CME Micro E-mini S&P 500 Index Contracts (United States) | 20 | June 2022 | 4,530,750 | (261,591) | (261,591) |
| TOTAL FUTURES CONTRACTS | | | | | $(9,430) |
The notional amount of futures purchased as a percentage of Net Assets is 0.6%
The notional amount of futures sold as a percentage of Net Assets is 0.4%
Legend
(a) Security or a portion of the security was pledged to cover margin requirements for futures contracts. At period end, the value of securities pledged amounted to $708,776.
(b) Affiliated Fund
(c) Affiliated fund that is generally available only to investment companies and other accounts managed by Fidelity Investments. The rate quoted is the annualized seven-day yield of the fund at period end. A complete unaudited listing of the fund's holdings as of its most recent quarter end is available upon request. In addition, each Fidelity Central Fund's financial statements, which are not covered by the Fund's Report of Independent Registered Public Accounting Firm, are available on the SEC's website or upon request.
Affiliated Central Funds
Fiscal year to date information regarding the Fund's investments in Fidelity Central Funds, including the ownership percentage, is presented below.
| Fund | Value, beginning of period | Purchases | Sales Proceeds | Dividend Income | Realized Gain/Loss | Change in Unrealized appreciation (depreciation) | Value, end of period | % ownership, end of period |
| Fidelity Cash Central Fund 0.31% | $49 | $2,147,575 | $1,707,903 | $159 | $-- | $-- | $439,721 | 0.0% |
| Total | $49 | $2,147,575 | $1,707,903 | $159 | $-- | $-- | $439,721 | |
Amounts in the income column in the above table include any capital gain distributions from underlying funds, which are presented in the corresponding line-item in the Statement of Operations, if applicable.
Affiliated Underlying Funds
Fiscal year to date information regarding the Fund's investments in affiliated Underlying Funds is presented below. Exchanges between classes of the same affiliated Underlying Funds may occur. If an underlying Fund changes its name, the name presented below is the name in effect at period end.
| Affiliate | Value, beginning of period | Purchases(a) | Sales Proceeds(a) | Dividend Income | Realized Gain (loss) | Change in Unrealized appreciation (depreciation) | Value, end of period |
| Fidelity Series 0-5 Year Inflation-Protected Bond Index Fund | $-- | $4,630,753 | $4,613,705 | $14,148 | $(14,942) | $-- | $-- |
| Fidelity Series 5+ Year Inflation-Protected Bond Index Fund | -- | 9,484,247 | 8,080,776 | 46,120 | (312,791) | (29,395) | 1,061,285 |
| Fidelity Series Blue Chip Growth Fund | 80,914,353 | 76,695,046 | 23,221,524 | 21,904,299 | (878,980) | (19,000,434) | 114,508,461 |
| Fidelity Series Canada Fund | 17,794,580 | 14,930,243 | 3,003,088 | 645,615 | (40,517) | 4,916,188 | 34,597,406 |
| Fidelity Series Commodity Strategy Fund | 20,416,512 | 16,963,186 | 22,538,828 | 8,094,574 | (717,108) | 1,557,434 | 15,681,196 |
| Fidelity Series Corporate Bond Fund | 80,602 | 1,669,207 | 591,249 | 5,567 | (16,017) | (3,899) | 1,138,644 |
| Fidelity Series Emerging Markets Debt Fund | 4,023,620 | 2,381,987 | 700,111 | 231,191 | (28,858) | (507,708) | 5,168,930 |
| Fidelity Series Emerging Markets Debt Local Currency Fund | 1,344,896 | 808,516 | 205,091 | 69,028 | (17,721) | (182,189) | 1,748,411 |
| Fidelity Series Emerging Markets Fund | 11,700,406 | 7,647,243 | 1,367,971 | 480,531 | (37,190) | (3,313,342) | 14,629,146 |
| Fidelity Series Emerging Markets Opportunities Fund | 105,187,298 | 85,641,137 | 13,062,513 | 15,112,589 | (388,196) | (42,669,633) | 134,708,093 |
| Fidelity Series Floating Rate High Income Fund | 810,590 | 476,716 | 229,002 | 43,171 | (545) | (593) | 1,057,166 |
| Fidelity Series Government Bond Index Fund | 98,867 | 2,621,467 | 1,031,481 | 2,681 | (18,431) | (3,039) | 1,667,383 |
| Fidelity Series Government Money Market Fund 0.31% | 1,906,155 | 325,129 | 2,231,284 | 391 | -- | -- | -- |
| Fidelity Series High Income Fund | 4,669,173 | 2,956,997 | 985,564 | 317,250 | (19,230) | (199,490) | 6,421,886 |
| Fidelity Series Inflation-Protected Bond Index Fund | 14,695,662 | 5,270,989 | 20,584,223 | 206,210 | 1,232,879 | (615,307) | -- |
| Fidelity Series International Growth Fund | 43,843,148 | 36,633,883 | 4,049,892 | 5,231,259 | 36,897 | (7,242,940) | 69,221,096 |
| Fidelity Series International Index Fund | 18,271,049 | 13,622,444 | 1,381,347 | 694,494 | (60,426) | (1,067,871) | 29,383,849 |
| Fidelity Series International Small Cap Fund | 15,675,110 | 10,319,995 | 775,616 | 2,712,446 | (23,177) | (3,612,862) | 21,583,450 |
| Fidelity Series International Value Fund | 43,744,401 | 34,273,200 | 8,373,846 | 3,284,577 | (164,258) | 420,800 | 69,900,297 |
| Fidelity Series Investment Grade Bond Fund | 110,871 | 2,832,703 | 1,160,099 | 7,041 | (19,036) | (3,685) | 1,760,754 |
| Fidelity Series Investment Grade Securitized Fund | 77,287 | 1,689,824 | 575,896 | 2,152 | (8,433) | (2,825) | 1,179,957 |
| Fidelity Series Large Cap Growth Index Fund | 51,079,832 | 31,830,212 | 16,961,390 | 2,081,145 | 17,748 | 6,193,900 | 72,160,302 |
| Fidelity Series Large Cap Stock Fund | 55,797,787 | 35,692,073 | 12,363,482 | 6,550,492 | (348,356) | 1,719,760 | 80,497,782 |
| Fidelity Series Large Cap Value Index Fund | 106,585,865 | 65,905,815 | 23,048,695 | 9,733,470 | (437,791) | 5,090,372 | 154,095,566 |
| Fidelity Series Long-Term Treasury Bond Index Fund | 20,129,746 | 43,529,103 | 3,952,027 | 771,283 | (429,725) | (2,454,118) | 56,822,979 |
| Fidelity Series Overseas Fund | 43,835,536 | 32,510,405 | 4,731,339 | 1,935,243 | 8,054 | (2,024,490) | 69,598,166 |
| Fidelity Series Real Estate Income Fund | 2,797,229 | 1,501,419 | 579,286 | 144,149 | (7,754) | 70,735 | 3,782,343 |
| Fidelity Series Short-Term Credit Fund | 940,434 | 231,823 | 1,171,893 | 4,948 | 11,408 | (11,772) | -- |
| Fidelity Series Small Cap Opportunities Fund | 26,948,239 | 24,758,147 | 4,624,012 | 8,856,358 | (406,153) | (7,950,283) | 38,725,938 |
| Fidelity Series Treasury Bill Index Fund | 3,028,772 | 782,693 | 3,811,465 | 612 | 524 | (524) | -- |
| Fidelity Series Value Discovery Fund | 39,382,723 | 27,087,285 | 9,037,223 | 6,276,801 | (206,618) | (254,829) | 56,971,338 |
| Total | $735,890,743 | $595,703,887 | $199,043,918 | $95,459,835 | $(3,294,743) | $(71,182,039) | $1,058,071,824 |
(a) Includes the value of shares purchased or redeemed through in-kind transactions, if applicable.
Amounts in the income column in the above table include any capital gain distributions from underlying funds, which are presented in the corresponding line-item in the Statement of Operations, if applicable.
Investment Valuation
The following is a summary of the inputs used, as of March 31, 2022, involving the Fund's assets and liabilities carried at fair value. The inputs or methodology used for valuing securities may not be an indication of the risk associated with investing in those securities. For more information on valuation inputs, and their aggregation into the levels used below, please refer to the Investment Valuation section in the accompanying Notes to Financial Statements.
| | Valuation Inputs at Reporting Date: |
| Description | Total | Level 1 | Level 2 | Level 3 |
| Investments in Securities: | | | | |
| Other Short-Term Investments and Net Other Assets | $709,775 | $-- | $709,775 | $-- |
| Domestic Equity Funds | 532,640,583 | 532,640,583 | -- | -- |
| International Equity Funds | 443,621,503 | 443,621,503 | -- | -- |
| Bond Funds | 81,809,738 | 81,809,738 | -- | -- |
| Short-Term Funds | 439,721 | 439,721 | -- | -- |
| Total Investments in Securities: | $1,059,221,320 | $1,058,511,545 | $709,775 | $-- |
| Derivative Instruments: | | | | |
| Assets | | | | |
| Futures Contracts | $252,161 | $252,161 | $-- | $-- |
| Total Assets | $252,161 | $252,161 | $-- | $-- |
| Liabilities | | | | |
| Futures Contracts | $(261,591) | $(261,591) | $-- | $-- |
| Total Liabilities | $(261,591) | $(261,591) | $-- | $-- |
| Total Derivative Instruments: | $(9,430) | $(9,430) | $-- | $-- |
Value of Derivative Instruments
The following table is a summary of the Fund's value of derivative instruments by primary risk exposure as of March 31, 2022. For additional information on derivative instruments, please refer to the Derivative Instruments section in the accompanying Notes to Financial Statements.
| Primary Risk Exposure / Derivative Type | Value |
| | Asset | Liability |
| Equity Risk | | |
| Futures Contracts(a) | $252,161 | $(261,591) |
| Total Equity Risk | 252,161 | (261,591) |
| Total Value of Derivatives | $252,161 | $(261,591) |
(a) Reflects gross cumulative appreciation (depreciation) on futures contracts as presented in the Schedule of Investments. In the Statement of Assets and Liabilities, the period end daily variation margin is included in receivable or payable for daily variation margin on futures contracts, and the net cumulative appreciation (depreciation) is included in Total accumulated earnings (loss).
See accompanying notes which are an integral part of the financial statements.
Fidelity Freedom® Blend 2050 Fund
Financial Statements
Statement of Assets and Liabilities
| | | March 31, 2022 |
| Assets | | |
Investment in securities, at value — See accompanying schedule:
Unaffiliated issuers (cost $709,741) | $709,775 | |
| Fidelity Central Funds (cost $439,721) | 439,721 | |
| Other affiliated issuers (cost $1,002,688,614) | 1,058,071,824 | |
| Total Investment in Securities (cost $1,003,838,076) | | $1,059,221,320 |
| Cash | | 8,086 |
| Receivable for investments sold | | 20,496,666 |
| Receivable for fund shares sold | | 1,765,165 |
| Distributions receivable from Fidelity Central Funds | | 85 |
| Receivable for daily variation margin on futures contracts | | 10,947 |
| Total assets | | 1,081,502,269 |
| Liabilities | | |
| Payable for investments purchased | $20,733,648 | |
| Payable for fund shares redeemed | 1,255,511 | |
| Accrued management fee | 285,051 | |
| Distribution and service plan fees payable | 2,456 | |
| Payable for daily variation margin on futures contracts | 57,346 | |
| Total liabilities | | 22,334,012 |
| Net Assets | | $1,059,168,257 |
| Net Assets consist of: | | |
| Paid in capital | | $980,827,519 |
| Total accumulated earnings (loss) | | 78,340,738 |
| Net Assets | | $1,059,168,257 |
| Net Asset Value and Maximum Offering Price | | |
| Class A: | | |
| Net Asset Value and redemption price per share ($4,292,005 ÷ 368,917 shares)(a) | | $11.63 |
| Maximum offering price per share (100/94.25 of $11.63) | | $12.34 |
| Class M: | | |
| Net Asset Value and redemption price per share ($964,979 ÷ 83,225 shares)(a) | | $11.59 |
| Maximum offering price per share (100/96.50 of $11.59) | | $12.01 |
| Class C: | | |
| Net Asset Value and offering price per share ($1,539,514 ÷ 134,042 shares)(a) | | $11.49 |
| Fidelity Freedom Blend 2050 Fund: | | |
| Net Asset Value, offering price and redemption price per share ($61,158,425 ÷ 5,250,327 shares) | | $11.65 |
| Class K: | | |
| Net Asset Value, offering price and redemption price per share ($15,640,244 ÷ 1,339,599 shares) | | $11.68 |
| Class K6: | | |
| Net Asset Value, offering price and redemption price per share ($417,396,739 ÷ 35,601,667 shares) | | $11.72 |
| Class I: | | |
| Net Asset Value, offering price and redemption price per share ($15,494,257 ÷ 1,329,440 shares) | | $11.65 |
| Class Z: | | |
| Net Asset Value, offering price and redemption price per share ($2,142,261 ÷ 183,134 shares) | | $11.70 |
| Class Z6: | | |
| Net Asset Value, offering price and redemption price per share ($56,381,968 ÷ 4,821,925 shares) | | $11.69 |
| Premier Class: | | |
| Net Asset Value, offering price and redemption price per share ($484,157,865 ÷ 41,393,124 shares) | | $11.70 |
(a) Redemption price per share is equal to net asset value less any applicable contingent deferred sales charge.
See accompanying notes which are an integral part of the financial statements.
Statement of Operations
| | | Year ended March 31, 2022 |
| Investment Income | | |
| Dividends: | | |
| Affiliated issuers | | $27,506,385 |
| Interest | | 193 |
| Income from Fidelity Central Funds | | 159 |
| Total income | | 27,506,737 |
| Expenses | | |
| Management fee | $3,192,154 | |
| Distribution and service plan fees | 25,705 | |
| Independent trustees' fees and expenses | 2,709 | |
| Total expenses | | 3,220,568 |
| Net investment income (loss) | | 24,286,169 |
| Realized and Unrealized Gain (Loss) | | |
| Net realized gain (loss) on: | | |
| Investment securities: | | |
| Affiliated issuers | (3,294,743) | |
| Futures contracts | (440,328) | |
| Capital gain distributions from underlying funds: | | |
| Affiliated issuers | 67,953,450 | |
| Total net realized gain (loss) | | 64,218,379 |
| Change in net unrealized appreciation (depreciation) on: | | |
| Investment securities: | | |
| Unaffiliated issuers | 34 | |
| Affiliated issuers | (71,182,039) | |
| Futures contracts | (9,430) | |
| Total change in net unrealized appreciation (depreciation) | | (71,191,435) |
| Net gain (loss) | | (6,973,056) |
| Net increase (decrease) in net assets resulting from operations | | $17,313,113 |
See accompanying notes which are an integral part of the financial statements.
Statement of Changes in Net Assets
| | Year ended March 31, 2022 | Year ended March 31, 2021 |
| Increase (Decrease) in Net Assets | | |
| Operations | | |
| Net investment income (loss) | $24,286,169 | $7,540,898 |
| Net realized gain (loss) | 64,218,379 | 33,853,518 |
| Change in net unrealized appreciation (depreciation) | (71,191,435) | 192,339,587 |
| Net increase (decrease) in net assets resulting from operations | 17,313,113 | 233,734,003 |
| Distributions to shareholders | (79,892,800) | (29,570,711) |
| Share transactions - net increase (decrease) | 386,065,047 | 162,933,188 |
| Total increase (decrease) in net assets | 323,485,360 | 367,096,480 |
| Net Assets | | |
| Beginning of period | 735,682,897 | 368,586,417 |
| End of period | $1,059,168,257 | $735,682,897 |
See accompanying notes which are an integral part of the financial statements.
Financial Highlights
Fidelity Freedom Blend 2050 Fund Class A
| Years ended March 31, | 2022 | 2021 | 2020 | 2019 A |
| Selected Per–Share Data | | | | |
| Net asset value, beginning of period | $12.24 | $8.26 | $9.51 | $10.00 |
| Income from Investment Operations | | | | |
| Net investment income (loss)B,C | .18 | .10 | .15 | .02 |
| Net realized and unrealized gain (loss) | .24 | 4.42 | (1.08) | (.21) |
| Total from investment operations | .42 | 4.52 | (.93) | (.19) |
| Distributions from net investment income | (.28) | (.12) | (.16) | (.14) |
| Distributions from net realized gain | (.75) | (.41) | (.16) | (.16) |
| Total distributions | (1.03) | (.54)D | (.32) | (.30) |
| Net asset value, end of period | $11.63 | $12.24 | $8.26 | $9.51 |
| Total ReturnE,F | 2.97% | 55.43% | (10.48)% | (1.50)% |
| Ratios to Average Net AssetsC,G,H | | | | |
| Expenses before reductions | .79% | .79% | .79% | .79%I |
| Expenses net of fee waivers, if any | .79% | .79% | .79% | .79%I |
| Expenses net of all reductions | .79% | .79% | .79% | .79%I |
| Net investment income (loss) | 1.47% | .90% | 1.51% | .31%I |
| Supplemental Data | | | | |
| Net assets, end of period (000 omitted) | $4,292 | $2,103 | $644 | $239 |
| Portfolio turnover rateJ | 21% | 21% | 26% | 12%I |
A For the period August 31, 2018 (commencement of operations) through March 31, 2019.
B Calculated based on average shares outstanding during the period.
C Net investment income (loss) is affected by the timing of the declaration of dividends by any underlying mutual funds or exchange-traded funds (ETFs). Net investment income (loss) of any such underlying funds is not included in the Fund's net investment income (loss) ratio.
D Total distributions per share do not sum due to rounding.
E Total returns for periods of less than one year are not annualized.
F Total returns do not include the effect of the sales charges.
G Fees and expenses of any underlying mutual funds or exchange-traded funds (ETFs) are not included in the Fund's expense ratio. The Fund indirectly bears its proportionate share of these expenses. For additional expense information related to investments in Fidelity Central Funds, please refer to the "Investments in Fidelity Central Funds" note found in the Notes to Financial Statements section of the most recent Annual or Semi-Annual report.
H Expense ratios reflect operating expenses of the class. Expenses before reductions do not reflect amounts reimbursed, waived, or reduced through arrangements with the investment adviser, brokerage services, or other offset arrangements, if applicable, and do not represent the amount paid by the class during periods when reimbursements, waivers or reductions occur.
I Annualized
J Amount does not include the portfolio activity of any underlying mutual funds or exchange-traded funds (ETFs).
See accompanying notes which are an integral part of the financial statements.
Fidelity Freedom Blend 2050 Fund Class M
| Years ended March 31, | 2022 | 2021 | 2020 | 2019 A |
| Selected Per–Share Data | | | | |
| Net asset value, beginning of period | $12.20 | $8.24 | $9.51 | $10.00 |
| Income from Investment Operations | | | | |
| Net investment income (loss)B,C | .15 | .07 | .12 | –D |
| Net realized and unrealized gain (loss) | .25 | 4.40 | (1.08) | (.20) |
| Total from investment operations | .40 | 4.47 | (.96) | (.20) |
| Distributions from net investment income | (.25) | (.10) | (.14) | (.13) |
| Distributions from net realized gain | (.75) | (.41) | (.16) | (.16) |
| Total distributions | (1.01)E | (.51) | (.31)E | (.29) |
| Net asset value, end of period | $11.59 | $12.20 | $8.24 | $9.51 |
| Total ReturnF,G | 2.77% | 55.03% | (10.80)% | (1.60)% |
| Ratios to Average Net AssetsC,H,I | | | | |
| Expenses before reductions | 1.04% | 1.04% | 1.04% | 1.04%J |
| Expenses net of fee waivers, if any | 1.04% | 1.04% | 1.04% | 1.04%J |
| Expenses net of all reductions | 1.04% | 1.04% | 1.04% | 1.04%J |
| Net investment income (loss) | 1.22% | .65% | 1.26% | .07%J |
| Supplemental Data | | | | |
| Net assets, end of period (000 omitted) | $965 | $686 | $298 | $99 |
| Portfolio turnover rateK | 21% | 21% | 26% | 12%J |
A For the period August 31, 2018 (commencement of operations) through March 31, 2019.
B Calculated based on average shares outstanding during the period.
C Net investment income (loss) is affected by the timing of the declaration of dividends by any underlying mutual funds or exchange-traded funds (ETFs). Net investment income (loss) of any such underlying funds is not included in the Fund's net investment income (loss) ratio.
D Amount represents less than $.005 per share.
E Total distributions per share do not sum due to rounding.
F Total returns for periods of less than one year are not annualized.
G Total returns do not include the effect of the sales charges.
H Fees and expenses of any underlying mutual funds or exchange-traded funds (ETFs) are not included in the Fund's expense ratio. The Fund indirectly bears its proportionate share of these expenses. For additional expense information related to investments in Fidelity Central Funds, please refer to the "Investments in Fidelity Central Funds" note found in the Notes to Financial Statements section of the most recent Annual or Semi-Annual report.
I Expense ratios reflect operating expenses of the class. Expenses before reductions do not reflect amounts reimbursed, waived, or reduced through arrangements with the investment adviser, brokerage services, or other offset arrangements, if applicable, and do not represent the amount paid by the class during periods when reimbursements, waivers or reductions occur.
J Annualized
K Amount does not include the portfolio activity of any underlying mutual funds or exchange-traded funds (ETFs).
See accompanying notes which are an integral part of the financial statements.
Fidelity Freedom Blend 2050 Fund Class C
| Years ended March 31, | 2022 | 2021 | 2020 | 2019 A |
| Selected Per–Share Data | | | | |
| Net asset value, beginning of period | $12.12 | $8.21 | $9.50 | $10.00 |
| Income from Investment Operations | | | | |
| Net investment income (loss)B,C | .09 | .02 | .07 | (.02) |
| Net realized and unrealized gain (loss) | .25 | 4.37 | (1.08) | (.20) |
| Total from investment operations | .34 | 4.39 | (1.01) | (.22) |
| Distributions from net investment income | (.22) | (.07) | (.12) | (.12) |
| Distributions from net realized gain | (.75) | (.41) | (.16) | (.16) |
| Total distributions | (.97) | (.48) | (.28) | (.28) |
| Net asset value, end of period | $11.49 | $12.12 | $8.21 | $9.50 |
| Total ReturnD,E,F | 2.35% | 54.21% | (11.22)% | (1.89)% |
| Ratios to Average Net AssetsC,G,H | | | | |
| Expenses before reductions | 1.54% | 1.54% | 1.54% | 1.54%I |
| Expenses net of fee waivers, if any | 1.54% | 1.54% | 1.54% | 1.54%I |
| Expenses net of all reductions | 1.54% | 1.54% | 1.54% | 1.54%I |
| Net investment income (loss) | .72% | .15% | .76% | (.43)%I |
| Supplemental Data | | | | |
| Net assets, end of period (000 omitted) | $1,540 | $978 | $449 | $137 |
| Portfolio turnover rateJ | 21% | 21% | 26% | 12%I |
A For the period August 31, 2018 (commencement of operations) through March 31, 2019.
B Calculated based on average shares outstanding during the period.
C Net investment income (loss) is affected by the timing of the declaration of dividends by any underlying mutual funds or exchange-traded funds (ETFs). Net investment income (loss) of any such underlying funds is not included in the Fund's net investment income (loss) ratio.
D Total returns for periods of less than one year are not annualized.
E Total returns would have been lower if certain expenses had not been reduced during the applicable periods shown.
F Total returns do not include the effect of the contingent deferred sales charge.
G Fees and expenses of any underlying mutual funds or exchange-traded funds (ETFs) are not included in the Fund's expense ratio. The Fund indirectly bears its proportionate share of these expenses. For additional expense information related to investments in Fidelity Central Funds, please refer to the "Investments in Fidelity Central Funds" note found in the Notes to Financial Statements section of the most recent Annual or Semi-Annual report.
H Expense ratios reflect operating expenses of the class. Expenses before reductions do not reflect amounts reimbursed, waived, or reduced through arrangements with the investment adviser, brokerage services, or other offset arrangements, if applicable, and do not represent the amount paid by the class during periods when reimbursements, waivers or reductions occur.
I Annualized
J Amount does not include the portfolio activity of any underlying mutual funds or exchange-traded funds (ETFs).
See accompanying notes which are an integral part of the financial statements.
Fidelity Freedom Blend 2050 Fund
| Years ended March 31, | 2022 | 2021 | 2020 | 2019 A |
| Selected Per–Share Data | | | | |
| Net asset value, beginning of period | $12.25 | $8.26 | $9.51 | $10.00 |
| Income from Investment Operations | | | | |
| Net investment income (loss)B,C | .21 | .13 | .16 | .03 |
| Net realized and unrealized gain (loss) | .25 | 4.42 | (1.07) | (.21) |
| Total from investment operations | .46 | 4.55 | (.91) | (.18) |
| Distributions from net investment income | (.30) | (.14) | (.18) | (.15) |
| Distributions from net realized gain | (.76) | (.42) | (.16) | (.16) |
| Total distributions | (1.06) | (.56) | (.34) | (.31) |
| Net asset value, end of period | $11.65 | $12.25 | $8.26 | $9.51 |
| Total ReturnD | 3.30% | 55.91% | (10.29)% | (1.39)% |
| Ratios to Average Net AssetsC,E,F | | | | |
| Expenses before reductions | .54% | .54% | .56%G | .54%H |
| Expenses net of fee waivers, if any | .54% | .54% | .56%G | .54%H |
| Expenses net of all reductions | .54% | .54% | .56%G | .54%H |
| Net investment income (loss) | 1.72% | 1.15% | 1.75% | .57%H |
| Supplemental Data | | | | |
| Net assets, end of period (000 omitted) | $61,158 | $27,448 | $9,530 | $466 |
| Portfolio turnover rateI | 21% | 21% | 26% | 12%H |
A For the period August 31, 2018 (commencement of operations) through March 31, 2019.
B Calculated based on average shares outstanding during the period.
C Net investment income (loss) is affected by the timing of the declaration of dividends by any underlying mutual funds or exchange-traded funds (ETFs). Net investment income (loss) of any such underlying funds is not included in the Fund's net investment income (loss) ratio.
D Total returns for periods of less than one year are not annualized.
E Fees and expenses of any underlying mutual funds or exchange-traded funds (ETFs) are not included in the Fund's expense ratio. The Fund indirectly bears its proportionate share of these expenses. For additional expense information related to investments in Fidelity Central Funds, please refer to the "Investments in Fidelity Central Funds" note found in the Notes to Financial Statements section of the most recent Annual or Semi-Annual report.
F Expense ratios reflect operating expenses of the class. Expenses before reductions do not reflect amounts reimbursed, waived, or reduced through arrangements with the investment adviser, brokerage services, or other offset arrangements, if applicable, and do not represent the amount paid by the class during periods when reimbursements, waivers or reductions occur.
G On certain classes, the size and fluctuation of net assets and expense amounts may cause ratios to differ from contractual rates.
H Annualized
I Amount does not include the portfolio activity of any underlying mutual funds or exchange-traded funds (ETFs).
See accompanying notes which are an integral part of the financial statements.
Fidelity Freedom Blend 2050 Fund Class K
| Years ended March 31, | 2022 | 2021 | 2020 | 2019 A |
| Selected Per–Share Data | | | | |
| Net asset value, beginning of period | $12.27 | $8.27 | $9.52 | $10.00 |
| Income from Investment Operations | | | | |
| Net investment income (loss)B,C | .23 | .13 | .19 | .04 |
| Net realized and unrealized gain (loss) | .25 | 4.43 | (1.09) | (.21) |
| Total from investment operations | .48 | 4.56 | (.90) | (.17) |
| Distributions from net investment income | (.31) | (.14) | (.19) | (.15) |
| Distributions from net realized gain | (.76) | (.42) | (.16) | (.16) |
| Total distributions | (1.07) | (.56) | (.35) | (.31) |
| Net asset value, end of period | $11.68 | $12.27 | $8.27 | $9.52 |
| Total ReturnD | 3.43% | 55.95% | (10.17)% | (1.28)% |
| Ratios to Average Net AssetsC,E,F | | | | |
| Expenses before reductions | .44% | .44% | .44% | .44%G |
| Expenses net of fee waivers, if any | .44% | .44% | .44% | .44%G |
| Expenses net of all reductions | .44% | .44% | .44% | .44%G |
| Net investment income (loss) | 1.82% | 1.25% | 1.86% | .67%G |
| Supplemental Data | | | | |
| Net assets, end of period (000 omitted) | $15,640 | $11,248 | $8,346 | $99 |
| Portfolio turnover rateH | 21% | 21% | 26% | 12%G |
A For the period August 31, 2018 (commencement of operations) through March 31, 2019.
B Calculated based on average shares outstanding during the period.
C Net investment income (loss) is affected by the timing of the declaration of dividends by any underlying mutual funds or exchange-traded funds (ETFs). Net investment income (loss) of any such underlying funds is not included in the Fund's net investment income (loss) ratio.
D Total returns for periods of less than one year are not annualized.
E Fees and expenses of any underlying mutual funds or exchange-traded funds (ETFs) are not included in the Fund's expense ratio. The Fund indirectly bears its proportionate share of these expenses. For additional expense information related to investments in Fidelity Central Funds, please refer to the "Investments in Fidelity Central Funds" note found in the Notes to Financial Statements section of the most recent Annual or Semi-Annual report.
F Expense ratios reflect operating expenses of the class. Expenses before reductions do not reflect amounts reimbursed, waived, or reduced through arrangements with the investment adviser, brokerage services, or other offset arrangements, if applicable, and do not represent the amount paid by the class during periods when reimbursements, waivers or reductions occur.
G Annualized
H Amount does not include the portfolio activity of any underlying mutual funds or exchange-traded funds (ETFs).
See accompanying notes which are an integral part of the financial statements.
Fidelity Freedom Blend 2050 Fund Class K6
| Years ended March 31, | 2022 | 2021 | 2020 | 2019 A |
| Selected Per–Share Data | | | | |
| Net asset value, beginning of period | $12.29 | $8.28 | $9.52 | $10.00 |
| Income from Investment Operations | | | | |
| Net investment income (loss)B,C | .24 | .15 | .19 | .04 |
| Net realized and unrealized gain (loss) | .25 | 4.43 | (1.08) | (.20) |
| Total from investment operations | .49 | 4.58 | (.89) | (.16) |
| Distributions from net investment income | (.30) | (.15) | (.18) | (.16) |
| Distributions from net realized gain | (.77) | (.42) | (.17) | (.16) |
| Total distributions | (1.06)D | (.57) | (.35) | (.32) |
| Net asset value, end of period | $11.72 | $12.29 | $8.28 | $9.52 |
| Total ReturnE | 3.52% | 56.13% | (10.13)% | (1.25)% |
| Ratios to Average Net AssetsC,F,G | | | | |
| Expenses before reductions | .34% | .34% | .34% | .35%H,I |
| Expenses net of fee waivers, if any | .34% | .34% | .34% | .35%H,I |
| Expenses net of all reductions | .34% | .34% | .34% | .35%H,I |
| Net investment income (loss) | 1.92% | 1.35% | 1.96% | .76%H |
| Supplemental Data | | | | |
| Net assets, end of period (000 omitted) | $417,397 | $681,408 | $344,082 | $7,480 |
| Portfolio turnover rateJ | 21% | 21% | 26% | 12%H |
A For the period August 31, 2018 (commencement of operations) through March 31, 2019.
B Calculated based on average shares outstanding during the period.
C Net investment income (loss) is affected by the timing of the declaration of dividends by any underlying mutual funds or exchange-traded funds (ETFs). Net investment income (loss) of any such underlying funds is not included in the Fund's net investment income (loss) ratio.
D Total distributions per share do not sum due to rounding.
E Total returns for periods of less than one year are not annualized.
F Fees and expenses of any underlying mutual funds or exchange-traded funds (ETFs) are not included in the Fund's expense ratio. The Fund indirectly bears its proportionate share of these expenses. For additional expense information related to investments in Fidelity Central Funds, please refer to the "Investments in Fidelity Central Funds" note found in the Notes to Financial Statements section of the most recent Annual or Semi-Annual report.
G Expense ratios reflect operating expenses of the class. Expenses before reductions do not reflect amounts reimbursed, waived, or reduced through arrangements with the investment adviser, brokerage services, or other offset arrangements, if applicable, and do not represent the amount paid by the class during periods when reimbursements, waivers or reductions occur.
H Annualized
I On certain classes, the size and fluctuation of net assets and expense amounts may cause ratios to differ from contractual rates.
J Amount does not include the portfolio activity of any underlying mutual funds or exchange-traded funds (ETFs).
See accompanying notes which are an integral part of the financial statements.
Fidelity Freedom Blend 2050 Fund Class I
| Years ended March 31, | 2022 | 2021 | 2020 | 2019 A |
| Selected Per–Share Data | | | | |
| Net asset value, beginning of period | $12.25 | $8.26 | $9.52 | $10.00 |
| Income from Investment Operations | | | | |
| Net investment income (loss)B,C | .22 | .12 | .17 | .03 |
| Net realized and unrealized gain (loss) | .24 | 4.42 | (1.08) | (.20) |
| Total from investment operations | .46 | 4.54 | (.91) | (.17) |
| Distributions from net investment income | (.30) | (.14) | (.19) | (.15) |
| Distributions from net realized gain | (.76) | (.42) | (.16) | (.16) |
| Total distributions | (1.06) | (.55)D | (.35) | (.31) |
| Net asset value, end of period | $11.65 | $12.25 | $8.26 | $9.52 |
| Total ReturnE | 3.27% | 55.81% | (10.32)% | (1.32)% |
| Ratios to Average Net AssetsC,F,G | | | | |
| Expenses before reductions | .54% | .54% | .54% | .54%H |
| Expenses net of fee waivers, if any | .54% | .54% | .54% | .54%H |
| Expenses net of all reductions | .54% | .54% | .54% | .54%H |
| Net investment income (loss) | 1.72% | 1.15% | 1.76% | .57%H |
| Supplemental Data | | | | |
| Net assets, end of period (000 omitted) | $15,494 | $7,177 | $3,181 | $101 |
| Portfolio turnover rateI | 21% | 21% | 26% | 12%H |
A For the period August 31, 2018 (commencement of operations) through March 31, 2019.
B Calculated based on average shares outstanding during the period.
C Net investment income (loss) is affected by the timing of the declaration of dividends by any underlying mutual funds or exchange-traded funds (ETFs). Net investment income (loss) of any such underlying funds is not included in the Fund's net investment income (loss) ratio.
D Total distributions per share do not sum due to rounding.
E Total returns for periods of less than one year are not annualized.
F Fees and expenses of any underlying mutual funds or exchange-traded funds (ETFs) are not included in the Fund's expense ratio. The Fund indirectly bears its proportionate share of these expenses. For additional expense information related to investments in Fidelity Central Funds, please refer to the "Investments in Fidelity Central Funds" note found in the Notes to Financial Statements section of the most recent Annual or Semi-Annual report.
G Expense ratios reflect operating expenses of the class. Expenses before reductions do not reflect amounts reimbursed, waived, or reduced through arrangements with the investment adviser, brokerage services, or other offset arrangements, if applicable, and do not represent the amount paid by the class during periods when reimbursements, waivers or reductions occur.
H Annualized
I Amount does not include the portfolio activity of any underlying mutual funds or exchange-traded funds (ETFs).
See accompanying notes which are an integral part of the financial statements.
Fidelity Freedom Blend 2050 Fund Premier Class
| Years ended March 31, | 2022 A |
| Selected Per–Share Data | |
| Net asset value, beginning of period | $12.56 |
| Income from Investment Operations | |
| Net investment income (loss)B,C | .48 |
| Net realized and unrealized gain (loss) | (.25) |
| Total from investment operations | .23 |
| Distributions from net investment income | (.33) |
| Distributions from net realized gain | (.77) |
| Total distributions | (1.09)D |
| Net asset value, end of period | $11.70 |
| Total ReturnE | 1.38% |
| Ratios to Average Net AssetsC,F,G | |
| Expenses before reductions | .29%H |
| Expenses net of fee waivers, if any | .29%H |
| Expenses net of all reductions | .29%H |
| Net investment income (loss) | 3.87%H |
| Supplemental Data | |
| Net assets, end of period (000 omitted) | $484,158 |
| Portfolio turnover rateI | 21% |
A For the period April 6, 2021 (commencement of sale of shares) through March 31, 2022.
B Calculated based on average shares outstanding during the period.
C Net investment income (loss) is affected by the timing of the declaration of dividends by any underlying mutual funds or exchange-traded funds (ETFs). Net investment income (loss) of any such underlying funds is not included in the Fund's net investment income (loss) ratio.
D Total distributions per share do not sum due to rounding.
E Total returns for periods of less than one year are not annualized.
F Fees and expenses of any underlying mutual funds or exchange-traded funds (ETFs) are not included in the Fund's expense ratio. The Fund indirectly bears its proportionate share of these expenses. For additional expense information related to investments in Fidelity Central Funds, please refer to the "Investments in Fidelity Central Funds" note found in the Notes to Financial Statements section of the most recent Annual or Semi-Annual report.
G Expense ratios reflect operating expenses of the class. Expenses before reductions do not reflect amounts reimbursed, waived, or reduced through arrangements with the investment adviser, brokerage services, or other offset arrangements, if applicable, and do not represent the amount paid by the class during periods when reimbursements, waivers or reductions occur.
H Annualized
I Amount does not include the portfolio activity of any underlying mutual funds or exchange-traded funds (ETFs).
See accompanying notes which are an integral part of the financial statements.
Fidelity Freedom Blend 2050 Fund Class Z
| Years ended March 31, | 2022 | 2021 | 2020 | 2019 A |
| Selected Per–Share Data | | | | |
| Net asset value, beginning of period | $12.30 | $8.28 | $9.52 | $10.00 |
| Income from Investment Operations | | | | |
| Net investment income (loss)B,C | .23 | .13 | .18 | .04 |
| Net realized and unrealized gain (loss) | .25 | 4.45 | (1.09) | (.21) |
| Total from investment operations | .48 | 4.58 | (.91) | (.17) |
| Distributions from net investment income | (.31) | (.14) | (.17) | (.15) |
| Distributions from net realized gain | (.77) | (.42) | (.16) | (.16) |
| Total distributions | (1.08) | (.56) | (.33) | (.31) |
| Net asset value, end of period | $11.70 | $12.30 | $8.28 | $9.52 |
| Total ReturnD | 3.40% | 56.08% | (10.24)% | (1.28)% |
| Ratios to Average Net AssetsC,E,F | | | | |
| Expenses before reductions | .44% | .44% | .44% | .44%G |
| Expenses net of fee waivers, if any | .44% | .44% | .44% | .44%G |
| Expenses net of all reductions | .44% | .44% | .44% | .44%G |
| Net investment income (loss) | 1.81% | 1.25% | 1.86% | .67%G |
| Supplemental Data | | | | |
| Net assets, end of period (000 omitted) | $2,142 | $138 | $89 | $99 |
| Portfolio turnover rateH | 21% | 21% | 26% | 12%G |
A For the period August 31, 2018 (commencement of operations) through March 31, 2019.
B Calculated based on average shares outstanding during the period.
C Net investment income (loss) is affected by the timing of the declaration of dividends by any underlying mutual funds or exchange-traded funds (ETFs). Net investment income (loss) of any such underlying funds is not included in the Fund's net investment income (loss) ratio.
D Total returns for periods of less than one year are not annualized.
E Fees and expenses of any underlying mutual funds or exchange-traded funds (ETFs) are not included in the Fund's expense ratio. The Fund indirectly bears its proportionate share of these expenses. For additional expense information related to investments in Fidelity Central Funds, please refer to the "Investments in Fidelity Central Funds" note found in the Notes to Financial Statements section of the most recent Annual or Semi-Annual report.
F Expense ratios reflect operating expenses of the class. Expenses before reductions do not reflect amounts reimbursed, waived, or reduced through arrangements with the investment adviser, brokerage services, or other offset arrangements, if applicable, and do not represent the amount paid by the class during periods when reimbursements, waivers or reductions occur.
G Annualized
H Amount does not include the portfolio activity of any underlying mutual funds or exchange-traded funds (ETFs).
See accompanying notes which are an integral part of the financial statements.
Fidelity Freedom Blend 2050 Fund Class Z6
| Years ended March 31, | 2022 | 2021 | 2020 | 2019 A |
| Selected Per–Share Data | | | | |
| Net asset value, beginning of period | $12.29 | $8.28 | $9.52 | $10.00 |
| Income from Investment Operations | | | | |
| Net investment income (loss)B,C | .24 | .15 | .18 | .04 |
| Net realized and unrealized gain (loss) | .25 | 4.44 | (1.08) | (.20) |
| Total from investment operations | .49 | 4.59 | (.90) | (.16) |
| Distributions from net investment income | (.32) | (.15) | (.18) | (.16) |
| Distributions from net realized gain | (.77) | (.42) | (.16) | (.16) |
| Total distributions | (1.09) | (.58)D | (.34) | (.32) |
| Net asset value, end of period | $11.69 | $12.29 | $8.28 | $9.52 |
| Total ReturnE | 3.48% | 56.23% | (10.15)% | (1.25)% |
| Ratios to Average Net AssetsC,F,G | | | | |
| Expenses before reductions | .34% | .34% | .35%H | .34%I |
| Expenses net of fee waivers, if any | .34% | .34% | .35%H | .34%I |
| Expenses net of all reductions | .34% | .34% | .35%H | .34%I |
| Net investment income (loss) | 1.92% | 1.35% | 1.95% | .77%I |
| Supplemental Data | | | | |
| Net assets, end of period (000 omitted) | $56,382 | $4,496 | $1,968 | $99 |
| Portfolio turnover rateJ | 21% | 21% | 26% | 12%I |
A For the period August 31, 2018 (commencement of operations) through March 31, 2019.
B Calculated based on average shares outstanding during the period.
C Net investment income (loss) is affected by the timing of the declaration of dividends by any underlying mutual funds or exchange-traded funds (ETFs). Net investment income (loss) of any such underlying funds is not included in the Fund's net investment income (loss) ratio.
D Total distributions per share do not sum due to rounding.
E Total returns for periods of less than one year are not annualized.
F Fees and expenses of any underlying mutual funds or exchange-traded funds (ETFs) are not included in the Fund's expense ratio. The Fund indirectly bears its proportionate share of these expenses. For additional expense information related to investments in Fidelity Central Funds, please refer to the "Investments in Fidelity Central Funds" note found in the Notes to Financial Statements section of the most recent Annual or Semi-Annual report.
G Expense ratios reflect operating expenses of the class. Expenses before reductions do not reflect amounts reimbursed, waived, or reduced through arrangements with the investment adviser, brokerage services, or other offset arrangements, if applicable, and do not represent the amount paid by the class during periods when reimbursements, waivers or reductions occur.
H On certain classes, the size and fluctuation of net assets and expense amounts may cause ratios to differ from contractual rates.
I Annualized
J Amount does not include the portfolio activity of any underlying mutual funds or exchange-traded funds (ETFs).
See accompanying notes which are an integral part of the financial statements.
Fidelity Freedom® Blend 2055 Fund
Investment Summary (Unaudited)
The information in the following tables is based on the direct investments of the Fund.
Top Holdings as of March 31, 2022
| | % of fund's net assets |
| Fidelity Series Large Cap Value Index Fund | 14.5 |
| Fidelity Series Emerging Markets Opportunities Fund | 12.7 |
| Fidelity Series Blue Chip Growth Fund | 10.8 |
| Fidelity Series Large Cap Stock Fund | 7.6 |
| Fidelity Series Large Cap Growth Index Fund | 6.8 |
| Fidelity Series International Value Fund | 6.6 |
| Fidelity Series Overseas Fund | 6.6 |
| Fidelity Series International Growth Fund | 6.5 |
| Fidelity Series Value Discovery Fund | 5.4 |
| Fidelity Series Long-Term Treasury Bond Index Fund | 5.4 |
| | 82.9 |
Asset Allocation (% of fund's net assets)
| Period end |
| | Domestic Equity Funds | 50.3% |
| | International Equity Funds | 41.9% |
| | Bond Funds | 7.7% |
| | Short-Term Investments | 0.1% |

Percentages are adjusted for the effect of futures contracts and swaps, if applicable.
Domestic Equity Funds category includes Fidelity Series Commodity Strategy Fund which invests in commodity-related investments.
Fidelity Freedom® Blend 2055 Fund
Schedule of Investments March 31, 2022
Showing Percentage of Net Assets
| U.S. Treasury Obligations - 0.1% | | | |
| | | Principal Amount | Value |
| U.S. Treasury Bills, yield at date of purchase 0.12% to 0.5% 4/14/22 to 6/23/22 (a) | | | |
| (Cost $409,855) | | 410,000 | 409,871 |
| | | Shares | Value |
|
| Domestic Equity Funds - 50.3% | | | |
| Fidelity Series Blue Chip Growth Fund (b) | | 4,638,993 | $66,662,323 |
| Fidelity Series Commodity Strategy Fund (b) | | 1,786,610 | 9,129,578 |
| Fidelity Series Large Cap Growth Index Fund (b) | | 2,386,912 | 42,009,644 |
| Fidelity Series Large Cap Stock Fund (b) | | 2,465,156 | 46,862,621 |
| Fidelity Series Large Cap Value Index Fund (b) | | 5,840,449 | 89,709,305 |
| Fidelity Series Small Cap Opportunities Fund (b) | | 1,655,263 | 22,544,676 |
| Fidelity Series Value Discovery Fund (b) | | 2,072,906 | 33,166,503 |
| TOTAL DOMESTIC EQUITY FUNDS | | | |
| (Cost $278,755,410) | | | 310,084,650 |
|
| International Equity Funds - 41.9% | | | |
| Fidelity Series Canada Fund (b) | | 1,297,720 | 20,140,616 |
| Fidelity Series Emerging Markets Fund (b) | | 917,550 | 8,514,861 |
| Fidelity Series Emerging Markets Opportunities Fund (b) | | 4,261,958 | 78,420,031 |
| Fidelity Series International Growth Fund (b) | | 2,430,456 | 40,296,964 |
| Fidelity Series International Index Fund (b) | | 1,495,216 | 17,105,274 |
| Fidelity Series International Small Cap Fund (b) | | 699,994 | 12,564,890 |
| Fidelity Series International Value Fund (b) | | 3,689,223 | 40,692,128 |
| Fidelity Series Overseas Fund (b) | | 3,210,496 | 40,516,465 |
| TOTAL INTERNATIONAL EQUITY FUNDS | | | |
| (Cost $259,814,322) | | | 258,251,229 |
|
| Bond Funds - 7.7% | | | |
| Fidelity Series 5+ Year Inflation-Protected Bond Index Fund (b) | | 64,358 | 617,840 |
| Fidelity Series Corporate Bond Fund (b) | | 65,546 | 662,013 |
| Fidelity Series Emerging Markets Debt Fund (b) | | 365,041 | 3,011,588 |
| Fidelity Series Emerging Markets Debt Local Currency Fund (b) | | 112,994 | 1,018,075 |
| Fidelity Series Floating Rate High Income Fund (b) | | 66,968 | 615,435 |
| Fidelity Series Government Bond Index Fund (b) | | 97,177 | 969,827 |
| Fidelity Series High Income Fund (b) | | 411,270 | 3,738,446 |
| Fidelity Series Investment Grade Bond Fund (b) | | 93,877 | 1,024,193 |
| Fidelity Series Investment Grade Securitized Fund (b) | | 70,575 | 685,991 |
| Fidelity Series Long-Term Treasury Bond Index Fund (b) | | 4,340,731 | 33,076,369 |
| Fidelity Series Real Estate Income Fund (b) | | 193,751 | 2,201,012 |
| TOTAL BOND FUNDS | | | |
| (Cost $51,057,403) | | | 47,620,789 |
|
| Short-Term Funds - 0.0% | | | |
| Fidelity Cash Central Fund 0.31% (c) | | | |
| (Cost $257,373) | | 257,322 | 257,373 |
| TOTAL INVESTMENT IN SECURITIES - 100.0% | | | |
| (Cost $590,294,363) | | | 616,623,912 |
| NET OTHER ASSETS (LIABILITIES) - 0.0% | | | (32,641) |
| NET ASSETS - 100% | | | $616,591,271 |
| Futures Contracts | | | | | |
| | Number of contracts | Expiration Date | Notional Amount | Value | Unrealized Appreciation/(Depreciation) |
| Purchased | | | | | |
| Equity Index Contracts | | | | | |
| ICE E-mini MSCI EAFE Index Contracts (United States) | 12 | June 2022 | $1,286,640 | $73,143 | $73,143 |
| ICE E-mini MSCI Emerging Markets Index Contracts (United States) | 43 | June 2022 | 2,419,825 | 70,507 | 70,507 |
| Sold | | | | | |
| Equity Index Contracts | | | | | |
| CME Micro E-mini S&P 500 Index Contracts (United States) | 12 | June 2022 | 2,718,450 | (164,596) | (164,596) |
| TOTAL FUTURES CONTRACTS | | | | | $(20,946) |
The notional amount of futures purchased as a percentage of Net Assets is 0.6%
The notional amount of futures sold as a percentage of Net Assets is 0.4%
Legend
(a) Security or a portion of the security was pledged to cover margin requirements for futures contracts. At period end, the value of securities pledged amounted to $408,872.
(b) Affiliated Fund
(c) Affiliated fund that is generally available only to investment companies and other accounts managed by Fidelity Investments. The rate quoted is the annualized seven-day yield of the fund at period end. A complete unaudited listing of the fund's holdings as of its most recent quarter end is available upon request. In addition, each Fidelity Central Fund's financial statements, which are not covered by the Fund's Report of Independent Registered Public Accounting Firm, are available on the SEC's website or upon request.
Affiliated Central Funds
Fiscal year to date information regarding the Fund's investments in Fidelity Central Funds, including the ownership percentage, is presented below.
| Fund | Value, beginning of period | Purchases | Sales Proceeds | Dividend Income | Realized Gain/Loss | Change in Unrealized appreciation (depreciation) | Value, end of period | % ownership, end of period |
| Fidelity Cash Central Fund 0.31% | $-- | $1,225,467 | $968,094 | $89 | $-- | $-- | $257,373 | 0.0% |
| Total | $-- | $1,225,467 | $968,094 | $89 | $-- | $-- | $257,373 | |
Amounts in the income column in the above table include any capital gain distributions from underlying funds, which are presented in the corresponding line-item in the Statement of Operations, if applicable.
Affiliated Underlying Funds
Fiscal year to date information regarding the Fund's investments in affiliated Underlying Funds is presented below. Exchanges between classes of the same affiliated Underlying Funds may occur. If an underlying Fund changes its name, the name presented below is the name in effect at period end.
| Affiliate | Value, beginning of period | Purchases(a) | Sales Proceeds(a) | Dividend Income | Realized Gain (loss) | Change in Unrealized appreciation (depreciation) | Value, end of period |
| Fidelity Series 0-5 Year Inflation-Protected Bond Index Fund | $-- | $2,632,964 | $2,623,319 | $8,016 | $(8,452) | $-- | $-- |
| Fidelity Series 5+ Year Inflation-Protected Bond Index Fund | -- | 5,461,693 | 4,647,803 | 26,227 | (179,835) | (16,215) | 617,840 |
| Fidelity Series Blue Chip Growth Fund | 43,079,529 | 47,547,124 | 12,541,008 | 12,225,416 | (605,357) | (10,817,965) | 66,662,323 |
| Fidelity Series Canada Fund | 9,474,093 | 9,482,007 | 1,543,931 | 365,028 | (21,539) | 2,749,986 | 20,140,616 |
| Fidelity Series Commodity Strategy Fund | 10,869,923 | 10,388,644 | 12,623,542 | 4,505,219 | (378,013) | 872,566 | 9,129,578 |
| Fidelity Series Corporate Bond Fund | 42,911 | 967,652 | 337,131 | 3,136 | (9,422) | (1,997) | 662,013 |
| Fidelity Series Emerging Markets Debt Fund | 2,142,296 | 1,554,861 | 376,229 | 129,235 | (14,892) | (294,448) | 3,011,588 |
| Fidelity Series Emerging Markets Debt Local Currency Fund | 716,032 | 526,704 | 110,227 | 39,030 | (10,102) | (104,332) | 1,018,075 |
| Fidelity Series Emerging Markets Fund | 6,229,493 | 4,915,770 | 720,579 | 271,678 | (22,625) | (1,887,198) | 8,514,861 |
| Fidelity Series Emerging Markets Opportunities Fund | 56,003,704 | 53,630,914 | 6,711,548 | 8,544,180 | (192,882) | (24,310,157) | 78,420,031 |
| Fidelity Series Floating Rate High Income Fund | 431,579 | 310,656 | 125,937 | 24,130 | (296) | (567) | 615,435 |
| Fidelity Series Government Bond Index Fund | 52,700 | 1,515,635 | 586,216 | 1,514 | (10,650) | (1,642) | 969,827 |
| Fidelity Series Government Money Market Fund 0.31% | 1,014,869 | 209,930 | 1,224,799 | 212 | -- | -- | -- |
| Fidelity Series High Income Fund | 2,485,978 | 1,917,582 | 536,863 | 177,526 | (11,581) | (116,670) | 3,738,446 |
| Fidelity Series Inflation-Protected Bond Index Fund | 7,824,193 | 3,397,868 | 11,554,864 | 116,497 | 637,603 | (304,800) | -- |
| Fidelity Series International Growth Fund | 23,342,808 | 23,285,027 | 2,050,173 | 2,957,448 | 16,919 | (4,297,617) | 40,296,964 |
| Fidelity Series International Index Fund | 9,727,759 | 8,738,625 | 676,130 | 392,663 | (29,112) | (655,868) | 17,105,274 |
| Fidelity Series International Small Cap Fund | 8,345,784 | 6,753,982 | 398,569 | 1,533,681 | (12,471) | (2,123,836) | 12,564,890 |
| Fidelity Series International Value Fund | 23,289,627 | 21,795,177 | 4,463,358 | 1,856,950 | (96,808) | 167,490 | 40,692,128 |
| Fidelity Series Investment Grade Bond Fund | 58,973 | 1,638,430 | 660,202 | 3,977 | (10,690) | (2,318) | 1,024,193 |
| Fidelity Series Investment Grade Securitized Fund | 41,147 | 979,866 | 328,578 | 1,222 | (4,873) | (1,571) | 685,991 |
| Fidelity Series Large Cap Growth Index Fund | 27,195,548 | 20,765,600 | 9,228,785 | 1,171,545 | (72,914) | 3,350,195 | 42,009,644 |
| Fidelity Series Large Cap Stock Fund | 29,707,678 | 22,935,616 | 6,466,837 | 3,655,100 | (201,107) | 887,271 | 46,862,621 |
| Fidelity Series Large Cap Value Index Fund | 56,748,156 | 42,882,752 | 12,344,746 | 5,513,491 | (295,484) | 2,718,627 | 89,709,305 |
| Fidelity Series Long-Term Treasury Bond Index Fund | 10,717,545 | 26,150,401 | 2,077,357 | 432,569 | (217,009) | (1,497,211) | 33,076,369 |
| Fidelity Series Overseas Fund | 23,338,543 | 20,958,825 | 2,441,884 | 1,094,088 | 2,896 | (1,341,915) | 40,516,465 |
| Fidelity Series Real Estate Income Fund | 1,489,282 | 996,158 | 315,023 | 80,948 | (4,349) | 34,944 | 2,201,012 |
| Fidelity Series Short-Term Credit Fund | 500,716 | 145,446 | 645,949 | 2,690 | 4,426 | (4,639) | -- |
| Fidelity Series Small Cap Opportunities Fund | 14,347,497 | 15,323,337 | 2,420,168 | 4,935,126 | (229,835) | (4,476,155) | 22,544,676 |
| Fidelity Series Treasury Bill Index Fund | 1,612,557 | 487,562 | 2,100,119 | 334 | (117) | 117 | -- |
| Fidelity Series Value Discovery Fund | 20,968,043 | 17,199,991 | 4,636,410 | 3,569,507 | (117,606) | (247,515) | 33,166,503 |
| Total | $391,798,963 | $375,496,799 | $107,518,284 | $53,638,383 | $(2,096,177) | $(41,723,440) | $615,956,668 |
(a) Includes the value of shares purchased or redeemed through in-kind transactions, if applicable.
Amounts in the income column in the above table include any capital gain distributions from underlying funds, which are presented in the corresponding line-item in the Statement of Operations, if applicable.
Investment Valuation
The following is a summary of the inputs used, as of March 31, 2022, involving the Fund's assets and liabilities carried at fair value. The inputs or methodology used for valuing securities may not be an indication of the risk associated with investing in those securities. For more information on valuation inputs, and their aggregation into the levels used below, please refer to the Investment Valuation section in the accompanying Notes to Financial Statements.
| | Valuation Inputs at Reporting Date: |
| Description | Total | Level 1 | Level 2 | Level 3 |
| Investments in Securities: | | | | |
| Other Short-Term Investments and Net Other Assets | $409,871 | $-- | $409,871 | $-- |
| Domestic Equity Funds | 310,084,650 | 310,084,650 | -- | -- |
| International Equity Funds | 258,251,229 | 258,251,229 | -- | -- |
| Bond Funds | 47,620,789 | 47,620,789 | -- | -- |
| Short-Term Funds | 257,373 | 257,373 | -- | -- |
| Total Investments in Securities: | $616,623,912 | $616,214,041 | $409,871 | $-- |
| Derivative Instruments: | | | | |
| Assets | | | | |
| Futures Contracts | $143,650 | $143,650 | $-- | $-- |
| Total Assets | $143,650 | $143,650 | $-- | $-- |
| Liabilities | | | | |
| Futures Contracts | $(164,596) | $(164,596) | $-- | $-- |
| Total Liabilities | $(164,596) | $(164,596) | $-- | $-- |
| Total Derivative Instruments: | $(20,946) | $(20,946) | $-- | $-- |
Value of Derivative Instruments
The following table is a summary of the Fund's value of derivative instruments by primary risk exposure as of March 31, 2022. For additional information on derivative instruments, please refer to the Derivative Instruments section in the accompanying Notes to Financial Statements.
| Primary Risk Exposure / Derivative Type | Value |
| | Asset | Liability |
| Equity Risk | | |
| Futures Contracts(a) | $143,650 | $(164,596) |
| Total Equity Risk | 143,650 | (164,596) |
| Total Value of Derivatives | $143,650 | $(164,596) |
(a) Reflects gross cumulative appreciation (depreciation) on futures contracts as presented in the Schedule of Investments. In the Statement of Assets and Liabilities, the period end daily variation margin is included in receivable or payable for daily variation margin on futures contracts, and the net cumulative appreciation (depreciation) is included in Total accumulated earnings (loss).
See accompanying notes which are an integral part of the financial statements.
Fidelity Freedom® Blend 2055 Fund
Financial Statements
Statement of Assets and Liabilities
| | | March 31, 2022 |
| Assets | | |
Investment in securities, at value — See accompanying schedule:
Unaffiliated issuers (cost $409,855) | $409,871 | |
| Fidelity Central Funds (cost $257,373) | 257,373 | |
| Other affiliated issuers (cost $589,627,135) | 615,956,668 | |
| Total Investment in Securities (cost $590,294,363) | | $616,623,912 |
| Cash | | 4,155 |
| Receivable for investments sold | | 11,877,236 |
| Receivable for fund shares sold | | 1,346,008 |
| Distributions receivable from Fidelity Central Funds | | 48 |
| Receivable for daily variation margin on futures contracts | | 3,595 |
| Total assets | | 629,854,954 |
| Liabilities | | |
| Payable for investments purchased | $12,070,532 | |
| Payable for fund shares redeemed | 992,056 | |
| Accrued management fee | 167,952 | |
| Distribution and service plan fees payable | 1,342 | |
| Payable for daily variation margin on futures contracts | 31,801 | |
| Total liabilities | | 13,263,683 |
| Net Assets | | $616,591,271 |
| Net Assets consist of: | | |
| Paid in capital | | $577,372,721 |
| Total accumulated earnings (loss) | | 39,218,550 |
| Net Assets | | $616,591,271 |
| Net Asset Value and Maximum Offering Price | | |
| Class A: | | |
| Net Asset Value and redemption price per share ($2,479,094 ÷ 211,907 shares)(a) | | $11.70 |
| Maximum offering price per share (100/94.25 of $11.70) | | $12.41 |
| Class M: | | |
| Net Asset Value and redemption price per share ($821,916 ÷ 70,473 shares)(a) | | $11.66 |
| Maximum offering price per share (100/96.50 of $11.66) | | $12.08 |
| Class C: | | |
| Net Asset Value and offering price per share ($630,594 ÷ 54,519 shares)(a) | | $11.57 |
| Fidelity Freedom Blend 2055 Fund: | | |
| Net Asset Value, offering price and redemption price per share ($38,089,598 ÷ 3,244,871 shares) | | $11.74 |
| Class K: | | |
| Net Asset Value, offering price and redemption price per share ($8,994,866 ÷ 765,082 shares) | | $11.76 |
| Class K6: | | |
| Net Asset Value, offering price and redemption price per share ($287,129,051 ÷ 24,341,645 shares) | | $11.80 |
| Class I: | | |
| Net Asset Value, offering price and redemption price per share ($12,306,402 ÷ 1,048,374 shares) | | $11.74 |
| Class Z: | | |
| Net Asset Value, offering price and redemption price per share ($1,648,851 ÷ 139,980 shares) | | $11.78 |
| Class Z6: | | |
| Net Asset Value, offering price and redemption price per share ($35,927,330 ÷ 3,054,088 shares) | | $11.76 |
| Premier Class: | | |
| Net Asset Value, offering price and redemption price per share ($228,563,569 ÷ 19,415,412 shares) | | $11.77 |
(a) Redemption price per share is equal to net asset value less any applicable contingent deferred sales charge.
See accompanying notes which are an integral part of the financial statements.
Statement of Operations
| | | Year ended March 31, 2022 |
| Investment Income | | |
| Dividends: | | |
| Affiliated issuers | | $15,462,286 |
| Interest | | 109 |
| Income from Fidelity Central Funds | | 89 |
| Total income | | 15,462,484 |
| Expenses | | |
| Management fee | $1,804,518 | |
| Distribution and service plan fees | 14,109 | |
| Independent trustees' fees and expenses | 1,499 | |
| Total expenses | | 1,820,126 |
| Net investment income (loss) | | 13,642,358 |
| Realized and Unrealized Gain (Loss) | | |
| Net realized gain (loss) on: | | |
| Investment securities: | | |
| Affiliated issuers | (2,096,177) | |
| Futures contracts | (242,176) | |
| Capital gain distributions from underlying funds: | | |
| Affiliated issuers | 38,176,097 | |
| Total net realized gain (loss) | | 35,837,744 |
| Change in net unrealized appreciation (depreciation) on: | | |
| Investment securities: | | |
| Unaffiliated issuers | 16 | |
| Affiliated issuers | (41,723,440) | |
| Futures contracts | (20,946) | |
| Total change in net unrealized appreciation (depreciation) | | (41,744,370) |
| Net gain (loss) | | (5,906,626) |
| Net increase (decrease) in net assets resulting from operations | | $7,735,732 |
See accompanying notes which are an integral part of the financial statements.
Statement of Changes in Net Assets
| | Year ended March 31, 2022 | Year ended March 31, 2021 |
| Increase (Decrease) in Net Assets | | |
| Operations | | |
| Net investment income (loss) | $13,642,358 | $3,996,361 |
| Net realized gain (loss) | 35,837,744 | 17,649,461 |
| Change in net unrealized appreciation (depreciation) | (41,744,370) | 99,763,596 |
| Net increase (decrease) in net assets resulting from operations | 7,735,732 | 121,409,418 |
| Distributions to shareholders | (44,065,406) | (14,842,492) |
| Share transactions - net increase (decrease) | 261,233,331 | 103,892,978 |
| Total increase (decrease) in net assets | 224,903,657 | 210,459,904 |
| Net Assets | | |
| Beginning of period | 391,687,614 | 181,227,710 |
| End of period | $616,591,271 | $391,687,614 |
See accompanying notes which are an integral part of the financial statements.
Financial Highlights
Fidelity Freedom Blend 2055 Fund Class A
| Years ended March 31, | 2022 | 2021 | 2020 | 2019 A |
| Selected Per–Share Data | | | | |
| Net asset value, beginning of period | $12.28 | $8.27 | $9.51 | $10.00 |
| Income from Investment Operations | | | | |
| Net investment income (loss)B,C | .21 | .10 | .16 | .04 |
| Net realized and unrealized gain (loss) | .23 | 4.43 | (1.10) | (.22) |
| Total from investment operations | .44 | 4.53 | (.94) | (.18) |
| Distributions from net investment income | (.28) | (.13) | (.15) | (.14) |
| Distributions from net realized gain | (.74) | (.39) | (.14) | (.16) |
| Total distributions | (1.02) | (.52) | (.30)D | (.31)D |
| Net asset value, end of period | $11.70 | $12.28 | $8.27 | $9.51 |
| Total ReturnE,F | 3.10% | 55.44% | (10.55)% | (1.46)% |
| Ratios to Average Net AssetsC,G,H | | | | |
| Expenses before reductions | .79% | .79% | .79% | .79%I |
| Expenses net of fee waivers, if any | .79% | .79% | .79% | .79%I |
| Expenses net of all reductions | .79% | .79% | .79% | .79%I |
| Net investment income (loss) | 1.66% | .92% | 1.58% | .70%I |
| Supplemental Data | | | | |
| Net assets, end of period (000 omitted) | $2,479 | $1,296 | $393 | $151 |
| Portfolio turnover rateJ | 20% | 21% | 26% | 14%I |
A For the period August 31, 2018 (commencement of operations) through March 31, 2019.
B Calculated based on average shares outstanding during the period.
C Net investment income (loss) is affected by the timing of the declaration of dividends by any underlying mutual funds or exchange-traded funds (ETFs). Net investment income (loss) of any such underlying funds is not included in the Fund's net investment income (loss) ratio.
D Total distributions per share do not sum due to rounding.
E Total returns for periods of less than one year are not annualized.
F Total returns do not include the effect of the sales charges.
G Fees and expenses of any underlying mutual funds or exchange-traded funds (ETFs) are not included in the Fund's expense ratio. The Fund indirectly bears its proportionate share of these expenses. For additional expense information related to investments in Fidelity Central Funds, please refer to the "Investments in Fidelity Central Funds" note found in the Notes to Financial Statements section of the most recent Annual or Semi-Annual report.
H Expense ratios reflect operating expenses of the class. Expenses before reductions do not reflect amounts reimbursed, waived, or reduced through arrangements with the investment adviser, brokerage services, or other offset arrangements, if applicable, and do not represent the amount paid by the class during periods when reimbursements, waivers or reductions occur.
I Annualized
J Amount does not include the portfolio activity of any underlying mutual funds or exchange-traded funds (ETFs).
See accompanying notes which are an integral part of the financial statements.
Fidelity Freedom Blend 2055 Fund Class M
| Years ended March 31, | 2022 | 2021 | 2020 | 2019 A |
| Selected Per–Share Data | | | | |
| Net asset value, beginning of period | $12.26 | $8.27 | $9.51 | $10.00 |
| Income from Investment Operations | | | | |
| Net investment income (loss)B,C | .18 | .07 | .13 | .02 |
| Net realized and unrealized gain (loss) | .21 | 4.42 | (1.09) | (.21) |
| Total from investment operations | .39 | 4.49 | (.96) | (.19) |
| Distributions from net investment income | (.25) | (.11) | (.13) | (.13) |
| Distributions from net realized gain | (.74) | (.39) | (.14) | (.16) |
| Total distributions | (.99) | (.50) | (.28)D | (.30)D |
| Net asset value, end of period | $11.66 | $12.26 | $8.27 | $9.51 |
| Total ReturnE,F | 2.73% | 54.95% | (10.73)% | (1.55)% |
| Ratios to Average Net AssetsC,G,H | | | | |
| Expenses before reductions | 1.04% | 1.04% | 1.04% | 1.04%I |
| Expenses net of fee waivers, if any | 1.04% | 1.04% | 1.04% | 1.04%I |
| Expenses net of all reductions | 1.04% | 1.04% | 1.04% | 1.04%I |
| Net investment income (loss) | 1.40% | .67% | 1.33% | .45%I |
| Supplemental Data | | | | |
| Net assets, end of period (000 omitted) | $822 | $671 | $249 | $101 |
| Portfolio turnover rateJ | 20% | 21% | 26% | 14%I |
A For the period August 31, 2018 (commencement of operations) through March 31, 2019.
B Calculated based on average shares outstanding during the period.
C Net investment income (loss) is affected by the timing of the declaration of dividends by any underlying mutual funds or exchange-traded funds (ETFs). Net investment income (loss) of any such underlying funds is not included in the Fund's net investment income (loss) ratio.
D Total distributions per share do not sum due to rounding.
E Total returns for periods of less than one year are not annualized.
F Total returns do not include the effect of the sales charges.
G Fees and expenses of any underlying mutual funds or exchange-traded funds (ETFs) are not included in the Fund's expense ratio. The Fund indirectly bears its proportionate share of these expenses. For additional expense information related to investments in Fidelity Central Funds, please refer to the "Investments in Fidelity Central Funds" note found in the Notes to Financial Statements section of the most recent Annual or Semi-Annual report.
H Expense ratios reflect operating expenses of the class. Expenses before reductions do not reflect amounts reimbursed, waived, or reduced through arrangements with the investment adviser, brokerage services, or other offset arrangements, if applicable, and do not represent the amount paid by the class during periods when reimbursements, waivers or reductions occur.
I Annualized
J Amount does not include the portfolio activity of any underlying mutual funds or exchange-traded funds (ETFs).
See accompanying notes which are an integral part of the financial statements.
Fidelity Freedom Blend 2055 Fund Class C
| Years ended March 31, | 2022 | 2021 | 2020 | 2019 A |
| Selected Per–Share Data | | | | |
| Net asset value, beginning of period | $12.19 | $8.24 | $9.49 | $10.00 |
| Income from Investment Operations | | | | |
| Net investment income (loss)B,C | .11 | .02 | .08 | –D |
| Net realized and unrealized gain (loss) | .23 | 4.40 | (1.08) | (.23) |
| Total from investment operations | .34 | 4.42 | (1.00) | (.23) |
| Distributions from net investment income | (.22) | (.08) | (.10) | (.12) |
| Distributions from net realized gain | (.74) | (.39) | (.14) | (.16) |
| Total distributions | (.96) | (.47) | (.25)E | (.28) |
| Net asset value, end of period | $11.57 | $12.19 | $8.24 | $9.49 |
| Total ReturnF,G | 2.31% | 54.23% | (11.12)% | (1.93)% |
| Ratios to Average Net AssetsC,H,I | | | | |
| Expenses before reductions | 1.54% | 1.55%J | 1.54% | 1.54%K |
| Expenses net of fee waivers, if any | 1.54% | 1.55%J | 1.54% | 1.54%K |
| Expenses net of all reductions | 1.54% | 1.55%J | 1.54% | 1.54%K |
| Net investment income (loss) | .90% | .16% | .83% | (.05)%K |
| Supplemental Data | | | | |
| Net assets, end of period (000 omitted) | $631 | $391 | $153 | $107 |
| Portfolio turnover rateL | 20% | 21% | 26% | 14%K |
A For the period August 31, 2018 (commencement of operations) through March 31, 2019.
B Calculated based on average shares outstanding during the period.
C Net investment income (loss) is affected by the timing of the declaration of dividends by any underlying mutual funds or exchange-traded funds (ETFs). Net investment income (loss) of any such underlying funds is not included in the Fund's net investment income (loss) ratio.
D Amount represents less than $.005 per share.
E Total distributions per share do not sum due to rounding.
F Total returns for periods of less than one year are not annualized.
G Total returns do not include the effect of the contingent deferred sales charge.
H Fees and expenses of any underlying mutual funds or exchange-traded funds (ETFs) are not included in the Fund's expense ratio. The Fund indirectly bears its proportionate share of these expenses. For additional expense information related to investments in Fidelity Central Funds, please refer to the "Investments in Fidelity Central Funds" note found in the Notes to Financial Statements section of the most recent Annual or Semi-Annual report.
I Expense ratios reflect operating expenses of the class. Expenses before reductions do not reflect amounts reimbursed, waived, or reduced through arrangements with the investment adviser, brokerage services, or other offset arrangements, if applicable, and do not represent the amount paid by the class during periods when reimbursements, waivers or reductions occur.
J On certain classes, the size and fluctuation of net assets and expense amounts may cause ratios to differ from contractual rates.
K Annualized
L Amount does not include the portfolio activity of any underlying mutual funds or exchange-traded funds (ETFs).
See accompanying notes which are an integral part of the financial statements.
Fidelity Freedom Blend 2055 Fund
| Years ended March 31, | 2022 | 2021 | 2020 | 2019 A |
| Selected Per–Share Data | | | | |
| Net asset value, beginning of period | $12.32 | $8.29 | $9.51 | $10.00 |
| Income from Investment Operations | | | | |
| Net investment income (loss)B,C | .24 | .13 | .17 | .05 |
| Net realized and unrealized gain (loss) | .23 | 4.43 | (1.08) | (.22) |
| Total from investment operations | .47 | 4.56 | (.91) | (.17) |
| Distributions from net investment income | (.31) | (.14) | (.17) | (.15) |
| Distributions from net realized gain | (.75) | (.39) | (.14) | (.16) |
| Total distributions | (1.05)D | (.53) | (.31) | (.32)D |
| Net asset value, end of period | $11.74 | $12.32 | $8.29 | $9.51 |
| Total ReturnE | 3.36% | 55.75% | (10.22)% | (1.35)% |
| Ratios to Average Net AssetsC,F,G | | | | |
| Expenses before reductions | .54% | .54% | .56%C | .54%H |
| Expenses net of fee waivers, if any | .54% | .54% | .56%C | .54%H |
| Expenses net of all reductions | .54% | .54% | .56%C | .54%H |
| Net investment income (loss) | 1.90% | 1.17% | 1.82% | .95%H |
| Supplemental Data | | | | |
| Net assets, end of period (000 omitted) | $38,090 | $13,739 | $5,211 | $320 |
| Portfolio turnover rateI | 20% | 21% | 26% | 14%H |
A For the period August 31, 2018 (commencement of operations) through March 31, 2019.
B Calculated based on average shares outstanding during the period.
C Net investment income (loss) is affected by the timing of the declaration of dividends by any underlying mutual funds or exchange-traded funds (ETFs). Net investment income (loss) of any such underlying funds is not included in the Fund's net investment income (loss) ratio.
D Total distributions per share do not sum due to rounding.
E Total returns for periods of less than one year are not annualized.
F Fees and expenses of any underlying mutual funds or exchange-traded funds (ETFs) are not included in the Fund's expense ratio. The Fund indirectly bears its proportionate share of these expenses. For additional expense information related to investments in Fidelity Central Funds, please refer to the "Investments in Fidelity Central Funds" note found in the Notes to Financial Statements section of the most recent Annual or Semi-Annual report.
G Expense ratios reflect operating expenses of the class. Expenses before reductions do not reflect amounts reimbursed, waived, or reduced through arrangements with the investment adviser, brokerage services, or other offset arrangements, if applicable, and do not represent the amount paid by the class during periods when reimbursements, waivers or reductions occur.
H Annualized
I Amount does not include the portfolio activity of any underlying mutual funds or exchange-traded funds (ETFs).
See accompanying notes which are an integral part of the financial statements.
Fidelity Freedom Blend 2055 Fund Class K
| Years ended March 31, | 2022 | 2021 | 2020 | 2019 A |
| Selected Per–Share Data | | | | |
| Net asset value, beginning of period | $12.33 | $8.29 | $9.52 | $10.00 |
| Income from Investment Operations | | | | |
| Net investment income (loss)B,C | .25 | .14 | .19 | .06 |
| Net realized and unrealized gain (loss) | .23 | 4.44 | (1.09) | (.22) |
| Total from investment operations | .48 | 4.58 | (.90) | (.16) |
| Distributions from net investment income | (.30) | (.15) | (.19) | (.15) |
| Distributions from net realized gain | (.75) | (.39) | (.14) | (.16) |
| Total distributions | (1.05) | (.54) | (.33) | (.32)D |
| Net asset value, end of period | $11.76 | $12.33 | $8.29 | $9.52 |
| Total ReturnE | 3.43% | 55.92% | (10.17)% | (1.23)% |
| Ratios to Average Net AssetsC,F,G | | | | |
| Expenses before reductions | .44% | .44% | .44% | .44%H |
| Expenses net of fee waivers, if any | .44% | .44% | .44% | .44%H |
| Expenses net of all reductions | .44% | .44% | .44% | .44%H |
| Net investment income (loss) | 2.00% | 1.27% | 1.93% | 1.05%H |
| Supplemental Data | | | | |
| Net assets, end of period (000 omitted) | $8,995 | $7,108 | $4,757 | $99 |
| Portfolio turnover rateI | 20% | 21% | 26% | 14%H |
A For the period August 31, 2018 (commencement of operations) through March 31, 2019.
B Calculated based on average shares outstanding during the period.
C Net investment income (loss) is affected by the timing of the declaration of dividends by any underlying mutual funds or exchange-traded funds (ETFs). Net investment income (loss) of any such underlying funds is not included in the Fund's net investment income (loss) ratio.
D Total distributions per share do not sum due to rounding.
E Total returns for periods of less than one year are not annualized.
F Fees and expenses of any underlying mutual funds or exchange-traded funds (ETFs) are not included in the Fund's expense ratio. The Fund indirectly bears its proportionate share of these expenses. For additional expense information related to investments in Fidelity Central Funds, please refer to the "Investments in Fidelity Central Funds" note found in the Notes to Financial Statements section of the most recent Annual or Semi-Annual report.
G Expense ratios reflect operating expenses of the class. Expenses before reductions do not reflect amounts reimbursed, waived, or reduced through arrangements with the investment adviser, brokerage services, or other offset arrangements, if applicable, and do not represent the amount paid by the class during periods when reimbursements, waivers or reductions occur.
H Annualized
I Amount does not include the portfolio activity of any underlying mutual funds or exchange-traded funds (ETFs).
See accompanying notes which are an integral part of the financial statements.
Fidelity Freedom Blend 2055 Fund Class K6
| Years ended March 31, | 2022 | 2021 | 2020 | 2019 A |
| Selected Per–Share Data | | | | |
| Net asset value, beginning of period | $12.35 | $8.30 | $9.52 | $10.00 |
| Income from Investment Operations | | | | |
| Net investment income (loss)B,C | .27 | .15 | .20 | .06 |
| Net realized and unrealized gain (loss) | .23 | 4.44 | (1.10) | (.22) |
| Total from investment operations | .50 | 4.59 | (.90) | (.16) |
| Distributions from net investment income | (.30) | (.15) | (.18) | (.16) |
| Distributions from net realized gain | (.75) | (.40) | (.15) | (.16) |
| Total distributions | (1.05) | (.54)D | (.32)D | (.32) |
| Net asset value, end of period | $11.80 | $12.35 | $8.30 | $9.52 |
| Total ReturnE | 3.60% | 56.09% | (10.11)% | (1.19)% |
| Ratios to Average Net AssetsC,F,G | | | | |
| Expenses before reductions | .34% | .34% | .34% | .35%H,I |
| Expenses net of fee waivers, if any | .34% | .34% | .34% | .35%H,I |
| Expenses net of all reductions | .34% | .34% | .34% | .35%H,I |
| Net investment income (loss) | 2.10% | 1.37% | 2.03% | 1.15%H |
| Supplemental Data | | | | |
| Net assets, end of period (000 omitted) | $287,129 | $361,200 | $167,831 | $4,021 |
| Portfolio turnover rateJ | 20% | 21% | 26% | 14%H |
A For the period August 31, 2018 (commencement of operations) through March 31, 2019.
B Calculated based on average shares outstanding during the period.
C Net investment income (loss) is affected by the timing of the declaration of dividends by any underlying mutual funds or exchange-traded funds (ETFs). Net investment income (loss) of any such underlying funds is not included in the Fund's net investment income (loss) ratio.
D Total distributions per share do not sum due to rounding.
E Total returns for periods of less than one year are not annualized.
F Fees and expenses of any underlying mutual funds or exchange-traded funds (ETFs) are not included in the Fund's expense ratio. The Fund indirectly bears its proportionate share of these expenses. For additional expense information related to investments in Fidelity Central Funds, please refer to the "Investments in Fidelity Central Funds" note found in the Notes to Financial Statements section of the most recent Annual or Semi-Annual report.
G Expense ratios reflect operating expenses of the class. Expenses before reductions do not reflect amounts reimbursed, waived, or reduced through arrangements with the investment adviser, brokerage services, or other offset arrangements, if applicable, and do not represent the amount paid by the class during periods when reimbursements, waivers or reductions occur.
H Annualized
I On certain classes, the size and fluctuation of net assets and expense amounts may cause ratios to differ from contractual rates.
J Amount does not include the portfolio activity of any underlying mutual funds or exchange-traded funds (ETFs).
See accompanying notes which are an integral part of the financial statements.
Fidelity Freedom Blend 2055 Fund Class I
| Years ended March 31, | 2022 | 2021 | 2020 | 2019 A |
| Selected Per–Share Data | | | | |
| Net asset value, beginning of period | $12.32 | $8.28 | $9.52 | $10.00 |
| Income from Investment Operations | | | | |
| Net investment income (loss)B,C | .24 | .13 | .18 | .05 |
| Net realized and unrealized gain (loss) | .23 | 4.44 | (1.10) | (.22) |
| Total from investment operations | .47 | 4.57 | (.92) | (.17) |
| Distributions from net investment income | (.30) | (.14) | (.18) | (.15) |
| Distributions from net realized gain | (.75) | (.39) | (.14) | (.16) |
| Total distributions | (1.05) | (.53) | (.32) | (.31) |
| Net asset value, end of period | $11.74 | $12.32 | $8.28 | $9.52 |
| Total ReturnD | 3.32% | 55.85% | (10.32)% | (1.27)% |
| Ratios to Average Net AssetsC,E,F | | | | |
| Expenses before reductions | .54% | .54% | .54% | .54%G |
| Expenses net of fee waivers, if any | .54% | .54% | .54% | .54%G |
| Expenses net of all reductions | .54% | .54% | .54% | .54%G |
| Net investment income (loss) | 1.91% | 1.17% | 1.83% | .95%G |
| Supplemental Data | | | | |
| Net assets, end of period (000 omitted) | $12,306 | $3,995 | $1,851 | $99 |
| Portfolio turnover rateH | 20% | 21% | 26% | 14%G |
A For the period August 31, 2018 (commencement of operations) through March 31, 2019.
B Calculated based on average shares outstanding during the period.
C Net investment income (loss) is affected by the timing of the declaration of dividends by any underlying mutual funds or exchange-traded funds (ETFs). Net investment income (loss) of any such underlying funds is not included in the Fund's net investment income (loss) ratio.
D Total returns for periods of less than one year are not annualized.
E Fees and expenses of any underlying mutual funds or exchange-traded funds (ETFs) are not included in the Fund's expense ratio. The Fund indirectly bears its proportionate share of these expenses. For additional expense information related to investments in Fidelity Central Funds, please refer to the "Investments in Fidelity Central Funds" note found in the Notes to Financial Statements section of the most recent Annual or Semi-Annual report.
F Expense ratios reflect operating expenses of the class. Expenses before reductions do not reflect amounts reimbursed, waived, or reduced through arrangements with the investment adviser, brokerage services, or other offset arrangements, if applicable, and do not represent the amount paid by the class during periods when reimbursements, waivers or reductions occur.
G Annualized
H Amount does not include the portfolio activity of any underlying mutual funds or exchange-traded funds (ETFs).
See accompanying notes which are an integral part of the financial statements.
Fidelity Freedom Blend 2055 Fund Premier Class
| Years ended March 31, | 2022 A |
| Selected Per–Share Data | |
| Net asset value, beginning of period | $12.62 |
| Income from Investment Operations | |
| Net investment income (loss)B,C | .48 |
| Net realized and unrealized gain (loss) | (.25) |
| Total from investment operations | .23 |
| Distributions from net investment income | (.33) |
| Distributions from net realized gain | (.75) |
| Total distributions | (1.08) |
| Net asset value, end of period | $11.77 |
| Total ReturnD | 1.34% |
| Ratios to Average Net AssetsC,E,F | |
| Expenses before reductions | .29%G |
| Expenses net of fee waivers, if any | .29%G |
| Expenses net of all reductions | .29%G |
| Net investment income (loss) | 3.85%G |
| Supplemental Data | |
| Net assets, end of period (000 omitted) | $228,564 |
| Portfolio turnover rateH | 20% |
A For the period April 6, 2021 (commencement of sale of shares) through March 31, 2022.
B Calculated based on average shares outstanding during the period.
C Net investment income (loss) is affected by the timing of the declaration of dividends by any underlying mutual funds or exchange-traded funds (ETFs). Net investment income (loss) of any such underlying funds is not included in the Fund's net investment income (loss) ratio.
D Total returns for periods of less than one year are not annualized.
E Fees and expenses of any underlying mutual funds or exchange-traded funds (ETFs) are not included in the Fund's expense ratio. The Fund indirectly bears its proportionate share of these expenses. For additional expense information related to investments in Fidelity Central Funds, please refer to the "Investments in Fidelity Central Funds" note found in the Notes to Financial Statements section of the most recent Annual or Semi-Annual report.
F Expense ratios reflect operating expenses of the class. Expenses before reductions do not reflect amounts reimbursed, waived, or reduced through arrangements with the investment adviser, brokerage services, or other offset arrangements, if applicable, and do not represent the amount paid by the class during periods when reimbursements, waivers or reductions occur.
G Annualized
H Amount does not include the portfolio activity of any underlying mutual funds or exchange-traded funds (ETFs).
See accompanying notes which are an integral part of the financial statements.
Fidelity Freedom Blend 2055 Fund Class Z
| Years ended March 31, | 2022 | 2021 | 2020 | 2019 A |
| Selected Per–Share Data | | | | |
| Net asset value, beginning of period | $12.36 | $8.30 | $9.52 | $10.00 |
| Income from Investment Operations | | | | |
| Net investment income (loss)B,C | .25 | .14 | .19 | .06 |
| Net realized and unrealized gain (loss) | .23 | 4.45 | (1.10) | (.22) |
| Total from investment operations | .48 | 4.59 | (.91) | (.16) |
| Distributions from net investment income | (.30) | (.14) | (.17) | (.15) |
| Distributions from net realized gain | (.76) | (.39) | (.14) | (.16) |
| Total distributions | (1.06) | (.53) | (.31) | (.32)D |
| Net asset value, end of period | $11.78 | $12.36 | $8.30 | $9.52 |
| Total ReturnE | 3.41% | 56.03% | (10.23)% | (1.23)% |
| Ratios to Average Net AssetsC,F,G | | | | |
| Expenses before reductions | .44% | .44% | .44% | .44%H |
| Expenses net of fee waivers, if any | .44% | .44% | .44% | .44%H |
| Expenses net of all reductions | .44% | .44% | .44% | .44%H |
| Net investment income (loss) | 2.00% | 1.27% | 1.93% | 1.05%H |
| Supplemental Data | | | | |
| Net assets, end of period (000 omitted) | $1,649 | $217 | $89 | $99 |
| Portfolio turnover rateI | 20% | 21% | 26% | 14%H |
A For the period August 31, 2018 (commencement of operations) through March 31, 2019.
B Calculated based on average shares outstanding during the period.
C Net investment income (loss) is affected by the timing of the declaration of dividends by any underlying mutual funds or exchange-traded funds (ETFs). Net investment income (loss) of any such underlying funds is not included in the Fund's net investment income (loss) ratio.
D Total distributions per share do not sum due to rounding.
E Total returns for periods of less than one year are not annualized.
F Fees and expenses of any underlying mutual funds or exchange-traded funds (ETFs) are not included in the Fund's expense ratio. The Fund indirectly bears its proportionate share of these expenses. For additional expense information related to investments in Fidelity Central Funds, please refer to the "Investments in Fidelity Central Funds" note found in the Notes to Financial Statements section of the most recent Annual or Semi-Annual report.
G Expense ratios reflect operating expenses of the class. Expenses before reductions do not reflect amounts reimbursed, waived, or reduced through arrangements with the investment adviser, brokerage services, or other offset arrangements, if applicable, and do not represent the amount paid by the class during periods when reimbursements, waivers or reductions occur.
H Annualized
I Amount does not include the portfolio activity of any underlying mutual funds or exchange-traded funds (ETFs).
See accompanying notes which are an integral part of the financial statements.
Fidelity Freedom Blend 2055 Fund Class Z6
| Years ended March 31, | 2022 | 2021 | 2020 | 2019 A |
| Selected Per–Share Data | | | | |
| Net asset value, beginning of period | $12.34 | $8.30 | $9.52 | $10.00 |
| Income from Investment Operations | | | | |
| Net investment income (loss)B,C | .26 | .15 | .19 | .06 |
| Net realized and unrealized gain (loss) | .23 | 4.44 | (1.09) | (.22) |
| Total from investment operations | .49 | 4.59 | (.90) | (.16) |
| Distributions from net investment income | (.32) | (.16) | (.18) | (.16) |
| Distributions from net realized gain | (.75) | (.40) | (.14) | (.16) |
| Total distributions | (1.07) | (.55)D | (.32) | (.32) |
| Net asset value, end of period | $11.76 | $12.34 | $8.30 | $9.52 |
| Total ReturnE | 3.52% | 56.10% | (10.11)% | (1.19)% |
| Ratios to Average Net AssetsC,F,G | | | | |
| Expenses before reductions | .34% | .34% | .35%H | .34%I |
| Expenses net of fee waivers, if any | .34% | .34% | .35%H | .34%I |
| Expenses net of all reductions | .34% | .34% | .35%H | .34%I |
| Net investment income (loss) | 2.11% | 1.37% | 2.03% | 1.15%I |
| Supplemental Data | | | | |
| Net assets, end of period (000 omitted) | $35,927 | $3,072 | $694 | $99 |
| Portfolio turnover rateJ | 20% | 21% | 26% | 14%I |
A For the period August 31, 2018 (commencement of operations) through March 31, 2019.
B Calculated based on average shares outstanding during the period.
C Net investment income (loss) is affected by the timing of the declaration of dividends by any underlying mutual funds or exchange-traded funds (ETFs). Net investment income (loss) of any such underlying funds is not included in the Fund's net investment income (loss) ratio.
D Total distributions per share do not sum due to rounding.
E Total returns for periods of less than one year are not annualized.
F Fees and expenses of any underlying mutual funds or exchange-traded funds (ETFs) are not included in the Fund's expense ratio. The Fund indirectly bears its proportionate share of these expenses. For additional expense information related to investments in Fidelity Central Funds, please refer to the "Investments in Fidelity Central Funds" note found in the Notes to Financial Statements section of the most recent Annual or Semi-Annual report.
G Expense ratios reflect operating expenses of the class. Expenses before reductions do not reflect amounts reimbursed, waived, or reduced through arrangements with the investment adviser, brokerage services, or other offset arrangements, if applicable, and do not represent the amount paid by the class during periods when reimbursements, waivers or reductions occur.
H On certain classes, the size and fluctuation of net assets and expense amounts may cause ratios to differ from contractual rates.
I Annualized
J Amount does not include the portfolio activity of any underlying mutual funds or exchange-traded funds (ETFs).
See accompanying notes which are an integral part of the financial statements.
Fidelity Freedom® Blend 2060 Fund
Investment Summary (Unaudited)
The information in the following tables is based on the direct investments of the Fund.
Top Holdings as of March 31, 2022
| | % of fund's net assets |
| Fidelity Series Large Cap Value Index Fund | 14.5 |
| Fidelity Series Emerging Markets Opportunities Fund | 12.7 |
| Fidelity Series Blue Chip Growth Fund | 10.8 |
| Fidelity Series Large Cap Stock Fund | 7.6 |
| Fidelity Series Large Cap Growth Index Fund | 6.8 |
| Fidelity Series International Value Fund | 6.6 |
| Fidelity Series Overseas Fund | 6.6 |
| Fidelity Series International Growth Fund | 6.5 |
| Fidelity Series Value Discovery Fund | 5.4 |
| Fidelity Series Long-Term Treasury Bond Index Fund | 5.4 |
| | 82.9 |
Asset Allocation (% of fund's net assets)
| Period end |
| | Domestic Equity Funds | 50.3% |
| | International Equity Funds | 41.9% |
| | Bond Funds | 7.7% |
| | Short-Term Investments | 0.1% |

Percentages are adjusted for the effect of futures contracts and swaps, if applicable.
Domestic Equity Funds category includes Fidelity Series Commodity Strategy Fund which invests in commodity-related investments.
Fidelity Freedom® Blend 2060 Fund
Schedule of Investments March 31, 2022
Showing Percentage of Net Assets
| U.S. Treasury Obligations - 0.1% | | | |
| | | Principal Amount | Value |
| U.S. Treasury Bills, yield at date of purchase 0.12% to 0.5% 4/14/22 to 6/23/22 (a) | | | |
| (Cost $159,941) | | 160,000 | 159,951 |
| | | Shares | Value |
|
| Domestic Equity Funds - 50.3% | | | |
| Fidelity Series Blue Chip Growth Fund (b) | | 1,766,551 | $25,385,337 |
| Fidelity Series Commodity Strategy Fund (b) | | 680,234 | 3,475,997 |
| Fidelity Series Large Cap Growth Index Fund (b) | | 908,960 | 15,997,698 |
| Fidelity Series Large Cap Stock Fund (b) | | 938,748 | 17,845,603 |
| Fidelity Series Large Cap Value Index Fund (b) | | 2,224,106 | 34,162,271 |
| Fidelity Series Small Cap Opportunities Fund (b) | | 630,336 | 8,585,174 |
| Fidelity Series Value Discovery Fund (b) | | 789,379 | 12,630,067 |
| TOTAL DOMESTIC EQUITY FUNDS | | | |
| (Cost $108,466,949) | | | 118,082,147 |
|
| International Equity Funds - 41.9% | | | |
| Fidelity Series Canada Fund (b) | | 494,203 | 7,670,030 |
| Fidelity Series Emerging Markets Fund (b) | | 349,490 | 3,243,263 |
| Fidelity Series Emerging Markets Opportunities Fund (b) | | 1,623,017 | 29,863,515 |
| Fidelity Series International Growth Fund (b) | | 925,551 | 15,345,635 |
| Fidelity Series International Index Fund (b) | | 569,412 | 6,514,071 |
| Fidelity Series International Small Cap Fund (b) | | 266,563 | 4,784,802 |
| Fidelity Series International Value Fund (b) | | 1,404,900 | 15,496,049 |
| Fidelity Series Overseas Fund (b) | | 1,222,598 | 15,429,188 |
| TOTAL INTERNATIONAL EQUITY FUNDS | | | |
| (Cost $100,768,397) | | | 98,346,553 |
|
| Bond Funds - 7.7% | | | |
| Fidelity Series 5+ Year Inflation-Protected Bond Index Fund (b) | | 24,508 | 235,281 |
| Fidelity Series Corporate Bond Fund (b) | | 24,999 | 252,486 |
| Fidelity Series Emerging Markets Debt Fund (b) | | 139,047 | 1,147,139 |
| Fidelity Series Emerging Markets Debt Local Currency Fund (b) | | 43,030 | 387,697 |
| Fidelity Series Floating Rate High Income Fund (b) | | 25,494 | 234,289 |
| Fidelity Series Government Bond Index Fund (b) | | 37,045 | 369,704 |
| Fidelity Series High Income Fund (b) | | 156,611 | 1,423,597 |
| Fidelity Series Investment Grade Bond Fund (b) | | 35,785 | 390,410 |
| Fidelity Series Investment Grade Securitized Fund (b) | | 26,914 | 261,605 |
| Fidelity Series Long-Term Treasury Bond Index Fund (b) | | 1,653,177 | 12,597,211 |
| Fidelity Series Real Estate Income Fund (b) | | 73,733 | 837,607 |
| TOTAL BOND FUNDS | | | |
| (Cost $19,428,549) | | | 18,137,026 |
|
| Short-Term Funds - 0.0% | | | |
| Fidelity Cash Central Fund 0.31% (c) | | | |
| (Cost $49,764) | | 49,754 | 49,764 |
| TOTAL INVESTMENT IN SECURITIES - 100.0% | | | |
| (Cost $228,873,600) | | | 234,775,441 |
| NET OTHER ASSETS (LIABILITIES) - 0.0% | | | 23,271 |
| NET ASSETS - 100% | | | $234,798,712 |
| Futures Contracts | | | | | |
| | Number of contracts | Expiration Date | Notional Amount | Value | Unrealized Appreciation/(Depreciation) |
| Purchased | | | | | |
| Equity Index Contracts | | | | | |
| ICE E-mini MSCI EAFE Index Contracts (United States) | 4 | June 2022 | $428,880 | $24,380 | $24,380 |
| ICE E-mini MSCI Emerging Markets Index Contracts (United States) | 16 | June 2022 | 900,400 | 24,555 | 24,555 |
| Sold | | | | | |
| Equity Index Contracts | | | | | |
| CME Micro E-mini S&P 500 Index Contracts (United States) | 5 | June 2022 | 1,132,688 | (73,223) | (73,223) |
| TOTAL FUTURES CONTRACTS | | | | | $(24,288) |
The notional amount of futures purchased as a percentage of Net Assets is 0.6%
The notional amount of futures sold as a percentage of Net Assets is 0.5%
Legend
(a) Security or a portion of the security was pledged to cover margin requirements for futures contracts. At period end, the value of securities pledged amounted to $156,955.
(b) Affiliated Fund
(c) Affiliated fund that is generally available only to investment companies and other accounts managed by Fidelity Investments. The rate quoted is the annualized seven-day yield of the fund at period end. A complete unaudited listing of the fund's holdings as of its most recent quarter end is available upon request. In addition, each Fidelity Central Fund's financial statements, which are not covered by the Fund's Report of Independent Registered Public Accounting Firm, are available on the SEC's website or upon request.
Affiliated Central Funds
Fiscal year to date information regarding the Fund's investments in Fidelity Central Funds, including the ownership percentage, is presented below.
| Fund | Value, beginning of period | Purchases | Sales Proceeds | Dividend Income | Realized Gain/Loss | Change in Unrealized appreciation (depreciation) | Value, end of period | % ownership, end of period |
| Fidelity Cash Central Fund 0.31% | $-- | $328,775 | $279,011 | $29 | $-- | $-- | $49,764 | 0.0% |
| Total | $-- | $328,775 | $279,011 | $29 | $-- | $-- | $49,764 | |
Amounts in the income column in the above table include any capital gain distributions from underlying funds, which are presented in the corresponding line-item in the Statement of Operations, if applicable.
Affiliated Underlying Funds
Fiscal year to date information regarding the Fund's investments in affiliated Underlying Funds is presented below. Exchanges between classes of the same affiliated Underlying Funds may occur. If an underlying Fund changes its name, the name presented below is the name in effect at period end.
| Affiliate | Value, beginning of period | Purchases(a) | Sales Proceeds(a) | Dividend Income | Realized Gain (loss) | Change in Unrealized appreciation (depreciation) | Value, end of period |
| Fidelity Series 0-5 Year Inflation-Protected Bond Index Fund | $-- | $986,828 | $983,209 | $2,986 | $(3,174) | $-- | $-- |
| Fidelity Series 5+ Year Inflation-Protected Bond Index Fund | -- | 2,082,788 | 1,773,345 | 9,800 | (67,856) | (6,306) | 235,281 |
| Fidelity Series Blue Chip Growth Fund | 14,493,113 | 20,232,154 | 4,912,577 | 4,507,060 | (333,288) | (4,094,065) | 25,385,337 |
| Fidelity Series Canada Fund | 3,187,380 | 4,083,906 | 595,276 | 135,861 | (6,869) | 1,000,889 | 7,670,030 |
| Fidelity Series Commodity Strategy Fund | 3,656,970 | 4,418,912 | 4,767,050 | 1,658,131 | (186,313) | 353,478 | 3,475,997 |
| Fidelity Series Corporate Bond Fund | 14,435 | 373,130 | 130,779 | 1,151 | (3,544) | (756) | 252,486 |
| Fidelity Series Emerging Markets Debt Fund | 720,725 | 700,549 | 155,781 | 46,914 | (6,013) | (112,341) | 1,147,139 |
| Fidelity Series Emerging Markets Debt Local Currency Fund | 240,892 | 236,293 | 46,336 | 14,528 | (3,988) | (39,164) | 387,697 |
| Fidelity Series Emerging Markets Fund | 2,095,811 | 2,163,962 | 309,014 | 101,110 | (10,715) | (696,781) | 3,243,263 |
| Fidelity Series Emerging Markets Opportunities Fund | 18,841,581 | 22,963,298 | 2,827,849 | 3,179,822 | (119,513) | (8,994,002) | 29,863,515 |
| Fidelity Series Floating Rate High Income Fund | 145,194 | 139,658 | 50,163 | 8,761 | (40) | (360) | 234,289 |
| Fidelity Series Government Bond Index Fund | 17,620 | 579,989 | 223,242 | 557 | (4,045) | (618) | 369,704 |
| Fidelity Series Government Money Market Fund 0.31% | 341,434 | 89,267 | 430,701 | 72 | -- | -- | -- |
| Fidelity Series High Income Fund | 836,325 | 854,956 | 217,251 | 64,556 | (4,441) | (45,992) | 1,423,597 |
| Fidelity Series Inflation-Protected Bond Index Fund | 2,632,303 | 1,578,470 | 4,323,834 | 43,297 | 200,487 | (87,426) | -- |
| Fidelity Series International Growth Fund | 7,853,697 | 10,134,890 | 922,059 | 1,100,593 | (17,791) | (1,703,102) | 15,345,635 |
| Fidelity Series International Index Fund | 3,272,708 | 3,854,905 | 331,719 | 146,141 | (10,953) | (270,870) | 6,514,071 |
| Fidelity Series International Small Cap Fund | 2,809,546 | 3,041,924 | 223,967 | 570,887 | (10,696) | (832,005) | 4,784,802 |
| Fidelity Series International Value Fund | 7,832,972 | 9,469,749 | 1,798,778 | 691,041 | (39,310) | 31,416 | 15,496,049 |
| Fidelity Series Investment Grade Bond Fund | 19,953 | 627,311 | 251,937 | 1,468 | (4,022) | (895) | 390,410 |
| Fidelity Series Investment Grade Securitized Fund | 13,842 | 377,914 | 127,752 | 453 | (1,828) | (571) | 261,605 |
| Fidelity Series Large Cap Growth Index Fund | 9,149,383 | 9,337,643 | 3,543,463 | 431,061 | (64,386) | 1,118,521 | 15,997,698 |
| Fidelity Series Large Cap Stock Fund | 9,994,618 | 10,225,757 | 2,596,116 | 1,320,638 | (77,530) | 298,874 | 17,845,603 |
| Fidelity Series Large Cap Value Index Fund | 19,091,927 | 19,251,110 | 4,953,938 | 2,054,417 | (113,807) | 886,979 | 34,162,271 |
| Fidelity Series Long-Term Treasury Bond Index Fund | 3,605,691 | 10,512,332 | 829,495 | 157,849 | (81,593) | (609,724) | 12,597,211 |
| Fidelity Series Overseas Fund | 7,851,748 | 9,265,253 | 1,064,208 | 407,165 | (15,394) | (608,211) | 15,429,188 |
| Fidelity Series Real Estate Income Fund | 501,036 | 457,174 | 128,344 | 29,802 | (1,774) | 9,515 | 837,607 |
| Fidelity Series Short-Term Credit Fund | 168,457 | 61,883 | 230,262 | 925 | 793 | (871) | -- |
| Fidelity Series Small Cap Opportunities Fund | 4,826,919 | 6,527,952 | 1,016,167 | 1,818,074 | (97,954) | (1,655,576) | 8,585,174 |
| Fidelity Series Treasury Bill Index Fund | 542,511 | 206,148 | 748,659 | 114 | (288) | 288 | -- |
| Fidelity Series Value Discovery Fund | 7,054,331 | 7,577,178 | 1,807,386 | 1,333,508 | (47,632) | (146,424) | 12,630,067 |
| Total | $131,813,122 | $162,413,283 | $42,320,657 | $19,838,742 | $(1,133,477) | $(16,206,100) | $234,565,726 |
(a) Includes the value of shares purchased or redeemed through in-kind transactions, if applicable.
Amounts in the income column in the above table include any capital gain distributions from underlying funds, which are presented in the corresponding line-item in the Statement of Operations, if applicable.
Investment Valuation
The following is a summary of the inputs used, as of March 31, 2022, involving the Fund's assets and liabilities carried at fair value. The inputs or methodology used for valuing securities may not be an indication of the risk associated with investing in those securities. For more information on valuation inputs, and their aggregation into the levels used below, please refer to the Investment Valuation section in the accompanying Notes to Financial Statements.
| | Valuation Inputs at Reporting Date: |
| Description | Total | Level 1 | Level 2 | Level 3 |
| Investments in Securities: | | | | |
| Other Short-Term Investments and Net Other Assets | $159,951 | $-- | $159,951 | $-- |
| Domestic Equity Funds | 118,082,147 | 118,082,147 | -- | -- |
| International Equity Funds | 98,346,553 | 98,346,553 | -- | -- |
| Bond Funds | 18,137,026 | 18,137,026 | -- | -- |
| Short-Term Funds | 49,764 | 49,764 | -- | -- |
| Total Investments in Securities: | $234,775,441 | $234,615,490 | $159,951 | $-- |
| Derivative Instruments: | | | | |
| Assets | | | | |
| Futures Contracts | $48,935 | $48,935 | $-- | $-- |
| Total Assets | $48,935 | $48,935 | $-- | $-- |
| Liabilities | | | | |
| Futures Contracts | $(73,223) | $(73,223) | $-- | $-- |
| Total Liabilities | $(73,223) | $(73,223) | $-- | $-- |
| Total Derivative Instruments: | $(24,288) | $(24,288) | $-- | $-- |
Value of Derivative Instruments
The following table is a summary of the Fund's value of derivative instruments by primary risk exposure as of March 31, 2022. For additional information on derivative instruments, please refer to the Derivative Instruments section in the accompanying Notes to Financial Statements.
| Primary Risk Exposure / Derivative Type | Value |
| | Asset | Liability |
| Equity Risk | | |
| Futures Contracts(a) | $48,935 | $(73,223) |
| Total Equity Risk | 48,935 | (73,223) |
| Total Value of Derivatives | $48,935 | $(73,223) |
(a) Reflects gross cumulative appreciation (depreciation) on futures contracts as presented in the Schedule of Investments. In the Statement of Assets and Liabilities, the period end daily variation margin is included in receivable or payable for daily variation margin on futures contracts, and the net cumulative appreciation (depreciation) is included in Total accumulated earnings (loss).
See accompanying notes which are an integral part of the financial statements.
Fidelity Freedom® Blend 2060 Fund
Financial Statements
Statement of Assets and Liabilities
| | | March 31, 2022 |
| Assets | | |
Investment in securities, at value — See accompanying schedule:
Unaffiliated issuers (cost $159,941) | $159,951 | |
| Fidelity Central Funds (cost $49,764) | 49,764 | |
| Other affiliated issuers (cost $228,663,895) | 234,565,726 | |
| Total Investment in Securities (cost $228,873,600) | | $234,775,441 |
| Cash | | 36,629 |
| Receivable for investments sold | | 4,498,031 |
| Receivable for fund shares sold | | 572,304 |
| Distributions receivable from Fidelity Central Funds | | 14 |
| Total assets | | 239,882,419 |
| Liabilities | | |
| Payable for investments purchased | $4,560,406 | |
| Payable for fund shares redeemed | 447,564 | |
| Accrued management fee | 64,656 | |
| Distribution and service plan fees payable | 1,167 | |
| Payable for daily variation margin on futures contracts | 9,914 | |
| Total liabilities | | 5,083,707 |
| Net Assets | | $234,798,712 |
| Net Assets consist of: | | |
| Paid in capital | | $224,389,805 |
| Total accumulated earnings (loss) | | 10,408,907 |
| Net Assets | | $234,798,712 |
| Net Asset Value and Maximum Offering Price | | |
| Class A: | | |
| Net Asset Value and redemption price per share ($2,021,119 ÷ 170,964 shares)(a) | | $11.82 |
| Maximum offering price per share (100/94.25 of $11.82) | | $12.54 |
| Class M: | | |
| Net Asset Value and redemption price per share ($588,595 ÷ 49,979 shares)(a) | | $11.78 |
| Maximum offering price per share (100/96.50 of $11.78) | | $12.21 |
| Class C: | | |
| Net Asset Value and offering price per share ($643,783 ÷ 55,118 shares)(a) | | $11.68 |
| Fidelity Freedom Blend 2060 Fund: | | |
| Net Asset Value, offering price and redemption price per share ($14,200,673 ÷ 1,197,276 shares) | | $11.86 |
| Class K: | | |
| Net Asset Value, offering price and redemption price per share ($3,292,411 ÷ 277,349 shares) | | $11.87 |
| Class K6: | | |
| Net Asset Value, offering price and redemption price per share ($133,841,806 ÷ 11,245,912 shares) | | $11.90 |
| Class I: | | |
| Net Asset Value, offering price and redemption price per share ($5,358,506 ÷ 452,122 shares) | | $11.85 |
| Class Z: | | |
| Net Asset Value, offering price and redemption price per share ($544,830 ÷ 45,817 shares) | | $11.89 |
| Class Z6: | | |
| Net Asset Value, offering price and redemption price per share ($12,178,199 ÷ 1,024,029 shares) | | $11.89 |
| Premier Class: | | |
| Net Asset Value, offering price and redemption price per share ($62,128,790 ÷ 5,225,234 shares) | | $11.89 |
(a) Redemption price per share is equal to net asset value less any applicable contingent deferred sales charge.
See accompanying notes which are an integral part of the financial statements.
Statement of Operations
| | | Year ended March 31, 2022 |
| Investment Income | | |
| Dividends: | | |
| Affiliated issuers | | $5,720,942 |
| Interest | | 42 |
| Income from Fidelity Central Funds | | 29 |
| Total income | | 5,721,013 |
| Expenses | | |
| Management fee | $672,584 | |
| Distribution and service plan fees | 12,318 | |
| Independent trustees' fees and expenses | 535 | |
| Total expenses | | 685,437 |
| Net investment income (loss) | | 5,035,576 |
| Realized and Unrealized Gain (Loss) | | |
| Net realized gain (loss) on: | | |
| Investment securities: | | |
| Affiliated issuers | (1,133,477) | |
| Futures contracts | (71,145) | |
| Capital gain distributions from underlying funds: | | |
| Affiliated issuers | 14,117,800 | |
| Total net realized gain (loss) | | 12,913,178 |
| Change in net unrealized appreciation (depreciation) on: | | |
| Investment securities: | | |
| Unaffiliated issuers | 10 | |
| Affiliated issuers | (16,206,100) | |
| Futures contracts | (24,288) | |
| Total change in net unrealized appreciation (depreciation) | | (16,230,378) |
| Net gain (loss) | | (3,317,200) |
| Net increase (decrease) in net assets resulting from operations | | $1,718,376 |
See accompanying notes which are an integral part of the financial statements.
Statement of Changes in Net Assets
| | Year ended March 31, 2022 | Year ended March 31, 2021 |
| Increase (Decrease) in Net Assets | | |
| Operations | | |
| Net investment income (loss) | $5,035,576 | $1,254,362 |
| Net realized gain (loss) | 12,913,178 | 5,402,057 |
| Change in net unrealized appreciation (depreciation) | (16,230,378) | 30,721,613 |
| Net increase (decrease) in net assets resulting from operations | 1,718,376 | 37,378,032 |
| Distributions to shareholders | (15,684,311) | (4,331,551) |
| Share transactions - net increase (decrease) | 116,988,606 | 47,556,542 |
| Total increase (decrease) in net assets | 103,022,671 | 80,603,023 |
| Net Assets | | |
| Beginning of period | 131,776,041 | 51,173,018 |
| End of period | $234,798,712 | $131,776,041 |
See accompanying notes which are an integral part of the financial statements.
Financial Highlights
Fidelity Freedom Blend 2060 Fund Class A
| Years ended March 31, | 2022 | 2021 | 2020 | 2019 A |
| Selected Per–Share Data | | | | |
| Net asset value, beginning of period | $12.38 | $8.30 | $9.53 | $10.00 |
| Income from Investment Operations | | | | |
| Net investment income (loss)B,C | .24 | .10 | .16 | .08 |
| Net realized and unrealized gain (loss) | .20 | 4.45 | (1.11) | (.27) |
| Total from investment operations | .44 | 4.55 | (.95) | (.19) |
| Distributions from net investment income | (.28) | (.12) | (.14) | (.14) |
| Distributions from net realized gain | (.72) | (.35) | (.14) | (.15) |
| Total distributions | (1.00) | (.47) | (.28) | (.28)D |
| Net asset value, end of period | $11.82 | $12.38 | $8.30 | $9.53 |
| Total ReturnE,F,G | 3.08% | 55.38% | (10.54)% | (1.50)% |
| Ratios to Average Net AssetsC,H,I | | | | |
| Expenses before reductions | .79% | .79% | .79% | .80%J,K |
| Expenses net of fee waivers, if any | .79% | .79% | .79% | .80%J,K |
| Expenses net of all reductions | .79% | .79% | .79% | .80%J,K |
| Net investment income (loss) | 1.90% | .93% | 1.62% | 1.50%J |
| Supplemental Data | | | | |
| Net assets, end of period (000 omitted) | $2,021 | $1,205 | $493 | $243 |
| Portfolio turnover rateL | 22% | 22% | 27% | 11%J |
A For the period August 31, 2018 (commencement of operations) through March 31, 2019.
B Calculated based on average shares outstanding during the period.
C Net investment income (loss) is affected by the timing of the declaration of dividends by any underlying mutual funds or exchange-traded funds (ETFs). Net investment income (loss) of any such underlying funds is not included in the Fund's net investment income (loss) ratio.
D Total distributions per share do not sum due to rounding.
E Total returns for periods of less than one year are not annualized.
F Total returns would have been lower if certain expenses had not been reduced during the applicable periods shown.
G Total returns do not include the effect of the sales charges.
H Fees and expenses of any underlying mutual funds or exchange-traded funds (ETFs) are not included in the Fund's expense ratio. The Fund indirectly bears its proportionate share of these expenses. For additional expense information related to investments in Fidelity Central Funds, please refer to the "Investments in Fidelity Central Funds" note found in the Notes to Financial Statements section of the most recent Annual or Semi-Annual report.
I Expense ratios reflect operating expenses of the class. Expenses before reductions do not reflect amounts reimbursed, waived, or reduced through arrangements with the investment adviser, brokerage services, or other offset arrangements, if applicable, and do not represent the amount paid by the class during periods when reimbursements, waivers or reductions occur.
J Annualized
K On certain classes, the size and fluctuation of net assets and expense amounts may cause ratios to differ from contractual rates.
L Amount does not include the portfolio activity of any underlying mutual funds or exchange-traded funds (ETFs).
See accompanying notes which are an integral part of the financial statements.
Fidelity Freedom Blend 2060 Fund Class M
| Years ended March 31, | 2022 | 2021 | 2020 | 2019 A |
| Selected Per–Share Data | | | | |
| Net asset value, beginning of period | $12.35 | $8.29 | $9.53 | $10.00 |
| Income from Investment Operations | | | | |
| Net investment income (loss)B,C | .21 | .07 | .14 | .07 |
| Net realized and unrealized gain (loss) | .19 | 4.45 | (1.12) | (.26) |
| Total from investment operations | .40 | 4.52 | (.98) | (.19) |
| Distributions from net investment income | (.25) | (.11) | (.12) | (.13) |
| Distributions from net realized gain | (.72) | (.35) | (.14) | (.15) |
| Total distributions | (.97) | (.46) | (.26) | (.28) |
| Net asset value, end of period | $11.78 | $12.35 | $8.29 | $9.53 |
| Total ReturnD,E | 2.79% | 55.06% | (10.80)% | (1.59)% |
| Ratios to Average Net AssetsC,F,G | | | | |
| Expenses before reductions | 1.04% | 1.04% | 1.04% | 1.04%H |
| Expenses net of fee waivers, if any | 1.04% | 1.04% | 1.04% | 1.04%H |
| Expenses net of all reductions | 1.04% | 1.04% | 1.04% | 1.04%H |
| Net investment income (loss) | 1.65% | .68% | 1.37% | 1.25%H |
| Supplemental Data | | | | |
| Net assets, end of period (000 omitted) | $589 | $414 | $174 | $143 |
| Portfolio turnover rateI | 22% | 22% | 27% | 11%H |
A For the period August 31, 2018 (commencement of operations) through March 31, 2019.
B Calculated based on average shares outstanding during the period.
C Net investment income (loss) is affected by the timing of the declaration of dividends by any underlying mutual funds or exchange-traded funds (ETFs). Net investment income (loss) of any such underlying funds is not included in the Fund's net investment income (loss) ratio.
D Total returns for periods of less than one year are not annualized.
E Total returns do not include the effect of the sales charges.
F Fees and expenses of any underlying mutual funds or exchange-traded funds (ETFs) are not included in the Fund's expense ratio. The Fund indirectly bears its proportionate share of these expenses. For additional expense information related to investments in Fidelity Central Funds, please refer to the "Investments in Fidelity Central Funds" note found in the Notes to Financial Statements section of the most recent Annual or Semi-Annual report.
G Expense ratios reflect operating expenses of the class. Expenses before reductions do not reflect amounts reimbursed, waived, or reduced through arrangements with the investment adviser, brokerage services, or other offset arrangements, if applicable, and do not represent the amount paid by the class during periods when reimbursements, waivers or reductions occur.
H Annualized
I Amount does not include the portfolio activity of any underlying mutual funds or exchange-traded funds (ETFs).
See accompanying notes which are an integral part of the financial statements.
Fidelity Freedom Blend 2060 Fund Class C
| Years ended March 31, | 2022 | 2021 | 2020 | 2019 A |
| Selected Per–Share Data | | | | |
| Net asset value, beginning of period | $12.27 | $8.26 | $9.52 | $10.00 |
| Income from Investment Operations | | | | |
| Net investment income (loss)B,C | .14 | .02 | .09 | .04 |
| Net realized and unrealized gain (loss) | .20 | 4.41 | (1.11) | (.26) |
| Total from investment operations | .34 | 4.43 | (1.02) | (.22) |
| Distributions from net investment income | (.21) | (.07) | (.10) | (.12) |
| Distributions from net realized gain | (.72) | (.35) | (.14) | (.15) |
| Total distributions | (.93) | (.42) | (.24) | (.26)D |
| Net asset value, end of period | $11.68 | $12.27 | $8.26 | $9.52 |
| Total ReturnE,F | 2.30% | 54.17% | (11.22)% | (1.87)% |
| Ratios to Average Net AssetsC,G,H | | | | |
| Expenses before reductions | 1.54% | 1.54% | 1.54% | 1.54%I |
| Expenses net of fee waivers, if any | 1.54% | 1.54% | 1.54% | 1.54%I |
| Expenses net of all reductions | 1.54% | 1.54% | 1.54% | 1.54%I |
| Net investment income (loss) | 1.15% | .18% | .87% | .76%I |
| Supplemental Data | | | | |
| Net assets, end of period (000 omitted) | $644 | $484 | $222 | $107 |
| Portfolio turnover rateJ | 22% | 22% | 27% | 11%I |
A For the period August 31, 2018 (commencement of operations) through March 31, 2019.
B Calculated based on average shares outstanding during the period.
C Net investment income (loss) is affected by the timing of the declaration of dividends by any underlying mutual funds or exchange-traded funds (ETFs). Net investment income (loss) of any such underlying funds is not included in the Fund's net investment income (loss) ratio.
D Total distributions per share do not sum due to rounding.
E Total returns for periods of less than one year are not annualized.
F Total returns do not include the effect of the contingent deferred sales charge.
G Fees and expenses of any underlying mutual funds or exchange-traded funds (ETFs) are not included in the Fund's expense ratio. The Fund indirectly bears its proportionate share of these expenses. For additional expense information related to investments in Fidelity Central Funds, please refer to the "Investments in Fidelity Central Funds" note found in the Notes to Financial Statements section of the most recent Annual or Semi-Annual report.
H Expense ratios reflect operating expenses of the class. Expenses before reductions do not reflect amounts reimbursed, waived, or reduced through arrangements with the investment adviser, brokerage services, or other offset arrangements, if applicable, and do not represent the amount paid by the class during periods when reimbursements, waivers or reductions occur.
I Annualized
J Amount does not include the portfolio activity of any underlying mutual funds or exchange-traded funds (ETFs).
See accompanying notes which are an integral part of the financial statements.
Fidelity Freedom Blend 2060 Fund
| Years ended March 31, | 2022 | 2021 | 2020 | 2019 A |
| Selected Per–Share Data | | | | |
| Net asset value, beginning of period | $12.41 | $8.31 | $9.54 | $10.00 |
| Income from Investment Operations | | | | |
| Net investment income (loss)B,C | .27 | .13 | .18 | .09 |
| Net realized and unrealized gain (loss) | .20 | 4.46 | (1.11) | (.25) |
| Total from investment operations | .47 | 4.59 | (.93) | (.16) |
| Distributions from net investment income | (.30) | (.14) | (.16) | (.15) |
| Distributions from net realized gain | (.72) | (.35) | (.14) | (.15) |
| Total distributions | (1.02) | (.49) | (.30) | (.30) |
| Net asset value, end of period | $11.86 | $12.41 | $8.31 | $9.54 |
| Total ReturnD | 3.31% | 55.78% | (10.35)% | (1.27)% |
| Ratios to Average Net AssetsC,E,F | | | | |
| Expenses before reductions | .54% | .54% | .55%G | .54%H |
| Expenses net of fee waivers, if any | .54% | .54% | .55%G | .54%H |
| Expenses net of all reductions | .54% | .54% | .55%G | .54%H |
| Net investment income (loss) | 2.15% | 1.18% | 1.87% | 1.75%H |
| Supplemental Data | | | | |
| Net assets, end of period (000 omitted) | $14,201 | $6,778 | $2,773 | $453 |
| Portfolio turnover rateI | 22% | 22% | 27% | 11%H |
A For the period August 31, 2018 (commencement of operations) through March 31, 2019.
B Calculated based on average shares outstanding during the period.
C Net investment income (loss) is affected by the timing of the declaration of dividends by any underlying mutual funds or exchange-traded funds (ETFs). Net investment income (loss) of any such underlying funds is not included in the Fund's net investment income (loss) ratio.
D Total returns for periods of less than one year are not annualized.
E Fees and expenses of any underlying mutual funds or exchange-traded funds (ETFs) are not included in the Fund's expense ratio. The Fund indirectly bears its proportionate share of these expenses. For additional expense information related to investments in Fidelity Central Funds, please refer to the "Investments in Fidelity Central Funds" note found in the Notes to Financial Statements section of the most recent Annual or Semi-Annual report.
F Expense ratios reflect operating expenses of the class. Expenses before reductions do not reflect amounts reimbursed, waived, or reduced through arrangements with the investment adviser, brokerage services, or other offset arrangements, if applicable, and do not represent the amount paid by the class during periods when reimbursements, waivers or reductions occur.
G On certain classes, the size and fluctuation of net assets and expense amounts may cause ratios to differ from contractual rates.
H Annualized
I Amount does not include the portfolio activity of any underlying mutual funds or exchange-traded funds (ETFs).
See accompanying notes which are an integral part of the financial statements.
Fidelity Freedom Blend 2060 Fund Class K
| Years ended March 31, | 2022 | 2021 | 2020 | 2019 A |
| Selected Per–Share Data | | | | |
| Net asset value, beginning of period | $12.42 | $8.31 | $9.54 | $10.00 |
| Income from Investment Operations | | | | |
| Net investment income (loss)B,C | .29 | .14 | .20 | .10 |
| Net realized and unrealized gain (loss) | .19 | 4.47 | (1.11) | (.26) |
| Total from investment operations | .48 | 4.61 | (.91) | (.16) |
| Distributions from net investment income | (.30) | (.14) | (.18) | (.15) |
| Distributions from net realized gain | (.72) | (.35) | (.14) | (.15) |
| Total distributions | (1.03)D | (.50)D | (.32) | (.30) |
| Net asset value, end of period | $11.87 | $12.42 | $8.31 | $9.54 |
| Total ReturnE | 3.38% | 56.01% | (10.22)% | (1.28)% |
| Ratios to Average Net AssetsC,F,G | | | | |
| Expenses before reductions | .44% | .44% | .44% | .44%H |
| Expenses net of fee waivers, if any | .44% | .44% | .44% | .44%H |
| Expenses net of all reductions | .44% | .44% | .44% | .44%H |
| Net investment income (loss) | 2.25% | 1.28% | 1.97% | 1.85%H |
| Supplemental Data | | | | |
| Net assets, end of period (000 omitted) | $3,292 | $2,363 | $1,307 | $99 |
| Portfolio turnover rateI | 22% | 22% | 27% | 11%H |
A For the period August 31, 2018 (commencement of operations) through March 31, 2019.
B Calculated based on average shares outstanding during the period.
C Net investment income (loss) is affected by the timing of the declaration of dividends by any underlying mutual funds or exchange-traded funds (ETFs). Net investment income (loss) of any such underlying funds is not included in the Fund's net investment income (loss) ratio.
D Total distributions per share do not sum due to rounding.
E Total returns for periods of less than one year are not annualized.
F Fees and expenses of any underlying mutual funds or exchange-traded funds (ETFs) are not included in the Fund's expense ratio. The Fund indirectly bears its proportionate share of these expenses. For additional expense information related to investments in Fidelity Central Funds, please refer to the "Investments in Fidelity Central Funds" note found in the Notes to Financial Statements section of the most recent Annual or Semi-Annual report.
G Expense ratios reflect operating expenses of the class. Expenses before reductions do not reflect amounts reimbursed, waived, or reduced through arrangements with the investment adviser, brokerage services, or other offset arrangements, if applicable, and do not represent the amount paid by the class during periods when reimbursements, waivers or reductions occur.
H Annualized
I Amount does not include the portfolio activity of any underlying mutual funds or exchange-traded funds (ETFs).
See accompanying notes which are an integral part of the financial statements.
Fidelity Freedom Blend 2060 Fund Class K6
| Years ended March 31, | 2022 | 2021 | 2020 | 2019 A |
| Selected Per–Share Data | | | | |
| Net asset value, beginning of period | $12.44 | $8.32 | $9.54 | $10.00 |
| Income from Investment Operations | | | | |
| Net investment income (loss)B,C | .30 | .15 | .20 | .10 |
| Net realized and unrealized gain (loss) | .19 | 4.47 | (1.10) | (.26) |
| Total from investment operations | .49 | 4.62 | (.90) | (.16) |
| Distributions from net investment income | (.31) | (.15) | (.17) | (.15) |
| Distributions from net realized gain | (.73) | (.35) | (.14) | (.15) |
| Total distributions | (1.03)D | (.50) | (.32)D | (.30) |
| Net asset value, end of period | $11.90 | $12.44 | $8.32 | $9.54 |
| Total ReturnE | 3.49% | 56.17% | (10.12)% | (1.24)% |
| Ratios to Average Net AssetsC,F,G | | | | |
| Expenses before reductions | .34% | .34% | .34% | .34%H |
| Expenses net of fee waivers, if any | .34% | .34% | .34% | .34%H |
| Expenses net of all reductions | .34% | .34% | .34% | .34%H |
| Net investment income (loss) | 2.35% | 1.38% | 2.07% | 1.95%H |
| Supplemental Data | | | | |
| Net assets, end of period (000 omitted) | $133,842 | $116,569 | $44,655 | $1,261 |
| Portfolio turnover rateI | 22% | 22% | 27% | 11%H |
A For the period August 31, 2018 (commencement of operations) through March 31, 2019.
B Calculated based on average shares outstanding during the period.
C Net investment income (loss) is affected by the timing of the declaration of dividends by any underlying mutual funds or exchange-traded funds (ETFs). Net investment income (loss) of any such underlying funds is not included in the Fund's net investment income (loss) ratio.
D Total distributions per share do not sum due to rounding.
E Total returns for periods of less than one year are not annualized.
F Fees and expenses of any underlying mutual funds or exchange-traded funds (ETFs) are not included in the Fund's expense ratio. The Fund indirectly bears its proportionate share of these expenses. For additional expense information related to investments in Fidelity Central Funds, please refer to the "Investments in Fidelity Central Funds" note found in the Notes to Financial Statements section of the most recent Annual or Semi-Annual report.
G Expense ratios reflect operating expenses of the class. Expenses before reductions do not reflect amounts reimbursed, waived, or reduced through arrangements with the investment adviser, brokerage services, or other offset arrangements, if applicable, and do not represent the amount paid by the class during periods when reimbursements, waivers or reductions occur.
H Annualized
I Amount does not include the portfolio activity of any underlying mutual funds or exchange-traded funds (ETFs).
See accompanying notes which are an integral part of the financial statements.
Fidelity Freedom Blend 2060 Fund Class I
| Years ended March 31, | 2022 | 2021 | 2020 | 2019 A |
| Selected Per–Share Data | | | | |
| Net asset value, beginning of period | $12.40 | $8.30 | $9.54 | $10.00 |
| Income from Investment Operations | | | | |
| Net investment income (loss)B,C | .27 | .13 | .19 | .10 |
| Net realized and unrealized gain (loss) | .20 | 4.46 | (1.12) | (.27) |
| Total from investment operations | .47 | 4.59 | (.93) | (.17) |
| Distributions from net investment income | (.30) | (.13) | (.17) | (.15) |
| Distributions from net realized gain | (.72) | (.35) | (.14) | (.15) |
| Total distributions | (1.02) | (.49)D | (.31) | (.29)D |
| Net asset value, end of period | $11.85 | $12.40 | $8.30 | $9.54 |
| Total ReturnE | 3.33% | 55.83% | (10.37)% | (1.31)% |
| Ratios to Average Net AssetsC,F,G | | | | |
| Expenses before reductions | .54% | .54% | .54% | .54%H |
| Expenses net of fee waivers, if any | .54% | .54% | .54% | .54%H |
| Expenses net of all reductions | .54% | .54% | .54% | .54%H |
| Net investment income (loss) | 2.15% | 1.18% | 1.87% | 1.75%H |
| Supplemental Data | | | | |
| Net assets, end of period (000 omitted) | $5,359 | $2,284 | $1,084 | $102 |
| Portfolio turnover rateI | 22% | 22% | 27% | 11%H |
A For the period August 31, 2018 (commencement of operations) through March 31, 2019.
B Calculated based on average shares outstanding during the period.
C Net investment income (loss) is affected by the timing of the declaration of dividends by any underlying mutual funds or exchange-traded funds (ETFs). Net investment income (loss) of any such underlying funds is not included in the Fund's net investment income (loss) ratio.
D Total distributions per share do not sum due to rounding.
E Total returns for periods of less than one year are not annualized.
F Fees and expenses of any underlying mutual funds or exchange-traded funds (ETFs) are not included in the Fund's expense ratio. The Fund indirectly bears its proportionate share of these expenses. For additional expense information related to investments in Fidelity Central Funds, please refer to the "Investments in Fidelity Central Funds" note found in the Notes to Financial Statements section of the most recent Annual or Semi-Annual report.
G Expense ratios reflect operating expenses of the class. Expenses before reductions do not reflect amounts reimbursed, waived, or reduced through arrangements with the investment adviser, brokerage services, or other offset arrangements, if applicable, and do not represent the amount paid by the class during periods when reimbursements, waivers or reductions occur.
H Annualized
I Amount does not include the portfolio activity of any underlying mutual funds or exchange-traded funds (ETFs).
See accompanying notes which are an integral part of the financial statements.
Fidelity Freedom Blend 2060 Fund Premier Class
| Years ended March 31, | 2022 A |
| Selected Per–Share Data | |
| Net asset value, beginning of period | $12.71 |
| Income from Investment Operations | |
| Net investment income (loss)B,C | .48 |
| Net realized and unrealized gain (loss) | (.25) |
| Total from investment operations | .23 |
| Distributions from net investment income | (.33) |
| Distributions from net realized gain | (.73) |
| Total distributions | (1.05)D |
| Net asset value, end of period | $11.89 |
| Total ReturnE | 1.36% |
| Ratios to Average Net AssetsC,F,G | |
| Expenses before reductions | .29%H |
| Expenses net of fee waivers, if any | .29%H |
| Expenses net of all reductions | .29%H |
| Net investment income (loss) | 3.82%H |
| Supplemental Data | |
| Net assets, end of period (000 omitted) | $62,129 |
| Portfolio turnover rateI | 22% |
A For the period April 6, 2021 (commencement of sale of shares) through March 31, 2022.
B Calculated based on average shares outstanding during the period.
C Net investment income (loss) is affected by the timing of the declaration of dividends by any underlying mutual funds or exchange-traded funds (ETFs). Net investment income (loss) of any such underlying funds is not included in the Fund's net investment income (loss) ratio.
D Total distributions per share do not sum due to rounding.
E Total returns for periods of less than one year are not annualized.
F Fees and expenses of any underlying mutual funds or exchange-traded funds (ETFs) are not included in the Fund's expense ratio. The Fund indirectly bears its proportionate share of these expenses. For additional expense information related to investments in Fidelity Central Funds, please refer to the "Investments in Fidelity Central Funds" note found in the Notes to Financial Statements section of the most recent Annual or Semi-Annual report.
G Expense ratios reflect operating expenses of the class. Expenses before reductions do not reflect amounts reimbursed, waived, or reduced through arrangements with the investment adviser, brokerage services, or other offset arrangements, if applicable, and do not represent the amount paid by the class during periods when reimbursements, waivers or reductions occur.
H Annualized
I Amount does not include the portfolio activity of any underlying mutual funds or exchange-traded funds (ETFs).
See accompanying notes which are an integral part of the financial statements.
Fidelity Freedom Blend 2060 Fund Class Z
| Years ended March 31, | 2022 | 2021 | 2020 | 2019 A |
| Selected Per–Share Data | | | | |
| Net asset value, beginning of period | $12.45 | $8.33 | $9.54 | $10.00 |
| Income from Investment Operations | | | | |
| Net investment income (loss)B,C | .29 | .14 | .20 | .10 |
| Net realized and unrealized gain (loss) | .19 | 4.47 | (1.11) | (.26) |
| Total from investment operations | .48 | 4.61 | (.91) | (.16) |
| Distributions from net investment income | (.31) | (.14) | (.16) | (.15) |
| Distributions from net realized gain | (.73) | (.35) | (.14) | (.15) |
| Total distributions | (1.04) | (.49) | (.30) | (.30) |
| Net asset value, end of period | $11.89 | $12.45 | $8.33 | $9.54 |
| Total ReturnD | 3.38% | 55.93% | (10.17)% | (1.28)% |
| Ratios to Average Net AssetsC,E,F | | | | |
| Expenses before reductions | .44% | .44% | .44% | .44%G |
| Expenses net of fee waivers, if any | .44% | .44% | .44% | .44%G |
| Expenses net of all reductions | .44% | .44% | .44% | .44%G |
| Net investment income (loss) | 2.25% | 1.28% | 1.97% | 1.86%G |
| Supplemental Data | | | | |
| Net assets, end of period (000 omitted) | $545 | $139 | $89 | $99 |
| Portfolio turnover rateH | 22% | 22% | 27% | 11%G |
A For the period August 31, 2018 (commencement of operations) through March 31, 2019.
B Calculated based on average shares outstanding during the period.
C Net investment income (loss) is affected by the timing of the declaration of dividends by any underlying mutual funds or exchange-traded funds (ETFs). Net investment income (loss) of any such underlying funds is not included in the Fund's net investment income (loss) ratio.
D Total returns for periods of less than one year are not annualized.
E Fees and expenses of any underlying mutual funds or exchange-traded funds (ETFs) are not included in the Fund's expense ratio. The Fund indirectly bears its proportionate share of these expenses. For additional expense information related to investments in Fidelity Central Funds, please refer to the "Investments in Fidelity Central Funds" note found in the Notes to Financial Statements section of the most recent Annual or Semi-Annual report.
F Expense ratios reflect operating expenses of the class. Expenses before reductions do not reflect amounts reimbursed, waived, or reduced through arrangements with the investment adviser, brokerage services, or other offset arrangements, if applicable, and do not represent the amount paid by the class during periods when reimbursements, waivers or reductions occur.
G Annualized
H Amount does not include the portfolio activity of any underlying mutual funds or exchange-traded funds (ETFs).
See accompanying notes which are an integral part of the financial statements.
Fidelity Freedom Blend 2060 Fund Class Z6
| Years ended March 31, | 2022 | 2021 | 2020 | 2019 A |
| Selected Per–Share Data | | | | |
| Net asset value, beginning of period | $12.44 | $8.33 | $9.54 | $10.00 |
| Income from Investment Operations | | | | |
| Net investment income (loss)B,C | .29 | .15 | .20 | .11 |
| Net realized and unrealized gain (loss) | .21 | 4.47 | (1.10) | (.27) |
| Total from investment operations | .50 | 4.62 | (.90) | (.16) |
| Distributions from net investment income | (.32) | (.15) | (.17) | (.15) |
| Distributions from net realized gain | (.73) | (.36) | (.14) | (.15) |
| Total distributions | (1.05) | (.51) | (.31) | (.30) |
| Net asset value, end of period | $11.89 | $12.44 | $8.33 | $9.54 |
| Total ReturnD | 3.53% | 56.07% | (10.10)% | (1.24)% |
| Ratios to Average Net AssetsC,E,F | | | | |
| Expenses before reductions | .34% | .34% | .34% | .34%G |
| Expenses net of fee waivers, if any | .34% | .34% | .34% | .34%G |
| Expenses net of all reductions | .34% | .34% | .34% | .34%G |
| Net investment income (loss) | 2.35% | 1.38% | 2.07% | 1.96%G |
| Supplemental Data | | | | |
| Net assets, end of period (000 omitted) | $12,178 | $1,541 | $375 | $103 |
| Portfolio turnover rateH | 22% | 22% | 27% | 11%G |
A For the period August 31, 2018 (commencement of operations) through March 31, 2019.
B Calculated based on average shares outstanding during the period.
C Net investment income (loss) is affected by the timing of the declaration of dividends by any underlying mutual funds or exchange-traded funds (ETFs). Net investment income (loss) of any such underlying funds is not included in the Fund's net investment income (loss) ratio.
D Total returns for periods of less than one year are not annualized.
E Fees and expenses of any underlying mutual funds or exchange-traded funds (ETFs) are not included in the Fund's expense ratio. The Fund indirectly bears its proportionate share of these expenses. For additional expense information related to investments in Fidelity Central Funds, please refer to the "Investments in Fidelity Central Funds" note found in the Notes to Financial Statements section of the most recent Annual or Semi-Annual report.
F Expense ratios reflect operating expenses of the class. Expenses before reductions do not reflect amounts reimbursed, waived, or reduced through arrangements with the investment adviser, brokerage services, or other offset arrangements, if applicable, and do not represent the amount paid by the class during periods when reimbursements, waivers or reductions occur.
G Annualized
H Amount does not include the portfolio activity of any underlying mutual funds or exchange-traded funds (ETFs).
See accompanying notes which are an integral part of the financial statements.
Fidelity Freedom® Blend 2065 Fund
Investment Summary (Unaudited)
The information in the following tables is based on the direct investments of the Fund.
Top Holdings as of March 31, 2022
| | % of fund's net assets |
| Fidelity Series Large Cap Value Index Fund | 14.4 |
| Fidelity Series Emerging Markets Opportunities Fund | 12.9 |
| Fidelity Series Blue Chip Growth Fund | 10.7 |
| Fidelity Series Large Cap Stock Fund | 7.5 |
| Fidelity Series Large Cap Growth Index Fund | 6.8 |
| Fidelity Series International Value Fund | 6.7 |
| Fidelity Series Overseas Fund | 6.6 |
| Fidelity Series International Growth Fund | 6.6 |
| Fidelity Series Long-Term Treasury Bond Index Fund | 5.4 |
| Fidelity Series Value Discovery Fund | 5.3 |
| | 82.9 |
Asset Allocation (% of fund's net assets)
| Period end |
| | Domestic Equity Funds | 49.8% |
| | International Equity Funds | 42.4% |
| | Bond Funds | 7.8% |

Domestic Equity Funds category includes Fidelity Series Commodity Strategy Fund which invests in commodity-related investments.
Fidelity Freedom® Blend 2065 Fund
Schedule of Investments March 31, 2022
Showing Percentage of Net Assets
| Domestic Equity Funds - 49.8% | | | |
| | | Shares | Value |
| Fidelity Series Blue Chip Growth Fund (a) | | 272,057 | $3,909,460 |
| Fidelity Series Commodity Strategy Fund (a) | | 107,104 | 547,302 |
| Fidelity Series Large Cap Growth Index Fund (a) | | 140,082 | 2,465,441 |
| Fidelity Series Large Cap Stock Fund (a) | | 144,561 | 2,748,109 |
| Fidelity Series Large Cap Value Index Fund (a) | | 342,770 | 5,264,942 |
| Fidelity Series Small Cap Opportunities Fund (a) | | 97,091 | 1,322,375 |
| Fidelity Series Value Discovery Fund (a) | | 121,573 | 1,945,173 |
| TOTAL DOMESTIC EQUITY FUNDS | | | |
| (Cost $17,656,742) | | | 18,202,802 |
|
| International Equity Funds - 42.4% | | | |
| Fidelity Series Canada Fund (a) | | 77,644 | 1,205,031 |
| Fidelity Series Emerging Markets Fund (a) | | 55,599 | 515,955 |
| Fidelity Series Emerging Markets Opportunities Fund (a) | | 257,128 | 4,731,149 |
| Fidelity Series International Growth Fund (a) | | 145,355 | 2,409,985 |
| Fidelity Series International Index Fund (a) | | 89,462 | 1,023,449 |
| Fidelity Series International Small Cap Fund (a) | | 41,864 | 751,462 |
| Fidelity Series International Value Fund (a) | | 220,611 | 2,433,334 |
| Fidelity Series Overseas Fund (a) | | 191,990 | 2,422,915 |
| TOTAL INTERNATIONAL EQUITY FUNDS | | | |
| (Cost $16,482,734) | | | 15,493,280 |
|
| Bond Funds - 7.8% | | | |
| Fidelity Series 5+ Year Inflation-Protected Bond Index Fund (a) | | 3,814 | 36,618 |
| Fidelity Series Corporate Bond Fund (a) | | 3,996 | 40,358 |
| Fidelity Series Emerging Markets Debt Fund (a) | | 22,534 | 185,903 |
| Fidelity Series Emerging Markets Debt Local Currency Fund (a) | | 6,734 | 60,673 |
| Fidelity Series Floating Rate High Income Fund (a) | | 3,969 | 36,480 |
| Fidelity Series Government Bond Index Fund (a) | | 5,871 | 58,598 |
| Fidelity Series High Income Fund (a) | | 24,371 | 221,528 |
| Fidelity Series Investment Grade Bond Fund (a) | | 5,667 | 61,830 |
| Fidelity Series Investment Grade Securitized Fund (a) | | 4,304 | 41,836 |
| Fidelity Series Long-Term Treasury Bond Index Fund (a) | | 257,669 | 1,963,437 |
| Fidelity Series Real Estate Income Fund (a) | | 11,447 | 130,040 |
| TOTAL BOND FUNDS | | | |
| (Cost $3,009,197) | | | 2,837,301 |
|
| Short-Term Funds - 0.0% | | | |
| Fidelity Cash Central Fund 0.31% (b) | | | |
| (Cost $105) | | 105 | 105 |
| TOTAL INVESTMENT IN SECURITIES - 100.0% | | | |
| (Cost $37,148,778) | | | 36,533,488 |
| NET OTHER ASSETS (LIABILITIES) - 0.0% | | | (1,209) |
| NET ASSETS - 100% | | | $36,532,279 |
Legend
(a) Affiliated Fund
(b) Affiliated fund that is generally available only to investment companies and other accounts managed by Fidelity Investments. The rate quoted is the annualized seven-day yield of the fund at period end. A complete unaudited listing of the fund's holdings as of its most recent quarter end is available upon request. In addition, each Fidelity Central Fund's financial statements, which are not covered by the Fund's Report of Independent Registered Public Accounting Firm, are available on the SEC's website or upon request.
Affiliated Central Funds
Fiscal year to date information regarding the Fund's investments in Fidelity Central Funds, including the ownership percentage, is presented below.
| Fund | Value, beginning of period | Purchases | Sales Proceeds | Dividend Income | Realized Gain/Loss | Change in Unrealized appreciation (depreciation) | Value, end of period | % ownership, end of period |
| Fidelity Cash Central Fund 0.31% | $-- | $100,199 | $100,094 | $-- | $-- | $-- | $105 | 0.0% |
| Total | $-- | $100,199 | $100,094 | $-- | $-- | $-- | $105 | |
Amounts in the income column in the above table include any capital gain distributions from underlying funds, which are presented in the corresponding line-item in the Statement of Operations, if applicable.
Affiliated Underlying Funds
Fiscal year to date information regarding the Fund's investments in affiliated Underlying Funds is presented below. Exchanges between classes of the same affiliated Underlying Funds may occur. If an underlying Fund changes its name, the name presented below is the name in effect at period end.
| Affiliate | Value, beginning of period | Purchases(a) | Sales Proceeds(a) | Dividend Income | Realized Gain (loss) | Change in Unrealized appreciation (depreciation) | Value, end of period |
| Fidelity Series 0-5 Year Inflation-Protected Bond Index Fund | $-- | $138,827 | $138,385 | $392 | $(383) | $-- | $-- |
| Fidelity Series 5+ Year Inflation-Protected Bond Index Fund | -- | 325,710 | 279,014 | 1,327 | (9,263) | (815) | 36,618 |
| Fidelity Series Blue Chip Growth Fund | 1,418,499 | 4,104,395 | 1,013,753 | 551,332 | (83,326) | (516,355) | 3,909,460 |
| Fidelity Series Canada Fund | 311,981 | 940,886 | 180,276 | 17,953 | (1,538) | 133,978 | 1,205,031 |
| Fidelity Series Commodity Strategy Fund | 357,937 | 831,195 | 678,891 | 199,362 | (26,294) | 63,355 | 547,302 |
| Fidelity Series Corporate Bond Fund | 1,408 | 58,122 | 18,621 | 158 | (525) | (26) | 40,358 |
| Fidelity Series Emerging Markets Debt Fund | 70,545 | 164,844 | 32,293 | 6,024 | (1,168) | (16,025) | 185,903 |
| Fidelity Series Emerging Markets Debt Local Currency Fund | 23,578 | 53,448 | 10,262 | 1,918 | (659) | (5,432) | 60,673 |
| Fidelity Series Emerging Markets Fund | 205,139 | 480,767 | 72,619 | 13,375 | (4,692) | (92,640) | 515,955 |
| Fidelity Series Emerging Markets Opportunities Fund | 1,844,205 | 4,743,271 | 613,124 | 420,263 | (40,456) | (1,202,747) | 4,731,149 |
| Fidelity Series Floating Rate High Income Fund | 14,211 | 31,704 | 9,344 | 1,118 | (33) | (58) | 36,480 |
| Fidelity Series Government Bond Index Fund | 1,735 | 88,656 | 31,040 | 80 | (539) | (214) | 58,598 |
| Fidelity Series Government Money Market Fund 0.31% | 33,421 | 17,371 | 50,792 | 8 | -- | -- | -- |
| Fidelity Series High Income Fund | 81,845 | 189,300 | 42,140 | 8,285 | (826) | (6,651) | 221,528 |
| Fidelity Series Inflation-Protected Bond Index Fund | 257,661 | 306,813 | 576,482 | 5,683 | 17,124 | (5,116) | -- |
| Fidelity Series International Growth Fund | 766,981 | 2,204,733 | 290,895 | 145,498 | (20,759) | (250,075) | 2,409,985 |
| Fidelity Series International Index Fund | 320,348 | 862,185 | 112,516 | 19,312 | (5,029) | (41,539) | 1,023,449 |
| Fidelity Series International Small Cap Fund | 277,070 | 693,426 | 91,200 | 75,435 | (8,228) | (119,606) | 751,462 |
| Fidelity Series International Value Fund | 766,444 | 2,053,660 | 372,339 | 91,342 | (9,700) | (4,731) | 2,433,334 |
| Fidelity Series Investment Grade Bond Fund | 1,933 | 95,095 | 34,478 | 204 | (570) | (150) | 61,830 |
| Fidelity Series Investment Grade Securitized Fund | 1,351 | 59,226 | 18,359 | 67 | (260) | (122) | 41,836 |
| Fidelity Series Large Cap Growth Index Fund | 895,503 | 2,158,077 | 687,662 | 56,188 | (21,596) | 121,119 | 2,465,441 |
| Fidelity Series Large Cap Stock Fund | 978,346 | 2,265,016 | 519,240 | 161,718 | (8,680) | 32,667 | 2,748,109 |
| Fidelity Series Large Cap Value Index Fund | 1,868,872 | 4,406,771 | 1,078,129 | 274,413 | (23,544) | 90,972 | 5,264,942 |
| Fidelity Series Long-Term Treasury Bond Index Fund | 352,865 | 1,915,786 | 196,801 | 20,432 | (11,307) | (97,106) | 1,963,437 |
| Fidelity Series Overseas Fund | 768,554 | 2,073,313 | 293,878 | 53,833 | (16,324) | (108,750) | 2,422,915 |
| Fidelity Series Real Estate Income Fund | 49,041 | 108,920 | 28,067 | 3,829 | (450) | 596 | 130,040 |
| Fidelity Series Short-Term Credit Fund | 16,490 | 11,193 | 27,671 | 105 | (7) | (5) | -- |
| Fidelity Series Small Cap Opportunities Fund | 472,527 | 1,276,626 | 202,491 | 220,297 | (17,972) | (206,315) | 1,322,375 |
| Fidelity Series Treasury Bill Index Fund | 53,102 | 36,451 | 89,553 | 13 | (12) | 12 | -- |
| Fidelity Series Value Discovery Fund | 690,520 | 1,651,016 | 351,564 | 183,223 | (9,124) | (35,675) | 1,945,173 |
| Total | $12,902,112 | $34,346,803 | $8,141,879 | $2,533,187 | $(306,140) | $(2,267,454) | $36,533,383 |
(a) Includes the value of shares purchased or redeemed through in-kind transactions, if applicable.
Amounts in the income column in the above table include any capital gain distributions from underlying funds, which are presented in the corresponding line-item in the Statement of Operations, if applicable.
Investment Valuation
The following is a summary of the inputs used, as of March 31, 2022, involving the Fund's assets and liabilities carried at fair value. The inputs or methodology used for valuing securities may not be an indication of the risk associated with investing in those securities. For more information on valuation inputs, and their aggregation into the levels used below, please refer to the Investment Valuation section in the accompanying Notes to Financial Statements.
| | Valuation Inputs at Reporting Date: |
| Description | Total | Level 1 | Level 2 | Level 3 |
| Investments in Securities: | | | | |
| Domestic Equity Funds | $18,202,802 | $18,202,802 | $-- | $-- |
| International Equity Funds | 15,493,280 | 15,493,280 | -- | -- |
| Bond Funds | 2,837,301 | 2,837,301 | -- | -- |
| Short-Term Funds | 105 | 105 | -- | -- |
| Total Investments in Securities: | $36,533,488 | $36,533,488 | $-- | $-- |
See accompanying notes which are an integral part of the financial statements.
Fidelity Freedom® Blend 2065 Fund
Financial Statements
Statement of Assets and Liabilities
| | | March 31, 2022 |
| Assets | | |
Investment in securities, at value — See accompanying schedule:
| | |
| Fidelity Central Funds (cost $105) | $105 | |
| Other affiliated issuers (cost $37,148,673) | 36,533,383 | |
| Total Investment in Securities (cost $37,148,778) | | $36,533,488 |
| Cash | | 95 |
| Receivable for investments sold | | 654,936 |
| Receivable for fund shares sold | | 82,109 |
| Total assets | | 37,270,628 |
| Liabilities | | |
| Payable for investments purchased | $657,666 | |
| Payable for fund shares redeemed | 69,299 | |
| Accrued management fee | 10,638 | |
| Distribution and service plan fees payable | 746 | |
| Total liabilities | | 738,349 |
| Net Assets | | $36,532,279 |
| Net Assets consist of: | | |
| Paid in capital | | $36,702,353 |
| Total accumulated earnings (loss) | | (170,074) |
| Net Assets | | $36,532,279 |
| Net Asset Value and Maximum Offering Price | | |
| Class A: | | |
| Net Asset Value and redemption price per share ($868,880 ÷ 71,188 shares)(a) | | $12.21 |
| Maximum offering price per share (100/94.25 of $12.21) | | $12.95 |
| Class M: | | |
| Net Asset Value and redemption price per share ($338,253 ÷ 27,739 shares)(a) | | $12.19 |
| Maximum offering price per share (100/96.50 of $12.19) | | $12.63 |
| Class C: | | |
| Net Asset Value and offering price per share ($500,681 ÷ 41,331 shares)(a) | | $12.11 |
| Fidelity Freedom Blend 2065 Fund: | | |
| Net Asset Value, offering price and redemption price per share ($3,662,124 ÷ 299,037 shares) | | $12.25 |
| Class K: | | |
| Net Asset Value, offering price and redemption price per share ($393,441 ÷ 32,051 shares) | | $12.28 |
| Class K6: | | |
| Net Asset Value, offering price and redemption price per share ($22,400,635 ÷ 1,826,717 shares) | | $12.26 |
| Class I: | | |
| Net Asset Value, offering price and redemption price per share ($1,304,653 ÷ 106,451 shares) | | $12.26 |
| Class Z: | | |
| Net Asset Value, offering price and redemption price per share ($172,381 ÷ 14,030 shares) | | $12.29 |
| Class Z6: | | |
| Net Asset Value, offering price and redemption price per share ($1,027,385 ÷ 83,687 shares) | | $12.28 |
| Premier Class: | | |
| Net Asset Value, offering price and redemption price per share ($5,863,846 ÷ 478,359 shares) | | $12.26 |
(a) Redemption price per share is equal to net asset value less any applicable contingent deferred sales charge.
See accompanying notes which are an integral part of the financial statements.
Statement of Operations
| | | Year ended March 31, 2022 |
| Investment Income | | |
| Dividends: | | |
| Affiliated issuers | | $732,914 |
| Expenses | | |
| Management fee | $92,845 | |
| Distribution and service plan fees | 8,105 | |
| Independent trustees' fees and expenses | 64 | |
| Total expenses | | 101,014 |
| Net investment income (loss) | | 631,900 |
| Realized and Unrealized Gain (Loss) | | |
| Net realized gain (loss) on: | | |
| Investment securities: | | |
| Affiliated issuers | (306,140) | |
| Capital gain distributions from underlying funds: | | |
| Affiliated issuers | 1,800,273 | |
| Total net realized gain (loss) | | 1,494,133 |
| Change in net unrealized appreciation (depreciation) on: | | |
| Investment securities: | | |
| Affiliated issuers | (2,267,454) | |
| Total change in net unrealized appreciation (depreciation) | | (2,267,454) |
| Net gain (loss) | | (773,321) |
| Net increase (decrease) in net assets resulting from operations | | $(141,421) |
See accompanying notes which are an integral part of the financial statements.
Statement of Changes in Net Assets
| | Year ended March 31, 2022 | Year ended March 31, 2021 |
| Increase (Decrease) in Net Assets | | |
| Operations | | |
| Net investment income (loss) | $631,900 | $89,291 |
| Net realized gain (loss) | 1,494,133 | 319,916 |
| Change in net unrealized appreciation (depreciation) | (2,267,454) | 2,100,019 |
| Net increase (decrease) in net assets resulting from operations | (141,421) | 2,509,226 |
| Distributions to shareholders | (1,809,366) | (284,148) |
| Share transactions - net increase (decrease) | 25,585,262 | 8,144,106 |
| Total increase (decrease) in net assets | 23,634,475 | 10,369,184 |
| Net Assets | | |
| Beginning of period | 12,897,804 | 2,528,620 |
| End of period | $36,532,279 | $12,897,804 |
See accompanying notes which are an integral part of the financial statements.
Financial Highlights
Fidelity Freedom Blend 2065 Fund Class A
| Years ended March 31, | 2022 | 2021 | 2020 A |
| Selected Per–Share Data | | | |
| Net asset value, beginning of period | $12.64 | $8.42 | $10.00 |
| Income from Investment Operations | | | |
| Net investment income (loss)B,C | .27 | .11 | .14 |
| Net realized and unrealized gain (loss) | .17 | 4.51 | (1.43) |
| Total from investment operations | .44 | 4.62 | (1.29) |
| Distributions from net investment income | (.27) | (.11) | (.16) |
| Distributions from net realized gain | (.61) | (.29) | (.14) |
| Total distributions | (.87)D | (.40) | (.29)D |
| Net asset value, end of period | $12.21 | $12.64 | $8.42 |
| Total ReturnE,F | 3.10% | 55.34% | (13.48)% |
| Ratios to Average Net AssetsC,G,H | | | |
| Expenses before reductions | .79% | .79% | .79%I |
| Expenses net of fee waivers, if any | .79% | .79% | .79%I |
| Expenses net of all reductions | .79% | .79% | .79%I |
| Net investment income (loss) | 2.05% | 1.00% | 1.78%I |
| Supplemental Data | | | |
| Net assets, end of period (000 omitted) | $869 | $466 | $154 |
| Portfolio turnover rateJ | 33% | 38% | 29%I |
A For the period June 28, 2019 (commencement of operations) through March 31, 2020.
B Calculated based on average shares outstanding during the period.
C Net investment income (loss) is affected by the timing of the declaration of dividends by any underlying mutual funds or exchange-traded funds (ETFs). Net investment income (loss) of any such underlying funds is not included in the Fund's net investment income (loss) ratio.
D Total distributions per share do not sum due to rounding.
E Total returns for periods of less than one year are not annualized.
F Total returns do not include the effect of the sales charges.
G Fees and expenses of any underlying mutual funds or exchange-traded funds (ETFs) are not included in the Fund's expense ratio. The Fund indirectly bears its proportionate share of these expenses.
H Expense ratios reflect operating expenses of the class. Expenses before reductions do not reflect amounts reimbursed, waived, or reduced through arrangements with the investment adviser, brokerage services, or other offset arrangements, if applicable, and do not represent the amount paid by the class during periods when reimbursements, waivers or reductions occur.
I Annualized
J Amount does not include the portfolio activity of any underlying mutual funds or exchange-traded funds (ETFs).
See accompanying notes which are an integral part of the financial statements.
Fidelity Freedom Blend 2065 Fund Class M
| Years ended March 31, | 2022 | 2021 | 2020 A |
| Selected Per–Share Data | | | |
| Net asset value, beginning of period | $12.63 | $8.42 | $10.00 |
| Income from Investment Operations | | | |
| Net investment income (loss)B,C | .23 | .08 | .12 |
| Net realized and unrealized gain (loss) | .17 | 4.51 | (1.42) |
| Total from investment operations | .40 | 4.59 | (1.30) |
| Distributions from net investment income | (.23) | (.09) | (.14) |
| Distributions from net realized gain | (.61) | (.29) | (.14) |
| Total distributions | (.84) | (.38) | (.28) |
| Net asset value, end of period | $12.19 | $12.63 | $8.42 |
| Total ReturnD,E | 2.76% | 54.90% | (13.60)% |
| Ratios to Average Net AssetsC,F,G | | | |
| Expenses before reductions | 1.04% | 1.04% | 1.05%H,I |
| Expenses net of fee waivers, if any | 1.04% | 1.04% | 1.05%H,I |
| Expenses net of all reductions | 1.04% | 1.04% | 1.05%H,I |
| Net investment income (loss) | 1.79% | .75% | 1.53%H |
| Supplemental Data | | | |
| Net assets, end of period (000 omitted) | $338 | $358 | $165 |
| Portfolio turnover rateJ | 33% | 38% | 29%H |
A For the period June 28, 2019 (commencement of operations) through March 31, 2020.
B Calculated based on average shares outstanding during the period.
C Net investment income (loss) is affected by the timing of the declaration of dividends by any underlying mutual funds or exchange-traded funds (ETFs). Net investment income (loss) of any such underlying funds is not included in the Fund's net investment income (loss) ratio.
D Total returns for periods of less than one year are not annualized.
E Total returns do not include the effect of the sales charges.
F Fees and expenses of any underlying mutual funds or exchange-traded funds (ETFs) are not included in the Fund's expense ratio. The Fund indirectly bears its proportionate share of these expenses.
G Expense ratios reflect operating expenses of the class. Expenses before reductions do not reflect amounts reimbursed, waived, or reduced through arrangements with the investment adviser, brokerage services, or other offset arrangements, if applicable, and do not represent the amount paid by the class during periods when reimbursements, waivers or reductions occur.
H Annualized
I On certain classes, the size and fluctuation of net assets and expense amounts may cause ratios to differ from contractual rates.
J Amount does not include the portfolio activity of any underlying mutual funds or exchange-traded funds (ETFs).
See accompanying notes which are an integral part of the financial statements.
Fidelity Freedom Blend 2065 Fund Class C
| Years ended March 31, | 2022 | 2021 | 2020 A |
| Selected Per–Share Data | | | |
| Net asset value, beginning of period | $12.58 | $8.40 | $10.00 |
| Income from Investment Operations | | | |
| Net investment income (loss)B,C | .17 | .03 | .08 |
| Net realized and unrealized gain (loss) | .16 | 4.49 | (1.42) |
| Total from investment operations | .33 | 4.52 | (1.34) |
| Distributions from net investment income | (.19) | (.05) | (.12) |
| Distributions from net realized gain | (.61) | (.29) | (.14) |
| Total distributions | (.80) | (.34) | (.26) |
| Net asset value, end of period | $12.11 | $12.58 | $8.40 |
| Total ReturnD,E | 2.21% | 54.22% | (13.94)% |
| Ratios to Average Net AssetsC,F,G | | | |
| Expenses before reductions | 1.54% | 1.54% | 1.55%H,I |
| Expenses net of fee waivers, if any | 1.54% | 1.54% | 1.55%H,I |
| Expenses net of all reductions | 1.54% | 1.54% | 1.55%H,I |
| Net investment income (loss) | 1.29% | .25% | 1.03%H |
| Supplemental Data | | | |
| Net assets, end of period (000 omitted) | $501 | $339 | $156 |
| Portfolio turnover rateJ | 33% | 38% | 29%H |
A For the period June 28, 2019 (commencement of operations) through March 31, 2020.
B Calculated based on average shares outstanding during the period.
C Net investment income (loss) is affected by the timing of the declaration of dividends by any underlying mutual funds or exchange-traded funds (ETFs). Net investment income (loss) of any such underlying funds is not included in the Fund's net investment income (loss) ratio.
D Total returns for periods of less than one year are not annualized.
E Total returns do not include the effect of the contingent deferred sales charge.
F Fees and expenses of any underlying mutual funds or exchange-traded funds (ETFs) are not included in the Fund's expense ratio. The Fund indirectly bears its proportionate share of these expenses.
G Expense ratios reflect operating expenses of the class. Expenses before reductions do not reflect amounts reimbursed, waived, or reduced through arrangements with the investment adviser, brokerage services, or other offset arrangements, if applicable, and do not represent the amount paid by the class during periods when reimbursements, waivers or reductions occur.
H Annualized
I On certain classes, the size and fluctuation of net assets and expense amounts may cause ratios to differ from contractual rates.
J Amount does not include the portfolio activity of any underlying mutual funds or exchange-traded funds (ETFs).
See accompanying notes which are an integral part of the financial statements.
Fidelity Freedom Blend 2065 Fund
| Years ended March 31, | 2022 | 2021 | 2020 A |
| Selected Per–Share Data | | | |
| Net asset value, beginning of period | $12.67 | $8.43 | $10.00 |
| Income from Investment Operations | | | |
| Net investment income (loss)B,C | .30 | .14 | .15 |
| Net realized and unrealized gain (loss) | .18 | 4.52 | (1.42) |
| Total from investment operations | .48 | 4.66 | (1.27) |
| Distributions from net investment income | (.29) | (.13) | (.17) |
| Distributions from net realized gain | (.61) | (.29) | (.14) |
| Total distributions | (.90) | (.42) | (.30)D |
| Net asset value, end of period | $12.25 | $12.67 | $8.43 |
| Total ReturnE | 3.34% | 55.69% | (13.28)% |
| Ratios to Average Net AssetsC,F,G | | | |
| Expenses before reductions | .54% | .54% | .54%H |
| Expenses net of fee waivers, if any | .54% | .54% | .54%H |
| Expenses net of all reductions | .54% | .54% | .54%H |
| Net investment income (loss) | 2.30% | 1.25% | 2.03%H |
| Supplemental Data | | | |
| Net assets, end of period (000 omitted) | $3,662 | $1,767 | $423 |
| Portfolio turnover rateI | 33% | 38% | 29%H |
A For the period June 28, 2019 (commencement of operations) through March 31, 2020.
B Calculated based on average shares outstanding during the period.
C Net investment income (loss) is affected by the timing of the declaration of dividends by any underlying mutual funds or exchange-traded funds (ETFs). Net investment income (loss) of any such underlying funds is not included in the Fund's net investment income (loss) ratio.
D Total distributions per share do not sum due to rounding.
E Total returns for periods of less than one year are not annualized.
F Fees and expenses of any underlying mutual funds or exchange-traded funds (ETFs) are not included in the Fund's expense ratio. The Fund indirectly bears its proportionate share of these expenses.
G Expense ratios reflect operating expenses of the class. Expenses before reductions do not reflect amounts reimbursed, waived, or reduced through arrangements with the investment adviser, brokerage services, or other offset arrangements, if applicable, and do not represent the amount paid by the class during periods when reimbursements, waivers or reductions occur.
H Annualized
I Amount does not include the portfolio activity of any underlying mutual funds or exchange-traded funds (ETFs).
See accompanying notes which are an integral part of the financial statements.
Fidelity Freedom Blend 2065 Fund Class K
| Years ended March 31, | 2022 | 2021 | 2020 A |
| Selected Per–Share Data | | | |
| Net asset value, beginning of period | $12.69 | $8.43 | $10.00 |
| Income from Investment Operations | | | |
| Net investment income (loss)B,C | .32 | .15 | .16 |
| Net realized and unrealized gain (loss) | .17 | 4.53 | (1.43) |
| Total from investment operations | .49 | 4.68 | (1.27) |
| Distributions from net investment income | (.29) | (.13) | (.17) |
| Distributions from net realized gain | (.61) | (.29) | (.14) |
| Total distributions | (.90) | (.42) | (.30)D |
| Net asset value, end of period | $12.28 | $12.69 | $8.43 |
| Total ReturnE | 3.47% | 55.98% | (13.30)% |
| Ratios to Average Net AssetsC,F,G | | | |
| Expenses before reductions | .44% | .44% | .44%H |
| Expenses net of fee waivers, if any | .44% | .44% | .44%H |
| Expenses net of all reductions | .44% | .44% | .44%H |
| Net investment income (loss) | 2.40% | 1.35% | 2.13%H |
| Supplemental Data | | | |
| Net assets, end of period (000 omitted) | $393 | $259 | $118 |
| Portfolio turnover rateI | 33% | 38% | 29%H |
A For the period June 28, 2019 (commencement of operations) through March 31, 2020.
B Calculated based on average shares outstanding during the period.
C Net investment income (loss) is affected by the timing of the declaration of dividends by any underlying mutual funds or exchange-traded funds (ETFs). Net investment income (loss) of any such underlying funds is not included in the Fund's net investment income (loss) ratio.
D Total distributions per share do not sum due to rounding.
E Total returns for periods of less than one year are not annualized.
F Fees and expenses of any underlying mutual funds or exchange-traded funds (ETFs) are not included in the Fund's expense ratio. The Fund indirectly bears its proportionate share of these expenses.
G Expense ratios reflect operating expenses of the class. Expenses before reductions do not reflect amounts reimbursed, waived, or reduced through arrangements with the investment adviser, brokerage services, or other offset arrangements, if applicable, and do not represent the amount paid by the class during periods when reimbursements, waivers or reductions occur.
H Annualized
I Amount does not include the portfolio activity of any underlying mutual funds or exchange-traded funds (ETFs).
See accompanying notes which are an integral part of the financial statements.
Fidelity Freedom Blend 2065 Fund Class K6
| Years ended March 31, | 2022 | 2021 | 2020 A |
| Selected Per–Share Data | | | |
| Net asset value, beginning of period | $12.68 | $8.43 | $10.00 |
| Income from Investment Operations | | | |
| Net investment income (loss)B,C | .32 | .17 | .16 |
| Net realized and unrealized gain (loss) | .18 | 4.52 | (1.42) |
| Total from investment operations | .50 | 4.69 | (1.26) |
| Distributions from net investment income | (.30) | (.15) | (.18) |
| Distributions from net realized gain | (.62) | (.29) | (.14) |
| Total distributions | (.92) | (.44) | (.31)D |
| Net asset value, end of period | $12.26 | $12.68 | $8.43 |
| Total ReturnE | 3.50% | 56.09% | (13.20)% |
| Ratios to Average Net AssetsC,F,G | | | |
| Expenses before reductions | .34% | .34% | .34%H |
| Expenses net of fee waivers, if any | .34% | .34% | .34%H |
| Expenses net of all reductions | .34% | .34% | .34%H |
| Net investment income (loss) | 2.50% | 1.45% | 2.23%H |
| Supplemental Data | | | |
| Net assets, end of period (000 omitted) | $22,401 | $8,863 | $1,084 |
| Portfolio turnover rateI | 33% | 38% | 29%H |
A For the period June 28, 2019 (commencement of operations) through March 31, 2020.
B Calculated based on average shares outstanding during the period.
C Net investment income (loss) is affected by the timing of the declaration of dividends by any underlying mutual funds or exchange-traded funds (ETFs). Net investment income (loss) of any such underlying funds is not included in the Fund's net investment income (loss) ratio.
D Total distributions per share do not sum due to rounding.
E Total returns for periods of less than one year are not annualized.
F Fees and expenses of any underlying mutual funds or exchange-traded funds (ETFs) are not included in the Fund's expense ratio. The Fund indirectly bears its proportionate share of these expenses.
G Expense ratios reflect operating expenses of the class. Expenses before reductions do not reflect amounts reimbursed, waived, or reduced through arrangements with the investment adviser, brokerage services, or other offset arrangements, if applicable, and do not represent the amount paid by the class during periods when reimbursements, waivers or reductions occur.
H Annualized
I Amount does not include the portfolio activity of any underlying mutual funds or exchange-traded funds (ETFs).
See accompanying notes which are an integral part of the financial statements.
Fidelity Freedom Blend 2065 Fund Class I
| Years ended March 31, | 2022 | 2021 | 2020 A |
| Selected Per–Share Data | | | |
| Net asset value, beginning of period | $12.68 | $8.43 | $10.00 |
| Income from Investment Operations | | | |
| Net investment income (loss)B,C | .30 | .14 | .15 |
| Net realized and unrealized gain (loss) | .18 | 4.52 | (1.42) |
| Total from investment operations | .48 | 4.66 | (1.27) |
| Distributions from net investment income | (.29) | (.13) | (.16) |
| Distributions from net realized gain | (.61) | (.29) | (.14) |
| Total distributions | (.90) | (.41)D | (.30) |
| Net asset value, end of period | $12.26 | $12.68 | $8.43 |
| Total ReturnE | 3.37% | 55.77% | (13.34)% |
| Ratios to Average Net AssetsC,F,G | | | |
| Expenses before reductions | .54% | .54% | .54%H |
| Expenses net of fee waivers, if any | .54% | .54% | .54%H |
| Expenses net of all reductions | .54% | .54% | .54%H |
| Net investment income (loss) | 2.30% | 1.25% | 2.03%H |
| Supplemental Data | | | |
| Net assets, end of period (000 omitted) | $1,305 | $428 | $235 |
| Portfolio turnover rateI | 33% | 38% | 29%H |
A For the period June 28, 2019 (commencement of operations) through March 31, 2020.
B Calculated based on average shares outstanding during the period.
C Net investment income (loss) is affected by the timing of the declaration of dividends by any underlying mutual funds or exchange-traded funds (ETFs). Net investment income (loss) of any such underlying funds is not included in the Fund's net investment income (loss) ratio.
D Total distributions per share do not sum due to rounding.
E Total returns for periods of less than one year are not annualized.
F Fees and expenses of any underlying mutual funds or exchange-traded funds (ETFs) are not included in the Fund's expense ratio. The Fund indirectly bears its proportionate share of these expenses.
G Expense ratios reflect operating expenses of the class. Expenses before reductions do not reflect amounts reimbursed, waived, or reduced through arrangements with the investment adviser, brokerage services, or other offset arrangements, if applicable, and do not represent the amount paid by the class during periods when reimbursements, waivers or reductions occur.
H Annualized
I Amount does not include the portfolio activity of any underlying mutual funds or exchange-traded funds (ETFs).
See accompanying notes which are an integral part of the financial statements.
Fidelity Freedom Blend 2065 Fund Premier Class
| Years ended March 31, | 2022 A |
| Selected Per–Share Data | |
| Net asset value, beginning of period | $12.96 |
| Income from Investment Operations | |
| Net investment income (loss)B,C | .47 |
| Net realized and unrealized gain (loss) | (.24) |
| Total from investment operations | .23 |
| Distributions from net investment income | (.31) |
| Distributions from net realized gain | (.62) |
| Total distributions | (.93) |
| Net asset value, end of period | $12.26 |
| Total ReturnD | 1.36% |
| Ratios to Average Net AssetsC,E,F | |
| Expenses before reductions | .29%G |
| Expenses net of fee waivers, if any | .29%G |
| Expenses net of all reductions | .29%G |
| Net investment income (loss) | 3.68%G |
| Supplemental Data | |
| Net assets, end of period (000 omitted) | $5,864 |
| Portfolio turnover rateH | 33% |
A For the period April 6, 2021 (commencement of sale of shares) through March 31, 2022.
B Calculated based on average shares outstanding during the period.
C Net investment income (loss) is affected by the timing of the declaration of dividends by any underlying mutual funds or exchange-traded funds (ETFs). Net investment income (loss) of any such underlying funds is not included in the Fund's net investment income (loss) ratio.
D Total returns for periods of less than one year are not annualized.
E Fees and expenses of any underlying mutual funds or exchange-traded funds (ETFs) are not included in the Fund's expense ratio. The Fund indirectly bears its proportionate share of these expenses.
F Expense ratios reflect operating expenses of the class. Expenses before reductions do not reflect amounts reimbursed, waived, or reduced through arrangements with the investment adviser, brokerage services, or other offset arrangements, if applicable, and do not represent the amount paid by the class during periods when reimbursements, waivers or reductions occur.
G Annualized
H Amount does not include the portfolio activity of any underlying mutual funds or exchange-traded funds (ETFs).
See accompanying notes which are an integral part of the financial statements.
Fidelity Freedom Blend 2065 Fund Class Z
| Years ended March 31, | 2022 | 2021 | 2020 A |
| Selected Per–Share Data | | | |
| Net asset value, beginning of period | $12.70 | $8.44 | $10.00 |
| Income from Investment Operations | | | |
| Net investment income (loss)B,C | .32 | .15 | .16 |
| Net realized and unrealized gain (loss) | .17 | 4.53 | (1.42) |
| Total from investment operations | .49 | 4.68 | (1.26) |
| Distributions from net investment income | (.29) | (.13) | (.17) |
| Distributions from net realized gain | (.61) | (.29) | (.14) |
| Total distributions | (.90) | (.42) | (.30)D |
| Net asset value, end of period | $12.29 | $12.70 | $8.44 |
| Total ReturnE | 3.43% | 55.86% | (13.20)% |
| Ratios to Average Net AssetsC,F,G | | | |
| Expenses before reductions | .44% | .44% | .44%H |
| Expenses net of fee waivers, if any | .44% | .44% | .44%H |
| Expenses net of all reductions | .44% | .44% | .44%H |
| Net investment income (loss) | 2.40% | 1.35% | 2.13%H |
| Supplemental Data | | | |
| Net assets, end of period (000 omitted) | $172 | $150 | $96 |
| Portfolio turnover rateI | 33% | 38% | 29%H |
A For the period June 28, 2019 (commencement of operations) through March 31, 2020.
B Calculated based on average shares outstanding during the period.
C Net investment income (loss) is affected by the timing of the declaration of dividends by any underlying mutual funds or exchange-traded funds (ETFs). Net investment income (loss) of any such underlying funds is not included in the Fund's net investment income (loss) ratio.
D Total distributions per share do not sum due to rounding.
E Total returns for periods of less than one year are not annualized.
F Fees and expenses of any underlying mutual funds or exchange-traded funds (ETFs) are not included in the Fund's expense ratio. The Fund indirectly bears its proportionate share of these expenses.
G Expense ratios reflect operating expenses of the class. Expenses before reductions do not reflect amounts reimbursed, waived, or reduced through arrangements with the investment adviser, brokerage services, or other offset arrangements, if applicable, and do not represent the amount paid by the class during periods when reimbursements, waivers or reductions occur.
H Annualized
I Amount does not include the portfolio activity of any underlying mutual funds or exchange-traded funds (ETFs).
See accompanying notes which are an integral part of the financial statements.
Fidelity Freedom Blend 2065 Fund Class Z6
| Years ended March 31, | 2022 | 2021 | 2020 A |
| Selected Per–Share Data | | | |
| Net asset value, beginning of period | $12.69 | $8.44 | $10.00 |
| Income from Investment Operations | | | |
| Net investment income (loss)B,C | .33 | .16 | .17 |
| Net realized and unrealized gain (loss) | .18 | 4.52 | (1.42) |
| Total from investment operations | .51 | 4.68 | (1.25) |
| Distributions from net investment income | (.30) | (.15) | (.17) |
| Distributions from net realized gain | (.61) | (.29) | (.14) |
| Total distributions | (.92)D | (.43)D | (.31) |
| Net asset value, end of period | $12.28 | $12.69 | $8.44 |
| Total ReturnE | 3.58% | 55.98% | (13.16)% |
| Ratios to Average Net AssetsC,F,G | | | |
| Expenses before reductions | .34% | .34% | .34%H |
| Expenses net of fee waivers, if any | .34% | .34% | .34%H |
| Expenses net of all reductions | .34% | .34% | .34%H |
| Net investment income (loss) | 2.50% | 1.45% | 2.24%H |
| Supplemental Data | | | |
| Net assets, end of period (000 omitted) | $1,027 | $267 | $97 |
| Portfolio turnover rateI | 33% | 38% | 29%H |
A For the period June 28, 2019 (commencement of operations) through March 31, 2020.
B Calculated based on average shares outstanding during the period.
C Net investment income (loss) is affected by the timing of the declaration of dividends by any underlying mutual funds or exchange-traded funds (ETFs). Net investment income (loss) of any such underlying funds is not included in the Fund's net investment income (loss) ratio.
D Total distributions per share do not sum due to rounding.
E Total returns for periods of less than one year are not annualized.
F Fees and expenses of any underlying mutual funds or exchange-traded funds (ETFs) are not included in the Fund's expense ratio. The Fund indirectly bears its proportionate share of these expenses.
G Expense ratios reflect operating expenses of the class. Expenses before reductions do not reflect amounts reimbursed, waived, or reduced through arrangements with the investment adviser, brokerage services, or other offset arrangements, if applicable, and do not represent the amount paid by the class during periods when reimbursements, waivers or reductions occur.
H Annualized
I Amount does not include the portfolio activity of any underlying mutual funds or exchange-traded funds (ETFs).
See accompanying notes which are an integral part of the financial statements.
Notes to Financial Statements
For the period ended March 31, 2022
1. Organization.
Fidelity Freedom Blend Income Fund, Fidelity Freedom Blend 2005 Fund, Fidelity Freedom Blend 2010 Fund, Fidelity Freedom Blend 2015 Fund, Fidelity Freedom Blend 2020 Fund, Fidelity Freedom Blend 2025 Fund, Fidelity Freedom Blend 2030 Fund, Fidelity Freedom Blend 2035 Fund, Fidelity Freedom Blend 2040 Fund, Fidelity Freedom Blend 2045 Fund, Fidelity Freedom Blend 2050 Fund, Fidelity Freedom Blend 2055 Fund, Fidelity Freedom Blend 2060 Fund and Fidelity Freedom Blend 2065 Fund (the Funds) are funds of Fidelity Aberdeen Street Trust (the Trust). The Trust is registered under the Investment Company Act of 1940, as amended (the 1940 Act), as an open-end management investment company organized as a Delaware statutory trust. Each Fund is authorized to issue an unlimited number of shares. Each Fund offers Class A, Class M, Class C, Fidelity Freedom Blend, Class K, Class K6, Class I, Class Z, Class Z6 and Premier Class shares, each of which has equal rights as to assets and voting privileges. Each class has exclusive voting rights with respect to matters that affect that class. Each Fund commenced sale of Premier Class shares on April 6, 2021. Effective June 21, 2021, Class C shares will automatically convert to Class A shares after a holding period of eight years from the initial date of purchase, with certain exceptions. Prior to June 21, 2021, Class C shares automatically converted to Class A shares after a holding period of ten years from the initial date of purchase, with certain exceptions.
2. Investments in Fidelity Central Funds.
Funds may invest in Fidelity Central Funds, which are open-end investment companies generally available only to other investment companies and accounts managed by the investment adviser and its affiliates. The Schedule of Investments lists any Fidelity Central Funds held as an investment as of period end, but does not include the underlying holdings of each Fidelity Central Fund. An investing fund indirectly bears its proportionate share of the expenses of the underlying Fidelity Central Funds.
Based on its investment objective, each Fidelity Central Fund may invest or participate in various investment vehicles or strategies that are similar to those of the investing fund. These strategies are consistent with the investment objectives of the investing fund and may involve certain economic risks which may cause a decline in value of each of the Fidelity Central Funds and thus a decline in the value of the investing fund.
| Fidelity Central Fund | Investment Manager | Investment Objective | Investment Practices | Expense Ratio(a) |
| Fidelity Money Market Central Funds | Fidelity Management & Research Company LLC (FMR) | Each fund seeks to obtain a high level of current income consistent with the preservation of capital and liquidity. | Short-term Investments | Less than .005% |
(a) Expenses expressed as a percentage of average net assets and are as of each underlying Central Fund's most recent annual or semi-annual shareholder report.
A complete unaudited list of holdings for each Fidelity Central Fund is available upon request or at the Securities and Exchange Commission website at www.sec.gov. In addition, the financial statements of the Fidelity Central Funds which contain the significant accounting policies (including investment valuation policies) of those funds, and are not covered by the Report of Independent Registered Public Accounting Firm, are available on the Securities and Exchange Commission website or upon request.
3. Significant Accounting Policies.
Each Fund is an investment company and applies the accounting and reporting guidance of the Financial Accounting Standards Board (FASB) Accounting Standards Codification Topic 946 Financial Services - Investment Companies. The financial statements have been prepared in conformity with accounting principles generally accepted in the United States of America (GAAP), which require management to make certain estimates and assumptions at the date of the financial statements. Actual results could differ from those estimates. Subsequent events, if any, through the date that the financial statements were issued have been evaluated in the preparation of the financial statements. Each Fund's Schedule of Investments lists any underlying mutual funds or exchange-traded funds (ETFs) but does not include the underlying holdings of these funds. The following summarizes the significant accounting policies of each Fund:
Investment Valuation. Investments are valued as of 4:00 p.m. Eastern time on the last calendar day of the period. The Board of Trustees (the Board) has delegated the day to day responsibility for the valuation of each Fund's investments to the Fair Value Committee (the Committee) established by the each Fund's investment adviser. In accordance with valuation policies and procedures approved by the Board, each Fund attempts to obtain prices from one or more third party pricing vendors or brokers to value its investments. When current market prices, quotations or currency exchange rates are not readily available or reliable, investments will be fair valued in good faith by the Committee, in accordance with procedures adopted by the Board. Factors used in determining fair value vary by investment type and may include market or investment specific events, changes in interest rates and credit quality. The frequency with which these procedures are used cannot be predicted and they may be utilized to a significant extent. The Committee oversees each Fund's valuation policies and procedures and reports to the Board on the Committee's activities and fair value determinations. The Board monitors the appropriateness of the procedures used in valuing each Fund's investments and ratifies the fair value determinations of the Committee. Each Fund categorizes the inputs to valuation techniques used to value its investments into a disclosure hierarchy consisting of three levels as shown below:
- Level 1 – unadjusted quoted prices in active markets for identical investments
- Level 2 – other significant observable inputs (including quoted prices for similar investments, interest rates, prepayment speeds, etc.)
- Level 3 – unobservable inputs (including the Fund's own assumptions based on the best information available)
Valuation techniques used to value each Fund's investments by major category are as follows. Investments in open-end mutual funds are valued at their closing net asset value (NAV) each business day and are categorized as Level 1 in the hierarchy. Debt securities, including restricted securities, are valued based on evaluated prices received from third party pricing vendors or from brokers who make markets in such securities. U.S. government and government agency obligations are valued by pricing vendors who utilize matrix pricing which considers yield or price of bonds of comparable quality, coupon, maturity and type or by broker-supplied prices. When independent prices are unavailable or unreliable, debt securities may be valued utilizing pricing methodologies which consider similar factors that would be used by third party pricing vendors. Debt securities are generally categorized as Level 2 in the hierarchy but may be Level 3 depending on the circumstances. The aggregate value of investments by input level as of March 31, 2022 is included at the end of each Fund's Schedule of Investments.
Futures contracts are valued at the settlement price established each day by the board of trade or exchange on which they are traded and are categorized as Level 1 in the hierarchy.
Investment Transactions and Income. For financial reporting purposes, the Funds’ investment holdings and NAV include trades executed through the end of the last business day of the period. The NAV per share for processing shareholder transactions is calculated as of the close of business of the New York Stock Exchange (NYSE), normally 4:00 p.m. Eastern time and includes trades executed through the end of the prior business day. Gains and losses on securities sold are determined on the basis of identified cost. Income and capital gain distributions from any underlying mutual funds or exchange-traded funds (ETFs) are recorded on the ex-dividend date. Distributions from any underlying mutual funds or exchange-traded funds (ETFs) that are deemed to be return of capital are recorded as a reduction of cost of investments. Interest income is accrued as earned. Interest income includes coupon interest and amortization of premium and accretion of discount on debt securities as applicable.
Class Allocations and Expenses. Investment income, realized and unrealized capital gains and losses, common expenses of a fund, and certain fund-level expense reductions, if any, are allocated daily on a pro-rata basis to each class based on the relative net assets of each class to the total net assets of a fund. Each class differs with respect to transfer agent and distribution and service plan fees incurred, as applicable. Certain expense reductions may also differ by class, if applicable. For the reporting period, the allocated portion of income and expenses to each class as a percent of its average net assets may vary due to the timing of recording these transactions in relation to fluctuating net assets of the classes. Expenses directly attributable to a fund are charged to that fund. Expenses attributable to more than one fund are allocated among the respective funds on the basis of relative net assets or other appropriate methods. Expenses included in the accompanying financial statements reflect the expenses of that fund and do not include any expenses associated with any underlying mutual funds or exchange-traded funds. Although not included in a fund's expenses, a fund indirectly bears its proportionate share of these expenses through the net asset value of each underlying mutual fund or exchange-traded fund. Expense estimates are accrued in the period to which they relate and adjustments are made when actual amounts are known.
Income Tax Information and Distributions to Shareholders. Each year, each Fund intends to qualify as a regulated investment company under Subchapter M of the Internal Revenue Code, including distributing substantially all of its taxable income and realized gains. As a result, no provision for U.S. Federal income taxes is required. As of March 31, 2022, each Fund did not have any unrecognized tax benefits in the financial statements; nor is each Fund aware of any tax positions for which it is reasonably possible that the total amounts of unrecognized tax benefits will significantly change in the next twelve months. Each Fund files a U.S. federal tax return, in addition to state and local tax returns as required. Each Fund's federal income tax returns are subject to examination by the Internal Revenue Service (IRS) for a period of three fiscal years after they are filed. State and local tax returns may be subject to examination for an additional fiscal year depending on the jurisdiction.
Distributions are declared and recorded on the ex-dividend date. Income and capital gain distributions are declared separately for each class. Income and capital gain distributions are determined in accordance with income tax regulations, which may differ from GAAP.
Capital accounts within the financial statements are adjusted for permanent book-tax differences. These adjustments have no impact on net assets or the results of operations. Capital accounts are not adjusted for temporary book-tax differences which will reverse in a subsequent period.
Book-tax differences are primarily due to the short-term gain distributions from the underlying mutual funds or exchange-traded funds (ETFs), futures contracts, foreign currency transactions, and losses deferred due to wash sales and excise tax regulations.
As of period end, the cost and unrealized appreciation (depreciation) in securities, and derivatives if applicable, for federal income tax purposes were as follows for each Fund:
| | Tax cost | Gross unrealized appreciation | Gross unrealized depreciation | Net unrealized appreciation (depreciation) |
| Fidelity Freedom Blend Income Fund | $90,953,603 | $1,898,742 | $(3,933,956) | $(2,035,214) |
| Fidelity Freedom Blend 2005 Fund | 25,360,183 | 795,545 | (997,452) | (201,907) |
| Fidelity Freedom Blend 2010 Fund | 88,767,359 | 3,820,139 | (3,443,390) | 376,749 |
| Fidelity Freedom Blend 2015 Fund | 247,437,864 | 14,587,022 | (8,495,866) | 6,091,156 |
| Fidelity Freedom Blend 2020 Fund | 787,776,373 | 57,866,560 | (30,217,303) | 27,649,257 |
| Fidelity Freedom Blend 2025 Fund | 1,457,103,444 | 105,744,461 | (69,000,040) | 36,744,421 |
| Fidelity Freedom Blend 2030 Fund | 1,587,269,799 | 123,860,878 | (78,557,923) | 45,302,955 |
| Fidelity Freedom Blend 2035 Fund | 1,554,337,510 | 141,432,249 | (80,454,570) | 60,977,679 |
| Fidelity Freedom Blend 2040 Fund | 1,387,433,827 | 141,525,257 | (69,269,066) | 72,256,191 |
| Fidelity Freedom Blend 2045 Fund | 1,200,217,850 | 121,802,064 | (61,397,708) | 60,404,356 |
| Fidelity Freedom Blend 2050 Fund | 1,009,923,962 | 101,573,421 | (52,276,063) | 49,297,358 |
| Fidelity Freedom Blend 2055 Fund | 593,809,614 | 55,691,177 | (32,876,879) | 22,814,298 |
| Fidelity Freedom Blend 2060 Fund | 230,433,278 | 18,872,505 | (14,530,342) | 4,342,163 |
| Fidelity Freedom Blend 2065 Fund | 37,525,428 | 1,700,380 | (2,692,320) | (991,940) |
The tax-based components of distributable earnings as of period end were as follows for each Fund:
| | Undistributed ordinary income | Undistributed long-term capital gain | Net unrealized appreciation (depreciation) on securities and other investments |
| Fidelity Freedom Blend Income Fund | $78,758 | $1,099,794 | $(2,035,214) |
| Fidelity Freedom Blend 2005 Fund | 34,097 | 388,267 | (201,907) |
| Fidelity Freedom Blend 2010 Fund | 109,881 | 1,460,759 | 376,749 |
| Fidelity Freedom Blend 2015 Fund | 272,361 | 5,182,092 | 6,091,156 |
| Fidelity Freedom Blend 2020 Fund | 736,013 | 18,222,264 | 27,649,257 |
| Fidelity Freedom Blend 2025 Fund | 1,105,735 | 32,222,895 | 36,744,421 |
| Fidelity Freedom Blend 2030 Fund | 933,327 | 36,626,237 | 45,302,955 |
| Fidelity Freedom Blend 2035 Fund | – | 41,974,372 | 60,977,679 |
| Fidelity Freedom Blend 2040 Fund | – | 41,647,447 | 72,256,191 |
| Fidelity Freedom Blend 2045 Fund | – | 36,209,471 | 60,404,356 |
| Fidelity Freedom Blend 2050 Fund | – | 29,936,594 | 49,297,358 |
| Fidelity Freedom Blend 2055 Fund | – | 17,112,497 | 22,814,298 |
| Fidelity Freedom Blend 2060 Fund | – | 6,317,310 | 4,342,163 |
| Fidelity Freedom Blend 2065 Fund | – | 823,716 | (991,940) |
Certain of the Funds intend to elect to defer to the next fiscal year capital losses recognized during the period November 1, 2021 to March 31, 2022, and ordinary losses recognized during the period January 1, 2022 to March 31,2022. Loss deferrals were as follows:
| | Capital losses | Ordinary losses |
| Fidelity Freedom Blend Income Fund | $(147,501) | $– |
| Fidelity Freedom Blend 2005 Fund | (14,259) | – |
| Fidelity Freedom Blend 2010 Fund | (36,981) | – |
| Fidelity Freedom Blend 2015 Fund | (148,710) | – |
| Fidelity Freedom Blend 2020 Fund | (521,001) | – |
| Fidelity Freedom Blend 2025 Fund | (1,311,110) | – |
| Fidelity Freedom Blend 2030 Fund | (1,056,097) | – |
| Fidelity Freedom Blend 2035 Fund | (1,487,343) | – |
| Fidelity Freedom Blend 2040 Fund | (1,217,562) | (305,269) |
| Fidelity Freedom Blend 2045 Fund | (1,092,871) | (272,623) |
| Fidelity Freedom Blend 2050 Fund | (893,211) | – |
| Fidelity Freedom Blend 2055 Fund | (566,429) | (141,814) |
| Fidelity Freedom Blend 2060 Fund | (189,925) | (60,640) |
| Fidelity Freedom Blend 2065 Fund | – | (1,856) |
The tax character of distributions paid was as follows:
| March 31, 2022 | | | |
| | Ordinary Income | Long-term Capital Gains | Total |
| Fidelity Freedom Blend Income Fund | $2,371,871 | $934,474 | $3,306,345 |
| Fidelity Freedom Blend 2005 Fund | 779,657 | 447,765 | 1,227,422 |
| Fidelity Freedom Blend 2010 Fund | 2,642,138 | 2,609,888 | 5,252,026 |
| Fidelity Freedom Blend 2015 Fund | 8,614,983 | 8,956,429 | 17,571,412 |
| Fidelity Freedom Blend 2020 Fund | 30,030,194 | 29,502,521 | 59,532,715 |
| Fidelity Freedom Blend 2025 Fund | 53,647,858 | 42,085,243 | 95,733,101 |
| Fidelity Freedom Blend 2030 Fund | 59,228,836 | 47,795,612 | 107,024,448 |
| Fidelity Freedom Blend 2035 Fund | 60,645,134 | 53,843,811 | 114,488,945 |
| Fidelity Freedom Blend 2040 Fund | 57,172,632 | 53,870,254 | 111,042,886 |
| Fidelity Freedom Blend 2045 Fund | 49,957,940 | 46,992,547 | 96,950,487 |
| Fidelity Freedom Blend 2050 Fund | 41,452,681 | 38,440,119 | 79,892,800 |
| Fidelity Freedom Blend 2055 Fund | 23,197,415 | 20,867,991 | 44,065,406 |
| Fidelity Freedom Blend 2060 Fund | 8,528,089 | 7,156,222 | 15,684,311 |
| Fidelity Freedom Blend 2065 Fund | 1,069,783 | 739,583 | 1,809,366 |
| March 31, 2021 | | | |
| | Ordinary Income | Long-term Capital Gains | Total |
| Fidelity Freedom Blend Income Fund | $1,096,757 | $430,922 | $1,527,679 |
| Fidelity Freedom Blend 2005 Fund | 410,221 | 238,471 | 648,692 |
| Fidelity Freedom Blend 2010 Fund | 1,665,385 | 1,059,769 | 2,725,154 |
| Fidelity Freedom Blend 2015 Fund | 4,898,725 | 4,551,089 | 9,449,814 |
| Fidelity Freedom Blend 2020 Fund | 15,076,422 | 16,432,190 | 31,508,612 |
| Fidelity Freedom Blend 2025 Fund | 21,577,088 | 23,488,125 | 45,065,213 |
| Fidelity Freedom Blend 2030 Fund | 22,072,830 | 26,511,497 | 48,584,327 |
| Fidelity Freedom Blend 2035 Fund | 19,379,849 | 28,656,374 | 48,036,223 |
| Fidelity Freedom Blend 2040 Fund | 15,906,663 | 27,660,206 | 43,566,869 |
| Fidelity Freedom Blend 2045 Fund | 13,644,027 | 23,508,137 | 37,152,164 |
| Fidelity Freedom Blend 2050 Fund | 11,154,730 | 18,415,981 | 29,570,711 |
| Fidelity Freedom Blend 2055 Fund | 5,894,331 | 8,948,161 | 14,842,492 |
| Fidelity Freedom Blend 2060 Fund | 1,807,397 | 2,524,154 | 4,331,551 |
| Fidelity Freedom Blend 2065 Fund | 137,655 | 146,493 | 284,148 |
4. Derivative Instruments.
Risk Exposures and the Use of Derivative Instruments. The Funds' investment objective allows the Funds to enter into various types of derivative contracts, including futures contracts. Derivatives are investments whose value is primarily derived from underlying assets, indices or reference rates and may be transacted on an exchange or over-the-counter (OTC). Derivatives may involve a future commitment to buy or sell a specified asset based on specified terms, to exchange future cash flows at periodic intervals based on a notional principal amount, or for one party to make one or more payments upon the occurrence of specified events in exchange for periodic payments from the other party.
The Funds used derivatives to increase returns and to manage exposure to certain risks as defined below. The success of any strategy involving derivatives depends on analysis of numerous economic factors, and if the strategies for investment do not work as intended, the Funds may not achieve their objectives.
The Funds' use of derivatives increased or decreased their exposure to the following risk:
| Equity Risk | Equity risk relates to the fluctuations in the value of financial instruments as a result of changes in market prices (other than those arising from interest rate risk or foreign exchange risk), whether caused by factors specific to an individual investment, its issuer, or all factors affecting all instruments traded in a market or market segment.
|
The Funds are also exposed to additional risks from investing in derivatives, such as liquidity risk and counterparty credit risk. Liquidity risk is the risk that the Funds will be unable to close out the derivative in the open market in a timely manner. Counterparty credit risk is the risk that the counterparty will not be able to fulfill its obligation to the Funds. Derivative counterparty credit risk is managed through formal evaluation of the creditworthiness of all potential counterparties.
Investing in derivatives may involve greater risks than investing in the underlying assets directly and, to varying degrees, may involve risk of loss in excess of any initial investment and collateral received and amounts recognized in the Statement of Assets and Liabilities. In addition, there may be the risk that the change in value of the derivative contract does not correspond to the change in value of the underlying instrument.
Futures Contracts. A futures contract is an agreement between two parties to buy or sell a specified underlying instrument for a fixed price at a specified future date. The Funds used futures contracts to manage their exposure to the stock market.
Upon entering into a futures contract, a fund is required to deposit either cash or securities (initial margin) with a clearing broker in an amount equal to a certain percentage of the face value of the contract. Futures contracts are marked-to-market daily and subsequent daily payments are made or received by a fund depending on the daily fluctuations in the value of the futures contracts and are recorded as unrealized appreciation or (depreciation). This receivable and/or payable, if any, is included in daily variation margin on futures contracts in the Statement of Assets and Liabilities. Realized gain or (loss) is recorded upon the expiration or closing of a futures contract. The net realized gain (loss) and change in net unrealized appreciation (depreciation) on futures contracts during the period is presented in the Statement of Operations.
Any open futures contracts at period end are presented in the Schedule of Investments under the caption "Futures Contracts". The notional amount at value reflects each contract's exposure to the underlying instrument or index at period end and is representative of volume of activity during the period for Fidelity Freedom Blend Income Fund, Fidelity Freedom Blend 2010 Fund, Fidelity Freedom Blend 2035 Fund, Fidelity Freedom Blend 2040 Fund, Fidelity Freedom Blend 2050 Fund, Fidelity Freedom Blend 2055 Fund, and Fidelity Freedom Blend 2060 Fund. Securities deposited to meet initial margin requirements are identified in the Schedule of Investments.
5. Purchases and Sales of Investments.
Purchases and sales of securities, other than short-term securities, U.S. government securities and in-kind transactions, as applicable, are noted in the table below.
| | Purchases ($) | Sales ($) |
| Fidelity Freedom Blend Income Fund | 82,163,962 | 50,405,299 |
| Fidelity Freedom Blend 2005 Fund | 19,917,708 | 16,983,353 |
| Fidelity Freedom Blend 2010 Fund | 58,800,817 | 45,456,747 |
| Fidelity Freedom Blend 2015 Fund | 154,416,390 | 121,423,213 |
| Fidelity Freedom Blend 2020 Fund | 469,006,245 | 366,111,841 |
| Fidelity Freedom Blend 2025 Fund | 908,440,042 | 487,308,890 |
| Fidelity Freedom Blend 2030 Fund | 950,178,737 | 432,647,900 |
| Fidelity Freedom Blend 2035 Fund | 913,431,590 | 344,052,136 |
| Fidelity Freedom Blend 2040 Fund | 802,791,954 | 289,122,483 |
| Fidelity Freedom Blend 2045 Fund | 698,033,400 | 241,834,529 |
| Fidelity Freedom Blend 2050 Fund | 595,703,887 | 199,043,918 |
| Fidelity Freedom Blend 2055 Fund | 375,496,799 | 107,518,284 |
| Fidelity Freedom Blend 2060 Fund | 162,413,283 | 42,320,657 |
| Fidelity Freedom Blend 2065 Fund | 34,346,803 | 8,141,879 |
6. Fees and Other Transactions with Affiliates.
Management Fee and Expense Contract. Fidelity Management & Research Company LLC (the investment adviser) and its affiliates provide the Funds with investment management related services. Under the management contract, each Class of each Fund pays a monthly management fee that is set at an annual rate by referring to each Fund's target date, indicated by its name, such that the management fee rate applicable to each Class of each Fund is reduced as the fund approaches, and then passes, its target date. In addition, under the management contract, the investment adviser pays all ordinary operating expenses of each Fund, except distribution and service plan fees, fees and expenses of the independent Trustees, and certain miscellaneous expenses such as proxy and shareholder meeting expenses. For the reporting period, the total annual management fee rate for each Class of each Fund was as follows:
| | Annual % of Class-Level Average Net Assets (Classes A, M, C, I, Fidelity Freedom Blend Class) | Annual % of Class-Level Average Net Assets
(Classes K, K6, Z, Z6, Premier Class) |
| Fidelity Freedom Blend Income Fund | .46% | .36% |
| Fidelity Freedom Blend 2005 Fund | .46% | .36% |
| Fidelity Freedom Blend 2010 Fund | .47% | .37% |
| Fidelity Freedom Blend 2015 Fund | .48% | .38% |
| Fidelity Freedom Blend 2020 Fund | .49% | .39% |
| Fidelity Freedom Blend 2025 Fund | .50% | .40% |
| Fidelity Freedom Blend 2030 Fund | .52% | .42% |
| Fidelity Freedom Blend 2035 Fund | .53% | .43% |
| Fidelity Freedom Blend 2040 Fund | .54% | .44% |
| Fidelity Freedom Blend 2045 Fund | .54% | .44% |
| Fidelity Freedom Blend 2050 Fund | .54% | .44% |
| Fidelity Freedom Blend 2055 Fund | .54% | .44% |
| Fidelity Freedom Blend 2060 Fund | .54% | .44% |
| Fidelity Freedom Blend 2065 Fund | .54% | .44% |
Under the expense contract, the investment adviser pays class-level expenses for Class K6, Class Z6 and Premier Class of each Fund as necessary so that Class K6, Class Z6 and Premier Class total expenses do not exceed certain amounts of Class K6, Class Z6 and Premier Class average net assets, respectively, on an annual basis with certain exceptions, as noted in the following table:
| | Annual % of Class-Level Average Net Assets (Classes K6, Z6) | Annual % of Class-Level Average Net Assets (Premier Class) |
| Fidelity Freedom Blend Income Fund | .26% | .24% |
| Fidelity Freedom Blend 2005 Fund | .26% | .24% |
| Fidelity Freedom Blend 2010 Fund | .27% | .25% |
| Fidelity Freedom Blend 2015 Fund | .28% | .25% |
| Fidelity Freedom Blend 2020 Fund | .29% | .26% |
| Fidelity Freedom Blend 2025 Fund | .30% | .26% |
| Fidelity Freedom Blend 2030 Fund | .32% | .27% |
| Fidelity Freedom Blend 2035 Fund | .33% | .28% |
| Fidelity Freedom Blend 2040 Fund | .34% | .29% |
| Fidelity Freedom Blend 2045 Fund | .34% | .29% |
| Fidelity Freedom Blend 2050 Fund | .34% | .29% |
| Fidelity Freedom Blend 2055 Fund | .34% | .29% |
| Fidelity Freedom Blend 2060 Fund | .34% | .29% |
| Fidelity Freedom Blend 2065 Fund | .34% | .29% |
During March 2022 the Board approved a change in the total annual management fee rate for each Class of each Fund to the rates presented in the table below effective April 1, 2022.
| | Annual % of Class-Level Average Net Assets (Classes A, M, C, I, Fidelity Freedom Blend Class) | Annual % of Class-Level Average Net Assets
(Classes K, K6, Z, Z6, Premier Class) |
| Fidelity Freedom Blend Income Fund | .41% | .31% |
| Fidelity Freedom Blend 2005 Fund | .41% | .31% |
| Fidelity Freedom Blend 2010 Fund | .41% | .31% |
| Fidelity Freedom Blend 2015 Fund | .43% | .33% |
| Fidelity Freedom Blend 2020 Fund | .44% | .34% |
| Fidelity Freedom Blend 2025 Fund | .45% | .35% |
| Fidelity Freedom Blend 2030 Fund | .46% | .36% |
| Fidelity Freedom Blend 2035 Fund | .48% | .38% |
| Fidelity Freedom Blend 2040 Fund | .49% | .39% |
| Fidelity Freedom Blend 2045 Fund | .49% | .39% |
| Fidelity Freedom Blend 2050 Fund | .49% | .39% |
| Fidelity Freedom Blend 2055 Fund | .49% | .39% |
| Fidelity Freedom Blend 2060 Fund | .49% | .39% |
| Fidelity Freedom Blend 2065 Fund | .49% | .39% |
The Board also approved a change in the expense contract rate for Class K6, Class Z6 and Premier Class of each Fund to the rates presented in the table below effective April 1, 2022.
| | Annual % of Class-Level Average Net Assets (Classes K6, Z6) | Annual % of Class-Level Average Net Assets
(Premier Class) |
| Fidelity Freedom Blend Income Fund | .21% | .19% |
| Fidelity Freedom Blend 2005 Fund | .21% | .19% |
| Fidelity Freedom Blend 2010 Fund | .21% | .19% |
| Fidelity Freedom Blend 2015 Fund | .23% | .20% |
| Fidelity Freedom Blend 2020 Fund | .24% | .21% |
| Fidelity Freedom Blend 2025 Fund | .25% | .22% |
| Fidelity Freedom Blend 2030 Fund | .26% | .23% |
| Fidelity Freedom Blend 2035 Fund | .28% | .24% |
| Fidelity Freedom Blend 2040 Fund | .29% | .25% |
| Fidelity Freedom Blend 2045 Fund | .29% | .25% |
| Fidelity Freedom Blend 2050 Fund | .29% | .25% |
| Fidelity Freedom Blend 2055 Fund | .29% | .25% |
| Fidelity Freedom Blend 2060 Fund | .29% | .25% |
| Fidelity Freedom Blend 2065 Fund | .29% | .25% |
Distribution and Service Plan Fees. In accordance with Rule 12b-1 of the 1940 Act, each Fund has adopted separate Distribution and Service Plans for each class of shares. Certain classes pay Fidelity Distributors Company LLC (FDC), an affiliate of the investment adviser, separate Distribution and Service Fees, each of which is based on an annual percentage of each class' average net assets. In addition, FDC may pay financial intermediaries for selling shares of each Fund and providing shareholder support services. For the period, the Distribution and Service Fee rates, total fees and amounts retained by FDC were as follows:
| | Distribution Fee | Service Fee | Total Fees | Retained by FDC |
| Fidelity Freedom Blend Income Fund | | | | |
| Class A | -% | .25% | $5,696 | $– |
| Class M | .25% | .25% | 886 | 477 |
| Class C | .75% | .25% | 6,329 | 491 |
| | | | $12,911 | $968 |
| Fidelity Freedom Blend 2005 Fund | | | | |
| Class A | -% | .25% | $1,015 | $213 |
| Class M | .25% | .25% | 926 | 595 |
| Class C | .75% | .25% | 3,241 | 1,316 |
| | | | $5,182 | $2,124 |
| Fidelity Freedom Blend 2010 Fund | | | | |
| Class A | -% | .25% | $1,753 | $18 |
| Class M | .25% | .25% | 1,868 | 574 |
| Class C | .75% | .25% | 2,725 | 1,508 |
| | | | $6,346 | $2,100 |
| Fidelity Freedom Blend 2015 Fund | | | | |
| Class A | -% | .25% | $1,698 | $19 |
| Class M | .25% | .25% | 3,527 | 311 |
| Class C | .75% | .25% | 9,075 | 1,532 |
| | | | $14,300 | $1,862 |
| Fidelity Freedom Blend 2020 Fund | | | | |
| Class A | -% | .25% | $13,165 | $246 |
| Class M | .25% | .25% | 7,190 | 211 |
| Class C | .75% | .25% | 11,869 | 4,377 |
| | | | $32,224 | $4,834 |
| Fidelity Freedom Blend 2025 Fund | | | | |
| Class A | -% | .25% | $16,951 | $105 |
| Class M | .25% | .25% | 10,647 | 45 |
| Class C | .75% | .25% | 15,731 | 5,416 |
| | | | $43,329 | $5,566 |
| Fidelity Freedom Blend 2030 Fund | | | | |
| Class A | -% | .25% | $22,440 | $1,031 |
| Class M | .25% | .25% | 13,260 | 70 |
| Class C | .75% | .25% | 31,279 | 9,665 |
| | | | $66,979 | $10,766 |
| Fidelity Freedom Blend 2035 Fund | | | | |
| Class A | -% | .25% | $10,446 | $1,252 |
| Class M | .25% | .25% | 6,304 | 119 |
| Class C | .75% | .25% | 17,747 | 8,325 |
| | | | $34,497 | $9,696 |
| Fidelity Freedom Blend 2040 Fund | | | | |
| Class A | -% | .25% | $12,478 | $149 |
| Class M | .25% | .25% | 5,184 | 149 |
| Class C | .75% | .25% | 17,436 | 5,889 |
| | | | $35,098 | $6,187 |
| Fidelity Freedom Blend 2045 Fund | | | | |
| Class A | -% | .25% | $6,973 | $162 |
| Class M | .25% | .25% | 10,260 | 4 |
| Class C | .75% | .25% | 20,872 | 11,910 |
| | | | $38,105 | $12,076 |
| Fidelity Freedom Blend 2050 Fund | | | | |
| Class A | -% | .25% | $8,856 | $260 |
| Class M | .25% | .25% | 4,312 | 391 |
| Class C | .75% | .25% | 12,537 | 6,112 |
| | | | $25,705 | $6,763 |
| Fidelity Freedom Blend 2055 Fund | | | | |
| Class A | -% | .25% | $5,028 | $185 |
| Class M | .25% | .25% | 3,936 | 381 |
| Class C | .75% | .25% | 5,145 | 3,019 |
| | | | $14,109 | $3,585 |
| Fidelity Freedom Blend 2060 Fund | | | | |
| Class A | -% | .25% | $4,031 | $250 |
| Class M | .25% | .25% | 2,568 | 434 |
| Class C | .75% | .25% | 5,719 | 2,664 |
| | | | $12,318 | $3,348 |
| Fidelity Freedom Blend 2065 Fund | | | | |
| Class A | -% | .25% | $1,808 | $315 |
| Class M | .25% | .25% | 1,934 | 614 |
| Class C | .75% | .25% | 4,363 | 2,920 |
| | | | $8,105 | $3,849 |
Sales Load. FDC may receive a front-end sales charge of up to 5.75% for selling Class A shares and 3.50% for selling Class M shares, some of which is paid to financial intermediaries for selling shares of each Fund. Depending on the holding period, FDC may receive contingent deferred sales charges levied on Class A, Class M and Class C redemptions. The deferred sales charges are 1.00% for Class C shares, 1.00% for certain purchases of Class A shares and .25% for certain purchases of Class M shares.
For the period, sales charge amounts retained by FDC were as follows:
| | Retained by FDC |
| Fidelity Freedom Blend Income Fund | |
| Class A | $727 |
| Class M | 54 |
| Class C(a) | 444 |
| | $1,225 |
| Fidelity Freedom Blend 2005 Fund | |
| Class A | $145 |
| Class M | 2 |
| Class C(a) | 102 |
| | $249 |
| Fidelity Freedom Blend 2010 Fund | |
| Class A | $408 |
| Class M | 2 |
| | $410 |
| Fidelity Freedom Blend 2015 Fund | |
| Class A | $243 |
| Class M | 97 |
| | $340 |
| Fidelity Freedom Blend 2020 Fund | |
| Class A | $956 |
| Class M | 390 |
| Class C(a) | 144 |
| | $1,490 |
| Fidelity Freedom Blend 2025 Fund | |
| Class A | $3,217 |
| Class M | 636 |
| Class C(a) | 230 |
| | $4,083 |
| Fidelity Freedom Blend 2030 Fund | |
| Class A | $8,393 |
| Class M | 1,853 |
| Class C(a) | 715 |
| | $10,961 |
| Fidelity Freedom Blend 2035 Fund | |
| Class A | $6,954 |
| Class M | 3,813 |
| Class C(a) | 658 |
| | $11,425 |
| Fidelity Freedom Blend 2040 Fund | |
| Class A | $7,895 |
| Class M | 852 |
| Class C(a) | 486 |
| | $9,233 |
| Fidelity Freedom Blend 2045 Fund | |
| Class A | $6,168 |
| Class M | 784 |
| Class C(a) | 239 |
| | $7,191 |
| Fidelity Freedom Blend 2050 Fund | |
| Class A | $6,320 |
| Class M | 1,286 |
| Class C(a) | 238 |
| | $7,844 |
| Fidelity Freedom Blend 2055 Fund | |
| Class A | $4,223 |
| Class M | 1,080 |
| Class C(a) | 50 |
| | $5,353 |
| Fidelity Freedom Blend 2060 Fund | |
| Class A | $3,984 |
| Class M | 974 |
| Class C(a) | 225 |
| | $5,183 |
| Fidelity Freedom Blend 2065 Fund | |
| Class A | $3,474 |
| Class M | 287 |
| Class C(a) | 187 |
| | $3,948 |
(a) When Class C shares are initially sold, FDC pays commissions from its own resources to financial intermediaries through which the sales are made.
Interfund Trades. Funds may purchase from or sell securities to other Fidelity Funds under procedures adopted by the Board. The procedures have been designed to ensure these interfund trades are executed in accordance with Rule 17a-7 of the 1940 Act. Any interfund trades are included within the respective purchases and sales amounts shown in the Purchases and Sales of Investments note. During the period there were no interfund trades.
Reallocation of Underlying Fund Investments. During the period, the investment adviser reallocated investments of the Funds. This involved taxable redemptions of the Funds' interest in Fidelity Series Inflation-Protected Bond Index Fund, ("Underlying Fund") for investments and cash and non-taxable exchanges of those investments and cash for shares of Fidelity Series 0-5 Year Inflation-Protected Bond Index Fund and Fidelity Series 5+ Year Inflation-Protected Bond Index Fund which are affiliated investment companies managed by FMR. Net realized gain (loss) on the redemptions of the Underlying Fund in connection with the reallocation is included in the accompanying Statements of Operations as "Net realized gain (loss) on Affiliated issuers."
Details of these transactions with the net related gain (loss) for the Funds are presented in the accompanying table:
| | Value of Investments and Cash reallocated ($) | Net realized Gain (Loss) on redemptions of Underlying Fund ($) |
| Fidelity Freedom Blend Income Fund | 7,123,121 | 204,953 |
| Fidelity Freedom Blend 2005 Fund | 1,807,311 | 82,916 |
| Fidelity Freedom Blend 2010 Fund | 5,275,327 | 275,911 |
| Fidelity Freedom Blend 2015 Fund | 14,768,487 | 847,314 |
| Fidelity Freedom Blend 2020 Fund | 39,240,243 | 2,086,632 |
| Fidelity Freedom Blend 2025 Fund | 59,280,958 | 2,290,887 |
| Fidelity Freedom Blend 2030 Fund | 48,538,753 | 1,662,007 |
| Fidelity Freedom Blend 2035 Fund | 13,241,355 | 494,572 |
| Fidelity Freedom Blend 2040 Fund | 12,708,507 | 549,749 |
| Fidelity Freedom Blend 2045 Fund | 12,943,681 | 575,227 |
| Fidelity Freedom Blend 2050 Fund | 10,776,444 | 466,196 |
| Fidelity Freedom Blend 2055 Fund | 6,045,813 | 227,195 |
| Fidelity Freedom Blend 2060 Fund | 2,238,361 | 68,094 |
| Fidelity Freedom Blend 2065 Fund | 284,085 | 5,925 |
7. Distributions to Shareholders.
Distributions to shareholders of each class were as follows:
| | Year ended
March 31, 2022 | Year ended
March 31, 2021 |
| Fidelity Freedom Blend Income Fund | | |
| Distributions to shareholders | | |
| Class A | $76,412 | $30,789 |
| Class M | 6,205 | 3,747 |
| Class C | 21,630 | 12,679 |
| Fidelity Freedom Blend Income Fund | 239,649 | 113,118 |
| Class K | 29,144 | 12,402 |
| Class K6 | 1,601,998 | 1,312,353 |
| Class I | 48,705 | 16,047 |
| Class Z | 71,232 | 21,786 |
| Class Z6 | 457,958 | 4,758 |
| Premier Class(a) | 753,412 | – |
| Total | $3,306,345 | $1,527,679 |
| Fidelity Freedom Blend 2005 Fund | | |
| Distributions to shareholders | | |
| Class A | $17,065 | $6,978 |
| Class M | 9,884 | 3,090 |
| Class C | 11,364 | 7,183 |
| Fidelity Freedom Blend 2005 Fund | 90,893 | 50,201 |
| Class K | 20,719 | 15,146 |
| Class K6 | 598,501 | 530,391 |
| Class I | 40,600 | 27,076 |
| Class Z | 8,700 | 4,905 |
| Class Z6 | 83,920 | 3,722 |
| Premier Class(a) | 345,776 | – |
| Total | $1,227,422 | $648,692 |
| Fidelity Freedom Blend 2010 Fund | | |
| Distributions to shareholders | | |
| Class A | $43,409 | $26,980 |
| Class M | 19,053 | 10,695 |
| Class C | 15,290 | 6,665 |
| Fidelity Freedom Blend 2010 Fund | 320,345 | 134,742 |
| Class K | 476,794 | 259,643 |
| Class K6 | 2,578,221 | 2,224,771 |
| Class I | 110,114 | 27,543 |
| Class Z | 11,714 | 5,353 |
| Class Z6 | 174,675 | 28,762 |
| Premier Class(a) | 1,502,411 | – |
| Total | $5,252,026 | $2,725,154 |
| Fidelity Freedom Blend 2015 Fund | | |
| Distributions to shareholders | | |
| Class A | $45,834 | $24,467 |
| Class M | 42,974 | 6,554 |
| Class C | 55,979 | 23,534 |
| Fidelity Freedom Blend 2015 Fund | 875,190 | 416,022 |
| Class K | 446,502 | 238,094 |
| Class K6 | 9,072,606 | 8,475,902 |
| Class I | 436,484 | 197,917 |
| Class Z | 8,751 | 4,851 |
| Class Z6 | 1,217,602 | 62,473 |
| Premier Class(a) | 5,369,490 | – |
| Total | $17,571,412 | $9,449,814 |
| Fidelity Freedom Blend 2020 Fund | | |
| Distributions to shareholders | | |
| Class A | $343,598 | $116,447 |
| Class M | 96,522 | 26,115 |
| Class C | 78,103 | 32,784 |
| Fidelity Freedom Blend 2020 Fund | 3,296,533 | 1,223,012 |
| Class K | 2,152,977 | 1,178,680 |
| Class K6 | 30,245,071 | 28,438,532 |
| Class I | 921,176 | 366,060 |
| Class Z | 62,797 | 6,540 |
| Class Z6 | 2,405,226 | 120,442 |
| Premier Class(a) | 19,930,712 | – |
| Total | $59,532,715 | $31,508,612 |
| Fidelity Freedom Blend 2025 Fund | | |
| Distributions to shareholders | | |
| Class A | $404,040 | $135,485 |
| Class M | 143,031 | 53,311 |
| Class C | 92,899 | 35,148 |
| Fidelity Freedom Blend 2025 Fund | 4,210,203 | 1,520,063 |
| Class K | 2,711,347 | 1,328,142 |
| Class K6 | 48,534,981 | 40,753,859 |
| Class I | 1,989,221 | 959,802 |
| Class Z | 212,564 | 5,255 |
| Class Z6 | 5,778,512 | 274,148 |
| Premier Class(a) | 31,656,303 | – |
| Total | $95,733,101 | $45,065,213 |
| Fidelity Freedom Blend 2030 Fund | | |
| Distributions to shareholders | | |
| Class A | $586,739 | $168,878 |
| Class M | 189,177 | 68,058 |
| Class C | 197,106 | 101,064 |
| Fidelity Freedom Blend 2030 Fund | 4,385,902 | 1,199,509 |
| Class K | 2,873,814 | 1,307,651 |
| Class K6 | 52,904,449 | 44,309,572 |
| Class I | 2,849,745 | 1,140,293 |
| Class Z | 367,357 | 9,907 |
| Class Z6 | 4,557,776 | 279,395 |
| Premier Class(a) | 38,112,383 | – |
| Total | $107,024,448 | $48,584,327 |
| Fidelity Freedom Blend 2035 Fund | | |
| Distributions to shareholders | | |
| Class A | $357,375 | $81,391 |
| Class M | 82,367 | 43,152 |
| Class C | 131,999 | 42,230 |
| Fidelity Freedom Blend 2035 Fund | 5,343,842 | 1,387,579 |
| Class K | 2,748,378 | 1,034,516 |
| Class K6 | 53,430,689 | 44,547,977 |
| Class I | 2,036,854 | 666,837 |
| Class Z | 116,232 | 15,254 |
| Class Z6 | 6,005,398 | 217,287 |
| Premier Class(a) | 44,235,811 | – |
| Total | $114,488,945 | $48,036,223 |
| Fidelity Freedom Blend 2040 Fund | | |
| Distributions to shareholders | | |
| Class A | $409,884 | $90,051 |
| Class M | 76,330 | 29,927 |
| Class C | 134,945 | 49,879 |
| Fidelity Freedom Blend 2040 Fund | 5,716,409 | 1,266,304 |
| Class K | 2,345,285 | 883,718 |
| Class K6 | 51,811,849 | 40,625,180 |
| Class I | 1,554,389 | 480,886 |
| Class Z | 307,930 | 6,183 |
| Class Z6 | 4,246,529 | 134,741 |
| Premier Class(a) | 44,439,336 | – |
| Total | $111,042,886 | $43,566,869 |
| Fidelity Freedom Blend 2045 Fund | | |
| Distributions to shareholders | | |
| Class A | $242,403 | $70,620 |
| Class M | 161,064 | 72,607 |
| Class C | 166,826 | 41,341 |
| Fidelity Freedom Blend 2045 Fund | 3,451,438 | 911,956 |
| Class K | 2,249,951 | 886,361 |
| Class K6 | 44,759,022 | 34,613,340 |
| Class I | 1,345,059 | 428,586 |
| Class Z | 258,147 | 6,722 |
| Class Z6 | 3,705,795 | 120,631 |
| Premier Class(a) | 40,610,782 | – |
| Total | $96,950,487 | $37,152,164 |
| Fidelity Freedom Blend 2050 Fund | | |
| Distributions to shareholders | | |
| Class A | $285,597 | $68,023 |
| Class M | 69,109 | 24,168 |
| Class C | 98,454 | 34,540 |
| Fidelity Freedom Blend 2050 Fund | 3,455,859 | 964,286 |
| Class K | 1,330,121 | 486,658 |
| Class K6 | 39,393,616 | 27,519,027 |
| Class I | 1,084,022 | 294,662 |
| Class Z | 179,580 | 6,016 |
| Class Z6 | 2,767,644 | 173,331 |
| Premier Class(a) | 31,228,798 | – |
| Total | $79,892,800 | $29,570,711 |
| Fidelity Freedom Blend 2055 Fund | | |
| Distributions to shareholders | | |
| Class A | $160,223 | $48,263 |
| Class M | 62,566 | 23,005 |
| Class C | 39,444 | 12,302 |
| Fidelity Freedom Blend 2055 Fund | 1,914,513 | 475,289 |
| Class K | 792,143 | 296,213 |
| Class K6 | 24,208,036 | 13,744,285 |
| Class I | 765,068 | 156,276 |
| Class Z | 132,003 | 5,718 |
| Class Z6 | 1,750,158 | 81,141 |
| Premier Class(a) | 14,241,252 | – |
| Total | $44,065,406 | $14,842,492 |
| Fidelity Freedom Blend 2060 Fund | | |
| Distributions to shareholders | | |
| Class A | $133,173 | $38,825 |
| Class M | 39,479 | 13,370 |
| Class C | 42,557 | 14,892 |
| Fidelity Freedom Blend 2060 Fund | 825,176 | 215,485 |
| Class K | 293,216 | 81,145 |
| Class K6 | 9,662,007 | 3,843,006 |
| Class I | 376,888 | 78,938 |
| Class Z | 38,902 | 5,263 |
| Class Z6 | 576,640 | 40,627 |
| Premier Class(a) | 3,696,273 | – |
| Total | $15,684,311 | $4,331,551 |
| Fidelity Freedom Blend 2065 Fund | | |
| Distributions to shareholders | | |
| Class A | $51,161 | $10,963 |
| Class M | 25,230 | 9,480 |
| Class C | 26,538 | 7,987 |
| Fidelity Freedom Blend 2065 Fund | 214,302 | 39,047 |
| Class K | 31,781 | 6,950 |
| Class K6 | 1,034,966 | 188,061 |
| Class I | 66,357 | 8,712 |
| Class Z | 11,690 | 4,765 |
| Class Z6 | 53,845 | 8,183 |
| Premier Class(a) | 293,496 | – |
| Total | $1,809,366 | $284,148 |
(a) Distributions for Premier Class are for the period April 6, 2021 (commencement of sale of shares) through March 31, 2022.
8. Share Transactions.
Share transactions for each class were as follows and may contain in-kind transactions, automatic conversions between classes or exchanges between affiliated funds:
| | Shares | Shares | Dollars | Dollars |
| | Year ended March 31, 2022 | Year ended March 31, 2021 | Year ended March 31, 2022 | Year ended March 31, 2021 |
| Fidelity Freedom Blend Income Fund | | | | |
| Class A | | | | |
| Shares sold | 161,977 | 85,072 | $1,774,882 | $895,089 |
| Reinvestment of distributions | 6,990 | 2,837 | 76,412 | 30,789 |
| Shares redeemed | (46,851) | (27,679) | (515,320) | (301,591) |
| Net increase (decrease) | 122,116 | 60,230 | $1,335,974 | $624,287 |
| Class M | | | | |
| Shares sold | 1,360 | 1,969 | $14,965 | $20,671 |
| Reinvestment of distributions | 567 | 345 | 6,205 | 3,747 |
| Shares redeemed | (6,418) | (35) | (70,685) | (389) |
| Net increase (decrease) | (4,491) | 2,279 | $(49,515) | $24,029 |
| Class C | | | | |
| Shares sold | 5,546 | 56,293 | $60,949 | $600,861 |
| Reinvestment of distributions | 1,993 | 1,165 | 21,630 | 12,679 |
| Shares redeemed | (22,606) | (14,842) | (244,733) | (160,615) |
| Net increase (decrease) | (15,067) | 42,616 | $(162,154) | $452,925 |
| Fidelity Freedom Blend Income Fund | | | | |
| Shares sold | 168,412 | 720,200 | $1,859,202 | $7,812,819 |
| Reinvestment of distributions | 18,571 | 10,407 | 203,539 | 112,904 |
| Shares redeemed | (212,558) | (457,220) | (2,328,646) | (4,972,335) |
| Net increase (decrease) | (25,575) | 273,387 | $(265,905) | $2,953,388 |
| Class K | | | | |
| Shares sold | 100,946 | 24,778 | $1,102,073 | $271,629 |
| Reinvestment of distributions | 2,659 | 1,147 | 29,144 | 12,402 |
| Shares redeemed | (52,482) | (14,810) | (573,087) | (158,783) |
| Net increase (decrease) | 51,123 | 11,115 | $558,130 | $125,248 |
| Class K6 | | | | |
| Shares sold | 2,387,707 | 2,512,373 | $26,144,839 | $26,898,262 |
| Reinvestment of distributions | 145,997 | 121,385 | 1,601,998 | 1,312,353 |
| Shares redeemed | (3,768,833) | (1,845,091) | (41,740,068) | (19,920,222) |
| Net increase (decrease) | (1,235,129) | 788,667 | $(13,993,231) | $8,290,393 |
| Class I | | | | |
| Shares sold | 202,021 | 49,310 | $2,163,601 | $533,513 |
| Reinvestment of distributions | 4,451 | 1,472 | 48,705 | 16,047 |
| Shares redeemed | (33,599) | (6,511) | (362,258) | (71,189) |
| Net increase (decrease) | 172,873 | 44,271 | $1,850,048 | $478,371 |
| Class Z | | | | |
| Shares sold | 97,421 | 112,876 | $1,081,329 | $1,215,647 |
| Reinvestment of distributions | 4,149 | 421 | 45,477 | 4,569 |
| Shares redeemed | (82,087) | (29,867) | (890,844) | (322,845) |
| Net increase (decrease) | 19,483 | 83,430 | $235,962 | $897,371 |
| Class Z6 | | | | |
| Shares sold | 1,807,217 | 7,516 | $19,960,600 | $82,200 |
| Reinvestment of distributions | 41,873 | 440 | 457,958 | 4,758 |
| Shares redeemed | (324,501) | (5,474) | (3,509,523) | (57,647) |
| Net increase (decrease) | 1,524,589 | 2,482 | $16,909,035 | $29,311 |
| Premier Class(a) | | | | |
| Shares sold | 2,690,144 | – | $30,030,288 | $– |
| Reinvestment of distributions | 68,932 | – | 753,412 | – |
| Shares redeemed | (501,159) | – | (5,439,025) | – |
| Net increase (decrease) | 2,257,917 | – | $25,344,675 | $– |
| Fidelity Freedom Blend 2005 Fund | | | | |
| Class A | | | | |
| Shares sold | 38,165 | 11,747 | $428,940 | $128,608 |
| Reinvestment of distributions | 1,554 | 646 | 17,065 | 6,978 |
| Shares redeemed | (33,224) | (7,183) | (372,472) | (77,499) |
| Net increase (decrease) | 6,495 | 5,210 | $73,533 | $58,087 |
| Class M | | | | |
| Shares sold | 10,241 | 2,161 | $115,367 | $22,948 |
| Reinvestment of distributions | 902 | 284 | 9,884 | 3,090 |
| Shares redeemed | (11,833) | – | (127,720) | – |
| Net increase (decrease) | (690) | 2,445 | $(2,469) | $26,038 |
| Class C | | | | |
| Shares sold | 3,243 | 13,733 | $35,849 | $147,756 |
| Reinvestment of distributions | 1,040 | 667 | 11,364 | 7,183 |
| Shares redeemed | (7,131) | (11,205) | (77,521) | (121,070) |
| Net increase (decrease) | (2,848) | 3,195 | $(30,308) | $33,869 |
| Fidelity Freedom Blend 2005 Fund | | | | |
| Shares sold | 24,698 | 127,898 | $275,660 | $1,391,257 |
| Reinvestment of distributions | 8,097 | 4,538 | 89,062 | 49,375 |
| Shares redeemed | (48,726) | (62,564) | (538,407) | (683,181) |
| Net increase (decrease) | (15,931) | 69,872 | $(173,685) | $757,451 |
| Class K | | | | |
| Shares sold | 4,255 | 43,370 | $46,808 | $466,117 |
| Reinvestment of distributions | 1,884 | 1,381 | 20,719 | 15,146 |
| Shares redeemed | (8,160) | (21,238) | (89,867) | (229,590) |
| Net increase (decrease) | (2,021) | 23,513 | $(22,340) | $251,673 |
| Class K6 | | | | |
| Shares sold | 516,395 | 1,007,042 | $5,672,447 | $10,781,619 |
| Reinvestment of distributions | 54,223 | 48,741 | 598,501 | 530,391 |
| Shares redeemed | (1,391,954) | (540,452) | (15,541,992) | (5,869,921) |
| Net increase (decrease) | (821,336) | 515,331 | $(9,271,044) | $5,442,089 |
| Class I | | | | |
| Shares sold | 51,260 | 36,211 | $579,108 | $392,567 |
| Reinvestment of distributions | 3,704 | 2,495 | 40,600 | 27,076 |
| Shares redeemed | (75,088) | (31,471) | (815,935) | (338,148) |
| Net increase (decrease) | (20,124) | 7,235 | $(196,227) | $81,495 |
| Class Z | | | | |
| Shares sold | – | 20,032 | $– | $216,014 |
| Reinvestment of distributions | 511 | 316 | 5,631 | 3,424 |
| Shares redeemed | (2,510) | (14,131) | (26,676) | (154,976) |
| Net increase (decrease) | (1,999) | 6,217 | $(21,045) | $64,462 |
| Class Z6 | | | | |
| Shares sold | 278,609 | 108 | $3,077,787 | $1,179 |
| Reinvestment of distributions | 7,661 | 343 | 83,920 | 3,722 |
| Shares redeemed | (83,849) | (4) | (901,721) | (40) |
| Net increase (decrease) | 202,421 | 447 | $2,259,986 | $4,861 |
| Premier Class(a) | | | | |
| Shares sold | 1,032,875 | – | $11,665,240 | $– |
| Reinvestment of distributions | 31,604 | – | 345,776 | – |
| Shares redeemed | (141,036) | – | (1,578,440) | – |
| Net increase (decrease) | 923,443 | – | $10,432,576 | $– |
| Fidelity Freedom Blend 2010 Fund | | | | |
| Class A | | | | |
| Shares sold | 13,788 | 71,441 | $155,652 | $738,761 |
| Reinvestment of distributions | 3,899 | 2,486 | 43,409 | 26,980 |
| Shares redeemed | (34,885) | (10,349) | (394,234) | (111,790) |
| Net increase (decrease) | (17,198) | 63,578 | $(195,173) | $653,951 |
| Class M | | | | |
| Shares sold | 5,102 | 8,968 | $54,922 | $93,882 |
| Reinvestment of distributions | 1,710 | 984 | 19,053 | 10,695 |
| Shares redeemed | (6,527) | (2,943) | (73,358) | (32,780) |
| Net increase (decrease) | 285 | 7,009 | $617 | $71,797 |
| Class C | | | | |
| Shares sold | 7,319 | 14,178 | $83,015 | $150,459 |
| Reinvestment of distributions | 1,384 | 608 | 15,290 | 6,665 |
| Shares redeemed | (2,562) | (5,476) | (27,849) | (59,005) |
| Net increase (decrease) | 6,141 | 9,310 | $70,456 | $98,119 |
| Fidelity Freedom Blend 2010 Fund | | | | |
| Shares sold | 253,553 | 325,624 | $2,833,504 | $3,507,420 |
| Reinvestment of distributions | 27,939 | 12,315 | 310,930 | 134,742 |
| Shares redeemed | (174,895) | (164,241) | (1,938,677) | (1,818,468) |
| Net increase (decrease) | 106,597 | 173,698 | $1,205,757 | $1,823,694 |
| Class K | | | | |
| Shares sold | 254,745 | 47,839 | $2,807,763 | $532,618 |
| Reinvestment of distributions | 42,724 | 23,846 | 476,794 | 259,643 |
| Shares redeemed | (336,610) | (37,609) | (3,580,850) | (397,419) |
| Net increase (decrease) | (39,141) | 34,076 | $(296,293) | $394,842 |
| Class K6 | | | | |
| Shares sold | 1,602,133 | 1,820,261 | $18,119,622 | $19,267,788 |
| Reinvestment of distributions | 229,885 | 203,724 | 2,578,221 | 2,224,771 |
| Shares redeemed | (4,227,342) | (1,225,461) | (48,522,576) | (13,344,262) |
| Net increase (decrease) | (2,395,324) | 798,524 | $(27,824,733) | $8,148,297 |
| Class I | | | | |
| Shares sold | 135,877 | 48,941 | $1,564,053 | $512,741 |
| Reinvestment of distributions | 9,905 | 2,523 | 110,114 | 27,543 |
| Shares redeemed | (117,427) | (16,872) | (1,271,475) | (183,765) |
| Net increase (decrease) | 28,355 | 34,592 | $402,692 | $356,519 |
| Class Z | | | | |
| Shares sold | – | 11,151 | $– | $124,418 |
| Reinvestment of distributions | 621 | 390 | 6,946 | 4,254 |
| Shares redeemed | (8,966) | – | (100,546) | – |
| Net increase (decrease) | (8,345) | 11,541 | $(93,600) | $128,672 |
| Class Z6 | | | | |
| Shares sold | 524,202 | 66,542 | $5,806,859 | $724,009 |
| Reinvestment of distributions | 15,704 | 2,600 | 174,675 | 28,762 |
| Shares redeemed | (59,458) | (20,319) | (671,595) | (230,458) |
| Net increase (decrease) | 480,448 | 48,823 | $5,309,939 | $522,313 |
| Premier Class(a) | | | | |
| Shares sold | 3,611,516 | – | $41,480,655 | $– |
| Reinvestment of distributions | 135,471 | – | 1,502,411 | – |
| Shares redeemed | (650,178) | – | (7,191,166) | – |
| Net increase (decrease) | 3,096,809 | – | $35,791,900 | $– |
| Fidelity Freedom Blend 2015 Fund | | | | |
| Class A | | | | |
| Shares sold | 19,952 | 22,780 | $227,989 | $225,650 |
| Reinvestment of distributions | 4,060 | 2,247 | 45,834 | 24,467 |
| Shares redeemed | (13,084) | (6,595) | (146,463) | (72,394) |
| Net increase (decrease) | 10,928 | 18,432 | $127,360 | $177,723 |
| Class M | | | | |
| Shares sold | 31,766 | 49,411 | $365,848 | $563,497 |
| Reinvestment of distributions | 3,805 | 596 | 42,974 | 6,554 |
| Shares redeemed | (37,736) | (18) | (433,430) | (203) |
| Net increase (decrease) | (2,165) | 49,989 | $(24,608) | $569,848 |
| Class C | | | | |
| Shares sold | 26,631 | 18,999 | $303,973 | $190,458 |
| Reinvestment of distributions | 4,998 | 2,168 | 55,979 | 23,534 |
| Shares redeemed | (41,644)�� | (3,300) | (450,083) | (36,390) |
| Net increase (decrease) | (10,015) | 17,867 | $(90,131) | $177,602 |
| Fidelity Freedom Blend 2015 Fund | | | | |
| Shares sold | 754,335 | 1,030,787 | $8,639,968 | $11,403,444 |
| Reinvestment of distributions | 65,672 | 36,310 | 742,985 | 395,121 |
| Shares redeemed | (634,459) | (906,644) | (7,283,463) | (9,932,278) |
| Net increase (decrease) | 185,548 | 160,453 | $2,099,490 | $1,866,287 |
| Class K | | | | |
| Shares sold | 467,945 | 100,377 | $5,267,714 | $1,100,701 |
| Reinvestment of distributions | 39,439 | 21,979 | 446,502 | 238,094 |
| Shares redeemed | (278,294) | (313,177) | (3,082,586) | (3,288,291) |
| Net increase (decrease) | 229,090 | (190,821) | $2,631,630 | $(1,949,496) |
| Class K6 | | | | |
| Shares sold | 2,864,313 | 5,034,639 | $32,756,440 | $53,169,125 |
| Reinvestment of distributions | 795,878 | 774,488 | 9,072,606 | 8,475,902 |
| Shares redeemed | (13,907,240) | (4,695,026) | (161,913,308) | (51,315,780) |
| Net increase (decrease) | (10,247,049) | 1,114,101 | $(120,084,262) | $10,329,247 |
| Class I | | | | |
| Shares sold | 299,109 | 222,844 | $3,501,615 | $2,306,146 |
| Reinvestment of distributions | 38,618 | 18,225 | 436,484 | 197,917 |
| Shares redeemed | (341,658) | (145,309) | (3,821,195) | (1,592,292) |
| Net increase (decrease) | (3,931) | 95,760 | $116,904 | $911,771 |
| Class Z | | | | |
| Reinvestment of distributions | 771 | 443 | 8,751 | 4,851 |
| Net increase (decrease) | 771 | 443 | $8,751 | $4,851 |
| Class Z6 | | | | |
| Shares sold | 3,004,837 | 115,561 | $34,271,340 | $1,267,695 |
| Reinvestment of distributions | 108,064 | 5,640 | 1,217,602 | 62,473 |
| Shares redeemed | (495,249) | (39,083) | (5,612,189) | (429,587) |
| Net increase (decrease) | 2,617,652 | 82,118 | $29,876,753 | $900,581 |
| Premier Class(a) | | | | |
| Shares sold | 11,518,003 | – | $134,557,869 | $– |
| Reinvestment of distributions | 476,437 | – | 5,369,490 | – |
| Shares redeemed | (1,635,532) | – | (18,648,350) | – |
| Net increase (decrease) | 10,358,908 | – | $121,279,009 | $– |
| Fidelity Freedom Blend 2020 Fund | | | | |
| Class A | | | | |
| Shares sold | 336,145 | 278,275 | $3,907,341 | $3,089,264 |
| Reinvestment of distributions | 29,658 | 10,433 | 343,598 | 116,447 |
| Shares redeemed | (116,321) | (157,237) | (1,347,347) | (1,763,914) |
| Net increase (decrease) | 249,482 | 131,471 | $2,903,592 | $1,441,797 |
| Class M | | | | |
| Shares sold | 18,537 | 108,998 | $219,586 | $1,232,361 |
| Reinvestment of distributions | 8,323 | 2,328 | 96,522 | 26,115 |
| Shares redeemed | (18,281) | (16,410) | (217,273) | (186,238) |
| Net increase (decrease) | 8,579 | 94,916 | $98,835 | $1,072,238 |
| Class C | | | | |
| Shares sold | 53,193 | 59,657 | $615,300 | $634,219 |
| Reinvestment of distributions | 6,767 | 2,973 | 78,103 | 32,784 |
| Shares redeemed | (26,861) | (18,186) | (309,497) | (203,010) |
| Net increase (decrease) | 33,099 | 44,444 | $383,906 | $463,993 |
| Fidelity Freedom Blend 2020 Fund | | | | |
| Shares sold | 4,846,010 | 3,368,825 | $56,386,253 | $37,375,799 |
| Reinvestment of distributions | 243,681 | 109,072 | 2,830,996 | 1,208,398 |
| Shares redeemed | (2,442,289) | (2,660,472) | (28,333,515) | (29,435,131) |
| Net increase (decrease) | 2,647,402 | 817,425 | $30,883,734 | $9,149,066 |
| Class K | | | | |
| Shares sold | 1,033,748 | 559,013 | $11,997,159 | $6,209,161 |
| Reinvestment of distributions | 184,793 | 107,013 | 2,152,977 | 1,178,680 |
| Shares redeemed | (1,365,484) | (867,863) | (15,310,946) | (9,058,786) |
| Net increase (decrease) | (146,943) | (201,837) | $(1,160,810) | $(1,670,945) |
| Class K6 | | | | |
| Shares sold | 11,360,898 | 18,252,762 | $133,905,411 | $193,645,477 |
| Reinvestment of distributions | 2,578,061 | 2,565,952 | 30,245,071 | 28,438,532 |
| Shares redeemed | (45,467,817) | (13,293,126) | (545,628,683) | (146,192,959) |
| Net increase (decrease) | (31,528,858) | 7,525,588 | $(381,478,201) | $75,891,050 |
| Class I | | | | |
| Shares sold | 782,766 | 398,942 | $9,345,267 | $4,260,440 |
| Reinvestment of distributions | 79,307 | 33,056 | 921,176 | 366,060 |
| Shares redeemed | (762,108) | (252,106) | (8,482,293) | (2,772,460) |
| Net increase (decrease) | 99,965 | 179,892 | $1,784,150 | $1,854,040 |
| Class Z | | | | |
| Shares sold | 70,296 | – | $842,689 | $– |
| Reinvestment of distributions | 5,287 | 536 | 61,753 | 5,929 |
| Shares redeemed | (21,373) | – | (246,532) | – |
| Net increase (decrease) | 54,210 | 536 | $657,910 | $5,929 |
| Class Z6 | | | | |
| Shares sold | 5,037,752 | 201,311 | $59,147,728 | $2,247,340 |
| Reinvestment of distributions | 207,173 | 10,815 | 2,405,226 | 120,442 |
| Shares redeemed | (759,727) | (82,615) | (8,760,872) | (937,293) |
| Net increase (decrease) | 4,485,198 | 129,511 | $52,792,082 | $1,430,489 |
| Premier Class(a) | | | | |
| Shares sold | 38,635,335 | – | $465,089,238 | $– |
| Reinvestment of distributions | 1,716,681 | – | 19,930,712 | – |
| Shares redeemed | (7,061,671) | – | (82,258,577) | – |
| Net increase (decrease) | 33,290,345 | – | $402,761,373 | $– |
| Fidelity Freedom Blend 2025 Fund | | | | |
| Class A | | | | |
| Shares sold | 455,256 | 231,576 | $5,377,768 | $2,498,355 |
| Reinvestment of distributions | 34,237 | 12,116 | 404,040 | 135,485 |
| Shares redeemed | (119,925) | (110,944) | (1,435,521) | (1,200,049) |
| Net increase (decrease) | 369,568 | 132,748 | $4,346,287 | $1,433,791 |
| Class M | | | | |
| Shares sold | 95,055 | 118,505 | $1,122,180 | $1,300,045 |
| Reinvestment of distributions | 12,048 | 4,766 | 143,031 | 53,311 |
| Shares redeemed | (60,731) | (64,126) | (687,811) | (752,618) |
| Net increase (decrease) | 46,372 | 59,145 | $577,400 | $600,738 |
| Class C | | | | |
| Shares sold | 50,116 | 85,736 | $591,009 | $896,555 |
| Reinvestment of distributions | 7,916 | 3,178 | 92,899 | 35,148 |
| Shares redeemed | (12,628) | (31,717) | (149,176) | (343,248) |
| Net increase (decrease) | 45,404 | 57,197 | $534,732 | $588,455 |
| Fidelity Freedom Blend 2025 Fund | | | | |
| Shares sold | 7,152,455 | 3,086,328 | $84,189,925 | $34,224,076 |
| Reinvestment of distributions | 314,897 | 132,525 | 3,719,575 | 1,475,891 |
| Shares redeemed | (2,742,034) | (1,866,188) | (32,304,006) | (20,480,296) |
| Net increase (decrease) | 4,725,318 | 1,352,665 | $55,605,494 | $15,219,671 |
| Class K | | | | |
| Shares sold | 2,040,200 | 815,369 | $24,153,642 | $9,135,853 |
| Reinvestment of distributions | 228,853 | 119,983 | 2,711,347 | 1,328,142 |
| Shares redeemed | (1,712,303) | (852,815) | (19,415,129) | (8,946,163) |
| Net increase (decrease) | 556,750 | 82,537 | $7,449,860 | $1,517,832 |
| Class K6 | | | | |
| Shares sold | 24,996,139 | 30,668,060 | $299,281,410 | $324,651,985 |
| Reinvestment of distributions | 4,074,718 | 3,662,079 | 48,534,981 | 40,753,860 |
| Shares redeemed | (66,157,169) | (13,008,845) | (806,217,945) | (142,611,587) |
| Net increase (decrease) | (37,086,312) | 21,321,294 | $(458,401,554) | $222,794,258 |
| Class I | | | | |
| Shares sold | 1,204,090 | 1,899,911 | $14,346,238 | $19,110,228 |
| Reinvestment of distributions | 168,161 | 87,154 | 1,989,221 | 959,802 |
| Shares redeemed | (1,081,025) | (742,591) | (12,346,462) | (8,182,270) |
| Net increase (decrease) | 291,226 | 1,244,474 | $3,988,997 | $11,887,760 |
| Class Z | | | | |
| Shares sold | 276,655 | – | $3,350,254 | $– |
| Reinvestment of distributions | 17,520 | 474 | 207,866 | 5,255 |
| Shares redeemed | (104,733) | – | (1,160,450) | – |
| Net increase (decrease) | 189,442 | 474 | $2,397,670 | $5,255 |
| Class Z6 | | | | |
| Shares sold | 11,794,618 | 419,482 | $140,946,329 | $4,789,505 |
| Reinvestment of distributions | 489,031 | 24,446 | 5,778,085 | 272,725 |
| Shares redeemed | (1,716,005) | (108,195) | (20,179,032) | (1,166,354) |
| Net increase (decrease) | 10,567,644 | 335,733 | $126,545,382 | $3,895,876 |
| Premier Class(a) | | | | |
| Shares sold | 58,538,987 | – | $714,749,395 | $– |
| Reinvestment of distributions | 2,678,196 | – | 31,656,303 | – |
| Shares redeemed | (6,032,894) | – | (71,220,974) | – |
| Net increase (decrease) | 55,184,289 | – | $675,184,724 | $– |
| Fidelity Freedom Blend 2030 Fund | | | | |
| Class A | | | | |
| Shares sold | 539,436 | 454,122 | $6,445,962 | $5,029,304 |
| Reinvestment of distributions | 49,336 | 15,071 | 586,739 | 168,878 |
| Shares redeemed | (175,748) | (160,781) | (2,061,120) | (1,753,468) |
| Net increase (decrease) | 413,024 | 308,412 | $4,971,581 | $3,444,714 |
| Class M | | | | |
| Shares sold | 93,264 | 92,691 | $1,135,100 | $1,033,270 |
| Reinvestment of distributions | 15,899 | 6,125 | 189,177 | 68,058 |
| Shares redeemed | (59,755) | (13,698) | (693,001) | (153,729) |
| Net increase (decrease) | 49,408 | 85,118 | $631,276 | $947,599 |
| Class C | | | | |
| Shares sold | 55,614 | 224,077 | $660,587 | $2,292,531 |
| Reinvestment of distributions | 16,668 | 9,238 | 197,106 | 101,064 |
| Shares redeemed | (35,155) | (88,801) | (417,415) | (936,801) |
| Net increase (decrease) | 37,127 | 144,514 | $440,278 | $1,456,794 |
| Fidelity Freedom Blend 2030 Fund | | | | |
| Shares sold | 6,707,920 | 1,448,652 | $80,502,523 | $15,812,844 |
| Reinvestment of distributions | 309,675 | 108,204 | 3,691,501 | 1,198,805 |
| Shares redeemed | (1,547,851) | (854,989) | (18,253,263) | (9,039,662) |
| Net increase (decrease) | 5,469,744 | 701,867 | $65,940,761 | $7,971,987 |
| Class K | | | | |
| Shares sold | 2,450,817 | 696,511 | $29,315,330 | $7,684,693 |
| Reinvestment of distributions | 240,369 | 118,617 | 2,873,814 | 1,307,651 |
| Shares redeemed | (994,320) | (590,584) | (11,579,264) | (6,065,281) |
| Net increase (decrease) | 1,696,866 | 224,544 | $20,609,880 | $2,927,063 |
| Class K6 | | | | |
| Shares sold | 25,620,708 | 30,060,192 | $309,454,433 | $315,433,952 |
| Reinvestment of distributions | 4,400,462 | 3,995,352 | 52,904,449 | 44,309,572 |
| Shares redeemed | (69,193,187) | (9,722,328) | (852,332,956) | (105,348,399) |
| Net increase (decrease) | (39,172,017) | 24,333,216 | $(489,974,074) | $254,395,125 |
| Class I | | | | |
| Shares sold | 1,864,211 | 1,662,604 | $22,558,570 | $17,087,189 |
| Reinvestment of distributions | 238,771 | 103,115 | 2,849,745 | 1,140,293 |
| Shares redeemed | (1,400,971) | (340,830) | (16,065,342) | (3,646,619) |
| Net increase (decrease) | 702,011 | 1,424,889 | $9,342,973 | $14,580,863 |
| Class Z | | | | |
| Shares sold | 432,452 | 7,726 | $5,277,510 | $83,970 |
| Reinvestment of distributions | 30,676 | 898 | 367,357 | 9,907 |
| Shares redeemed | (31,790) | – | (379,603) | – |
| Net increase (decrease) | 431,338 | 8,624 | $5,265,264 | $93,877 |
| Class Z6 | | | | |
| Shares sold | 9,462,006 | 317,050 | $113,610,084 | $3,538,839 |
| Reinvestment of distributions | 381,876 | 25,180 | 4,557,776 | 279,395 |
| Shares redeemed | (995,161) | (222,013) | (11,796,425) | (2,387,003) |
| Net increase (decrease) | 8,848,721 | 120,217 | $106,371,435 | $1,431,231 |
| Premier Class(a) | | | | |
| Shares sold | 64,266,025 | – | $793,161,595 | $– |
| Reinvestment of distributions | 3,194,665 | – | 38,112,383 | – |
| Shares redeemed | (3,605,184) | – | (43,066,839) | – |
| Net increase (decrease) | 63,855,506 | – | $788,207,139 | $– |
| Fidelity Freedom Blend 2035 Fund | | | | |
| Class A | | | | |
| Shares sold | 370,791 | 98,148 | $4,590,370 | $1,034,436 |
| Reinvestment of distributions | 29,171 | 7,267 | 357,375 | 81,391 |
| Shares redeemed | (31,682) | (25,410) | (386,370) | (278,150) |
| Net increase (decrease) | 368,280 | 80,005 | $4,561,375 | $837,677 |
| Class M | | | | |
| Shares sold | 112,257 | 76,987 | $1,376,608 | $846,594 |
| Reinvestment of distributions | 6,733 | 3,816 | 82,367 | 43,152 |
| Shares redeemed | (24,837) | (41,352) | (300,028) | (494,143) |
| Net increase (decrease) | 94,153 | 39,451 | $1,158,947 | $395,603 |
| Class C | | | | |
| Shares sold | 69,278 | 95,363 | $850,163 | $1,008,030 |
| Reinvestment of distributions | 10,854 | 3,766 | 131,999 | 42,230 |
| Shares redeemed | (20,767) | (17,733) | (251,653) | (199,046) |
| Net increase (decrease) | 59,365 | 81,396 | $730,509 | $851,214 |
| Fidelity Freedom Blend 2035 Fund | | | | |
| Shares sold | 7,416,876 | 1,748,448 | $90,998,803 | $19,510,483 |
| Reinvestment of distributions | 366,944 | 124,374 | 4,505,467 | 1,387,247 |
| Shares redeemed | (1,333,594) | (484,145) | (16,099,525) | (5,409,394) |
| Net increase (decrease) | 6,450,226 | 1,388,677 | $79,404,745 | $15,488,336 |
| Class K | | | | |
| Shares sold | 2,030,920 | 618,688 | $25,019,545 | $6,924,881 |
| Reinvestment of distributions | 223,281 | 93,889 | 2,748,378 | 1,034,516 |
| Shares redeemed | (1,164,314) | (553,741) | (13,585,040) | (5,424,055) |
| Net increase (decrease) | 1,089,887 | 158,836 | $14,182,883 | $2,535,342 |
| Class K6 | | | | |
| Shares sold | 23,342,154 | 26,242,237 | $289,789,543 | $276,687,978 |
| Reinvestment of distributions | 4,313,106 | 4,016,752 | 53,430,689 | 44,547,977 |
| Shares redeemed | (66,982,963) | (9,529,375) | (850,173,541) | (102,470,993) |
| Net increase (decrease) | (39,327,703) | 20,729,614 | $(506,953,309) | $218,764,962 |
| Class I | | | | |
| Shares sold | 1,283,900 | 900,947 | $16,025,782 | $8,938,182 |
| Reinvestment of distributions | 165,740 | 60,506 | 2,036,854 | 666,837 |
| Shares redeemed | (745,148) | (218,831) | (8,585,500) | (2,202,323) |
| Net increase (decrease) | 704,492 | 742,622 | $9,477,136 | $7,402,696 |
| Class Z | | | | |
| Shares sold | 122,110 | 302 | $1,535,601 | $3,649 |
| Reinvestment of distributions | 9,426 | 1,383 | 116,232 | 15,254 |
| Shares redeemed | (50,207) | – | (618,373) | – |
| Net increase (decrease) | 81,329 | 1,685 | $1,033,460 | $18,903 |
| Class Z6 | | | | |
| Shares sold | 10,729,886 | 261,889 | $133,013,906 | $2,949,996 |
| Reinvestment of distributions | 488,500 | 19,414 | 6,005,398 | 217,287 |
| Shares redeemed | (1,115,397) | (60,687) | (13,674,692) | (665,901) |
| Net increase (decrease) | 10,102,989 | 220,616 | $125,344,612 | $2,501,382 |
| Premier Class(a) | | | | |
| Shares sold | 64,365,727 | – | $818,621,685 | $– |
| Reinvestment of distributions | 3,596,405 | – | 44,235,811 | – |
| Shares redeemed | (2,761,230) | – | (33,991,636) | – |
| Net increase (decrease) | 65,200,902 | – | $828,865,860 | $– |
| Fidelity Freedom Blend 2040 Fund | | | | |
| Class A | | | | |
| Shares sold | 293,262 | 157,894 | $3,682,503 | $1,701,727 |
| Reinvestment of distributions | 32,825 | 7,982 | 409,884 | 90,051 |
| Shares redeemed | (49,051) | (17,480) | (600,196) | (201,508) |
| Net increase (decrease) | 277,036 | 148,396 | $3,492,191 | $1,590,270 |
| Class M | | | | |
| Shares sold | 55,113 | 32,527 | $685,630 | $350,440 |
| Reinvestment of distributions | 6,107 | 2,672 | 76,330 | 29,927 |
| Shares redeemed | (12,125) | (3,898) | (155,366) | (47,397) |
| Net increase (decrease) | 49,095 | 31,301 | $606,594 | $332,970 |
| Class C | | | | |
| Shares sold | 77,880 | 90,582 | $941,868 | $925,575 |
| Reinvestment of distributions | 10,891 | 4,449 | 134,945 | 49,879 |
| Shares redeemed | (16,298) | (18,837) | (199,794) | (200,778) |
| Net increase (decrease) | 72,473 | 76,194 | $877,019 | $774,676 |
| Fidelity Freedom Blend 2040 Fund | | | | |
| Shares sold | 8,262,300 | 1,148,892 | $103,132,010 | $12,693,716 |
| Reinvestment of distributions | 384,455 | 113,489 | 4,812,837 | 1,264,619 |
| Shares redeemed | (1,331,905) | (365,267) | (16,295,166) | (3,872,465) |
| Net increase (decrease) | 7,314,850 | 897,114 | $91,649,681 | $10,085,870 |
| Class K | | | | |
| Shares sold | 1,542,523 | 516,228 | $19,432,806 | $5,763,100 |
| Reinvestment of distributions | 186,724 | 80,647 | 2,345,285 | 883,718 |
| Shares redeemed | (964,563) | (849,962) | (11,487,604) | (8,414,711) |
| Net increase (decrease) | 764,684 | (253,087) | $10,290,487 | $(1,767,893) |
| Class K6 | | | | |
| Shares sold | 20,148,630 | 22,099,060 | $254,929,815 | $234,086,978 |
| Reinvestment of distributions | 4,098,496 | 3,646,821 | 51,811,849 | 40,625,180 |
| Shares redeemed | (59,800,552) | (8,197,139) | (776,122,846) | (87,746,957) |
| Net increase (decrease) | (35,553,426) | 17,548,742 | $(469,381,182) | $186,965,201 |
| Class I | | | | |
| Shares sold | 966,897 | 532,526 | $12,194,312 | $5,379,555 |
| Reinvestment of distributions | 124,016 | 43,104 | 1,554,389 | 480,886 |
| Shares redeemed | (364,040) | (106,183) | (4,383,936) | (1,114,128) |
| Net increase (decrease) | 726,873 | 469,447 | $9,364,765 | $4,746,313 |
| Class Z | | | | |
| Shares sold | 308,671 | – | $3,958,175 | $– |
| Reinvestment of distributions | 24,450 | 557 | 307,930 | 6,183 |
| Shares redeemed | (35,602) | – | (469,054) | – |
| Net increase (decrease) | 297,519 | 557 | $3,797,051 | $6,183 |
| Class Z6 | | | | |
| Shares sold | 7,163,744 | 164,379 | $90,911,815 | $1,896,486 |
| Reinvestment of distributions | 338,280 | 12,029 | 4,246,529 | 134,741 |
| Shares redeemed | (587,640) | (84,821) | (7,397,919) | (910,342) |
| Net increase (decrease) | 6,914,384 | 91,587 | $87,760,425 | $1,120,885 |
| Premier Class(a) | | | | |
| Shares sold | 57,474,801 | – | $746,408,626 | $– |
| Reinvestment of distributions | 3,540,980 | – | 44,439,336 | – |
| Shares redeemed | (2,277,338) | – | (28,550,871) | – |
| Net increase (decrease) | 58,738,443 | – | $762,297,091 | $– |
| Fidelity Freedom Blend 2045 Fund | | | | |
| Class A | | | | |
| Shares sold | 193,830 | 93,659 | $2,388,013 | $1,016,138 |
| Reinvestment of distributions | 19,354 | 6,337 | 242,141 | 70,620 |
| Shares redeemed | (48,488) | (40,716) | (586,124) | (442,138) |
| Net increase (decrease) | 164,696 | 59,280 | $2,044,030 | $644,620 |
| Class M | | | | |
| Shares sold | 68,730 | 23,703 | $814,693 | $257,491 |
| Reinvestment of distributions | 12,895 | 6,560 | 161,064 | 72,607 |
| Shares redeemed | (8,406) | (19,491) | (107,108) | (198,419) |
| Net increase (decrease) | 73,219 | 10,772 | $868,649 | $131,679 |
| Class C | | | | |
| Shares sold | 108,962 | 68,867 | $1,357,431 | $716,112 |
| Reinvestment of distributions | 13,467 | 3,656 | 166,826 | 41,341 |
| Shares redeemed | (10,194) | (9,421) | (127,022) | (109,061) |
| Net increase (decrease) | 112,235 | 63,102 | $1,397,235 | $648,392 |
| Fidelity Freedom Blend 2045 Fund | | | | |
| Shares sold | 3,836,115 | 839,531 | $47,928,221 | $9,001,204 |
| Reinvestment of distributions | 233,735 | 81,575 | 2,929,450 | 909,988 |
| Shares redeemed | (549,935) | (313,385) | (6,850,210) | (3,342,716) |
| Net increase (decrease) | 3,519,915 | 607,721 | $44,007,461 | $6,568,476 |
| Class K | | | | |
| Shares sold | 1,168,763 | 627,503 | $14,774,956 | $7,060,709 |
| Reinvestment of distributions | 179,227 | 80,356 | 2,249,951 | 886,361 |
| Shares redeemed | (919,032) | (694,235) | (11,124,163) | (6,755,235) |
| Net increase (decrease) | 428,958 | 13,624 | $5,900,744 | $1,191,835 |
| Class K6 | | | | |
| Shares sold | 20,630,494 | 18,821,134 | $261,186,677 | $199,128,585 |
| Reinvestment of distributions | 3,540,784 | 3,106,858 | 44,759,022 | 34,613,340 |
| Shares redeemed | (53,433,644) | (7,078,985) | (693,523,790) | (76,328,330) |
| Net increase (decrease) | (29,262,366) | 14,849,007 | $(387,578,091) | $157,413,595 |
| Class I | | | | |
| Shares sold | 792,970 | 467,538 | $9,960,414 | $4,719,431 |
| Reinvestment of distributions | 107,334 | 38,374 | 1,345,059 | 428,586 |
| Shares redeemed | (283,596) | (71,993) | (3,319,204) | (788,578) |
| Net increase (decrease) | 616,708 | 433,919 | $7,986,269 | $4,359,439 |
| Class Z | | | | |
| Shares sold | 240,109 | 15,658 | $3,080,342 | $188,660 |
| Reinvestment of distributions | 17,851 | 604 | 224,583 | 6,722 |
| Shares redeemed | (47,383) | (657) | (596,842) | (6,840) |
| Net increase (decrease) | 210,577 | 15,605 | $2,708,083 | $188,542 |
| Class Z6 | | | | |
| Shares sold | 6,104,951 | 274,215 | $77,099,074 | $3,194,080 |
| Reinvestment of distributions | 295,644 | 10,704 | 3,705,795 | 120,631 |
| Shares redeemed | (522,107) | (75,241) | (6,513,360) | (855,454) |
| Net increase (decrease) | 5,878,488 | 209,678 | $74,291,509 | $2,459,257 |
| Premier Class(a) | | | | |
| Shares sold | 52,241,478 | – | $678,303,767 | $– |
| Reinvestment of distributions | 3,235,917 | – | 40,610,782 | – |
| Shares redeemed | (2,081,387) | – | (26,313,857) | – |
| Net increase (decrease) | 53,396,008 | – | $692,600,692 | $– |
| Fidelity Freedom Blend 2050 Fund | | | | |
| Class A | | | | |
| Shares sold | 201,509 | 113,331 | $2,507,177 | $1,241,611 |
| Reinvestment of distributions | 22,848 | 6,047 | 285,597 | 68,023 |
| Shares redeemed | (27,346) | (25,431) | (343,364) | (296,761) |
| Net increase (decrease) | 197,011 | 93,947 | $2,449,410 | $1,012,873 |
| Class M | | | | |
| Shares sold | 36,989 | 29,385 | $458,455 | $324,443 |
| Reinvestment of distributions | 5,540 | 2,172 | 69,109 | 24,168 |
| Shares redeemed | (15,559) | (11,442) | (192,005) | (137,157) |
| Net increase (decrease) | 26,970 | 20,115 | $335,559 | $211,454 |
| Class C | | | | |
| Shares sold | 53,161 | 60,198 | $654,039 | $641,066 |
| Reinvestment of distributions | 7,960 | 3,135 | 98,454 | 34,540 |
| Shares redeemed | (7,722) | (37,377) | (97,279) | (405,588) |
| Net increase (decrease) | 53,399 | 25,956 | $655,214 | $270,018 |
| Fidelity Freedom Blend 2050 Fund | | | | |
| Shares sold | 3,433,619 | 1,412,929 | $42,533,161 | $15,547,970 |
| Reinvestment of distributions | 251,632 | 85,755 | 3,148,560 | 961,305 |
| Shares redeemed | (676,126) | (410,757) | (8,471,868) | (4,549,086) |
| Net increase (decrease) | 3,009,125 | 1,087,927 | $37,209,853 | $11,960,189 |
| Class K | | | | |
| Shares sold | 894,405 | 394,842 | $11,268,353 | $4,382,580 |
| Reinvestment of distributions | 106,142 | 44,356 | 1,330,121 | 486,658 |
| Shares redeemed | (577,942) | (531,894) | (7,061,457) | (5,174,594) |
| Net increase (decrease) | 422,605 | (92,696) | $5,537,017 | $(305,356) |
| Class K6 | | | | |
| Shares sold | 18,632,564 | 17,154,415 | $235,722,331 | $179,714,856 |
| Reinvestment of distributions | 3,125,106 | 2,470,851 | 39,393,616 | 27,519,027 |
| Shares redeemed | (41,579,061) | (5,741,358) | (538,454,634) | (61,039,314) |
| Net increase (decrease) | (19,821,391) | 13,883,908 | $(263,338,687) | $146,194,569 |
| Class I | | | | |
| Shares sold | 842,519 | 250,536 | $10,524,407 | $2,644,872 |
| Reinvestment of distributions | 86,637 | 26,352 | 1,084,022 | 294,662 |
| Shares redeemed | (185,597) | (76,080) | (2,260,384) | (834,701) |
| Net increase (decrease) | 743,559 | 200,808 | $9,348,045 | $2,104,833 |
| Class Z | | | | |
| Shares sold | 190,964 | – | $2,445,973 | $– |
| Reinvestment of distributions | 14,285 | 542 | 179,580 | 6,016 |
| Shares redeemed | (33,358) | – | (429,829) | – |
| Net increase (decrease) | 171,891 | 542 | $2,195,724 | $6,016 |
| Class Z6 | | | | |
| Shares sold | 4,680,585 | 159,741 | $58,837,220 | $1,805,963 |
| Reinvestment of distributions | 220,942 | 15,508 | 2,767,644 | 173,331 |
| Shares redeemed | (445,498) | (46,920) | (5,462,053) | (500,702) |
| Net increase (decrease) | 4,456,029 | 128,329 | $56,142,811 | $1,478,592 |
| Premier Class(a) | | | | |
| Shares sold | 40,694,821 | – | $526,813,301 | $– |
| Reinvestment of distributions | 2,494,311 | – | 31,228,798 | – |
| Shares redeemed | (1,796,008) | – | (22,511,998) | – |
| Net increase (decrease) | 41,393,124 | – | $535,530,101 | $– |
| Fidelity Freedom Blend 2055 Fund | | | | |
| Class A | | | | |
| Shares sold | 144,481 | 71,346 | $1,829,584 | $763,966 |
| Reinvestment of distributions | 12,751 | 4,242 | 160,223 | 48,262 |
| Shares redeemed | (50,797) | (17,605) | (657,488) | (208,935) |
| Net increase (decrease) | 106,435 | 57,983 | $1,332,319 | $603,293 |
| Class M | | | | |
| Shares sold | 35,948 | 28,746 | $450,317 | $305,499 |
| Reinvestment of distributions | 4,988 | 2,037 | 62,566 | 23,005 |
| Shares redeemed | (25,190) | (6,153) | (312,499) | (66,407) |
| Net increase (decrease) | 15,746 | 24,630 | $200,384 | $262,097 |
| Class C | | | | |
| Shares sold | 28,757 | 19,514 | $357,370 | $214,067 |
| Reinvestment of distributions | 3,167 | 1,100 | 39,444 | 12,301 |
| Shares redeemed | (9,454) | (7,188) | (117,930) | (84,097) |
| Net increase (decrease) | 22,470 | 13,426 | $278,884 | $142,271 |
| Fidelity Freedom Blend 2055 Fund | | | | |
| Shares sold | 2,266,284 | 566,903 | $28,284,688 | $6,100,481 |
| Reinvestment of distributions | 135,969 | 42,059 | 1,712,890 | 475,150 |
| Shares redeemed | (272,282) | (122,667) | (3,375,045) | (1,317,151) |
| Net increase (decrease) | 2,129,971 | 486,295 | $26,622,533 | $5,258,480 |
| Class K | | | | |
| Shares sold | 525,518 | 290,643 | $6,663,410 | $3,192,388 |
| Reinvestment of distributions | 62,776 | 26,567 | 792,143 | 296,213 |
| Shares redeemed | (399,741) | (314,831) | (4,916,323) | (3,126,380) |
| Net increase (decrease) | 188,553 | 2,379 | $2,539,230 | $362,221 |
| Class K6 | | | | |
| Shares sold | 13,051,819 | 11,345,541 | $165,704,017 | $118,727,537 |
| Reinvestment of distributions | 1,910,073 | 1,219,504 | 24,208,036 | 13,744,285 |
| Shares redeemed | (19,855,419) | (3,546,758) | (258,092,863) | (38,257,443) |
| Net increase (decrease) | (4,893,527) | 9,018,287 | $(68,180,810) | $94,214,379 |
| Class I | | | | |
| Shares sold | 813,092 | 163,754 | $10,192,295 | $1,746,568 |
| Reinvestment of distributions | 60,748 | 13,854 | 765,068 | 156,276 |
| Shares redeemed | (149,797) | (76,850) | (1,807,704) | (858,570) |
| Net increase (decrease) | 724,043 | 100,758 | $9,149,659 | $1,044,274 |
| Class Z | | | | |
| Shares sold | 137,509 | 6,400 | $1,772,954 | $77,500 |
| Reinvestment of distributions | 10,438 | 510 | 132,003 | 5,718 |
| Shares redeemed | (25,560) | – | (332,089) | – |
| Net increase (decrease) | 122,387 | 6,910 | $1,572,868 | $83,218 |
| Class Z6 | | | | |
| Shares sold | 2,892,398 | 182,076 | $36,582,149 | $2,109,248 |
| Reinvestment of distributions | 138,939 | 7,124 | 1,750,158 | 81,141 |
| Shares redeemed | (226,091) | (23,921) | (2,820,895) | (267,644) |
| Net increase (decrease) | 2,805,246 | 165,279 | $35,511,412 | $1,922,745 |
| Premier Class(a) | | | | |
| Shares sold | 19,132,125 | – | $248,681,311 | $– |
| Reinvestment of distributions | 1,130,256 | – | 14,241,252 | – |
| Shares redeemed | (846,969) | – | (10,715,711) | – |
| Net increase (decrease) | 19,415,412 | – | $252,206,852 | $– |
| Fidelity Freedom Blend 2060 Fund | | | | |
| Class A | | | | |
| Shares sold | 88,283 | 65,312 | $1,128,354 | $714,708 |
| Reinvestment of distributions | 10,491 | 3,398 | 133,173 | 38,825 |
| Shares redeemed | (25,108) | (30,838) | (317,896) | (348,582) |
| Net increase (decrease) | 73,666 | 37,872 | $943,631 | $404,951 |
| Class M | | | | |
| Shares sold | 26,275 | 15,597 | $332,568 | $169,875 |
| Reinvestment of distributions | 3,119 | 1,174 | 39,479 | 13,370 |
| Shares redeemed | (12,939) | (4,222) | (163,661) | (45,371) |
| Net increase (decrease) | 16,455 | 12,549 | $208,386 | $137,874 |
| Class C | | | | |
| Shares sold | 24,391 | 17,098 | $306,351 | $181,359 |
| Reinvestment of distributions | 3,385 | 1,321 | 42,557 | 14,892 |
| Shares redeemed | (12,109) | (5,899) | (153,894) | (64,817) |
| Net increase (decrease) | 15,667 | 12,520 | $195,014 | $131,434 |
| Fidelity Freedom Blend 2060 Fund | | | | |
| Shares sold | 918,701 | 257,189 | $11,676,135 | $2,815,658 |
| Reinvestment of distributions | 59,056 | 18,097 | 751,434 | 206,276 |
| Shares redeemed | (326,673) | (62,792) | (4,202,451) | (677,248) |
| Net increase (decrease) | 651,084 | 212,494 | $8,225,118 | $2,344,686 |
| Class K | | | | |
| Shares sold | 218,976 | 110,925 | $2,810,533 | $1,232,454 |
| Reinvestment of distributions | 23,028 | 7,137 | 293,216 | 81,145 |
| Shares redeemed | (155,020) | (84,982) | (1,907,776) | (844,184) |
| Net increase (decrease) | 86,984 | 33,080 | $1,195,973 | $469,415 |
| Class K6 | | | | |
| Shares sold | 7,132,179 | 5,107,278 | $91,309,402 | $54,365,056 |
| Reinvestment of distributions | 756,450 | 335,311 | 9,662,007 | 3,843,006 |
| Shares redeemed | (6,015,086) | (1,436,035) | (78,453,146) | (15,636,966) |
| Net increase (decrease) | 1,873,543 | 4,006,554 | $22,518,263 | $42,571,096 |
| Class I | | | | |
| Shares sold | 309,657 | 99,838 | $3,968,781 | $1,077,146 |
| Reinvestment of distributions | 29,645 | 6,924 | 376,888 | 78,938 |
| Shares redeemed | (71,291) | (53,196) | (897,804) | (577,268) |
| Net increase (decrease) | 268,011 | 53,566 | $3,447,865 | $578,816 |
| Class Z | | | | |
| Shares sold | 38,361 | 53 | $497,649 | $636 |
| Reinvestment of distributions | 3,051 | 463 | 38,902 | 5,263 |
| Shares redeemed | (6,753) | (53) | (85,414) | (642) |
| Net increase (decrease) | 34,659 | 463 | $451,137 | $5,257 |
| Class Z6 | | | | |
| Shares sold | 955,235 | 92,880 | $12,152,248 | $1,071,821 |
| Reinvestment of distributions | 45,270 | 3,524 | 576,640 | 40,627 |
| Shares redeemed | (100,296) | (17,629) | (1,267,327) | (199,435) |
| Net increase (decrease) | 900,209 | 78,775 | $11,461,561 | $913,013 |
| Premier Class(a) | | | | |
| Shares sold | 5,259,475 | – | $68,793,958 | $– |
| Reinvestment of distributions | 290,358 | – | 3,696,273 | – |
| Shares redeemed | (324,599) | – | (4,148,573) | – |
| Net increase (decrease) | 5,225,234 | – | $68,341,658 | $– |
| Fidelity Freedom Blend 2065 Fund | | | | |
| Class A | | | | |
| Shares sold | 49,104 | 22,167 | $641,932 | $255,173 |
| Reinvestment of distributions | 3,908 | 938 | 51,161 | 10,963 |
| Shares redeemed | (18,707) | (4,534) | (239,590) | (50,817) |
| Net increase (decrease) | 34,305 | 18,571 | $453,503 | $215,319 |
| Class M | | | | |
| Shares sold | 11,644 | 10,655 | $151,607 | $116,081 |
| Reinvestment of distributions | 1,927 | 815 | 25,230 | 9,480 |
| Shares redeemed | (14,154) | (2,799) | (178,369) | (31,353) |
| Net increase (decrease) | (583) | 8,671 | $(1,532) | $94,208 |
| Class C | | | | |
| Shares sold | 21,988 | 14,552 | $284,981 | $161,619 |
| Reinvestment of distributions | 2,038 | 691 | 26,538 | 7,987 |
| Shares redeemed | (9,653) | (6,847) | (126,013) | (77,908) |
| Net increase (decrease) | 14,373 | 8,396 | $185,506 | $91,698 |
| Fidelity Freedom Blend 2065 Fund | | | | |
| Shares sold | 213,771 | 121,370 | $2,798,767 | $1,372,770 |
| Reinvestment of distributions | 15,401 | 3,296 | 202,187 | 38,785 |
| Shares redeemed | (69,585) | (35,369) | (885,245) | (413,222) |
| Net increase (decrease) | 159,587 | 89,297 | $2,115,709 | $998,333 |
| Class K | | | | |
| Shares sold | 32,221 | 13,080 | $428,308 | $154,165 |
| Reinvestment of distributions | 2,417 | 594 | 31,781 | 6,950 |
| Shares redeemed | (22,971) | (7,259) | (296,747) | (87,502) |
| Net increase (decrease) | 11,667 | 6,415 | $163,342 | $73,613 |
| Class K6 | | | | |
| Shares sold | 1,796,449 | 731,468 | $23,348,871 | $8,304,080 |
| Reinvestment of distributions | 78,762 | 15,833 | 1,034,966 | 188,061 |
| Shares redeemed | (747,411) | (176,977) | (9,905,015) | (2,044,398) |
| Net increase (decrease) | 1,127,800 | 570,324 | $14,478,822 | $6,447,743 |
| Class I | | | | |
| Shares sold | 91,078 | 39,593 | $1,197,943 | $430,178 |
| Reinvestment of distributions | 5,050 | 743 | 66,357 | 8,712 |
| Shares redeemed | (23,444) | (34,421) | (311,803) | (336,216) |
| Net increase (decrease) | 72,684 | 5,915 | $952,497 | $102,674 |
| Class Z | | | | |
| Shares sold | 2,031 | – | $26,924 | $– |
| Reinvestment of distributions | 888 | 409 | 11,690 | 4,765 |
| Shares redeemed | (725) | – | (8,884) | – |
| Net increase (decrease) | 2,194 | 409 | $29,730 | $4,765 |
| Class Z6 | | | | |
| Shares sold | 95,815 | 8,857 | $1,260,894 | $107,657 |
| Reinvestment of distributions | 4,096 | 693 | 53,845 | 8,183 |
| Shares redeemed | (37,290) | (8) | (496,192) | (87) |
| Net increase (decrease) | 62,621 | 9,542 | $818,547 | $115,753 |
| Premier Class(a) | | | | |
| Shares sold | 575,740 | – | $7,644,012 | $– |
| Reinvestment of distributions | 22,370 | – | 293,496 | – |
| Shares redeemed | (119,751) | – | (1,548,370) | – |
| Net increase (decrease) | 478,359 | – | $6,389,138 | $– |
(a) Share transactions for Premier Class are for the period April 6, 2021 (commencement of sale of shares) through March 31, 2022.
9. Other.
A fund's organizational documents provide former and current trustees and officers with a limited indemnification against liabilities arising in connection with the performance of their duties to the fund. In the normal course of business, a fund may also enter into contracts that provide general indemnifications. A fund's maximum exposure under these arrangements is unknown as this would be dependent on future claims that may be made against a fund. The risk of material loss from such claims is considered remote.
Funds do not invest in underlying mutual funds for the purpose of exercising management or control; however, investments by funds within their principal investment strategies may represent a significant portion of the underlying mutual fund's net assets. At the end of the period, certain Funds were the owners of record of 10% or more of the total outstanding shares of the following underlying mutual funds as shown below.
| Fund | Fidelity Freedom Blend 2020 Fund | Fidelity Freedom Blend 2025 Fund | Fidelity Freedom Blend 2030 Fund | Fidelity Freedom Blend 2035 Fund | Fidelity Freedom Blend 2040 Fund | Fidelity Freedom Blend 2045 Fund | Fidelity Freedom Blend 2050 Fund |
| Fidelity Series Corporate Bond Fund | 10% | 17% | 16% | –% | –% | –% | –% |
| Fidelity Series Government Bond Index Fund | 10% | 17% | 16% | –% | –% | –% | –% |
| Fidelity Series International Index Fund | –% | –% | 11% | 13% | 14% | 12% | –% |
| Fidelity Series Investment Grade Securitized Fund | 10% | 17% | 16% | –% | –% | –% | –% |
| Fidelity Series Large Cap Growth Index Fund | –% | –% | 11% | 14% | 15% | 13% | 11% |
The Funds, in aggregate, were the owners of record of more than 20% of the total outstanding shares of the following underlying mutual funds.
| Fund | % of shares held |
| Fidelity Series Corporate Bond Fund | 61% |
| Fidelity Series Government Bond Index Fund | 61% |
| Fidelity Series International Index Fund | 83% |
| Fidelity Series Investment Grade Securitized Fund | 61% |
| Fidelity Series Large Cap Growth Index Fund | 86% |
| Fidelity Series Large Cap Value Index Fund | 21% |
10. Coronavirus (COVID-19) Pandemic.
An outbreak of COVID-19 first detected in China during December 2019 has since spread globally and was declared a pandemic by the World Health Organization during March 2020. Developments that disrupt global economies and financial markets, such as the COVID-19 pandemic, may magnify factors that affect the Funds' performance.
Report of Independent Registered Public Accounting Firm
To the Board of Trustees of Fidelity Aberdeen Street Trust and Shareholders of Fidelity Freedom Blend Income Fund, Fidelity Freedom Blend 2005 Fund, Fidelity Freedom Blend 2010 Fund, Fidelity Freedom Blend 2015 Fund, Fidelity Freedom Blend 2020 Fund , Fidelity Freedom Blend 2025 Fund, Fidelity Freedom Blend 2030 Fund, Fidelity Freedom Blend 2035 Fund, Fidelity Freedom Blend 2040 Fund, Fidelity Freedom Blend 2045 Fund, Fidelity Freedom Blend 2050 Fund, Fidelity Freedom Blend 2055 Fund, Fidelity Freedom Blend 2060 Fund and Fidelity Freedom Blend 2065 Fund
Opinions on the Financial Statements
We have audited the accompanying statements of assets and liabilities, including the schedules of investments, of Fidelity Freedom Blend Income Fund, Fidelity Freedom Blend 2005 Fund, Fidelity Freedom Blend 2010 Fund, Fidelity Freedom Blend 2015 Fund, Fidelity Freedom Blend 2020 Fund, Fidelity Freedom Blend 2025 Fund, Fidelity Freedom Blend 2030 Fund, Fidelity Freedom Blend 2035 Fund, Fidelity Freedom Blend 2040 Fund, Fidelity Freedom Blend 2045 Fund, Fidelity Freedom Blend 2050 Fund, Fidelity Freedom Blend 2055 Fund, Fidelity Freedom Blend 2060 Fund and Fidelity Freedom Blend 2065 Fund (fourteen of the funds constituting Fidelity Aberdeen Street Trust, hereafter collectively referred to as the “Funds”) as of March 31, 2022, the related statements of operations for the year ended March 31, 2022, the statements of changes in net assets for each of the two years in the period ended March 31, 2022, including the related notes, and the financial highlights for each of the periods indicated therein (collectively referred to as the “financial statements”). In our opinion, the financial statements present fairly, in all material respects, the financial position of each of the Funds as of March 31, 2022, the results of each of their operations for the year then ended, the changes in each of their net assets for each of the two years in the period ended March 31, 2022, and each of the financial highlights for each of the periods indicated therein in conformity with accounting principles generally accepted in the United States of America.
Basis for Opinions
These financial statements are the responsibility of the Funds’ management. Our responsibility is to express an opinion on the Funds’ financial statements based on our audits. We are a public accounting firm registered with the Public Company Accounting Oversight Board (United States) (PCAOB) and are required to be independent with respect to the Funds in accordance with the U.S. federal securities laws and the applicable rules and regulations of the Securities and Exchange Commission and the PCAOB.
We conducted our audits of these financial statements in accordance with the standards of the PCAOB. Those standards require that we plan and perform the audit to obtain reasonable assurance about whether the financial statements are free of material misstatement, whether due to error or fraud.
Our audits included performing procedures to assess the risks of material misstatement of the financial statements, whether due to error or fraud, and performing procedures that respond to those risks. Such procedures included examining, on a test basis, evidence regarding the amounts and disclosures in the financial statements. Our audits also included evaluating the accounting principles used and significant estimates made by management, as well as evaluating the overall presentation of the financial statements. Our procedures included confirmation of securities owned as of March 31, 2022 by correspondence with the custodian and brokers; when replies were not received from brokers, we performed other auditing procedures. We believe that our audits provide a reasonable basis for our opinions.
/s/ PricewaterhouseCoopers LLP
Boston, Massachusetts
May 10, 2022
We have served as the auditor of one or more investment companies in the Fidelity group of funds since 1932.
Trustees and Officers
The Trustees, Members of the Advisory Board (if any), and officers of the trust and funds, as applicable, are listed below. The Board of Trustees governs each fund and is responsible for protecting the interests of shareholders. The Trustees are experienced executives who meet periodically throughout the year to oversee each fund's activities, review contractual arrangements with companies that provide services to each fund, oversee management of the risks associated with such activities and contractual arrangements, and review each fund's performance. If the interests of a fund and an underlying Fidelity® fund were to diverge, a conflict of interest could arise and affect how the Trustees and Members of the Advisory Board fulfill their fiduciary duties to the affected funds. FMR has structured the funds to avoid these potential conflicts, although there may be situations where a conflict of interest is unavoidable. In such instances, FMR, the Trustees, and Members of the Advisory Board would take reasonable steps to minimize and, if possible, eliminate the conflict. Each of the Trustees oversees 292 funds.
The Trustees hold office without limit in time except that (a) any Trustee may resign; (b) any Trustee may be removed by written instrument, signed by at least two-thirds of the number of Trustees prior to such removal; (c) any Trustee who requests to be retired or who has become incapacitated by illness or injury may be retired by written instrument signed by a majority of the other Trustees; and (d) any Trustee may be removed at any special meeting of shareholders by a two-thirds vote of the outstanding voting securities of the trust. Each Trustee who is not an interested person (as defined in the 1940 Act) of the trust and the funds is referred to herein as an Independent Trustee. Each Independent Trustee shall retire not later than the last day of the calendar year in which his or her 75th birthday occurs. The Independent Trustees may waive this mandatory retirement age policy with respect to individual Trustees. Officers and Advisory Board Members hold office without limit in time, except that any officer or Advisory Board Member may resign or may be removed by a vote of a majority of the Trustees at any regular meeting or any special meeting of the Trustees. Except as indicated, each individual has held the office shown or other offices in the same company for the past five years.
Each fund's Statement of Additional Information (SAI) includes more information about the Trustees. To request a free copy, call Fidelity at 1-800-544-8544 if you’re an individual investing directly with Fidelity, call 1-800-835-5092 if you’re a plan sponsor or participant with Fidelity as your recordkeeper or call 1-877-208-0098 on institutional accounts or if you’re an advisor or invest through one.
Experience, Skills, Attributes, and Qualifications of the Trustees. The Governance and Nominating Committee has adopted a statement of policy that describes the experience, qualifications, attributes, and skills that are necessary and desirable for potential Independent Trustee candidates (Statement of Policy). The Board believes that each Trustee satisfied at the time he or she was initially elected or appointed a Trustee, and continues to satisfy, the standards contemplated by the Statement of Policy. The Governance and Nominating Committee also engages professional search firms to help identify potential Independent Trustee candidates who have the experience, qualifications, attributes, and skills consistent with the Statement of Policy. From time to time, additional criteria based on the composition and skills of the current Independent Trustees, as well as experience or skills that may be appropriate in light of future changes to board composition, business conditions, and regulatory or other developments, have also been considered by the professional search firms and the Governance and Nominating Committee. In addition, the Board takes into account the Trustees' commitment and participation in Board and committee meetings, as well as their leadership of standing and ad hoc committees throughout their tenure.
In determining that a particular Trustee was and continues to be qualified to serve as a Trustee, the Board has considered a variety of criteria, none of which, in isolation, was controlling. The Board believes that, collectively, the Trustees have balanced and diverse experience, qualifications, attributes, and skills, which allow the Board to operate effectively in governing each fund and protecting the interests of shareholders. Information about the specific experience, skills, attributes, and qualifications of each Trustee, which in each case led to the Board's conclusion that the Trustee should serve (or continue to serve) as a trustee of the funds, is provided below.
Board Structure and Oversight Function. Abigail P. Johnson is an interested person and currently serves as Chairman. The Trustees have determined that an interested Chairman is appropriate and benefits shareholders because an interested Chairman has a personal and professional stake in the quality and continuity of services provided to the funds. Independent Trustees exercise their informed business judgment to appoint an individual of their choosing to serve as Chairman, regardless of whether the Trustee happens to be independent or a member of management. The Independent Trustees have determined that they can act independently and effectively without having an Independent Trustee serve as Chairman and that a key structural component for assuring that they are in a position to do so is for the Independent Trustees to constitute a substantial majority for the Board. The Independent Trustees also regularly meet in executive session. Michael E. Kenneally serves as Chairman of the Independent Trustees and as such (i) acts as a liaison between the Independent Trustees and management with respect to matters important to the Independent Trustees and (ii) with management prepares agendas for Board meetings.
Fidelity® funds are overseen by different Boards of Trustees. The funds' Board oversees Fidelity's investment-grade bond, money market, asset allocation and certain equity funds, and other Boards oversee Fidelity's high income and other equity funds. The asset allocation funds may invest in Fidelity® funds that are overseen by such other Boards. The use of separate Boards, each with its own committee structure, allows the Trustees of each group of Fidelity® funds to focus on the unique issues of the funds they oversee, including common research, investment, and operational issues. On occasion, the separate Boards establish joint committees to address issues of overlapping consequences for the Fidelity® funds overseen by each Board.
The Trustees operate using a system of committees to facilitate the timely and efficient consideration of all matters of importance to the Trustees, each fund, and fund shareholders and to facilitate compliance with legal and regulatory requirements and oversight of the funds' activities and associated risks. The Board, acting through its committees, has charged FMR and its affiliates with (i) identifying events or circumstances the occurrence of which could have demonstrably adverse effects on the funds' business and/or reputation; (ii) implementing processes and controls to lessen the possibility that such events or circumstances occur or to mitigate the effects of such events or circumstances if they do occur; and (iii) creating and maintaining a system designed to evaluate continuously business and market conditions in order to facilitate the identification and implementation processes described in (i) and (ii) above. Because the day-to-day operations and activities of the funds are carried out by or through FMR, its affiliates, and other service providers, the funds' exposure to risks is mitigated but not eliminated by the processes overseen by the Trustees. While each of the Board's committees has responsibility for overseeing different aspects of the funds' activities, oversight is exercised primarily through the Operations and Audit Committees. In addition, an ad hoc Board committee of Independent Trustees has worked with FMR to enhance the Board's oversight of investment and financial risks, legal and regulatory risks, technology risks, and operational risks, including the development of additional risk reporting to the Board. Appropriate personnel, including but not limited to the funds' Chief Compliance Officer (CCO), FMR's internal auditor, the independent accountants, the funds' Treasurer and portfolio management personnel, make periodic reports to the Board's committees, as appropriate, including an annual review of Fidelity's risk management program for the Fidelity® funds. The responsibilities of each standing committee, including their oversight responsibilities, are described further under "Standing Committees of the Trustees."
Interested Trustees*:
Correspondence intended for a Trustee who is an interested person may be sent to Fidelity Investments, 245 Summer Street, Boston, Massachusetts 02210.
Name, Year of Birth; Principal Occupations and Other Relevant Experience+
Abigail P. Johnson (1961)
Year of Election or Appointment: 2009
Trustee
Chairman of the Board of Trustees
Ms. Johnson also serves as Trustee of other Fidelity® funds. Ms. Johnson serves as Chairman (2016-present), Chief Executive Officer (2014-present), and Director (2007-present) of FMR LLC (diversified financial services company), President of Fidelity Financial Services (2012-present) and President of Personal, Workplace and Institutional Services (2005-present). Ms. Johnson is Chairman and Director of Fidelity Management & Research Company LLC (investment adviser firm, 2011-present). Previously, Ms. Johnson served as Chairman and Director of FMR Co., Inc. (investment adviser firm, 2011-2019), Vice Chairman (2007-2016) and President (2013-2016) of FMR LLC, President and a Director of Fidelity Management & Research Company (2001-2005), a Trustee of other investment companies advised by Fidelity Management & Research Company, Fidelity Investments Money Management, Inc. (investment adviser firm), and FMR Co., Inc. (2001-2005), Senior Vice President of the Fidelity® funds (2001-2005), and managed a number of Fidelity® funds. Ms. Abigail P. Johnson and Mr. Arthur E. Johnson are not related.
Jennifer Toolin McAuliffe (1959)
Year of Election or Appointment: 2016
Trustee
Ms. McAuliffe also serves as Trustee of other Fidelity® funds and as Trustee of Fidelity Charitable (2020-present). Previously, Ms. McAuliffe served as Co-Head of Fixed Income of Fidelity Investments Limited (now known as FIL Limited (FIL)) (diversified financial services company), Director of Research for FIL’s credit and quantitative teams in London, Hong Kong and Tokyo and Director of Research for taxable and municipal bonds at Fidelity Investments Money Management, Inc. Ms. McAuliffe previously served as a member of the Advisory Board of certain Fidelity® funds (2016). Ms. McAuliffe was previously a lawyer at Ropes & Gray LLP and currently serves as director or trustee of several not-for-profit entities.
* Determined to be an “Interested Trustee” by virtue of, among other things, his or her affiliation with the trust or various entities under common control with FMR.
+ The information includes the Trustee's principal occupation during the last five years and other information relating to the experience, attributes, and skills relevant to the Trustee's qualifications to serve as a Trustee, which led to the conclusion that the Trustee should serve as a Trustee for each fund.
Independent Trustees:
Correspondence intended for an Independent Trustee may be sent to Fidelity Investments, P.O. Box 55235, Boston, Massachusetts 02205-5235.
Name, Year of Birth; Principal Occupations and Other Relevant Experience+
Elizabeth S. Acton (1951)
Year of Election or Appointment: 2013
Trustee
Ms. Acton also serves as Trustee of other Fidelity® funds. Prior to her retirement, Ms. Acton served as Executive Vice President, Finance (2011-2012), Executive Vice President, Chief Financial Officer (2002-2011) and Treasurer (2004-2005) of Comerica Incorporated (financial services). Prior to joining Comerica, Ms. Acton held a variety of positions at Ford Motor Company (1983-2002), including Vice President and Treasurer (2000-2002) and Executive Vice President and Chief Financial Officer of Ford Motor Credit Company (1998-2000). Ms. Acton currently serves as a member of the Board and Audit and Finance Committees of Beazer Homes USA, Inc. (homebuilding, 2012-present). Ms. Acton previously served as a member of the Advisory Board of certain Fidelity® funds (2013-2016).
Ann E. Dunwoody (1953)
Year of Election or Appointment: 2018
Trustee
General Dunwoody also serves as Trustee of other Fidelity® funds. General Dunwoody (United States Army, Retired) was the first woman in U.S. military history to achieve the rank of four-star general and prior to her retirement in 2012 held a variety of positions within the U.S. Army, including Commanding General, U.S. Army Material Command (2008-2012). General Dunwoody currently serves as President of First to Four LLC (leadership and mentoring services, 2012-present), a member of the Board and Nomination and Corporate Governance Committees of Kforce Inc. (professional staffing services, 2016-present) and a member of the Board of Automattic Inc. (software engineering, 2018-present). Previously, General Dunwoody served as a member of the Advisory Board and Nominating and Corporate Governance Committee of L3 Technologies, Inc. (communication, electronic, sensor and aerospace systems, 2013-2019) and a member of the Board and Audit and Sustainability and Corporate Responsibility Committees of Republic Services, Inc. (waste collection, disposal and recycling, 2013-2016). Ms. Dunwoody also serves on several boards for non-profit organizations, including as a member of the Board, Chair of the Nomination and Governance Committee and a member of the Audit Committee of Logistics Management Institute (consulting non-profit, 2012-present), a member of the Council of Trustees for the Association of the United States Army (advocacy non-profit, 2013-present), a member of the Board of Florida Institute of Technology (2015-present) and a member of the Board of ThanksUSA (military family education non-profit, 2014-present). General Dunwoody previously served as a member of the Advisory Board of certain Fidelity® funds (2018).
John Engler (1948)
Year of Election or Appointment: 2014
Trustee
Mr. Engler also serves as Trustee of other Fidelity® funds. Previously, Mr. Engler served as Governor of Michigan (1991-2003), President of the Business Roundtable (2011-2017) and interim President of Michigan State University (2018-2019). Mr. Engler currently serves as a member of the Board of Stride, Inc. (formerly K12 Inc.) (technology-based education company, 2012-present). Previously, Mr. Engler served as a member of the Board of Universal Forest Products (manufacturer and distributor of wood and wood-alternative products, 2003-2019) and Trustee of The Munder Funds (2003-2014). Mr. Engler previously served as a member of the Advisory Board of certain Fidelity® funds (2014-2016).
Robert F. Gartland (1951)
Year of Election or Appointment: 2010
Trustee
Mr. Gartland also serves as Trustee of other Fidelity® funds. Prior to his retirement, Mr. Gartland held a variety of positions at Morgan Stanley (financial services, 1979-2007), including Managing Director (1987-2007) and Chase Manhattan Bank (1975-1978). Mr. Gartland previously served as Chairman and an investor in Gartland & Mellina Group Corp. (consulting, 2009-2019), as a member of the Board of National Securities Clearing Corporation (1993-1996) and as Chairman of TradeWeb (2003-2004).
Arthur E. Johnson (1947)
Year of Election or Appointment: 2008
Trustee
Mr. Johnson also serves as Trustee of other Fidelity® funds. Prior to his retirement, Mr. Johnson served as Senior Vice President of Corporate Strategic Development of Lockheed Martin Corporation (defense contractor, 1999-2009). Mr. Johnson currently serves as a member of the Board of Booz Allen Hamilton (management consulting, 2011-present). Mr. Johnson previously served as a member of the Board of Eaton Corporation plc (diversified power management, 2009-2019) and a member of the Board of AGL Resources, Inc. (holding company, 2002-2016). Mr. Johnson previously served as Chairman (2018-2021) and Vice Chairman (2015-2018) of the Independent Trustees of certain Fidelity® funds. Mr. Arthur E. Johnson is not related to Ms. Abigail P. Johnson.
Michael E. Kenneally (1954)
Year of Election or Appointment: 2009
Trustee
Chairman of the Independent Trustees
Mr. Kenneally also serves as Trustee of other Fidelity® funds and was Vice Chairman (2018-2021) of the Independent Trustees of certain Fidelity® funds. Prior to retirement in 2005, he was Chairman and Global Chief Executive Officer of Credit Suisse Asset Management, the worldwide fund management and institutional investment business of Credit Suisse Group. Previously, Mr. Kenneally was an Executive Vice President and the Chief Investment Officer for Bank of America. In this role, he was responsible for the investment management, strategy and products delivered to the bank’s institutional, high-net-worth and retail clients. Earlier, Mr. Kenneally directed the organization’s equity and quantitative research groups. He began his career as a research analyst and then spent more than a dozen years as a portfolio manager for endowments, pension plans and mutual funds. He earned the Chartered Financial Analyst (CFA) designation in 1991.
Marie L. Knowles (1946)
Year of Election or Appointment: 2001
Trustee
Ms. Knowles also serves as Trustee of other Fidelity® funds. Prior to her retirement, Ms. Knowles held several positions at Atlantic Richfield Company (diversified energy), including Executive Vice President and Chief Financial Officer (1996-2000), Senior Vice President (1993-1996) and President of ARCO Transportation Company (pipeline and tanker operations, 1993-1996). Ms. Knowles currently serves as a member of the Board of the Santa Catalina Island Company (real estate, 2009-present), a member of the Investment Company Institute Board of Governors and a member of the Governing Council of the Independent Directors Council (2014-present). Ms. Knowles also serves as a member of the Advisory Board for the School of Engineering of the University of Southern California. Ms. Knowles previously served as a member of the Board of McKesson Corporation (healthcare service, 2002-2021). In addition, Ms. Knowles previously served as Chairman (2015-2018) and Vice Chairman (2012-2015) of the Independent Trustees of certain Fidelity® funds.
Mark A. Murray (1954)
Year of Election or Appointment: 2016
Trustee
Mr. Murray also serves as Trustee of other Fidelity® funds. Previously, Mr. Murray served as Co-Chief Executive Officer (2013-2016), President (2006-2013) and Vice Chairman (2013-2020) of Meijer, Inc. Mr. Murray serves as a member of the Board (2009-present) and Public Policy and Responsibility Committee (2009-present) and Chair of the Nuclear Review Committee (2019-present) of DTE Energy Company (diversified energy company). Mr. Murray previously served as a member of the Board of Spectrum Health (not-for-profit health system, 2015-2019) and as a member of the Board and Audit Committee and Chairman of the Nominating and Corporate Governance Committee of Universal Forest Products, Inc. (manufacturer and distributor of wood and wood-alternative products, 2004-2016). Mr. Murray also serves as a member of the Board of many community and professional organizations. Mr. Murray previously served as a member of the Advisory Board of certain Fidelity® funds (2016).
+ The information includes the Trustee's principal occupation during the last five years and other information relating to the experience, attributes, and skills relevant to the Trustee's qualifications to serve as a Trustee, which led to the conclusion that the Trustee should serve as a Trustee for each fund.
Advisory Board Members and Officers:
Correspondence intended for an officer may be sent to Fidelity Investments, 245 Summer Street, Boston, Massachusetts 02210. Officers appear below in alphabetical order.
Name, Year of Birth; Principal Occupation
Robert W. Helm (1957)
Year of Election or Appointment: 2021
Member of the Advisory Board
Mr. Helm also serves as a Member of the Advisory Board of other Fidelity® funds. Mr. Helm was formerly Deputy Chairman (2003-2020), partner (1991-2020) and an associate (1984-1991) of Dechert LLP (formerly Dechert Price & Rhoads). Mr. Helm currently serves on boards and committees of several not-for-profit organizations.
Craig S. Brown (1977)
Year of Election or Appointment: 2019
Assistant Treasurer
Mr. Brown also serves as an officer of other funds. Mr. Brown serves as Assistant Treasurer of FIMM, LLC (2021-present) and is an employee of Fidelity Investments (2013-present).
John J. Burke III (1964)
Year of Election or Appointment: 2018
Chief Financial Officer
Mr. Burke also serves as Chief Financial Officer of other funds. Mr. Burke serves as Head of Investment Operations for Fidelity Fund and Investment Operations (2018-present) and is an employee of Fidelity Investments (1998-present). Previously Mr. Burke served as head of Asset Management Investment Operations (2012-2018).
David J. Carter (1973)
Year of Election or Appointment: 2020
Assistant Secretary
Mr. Carter also serves as Assistant Secretary of other funds. Mr. Carter serves as Senior Vice President, Deputy General Counsel (2022-present) and is an employee of Fidelity Investments (2005-present).
Jonathan Davis (1968)
Year of Election or Appointment: 2010
Assistant Treasurer
Mr. Davis also serves as an officer of other funds. Mr. Davis serves as Assistant Treasurer of FIMM, LLC (2021-present), FMR Capital, Inc. (2017-present), FD Funds GP LLC (2021-present), FD Funds Holding LLC (2021-present), and FD Funds Management LLC (2021-present); and is an employee of Fidelity Investments. Previously, Mr. Davis served as Vice President and Associate General Counsel of FMR LLC (diversified financial services company, 2003-2010).
Laura M. Del Prato (1964)
Year of Election or Appointment: 2018
President and Treasurer
Ms. Del Prato also serves as an officer of other funds. Ms. Del Prato serves as Assistant Treasurer of FIMM, LLC (2021-present) and is an employee of Fidelity Investments (2017-present). Previously, Ms. Del Prato served as President and Treasurer of The North Carolina Capital Management Trust: Cash Portfolio and Term Portfolio (2018-2020). Prior to joining Fidelity Investments, Ms. Del Prato served as a Managing Director and Treasurer of the JPMorgan Mutual Funds (2014-2017). Prior to JPMorgan, Ms. Del Prato served as a partner at Cohen Fund Audit Services (accounting firm, 2012-2013) and KPMG LLP (accounting firm, 2004-2012).
Colm A. Hogan (1973)
Year of Election or Appointment: 2016
Assistant Treasurer
Mr. Hogan also serves as an officer of other funds. Mr. Hogan serves as Assistant Treasurer of FIMM, LLC (2021-present) and FMR Capital, Inc. (2017-present) and is an employee of Fidelity Investments (2005-present). Previously, Mr. Hogan served as Deputy Treasurer of certain Fidelity® funds (2016-2020) and Assistant Treasurer of certain Fidelity® funds (2016-2018).
Cynthia Lo Bessette (1969)
Year of Election or Appointment: 2019
Secretary and Chief Legal Officer (CLO)
Ms. Lo Bessette also serves as an officer of other funds. Ms. Lo Bessette serves as CLO, Secretary, and Senior Vice President of Fidelity Management & Research Company LLC (investment adviser firm, 2019-present); CLO of Fidelity Management & Research (Hong Kong) Limited, FMR Investment Management (UK) Limited, and Fidelity Management & Research (Japan) Limited (investment adviser firms, 2019-present); Secretary of FD Funds GP LLC (2021-present), FD Funds Holding LLC (2021-present), and FD Funds Management LLC (2021-present); and Assistant Secretary of FIMM, LLC (2019-present). She is a Senior Vice President and Deputy General Counsel of FMR LLC (diversified financial services company, 2019-present), and is an employee of Fidelity Investments. Previously, Ms. Lo Bessette served as CLO, Secretary, and Senior Vice President of FMR Co., Inc. (investment adviser firm, 2019); Secretary of Fidelity SelectCo, LLC and Fidelity Investments Money Management, Inc. (investment adviser firms, 2019). Prior to joining Fidelity Investments, Ms. Lo Bessette was Executive Vice President, General Counsel (2016-2019) and Senior Vice President, Deputy General Counsel (2015-2016) of OppenheimerFunds (investment management company) and Deputy Chief Legal Officer (2013-2015) of Jennison Associates LLC (investment adviser firm).
Chris Maher (1972)
Year of Election or Appointment: 2013
Assistant Treasurer
Mr. Maher also serves as an officer of other funds. Mr. Maher serves as Assistant Treasurer of FIMM, LLC (2021-present) and FMR Capital, Inc. (2017-present), and is an employee of Fidelity Investments (2008-present). Previously, Mr. Maher served as Assistant Treasurer of certain funds (2013-2020); Vice President of Asset Management Compliance (2013), Vice President of the Program Management Group of FMR (investment adviser firm, 2010-2013), and Vice President of Valuation Oversight (2008-2010).
Kenneth B. Robins (1969)
Year of Election or Appointment: 2020
Chief Compliance Officer
Mr. Robins also serves as an officer of other funds. Mr. Robins serves as Compliance Officer of Fidelity Management & Research Company LLC (investment adviser firm, 2016-present) and is an employee of Fidelity Investments (2004-present). Previously, Mr. Robins served as Compliance Officer of FMR Co., Inc. (investment adviser firm, 2016-2019), as Executive Vice President of Fidelity Investments Money Management, Inc. (investment adviser firm, 2013-2016) and served in other fund officer roles.
Brett Segaloff (1972)
Year of Election or Appointment: 2021
Anti-Money Laundering (AML) Officer
Mr. Segaloff also serves as an AML Officer of other funds and other related entities. He is Director, Anti-Money Laundering (2007-present) of FMR LLC (diversified financial services company) and is an employee of Fidelity Investments (1996-present).
Stacie M. Smith (1974)
Year of Election or Appointment: 2013
Assistant Treasurer
Ms. Smith also serves as an officer of other funds. Ms. Smith serves as Assistant Treasurer of FIMM, LLC (2021-present) and FMR Capital, Inc. (2017-present), is an employee of Fidelity Investments (2009-present), and has served in other fund officer roles. Prior to joining Fidelity Investments, Ms. Smith served as Senior Audit Manager of Ernst & Young LLP (accounting firm, 1996-2009). Previously, Ms. Smith served as Assistant Treasurer (2013-2019) and Deputy Treasurer (2013-2016) of certain Fidelity® funds.
Jim Wegmann (1979)
Year of Election or Appointment: 2021
Deputy Treasurer
Mr. Wegmann also serves as an officer of other funds. Mr. Wegmann serves as Assistant Treasurer of FIMM, LLC (2021-present) and is an employee of Fidelity Investments (2011-present). Previously, Mr. Wegmann served as Assistant Treasurer of certain Fidelity® funds (2019-2021).
Vadim Zlotnikov (1962)
Year of Election or Appointment: 2019
Vice President
Mr. Zlotnikov also serves as Vice President of other funds. Mr. Zlotnikov serves as President and Director of Fidelity Diversifying Solutions LLC (investment adviser firm, 2021-present), President and Director of FIAM LLC (investment adviser firm, 2020-present), and is an employee of Fidelity Investments (2018-present). Previously, Mr. Zlotnikov served as President and Chief Investment Officer of Global Asset Allocation (2018-2020). Prior to joining Fidelity Investments, Mr. Zlotnikov served as Co-Head of Multi-Asset Solutions, Chief Market Strategist, and CIO of Systematic Strategies with AllianceBernstein (investment adviser firm, 2002-2018).
Shareholder Expense Example
As a shareholder, you incur two types of costs: (1) transaction costs, which may include sales charges (loads) on purchase payments or redemption proceeds, as applicable and (2) ongoing costs, which generally include management fees, distribution and/or service (12b-1) fees and other Fund expenses. This Example is intended to help you understand your ongoing costs (in dollars) of investing in a fund and to compare these costs with the ongoing costs of investing in other mutual funds.
The Example is based on an investment of $1,000 invested at the beginning of the period and held for the entire period (October 1, 2021 to March 31, 2022).
Actual Expenses
The first line of the accompanying table provides information about actual account values and actual expenses. You may use the information in this line, together with the amount you invested, to estimate the expenses that you paid over the period. Simply divide your account value by $1,000.00 (for example, an $8,600 account value divided by $1,000.00 = 8.6), then multiply the result by the number in the first line for a class/Fund under the heading entitled "Expenses Paid During Period" to estimate the expenses you paid on your account during this period. If any fund is a shareholder of any underlying mutual funds or exchange-traded funds (ETFs) (the Underlying Funds), such fund indirectly bears its proportional share of the expenses of the Underlying Funds in addition to the direct expenses incurred presented in the table. These fees and expenses are not included in the annualized expense ratio used to calculate the expense estimate in the table below.
Hypothetical Example for Comparison Purposes
The second line of the accompanying table provides information about hypothetical account values and hypothetical expenses based on the actual expense ratio and an assumed rate of return of 5% per year before expenses, which is not the actual return. The hypothetical account values and expenses may not be used to estimate the actual ending account balance or expenses you paid for the period. You may use this information to compare the ongoing costs of investing in the Fund and other funds. To do so, compare this 5% hypothetical example with the 5% hypothetical examples that appear in the shareholder reports of the other funds. If any fund is a shareholder of any Underlying Funds, such fund indirectly bears its proportional share of the expenses of the Underlying Funds in addition to the direct expenses as presented in the table. These fees and expenses are not included in the annualized expense ratio used to calculate the expense estimate in the table below.
Please note that the expenses shown in the table are meant to highlight your ongoing costs only and do not reflect any transaction costs. Therefore, the second line of the table is useful in comparing ongoing costs only, and will not help you determine the relative total costs of owning different funds. In addition, if these transactional costs were included, your costs would have been higher.
| | Annualized Expense Ratio-A | Beginning
Account Value
October 1, 2021 | Ending
Account Value
March 31, 2022 | Expenses Paid
During Period-B
October 1, 2021
to March 31, 2022 |
| Fidelity Freedom Blend Income Fund | | | | |
| Class A | .71% | | | |
| Actual | | $1,000.00 | $963.00 | $3.47-C |
| Hypothetical-D | | $1,000.00 | $1,021.39 | $3.58-C |
| Class M | .96% | | | |
| Actual | | $1,000.00 | $962.30 | $4.70-C |
| Hypothetical-D | | $1,000.00 | $1,020.14 | $4.84-C |
| Class C | 1.46% | | | |
| Actual | | $1,000.00 | $959.60 | $7.13 |
| Hypothetical-D | | $1,000.00 | $1,017.65 | $7.34 |
| Fidelity Freedom Blend Income Fund | .46% | | | |
| Actual | | $1,000.00 | $964.80 | $2.25-C |
| Hypothetical-D | | $1,000.00 | $1,022.64 | $2.32-C |
| Class K | .36% | | | |
| Actual | | $1,000.00 | $965.30 | $1.76-C |
| Hypothetical-D | | $1,000.00 | $1,023.14 | $1.82-C |
| Class K6 | .26% | | | |
| Actual | | $1,000.00 | $966.00 | $1.27-C |
| Hypothetical-D | | $1,000.00 | $1,023.64 | $1.31-C |
| Class I | .46% | | | |
| Actual | | $1,000.00 | $965.00 | $2.25-C |
| Hypothetical-D | | $1,000.00 | $1,022.64 | $2.32-C |
| Class Z | .36% | | | |
| Actual | | $1,000.00 | $965.30 | $1.76-C |
| Hypothetical-D | | $1,000.00 | $1,023.14 | $1.82-C |
| Class Z6 | .26% | | | |
| Actual | | $1,000.00 | $966.00 | $1.27-C |
| Hypothetical-D | | $1,000.00 | $1,023.64 | $1.31-C |
| Premier Class | .24% | | | |
| Actual | | $1,000.00 | $966.00 | $1.18-C |
| Hypothetical-D | | $1,000.00 | $1,023.73 | $1.21-C |
| Fidelity Freedom Blend 2005 Fund | | | | |
| Class A | .71% | | | |
| Actual | | $1,000.00 | $964.00 | $3.48-C |
| Hypothetical-D | | $1,000.00 | $1,021.39 | $3.58-C |
| Class M | .96% | | | |
| Actual | | $1,000.00 | $962.90 | $4.70-C |
| Hypothetical-D | | $1,000.00 | $1,020.14 | $4.84-C |
| Class C | 1.46% | | | |
| Actual | | $1,000.00 | $960.30 | $7.14 |
| Hypothetical-D | | $1,000.00 | $1,017.65 | $7.34 |
| Fidelity Freedom Blend 2005 Fund | .46% | | | |
| Actual | | $1,000.00 | $965.30 | $2.25-C |
| Hypothetical-D | | $1,000.00 | $1,022.64 | $2.32-C |
| Class K | .36% | | | |
| Actual | | $1,000.00 | $966.20 | $1.76-C |
| Hypothetical-D | | $1,000.00 | $1,023.14 | $1.82-C |
| Class K6 | .26% | | | |
| Actual | | $1,000.00 | $966.40 | $1.27-C |
| Hypothetical-D | | $1,000.00 | $1,023.64 | $1.31-C |
| Class I | .46% | | | |
| Actual | | $1,000.00 | $965.60 | $2.25-C |
| Hypothetical-D | | $1,000.00 | $1,022.64 | $2.32-C |
| Class Z | .36% | | | |
| Actual | | $1,000.00 | $966.40 | $1.76-C |
| Hypothetical-D | | $1,000.00 | $1,023.14 | $1.82-C |
| Class Z6 | .26% | | | |
| Actual | | $1,000.00 | $966.00 | $1.27-C |
| Hypothetical-D | | $1,000.00 | $1,023.64 | $1.31-C |
| Premier Class | .24% | | | |
| Actual | | $1,000.00 | $966.30 | $1.18-C |
| Hypothetical-D | | $1,000.00 | $1,023.73 | $1.21-C |
| Fidelity Freedom Blend 2010 Fund | | | | |
| Class A | .72% | | | |
| Actual | | $1,000.00 | $964.20 | $3.53-C |
| Hypothetical-D | | $1,000.00 | $1,021.34 | $3.63-C |
| Class M | .97% | | | |
| Actual | | $1,000.00 | $963.40 | $4.75-C |
| Hypothetical-D | | $1,000.00 | $1,020.09 | $4.89-C |
| Class C | 1.47% | | | |
| Actual | | $1,000.00 | $961.30 | $7.19 |
| Hypothetical-D | | $1,000.00 | $1,017.60 | $7.39 |
| Fidelity Freedom Blend 2010 Fund | .47% | | | |
| Actual | | $1,000.00 | $966.20 | $2.30-C |
| Hypothetical-D | | $1,000.00 | $1,022.59 | $2.37-C |
| Class K | .37% | | | |
| Actual | | $1,000.00 | $966.70 | $1.81-C |
| Hypothetical-D | | $1,000.00 | $1,023.09 | $1.87-C |
| Class K6 | .27% | | | |
| Actual | | $1,000.00 | $966.60 | $1.32-C |
| Hypothetical-D | | $1,000.00 | $1,023.59 | $1.36-C |
| Class I | .47% | | | |
| Actual | | $1,000.00 | $965.10 | $2.30-C |
| Hypothetical-D | | $1,000.00 | $1,022.59 | $2.37-C |
| Class Z | .37% | | | |
| Actual | | $1,000.00 | $965.60 | $1.81-C |
| Hypothetical-D | | $1,000.00 | $1,023.09 | $1.87-C |
| Class Z6 | .27% | | | |
| Actual | | $1,000.00 | $966.20 | $1.32-C |
| Hypothetical-D | | $1,000.00 | $1,023.59 | $1.36-C |
| Premier Class | .25% | | | |
| Actual | | $1,000.00 | $966.70 | $1.23-C |
| Hypothetical-D | | $1,000.00 | $1,023.68 | $1.26-C |
| Fidelity Freedom Blend 2015 Fund | | | | |
| Class A | .73% | | | |
| Actual | | $1,000.00 | $964.70 | $3.58-C |
| Hypothetical-D | | $1,000.00 | $1,021.29 | $3.68-C |
| Class M | .98% | | | |
| Actual | | $1,000.00 | $964.50 | $4.80-C |
| Hypothetical-D | | $1,000.00 | $1,020.04 | $4.94-C |
| Class C | 1.48% | | | |
| Actual | | $1,000.00 | $961.70 | $7.24 |
| Hypothetical-D | | $1,000.00 | $1,017.55 | $7.44 |
| Fidelity Freedom Blend 2015 Fund | .48% | | | |
| Actual | | $1,000.00 | $965.80 | $2.35-C |
| Hypothetical-D | | $1,000.00 | $1,022.54 | $2.42-C |
| Class K | .38% | | | |
| Actual | | $1,000.00 | $966.90 | $1.86-C |
| Hypothetical-D | | $1,000.00 | $1,023.04 | $1.92-C |
| Class K6 | .28% | | | |
| Actual | | $1,000.00 | $967.00 | $1.37-C |
| Hypothetical-D | | $1,000.00 | $1,023.54 | $1.41-C |
| Class I | .48% | | | |
| Actual | | $1,000.00 | $966.10 | $2.35-C |
| Hypothetical-D | | $1,000.00 | $1,022.54 | $2.42-C |
| Class Z | .38% | | | |
| Actual | | $1,000.00 | $966.70 | $1.86-C |
| Hypothetical-D | | $1,000.00 | $1,023.04 | $1.92-C |
| Class Z6 | .28% | | | |
| Actual | | $1,000.00 | $967.00 | $1.37-C |
| Hypothetical-D | | $1,000.00 | $1,023.54 | $1.41-C |
| Premier Class | .25% | | | |
| Actual | | $1,000.00 | $967.60 | $1.23-C |
| Hypothetical-D | | $1,000.00 | $1,023.68 | $1.26-C |
| Fidelity Freedom Blend 2020 Fund | | | | |
| Class A | .74% | | | |
| Actual | | $1,000.00 | $965.50 | $3.63-C |
| Hypothetical-D | | $1,000.00 | $1,021.24 | $3.73-C |
| Class M | .99% | | | |
| Actual | | $1,000.00 | $965.00 | $4.85 |
| Hypothetical-D | | $1,000.00 | $1,020.00 | $4.99 |
| Class C | 1.49% | | | |
| Actual | | $1,000.00 | $961.70 | $7.29 |
| Hypothetical-D | | $1,000.00 | $1,017.50 | $7.49 |
| Fidelity Freedom Blend 2020 Fund | .49% | | | |
| Actual | | $1,000.00 | $966.50 | $2.40-C |
| Hypothetical-D | | $1,000.00 | $1,022.49 | $2.47-C |
| Class K | .39% | | | |
| Actual | | $1,000.00 | $967.70 | $1.91-C |
| Hypothetical-D | | $1,000.00 | $1,022.99 | $1.97-C |
| Class K6 | .29% | | | |
| Actual | | $1,000.00 | $967.80 | $1.42-C |
| Hypothetical-D | | $1,000.00 | $1,023.49 | $1.46-C |
| Class I | .49% | | | |
| Actual | | $1,000.00 | $967.50 | $2.40-C |
| Hypothetical-D | | $1,000.00 | $1,022.49 | $2.47-C |
| Class Z | .39% | | | |
| Actual | | $1,000.00 | $966.80 | $1.91-C |
| Hypothetical-D | | $1,000.00 | $1,022.99 | $1.97-C |
| Class Z6 | .29% | | | |
| Actual | | $1,000.00 | $968.00 | $1.42-C |
| Hypothetical-D | | $1,000.00 | $1,023.49 | $1.46-C |
| Premier Class | .26% | | | |
| Actual | | $1,000.00 | $968.50 | $1.28-C |
| Hypothetical-D | | $1,000.00 | $1,023.64 | $1.31-C |
| Fidelity Freedom Blend 2025 Fund | | | | |
| Class A | .75% | | | |
| Actual | | $1,000.00 | $966.60 | $3.68-C |
| Hypothetical- D | | $1,000.00 | $1,021.19 | $3.78-C |
| Class M | 1.00% | | | |
| Actual | | $1,000.00 | $965.60 | $4.90 |
| Hypothetical-D | | $1,000.00 | $1,019.95 | $5.04 |
| Class C | 1.50% | | | |
| Actual | | $1,000.00 | $963.10 | $7.34 |
| Hypothetical-D | | $1,000.00 | $1,017.45 | $7.54 |
| Fidelity Freedom Blend 2025 Fund | .50% | | | |
| Actual | | $1,000.00 | $967.90 | $2.45-C |
| Hypothetical-D | | $1,000.00 | $1,022.44 | $2.52-C |
| Class K | .40% | | | |
| Actual | | $1,000.00 | $968.10 | $1.96-C |
| Hypothetical-D | | $1,000.00 | $1,022.94 | $2.02-C |
| Class K6 | .30% | | | |
| Actual | | $1,000.00 | $968.50 | $1.47-C |
| Hypothetical-D | | $1,000.00 | $1,023.44 | $1.51-C |
| Class I | .50% | | | |
| Actual | | $1,000.00 | $967.40 | $2.45-C |
| Hypothetical-D | | $1,000.00 | $1,022.44 | $2.52-C |
| Class Z | .40% | | | |
| Actual | | $1,000.00 | $969.10 | $1.96-C |
| Hypothetical-D | | $1,000.00 | $1,022.94 | $2.02-C |
| Class Z6 | .30% | | | |
| Actual | | $1,000.00 | $969.10 | $1.47-C |
| Hypothetical-D | | $1,000.00 | $1,023.44 | $1.51-C |
| Premier Class | .26% | | | |
| Actual | | $1,000.00 | $969.70 | $1.28-C |
| Hypothetical-D | | $1,000.00 | $1,023.64 | $1.31-C |
| Fidelity Freedom Blend 2030 Fund | | | | |
| Class A | .77% | | | |
| Actual | | $1,000.00 | $968.00 | $3.78-C |
| Hypothetical-D | | $1,000.00 | $1,021.09 | $3.88-C |
| Class M | 1.02% | | | |
| Actual | | $1,000.00 | $966.90 | $5.00-C |
| Hypothetical-D | | $1,000.00 | $1,019.85 | $5.14-C |
| Class C | 1.52% | | | |
| Actual | | $1,000.00 | $964.20 | $7.44 |
| Hypothetical-D | | $1,000.00 | $1,017.35 | $7.64 |
| Fidelity Freedom Blend 2030 Fund | .52% | | | |
| Actual | | $1,000.00 | $969.90 | $2.55-C |
| Hypothetical-D | | $1,000.00 | $1,022.34 | $2.62-C |
| Class K | .42% | | | |
| Actual | | $1,000.00 | $970.40 | $2.06-C |
| Hypothetical-D | | $1,000.00 | $1,022.84 | $2.12-C |
| Class K6 | .32% | | | |
| Actual | | $1,000.00 | $970.60 | $1.57-C |
| Hypothetical-D | | $1,000.00 | $1,023.34 | $1.61-C |
| Class I | .52% | | | |
| Actual | | $1,000.00 | $969.80 | $2.55-C |
| Hypothetical-D | | $1,000.00 | $1,022.34 | $2.62-C |
| Class Z | .42% | | | |
| Actual | | $1,000.00 | $970.40 | $2.06-C |
| Hypothetical-D | | $1,000.00 | $1,022.84 | $2.12-C |
| Class Z6 | .32% | | | |
| Actual | | $1,000.00 | $970.00 | $1.57-C |
| Hypothetical-D | | $1,000.00 | $1,023.34 | $1.61-C |
| Premier Class | .27% | | | |
| Actual | | $1,000.00 | $971.30 | $1.33-C |
| Hypothetical-D | | $1,000.00 | $1,023.59 | $1.36-C |
| Fidelity Freedom Blend 2035 Fund | | | | |
| Class A | .78% | | | |
| Actual | | $1,000.00 | $973.20 | $3.84-C |
| Hypothetical-D | | $1,000.00 | $1,021.04 | $3.93-C |
| Class M | 1.03% | | | |
| Actual | | $1,000.00 | $972.90 | $5.07-C |
| Hypothetical-D | | $1,000.00 | $1,019.80 | $5.19-C |
| Class C | 1.53% | | | |
| Actual | | $1,000.00 | $969.70 | $7.51 |
| Hypothetical-D | | $1,000.00 | $1,017.30 | $7.70 |
| Fidelity Freedom Blend 2035 Fund | .53% | | | |
| Actual | | $1,000.00 | $974.70 | $2.61-C |
| Hypothetical-D | | $1,000.00 | $1,022.29 | $2.67-C |
| Class K | .43% | | | |
| Actual | | $1,000.00 | $975.30 | $2.12-C |
| Hypothetical-D | | $1,000.00 | $1,022.79 | $2.17-C |
| Class K6 | .33% | | | |
| Actual | | $1,000.00 | $975.80 | $1.63-C |
| Hypothetical-D | | $1,000.00 | $1,023.29 | $1.66-C |
| Class I | .53% | | | |
| Actual | | $1,000.00 | $974.60 | $2.61-C |
| Hypothetical-D | | $1,000.00 | $1,022.29 | $2.67-C |
| Class Z | .43% | | | |
| Actual | | $1,000.00 | $974.80 | $2.12-C |
| Hypothetical-D | | $1,000.00 | $1,022.79 | $2.17-C |
| Class Z6 | .33% | | | |
| Actual | | $1,000.00 | $975.50 | $1.63-C |
| Hypothetical-D | | $1,000.00 | $1,023.29 | $1.66-C |
| Premier Class | .28% | | | |
| Actual | | $1,000.00 | $975.20 | $1.38-C |
| Hypothetical-D | | $1,000.00 | $1,023.54 | $1.41-C |
| Fidelity Freedom Blend 2040 Fund | | | | |
| Class A | .79% | | | |
| Actual | | $1,000.00 | $978.40 | $3.90-C |
| Hypothetical-D | | $1,000.00 | $1,020.99 | $3.98-C |
| Class M | 1.04% | | | |
| Actual | | $1,000.00 | $977.60 | $5.13 |
| Hypothetical-D | | $1,000.00 | $1,019.75 | $5.24 |
| Class C | 1.54% | | | |
| Actual | | $1,000.00 | $974.50 | $7.58 |
| Hypothetical-D | | $1,000.00 | $1,017.25 | $7.75 |
| Fidelity Freedom Blend 2040 Fund | .54% | | | |
| Actual | | $1,000.00 | $980.10 | $2.67-C |
| Hypothetical-D | | $1,000.00 | $1,022.24 | $2.72-C |
| Class K | .44% | | | |
| Actual | | $1,000.00 | $980.40 | $2.17-C |
| Hypothetical-D | | $1,000.00 | $1,022.74 | $2.22-C |
| Class K6 | .34% | | | |
| Actual | | $1,000.00 | $980.90 | $1.68-C |
| Hypothetical-D | | $1,000.00 | $1,023.24 | $1.72-C |
| Class I | .54% | | | |
| Actual | | $1,000.00 | $979.70 | $2.67-C |
| Hypothetical-D | | $1,000.00 | $1,022.24 | $2.72-C |
| Class Z | .44% | | | |
| Actual | | $1,000.00 | $980.20 | $2.17-C |
| Hypothetical-D | | $1,000.00 | $1,022.74 | $2.22-C |
| Class Z6 | .34% | | | |
| Actual | | $1,000.00 | $980.90 | $1.68-C |
| Hypothetical-D | | $1,000.00 | $1,023.24 | $1.72-C |
| Premier Class | .29% | | | |
| Actual | | $1,000.00 | $980.40 | $1.43-C |
| Hypothetical-D | | $1,000.00 | $1,023.49 | $1.46-C |
| Fidelity Freedom Blend 2045 Fund | | | | |
| Class A | .79% | | | |
| Actual | | $1,000.00 | $978.20 | $3.90-C |
| Hypothetical-D | | $1,000.00 | $1,020.99 | $3.98-C |
| Class M | 1.04% | | | |
| Actual | | $1,000.00 | $977.30 | $5.13 |
| Hypothetical-D | | $1,000.00 | $1,019.75 | $5.24 |
| Class C | 1.54% | | | |
| Actual | | $1,000.00 | $974.70 | $7.58 |
| Hypothetical-D | | $1,000.00 | $1,017.25 | $7.75 |
| Fidelity Freedom Blend 2045 Fund | .54% | | | |
| Actual | | $1,000.00 | $979.50 | $2.67-C |
| Hypothetical-D | | $1,000.00 | $1,022.24 | $2.72-C |
| Class K | .44% | | | |
| Actual | | $1,000.00 | $980.20 | $2.17-C |
| Hypothetical-D | | $1,000.00 | $1,022.74 | $2.22-C |
| Class K6 | .34% | | | |
| Actual | | $1,000.00 | $980.80 | $1.68-C |
| Hypothetical-D | | $1,000.00 | $1,023.24 | $1.72-C |
| Class I | .54% | | | |
| Actual | | $1,000.00 | $979.60 | $2.67-C |
| Hypothetical-D | | $1,000.00 | $1,022.24 | $2.72-C |
| Class Z | .44% | | | |
| Actual | | $1,000.00 | $980.20 | $2.17-C |
| Hypothetical-D | | $1,000.00 | $1,022.74 | $2.22-C |
| Class Z6 | .34% | | | |
| Actual | | $1,000.00 | $981.40 | $1.68-C |
| Hypothetical-D | | $1,000.00 | $1,023.24 | $1.72-C |
| Premier Class | .29% | | | |
| Actual | | $1,000.00 | $981.00 | $1.43-C |
| Hypothetical-D | | $1,000.00 | $1,023.49 | $1.46-C |
| Fidelity Freedom Blend 2050 Fund | | | | |
| Class A | .79% | | | |
| Actual | | $1,000.00 | $978.50 | $3.90-C |
| Hypothetical-D | | $1,000.00 | $1,020.99 | $3.98-C |
| Class M | 1.04% | | | |
| Actual | | $1,000.00 | $977.20 | $5.13 |
| Hypothetical-D | | $1,000.00 | $1,019.75 | $5.24 |
| Class C | 1.54% | | | |
| Actual | | $1,000.00 | $975.30 | $7.58 |
| Hypothetical-D | | $1,000.00 | $1,017.25 | $7.75 |
| Fidelity Freedom Blend 2050 Fund | .54% | | | |
| Actual | | $1,000.00 | $980.40 | $2.67-C |
| Hypothetical-D | | $1,000.00 | $1,022.24 | $2.72-C |
| Class K | .44% | | | |
| Actual | | $1,000.00 | $980.80 | $2.17-C |
| Hypothetical-D | | $1,000.00 | $1,022.74 | $2.22-C |
| Class K6 | .34% | | | |
| Actual | | $1,000.00 | $980.70 | $1.68-C |
| Hypothetical-D | | $1,000.00 | $1,023.24 | $1.72-C |
| Class I | .54% | | | |
| Actual | | $1,000.00 | $979.20 | $2.66-C |
| Hypothetical-D | | $1,000.00 | $1,022.24 | $2.72-C |
| Class Z | .44% | | | |
| Actual | | $1,000.00 | $980.60 | $2.17-C |
| Hypothetical-D | | $1,000.00 | $1,022.74 | $2.22-C |
| Class Z6 | .34% | | | |
| Actual | | $1,000.00 | $980.30 | $1.68-C |
| Hypothetical-D | | $1,000.00 | $1,023.24 | $1.72-C |
| Premier Class | .29% | | | |
| Actual | | $1,000.00 | $981.50 | $1.43-C |
| Hypothetical-D | | $1,000.00 | $1,023.49 | $1.46-C |
| Fidelity Freedom Blend 2055 Fund | | | | |
| Class A | .79% | | | |
| Actual | | $1,000.00 | $978.70 | $3.90-C |
| Hypothetical-D | | $1,000.00 | $1,020.99 | $3.98-C |
| Class M | 1.04% | | | |
| Actual | | $1,000.00 | $977.40 | $5.13 |
| Hypothetical-D | | $1,000.00 | $1,019.75 | $5.24 |
| Class C | 1.54% | | | |
| Actual | | $1,000.00 | $975.50 | $7.58 |
| Hypothetical-D | | $1,000.00 | $1,017.25 | $7.75 |
| Fidelity Freedom Blend 2055 Fund | .54% | | | |
| Actual | | $1,000.00 | $980.20 | $2.67-C |
| Hypothetical-D | | $1,000.00 | $1,022.24 | $2.72-C |
| Class K | .44% | | | |
| Actual | | $1,000.00 | $980.80 | $2.17-C |
| Hypothetical-D | | $1,000.00 | $1,022.74 | $2.22-C |
| Class K6 | .34% | | | |
| Actual | | $1,000.00 | $981.40 | $1.68-C |
| Hypothetical-D | | $1,000.00 | $1,023.24 | $1.72-C |
| Class I | .54% | | | |
| Actual | | $1,000.00 | $980.40 | $2.67-C |
| Hypothetical-D | | $1,000.00 | $1,022.24 | $2.72-C |
| Class Z | .44% | | | |
| Actual | | $1,000.00 | $980.90 | $2.17-C |
| Hypothetical-D | | $1,000.00 | $1,022.74 | $2.22-C |
| Class Z6 | .34% | | | |
| Actual | | $1,000.00 | $980.60 | $1.68-C |
| Hypothetical-D | | $1,000.00 | $1,023.24 | $1.72-C |
| Premier Class | .29% | | | |
| Actual | | $1,000.00 | $980.90 | $1.43-C |
| Hypothetical-D | | $1,000.00 | $1,023.49 | $1.46-C |
| Fidelity Freedom Blend 2060 Fund | | | | |
| Class A | .79% | | | |
| Actual | | $1,000.00 | $978.60 | $3.90-C |
| Hypothetical-D | | $1,000.00 | $1,020.99 | $3.98-C |
| Class M | 1.04% | | | |
| Actual | | $1,000.00 | $978.10 | $5.13 |
| Hypothetical-D | | $1,000.00 | $1,019.75 | $5.24 |
| Class C | 1.54% | | | |
| Actual | | $1,000.00 | $975.40 | $7.58 |
| Hypothetical-D | | $1,000.00 | $1,017.25 | $7.75 |
| Fidelity Freedom Blend 2060 Fund | .54% | | | |
| Actual | | $1,000.00 | $980.00 | $2.67-C |
| Hypothetical-D | | $1,000.00 | $1,022.24 | $2.72-C |
| Class K | .44% | | | |
| Actual | | $1,000.00 | $980.50 | $2.17-C |
| Hypothetical-D | | $1,000.00 | $1,022.74 | $2.22-C |
| Class K6 | .34% | | | |
| Actual | | $1,000.00 | $980.70 | $1.68-C |
| Hypothetical-D | | $1,000.00 | $1,023.24 | $1.72-C |
| Class I | .54% | | | |
| Actual | | $1,000.00 | $979.90 | $2.67-C |
| Hypothetical-D | | $1,000.00 | $1,022.24 | $2.72-C |
| Class Z | .44% | | | |
| Actual | | $1,000.00 | $980.20 | $2.17-C |
| Hypothetical-D | | $1,000.00 | $1,022.74 | $2.22-C |
| Class Z6 | .34% | | | |
| Actual | | $1,000.00 | $980.90 | $1.68-C |
| Hypothetical-D | | $1,000.00 | $1,023.24 | $1.72-C |
| Premier Class | .29% | | | |
| Actual | | $1,000.00 | $981.30 | $1.43-C |
| Hypothetical-D | | $1,000.00 | $1,023.49 | $1.46-C |
| Fidelity Freedom Blend 2065 Fund | | | | |
| Class A | .79% | | | |
| Actual | | $1,000.00 | $979.50 | $3.90-C |
| Hypothetical-D | | $1,000.00 | $1,020.99 | $3.98-C |
| Class M | 1.04% | | | |
| Actual | | $1,000.00 | $977.60 | $5.13 |
| Hypothetical-D | | $1,000.00 | $1,019.75 | $5.24 |
| Class C | 1.54% | | | |
| Actual | | $1,000.00 | $975.20 | $7.58 |
| Hypothetical-D | | $1,000.00 | $1,017.25 | $7.75 |
| Fidelity Freedom Blend 2065 Fund | .54% | | | |
| Actual | | $1,000.00 | $980.30 | $2.67-C |
| Hypothetical-D | | $1,000.00 | $1,022.24 | $2.72-C |
| Class K | .44% | | | |
| Actual | | $1,000.00 | $980.80 | $2.17-C |
| Hypothetical-D | | $1,000.00 | $1,022.74 | $2.22-C |
| Class K6 | .34% | | | |
| Actual | | $1,000.00 | $980.50 | $1.68-C |
| Hypothetical-D | | $1,000.00 | $1,023.24 | $1.72-C |
| Class I | .54% | | | |
| Actual | | $1,000.00 | $980.30 | $2.67-C |
| Hypothetical-D | | $1,000.00 | $1,022.24 | $2.72-C |
| Class Z | .44% | | | |
| Actual | | $1,000.00 | $981.20 | $2.17-C |
| Hypothetical-D | | $1,000.00 | $1,022.74 | $2.22-C |
| Class Z6 | .34% | | | |
| Actual | | $1,000.00 | $981.50 | $1.68-C |
| Hypothetical-D | | $1,000.00 | $1,023.24 | $1.72-C |
| Premier Class | .29% | | | |
| Actual | | $1,000.00 | $981.50 | $1.43-C |
| Hypothetical-D | | $1,000.00 | $1,023.49 | $1.46-C |
A Annualized expense ratio reflects expenses net of applicable fee waivers.
B Expenses are equal to the annualized expense ratio, multiplied by the average account value over the period, multiplied by 182/ 365 (to reflect the one-half year period). The fees and expenses of any Underlying Funds are not included in each annualized expense ratio.
C If fees and changes to the expense contract and/or expense cap, effective April 1, 2022, had been in effect during the current period, the restated annualized expense ratio and the expenses paid in the actual and hypothetical examples above would be shown in the table below:
D 5% return per year before expenses
| | Annualized Expense Ratio-(a)
| Expenses Paid
|
| Fidelity Freedom Blend Income Fund | | |
| Class A | .66% | |
| Actual | | $3.23 |
| Hypothetical-(b) | | $3.33 |
| Class M | .91% | |
| Actual | | $4.45 |
| Hypothetical-(b) | | $4.58 |
| Fidelity Freedom Blend Income Fund | .41% | |
| Actual | | $2.01 |
| Hypothetical-(b) | | $2.07 |
| Class K | .31% | |
| Actual | | $1.52 |
| Hypothetical-(b) | | $1.56 |
| Class K6 | .21% | |
| Actual | | $1.03 |
| Hypothetical-(b) | | $1.06 |
| Class I | .41% | |
| Actual | | $2.01 |
| Hypothetical-(b) | | $2.07 |
| Class Z | .31% | |
| Actual | | $1.52 |
| Hypothetical-(b) | | $1.56 |
| Class Z6 | .21% | |
| Actual | | $1.03 |
| Hypothetical-(b) | | $1.06 |
| Premier Class | .19% | |
| Actual | | $.93 |
| Hypothetical-(b) | | $.96 |
| Fidelity Freedom Blend 2005 Fund | | |
| Class A | .66% | |
| Actual | | $3.23 |
| Hypothetical-(b) | | $3.33 |
| Class M | .91% | |
| Actual | | $4.45 |
| Hypothetical-(b) | | $4.58 |
| Fidelity Freedom Blend 2005 Fund | .41% | |
| Actual | | $2.01 |
| Hypothetical-(b) | | $2.07 |
| Class K | .31% | |
| Actual | | $1.52 |
| Hypothetical-(b) | | $1.56 |
| Class K6 | .21% | |
| Actual | | $1.03 |
| Hypothetical-(b) | | $1.06 |
| Class I | .41% | |
| Actual | | $2.01 |
| Hypothetical-(b) | | $2.07 |
| Class Z | .31% | |
| Actual | | $1.52 |
| Hypothetical-(b) | | $1.56 |
| Class Z6 | .21% | |
| Actual | | $1.03 |
| Hypothetical-(b) | | $1.06 |
| Premier Class | .19% | |
| Actual | | $.93 |
| Hypothetical-(b) | | $.96 |
| Fidelity Freedom Blend 2010 Fund | | |
| Class A | .66% | |
| Actual | | $3.23 |
| Hypothetical-(b) | | $3.33 |
| Class M | .91% | |
| Actual | | $4.46 |
| Hypothetical-(b) | | $4.58 |
| Fidelity Freedom Blend 2010 Fund | .41% | |
| Actual | | $2.01 |
| Hypothetical-(b) | | $2.07 |
| Class K | .31% | |
| Actual | | $1.52 |
| Hypothetical-(b) | | $1.56 |
| Class K6 | .21% | |
| Actual | | $1.03 |
| Hypothetical-(b) | | $1.06 |
| Class I | .41% | |
| Actual | | $2.01 |
| Hypothetical-(b) | | $2.07 |
| Class Z | .31% | |
| Actual | | $1.52 |
| Hypothetical-(b) | | $1.56 |
| Class Z6 | .21% | |
| Actual | | $1.03 |
| Hypothetical-(b) | | $1.06 |
| Premier Class | .19% | |
| Actual | | $.93 |
| Hypothetical-(b) | | $.96 |
| Fidelity Freedom Blend 2015 Fund | | |
| Class A | .68% | |
| Actual | | $3.33 |
| Hypothetical-(b) | | $3.43 |
| Class M | .93% | |
| Actual | | $4.56 |
| Hypothetical-(b) | | $4.68 |
| Fidelity Freedom Blend 2015 Fund | .43% | |
| Actual | | $2.11 |
| Hypothetical-(b) | | $2.17 |
| Class K | .33% | |
| Actual | | $1.62 |
| Hypothetical-(b) | | $1.66 |
| Class K6 | .23% | |
| Actual | | $1.13 |
| Hypothetical-(b) | | $1.16 |
| Class I | .43% | |
| Actual | | $2.11 |
| Hypothetical-(b) | | $2.17 |
| Class Z | .33% | |
| Actual | | $1.62 |
| Hypothetical-(b) | | $1.66 |
| Class Z6 | .23% | |
| Actual | | $1.13 |
| Hypothetical-(b) | | $1.16 |
| Premier Class | .20% | |
| Actual | | $.98 |
| Hypothetical-(b) | | $1.01 |
| Fidelity Freedom Blend 2020 Fund | | |
| Class A | .69% | |
| Actual | | $3.38 |
| Hypothetical-(b) | | $3.48 |
| Fidelity Freedom Blend 2020 Fund | .44% | |
| Actual | | $2.16 |
| Hypothetical-(b) | | $2.22 |
| Class K | .34% | |
| Actual | | $1.67 |
| Hypothetical-(b) | | $1.72 |
| Class K6 | .24% | |
| Actual | | $1.18 |
| Hypothetical-(b) | | $1.21 |
| Class I | .44% | |
| Actual | | $2.16 |
| Hypothetical-(b) | | $2.22 |
| Class Z | .34% | |
| Actual | | $1.67 |
| Hypothetical-(b) | | $1.72 |
| Class Z6 | .24% | |
| Actual | | $1.18 |
| Hypothetical-(b) | | $1.21 |
| Premier Class | .21% | |
| Actual | | $1.03 |
| Hypothetical-(b) | | $1.06 |
| Fidelity Freedom Blend 2025 Fund | | |
| Class A | .70% | |
| Actual | | $3.43 |
| Hypothetical-(b) | | $3.53 |
| Fidelity Freedom Blend 2025 Fund | .45% | |
| Actual | | $2.21 |
| Hypothetical-(b) | | $2.27 |
| Class K | .35% | |
| Actual | | $1.72 |
| Hypothetical-(b) | | $1.77 |
| Class K6 | .25% | |
| Actual | | $1.23 |
| Hypothetical-(b) | | $1.26 |
| Class I | .45% | |
| Actual | | $2.21 |
| Hypothetical-(b) | | $2.27 |
| Class Z | .35% | |
| Actual | | $1.72 |
| Hypothetical-(b) | | $1.77 |
| Class Z6 | .25% | |
| Actual | | $1.23 |
| Hypothetical-(b) | | $1.26 |
| Premier Class | .22% | |
| Actual | | $1.08 |
| Hypothetical-(b) | | $1.11 |
| Fidelity Freedom Blend 2030 Fund | | |
| Class A | .71% | |
| Actual | | $3.48 |
| Hypothetical-(b) | | $3.58 |
| Class M | .96% | |
| Actual | | $4.71 |
| Hypothetical-(b) | | $4.84 |
| Fidelity Freedom Blend 2030 Fund | .46% | |
| Actual | | $2.26 |
| Hypothetical-(b) | | $2.32 |
| Class K | .36% | |
| Actual | | $1.77 |
| Hypothetical-(b) | | $1.82 |
| Class K6 | .26% | |
| Actual | | $1.28 |
| Hypothetical-(b) | | $1.31 |
| Class I | .46% | |
| Actual | | $2.26 |
| Hypothetical-(b) | | $2.32 |
| Class Z | .36% | |
| Actual | | $1.77 |
| Hypothetical-(b) | | $1.82 |
| Class Z6 | .26% | |
| Actual | | $1.28 |
| Hypothetical-(b) | | $1.31 |
| Premier Class | .23% | |
| Actual | | $1.13 |
| Hypothetical-(b) | | $1.16 |
| Fidelity Freedom Blend 2035 Fund | | |
| Class A | .73% | |
| Actual | | $3.59 |
| Hypothetical-(b) | | $3.68 |
| Class M | .98% | |
| Actual | | $4.82 |
| Hypothetical-(b) | | $4.94 |
| Fidelity Freedom Blend 2035 Fund | .48% | |
| Actual | | $2.36 |
| Hypothetical-(b) | | $2.42 |
| Class K | .38% | |
| Actual | | $1.87 |
| Hypothetical-(b) | | $1.92 |
| Class K6 | .28% | |
| Actual | | $1.38 |
| Hypothetical-(b) | | $1.41 |
| Class I | .48% | |
| Actual | | $2.36 |
| Hypothetical-(b) | | $2.42 |
| Class Z | .38% | |
| Actual | | $1.87 |
| Hypothetical-(b) | | $1.92 |
| Class Z6 | .28% | |
| Actual | | $1.38 |
| Hypothetical-(b) | | $1.41 |
| Premier Class | .24% | |
| Actual | | $1.18 |
| Hypothetical-(b) | | $1.21 |
| Fidelity Freedom Blend 2040 Fund | | |
| Class A | .74% | |
| Actual | | $3.65 |
| Hypothetical-(b) | | $3.73 |
| Fidelity Freedom Blend 2040 Fund | .49% | |
| Actual | | $2.42 |
| Hypothetical-(b) | | $2.47 |
| Class K | .39% | |
| Actual | | $1.93 |
| Hypothetical-(b) | | $1.97 |
| Class K6 | .29% | |
| Actual | | $1.43 |
| Hypothetical-(b) | | $1.46 |
| Class I | .49% | |
| Actual | | $2.42 |
| Hypothetical-(b) | | $2.47 |
| Class Z | .39% | |
| Actual | | $1.93 |
| Hypothetical-(b) | | $1.97 |
| Class Z6 | .29% | |
| Actual | | $1.43 |
| Hypothetical-(b) | | $1.46 |
| Premier Class | .25% | |
| Actual | | $1.23 |
| Hypothetical-(b) | | $1.26 |
| Fidelity Freedom Blend 2045 Fund | | |
| Class A | .74% | |
| Actual | | $3.65 |
| Hypothetical-(b) | | $3.73 |
| Fidelity Freedom Blend 2045 Fund | .49% | |
| Actual | | $2.42 |
| Hypothetical-(b) | | $2.47 |
| Class K | .39% | |
| Actual | | $1.93 |
| Hypothetical-(b) | | $1.97 |
| Class K6 | .29% | |
| Actual | | $1.43 |
| Hypothetical-(b) | | $1.46 |
| Class I | .49% | |
| Actual | | $2.42 |
| Hypothetical-(b) | | $2.47 |
| Class Z | .39% | |
| Actual | | $1.93 |
| Hypothetical-(b) | | $1.97 |
| Class Z6 | .29% | |
| Actual | | $1.43 |
| Hypothetical-(b) | | $1.46 |
| Premier Class | .25% | |
| Actual | | $1.23 |
| Hypothetical-(b) | | $1.26 |
| Fidelity Freedom Blend 2050 Fund | | |
| Class A | .74% | |
| Actual | | $3.65 |
| Hypothetical-(b) | | $3.73 |
| Fidelity Freedom Blend 2050 Fund | .49% | |
| Actual | | $2.42 |
| Hypothetical-(b) | | $2.47 |
| Class K | .39% | |
| Actual | | $1.93 |
| Hypothetical-(b) | | $1.97 |
| Class K6 | .29% | |
| Actual | | $1.43 |
| Hypothetical-(b) | | $1.46 |
| Class I | .49% | |
| Actual | | $2.42 |
| Hypothetical-(b) | | $2.47 |
| Class Z | .39% | |
| Actual | | $1.93 |
| Hypothetical-(b) | | $1.97 |
| Class Z6 | .29% | |
| Actual | | $1.43 |
| Hypothetical-(b) | | $1.46 |
| Premier Class | .25% | |
| Actual | | $1.24 |
| Hypothetical-(b) | | $1.26 |
| Fidelity Freedom Blend 2055 Fund | | |
| Class A | .74% | |
| Actual | | $3.65 |
| Hypothetical-(b) | | $3.73 |
| Fidelity Freedom Blend 2055 Fund | .49% | |
| Actual | | $2.42 |
| Hypothetical-(b) | | $2.47 |
| Class K | .39% | |
| Actual | | $1.93 |
| Hypothetical-(b) | | $1.97 |
| Class K6 | .29% | |
| Actual | | $1.43 |
| Hypothetical-(b) | | $1.46 |
| Class I | .49% | |
| Actual | | $2.42 |
| Hypothetical-(b) | | $2.47 |
| Class Z | .39% | |
| Actual | | $1.93 |
| Hypothetical-(b) | | $1.97 |
| Class Z6 | .29% | |
| Actual | | $1.43 |
| Hypothetical-(b) | | $1.46 |
| Premier Class | .25% | |
| Actual | | $1.23 |
| Hypothetical-(b) | | $1.26 |
| Fidelity Freedom Blend 2060 Fund | | |
| Class A | .74% | |
| Actual | | $3.65 |
| Hypothetical-(b) | | $3.73 |
| Fidelity Freedom Blend 2060 Fund | .49% | |
| Actual | | $2.42 |
| Hypothetical-(b) | | $2.47 |
| Class K | .39% | |
| Actual | | $1.93 |
| Hypothetical-(b) | | $1.97 |
| Class K6 | .29% | |
| Actual | | $1.43 |
| Hypothetical-(b) | | $1.46 |
| Class I | .49% | |
| Actual | | $2.42 |
| Hypothetical-(b) | | $2.47 |
| Class Z | .39% | |
| Actual | | $1.93 |
| Hypothetical-(b) | | $1.97 |
| Class Z6 | .29% | |
| Actual | | $1.43 |
| Hypothetical-(b) | | $1.46 |
| Premier Class | .25% | |
| Actual | | $1.24 |
| Hypothetical-(b) | | $1.26 |
| Fidelity Freedom Blend 2065 Fund | | |
| Class A | .74% | |
| Actual | | $3.65 |
| Hypothetical-(b) | | $3.73 |
| Fidelity Freedom Blend 2065 Fund | .49% | |
| Actual | | $2.42 |
| Hypothetical-(b) | | $2.47 |
| Class K | .39% | |
| Actual | | $1.93 |
| Hypothetical-(b) | | $1.97 |
| Class K6 | .29% | |
| Actual | | $1.43 |
| Hypothetical-(b) | | $1.46 |
| Class I | .49% | |
| Actual | | $2.42 |
| Hypothetical-(b) | | $2.47 |
| Class Z | .39% | |
| Actual | | $1.93 |
| Hypothetical-(b) | | $1.97 |
| Class Z6 | .29% | |
| Actual | | $1.43 |
| Hypothetical-(b) | | $1.46 |
| Premier Class | .25% | |
| Actual | | $1.24 |
| Hypothetical-(b) | | $1.26 |
| | | |
(a) Annualized expense ratio reflects expenses net of applicable fee waivers.
(b) 5% return per year before expenses
Distributions (Unaudited)
The dividend and capital gains distributions for the fund(s) are available on Fidelity.com or Institutional.Fidelity.com.
The funds hereby designate as capital gain dividend the amounts noted below for the taxable year ended March 31, 2022, or, if subsequently determined to be different, the net capital gain of such year.
| Fidelity Freedom Blend Income Fund | $1,394,671 |
| Fidelity Freedom Blend 2005 Fund | $586,147 |
| Fidelity Freedom Blend 2010 Fund | $2,575,432 |
| Fidelity Freedom Blend 2015 Fund | $8,456,561 |
| Fidelity Freedom Blend 2020 Fund | $30,657,980 |
| Fidelity Freedom Blend 2025 Fund | $52,279,174 |
| Fidelity Freedom Blend 2030 Fund | $60,412,625 |
| Fidelity Freedom Blend 2035 Fund | $71,199,563 |
| Fidelity Freedom Blend 2040 Fund | $72,157,454 |
| Fidelity Freedom Blend 2045 Fund | $63,092,052 |
| Fidelity Freedom Blend 2050 Fund | $52,513,156 |
| Fidelity Freedom Blend 2055 Fund | $29,486,818 |
| Fidelity Freedom Blend 2060 Fund | $10,834,950 |
| Fidelity Freedom Blend 2065 Fund | $1,355,725 |
|
A percentage of the dividends distributed during the fiscal year for the following funds were derived from interest on U.S. Government securities which is generally exempt from state income tax
| Fidelity Freedom Blend Income Fund | 23.51% |
| Fidelity Freedom Blend 2005 Fund | 21.09% |
| Fidelity Freedom Blend 2010 Fund | 16.33% |
| Fidelity Freedom Blend 2015 Fund | 12.45% |
| Fidelity Freedom Blend 2020 Fund | 9.74% |
| Fidelity Freedom Blend 2025 Fund | 8.12% |
| Fidelity Freedom Blend 2030 Fund | 6.71% |
| Fidelity Freedom Blend 2035 Fund | 3.08% |
| Fidelity Freedom Blend 2040 Fund | 2.30% |
| Fidelity Freedom Blend 2045 Fund | 2.29% |
| Fidelity Freedom Blend 2050 Fund | 2.29% |
| Fidelity Freedom Blend 2055 Fund | 2.28% |
| Fidelity Freedom Blend 2060 Fund | 2.26% |
| Fidelity Freedom Blend 2065 Fund | 2.22% |
|
A percentage of the dividends distributed during the fiscal year for the following funds qualify for the dividends–received deduction for corporate shareholders:
| | Class A | Class M | Class C | Fidelity Freedom Blend Class | Class K | Class K6 | Class I | Premier Class
| Class Z | Class Z6 |
| Fidelity Freedom Blend Income Fund | | | | | | | | | | |
| April, 2021 | 0% | – | – | 0% | 0% | 0% | 0% | 0% | 0% | 0% |
| May, 2021 | 2% | 2% | 2% | 1% | 1% | 1% | 1% | 1% | 1% | 1% |
| June, 2021 | 9% | – | – | 9% | 4% | 3% | 3% | 3% | 4% | 2% |
| July, 2021 | – | – | – | 5% | 4% | 3% | 5% | 3% | 4% | 3% |
| August, 2021 | 14% | – | – | 5% | 3% | 5% | 5% | 2% | 3% | 3% |
| September, 2021 | 7% | – | – | 4% | 3% | 3% | 4% | 2% | 3% | 2% |
| October, 2021 | 3% | 3% | 3% | 3% | 3% | 3% | 3% | 3% | 3% | 3% |
| November, 2021 | – | – | – | 6% | 4% | 3% | 6% | 3% | 4% | 2% |
| December, 2021 | 3% | 3% | 3% | 3% | 3% | 3% | 3% | 3% | 3% | 3% |
| February, 2022 | – | – | – | 12% | 6% | 4% | 12% | 4% | 12% | 4% |
| March, 2022 | – | – | – | 12% | 6% | 4% | 12% | 4% | 6% | 4% |
| Fidelity Freedom Blend 2005 Fund | | | | | | | | | | |
| May, 2021 | 2% | 3% | – | 1% | 1% | 1% | 2% | 1% | 1% | 1% |
| December, 2021 | 4% | 4% | 5% | 4% | 4% | 4% | 4% | 3% | 4% | 3% |
| Fidelity Freedom Blend 2010 Fund | | | | | | | | | | |
| May, 2021 | 10% | – | – | 4% | 4% | 3% | 4% | 3% | 3% | 3% |
| December, 2021 | 6% | 7% | 7% | 6% | 5% | 5% | 5% | 5% | 5% | 5% |
| Fidelity Freedom Blend 2015 Fund | | | | | | | | | | |
| May, 2021 | – | 82% | – | 14% | 10% | 7% | 16% | 7% | 10% | 7% |
| December, 2021 | 7% | 8% | 9% | 7% | 7% | 7% | 7% | 6% | 7% | 7% |
| Fidelity Freedom Blend 2020 Fund | | | | | | | | | | |
| May, 2021 | 22% | – | – | 8% | 7% | 6% | 11% | 6% | 4% | 6% |
| December, 2021 | 9% | 9% | 10% | 8% | 8% | 8% | 8% | 8% | 8% | 8% |
| Fidelity Freedom Blend 2025 Fund | | | | | | | | | | |
| May, 2021 | 15% | 100% | – | 7% | 7% | 6% | 8% | 6% | 4% | 6% |
| December, 2021 | 10% | 10% | 12% | 9% | 9% | 9% | 9% | 9% | 9% | 9% |
| Fidelity Freedom Blend 2030 Fund | | | | | | | | | | |
| May, 2021 | 16% | 100% | – | 9% | 8% | 7% | 10% | 7% | 5% | 7% |
| December, 2021 | 11% | 11% | 13% | 10% | 10% | 10% | 10% | 9% | 10% | 10% |
| Fidelity Freedom Blend 2035 Fund | | | | | | | | | | |
| May, 2021 | 100% | – | – | 21% | 17% | 12% | 21% | 12% | 8% | 11% |
| December, 2021 | 12% | 13% | 15% | 12% | 12% | 12% | 12% | 11% | 12% | 12% |
| Fidelity Freedom Blend 2040 Fund | | | | | | | | | | |
| May, 2021 | 100% | – | – | 27% | 21% | 15% | 24% | 15% | 9% | 15% |
| December, 2021 | 14% | 15% | 16% | 13% | 13% | 13% | 13% | 12% | 13% | 13% |
| Fidelity Freedom Blend 2045 Fund | | | | | | | | | | |
| May, 2021 | – | – | – | 39% | 28% | 18% | 39% | 18% | 10% | 18% |
| December, 2021 | 14% | 15% | 16% | 13% | 13% | 13% | 13% | 12% | 13% | 13% |
| Fidelity Freedom Blend 2050 Fund | | | | | | | | | | |
| May, 2021 | 100% | – | – | 33% | 24% | 16% | 24% | 16% | 11% | 16% |
| December, 2021 | 14% | 15% | 16% | 13% | 13% | 13% | 13% | 13% | 13% | 13% |
| Fidelity Freedom Blend 2055 Fund | | | | | | | | | | |
| May, 2021 | – | – | – | 38% | 27% | 17% | 24% | 17% | 13% | 16% |
| December, 2021 | 14% | 15% | 16% | 13% | 13% | 13% | 13% | 13% | 13% | 13% |
| Fidelity Freedom Blend 2060 Fund | | | | | | | | | | |
| May, 2021 | – | – | – | 93% | 37% | 23% | 31% | 23% | 19% | 21% |
| December, 2021 | 14% | 15% | 16% | 13% | 13% | 13% | 13% | 13% | 13% | 13% |
| Fidelity Freedom Blend 2065 Fund | | | | | | | | | | |
| May, 2021 | – | – | – | – | 100% | 27% | 43% | 27% | 100% | 35% |
| December, 2021 | 14% | 15% | 17% | 14% | 13% | 13% | 14% | 13% | 14% | 13% |
|
A percentage of the dividends distributed during the fiscal year for the following funds may be taken into account as a dividend for purposes of the maximum rate under section 1(h)(11) of the Internal Revenue Code.
| | Class A | Class M | Class C | Fidelity Freedom Blend Class | Class K | Class K6 | Class I | Premier Class
| Class Z | Class Z6 |
| Fidelity Freedom Blend Income Fund | | | | | | | | | | |
| April, 2021 | 0% | – | – | 0% | 0% | 0% | 0% | 0% | 0% | 0% |
| May, 2021 | 7% | 7% | 7% | 4% | 4% | 3% | 4% | 3% | 3% | 3% |
| June, 2021 | 33% | – | – | 33% | 17% | 11% | 11% | 11% | 17% | 7% |
| July, 2021 | – | – | – | 20% | 14% | 10% | 20% | 10% | 14% | 10% |
| August, 2021 | 52% | – | – | 18% | 13% | 18% | 18% | 7% | 13% | 11% |
| September, 2021 | 28% | – | – | 14% | 12% | 12% | 14% | 10% | 12% | 10% |
| October, 2021 | 11% | 12% | 12% | 11% | 11% | 11% | 11% | 11% | 11% | 11% |
| November, 2021 | – | – | – | 22% | 15% | 11% | 22% | 11% | 15% | 9% |
| December, 2021 | 12% | 12% | 13% | 11% | 11% | 11% | 11% | 11% | 11% | 11% |
| February, 2022 | – | – | – | 0% | 0% | 0% | 0% | 0% | 0% | 0% |
| March, 2022 | – | – | – | 0% | 0% | 0% | 0% | 0% | 0% | 0% |
| Fidelity Freedom Blend 2005 Fund | | | | | | | | | | |
| May, 2021 | 2% | 3% | – | 2% | 2% | 2% | 3% | 2% | 2% | 2% |
| December, 2021 | 14% | 14% | 18% | 13% | 12% | 12% | 12% | 12% | 12% | 12% |
| Fidelity Freedom Blend 2010 Fund | | | | | | | | | | |
| May, 2021 | 12% | – | – | 5% | 5% | 4% | 5% | 4% | 4% | 4% |
| December, 2021 | 17% | 19% | 20% | 16% | 16% | 16% | 16% | 15% | 16% | 15% |
| Fidelity Freedom Blend 2015 Fund | | | | | | | | | | |
| May, 2021 | – | 85% | – | 15% | 11% | 8% | 17% | 8% | 11% | 8% |
| December, 2021 | 19% | 21% | 23% | 18% | 18% | 18% | 18% | 17% | 18% | 17% |
| Fidelity Freedom Blend 2020 Fund | | | | | | | | | | |
| May, 2021 | 24% | – | – | 9% | 8% | 7% | 12% | 7% | 5% | 7% |
| December, 2021 | 21% | 23% | 25% | 20% | 20% | 21% | 20% | 19% | 20% | 19% |
| Fidelity Freedom Blend 2025 Fund | | | | | | | | | | |
| May, 2021 | 18% | 100% | – | 9% | 8% | 7% | 10% | 7% | 5% | 7% |
| December, 2021 | 24% | 24% | 28% | 22% | 22% | 22% | 22% | 21% | 22% | 21% |
| Fidelity Freedom Blend 2030 Fund | | | | | | | | | | |
| May, 2021 | 18% | 100% | – | 11% | 10% | 8% | 12% | 8% | 6% | 8% |
| December, 2021 | 25% | 26% | 30% | 23% | 23% | 24% | 24% | 22% | 24% | 23% |
| Fidelity Freedom Blend 2035 Fund | | | | | | | | | | |
| May, 2021 | 100% | – | – | 24% | 19% | 14% | 24% | 14% | 10% | 13% |
| December, 2021 | 28% | 30% | 33% | 27% | 27% | 28% | 27% | 26% | 27% | 26% |
| Fidelity Freedom Blend 2040 Fund | | | | | | | | | | |
| May, 2021 | 100% | – | – | 29% | 23% | 16% | 25% | 16% | 10% | 16% |
| December, 2021 | 30% | 32% | 35% | 29% | 29% | 30% | 29% | 28% | 29% | 28% |
| Fidelity Freedom Blend 2045 Fund | | | | | | | | | | |
| May, 2021 | – | – | – | 40% | 29% | 19% | 40% | 19% | 10% | 19% |
| December, 2021 | 30% | 33% | 35% | 29% | 29% | 30% | 29% | 28% | 29% | 28% |
| Fidelity Freedom Blend 2050 Fund | | | | | | | | | | |
| May, 2021 | 100% | – | – | 34% | 26% | 17% | 26% | 17% | 12% | 17% |
| December, 2021 | 31% | 33% | 35% | 29% | 29% | 30% | 30% | 28% | 29% | 28% |
| Fidelity Freedom Blend 2055 Fund | | | | | | | | | | |
| May, 2021 | – | – | – | 32% | 23% | 15% | 20% | 15% | 11% | 14% |
| December, 2021 | 31% | 33% | 35% | 29% | 29% | 30% | 30% | 28% | 29% | 28% |
| Fidelity Freedom Blend 2060 Fund | | | | | | | | | | |
| May, 2021 | – | – | – | 92% | 37% | 23% | 31% | 23% | 19% | 21% |
| December, 2021 | 31% | 33% | 36% | 30% | 29% | 29% | 30% | 28% | 29% | 29% |
| Fidelity Freedom Blend 2065 Fund | | | | | | | | | | |
| May, 2021 | – | – | – | – | 100% | 28% | 44% | 28% | 100% | 37% |
| December, 2021 | 32% | 35% | 38% | 31% | 30% | 30% | 31% | 29% | 31% | 30% |
|
A percentage of the dividends distributed during the fiscal year for the following funds qualify as a section 199A dividend:
| | Class A | Class M | Class C | Fidelity Freedom Blend Class | Class K | Class K6 | Class I | Premier Class
| Class Z | Class Z6 |
| Fidelity Freedom Blend Income Fund | | | | | | | | | | |
| April, 2021 | 0% | – | – | 0% | 0% | 0% | 0% | 0% | 0% | 0% |
| May, 2021 | 1% | 1% | 1% | 1% | 1% | 1% | 1% | 1% | 1% | 1% |
| June, 2021 | 1% | – | – | 1% | 1% | 1% | 1% | 1% | 1% | 1% |
| July, 2021 | – | – | – | 1% | 1% | 1% | 1% | 1% | 1% | 1% |
| August, 2021 | 2% | – | – | 1% | 1% | 1% | 1% | 1% | 1% | 1% |
| September, 2021 | 1% | – | – | 1% | 1% | 1% | 1% | 1% | 1% | 1% |
| October, 2021 | 1% | 1% | 1% | 1% | 1% | 1% | 1% | 1% | 1% | 1% |
| November, 2021 | – | – | – | 1% | 1% | 1% | 1% | 1% | 1% | 1% |
| December, 2021 | 1% | 1% | 1% | 1% | 1% | 1% | 1% | 1% | 1% | 1% |
| February, 2022 | – | – | – | 4% | 2% | 2% | 4% | 2% | 4% | 2% |
| March, 2022 | – | – | – | 4% | 2% | 2% | 4% | 2% | 2% | 2% |
| Fidelity Freedom Blend 2005 Fund | | | | | | | | | | |
| May, 2021 | 0% | 0% | – | 0% | 0% | 0% | 0% | 0% | 0% | 0% |
| December, 2021 | 1% | 1% | 1% | 1% | 1% | 1% | 1% | 1% | 1% | 1% |
| Fidelity Freedom Blend 2010 Fund | | | | | | | | | | |
| May, 2021 | 1% | – | – | 1% | 1% | 1% | 1% | 1% | 1% | 1% |
| December, 2021 | 1% | 1% | 1% | 1% | 1% | 1% | 1% | 1% | 1% | 1% |
| Fidelity Freedom Blend 2015 Fund | | | | | | | | | | |
| May, 2021 | – | 1% | – | 1% | 1% | 1% | 1% | 1% | 1% | 1% |
| December, 2021 | 1% | 1% | 1% | 1% | 1% | 1% | 1% | 1% | 1% | 1% |
| Fidelity Freedom Blend 2020 Fund | | | | | | | | | | |
| May, 2021 | 1% | – | – | 1% | 1% | 1% | 1% | 1% | 1% | 1% |
| December, 2021 | 1% | 1% | 1% | 1% | 1% | 1% | 1% | 1% | 1% | 1% |
| Fidelity Freedom Blend 2025 Fund | | | | | | | | | | |
| May, 2021 | 1% | – | – | 1% | 1% | 1% | 1% | 1% | 1% | 1% |
| December, 2021 | 1% | 1% | 1% | 1% | 1% | 1% | 1% | 1% | 1% | 1% |
| Fidelity Freedom Blend 2030 Fund | | | | | | | | | | |
| May, 2021 | 1% | – | – | 1% | 1% | 1% | 1% | 1% | 1% | 1% |
| December, 2021 | 1% | 1% | 1% | 1% | 1% | 1% | 1% | 1% | 1% | 1% |
| Fidelity Freedom Blend 2035 Fund | | | | | | | | | | |
| May, 2021 | 0% | – | – | 1% | 1% | 1% | 1% | 1% | 1% | 1% |
| December, 2021 | 1% | 1% | 1% | 1% | 1% | 1% | 1% | 1% | 1% | 1% |
| Fidelity Freedom Blend 2040 Fund | | | | | | | | | | |
| May, 2021 | – | – | – | 1% | 1% | 1% | 1% | 1% | 1% | 1% |
| December, 2021 | 1% | 1% | 1% | 1% | 1% | 1% | 1% | 1% | 1% | 1% |
| Fidelity Freedom Blend 2045 Fund | | | | | | | | | | |
| May, 2021 | – | – | – | 1% | 1% | 1% | 1% | 1% | 1% | 1% |
| December, 2021 | 1% | 1% | 1% | 1% | 1% | 1% | 1% | 1% | 1% | 1% |
| Fidelity Freedom Blend 2050 Fund | | | | | | | | | | |
| May, 2021 | – | – | – | 1% | 1% | 1% | 1% | 1% | 1% | 1% |
| December, 2021 | 1% | 1% | 1% | 1% | 1% | 1% | 1% | 1% | 1% | 1% |
| Fidelity Freedom Blend 2055 Fund | | | | | | | | | | |
| May, 2021 | – | – | – | 1% | 1% | 1% | 1% | 1% | 1% | 1% |
| December, 2021 | 1% | 1% | 1% | 1% | 1% | 1% | 1% | 1% | 1% | 1% |
| Fidelity Freedom Blend 2060 Fund | | | | | | | | | | |
| May, 2021 | – | – | – | 1% | 1% | 1% | 1% | 1% | 1% | 1% |
| December, 2021 | 1% | 1% | 1% | 1% | 1% | 1% | 1% | 1% | 1% | 1% |
| Fidelity Freedom Blend 2065 Fund | | | | | | | | | | |
| May, 2021 | – | – | – | – | – | 1% | 1% | 1% | – | 1% |
| December, 2021 | 1% | 1% | 1% | 1% | 1% | 1% | 1% | 1% | 1% | 1% |
|
The funds will notify shareholders in January 2023 of amounts for use in preparing 2022 income tax returns.
Board Approval of Investment Advisory Contracts and Management Fees
Fidelity Freedom Blend Funds
At its March 2022 meeting the Board of Trustees, including the Independent Trustees (together, the Board), voted to approve an amended and restated management contract (the Amended Contract) for the funds to decrease the management fees paid to Fidelity Management & Research Company LLC (FMR), the funds' investment adviser, by 5 basis points, effective April 1, 2022. The Board, assisted by the advice of fund counsel and Independent Trustees' counsel, considered a broad range of information.
Nature, Extent, and Quality of Services Provided. The Board previously received and considered materials relating to the nature, extent and quality of services provided by FMR to the funds, including the resources dedicated to investment management and support services, shareholder and administrative services, the benefits to shareholders of investment in a large fund family, and the investment performance of the funds in connection with the annual renewal of the funds' current management contracts. At its September 2021 meeting, the Board concluded that the nature, extent and quality of the services provided to the funds under the existing management contract should continue to benefit each fund's shareholders. In connection with its approval of the Amended Contract at its March 2022 meeting, the Board noted that such approval would not change the funds' portfolio manager, the investment processes, the level or nature of services provided, the resources and personnel allocated or trading and compliance operations. The Board concluded that the nature, extent, and quality of services to be provided to the funds under the Amended Contract will continue to benefit the funds' shareholders.
Competitiveness of Management Fee and Total Expense Ratio. The Board considered that it received and reviewed information regarding the funds' management fee rate and total expense ratio compared to "mapped groups" of competitive funds and classes at the current management fee and expense levels in connection with the annual renewal of the management contract. Based on its review, the Board concluded at its September 2021 meeting that each fund's current management fee and total expenses are fair and reasonable in light of the services that each fund receives and the other factors considered. In its review of the proposed management fee rate under the Amended Contract, the Board considered that the proposed fee rate is lower for each class of each fund by 5 basis points than the current management fee rate. The Board also considered that FMR will retain its obligation to pay fund-level operating expenses, with certain limited exceptions, under the management contract. In addition, the Board considered the effects of amended contractual arrangements for each fund that continue to oblige FMR to pay all "class-level" expenses of each class of each fund to the extent necessary to limit total expenses, with certain exceptions, to certain levels, which have been further reduced by FMR between 4 and 6 basis points for each class. Based on its review, the Board concluded that the management fee and the total expense ratio of each class of each fund continue to be fair and reasonable in light of the services that each fund receives and the other factors considered.
Costs of the Services and Profitability. The Board considered that it previously reviewed information regarding the revenues earned, the expenses incurred by FMR in providing services to each fund and the level of FMR's profitability. At its September 2021 meeting, the Board concluded that it was satisfied that the profitability of FMR in connection with the operation of the fund was not excessive. Because the Board was approving an arrangement under which the management fees were being reduced, the Board did not consider FMR's costs of services, revenues, or profitability to be significant factors in its decision to approve the Amended Contract.
Economies of Scale. The Board considered that it previously received and reviewed information regarding whether there have been economies of scale in respect of the management of the Fidelity funds, whether the Fidelity funds (including the funds) have appropriately benefited from any such economies of scale, and whether there is a potential realization of any further economies of scale and that it concluded, at its September 2021 meeting, that economies of scale, if any, are being appropriately shared between fund shareholders and Fidelity. In connection with the approval of the fund's Amended Contract, the Board did not consider economies of scale because the proposed fee arrangement lowers the funds' management fee and FMR will continue to contractually limit expenses. The Board will continue to review economies of scale in connection with future renewals of the Amended Contract.
Based on its evaluation of all of the conclusions noted above, and after considering all factors it believed relevant, the Board ultimately concluded that the advisory fee structures are fair and reasonable, and that each fund's Amended Contract should be ratified and approved.
Liquidity Risk Management Program
The Securities and Exchange Commission adopted Rule 22e-4 under the Investment Company Act of 1940 (the Liquidity Rule) to promote effective liquidity risk management throughout the open-end investment company industry, thereby reducing the risk that funds will be unable to meet their redemption obligations and mitigating dilution of the interests of fund shareholders.
The Funds have adopted and implemented a liquidity risk management program pursuant to the Liquidity Rule (the Program) effective December 1, 2018. The Program is reasonably designed to assess and manage each Fund’s liquidity risk and to comply with the requirements of the Liquidity Rule. Each Fund’s Board of Trustees (the Board) has designated each Fund’s investment adviser as administrator of the Program. The Fidelity advisers have established a Liquidity Risk Management Committee (the LRM Committee) to manage the Program for each of the Fidelity Funds. The LRM Committee monitors the adequacy and effectiveness of implementation of the Program and on a periodic basis assesses each Fund’s liquidity risk based on a variety of factors including (1) the Fund’s investment strategy, (2) portfolio liquidity and cash flow projections during normal and reasonably foreseeable stressed conditions, (3) shareholder redemptions, (4) borrowings and other funding sources and (5) in the case of exchange-traded funds, certain additional factors including the effect of the Fund’s prices and spreads, market participants, and basket compositions on the overall liquidity of the Fund’s portfolio, as applicable.
In accordance with the Program, each of the Fund’s portfolio investments is classified into one of four liquidity categories described below based on a determination of a reasonable expectation for how long it would take to convert the investment to cash (or sell or dispose of the investment) without significantly changing its market value.
- Highly liquid investments – cash or convertible to cash within three business days or less
- Moderately liquid investments – convertible to cash in three to seven calendar days
- Less liquid investments – can be sold or disposed of, but not settled, within seven calendar days
- Illiquid investments – cannot be sold or disposed of within seven calendar days
Liquidity classification determinations take into account a variety of factors including various market, trading and investment-specific considerations, as well as market depth, and generally utilize analysis from a third-party liquidity metrics service.
The Liquidity Rule places a 15% limit on a fund’s illiquid investments and requires funds that do not primarily hold assets that are highly liquid investments to determine and maintain a minimum percentage of the fund’s net assets to be invested in highly liquid investments (highly liquid investment minimum or HLIM). The Program includes provisions reasonably designed to comply with the 15% limit on illiquid investments and for determining, periodically reviewing and complying with the HLIM requirement as applicable.
At a recent meeting of the Fund’s Board of Trustees, the LRM Committee provided a written report to the Board pertaining to the operation, adequacy, and effectiveness of implementation of the Program for the annual period from December 1, 2020 through November 30, 2021. The report concluded that the Program has been implemented and is operating effectively and is reasonably designed to assess and manage the Fund’s liquidity risk.
FBF-ANN-0522
1.9890344.103
Fidelity Freedom® Index Funds - Income, 2005, 2010, 2015, 2020, 2025, 2030, 2035, 2040, 2045, 2050, 2055, 2060, 2065
Annual Report
March 31, 2022
Contents
To view a fund's proxy voting guidelines and proxy voting record for the 12-month period ended June 30, visit http://www.fidelity.com/proxyvotingresults or visit the Securities and Exchange Commission's (SEC) web site at http://www.sec.gov.
You may also call 1-800-835-5092 (plan accounts and Institutional Premium Class) or 1-800-544-8544 (all other accounts) to request a free copy of the proxy voting guidelines.
Standard & Poor’s® and S&P® are registered trademarks of Standard & Poor’s Financial Services LLC (“S&P”) and Dow Jones® is a registered trademark of Dow Jones Trademark Holdings LLC (“Dow Jones”). A fund is not sponsored, endorsed, sold or promoted by SPDJI, Dow Jones, S&P, or their respective affiliates and none of such parties make any representation regarding the advisability of investing in such product(s) nor do they have any liability for any errors, omissions, or interruptions of the index or indices.
BLOOMBERG® is a trademark and service mark of Bloomberg Finance L.P. and its affiliates (collectively “Bloomberg”). Bloomberg or Bloomberg’s licensors own all proprietary rights in the Bloomberg Indices. Neither Bloomberg nor Bloomberg’s licensors approves or endorses this material, or guarantees the accuracy or completeness of any information herein, or makes any warranty, express or implied, as to the results to be obtained therefrom and, to the maximum extent allowed by law, neither shall have any liability or responsibility for injury or damages arising in connection therewith.
Standard & Poor's, S&P and S&P 500 are registered service marks of The McGraw-Hill Companies, Inc. and have been licensed for use by Fidelity Distributors Corporation.
Other third-party marks appearing herein are the property of their respective owners.
All other marks appearing herein are registered or unregistered trademarks or service marks of FMR LLC or an affiliated company. © 2022 FMR LLC. All rights reserved.
This report and the financial statements contained herein are submitted for the general information of the shareholders of the Funds. This report is not authorized for distribution to prospective investors in the Funds unless preceded or accompanied by an effective prospectus.
A fund files its complete schedule of portfolio holdings with the SEC for the first and third quarters of each fiscal year on Form N-PORT. Forms N-PORT are available on the SEC’s web site at http://www.sec.gov. A fund's Forms N-PORT may be reviewed and copied at the SEC’s Public Reference Room in Washington, DC. Information regarding the operation of the SEC's Public Reference Room may be obtained by calling 1-800-SEC-0330.
For a complete list of a fund's portfolio holdings, view the most recent holdings listing, semiannual report, or annual report on Fidelity's web site at http://www.fidelity.com, http://www.institutional.fidelity.com, or http://www.401k.com, as applicable.
NOT FDIC INSURED •MAY LOSE VALUE •NO BANK GUARANTEE
Neither the Funds nor Fidelity Distributors Corporation is a bank.
Note to Shareholders:
Early in 2020, the outbreak and spread of COVID-19 emerged as a public health emergency that had a major influence on financial markets, primarily based on its impact on the global economy and corporate earnings. On March 11, 2020, the World Health Organization declared the COVID-19 outbreak a pandemic, citing sustained risk of further global spread. The pandemic prompted a number of measures to limit the spread of COVID-19, including travel and border restrictions, quarantines, and restrictions on large gatherings. In turn, these resulted in lower consumer activity, diminished demand for a wide range of products and services, disruption in manufacturing and supply chains, and – given the wide variability in outcomes regarding the outbreak – significant market uncertainty and volatility. To help stem the turmoil, the U.S. government took unprecedented action – in concert with the U.S. Federal Reserve and central banks around the world – to help support consumers, businesses, and the broader economy, and to limit disruption to the financial system.
In general, the overall impact of the pandemic lessened in 2021, amid a resilient economy and widespread distribution of three COVID-19 vaccines granted emergency use authorization from the U.S. Food and Drug Administration (FDA) early in the year. Still, the situation remains dynamic, and the extent and duration of its influence on financial markets and the economy is highly uncertain, due in part to a recent spike in cases based on highly contagious variants of the coronavirus.
Extreme events such as the COVID-19 crisis are exogenous shocks that can have significant adverse effects on mutual funds and their investments. Although multiple asset classes may be affected by market disruption, the duration and impact may not be the same for all types of assets. Fidelity is committed to helping you stay informed amid news about COVID-19 and during increased market volatility, and we continue to take extra steps to be responsive to customer needs. We encourage you to visit us online, where we offer ongoing updates, commentary, and analysis on the markets and our funds.
Fidelity Freedom® Index Income Fund
Performance: The Bottom Line
Average annual total return reflects the change in the value of an investment, assuming reinvestment of distributions from dividend income and capital gains (the profits earned upon the sale of securities that have grown in value, if any) and assuming a constant rate of performance each year. The hypothetical investment and the average annual total returns do not reflect the deduction of taxes that a shareholder would pay on fund distributions or the redemption of fund shares. During periods of reimbursement by Fidelity, a fund’s total return will be greater than it would be had the reimbursement not occurred. How a fund did yesterday is no guarantee of how it will do tomorrow.
Average Annual Total Returns
| Periods ended March 31, 2022 | Past 1 year | Past 5 years | Past 10 years |
| Investor Class | (0.50)% | 4.18% | 3.55% |
| Institutional Premium Class | (0.44)% | 4.24% | 3.58% |
| Premier Class | (0.40)% | 4.24% | 3.58% |
The initial offering of Institutional Premium Class took place on June 24, 2015. Returns prior to June 24, 2015 are those of Investor Class, the original class of the fund.
The initial offering of Premier Class took place on June 24, 2020. Returns between June 24, 2015 and June 24, 2020 are those of Institutional Premium Class. Returns prior to June 24, 2015 are those of Investor Class, the original class of the fund.
$10,000 Over 10 Years
Let's say hypothetically that $10,000 was invested in Fidelity Freedom® Index Income Fund - Investor Class on March 31, 2012.
The chart shows how the value of your investment would have changed, and also shows how the Bloomberg U.S. Aggregate Bond Index performed over the same period.
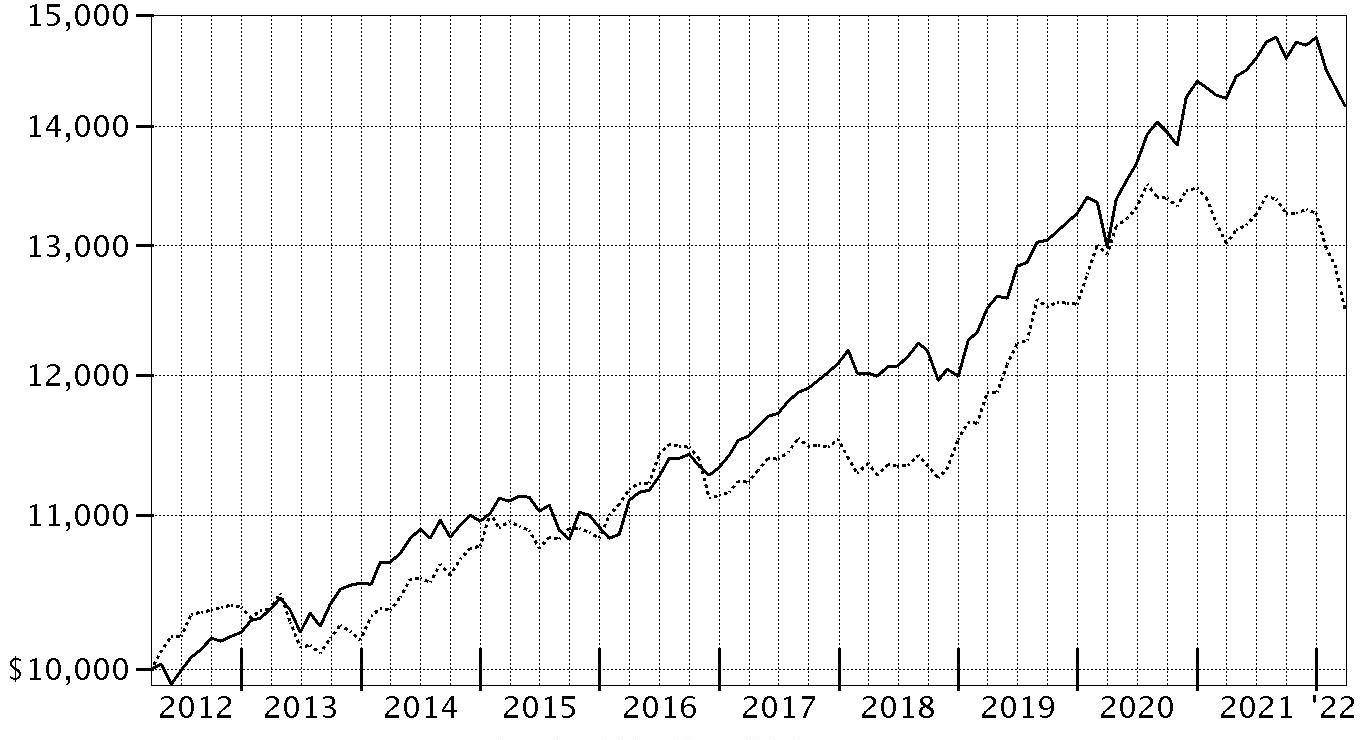
| Period Ending Values |
| $14,177 | Fidelity Freedom® Index Income Fund - Investor Class |
| $12,480 | Bloomberg U.S. Aggregate Bond Index |
Effective August 24, 2021, all Bloomberg Barclays Indices were re-branded as Bloomberg Indices.
Fidelity Freedom® Index 2005 Fund
Performance: The Bottom Line
Average annual total return reflects the change in the value of an investment, assuming reinvestment of distributions from dividend income and capital gains (the profits earned upon the sale of securities that have grown in value, if any) and assuming a constant rate of performance each year. The hypothetical investment and the average annual total returns do not reflect the deduction of taxes that a shareholder would pay on fund distributions or the redemption of fund shares. During periods of reimbursement by Fidelity, a fund’s total return will be greater than it would be had the reimbursement not occurred. How a fund did yesterday is no guarantee of how it will do tomorrow.
Average Annual Total Returns
| Periods ended March 31, 2022 | Past 1 year | Past 5 years | Past 10 years |
| Investor Class | (0.20)% | 4.86% | 4.49% |
| Institutional Premium Class | (0.25)% | 4.90% | 4.52% |
| Premier Class | (0.15)% | 4.92% | 4.53% |
The initial offering of Institutional Premium Class took place on June 24, 2015. Returns prior to June 24, 2015 are those of Investor Class, the original class of the fund.
The initial offering of Premier Class took place on June 24, 2020. Returns between June 24, 2015 and June 24, 2020 are those of Institutional Premium Class. Returns prior to June 24, 2015 are those of Investor Class, the original class of the fund.
$10,000 Over 10 Years
Let's say hypothetically that $10,000 was invested in Fidelity Freedom® Index 2005 Fund - Investor Class on March 31, 2012.
The chart shows how the value of your investment would have changed, and also shows how the Bloomberg U.S. Aggregate Bond Index performed over the same period.

| Period Ending Values |
| $15,514 | Fidelity Freedom® Index 2005 Fund - Investor Class |
| $12,480 | Bloomberg U.S. Aggregate Bond Index |
Effective August 24, 2021, all Bloomberg Barclays Indices were re-branded as Bloomberg Indices.
Fidelity Freedom® Index 2010 Fund
Performance: The Bottom Line
Average annual total return reflects the change in the value of an investment, assuming reinvestment of distributions from dividend income and capital gains (the profits earned upon the sale of securities that have grown in value, if any) and assuming a constant rate of performance each year. The hypothetical investment and the average annual total returns do not reflect the deduction of taxes that a shareholder would pay on fund distributions or the redemption of fund shares. During periods of reimbursement by Fidelity, a fund’s total return will be greater than it would be had the reimbursement not occurred. How a fund did yesterday is no guarantee of how it will do tomorrow.
Average Annual Total Returns
| Periods ended March 31, 2022 | Past 1 year | Past 5 years | Past 10 years |
| Investor Class | 0.33% | 5.79% | 5.45% |
| Institutional Premium Class | 0.35% | 5.83% | 5.49% |
| Premier Class | 0.37% | 5.85% | 5.49% |
The initial offering of Institutional Premium Class took place on June 24, 2015. Returns prior to June 24, 2015 are those of Investor Class, the original class of the fund.
The initial offering of Premier Class took place on June 24, 2020. Returns between June 24, 2015 and June 24, 2020 are those of Institutional Premium Class. Returns prior to June 24, 2015 are those of Investor Class, the original class of the fund.
$10,000 Over 10 Years
Let's say hypothetically that $10,000 was invested in Fidelity Freedom® Index 2010 Fund - Investor Class on March 31, 2012.
The chart shows how the value of your investment would have changed, and also shows how the Bloomberg U.S. Aggregate Bond Index performed over the same period.
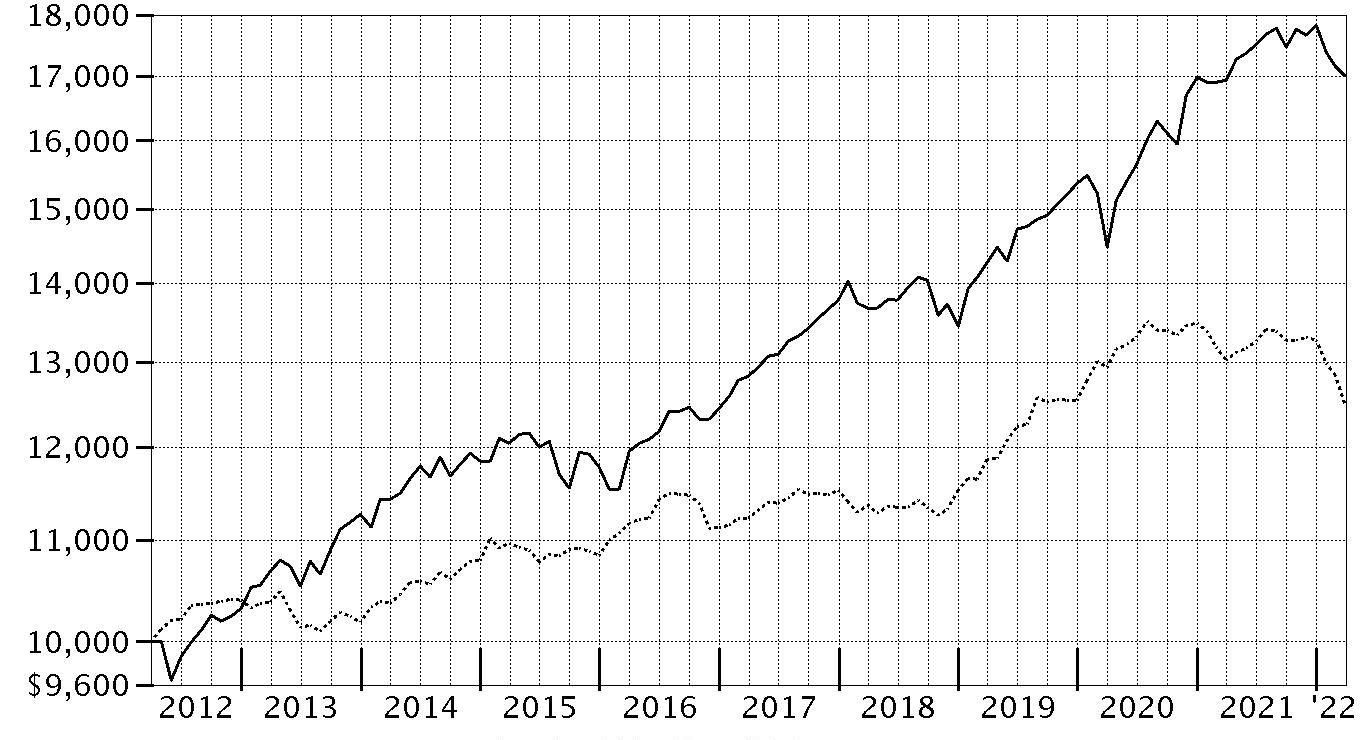
| Period Ending Values |
| $16,993 | Fidelity Freedom® Index 2010 Fund - Investor Class |
| $12,480 | Bloomberg U.S. Aggregate Bond Index |
Effective August 24, 2021, all Bloomberg Barclays Indices were re-branded as Bloomberg Indices.
Fidelity Freedom® Index 2015 Fund
Performance: The Bottom Line
Average annual total return reflects the change in the value of an investment, assuming reinvestment of distributions from dividend income and capital gains (the profits earned upon the sale of securities that have grown in value, if any) and assuming a constant rate of performance each year. The hypothetical investment and the average annual total returns do not reflect the deduction of taxes that a shareholder would pay on fund distributions or the redemption of fund shares. During periods of reimbursement by Fidelity, a fund’s total return will be greater than it would be had the reimbursement not occurred. How a fund did yesterday is no guarantee of how it will do tomorrow.
Average Annual Total Returns
| Periods ended March 31, 2022 | Past 1 year | Past 5 years | Past 10 years |
| Investor Class | 0.86% | 6.71% | 6.15% |
| Institutional Premium Class | 0.96% | 6.77% | 6.18% |
| Premier Class | 0.92% | 6.78% | 6.18% |
The initial offering of Institutional Premium Class took place on June 24, 2015. Returns prior to June 24, 2015 are those of Investor Class, the original class of the fund.
The initial offering of Premier Class took place on June 24, 2020. Returns between June 24, 2015 and June 24, 2020 are those of Institutional Premium Class. Returns prior to June 24, 2015 are those of Investor Class, the original class of the fund.
$10,000 Over 10 Years
Let's say hypothetically that $10,000 was invested in Fidelity Freedom® Index 2015 Fund - Investor Class on March 31, 2012.
The chart shows how the value of your investment would have changed, and also shows how the Bloomberg U.S. Aggregate Bond Index performed over the same period.
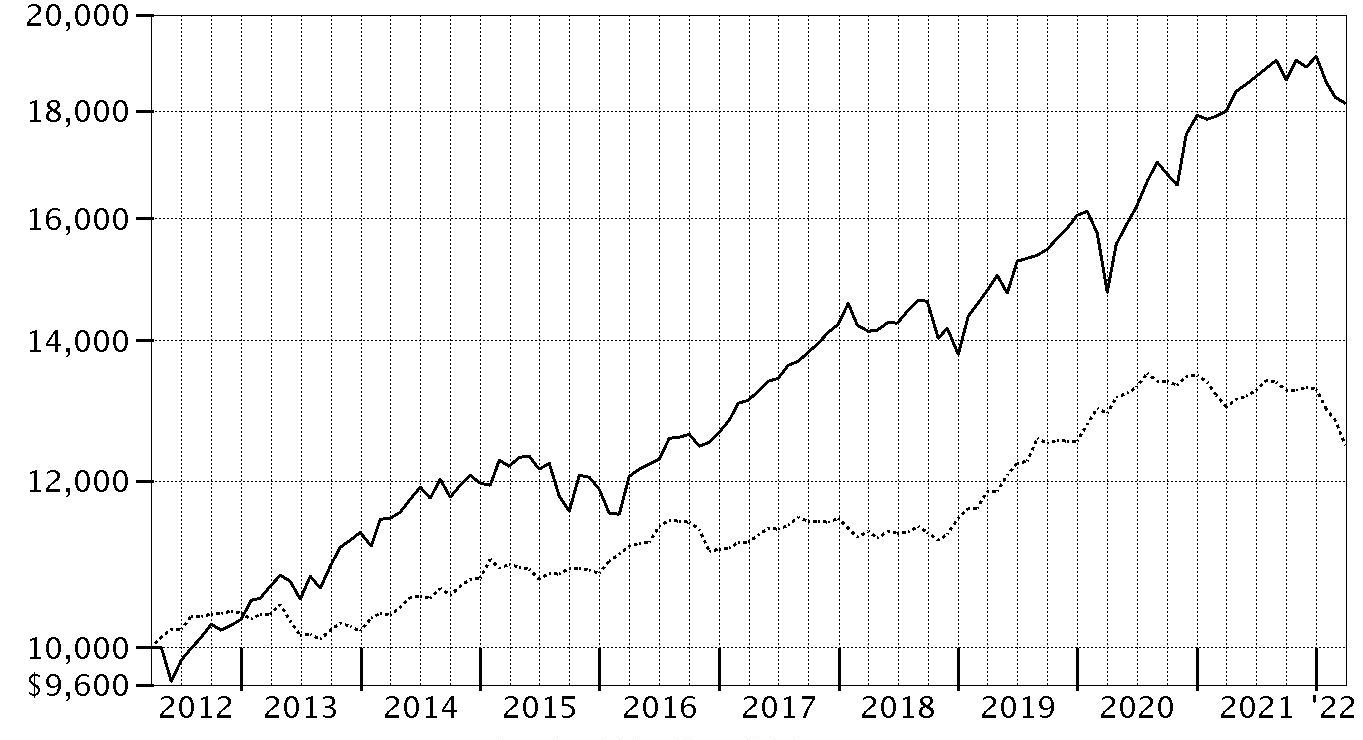
| Period Ending Values |
| $18,159 | Fidelity Freedom® Index 2015 Fund - Investor Class |
| $12,480 | Bloomberg U.S. Aggregate Bond Index |
Effective August 24, 2021, all Bloomberg Barclays Indices were re-branded as Bloomberg Indices.
Fidelity Freedom® Index 2020 Fund
Performance: The Bottom Line
Average annual total return reflects the change in the value of an investment, assuming reinvestment of distributions from dividend income and capital gains (the profits earned upon the sale of securities that have grown in value, if any) and assuming a constant rate of performance each year. The hypothetical investment and the average annual total returns do not reflect the deduction of taxes that a shareholder would pay on fund distributions or the redemption of fund shares. During periods of reimbursement by Fidelity, a fund’s total return will be greater than it would be had the reimbursement not occurred. How a fund did yesterday is no guarantee of how it will do tomorrow.
Average Annual Total Returns
| Periods ended March 31, 2022 | Past 1 year | Past 5 years | Past 10 years |
| Investor Class | 1.46% | 7.52% | 6.77% |
| Institutional Premium Class | 1.44% | 7.56% | 6.80% |
| Premier Class | 1.46% | 7.57% | 6.80% |
The initial offering of Institutional Premium Class took place on June 24, 2015. Returns prior to June 24, 2015 are those of Investor Class, the original class of the fund.
The initial offering of Premier Class took place on June 24, 2020. Returns between June 24, 2015 and June 24, 2020 are those of Institutional Premium Class. Returns prior to June 24, 2015 are those of Investor Class, the original class of the fund.
$10,000 Over 10 Years
Let's say hypothetically that $10,000 was invested in Fidelity Freedom® Index 2020 Fund - Investor Class on March 31, 2012.
The chart shows how the value of your investment would have changed, and also shows how the Bloomberg U.S. Aggregate Bond Index and S&P 500 Index performed over the same period.
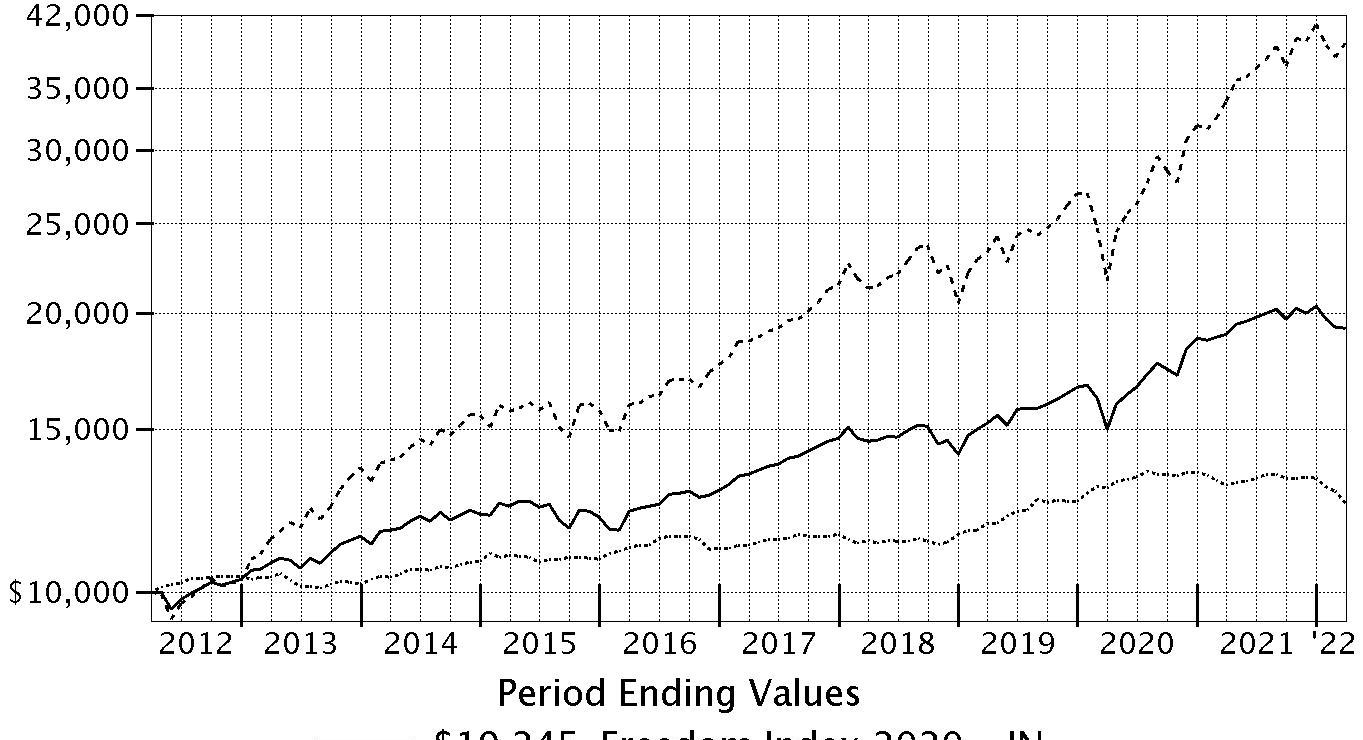
| Period Ending Values |
| $19,245 | Fidelity Freedom® Index 2020 Fund - Investor Class |
| $12,480 | Bloomberg U.S. Aggregate Bond Index |
| $39,197 | S&P 500 Index |
Effective August 24, 2021, all Bloomberg Barclays Indices were re-branded as Bloomberg Indices.
Effective October 1, 2021, the fund’s benchmark changed from the S&P 500 Index to the Bloomberg U.S. Aggregate Bond Index.
Fidelity Freedom® Index 2025 Fund
Performance: The Bottom Line
Average annual total return reflects the change in the value of an investment, assuming reinvestment of distributions from dividend income and capital gains (the profits earned upon the sale of securities that have grown in value, if any) and assuming a constant rate of performance each year. The hypothetical investment and the average annual total returns do not reflect the deduction of taxes that a shareholder would pay on fund distributions or the redemption of fund shares. During periods of reimbursement by Fidelity, a fund’s total return will be greater than it would be had the reimbursement not occurred. How a fund did yesterday is no guarantee of how it will do tomorrow.
Average Annual Total Returns
| Periods ended March 31, 2022 | Past 1 year | Past 5 years | Past 10 years |
| Investor Class | 1.91% | 8.15% | 7.52% |
| Institutional Premium Class | 1.96% | 8.21% | 7.56% |
| Premier Class | 1.98% | 8.21% | 7.56% |
The initial offering of Institutional Premium Class took place on June 24, 2015. Returns prior to June 24, 2015 are those of Investor Class, the original class of the fund.
The initial offering of Premier Class took place on June 24, 2020. Returns between June 24, 2015 and June 24, 2020 are those of Institutional Premium Class. Returns prior to June 24, 2015 are those of Investor Class, the original class of the fund.
$10,000 Over 10 Years
Let's say hypothetically that $10,000 was invested in Fidelity Freedom® Index 2025 Fund - Investor Class on March 31, 2012.
The chart shows how the value of your investment would have changed, and also shows how the S&P 500® Index performed over the same period.
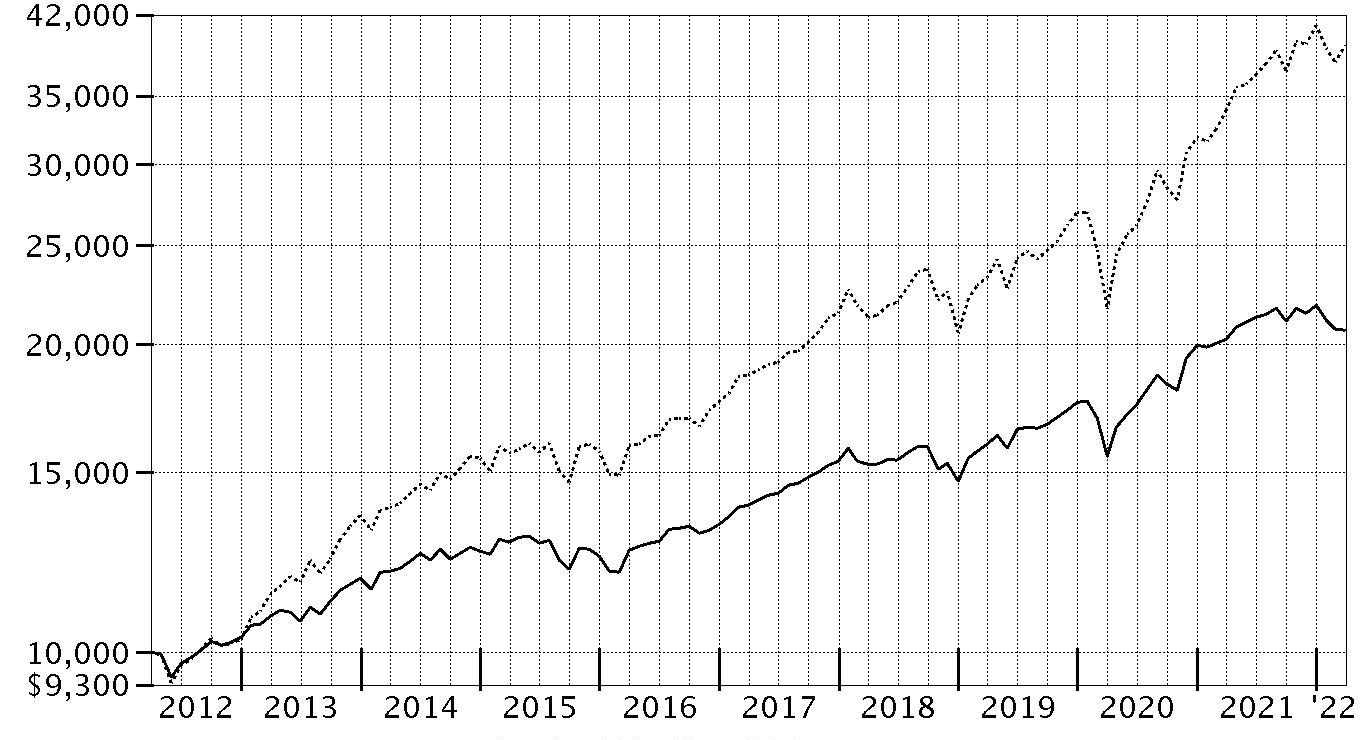
| Period Ending Values |
| $20,641 | Fidelity Freedom® Index 2025 Fund - Investor Class |
| $39,197 | S&P 500® Index |
Fidelity Freedom® Index 2030 Fund
Performance: The Bottom Line
Average annual total return reflects the change in the value of an investment, assuming reinvestment of distributions from dividend income and capital gains (the profits earned upon the sale of securities that have grown in value, if any) and assuming a constant rate of performance each year. The hypothetical investment and the average annual total returns do not reflect the deduction of taxes that a shareholder would pay on fund distributions or the redemption of fund shares. During periods of reimbursement by Fidelity, a fund’s total return will be greater than it would be had the reimbursement not occurred. How a fund did yesterday is no guarantee of how it will do tomorrow.
Average Annual Total Returns
| Periods ended March 31, 2022 | Past 1 year | Past 5 years | Past 10 years |
| Investor Class | 2.47% | 9.11% | 8.32% |
| Institutional Premium Class | 2.57% | 9.17% | 8.36% |
| Premier Class | 2.54% | 9.17% | 8.36% |
The initial offering of Institutional Premium Class took place on June 24, 2015. Returns prior to June 24, 2015 are those of Investor Class, the original class of the fund.
The initial offering of Premier Class took place on June 24, 2020. Returns between June 24, 2015 and June 24, 2020 are those of Institutional Premium Class. Returns prior to June 24, 2015 are those of Investor Class, the original class of the fund.
$10,000 Over 10 Years
Let's say hypothetically that $10,000 was invested in Fidelity Freedom® Index 2030 Fund - Investor Class on March 31, 2012.
The chart shows how the value of your investment would have changed, and also shows how the S&P 500® Index performed over the same period.

| Period Ending Values |
| $22,234 | Fidelity Freedom® Index 2030 Fund - Investor Class |
| $39,197 | S&P 500® Index |
Fidelity Freedom® Index 2035 Fund
Performance: The Bottom Line
Average annual total return reflects the change in the value of an investment, assuming reinvestment of distributions from dividend income and capital gains (the profits earned upon the sale of securities that have grown in value, if any) and assuming a constant rate of performance each year. The hypothetical investment and the average annual total returns do not reflect the deduction of taxes that a shareholder would pay on fund distributions or the redemption of fund shares. During periods of reimbursement by Fidelity, a fund’s total return will be greater than it would be had the reimbursement not occurred. How a fund did yesterday is no guarantee of how it will do tomorrow.
Average Annual Total Returns
| Periods ended March 31, 2022 | Past 1 year | Past 5 years | Past 10 years |
| Investor Class | 3.76% | 10.38% | 9.30% |
| Institutional Premium Class | 3.82% | 10.43% | 9.35% |
| Premier Class | 3.80% | 10.44% | 9.35% |
The initial offering of Institutional Premium Class took place on June 24, 2015. Returns prior to June 24, 2015 are those of Investor Class, the original class of the fund.
The initial offering of Premier Class took place on June 24, 2020. Returns between June 24, 2015 and June 24, 2020 are those of Institutional Premium Class. Returns prior to June 24, 2015 are those of Investor Class, the original class of the fund.
$10,000 Over 10 Years
Let's say hypothetically that $10,000 was invested in Fidelity Freedom® Index 2035 Fund - Investor Class on March 31, 2012.
The chart shows how the value of your investment would have changed, and also shows how the S&P 500® Index performed over the same period.
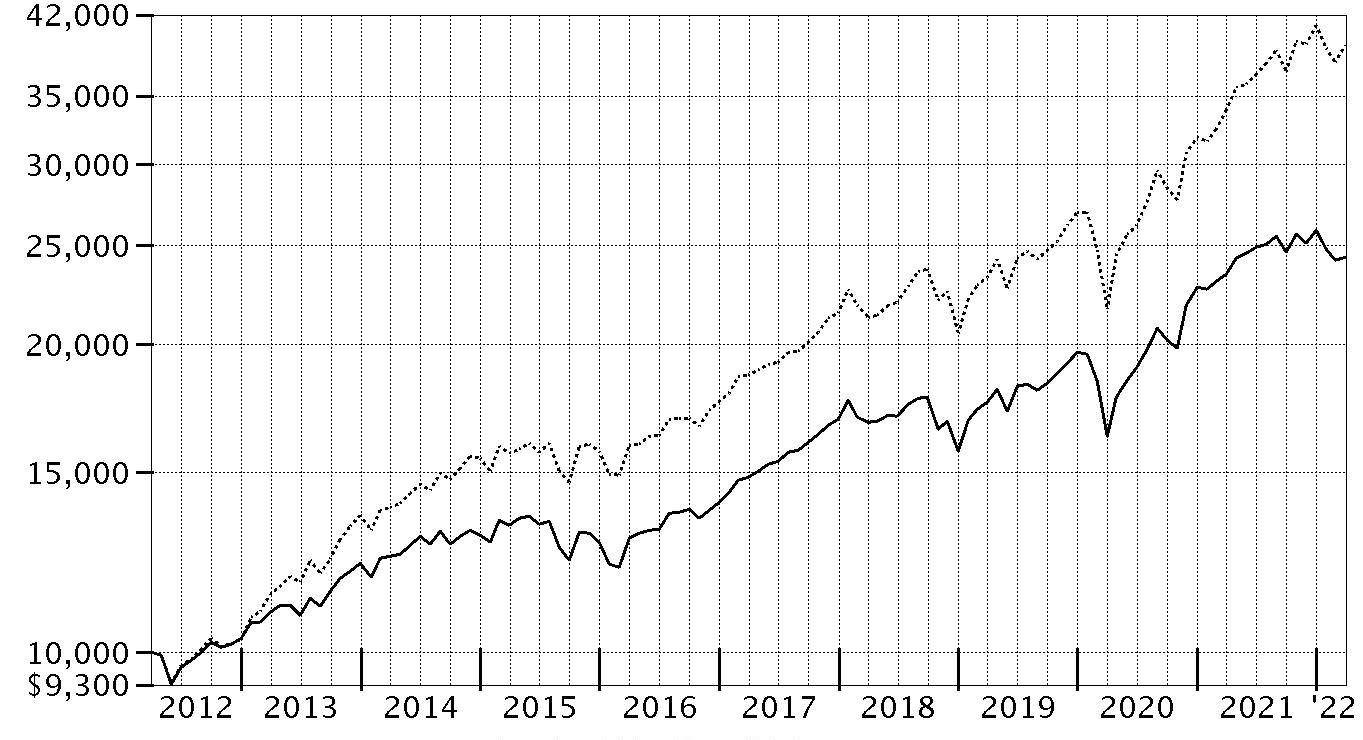
| Period Ending Values |
| $24,344 | Fidelity Freedom® Index 2035 Fund - Investor Class |
| $39,197 | S&P 500® Index |
Fidelity Freedom® Index 2040 Fund
Performance: The Bottom Line
Average annual total return reflects the change in the value of an investment, assuming reinvestment of distributions from dividend income and capital gains (the profits earned upon the sale of securities that have grown in value, if any) and assuming a constant rate of performance each year. The hypothetical investment and the average annual total returns do not reflect the deduction of taxes that a shareholder would pay on fund distributions or the redemption of fund shares. During periods of reimbursement by Fidelity, a fund’s total return will be greater than it would be had the reimbursement not occurred. How a fund did yesterday is no guarantee of how it will do tomorrow.
Average Annual Total Returns
| Periods ended March 31, 2022 | Past 1 year | Past 5 years | Past 10 years |
| Investor Class | 4.90% | 11.10% | 9.70% |
| Institutional Premium Class | 4.92% | 11.15% | 9.74% |
| Premier Class | 4.94% | 11.16% | 9.74% |
The initial offering of Institutional Premium Class took place on June 24, 2015. Returns prior to June 24, 2015 are those of Investor Class, the original class of the fund.
The initial offering of Premier Class took place on June 24, 2020. Returns between June 24, 2015 and June 24, 2020 are those of Institutional Premium Class. Returns prior to June 24, 2015 are those of Investor Class, the original class of the fund.
$10,000 Over 10 Years
Let's say hypothetically that $10,000 was invested in Fidelity Freedom® Index 2040 Fund - Investor Class on March 31, 2012.
The chart shows how the value of your investment would have changed, and also shows how the S&P 500® Index performed over the same period.

| Period Ending Values |
| $25,244 | Fidelity Freedom® Index 2040 Fund - Investor Class |
| $39,197 | S&P 500® Index |
Fidelity Freedom® Index 2045 Fund
Performance: The Bottom Line
Average annual total return reflects the change in the value of an investment, assuming reinvestment of distributions from dividend income and capital gains (the profits earned upon the sale of securities that have grown in value, if any) and assuming a constant rate of performance each year. The hypothetical investment and the average annual total returns do not reflect the deduction of taxes that a shareholder would pay on fund distributions or the redemption of fund shares. During periods of reimbursement by Fidelity, a fund’s total return will be greater than it would be had the reimbursement not occurred. How a fund did yesterday is no guarantee of how it will do tomorrow.
Average Annual Total Returns
| Periods ended March 31, 2022 | Past 1 year | Past 5 years | Past 10 years |
| Investor Class | 4.88% | 11.10% | 9.75% |
| Institutional Premium Class | 4.95% | 11.16% | 9.79% |
| Premier Class | 4.93% | 11.16% | 9.79% |
The initial offering of Institutional Premium Class took place on June 24, 2015. Returns prior to June 24, 2015 are those of Investor Class, the original class of the fund.
The initial offering of Premier Class took place on June 24, 2020. Returns between June 24, 2015 and June 24, 2020 are those of Institutional Premium Class. Returns prior to June 24, 2015 are those of Investor Class, the original class of the fund.
$10,000 Over 10 Years
Let's say hypothetically that $10,000 was invested in Fidelity Freedom® Index 2045 Fund - Investor Class on March 31, 2012.
The chart shows how the value of your investment would have changed, and also shows how the S&P 500® Index performed over the same period.

| Period Ending Values |
| $25,347 | Fidelity Freedom® Index 2045 Fund - Investor Class |
| $39,197 | S&P 500® Index |
Fidelity Freedom® Index 2050 Fund
Performance: The Bottom Line
Average annual total return reflects the change in the value of an investment, assuming reinvestment of distributions from dividend income and capital gains (the profits earned upon the sale of securities that have grown in value, if any) and assuming a constant rate of performance each year. The hypothetical investment and the average annual total returns do not reflect the deduction of taxes that a shareholder would pay on fund distributions or the redemption of fund shares. During periods of reimbursement by Fidelity, a fund’s total return will be greater than it would be had the reimbursement not occurred. How a fund did yesterday is no guarantee of how it will do tomorrow.
Average Annual Total Returns
| Periods ended March 31, 2022 | Past 1 year | Past 5 years | Past 10 years |
| Investor Class | 4.89% | 11.11% | 9.76% |
| Institutional Premium Class | 4.93% | 11.16% | 9.79% |
| Premier Class | 4.95% | 11.17% | 9.80% |
The initial offering of Institutional Premium Class took place on June 24, 2015. Returns prior to June 24, 2015 are those of Investor Class, the original class of the fund.
The initial offering of Premier Class took place on June 24, 2020. Returns between June 24, 2015 and June 24, 2020 are those of Institutional Premium Class. Returns prior to June 24, 2015 are those of Investor Class, the original class of the fund.
$10,000 Over 10 Years
Let's say hypothetically that $10,000 was invested in Fidelity Freedom® Index 2050 Fund - Investor Class on March 31, 2012.
The chart shows how the value of your investment would have changed, and also shows how the S&P 500® Index performed over the same period.
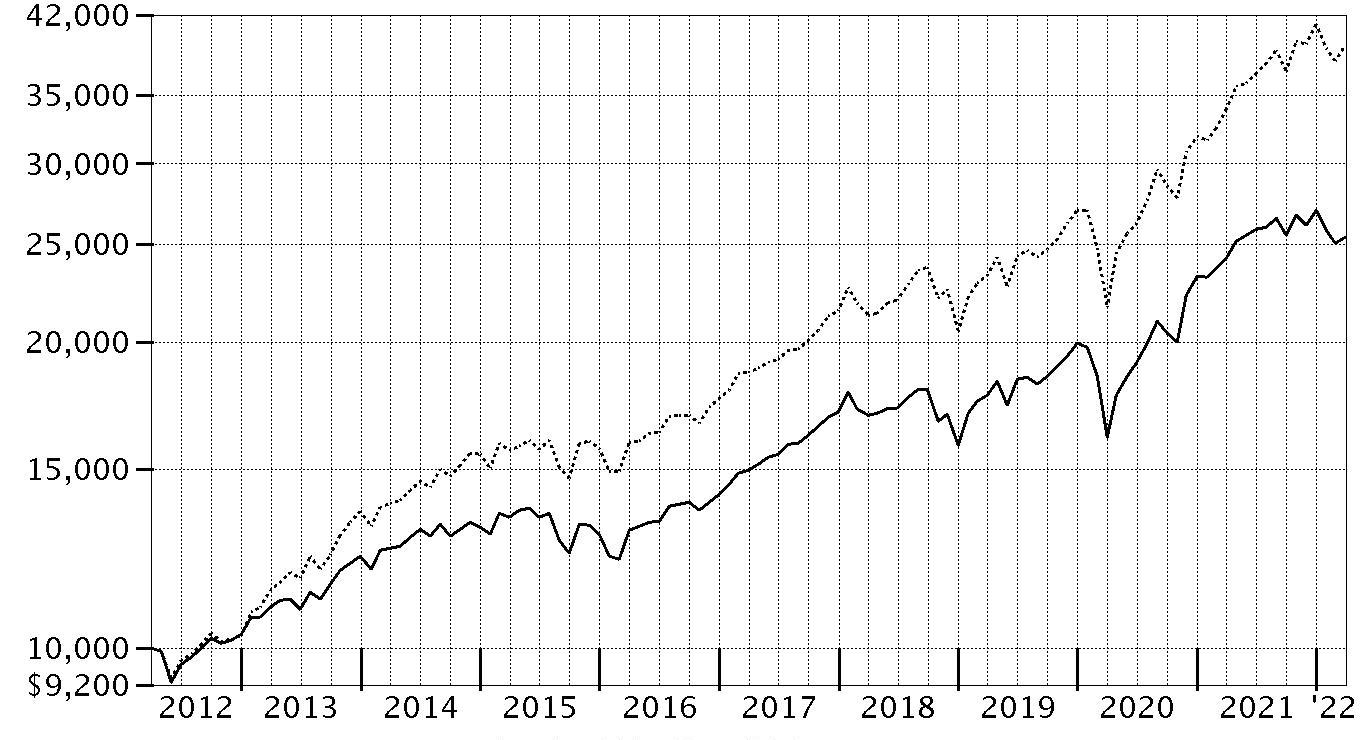
| Period Ending Values |
| $25,379 | Fidelity Freedom® Index 2050 Fund - Investor Class |
| $39,197 | S&P 500® Index |
Fidelity Freedom® Index 2055 Fund
Performance: The Bottom Line
Average annual total return reflects the change in the value of an investment, assuming reinvestment of distributions from dividend income and capital gains (the profits earned upon the sale of securities that have grown in value, if any) and assuming a constant rate of performance each year. The hypothetical investment and the average annual total returns do not reflect the deduction of taxes that a shareholder would pay on fund distributions or the redemption of fund shares. During periods of reimbursement by Fidelity, a fund’s total return will be greater than it would be had the reimbursement not occurred. How a fund did yesterday is no guarantee of how it will do tomorrow.
Average Annual Total Returns
| Periods ended March 31, 2022 | Past 1 year | Past 5 years | Past 10 years |
| Investor Class | 4.88% | 11.10% | 9.84% |
| Institutional Premium Class | 4.92% | 11.15% | 9.88% |
| Premier Class | 4.99% | 11.16% | 9.89% |
The initial offering of Institutional Premium Class took place on June 24, 2015. Returns prior to June 24, 2015 are those of Investor Class, the original class of the fund.
The initial offering of Premier Class took place on June 24, 2020. Returns between June 24, 2015 and June 24, 2020 are those of Institutional Premium Class. Returns prior to June 24, 2015 are those of Investor Class, the original class of the fund.
$10,000 Over 10 Years
Let's say hypothetically that $10,000 was invested in Fidelity Freedom® Index 2055 Fund - Investor Class on March 31, 2012.
The chart shows how the value of your investment would have changed, and also shows how the S&P 500® Index performed over the same period.

| Period Ending Values |
| $25,568 | Fidelity Freedom® Index 2055 Fund - Investor Class |
| $39,197 | S&P 500® Index |
Fidelity Freedom® Index 2060 Fund
Performance: The Bottom Line
Average annual total return reflects the change in the value of an investment, assuming reinvestment of distributions from dividend income and capital gains (the profits earned upon the sale of securities that have grown in value, if any) and assuming a constant rate of performance each year. The hypothetical investment and the average annual total returns do not reflect the deduction of taxes that a shareholder would pay on fund distributions or the redemption of fund shares. During periods of reimbursement by Fidelity, a fund’s total return will be greater than it would be had the reimbursement not occurred. How a fund did yesterday is no guarantee of how it will do tomorrow.
Average Annual Total Returns
| Periods ended March 31, 2022 | Past 1 year | Past 5 years | Life of PortfolioA |
| Investor Class | 4.87% | 11.11% | 9.32% |
| Institutional Premium Class | 4.96% | 11.15% | 9.37% |
| Premier Class | 4.91% | 11.16% | 9.38% |
A From August 5, 2014
The initial offering of Institutional Premium Class took place on June 24, 2015. Returns prior to June 24, 2015 are those of Investor Class, the original class of the fund.
The initial offering of Premier Class took place on June 24, 2020. Returns between June 24, 2015 and June 24, 2020 are those of Institutional Premium Class. Returns prior to June 24, 2015 are those of Investor Class, the original class of the fund.
$10,000 Over Life of Fund
Let's say hypothetically that $10,000 was invested in Fidelity Freedom® Index 2060 Fund - Investor Class on August 5, 2014, when the fund started.
The chart shows how the value of your investment would have changed, and also shows how the S&P 500® Index performed over the same period.
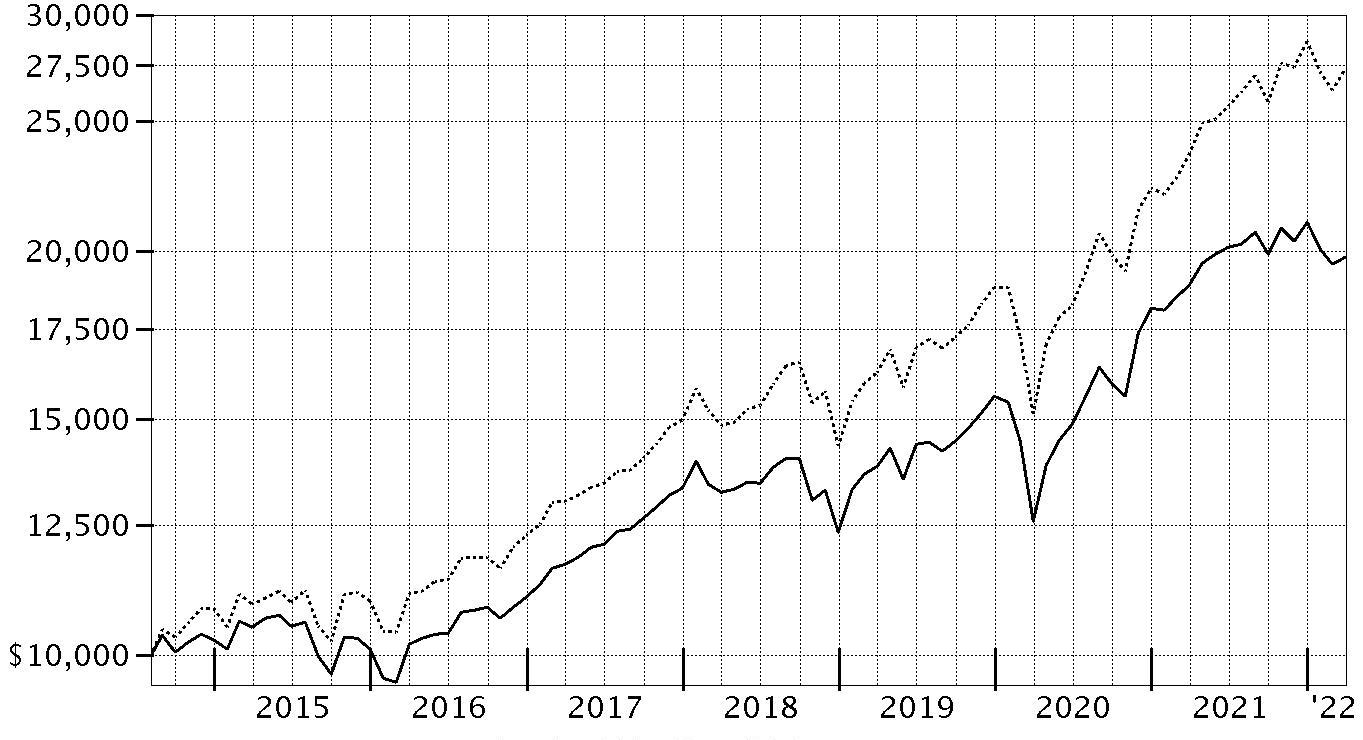
| Period Ending Values |
| $19,789 | Fidelity Freedom® Index 2060 Fund - Investor Class |
| $27,342 | S&P 500® Index |
Fidelity Freedom® Index 2065 Fund
Performance: The Bottom Line
Average annual total return reflects the change in the value of an investment, assuming reinvestment of distributions from dividend income and capital gains (the profits earned upon the sale of securities that have grown in value, if any) and assuming a constant rate of performance each year. The hypothetical investment and the average annual total returns do not reflect the deduction of taxes that a shareholder would pay on fund distributions or the redemption of fund shares. During periods of reimbursement by Fidelity, a fund’s total return will be greater than it would be had the reimbursement not occurred. How a fund did yesterday is no guarantee of how it will do tomorrow.
Average Annual Total Returns
| Periods ended March 31, 2022 | Past 1 year | Life of PortfolioA |
| Investor Class | 4.87% | 12.41% |
| Institutional Premium Class | 4.95% | 12.45% |
| Premier Class | 4.96% | 12.47% |
A From June 28, 2019
The initial offering of Premier Class took place on June 24, 2020. Returns prior to June 24, 2020 are those of Institutional Premium Class.
$10,000 Over Life of Fund
Let's say hypothetically that $10,000 was invested in Fidelity Freedom® Index 2065 Fund - Investor Class on June 28, 2019, when the fund started.
The chart shows how the value of your investment would have changed, and also shows how the S&P 500® Index performed over the same period.
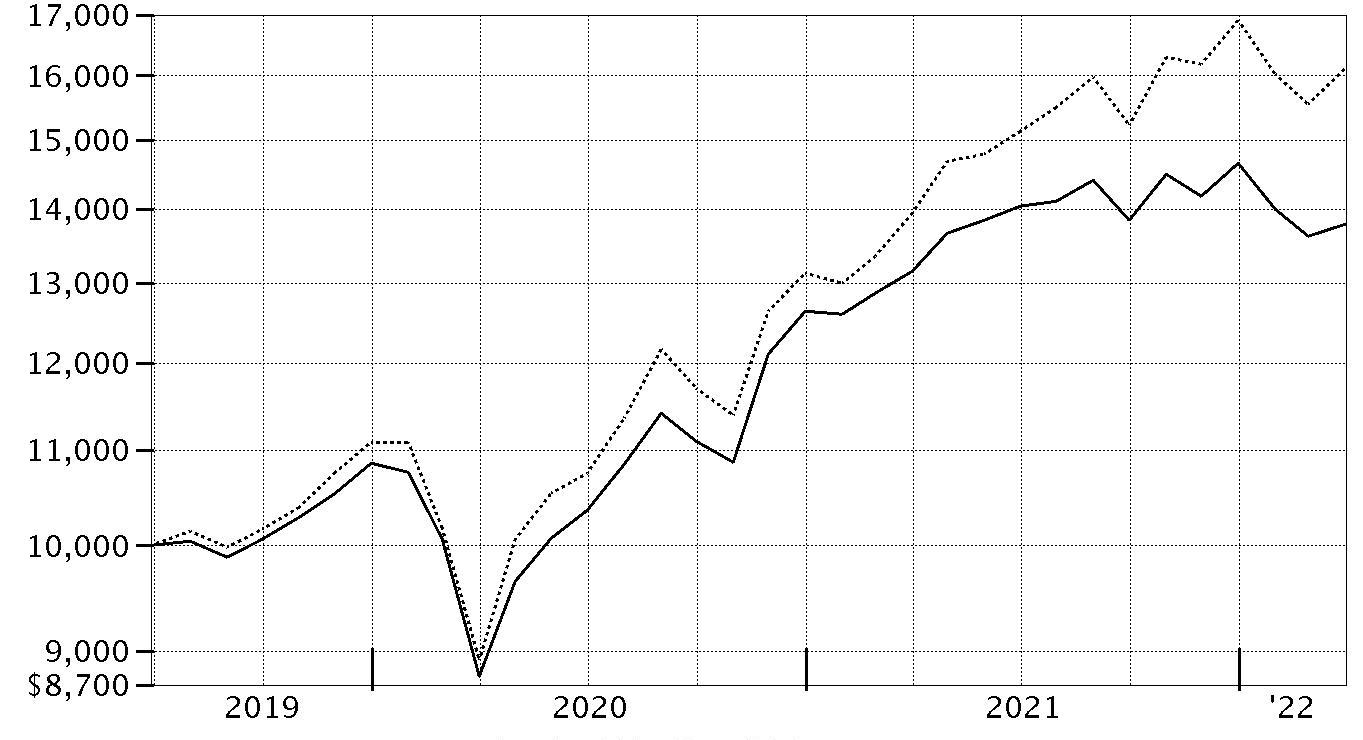
| Period Ending Values |
| $13,794 | Fidelity Freedom® Index 2065 Fund - Investor Class |
| $16,126 | S&P 500® Index |
Management's Discussion of Fund Performance
Market Recap: For the 12 months ending March 31, 2022, global financial markets were influenced by the reopening of businesses, an improved outlook for global economic growth, and fiscal and monetary stimulus. Strong corporate earnings growth amid ongoing midcycle economic expansion in several countries provided support for risk assets. However, as the calendar turned, investors grappled with soaring inflation, increasing bond yields, supply constraint and disruption, and Russia’s invasion of Ukraine, which led to surging commodity prices.
International equities returned -1.33% the past 12 months, according to the MSCI ACWI (All Country World Index) ex USA Index. By region, emerging markets (-11%) lagged most, followed by Japan (-6%). Conversely, Canada (+21%) topped the broader index by a wide margin. The U.K. (+15%), Asia Pacific ex Japan (+3%) and Europe ex U.K. (+1%) also outperformed. By sector, consumer discretionary (-21%) and communication services (-16%) fared worst. In contrast, energy (+24%) notably outperformed due to rising prices for oil and natural gas. Materials and financials each gained about 10%.
U.S. stocks gained 11.67% for the 12 months, as measured by the Dow Jones U.S. Total Stock Market Index. Among sectors, energy (+64%) led the way. Real estate (+20%), utilities (+19%) and information technology (+16%) also showed strength. In contrast, communication services (-3%) notably lagged. Small-cap stocks widely trailed larger-caps, while value outpaced growth, except among large-caps. Commodities rose 49.25%, per the Bloomberg Commodity Index Total Return.
U.S. taxable investment-grade bonds returned -4.15%, according to the Bloomberg U.S. Aggregate Bond Index, amid rising market interest rates and inflation. In December, the U.S. Federal Reserve said it was time to retire the term “transitory” in describing U.S. inflation and raised prospects for three quarter-point rate hikes in 2022. Corporate bonds (-4.16%) trailed U.S. Treasuries (-3.67%). Commercial mortgage-backed securities (-4.46%) and agencies (-3.94%) also lost ground. Outside the index, Treasury Inflation-Protected Securities (+4.29%) and leveraged loans (+3.38%) gained, but other non-core groups declined, such as emerging-markets debt (-6.18%) and U.S. corporate high-yield bonds (-0.30%).
Comments from Co-Portfolio Managers Andrew Dierdorf, Brett Sumsion and Finola McGuire Foley: For the fiscal year, the Investor Class shares of each Fidelity Freedom
® Index Fund posted a return ranging from -0.50% for Fidelity Freedom
® Index Income Fund to 4.90% for Fidelity Freedom
® Index 2040 Fund. Each Fund performed roughly in line with its Composite index the past 12 months. U.S. equities and non-U.S. equities were the best-performing asset classes this period, one that was marked by improved economic growth, coordinated monetary and fiscal response from the U.S. government, widespread COVID-19 vaccination, soaring inflation and Russia's late-February invasion of Ukraine. The Funds’ investment in Fidelity
® Series Total Market Index Fund, which invests in large- and small-cap stocks, as well as growth and value stocks, gained 11.68% the past 12 months, about in line with the benchmark Dow Jones U.S. Total Stock Market Index. Fidelity
® Series Global ex U.S. Index Fund, which invests in non-U.S. stocks, returned -2.29%, trailing the -1.33% result of the MSCI ACWI (All Country World Index) ex USA Index. Looking at other asset classes, most fixed-income and short-term securities notably lagged equities this period. The Bloomberg U.S. Aggregate Bond Index, a benchmark for investment-grade bonds, returned -4.15%, compared to -4.16% for our stake in Fidelity
® Series Bond Index Fund. Long-term U.S. Treasury bonds returned -1.42%, according to the Bloomberg U.S. Long-Term Treasury Bond Index. Comparatively, our position in Fidelity
® Series Long-Term Treasury Bond Index Fund returned -1.19%. U.S. intermediate-term inflation-protected securities and short-term securities returned 3.78% and -0.01%, respectively, as measured by the Bloomberg 1-10 TIPS Index and the Bloomberg 3-6 Month Treasury Bond Index. The Funds' investments in these two asset classes roughly kept pace with the benchmarks.
The views expressed above reflect those of the portfolio manager(s) only through the end of the period as stated on the cover of this report and do not necessarily represent the views of Fidelity or any other person in the Fidelity organization. Any such views are subject to change at any time based upon market or other conditions and Fidelity disclaims any responsibility to update such views. These views may not be relied on as investment advice and, because investment decisions for a Fidelity fund are based on numerous factors, may not be relied on as an indication of trading intent on behalf of any Fidelity fund.
Fidelity Freedom® Index Income Fund
Investment Summary (Unaudited)
The information in the following tables is based on the direct investments of the Fund.
Top Holdings as of March 31, 2022
| | % of fund's net assets |
| Fidelity Series Bond Index Fund | 43.6 |
| Fidelity Series 0-5 Year Inflation-Protected Bond Index Fund | 16.0 |
| Fidelity Series Treasury Bill Index Fund | 12.6 |
| Fidelity Series Total Market Index Fund | 11.3 |
| Fidelity Series Global ex U.S. Index Fund | 7.6 |
| Fidelity Series International Developed Markets Bond Index Fund | 3.9 |
| Fidelity Series Long-Term Treasury Bond Index Fund | 3.0 |
| Fidelity Series Inflation-Protected Bond Index Fund | 2.0 |
| Fidelity Cash Central Fund 0.31% | 0.0 |
| | 100.0 |
Asset Allocation (% of fund's net assets)
| Period end |
| | Domestic Equity Funds | 11.3% |
| | International Equity Funds | 7.6% |
| | Bond Funds | 50.5% |
| | Inflation-Protected Bond Funds | 18.0% |
| | Short-Term Funds | 12.6% |

Percentages shown as 0.0% may reflect amounts less than 0.05%.
Fidelity Freedom® Index Income Fund
Schedule of Investments March 31, 2022
Showing Percentage of Net Assets
| Domestic Equity Funds - 11.3% | | | |
| | | Shares | Value |
| Fidelity Series Total Market Index Fund (a) | | | |
| (Cost $108,020,816) | | 9,838,706 | 148,564,464 |
|
| International Equity Funds - 7.6% | | | |
| Fidelity Series Global ex U.S. Index Fund (a) | | | |
| (Cost $87,793,059) | | 7,039,996 | 99,615,937 |
|
| Bond Funds - 50.5% | | | |
| Fidelity Series Bond Index Fund (a) | | 58,632,925 | 572,843,672 |
| Fidelity Series International Developed Markets Bond Index Fund (a) | | 5,575,014 | 52,014,885 |
| Fidelity Series Long-Term Treasury Bond Index Fund (a) | | 5,104,785 | 38,898,464 |
| TOTAL BOND FUNDS | | | |
| (Cost $708,982,196) | | | 663,757,021 |
|
| Inflation-Protected Bond Funds - 18.0% | | | |
| Fidelity Series 0-5 Year Inflation-Protected Bond Index Fund (a) | | 20,900,564 | 209,632,662 |
| Fidelity Series Inflation-Protected Bond Index Fund (a) | | 2,635,135 | 26,746,625 |
| TOTAL INFLATION-PROTECTED BOND FUNDS | | | |
| (Cost $235,795,690) | | | 236,379,287 |
|
| Short-Term Funds - 12.6% | | | |
| Fidelity Cash Central Fund 0.31% (b) | | 18,033 | 18,037 |
| Fidelity Series Treasury Bill Index Fund (a) | | 16,552,724 | 165,361,708 |
| TOTAL SHORT-TERM FUNDS | | | |
| (Cost $165,520,445) | | | 165,379,745 |
| TOTAL INVESTMENT IN SECURITIES - 100.0% | | | |
| (Cost $1,306,112,206) | | | 1,313,696,454 |
| NET OTHER ASSETS (LIABILITIES) - 0.0% | | | (78,587) |
| NET ASSETS - 100% | | | $1,313,617,867 |
Legend
(a) Affiliated Fund
(b) Affiliated fund that is generally available only to investment companies and other accounts managed by Fidelity Investments. The rate quoted is the annualized seven-day yield of the fund at period end. A complete unaudited listing of the fund's holdings as of its most recent quarter end is available upon request. In addition, each Fidelity Central Fund's financial statements, which are not covered by the Fund's Report of Independent Registered Public Accounting Firm, are available on the SEC's website or upon request.
Affiliated Central Funds
Fiscal year to date information regarding the Fund's investments in Fidelity Central Funds, including the ownership percentage, is presented below.
| Fund | Value, beginning of period | Purchases | Sales Proceeds | Dividend Income | Realized Gain/Loss | Change in Unrealized appreciation (depreciation) | Value, end of period | % ownership, end of period |
| Fidelity Cash Central Fund 0.31% | $18,037 | $-- | $-- | $13 | $-- | $-- | $18,037 | 0.0% |
| Total | $18,037 | $-- | $-- | $13 | $-- | $-- | $18,037 | |
Amounts in the income column in the above table include any capital gain distributions from underlying funds, which are presented in the corresponding line-item in the Statement of Operations, if applicable.
Affiliated Underlying Funds
Fiscal year to date information regarding the Fund's investments in affiliated Underlying Funds is presented below. Exchanges between classes of the same affiliated Underlying Funds may occur. If an underlying Fund changes its name, the name presented below is the name in effect at period end.
| Affiliate | Value, beginning of period | Purchases(a) | Sales Proceeds(a) | Dividend Income | Realized Gain (loss) | Change in Unrealized appreciation (depreciation) | Value, end of period |
| Fidelity Series 0-5 Year Inflation-Protected Bond Index Fund | $-- | $216,658,048 | $6,444,024 | $755,456 | $(3,582) | $(465,308) | $209,632,662 |
| Fidelity Series Bond Index Fund | 453,434,102 | 238,829,766 | 83,039,458 | 8,515,209 | (1,068,859) | (35,311,879) | 572,843,672 |
| Fidelity Series Global ex U.S. Index Fund | 75,882,498 | 47,793,542 | 18,771,927 | 2,668,154 | 43,267 | (5,331,443) | 99,615,937 |
| Fidelity Series Inflation-Protected Bond Index Fund | 99,891,013 | 42,301,188 | 113,332,016 | 6,671,341 | 1,165,800 | (3,279,360) | 26,746,625 |
| Fidelity Series International Developed Markets Bond Index Fund | -- | 55,941,160 | 1,596,494 | 17,632 | (26,243) | (2,303,538) | 52,014,885 |
| Fidelity Series Long-Term Treasury Bond Index Fund | 29,412,044 | 18,199,712 | 6,482,405 | 836,405 | (403,884) | (1,827,003) | 38,898,464 |
| Fidelity Series Total Market Index Fund | 113,630,905 | 69,816,566 | 46,124,177 | 2,367,339 | 998,660 | 10,242,510 | 148,564,464 |
| Fidelity Series Treasury Bill Index Fund | 224,908,055 | 101,485,948 | 160,830,249 | 198,507 | (114,666) | (87,380) | 165,361,708 |
| Total | $997,158,617 | $791,025,930 | $436,620,750 | $22,030,043 | $590,493 | $(38,363,401) | $1,313,678,417 |
(a) Includes the value of shares purchased or redeemed through in-kind transactions, if applicable.
Amounts in the income column in the above table include any capital gain distributions from underlying funds, which are presented in the corresponding line-item in the Statement of Operations, if applicable.
Investment Valuation
The following is a summary of the inputs used, as of March 31, 2022, involving the Fund's assets and liabilities carried at fair value. The inputs or methodology used for valuing securities may not be an indication of the risk associated with investing in those securities. For more information on valuation inputs, and their aggregation into the levels used below, please refer to the Investment Valuation section in the accompanying Notes to Financial Statements.
| | Valuation Inputs at Reporting Date: |
| Description | Total | Level 1 | Level 2 | Level 3 |
| Investments in Securities: | | | | |
| Domestic Equity Funds | $148,564,464 | $148,564,464 | $-- | $-- |
| International Equity Funds | 99,615,937 | 99,615,937 | -- | -- |
| Bond Funds | 900,136,308 | 900,136,308 | -- | -- |
| Short-Term Funds | 165,379,745 | 165,379,745 | -- | -- |
| Total Investments in Securities: | $1,313,696,454 | $1,313,696,454 | $-- | $-- |
See accompanying notes which are an integral part of the financial statements.
Fidelity Freedom® Index Income Fund
Financial Statements
Statement of Assets and Liabilities
| | | March 31, 2022 |
| Assets | | |
Investment in securities, at value — See accompanying schedule:
| | |
| Fidelity Central Funds (cost $18,037) | $18,037 | |
| Other affiliated issuers (cost $1,306,094,169) | 1,313,678,417 | |
| Total Investment in Securities (cost $1,306,112,206) | | $1,313,696,454 |
| Cash | | 9,244 |
| Receivable for investments sold | | 39,376,798 |
| Receivable for fund shares sold | | 973,848 |
| Distributions receivable from Fidelity Central Funds | | 3 |
| Total assets | | 1,354,056,347 |
| Liabilities | | |
| Payable for investments purchased | $39,210,757 | |
| Payable for fund shares redeemed | 1,143,554 | |
| Accrued management fee | 84,169 | |
| Total liabilities | | 40,438,480 |
| Net Assets | | $1,313,617,867 |
| Net Assets consist of: | | |
| Paid in capital | | $1,307,604,205 |
| Total accumulated earnings (loss) | | 6,013,662 |
| Net Assets | | $1,313,617,867 |
| Net Asset Value and Maximum Offering Price | | |
| Investor Class: | | |
| Net Asset Value, offering price and redemption price per share ($219,578,930 ÷ 18,079,559 shares) | | $12.15 |
| Institutional Premium Class: | | |
| Net Asset Value, offering price and redemption price per share ($733,168,415 ÷ 60,462,180 shares) | | $12.13 |
| Premier Class: | | |
| Net Asset Value, offering price and redemption price per share ($360,870,522 ÷ 29,777,898 shares) | | $12.12 |
See accompanying notes which are an integral part of the financial statements.
Statement of Operations
| | | Year ended March 31, 2022 |
| Investment Income | | |
| Dividends: | | |
| Affiliated issuers | | $19,957,163 |
| Income from Fidelity Central Funds | | 13 |
| Total income | | 19,957,176 |
| Expenses | | |
| Management fee | $992,159 | |
| Independent trustees' fees and expenses | 3,383 | |
| Total expenses before reductions | 995,542 | |
| Expense reductions | (7) | |
| Total expenses after reductions | | 995,535 |
| Net investment income (loss) | | 18,961,641 |
| Realized and Unrealized Gain (Loss) | | |
| Net realized gain (loss) on: | | |
| Investment securities: | | |
| Affiliated issuers | 590,493 | |
| Capital gain distributions from underlying funds: | | |
| Affiliated issuers | 2,072,880 | |
| Total net realized gain (loss) | | 2,663,373 |
| Change in net unrealized appreciation (depreciation) on: | | |
| Investment securities: | | |
| Affiliated issuers | (38,363,401) | |
| Total change in net unrealized appreciation (depreciation) | | (38,363,401) |
| Net gain (loss) | | (35,700,028) |
| Net increase (decrease) in net assets resulting from operations | | $(16,738,387) |
See accompanying notes which are an integral part of the financial statements.
Statement of Changes in Net Assets
| | Year ended March 31, 2022 | Year ended March 31, 2021 |
| Increase (Decrease) in Net Assets | | |
| Operations | | |
| Net investment income (loss) | $18,961,641 | $9,369,233 |
| Net realized gain (loss) | 2,663,373 | 9,292,316 |
| Change in net unrealized appreciation (depreciation) | (38,363,401) | 42,768,794 |
| Net increase (decrease) in net assets resulting from operations | (16,738,387) | 61,430,343 |
| Distributions to shareholders | (25,494,060) | (17,384,777) |
| Share transactions - net increase (decrease) | 358,741,485 | 394,244,729 |
| Total increase (decrease) in net assets | 316,509,038 | 438,290,295 |
| Net Assets | | |
| Beginning of period | 997,108,829 | 558,818,534 |
| End of period | $1,313,617,867 | $997,108,829 |
See accompanying notes which are an integral part of the financial statements.
Financial Highlights
Fidelity Freedom Index Income Fund Investor Class
| Years ended March 31, | 2022 | 2021 | 2020 | 2019 | 2018 |
| Selected Per–Share Data | | | | | |
| Net asset value, beginning of period | $12.46 | $11.60 | $11.98 | $11.86 | $11.63 |
| Income from Investment Operations | | | | | |
| Net investment income (loss)A,B | .20 | .14 | .24 | .25 | .20 |
| Net realized and unrealized gain (loss) | (.25) | .98 | .23 | .22 | .27 |
| Total from investment operations | (.05) | 1.12 | .47 | .47 | .47 |
| Distributions from net investment income | (.18) | (.15) | (.24) | (.25) | (.19) |
| Distributions from net realized gain | (.08) | (.12) | (.62) | (.10) | (.04) |
| Total distributions | (.26) | (.26)C | (.85)C | (.35) | (.24)C |
| Net asset value, end of period | $12.15 | $12.46 | $11.60 | $11.98 | $11.86 |
| Total ReturnD | (.50)% | 9.72% | 3.83% | 4.09% | 4.02% |
| Ratios to Average Net AssetsB,E,F | | | | | |
| Expenses before reductions | .12% | .12% | .12% | .15% | .15% |
| Expenses net of fee waivers, if any | .12% | .12% | .12% | .12% | .12% |
| Expenses net of all reductions | .12% | .12% | .12% | .12% | .12% |
| Net investment income (loss) | 1.59% | 1.13% | 1.96% | 2.15% | 1.69% |
| Supplemental Data | | | | | |
| Net assets, end of period (000 omitted) | $219,579 | $469,552 | $282,522 | $167,641 | $126,634 |
| Portfolio turnover rateG | 38% | 33% | 67% | 51% | 17% |
A Calculated based on average shares outstanding during the period.
B Net investment income (loss) is affected by the timing of the declaration of dividends by any underlying mutual funds or exchange-traded funds (ETFs). Net investment income (loss) of any such underlying funds is not included in the Fund's net investment income (loss) ratio.
C Total distributions per share do not sum due to rounding.
D Total returns would have been lower if certain expenses had not been reduced during the applicable periods shown.
E Fees and expenses of any underlying mutual funds or exchange-traded funds (ETFs) are not included in the Fund's expense ratio. The Fund indirectly bears its proportionate share of these expenses. For additional expense information related to investments in Fidelity Central Funds, please refer to the "Investments in Fidelity Central Funds" note found in the Notes to Financial Statements section of the most recent Annual or Semi-Annual report.
F Expense ratios reflect operating expenses of the class. Expenses before reductions do not reflect amounts reimbursed, waived, or reduced through arrangements with the investment adviser, brokerage services, or other offset arrangements, if applicable, and do not represent the amount paid by the class during periods when reimbursements, waivers or reductions occur.
G Amount does not include the portfolio activity of any underlying mutual funds or exchange-traded funds (ETFs).
See accompanying notes which are an integral part of the financial statements.
Fidelity Freedom Index Income Fund Institutional Premium Class
| Years ended March 31, | 2022 | 2021 | 2020 | 2019 | 2018 |
| Selected Per–Share Data | | | | | |
| Net asset value, beginning of period | $12.44 | $11.59 | $11.96 | $11.84 | $11.61 |
| Income from Investment Operations | | | | | |
| Net investment income (loss)A,B | .21 | .14 | .24 | .26 | .21 |
| Net realized and unrealized gain (loss) | (.25) | .98 | .25 | .22 | .26 |
| Total from investment operations | (.04) | 1.12 | .49 | .48 | .47 |
| Distributions from net investment income | (.19) | (.15) | (.24) | (.26) | (.20) |
| Distributions from net realized gain | (.08) | (.12) | (.62) | (.10) | (.04) |
| Total distributions | (.27) | (.27) | (.86) | (.36) | (.24) |
| Net asset value, end of period | $12.13 | $12.44 | $11.59 | $11.96 | $11.84 |
| Total ReturnC | (.44)% | 9.68% | 3.98% | 4.16% | 4.07% |
| Ratios to Average Net AssetsB,D,E | | | | | |
| Expenses before reductions | .08% | .08% | .08% | .10% | .10% |
| Expenses net of fee waivers, if any | .08% | .08% | .08% | .06% | .07% |
| Expenses net of all reductions | .08% | .08% | .08% | .06% | .07% |
| Net investment income (loss) | 1.63% | 1.17% | 2.00% | 2.21% | 1.74% |
| Supplemental Data | | | | | |
| Net assets, end of period (000 omitted) | $733,168 | $410,094 | $276,297 | $185,706 | $163,733 |
| Portfolio turnover rateF | 38% | 33% | 67% | 51% | 17% |
A Calculated based on average shares outstanding during the period.
B Net investment income (loss) is affected by the timing of the declaration of dividends by any underlying mutual funds or exchange-traded funds (ETFs). Net investment income (loss) of any such underlying funds is not included in the Fund's net investment income (loss) ratio.
C Total returns would have been lower if certain expenses had not been reduced during the applicable periods shown.
D Fees and expenses of any underlying mutual funds or exchange-traded funds (ETFs) are not included in the Fund's expense ratio. The Fund indirectly bears its proportionate share of these expenses. For additional expense information related to investments in Fidelity Central Funds, please refer to the "Investments in Fidelity Central Funds" note found in the Notes to Financial Statements section of the most recent Annual or Semi-Annual report.
E Expense ratios reflect operating expenses of the class. Expenses before reductions do not reflect amounts reimbursed, waived, or reduced through arrangements with the investment adviser, brokerage services, or other offset arrangements, if applicable, and do not represent the amount paid by the class during periods when reimbursements, waivers or reductions occur.
F Amount does not include the portfolio activity of any underlying mutual funds or exchange-traded funds (ETFs).
See accompanying notes which are an integral part of the financial statements.
Fidelity Freedom Index Income Fund Premier Class
| Years ended March 31, | 2022 | 2021 A |
| Selected Per–Share Data | | |
| Net asset value, beginning of period | $12.43 | $12.07 |
| Income from Investment Operations | | |
| Net investment income (loss)B,C | .21 | .18 |
| Net realized and unrealized gain (loss) | (.25) | .38 |
| Total from investment operations | (.04) | .56 |
| Distributions from net investment income | (.19) | (.11) |
| Distributions from net realized gain | (.08) | (.09) |
| Total distributions | (.27) | (.20) |
| Net asset value, end of period | $12.12 | $12.43 |
| Total ReturnD,E | (.40)% | 4.59% |
| Ratios to Average Net AssetsC,F,G | | |
| Expenses before reductions | .06% | .06%H |
| Expenses net of fee waivers, if any | .06% | .06%H |
| Expenses net of all reductions | .06% | .06%H |
| Net investment income (loss) | 1.65% | 1.93%H |
| Supplemental Data | | |
| Net assets, end of period (000 omitted) | $360,871 | $117,463 |
| Portfolio turnover rateI | 38% | 33% |
A For the period June 24, 2020 (commencement of sale of shares) through March 31, 2021.
B Calculated based on average shares outstanding during the period.
C Net investment income (loss) is affected by the timing of the declaration of dividends by any underlying mutual funds or exchange-traded funds (ETFs). Net investment income (loss) of any such underlying funds is not included in the Fund's net investment income (loss) ratio.
D Total returns for periods of less than one year are not annualized.
E Total returns would have been lower if certain expenses had not been reduced during the applicable periods shown.
F Fees and expenses of any underlying mutual funds or exchange-traded funds (ETFs) are not included in the Fund's expense ratio. The Fund indirectly bears its proportionate share of these expenses. For additional expense information related to investments in Fidelity Central Funds, please refer to the "Investments in Fidelity Central Funds" note found in the Notes to Financial Statements section of the most recent Annual or Semi-Annual report.
G Expense ratios reflect operating expenses of the class. Expenses before reductions do not reflect amounts reimbursed, waived, or reduced through arrangements with the investment adviser, brokerage services, or other offset arrangements, if applicable, and do not represent the amount paid by the class during periods when reimbursements, waivers or reductions occur.
H Annualized
I Amount does not include the portfolio activity of any underlying mutual funds or exchange-traded funds (ETFs).
See accompanying notes which are an integral part of the financial statements.
Fidelity Freedom® Index 2005 Fund
Investment Summary (Unaudited)
The information in the following tables is based on the direct investments of the Fund.
Top Holdings as of March 31, 2022
| | % of fund's net assets |
| Fidelity Series Bond Index Fund | 42.6 |
| Fidelity Series 0-5 Year Inflation-Protected Bond Index Fund | 14.6 |
| Fidelity Series Total Market Index Fund | 12.8 |
| Fidelity Series Treasury Bill Index Fund | 11.8 |
| Fidelity Series Global ex U.S. Index Fund | 8.6 |
| Fidelity Series International Developed Markets Bond Index Fund | 4.0 |
| Fidelity Series Long-Term Treasury Bond Index Fund | 3.0 |
| Fidelity Series Inflation-Protected Bond Index Fund | 2.0 |
| Fidelity Series 5+ Year Inflation-Protected Bond Index Fund | 0.6 |
| Fidelity Cash Central Fund 0.31% | 0.0 |
| | 100.0 |
Asset Allocation (% of fund's net assets)
| Period end |
| | Domestic Equity Funds | 12.8% |
| | International Equity Funds | 8.6% |
| | Bond Funds | 49.6% |
| | Inflation-Protected Bond Funds | 17.2% |
| | Short-Term Funds | 11.8% |

Percentages shown as 0.0% may reflect amounts less than 0.05%.
Fidelity Freedom® Index 2005 Fund
Schedule of Investments March 31, 2022
Showing Percentage of Net Assets
| Domestic Equity Funds - 12.8% | | | |
| | | Shares | Value |
| Fidelity Series Total Market Index Fund (a) | | | |
| (Cost $20,988,354) | | 2,173,409 | 32,818,469 |
|
| International Equity Funds - 8.6% | | | |
| Fidelity Series Global ex U.S. Index Fund (a) | | | |
| (Cost $17,208,153) | | 1,553,596 | 21,983,382 |
|
| Bond Funds - 49.6% | | | |
| Fidelity Series Bond Index Fund (a) | | 11,149,106 | 108,926,772 |
| Fidelity Series International Developed Markets Bond Index Fund (a) | | 1,088,125 | 10,152,210 |
| Fidelity Series Long-Term Treasury Bond Index Fund (a) | | 1,017,343 | 7,752,153 |
| TOTAL BOND FUNDS | | | |
| (Cost $133,829,586) | | | 126,831,135 |
|
| Inflation-Protected Bond Funds - 17.2% | | | |
| Fidelity Series 0-5 Year Inflation-Protected Bond Index Fund (a) | | 3,730,353 | 37,415,441 |
| Fidelity Series 5+ Year Inflation-Protected Bond Index Fund (a) | | 153,826 | 1,476,725 |
| Fidelity Series Inflation-Protected Bond Index Fund (a) | | 490,728 | 4,980,894 |
| TOTAL INFLATION-PROTECTED BOND FUNDS | | | |
| (Cost $43,774,225) | | | 43,873,060 |
|
| Short-Term Funds - 11.8% | | | |
| Fidelity Cash Central Fund 0.31% (b) | | 9,878 | 9,880 |
| Fidelity Series Treasury Bill Index Fund (a) | | 3,023,049 | 30,200,260 |
| TOTAL SHORT-TERM FUNDS | | | |
| (Cost $30,234,417) | | | 30,210,140 |
| TOTAL INVESTMENT IN SECURITIES - 100.0% | | | |
| (Cost $246,034,735) | | | 255,716,186 |
| NET OTHER ASSETS (LIABILITIES) - 0.0% | | | (17,474) |
| NET ASSETS - 100% | | | $255,698,712 |
Legend
(a) Affiliated Fund
(b) Affiliated fund that is generally available only to investment companies and other accounts managed by Fidelity Investments. The rate quoted is the annualized seven-day yield of the fund at period end. A complete unaudited listing of the fund's holdings as of its most recent quarter end is available upon request. In addition, each Fidelity Central Fund's financial statements, which are not covered by the Fund's Report of Independent Registered Public Accounting Firm, are available on the SEC's website or upon request.
Affiliated Central Funds
Fiscal year to date information regarding the Fund's investments in Fidelity Central Funds, including the ownership percentage, is presented below.
| Fund | Value, beginning of period | Purchases | Sales Proceeds | Dividend Income | Realized Gain/Loss | Change in Unrealized appreciation (depreciation) | Value, end of period | % ownership, end of period |
| Fidelity Cash Central Fund 0.31% | $9,880 | $-- | $-- | $7 | $-- | $-- | $9,880 | 0.0% |
| Total | $9,880 | $-- | $-- | $7 | $-- | $-- | $9,880 | |
Amounts in the income column in the above table include any capital gain distributions from underlying funds, which are presented in the corresponding line-item in the Statement of Operations, if applicable.
Affiliated Underlying Funds
Fiscal year to date information regarding the Fund's investments in affiliated Underlying Funds is presented below. Exchanges between classes of the same affiliated Underlying Funds may occur. If an underlying Fund changes its name, the name presented below is the name in effect at period end.
| Affiliate | Value, beginning of period | Purchases(a) | Sales Proceeds(a) | Dividend Income | Realized Gain (loss) | Change in Unrealized appreciation (depreciation) | Value, end of period |
| Fidelity Series 0-5 Year Inflation-Protected Bond Index Fund | $-- | $39,936,580 | $2,425,708 | $ 134,039 | $(3,535) | $(71,932) | $37,415,441 |
| Fidelity Series 5+ Year Inflation-Protected Bond Index Fund | -- | 1,656,074 | 124,978 | 8,100 | (911) | (53,460) | 1,476,725 |
| Fidelity Series Bond Index Fund | 111,881,319 | 31,053,177 | 27,518,589 | 1,847,866 | (289,827) | (6,199,308) | 108,926,772 |
| Fidelity Series Global ex U.S. Index Fund | 23,776,047 | 7,130,667 | 7,911,816 | 616,361 | 364,935 | (1,376,451) | 21,983,382 |
| Fidelity Series Inflation-Protected Bond Index Fund | 23,458,328 | 5,715,040 | 24,014,354 | 1,239,491 | 883,290 | (1,061,410) | 4,980,894 |
| Fidelity Series International Developed Markets Bond Index Fund | -- | 11,268,274 | 670,988 | 3,524 | (8,243) | (436,833) | 10,152,210 |
| Fidelity Series Long-Term Treasury Bond Index Fund | 7,549,602 | 2,518,237 | 2,052,369 | 192,100 | (91,440) | (171,877) | 7,752,153 |
| Fidelity Series Total Market Index Fund | 35,605,345 | 9,699,897 | 16,197,183 | 580,022 | 2,381,010 | 1,329,400 | 32,818,469 |
| Fidelity Series Treasury Bill Index Fund | 51,962,647 | 13,119,711 | 34,845,849 | 39,353 | (22,109) | (14,140) | 30,200,260 |
| Total | $254,233,288 | $122,097,657 | $ 115,761,834 | $ 4,660,856 | $ 3,213,170 | $(8,056,011) | $255,706,306 |
(a) Includes the value of shares purchased or redeemed through in-kind transactions, if applicable.
Amounts in the income column in the above table include any capital gain distributions from underlying funds, which are presented in the corresponding line-item in the Statement of Operations, if applicable.
Investment Valuation
The following is a summary of the inputs used, as of March 31, 2022, involving the Fund's assets and liabilities carried at fair value. The inputs or methodology used for valuing securities may not be an indication of the risk associated with investing in those securities. For more information on valuation inputs, and their aggregation into the levels used below, please refer to the Investment Valuation section in the accompanying Notes to Financial Statements.
| | Valuation Inputs at Reporting Date: |
| Description | Total | Level 1 | Level 2 | Level 3 |
| Investments in Securities: | | | | |
| Domestic Equity Funds | $32,818,469 | $32,818,469 | $-- | $-- |
| International Equity Funds | 21,983,382 | 21,983,382 | -- | -- |
| Bond Funds | 170,704,195 | 170,704,195 | -- | -- |
| Short-Term Funds | 30,210,140 | 30,210,140 | -- | -- |
| Total Investments in Securities: | $255,716,186 | $255,716,186 | $-- | $-- |
See accompanying notes which are an integral part of the financial statements.
Fidelity Freedom® Index 2005 Fund
Financial Statements
Statement of Assets and Liabilities
| | | March 31, 2022 |
| Assets | | |
Investment in securities, at value — See accompanying schedule:
| | |
| Fidelity Central Funds (cost $9,880) | $9,880 | |
| Other affiliated issuers (cost $246,024,855) | 255,706,306 | |
| Total Investment in Securities (cost $246,034,735) | | $255,716,186 |
| Cash | | 522 |
| Receivable for investments sold | | 7,833,662 |
| Receivable for fund shares sold | | 194,598 |
| Distributions receivable from Fidelity Central Funds | | 2 |
| Total assets | | 263,744,970 |
| Liabilities | | |
| Payable for investments purchased | $7,756,487 | |
| Payable for fund shares redeemed | 272,497 | |
| Accrued management fee | 17,274 | |
| Total liabilities | | 8,046,258 |
| Net Assets | | $255,698,712 |
| Net Assets consist of: | | |
| Paid in capital | | $244,650,668 |
| Total accumulated earnings (loss) | | 11,048,044 |
| Net Assets | | $255,698,712 |
| Net Asset Value and Maximum Offering Price | | |
| Investor Class: | | |
| Net Asset Value, offering price and redemption price per share ($54,327,794 ÷ 4,060,660 shares) | | $13.38 |
| Institutional Premium Class: | | |
| Net Asset Value, offering price and redemption price per share ($179,853,571 ÷ 13,447,195 shares) | | $13.37 |
| Premier Class: | | |
| Net Asset Value, offering price and redemption price per share ($21,517,347 ÷ 1,609,353 shares) | | $13.37 |
See accompanying notes which are an integral part of the financial statements.
Statement of Operations
| | | Year ended March 31, 2022 |
| Investment Income | | |
| Dividends: | | |
| Affiliated issuers | | $4,230,665 |
| Income from Fidelity Central Funds | | 7 |
| Total income | | 4,230,672 |
| Expenses | | |
| Management fee | $234,230 | |
| Independent trustees' fees and expenses | 791 | |
| Total expenses | | 235,021 |
| Net investment income (loss) | | 3,995,651 |
| Realized and Unrealized Gain (Loss) | | |
| Net realized gain (loss) on: | | |
| Investment securities: | | |
| Affiliated issuers | 3,213,170 | |
| Capital gain distributions from underlying funds: | | |
| Affiliated issuers | 430,191 | |
| Total net realized gain (loss) | | 3,643,361 |
| Change in net unrealized appreciation (depreciation) on: | | |
| Investment securities: | | |
| Affiliated issuers | (8,056,011) | |
| Total change in net unrealized appreciation (depreciation) | | (8,056,011) |
| Net gain (loss) | | (4,412,650) |
| Net increase (decrease) in net assets resulting from operations | | $(416,999) |
See accompanying notes which are an integral part of the financial statements.
Statement of Changes in Net Assets
| | Year ended March 31, 2022 | Year ended March 31, 2021 |
| Increase (Decrease) in Net Assets | | |
| Operations | | |
| Net investment income (loss) | $3,995,651 | $2,728,922 |
| Net realized gain (loss) | 3,643,361 | 3,654,797 |
| Change in net unrealized appreciation (depreciation) | (8,056,011) | 17,566,345 |
| Net increase (decrease) in net assets resulting from operations | (416,999) | 23,950,064 |
| Distributions to shareholders | (7,824,187) | (5,459,492) |
| Share transactions - net increase (decrease) | 9,716,577 | 58,980,322 |
| Total increase (decrease) in net assets | 1,475,391 | 77,470,894 |
| Net Assets | | |
| Beginning of period | 254,223,321 | 176,752,427 |
| End of period | $255,698,712 | $254,223,321 |
See accompanying notes which are an integral part of the financial statements.
Financial Highlights
Fidelity Freedom Index 2005 Fund Investor Class
| Years ended March 31, | 2022 | 2021 | 2020 | 2019 | 2018 |
| Selected Per–Share Data | | | | | |
| Net asset value, beginning of period | $13.80 | $12.58 | $13.50 | $13.36 | $12.94 |
| Income from Investment Operations | | | | | |
| Net investment income (loss)A,B | .21 | .16 | .27 | .29 | .23 |
| Net realized and unrealized gain (loss) | (.22) | 1.39 | .17 | .26 | .47 |
| Total from investment operations | (.01) | 1.55 | .44 | .55 | .70 |
| Distributions from net investment income | (.20) | (.17) | (.26) | (.26) | (.21) |
| Distributions from net realized gain | (.21) | (.16) | (1.10) | (.14) | (.07) |
| Total distributions | (.41) | (.33) | (1.36) | (.41)C | (.28) |
| Net asset value, end of period | $13.38 | $13.80 | $12.58 | $13.50 | $13.36 |
| Total ReturnD | (.20)% | 12.35% | 2.91% | 4.25% | 5.41% |
| Ratios to Average Net AssetsB,E,F | | | | | |
| Expenses before reductions | .12% | .12% | .12% | .15% | .15% |
| Expenses net of fee waivers, if any | .12% | .12% | .12% | .12% | .12% |
| Expenses net of all reductions | .12% | .12% | .12% | .12% | .12% |
| Net investment income (loss) | 1.49% | 1.21% | 1.96% | 2.16% | 1.74% |
| Supplemental Data | | | | | |
| Net assets, end of period (000 omitted) | $54,328 | $140,539 | $93,765 | $66,875 | $60,299 |
| Portfolio turnover rateG | 44% | 33% | 83% | 52% | 26% |
A Calculated based on average shares outstanding during the period.
B Net investment income (loss) is affected by the timing of the declaration of dividends by any underlying mutual funds or exchange-traded funds (ETFs). Net investment income (loss) of any such underlying funds is not included in the Fund's net investment income (loss) ratio.
C Total distributions per share do not sum due to rounding.
D Total returns would have been lower if certain expenses had not been reduced during the applicable periods shown.
E Fees and expenses of any underlying mutual funds or exchange-traded funds (ETFs) are not included in the Fund's expense ratio. The Fund indirectly bears its proportionate share of these expenses. For additional expense information related to investments in Fidelity Central Funds, please refer to the "Investments in Fidelity Central Funds" note found in the Notes to Financial Statements section of the most recent Annual or Semi-Annual report.
F Expense ratios reflect operating expenses of the class. Expenses before reductions do not reflect amounts reimbursed, waived, or reduced through arrangements with the investment adviser, brokerage services, or other offset arrangements, if applicable, and do not represent the amount paid by the class during periods when reimbursements, waivers or reductions occur.
G Amount does not include the portfolio activity of any underlying mutual funds or exchange-traded funds (ETFs).
See accompanying notes which are an integral part of the financial statements.
Fidelity Freedom Index 2005 Fund Institutional Premium Class
| Years ended March 31, | 2022 | 2021 | 2020 | 2019 | 2018 |
| Selected Per–Share Data | | | | | |
| Net asset value, beginning of period | $13.81 | $12.58 | $13.50 | $13.36 | $12.94 |
| Income from Investment Operations | | | | | |
| Net investment income (loss)A,B | .21 | .17 | .27 | .30 | .24 |
| Net realized and unrealized gain (loss) | (.23) | 1.39 | .17 | .25 | .46 |
| Total from investment operations | (.02) | 1.56 | .44 | .55 | .70 |
| Distributions from net investment income | (.21) | (.18) | (.27) | (.27) | (.22) |
| Distributions from net realized gain | (.21) | (.16) | (1.10) | (.14) | (.07) |
| Total distributions | (.42) | (.33)C | (1.36)C | (.41) | (.28)C |
| Net asset value, end of period | $13.37 | $13.81 | $12.58 | $13.50 | $13.36 |
| Total ReturnD | (.25)% | 12.46% | 2.95% | 4.31% | 5.45% |
| Ratios to Average Net AssetsB,E,F | | | | | |
| Expenses before reductions | .08% | .08% | .08% | .10% | .10% |
| Expenses net of fee waivers, if any | .08% | .08% | .08% | .06% | .07% |
| Expenses net of all reductions | .08% | .08% | .08% | .06% | .07% |
| Net investment income (loss) | 1.53% | 1.25% | 2.00% | 2.22% | 1.79% |
| Supplemental Data | | | | | |
| Net assets, end of period (000 omitted) | $179,854 | $105,990 | $82,988 | $63,956 | $52,913 |
| Portfolio turnover rateG | 44% | 33% | 83% | 52% | 26% |
A Calculated based on average shares outstanding during the period.
B Net investment income (loss) is affected by the timing of the declaration of dividends by any underlying mutual funds or exchange-traded funds (ETFs). Net investment income (loss) of any such underlying funds is not included in the Fund's net investment income (loss) ratio.
C Total distributions per share do not sum due to rounding.
D Total returns would have been lower if certain expenses had not been reduced during the applicable periods shown.
E Fees and expenses of any underlying mutual funds or exchange-traded funds (ETFs) are not included in the Fund's expense ratio. The Fund indirectly bears its proportionate share of these expenses. For additional expense information related to investments in Fidelity Central Funds, please refer to the "Investments in Fidelity Central Funds" note found in the Notes to Financial Statements section of the most recent Annual or Semi-Annual report.
F Expense ratios reflect operating expenses of the class. Expenses before reductions do not reflect amounts reimbursed, waived, or reduced through arrangements with the investment adviser, brokerage services, or other offset arrangements, if applicable, and do not represent the amount paid by the class during periods when reimbursements, waivers or reductions occur.
G Amount does not include the portfolio activity of any underlying mutual funds or exchange-traded funds (ETFs).
See accompanying notes which are an integral part of the financial statements.
Fidelity Freedom Index 2005 Fund Premier Class
| Years ended March 31, | 2022 | 2021 A |
| Selected Per–Share Data | | |
| Net asset value, beginning of period | $13.80 | $13.24 |
| Income from Investment Operations | | |
| Net investment income (loss)B,C | .22 | .03 |
| Net realized and unrealized gain (loss) | (.23) | .79 |
| Total from investment operations | (.01) | .82 |
| Distributions from net investment income | (.22) | (.14) |
| Distributions from net realized gain | (.21) | (.12) |
| Total distributions | (.42)D | (.26) |
| Net asset value, end of period | $13.37 | $13.80 |
| Total ReturnE,F | (.15)% | 6.16% |
| Ratios to Average Net AssetsC,G,H | | |
| Expenses before reductions | .06% | .06%I |
| Expenses net of fee waivers, if any | .06% | .06%I |
| Expenses net of all reductions | .06% | .06%I |
| Net investment income (loss) | 1.55% | .32%I |
| Supplemental Data | | |
| Net assets, end of period (000 omitted) | $21,517 | $7,695 |
| Portfolio turnover rateJ | 44% | 33% |
A For the period June 24, 2020 (commencement of sale of shares) through March 31, 2021.
B Calculated based on average shares outstanding during the period.
C Net investment income (loss) is affected by the timing of the declaration of dividends by any underlying mutual funds or exchange-traded funds (ETFs). Net investment income (loss) of any such underlying funds is not included in the Fund's net investment income (loss) ratio.
D Total distributions per share do not sum due to rounding.
E Total returns for periods of less than one year are not annualized.
F Total returns would have been lower if certain expenses had not been reduced during the applicable periods shown.
G Fees and expenses of any underlying mutual funds or exchange-traded funds (ETFs) are not included in the Fund's expense ratio. The Fund indirectly bears its proportionate share of these expenses. For additional expense information related to investments in Fidelity Central Funds, please refer to the "Investments in Fidelity Central Funds" note found in the Notes to Financial Statements section of the most recent Annual or Semi-Annual report.
H Expense ratios reflect operating expenses of the class. Expenses before reductions do not reflect amounts reimbursed, waived, or reduced through arrangements with the investment adviser, brokerage services, or other offset arrangements, if applicable, and do not represent the amount paid by the class during periods when reimbursements, waivers or reductions occur.
I Annualized
J Amount does not include the portfolio activity of any underlying mutual funds or exchange-traded funds (ETFs).
See accompanying notes which are an integral part of the financial statements.
Fidelity Freedom® Index 2010 Fund
Investment Summary (Unaudited)
The information in the following tables is based on the direct investments of the Fund.
Top Holdings as of March 31, 2022
| | % of fund's net assets |
| Fidelity Series Bond Index Fund | 39.1 |
| Fidelity Series Total Market Index Fund | 18.2 |
| Fidelity Series Global ex U.S. Index Fund | 12.2 |
| Fidelity Series 0-5 Year Inflation-Protected Bond Index Fund | 10.1 |
| Fidelity Series Treasury Bill Index Fund | 8.8 |
| Fidelity Series International Developed Markets Bond Index Fund | 4.0 |
| Fidelity Series Long-Term Treasury Bond Index Fund | 3.2 |
| Fidelity Series 5+ Year Inflation-Protected Bond Index Fund | 2.7 |
| Fidelity Series Inflation-Protected Bond Index Fund | 1.7 |
| | 100.0 |
Asset Allocation (% of fund's net assets)
| Period end |
| | Domestic Equity Funds | 18.2% |
| | International Equity Funds | 12.2% |
| | Bond Funds | 46.3% |
| | Inflation-Protected Bond Funds | 14.5% |
| | Short-Term Funds | 8.8% |

Fidelity Freedom® Index 2010 Fund
Schedule of Investments March 31, 2022
Showing Percentage of Net Assets
| Domestic Equity Funds - 18.2% | | | |
| | | Shares | Value |
| Fidelity Series Total Market Index Fund (a) | | | |
| (Cost $98,175,151) | | 10,073,176 | 152,104,957 |
|
| International Equity Funds - 12.2% | | | |
| Fidelity Series Global ex U.S. Index Fund (a) | | | |
| (Cost $76,338,384) | | 7,201,926 | 101,907,247 |
|
| Bond Funds - 46.3% | | | |
| Fidelity Series Bond Index Fund (a) | | 33,480,827 | 327,107,682 |
| Fidelity Series International Developed Markets Bond Index Fund (a) | | 3,564,765 | 33,259,262 |
| Fidelity Series Long-Term Treasury Bond Index Fund (a) | | 3,542,802 | 26,996,149 |
| TOTAL BOND FUNDS | | | |
| (Cost $405,680,703) | | | 387,363,093 |
|
| Inflation-Protected Bond Funds - 14.5% | | | |
| Fidelity Series 0-5 Year Inflation-Protected Bond Index Fund (a) | | 8,466,545 | 84,919,448 |
| Fidelity Series 5+ Year Inflation-Protected Bond Index Fund (a) | | 2,331,902 | 22,386,259 |
| Fidelity Series Inflation-Protected Bond Index Fund (a) | | 1,361,450 | 13,818,714 |
| TOTAL INFLATION-PROTECTED BOND FUNDS | | | |
| (Cost $121,397,662) | | | 121,124,421 |
|
| Short-Term Funds - 8.8% | | | |
| Fidelity Series Treasury Bill Index Fund (a) | | | |
| (Cost $74,099,624) | | 7,411,655 | 74,042,431 |
| TOTAL INVESTMENT IN SECURITIES - 100.0% | | | |
| (Cost $775,691,524) | | | 836,542,149 |
| NET OTHER ASSETS (LIABILITIES) - 0.0% | | | (53,136) |
| NET ASSETS - 100% | | | $836,489,013 |
Legend
(a) Affiliated Fund
Affiliated Central Funds
Fiscal year to date information regarding the Fund's investments in Fidelity Central Funds, including the ownership percentage, is presented below.
| Fund | Value, beginning of period | Purchases | Sales Proceeds | Dividend Income | Realized Gain/Loss | Change in Unrealized appreciation (depreciation) | Value, end of period | % ownership, end of period |
| Fidelity Cash Central Fund 0.31% | $5,947 | $-- | $5,947 | $3 | $-- | $-- | $-- | 0.0% |
| Total | $5,947 | $-- | $5,947 | $3 | $-- | $-- | $-- | |
Amounts in the income column in the above table include any capital gain distributions from underlying funds, which are presented in the corresponding line-item in the Statement of Operations, if applicable.
Affiliated Underlying Funds
Fiscal year to date information regarding the Fund's investments in affiliated Underlying Funds is presented below. Exchanges between classes of the same affiliated Underlying Funds may occur. If an underlying Fund changes its name, the name presented below is the name in effect at period end.
| Affiliate | Value, beginning of period | Purchases(a) | Sales Proceeds(a) | Dividend Income | Realized Gain (loss) | Change in Unrealized appreciation (depreciation) | Value, end of period |
| Fidelity Series 0-5 Year Inflation-Protected Bond Index Fund | $-- | $89,649,947 | $4,529,949 | $310,583 | $3,098 | $(157,409) | $84,919,448 |
| Fidelity Series 5+ Year Inflation-Protected Bond Index Fund | -- | 24,486,319 | 1,299,811 | 111,019 | (9,998) | (790,251) | 22,386,259 |
| Fidelity Series Bond Index Fund | 354,630,504 | 72,658,953 | 80,124,335 | 5,801,274 | (1,685,160) | (18,372,280) | 327,107,682 |
| Fidelity Series Global ex U.S. Index Fund | 113,532,428 | 26,234,403 | 32,946,112 | 2,931,436 | 1,371,259 | (6,284,731) | 101,907,247 |
| Fidelity Series Inflation-Protected Bond Index Fund | 67,332,050 | 13,627,310 | 66,671,686 | 3,531,478 | 2,890,155 | (3,359,115) | 13,818,714 |
| Fidelity Series International Developed Markets Bond Index Fund | -- | 36,583,680 | 1,835,092 | 11,760 | (24,514) | (1,464,812) | 33,259,262 |
| Fidelity Series Long-Term Treasury Bond Index Fund | 26,011,511 | 7,640,876 | 5,651,496 | 664,367 | (407,347) | (597,395) | 26,996,149 |
| Fidelity Series Total Market Index Fund | 169,980,797 | 36,314,540 | 71,726,226 | 2,764,973 | 12,324,662 | 5,211,184 | 152,104,957 |
| Fidelity Series Treasury Bill Index Fund | 142,587,634 | 27,899,038 | 96,351,360 | 104,005 | (52,645) | (40,236) | 74,042,431 |
| | $874,074,924 | $335,095,066 | $361,136,067 | $16,230,895 | $14,409,510 | $(25,855,045) | $836,542,149 |
(a) Includes the value of shares purchased or redeemed through in-kind transactions, if applicable.
Amounts in the income column in the above table include any capital gain distributions from underlying funds, which are presented in the corresponding line-item in the Statement of Operations, if applicable.
Investment Valuation
The following is a summary of the inputs used, as of March 31, 2022, involving the Fund's assets and liabilities carried at fair value. The inputs or methodology used for valuing securities may not be an indication of the risk associated with investing in those securities. For more information on valuation inputs, and their aggregation into the levels used below, please refer to the Investment Valuation section in the accompanying Notes to Financial Statements.
| | Valuation Inputs at Reporting Date: |
| Description | Total | Level 1 | Level 2 | Level 3 |
| Investments in Securities: | | | | |
| Domestic Equity Funds | $152,104,957 | $152,104,957 | $-- | $-- |
| International Equity Funds | 101,907,247 | 101,907,247 | -- | -- |
| Bond Funds | 508,487,514 | 508,487,514 | -- | -- |
| Short-Term Funds | 74,042,431 | 74,042,431 | -- | -- |
| Total Investments in Securities: | $836,542,149 | $836,542,149 | $-- | $-- |
See accompanying notes which are an integral part of the financial statements.
Fidelity Freedom® Index 2010 Fund
Financial Statements
Statement of Assets and Liabilities
| | | March 31, 2022 |
| Assets | | |
Investment in securities, at value — See accompanying schedule:
| | |
| Affiliated issuers (cost $775,691,524) | $836,542,149 | |
| Total Investment in Securities (cost $775,691,524) | | $836,542,149 |
| Cash | | 6,385 |
| Receivable for investments sold | | 24,566,516 |
| Receivable for fund shares sold | | 524,032 |
| Total assets | | 861,639,082 |
| Liabilities | | |
| Payable for investments purchased | $24,007,964 | |
| Payable for fund shares redeemed | 1,085,045 | |
| Accrued management fee | 57,060 | |
| Total liabilities | | 25,150,069 |
| Net Assets | | $836,489,013 |
| Net Assets consist of: | | |
| Paid in capital | | $770,383,386 |
| Total accumulated earnings (loss) | | 66,105,627 |
| Net Assets | | $836,489,013 |
| Net Asset Value and Maximum Offering Price | | |
| Investor Class: | | |
| Net Asset Value, offering price and redemption price per share ($222,428,521 ÷ 16,341,936 shares) | | $13.61 |
| Institutional Premium Class: | | |
| Net Asset Value, offering price and redemption price per share ($567,760,145 ÷ 41,725,967 shares) | | $13.61 |
| Premier Class: | | |
| Net Asset Value, offering price and redemption price per share ($46,300,347 ÷ 3,403,110 shares) | | $13.61 |
See accompanying notes which are an integral part of the financial statements.
Statement of Operations
| | | Year ended March 31, 2022 |
| Investment Income | | |
| Dividends: | | |
| Affiliated issuers | | $14,693,637 |
| Income from Fidelity Central Funds | | 3 |
| Total income | | 14,693,640 |
| Expenses | | |
| Management fee | $810,965 | |
| Independent trustees' fees and expenses | 2,720 | |
| Total expenses | | 813,685 |
| Net investment income (loss) | | 13,879,955 |
| Realized and Unrealized Gain (Loss) | | |
| Net realized gain (loss) on: | | |
| Investment securities: | | |
| Affiliated issuers | 14,409,510 | |
| Capital gain distributions from underlying funds: | | |
| Affiliated issuers | 1,537,258 | |
| Total net realized gain (loss) | | 15,946,768 |
| Change in net unrealized appreciation (depreciation) on: | | |
| Investment securities: | | |
| Affiliated issuers | (25,855,045) | |
| Total change in net unrealized appreciation (depreciation) | | (25,855,045) |
| Net gain (loss) | | (9,908,277) |
| Net increase (decrease) in net assets resulting from operations | | $3,971,678 |
See accompanying notes which are an integral part of the financial statements.
Statement of Changes in Net Assets
| | Year ended March 31, 2022 | Year ended March 31, 2021 |
| Increase (Decrease) in Net Assets | | |
| Operations | | |
| Net investment income (loss) | $13,879,955 | $10,442,098 |
| Net realized gain (loss) | 15,946,768 | 15,695,439 |
| Change in net unrealized appreciation (depreciation) | (25,855,045) | 94,250,099 |
| Net increase (decrease) in net assets resulting from operations | 3,971,678 | 120,387,636 |
| Distributions to shareholders | (32,658,343) | (21,511,773) |
| Share transactions - net increase (decrease) | (8,837,322) | 98,235,509 |
| Total increase (decrease) in net assets | (37,523,987) | 197,111,372 |
| Net Assets | | |
| Beginning of period | 874,013,000 | 676,901,628 |
| End of period | $836,489,013 | $874,013,000 |
See accompanying notes which are an integral part of the financial statements.
Financial Highlights
Fidelity Freedom Index 2010 Fund Investor Class
| Years ended March 31, | 2022 | 2021 | 2020 | 2019 | 2018 |
| Selected Per–Share Data | | | | | |
| Net asset value, beginning of period | $14.06 | $12.33 | $14.17 | $14.25 | $13.72 |
| Income from Investment Operations | | | | | |
| Net investment income (loss)A,B | .22 | .18 | .27 | .30 | .25 |
| Net realized and unrealized gain (loss) | (.15) | 1.91 | .04 | .29 | .65 |
| Total from investment operations | .07 | 2.09 | .31 | .59 | .90 |
| Distributions from net investment income | (.21) | (.19) | (.27) | (.30) | (.24) |
| Distributions from net realized gain | (.30) | (.17) | (1.88) | (.37) | (.14) |
| Total distributions | (.52)C | (.36) | (2.15) | (.67) | (.37)C |
| Net asset value, end of period | $13.61 | $14.06 | $12.33 | $14.17 | $14.25 |
| Total ReturnD | .33% | 17.04% | 1.34% | 4.43% | 6.62% |
| Ratios to Average Net AssetsB,E,F | | | | | |
| Expenses before reductions | .12% | .12% | .12% | .15% | .15% |
| Expenses net of fee waivers, if any | .12% | .12% | .12% | .12% | .12% |
| Expenses net of all reductions | .12% | .12% | .12% | .12% | .12% |
| Net investment income (loss) | 1.52% | 1.28% | 1.93% | 2.13% | 1.77% |
| Supplemental Data | | | | | |
| Net assets, end of period (000 omitted) | $222,429 | $477,015 | $353,955 | $254,371 | $239,660 |
| Portfolio turnover rateG | 38% | 27% | 83% | 45% | 22% |
A Calculated based on average shares outstanding during the period.
B Net investment income (loss) is affected by the timing of the declaration of dividends by any underlying mutual funds or exchange-traded funds (ETFs). Net investment income (loss) of any such underlying funds is not included in the Fund's net investment income (loss) ratio.
C Total distributions per share do not sum due to rounding.
D Total returns would have been lower if certain expenses had not been reduced during the applicable periods shown.
E Fees and expenses of any underlying mutual funds or exchange-traded funds (ETFs) are not included in the Fund's expense ratio. The Fund indirectly bears its proportionate share of these expenses. For additional expense information related to investments in Fidelity Central Funds, please refer to the "Investments in Fidelity Central Funds" note found in the Notes to Financial Statements section of the most recent Annual or Semi-Annual report.
F Expense ratios reflect operating expenses of the class. Expenses before reductions do not reflect amounts reimbursed, waived, or reduced through arrangements with the investment adviser, brokerage services, or other offset arrangements, if applicable, and do not represent the amount paid by the class during periods when reimbursements, waivers or reductions occur.
G Amount does not include the portfolio activity of any underlying mutual funds or exchange-traded funds (ETFs).
See accompanying notes which are an integral part of the financial statements.
Fidelity Freedom Index 2010 Fund Institutional Premium Class
| Years ended March 31, | 2022 | 2021 | 2020 | 2019 | 2018 |
| Selected Per–Share Data | | | | | |
| Net asset value, beginning of period | $14.07 | $12.33 | $14.17 | $14.25 | $13.73 |
| Income from Investment Operations | | | | | |
| Net investment income (loss)A,B | .22 | .18 | .28 | .31 | .26 |
| Net realized and unrealized gain (loss) | (.15) | 1.93 | .04 | .29 | .64 |
| Total from investment operations | .07 | 2.11 | .32 | .60 | .90 |
| Distributions from net investment income | (.23) | (.19) | (.28) | (.31) | (.24) |
| Distributions from net realized gain | (.30) | (.17) | (1.88) | (.37) | (.14) |
| Total distributions | (.53) | (.37)C | (2.16) | (.68) | (.38) |
| Net asset value, end of period | $13.61 | $14.07 | $12.33 | $14.17 | $14.25 |
| Total ReturnD | .35% | 17.17% | 1.37% | 4.49% | 6.59% |
| Ratios to Average Net AssetsB,E,F | | | | | |
| Expenses before reductions | .08% | .08% | .08% | .10% | .10% |
| Expenses net of fee waivers, if any | .08% | .08% | .08% | .06% | .07% |
| Expenses net of all reductions | .08% | .08% | .08% | .06% | .07% |
| Net investment income (loss) | 1.56% | 1.33% | 1.98% | 2.19% | 1.82% |
| Supplemental Data | | | | | |
| Net assets, end of period (000 omitted) | $567,760 | $389,414 | $322,946 | $309,781 | $319,248 |
| Portfolio turnover rateG | 38% | 27% | 83% | 45% | 22% |
A Calculated based on average shares outstanding during the period.
B Net investment income (loss) is affected by the timing of the declaration of dividends by any underlying mutual funds or exchange-traded funds (ETFs). Net investment income (loss) of any such underlying funds is not included in the Fund's net investment income (loss) ratio.
C Total distributions per share do not sum due to rounding.
D Total returns would have been lower if certain expenses had not been reduced during the applicable periods shown.
E Fees and expenses of any underlying mutual funds or exchange-traded funds (ETFs) are not included in the Fund's expense ratio. The Fund indirectly bears its proportionate share of these expenses. For additional expense information related to investments in Fidelity Central Funds, please refer to the "Investments in Fidelity Central Funds" note found in the Notes to Financial Statements section of the most recent Annual or Semi-Annual report.
F Expense ratios reflect operating expenses of the class. Expenses before reductions do not reflect amounts reimbursed, waived, or reduced through arrangements with the investment adviser, brokerage services, or other offset arrangements, if applicable, and do not represent the amount paid by the class during periods when reimbursements, waivers or reductions occur.
G Amount does not include the portfolio activity of any underlying mutual funds or exchange-traded funds (ETFs).
See accompanying notes which are an integral part of the financial statements.
Fidelity Freedom Index 2010 Fund Premier Class
| Years ended March 31, | 2022 | 2021 A |
| Selected Per–Share Data | | |
| Net asset value, beginning of period | $14.07 | $13.15 |
| Income from Investment Operations | | |
| Net investment income (loss)B,C | .22 | .07 |
| Net realized and unrealized gain (loss) | (.15) | 1.12 |
| Total from investment operations | .07 | 1.19 |
| Distributions from net investment income | (.23) | (.16) |
| Distributions from net realized gain | (.30) | (.11) |
| Total distributions | (.53) | (.27) |
| Net asset value, end of period | $13.61 | $14.07 |
| Total ReturnD,E | .37% | 9.06% |
| Ratios to Average Net AssetsC,F,G | | |
| Expenses before reductions | .06% | .06%H |
| Expenses net of fee waivers, if any | .06% | .06%H |
| Expenses net of all reductions | .06% | .06%H |
| Net investment income (loss) | 1.58% | .64%H |
| Supplemental Data | | |
| Net assets, end of period (000 omitted) | $46,300 | $7,583 |
| Portfolio turnover rateI | 38% | 27% |
A For the period June 24, 2020 (commencement of sale of shares) through March 31, 2021.
B Calculated based on average shares outstanding during the period.
C Net investment income (loss) is affected by the timing of the declaration of dividends by any underlying mutual funds or exchange-traded funds (ETFs). Net investment income (loss) of any such underlying funds is not included in the Fund's net investment income (loss) ratio.
D Total returns for periods of less than one year are not annualized.
E Total returns would have been lower if certain expenses had not been reduced during the applicable periods shown.
F Fees and expenses of any underlying mutual funds or exchange-traded funds (ETFs) are not included in the Fund's expense ratio. The Fund indirectly bears its proportionate share of these expenses. For additional expense information related to investments in Fidelity Central Funds, please refer to the "Investments in Fidelity Central Funds" note found in the Notes to Financial Statements section of the most recent Annual or Semi-Annual report.
G Expense ratios reflect operating expenses of the class. Expenses before reductions do not reflect amounts reimbursed, waived, or reduced through arrangements with the investment adviser, brokerage services, or other offset arrangements, if applicable, and do not represent the amount paid by the class during periods when reimbursements, waivers or reductions occur.
H Annualized
I Amount does not include the portfolio activity of any underlying mutual funds or exchange-traded funds (ETFs).
See accompanying notes which are an integral part of the financial statements.
Fidelity Freedom® Index 2015 Fund
Investment Summary (Unaudited)
The information in the following tables is based on the direct investments of the Fund.
Top Holdings as of March 31, 2022
| | % of fund's net assets |
| Fidelity Series Bond Index Fund | 35.6 |
| Fidelity Series Total Market Index Fund | 23.7 |
| Fidelity Series Global ex U.S. Index Fund | 15.8 |
| Fidelity Series Treasury Bill Index Fund | 5.7 |
| Fidelity Series 0-5 Year Inflation-Protected Bond Index Fund | 5.6 |
| Fidelity Series 5+ Year Inflation-Protected Bond Index Fund | 4.8 |
| Fidelity Series International Developed Markets Bond Index Fund | 4.0 |
| Fidelity Series Long-Term Treasury Bond Index Fund | 3.4 |
| Fidelity Series Inflation-Protected Bond Index Fund | 1.4 |
| | 100.0 |
Asset Allocation (% of fund's net assets)
| Period end |
| | Domestic Equity Funds | 23.7% |
| | International Equity Funds | 15.8% |
| | Bond Funds | 43.0% |
| | Inflation-Protected Bond Funds | 11.8% |
| | Short-Term Funds | 5.7% |
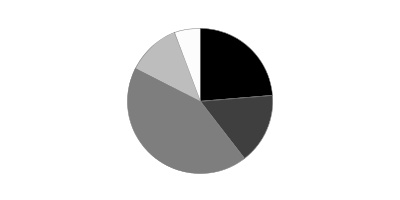
Fidelity Freedom® Index 2015 Fund
Schedule of Investments March 31, 2022
Showing Percentage of Net Assets
| Domestic Equity Funds - 23.7% | | | |
| | | Shares | Value |
| Fidelity Series Total Market Index Fund (a) | | | |
| (Cost $393,602,837) | | 38,598,014 | 582,830,013 |
|
| International Equity Funds - 15.8% | | | |
| Fidelity Series Global ex U.S. Index Fund (a) | | | |
| (Cost $320,039,056) | | 27,580,236 | 390,260,335 |
|
| Bond Funds - 43.0% | | | |
| Fidelity Series Bond Index Fund (a) | | 89,632,856 | 875,713,006 |
| Fidelity Series International Developed Markets Bond Index Fund (a) | | 10,507,084 | 98,031,093 |
| Fidelity Series Long-Term Treasury Bond Index Fund (a) | | 11,028,309 | 84,035,717 |
| TOTAL BOND FUNDS | | | |
| (Cost $1,117,006,390) | | | 1,057,779,816 |
|
| Inflation-Protected Bond Funds - 11.8% | | | |
| Fidelity Series 0-5 Year Inflation-Protected Bond Index Fund (a) | | 13,894,216 | 139,358,988 |
| Fidelity Series 5+ Year Inflation-Protected Bond Index Fund (a) | | 12,234,272 | 117,449,015 |
| Fidelity Series Inflation-Protected Bond Index Fund (a) | | 3,361,521 | 34,119,434 |
| TOTAL INFLATION-PROTECTED BOND FUNDS | | | |
| (Cost $294,000,955) | | | 290,927,437 |
|
| Short-Term Funds - 5.7% | | | |
| Fidelity Series Treasury Bill Index Fund (a) | | | |
| (Cost $141,094,062) | | 14,111,852 | 140,977,398 |
| TOTAL INVESTMENT IN SECURITIES - 100.0% | | | |
| (Cost $2,265,743,300) | | | 2,462,774,999 |
| NET OTHER ASSETS (LIABILITIES) - 0.0% | | | (160,481) |
| NET ASSETS - 100% | | | $2,462,614,518 |
Legend
(a) Affiliated Fund
Affiliated Central Funds
Fiscal year to date information regarding the Fund's investments in Fidelity Central Funds, including the ownership percentage, is presented below.
| Fund | Value, beginning of period | Purchases | Sales Proceeds | Dividend Income | Realized Gain/Loss | Change in Unrealized appreciation (depreciation) | Value, end of period | % ownership, end of period |
| Fidelity Cash Central Fund 0.31% | $513 | $-- | $513 | $-- | $-- | $-- | $-- | 0.0% |
| Total | $513 | $-- | $513 | $-- | $-- | $-- | $-- | |
Amounts in the income column in the above table include any capital gain distributions from underlying funds, which are presented in the corresponding line-item in the Statement of Operations, if applicable.
Affiliated Underlying Funds
Fiscal year to date information regarding the Fund's investments in affiliated Underlying Funds is presented below. Exchanges between classes of the same affiliated Underlying Funds may occur. If an underlying Fund changes its name, the name presented below is the name in effect at period end.
| Affiliate | Value, beginning of period | Purchases(a) | Sales Proceeds(a) | Dividend Income | Realized Gain (loss) | Change in Unrealized appreciation (depreciation) | Value, end of period |
| Fidelity Series 0-5 Year Inflation-Protected Bond Index Fund | $-- | $144,278,364 | $4,563,220 | $485,080 | $(525) | $(283,382) | $139,358,988 |
| Fidelity Series 5+ Year Inflation-Protected Bond Index Fund | -- | 125,819,530 | 4,099,149 | 560,172 | (40,861) | (4,230,505) | 117,449,015 |
| Fidelity Series Bond Index Fund | 791,824,646 | 289,507,703 | 150,767,546 | 14,109,759 | (2,902,868) | (51,948,929) | 875,713,006 |
| Fidelity Series Global ex U.S. Index Fund | 357,851,007 | 127,469,998 | 75,126,200 | 10,965,693 | 762,767 | (20,697,237) | 390,260,335 |
| Fidelity Series Inflation-Protected Bond Index Fund | 137,816,704 | 40,260,023 | 141,824,041 | 8,511,670 | 4,136,345 | (6,269,597) | 34,119,434 |
| Fidelity Series International Developed Markets Bond Index Fund | -- | 105,747,740 | 3,340,513 | 33,530 | (40,065) | (4,336,069) | 98,031,093 |
| Fidelity Series Long-Term Treasury Bond Index Fund | 63,946,726 | 35,021,639 | 10,523,555 | 1,792,465 | (759,201) | (3,649,892) | 84,035,717 |
| Fidelity Series Total Market Index Fund | 535,819,121 | 182,730,366 | 190,066,402 | 9,976,477 | 15,673,806 | 38,673,122 | 582,830,013 |
| Fidelity Series Treasury Bill Index Fund | 260,995,575 | 77,929,440 | 197,760,809 | 202,480 | (120,646) | (66,162) | 140,977,398 |
| | $2,148,253,779 | $1,128,764,803 | $778,071,435 | $46,637,326 | $16,708,752 | $(52,808,651) | $2,462,774,999 |
(a) Includes the value of shares purchased or redeemed through in-kind transactions, if applicable.
Amounts in the income column in the above table include any capital gain distributions from underlying funds, which are presented in the corresponding line-item in the Statement of Operations, if applicable.
Investment Valuation
The following is a summary of the inputs used, as of March 31, 2022, involving the Fund's assets and liabilities carried at fair value. The inputs or methodology used for valuing securities may not be an indication of the risk associated with investing in those securities. For more information on valuation inputs, and their aggregation into the levels used below, please refer to the Investment Valuation section in the accompanying Notes to Financial Statements.
| | Valuation Inputs at Reporting Date: |
| Description | Total | Level 1 | Level 2 | Level 3 |
| Investments in Securities: | | | | |
| Domestic Equity Funds | $582,830,013 | $582,830,013 | $-- | $-- |
| International Equity Funds | 390,260,335 | 390,260,335 | -- | -- |
| Bond Funds | 1,348,707,253 | 1,348,707,253 | -- | -- |
| Short-Term Funds | 140,977,398 | 140,977,398 | -- | -- |
| Total Investments in Securities: | $2,462,774,999 | $2,462,774,999 | $-- | $-- |
See accompanying notes which are an integral part of the financial statements.
Fidelity Freedom® Index 2015 Fund
Financial Statements
Statement of Assets and Liabilities
| | | March 31, 2022 |
| Assets | | |
Investment in securities, at value — See accompanying schedule:
| | |
| Affiliated issuers (cost $2,265,743,300) | $2,462,774,999 | |
| Total Investment in Securities (cost $2,265,743,300) | | $2,462,774,999 |
| Cash | | 1,836 |
| Receivable for investments sold | | 69,602,903 |
| Receivable for fund shares sold | | 1,146,354 |
| Total assets | | 2,533,526,092 |
| Liabilities | | |
| Payable for investments purchased | $68,578,949 | |
| Payable for fund shares redeemed | 2,177,799 | |
| Accrued management fee | 154,826 | |
| Total liabilities | | 70,911,574 |
| Net Assets | | $2,462,614,518 |
| Net Assets consist of: | | |
| Paid in capital | | $2,263,224,301 |
| Total accumulated earnings (loss) | | 199,390,217 |
| Net Assets | | $2,462,614,518 |
| Net Asset Value and Maximum Offering Price | | |
| Investor Class: | | |
| Net Asset Value, offering price and redemption price per share ($604,032,111 ÷ 40,732,386 shares) | | $14.83 |
| Institutional Premium Class: | | |
| Net Asset Value, offering price and redemption price per share ($1,343,537,221 ÷ 90,686,602 shares) | | $14.82 |
| Premier Class: | | |
| Net Asset Value, offering price and redemption price per share ($515,045,186 ÷ 34,773,054 shares) | | $14.81 |
See accompanying notes which are an integral part of the financial statements.
Statement of Operations
| | | Year ended March 31, 2022 |
| Investment Income | | |
| Dividends: | | |
| Affiliated issuers | | $42,115,052 |
| Expenses | | |
| Management fee | $2,107,738 | |
| Independent trustees' fees and expenses | 7,060 | |
| Total expenses before reductions | 2,114,798 | |
| Expense reductions | (1) | |
| Total expenses after reductions | | 2,114,797 |
| Net investment income (loss) | | 40,000,255 |
| Realized and Unrealized Gain (Loss) | | |
| Net realized gain (loss) on: | | |
| Investment securities: | | |
| Affiliated issuers | 16,708,752 | |
| Capital gain distributions from underlying funds: | | |
| Affiliated issuers | 4,522,274 | |
| Total net realized gain (loss) | | 21,231,026 |
| Change in net unrealized appreciation (depreciation) on: | | |
| Investment securities: | | |
| Affiliated issuers | (52,808,651) | |
| Total change in net unrealized appreciation (depreciation) | | (52,808,651) |
| Net gain (loss) | | (31,577,625) |
| Net increase (decrease) in net assets resulting from operations | | $8,422,630 |
See accompanying notes which are an integral part of the financial statements.
Statement of Changes in Net Assets
| | Year ended March 31, 2022 | Year ended March 31, 2021 |
| Increase (Decrease) in Net Assets | | |
| Operations | | |
| Net investment income (loss) | $40,000,255 | $25,921,424 |
| Net realized gain (loss) | 21,231,026 | 33,251,954 |
| Change in net unrealized appreciation (depreciation) | (52,808,651) | 295,450,281 |
| Net increase (decrease) in net assets resulting from operations | 8,422,630 | 354,623,659 |
| Distributions to shareholders | (71,529,567) | (52,456,187) |
| Share transactions - net increase (decrease) | 377,629,022 | 281,049,614 |
| Total increase (decrease) in net assets | 314,522,085 | 583,217,086 |
| Net Assets | | |
| Beginning of period | 2,148,092,433 | 1,564,875,347 |
| End of period | $2,462,614,518 | $2,148,092,433 |
See accompanying notes which are an integral part of the financial statements.
Financial Highlights
Fidelity Freedom Index 2015 Fund Investor Class
| Years ended March 31, | 2022 | 2021 | 2020 | 2019 | 2018 |
| Selected Per–Share Data | | | | | |
| Net asset value, beginning of period | $15.12 | $12.74 | $15.09 | $14.92 | $14.11 |
| Income from Investment Operations | | | | | |
| Net investment income (loss)A,B | .26 | .19 | .29 | .32 | .27 |
| Net realized and unrealized gain (loss) | (.11) | 2.59 | (.12) | .33 | .83 |
| Total from investment operations | .15 | 2.78 | .17 | .65 | 1.10 |
| Distributions from net investment income | (.23) | (.20) | (.29) | (.31) | (.25) |
| Distributions from net realized gain | (.21) | (.19) | (2.23) | (.17) | (.04) |
| Total distributions | (.44) | (.40)C | (2.52) | (.48) | (.29) |
| Net asset value, end of period | $14.83 | $15.12 | $12.74 | $15.09 | $14.92 |
| Total ReturnD | .86% | 21.92% | (.17)% | 4.55% | 7.82% |
| Ratios to Average Net AssetsB,E,F | | | | | |
| Expenses before reductions | .12% | .12% | .12% | .15% | .15% |
| Expenses net of fee waivers, if any | .12% | .12% | .12% | .12% | .12% |
| Expenses net of all reductions | .12% | .12% | .12% | .12% | .12% |
| Net investment income (loss) | 1.65% | 1.32% | 1.93% | 2.12% | 1.81% |
| Supplemental Data | | | | | |
| Net assets, end of period (000 omitted) | $604,032 | $1,197,347 | $887,110 | $721,922 | $637,221 |
| Portfolio turnover rateG | 33% | 30% | 87% | 36% | 17% |
A Calculated based on average shares outstanding during the period.
B Net investment income (loss) is affected by the timing of the declaration of dividends by any underlying mutual funds or exchange-traded funds (ETFs). Net investment income (loss) of any such underlying funds is not included in the Fund's net investment income (loss) ratio.
C Total distributions per share do not sum due to rounding.
D Total returns would have been lower if certain expenses had not been reduced during the applicable periods shown.
E Fees and expenses of any underlying mutual funds or exchange-traded funds (ETFs) are not included in the Fund's expense ratio. The Fund indirectly bears its proportionate share of these expenses. For additional expense information related to investments in Fidelity Central Funds, please refer to the "Investments in Fidelity Central Funds" note found in the Notes to Financial Statements section of the most recent Annual or Semi-Annual report.
F Expense ratios reflect operating expenses of the class. Expenses before reductions do not reflect amounts reimbursed, waived, or reduced through arrangements with the investment adviser, brokerage services, or other offset arrangements, if applicable, and do not represent the amount paid by the class during periods when reimbursements, waivers or reductions occur.
G Amount does not include the portfolio activity of any underlying mutual funds or exchange-traded funds (ETFs).
See accompanying notes which are an integral part of the financial statements.
Fidelity Freedom Index 2015 Fund Institutional Premium Class
| Years ended March 31, | 2022 | 2021 | 2020 | 2019 | 2018 |
| Selected Per–Share Data | | | | | |
| Net asset value, beginning of period | $15.11 | $12.73 | $15.08 | $14.92 | $14.10 |
| Income from Investment Operations | | | | | |
| Net investment income (loss)A,B | .26 | .20 | .30 | .33 | .27 |
| Net realized and unrealized gain (loss) | (.10) | 2.58 | (.12) | .31 | .85 |
| Total from investment operations | .16 | 2.78 | .18 | .64 | 1.12 |
| Distributions from net investment income | (.24) | (.21) | (.29) | (.32) | (.26) |
| Distributions from net realized gain | (.21) | (.19) | (2.23) | (.17) | (.04) |
| Total distributions | (.45) | (.40) | (2.53)C | (.48)C | (.30) |
| Net asset value, end of period | $14.82 | $15.11 | $12.73 | $15.08 | $14.92 |
| Total ReturnD | .96% | 21.98% | (.15)% | 4.55% | 7.94% |
| Ratios to Average Net AssetsB,E,F | | | | | |
| Expenses before reductions | .08% | .08% | .08% | .10% | .10% |
| Expenses net of fee waivers, if any | .08% | .08% | .08% | .06% | .07% |
| Expenses net of all reductions | .08% | .08% | .08% | .06% | .07% |
| Net investment income (loss) | 1.69% | 1.36% | 1.97% | 2.18% | 1.86% |
| Supplemental Data | | | | | |
| Net assets, end of period (000 omitted) | $1,343,537 | $789,557 | $677,766 | $597,338 | $560,428 |
| Portfolio turnover rateG | 33% | 30% | 87% | 36% | 17% |
A Calculated based on average shares outstanding during the period.
B Net investment income (loss) is affected by the timing of the declaration of dividends by any underlying mutual funds or exchange-traded funds (ETFs). Net investment income (loss) of any such underlying funds is not included in the Fund's net investment income (loss) ratio.
C Total distributions per share do not sum due to rounding.
D Total returns would have been lower if certain expenses had not been reduced during the applicable periods shown.
E Fees and expenses of any underlying mutual funds or exchange-traded funds (ETFs) are not included in the Fund's expense ratio. The Fund indirectly bears its proportionate share of these expenses. For additional expense information related to investments in Fidelity Central Funds, please refer to the "Investments in Fidelity Central Funds" note found in the Notes to Financial Statements section of the most recent Annual or Semi-Annual report.
F Expense ratios reflect operating expenses of the class. Expenses before reductions do not reflect amounts reimbursed, waived, or reduced through arrangements with the investment adviser, brokerage services, or other offset arrangements, if applicable, and do not represent the amount paid by the class during periods when reimbursements, waivers or reductions occur.
G Amount does not include the portfolio activity of any underlying mutual funds or exchange-traded funds (ETFs).
See accompanying notes which are an integral part of the financial statements.
Fidelity Freedom Index 2015 Fund Premier Class
| Years ended March 31, | 2022 | 2021 A |
| Selected Per–Share Data | | |
| Net asset value, beginning of period | $15.11 | $13.77 |
| Income from Investment Operations | | |
| Net investment income (loss)B,C | .26 | .27 |
| Net realized and unrealized gain (loss) | (.10) | 1.38 |
| Total from investment operations | .16 | 1.65 |
| Distributions from net investment income | (.25) | (.18) |
| Distributions from net realized gain | (.21) | (.13) |
| Total distributions | (.46) | (.31) |
| Net asset value, end of period | $14.81 | $15.11 |
| Total ReturnD,E | .92% | 11.98% |
| Ratios to Average Net AssetsC,F,G | | |
| Expenses before reductions | .06% | .06%H |
| Expenses net of fee waivers, if any | .06% | .06%H |
| Expenses net of all reductions | .06% | .06%H |
| Net investment income (loss) | 1.71% | 2.36%H |
| Supplemental Data | | |
| Net assets, end of period (000 omitted) | $515,045 | $161,189 |
| Portfolio turnover rateI | 33% | 30% |
A For the period June 24, 2020 (commencement of sale of shares) through March 31, 2021.
B Calculated based on average shares outstanding during the period.
C Net investment income (loss) is affected by the timing of the declaration of dividends by any underlying mutual funds or exchange-traded funds (ETFs). Net investment income (loss) of any such underlying funds is not included in the Fund's net investment income (loss) ratio.
D Total returns for periods of less than one year are not annualized.
E Total returns would have been lower if certain expenses had not been reduced during the applicable periods shown.
F Fees and expenses of any underlying mutual funds or exchange-traded funds (ETFs) are not included in the Fund's expense ratio. The Fund indirectly bears its proportionate share of these expenses. For additional expense information related to investments in Fidelity Central Funds, please refer to the "Investments in Fidelity Central Funds" note found in the Notes to Financial Statements section of the most recent Annual or Semi-Annual report.
G Expense ratios reflect operating expenses of the class. Expenses before reductions do not reflect amounts reimbursed, waived, or reduced through arrangements with the investment adviser, brokerage services, or other offset arrangements, if applicable, and do not represent the amount paid by the class during periods when reimbursements, waivers or reductions occur.
H Annualized
I Amount does not include the portfolio activity of any underlying mutual funds or exchange-traded funds (ETFs).
See accompanying notes which are an integral part of the financial statements.
Fidelity Freedom® Index 2020 Fund
Investment Summary (Unaudited)
The information in the following tables is based on the direct investments of the Fund.
Top Holdings as of March 31, 2022
| | % of fund's net assets |
| Fidelity Series Bond Index Fund | 32.0 |
| Fidelity Series Total Market Index Fund | 29.2 |
| Fidelity Series Global ex U.S. Index Fund | 19.5 |
| Fidelity Series 5+ Year Inflation-Protected Bond Index Fund | 6.8 |
| Fidelity Series International Developed Markets Bond Index Fund | 4.0 |
| Fidelity Series Long-Term Treasury Bond Index Fund | 3.6 |
| Fidelity Series Treasury Bill Index Fund | 2.6 |
| Fidelity Series Inflation-Protected Bond Index Fund | 1.2 |
| Fidelity Series 0-5 Year Inflation-Protected Bond Index Fund | 1.1 |
| | 100.0 |
Asset Allocation (% of fund's net assets)
| Period end |
| | Domestic Equity Funds | 29.2% |
| | International Equity Funds | 19.5% |
| | Bond Funds | 39.6% |
| | Inflation-Protected Bond Funds | 9.1% |
| | Short-Term Funds | 2.6% |
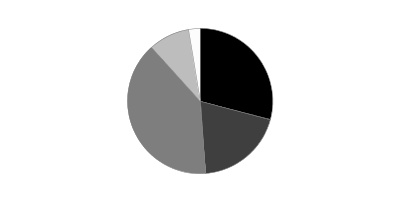
Fidelity Freedom® Index 2020 Fund
Schedule of Investments March 31, 2022
Showing Percentage of Net Assets
| Domestic Equity Funds - 29.2% | | | |
| | | Shares | Value |
| Fidelity Series Total Market Index Fund (a) | | | |
| (Cost $1,648,303,305) | | 163,484,096 | 2,468,609,849 |
|
| International Equity Funds - 19.5% | | | |
| Fidelity Series Global ex U.S. Index Fund (a) | | | |
| (Cost $1,386,015,866) | | 116,797,183 | 1,652,680,145 |
|
| Bond Funds - 39.6% | | | |
| Fidelity Series Bond Index Fund (a) | | 276,499,910 | 2,701,404,120 |
| Fidelity Series International Developed Markets Bond Index Fund (a) | | 36,114,736 | 336,950,487 |
| Fidelity Series Long-Term Treasury Bond Index Fund (a) | | 40,028,614 | 305,018,040 |
| TOTAL BOND FUNDS | | | |
| (Cost $3,526,848,383) | | | 3,343,372,647 |
|
| Inflation-Protected Bond Funds - 9.1% | | | |
| Fidelity Series 0-5 Year Inflation-Protected Bond Index Fund (a) | | 9,569,740 | 95,984,494 |
| Fidelity Series 5+ Year Inflation-Protected Bond Index Fund (a) | | 60,126,428 | 577,213,706 |
| Fidelity Series Inflation-Protected Bond Index Fund (a) | | 9,473,704 | 96,158,096 |
| TOTAL INFLATION-PROTECTED BOND FUNDS | | | |
| (Cost $785,839,460) | | | 769,356,296 |
|
| Short-Term Funds - 2.6% | | | |
| Fidelity Series Treasury Bill Index Fund (a) | | | |
| (Cost $219,850,197) | | 21,991,471 | 219,694,800 |
| TOTAL INVESTMENT IN SECURITIES - 100.0% | | | |
| (Cost $7,566,857,211) | | | 8,453,713,737 |
| NET OTHER ASSETS (LIABILITIES) - 0.0% | | | (526,900) |
| NET ASSETS - 100% | | | $8,453,186,837 |
Legend
(a) Affiliated Fund
Affiliated Central Funds
Fiscal year to date information regarding the Fund's investments in Fidelity Central Funds, including the ownership percentage, is presented below.
| Fund | Value, beginning of period | Purchases | Sales Proceeds | Dividend Income | Realized Gain/Loss | Change in Unrealized appreciation (depreciation) | Value, end of period | % ownership, end of period |
| Fidelity Cash Central Fund 0.31% | $8,009 | $89,589 | $97,598 | $-- | $-- | $-- | $-- | 0.0% |
| Total | $8,009 | $89,589 | $97,598 | $-- | $-- | $-- | $-- | |
Amounts in the income column in the above table include any capital gain distributions from underlying funds, which are presented in the corresponding line-item in the Statement of Operations, if applicable.
Affiliated Underlying Funds
Fiscal year to date information regarding the Fund's investments in affiliated Underlying Funds is presented below. Exchanges between classes of the same affiliated Underlying Funds may occur. If an underlying Fund changes its name, the name presented below is the name in effect at period end.
| Affiliate | Value, beginning of period | Purchases(a) | Sales Proceeds(a) | Dividend Income | Realized Gain (loss) | Change in Unrealized appreciation (depreciation) | Value, end of period |
| Fidelity Series 0-5 Year Inflation-Protected Bond Index Fund | $-- | $98,636,734 | $2,438,410 | $246,941 | $1,550 | $(178,615) | $95,984,494 |
| Fidelity Series 5+ Year Inflation-Protected Bond Index Fund | -- | 616,342,948 | 18,493,363 | 2,728,183 | (140,046) | (20,495,833) | 577,213,706 |
| Fidelity Series Bond Index Fund | 2,497,129,281 | 994,738,306 | 624,180,244 | 44,541,159 | (11,697,364) | (154,585,859) | 2,701,404,120 |
| Fidelity Series Global ex U.S. Index Fund | 1,525,763,119 | 578,685,429 | 363,624,743 | 46,010,486 | (1,082,369) | (87,061,291) | 1,652,680,145 |
| Fidelity Series Inflation-Protected Bond Index Fund | 389,509,114 | 129,896,316 | 418,214,427 | 23,692,544 | 14,068,130 | (19,101,037) | 96,158,096 |
| Fidelity Series International Developed Markets Bond Index Fund | -- | 362,524,930 | 10,609,005 | 113,289 | (120,819) | (14,844,619) | 336,950,487 |
| Fidelity Series Long-Term Treasury Bond Index Fund | 224,471,798 | 145,475,216 | 50,038,113 | 6,433,055 | (4,865,349) | (10,025,512) | 305,018,040 |
| Fidelity Series Total Market Index Fund | 2,285,064,615 | 784,287,205 | 837,695,279 | 42,003,282 | 51,098,823 | 185,854,485 | 2,468,609,849 |
| Fidelity Series Treasury Bill Index Fund | 616,942,224 | 194,483,216 | 591,379,946 | 421,108 | (329,988) | (20,706) | 219,694,800 |
| | $7,538,880,151 | $3,905,070,300 | $2,916,673,530 | $166,190,047 | $46,932,568 | $(120,458,987) | $8,453,713,737 |
(a) Includes the value of shares purchased or redeemed through in-kind transactions, if applicable.
Amounts in the income column in the above table include any capital gain distributions from underlying funds, which are presented in the corresponding line-item in the Statement of Operations, if applicable.
Investment Valuation
The following is a summary of the inputs used, as of March 31, 2022, involving the Fund's assets and liabilities carried at fair value. The inputs or methodology used for valuing securities may not be an indication of the risk associated with investing in those securities. For more information on valuation inputs, and their aggregation into the levels used below, please refer to the Investment Valuation section in the accompanying Notes to Financial Statements.
| | Valuation Inputs at Reporting Date: |
| Description | Total | Level 1 | Level 2 | Level 3 |
| Investments in Securities: | | | | |
| Domestic Equity Funds | $2,468,609,849 | $2,468,609,849 | $-- | $-- |
| International Equity Funds | 1,652,680,145 | 1,652,680,145 | -- | -- |
| Bond Funds | 4,112,728,943 | 4,112,728,943 | -- | -- |
| Short-Term Funds | 219,694,800 | 219,694,800 | -- | -- |
| Total Investments in Securities: | $8,453,713,737 | $8,453,713,737 | $-- | $-- |
See accompanying notes which are an integral part of the financial statements.
Fidelity Freedom® Index 2020 Fund
Financial Statements
Statement of Assets and Liabilities
| | | March 31, 2022 |
| Assets | | |
Investment in securities, at value — See accompanying schedule:
| | |
| Affiliated issuers (cost $7,566,857,211) | $8,453,713,737 | |
| Total Investment in Securities (cost $7,566,857,211) | | $8,453,713,737 |
| Cash | | 9,488 |
| Receivable for investments sold | | 225,141,708 |
| Receivable for fund shares sold | | 7,279,871 |
| Total assets | | 8,686,144,804 |
| Liabilities | | |
| Payable for investments purchased | $224,764,808 | |
| Payable for fund shares redeemed | 7,683,589 | |
| Accrued management fee | 509,570 | |
| Total liabilities | | 232,957,967 |
| Net Assets | | $8,453,186,837 |
| Net Assets consist of: | | |
| Paid in capital | | $7,567,483,259 |
| Total accumulated earnings (loss) | | 885,703,578 |
| Net Assets | | $8,453,186,837 |
| Net Asset Value and Maximum Offering Price | | |
| Investor Class: | | |
| Net Asset Value, offering price and redemption price per share ($1,825,353,984 ÷ 111,733,947 shares) | | $16.34 |
| Institutional Premium Class: | | |
| Net Asset Value, offering price and redemption price per share ($5,076,225,707 ÷ 310,972,428 shares) | | $16.32 |
| Premier Class: | | |
| Net Asset Value, offering price and redemption price per share ($1,551,607,146 ÷ 95,084,466 shares) | | $16.32 |
See accompanying notes which are an integral part of the financial statements.
Statement of Operations
| | | Year ended March 31, 2022 |
| Investment Income | | |
| Dividends: | | |
| Affiliated issuers | | $149,710,275 |
| Expenses | | |
| Management fee | $7,240,771 | |
| Independent trustees' fees and expenses | 24,962 | |
| Total expenses before reductions | 7,265,733 | |
| Expense reductions | (1) | |
| Total expenses after reductions | | 7,265,732 |
| Net investment income (loss) | | 142,444,543 |
| Realized and Unrealized Gain (Loss) | | |
| Net realized gain (loss) on: | | |
| Investment securities: | | |
| Affiliated issuers | 46,932,568 | |
| Capital gain distributions from underlying funds: | | |
| Affiliated issuers | 16,479,772 | |
| Total net realized gain (loss) | | 63,412,340 |
| Change in net unrealized appreciation (depreciation) on: | | |
| Investment securities: | | |
| Affiliated issuers | (120,458,987) | |
| Total change in net unrealized appreciation (depreciation) | | (120,458,987) |
| Net gain (loss) | | (57,046,647) |
| Net increase (decrease) in net assets resulting from operations | | $85,397,896 |
See accompanying notes which are an integral part of the financial statements.
Statement of Changes in Net Assets
| | Year ended March 31, 2022 | Year ended March 31, 2021 |
| Increase (Decrease) in Net Assets | | |
| Operations | | |
| Net investment income (loss) | $142,444,543 | $94,722,035 |
| Net realized gain (loss) | 63,412,340 | 100,419,318 |
| Change in net unrealized appreciation (depreciation) | (120,458,987) | 1,259,070,736 |
| Net increase (decrease) in net assets resulting from operations | 85,397,896 | 1,454,212,089 |
| Distributions to shareholders | (237,762,198) | (178,384,868) |
| Share transactions - net increase (decrease) | 1,067,202,171 | 1,004,637,727 |
| Total increase (decrease) in net assets | 914,837,869 | 2,280,464,948 |
| Net Assets | | |
| Beginning of period | 7,538,348,968 | 5,257,884,020 |
| End of period | $8,453,186,837 | $7,538,348,968 |
See accompanying notes which are an integral part of the financial statements.
Financial Highlights
Fidelity Freedom Index 2020 Fund Investor Class
| Years ended March 31, | 2022 | 2021 | 2020 | 2019 | 2018 |
| Selected Per–Share Data | | | | | |
| Net asset value, beginning of period | $16.54 | $13.41 | $16.01 | $15.69 | $14.70 |
| Income from Investment Operations | | | | | |
| Net investment income (loss)A,B | .28 | .22 | .31 | .33 | .29 |
| Net realized and unrealized gain (loss) | (.02) | 3.33 | (.31) | .36 | .99 |
| Total from investment operations | .26 | 3.55 | –C | .69 | 1.28 |
| Distributions from net investment income | (.26) | (.23) | (.30) | (.32) | (.27) |
| Distributions from net realized gain | (.20) | (.19) | (2.30) | (.05) | (.02) |
| Total distributions | (.46) | (.42) | (2.60) | (.37) | (.29) |
| Net asset value, end of period | $16.34 | $16.54 | $13.41 | $16.01 | $15.69 |
| Total ReturnD | 1.46% | 26.61% | (1.62)% | 4.59% | 8.72% |
| Ratios to Average Net AssetsB,E,F | | | | | |
| Expenses before reductions | .12% | .12% | .12% | .15% | .15% |
| Expenses net of fee waivers, if any | .12% | .12% | .12% | .11% | .12% |
| Expenses net of all reductions | .12% | .12% | .12% | .11% | .12% |
| Net investment income (loss) | 1.66% | 1.40% | 1.92% | 2.12% | 1.86% |
| Supplemental Data | | | | | |
| Net assets, end of period (000 omitted) | $1,825,354 | $3,660,550 | $2,544,746 | $1,971,676 | $1,638,441 |
| Portfolio turnover rateG | 35% | 28% | 87% | 26% | 11% |
A Calculated based on average shares outstanding during the period.
B Net investment income (loss) is affected by the timing of the declaration of dividends by any underlying mutual funds or exchange-traded funds (ETFs). Net investment income (loss) of any such underlying funds is not included in the Fund's net investment income (loss) ratio.
C Amount represents less than $.005 per share.
D Total returns would have been lower if certain expenses had not been reduced during the applicable periods shown.
E Fees and expenses of any underlying mutual funds or exchange-traded funds (ETFs) are not included in the Fund's expense ratio. The Fund indirectly bears its proportionate share of these expenses. For additional expense information related to investments in Fidelity Central Funds, please refer to the "Investments in Fidelity Central Funds" note found in the Notes to Financial Statements section of the most recent Annual or Semi-Annual report.
F Expense ratios reflect operating expenses of the class. Expenses before reductions do not reflect amounts reimbursed, waived, or reduced through arrangements with the investment adviser, brokerage services, or other offset arrangements, if applicable, and do not represent the amount paid by the class during periods when reimbursements, waivers or reductions occur.
G Amount does not include the portfolio activity of any underlying mutual funds or exchange-traded funds (ETFs).
See accompanying notes which are an integral part of the financial statements.
Fidelity Freedom Index 2020 Fund Institutional Premium Class
| Years ended March 31, | 2022 | 2021 | 2020 | 2019 | 2018 |
| Selected Per–Share Data | | | | | |
| Net asset value, beginning of period | $16.54 | $13.41 | $16.01 | $15.69 | $14.70 |
| Income from Investment Operations | | | | | |
| Net investment income (loss)A,B | .29 | .22 | .31 | .34 | .30 |
| Net realized and unrealized gain (loss) | (.03) | 3.33 | (.31) | .36 | .99 |
| Total from investment operations | .26 | 3.55 | –C | .70 | 1.29 |
| Distributions from net investment income | (.28) | (.23) | (.31) | (.33) | (.28) |
| Distributions from net realized gain | (.20) | (.19) | (2.30) | (.05) | (.02) |
| Total distributions | (.48) | (.42) | (2.60)D | (.38) | (.30) |
| Net asset value, end of period | $16.32 | $16.54 | $13.41 | $16.01 | $15.69 |
| Total ReturnE | 1.44% | 26.66% | (1.57)% | 4.65% | 8.77% |
| Ratios to Average Net AssetsB,F,G | | | | | |
| Expenses before reductions | .08% | .08% | .08% | .10% | .10% |
| Expenses net of fee waivers, if any | .08% | .08% | .08% | .06% | .07% |
| Expenses net of all reductions | .08% | .08% | .08% | .06% | .07% |
| Net investment income (loss) | 1.70% | 1.44% | 1.96% | 2.18% | 1.91% |
| Supplemental Data | | | | | |
| Net assets, end of period (000 omitted) | $5,076,226 | $3,331,247 | $2,713,138 | $2,528,449 | $2,304,112 |
| Portfolio turnover rateH | 35% | 28% | 87% | 26% | 11% |
A Calculated based on average shares outstanding during the period.
B Net investment income (loss) is affected by the timing of the declaration of dividends by any underlying mutual funds or exchange-traded funds (ETFs). Net investment income (loss) of any such underlying funds is not included in the Fund's net investment income (loss) ratio.
C Amount represents less than $.005 per share.
D Total distributions per share do not sum due to rounding.
E Total returns would have been lower if certain expenses had not been reduced during the applicable periods shown.
F Fees and expenses of any underlying mutual funds or exchange-traded funds (ETFs) are not included in the Fund's expense ratio. The Fund indirectly bears its proportionate share of these expenses. For additional expense information related to investments in Fidelity Central Funds, please refer to the "Investments in Fidelity Central Funds" note found in the Notes to Financial Statements section of the most recent Annual or Semi-Annual report.
G Expense ratios reflect operating expenses of the class. Expenses before reductions do not reflect amounts reimbursed, waived, or reduced through arrangements with the investment adviser, brokerage services, or other offset arrangements, if applicable, and do not represent the amount paid by the class during periods when reimbursements, waivers or reductions occur.
H Amount does not include the portfolio activity of any underlying mutual funds or exchange-traded funds (ETFs).
See accompanying notes which are an integral part of the financial statements.
Fidelity Freedom Index 2020 Fund Premier Class
| Years ended March 31, | 2022 | 2021 A |
| Selected Per–Share Data | | |
| Net asset value, beginning of period | $16.54 | $14.69 |
| Income from Investment Operations | | |
| Net investment income (loss)B,C | .29 | .30 |
| Net realized and unrealized gain (loss) | (.03) | 1.88 |
| Total from investment operations | .26 | 2.18 |
| Distributions from net investment income | (.28) | (.20) |
| Distributions from net realized gain | (.20) | (.12) |
| Total distributions | (.48) | (.33)D |
| Net asset value, end of period | $16.32 | $16.54 |
| Total ReturnE,F | 1.46% | 14.83% |
| Ratios to Average Net AssetsC,G,H | | |
| Expenses before reductions | .06% | .06%I |
| Expenses net of fee waivers, if any | .06% | .06%I |
| Expenses net of all reductions | .06% | .06%I |
| Net investment income (loss) | 1.72% | 2.40%I |
| Supplemental Data | | |
| Net assets, end of period (000 omitted) | $1,551,607 | $546,553 |
| Portfolio turnover rateJ | 35% | 28% |
A For the period June 24, 2020 (commencement of sale of shares) through March 31, 2021.
B Calculated based on average shares outstanding during the period.
C Net investment income (loss) is affected by the timing of the declaration of dividends by any underlying mutual funds or exchange-traded funds (ETFs). Net investment income (loss) of any such underlying funds is not included in the Fund's net investment income (loss) ratio.
D Total distributions per share do not sum due to rounding.
E Total returns for periods of less than one year are not annualized.
F Total returns would have been lower if certain expenses had not been reduced during the applicable periods shown.
G Fees and expenses of any underlying mutual funds or exchange-traded funds (ETFs) are not included in the Fund's expense ratio. The Fund indirectly bears its proportionate share of these expenses. For additional expense information related to investments in Fidelity Central Funds, please refer to the "Investments in Fidelity Central Funds" note found in the Notes to Financial Statements section of the most recent Annual or Semi-Annual report.
H Expense ratios reflect operating expenses of the class. Expenses before reductions do not reflect amounts reimbursed, waived, or reduced through arrangements with the investment adviser, brokerage services, or other offset arrangements, if applicable, and do not represent the amount paid by the class during periods when reimbursements, waivers or reductions occur.
I Annualized
J Amount does not include the portfolio activity of any underlying mutual funds or exchange-traded funds (ETFs).
See accompanying notes which are an integral part of the financial statements.
Fidelity Freedom® Index 2025 Fund
Investment Summary (Unaudited)
The information in the following tables is based on the direct investments of the Fund.
Top Holdings as of March 31, 2022
| | % of fund's net assets |
| Fidelity Series Total Market Index Fund | 33.2 |
| Fidelity Series Bond Index Fund | 28.7 |
| Fidelity Series Global ex U.S. Index Fund | 22.2 |
| Fidelity Series 5+ Year Inflation-Protected Bond Index Fund | 5.8 |
| Fidelity Series Long-Term Treasury Bond Index Fund | 4.0 |
| Fidelity Series International Developed Markets Bond Index Fund | 3.9 |
| Fidelity Series Treasury Bill Index Fund | 1.2 |
| Fidelity Series Inflation-Protected Bond Index Fund | 1.0 |
| | 100.0 |
Asset Allocation (% of fund's net assets)
| Period end |
| | Domestic Equity Funds | 33.2% |
| | International Equity Funds | 22.2% |
| | Bond Funds | 36.6% |
| | Inflation-Protected Bond Funds | 6.8% |
| | Short-Term Funds | 1.2% |
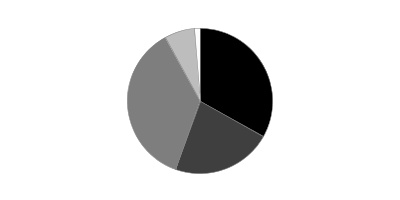
Fidelity Freedom® Index 2025 Fund
Schedule of Investments March 31, 2022
Showing Percentage of Net Assets
| Domestic Equity Funds - 33.2% | | | |
| | | Shares | Value |
| Fidelity Series Total Market Index Fund (a) | | | |
| (Cost $3,165,717,986) | | 299,542,589 | 4,523,093,091 |
|
| International Equity Funds - 22.2% | | | |
| Fidelity Series Global ex U.S. Index Fund (a) | | | |
| (Cost $2,700,857,438) | | 213,758,204 | 3,024,678,588 |
|
| Bond Funds - 36.6% | | | |
| Fidelity Series Bond Index Fund (a) | | 399,700,141 | 3,905,070,373 |
| Fidelity Series International Developed Markets Bond Index Fund (a) | | 57,275,646 | 534,381,781 |
| Fidelity Series Long-Term Treasury Bond Index Fund (a) | | 71,660,697 | 546,054,510 |
| TOTAL BOND FUNDS | | | |
| (Cost $5,307,898,126) | | | 4,985,506,664 |
|
| Inflation-Protected Bond Funds - 6.8% | | | |
| Fidelity Series 5+ Year Inflation-Protected Bond Index Fund (a) | | 82,237,671 | 789,481,643 |
| Fidelity Series Inflation-Protected Bond Index Fund (a) | | 12,726,135 | 129,170,269 |
| TOTAL INFLATION-PROTECTED BOND FUNDS | | | |
| (Cost $940,109,280) | | | 918,651,912 |
|
| Short-Term Funds - 1.2% | | | |
| Fidelity Series Treasury Bill Index Fund (a) | | | |
| (Cost $164,823,657) | | 16,488,917 | 164,724,284 |
| TOTAL INVESTMENT IN SECURITIES - 100.0% | | | |
| (Cost $12,279,406,487) | | | 13,616,654,539 |
| NET OTHER ASSETS (LIABILITIES) - 0.0% | | | (817,338) |
| NET ASSETS - 100% | | | $13,615,837,201 |
Legend
(a) Affiliated Fund
Affiliated Underlying Funds
Fiscal year to date information regarding the Fund's investments in affiliated Underlying Funds is presented below. Exchanges between classes of the same affiliated Underlying Funds may occur. If an underlying Fund changes its name, the name presented below is the name in effect at period end.
| Affiliate | Value, beginning of period | Purchases(a) | Sales Proceeds(a) | Dividend Income | Realized Gain (loss) | Change in Unrealized appreciation (depreciation) | Value, end of period |
| Fidelity Series 5+ Year Inflation-Protected Bond Index Fund | $-- | $830,549,145 | $14,023,013 | $3,407,981 | $(78,068) | $(26,966,421) | $789,481,643 |
| Fidelity Series Bond Index Fund | 3,348,904,582 | 1,406,508,284 | 607,061,038 | 62,576,394 | (13,406,716) | (229,874,739) | 3,905,070,373 |
| Fidelity Series Global ex U.S. Index Fund | 2,501,416,124 | 1,030,050,431 | 341,883,045 | 81,418,086 | (1,981,936) | (162,922,986) | 3,024,678,588 |
| Fidelity Series Inflation-Protected Bond Index Fund | 475,210,437 | 164,078,220 | 501,803,673 | 31,118,179 | 11,322,358 | (19,637,073) | 129,170,269 |
| Fidelity Series International Developed Markets Bond Index Fund | -- | 567,444,667 | 9,812,640 | 173,011 | (120,964) | (23,129,282) | 534,381,781 |
| Fidelity Series Long-Term Treasury Bond Index Fund | 326,294,743 | 289,756,048 | 39,169,950 | 10,257,059 | (4,977,305) | (25,849,026) | 546,054,510 |
| Fidelity Series Total Market Index Fund | 3,747,228,265 | 1,394,048,626 | 1,006,759,021 | 73,274,897 | 13,307,520 | 375,267,701 | 4,523,093,091 |
| Fidelity Series Treasury Bill Index Fund | 557,408,970 | 197,678,619 | 590,046,662 | 387,682 | (377,446) | 60,803 | 164,724,284 |
| | $10,956,463,121 | $5,880,114,040 | $3,110,559,042 | $262,613,289 | $3,687,443 | $(113,051,023) | $13,616,654,539 |
(a) Includes the value of shares purchased or redeemed through in-kind transactions, if applicable.
Amounts in the income column in the above table include any capital gain distributions from underlying funds, which are presented in the corresponding line-item in the Statement of Operations, if applicable.
Investment Valuation
The following is a summary of the inputs used, as of March 31, 2022, involving the Fund's assets and liabilities carried at fair value. The inputs or methodology used for valuing securities may not be an indication of the risk associated with investing in those securities. For more information on valuation inputs, and their aggregation into the levels used below, please refer to the Investment Valuation section in the accompanying Notes to Financial Statements.
| | Valuation Inputs at Reporting Date: |
| Description | Total | Level 1 | Level 2 | Level 3 |
| Investments in Securities: | | | | |
| Domestic Equity Funds | $4,523,093,091 | $4,523,093,091 | $-- | $-- |
| International Equity Funds | 3,024,678,588 | 3,024,678,588 | -- | -- |
| Bond Funds | 5,904,158,576 | 5,904,158,576 | -- | -- |
| Short-Term Funds | 164,724,284 | 164,724,284 | -- | -- |
| Total Investments in Securities: | $13,616,654,539 | $13,616,654,539 | $-- | $-- |
See accompanying notes which are an integral part of the financial statements.
Fidelity Freedom® Index 2025 Fund
Financial Statements
Statement of Assets and Liabilities
| | | March 31, 2022 |
| Assets | | |
Investment in securities, at value — See accompanying schedule:
| | |
| Affiliated issuers (cost $12,279,406,487) | $13,616,654,539 | |
| Total Investment in Securities (cost $12,279,406,487) | | $13,616,654,539 |
| Cash | | 11,193 |
| Receivable for investments sold | | 321,511,971 |
| Receivable for fund shares sold | | 13,601,372 |
| Total assets | | 13,951,779,075 |
| Liabilities | | |
| Payable for investments purchased | $325,934,627 | |
| Payable for fund shares redeemed | 9,222,519 | |
| Accrued management fee | 784,728 | |
| Total liabilities | | 335,941,874 |
| Net Assets | | $13,615,837,201 |
| Net Assets consist of: | | |
| Paid in capital | | $12,304,624,494 |
| Total accumulated earnings (loss) | | 1,311,212,707 |
| Net Assets | | $13,615,837,201 |
| Net Asset Value and Maximum Offering Price | | |
| Investor Class: | | |
| Net Asset Value, offering price and redemption price per share ($2,585,677,632 ÷ 139,879,995 shares) | | $18.48 |
| Institutional Premium Class: | | |
| Net Asset Value, offering price and redemption price per share ($8,419,297,732 ÷ 455,578,788 shares) | | $18.48 |
| Premier Class: | | |
| Net Asset Value, offering price and redemption price per share ($2,610,861,837 ÷ 141,331,466 shares) | | $18.47 |
See accompanying notes which are an integral part of the financial statements.
Statement of Operations
| | | Year ended March 31, 2022 |
| Investment Income | | |
| Dividends: | | |
| Affiliated issuers | | $236,318,730 |
| Expenses | | |
| Management fee | $10,951,133 | |
| Independent trustees' fees and expenses | 37,666 | |
| Total expenses before reductions | 10,988,799 | |
| Expense reductions | (5) | |
| Total expenses after reductions | | 10,988,794 |
| Net investment income (loss) | | 225,329,936 |
| Realized and Unrealized Gain (Loss) | | |
| Net realized gain (loss) on: | | |
| Investment securities: | | |
| Affiliated issuers | 3,687,443 | |
| Capital gain distributions from underlying funds: | | |
| Affiliated issuers | 26,294,559 | |
| Total net realized gain (loss) | | 29,982,002 |
| Change in net unrealized appreciation (depreciation) on: | | |
| Investment securities: | | |
| Affiliated issuers | (113,051,023) | |
| Total change in net unrealized appreciation (depreciation) | | (113,051,023) |
| Net gain (loss) | | (83,069,021) |
| Net increase (decrease) in net assets resulting from operations | | $142,260,915 |
See accompanying notes which are an integral part of the financial statements.
Statement of Changes in Net Assets
| | Year ended March 31, 2022 | Year ended March 31, 2021 |
| Increase (Decrease) in Net Assets | | |
| Operations | | |
| Net investment income (loss) | $225,329,936 | $132,013,268 |
| Net realized gain (loss) | 29,982,002 | 95,502,123 |
| Change in net unrealized appreciation (depreciation) | (113,051,023) | 1,893,692,603 |
| Net increase (decrease) in net assets resulting from operations | 142,260,915 | 2,121,207,994 |
| Distributions to shareholders | (295,764,675) | (226,997,470) |
| Share transactions - net increase (decrease) | 2,813,645,955 | 2,651,196,550 |
| Total increase (decrease) in net assets | 2,660,142,195 | 4,545,407,074 |
| Net Assets | | |
| Beginning of period | 10,955,695,006 | 6,410,287,932 |
| End of period | $13,615,837,201 | $10,955,695,006 |
See accompanying notes which are an integral part of the financial statements.
Financial Highlights
Fidelity Freedom Index 2025 Fund Investor Class
| Years ended March 31, | 2022 | 2021 | 2020 | 2019 | 2018 |
| Selected Per–Share Data | | | | | |
| Net asset value, beginning of period | $18.52 | $14.57 | $17.05 | $16.67 | $15.50 |
| Income from Investment Operations | | | | | |
| Net investment income (loss)A,B | .33 | .25 | .33 | .36 | .31 |
| Net realized and unrealized gain (loss) | .04C | 4.13 | (.54) | .38 | 1.17 |
| Total from investment operations | .37 | 4.38 | (.21) | .74 | 1.48 |
| Distributions from net investment income | (.30) | (.25) | (.31) | (.34) | (.29) |
| Distributions from net realized gain | (.12) | (.18) | (1.96) | (.03) | (.02) |
| Total distributions | (.41)D | (.43) | (2.27) | (.36)D | (.31) |
| Net asset value, end of period | $18.48 | $18.52 | $14.57 | $17.05 | $16.67 |
| Total ReturnE | 1.91% | 30.27% | (2.75)% | 4.64% | 9.53% |
| Ratios to Average Net AssetsB,F,G | | | | | |
| Expenses before reductions | .12% | .12% | .12% | .15% | .15% |
| Expenses net of fee waivers, if any | .12% | .12% | .12% | .11% | .12% |
| Expenses net of all reductions | .12% | .12% | .12% | .11% | .12% |
| Net investment income (loss) | 1.71% | 1.46% | 1.93% | 2.13% | 1.91% |
| Supplemental Data | | | | | |
| Net assets, end of period (000 omitted) | $2,585,678 | $5,538,556 | $3,443,936 | $2,382,206 | $1,761,022 |
| Portfolio turnover rateH | 24% | 26% | 82% | 19% | 9% |
A Calculated based on average shares outstanding during the period.
B Net investment income (loss) is affected by the timing of the declaration of dividends by any underlying mutual funds or exchange-traded funds (ETFs). Net investment income (loss) of any such underlying funds is not included in the Fund's net investment income (loss) ratio.
C The amount shown for a share outstanding does not correspond with the aggregate net gain (loss) on investments for the period due to the timing of sales and repurchases of shares in relation to fluctuating market values of the investments of the Fund.
D Total distributions per share do not sum due to rounding.
E Total returns would have been lower if certain expenses had not been reduced during the applicable periods shown.
F Fees and expenses of any underlying mutual funds or exchange-traded funds (ETFs) are not included in the Fund's expense ratio. The Fund indirectly bears its proportionate share of these expenses.
G Expense ratios reflect operating expenses of the class. Expenses before reductions do not reflect amounts reimbursed, waived, or reduced through arrangements with the investment adviser, brokerage services, or other offset arrangements, if applicable, and do not represent the amount paid by the class during periods when reimbursements, waivers or reductions occur.
H Amount does not include the portfolio activity of any underlying mutual funds or exchange-traded funds (ETFs).
See accompanying notes which are an integral part of the financial statements.
Fidelity Freedom Index 2025 Fund Institutional Premium Class
| Years ended March 31, | 2022 | 2021 | 2020 | 2019 | 2018 |
| Selected Per–Share Data | | | | | |
| Net asset value, beginning of period | $18.53 | $14.57 | $17.05 | $16.67 | $15.50 |
| Income from Investment Operations | | | | | |
| Net investment income (loss)A,B | .34 | .26 | .34 | .37 | .32 |
| Net realized and unrealized gain (loss) | .04C | 4.14 | (.54) | .38 | 1.17 |
| Total from investment operations | .38 | 4.40 | (.20) | .75 | 1.49 |
| Distributions from net investment income | (.32) | (.26) | (.32) | (.34) | (.30) |
| Distributions from net realized gain | (.12) | (.18) | (1.96) | (.03) | (.02) |
| Total distributions | (.43)D | (.44) | (2.28) | (.37) | (.32) |
| Net asset value, end of period | $18.48 | $18.53 | $14.57 | $17.05 | $16.67 |
| Total ReturnE | 1.96% | 30.37% | (2.71)% | 4.70% | 9.58% |
| Ratios to Average Net AssetsB,F,G | | | | | |
| Expenses before reductions | .08% | .08% | .08% | .10% | .10% |
| Expenses net of fee waivers, if any | .08% | .08% | .08% | .05% | .07% |
| Expenses net of all reductions | .08% | .08% | .08% | .05% | .07% |
| Net investment income (loss) | 1.75% | 1.50% | 1.97% | 2.19% | 1.96% |
| Supplemental Data | | | | | |
| Net assets, end of period (000 omitted) | $8,419,298 | $4,504,542 | $2,966,352 | $2,380,799 | $1,856,410 |
| Portfolio turnover rateH | 24% | 26% | 82% | 19% | 9% |
A Calculated based on average shares outstanding during the period.
B Net investment income (loss) is affected by the timing of the declaration of dividends by any underlying mutual funds or exchange-traded funds (ETFs). Net investment income (loss) of any such underlying funds is not included in the Fund's net investment income (loss) ratio.
C The amount shown for a share outstanding does not correspond with the aggregate net gain (loss) on investments for the period due to the timing of sales and repurchases of shares in relation to fluctuating market values of the investments of the Fund.
D Total distributions per share do not sum due to rounding.
E Total returns would have been lower if certain expenses had not been reduced during the applicable periods shown.
F Fees and expenses of any underlying mutual funds or exchange-traded funds (ETFs) are not included in the Fund's expense ratio. The Fund indirectly bears its proportionate share of these expenses.
G Expense ratios reflect operating expenses of the class. Expenses before reductions do not reflect amounts reimbursed, waived, or reduced through arrangements with the investment adviser, brokerage services, or other offset arrangements, if applicable, and do not represent the amount paid by the class during periods when reimbursements, waivers or reductions occur.
H Amount does not include the portfolio activity of any underlying mutual funds or exchange-traded funds (ETFs).
See accompanying notes which are an integral part of the financial statements.
Fidelity Freedom Index 2025 Fund Premier Class
| Years ended March 31, | 2022 | 2021 A |
| Selected Per–Share Data | | |
| Net asset value, beginning of period | $18.52 | $16.14 |
| Income from Investment Operations | | |
| Net investment income (loss)B,C | .34 | .35 |
| Net realized and unrealized gain (loss) | .05D | 2.38 |
| Total from investment operations | .39 | 2.73 |
| Distributions from net investment income | (.32) | (.23) |
| Distributions from net realized gain | (.12) | (.12) |
| Total distributions | (.44) | (.35) |
| Net asset value, end of period | $18.47 | $18.52 |
| Total ReturnE,F | 1.98% | 16.94% |
| Ratios to Average Net AssetsC,G,H | | |
| Expenses before reductions | .06% | .06%I |
| Expenses net of fee waivers, if any | .06% | .06%I |
| Expenses net of all reductions | .06% | .06%I |
| Net investment income (loss) | 1.77% | 2.53%I |
| Supplemental Data | | |
| Net assets, end of period (000 omitted) | $2,610,862 | $912,597 |
| Portfolio turnover rateJ | 24% | 26% |
A For the period June 24, 2020 (commencement of sale of shares) through March 31, 2021.
B Calculated based on average shares outstanding during the period.
C Net investment income (loss) is affected by the timing of the declaration of dividends by any underlying mutual funds or exchange-traded funds (ETFs). Net investment income (loss) of any such underlying funds is not included in the Fund's net investment income (loss) ratio.
D The amount shown for a share outstanding does not correspond with the aggregate net gain (loss) on investments for the period due to the timing of sales and repurchases of shares in relation to fluctuating market values of the investments of the Fund.
E Total returns for periods of less than one year are not annualized.
F Total returns would have been lower if certain expenses had not been reduced during the applicable periods shown.
G Fees and expenses of any underlying mutual funds or exchange-traded funds (ETFs) are not included in the Fund's expense ratio. The Fund indirectly bears its proportionate share of these expenses.
H Expense ratios reflect operating expenses of the class. Expenses before reductions do not reflect amounts reimbursed, waived, or reduced through arrangements with the investment adviser, brokerage services, or other offset arrangements, if applicable, and do not represent the amount paid by the class during periods when reimbursements, waivers or reductions occur.
I Annualized
J Amount does not include the portfolio activity of any underlying mutual funds or exchange-traded funds (ETFs).
See accompanying notes which are an integral part of the financial statements.
Fidelity Freedom® Index 2030 Fund
Investment Summary (Unaudited)
The information in the following tables is based on the direct investments of the Fund.
Top Holdings as of March 31, 2022
| | % of fund's net assets |
| Fidelity Series Total Market Index Fund | 37.2 |
| Fidelity Series Bond Index Fund | 25.9 |
| Fidelity Series Global ex U.S. Index Fund | 24.8 |
| Fidelity Series Long-Term Treasury Bond Index Fund | 4.4 |
| Fidelity Series International Developed Markets Bond Index Fund | 3.9 |
| Fidelity Series 5+ Year Inflation-Protected Bond Index Fund | 2.5 |
| Fidelity Series Inflation-Protected Bond Index Fund | 0.8 |
| Fidelity Series Treasury Bill Index Fund | 0.5 |
| | 100.0 |
Asset Allocation (% of fund's net assets)
| Period end |
| | Domestic Equity Funds | 37.2% |
| | International Equity Funds | 24.8% |
| | Bond Funds | 34.2% |
| | Inflation-Protected Bond Funds | 3.3% |
| | Short-Term Funds | 0.5% |
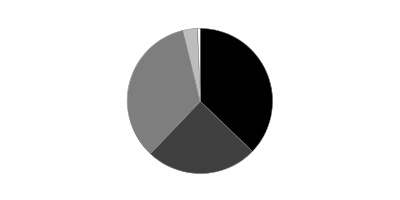
Fidelity Freedom® Index 2030 Fund
Schedule of Investments March 31, 2022
Showing Percentage of Net Assets
| Domestic Equity Funds - 37.2% | | | |
| | | Shares | Value |
| Fidelity Series Total Market Index Fund (a) | | | |
| (Cost $4,429,636,392) | | 414,918,894 | 6,265,275,295 |
|
| International Equity Funds - 24.8% | | | |
| Fidelity Series Global ex U.S. Index Fund (a) | | | |
| (Cost $3,756,268,762) | | 295,382,943 | 4,179,668,637 |
|
| Bond Funds - 34.2% | | | |
| Fidelity Series Bond Index Fund (a) | | 447,529,419 | 4,372,362,421 |
| Fidelity Series International Developed Markets Bond Index Fund (a) | | 70,667,699 | 659,329,633 |
| Fidelity Series Long-Term Treasury Bond Index Fund (a) | | 96,459,886 | 735,024,329 |
| TOTAL BOND FUNDS | | | |
| (Cost $6,146,115,947) | | | 5,766,716,383 |
|
| Inflation-Protected Bond Funds - 3.3% | | | |
| Fidelity Series 5+ Year Inflation-Protected Bond Index Fund (a) | | 43,498,181 | 417,582,533 |
| Fidelity Series Inflation-Protected Bond Index Fund (a) | | 13,276,616 | 134,757,656 |
| TOTAL INFLATION-PROTECTED BOND FUNDS | | | |
| (Cost $561,377,499) | | | 552,340,189 |
|
| Short-Term Funds - 0.5% | | | |
| Fidelity Series Treasury Bill Index Fund (a) | | | |
| (Cost $93,623,522) | | 9,362,482 | 93,531,191 |
| TOTAL INVESTMENT IN SECURITIES - 100.0% | | | |
| (Cost $14,987,022,122) | | | 16,857,531,695 |
| NET OTHER ASSETS (LIABILITIES) - 0.0% | | | (971,353) |
| NET ASSETS - 100% | | | $16,856,560,342 |
Legend
(a) Affiliated Fund
Affiliated Central Funds
Fiscal year to date information regarding the Fund's investments in Fidelity Central Funds, including the ownership percentage, is presented below.
| Fund | Value, beginning of period | Purchases | Sales Proceeds | Dividend Income | Realized Gain/Loss | Change in Unrealized appreciation (depreciation) | Value, end of period | % ownership, end of period |
| Fidelity Cash Central Fund 0.31% | $16,109 | $-- | $16,109 | $6 | $-- | $-- | $-- | 0.0% |
| Total | $16,109 | $-- | $16,109 | $6 | $-- | $-- | $-- | |
Amounts in the income column in the above table include any capital gain distributions from underlying funds, which are presented in the corresponding line-item in the Statement of Operations, if applicable.
Affiliated Underlying Funds
Fiscal year to date information regarding the Fund's investments in affiliated Underlying Funds is presented below. Exchanges between classes of the same affiliated Underlying Funds may occur. If an underlying Fund changes its name, the name presented below is the name in effect at period end.
| Affiliate | Value, beginning of period | Purchases(a) | Sales Proceeds(a) | Dividend Income | Realized Gain (loss) | Change in Unrealized appreciation (depreciation) | Value, end of period |
| Fidelity Series 5+ Year Inflation-Protected Bond Index Fund | $-- | $435,671,869 | $4,385,201 | $1,654,021 | $(29,447) | $(13,674,688) | $417,582,533 |
| Fidelity Series Bond Index Fund | 3,610,297,232 | 1,700,541,354 | 667,377,584 | 69,248,749 | (13,750,289) | (257,348,292) | 4,372,362,421 |
| Fidelity Series Global ex U.S. Index Fund | 3,374,575,088 | 1,466,334,564 | 432,053,011 | 110,305,197 | (3,344,408) | (225,843,596) | 4,179,668,637 |
| Fidelity Series Inflation-Protected Bond Index Fund | 469,012,165 | 177,487,302 | 502,848,536 | 31,612,681 | 8,228,213 | (17,121,488) | 134,757,656 |
| Fidelity Series International Developed Markets Bond Index Fund | -- | 695,408,570 | 7,676,446 | 207,109 | (67,659) | (28,334,832) | 659,329,633 |
| Fidelity Series Long-Term Treasury Bond Index Fund | 389,408,709 | 429,358,022 | 40,932,140 | 12,917,147 | (5,402,683) | (37,407,579) | 735,024,329 |
| Fidelity Series Total Market Index Fund | 5,056,994,345 | 1,955,989,699 | 1,274,018,785 | 99,207,841 | 12,130,590 | 514,179,446 | 6,265,275,295 |
| Fidelity Series Treasury Bill Index Fund | 172,371,179 | 156,133,902 | 234,803,904 | 182,038 | (163,402) | (6,584) | 93,531,191 |
| | $13,072,658,718 | $7,016,925,282 | $3,164,095,607 | $325,334,783 | $(2,399,085) | $(65,557,613) | $16,857,531,695 |
(a) Includes the value of shares purchased or redeemed through in-kind transactions, if applicable.
Amounts in the income column in the above table include any capital gain distributions from underlying funds, which are presented in the corresponding line-item in the Statement of Operations, if applicable.
Investment Valuation
The following is a summary of the inputs used, as of March 31, 2022, involving the Fund's assets and liabilities carried at fair value. The inputs or methodology used for valuing securities may not be an indication of the risk associated with investing in those securities. For more information on valuation inputs, and their aggregation into the levels used below, please refer to the Investment Valuation section in the accompanying Notes to Financial Statements.
| | Valuation Inputs at Reporting Date: |
| Description | Total | Level 1 | Level 2 | Level 3 |
| Investments in Securities: | | | | |
| Domestic Equity Funds | $6,265,275,295 | $6,265,275,295 | $-- | $-- |
| International Equity Funds | 4,179,668,637 | 4,179,668,637 | -- | -- |
| Bond Funds | 6,319,056,572 | 6,319,056,572 | -- | -- |
| Short-Term Funds | 93,531,191 | 93,531,191 | -- | -- |
| Total Investments in Securities: | $16,857,531,695 | $16,857,531,695 | $-- | $-- |
See accompanying notes which are an integral part of the financial statements.
Fidelity Freedom® Index 2030 Fund
Financial Statements
Statement of Assets and Liabilities
| | | March 31, 2022 |
| Assets | | |
Investment in securities, at value — See accompanying schedule:
| | |
| Affiliated issuers (cost $14,987,022,122) | $16,857,531,695 | |
| Total Investment in Securities (cost $14,987,022,122) | | $16,857,531,695 |
| Cash | | 16,116 |
| Receivable for investments sold | | 341,160,506 |
| Receivable for fund shares sold | | 14,395,889 |
| Other receivables | | 16,722 |
| Total assets | | 17,213,120,928 |
| Liabilities | | |
| Payable for investments purchased | $342,688,790 | |
| Payable for fund shares redeemed | 12,922,670 | |
| Accrued management fee | 932,399 | |
| Other payables and accrued expenses | 16,727 | |
| Total liabilities | | 356,560,586 |
| Net Assets | | $16,856,560,342 |
| Net Assets consist of: | | |
| Paid in capital | | $15,019,564,526 |
| Total accumulated earnings (loss) | | 1,836,995,816 |
| Net Assets | | $16,856,560,342 |
| Net Asset Value and Maximum Offering Price | | |
| Investor Class: | | |
| Net Asset Value, offering price and redemption price per share ($2,775,099,764 ÷ 142,226,239 shares) | | $19.51 |
| Institutional Premium Class: | | |
| Net Asset Value, offering price and redemption price per share ($10,927,825,308 ÷ 560,253,298 shares) | | $19.51 |
| Premier Class: | | |
| Net Asset Value, offering price and redemption price per share ($3,153,635,270 ÷ 161,731,507 shares) | | $19.50 |
See accompanying notes which are an integral part of the financial statements.
Statement of Operations
| | | Year ended March 31, 2022 |
| Investment Income | | |
| Dividends: | | |
| Affiliated issuers | | $292,052,501 |
| Income from Fidelity Central Funds | | 6 |
| Total income | | 292,052,507 |
| Expenses | | |
| Management fee | $13,088,077 | |
| Independent trustees' fees and expenses | 45,685 | |
| Total expenses before reductions | 13,133,762 | |
| Expense reductions | (4) | |
| Total expenses after reductions | | 13,133,758 |
| Net investment income (loss) | | 278,918,749 |
| Realized and Unrealized Gain (Loss) | | |
| Net realized gain (loss) on: | | |
| Investment securities: | | |
| Affiliated issuers | (2,399,085) | |
| Capital gain distributions from underlying funds: | | |
| Affiliated issuers | 33,282,282 | |
| Total net realized gain (loss) | | 30,883,197 |
| Change in net unrealized appreciation (depreciation) on: | | |
| Investment securities: | | |
| Affiliated issuers | (65,557,613) | |
| Total change in net unrealized appreciation (depreciation) | | (65,557,613) |
| Net gain (loss) | | (34,674,416) |
| Net increase (decrease) in net assets resulting from operations | | $244,244,333 |
See accompanying notes which are an integral part of the financial statements.
Statement of Changes in Net Assets
| | Year ended March 31, 2022 | Year ended March 31, 2021 |
| Increase (Decrease) in Net Assets | | |
| Operations | | |
| Net investment income (loss) | $278,918,749 | $163,704,383 |
| Net realized gain (loss) | 30,883,197 | 109,348,941 |
| Change in net unrealized appreciation (depreciation) | (65,557,613) | 2,603,399,307 |
| Net increase (decrease) in net assets resulting from operations | 244,244,333 | 2,876,452,631 |
| Distributions to shareholders | (363,829,645) | (273,862,053) |
| Share transactions - net increase (decrease) | 3,904,360,091 | 2,974,151,980 |
| Total increase (decrease) in net assets | 3,784,774,779 | 5,576,742,558 |
| Net Assets | | |
| Beginning of period | 13,071,785,563 | 7,495,043,005 |
| End of period | $16,856,560,342 | $13,071,785,563 |
See accompanying notes which are an integral part of the financial statements.
Financial Highlights
Fidelity Freedom Index 2030 Fund Investor Class
| Years ended March 31, | 2022 | 2021 | 2020 | 2019 | 2018 |
| Selected Per–Share Data | | | | | |
| Net asset value, beginning of period | $19.45 | $14.73 | $17.99 | $17.57 | $16.07 |
| Income from Investment Operations | | | | | |
| Net investment income (loss)A,B | .35 | .27 | .34 | .38 | .33 |
| Net realized and unrealized gain (loss) | .15C | 4.91 | (.74) | .41 | 1.50 |
| Total from investment operations | .50 | 5.18 | (.40) | .79 | 1.83 |
| Distributions from net investment income | (.32) | (.27) | (.33) | (.36) | (.31) |
| Distributions from net realized gain | (.12) | (.19) | (2.53) | (.01) | (.01) |
| Total distributions | (.44) | (.46) | (2.86) | (.37) | (.33)D |
| Net asset value, end of period | $19.51 | $19.45 | $14.73 | $17.99 | $17.57 |
| Total ReturnE | 2.47% | 35.36% | (4.38)% | 4.71% | 11.35% |
| Ratios to Average Net AssetsB,F,G | | | | | |
| Expenses before reductions | .12% | .12% | .12% | .15% | .15% |
| Expenses net of fee waivers, if any | .12% | .12% | .12% | .11% | .12% |
| Expenses net of all reductions | .12% | .12% | .12% | .11% | .12% |
| Net investment income (loss) | 1.74% | 1.52% | 1.92% | 2.14% | 1.92% |
| Supplemental Data | | | | | |
| Net assets, end of period (000 omitted) | $2,775,100 | $6,036,702 | $3,610,892 | $2,500,479 | $1,856,566 |
| Portfolio turnover rateH | 20% | 26% | 85% | 14% | 9% |
A Calculated based on average shares outstanding during the period.
B Net investment income (loss) is affected by the timing of the declaration of dividends by any underlying mutual funds or exchange-traded funds (ETFs). Net investment income (loss) of any such underlying funds is not included in the Fund's net investment income (loss) ratio.
C The amount shown for a share outstanding does not correspond with the aggregate net gain (loss) on investments for the period due to the timing of sales and repurchases of shares in relation to fluctuating market values of the investments of the Fund.
D Total distributions per share do not sum due to rounding.
E Total returns would have been lower if certain expenses had not been reduced during the applicable periods shown.
F Fees and expenses of any underlying mutual funds or exchange-traded funds (ETFs) are not included in the Fund's expense ratio. The Fund indirectly bears its proportionate share of these expenses. For additional expense information related to investments in Fidelity Central Funds, please refer to the "Investments in Fidelity Central Funds" note found in the Notes to Financial Statements section of the most recent Annual or Semi-Annual report.
G Expense ratios reflect operating expenses of the class. Expenses before reductions do not reflect amounts reimbursed, waived, or reduced through arrangements with the investment adviser, brokerage services, or other offset arrangements, if applicable, and do not represent the amount paid by the class during periods when reimbursements, waivers or reductions occur.
H Amount does not include the portfolio activity of any underlying mutual funds or exchange-traded funds (ETFs).
See accompanying notes which are an integral part of the financial statements.
Fidelity Freedom Index 2030 Fund Institutional Premium Class
| Years ended March 31, | 2022 | 2021 | 2020 | 2019 | 2018 |
| Selected Per–Share Data | | | | | |
| Net asset value, beginning of period | $19.45 | $14.73 | $18.00 | $17.57 | $16.07 |
| Income from Investment Operations | | | | | |
| Net investment income (loss)A,B | .36 | .28 | .35 | .39 | .34 |
| Net realized and unrealized gain (loss) | .16C | 4.90 | (.75) | .42 | 1.49 |
| Total from investment operations | .52 | 5.18 | (.40) | .81 | 1.83 |
| Distributions from net investment income | (.34) | (.27) | (.34) | (.37) | (.32) |
| Distributions from net realized gain | (.12) | (.19) | (2.53) | (.01) | (.01) |
| Total distributions | (.46) | (.46) | (2.87) | (.38) | (.33) |
| Net asset value, end of period | $19.51 | $19.45 | $14.73 | $18.00 | $17.57 |
| Total ReturnD | 2.57% | 35.41% | (4.40)% | 4.82% | 11.39% |
| Ratios to Average Net AssetsB,E,F | | | | | |
| Expenses before reductions | .08% | .08% | .08% | .10% | .10% |
| Expenses net of fee waivers, if any | .08% | .08% | .08% | .05% | .07% |
| Expenses net of all reductions | .08% | .08% | .08% | .05% | .07% |
| Net investment income (loss) | 1.78% | 1.56% | 1.96% | 2.20% | 1.97% |
| Supplemental Data | | | | | |
| Net assets, end of period (000 omitted) | $10,927,825 | $5,916,521 | $3,884,151 | $3,269,588 | $2,642,936 |
| Portfolio turnover rateG | 20% | 26% | 85% | 14% | 9% |
A Calculated based on average shares outstanding during the period.
B Net investment income (loss) is affected by the timing of the declaration of dividends by any underlying mutual funds or exchange-traded funds (ETFs). Net investment income (loss) of any such underlying funds is not included in the Fund's net investment income (loss) ratio.
C The amount shown for a share outstanding does not correspond with the aggregate net gain (loss) on investments for the period due to the timing of sales and repurchases of shares in relation to fluctuating market values of the investments of the Fund.
D Total returns would have been lower if certain expenses had not been reduced during the applicable periods shown.
E Fees and expenses of any underlying mutual funds or exchange-traded funds (ETFs) are not included in the Fund's expense ratio. The Fund indirectly bears its proportionate share of these expenses. For additional expense information related to investments in Fidelity Central Funds, please refer to the "Investments in Fidelity Central Funds" note found in the Notes to Financial Statements section of the most recent Annual or Semi-Annual report.
F Expense ratios reflect operating expenses of the class. Expenses before reductions do not reflect amounts reimbursed, waived, or reduced through arrangements with the investment adviser, brokerage services, or other offset arrangements, if applicable, and do not represent the amount paid by the class during periods when reimbursements, waivers or reductions occur.
G Amount does not include the portfolio activity of any underlying mutual funds or exchange-traded funds (ETFs).
See accompanying notes which are an integral part of the financial statements.
Fidelity Freedom Index 2030 Fund Premier Class
| Years ended March 31, | 2022 | 2021 A |
| Selected Per–Share Data | | |
| Net asset value, beginning of period | $19.45 | $16.56 |
| Income from Investment Operations | | |
| Net investment income (loss)B,C | .36 | .39 |
| Net realized and unrealized gain (loss) | .16D | 2.88 |
| Total from investment operations | .52 | 3.27 |
| Distributions from net investment income | (.34) | (.26) |
| Distributions from net realized gain | (.12) | (.12) |
| Total distributions | (.47)E | (.38) |
| Net asset value, end of period | $19.50 | $19.45 |
| Total ReturnF,G | 2.54% | 19.78% |
| Ratios to Average Net AssetsC,H,I | | |
| Expenses before reductions | .06% | .06%J |
| Expenses net of fee waivers, if any | .06% | .06%J |
| Expenses net of all reductions | .06% | .06%J |
| Net investment income (loss) | 1.80% | 2.66%J |
| Supplemental Data | | |
| Net assets, end of period (000 omitted) | $3,153,635 | $1,118,562 |
| Portfolio turnover rateK | 20% | 26% |
A For the period June 24, 2020 (commencement of sale of shares) through March 31, 2021.
B Calculated based on average shares outstanding during the period.
C Net investment income (loss) is affected by the timing of the declaration of dividends by any underlying mutual funds or exchange-traded funds (ETFs). Net investment income (loss) of any such underlying funds is not included in the Fund's net investment income (loss) ratio.
D The amount shown for a share outstanding does not correspond with the aggregate net gain (loss) on investments for the period due to the timing of sales and repurchases of shares in relation to fluctuating market values of the investments of the Fund.
E Total distributions per share do not sum due to rounding.
F Total returns for periods of less than one year are not annualized.
G Total returns would have been lower if certain expenses had not been reduced during the applicable periods shown.
H Fees and expenses of any underlying mutual funds or exchange-traded funds (ETFs) are not included in the Fund's expense ratio. The Fund indirectly bears its proportionate share of these expenses. For additional expense information related to investments in Fidelity Central Funds, please refer to the "Investments in Fidelity Central Funds" note found in the Notes to Financial Statements section of the most recent Annual or Semi-Annual report.
I Expense ratios reflect operating expenses of the class. Expenses before reductions do not reflect amounts reimbursed, waived, or reduced through arrangements with the investment adviser, brokerage services, or other offset arrangements, if applicable, and do not represent the amount paid by the class during periods when reimbursements, waivers or reductions occur.
J Annualized
K Amount does not include the portfolio activity of any underlying mutual funds or exchange-traded funds (ETFs).
See accompanying notes which are an integral part of the financial statements.
Fidelity Freedom® Index 2035 Fund
Investment Summary (Unaudited)
The information in the following tables is based on the direct investments of the Fund.
Top Holdings as of March 31, 2022
| | % of fund's net assets |
| Fidelity Series Total Market Index Fund | 46.1 |
| Fidelity Series Global ex U.S. Index Fund | 30.8 |
| Fidelity Series Bond Index Fund | 15.9 |
| Fidelity Series Long-Term Treasury Bond Index Fund | 4.6 |
| Fidelity Series International Developed Markets Bond Index Fund | 2.6 |
| Fidelity Cash Central Fund 0.31% | 0.0 |
| | 100.0 |
Asset Allocation (% of fund's net assets)
| Period end |
| | Domestic Equity Funds | 46.1% |
| | International Equity Funds | 30.8% |
| | Bond Funds | 23.1% |

Percentages shown as 0.0% may reflect amounts less than 0.05%.
Fidelity Freedom® Index 2035 Fund
Schedule of Investments March 31, 2022
Showing Percentage of Net Assets
| Domestic Equity Funds - 46.1% | | | |
| | | Shares | Value |
| Fidelity Series Total Market Index Fund (a) | | | |
| (Cost $5,027,445,129) | | 450,460,049 | 6,801,946,745 |
|
| International Equity Funds - 30.8% | | | |
| Fidelity Series Global ex U.S. Index Fund (a) | | | |
| (Cost $4,203,942,133) | | 321,072,705 | 4,543,178,782 |
|
| Bond Funds - 23.1% | | | |
| Fidelity Series Bond Index Fund (a) | | 240,375,882 | 2,348,472,370 |
| Fidelity Series International Developed Markets Bond Index Fund (a) | | 40,857,926 | 381,204,453 |
| Fidelity Series Long-Term Treasury Bond Index Fund (a) | | 89,846,267 | 684,628,552 |
| TOTAL BOND FUNDS | | | |
| (Cost $3,665,209,873) | | | 3,414,305,375 |
|
| Short-Term Funds - 0.0% | | | |
| Fidelity Cash Central Fund 0.31% (b) | | | |
| (Cost $13,423) | | 13,420 | 13,423 |
| TOTAL INVESTMENT IN SECURITIES - 100.0% | | | |
| (Cost $12,896,610,558) | | | 14,759,444,325 |
| NET OTHER ASSETS (LIABILITIES) - 0.0% | | | (790,437) |
| NET ASSETS - 100% | | | $14,758,653,888 |
Legend
(a) Affiliated Fund
(b) Affiliated fund that is generally available only to investment companies and other accounts managed by Fidelity Investments. The rate quoted is the annualized seven-day yield of the fund at period end. A complete unaudited listing of the fund's holdings as of its most recent quarter end is available upon request. In addition, each Fidelity Central Fund's financial statements, which are not covered by the Fund's Report of Independent Registered Public Accounting Firm, are available on the SEC's website or upon request.
Affiliated Central Funds
Fiscal year to date information regarding the Fund's investments in Fidelity Central Funds, including the ownership percentage, is presented below.
| Fund | Value, beginning of period | Purchases | Sales Proceeds | Dividend Income | Realized Gain/Loss | Change in Unrealized appreciation (depreciation) | Value, end of period | % ownership, end of period |
| Fidelity Cash Central Fund 0.31% | $-- | $1,629,231 | $1,615,808 | $9 | $-- | $-- | $13,423 | 0.0% |
| Total | $-- | $1,629,231 | $1,615,808 | $9 | $-- | $-- | $13,423 | |
Amounts in the income column in the above table include any capital gain distributions from underlying funds, which are presented in the corresponding line-item in the Statement of Operations, if applicable.
Affiliated Underlying Funds
Fiscal year to date information regarding the Fund's investments in affiliated Underlying Funds is presented below. Exchanges between classes of the same affiliated Underlying Funds may occur. If an underlying Fund changes its name, the name presented below is the name in effect at period end.
| Affiliate | Value, beginning of period | Purchases | Sales Proceeds | Dividend Income | Realized Gain (loss) | Change in Unrealized appreciation (depreciation) | Value, end of period |
| Fidelity Series Bond Index Fund | $1,827,171,741 | $1,083,723,702 | $415,156,236 | $36,919,327 | $(11,481,926) | $(135,784,911) | $2,348,472,370 |
| Fidelity Series Global ex U.S. Index Fund | 3,398,992,258 | 1,800,385,637 | 399,379,085 | 118,413,048 | (7,414,276) | (249,405,752) | 4,543,178,782 |
| Fidelity Series International Developed Markets Bond Index Fund | -- | 399,924,706 | 2,939,399 | 104,660 | (34,968) | (15,745,886) | 381,204,453 |
| Fidelity Series Long-Term Treasury Bond Index Fund | 318,148,480 | 434,346,658 | 26,169,822 | 11,260,614 | (3,516,833) | (38,179,931) | 684,628,552 |
| Fidelity Series Total Market Index Fund | 5,101,952,389 | 2,271,456,970 | 1,104,548,506 | 105,318,211 | 3,304,206 | 529,781,686 | 6,801,946,745 |
| | $10,646,264,868 | $5,989,837,673 | $1,948,193,048 | $272,015,860 | $(19,143,797) | $90,665,206 | $14,759,430,902 |
Amounts in the income column in the above table include any capital gain distributions from underlying funds, which are presented in the corresponding line-item in the Statement of Operations, if applicable.
Investment Valuation
The following is a summary of the inputs used, as of March 31, 2022, involving the Fund's assets and liabilities carried at fair value. The inputs or methodology used for valuing securities may not be an indication of the risk associated with investing in those securities. For more information on valuation inputs, and their aggregation into the levels used below, please refer to the Investment Valuation section in the accompanying Notes to Financial Statements.
| | Valuation Inputs at Reporting Date: |
| Description | Total | Level 1 | Level 2 | Level 3 |
| Investments in Securities: | | | | |
| Domestic Equity Funds | $6,801,946,745 | $6,801,946,745 | $-- | $-- |
| International Equity Funds | 4,543,178,782 | 4,543,178,782 | -- | -- |
| Bond Funds | 3,414,305,375 | 3,414,305,375 | -- | -- |
| Short-Term Funds | 13,423 | 13,423 | -- | -- |
| Total Investments in Securities: | $14,759,444,325 | $14,759,444,325 | $-- | $-- |
See accompanying notes which are an integral part of the financial statements.
Fidelity Freedom® Index 2035 Fund
Financial Statements
Statement of Assets and Liabilities
| | | March 31, 2022 |
| Assets | | |
Investment in securities, at value — See accompanying schedule:
| | |
| Fidelity Central Funds (cost $13,423) | $13,423 | |
| Other affiliated issuers (cost $12,896,597,135) | 14,759,430,902 | |
| Total Investment in Securities (cost $12,896,610,558) | | $14,759,444,325 |
| Receivable for investments sold | | 226,831,227 |
| Receivable for fund shares sold | | 15,451,379 |
| Distributions receivable from Fidelity Central Funds | | 4 |
| Total assets | | 15,001,726,935 |
| Liabilities | | |
| Payable for investments purchased | $229,257,470 | |
| Payable for fund shares redeemed | 13,061,348 | |
| Accrued management fee | 754,229 | |
| Total liabilities | | 243,073,047 |
| Net Assets | | $14,758,653,888 |
| Net Assets consist of: | | |
| Paid in capital | | $12,942,374,856 |
| Total accumulated earnings (loss) | | 1,816,279,032 |
| Net Assets | | $14,758,653,888 |
| Net Asset Value and Maximum Offering Price | | |
| Investor Class: | | |
| Net Asset Value, offering price and redemption price per share ($2,174,421,707 ÷ 99,598,934 shares) | | $21.83 |
| Institutional Premium Class: | | |
| Net Asset Value, offering price and redemption price per share ($9,501,028,673 ÷ 435,313,672 shares) | | $21.83 |
| Premier Class: | | |
| Net Asset Value, offering price and redemption price per share ($3,083,203,508 ÷ 141,272,071 shares) | | $21.82 |
See accompanying notes which are an integral part of the financial statements.
Statement of Operations
| | | Year ended March 31, 2022 |
| Investment Income | | |
| Dividends: | | |
| Affiliated issuers | | $244,255,940 |
| Income from Fidelity Central Funds | | 9 |
| Total income | | 244,255,949 |
| Expenses | | |
| Management fee | $10,911,041 | |
| Independent trustees' fees and expenses | 38,370 | |
| Total expenses before reductions | 10,949,411 | |
| Expense reductions | (4) | |
| Total expenses after reductions | | 10,949,407 |
| Net investment income (loss) | | 233,306,542 |
| Realized and Unrealized Gain (Loss) | | |
| Net realized gain (loss) on: | | |
| Investment securities: | | |
| Affiliated issuers | (19,143,797) | |
| Capital gain distributions from underlying funds: | | |
| Affiliated issuers | 27,759,920 | |
| Total net realized gain (loss) | | 8,616,123 |
| Change in net unrealized appreciation (depreciation) on: | | |
| Investment securities: | | |
| Affiliated issuers | 90,665,206 | |
| Total change in net unrealized appreciation (depreciation) | | 90,665,206 |
| Net gain (loss) | | 99,281,329 |
| Net increase (decrease) in net assets resulting from operations | | $332,587,871 |
See accompanying notes which are an integral part of the financial statements.
Statement of Changes in Net Assets
| | Year ended March 31, 2022 | Year ended March 31, 2021 |
| Increase (Decrease) in Net Assets | | |
| Operations | | |
| Net investment income (loss) | $233,306,542 | $130,045,024 |
| Net realized gain (loss) | 8,616,123 | 58,444,966 |
| Change in net unrealized appreciation (depreciation) | 90,665,206 | 2,454,188,965 |
| Net increase (decrease) in net assets resulting from operations | 332,587,871 | 2,642,678,955 |
| Distributions to shareholders | (289,745,899) | (192,547,604) |
| Share transactions - net increase (decrease) | 4,070,232,386 | 2,838,397,595 |
| Total increase (decrease) in net assets | 4,113,074,358 | 5,288,528,946 |
| Net Assets | | |
| Beginning of period | 10,645,579,530 | 5,357,050,584 |
| End of period | $14,758,653,888 | $10,645,579,530 |
See accompanying notes which are an integral part of the financial statements.
Financial Highlights
Fidelity Freedom Index 2035 Fund Investor Class
| Years ended March 31, | 2022 | 2021 | 2020 | 2019 | 2018 |
| Selected Per–Share Data | | | | | |
| Net asset value, beginning of period | $21.45 | $15.20 | $19.07 | $18.63 | $16.79 |
| Income from Investment Operations | | | | | |
| Net investment income (loss)A,B | .39 | .30 | .36 | .39 | .34 |
| Net realized and unrealized gain (loss) | .44 | 6.40 | (1.26) | .43 | 1.84 |
| Total from investment operations | .83 | 6.70 | (.90) | .82 | 2.18 |
| Distributions from net investment income | (.34) | (.29) | (.33) | (.37) | (.32) |
| Distributions from net realized gain | (.11) | (.16) | (2.64) | (.01) | (.02) |
| Total distributions | (.45) | (.45) | (2.97) | (.38) | (.34) |
| Net asset value, end of period | $21.83 | $21.45 | $15.20 | $19.07 | $18.63 |
| Total ReturnC | 3.76% | 44.28% | (7.39)% | 4.63% | 12.96% |
| Ratios to Average Net AssetsB,D,E | | | | | |
| Expenses before reductions | .12% | .12% | .12% | .15% | .15% |
| Expenses net of fee waivers, if any | .12% | .12% | .12% | .11% | .12% |
| Expenses net of all reductions | .12% | .12% | .12% | .11% | .12% |
| Net investment income (loss) | 1.71% | 1.56% | 1.87% | 2.08% | 1.89% |
| Supplemental Data | | | | | |
| Net assets, end of period (000 omitted) | $2,174,422 | $5,124,327 | $2,844,302 | $2,003,135 | $1,390,826 |
| Portfolio turnover rateF | 15% | 24% | 80% | 10% | 7% |
A Calculated based on average shares outstanding during the period.
B Net investment income (loss) is affected by the timing of the declaration of dividends by any underlying mutual funds or exchange-traded funds (ETFs). Net investment income (loss) of any such underlying funds is not included in the Fund's net investment income (loss) ratio.
C Total returns would have been lower if certain expenses had not been reduced during the applicable periods shown.
D Fees and expenses of any underlying mutual funds or exchange-traded funds (ETFs) are not included in the Fund's expense ratio. The Fund indirectly bears its proportionate share of these expenses. For additional expense information related to investments in Fidelity Central Funds, please refer to the "Investments in Fidelity Central Funds" note found in the Notes to Financial Statements section of the most recent Annual or Semi-Annual report.
E Expense ratios reflect operating expenses of the class. Expenses before reductions do not reflect amounts reimbursed, waived, or reduced through arrangements with the investment adviser, brokerage services, or other offset arrangements, if applicable, and do not represent the amount paid by the class during periods when reimbursements, waivers or reductions occur.
F Amount does not include the portfolio activity of any underlying mutual funds or exchange-traded funds (ETFs).
See accompanying notes which are an integral part of the financial statements.
Fidelity Freedom Index 2035 Fund Institutional Premium Class
| Years ended March 31, | 2022 | 2021 | 2020 | 2019 | 2018 |
| Selected Per–Share Data | | | | | |
| Net asset value, beginning of period | $21.46 | $15.21 | $19.08 | $18.64 | $16.80 |
| Income from Investment Operations | | | | | |
| Net investment income (loss)A,B | .40 | .31 | .37 | .40 | .35 |
| Net realized and unrealized gain (loss) | .44 | 6.39 | (1.26) | .43 | 1.84 |
| Total from investment operations | .84 | 6.70 | (.89) | .83 | 2.19 |
| Distributions from net investment income | (.37) | (.30) | (.34) | (.38) | (.33) |
| Distributions from net realized gain | (.11) | (.16) | (2.64) | (.01) | (.02) |
| Total distributions | (.47)C | (.45)C | (2.98) | (.39) | (.35) |
| Net asset value, end of period | $21.83 | $21.46 | $15.21 | $19.08 | $18.64 |
| Total ReturnD | 3.82% | 44.31% | (7.33)% | 4.69% | 13.00% |
| Ratios to Average Net AssetsB,E,F | | | | | |
| Expenses before reductions | .08% | .08% | .08% | .10% | .10% |
| Expenses net of fee waivers, if any | .08% | .08% | .08% | .05% | .07% |
| Expenses net of all reductions | .08% | .08% | .08% | .05% | .07% |
| Net investment income (loss) | 1.75% | 1.60% | 1.92% | 2.14% | 1.94% |
| Supplemental Data | | | | | |
| Net assets, end of period (000 omitted) | $9,501,029 | $4,357,280 | $2,512,748 | $2,015,039 | $1,522,603 |
| Portfolio turnover rateG | 15% | 24% | 80% | 10% | 7% |
A Calculated based on average shares outstanding during the period.
B Net investment income (loss) is affected by the timing of the declaration of dividends by any underlying mutual funds or exchange-traded funds (ETFs). Net investment income (loss) of any such underlying funds is not included in the Fund's net investment income (loss) ratio.
C Total distributions per share do not sum due to rounding.
D Total returns would have been lower if certain expenses had not been reduced during the applicable periods shown.
E Fees and expenses of any underlying mutual funds or exchange-traded funds (ETFs) are not included in the Fund's expense ratio. The Fund indirectly bears its proportionate share of these expenses. For additional expense information related to investments in Fidelity Central Funds, please refer to the "Investments in Fidelity Central Funds" note found in the Notes to Financial Statements section of the most recent Annual or Semi-Annual report.
F Expense ratios reflect operating expenses of the class. Expenses before reductions do not reflect amounts reimbursed, waived, or reduced through arrangements with the investment adviser, brokerage services, or other offset arrangements, if applicable, and do not represent the amount paid by the class during periods when reimbursements, waivers or reductions occur.
G Amount does not include the portfolio activity of any underlying mutual funds or exchange-traded funds (ETFs).
See accompanying notes which are an integral part of the financial statements.
Fidelity Freedom Index 2035 Fund Premier Class
| Years ended March 31, | 2022 | 2021 A |
| Selected Per–Share Data | | |
| Net asset value, beginning of period | $21.46 | $17.48 |
| Income from Investment Operations | | |
| Net investment income (loss)B,C | .40 | .45 |
| Net realized and unrealized gain (loss) | .44 | 3.92 |
| Total from investment operations | .84 | 4.37 |
| Distributions from net investment income | (.37) | (.29) |
| Distributions from net realized gain | (.11) | (.10) |
| Total distributions | (.48) | (.39) |
| Net asset value, end of period | $21.82 | $21.46 |
| Total ReturnD,E | 3.80% | 25.06% |
| Ratios to Average Net AssetsC,F,G | | |
| Expenses before reductions | .06% | .06%H |
| Expenses net of fee waivers, if any | .06% | .06%H |
| Expenses net of all reductions | .06% | .06%H |
| Net investment income (loss) | 1.77% | 2.86%H |
| Supplemental Data | | |
| Net assets, end of period (000 omitted) | $3,083,204 | $1,163,973 |
| Portfolio turnover rateI | 15% | 24% |
A For the period June 24, 2020 (commencement of sale of shares) through March 31, 2021.
B Calculated based on average shares outstanding during the period.
C Net investment income (loss) is affected by the timing of the declaration of dividends by any underlying mutual funds or exchange-traded funds (ETFs). Net investment income (loss) of any such underlying funds is not included in the Fund's net investment income (loss) ratio.
D Total returns for periods of less than one year are not annualized.
E Total returns would have been lower if certain expenses had not been reduced during the applicable periods shown.
F Fees and expenses of any underlying mutual funds or exchange-traded funds (ETFs) are not included in the Fund's expense ratio. The Fund indirectly bears its proportionate share of these expenses. For additional expense information related to investments in Fidelity Central Funds, please refer to the "Investments in Fidelity Central Funds" note found in the Notes to Financial Statements section of the most recent Annual or Semi-Annual report.
G Expense ratios reflect operating expenses of the class. Expenses before reductions do not reflect amounts reimbursed, waived, or reduced through arrangements with the investment adviser, brokerage services, or other offset arrangements, if applicable, and do not represent the amount paid by the class during periods when reimbursements, waivers or reductions occur.
H Annualized
I Amount does not include the portfolio activity of any underlying mutual funds or exchange-traded funds (ETFs).
See accompanying notes which are an integral part of the financial statements.
Fidelity Freedom® Index 2040 Fund
Investment Summary (Unaudited)
The information in the following tables is based on the direct investments of the Fund.
Top Holdings as of March 31, 2022
| | % of fund's net assets |
| Fidelity Series Total Market Index Fund | 53.4 |
| Fidelity Series Global ex U.S. Index Fund | 35.6 |
| Fidelity Series Bond Index Fund | 5.4 |
| Fidelity Series Long-Term Treasury Bond Index Fund | 4.7 |
| Fidelity Series International Developed Markets Bond Index Fund | 0.9 |
| | 100.0 |
Asset Allocation (% of fund's net assets)
| Period end |
| | Domestic Equity Funds | 53.4% |
| | International Equity Funds | 35.6% |
| | Bond Funds | 11.0% |

Fidelity Freedom® Index 2040 Fund
Schedule of Investments March 31, 2022
Showing Percentage of Net Assets
| Domestic Equity Funds - 53.4% | | | |
| | | Shares | Value |
| Fidelity Series Total Market Index Fund (a) | | | |
| (Cost $5,757,063,140) | | 512,351,188 | 7,736,502,945 |
|
| International Equity Funds - 35.6% | | | |
| Fidelity Series Global ex U.S. Index Fund (a) | | | |
| (Cost $4,792,982,882) | | 365,260,908 | 5,168,441,849 |
|
| Bond Funds - 11.0% | | | |
| Fidelity Series Bond Index Fund (a) | | 80,047,653 | 782,065,574 |
| Fidelity Series International Developed Markets Bond Index Fund (a) | | 14,416,937 | 134,510,022 |
| Fidelity Series Long-Term Treasury Bond Index Fund (a) | | 88,375,508 | 673,421,369 |
| TOTAL BOND FUNDS | | | |
| (Cost $1,721,219,936) | | | 1,589,996,965 |
| TOTAL INVESTMENT IN SECURITIES - 100.0% | | | |
| (Cost $12,271,265,958) | | | 14,494,941,759 |
| NET OTHER ASSETS (LIABILITIES) - 0.0% | | | (693,129) |
| NET ASSETS - 100% | | | $14,494,248,630 |
Legend
(a) Affiliated Fund
Affiliated Central Funds
Fiscal year to date information regarding the Fund's investments in Fidelity Central Funds, including the ownership percentage, is presented below.
| Fund | Value, beginning of period | Purchases | Sales Proceeds | Dividend Income | Realized Gain/Loss | Change in Unrealized appreciation (depreciation) | Value, end of period | % ownership, end of period |
| Fidelity Cash Central Fund 0.31% | $-- | $274,249 | $274,249 | $3 | $-- | $-- | $-- | 0.0% |
| Total | $-- | $274,249 | $274,249 | $3 | $-- | $-- | $-- | |
Amounts in the income column in the above table include any capital gain distributions from underlying funds, which are presented in the corresponding line-item in the Statement of Operations, if applicable.
Affiliated Underlying Funds
Fiscal year to date information regarding the Fund's investments in affiliated Underlying Funds is presented below. Exchanges between classes of the same affiliated Underlying Funds may occur. If an underlying Fund changes its name, the name presented below is the name in effect at period end.
| Affiliate | Value, beginning of period | Purchases | Sales Proceeds | Dividend Income | Realized Gain (loss) | Change in Unrealized appreciation (depreciation) | Value, end of period |
| Fidelity Series Bond Index Fund | $744,967,329 | $318,079,206 | $231,882,053 | $13,659,987 | $(6,679,693) | $(42,419,215) | $782,065,574 |
| Fidelity Series Global ex U.S. Index Fund | 3,829,149,093 | 2,076,603,971 | 443,513,111 | 133,001,371 | (9,699,478) | (284,098,626) | 5,168,441,849 |
| Fidelity Series International Developed Markets Bond Index Fund | -- | 140,876,292 | 1,040,388 | 30,660 | (9,649) | (5,316,233) | 134,510,022 |
| Fidelity Series Long-Term Treasury Bond Index Fund | 318,067,824 | 425,557,811 | 30,018,322 | 11,130,208 | (3,736,927) | (36,449,017) | 673,421,369 |
| Fidelity Series Total Market Index Fund | 5,748,444,670 | 2,383,083,589 | 991,978,656 | 118,397,165 | (249,391) | 597,202,733 | 7,736,502,945 |
| | $10,640,628,916 | $5,344,200,869 | $1,698,432,530 | $276,219,391 | $(20,375,138) | $228,919,642 | $14,494,941,759 |
Amounts in the income column in the above table include any capital gain distributions from underlying funds, which are presented in the corresponding line-item in the Statement of Operations, if applicable.
Investment Valuation
The following is a summary of the inputs used, as of March 31, 2022, involving the Fund's assets and liabilities carried at fair value. The inputs or methodology used for valuing securities may not be an indication of the risk associated with investing in those securities. For more information on valuation inputs, and their aggregation into the levels used below, please refer to the Investment Valuation section in the accompanying Notes to Financial Statements.
| | Valuation Inputs at Reporting Date: |
| Description | Total | Level 1 | Level 2 | Level 3 |
| Investments in Securities: | | | | |
| Domestic Equity Funds | $7,736,502,945 | $7,736,502,945 | $-- | $-- |
| International Equity Funds | 5,168,441,849 | 5,168,441,849 | -- | -- |
| Bond Funds | 1,589,996,965 | 1,589,996,965 | -- | -- |
| Total Investments in Securities: | $14,494,941,759 | $14,494,941,759 | $-- | $-- |
See accompanying notes which are an integral part of the financial statements.
Fidelity Freedom® Index 2040 Fund
Financial Statements
Statement of Assets and Liabilities
| | | March 31, 2022 |
| Assets | | |
Investment in securities, at value — See accompanying schedule:
| | |
| Affiliated issuers (cost $12,271,265,958) | $14,494,941,759 | |
| Total Investment in Securities (cost $12,271,265,958) | | $14,494,941,759 |
| Cash | | 14,328 |
| Receivable for investments sold | | 186,474,240 |
| Receivable for fund shares sold | | 20,654,841 |
| Total assets | | 14,702,085,168 |
| Liabilities | | |
| Payable for investments purchased | $199,040,201 | |
| Payable for fund shares redeemed | 8,103,068 | |
| Accrued management fee | 693,269 | |
| Total liabilities | | 207,836,538 |
| Net Assets | | $14,494,248,630 |
| Net Assets consist of: | | |
| Paid in capital | | $12,315,817,586 |
| Total accumulated earnings (loss) | | 2,178,431,044 |
| Net Assets | | $14,494,248,630 |
| Net Asset Value and Maximum Offering Price | | |
| Investor Class: | | |
| Net Asset Value, offering price and redemption price per share ($1,823,668,011 ÷ 81,792,150 shares) | | $22.30 |
| Institutional Premium Class: | | |
| Net Asset Value, offering price and redemption price per share ($9,622,454,496 ÷ 431,922,907 shares) | | $22.28 |
| Premier Class: | | |
| Net Asset Value, offering price and redemption price per share ($3,048,126,123 ÷ 136,875,545 shares) | | $22.27 |
See accompanying notes which are an integral part of the financial statements.
Statement of Operations
| | | Year ended March 31, 2022 |
| Investment Income | | |
| Dividends: | | |
| Affiliated issuers | | $245,270,007 |
| Income from Fidelity Central Funds | | 3 |
| Total income | | 245,270,010 |
| Expenses | | |
| Management fee | $10,552,930 | |
| Independent trustees' fees and expenses | 38,096 | |
| Total expenses before reductions | 10,591,026 | |
| Expense reductions | (6) | |
| Total expenses after reductions | | 10,591,020 |
| Net investment income (loss) | | 234,678,990 |
| Realized and Unrealized Gain (Loss) | | |
| Net realized gain (loss) on: | | |
| Investment securities: | | |
| Affiliated issuers | (20,375,138) | |
| Capital gain distributions from underlying funds: | | |
| Affiliated issuers | 30,949,384 | |
| Total net realized gain (loss) | | 10,574,246 |
| Change in net unrealized appreciation (depreciation) on: | | |
| Investment securities: | | |
| Affiliated issuers | 228,919,642 | |
| Total change in net unrealized appreciation (depreciation) | | 228,919,642 |
| Net gain (loss) | | 239,493,888 |
| Net increase (decrease) in net assets resulting from operations | | $474,172,878 |
See accompanying notes which are an integral part of the financial statements.
Statement of Changes in Net Assets
| | Year ended March 31, 2022 | Year ended March 31, 2021 |
| Increase (Decrease) in Net Assets | | |
| Operations | | |
| Net investment income (loss) | $234,678,990 | $130,725,495 |
| Net realized gain (loss) | 10,574,246 | 46,511,100 |
| Change in net unrealized appreciation (depreciation) | 228,919,642 | 2,758,413,900 |
| Net increase (decrease) in net assets resulting from operations | 474,172,878 | 2,935,650,495 |
| Distributions to shareholders | (291,545,504) | (181,073,323) |
| Share transactions - net increase (decrease) | 3,671,639,287 | 2,618,792,682 |
| Total increase (decrease) in net assets | 3,854,266,661 | 5,373,369,854 |
| Net Assets | | |
| Beginning of period | 10,639,981,969 | 5,266,612,115 |
| End of period | $14,494,248,630 | $10,639,981,969 |
See accompanying notes which are an integral part of the financial statements.
Financial Highlights
Fidelity Freedom Index 2040 Fund Investor Class
| Years ended March 31, | 2022 | 2021 | 2020 | 2019 | 2018 |
| Selected Per–Share Data | | | | | |
| Net asset value, beginning of period | $21.68 | $14.77 | $19.19 | $18.77 | $16.90 |
| Income from Investment Operations | | | | | |
| Net investment income (loss)A,B | .40 | .30 | .35 | .39 | .34 |
| Net realized and unrealized gain (loss) | .69 | 7.03 | (1.43) | .42 | 1.87 |
| Total from investment operations | 1.09 | 7.33 | (1.08) | .81 | 2.21 |
| Distributions from net investment income | (.36) | (.29) | (.33) | (.38) | (.33) |
| Distributions from net realized gain | (.10) | (.12) | (3.00) | (.01) | (.02) |
| Total distributions | (.47)C | (.42)C | (3.34)C | (.39) | (.34)C |
| Net asset value, end of period | $22.30 | $21.68 | $14.77 | $19.19 | $18.77 |
| Total ReturnD | 4.90% | 49.86% | (8.93)% | 4.56% | 13.08% |
| Ratios to Average Net AssetsB,E,F | | | | | |
| Expenses before reductions | .12% | .12% | .12% | .15% | .15% |
| Expenses net of fee waivers, if any | .12% | .12% | .12% | .11% | .12% |
| Expenses net of all reductions | .12% | .12% | .12% | .11% | .12% |
| Net investment income (loss) | 1.74% | 1.56% | 1.82% | 2.06% | 1.87% |
| Supplemental Data | | | | | |
| Net assets, end of period (000 omitted) | $1,823,668 | $4,532,047 | $2,405,077 | $1,731,927 | $1,281,722 |
| Portfolio turnover rateG | 13% | 20% | 78% | 10% | 6% |
A Calculated based on average shares outstanding during the period.
B Net investment income (loss) is affected by the timing of the declaration of dividends by any underlying mutual funds or exchange-traded funds (ETFs). Net investment income (loss) of any such underlying funds is not included in the Fund's net investment income (loss) ratio.
C Total distributions per share do not sum due to rounding.
D Total returns would have been lower if certain expenses had not been reduced during the applicable periods shown.
E Fees and expenses of any underlying mutual funds or exchange-traded funds (ETFs) are not included in the Fund's expense ratio. The Fund indirectly bears its proportionate share of these expenses. For additional expense information related to investments in Fidelity Central Funds, please refer to the "Investments in Fidelity Central Funds" note found in the Notes to Financial Statements section of the most recent Annual or Semi-Annual report.
F Expense ratios reflect operating expenses of the class. Expenses before reductions do not reflect amounts reimbursed, waived, or reduced through arrangements with the investment adviser, brokerage services, or other offset arrangements, if applicable, and do not represent the amount paid by the class during periods when reimbursements, waivers or reductions occur.
G Amount does not include the portfolio activity of any underlying mutual funds or exchange-traded funds (ETFs).
See accompanying notes which are an integral part of the financial statements.
Fidelity Freedom Index 2040 Fund Institutional Premium Class
| Years ended March 31, | 2022 | 2021 | 2020 | 2019 | 2018 |
| Selected Per–Share Data | | | | | |
| Net asset value, beginning of period | $21.68 | $14.77 | $19.19 | $18.77 | $16.89 |
| Income from Investment Operations | | | | | |
| Net investment income (loss)A,B | .41 | .31 | .36 | .40 | .35 |
| Net realized and unrealized gain (loss) | .68 | 7.02 | (1.43) | .42 | 1.88 |
| Total from investment operations | 1.09 | 7.33 | (1.07) | .82 | 2.23 |
| Distributions from net investment income | (.38) | (.30) | (.34) | (.39) | (.34) |
| Distributions from net realized gain | (.11) | (.12) | (3.00) | (.01) | (.02) |
| Total distributions | (.49) | (.42) | (3.35)C | (.40) | (.35)C |
| Net asset value, end of period | $22.28 | $21.68 | $14.77 | $19.19 | $18.77 |
| Total ReturnD | 4.92% | 49.89% | (8.89)% | 4.61% | 13.20% |
| Ratios to Average Net AssetsB,E,F | | | | | |
| Expenses before reductions | .08% | .08% | .08% | .10% | .10% |
| Expenses net of fee waivers, if any | .08% | .08% | .08% | .05% | .07% |
| Expenses net of all reductions | .08% | .08% | .08% | .05% | .07% |
| Net investment income (loss) | 1.78% | 1.60% | 1.86% | 2.12% | 1.92% |
| Supplemental Data | | | | | |
| Net assets, end of period (000 omitted) | $9,622,454 | $4,910,687 | $2,861,535 | $2,404,340 | $1,929,498 |
| Portfolio turnover rateG | 13% | 20% | 78% | 10% | 6% |
A Calculated based on average shares outstanding during the period.
B Net investment income (loss) is affected by the timing of the declaration of dividends by any underlying mutual funds or exchange-traded funds (ETFs). Net investment income (loss) of any such underlying funds is not included in the Fund's net investment income (loss) ratio.
C Total distributions per share do not sum due to rounding.
D Total returns would have been lower if certain expenses had not been reduced during the applicable periods shown.
E Fees and expenses of any underlying mutual funds or exchange-traded funds (ETFs) are not included in the Fund's expense ratio. The Fund indirectly bears its proportionate share of these expenses. For additional expense information related to investments in Fidelity Central Funds, please refer to the "Investments in Fidelity Central Funds" note found in the Notes to Financial Statements section of the most recent Annual or Semi-Annual report.
F Expense ratios reflect operating expenses of the class. Expenses before reductions do not reflect amounts reimbursed, waived, or reduced through arrangements with the investment adviser, brokerage services, or other offset arrangements, if applicable, and do not represent the amount paid by the class during periods when reimbursements, waivers or reductions occur.
G Amount does not include the portfolio activity of any underlying mutual funds or exchange-traded funds (ETFs).
See accompanying notes which are an integral part of the financial statements.
Fidelity Freedom Index 2040 Fund Premier Class
| Years ended March 31, | 2022 | 2021 A |
| Selected Per–Share Data | | |
| Net asset value, beginning of period | $21.67 | $17.16 |
| Income from Investment Operations | | |
| Net investment income (loss)B,C | .41 | .47 |
| Net realized and unrealized gain (loss) | .69 | 4.40 |
| Total from investment operations | 1.10 | 4.87 |
| Distributions from net investment income | (.39) | (.30) |
| Distributions from net realized gain | (.11) | (.07) |
| Total distributions | (.50) | (.36)D |
| Net asset value, end of period | $22.27 | $21.67 |
| Total ReturnE,F | 4.94% | 28.49% |
| Ratios to Average Net AssetsC,G,H | | |
| Expenses before reductions | .06% | .06%I |
| Expenses net of fee waivers, if any | .06% | .06%I |
| Expenses net of all reductions | .06% | .06%I |
| Net investment income (loss) | 1.80% | 2.95%I |
| Supplemental Data | | |
| Net assets, end of period (000 omitted) | $3,048,126 | $1,197,248 |
| Portfolio turnover rateJ | 13% | 20% |
A For the period June 24, 2020 (commencement of sale of shares) through March 31, 2021.
B Calculated based on average shares outstanding during the period.
C Net investment income (loss) is affected by the timing of the declaration of dividends by any underlying mutual funds or exchange-traded funds (ETFs). Net investment income (loss) of any such underlying funds is not included in the Fund's net investment income (loss) ratio.
D Total distributions per share do not sum due to rounding.
E Total returns for periods of less than one year are not annualized.
F Total returns would have been lower if certain expenses had not been reduced during the applicable periods shown.
G Fees and expenses of any underlying mutual funds or exchange-traded funds (ETFs) are not included in the Fund's expense ratio. The Fund indirectly bears its proportionate share of these expenses. For additional expense information related to investments in Fidelity Central Funds, please refer to the "Investments in Fidelity Central Funds" note found in the Notes to Financial Statements section of the most recent Annual or Semi-Annual report.
H Expense ratios reflect operating expenses of the class. Expenses before reductions do not reflect amounts reimbursed, waived, or reduced through arrangements with the investment adviser, brokerage services, or other offset arrangements, if applicable, and do not represent the amount paid by the class during periods when reimbursements, waivers or reductions occur.
I Annualized
J Amount does not include the portfolio activity of any underlying mutual funds or exchange-traded funds (ETFs).
See accompanying notes which are an integral part of the financial statements.
Fidelity Freedom® Index 2045 Fund
Investment Summary (Unaudited)
The information in the following tables is based on the direct investments of the Fund.
Top Holdings as of March 31, 2022
| | % of fund's net assets |
| Fidelity Series Total Market Index Fund | 53.9 |
| Fidelity Series Global ex U.S. Index Fund | 36.0 |
| Fidelity Series Bond Index Fund | 4.7 |
| Fidelity Series Long-Term Treasury Bond Index Fund | 4.6 |
| Fidelity Series International Developed Markets Bond Index Fund | 0.8 |
| Fidelity Cash Central Fund 0.31% | 0.0 |
| | 100.0 |
Asset Allocation (% of fund's net assets)
| Period end |
| | Domestic Equity Funds | 53.9% |
| | International Equity Funds | 36.0% |
| | Bond Funds | 10.1% |

Percentages shown as 0.0% may reflect amounts less than 0.05%.
Fidelity Freedom® Index 2045 Fund
Schedule of Investments March 31, 2022
Showing Percentage of Net Assets
| Domestic Equity Funds - 53.9% | | | |
| | | Shares | Value |
| Fidelity Series Total Market Index Fund (a) | | | |
| (Cost $4,785,718,111) | | 415,140,713 | 6,268,624,767 |
|
| International Equity Funds - 36.0% | | | |
| Fidelity Series Global ex U.S. Index Fund (a) | | | |
| (Cost $3,935,571,608) | | 295,688,134 | 4,183,987,094 |
|
| Bond Funds - 10.1% | | | |
| Fidelity Series Bond Index Fund (a) | | 56,616,862 | 553,146,738 |
| Fidelity Series International Developed Markets Bond Index Fund (a) | | 9,474,353 | 88,395,717 |
| Fidelity Series Long-Term Treasury Bond Index Fund (a) | | 70,359,293 | 536,137,809 |
| TOTAL BOND FUNDS | | | |
| (Cost $1,277,658,623) | | | 1,177,680,264 |
|
| Short-Term Funds - 0.0% | | | |
| Fidelity Cash Central Fund 0.31% (b) | | | |
| (Cost $9,885) | | 9,883 | 9,885 |
| TOTAL INVESTMENT IN SECURITIES - 100.0% | | | |
| (Cost $9,998,958,227) | | | 11,630,302,010 |
| NET OTHER ASSETS (LIABILITIES) - 0.0% | | | (557,510) |
| NET ASSETS - 100% | | | $11,629,744,500 |
Legend
(a) Affiliated Fund
(b) Affiliated fund that is generally available only to investment companies and other accounts managed by Fidelity Investments. The rate quoted is the annualized seven-day yield of the fund at period end. A complete unaudited listing of the fund's holdings as of its most recent quarter end is available upon request. In addition, each Fidelity Central Fund's financial statements, which are not covered by the Fund's Report of Independent Registered Public Accounting Firm, are available on the SEC's website or upon request.
Affiliated Central Funds
Fiscal year to date information regarding the Fund's investments in Fidelity Central Funds, including the ownership percentage, is presented below.
| Fund | Value, beginning of period | Purchases | Sales Proceeds | Dividend Income | Realized Gain/Loss | Change in Unrealized appreciation (depreciation) | Value, end of period | % ownership, end of period |
| Fidelity Cash Central Fund 0.31% | $-- | $1,094,807 | $1,084,922 | $6 | $-- | $-- | $9,885 | 0.0% |
| Total | $-- | $1,094,807 | $1,084,922 | $6 | $-- | $-- | $9,885 | |
Amounts in the income column in the above table include any capital gain distributions from underlying funds, which are presented in the corresponding line-item in the Statement of Operations, if applicable.
Affiliated Underlying Funds
Fiscal year to date information regarding the Fund's investments in affiliated Underlying Funds is presented below. Exchanges between classes of the same affiliated Underlying Funds may occur. If an underlying Fund changes its name, the name presented below is the name in effect at period end.
| Affiliate | Value, beginning of period | Purchases | Sales Proceeds | Dividend Income | Realized Gain (loss) | Change in Unrealized appreciation (depreciation) | Value, end of period |
| Fidelity Series Bond Index Fund | $570,712,086 | $253,392,075 | $235,428,893 | $10,409,178 | $(8,199,582) | $(27,328,948) | $553,146,738 |
| Fidelity Series Global ex U.S. Index Fund | 2,933,486,882 | 1,785,204,782 | 295,357,785 | 105,464,929 | (6,800,639) | (232,546,146) | 4,183,987,094 |
| Fidelity Series International Developed Markets Bond Index Fund | -- | 92,829,446 | 654,284 | 27,275 | (7,577) | (3,771,868) | 88,395,717 |
| Fidelity Series Long-Term Treasury Bond Index Fund | 243,668,601 | 346,516,300 | 21,516,143 | 8,751,646 | (2,539,710) | (29,991,239) | 536,137,809 |
| Fidelity Series Total Market Index Fund | 4,403,845,781 | 2,102,017,366 | 696,844,114 | 93,367,269 | (3,688,741) | 463,294,475 | 6,268,624,767 |
| | $8,151,713,350 | $4,579,959,969 | $1,249,801,219 | $218,020,297 | $(21,236,249) | $169,656,274 | $11,630,292,125 |
Amounts in the income column in the above table include any capital gain distributions from underlying funds, which are presented in the corresponding line-item in the Statement of Operations, if applicable.
Investment Valuation
The following is a summary of the inputs used, as of March 31, 2022, involving the Fund's assets and liabilities carried at fair value. The inputs or methodology used for valuing securities may not be an indication of the risk associated with investing in those securities. For more information on valuation inputs, and their aggregation into the levels used below, please refer to the Investment Valuation section in the accompanying Notes to Financial Statements.
| | Valuation Inputs at Reporting Date: |
| Description | Total | Level 1 | Level 2 | Level 3 |
| Investments in Securities: | | | | |
| Domestic Equity Funds | $6,268,624,767 | $6,268,624,767 | $-- | $-- |
| International Equity Funds | 4,183,987,094 | 4,183,987,094 | -- | -- |
| Bond Funds | 1,177,680,264 | 1,177,680,264 | -- | -- |
| Short-Term Funds | 9,885 | 9,885 | -- | -- |
| Total Investments in Securities: | $11,630,302,010 | $11,630,302,010 | $-- | $-- |
See accompanying notes which are an integral part of the financial statements.
Fidelity Freedom® Index 2045 Fund
Financial Statements
Statement of Assets and Liabilities
| | | March 31, 2022 |
| Assets | | |
Investment in securities, at value — See accompanying schedule:
| | |
| Fidelity Central Funds (cost $9,885) | $9,885 | |
| Other affiliated issuers (cost $9,998,948,342) | 11,630,292,125 | |
| Total Investment in Securities (cost $9,998,958,227) | | $11,630,302,010 |
| Receivable for investments sold | | 139,542,749 |
| Receivable for fund shares sold | | 17,659,762 |
| Distributions receivable from Fidelity Central Funds | | 2 |
| Total assets | | 11,787,504,523 |
| Liabilities | | |
| Payable for investments purchased | $149,893,583 | |
| Payable for fund shares redeemed | 7,316,076 | |
| Accrued management fee | 550,364 | |
| Total liabilities | | 157,760,023 |
| Net Assets | | $11,629,744,500 |
| Net Assets consist of: | | |
| Paid in capital | | $10,037,793,588 |
| Total accumulated earnings (loss) | | 1,591,950,912 |
| Net Assets | | $11,629,744,500 |
| Net Asset Value and Maximum Offering Price | | |
| Investor Class: | | |
| Net Asset Value, offering price and redemption price per share ($1,355,157,110 ÷ 58,556,746 shares) | | $23.14 |
| Institutional Premium Class: | | |
| Net Asset Value, offering price and redemption price per share ($7,627,068,093 ÷ 329,646,661 shares) | | $23.14 |
| Premier Class: | | |
| Net Asset Value, offering price and redemption price per share ($2,647,519,297 ÷ 114,443,690 shares) | | $23.13 |
See accompanying notes which are an integral part of the financial statements.
Statement of Operations
| | | Year ended March 31, 2022 |
| Investment Income | | |
| Dividends: | | |
| Affiliated issuers | | $193,741,194 |
| Income from Fidelity Central Funds | | 6 |
| Total income | | 193,741,200 |
| Expenses | | |
| Management fee | $8,238,264 | |
| Independent trustees' fees and expenses | 29,695 | |
| Total expenses before reductions | 8,267,959 | |
| Expense reductions | (3) | |
| Total expenses after reductions | | 8,267,956 |
| Net investment income (loss) | | 185,473,244 |
| Realized and Unrealized Gain (Loss) | | |
| Net realized gain (loss) on: | | |
| Investment securities: | | |
| Affiliated issuers | (21,236,249) | |
| Capital gain distributions from underlying funds: | | |
| Affiliated issuers | 24,279,103 | |
| Total net realized gain (loss) | | 3,042,854 |
| Change in net unrealized appreciation (depreciation) on: | | |
| Investment securities: | | |
| Affiliated issuers | 169,656,274 | |
| Total change in net unrealized appreciation (depreciation) | | 169,656,274 |
| Net gain (loss) | | 172,699,128 |
| Net increase (decrease) in net assets resulting from operations | | $358,172,372 |
See accompanying notes which are an integral part of the financial statements.
Statement of Changes in Net Assets
| | Year ended March 31, 2022 | Year ended March 31, 2021 |
| Increase (Decrease) in Net Assets | | |
| Operations | | |
| Net investment income (loss) | $185,473,244 | $96,633,547 |
| Net realized gain (loss) | 3,042,854 | 27,506,354 |
| Change in net unrealized appreciation (depreciation) | 169,656,274 | 2,007,001,848 |
| Net increase (decrease) in net assets resulting from operations | 358,172,372 | 2,131,141,749 |
| Distributions to shareholders | (225,996,600) | (131,346,090) |
| Share transactions - net increase (decrease) | 3,346,353,428 | 2,450,965,587 |
| Total increase (decrease) in net assets | 3,478,529,200 | 4,450,761,246 |
| Net Assets | | |
| Beginning of period | 8,151,215,300 | 3,700,454,054 |
| End of period | $11,629,744,500 | $8,151,215,300 |
See accompanying notes which are an integral part of the financial statements.
Financial Highlights
Fidelity Freedom Index 2045 Fund Investor Class
| Years ended March 31, | 2022 | 2021 | 2020 | 2019 | 2018 |
| Selected Per–Share Data | | | | | |
| Net asset value, beginning of period | $22.49 | $15.31 | $19.33 | $18.91 | $17.04 |
| Income from Investment Operations | | | | | |
| Net investment income (loss)A,B | .42 | .31 | .36 | .39 | .35 |
| Net realized and unrealized gain (loss) | .70 | 7.29 | (1.56) | .43 | 1.88 |
| Total from investment operations | 1.12 | 7.60 | (1.20) | .82 | 2.23 |
| Distributions from net investment income | (.37) | (.30) | (.33) | (.38) | (.33) |
| Distributions from net realized gain | (.10) | (.12) | (2.49) | (.02) | (.03) |
| Total distributions | (.47) | (.42) | (2.82) | (.40) | (.36) |
| Net asset value, end of period | $23.14 | $22.49 | $15.31 | $19.33 | $18.91 |
| Total ReturnC | 4.88% | 49.89% | (8.96)% | 4.58% | 13.08% |
| Ratios to Average Net AssetsB,D,E | | | | | |
| Expenses before reductions | .12% | .12% | .12% | .15% | .15% |
| Expenses net of fee waivers, if any | .12% | .12% | .12% | .11% | .12% |
| Expenses net of all reductions | .12% | .12% | .12% | .11% | .12% |
| Net investment income (loss) | 1.75% | 1.55% | 1.85% | 2.06% | 1.89% |
| Supplemental Data | | | | | |
| Net assets, end of period (000 omitted) | $1,355,157 | $3,625,141 | $1,810,294 | $1,244,020 | $872,779 |
| Portfolio turnover rateF | 12% | 20% | 77% | 10% | 6% |
A Calculated based on average shares outstanding during the period.
B Net investment income (loss) is affected by the timing of the declaration of dividends by any underlying mutual funds or exchange-traded funds (ETFs). Net investment income (loss) of any such underlying funds is not included in the Fund's net investment income (loss) ratio.
C Total returns would have been lower if certain expenses had not been reduced during the applicable periods shown.
D Fees and expenses of any underlying mutual funds or exchange-traded funds (ETFs) are not included in the Fund's expense ratio. The Fund indirectly bears its proportionate share of these expenses. For additional expense information related to investments in Fidelity Central Funds, please refer to the "Investments in Fidelity Central Funds" note found in the Notes to Financial Statements section of the most recent Annual or Semi-Annual report.
E Expense ratios reflect operating expenses of the class. Expenses before reductions do not reflect amounts reimbursed, waived, or reduced through arrangements with the investment adviser, brokerage services, or other offset arrangements, if applicable, and do not represent the amount paid by the class during periods when reimbursements, waivers or reductions occur.
F Amount does not include the portfolio activity of any underlying mutual funds or exchange-traded funds (ETFs).
See accompanying notes which are an integral part of the financial statements.
Fidelity Freedom Index 2045 Fund Institutional Premium Class
| Years ended March 31, | 2022 | 2021 | 2020 | 2019 | 2018 |
| Selected Per–Share Data | | | | | |
| Net asset value, beginning of period | $22.50 | $15.32 | $19.33 | $18.92 | $17.04 |
| Income from Investment Operations | | | | | |
| Net investment income (loss)A,B | .43 | .31 | .37 | .40 | .36 |
| Net realized and unrealized gain (loss) | .71 | 7.30 | (1.55) | .42 | 1.89 |
| Total from investment operations | 1.14 | 7.61 | (1.18) | .82 | 2.25 |
| Distributions from net investment income | (.40) | (.31) | (.34) | (.39) | (.34) |
| Distributions from net realized gain | (.10) | (.12) | (2.49) | (.02) | (.03) |
| Total distributions | (.50) | (.43) | (2.83) | (.41) | (.37) |
| Net asset value, end of period | $23.14 | $22.50 | $15.32 | $19.33 | $18.92 |
| Total ReturnC | 4.95% | 49.89% | (8.88)% | 4.58% | 13.20% |
| Ratios to Average Net AssetsB,D,E | | | | | |
| Expenses before reductions | .08% | .08% | .08% | .10% | .10% |
| Expenses net of fee waivers, if any | .08% | .08% | .08% | .05% | .07% |
| Expenses net of all reductions | .08% | .08% | .08% | .05% | .07% |
| Net investment income (loss) | 1.79% | 1.59% | 1.89% | 2.11% | 1.94% |
| Supplemental Data | | | | | |
| Net assets, end of period (000 omitted) | $7,627,068 | $3,397,662 | $1,890,160 | $1,446,055 | $1,062,443 |
| Portfolio turnover rateF | 12% | 20% | 77% | 10% | 6% |
A Calculated based on average shares outstanding during the period.
B Net investment income (loss) is affected by the timing of the declaration of dividends by any underlying mutual funds or exchange-traded funds (ETFs). Net investment income (loss) of any such underlying funds is not included in the Fund's net investment income (loss) ratio.
C Total returns would have been lower if certain expenses had not been reduced during the applicable periods shown.
D Fees and expenses of any underlying mutual funds or exchange-traded funds (ETFs) are not included in the Fund's expense ratio. The Fund indirectly bears its proportionate share of these expenses. For additional expense information related to investments in Fidelity Central Funds, please refer to the "Investments in Fidelity Central Funds" note found in the Notes to Financial Statements section of the most recent Annual or Semi-Annual report.
E Expense ratios reflect operating expenses of the class. Expenses before reductions do not reflect amounts reimbursed, waived, or reduced through arrangements with the investment adviser, brokerage services, or other offset arrangements, if applicable, and do not represent the amount paid by the class during periods when reimbursements, waivers or reductions occur.
F Amount does not include the portfolio activity of any underlying mutual funds or exchange-traded funds (ETFs).
See accompanying notes which are an integral part of the financial statements.
Fidelity Freedom Index 2045 Fund Premier Class
| Years ended March 31, | 2022 | 2021 A |
| Selected Per–Share Data | | |
| Net asset value, beginning of period | $22.50 | $17.81 |
| Income from Investment Operations | | |
| Net investment income (loss)B,C | .43 | .49 |
| Net realized and unrealized gain (loss) | .70 | 4.57 |
| Total from investment operations | 1.13 | 5.06 |
| Distributions from net investment income | (.40) | (.31) |
| Distributions from net realized gain | (.10) | (.07) |
| Total distributions | (.50) | (.37)D |
| Net asset value, end of period | $23.13 | $22.50 |
| Total ReturnE,F | 4.93% | 28.52% |
| Ratios to Average Net AssetsC,G,H | | |
| Expenses before reductions | .06% | .06%I |
| Expenses net of fee waivers, if any | .06% | .06%I |
| Expenses net of all reductions | .06% | .06%I |
| Net investment income (loss) | 1.81% | 2.96%I |
| Supplemental Data | | |
| Net assets, end of period (000 omitted) | $2,647,519 | $1,128,413 |
| Portfolio turnover rateJ | 12% | 20% |
A For the period June 24, 2020 (commencement of sale of shares) through March 31, 2021.
B Calculated based on average shares outstanding during the period.
C Net investment income (loss) is affected by the timing of the declaration of dividends by any underlying mutual funds or exchange-traded funds (ETFs). Net investment income (loss) of any such underlying funds is not included in the Fund's net investment income (loss) ratio.
D Total distributions per share do not sum due to rounding.
E Total returns for periods of less than one year are not annualized.
F Total returns would have been lower if certain expenses had not been reduced during the applicable periods shown.
G Fees and expenses of any underlying mutual funds or exchange-traded funds (ETFs) are not included in the Fund's expense ratio. The Fund indirectly bears its proportionate share of these expenses. For additional expense information related to investments in Fidelity Central Funds, please refer to the "Investments in Fidelity Central Funds" note found in the Notes to Financial Statements section of the most recent Annual or Semi-Annual report.
H Expense ratios reflect operating expenses of the class. Expenses before reductions do not reflect amounts reimbursed, waived, or reduced through arrangements with the investment adviser, brokerage services, or other offset arrangements, if applicable, and do not represent the amount paid by the class during periods when reimbursements, waivers or reductions occur.
I Annualized
J Amount does not include the portfolio activity of any underlying mutual funds or exchange-traded funds (ETFs).
See accompanying notes which are an integral part of the financial statements.
Fidelity Freedom® Index 2050 Fund
Investment Summary (Unaudited)
The information in the following tables is based on the direct investments of the Fund.
Top Holdings as of March 31, 2022
| | % of fund's net assets |
| Fidelity Series Total Market Index Fund | 53.9 |
| Fidelity Series Global ex U.S. Index Fund | 36.0 |
| Fidelity Series Bond Index Fund | 4.7 |
| Fidelity Series Long-Term Treasury Bond Index Fund | 4.6 |
| Fidelity Series International Developed Markets Bond Index Fund | 0.8 |
| Fidelity Cash Central Fund 0.31% | 0.0 |
| | 100.0 |
Asset Allocation (% of fund's net assets)
| Period end |
| | Domestic Equity Funds | 53.9% |
| | International Equity Funds | 36.0% |
| | Bond Funds | 10.1% |

Percentages shown as 0.0% may reflect amounts less than 0.05%.
Fidelity Freedom® Index 2050 Fund
Schedule of Investments March 31, 2022
Showing Percentage of Net Assets
| Domestic Equity Funds - 53.9% | | | |
| | | Shares | Value |
| Fidelity Series Total Market Index Fund (a) | | | |
| (Cost $4,274,571,874) | | 372,019,397 | 5,617,492,891 |
|
| International Equity Funds - 36.0% | | | |
| Fidelity Series Global ex U.S. Index Fund (a) | | | |
| (Cost $3,518,270,434) | | 264,974,709 | 3,749,392,136 |
|
| Bond Funds - 10.1% | | | |
| Fidelity Series Bond Index Fund (a) | | 50,734,407 | 495,675,160 |
| Fidelity Series International Developed Markets Bond Index Fund (a) | | 8,490,699 | 79,218,225 |
| Fidelity Series Long-Term Treasury Bond Index Fund (a) | | 63,051,170 | 480,449,918 |
| TOTAL BOND FUNDS | | | |
| (Cost $1,144,646,117) | | | 1,055,343,303 |
|
| Short-Term Funds - 0.0% | | | |
| Fidelity Cash Central Fund 0.31% (b) | | | |
| (Cost $8,806) | | 8,804 | 8,806 |
| TOTAL INVESTMENT IN SECURITIES - 100.0% | | | |
| (Cost $8,937,497,231) | | | 10,422,237,136 |
| NET OTHER ASSETS (LIABILITIES) - 0.0% | | | (498,475) |
| NET ASSETS - 100% | | | $10,421,738,661 |
Legend
(a) Affiliated Fund
(b) Affiliated fund that is generally available only to investment companies and other accounts managed by Fidelity Investments. The rate quoted is the annualized seven-day yield of the fund at period end. A complete unaudited listing of the fund's holdings as of its most recent quarter end is available upon request. In addition, each Fidelity Central Fund's financial statements, which are not covered by the Fund's Report of Independent Registered Public Accounting Firm, are available on the SEC's website or upon request.
Affiliated Central Funds
Fiscal year to date information regarding the Fund's investments in Fidelity Central Funds, including the ownership percentage, is presented below.
| Fund | Value, beginning of period | Purchases | Sales Proceeds | Dividend Income | Realized Gain/Loss | Change in Unrealized appreciation (depreciation) | Value, end of period | % ownership, end of period |
| Fidelity Cash Central Fund 0.31% | $-- | $5,535,689 | $5,526,883 | $11 | $-- | $-- | $8,806 | 0.0% |
| Total | $-- | $5,535,689 | $5,526,883 | $11 | $-- | $-- | $8,806 | |
Amounts in the income column in the above table include any capital gain distributions from underlying funds, which are presented in the corresponding line-item in the Statement of Operations, if applicable.
Affiliated Underlying Funds
Fiscal year to date information regarding the Fund's investments in affiliated Underlying Funds is presented below. Exchanges between classes of the same affiliated Underlying Funds may occur. If an underlying Fund changes its name, the name presented below is the name in effect at period end.
| Affiliate | Value, beginning of period | Purchases | Sales Proceeds | Dividend Income | Realized Gain (loss) | Change in Unrealized appreciation (depreciation) | Value, end of period |
| Fidelity Series Bond Index Fund | $514,007,640 | $224,081,321 | $210,726,945 | $9,325,605 | $(7,257,582) | $(24,429,274) | $495,675,160 |
| Fidelity Series Global ex U.S. Index Fund | 2,642,024,053 | 1,583,582,889 | 262,205,580 | 93,489,638 | (5,934,687) | (208,074,539) | 3,749,392,136 |
| Fidelity Series International Developed Markets Bond Index Fund | -- | 83,165,249 | 584,070 | 23,466 | (5,677) | (3,357,277) | 79,218,225 |
| Fidelity Series Long-Term Treasury Bond Index Fund | 219,458,170 | 309,132,861 | 19,367,417 | 7,839,672 | (2,403,012) | (26,370,684) | 480,449,918 |
| Fidelity Series Total Market Index Fund | 3,966,292,981 | 1,855,456,587 | 617,913,123 | 82,938,560 | (3,802,342) | 417,458,788 | 5,617,492,891 |
| | $7,341,782,844 | $4,055,418,907 | $1,110,797,135 | $193,616,941 | $(19,403,300) | $155,227,014 | $10,422,228,330 |
Amounts in the income column in the above table include any capital gain distributions from underlying funds, which are presented in the corresponding line-item in the Statement of Operations, if applicable.
Investment Valuation
The following is a summary of the inputs used, as of March 31, 2022, involving the Fund's assets and liabilities carried at fair value. The inputs or methodology used for valuing securities may not be an indication of the risk associated with investing in those securities. For more information on valuation inputs, and their aggregation into the levels used below, please refer to the Investment Valuation section in the accompanying Notes to Financial Statements.
| | Valuation Inputs at Reporting Date: |
| Description | Total | Level 1 | Level 2 | Level 3 |
| Investments in Securities: | | | | |
| Domestic Equity Funds | $5,617,492,891 | $5,617,492,891 | $-- | $-- |
| International Equity Funds | 3,749,392,136 | 3,749,392,136 | -- | -- |
| Bond Funds | 1,055,343,303 | 1,055,343,303 | -- | -- |
| Short-Term Funds | 8,806 | 8,806 | -- | -- |
| Total Investments in Securities: | $10,422,237,136 | $10,422,237,136 | $-- | $-- |
See accompanying notes which are an integral part of the financial statements.
Fidelity Freedom® Index 2050 Fund
Financial Statements
Statement of Assets and Liabilities
| | | March 31, 2022 |
| Assets | | |
Investment in securities, at value — See accompanying schedule:
| | |
| Fidelity Central Funds (cost $8,806) | $8,806 | |
| Other affiliated issuers (cost $8,937,488,425) | 10,422,228,330 | |
| Total Investment in Securities (cost $8,937,497,231) | | $10,422,237,136 |
| Receivable for investments sold | | 123,362,554 |
| Receivable for fund shares sold | | 18,957,141 |
| Distributions receivable from Fidelity Central Funds | | 2 |
| Other receivables | | 1 |
| Total assets | | 10,564,556,834 |
| Liabilities | | |
| Payable for investments purchased | $135,682,032 | |
| Payable for fund shares redeemed | 6,644,078 | |
| Accrued management fee | 492,063 | |
| Total liabilities | | 142,818,173 |
| Net Assets | | $10,421,738,661 |
| Net Assets consist of: | | |
| Paid in capital | | $8,975,336,455 |
| Total accumulated earnings (loss) | | 1,446,402,206 |
| Net Assets | | $10,421,738,661 |
| Net Asset Value and Maximum Offering Price | | |
| Investor Class: | | |
| Net Asset Value, offering price and redemption price per share ($1,179,926,470 ÷ 50,878,365 shares) | | $23.19 |
| Institutional Premium Class: | | |
| Net Asset Value, offering price and redemption price per share ($6,949,488,271 ÷ 299,894,968 shares) | | $23.17 |
| Premier Class: | | |
| Net Asset Value, offering price and redemption price per share ($2,292,323,920 ÷ 98,940,966 shares) | | $23.17 |
See accompanying notes which are an integral part of the financial statements.
Statement of Operations
| | | Year ended March 31, 2022 |
| Investment Income | | |
| Dividends: | | |
| Affiliated issuers | | $171,992,984 |
| Income from Fidelity Central Funds | | 11 |
| Total income | | 171,992,995 |
| Expenses | | |
| Management fee | $7,339,990 | |
| Independent trustees' fees and expenses | 26,643 | |
| Total expenses before reductions | 7,366,633 | |
| Expense reductions | (1) | |
| Total expenses after reductions | | 7,366,632 |
| Net investment income (loss) | | 164,626,363 |
| Realized and Unrealized Gain (Loss) | | |
| Net realized gain (loss) on: | | |
| Investment securities: | | |
| Affiliated issuers | (19,403,300) | |
| Capital gain distributions from underlying funds: | | |
| Affiliated issuers | 21,623,957 | |
| Total net realized gain (loss) | | 2,220,657 |
| Change in net unrealized appreciation (depreciation) on: | | |
| Investment securities: | | |
| Affiliated issuers | 155,227,014 | |
| Total change in net unrealized appreciation (depreciation) | | 155,227,014 |
| Net gain (loss) | | 157,447,671 |
| Net increase (decrease) in net assets resulting from operations | | $322,074,034 |
See accompanying notes which are an integral part of the financial statements.
Statement of Changes in Net Assets
| | Year ended March 31, 2022 | Year ended March 31, 2021 |
| Increase (Decrease) in Net Assets | | |
| Operations | | |
| Net investment income (loss) | $164,626,363 | $87,879,375 |
| Net realized gain (loss) | 2,220,657 | 24,386,295 |
| Change in net unrealized appreciation (depreciation) | 155,227,014 | 1,823,474,504 |
| Net increase (decrease) in net assets resulting from operations | 322,074,034 | 1,935,740,174 |
| Distributions to shareholders | (202,425,473) | (119,656,404) |
| Share transactions - net increase (decrease) | 2,960,752,208 | 2,185,062,073 |
| Total increase (decrease) in net assets | 3,080,400,769 | 4,001,145,843 |
| Net Assets | | |
| Beginning of period | 7,341,337,892 | 3,340,192,049 |
| End of period | $10,421,738,661 | $7,341,337,892 |
See accompanying notes which are an integral part of the financial statements.
Financial Highlights
Fidelity Freedom Index 2050 Fund Investor Class
| Years ended March 31, | 2022 | 2021 | 2020 | 2019 | 2018 |
| Selected Per–Share Data | | | | | |
| Net asset value, beginning of period | $22.54 | $15.34 | $19.41 | $19.00 | $17.14 |
| Income from Investment Operations | | | | | |
| Net investment income (loss)A,B | .42 | .31 | .36 | .39 | .35 |
| Net realized and unrealized gain (loss) | .71 | 7.31 | (1.55) | .42 | 1.90 |
| Total from investment operations | 1.13 | 7.62 | (1.19) | .81 | 2.25 |
| Distributions from net investment income | (.37) | (.30) | (.34) | (.38) | (.33) |
| Distributions from net realized gain | (.10) | (.12) | (2.54) | (.02) | (.06) |
| Total distributions | (.48)C | (.42) | (2.88) | (.40) | (.39) |
| Net asset value, end of period | $23.19 | $22.54 | $15.34 | $19.41 | $19.00 |
| Total ReturnD | 4.89% | 49.93% | (8.95)% | 4.53% | 13.15% |
| Ratios to Average Net AssetsB,E,F | | | | | |
| Expenses before reductions | .12% | .12% | .12% | .15% | .15% |
| Expenses net of fee waivers, if any | .12% | .12% | .12% | .11% | .12% |
| Expenses net of all reductions | .12% | .12% | .12% | .11% | .12% |
| Net investment income (loss) | 1.74% | 1.54% | 1.84% | 2.06% | 1.89% |
| Supplemental Data | | | | | |
| Net assets, end of period (000 omitted) | $1,179,926 | $3,177,558 | $1,524,955 | $1,049,434 | $739,919 |
| Portfolio turnover rateG | 12% | 20% | 77% | 12% | 6% |
A Calculated based on average shares outstanding during the period.
B Net investment income (loss) is affected by the timing of the declaration of dividends by any underlying mutual funds or exchange-traded funds (ETFs). Net investment income (loss) of any such underlying funds is not included in the Fund's net investment income (loss) ratio.
C Total distributions per share do not sum due to rounding.
D Total returns would have been lower if certain expenses had not been reduced during the applicable periods shown.
E Fees and expenses of any underlying mutual funds or exchange-traded funds (ETFs) are not included in the Fund's expense ratio. The Fund indirectly bears its proportionate share of these expenses. For additional expense information related to investments in Fidelity Central Funds, please refer to the "Investments in Fidelity Central Funds" note found in the Notes to Financial Statements section of the most recent Annual or Semi-Annual report.
F Expense ratios reflect operating expenses of the class. Expenses before reductions do not reflect amounts reimbursed, waived, or reduced through arrangements with the investment adviser, brokerage services, or other offset arrangements, if applicable, and do not represent the amount paid by the class during periods when reimbursements, waivers or reductions occur.
G Amount does not include the portfolio activity of any underlying mutual funds or exchange-traded funds (ETFs).
See accompanying notes which are an integral part of the financial statements.
Fidelity Freedom Index 2050 Fund Institutional Premium Class
| Years ended March 31, | 2022 | 2021 | 2020 | 2019 | 2018 |
| Selected Per–Share Data | | | | | |
| Net asset value, beginning of period | $22.54 | $15.34 | $19.41 | $19.00 | $17.14 |
| Income from Investment Operations | | | | | |
| Net investment income (loss)A,B | .42 | .31 | .37 | .40 | .36 |
| Net realized and unrealized gain (loss) | .72 | 7.32 | (1.55) | .42 | 1.90 |
| Total from investment operations | 1.14 | 7.63 | (1.18) | .82 | 2.26 |
| Distributions from net investment income | (.40) | (.31) | (.34) | (.39) | (.34) |
| Distributions from net realized gain | (.11) | (.12) | (2.54) | (.02) | (.06) |
| Total distributions | (.51) | (.43) | (2.89)C | (.41) | (.40) |
| Net asset value, end of period | $23.17 | $22.54 | $15.34 | $19.41 | $19.00 |
| Total ReturnD | 4.93% | 49.96% | (8.91)% | 4.59% | 13.20% |
| Ratios to Average Net AssetsB,E,F | | | | | |
| Expenses before reductions | .08% | .08% | .08% | .10% | .10% |
| Expenses net of fee waivers, if any | .08% | .08% | .08% | .05% | .07% |
| Expenses net of all reductions | .08% | .08% | .08% | .05% | .07% |
| Net investment income (loss) | 1.78% | 1.59% | 1.89% | 2.11% | 1.94% |
| Supplemental Data | | | | | |
| Net assets, end of period (000 omitted) | $6,949,488 | $3,119,255 | $1,815,237 | $1,376,687 | $1,063,718 |
| Portfolio turnover rateG | 12% | 20% | 77% | 12% | 6% |
A Calculated based on average shares outstanding during the period.
B Net investment income (loss) is affected by the timing of the declaration of dividends by any underlying mutual funds or exchange-traded funds (ETFs). Net investment income (loss) of any such underlying funds is not included in the Fund's net investment income (loss) ratio.
C Total distributions per share do not sum due to rounding.
D Total returns would have been lower if certain expenses had not been reduced during the applicable periods shown.
E Fees and expenses of any underlying mutual funds or exchange-traded funds (ETFs) are not included in the Fund's expense ratio. The Fund indirectly bears its proportionate share of these expenses. For additional expense information related to investments in Fidelity Central Funds, please refer to the "Investments in Fidelity Central Funds" note found in the Notes to Financial Statements section of the most recent Annual or Semi-Annual report.
F Expense ratios reflect operating expenses of the class. Expenses before reductions do not reflect amounts reimbursed, waived, or reduced through arrangements with the investment adviser, brokerage services, or other offset arrangements, if applicable, and do not represent the amount paid by the class during periods when reimbursements, waivers or reductions occur.
G Amount does not include the portfolio activity of any underlying mutual funds or exchange-traded funds (ETFs).
See accompanying notes which are an integral part of the financial statements.
Fidelity Freedom Index 2050 Fund Premier Class
| Years ended March 31, | 2022 | 2021 A |
| Selected Per–Share Data | | |
| Net asset value, beginning of period | $22.54 | $17.84 |
| Income from Investment Operations | | |
| Net investment income (loss)B,C | .43 | .50 |
| Net realized and unrealized gain (loss) | .71 | 4.57 |
| Total from investment operations | 1.14 | 5.07 |
| Distributions from net investment income | (.40) | (.31) |
| Distributions from net realized gain | (.11) | (.07) |
| Total distributions | (.51) | (.37)D |
| Net asset value, end of period | $23.17 | $22.54 |
| Total ReturnE,F | 4.95% | 28.53% |
| Ratios to Average Net AssetsC,G,H | | |
| Expenses before reductions | .06% | .06%I |
| Expenses net of fee waivers, if any | .06% | .06%I |
| Expenses net of all reductions | .06% | .06%I |
| Net investment income (loss) | 1.80% | 3.03%I |
| Supplemental Data | | |
| Net assets, end of period (000 omitted) | $2,292,324 | $1,044,525 |
| Portfolio turnover rateJ | 12% | 20% |
A For the period June 24, 2020 (commencement of sale of shares) through March 31, 2021.
B Calculated based on average shares outstanding during the period.
C Net investment income (loss) is affected by the timing of the declaration of dividends by any underlying mutual funds or exchange-traded funds (ETFs). Net investment income (loss) of any such underlying funds is not included in the Fund's net investment income (loss) ratio.
D Total distributions per share do not sum due to rounding.
E Total returns for periods of less than one year are not annualized.
F Total returns would have been lower if certain expenses had not been reduced during the applicable periods shown.
G Fees and expenses of any underlying mutual funds or exchange-traded funds (ETFs) are not included in the Fund's expense ratio. The Fund indirectly bears its proportionate share of these expenses. For additional expense information related to investments in Fidelity Central Funds, please refer to the "Investments in Fidelity Central Funds" note found in the Notes to Financial Statements section of the most recent Annual or Semi-Annual report.
H Expense ratios reflect operating expenses of the class. Expenses before reductions do not reflect amounts reimbursed, waived, or reduced through arrangements with the investment adviser, brokerage services, or other offset arrangements, if applicable, and do not represent the amount paid by the class during periods when reimbursements, waivers or reductions occur.
I Annualized
J Amount does not include the portfolio activity of any underlying mutual funds or exchange-traded funds (ETFs).
See accompanying notes which are an integral part of the financial statements.
Fidelity Freedom® Index 2055 Fund
Investment Summary (Unaudited)
The information in the following tables is based on the direct investments of the Fund.
Top Holdings as of March 31, 2022
| | % of fund's net assets |
| Fidelity Series Total Market Index Fund | 53.9 |
| Fidelity Series Global ex U.S. Index Fund | 36.0 |
| Fidelity Series Bond Index Fund | 4.7 |
| Fidelity Series Long-Term Treasury Bond Index Fund | 4.6 |
| Fidelity Series International Developed Markets Bond Index Fund | 0.8 |
| Fidelity Cash Central Fund 0.31% | 0.0 |
| | 100.0 |
Asset Allocation (% of fund's net assets)
| Period end |
| | Domestic Equity Funds | 53.9% |
| | International Equity Funds | 36.0% |
| | Bond Funds | 10.1% |

Percentages shown as 0.0% may reflect amounts less than 0.05%.
Fidelity Freedom® Index 2055 Fund
Schedule of Investments March 31, 2022
Showing Percentage of Net Assets
| Domestic Equity Funds - 53.9% | | | |
| | | Shares | Value |
| Fidelity Series Total Market Index Fund (a) | | | |
| (Cost $2,738,321,805) | | 228,805,131 | 3,454,957,479 |
|
| International Equity Funds - 36.0% | | | |
| Fidelity Series Global ex U.S. Index Fund (a) | | | |
| (Cost $2,210,878,686) | | 162,969,610 | 2,306,019,982 |
|
| Bond Funds - 10.1% | | | |
| Fidelity Series Bond Index Fund (a) | | 31,200,495 | 304,828,835 |
| Fidelity Series International Developed Markets Bond Index Fund (a) | | 5,223,183 | 48,732,302 |
| Fidelity Series Long-Term Treasury Bond Index Fund (a) | | 38,779,719 | 295,501,456 |
| TOTAL BOND FUNDS | | | |
| (Cost $704,753,185) | | | 649,062,593 |
|
| Short-Term Funds - 0.0% | | | |
| Fidelity Cash Central Fund 0.31% (b) | | | |
| (Cost $1,119) | | 1,119 | 1,119 |
| TOTAL INVESTMENT IN SECURITIES - 100.0% | | | |
| (Cost $5,653,954,795) | | | 6,410,041,173 |
| NET OTHER ASSETS (LIABILITIES) - 0.0% | | | (309,686) |
| NET ASSETS - 100% | | | $6,409,731,487 |
Legend
(a) Affiliated Fund
(b) Affiliated fund that is generally available only to investment companies and other accounts managed by Fidelity Investments. The rate quoted is the annualized seven-day yield of the fund at period end. A complete unaudited listing of the fund's holdings as of its most recent quarter end is available upon request. In addition, each Fidelity Central Fund's financial statements, which are not covered by the Fund's Report of Independent Registered Public Accounting Firm, are available on the SEC's website or upon request.
Affiliated Central Funds
Fiscal year to date information regarding the Fund's investments in Fidelity Central Funds, including the ownership percentage, is presented below.
| Fund | Value, beginning of period | Purchases | Sales Proceeds | Dividend Income | Realized Gain/Loss | Change in Unrealized appreciation (depreciation) | Value, end of period | % ownership, end of period |
| Fidelity Cash Central Fund 0.31% | $-- | $2,050,849 | $2,049,730 | $4 | $-- | $-- | $1,119 | 0.0% |
| Total | $-- | $2,050,849 | $2,049,730 | $4 | $-- | $-- | $1,119 | |
Amounts in the income column in the above table include any capital gain distributions from underlying funds, which are presented in the corresponding line-item in the Statement of Operations, if applicable.
Affiliated Underlying Funds
Fiscal year to date information regarding the Fund's investments in affiliated Underlying Funds is presented below. Exchanges between classes of the same affiliated Underlying Funds may occur. If an underlying Fund changes its name, the name presented below is the name in effect at period end.
| Affiliate | Value, beginning of period | Purchases | Sales Proceeds | Dividend Income | Realized Gain (loss) | Change in Unrealized appreciation (depreciation) | Value, end of period |
| Fidelity Series Bond Index Fund | $286,068,222 | $162,305,730 | $124,063,362 | $5,500,430 | $(3,994,657) | $(15,487,098) | $304,828,835 |
| Fidelity Series Global ex U.S. Index Fund | 1,470,412,558 | 1,114,580,939 | 144,829,895 | 55,728,519 | (3,742,833) | (130,400,787) | 2,306,019,982 |
| Fidelity Series International Developed Markets Bond Index Fund | -- | 51,147,049 | 372,243 | 14,307 | (4,745) | (2,037,759) | 48,732,302 |
| Fidelity Series Long-Term Treasury Bond Index Fund | 122,138,262 | 202,463,623 | 11,083,374 | 4,649,477 | (1,356,960) | (16,660,095) | 295,501,456 |
| Fidelity Series Total Market Index Fund | 2,207,430,449 | 1,367,547,573 | 355,266,764 | 48,919,376 | (3,442,921) | 238,689,142 | 3,454,957,479 |
| | $4,086,049,491 | $2,898,044,914 | $635,615,638 | $114,812,109 | $(12,542,116) | $74,103,403 | $6,410,040,054 |
Amounts in the income column in the above table include any capital gain distributions from underlying funds, which are presented in the corresponding line-item in the Statement of Operations, if applicable.
Investment Valuation
The following is a summary of the inputs used, as of March 31, 2022, involving the Fund's assets and liabilities carried at fair value. The inputs or methodology used for valuing securities may not be an indication of the risk associated with investing in those securities. For more information on valuation inputs, and their aggregation into the levels used below, please refer to the Investment Valuation section in the accompanying Notes to Financial Statements.
| | Valuation Inputs at Reporting Date: |
| Description | Total | Level 1 | Level 2 | Level 3 |
| Investments in Securities: | | | | |
| Domestic Equity Funds | $3,454,957,479 | $3,454,957,479 | $-- | $-- |
| International Equity Funds | 2,306,019,982 | 2,306,019,982 | -- | -- |
| Bond Funds | 649,062,593 | 649,062,593 | -- | -- |
| Short-Term Funds | 1,119 | 1,119 | -- | -- |
| Total Investments in Securities: | $6,410,041,173 | $6,410,041,173 | $-- | $-- |
See accompanying notes which are an integral part of the financial statements.
Fidelity Freedom® Index 2055 Fund
Financial Statements
Statement of Assets and Liabilities
| | | March 31, 2022 |
| Assets | | |
Investment in securities, at value — See accompanying schedule:
| | |
| Fidelity Central Funds (cost $1,119) | $1,119 | |
| Other affiliated issuers (cost $5,653,953,676) | 6,410,040,054 | |
| Total Investment in Securities (cost $5,653,954,795) | | $6,410,041,173 |
| Cash | | 2,760 |
| Receivable for investments sold | | 74,550,732 |
| Receivable for fund shares sold | | 14,546,183 |
| Distributions receivable from Fidelity Central Funds | | 1 |
| Total assets | | 6,499,140,849 |
| Liabilities | | |
| Payable for investments purchased | $84,385,474 | |
| Payable for fund shares redeemed | 4,715,389 | |
| Accrued management fee | 308,499 | |
| Total liabilities | | 89,409,362 |
| Net Assets | | $6,409,731,487 |
| Net Assets consist of: | | |
| Paid in capital | | $5,675,670,988 |
| Total accumulated earnings (loss) | | 734,060,499 |
| Net Assets | | $6,409,731,487 |
| Net Asset Value and Maximum Offering Price | | |
| Investor Class: | | |
| Net Asset Value, offering price and redemption price per share ($781,317,299 ÷ 41,008,440 shares) | | $19.05 |
| Institutional Premium Class: | | |
| Net Asset Value, offering price and redemption price per share ($4,444,574,626 ÷ 233,162,002 shares) | | $19.06 |
| Premier Class: | | |
| Net Asset Value, offering price and redemption price per share ($1,183,839,562 ÷ 62,124,412 shares) | | $19.06 |
See accompanying notes which are an integral part of the financial statements.
Statement of Operations
| | | Year ended March 31, 2022 |
| Investment Income | | |
| Dividends: | | |
| Affiliated issuers | | $102,181,739 |
| Income from Fidelity Central Funds | | 4 |
| Total income | | 102,181,743 |
| Expenses | | |
| Management fee | $4,395,247 | |
| Independent trustees' fees and expenses | 15,509 | |
| Total expenses before reductions | 4,410,756 | |
| Expense reductions | (2) | |
| Total expenses after reductions | | 4,410,754 |
| Net investment income (loss) | | 97,770,989 |
| Realized and Unrealized Gain (Loss) | | |
| Net realized gain (loss) on: | | |
| Investment securities: | | |
| Affiliated issuers | (12,542,116) | |
| Capital gain distributions from underlying funds: | | |
| Affiliated issuers | 12,630,370 | |
| Total net realized gain (loss) | | 88,254 |
| Change in net unrealized appreciation (depreciation) on: | | |
| Investment securities: | | |
| Affiliated issuers | 74,103,403 | |
| Total change in net unrealized appreciation (depreciation) | | 74,103,403 |
| Net gain (loss) | | 74,191,657 |
| Net increase (decrease) in net assets resulting from operations | | $171,962,646 |
See accompanying notes which are an integral part of the financial statements.
Statement of Changes in Net Assets
| | Year ended March 31, 2022 | Year ended March 31, 2021 |
| Increase (Decrease) in Net Assets | | |
| Operations | | |
| Net investment income (loss) | $97,770,989 | $45,681,208 |
| Net realized gain (loss) | 88,254 | 9,658,931 |
| Change in net unrealized appreciation (depreciation) | 74,103,403 | 923,485,219 |
| Net increase (decrease) in net assets resulting from operations | 171,962,646 | 978,825,358 |
| Distributions to shareholders | (117,006,432) | (60,668,247) |
| Share transactions - net increase (decrease) | 2,268,983,634 | 1,587,446,404 |
| Total increase (decrease) in net assets | 2,323,939,848 | 2,505,603,515 |
| Net Assets | | |
| Beginning of period | 4,085,791,639 | 1,580,188,124 |
| End of period | $6,409,731,487 | $4,085,791,639 |
See accompanying notes which are an integral part of the financial statements.
Financial Highlights
Fidelity Freedom Index 2055 Fund Investor Class
| Years ended March 31, | 2022 | 2021 | 2020 | 2019 | 2018 |
| Selected Per–Share Data | | | | | |
| Net asset value, beginning of period | $18.51 | $12.59 | $15.33 | $15.01 | $13.53 |
| Income from Investment Operations | | | | | |
| Net investment income (loss)A,B | .34 | .26 | .28 | .31 | .28 |
| Net realized and unrealized gain (loss) | .58 | 5.99 | (1.33) | .34 | 1.49 |
| Total from investment operations | .92 | 6.25 | (1.05) | .65 | 1.77 |
| Distributions from net investment income | (.31) | (.24) | (.26) | (.30) | (.26) |
| Distributions from net realized gain | (.08) | (.09) | (1.42) | (.03) | (.04) |
| Total distributions | (.38)C | (.33) | (1.69)C | (.33) | (.29)C |
| Net asset value, end of period | $19.05 | $18.51 | $12.59 | $15.33 | $15.01 |
| Total ReturnD | 4.88% | 49.88% | (8.94)% | 4.57% | 13.09% |
| Ratios to Average Net AssetsB,E,F | | | | | |
| Expenses before reductions | .12% | .12% | .12% | .15% | .15% |
| Expenses net of fee waivers, if any | .12% | .12% | .12% | .11% | .12% |
| Expenses net of all reductions | .12% | .12% | .12% | .11% | .12% |
| Net investment income (loss) | 1.75% | 1.59% | 1.83% | 2.06% | 1.90% |
| Supplemental Data | | | | | |
| Net assets, end of period (000 omitted) | $781,317 | $1,962,061 | $867,162 | $510,460 | $305,192 |
| Portfolio turnover rateG | 12% | 21% | 74% | 11% | 6% |
A Calculated based on average shares outstanding during the period.
B Net investment income (loss) is affected by the timing of the declaration of dividends by any underlying mutual funds or exchange-traded funds (ETFs). Net investment income (loss) of any such underlying funds is not included in the Fund's net investment income (loss) ratio.
C Total distributions per share do not sum due to rounding.
D Total returns would have been lower if certain expenses had not been reduced during the applicable periods shown.
E Fees and expenses of any underlying mutual funds or exchange-traded funds (ETFs) are not included in the Fund's expense ratio. The Fund indirectly bears its proportionate share of these expenses. For additional expense information related to investments in Fidelity Central Funds, please refer to the "Investments in Fidelity Central Funds" note found in the Notes to Financial Statements section of the most recent Annual or Semi-Annual report.
F Expense ratios reflect operating expenses of the class. Expenses before reductions do not reflect amounts reimbursed, waived, or reduced through arrangements with the investment adviser, brokerage services, or other offset arrangements, if applicable, and do not represent the amount paid by the class during periods when reimbursements, waivers or reductions occur.
G Amount does not include the portfolio activity of any underlying mutual funds or exchange-traded funds (ETFs).
See accompanying notes which are an integral part of the financial statements.
Fidelity Freedom Index 2055 Fund Institutional Premium Class
| Years ended March 31, | 2022 | 2021 | 2020 | 2019 | 2018 |
| Selected Per–Share Data | | | | | |
| Net asset value, beginning of period | $18.53 | $12.61 | $15.34 | $15.02 | $13.54 |
| Income from Investment Operations | | | | | |
| Net investment income (loss)A,B | .35 | .27 | .29 | .32 | .29 |
| Net realized and unrealized gain (loss) | .58 | 5.99 | (1.33) | .34 | 1.49 |
| Total from investment operations | .93 | 6.26 | (1.04) | .66 | 1.78 |
| Distributions from net investment income | (.33) | (.25) | (.27) | (.30) | (.26) |
| Distributions from net realized gain | (.08) | (.09) | (1.42) | (.03) | (.04) |
| Total distributions | (.40)C | (.34) | (1.69) | (.34)C | (.30) |
| Net asset value, end of period | $19.06 | $18.53 | $12.61 | $15.34 | $15.02 |
| Total ReturnD | 4.92% | 49.87% | (8.85)% | 4.61% | 13.13% |
| Ratios to Average Net AssetsB,E,F | | | | | |
| Expenses before reductions | .08% | .08% | .08% | .10% | .10% |
| Expenses net of fee waivers, if any | .08% | .08% | .08% | .05% | .07% |
| Expenses net of all reductions | .08% | .08% | .08% | .05% | .07% |
| Net investment income (loss) | 1.79% | 1.63% | 1.87% | 2.12% | 1.95% |
| Supplemental Data | | | | | |
| Net assets, end of period (000 omitted) | $4,444,575 | $1,659,777 | $713,027 | $516,194 | $342,884 |
| Portfolio turnover rateG | 12% | 21% | 74% | 11% | 6% |
A Calculated based on average shares outstanding during the period.
B Net investment income (loss) is affected by the timing of the declaration of dividends by any underlying mutual funds or exchange-traded funds (ETFs). Net investment income (loss) of any such underlying funds is not included in the Fund's net investment income (loss) ratio.
C Total distributions per share do not sum due to rounding.
D Total returns would have been lower if certain expenses had not been reduced during the applicable periods shown.
E Fees and expenses of any underlying mutual funds or exchange-traded funds (ETFs) are not included in the Fund's expense ratio. The Fund indirectly bears its proportionate share of these expenses. For additional expense information related to investments in Fidelity Central Funds, please refer to the "Investments in Fidelity Central Funds" note found in the Notes to Financial Statements section of the most recent Annual or Semi-Annual report.
F Expense ratios reflect operating expenses of the class. Expenses before reductions do not reflect amounts reimbursed, waived, or reduced through arrangements with the investment adviser, brokerage services, or other offset arrangements, if applicable, and do not represent the amount paid by the class during periods when reimbursements, waivers or reductions occur.
G Amount does not include the portfolio activity of any underlying mutual funds or exchange-traded funds (ETFs).
See accompanying notes which are an integral part of the financial statements.
Fidelity Freedom Index 2055 Fund Premier Class
| Years ended March 31, | 2022 | 2021 A |
| Selected Per–Share Data | | |
| Net asset value, beginning of period | $18.52 | $14.66 |
| Income from Investment Operations | | |
| Net investment income (loss)B,C | .35 | .39 |
| Net realized and unrealized gain (loss) | .60 | 3.77 |
| Total from investment operations | .95 | 4.16 |
| Distributions from net investment income | (.33) | (.25) |
| Distributions from net realized gain | (.08) | (.05) |
| Total distributions | (.41) | (.30) |
| Net asset value, end of period | $19.06 | $18.52 |
| Total ReturnD,E | 4.99% | 28.47% |
| Ratios to Average Net AssetsC,F,G | | |
| Expenses before reductions | .06% | .06%H |
| Expenses net of fee waivers, if any | .06% | .06%H |
| Expenses net of all reductions | .06% | .06%H |
| Net investment income (loss) | 1.81% | 2.84%H |
| Supplemental Data | | |
| Net assets, end of period (000 omitted) | $1,183,840 | $463,953 |
| Portfolio turnover rateI | 12% | 21% |
A For the period June 24, 2020 (commencement of sale of shares) through March 31, 2021.
B Calculated based on average shares outstanding during the period.
C Net investment income (loss) is affected by the timing of the declaration of dividends by any underlying mutual funds or exchange-traded funds (ETFs). Net investment income (loss) of any such underlying funds is not included in the Fund's net investment income (loss) ratio.
D Total returns for periods of less than one year are not annualized.
E Total returns would have been lower if certain expenses had not been reduced during the applicable periods shown.
F Fees and expenses of any underlying mutual funds or exchange-traded funds (ETFs) are not included in the Fund's expense ratio. The Fund indirectly bears its proportionate share of these expenses. For additional expense information related to investments in Fidelity Central Funds, please refer to the "Investments in Fidelity Central Funds" note found in the Notes to Financial Statements section of the most recent Annual or Semi-Annual report.
G Expense ratios reflect operating expenses of the class. Expenses before reductions do not reflect amounts reimbursed, waived, or reduced through arrangements with the investment adviser, brokerage services, or other offset arrangements, if applicable, and do not represent the amount paid by the class during periods when reimbursements, waivers or reductions occur.
H Annualized
I Amount does not include the portfolio activity of any underlying mutual funds or exchange-traded funds (ETFs).
See accompanying notes which are an integral part of the financial statements.
Fidelity Freedom® Index 2060 Fund
Investment Summary (Unaudited)
The information in the following tables is based on the direct investments of the Fund.
Top Holdings as of March 31, 2022
| | % of fund's net assets |
| Fidelity Series Total Market Index Fund | 53.9 |
| Fidelity Series Global ex U.S. Index Fund | 36.0 |
| Fidelity Series Bond Index Fund | 4.7 |
| Fidelity Series Long-Term Treasury Bond Index Fund | 4.6 |
| Fidelity Series International Developed Markets Bond Index Fund | 0.8 |
| Fidelity Cash Central Fund 0.31% | 0.0 |
| | 100.0 |
Asset Allocation (% of fund's net assets)
| Period end |
| | Domestic Equity Funds | 53.9% |
| | International Equity Funds | 36.0% |
| | Bond Funds | 10.1% |

Percentages shown as 0.0% may reflect amounts less than 0.05%.
Fidelity Freedom® Index 2060 Fund
Schedule of Investments March 31, 2022
Showing Percentage of Net Assets
| Domestic Equity Funds - 53.9% | | | |
| | | Shares | Value |
| Fidelity Series Total Market Index Fund (a) | | | |
| (Cost $1,256,353,721) | | 101,658,544 | 1,535,044,017 |
|
| International Equity Funds - 36.0% | | | |
| Fidelity Series Global ex U.S. Index Fund (a) | | | |
| (Cost $997,695,739) | | 72,407,754 | 1,024,569,721 |
|
| Bond Funds - 10.1% | | | |
| Fidelity Series Bond Index Fund (a) | | 13,860,820 | 135,420,207 |
| Fidelity Series International Developed Markets Bond Index Fund (a) | | 2,321,115 | 21,656,004 |
| Fidelity Series Long-Term Treasury Bond Index Fund (a) | | 17,230,089 | 131,293,277 |
| TOTAL BOND FUNDS | | | |
| (Cost $313,031,368) | | | 288,369,488 |
|
| Short-Term Funds - 0.0% | | | |
| Fidelity Cash Central Fund 0.31% (b) | | | |
| (Cost $1,310) | | 1,310 | 1,310 |
| TOTAL INVESTMENT IN SECURITIES - 100.0% | | | |
| (Cost $2,567,082,138) | | | 2,847,984,536 |
| NET OTHER ASSETS (LIABILITIES) - 0.0% | | | (141,441) |
| NET ASSETS - 100% | | | $2,847,843,095 |
Legend
(a) Affiliated Fund
(b) Affiliated fund that is generally available only to investment companies and other accounts managed by Fidelity Investments. The rate quoted is the annualized seven-day yield of the fund at period end. A complete unaudited listing of the fund's holdings as of its most recent quarter end is available upon request. In addition, each Fidelity Central Fund's financial statements, which are not covered by the Fund's Report of Independent Registered Public Accounting Firm, are available on the SEC's website or upon request.
Affiliated Central Funds
Fiscal year to date information regarding the Fund's investments in Fidelity Central Funds, including the ownership percentage, is presented below.
| Fund | Value, beginning of period | Purchases | Sales Proceeds | Dividend Income | Realized Gain/Loss | Change in Unrealized appreciation (depreciation) | Value, end of period | % ownership, end of period |
| Fidelity Cash Central Fund 0.31% | $-- | $788,962 | $787,652 | $1 | $-- | $-- | $1,310 | 0.0% |
| Total | $-- | $788,962 | $787,652 | $1 | $-- | $-- | $1,310 | |
Amounts in the income column in the above table include any capital gain distributions from underlying funds, which are presented in the corresponding line-item in the Statement of Operations, if applicable.
Affiliated Underlying Funds
Fiscal year to date information regarding the Fund's investments in affiliated Underlying Funds is presented below. Exchanges between classes of the same affiliated Underlying Funds may occur. If an underlying Fund changes its name, the name presented below is the name in effect at period end.
| Affiliate | Value, beginning of period | Purchases | Sales Proceeds | Dividend Income | Realized Gain (loss) | Change in Unrealized appreciation (depreciation) | Value, end of period |
| Fidelity Series Bond Index Fund | $114,125,363 | $82,530,393 | $52,624,409 | $2,309,283 | $(1,595,018) | $(7,016,122) | $135,420,207 |
| Fidelity Series Global ex U.S. Index Fund | 586,616,378 | 558,031,884 | 60,367,139 | 23,707,982 | (1,617,673) | (58,093,729) | 1,024,569,721 |
| Fidelity Series International Developed Markets Bond Index Fund | -- | 22,725,105 | 175,489 | 6,062 | (1,852) | (891,760) | 21,656,004 |
| Fidelity Series Long-Term Treasury Bond Index Fund | 48,726,412 | 95,625,966 | 4,856,241 | 1,958,921 | (604,862) | (7,597,998) | 131,293,277 |
| Fidelity Series Total Market Index Fund | 880,646,823 | 706,601,646 | 146,798,540 | 20,572,290 | (1,971,262) | 96,565,350 | 1,535,044,017 |
| | $1,630,114,976 | $1,465,514,994 | $264,821,818 | $48,554,538 | $(5,790,667) | $22,965,741 | $2,847,983,226 |
Amounts in the income column in the above table include any capital gain distributions from underlying funds, which are presented in the corresponding line-item in the Statement of Operations, if applicable.
Investment Valuation
The following is a summary of the inputs used, as of March 31, 2022, involving the Fund's assets and liabilities carried at fair value. The inputs or methodology used for valuing securities may not be an indication of the risk associated with investing in those securities. For more information on valuation inputs, and their aggregation into the levels used below, please refer to the Investment Valuation section in the accompanying Notes to Financial Statements.
| | Valuation Inputs at Reporting Date: |
| Description | Total | Level 1 | Level 2 | Level 3 |
| Investments in Securities: | | | | |
| Domestic Equity Funds | $1,535,044,017 | $1,535,044,017 | $-- | $-- |
| International Equity Funds | 1,024,569,721 | 1,024,569,721 | -- | -- |
| Bond Funds | 288,369,488 | 288,369,488 | -- | -- |
| Short-Term Funds | 1,310 | 1,310 | -- | -- |
| Total Investments in Securities: | $2,847,984,536 | $2,847,984,536 | $-- | $-- |
See accompanying notes which are an integral part of the financial statements.
Fidelity Freedom® Index 2060 Fund
Financial Statements
Statement of Assets and Liabilities
| | | March 31, 2022 |
| Assets | | |
Investment in securities, at value — See accompanying schedule:
| | |
| Fidelity Central Funds (cost $1,310) | $1,310 | |
| Other affiliated issuers (cost $2,567,080,828) | 2,847,983,226 | |
| Total Investment in Securities (cost $2,567,082,138) | | $2,847,984,536 |
| Receivable for investments sold | | 32,297,243 |
| Receivable for fund shares sold | | 8,811,850 |
| Total assets | | 2,889,093,629 |
| Liabilities | | |
| Payable for investments purchased | $38,174,767 | |
| Payable for fund shares redeemed | 2,936,083 | |
| Accrued management fee | 139,684 | |
| Total liabilities | | 41,250,534 |
| Net Assets | | $2,847,843,095 |
| Net Assets consist of: | | |
| Paid in capital | | $2,576,166,454 |
| Total accumulated earnings (loss) | | 271,676,641 |
| Net Assets | | $2,847,843,095 |
| Net Asset Value and Maximum Offering Price | | |
| Investor Class: | | |
| Net Asset Value, offering price and redemption price per share ($402,772,216 ÷ 24,963,543 shares) | | $16.13 |
| Institutional Premium Class: | | |
| Net Asset Value, offering price and redemption price per share ($1,938,418,594 ÷ 120,111,240 shares) | | $16.14 |
| Premier Class: | | |
| Net Asset Value, offering price and redemption price per share ($506,652,285 ÷ 31,385,360 shares) | | $16.14 |
See accompanying notes which are an integral part of the financial statements.
Statement of Operations
| | | Year ended March 31, 2022 |
| Investment Income | | |
| Dividends: | | |
| Affiliated issuers | | $43,305,664 |
| Income from Fidelity Central Funds | | 1 |
| Total income | | 43,305,665 |
| Expenses | | |
| Management fee | $1,863,400 | |
| Independent trustees' fees and expenses | 6,425 | |
| Total expenses | | 1,869,825 |
| Net investment income (loss) | | 41,435,840 |
| Realized and Unrealized Gain (Loss) | | |
| Net realized gain (loss) on: | | |
| Investment securities: | | |
| Affiliated issuers | (5,790,667) | |
| Capital gain distributions from underlying funds: | | |
| Affiliated issuers | 5,248,874 | |
| Total net realized gain (loss) | | (541,793) |
| Change in net unrealized appreciation (depreciation) on: | | |
| Investment securities: | | |
| Affiliated issuers | 22,965,741 | |
| Total change in net unrealized appreciation (depreciation) | | 22,965,741 |
| Net gain (loss) | | 22,423,948 |
| Net increase (decrease) in net assets resulting from operations | | $63,859,788 |
See accompanying notes which are an integral part of the financial statements.
Statement of Changes in Net Assets
| | Year ended March 31, 2022 | Year ended March 31, 2021 |
| Increase (Decrease) in Net Assets | | |
| Operations | | |
| Net investment income (loss) | $41,435,840 | $17,413,584 |
| Net realized gain (loss) | (541,793) | 3,741,128 |
| Change in net unrealized appreciation (depreciation) | 22,965,741 | 347,013,939 |
| Net increase (decrease) in net assets resulting from operations | 63,859,788 | 368,168,651 |
| Distributions to shareholders | (49,042,894) | (22,742,707) |
| Share transactions - net increase (decrease) | 1,203,015,315 | 720,267,363 |
| Total increase (decrease) in net assets | 1,217,832,209 | 1,065,693,307 |
| Net Assets | | |
| Beginning of period | 1,630,010,886 | 564,317,579 |
| End of period | $2,847,843,095 | $1,630,010,886 |
See accompanying notes which are an integral part of the financial statements.
Financial Highlights
Fidelity Freedom Index 2060 Fund Investor Class
| Years ended March 31, | 2022 | 2021 | 2020 | 2019 | 2018 |
| Selected Per–Share Data | | | | | |
| Net asset value, beginning of period | $15.67 | $10.65 | $12.49 | $12.23 | $11.04 |
| Income from Investment Operations | | | | | |
| Net investment income (loss)A,B | .29 | .23 | .24 | .26 | .24 |
| Net realized and unrealized gain (loss) | .49 | 5.06 | (1.19) | .27 | 1.21 |
| Total from investment operations | .78 | 5.29 | (.95) | .53 | 1.45 |
| Distributions from net investment income | (.26) | (.20) | (.21) | (.24) | (.20) |
| Distributions from net realized gain | (.06) | (.07) | (.68) | (.03) | (.06) |
| Total distributions | (.32) | (.27) | (.89) | (.27) | (.26) |
| Net asset value, end of period | $16.13 | $15.67 | $10.65 | $12.49 | $12.23 |
| Total ReturnC | 4.87% | 49.89% | (8.95)% | 4.54% | 13.17% |
| Ratios to Average Net AssetsB,D,E | | | | | |
| Expenses before reductions | .12% | .12% | .12% | .15% | .15% |
| Expenses net of fee waivers, if any | .12% | .12% | .12% | .11% | .12% |
| Expenses net of all reductions | .12% | .12% | .12% | .11% | .12% |
| Net investment income (loss) | 1.76% | 1.58% | 1.85% | 2.13% | 1.97% |
| Supplemental Data | | | | | |
| Net assets, end of period (000 omitted) | $402,772 | $813,216 | $323,054 | $160,477 | $82,123 |
| Portfolio turnover rateF | 12% | 24% | 67% | 15% | 7% |
A Calculated based on average shares outstanding during the period.
B Net investment income (loss) is affected by the timing of the declaration of dividends by any underlying mutual funds or exchange-traded funds (ETFs). Net investment income (loss) of any such underlying funds is not included in the Fund's net investment income (loss) ratio.
C Total returns would have been lower if certain expenses had not been reduced during the applicable periods shown.
D Fees and expenses of any underlying mutual funds or exchange-traded funds (ETFs) are not included in the Fund's expense ratio. The Fund indirectly bears its proportionate share of these expenses. For additional expense information related to investments in Fidelity Central Funds, please refer to the "Investments in Fidelity Central Funds" note found in the Notes to Financial Statements section of the most recent Annual or Semi-Annual report.
E Expense ratios reflect operating expenses of the class. Expenses before reductions do not reflect amounts reimbursed, waived, or reduced through arrangements with the investment adviser, brokerage services, or other offset arrangements, if applicable, and do not represent the amount paid by the class during periods when reimbursements, waivers or reductions occur.
F Amount does not include the portfolio activity of any underlying mutual funds or exchange-traded funds (ETFs).
See accompanying notes which are an integral part of the financial statements.
Fidelity Freedom Index 2060 Fund Institutional Premium Class
| Years ended March 31, | 2022 | 2021 | 2020 | 2019 | 2018 |
| Selected Per–Share Data | | | | | |
| Net asset value, beginning of period | $15.68 | $10.66 | $12.50 | $12.23 | $11.05 |
| Income from Investment Operations | | | | | |
| Net investment income (loss)A,B | .30 | .23 | .24 | .27 | .24 |
| Net realized and unrealized gain (loss) | .50 | 5.07 | (1.19) | .27 | 1.21 |
| Total from investment operations | .80 | 5.30 | (.95) | .54 | 1.45 |
| Distributions from net investment income | (.27) | (.21) | (.21) | (.24) | (.21) |
| Distributions from net realized gain | (.06) | (.07) | (.68) | (.03) | (.06) |
| Total distributions | (.34)C | (.28) | (.89) | (.27) | (.27) |
| Net asset value, end of period | $16.14 | $15.68 | $10.66 | $12.50 | $12.23 |
| Total ReturnD | 4.96% | 49.92% | (8.93)% | 4.66% | 13.12% |
| Ratios to Average Net AssetsB,E,F | | | | | |
| Expenses before reductions | .08% | .08% | .08% | .10% | .10% |
| Expenses net of fee waivers, if any | .08% | .08% | .08% | .05% | .07% |
| Expenses net of all reductions | .08% | .08% | .08% | .05% | .07% |
| Net investment income (loss) | 1.80% | 1.62% | 1.90% | 2.19% | 2.02% |
| Supplemental Data | | | | | |
| Net assets, end of period (000 omitted) | $1,938,419 | $633,265 | $241,263 | $138,092 | $73,658 |
| Portfolio turnover rateG | 12% | 24% | 67% | 15% | 7% |
A Calculated based on average shares outstanding during the period.
B Net investment income (loss) is affected by the timing of the declaration of dividends by any underlying mutual funds or exchange-traded funds (ETFs). Net investment income (loss) of any such underlying funds is not included in the Fund's net investment income (loss) ratio.
C Total distributions per share do not sum due to rounding.
D Total returns would have been lower if certain expenses had not been reduced during the applicable periods shown.
E Fees and expenses of any underlying mutual funds or exchange-traded funds (ETFs) are not included in the Fund's expense ratio. The Fund indirectly bears its proportionate share of these expenses. For additional expense information related to investments in Fidelity Central Funds, please refer to the "Investments in Fidelity Central Funds" note found in the Notes to Financial Statements section of the most recent Annual or Semi-Annual report.
F Expense ratios reflect operating expenses of the class. Expenses before reductions do not reflect amounts reimbursed, waived, or reduced through arrangements with the investment adviser, brokerage services, or other offset arrangements, if applicable, and do not represent the amount paid by the class during periods when reimbursements, waivers or reductions occur.
G Amount does not include the portfolio activity of any underlying mutual funds or exchange-traded funds (ETFs).
See accompanying notes which are an integral part of the financial statements.
Fidelity Freedom Index 2060 Fund Premier Class
| Years ended March 31, | 2022 | 2021 A |
| Selected Per–Share Data | | |
| Net asset value, beginning of period | $15.69 | $12.41 |
| Income from Investment Operations | | |
| Net investment income (loss)B,C | .30 | .32 |
| Net realized and unrealized gain (loss) | .49 | 3.21 |
| Total from investment operations | .79 | 3.53 |
| Distributions from net investment income | (.27) | (.21) |
| Distributions from net realized gain | (.06) | (.04) |
| Total distributions | (.34)D | (.25) |
| Net asset value, end of period | $16.14 | $15.69 |
| Total ReturnE,F | 4.91% | 28.52% |
| Ratios to Average Net AssetsC,G,H | | |
| Expenses before reductions | .06% | .06%I |
| Expenses net of fee waivers, if any | .06% | .06%I |
| Expenses net of all reductions | .06% | .06%I |
| Net investment income (loss) | 1.82% | 2.82%I |
| Supplemental Data | | |
| Net assets, end of period (000 omitted) | $506,652 | $183,530 |
| Portfolio turnover rateJ | 12% | 24% |
A For the period June 24, 2020 (commencement of sale of shares) through March 31, 2021.
B Calculated based on average shares outstanding during the period.
C Net investment income (loss) is affected by the timing of the declaration of dividends by any underlying mutual funds or exchange-traded funds (ETFs). Net investment income (loss) of any such underlying funds is not included in the Fund's net investment income (loss) ratio.
D Total distributions per share do not sum due to rounding.
E Total returns for periods of less than one year are not annualized.
F Total returns would have been lower if certain expenses had not been reduced during the applicable periods shown.
G Fees and expenses of any underlying mutual funds or exchange-traded funds (ETFs) are not included in the Fund's expense ratio. The Fund indirectly bears its proportionate share of these expenses. For additional expense information related to investments in Fidelity Central Funds, please refer to the "Investments in Fidelity Central Funds" note found in the Notes to Financial Statements section of the most recent Annual or Semi-Annual report.
H Expense ratios reflect operating expenses of the class. Expenses before reductions do not reflect amounts reimbursed, waived, or reduced through arrangements with the investment adviser, brokerage services, or other offset arrangements, if applicable, and do not represent the amount paid by the class during periods when reimbursements, waivers or reductions occur.
I Annualized
J Amount does not include the portfolio activity of any underlying mutual funds or exchange-traded funds (ETFs).
See accompanying notes which are an integral part of the financial statements.
Fidelity Freedom® Index 2065 Fund
Investment Summary (Unaudited)
The information in the following tables is based on the direct investments of the Fund.
Top Holdings as of March 31, 2022
| | % of fund's net assets |
| Fidelity Series Total Market Index Fund | 53.9 |
| Fidelity Series Global ex U.S. Index Fund | 36.0 |
| Fidelity Series Bond Index Fund | 4.7 |
| Fidelity Series Long-Term Treasury Bond Index Fund | 4.6 |
| Fidelity Series International Developed Markets Bond Index Fund | 0.8 |
| Fidelity Cash Central Fund 0.31% | 0.0 |
| | 100.0 |
Asset Allocation (% of fund's net assets)
| Period end |
| | Domestic Equity Funds | 53.9% |
| | International Equity Funds | 36.0% |
| | Bond Funds | 10.1% |

Percentages shown as 0.0% may reflect amounts less than 0.05%.
Fidelity Freedom® Index 2065 Fund
Schedule of Investments March 31, 2022
Showing Percentage of Net Assets
| Domestic Equity Funds - 53.9% | | | |
| | | Shares | Value |
| Fidelity Series Total Market Index Fund (a) | | | |
| (Cost $232,383,793) | | 17,084,349 | 257,973,665 |
|
| International Equity Funds - 36.0% | | | |
| Fidelity Series Global ex U.S. Index Fund (a) | | | |
| (Cost $175,067,832) | | 12,168,283 | 172,181,203 |
|
| Bond Funds - 10.1% | | | |
| Fidelity Series Bond Index Fund (a) | | 2,328,662 | 22,751,030 |
| Fidelity Series International Developed Markets Bond Index Fund (a) | | 390,243 | 3,640,969 |
| Fidelity Series Long-Term Treasury Bond Index Fund (a) | | 2,895,452 | 22,063,342 |
| TOTAL BOND FUNDS | | | |
| (Cost $52,442,950) | | | 48,455,341 |
|
| Short-Term Funds - 0.0% | | | |
| Fidelity Cash Central Fund 0.31% (b) | | | |
| (Cost $144) | | 144 | 144 |
| TOTAL INVESTMENT IN SECURITIES - 100.0% | | | |
| (Cost $459,894,719) | | | 478,610,353 |
| NET OTHER ASSETS (LIABILITIES) - 0.0% | | | (23,470) |
| NET ASSETS - 100% | | | $478,586,883 |
Legend
(a) Affiliated Fund
(b) Affiliated fund that is generally available only to investment companies and other accounts managed by Fidelity Investments. The rate quoted is the annualized seven-day yield of the fund at period end. A complete unaudited listing of the fund's holdings as of its most recent quarter end is available upon request. In addition, each Fidelity Central Fund's financial statements, which are not covered by the Fund's Report of Independent Registered Public Accounting Firm, are available on the SEC's website or upon request.
Affiliated Central Funds
Fiscal year to date information regarding the Fund's investments in Fidelity Central Funds, including the ownership percentage, is presented below.
| Fund | Value, beginning of period | Purchases | Sales Proceeds | Dividend Income | Realized Gain/Loss | Change in Unrealized appreciation (depreciation) | Value, end of period | % ownership, end of period |
| Fidelity Cash Central Fund 0.31% | $-- | $80,748 | $80,604 | $-- | $-- | $-- | $144 | 0.0% |
| Total | $-- | $80,748 | $80,604 | $-- | $-- | $-- | $144 | |
Amounts in the income column in the above table include any capital gain distributions from underlying funds, which are presented in the corresponding line-item in the Statement of Operations, if applicable.
Affiliated Underlying Funds
Fiscal year to date information regarding the Fund's investments in affiliated Underlying Funds is presented below. Exchanges between classes of the same affiliated Underlying Funds may occur. If an underlying Fund changes its name, the name presented below is the name in effect at period end.
| Affiliate | Value, beginning of period | Purchases | Sales Proceeds | Dividend Income | Realized Gain (loss) | Change in Unrealized appreciation (depreciation) | Value, end of period |
| Fidelity Series Bond Index Fund | $12,831,238 | $19,020,009 | $7,648,743 | $329,127 | $(230,565) | $(1,220,909) | $22,751,030 |
| Fidelity Series Global ex U.S. Index Fund | 65,956,447 | 124,854,963 | 8,318,559 | 3,652,688 | (316,680) | (9,994,968) | 172,181,203 |
| Fidelity Series International Developed Markets Bond Index Fund | -- | 3,824,177 | 38,580 | 890 | (621) | (144,007) | 3,640,969 |
| Fidelity Series Long-Term Treasury Bond Index Fund | 5,478,347 | 18,828,319 | 743,064 | 283,662 | (94,486) | (1,405,774) | 22,063,342 |
| Fidelity Series Total Market Index Fund | 99,015,602 | 168,483,521 | 20,568,666 | 3,036,399 | (457,619) | 11,500,827 | 257,973,665 |
| | $183,281,634 | $335,010,989 | $37,317,612 | $7,302,766 | $(1,099,971) | $(1,264,831) | $478,610,209 |
Amounts in the income column in the above table include any capital gain distributions from underlying funds, which are presented in the corresponding line-item in the Statement of Operations, if applicable.
Investment Valuation
The following is a summary of the inputs used, as of March 31, 2022, involving the Fund's assets and liabilities carried at fair value. The inputs or methodology used for valuing securities may not be an indication of the risk associated with investing in those securities. For more information on valuation inputs, and their aggregation into the levels used below, please refer to the Investment Valuation section in the accompanying Notes to Financial Statements.
| | Valuation Inputs at Reporting Date: |
| Description | Total | Level 1 | Level 2 | Level 3 |
| Investments in Securities: | | | | |
| Domestic Equity Funds | $257,973,665 | $257,973,665 | $-- | $-- |
| International Equity Funds | 172,181,203 | 172,181,203 | -- | -- |
| Bond Funds | 48,455,341 | 48,455,341 | -- | -- |
| Short-Term Funds | 144 | 144 | -- | -- |
| Total Investments in Securities: | $478,610,353 | $478,610,353 | $-- | $-- |
See accompanying notes which are an integral part of the financial statements.
Fidelity Freedom® Index 2065 Fund
Financial Statements
Statement of Assets and Liabilities
| | | March 31, 2022 |
| Assets | | |
Investment in securities, at value — See accompanying schedule:
| | |
| Fidelity Central Funds (cost $144) | $144 | |
| Other affiliated issuers (cost $459,894,575) | 478,610,209 | |
| Total Investment in Securities (cost $459,894,719) | | $478,610,353 |
| Cash | | 407 |
| Receivable for investments sold | | 5,215,566 |
| Receivable for fund shares sold | | 2,028,682 |
| Total assets | | 485,855,008 |
| Liabilities | | |
| Payable for investments purchased | $6,626,399 | |
| Payable for fund shares redeemed | 618,162 | |
| Accrued management fee | 23,564 | |
| Total liabilities | | 7,268,125 |
| Net Assets | | $478,586,883 |
| Net Assets consist of: | | |
| Paid in capital | | $461,053,100 |
| Total accumulated earnings (loss) | | 17,533,783 |
| Net Assets | | $478,586,883 |
| Net Asset Value and Maximum Offering Price | | |
| Investor Class: | | |
| Net Asset Value, offering price and redemption price per share ($74,400,518 ÷ 5,705,018 shares) | | $13.04 |
| Institutional Premium Class: | | |
| Net Asset Value, offering price and redemption price per share ($298,535,702 ÷ 22,891,414 shares) | | $13.04 |
| Premier Class: | | |
| Net Asset Value, offering price and redemption price per share ($105,650,663 ÷ 8,102,075 shares) | | $13.04 |
See accompanying notes which are an integral part of the financial statements.
Statement of Operations
| | | Year ended March 31, 2022 |
| Investment Income | | |
| Dividends: | | |
| Affiliated issuers | | $6,563,451 |
| Expenses | | |
| Management fee | $266,135 | |
| Independent trustees' fees and expenses | 867 | |
| Total expenses | | 267,002 |
| Net investment income (loss) | | 6,296,449 |
| Realized and Unrealized Gain (Loss) | | |
| Net realized gain (loss) on: | | |
| Investment securities: | | |
| Affiliated issuers | (1,099,971) | |
| Capital gain distributions from underlying funds: | | |
| Affiliated issuers | 739,315 | |
| Total net realized gain (loss) | | (360,656) |
| Change in net unrealized appreciation (depreciation) on: | | |
| Investment securities: | | |
| Affiliated issuers | (1,264,831) | |
| Total change in net unrealized appreciation (depreciation) | | (1,264,831) |
| Net gain (loss) | | (1,625,487) |
| Net increase (decrease) in net assets resulting from operations | | $4,670,962 |
See accompanying notes which are an integral part of the financial statements.
Statement of Changes in Net Assets
| | Year ended March 31, 2022 | Year ended March 31, 2021 |
| Increase (Decrease) in Net Assets | | |
| Operations | | |
| Net investment income (loss) | $6,296,449 | $1,408,492 |
| Net realized gain (loss) | (360,656) | 205,272 |
| Change in net unrealized appreciation (depreciation) | (1,264,831) | 24,328,497 |
| Net increase (decrease) in net assets resulting from operations | 4,670,962 | 25,942,261 |
| Distributions to shareholders | (7,030,508) | (1,821,588) |
| Share transactions - net increase (decrease) | 297,675,782 | 133,890,708 |
| Total increase (decrease) in net assets | 295,316,236 | 158,011,381 |
| Net Assets | | |
| Beginning of period | 183,270,647 | 25,259,266 |
| End of period | $478,586,883 | $183,270,647 |
See accompanying notes which are an integral part of the financial statements.
Financial Highlights
Fidelity Freedom Index 2065 Fund Investor Class
| Years ended March 31, | 2022 | 2021 | 2020 A |
| Selected Per–Share Data | | | |
| Net asset value, beginning of period | $12.65 | $8.60 | $10.00 |
| Income from Investment Operations | | | |
| Net investment income (loss)B,C | .25 | .12 | .25 |
| Net realized and unrealized gain (loss) | .38D | 4.15 | (1.43) |
| Total from investment operations | .63 | 4.27 | (1.18) |
| Distributions from net investment income | (.20) | (.15) | (.19) |
| Distributions from net realized gain | (.04) | (.07) | (.02) |
| Total distributions | (.24) | (.22) | (.22)E |
| Net asset value, end of period | $13.04 | $12.65 | $8.60 |
| Total ReturnF | 4.87% | 49.88% | (12.24)% |
| Ratios to Average Net AssetsC,G,H | | | |
| Expenses before reductions | .12% | .12% | .12%I |
| Expenses net of fee waivers, if any | .12% | .12% | .12%I |
| Expenses net of all reductions | .12% | .12% | .12%I |
| Net investment income (loss) | 1.88% | 1.04% | 3.25%I |
| Supplemental Data | | | |
| Net assets, end of period (000 omitted) | $74,401 | $86,437 | $15,363 |
| Portfolio turnover rateJ | 11% | 33% | 103%I |
A For the period June 28, 2019 (commencement of operations) through March 31, 2020.
B Calculated based on average shares outstanding during the period.
C Net investment income (loss) is affected by the timing of the declaration of dividends by any underlying mutual funds or exchange-traded funds (ETFs). Net investment income (loss) of any such underlying funds is not included in the Fund's net investment income (loss) ratio.
D The amount shown for a share outstanding does not correspond with the aggregate net gain (loss) on investments for the period due to the timing of sales and repurchases of shares in relation to fluctuating market values of the investments of the Fund.
E Total distributions per share do not sum due to rounding.
F Total returns for periods of less than one year are not annualized.
G Fees and expenses of any underlying mutual funds or exchange-traded funds (ETFs) are not included in the Fund's expense ratio. The Fund indirectly bears its proportionate share of these expenses. For additional expense information related to investments in Fidelity Central Funds, please refer to the "Investments in Fidelity Central Funds" note found in the Notes to Financial Statements section of the most recent Annual or Semi-Annual report.
H Expense ratios reflect operating expenses of the class. Expenses before reductions do not reflect amounts reimbursed, waived, or reduced through arrangements with the investment adviser, brokerage services, or other offset arrangements, if applicable, and do not represent the amount paid by the class during periods when reimbursements, waivers or reductions occur.
I Annualized
J Amount does not include the portfolio activity of any underlying mutual funds or exchange-traded funds (ETFs).
See accompanying notes which are an integral part of the financial statements.
Fidelity Freedom Index 2065 Fund Institutional Premium Class
| Years ended March 31, | 2022 | 2021 | 2020 A |
| Selected Per–Share Data | | | |
| Net asset value, beginning of period | $12.65 | $8.60 | $10.00 |
| Income from Investment Operations | | | |
| Net investment income (loss)B,C | .26 | .12 | .25 |
| Net realized and unrealized gain (loss) | .38D | 4.15 | (1.43) |
| Total from investment operations | .64 | 4.27 | (1.18) |
| Distributions from net investment income | (.21) | (.15) | (.19) |
| Distributions from net realized gain | (.04) | (.07) | (.02) |
| Total distributions | (.25) | (.22) | (.22)E |
| Net asset value, end of period | $13.04 | $12.65 | $8.60 |
| Total ReturnF | 4.95% | 49.92% | (12.23)% |
| Ratios to Average Net AssetsC,G,H | | | |
| Expenses before reductions | .08% | .08% | .08%I |
| Expenses net of fee waivers, if any | .08% | .08% | .08%I |
| Expenses net of all reductions | .08% | .08% | .08%I |
| Net investment income (loss) | 1.92% | 1.08% | 3.29%I |
| Supplemental Data | | | |
| Net assets, end of period (000 omitted) | $298,536 | $66,985 | $9,896 |
| Portfolio turnover rateJ | 11% | 33% | 103%I |
A For the period June 28, 2019 (commencement of operations) through March 31, 2020.
B Calculated based on average shares outstanding during the period.
C Net investment income (loss) is affected by the timing of the declaration of dividends by any underlying mutual funds or exchange-traded funds (ETFs). Net investment income (loss) of any such underlying funds is not included in the Fund's net investment income (loss) ratio.
D The amount shown for a share outstanding does not correspond with the aggregate net gain (loss) on investments for the period due to the timing of sales and repurchases of shares in relation to fluctuating market values of the investments of the Fund.
E Total distributions per share do not sum due to rounding.
F Total returns for periods of less than one year are not annualized.
G Fees and expenses of any underlying mutual funds or exchange-traded funds (ETFs) are not included in the Fund's expense ratio. The Fund indirectly bears its proportionate share of these expenses. For additional expense information related to investments in Fidelity Central Funds, please refer to the "Investments in Fidelity Central Funds" note found in the Notes to Financial Statements section of the most recent Annual or Semi-Annual report.
H Expense ratios reflect operating expenses of the class. Expenses before reductions do not reflect amounts reimbursed, waived, or reduced through arrangements with the investment adviser, brokerage services, or other offset arrangements, if applicable, and do not represent the amount paid by the class during periods when reimbursements, waivers or reductions occur.
I Annualized
J Amount does not include the portfolio activity of any underlying mutual funds or exchange-traded funds (ETFs).
See accompanying notes which are an integral part of the financial statements.
Fidelity Freedom Index 2065 Fund Premier Class
| Years ended March 31, | 2022 | 2021 A |
| Selected Per–Share Data | | |
| Net asset value, beginning of period | $12.65 | $9.99 |
| Income from Investment Operations | | |
| Net investment income (loss)B,C | .26 | .59 |
| Net realized and unrealized gain (loss) | .38D | 2.25 |
| Total from investment operations | .64 | 2.84 |
| Distributions from net investment income | (.21) | (.15) |
| Distributions from net realized gain | (.04) | (.03) |
| Total distributions | (.25) | (.18) |
| Net asset value, end of period | $13.04 | $12.65 |
| Total ReturnE | 4.96% | 28.47% |
| Ratios to Average Net AssetsC,F,G | | |
| Expenses before reductions | .06% | .06%H |
| Expenses net of fee waivers, if any | .06% | .06%H |
| Expenses net of all reductions | .06% | .06%H |
| Net investment income (loss) | 1.94% | 6.34%H |
| Supplemental Data | | |
| Net assets, end of period (000 omitted) | $105,651 | $29,849 |
| Portfolio turnover rateI | 11% | 33% |
A For the period June 24, 2020 (commencement of sale of shares) through March 31, 2021.
B Calculated based on average shares outstanding during the period.
C Net investment income (loss) is affected by the timing of the declaration of dividends by any underlying mutual funds or exchange-traded funds (ETFs). Net investment income (loss) of any such underlying funds is not included in the Fund's net investment income (loss) ratio.
D The amount shown for a share outstanding does not correspond with the aggregate net gain (loss) on investments for the period due to the timing of sales and repurchases of shares in relation to fluctuating market values of the investments of the Fund.
E Total returns for periods of less than one year are not annualized.
F Fees and expenses of any underlying mutual funds or exchange-traded funds (ETFs) are not included in the Fund's expense ratio. The Fund indirectly bears its proportionate share of these expenses. For additional expense information related to investments in Fidelity Central Funds, please refer to the "Investments in Fidelity Central Funds" note found in the Notes to Financial Statements section of the most recent Annual or Semi-Annual report.
G Expense ratios reflect operating expenses of the class. Expenses before reductions do not reflect amounts reimbursed, waived, or reduced through arrangements with the investment adviser, brokerage services, or other offset arrangements, if applicable, and do not represent the amount paid by the class during periods when reimbursements, waivers or reductions occur.
H Annualized
I Amount does not include the portfolio activity of any underlying mutual funds or exchange-traded funds (ETFs).
See accompanying notes which are an integral part of the financial statements.
Notes to Financial Statements
For the period ended March 31, 2022
1. Organization.
Fidelity Freedom Index Income Fund, Fidelity Freedom Index 2005 Fund, Fidelity Freedom Index 2010 Fund, Fidelity Freedom Index 2015 Fund, Fidelity Freedom Index 2020 Fund, Fidelity Freedom Index 2025 Fund, Fidelity Freedom Index 2030 Fund, Fidelity Freedom Index 2035 Fund, Fidelity Freedom Index 2040 Fund, Fidelity Freedom Index 2045 Fund, Fidelity Freedom Index 2050 Fund, Fidelity Freedom Index 2055 Fund, Fidelity Freedom Index 2060 Fund and Fidelity Freedom Index 2065 Fund (the Funds) are funds of Fidelity Aberdeen Street Trust (the Trust). The Trust is registered under the Investment Company Act of 1940, as amended (the 1940 Act), as an open-end management investment company organized as a Delaware statutory trust. Each Fund is authorized to issue an unlimited number of shares. Each Fund offers Investor Class, Institutional Premium Class and Premier Class shares, each of which has equal rights as to assets and voting privileges. Premier Class commenced sale of shares on June 24, 2020. Each class has exclusive voting rights with respect to matters that affect that class.
2. Investments in Fidelity Central Funds.
Funds may invest in Fidelity Central Funds, which are open-end investment companies generally available only to other investment companies and accounts managed by the investment adviser and its affiliates. The Schedule of Investments lists any Fidelity Central Funds held as an investment as of period end, but does not include the underlying holdings of each Fidelity Central Fund. An investing fund indirectly bears its proportionate share of the expenses of the underlying Fidelity Central Funds.
Based on its investment objective, each Fidelity Central Fund may invest or participate in various investment vehicles or strategies that are similar to those of the investing fund. These strategies are consistent with the investment objectives of the investing fund and may involve certain economic risks which may cause a decline in value of each of the Fidelity Central Funds and thus a decline in the value of the investing fund.
| Fidelity Central Fund | Investment Manager | Investment Objective | Investment Practices | Expense Ratio(a) |
| Fidelity Money Market Central Funds | Fidelity Management & Research Company LLC (FMR) | Each fund seeks to obtain a high level of current income consistent with the preservation of capital and liquidity. | Short-term Investments | Less than .005% |
(a) Expenses expressed as a percentage of average net assets and are as of each underlying Central Fund's most recent annual or semi-annual shareholder report.
A complete unaudited list of holdings for each Fidelity Central Fund is available upon request or at the Securities and Exchange Commission website at www.sec.gov. In addition, the financial statements of the Fidelity Central Funds which contain the significant accounting policies (including investment valuation policies) of those funds, and are not covered by the Report of Independent Registered Public Accounting Firm, are available on the Securities and Exchange Commission website or upon request.
3. Significant Accounting Policies.
Each Fund is an investment company and applies the accounting and reporting guidance of the Financial Accounting Standards Board (FASB) Accounting Standards Codification Topic 946 Financial Services - Investment Companies. The financial statements have been prepared in conformity with accounting principles generally accepted in the United States of America (GAAP), which require management to make certain estimates and assumptions at the date of the financial statements. Actual results could differ from those estimates. Subsequent events, if any, through the date that the financial statements were issued have been evaluated in the preparation of the financial statements. Each Fund's Schedule of Investments lists any underlying mutual funds or exchange-traded funds (ETFs) but does not include the underlying holdings of these funds. The following summarizes the significant accounting policies of each Fund:
Investment Valuation. Investments are valued as of 4:00 p.m. Eastern time on the last calendar day of the period. Each Fund categorizes the inputs to valuation techniques used to value its investments into a disclosure hierarchy consisting of three levels as shown below:
- Level 1 – unadjusted quoted prices in active markets for identical investments
- Level 2 – other significant observable inputs (including quoted prices for similar investments, interest rates, prepayment speeds, etc.)
- Level 3 – unobservable inputs (including the Fund's own assumptions based on the best information available)
Valuation techniques used to value each Fund's investments by major category are as follows. Investments in open-end mutual funds are valued at their closing net asset value (NAV) each business day and are categorized as Level 1 in the hierarchy. The aggregate value of investments by input level as of March 31, 2022 is included at the end of each Fund's Schedule of Investments.
Investment Transactions and Income. For financial reporting purposes, the Funds' investment holdings and NAV include trades executed through the end of the last business day of the period. The NAV per share for processing shareholder transactions is calculated as of the close of business of the New York Stock Exchange (NYSE), normally 4:00 p.m. Eastern time and includes trades executed through the end of the prior business day. Gains and losses on securities sold are determined on the basis of identified cost. Income and capital gain distributions from any underlying mutual funds or exchange-traded funds (ETFs) are recorded on the ex-dividend date. Distributions from any underlying mutual funds or exchange-traded funds (ETFs) that are deemed to be return of capital are recorded as a reduction of cost of investments.
Class Allocations and Expenses. Investment income, realized and unrealized capital gains and losses, common expenses of a fund, and certain fund-level expense reductions, if any, are allocated daily on a pro-rata basis to each class based on the relative net assets of each class to the total net assets of a fund. Each class differs with respect to transfer agent and distribution and service plan fees incurred, as applicable. Certain expense reductions may also differ by class, if applicable. For the reporting period, the allocated portion of income and expenses to each class as a percent of its average net assets may vary due to the timing of recording these transactions in relation to fluctuating net assets of the classes. Expenses directly attributable to a fund are charged to that fund. Expenses attributable to more than one fund are allocated among the respective funds on the basis of relative net assets or other appropriate methods. Expenses included in the accompanying financial statements reflect the expenses of that fund and do not include any expenses associated with any underlying mutual funds or exchange-traded funds. Although not included in a fund's expenses, a fund indirectly bears its proportionate share of these expenses through the net asset value of each underlying mutual fund or exchange-traded fund. Expense estimates are accrued in the period to which they relate and adjustments are made when actual amounts are known.
Deferred Trustee Compensation. Under a Deferred Compensation Plan (the Plan) for certain Funds, certain independent Trustees have elected to defer receipt of a portion of their annual compensation. Deferred amounts are invested in affiliated mutual funds, are marked-to-market and remain in a fund until distributed in accordance with the Plan. The investment of deferred amounts and the offsetting payable to the Trustees presented below are included in the accompanying Statement of Assets and Liabilities in other receivables and other payables and accrued expenses, as applicable.
| Fidelity Freedom Index 2030 Fund | $16,722 |
Income Tax Information and Distributions to Shareholders. Each year, each Fund intends to qualify as a regulated investment company under Subchapter M of the Internal Revenue Code, including distributing substantially all of its taxable income and realized gains. As a result, no provision for U.S. Federal income taxes is required. As of March 31, 2022, each Fund did not have any unrecognized tax benefits in the financial statements; nor is each Fund aware of any tax positions for which it is reasonably possible that the total amounts of unrecognized tax benefits will significantly change in the next twelve months. Each Fund files a U.S. federal tax return, in addition to state and local tax returns as required. Each Fund's federal income tax returns are subject to examination by the Internal Revenue Service (IRS) for a period of three fiscal years after they are filed. State and local tax returns may be subject to examination for an additional fiscal year depending on the jurisdiction.
Distributions are declared and recorded on the ex-dividend date. Income and capital gain distributions are declared separately for each class. Income and capital gain distributions are determined in accordance with income tax regulations, which may differ from GAAP.
Capital accounts within the financial statements are adjusted for permanent book-tax differences. These adjustments have no impact on net assets or the results of operations. Capital accounts are not adjusted for temporary book-tax differences which will reverse in a subsequent period.
Book-tax differences are primarily due to the short-term gain distributions from the underlying mutual funds or exchange-traded funds (ETFs) and losses deferred due to wash sales and excise tax regulations.
As of period end, the cost and unrealized appreciation (depreciation) in securities, and derivatives if applicable, for federal income tax purposes were as follows for each Fund:
| | Tax cost | Gross unrealized appreciation | Gross unrealized depreciation | Net unrealized appreciation (depreciation) |
| Fidelity Freedom Index Income Fund | $1,310,441,985 | $54,094,793 | $(50,840,324) | $3,254,469 |
| Fidelity Freedom Index 2005 Fund | 246,806,254 | 16,596,304 | (7,686,372) | 8,909,932 |
| Fidelity Freedom Index 2010 Fund | 778,464,279 | 78,592,173 | (20,514,303) | 58,077,870 |
| Fidelity Freedom Index 2015 Fund | 2,274,291,224 | 259,283,037 | (70,799,262) | 188,483,775 |
| Fidelity Freedom Index 2020 Fund | 7,602,159,824 | 1,086,631,728 | (235,077,815) | 851,553,913 |
| Fidelity Freedom Index 2025 Fund | 12,343,522,888 | 1,702,728,763 | (429,597,112) | 1,273,131,651 |
| Fidelity Freedom Index 2030 Fund | 15,064,778,335 | 2,299,345,633 | (506,592,273) | 1,792,753,360 |
| Fidelity Freedom Index 2035 Fund | 12,966,394,096 | 2,182,102,265 | (389,052,036) | 1,793,050,229 |
| Fidelity Freedom Index 2040 Fund | 12,333,924,896 | 2,439,900,164 | (278,883,301) | 2,161,016,863 |
| Fidelity Freedom Index 2045 Fund | 10,047,132,190 | 1,814,452,017 | (231,282,197) | 1,583,169,820 |
| Fidelity Freedom Index 2050 Fund | 8,983,297,345 | 1,643,642,135 | (204,702,344) | 1,438,939,791 |
| Fidelity Freedom Index 2055 Fund | 5,680,453,309 | 869,731,303 | (140,143,439) | 729,587,864 |
| Fidelity Freedom Index 2060 Fund | 2,578,392,802 | 337,378,608 | (67,786,874) | 269,591,734 |
| Fidelity Freedom Index 2065 Fund | 461,472,318 | 31,650,492 | (14,512,457) | 17,138,035 |
The tax-based components of distributable earnings as of period end were as follows for each Fund:
| | Undistributed ordinary income | Undistributed long-term capital gain | Net unrealized appreciation (depreciation) on securities and other investments |
| Fidelity Freedom Index Income Fund | $1,230,235 | $2,164,617 | $3,254,469 |
| Fidelity Freedom Index 2005 Fund | 509,662 | 1,628,453 | 8,909,932 |
| Fidelity Freedom Index 2010 Fund | 1,371,561 | 6,656,195 | 58,077,870 |
| Fidelity Freedom Index 2015 Fund | 3,895,834 | 7,457,183 | 188,483,775 |
| Fidelity Freedom Index 2020 Fund | 10,914,215 | 23,235,449 | 851,553,913 |
| Fidelity Freedom Index 2025 Fund | 24,341,687 | 13,739,368 | 1,273,131,651 |
| Fidelity Freedom Index 2030 Fund | 26,356,682 | 17,885,774 | 1,792,753,360 |
| Fidelity Freedom Index 2035 Fund | 14,058,572 | 9,170,228 | 1,793,050,229 |
| Fidelity Freedom Index 2040 Fund | 7,599,049 | 9,815,134 | 2,161,016,863 |
| Fidelity Freedom Index 2045 Fund | 3,094,465 | 5,686,627 | 1,583,169,820 |
| Fidelity Freedom Index 2050 Fund | 2,493,014 | 4,969,400 | 1,438,939,791 |
| Fidelity Freedom Index 2055 Fund | 939,150 | 3,533,485 | 729,587,864 |
| Fidelity Freedom Index 2060 Fund | 436,985 | 1,647,922 | 269,591,734 |
| Fidelity Freedom Index 2065 Fund | 118,395 | 277,354 | 17,138,035 |
Certain of the Funds intend to elect to defer to the next fiscal year capital losses recognized during the period November 1, 2021 to March 31, 2022. Loss deferrals were as follows:
| | Capital losses |
| Fidelity Freedom Index Income Fund | $(635,659) |
| Fidelity Freedom Index 2015 Fund | (446,575) |
The tax character of distributions paid was as follows:
| March 31, 2022 | | | |
| | Ordinary Income | Long-term Capital Gains | Total |
| Fidelity Freedom Index Income Fund | $20,848,948 | $4,645,112 | $25,494,060 |
| Fidelity Freedom Index 2005 Fund | 4,372,992 | 3,451,195 | 7,824,187 |
| Fidelity Freedom Index 2010 Fund | 15,196,336 | 17,462,007 | 32,658,343 |
| Fidelity Freedom Index 2015 Fund | 44,065,214 | 27,464,352 | 71,529,566 |
| Fidelity Freedom Index 2020 Fund | 160,978,042 | 76,784,154 | 237,762,196 |
| Fidelity Freedom Index 2025 Fund | 250,811,546 | 44,953,130 | 295,764,676 |
| Fidelity Freedom Index 2030 Fund | 311,054,323 | 52,775,321 | 363,829,644 |
| Fidelity Freedom Index 2035 Fund | 251,316,518 | 38,429,382 | 289,745,900 |
| Fidelity Freedom Index 2040 Fund | 253,789,486 | 37,756,017 | 291,545,503 |
| Fidelity Freedom Index 2045 Fund | 198,196,298 | 27,800,302 | 225,996,600 |
| Fidelity Freedom Index 2050 Fund | 176,885,865 | 25,539,609 | 202,425,474 |
| Fidelity Freedom Index 2055 Fund | 103,441,230 | 13,565,202 | 117,006,432 |
| Fidelity Freedom Index 2060 Fund | 43,672,025 | 5,370,869 | 49,042,894 |
| Fidelity Freedom Index 2065 Fund | 6,539,505 | 491,004 | 7,030,509 |
| March 31, 2021 | | | |
| | Ordinary Income | Long-term Capital Gains | Total |
| Fidelity Freedom Index Income Fund | $15,038,006 | $2,346,771 | $17,384,777 |
| Fidelity Freedom Index 2005 Fund | 4,509,978 | 949,514 | 5,459,492 |
| Fidelity Freedom Index 2010 Fund | 17,243,995 | 4,267,778 | 21,511,773 |
| Fidelity Freedom Index 2015 Fund | 40,855,832 | 11,600,355 | 52,456,187 |
| Fidelity Freedom Index 2020 Fund | 142,448,517 | 35,936,351 | 178,384,868 |
| Fidelity Freedom Index 2025 Fund | 190,228,325 | 36,769,145 | 226,997,470 |
| Fidelity Freedom Index 2030 Fund | 227,350,731 | 46,511,322 | 273,862,053 |
| Fidelity Freedom Index 2035 Fund | 165,789,771 | 26,757,833 | 192,547,604 |
| Fidelity Freedom Index 2040 Fund | 164,016,123 | 17,057,200 | 181,073,323 |
| Fidelity Freedom Index 2045 Fund | 120,224,537 | 11,121,553 | 131,346,090 |
| Fidelity Freedom Index 2050 Fund | 109,788,546 | 9,867,858 | 119,656,404 |
| Fidelity Freedom Index 2055 Fund | 56,445,213 | 4,223,034 | 60,668,247 |
| Fidelity Freedom Index 2060 Fund | 21,418,348 | 1,324,359 | 22,742,707 |
| Fidelity Freedom Index 2065 Fund | 1,765,827 | 55,761 | 1,821,588 |
4. Purchases and Sales of Investments.
Purchases and sales of securities, other than short-term securities and in-kind transactions, as applicable, are noted in the table below.
| | Purchases ($) | Sales ($) |
| Fidelity Freedom Index Income Fund | 791,025,930 | 436,620,750 |
| Fidelity Freedom Index 2005 Fund | 122,097,657 | 115,761,834 |
| Fidelity Freedom Index 2010 Fund | 335,095,066 | 361,136,067 |
| Fidelity Freedom Index 2015 Fund | 1,128,764,803 | 778,071,435 |
| Fidelity Freedom Index 2020 Fund | 3,905,070,300 | 2,916,673,530 |
| Fidelity Freedom Index 2025 Fund | 5,880,114,040 | 3,110,559,042 |
| Fidelity Freedom Index 2030 Fund | 7,016,925,282 | 3,164,095,607 |
| Fidelity Freedom Index 2035 Fund | 5,989,837,673 | 1,948,193,048 |
| Fidelity Freedom Index 2040 Fund | 5,344,200,869 | 1,698,432,530 |
| Fidelity Freedom Index 2045 Fund | 4,579,959,969 | 1,249,801,219 |
| Fidelity Freedom Index 2050 Fund | 4,055,418,907 | 1,110,797,135 |
| Fidelity Freedom Index 2055 Fund | 2,898,044,914 | 635,615,638 |
| Fidelity Freedom Index 2060 Fund | 1,465,514,994 | 264,821,818 |
| Fidelity Freedom Index 2065 Fund | 335,010,989 | 37,317,612 |
5. Fees and Other Transactions with Affiliates.
Management Fee and Expense Contract. Fidelity Management & Research Company LLC (the investment adviser) provides the Funds with investment management related services. Under the management contract, Investor Class, Institutional Premium Class and Premier Class of each Fund pays an all-inclusive monthly management fee at an annual rate of .12%, .08% and .06% of class-level average net assets, respectively. Under the management contract, each Fund's investment adviser pays all ordinary operating expenses of the Fund, except fees and expenses of the independent Trustees and certain miscellaneous expenses such as interest expense. In addition, under the expense contract, total expenses, including acquired fund fees and expenses, are limited to an annual rate of .12%, .08% and .06% of class-level average net assets for Investor Class, Institutional Premium Class and Premier Class, respectively, with certain exceptions.
Interfund Trades. Funds may purchase from or sell securities to other Fidelity Funds under procedures adopted by the Board. The procedures have been designed to ensure these interfund trades are executed in accordance with Rule 17a-7 of the 1940 Act. Any interfund trades are included within the respective purchases and sales amounts shown in the Purchases and Sales of Investments note. During the period there were no interfund trades.
Reallocation of Underlying Fund Investments. During the period, the investment adviser reallocated investments of the Funds. This involved taxable redemptions of the Funds' interest in Fidelity Series Inflation-Protected Bond Index Fund, ("Underlying Fund") for investments and cash and non-taxable exchanges of those investments and cash for shares of Fidelity Series 0-5 Year Inflation-Protected Bond Index Fund and Fidelity Series 5+ Year Inflation-Protected Bond Index Fund which are affiliated investment companies managed by FMR. Net realized gain (loss) on the redemptions of the Underlying Fund in connection with the reallocation is included in the accompanying Statements of Operations as "Net realized gain (loss) on Affiliated issuers."
Details of these transactions with the net related gain (loss) for the Funds are presented in the accompanying table:
| | Value of Investments and Cash reallocated ($) | Net realized Gain (Loss) on redemptions of Underlying Fund ($) |
| Fidelity Freedom Index Income Fund | 22,256,667 | 603,802 |
| Fidelity Freedom Index 2005 Fund | 4,949,577 | 166,635 |
| Fidelity Freedom Index 2010 Fund | 14,191,070 | 631,236 |
| Fidelity Freedom Index 2015 Fund | 29,748,230 | 1,152,683 |
| Fidelity Freedom Index 2020 Fund | 84,251,171 | 2,931,515 |
| Fidelity Freedom Index 2025 Fund | 109,006,154 | 2,675,858 |
| Fidelity Freedom Index 2030 Fund | 107,554,641 | 2,308,913 |
6. Expense Reductions.
Through arrangements with each applicable Fund's custodian, credits realized as a result of certain uninvested cash balances were used to reduce each applicable Fund's or class' expenses. All of the applicable expense reductions are noted in the table below.
| | Custodian credits |
| Fidelity Freedom Index Income Fund | $7 |
| Fidelity Freedom Index 2015 Fund | 1 |
| Fidelity Freedom Index 2020 Fund | 1 |
| Fidelity Freedom Index 2025 Fund | 5 |
| Fidelity Freedom Index 2030 Fund | 4 |
| Fidelity Freedom Index 2035 Fund | 4 |
| Fidelity Freedom Index 2040 Fund | 6 |
| Fidelity Freedom Index 2045 Fund | 3 |
| Fidelity Freedom Index 2050 Fund | 1 |
| Fidelity Freedom Index 2055 Fund | 2 |
7. Distributions to Shareholders.
Distributions to shareholders of each class were as follows:
| | Year ended
March 31, 2022 | Year ended
March 31, 2021(a) |
| Fidelity Freedom Index Income Fund | | |
| Distributions to shareholders | | |
| Investor Class | $5,394,946 | $8,412,828 |
| Institutional Premium Class | 14,202,717 | 7,708,099 |
| Premier Class | 5,896,397 | 1,263,850 |
| Total | $25,494,060 | $17,384,777 |
| Fidelity Freedom Index 2005 Fund | | |
| Distributions to shareholders | | |
| Investor Class | $1,971,108 | $3,094,696 |
| Institutional Premium Class | 5,359,867 | 2,342,566 |
| Premier Class | 493,212 | 22,230 |
| Total | $7,824,187 | $5,459,492 |
| Fidelity Freedom Index 2010 Fund | | |
| Distributions to shareholders | | |
| Investor Class | $9,206,372 | $11,290,367 |
| Institutional Premium Class | 21,972,614 | 10,170,590 |
| Premier Class | 1,479,357 | 50,816 |
| Total | $32,658,343 | $21,511,773 |
| Fidelity Freedom Index 2015 Fund | | |
| Distributions to shareholders | | |
| Investor Class | $19,585,383 | $29,570,606 |
| Institutional Premium Class | 38,768,703 | 19,997,848 |
| Premier Class | 13,175,481 | 2,887,733 |
| Total | $71,529,567 | $52,456,187 |
| Fidelity Freedom Index 2020 Fund | | |
| Distributions to shareholders | | |
| Investor Class | $54,889,794 | $85,208,069 |
| Institutional Premium Class | 143,219,434 | 84,177,868 |
| Premier Class | 39,652,970 | 8,998,931 |
| Total | $237,762,198 | $178,384,868 |
| Fidelity Freedom Index 2025 Fund | | |
| Distributions to shareholders | | |
| Investor Class | $60,731,557 | $115,896,659 |
| Institutional Premium Class | 181,892,966 | 97,430,146 |
| Premier Class | 53,140,152 | 13,670,665 |
| Total | $295,764,675 | $226,997,470 |
| Fidelity Freedom Index 2030 Fund | | |
| Distributions to shareholders | | |
| Investor Class | $64,572,151 | $126,312,338 |
| Institutional Premium Class | 234,597,582 | 130,580,791 |
| Premier Class | 64,659,912 | 16,968,924 |
| Total | $363,829,645 | $273,862,053 |
| Fidelity Freedom Index 2035 Fund | | |
| Distributions to shareholders | | |
| Investor Class | $45,530,507 | $94,053,841 |
| Institutional Premium Class | 185,004,887 | 82,015,645 |
| Premier Class | 59,210,505 | 16,478,118 |
| Total | $289,745,899 | $192,547,604 |
| Fidelity Freedom Index 2040 Fund | | |
| Distributions to shareholders | | |
| Investor Class | $38,299,288 | $77,259,320 |
| Institutional Premium Class | 192,780,856 | 87,999,856 |
| Premier Class | 60,465,360 | 15,814,147 |
| Total | $291,545,504 | $181,073,323 |
| Fidelity Freedom Index 2045 Fund | | |
| Distributions to shareholders | | |
| Investor Class | $27,779,533 | $58,856,169 |
| Institutional Premium Class | 146,966,158 | 57,739,290 |
| Premier Class | 51,250,909 | 14,750,631 |
| Total | $225,996,600 | $131,346,090 |
| Fidelity Freedom Index 2050 Fund | | |
| Distributions to shareholders | | |
| Investor Class | $23,949,677 | $51,192,283 |
| Institutional Premium Class | 133,604,581 | 54,421,670 |
| Premier Class | 44,871,215 | 14,042,451 |
| Total | $202,425,473 | $119,656,404 |
| Fidelity Freedom Index 2055 Fund | | |
| Distributions to shareholders | | |
| Investor Class | $14,928,491 | $29,441,694 |
| Institutional Premium Class | 80,213,438 | 25,548,688 |
| Premier Class | 21,864,503 | 5,677,865 |
| Total | $117,006,432 | $60,668,247 |
| Fidelity Freedom Index 2060 Fund | | |
| Distributions to shareholders | | |
| Investor Class | $7,097,374 | $11,318,290 |
| Institutional Premium Class | 33,140,534 | 9,224,021 |
| Premier Class | 8,804,986 | 2,200,396 |
| Total | $49,042,894 | $22,742,707 |
| Fidelity Freedom Index 2065 Fund | | |
| Distributions to shareholders | | |
| Investor Class | $1,109,725 | $841,482 |
| Institutional Premium Class | 4,299,113 | 687,282 |
| Premier Class | 1,621,670 | 292,824 |
| Total | $7,030,508 | $1,821,588 |
(a) Distributions for Premier Class are for the period June 24, 2020 (commencement of sale of shares) through March 31, 2021.
8. Share Transactions.
Share transactions for each class were as follows and may contain in-kind transactions, automatic conversions between classes or exchanges between affiliated funds:
| | Shares | Shares | Dollars | Dollars |
| | Year ended March 31, 2022 | Year endedMarch 31, 2021(a) | Year ended March 31, 2022 | Year endedMarch 31, 2021(a) |
| Fidelity Freedom Index Income Fund | | | | |
| Investor Class | | | | |
| Shares sold | 8,481,393 | 25,346,654 | $107,435,815 | $313,022,247 |
| Reinvestment of distributions | 405,350 | 669,162 | 5,132,886 | 8,284,732 |
| Shares redeemed | (28,504,938) | (12,670,498) | (360,223,936) | (156,674,466) |
| Net increase (decrease) | (19,618,195) | 13,345,318 | $(247,655,235) | $164,632,513 |
| Institutional Premium Class | | | | |
| Shares sold | 49,575,552 | 22,139,554 | $625,596,426 | $274,262,737 |
| Reinvestment of distributions | 1,122,790 | 624,286 | 14,202,305 | 7,707,999 |
| Shares redeemed | (23,203,204) | (13,644,960) | (292,198,319) | (169,112,774) |
| Net increase (decrease) | 27,495,138 | 9,118,880 | $347,600,412 | $112,857,962 |
| Premier Class | | | | |
| Shares sold | 23,047,327 | 10,271,674 | $292,916,276 | $127,086,326 |
| Reinvestment of distributions | 466,673 | 100,652 | 5,896,397 | 1,263,850 |
| Shares redeemed | (3,183,861) | (924,567) | (40,016,365) | (11,595,922) |
| Net increase (decrease) | 20,330,139 | 9,447,759 | $258,796,308 | $116,754,254 |
| Fidelity Freedom Index 2005 Fund | | | | |
| Investor Class | | | | |
| Shares sold | 1,966,344 | 5,948,859 | $27,694,913 | $80,804,523 |
| Reinvestment of distributions | 136,839 | 224,144 | 1,909,546 | 3,069,159 |
| Shares redeemed | (8,224,180) | (3,445,237) | (115,310,215) | (46,986,744) |
| Net increase (decrease) | (6,120,997) | 2,727,766 | $(85,705,756) | $36,886,938 |
| Institutional Premium Class | | | | |
| Shares sold | 10,602,908 | 5,645,336 | $148,404,517 | $76,755,285 |
| Reinvestment of distributions | 384,063 | 171,436 | 5,359,861 | 2,342,563 |
| Shares redeemed | (5,215,870) | (4,736,494) | (73,005,068) | (64,741,537) |
| Net increase (decrease) | 5,771,101 | 1,080,278 | $80,759,310 | $14,356,311 |
| Premier Class | | | | |
| Shares sold | 1,354,970 | 600,224 | $18,878,809 | $8,328,392 |
| Reinvestment of distributions | 35,321 | 1,599 | 493,212 | 22,230 |
| Shares redeemed | (338,396) | (44,365) | (4,708,998) | (613,549) |
| Net increase (decrease) | 1,051,895 | 557,458 | $14,663,023 | $7,737,073 |
| Fidelity Freedom Index 2010 Fund | | | | |
| Investor Class | | | | |
| Shares sold | 4,839,851 | 14,253,379 | $69,231,957 | $194,656,950 |
| Reinvestment of distributions | 629,142 | 815,639 | 8,957,156 | 11,194,136 |
| Shares redeemed | (23,046,498) | (9,852,689) | (329,686,734) | (134,317,265) |
| Net increase (decrease) | (17,577,505) | 5,216,329 | $(251,497,621) | $71,533,821 |
| Institutional Premium Class | | | | |
| Shares sold | 30,215,121 | 12,764,960 | $432,730,529 | $175,013,482 |
| Reinvestment of distributions | 1,543,158 | 740,911 | 21,972,507 | 10,170,483 |
| Shares redeemed | (17,715,741) | (12,005,791) | (253,268,269) | (166,079,070) |
| Net increase (decrease) | 14,042,538 | 1,500,080 | $201,434,767 | $19,104,895 |
| Premier Class | | | | |
| Shares sold | 3,790,957 | 634,183 | $54,389,609 | $8,936,506 |
| Reinvestment of distributions | 103,754 | 3,609 | 1,479,357 | 50,816 |
| Shares redeemed | (1,030,719) | (98,674) | (14,643,434) | (1,390,529) |
| Net increase (decrease) | 2,863,992 | 539,118 | $41,225,532 | $7,596,793 |
| Fidelity Freedom Index 2015 Fund | | | | |
| Investor Class | | | | |
| Shares sold | 9,632,515 | 30,386,441 | $149,498,195 | $439,572,501 |
| Reinvestment of distributions | 1,223,278 | 2,006,976 | 18,981,469 | 29,308,339 |
| Shares redeemed | (49,325,988) | (22,842,196) | (763,372,393) | (330,139,338) |
| Net increase (decrease) | (38,470,195) | 9,551,221 | $(594,892,729) | $138,741,502 |
| Institutional Premium Class | | | | |
| Shares sold | 72,324,204 | 23,158,561 | $1,119,918,590 | $338,139,301 |
| Reinvestment of distributions | 2,497,214 | 1,376,153 | 38,768,136 | 19,997,502 |
| Shares redeemed | (36,385,158) | (25,524,261) | (563,536,135) | (370,171,600) |
| Net increase (decrease) | 38,436,260 | (989,547) | $595,150,591 | $(12,034,797) |
| Premier Class | | | | |
| Shares sold | 28,204,523 | 11,490,600 | $440,324,385 | $166,710,022 |
| Reinvestment of distributions | 846,552 | 192,131 | 13,175,481 | 2,887,733 |
| Shares redeemed | (4,946,640) | (1,014,112) | (76,128,706) | (15,254,846) |
| Net increase (decrease) | 24,104,435 | 10,668,619 | $377,371,160 | $154,342,909 |
| Fidelity Freedom Index 2020 Fund | | | | |
| Investor Class | | | | |
| Shares sold | 35,110,862 | 93,262,515 | $599,390,051 | $1,457,966,429 |
| Reinvestment of distributions | 3,058,846 | 5,341,510 | 52,438,843 | 84,421,816 |
| Shares redeemed | (147,696,067) | (67,103,425) | (2,511,947,013) | (1,042,246,096) |
| Net increase (decrease) | (109,526,359) | 31,500,600 | $(1,860,118,119) | $500,142,149 |
| Institutional Premium Class | | | | |
| Shares sold | 256,072,951 | 92,762,476 | $4,361,352,030 | $1,462,317,439 |
| Reinvestment of distributions | 8,329,069 | 5,347,730 | 142,869,596 | 84,177,292 |
| Shares redeemed | (154,828,095) | (99,086,681) | (2,645,131,560) | (1,560,326,361) |
| Net increase (decrease) | 109,573,925 | (976,475) | $1,859,090,066 | $(13,831,630) |
| Premier Class | | | | |
| Shares sold | 73,480,499 | 35,288,761 | $1,261,881,908 | $554,902,192 |
| Reinvestment of distributions | 2,305,212 | 550,393 | 39,652,970 | 8,998,931 |
| Shares redeemed | (13,752,567) | (2,787,832) | (233,304,654) | (45,573,915) |
| Net increase (decrease) | 62,033,144 | 33,051,322 | $1,068,230,224 | $518,327,208 |
| Fidelity Freedom Index 2025 Fund | | | | |
| Investor Class | | | | |
| Shares sold | 56,734,839 | 136,881,080 | $1,091,306,328 | $2,374,070,380 |
| Reinvestment of distributions | 3,016,077 | 6,533,424 | 58,529,327 | 115,155,009 |
| Shares redeemed | (218,848,664) | (80,881,962) | (4,184,214,590) | (1,389,266,714) |
| Net increase (decrease) | (159,097,748) | 62,532,542 | $(3,034,378,935) | $1,099,958,675 |
| Institutional Premium Class | | | | |
| Shares sold | 359,319,662 | 123,878,730 | $6,891,531,555 | $2,166,148,471 |
| Reinvestment of distributions | 9,335,797 | 5,535,115 | 181,616,864 | 97,428,286 |
| Shares redeemed | (156,142,595) | (89,951,270) | (3,006,248,743) | (1,569,492,319) |
| Net increase (decrease) | 212,512,864 | 39,462,575 | $4,066,899,676 | $694,084,438 |
| Premier Class | | | | |
| Shares sold | 103,732,816 | 50,993,626 | $2,004,154,818 | $888,752,718 |
| Reinvestment of distributions | 2,725,958 | 749,488 | 53,140,152 | 13,670,665 |
| Shares redeemed | (14,391,020) | (2,479,402) | (276,169,756) | (45,269,946) |
| Net increase (decrease) | 92,067,754 | 49,263,712 | $1,781,125,214 | $857,153,437 |
| Fidelity Freedom Index 2030 Fund | | | | |
| Investor Class | | | | |
| Shares sold | 58,229,571 | 137,199,675 | $1,179,636,160 | $2,474,790,896 |
| Reinvestment of distributions | 3,045,743 | 6,837,869 | 62,437,318 | 125,630,168 |
| Shares redeemed | (229,481,691) | (78,751,753) | (4,619,212,400) | (1,400,723,236) |
| Net increase (decrease) | (168,206,377) | 65,285,791 | $(3,377,138,922) | $1,199,697,828 |
| Institutional Premium Class | | | | |
| Shares sold | 406,093,310 | 139,414,801 | $8,204,133,168 | $2,527,931,635 |
| Reinvestment of distributions | 11,394,470 | 7,124,570 | 234,108,725 | 130,562,601 |
| Shares redeemed | (161,413,837) | (106,014,008) | (3,277,558,518) | (1,924,035,828) |
| Net increase (decrease) | 256,073,943 | 40,525,363 | $5,160,683,375 | $734,458,408 |
| Premier Class | | | | |
| Shares sold | 111,963,713 | 58,502,186 | $2,276,591,704 | $1,058,670,090 |
| Reinvestment of distributions | 3,140,937 | 890,757 | 64,659,912 | 16,968,924 |
| Shares redeemed | (10,894,011) | (1,872,075) | (220,435,978) | (35,643,270) |
| Net increase (decrease) | 104,210,639 | 57,520,868 | $2,120,815,638 | $1,039,995,744 |
| Fidelity Freedom Index 2035 Fund | | | | |
| Investor Class | | | | |
| Shares sold | 43,930,772 | 106,155,011 | $990,304,042 | $2,067,431,912 |
| Reinvestment of distributions | 1,925,209 | 4,673,438 | 44,207,328 | 93,610,468 |
| Shares redeemed | (185,181,062) | (58,991,939) | (4,137,404,034) | (1,126,333,179) |
| Net increase (decrease) | (139,325,081) | 51,836,510 | $(3,102,892,664) | $1,034,709,201 |
| Institutional Premium Class | | | | |
| Shares sold | 335,010,373 | 106,175,355 | $7,523,720,534 | $2,077,170,449 |
| Reinvestment of distributions | 8,019,906 | 4,099,741 | 184,756,784 | 82,015,174 |
| Shares redeemed | (110,785,911) | (72,419,322) | (2,505,013,424) | (1,407,709,200) |
| Net increase (decrease) | 232,244,368 | 37,855,774 | $5,203,463,894 | $751,476,423 |
| Premier Class | | | | |
| Shares sold | 93,239,380 | 55,493,567 | $2,108,785,102 | $1,078,127,048 |
| Reinvestment of distributions | 2,566,108 | 793,362 | 59,210,505 | 16,478,118 |
| Shares redeemed | (8,782,168) | (2,038,178) | (198,334,451) | (42,393,195) |
| Net increase (decrease) | 87,023,320 | 54,248,751 | $1,969,661,156 | $1,052,211,971 |
| Fidelity Freedom Index 2040 Fund | | | | |
| Investor Class | | | | |
| Shares sold | 37,137,861 | 94,239,000 | $851,345,804 | $1,822,185,978 |
| Reinvestment of distributions | 1,579,789 | 3,838,014 | 37,071,834 | 76,912,604 |
| Shares redeemed | (165,957,172) | (51,889,838) | (3,762,192,029) | (983,958,035) |
| Net increase (decrease) | (127,239,522) | 46,187,176 | $(2,873,774,391) | $915,140,547 |
| Institutional Premium Class | | | | |
| Shares sold | 309,848,319 | 108,007,290 | $7,067,578,292 | $2,095,546,770 |
| Reinvestment of distributions | 8,185,724 | 4,401,671 | 192,445,348 | 87,992,005 |
| Shares redeemed | (112,622,520) | (79,690,325) | (2,586,606,460) | (1,543,658,400) |
| Net increase (decrease) | 205,411,523 | 32,718,636 | $4,673,417,180 | $639,880,375 |
| Premier Class | | | | |
| Shares sold | 87,721,736 | 56,442,508 | $2,010,364,701 | $1,088,598,987 |
| Reinvestment of distributions | 2,568,160 | 760,296 | 60,465,360 | 15,814,147 |
| Shares redeemed | (8,662,197) | (1,954,958) | (198,833,563) | (40,641,374) |
| Net increase (decrease) | 81,627,699 | 55,247,846 | $1,871,996,498 | $1,063,771,760 |
| Fidelity Freedom Index 2045 Fund | | | | |
| Investor Class | | | | |
| Shares sold | 29,133,566 | 78,456,124 | $692,505,250 | $1,578,786,867 |
| Reinvestment of distributions | 1,104,373 | 2,810,714 | 26,889,804 | 58,613,839 |
| Shares redeemed | (132,865,847) | (38,311,512) | (3,125,109,903) | (755,400,376) |
| Net increase (decrease) | (102,627,908) | 42,955,326 | $(2,405,714,849) | $882,000,330 |
| Institutional Premium Class | | | | |
| Shares sold | 253,639,369 | 80,174,675 | $6,006,545,154 | $1,614,383,345 |
| Reinvestment of distributions | 6,004,169 | 2,775,034 | 146,719,719 | 57,738,665 |
| Shares redeemed | (80,992,620) | (55,359,004) | (1,932,159,045) | (1,103,709,815) |
| Net increase (decrease) | 178,650,918 | 27,590,705 | $4,221,105,828 | $568,412,195 |
| Premier Class | | | | |
| Shares sold | 69,062,329 | 51,429,572 | $1,643,565,007 | $1,028,148,325 |
| Reinvestment of distributions | 2,095,498 | 683,216 | 51,250,909 | 14,750,631 |
| Shares redeemed | (6,870,613) | (1,956,312) | (163,853,467) | (42,345,894) |
| Net increase (decrease) | 64,287,214 | 50,156,476 | $1,530,962,449 | $1,000,553,062 |
| Fidelity Freedom Index 2050 Fund | | | | |
| Investor Class | | | | |
| Shares sold | 26,391,010 | 71,868,741 | $628,297,628 | $1,444,342,389 |
| Reinvestment of distributions | 951,061 | 2,438,984 | 23,206,532 | 50,991,252 |
| Shares redeemed | (117,454,623) | (32,705,269) | (2,767,122,384) | (647,275,602) |
| Net increase (decrease) | (90,112,552) | 41,602,456 | $(2,115,618,224) | $848,058,039 |
| Institutional Premium Class | | | | |
| Shares sold | 230,124,478 | 73,054,143 | $5,460,686,676 | $1,470,085,092 |
| Reinvestment of distributions | 5,456,352 | 2,613,494 | 133,435,130 | 54,420,683 |
| Shares redeemed | (74,077,303) | (55,592,305) | (1,769,373,835) | (1,111,340,338) |
| Net increase (decrease) | 161,503,527 | 20,075,332 | $3,824,747,971 | $413,165,437 |
| Premier Class | | | | |
| Shares sold | 57,409,710 | 47,561,412 | $1,365,505,044 | $950,165,124 |
| Reinvestment of distributions | 1,833,409 | 649,212 | 44,871,215 | 14,042,451 |
| Shares redeemed | (6,653,247) | (1,859,530) | (158,753,798) | (40,368,978) |
| Net increase (decrease) | 52,589,872 | 46,351,094 | $1,251,622,461 | $923,838,597 |
| Fidelity Freedom Index 2055 Fund | | | | |
| Investor Class | | | | |
| Shares sold | 24,774,112 | 60,294,518 | $484,585,522 | $997,100,585 |
| Reinvestment of distributions | 718,074 | 1,697,472 | 14,406,080 | 29,307,832 |
| Shares redeemed | (90,484,552) | (24,863,112) | (1,751,737,816) | (404,066,375) |
| Net increase (decrease) | (64,992,366) | 37,128,878 | $(1,252,746,214) | $622,342,042 |
| Institutional Premium Class | | | | |
| Shares sold | 193,036,951 | 53,569,338 | $3,768,032,883 | $890,672,417 |
| Reinvestment of distributions | 3,977,131 | 1,479,045 | 80,133,407 | 25,548,115 |
| Shares redeemed | (53,422,553) | (22,044,549) | (1,051,225,635) | (367,166,898) |
| Net increase (decrease) | 143,591,529 | 33,003,834 | $2,796,940,655 | $549,053,634 |
| Premier Class | | | | |
| Shares sold | 41,004,109 | 25,605,310 | $801,547,188 | $425,920,576 |
| Reinvestment of distributions | 1,085,106 | 319,340 | 21,864,503 | 5,677,865 |
| Shares redeemed | (5,011,662) | (877,791) | (98,622,498) | (15,547,713) |
| Net increase (decrease) | 37,077,553 | 25,046,859 | $724,789,193 | $416,050,728 |
| Fidelity Freedom Index 2060 Fund | | | | |
| Investor Class | | | | |
| Shares sold | 17,211,123 | 32,693,069 | $285,192,120 | $460,071,253 |
| Reinvestment of distributions | 398,848 | 767,367 | 6,786,474 | 11,260,566 |
| Shares redeemed | (44,538,034) | (11,895,916) | (730,002,050) | (164,560,792) |
| Net increase (decrease) | (26,928,063) | 21,564,520 | $(438,023,456) | $306,771,027 |
| Institutional Premium Class | | | | |
| Shares sold | 105,032,297 | 28,910,560 | $1,736,140,469 | $407,106,862 |
| Reinvestment of distributions | 1,941,239 | 628,065 | 33,114,426 | 9,223,907 |
| Shares redeemed | (27,238,539) | (11,790,585) | (454,917,094) | (167,666,933) |
| Net increase (decrease) | 79,734,997 | 17,748,040 | $1,314,337,801 | $248,663,836 |
| Premier Class | | | | |
| Shares sold | 21,755,126 | 12,065,324 | $360,975,400 | $170,264,870 |
| Reinvestment of distributions | 515,720 | 146,206 | 8,804,986 | 2,200,396 |
| Shares redeemed | (2,585,003) | (512,013) | (43,079,416) | (7,632,766) |
| Net increase (decrease) | 19,685,843 | 11,699,517 | $326,700,970 | $164,832,500 |
| Fidelity Freedom Index 2065 Fund | | | | |
| Investor Class | | | | |
| Shares sold | 5,381,112 | 6,702,671 | $72,027,618 | $77,518,102 |
| Reinvestment of distributions | 75,587 | 70,990 | 1,041,985 | 835,966 |
| Shares redeemed | (6,585,030) | (1,726,561) | (87,473,204) | (19,269,585) |
| Net increase (decrease) | (1,128,331) | 5,047,100 | $(14,403,601) | $59,084,483 |
| Institutional Premium Class | | | | |
| Shares sold | 23,020,455 | 5,635,986 | $307,762,479 | $64,631,807 |
| Reinvestment of distributions | 310,708 | 58,293 | 4,293,087 | 687,080 |
| Shares redeemed | (5,733,491) | (1,550,917) | (77,292,296) | (17,468,608) |
| Net increase (decrease) | 17,597,672 | 4,143,362 | $234,763,270 | $47,850,279 |
| Premier Class | | | | |
| Shares sold | 6,820,356 | 2,505,372 | $91,713,119 | $28,691,071 |
| Reinvestment of distributions | 117,284 | 24,121 | 1,621,670 | 292,824 |
| Shares redeemed | (1,194,861) | (170,197) | (16,018,676) | (2,027,949) |
| Net increase (decrease) | 5,742,779 | 2,359,296 | $77,316,113 | $26,955,946 |
(a) Share transactions for Premier Class are for the period June 24, 2020 (commencement of sale of shares) through March 31, 2021.
9. Other.
A fund's organizational documents provide former and current trustees and officers with a limited indemnification against liabilities arising in connection with the performance of their duties to the fund. In the normal course of business, a fund may also enter into contracts that provide general indemnifications. A fund's maximum exposure under these arrangements is unknown as this would be dependent on future claims that may be made against a fund. The risk of material loss from such claims is considered remote.
Funds do not invest in underlying mutual funds for the purpose of exercising management or control; however, investments by funds within their principal investment strategies may represent a significant portion of the underlying mutual fund's net assets. At the end of the period, certain Funds were the owners of record of 10% or more of the total outstanding shares of the following underlying mutual funds as shown below.
| Fund | Fidelity Freedom Index 2020 Fund | Fidelity Freedom Index 2025 Fund | Fidelity Freedom Index 2030 Fund | Fidelity Freedom Index 2035 Fund | Fidelity Freedom Index 2040 Fund | Fidelity Freedom Index 2045 Fund | Fidelity Freedom Index 2050 Fund |
| Fidelity Series 5+ Year Inflation-Protected Bond Index Fund | –% | 10% | –% | –% | –% | –% | –% |
| Fidelity Series Bond Index Fund | 14% | 20% | 22% | 12% | –% | –% | –% |
| Fidelity Series Global ex U.S. Index Fund | –% | –% | 13% | 14% | 16% | 13% | 12% |
| Fidelity Series Total Market Index Fund | –% | –% | 13% | 14% | 16% | 13% | 12% |
| Fidelity Series Treasury Bill Index Fund | 13% | –% | –% | –% | –% | –% | –% |
The Funds, in aggregate, were the owners of record of more than 20% of the total outstanding shares of the following underlying mutual funds.
| Fund | % of shares held |
| Fidelity Series 5+ Year Inflation-Protected Bond Index Fund | 25% |
| Fidelity Series Bond Index Fund | 89% |
| Fidelity Series Global ex U.S. Index Fund | 94% |
| Fidelity Series Inflation-Protected Bond Index Fund | 22% |
| Fidelity Series International Developed Markets Bond Index Fund | 34% |
| Fidelity Series Long-Term Treasury Bond Index Fund | 26% |
| Fidelity Series Total Market Index Fund | 94% |
| Fidelity Series Treasury Bill Index Fund | 51% |
10. Coronavirus (COVID-19) Pandemic.
An outbreak of COVID-19 first detected in China during December 2019 has since spread globally and was declared a pandemic by the World Health Organization during March 2020. Developments that disrupt global economies and financial markets, such as the COVID-19 pandemic, may magnify factors that affect the Funds' performance.
Report of Independent Registered Public Accounting Firm
To the Board of Trustees of Fidelity Aberdeen Street Trust and Shareholders of Fidelity Freedom Index Income Fund, Fidelity Freedom Index 2005 Fund, Fidelity Freedom Index 2010 Fund, Fidelity Freedom Index 2015 Fund, Fidelity Freedom Index 2020 Fund, Fidelity Freedom Index 2025 Fund, Fidelity Freedom Index 2030 Fund, Fidelity Freedom Index 2035 Fund, Fidelity Freedom Index 2040 Fund, Fidelity Freedom Index 2045 Fund, Fidelity Freedom Index 2050 Fund, Fidelity Freedom Index 2055 Fund, Fidelity Freedom Index 2060 Fund and Fidelity Freedom Index 2065 Fund
Opinion on the Financial Statements and Financial Highlights
We have audited the accompanying statements of assets and liabilities of Fidelity Freedom Index Income Fund, Fidelity Freedom Index 2005 Fund, Fidelity Freedom Index 2010 Fund, Fidelity Freedom Index 2015 Fund, Fidelity Freedom Index 2020 Fund, Fidelity Freedom Index 2025 Fund, Fidelity Freedom Index 2030 Fund, Fidelity Freedom Index 2035 Fund, Fidelity Freedom Index 2040 Fund, Fidelity Freedom Index 2045 Fund, Fidelity Freedom Index 2050 Fund, Fidelity Freedom Index 2055 Fund, Fidelity Freedom Index 2060 Fund, and Fidelity Freedom Index 2065 Fund (the “Funds”), each a fund of Fidelity Aberdeen Street Trust, including the schedules of investments, as of March 31, 2022, the related statements of operations for the year then ended, the statements of changes in net assets for each of the two years in the period then ended, the financial highlights for each of the five years in the period then ended, except for the financial highlights for the Fidelity Freedom Index 2065 Fund, which are for the two years in the period then ended and for the period from June 28, 2019 (commencement of operations) to March 31, 2020; and the related notes. In our opinion, the financial statements and financial highlights present fairly, in all material respects, the financial position of the Funds as of March 31, 2022, and the results of their operations for the year then ended, the changes in their net assets for each of the two years in the period then ended, and the financial highlights for each of the five years in the period then ended (or for the period mentioned above), in conformity with accounting principles generally accepted in the United States of America.
Basis for Opinion
These financial statements and financial highlights are the responsibility of the Funds’ management. Our responsibility is to express an opinion on the Funds’ financial statements and financial highlights based on our audits. We are a public accounting firm registered with the Public Company Accounting Oversight Board (United States) (PCAOB) and are required to be independent with respect to the Funds in accordance with the U.S. federal securities laws and the applicable rules and regulations of the Securities and Exchange Commission and the PCAOB.
We conducted our audits in accordance with the standards of the PCAOB. Those standards require that we plan and perform the audit to obtain reasonable assurance about whether the financial statements and financial highlights are free of material misstatement, whether due to error or fraud. The Funds are not required to have, nor were we engaged to perform, an audit of its internal control over financial reporting. As part of our audits we are required to obtain an understanding of internal controls over financial reporting but not for the purpose of expressing an opinion on the effectiveness of the Funds’ internal controls over financial reporting. Accordingly, we express no such opinion.
Our audits included performing procedures to assess the risks of material misstatement of the financial statements and financial highlights, whether due to error or fraud, and performing procedures that respond to those risks. Such procedures included examining, on a test basis, evidence regarding the amounts and disclosures in the financial statements and financial highlights. Our audits also included evaluating the accounting principles used and significant estimates made by management, as well as evaluating the overall presentation of the financial statements and financial highlights. Our procedures included confirmation of securities owned as of March 31, 2022, by correspondence with the custodian and brokers; when replies were not received from brokers, we performed other auditing procedures. We believe that our audits provide a reasonable basis for our opinion.
/s/ Deloitte & Touche LLP
Boston, Massachusetts
May 12, 2022
We have served as the auditor of one or more of the Fidelity investment companies since 1999.
Trustees and Officers
The Trustees, Members of the Advisory Board (if any), and officers of the trust and funds, as applicable, are listed below. The Board of Trustees governs each fund and is responsible for protecting the interests of shareholders. The Trustees are experienced executives who meet periodically throughout the year to oversee each fund's activities, review contractual arrangements with companies that provide services to each fund, oversee management of the risks associated with such activities and contractual arrangements, and review each fund's performance. If the interests of a fund and an underlying Fidelity® fund were to diverge, a conflict of interest could arise and affect how the Trustees and Members of the Advisory Board fulfill their fiduciary duties to the affected funds. FMR has structured the funds to avoid these potential conflicts, although there may be situations where a conflict of interest is unavoidable. In such instances, FMR, the Trustees, and Members of the Advisory Board would take reasonable steps to minimize and, if possible, eliminate the conflict. Each of the Trustees oversees 292 funds.
The Trustees hold office without limit in time except that (a) any Trustee may resign; (b) any Trustee may be removed by written instrument, signed by at least two-thirds of the number of Trustees prior to such removal; (c) any Trustee who requests to be retired or who has become incapacitated by illness or injury may be retired by written instrument signed by a majority of the other Trustees; and (d) any Trustee may be removed at any special meeting of shareholders by a two-thirds vote of the outstanding voting securities of the trust. Each Trustee who is not an interested person (as defined in the 1940 Act) of the trust and the funds is referred to herein as an Independent Trustee. Each Independent Trustee shall retire not later than the last day of the calendar year in which his or her 75th birthday occurs. The Independent Trustees may waive this mandatory retirement age policy with respect to individual Trustees. Officers and Advisory Board Members hold office without limit in time, except that any officer or Advisory Board Member may resign or may be removed by a vote of a majority of the Trustees at any regular meeting or any special meeting of the Trustees. Except as indicated, each individual has held the office shown or other offices in the same company for the past five years.
Each fund’s Statement of Additional Information (SAI) includes more information about the Trustees. To request a free copy, call Fidelity at 1-800-835-5092 (plan accounts) or 1-800-544-8544 (all other accounts).
Experience, Skills, Attributes, and Qualifications of the Trustees. The Governance and Nominating Committee has adopted a statement of policy that describes the experience, qualifications, attributes, and skills that are necessary and desirable for potential Independent Trustee candidates (Statement of Policy). The Board believes that each Trustee satisfied at the time he or she was initially elected or appointed a Trustee, and continues to satisfy, the standards contemplated by the Statement of Policy. The Governance and Nominating Committee also engages professional search firms to help identify potential Independent Trustee candidates who have the experience, qualifications, attributes, and skills consistent with the Statement of Policy. From time to time, additional criteria based on the composition and skills of the current Independent Trustees, as well as experience or skills that may be appropriate in light of future changes to board composition, business conditions, and regulatory or other developments, have also been considered by the professional search firms and the Governance and Nominating Committee. In addition, the Board takes into account the Trustees' commitment and participation in Board and committee meetings, as well as their leadership of standing and ad hoc committees throughout their tenure.
In determining that a particular Trustee was and continues to be qualified to serve as a Trustee, the Board has considered a variety of criteria, none of which, in isolation, was controlling. The Board believes that, collectively, the Trustees have balanced and diverse experience, qualifications, attributes, and skills, which allow the Board to operate effectively in governing each fund and protecting the interests of shareholders. Information about the specific experience, skills, attributes, and qualifications of each Trustee, which in each case led to the Board's conclusion that the Trustee should serve (or continue to serve) as a trustee of the funds, is provided below.
Board Structure and Oversight Function. Abigail P. Johnson is an interested person and currently serves as Chairman. The Trustees have determined that an interested Chairman is appropriate and benefits shareholders because an interested Chairman has a personal and professional stake in the quality and continuity of services provided to the funds. Independent Trustees exercise their informed business judgment to appoint an individual of their choosing to serve as Chairman, regardless of whether the Trustee happens to be independent or a member of management. The Independent Trustees have determined that they can act independently and effectively without having an Independent Trustee serve as Chairman and that a key structural component for assuring that they are in a position to do so is for the Independent Trustees to constitute a substantial majority for the Board. The Independent Trustees also regularly meet in executive session. Michael E. Kenneally serves as Chairman of the Independent Trustees and as such (i) acts as a liaison between the Independent Trustees and management with respect to matters important to the Independent Trustees and (ii) with management prepares agendas for Board meetings.
Fidelity® funds are overseen by different Boards of Trustees. The funds' Board oversees Fidelity's investment-grade bond, money market, asset allocation and certain equity funds, and other Boards oversee Fidelity's high income and other equity funds. The asset allocation funds may invest in Fidelity® funds that are overseen by such other Boards. The use of separate Boards, each with its own committee structure, allows the Trustees of each group of Fidelity® funds to focus on the unique issues of the funds they oversee, including common research, investment, and operational issues. On occasion, the separate Boards establish joint committees to address issues of overlapping consequences for the Fidelity® funds overseen by each Board.
The Trustees operate using a system of committees to facilitate the timely and efficient consideration of all matters of importance to the Trustees, each fund, and fund shareholders and to facilitate compliance with legal and regulatory requirements and oversight of the funds' activities and associated risks. The Board, acting through its committees, has charged FMR and its affiliates with (i) identifying events or circumstances the occurrence of which could have demonstrably adverse effects on the funds' business and/or reputation; (ii) implementing processes and controls to lessen the possibility that such events or circumstances occur or to mitigate the effects of such events or circumstances if they do occur; and (iii) creating and maintaining a system designed to evaluate continuously business and market conditions in order to facilitate the identification and implementation processes described in (i) and (ii) above. Because the day-to-day operations and activities of the funds are carried out by or through FMR, its affiliates, and other service providers, the funds' exposure to risks is mitigated but not eliminated by the processes overseen by the Trustees. While each of the Board's committees has responsibility for overseeing different aspects of the funds' activities, oversight is exercised primarily through the Operations and Audit Committees. In addition, an ad hoc Board committee of Independent Trustees has worked with FMR to enhance the Board's oversight of investment and financial risks, legal and regulatory risks, technology risks, and operational risks, including the development of additional risk reporting to the Board. Appropriate personnel, including but not limited to the funds' Chief Compliance Officer (CCO), FMR's internal auditor, the independent accountants, the funds' Treasurer and portfolio management personnel, make periodic reports to the Board's committees, as appropriate, including an annual review of Fidelity's risk management program for the Fidelity® funds. The responsibilities of each standing committee, including their oversight responsibilities, are described further under "Standing Committees of the Trustees."
Interested Trustees*:
Correspondence intended for a Trustee who is an interested person may be sent to Fidelity Investments, 245 Summer Street, Boston, Massachusetts 02210.
Name, Year of Birth; Principal Occupations and Other Relevant Experience+
Abigail P. Johnson (1961)
Year of Election or Appointment: 2009
Trustee
Chairman of the Board of Trustees
Ms. Johnson also serves as Trustee of other Fidelity® funds. Ms. Johnson serves as Chairman (2016-present), Chief Executive Officer (2014-present), and Director (2007-present) of FMR LLC (diversified financial services company), President of Fidelity Financial Services (2012-present) and President of Personal, Workplace and Institutional Services (2005-present). Ms. Johnson is Chairman and Director of Fidelity Management & Research Company LLC (investment adviser firm, 2011-present). Previously, Ms. Johnson served as Chairman and Director of FMR Co., Inc. (investment adviser firm, 2011-2019), Vice Chairman (2007-2016) and President (2013-2016) of FMR LLC, President and a Director of Fidelity Management & Research Company (2001-2005), a Trustee of other investment companies advised by Fidelity Management & Research Company, Fidelity Investments Money Management, Inc. (investment adviser firm), and FMR Co., Inc. (2001-2005), Senior Vice President of the Fidelity® funds (2001-2005), and managed a number of Fidelity® funds. Ms. Abigail P. Johnson and Mr. Arthur E. Johnson are not related.
Jennifer Toolin McAuliffe (1959)
Year of Election or Appointment: 2016
Trustee
Ms. McAuliffe also serves as Trustee of other Fidelity® funds and as Trustee of Fidelity Charitable (2020-present). Previously, Ms. McAuliffe served as Co-Head of Fixed Income of Fidelity Investments Limited (now known as FIL Limited (FIL)) (diversified financial services company), Director of Research for FIL’s credit and quantitative teams in London, Hong Kong and Tokyo and Director of Research for taxable and municipal bonds at Fidelity Investments Money Management, Inc. Ms. McAuliffe previously served as a member of the Advisory Board of certain Fidelity® funds (2016). Ms. McAuliffe was previously a lawyer at Ropes & Gray LLP and currently serves as director or trustee of several not-for-profit entities.
* Determined to be an “Interested Trustee” by virtue of, among other things, his or her affiliation with the trust or various entities under common control with FMR.
+ The information includes the Trustee's principal occupation during the last five years and other information relating to the experience, attributes, and skills relevant to the Trustee's qualifications to serve as a Trustee, which led to the conclusion that the Trustee should serve as a Trustee for each fund.
Independent Trustees:
Correspondence intended for an Independent Trustee may be sent to Fidelity Investments, P.O. Box 55235, Boston, Massachusetts 02205-5235.
Name, Year of Birth; Principal Occupations and Other Relevant Experience+
Elizabeth S. Acton (1951)
Year of Election or Appointment: 2013
Trustee
Ms. Acton also serves as Trustee of other Fidelity® funds. Prior to her retirement, Ms. Acton served as Executive Vice President, Finance (2011-2012), Executive Vice President, Chief Financial Officer (2002-2011) and Treasurer (2004-2005) of Comerica Incorporated (financial services). Prior to joining Comerica, Ms. Acton held a variety of positions at Ford Motor Company (1983-2002), including Vice President and Treasurer (2000-2002) and Executive Vice President and Chief Financial Officer of Ford Motor Credit Company (1998-2000). Ms. Acton currently serves as a member of the Board and Audit and Finance Committees of Beazer Homes USA, Inc. (homebuilding, 2012-present). Ms. Acton previously served as a member of the Advisory Board of certain Fidelity® funds (2013-2016).
Ann E. Dunwoody (1953)
Year of Election or Appointment: 2018
Trustee
General Dunwoody also serves as Trustee of other Fidelity® funds. General Dunwoody (United States Army, Retired) was the first woman in U.S. military history to achieve the rank of four-star general and prior to her retirement in 2012 held a variety of positions within the U.S. Army, including Commanding General, U.S. Army Material Command (2008-2012). General Dunwoody currently serves as President of First to Four LLC (leadership and mentoring services, 2012-present), a member of the Board and Nomination and Corporate Governance Committees of Kforce Inc. (professional staffing services, 2016-present) and a member of the Board of Automattic Inc. (software engineering, 2018-present). Previously, General Dunwoody served as a member of the Advisory Board and Nominating and Corporate Governance Committee of L3 Technologies, Inc. (communication, electronic, sensor and aerospace systems, 2013-2019) and a member of the Board and Audit and Sustainability and Corporate Responsibility Committees of Republic Services, Inc. (waste collection, disposal and recycling, 2013-2016). Ms. Dunwoody also serves on several boards for non-profit organizations, including as a member of the Board, Chair of the Nomination and Governance Committee and a member of the Audit Committee of Logistics Management Institute (consulting non-profit, 2012-present), a member of the Council of Trustees for the Association of the United States Army (advocacy non-profit, 2013-present), a member of the Board of Florida Institute of Technology (2015-present) and a member of the Board of ThanksUSA (military family education non-profit, 2014-present). General Dunwoody previously served as a member of the Advisory Board of certain Fidelity® funds (2018).
John Engler (1948)
Year of Election or Appointment: 2014
Trustee
Mr. Engler also serves as Trustee of other Fidelity® funds. Previously, Mr. Engler served as Governor of Michigan (1991-2003), President of the Business Roundtable (2011-2017) and interim President of Michigan State University (2018-2019). Mr. Engler currently serves as a member of the Board of Stride, Inc. (formerly K12 Inc.) (technology-based education company, 2012-present). Previously, Mr. Engler served as a member of the Board of Universal Forest Products (manufacturer and distributor of wood and wood-alternative products, 2003-2019) and Trustee of The Munder Funds (2003-2014). Mr. Engler previously served as a member of the Advisory Board of certain Fidelity® funds (2014-2016).
Robert F. Gartland (1951)
Year of Election or Appointment: 2010
Trustee
Mr. Gartland also serves as Trustee of other Fidelity® funds. Prior to his retirement, Mr. Gartland held a variety of positions at Morgan Stanley (financial services, 1979-2007), including Managing Director (1987-2007) and Chase Manhattan Bank (1975-1978). Mr. Gartland previously served as Chairman and an investor in Gartland & Mellina Group Corp. (consulting, 2009-2019), as a member of the Board of National Securities Clearing Corporation (1993-1996) and as Chairman of TradeWeb (2003-2004).
Arthur E. Johnson (1947)
Year of Election or Appointment: 2008
Trustee
Mr. Johnson also serves as Trustee of other Fidelity® funds. Prior to his retirement, Mr. Johnson served as Senior Vice President of Corporate Strategic Development of Lockheed Martin Corporation (defense contractor, 1999-2009). Mr. Johnson currently serves as a member of the Board of Booz Allen Hamilton (management consulting, 2011-present). Mr. Johnson previously served as a member of the Board of Eaton Corporation plc (diversified power management, 2009-2019) and a member of the Board of AGL Resources, Inc. (holding company, 2002-2016). Mr. Johnson previously served as Chairman (2018-2021) and Vice Chairman (2015-2018) of the Independent Trustees of certain Fidelity® funds. Mr. Arthur E. Johnson is not related to Ms. Abigail P. Johnson.
Michael E. Kenneally (1954)
Year of Election or Appointment: 2009
Trustee
Chairman of the Independent Trustees
Mr. Kenneally also serves as Trustee of other Fidelity® funds and was Vice Chairman (2018-2021) of the Independent Trustees of certain Fidelity® funds. Prior to retirement in 2005, he was Chairman and Global Chief Executive Officer of Credit Suisse Asset Management, the worldwide fund management and institutional investment business of Credit Suisse Group. Previously, Mr. Kenneally was an Executive Vice President and the Chief Investment Officer for Bank of America. In this role, he was responsible for the investment management, strategy and products delivered to the bank’s institutional, high-net-worth and retail clients. Earlier, Mr. Kenneally directed the organization’s equity and quantitative research groups. He began his career as a research analyst and then spent more than a dozen years as a portfolio manager for endowments, pension plans and mutual funds. He earned the Chartered Financial Analyst (CFA) designation in 1991.
Marie L. Knowles (1946)
Year of Election or Appointment: 2001
Trustee
Ms. Knowles also serves as Trustee of other Fidelity® funds. Prior to her retirement, Ms. Knowles held several positions at Atlantic Richfield Company (diversified energy), including Executive Vice President and Chief Financial Officer (1996-2000), Senior Vice President (1993-1996) and President of ARCO Transportation Company (pipeline and tanker operations, 1993-1996). Ms. Knowles currently serves as a member of the Board of the Santa Catalina Island Company (real estate, 2009-present), a member of the Investment Company Institute Board of Governors and a member of the Governing Council of the Independent Directors Council (2014-present). Ms. Knowles also serves as a member of the Advisory Board for the School of Engineering of the University of Southern California. Ms. Knowles previously served as a member of the Board of McKesson Corporation (healthcare service, 2002-2021). In addition, Ms. Knowles previously served as Chairman (2015-2018) and Vice Chairman (2012-2015) of the Independent Trustees of certain Fidelity® funds.
Mark A. Murray (1954)
Year of Election or Appointment: 2016
Trustee
Mr. Murray also serves as Trustee of other Fidelity® funds. Previously, Mr. Murray served as Co-Chief Executive Officer (2013-2016), President (2006-2013) and Vice Chairman (2013-2020) of Meijer, Inc. Mr. Murray serves as a member of the Board (2009-present) and Public Policy and Responsibility Committee (2009-present) and Chair of the Nuclear Review Committee (2019-present) of DTE Energy Company (diversified energy company). Mr. Murray previously served as a member of the Board of Spectrum Health (not-for-profit health system, 2015-2019) and as a member of the Board and Audit Committee and Chairman of the Nominating and Corporate Governance Committee of Universal Forest Products, Inc. (manufacturer and distributor of wood and wood-alternative products, 2004-2016). Mr. Murray also serves as a member of the Board of many community and professional organizations. Mr. Murray previously served as a member of the Advisory Board of certain Fidelity® funds (2016).
+ The information includes the Trustee's principal occupation during the last five years and other information relating to the experience, attributes, and skills relevant to the Trustee's qualifications to serve as a Trustee, which led to the conclusion that the Trustee should serve as a Trustee for each fund.
Advisory Board Members and Officers:
Correspondence intended for an officer may be sent to Fidelity Investments, 245 Summer Street, Boston, Massachusetts 02210. Officers appear below in alphabetical order.
Name, Year of Birth; Principal Occupation
Robert W. Helm (1957)
Year of Election or Appointment: 2021
Member of the Advisory Board
Mr. Helm also serves as a Member of the Advisory Board of other Fidelity® funds. Mr. Helm was formerly Deputy Chairman (2003-2020), partner (1991-2020) and an associate (1984-1991) of Dechert LLP (formerly Dechert Price & Rhoads). Mr. Helm currently serves on boards and committees of several not-for-profit organizations.
Craig S. Brown (1977)
Year of Election or Appointment: 2019
Assistant Treasurer
Mr. Brown also serves as an officer of other funds. Mr. Brown serves as Assistant Treasurer of FIMM, LLC (2021-present) and is an employee of Fidelity Investments (2013-present).
John J. Burke III (1964)
Year of Election or Appointment: 2018
Chief Financial Officer
Mr. Burke also serves as Chief Financial Officer of other funds. Mr. Burke serves as Head of Investment Operations for Fidelity Fund and Investment Operations (2018-present) and is an employee of Fidelity Investments (1998-present). Previously Mr. Burke served as head of Asset Management Investment Operations (2012-2018).
David J. Carter (1973)
Year of Election or Appointment: 2020
Assistant Secretary
Mr. Carter also serves as Assistant Secretary of other funds. Mr. Carter serves as Senior Vice President, Deputy General Counsel (2022-present) and is an employee of Fidelity Investments (2005-present).
Jonathan Davis (1968)
Year of Election or Appointment: 2010
Assistant Treasurer
Mr. Davis also serves as an officer of other funds. Mr. Davis serves as Assistant Treasurer of FIMM, LLC (2021-present), FMR Capital, Inc. (2017-present), FD Funds GP LLC (2021-present), FD Funds Holding LLC (2021-present), and FD Funds Management LLC (2021-present); and is an employee of Fidelity Investments. Previously, Mr. Davis served as Vice President and Associate General Counsel of FMR LLC (diversified financial services company, 2003-2010).
Laura M. Del Prato (1964)
Year of Election or Appointment: 2018
President and Treasurer
Ms. Del Prato also serves as an officer of other funds. Ms. Del Prato serves as Assistant Treasurer of FIMM, LLC (2021-present) and is an employee of Fidelity Investments (2017-present). Previously, Ms. Del Prato served as President and Treasurer of The North Carolina Capital Management Trust: Cash Portfolio and Term Portfolio (2018-2020). Prior to joining Fidelity Investments, Ms. Del Prato served as a Managing Director and Treasurer of the JPMorgan Mutual Funds (2014-2017). Prior to JPMorgan, Ms. Del Prato served as a partner at Cohen Fund Audit Services (accounting firm, 2012-2013) and KPMG LLP (accounting firm, 2004-2012).
Colm A. Hogan (1973)
Year of Election or Appointment: 2016
Assistant Treasurer
Mr. Hogan also serves as an officer of other funds. Mr. Hogan serves as Assistant Treasurer of FIMM, LLC (2021-present) and FMR Capital, Inc. (2017-present) and is an employee of Fidelity Investments (2005-present). Previously, Mr. Hogan served as Deputy Treasurer of certain Fidelity® funds (2016-2020) and Assistant Treasurer of certain Fidelity® funds (2016-2018).
Cynthia Lo Bessette (1969)
Year of Election or Appointment: 2019
Secretary and Chief Legal Officer (CLO)
Ms. Lo Bessette also serves as an officer of other funds. Ms. Lo Bessette serves as CLO, Secretary, and Senior Vice President of Fidelity Management & Research Company LLC (investment adviser firm, 2019-present); CLO of Fidelity Management & Research (Hong Kong) Limited, FMR Investment Management (UK) Limited, and Fidelity Management & Research (Japan) Limited (investment adviser firms, 2019-present); Secretary of FD Funds GP LLC (2021-present), FD Funds Holding LLC (2021-present), and FD Funds Management LLC (2021-present); and Assistant Secretary of FIMM, LLC (2019-present). She is a Senior Vice President and Deputy General Counsel of FMR LLC (diversified financial services company, 2019-present), and is an employee of Fidelity Investments. Previously, Ms. Lo Bessette served as CLO, Secretary, and Senior Vice President of FMR Co., Inc. (investment adviser firm, 2019); Secretary of Fidelity SelectCo, LLC and Fidelity Investments Money Management, Inc. (investment adviser firms, 2019). Prior to joining Fidelity Investments, Ms. Lo Bessette was Executive Vice President, General Counsel (2016-2019) and Senior Vice President, Deputy General Counsel (2015-2016) of OppenheimerFunds (investment management company) and Deputy Chief Legal Officer (2013-2015) of Jennison Associates LLC (investment adviser firm).
Chris Maher (1972)
Year of Election or Appointment: 2013
Assistant Treasurer
Mr. Maher also serves as an officer of other funds. Mr. Maher serves as Assistant Treasurer of FIMM, LLC (2021-present) and FMR Capital, Inc. (2017-present), and is an employee of Fidelity Investments (2008-present). Previously, Mr. Maher served as Assistant Treasurer of certain funds (2013-2020); Vice President of Asset Management Compliance (2013), Vice President of the Program Management Group of FMR (investment adviser firm, 2010-2013), and Vice President of Valuation Oversight (2008-2010).
Kenneth B. Robins (1969)
Year of Election or Appointment: 2020
Chief Compliance Officer
Mr. Robins also serves as an officer of other funds. Mr. Robins serves as Compliance Officer of Fidelity Management & Research Company LLC (investment adviser firm, 2016-present) and is an employee of Fidelity Investments (2004-present). Previously, Mr. Robins served as Compliance Officer of FMR Co., Inc. (investment adviser firm, 2016-2019), as Executive Vice President of Fidelity Investments Money Management, Inc. (investment adviser firm, 2013-2016) and served in other fund officer roles.
Brett Segaloff (1972)
Year of Election or Appointment: 2021
Anti-Money Laundering (AML) Officer
Mr. Segaloff also serves as an AML Officer of other funds and other related entities. He is Director, Anti-Money Laundering (2007-present) of FMR LLC (diversified financial services company) and is an employee of Fidelity Investments (1996-present).
Stacie M. Smith (1974)
Year of Election or Appointment: 2013
Assistant Treasurer
Ms. Smith also serves as an officer of other funds. Ms. Smith serves as Assistant Treasurer of FIMM, LLC (2021-present) and FMR Capital, Inc. (2017-present), is an employee of Fidelity Investments (2009-present), and has served in other fund officer roles. Prior to joining Fidelity Investments, Ms. Smith served as Senior Audit Manager of Ernst & Young LLP (accounting firm, 1996-2009). Previously, Ms. Smith served as Assistant Treasurer (2013-2019) and Deputy Treasurer (2013-2016) of certain Fidelity® funds.
Jim Wegmann (1979)
Year of Election or Appointment: 2021
Deputy Treasurer
Mr. Wegmann also serves as an officer of other funds. Mr. Wegmann serves as Assistant Treasurer of FIMM, LLC (2021-present) and is an employee of Fidelity Investments (2011-present). Previously, Mr. Wegmann served as Assistant Treasurer of certain Fidelity® funds (2019-2021).
Vadim Zlotnikov (1962)
Year of Election or Appointment: 2019
Vice President
Mr. Zlotnikov also serves as Vice President of other funds. Mr. Zlotnikov serves as President and Director of Fidelity Diversifying Solutions LLC (investment adviser firm, 2021-present), President and Director of FIAM LLC (investment adviser firm, 2020-present), and is an employee of Fidelity Investments (2018-present). Previously, Mr. Zlotnikov served as President and Chief Investment Officer of Global Asset Allocation (2018-2020). Prior to joining Fidelity Investments, Mr. Zlotnikov served as Co-Head of Multi-Asset Solutions, Chief Market Strategist, and CIO of Systematic Strategies with AllianceBernstein (investment adviser firm, 2002-2018).
Shareholder Expense Example
As a shareholder, you incur two types of costs: (1) transaction costs, which may include sales charges (loads) on purchase payments or redemption proceeds, as applicable and (2) ongoing costs, which generally include management fees, distribution and/or service (12b-1) fees and other Fund expenses. This Example is intended to help you understand your ongoing costs (in dollars) of investing in a fund and to compare these costs with the ongoing costs of investing in other mutual funds.
The Example is based on an investment of $1,000 invested at the beginning of the period and held for the entire period (October 1, 2021 to March 31, 2022).
Actual Expenses
The first line of the accompanying table provides information about actual account values and actual expenses. You may use the information in this line, together with the amount you invested, to estimate the expenses that you paid over the period. Simply divide your account value by $1,000.00 (for example, an $8,600 account value divided by $1,000.00 = 8.6), then multiply the result by the number in the first line for a class/Fund under the heading entitled "Expenses Paid During Period" to estimate the expenses you paid on your account during this period. If any fund is a shareholder of any underlying mutual funds or exchange-traded funds (ETFs) (the Underlying Funds), such fund indirectly bears its proportional share of the expenses of the Underlying Funds in addition to the direct expenses incurred presented in the table. These fees and expenses are not included in the annualized expense ratio used to calculate the expense estimate in the table below.
Hypothetical Example for Comparison Purposes
The second line of the accompanying table provides information about hypothetical account values and hypothetical expenses based on the actual expense ratio and an assumed rate of return of 5% per year before expenses, which is not the actual return. The hypothetical account values and expenses may not be used to estimate the actual ending account balance or expenses you paid for the period. You may use this information to compare the ongoing costs of investing in the Fund and other funds. To do so, compare this 5% hypothetical example with the 5% hypothetical examples that appear in the shareholder reports of the other funds. If any fund is a shareholder of any Underlying Funds, such fund indirectly bears its proportional share of the expenses of the Underlying Funds in addition to the direct expenses as presented in the table. These fees and expenses are not included in the annualized expense ratio used to calculate the expense estimate in the table below.
Please note that the expenses shown in the table are meant to highlight your ongoing costs only and do not reflect any transaction costs. Therefore, the second line of the table is useful in comparing ongoing costs only, and will not help you determine the relative total costs of owning different funds. In addition, if these transactional costs were included, your costs would have been higher.
| | Annualized Expense Ratio-A | Beginning
Account Value
October 1, 2021 | Ending
Account Value
March 31, 2022 | Expenses Paid
During Period-B
October 1, 2021
to March 31, 2022 |
| Fidelity Freedom Index Income Fund | | | | |
| Investor Class | .12% | | | |
| Actual | | $1,000.00 | $970.80 | $.59 |
| Hypothetical-C | | $1,000.00 | $1,024.33 | $.61 |
| Institutional Premium Class | .08% | | | |
| Actual | | $1,000.00 | $971.00 | $.39 |
| Hypothetical-C | | $1,000.00 | $1,024.53 | $.40 |
| Premier Class | .06% | | | |
| Actual | | $1,000.00 | $971.20 | $.29 |
| Hypothetical-C | | $1,000.00 | $1,024.63 | $.30 |
| Fidelity Freedom Index 2005 Fund | | | | |
| Investor Class | .12% | | | |
| Actual | | $1,000.00 | $971.40 | $.59 |
| Hypothetical-C | | $1,000.00 | $1,024.33 | $.61 |
| Institutional Premium Class | .08% | | | |
| Actual | | $1,000.00 | $971.30 | $.39 |
| Hypothetical-C | | $1,000.00 | $1,024.53 | $.40 |
| Premier Class | .06% | | | |
| Actual | | $1,000.00 | $972.10 | $.30 |
| Hypothetical-C | | $1,000.00 | $1,024.63 | $.30 |
| Fidelity Freedom Index 2010 Fund | | | | |
| Investor Class | .12% | | | |
| Actual | | $1,000.00 | $973.00 | $.59 |
| Hypothetical-C | | $1,000.00 | $1,024.33 | $.61 |
| Institutional Premium Class | .08% | | | |
| Actual | | $1,000.00 | $973.50 | $.39 |
| Hypothetical-C | | $1,000.00 | $1,024.53 | $.40 |
| Premier Class | .06% | | | |
| Actual | | $1,000.00 | $973.70 | $.30 |
| Hypothetical-C | | $1,000.00 | $1,024.63 | $.30 |
| Fidelity Freedom Index 2015 Fund | | | | |
| Investor Class | .12% | | | |
| Actual | | $1,000.00 | $975.10 | $.59 |
| Hypothetical-C | | $1,000.00 | $1,024.33 | $.61 |
| Institutional Premium Class | .08% | | | |
| Actual | | $1,000.00 | $975.70 | $.39 |
| Hypothetical-C | | $1,000.00 | $1,024.53 | $.40 |
| Premier Class | .06% | | | |
| Actual | | $1,000.00 | $975.30 | $.30 |
| Hypothetical-C | | $1,000.00 | $1,024.63 | $.30 |
| Fidelity Freedom Index 2020 Fund | | | | |
| Investor Class | .12% | | | |
| Actual | | $1,000.00 | $976.70 | $.59 |
| Hypothetical-C | | $1,000.00 | $1,024.33 | $.61 |
| Institutional Premium Class | .08% | | | |
| Actual | | $1,000.00 | $976.60 | $.39 |
| Hypothetical-C | | $1,000.00 | $1,024.53 | $.40 |
| Premier Class | .06% | | | |
| Actual | | $1,000.00 | $976.90 | $.30 |
| Hypothetical-C | | $1,000.00 | $1,024.63 | $.30 |
| Fidelity Freedom Index 2025 Fund | | | | |
| Investor Class | .12% | | | |
| Actual | | $1,000.00 | $978.30 | $.59 |
| Hypothetical-C | | $1,000.00 | $1,024.33 | $.61 |
| Institutional Premium Class | .08% | | | |
| Actual | | $1,000.00 | $978.90 | $.39 |
| Hypothetical-C | | $1,000.00 | $1,024.53 | $.40 |
| Premier Class | .06% | | | |
| Actual | | $1,000.00 | $979.10 | $.30 |
| Hypothetical-C | | $1,000.00 | $1,024.63 | $.30 |
| Fidelity Freedom Index 2030 Fund | | | | |
| Investor Class | .12% | | | |
| Actual | | $1,000.00 | $981.10 | $.59 |
| Hypothetical-C | | $1,000.00 | $1,024.33 | $.61 |
| Institutional Premium Class | .08% | | | |
| Actual | | $1,000.00 | $981.70 | $.40 |
| Hypothetical-C | | $1,000.00 | $1,024.53 | $.40 |
| Premier Class | .06% | | | |
| Actual | | $1,000.00 | $981.40 | $.30 |
| Hypothetical-C | | $1,000.00 | $1,024.63 | $.30 |
| Fidelity Freedom Index 2035 Fund | | | | |
| Investor Class | .12% | | | |
| Actual | | $1,000.00 | $988.60 | $.59 |
| Hypothetical-C | | $1,000.00 | $1,024.33 | $.61 |
| Institutional Premium Class | .08% | | | |
| Actual | | $1,000.00 | $989.30 | $.40 |
| Hypothetical-C | | $1,000.00 | $1,024.53 | $.40 |
| Premier Class | .06% | | | |
| Actual | | $1,000.00 | $988.60 | $.30 |
| Hypothetical-C | | $1,000.00 | $1,024.63 | $.30 |
| Fidelity Freedom Index 2040 Fund | | | | |
| Investor Class | .12% | | | |
| Actual | | $1,000.00 | $996.00 | $.60 |
| Hypothetical-C | | $1,000.00 | $1,024.33 | $.61 |
| Institutional Premium Class | .08% | | | |
| Actual | | $1,000.00 | $996.20 | $.40 |
| Hypothetical-C | | $1,000.00 | $1,024.53 | $.40 |
| Premier Class | .06% | | | |
| Actual | | $1,000.00 | $995.90 | $.30 |
| Hypothetical-C | | $1,000.00 | $1,024.63 | $.30 |
| Fidelity Freedom Index 2045 Fund | | | | |
| Investor Class | .12% | | | |
| Actual | | $1,000.00 | $995.70 | $.60 |
| Hypothetical-C | | $1,000.00 | $1,024.33 | $.61 |
| Institutional Premium Class | .08% | | | |
| Actual | | $1,000.00 | $996.40 | $.40 |
| Hypothetical-C | | $1,000.00 | $1,024.53 | $.40 |
| Premier Class | .06% | | | |
| Actual | | $1,000.00 | $996.20 | $.30 |
| Hypothetical-C | | $1,000.00 | $1,024.63 | $.30 |
| Fidelity Freedom Index 2050 Fund | | | | |
| Investor Class | .12% | | | |
| Actual | | $1,000.00 | $996.10 | $.60 |
| Hypothetical-C | | $1,000.00 | $1,024.33 | $.61 |
| Institutional Premium Class | .08% | | | |
| Actual | | $1,000.00 | $996.00 | $.40 |
| Hypothetical-C | | $1,000.00 | $1,024.53 | $.40 |
| Premier Class | .06% | | | |
| Actual | | $1,000.00 | $996.20 | $.30 |
| Hypothetical-C | | $1,000.00 | $1,024.63 | $.30 |
| Fidelity Freedom Index 2055 Fund | | | | |
| Investor Class | .12% | | | |
| Actual | | $1,000.00 | $995.60 | $.60 |
| Hypothetical-C | | $1,000.00 | $1,024.33 | $.61 |
| Institutional Premium Class | .08% | | | |
| Actual | | $1,000.00 | $995.90 | $.40 |
| Hypothetical-C | | $1,000.00 | $1,024.53 | $.40 |
| Premier Class | .06% | | | |
| Actual | | $1,000.00 | $996.50 | $.30 |
| Hypothetical-C | | $1,000.00 | $1,024.63 | $.30 |
| Fidelity Freedom Index 2060 Fund | | | | |
| Investor Class | .12% | | | |
| Actual | | $1,000.00 | $995.40 | $.60 |
| Hypothetical-C | | $1,000.00 | $1,024.33 | $.61 |
| Institutional Premium Class | .08% | | | |
| Actual | | $1,000.00 | $996.00 | $.40 |
| Hypothetical-C | | $1,000.00 | $1,024.53 | $.40 |
| Premier Class | .06% | | | |
| Actual | | $1,000.00 | $996.20 | $.30 |
| Hypothetical-C | | $1,000.00 | $1,024.63 | $.30 |
| Fidelity Freedom Index 2065 Fund | | | | |
| Investor Class | .12% | | | |
| Actual | | $1,000.00 | $995.80 | $.60 |
| Hypothetical-C | | $1,000.00 | $1,024.33 | $.61 |
| Institutional Premium Class | .08% | | | |
| Actual | | $1,000.00 | $996.40 | $.40 |
| Hypothetical-C | | $1,000.00 | $1,024.53 | $.40 |
| Premier Class | .06% | | | |
| Actual | | $1,000.00 | $996.50 | $.30 |
| Hypothetical-C | | $1,000.00 | $1,024.63 | $.30 |
A Annualized expense ratio reflects expenses net of applicable fee waivers.
B Expenses are equal to the annualized expense ratio, multiplied by the average account value over the period, multiplied by 182/ 365 (to reflect the one-half year period). The fees and expenses of any Underlying Funds are not included in each annualized expense ratio.
C 5% return per year before expenses
Distributions (Unaudited)
The dividend and capital gains distributions for the fund(s) are available on Fidelity.com or Institutional.Fidelity.com.
The funds hereby designate as capital gain dividend the amounts noted below for the taxable year ended March 31, 2022, or, if subsequently determined to be different, the net capital gain of such year.
| Fidelity Freedom Index Income Fund | $3,634,099 |
| Fidelity Freedom Index 2005 Fund | $3,591,956 |
| Fidelity Freedom Index 2010 Fund | $15,939,507 |
| Fidelity Freedom Index 2015 Fund | $21,498,174 |
| Fidelity Freedom Index 2020 Fund | $59,734,397 |
| Fidelity Freedom Index 2025 Fund | $21,973,061 |
| Fidelity Freedom Index 2030 Fund | $27,091,931 |
| Fidelity Freedom Index 2035 Fund | $15,306,319 |
| Fidelity Freedom Index 2040 Fund | $16,503,938 |
| Fidelity Freedom Index 2045 Fund | $10,766,365 |
| Fidelity Freedom Index 2050 Fund | $9,819,743 |
| Fidelity Freedom Index 2055 Fund | $6,269,714 |
| Fidelity Freedom Index 2060 Fund | $2,819,721 |
| Fidelity Freedom Index 2065 Fund | $422,392 |
|
A percentage of the dividends distributed during the fiscal year for the following funds were derived from interest on U.S. Government securities which is generally exempt from state income tax:
| Fidelity Freedom Index Income Fund | 48.42% |
| Fidelity Freedom Index 2005 Fund | 44.84% |
| Fidelity Freedom Index 2010 Fund | 38.28% |
| Fidelity Freedom Index 2015 Fund | 32.50% |
| Fidelity Freedom Index 2020 Fund | 26.94% |
| Fidelity Freedom Index 2025 Fund | 23.21% |
| Fidelity Freedom Index 2030 Fund | 19.62% |
| Fidelity Freedom Index 2035 Fund | 7.56% |
| Fidelity Freedom Index 2040 Fund | 5.27% |
| Fidelity Freedom Index 2045 Fund | 5.22% |
| Fidelity Freedom Index 2050 Fund | 5.26% |
| Fidelity Freedom Index 2055 Fund | 5.26% |
| Fidelity Freedom Index 2060 Fund | 5.23% |
| Fidelity Freedom Index 2065 Fund | 5.02% |
|
A percentage of the dividends distributed during the fiscal year for the following funds qualify for the dividends–received deduction for corporate shareholders:
| | Investor Class | Institutional Premium Class | Premier Class |
| Fidelity Freedom Index Income Fund | | | |
| April 2021 | 0% | 0% | 0% |
| May 2021 | 3% | 3% | 3% |
| June 2021 | 9% | 9% | 7% |
| July 2021 | 10% | 8% | 8% |
| August 2021 | 9% | 9% | 9% |
| September 2021 | 9% | 9% | 8% |
| October 2021 | 10% | 8% | 8% |
| November 2021 | 10% | 8% | 8% |
| December 2021 | 9% | 9% | 9% |
| February 2022 | 0% | 0% | 0% |
| March 2022 | 0% | 0% | 0% |
| Fidelity Freedom Index 2005 Fund | | | |
| May 2021 | 0% | 0% | 0% |
| December 2021 | 11% | 10% | 10% |
| Fidelity Freedom Index 2010 Fund | | | |
| May 2021 | 0% | 0% | 0% |
| December 2021 | 15% | 14% | 14% |
| Fidelity Freedom Index 2015 Fund | | | |
| May 2021 | 0% | 0% | 0% |
| December 2021 | 18% | 17% | 17% |
| Fidelity Freedom Index 2020 Fund | | | |
| May 2021 | 0% | 0% | 0% |
| December 2021 | 20% | 19% | 19% |
| Fidelity Freedom Index 2025 Fund | | | |
| May 2021 | 1% | 0% | 0% |
| December 2021 | 22% | 21% | 21% |
| Fidelity Freedom Index 2030 Fund | | | |
| May 2021 | 0% | 0% | 0% |
| December 2021 | 24% | 23% | 23% |
| Fidelity Freedom Index 2035 Fund | | | |
| May 2021 | 1% | 1% | 1% |
| December 2021 | 30% | 29% | 29% |
| Fidelity Freedom Index 2040 Fund | | | |
| May 2021 | 0% | 0% | 0% |
| December 2021 | 33% | 32% | 32% |
| Fidelity Freedom Index 2045 Fund | | | |
| May 2021 | – | 0% | 0% |
| December 2021 | 33% | 32% | 32% |
| Fidelity Freedom Index 2050 Fund | | | |
| May 2021 | 10% | 2% | 1% |
| December 2021 | 34% | 32% | 32% |
| Fidelity Freedom Index 2055 Fund | | | |
| May 2021 | – | 4% | 4% |
| December 2021 | 33% | 32% | 32% |
| Fidelity Freedom Index 2060 Fund | | | |
| May 2021 | – | 7% | 7% |
| December 2021 | 33% | 32% | 32% |
| Fidelity Freedom Index 2065 Fund | | | |
| May 2021 | – | 9% | 9% |
| December 2021 | 33% | 31% | 31% |
|
A percentage of the dividends distributed during the fiscal year for the following funds may be taken into account as a dividend for purposes of the maximum rate under section 1(h)(11) of the Internal Revenue Code:
| | Investor Class | Institutional Premium Class | Premier Class |
| Fidelity Freedom Index Income Fund | | | |
| April 2021 | 0% | 0% | 0% |
| May 2021 | 7% | 6% | 6% |
| June 2021 | 19% | 19% | 16% |
| July 2021 | 20% | 18% | 18% |
| August 2021 | 18% | 18% | 18% |
| September 2021 | 19% | 19% | 16% |
| October 2021 | 20% | 18% | 18% |
| November 2021 | 21% | 18% | 18% |
| December 2021 | 19% | 18% | 18% |
| February 2022 | 0% | 0% | 0% |
| March 2022 | 0% | 0% | 0% |
| Fidelity Freedom Index 2005 Fund | | | |
| May 2021 | 1% | 1% | 1% |
| December 2021 | 22% | 21% | 21% |
| Fidelity Freedom Index 2010 Fund | | | |
| May 2021 | 0% | 0% | 0% |
| December 2021 | 29% | 28% | 28% |
| Fidelity Freedom Index 2015 Fund | | | |
| May 2021 | 1% | 1% | 1% |
| December 2021 | 36% | 35% | 34% |
| Fidelity Freedom Index 2020 Fund | | | |
| May 2021 | 0% | 0% | 0% |
| December 2021 | 41% | 39% | 39% |
| Fidelity Freedom Index 2025 Fund | | | |
| May 2021 | 2% | 1% | 1% |
| December 2021 | 45% | 43% | 43% |
| Fidelity Freedom Index 2030 Fund | | | |
| May 2021 | 0% | 0% | 0% |
| December 2021 | 49% | 47% | 46% |
| Fidelity Freedom Index 2035 Fund | | | |
| May 2021 | 3% | 2% | 2% |
| December 2021 | 62% | 59% | 58% |
| Fidelity Freedom Index 2040 Fund | | | |
| May 2021 | 1% | 1% | 1% |
| December 2021 | 67% | 65% | 64% |
| Fidelity Freedom Index 2045 Fund | | | |
| May 2021 | – | 1% | 1% |
| December 2021 | 68% | 65% | 64% |
| Fidelity Freedom Index 2050 Fund | | | |
| May 2021 | 20% | 4% | 3% |
| December 2021 | 68% | 65% | 65% |
| Fidelity Freedom Index 2055 Fund | | | |
| May 2021 | – | 9% | 9% |
| December 2021 | 68% | 65% | 65% |
| Fidelity Freedom Index 2060 Fund | | | |
| May 2021 | – | 14% | 14% |
| December 2021 | 68% | 65% | 65% |
| Fidelity Freedom Index 2065 Fund | | | |
| May 2021 | – | 18% | 18% |
| December 2021 | 68% | 66% | 65% |
|
A percentage of the dividends distributed during the fiscal year for the following funds qualify as a section 199A dividend:
| | Investor Class | Institutional Premium Class | Premier Class |
| Fidelity Freedom Index Income Fund | | | |
| April 2021 | 0% | 0% | 0% |
| May 2021 | 1% | 1% | 1% |
| June 2021 | 1% | 1% | 1% |
| July 2021 | 1% | 1% | 1% |
| August 2021 | 1% | 1% | 1% |
| September 2021 | 1% | 1% | 1% |
| October 2021 | 1% | 1% | 1% |
| November 2021 | 1% | 1% | 1% |
| December 2021 | 1% | 1% | 1% |
| February 2022 | 0% | 0% | 0% |
| March 2022 | 0% | 0% | 0% |
| Fidelity Freedom Index 2005 Fund | | | |
| May 2021 | 1% | 1% | 1% |
| December 2021 | 1% | 1% | 1% |
| Fidelity Freedom Index 2010 Fund | | | |
| May 2021 | 0% | 0% | 0% |
| December 2021 | 2% | 2% | 1% |
| Fidelity Freedom Index 2015 Fund | | | |
| May 2021 | 1% | 1% | 1% |
| December 2021 | 2% | 2% | 2% |
| Fidelity Freedom Index 2020 Fund | | | |
| May 2021 | 0% | 0% | 0% |
| December 2021 | 2% | 2% | 2% |
| Fidelity Freedom Index 2025 Fund | | | |
| May 2021 | 1% | 1% | 1% |
| December 2021 | 2% | 2% | 2% |
| Fidelity Freedom Index 2030 Fund | | | |
| May 2021 | 0% | 0% | 0% |
| December 2021 | 2% | 2% | 2% |
| Fidelity Freedom Index 2035 Fund | | | |
| May 2021 | 1% | 1% | 1% |
| December 2021 | 3% | 3% | 3% |
| Fidelity Freedom Index 2040 Fund | | | |
| May 2021 | 1% | 1% | 1% |
| December 2021 | 3% | 3% | 3% |
| Fidelity Freedom Index 2045 Fund | | | |
| May 2021 | – | 1% | 1% |
| December 2021 | 3% | 3% | 3% |
| Fidelity Freedom Index 2050 Fund | | | |
| May 2021 | 1% | 1% | 1% |
| December 2021 | 3% | 3% | 3% |
| Fidelity Freedom Index 2055 Fund | | | |
| May 2021 | – | 1% | 1% |
| December 2021 | 3% | 3% | 3% |
| Fidelity Freedom Index 2060 Fund | | | |
| May 2021 | – | 1% | 1% |
| December 2021 | 3% | 3% | 3% |
| Fidelity Freedom Index 2065 Fund | | | |
| May 2021 | – | 1% | 1% |
| December 2021 | 3% | 3% | 3% |
|
The funds will notify shareholders in January 2023 of amounts for use in preparing 2022 income tax returns.
Liquidity Risk Management Program
The Securities and Exchange Commission adopted Rule 22e-4 under the Investment Company Act of 1940 (the Liquidity Rule) to promote effective liquidity risk management throughout the open-end investment company industry, thereby reducing the risk that funds will be unable to meet their redemption obligations and mitigating dilution of the interests of fund shareholders.
The Funds have adopted and implemented a liquidity risk management program pursuant to the Liquidity Rule (the Program) effective December 1, 2018. The Program is reasonably designed to assess and manage each Fund’s liquidity risk and to comply with the requirements of the Liquidity Rule. Each Fund’s Board of Trustees (the Board) has designated each Fund’s investment adviser as administrator of the Program. The Fidelity advisers have established a Liquidity Risk Management Committee (the LRM Committee) to manage the Program for each of the Fidelity Funds. The LRM Committee monitors the adequacy and effectiveness of implementation of the Program and on a periodic basis assesses each Fund’s liquidity risk based on a variety of factors including (1) the Fund’s investment strategy, (2) portfolio liquidity and cash flow projections during normal and reasonably foreseeable stressed conditions, (3) shareholder redemptions, (4) borrowings and other funding sources and (5) in the case of exchange-traded funds, certain additional factors including the effect of the Fund’s prices and spreads, market participants, and basket compositions on the overall liquidity of the Fund’s portfolio, as applicable.
In accordance with the Program, each of the Fund’s portfolio investments is classified into one of four liquidity categories described below based on a determination of a reasonable expectation for how long it would take to convert the investment to cash (or sell or dispose of the investment) without significantly changing its market value.
- Highly liquid investments – cash or convertible to cash within three business days or less
- Moderately liquid investments – convertible to cash in three to seven calendar days
- Less liquid investments – can be sold or disposed of, but not settled, within seven calendar days
- Illiquid investments – cannot be sold or disposed of within seven calendar days
Liquidity classification determinations take into account a variety of factors including various market, trading and investment-specific considerations, as well as market depth, and generally utilize analysis from a third-party liquidity metrics service.
The Liquidity Rule places a 15% limit on a fund’s illiquid investments and requires funds that do not primarily hold assets that are highly liquid investments to determine and maintain a minimum percentage of the fund’s net assets to be invested in highly liquid investments (highly liquid investment minimum or HLIM). The Program includes provisions reasonably designed to comply with the 15% limit on illiquid investments and for determining, periodically reviewing and complying with the HLIM requirement as applicable.
At a recent meeting of the Fund’s Board of Trustees, the LRM Committee provided a written report to the Board pertaining to the operation, adequacy, and effectiveness of implementation of the Program for the annual period from December 1, 2020 through November 30, 2021. The report concluded that the Program has been implemented and is operating effectively and is reasonably designed to assess and manage the Fund’s liquidity risk.
FRX-ANN-0522
1.899264.112
Fidelity Flex® Freedom Blend Funds - Income, 2005, 2010, 2015, 2020, 2025, 2030, 2035, 2040, 2045, 2050, 2055, 2060, 2065
Annual Report
March 31, 2022
Contents
To view a fund's proxy voting guidelines and proxy voting record for the 12-month period ended June 30, visit http://www.fidelity.com/proxyvotingresults or visit the Securities and Exchange Commission's (SEC) web site at http://www.sec.gov.
You may also call 1-800-544-3455 (for managed account clients) or 1-800-835-5092 (for retirement plan participants) to request a free copy of the proxy voting guidelines.
Standard & Poor's, S&P and S&P 500 are registered service marks of The McGraw-Hill Companies, Inc. and have been licensed for use by Fidelity Distributors Corporation.
Other third-party marks appearing herein are the property of their respective owners.
All other marks appearing herein are registered or unregistered trademarks or service marks of FMR LLC or an affiliated company. © 2022 FMR LLC. All rights reserved.
This report and the financial statements contained herein are submitted for the general information of the shareholders of the Funds. This report is not authorized for distribution to prospective investors in the Funds unless preceded or accompanied by an effective prospectus.
A fund files its complete schedule of portfolio holdings with the SEC for the first and third quarters of each fiscal year on Form N-PORT. Forms N-PORT are available on the SEC’s web site at http://www.sec.gov. A fund's Forms N-PORT may be reviewed and copied at the SEC’s Public Reference Room in Washington, DC. Information regarding the operation of the SEC's Public Reference Room may be obtained by calling 1-800-SEC-0330.
For a complete list of a fund's portfolio holdings, view the most recent holdings listing, semiannual report, or annual report on Fidelity's web site at http://www.fidelity.com, http://www.institutional.fidelity.com, or http://www.401k.com, as applicable.
NOT FDIC INSURED •MAY LOSE VALUE •NO BANK GUARANTEE
Neither the Funds nor Fidelity Distributors Corporation is a bank.
Note to Shareholders:
Early in 2020, the outbreak and spread of COVID-19 emerged as a public health emergency that had a major influence on financial markets, primarily based on its impact on the global economy and corporate earnings. On March 11, 2020, the World Health Organization declared the COVID-19 outbreak a pandemic, citing sustained risk of further global spread. The pandemic prompted a number of measures to limit the spread of COVID-19, including travel and border restrictions, quarantines, and restrictions on large gatherings. In turn, these resulted in lower consumer activity, diminished demand for a wide range of products and services, disruption in manufacturing and supply chains, and – given the wide variability in outcomes regarding the outbreak – significant market uncertainty and volatility. To help stem the turmoil, the U.S. government took unprecedented action – in concert with the U.S. Federal Reserve and central banks around the world – to help support consumers, businesses, and the broader economy, and to limit disruption to the financial system.
In general, the overall impact of the pandemic lessened in 2021, amid a resilient economy and widespread distribution of three COVID-19 vaccines granted emergency use authorization from the U.S. Food and Drug Administration (FDA) early in the year. Still, the situation remains dynamic, and the extent and duration of its influence on financial markets and the economy is highly uncertain, due in part to a recent spike in cases based on highly contagious variants of the coronavirus.
Extreme events such as the COVID-19 crisis are exogenous shocks that can have significant adverse effects on mutual funds and their investments. Although multiple asset classes may be affected by market disruption, the duration and impact may not be the same for all types of assets. Fidelity is committed to helping you stay informed amid news about COVID-19 and during increased market volatility, and we continue to take extra steps to be responsive to customer needs. We encourage you to visit us online, where we offer ongoing updates, commentary, and analysis on the markets and our funds.
Fidelity Flex® Freedom Blend Income Fund
Performance: The Bottom Line
Average annual total return reflects the change in the value of an investment, assuming reinvestment of distributions from dividend income and capital gains (the profits earned upon the sale of securities that have grown in value, if any) and assuming a constant rate of performance each year. The hypothetical investment and the average annual total returns do not reflect the deduction of taxes that a shareholder would pay on fund distributions or the redemption of fund shares. During periods of reimbursement by Fidelity, a fund’s total return will be greater than it would be had the reimbursement not occurred. How a fund did yesterday is no guarantee of how it will do tomorrow.
Average Annual Total Returns
| Periods ended March 31, 2022 | Past 1 year | Life of Portfolio |
| Fidelity Flex® Freedom Blend Income Fund | (0.61)% | 4.30% |
$10,000 Over Life of Fund
Let's say hypothetically that $10,000 was invested in Fidelity Flex® Freedom Blend Income Fund on June 8, 2017, when the fund started.
The chart shows how the value of your investment would have changed, and also shows how the Bloomberg U.S. Aggregate Bond Index performed over the same period.
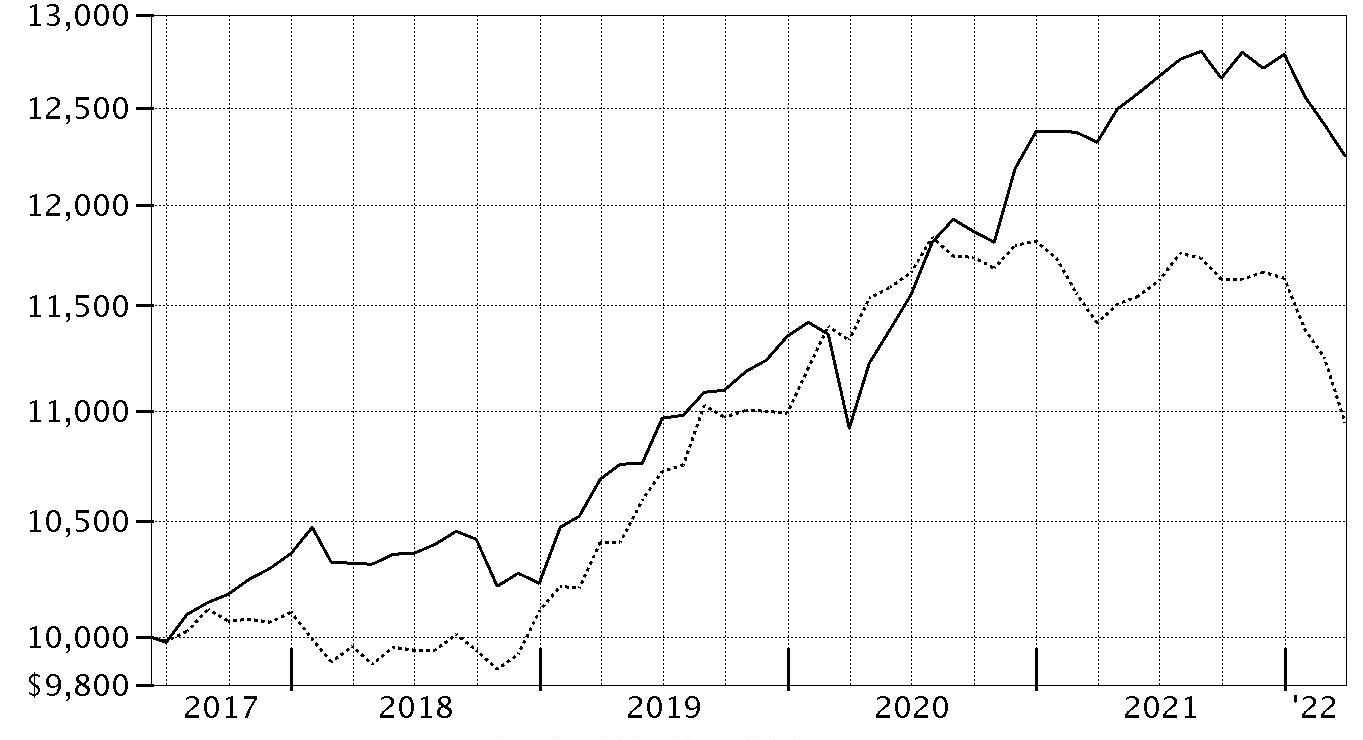
| Period Ending Values |
| $12,247 | Fidelity Flex® Freedom Blend Income Fund |
| $10,942 | Bloomberg U.S. Aggregate Bond Index |
Effective August 24, 2021, all Bloomberg Barclays Indices were re-branded as Bloomberg Indices.
Fidelity Flex® Freedom Blend 2005 Fund
Performance: The Bottom Line
Average annual total return reflects the change in the value of an investment, assuming reinvestment of distributions from dividend income and capital gains (the profits earned upon the sale of securities that have grown in value, if any) and assuming a constant rate of performance each year. The hypothetical investment and the average annual total returns do not reflect the deduction of taxes that a shareholder would pay on fund distributions or the redemption of fund shares. During periods of reimbursement by Fidelity, a fund’s total return will be greater than it would be had the reimbursement not occurred. How a fund did yesterday is no guarantee of how it will do tomorrow.
Average Annual Total Returns
| Periods ended March 31, 2022 | Past 1 year | Life of Portfolio |
| Fidelity Flex® Freedom Blend 2005 Fund | (0.41)% | 4.90% |
$10,000 Over Life of Fund
Let's say hypothetically that $10,000 was invested in Fidelity Flex® Freedom Blend 2005 Fund on June 8, 2017, when the fund started.
The chart shows how the value of your investment would have changed, and also shows how the Bloomberg U.S. Aggregate Bond Index performed over the same period.
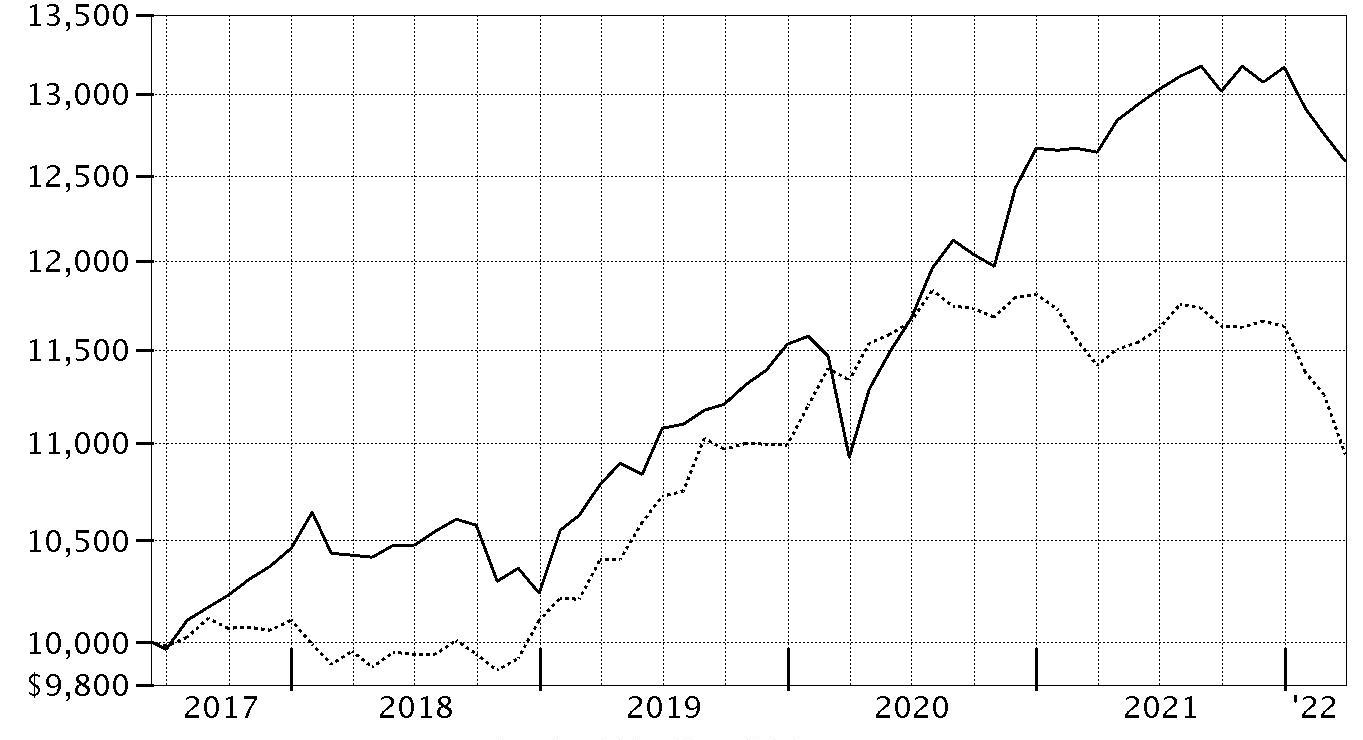
| Period Ending Values |
| $12,590 | Fidelity Flex® Freedom Blend 2005 Fund |
| $10,942 | Bloomberg U.S. Aggregate Bond Index |
Effective August 24, 2021, all Bloomberg Barclays Indices were re-branded as Bloomberg Indices.
Fidelity Flex® Freedom Blend 2010 Fund
Performance: The Bottom Line
Average annual total return reflects the change in the value of an investment, assuming reinvestment of distributions from dividend income and capital gains (the profits earned upon the sale of securities that have grown in value, if any) and assuming a constant rate of performance each year. The hypothetical investment and the average annual total returns do not reflect the deduction of taxes that a shareholder would pay on fund distributions or the redemption of fund shares. During periods of reimbursement by Fidelity, a fund’s total return will be greater than it would be had the reimbursement not occurred. How a fund did yesterday is no guarantee of how it will do tomorrow.
Average Annual Total Returns
| Periods ended March 31, 2022 | Past 1 year | Life of Portfolio |
| Fidelity Flex® Freedom Blend 2010 Fund | 0.02% | 5.79% |
$10,000 Over Life of Fund
Let's say hypothetically that $10,000 was invested in Fidelity Flex® Freedom Blend 2010 Fund on June 8, 2017, when the fund started.
The chart shows how the value of your investment would have changed, and also shows how the Bloomberg U.S. Aggregate Bond Index performed over the same period.
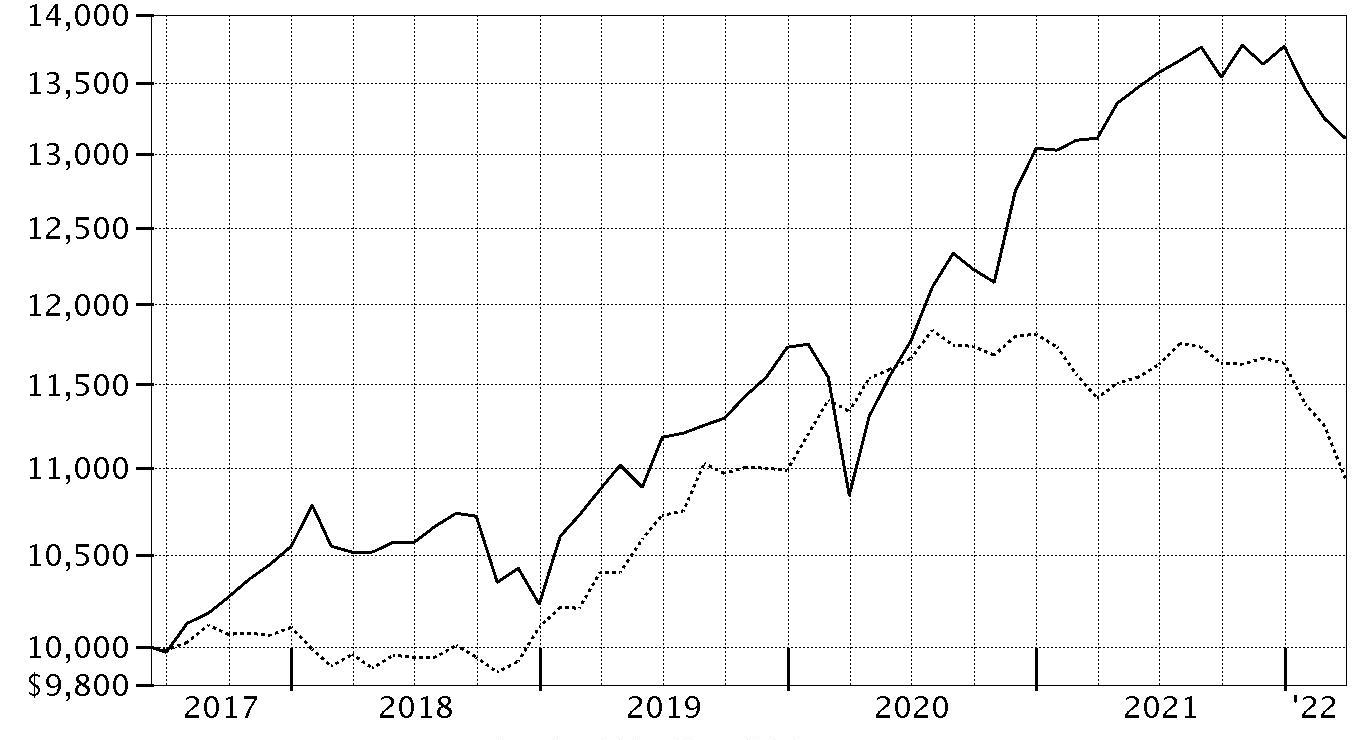
| Period Ending Values |
| $13,113 | Fidelity Flex® Freedom Blend 2010 Fund |
| $10,942 | Bloomberg U.S. Aggregate Bond Index |
Effective August 24, 2021, all Bloomberg Barclays Indices were re-branded as Bloomberg Indices.
Fidelity Flex® Freedom Blend 2015 Fund
Performance: The Bottom Line
Average annual total return reflects the change in the value of an investment, assuming reinvestment of distributions from dividend income and capital gains (the profits earned upon the sale of securities that have grown in value, if any) and assuming a constant rate of performance each year. The hypothetical investment and the average annual total returns do not reflect the deduction of taxes that a shareholder would pay on fund distributions or the redemption of fund shares. During periods of reimbursement by Fidelity, a fund’s total return will be greater than it would be had the reimbursement not occurred. How a fund did yesterday is no guarantee of how it will do tomorrow.
Average Annual Total Returns
| Periods ended March 31, 2022 | Past 1 year | Life of Portfolio |
| Fidelity Flex® Freedom Blend 2015 Fund | 0.49% | 6.67% |
$10,000 Over Life of Fund
Let's say hypothetically that $10,000 was invested in Fidelity Flex® Freedom Blend 2015 Fund on June 8, 2017, when the fund started.
The chart shows how the value of your investment would have changed, and also shows how the Bloomberg U.S. Aggregate Bond Index performed over the same period.

| Period Ending Values |
| $13,647 | Fidelity Flex® Freedom Blend 2015 Fund |
| $10,942 | Bloomberg U.S. Aggregate Bond Index |
Effective August 24, 2021, all Bloomberg Barclays Indices were re-branded as Bloomberg Indices.
Fidelity Flex® Freedom Blend 2020 Fund
Performance: The Bottom Line
Average annual total return reflects the change in the value of an investment, assuming reinvestment of distributions from dividend income and capital gains (the profits earned upon the sale of securities that have grown in value, if any) and assuming a constant rate of performance each year. The hypothetical investment and the average annual total returns do not reflect the deduction of taxes that a shareholder would pay on fund distributions or the redemption of fund shares. During periods of reimbursement by Fidelity, a fund’s total return will be greater than it would be had the reimbursement not occurred. How a fund did yesterday is no guarantee of how it will do tomorrow.
Average Annual Total Returns
| Periods ended March 31, 2022 | Past 1 year | Life of Portfolio |
| Fidelity Flex® Freedom Blend 2020 Fund | 0.98% | 7.47% |
$10,000 Over Life of Fund
Let's say hypothetically that $10,000 was invested in Fidelity Flex® Freedom Blend 2020 Fund on June 8, 2017, when the fund started.
The chart shows how the value of your investment would have changed, and also shows how the Bloomberg U.S. Aggregate Bond Index and S&P 500 Index performed over the same period.
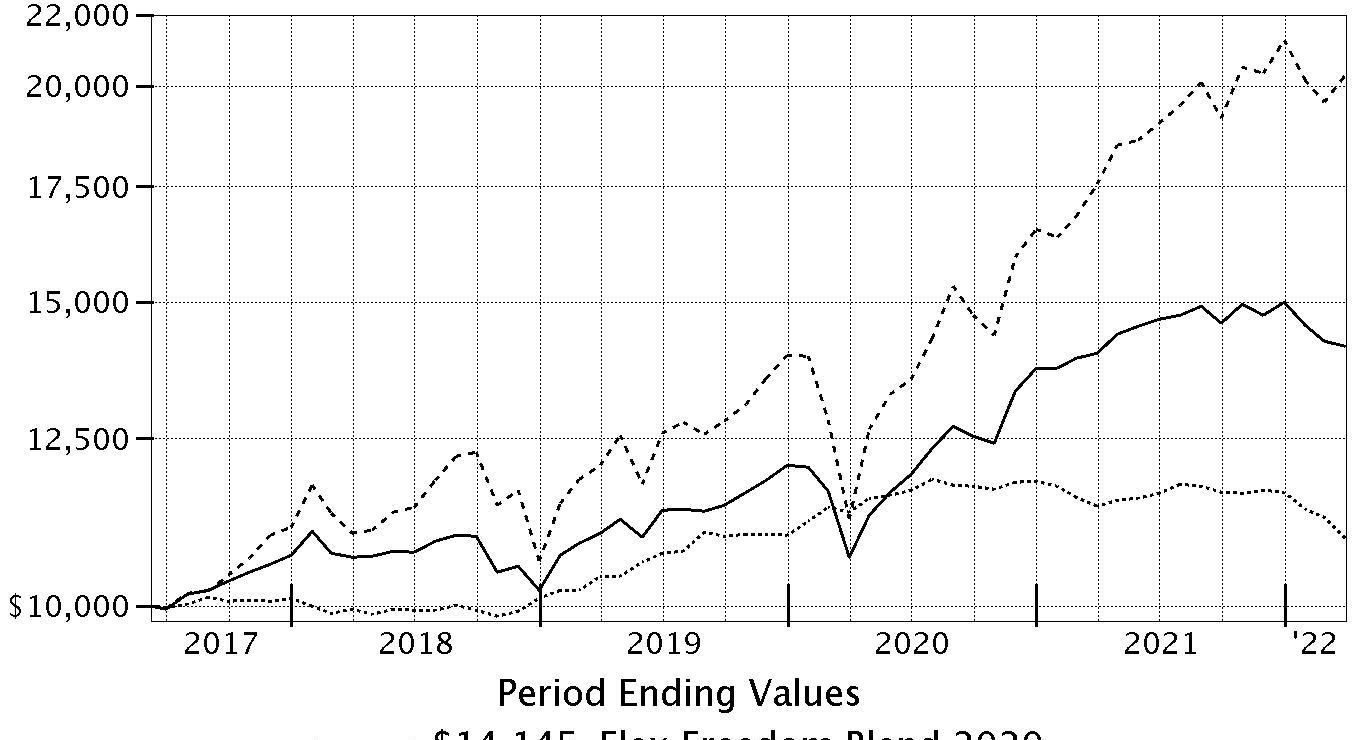
| Period Ending Values |
| $14,145 | Fidelity Flex® Freedom Blend 2020 Fund |
| $10,942 | Bloomberg U.S. Aggregate Bond Index |
| $20,299 | S&P 500 |
Effective August 24, 2021, all Bloomberg Barclays Indices were re-branded as Bloomberg Indices.
Effective October 1, 2021, the fund’s benchmark changed from the S&P 500 Index to the Bloomberg U.S. Aggregate Bond Index.
Fidelity Flex® Freedom Blend 2025 Fund
Performance: The Bottom Line
Average annual total return reflects the change in the value of an investment, assuming reinvestment of distributions from dividend income and capital gains (the profits earned upon the sale of securities that have grown in value, if any) and assuming a constant rate of performance each year. The hypothetical investment and the average annual total returns do not reflect the deduction of taxes that a shareholder would pay on fund distributions or the redemption of fund shares. During periods of reimbursement by Fidelity, a fund’s total return will be greater than it would be had the reimbursement not occurred. How a fund did yesterday is no guarantee of how it will do tomorrow.
Average Annual Total Returns
| Periods ended March 31, 2022 | Past 1 year | Life of Portfolio |
| Fidelity Flex® Freedom Blend 2025 Fund | 1.41% | 8.11% |
$10,000 Over Life of Fund
Let's say hypothetically that $10,000 was invested in Fidelity Flex® Freedom Blend 2025 Fund on June 8, 2017, when the fund started.
The chart shows how the value of your investment would have changed, and also shows how the S&P 500® Index performed over the same period.
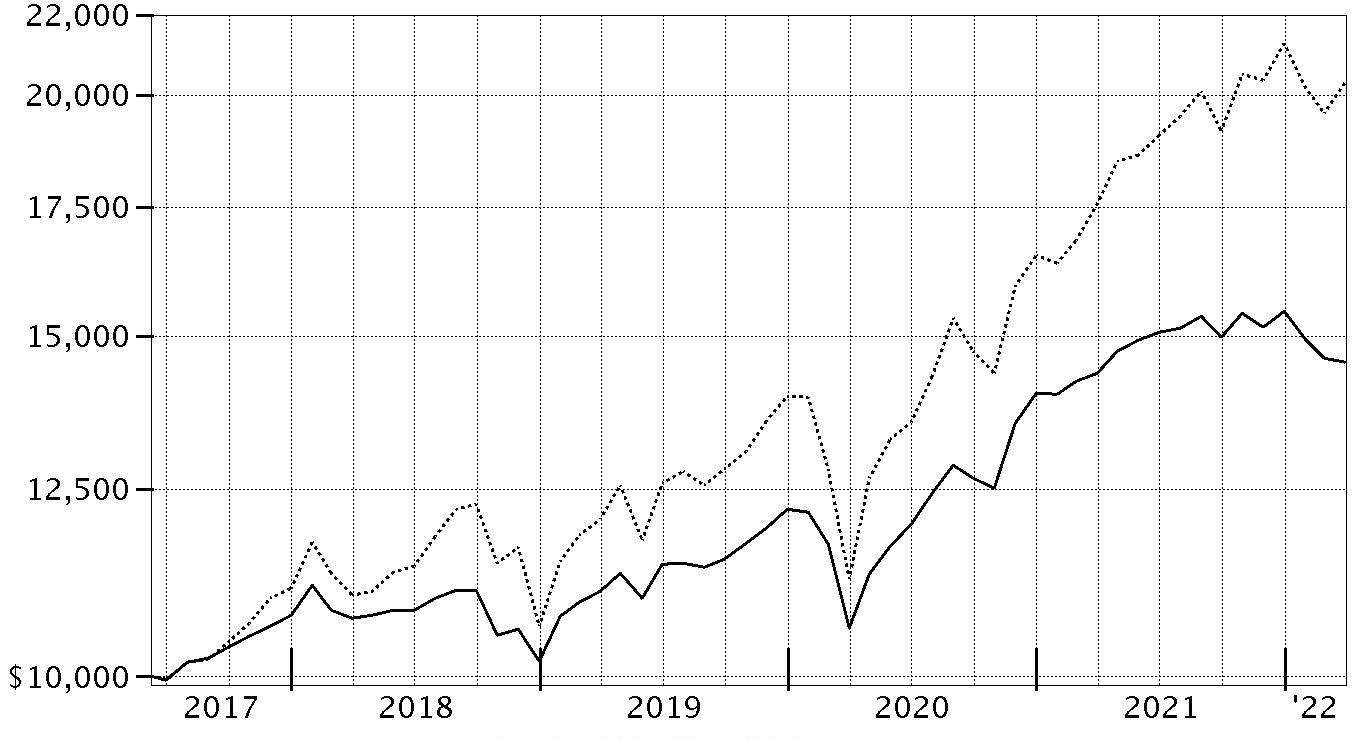
| Period Ending Values |
| $14,552 | Fidelity Flex® Freedom Blend 2025 Fund |
| $20,299 | S&P 500® Index |
Fidelity Flex® Freedom Blend 2030 Fund
Performance: The Bottom Line
Average annual total return reflects the change in the value of an investment, assuming reinvestment of distributions from dividend income and capital gains (the profits earned upon the sale of securities that have grown in value, if any) and assuming a constant rate of performance each year. The hypothetical investment and the average annual total returns do not reflect the deduction of taxes that a shareholder would pay on fund distributions or the redemption of fund shares. During periods of reimbursement by Fidelity, a fund’s total return will be greater than it would be had the reimbursement not occurred. How a fund did yesterday is no guarantee of how it will do tomorrow.
Average Annual Total Returns
| Periods ended March 31, 2022 | Past 1 year | Life of Portfolio |
| Fidelity Flex® Freedom Blend 2030 Fund | 1.87% | 8.98% |
$10,000 Over Life of Fund
Let's say hypothetically that $10,000 was invested in Fidelity Flex® Freedom Blend 2030 Fund on June 8, 2017, when the fund started.
The chart shows how the value of your investment would have changed, and also shows how the S&P 500® Index performed over the same period.
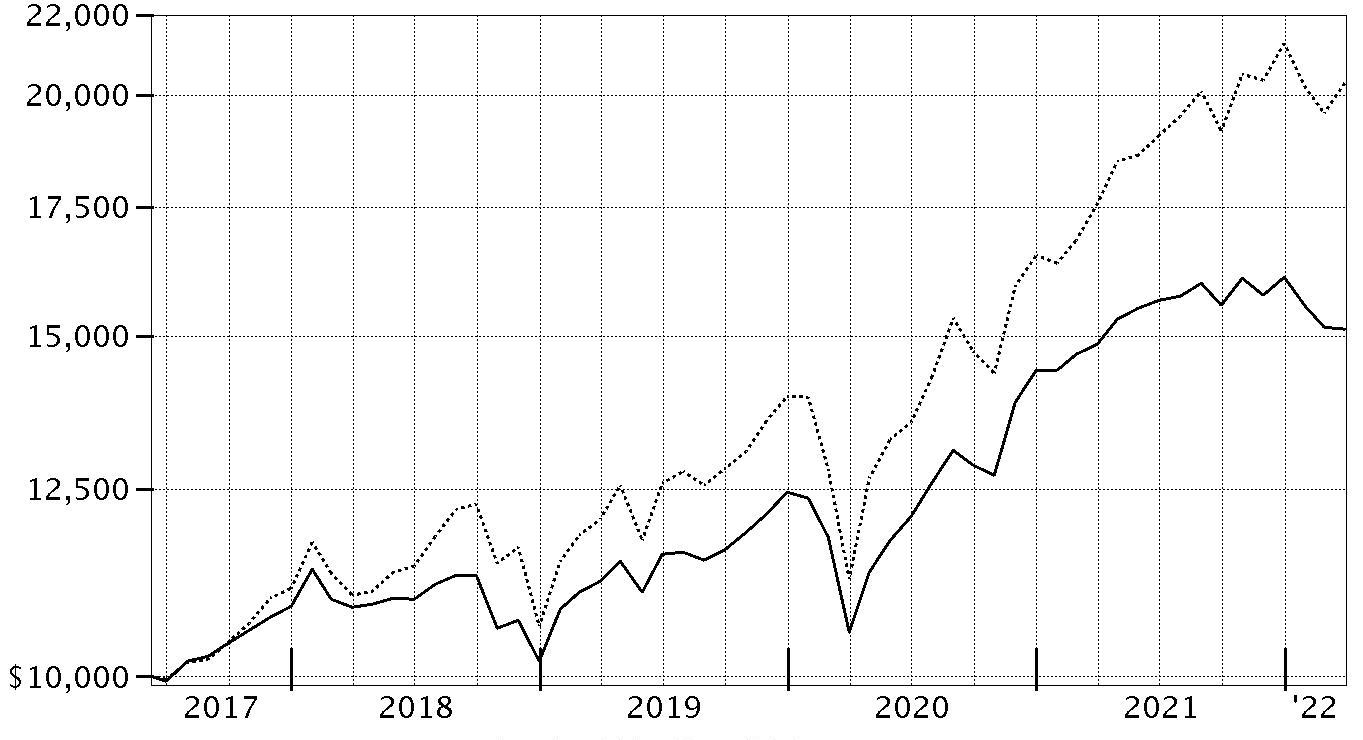
| Period Ending Values |
| $15,131 | Fidelity Flex® Freedom Blend 2030 Fund |
| $20,299 | S&P 500® Index |
Fidelity Flex® Freedom Blend 2035 Fund
Performance: The Bottom Line
Average annual total return reflects the change in the value of an investment, assuming reinvestment of distributions from dividend income and capital gains (the profits earned upon the sale of securities that have grown in value, if any) and assuming a constant rate of performance each year. The hypothetical investment and the average annual total returns do not reflect the deduction of taxes that a shareholder would pay on fund distributions or the redemption of fund shares. During periods of reimbursement by Fidelity, a fund’s total return will be greater than it would be had the reimbursement not occurred. How a fund did yesterday is no guarantee of how it will do tomorrow.
Average Annual Total Returns
| Periods ended March 31, 2022 | Past 1 year | Life of Portfolio |
| Fidelity Flex® Freedom Blend 2035 Fund | 2.94% | 10.21% |
$10,000 Over Life of Fund
Let's say hypothetically that $10,000 was invested in Fidelity Flex® Freedom Blend 2035 Fund on June 8, 2017, when the fund started.
The chart shows how the value of your investment would have changed, and also shows how the S&P 500® Index performed over the same period.
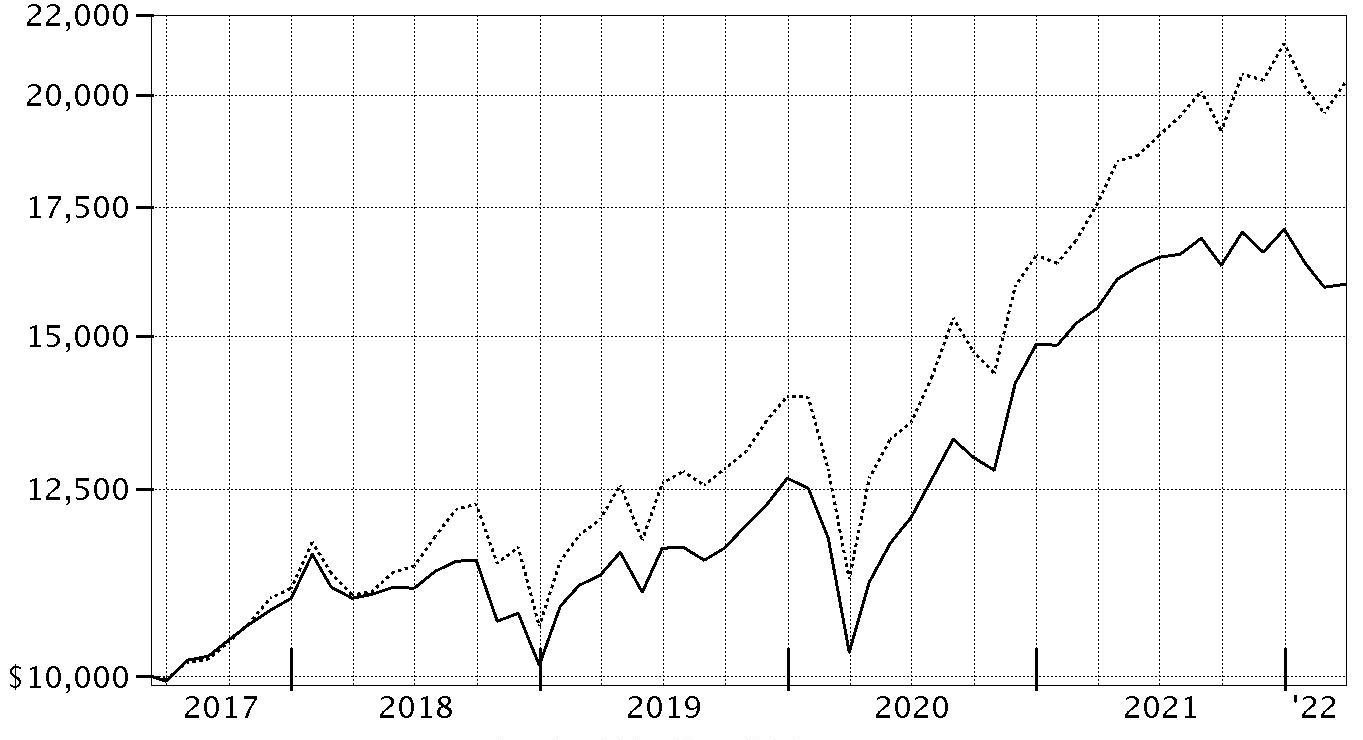
| Period Ending Values |
| $15,966 | Fidelity Flex® Freedom Blend 2035 Fund |
| $20,299 | S&P 500® Index |
Fidelity Flex® Freedom Blend 2040 Fund
Performance: The Bottom Line
Average annual total return reflects the change in the value of an investment, assuming reinvestment of distributions from dividend income and capital gains (the profits earned upon the sale of securities that have grown in value, if any) and assuming a constant rate of performance each year. The hypothetical investment and the average annual total returns do not reflect the deduction of taxes that a shareholder would pay on fund distributions or the redemption of fund shares. During periods of reimbursement by Fidelity, a fund’s total return will be greater than it would be had the reimbursement not occurred. How a fund did yesterday is no guarantee of how it will do tomorrow.
Average Annual Total Returns
| Periods ended March 31, 2022 | Past 1 year | Life of Portfolio |
| Fidelity Flex® Freedom Blend 2040 Fund | 3.91% | 10.89% |
$10,000 Over Life of Fund
Let's say hypothetically that $10,000 was invested in Fidelity Flex® Freedom Blend 2040 Fund on June 8, 2017, when the fund started.
The chart shows how the value of your investment would have changed, and also shows how the S&P 500® Index performed over the same period.
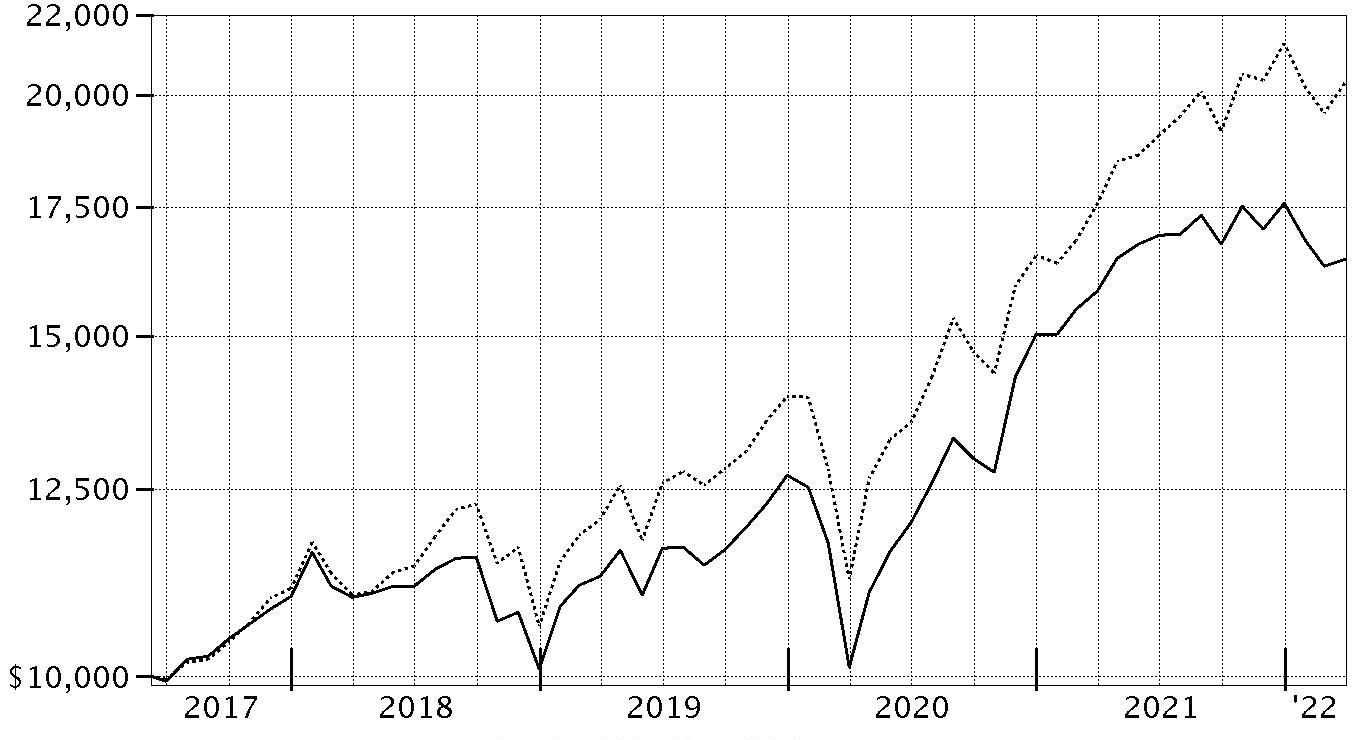
| Period Ending Values |
| $16,450 | Fidelity Flex® Freedom Blend 2040 Fund |
| $20,299 | S&P 500® Index |
Fidelity Flex® Freedom Blend 2045 Fund
Performance: The Bottom Line
Average annual total return reflects the change in the value of an investment, assuming reinvestment of distributions from dividend income and capital gains (the profits earned upon the sale of securities that have grown in value, if any) and assuming a constant rate of performance each year. The hypothetical investment and the average annual total returns do not reflect the deduction of taxes that a shareholder would pay on fund distributions or the redemption of fund shares. During periods of reimbursement by Fidelity, a fund’s total return will be greater than it would be had the reimbursement not occurred. How a fund did yesterday is no guarantee of how it will do tomorrow.
Average Annual Total Returns
| Periods ended March 31, 2022 | Past 1 year | Life of Portfolio |
| Fidelity Flex® Freedom Blend 2045 Fund | 3.89% | 10.90% |
$10,000 Over Life of Fund
Let's say hypothetically that $10,000 was invested in Fidelity Flex® Freedom Blend 2045 Fund on June 8, 2017, when the fund started.
The chart shows how the value of your investment would have changed, and also shows how the S&P 500® Index performed over the same period.

| Period Ending Values |
| $16,453 | Fidelity Flex® Freedom Blend 2045 Fund |
| $20,299 | S&P 500® Index |
Fidelity Flex® Freedom Blend 2050 Fund
Performance: The Bottom Line
Average annual total return reflects the change in the value of an investment, assuming reinvestment of distributions from dividend income and capital gains (the profits earned upon the sale of securities that have grown in value, if any) and assuming a constant rate of performance each year. The hypothetical investment and the average annual total returns do not reflect the deduction of taxes that a shareholder would pay on fund distributions or the redemption of fund shares. During periods of reimbursement by Fidelity, a fund’s total return will be greater than it would be had the reimbursement not occurred. How a fund did yesterday is no guarantee of how it will do tomorrow.
Average Annual Total Returns
| Periods ended March 31, 2022 | Past 1 year | Life of Portfolio |
| Fidelity Flex® Freedom Blend 2050 Fund | 3.89% | 10.88% |
$10,000 Over Life of Fund
Let's say hypothetically that $10,000 was invested in Fidelity Flex® Freedom Blend 2050 Fund on June 8, 2017, when the fund started.
The chart shows how the value of your investment would have changed, and also shows how the S&P 500® Index performed over the same period.

| Period Ending Values |
| $16,443 | Fidelity Flex® Freedom Blend 2050 Fund |
| $20,299 | S&P 500® Index |
Fidelity Flex® Freedom Blend 2055 Fund
Performance: The Bottom Line
Average annual total return reflects the change in the value of an investment, assuming reinvestment of distributions from dividend income and capital gains (the profits earned upon the sale of securities that have grown in value, if any) and assuming a constant rate of performance each year. The hypothetical investment and the average annual total returns do not reflect the deduction of taxes that a shareholder would pay on fund distributions or the redemption of fund shares. During periods of reimbursement by Fidelity, a fund’s total return will be greater than it would be had the reimbursement not occurred. How a fund did yesterday is no guarantee of how it will do tomorrow.
Average Annual Total Returns
| Periods ended March 31, 2022 | Past 1 year | Life of Portfolio |
| Fidelity Flex® Freedom Blend 2055 Fund | 3.84% | 10.90% |
$10,000 Over Life of Fund
Let's say hypothetically that $10,000 was invested in Fidelity Flex® Freedom Blend 2055 Fund on June 8, 2017, when the fund started.
The chart shows how the value of your investment would have changed, and also shows how the S&P 500® Index performed over the same period.

| Period Ending Values |
| $16,455 | Fidelity Flex® Freedom Blend 2055 Fund |
| $20,299 | S&P 500® Index |
Fidelity Flex® Freedom Blend 2060 Fund
Performance: The Bottom Line
Average annual total return reflects the change in the value of an investment, assuming reinvestment of distributions from dividend income and capital gains (the profits earned upon the sale of securities that have grown in value, if any) and assuming a constant rate of performance each year. The hypothetical investment and the average annual total returns do not reflect the deduction of taxes that a shareholder would pay on fund distributions or the redemption of fund shares. During periods of reimbursement by Fidelity, a fund’s total return will be greater than it would be had the reimbursement not occurred. How a fund did yesterday is no guarantee of how it will do tomorrow.
Average Annual Total Returns
| Periods ended March 31, 2022 | Past 1 year | Life of Portfolio |
| Fidelity Flex® Freedom Blend 2060 Fund | 3.84% | 10.89% |
$10,000 Over Life of Fund
Let's say hypothetically that $10,000 was invested in Fidelity Flex® Freedom Blend 2060 Fund on June 8, 2017, when the fund started.
The chart shows how the value of your investment would have changed, and also shows how the S&P 500® Index performed over the same period.
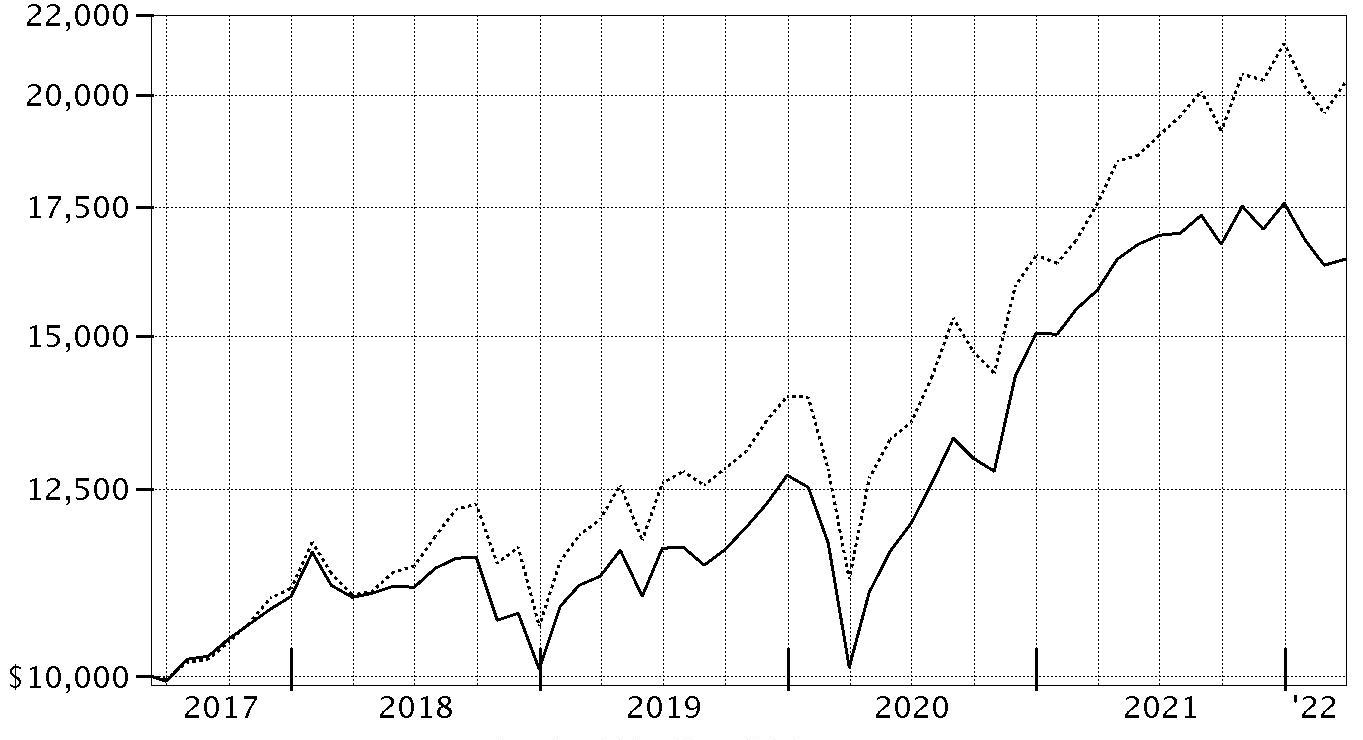
| Period Ending Values |
| $16,447 | Fidelity Flex® Freedom Blend 2060 Fund |
| $20,299 | S&P 500® Index |
Fidelity Flex® Freedom Blend 2065 Fund
Performance: The Bottom Line
Average annual total return reflects the change in the value of an investment, assuming reinvestment of distributions from dividend income and capital gains (the profits earned upon the sale of securities that have grown in value, if any) and assuming a constant rate of performance each year. The hypothetical investment and the average annual total returns do not reflect the deduction of taxes that a shareholder would pay on fund distributions or the redemption of fund shares. During periods of reimbursement by Fidelity, a fund’s total return will be greater than it would be had the reimbursement not occurred. How a fund did yesterday is no guarantee of how it will do tomorrow.
Average Annual Total Returns
| Periods ended March 31, 2022 | Past 1 year | Life of Portfolio |
| Fidelity Flex® Freedom Blend 2065 Fund | 3.86% | 13.42% |
$10,000 Over Life of Fund
Let's say hypothetically that $10,000 was invested in Fidelity Flex® Freedom Blend 2065 Fund on June 28, 2019, when the fund started.
The chart shows how the value of your investment would have changed, and also shows how the S&P 500® Index performed over the same period.
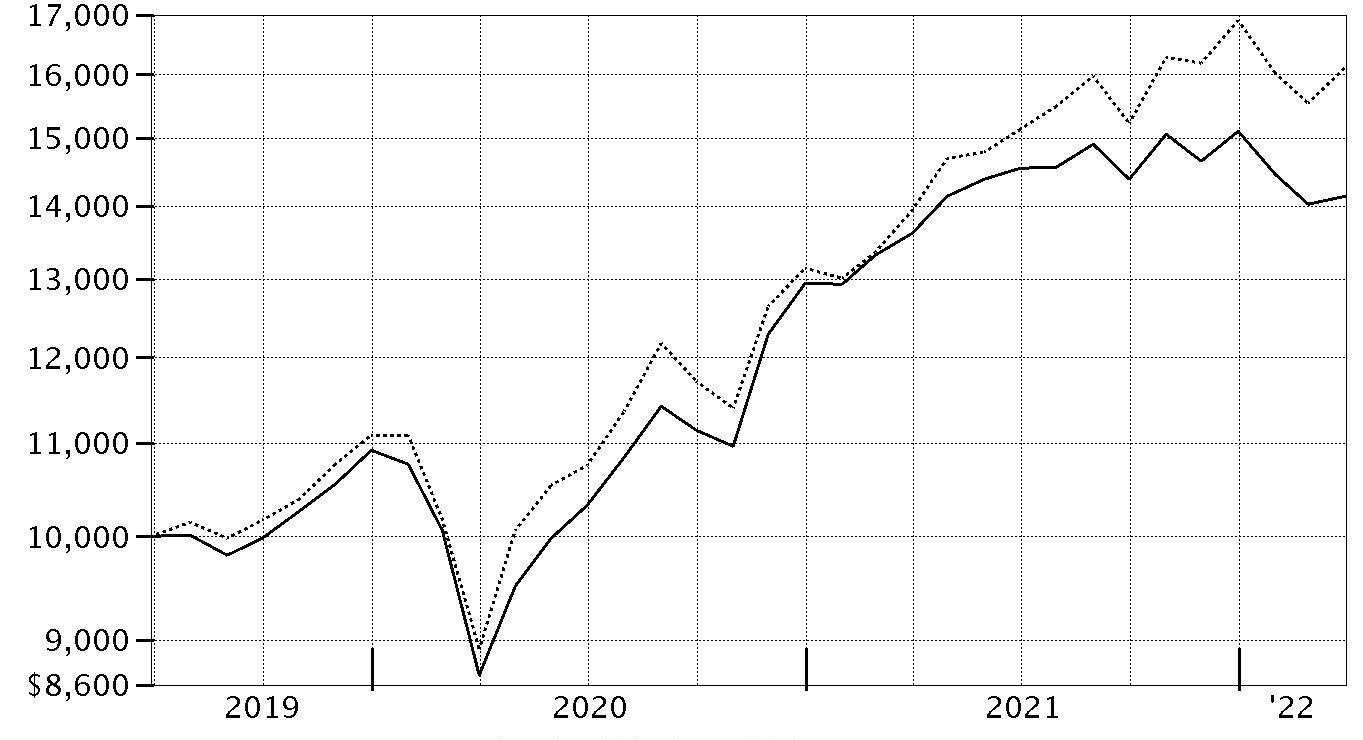
| Period Ending Values |
| $14,138 | Fidelity Flex® Freedom Blend 2065 Fund |
| $16,126 | S&P 500® Index |
Management's Discussion of Fund Performance
Market Recap: For the 12 months ending March 31, 2022, global financial markets were influenced by the reopening of businesses, an improved outlook for global economic growth, and fiscal and monetary stimulus. Strong corporate earnings growth amid ongoing midcycle economic expansion in several countries provided support for risk assets. However, as the calendar turned, investors grappled with soaring inflation, increasing bond yields, supply constraint and disruption, and Russia’s invasion of Ukraine, which led to surging commodity prices.
International equities returned -1.33% the past 12 months, according to the MSCI ACWI (All Country World Index) ex USA Index. By region, emerging markets (-11%) lagged most, followed by Japan (-6%). Conversely, Canada (+21%) topped the broader index by a wide margin. The U.K. (+15%), Asia Pacific ex Japan (+3%) and Europe ex U.K. (+1%) also outperformed. By sector, consumer discretionary (-21%) and communication services (-16%) fared worst. In contrast, energy (+24%) notably outperformed due to rising prices for oil and natural gas. Materials and financials each gained about 10%.
U.S. stocks gained 11.67% for the 12 months, as measured by the Dow Jones U.S. Total Stock Market Index. Among sectors, energy (+64%) led the way. Real estate (+20%), utilities (+19%) and information technology (+16%) also showed strength. In contrast, communication services (-3%) notably lagged. Small-cap stocks widely trailed larger-caps, while value outpaced growth, except among large-caps. Commodities rose 49.25%, per the Bloomberg Commodity Index Total Return.
U.S. taxable investment-grade bonds returned -4.15%, according to the Bloomberg U.S. Aggregate Bond Index, amid rising market interest rates and inflation. In December, the U.S. Federal Reserve said it was time to retire the term “transitory” in describing U.S. inflation and raised prospects for three quarter-point rate hikes in 2022. Corporate bonds (-4.16%) trailed U.S. Treasuries (-3.67%). Commercial mortgage-backed securities (-4.46%) and agencies (-3.94%) also lost ground. Outside the index, Treasury Inflation-Protected Securities (+4.29%) and leveraged loans (+3.38%) gained, but other non-core groups declined, such as emerging-markets debt (-6.18%) and U.S. corporate high-yield bonds (-0.30%).
Comments from Co-Portfolio Managers Andrew Dierdorf and Brett Sumsion: For the fiscal year, Fidelity Flex Freedom
® Blend Funds posted returns ranging from -0.61% to 3.91%, and each Fund underperformed its Composite index. Security selection among the underlying investment portfolios was the primary relative detractor, whereas active asset allocation contributed. Specifically, investments in underlying emerging-markets equity funds hurt most. In this asset class, Fidelity
® Series Emerging Markets Opportunities Fund (-19.20%) lagged the -11.36% result of its benchmark, the MSCI Emerging Markets Index. Underlying investments in U.S. equities also held back the Funds' performance versus Composites. Specifically, Fidelity
® Series Blue Chip Growth Fund (+3.25%) detracted, given the fund trailed the +14.98% gain of its benchmark, the Russell 1000
® Growth Index. Conversely, investments in non-U.S. developed-markets equities and U.S. investment-grade bonds lifted the Funds' relative performance the past year. In terms of active asset allocation, a non-Composite allocation to commodities added relative value, given the 48.79% return for Fidelity
® Series Commodity Strategy Fund. Underweighting investment-grade bonds also contributed, as this asset class lagged many others in which the Funds invest. In contrast, positioning in equities detracted from the Funds' relative results. An outsized allocation to emerging-markets equities hurt, as did an underweighting in strong-performing U.S. equities.
The views expressed above reflect those of the portfolio manager(s) only through the end of the period as stated on the cover of this report and do not necessarily represent the views of Fidelity or any other person in the Fidelity organization. Any such views are subject to change at any time based upon market or other conditions and Fidelity disclaims any responsibility to update such views. These views may not be relied on as investment advice and, because investment decisions for a Fidelity fund are based on numerous factors, may not be relied on as an indication of trading intent on behalf of any Fidelity fund.
Fidelity Flex® Freedom Blend Income Fund
Investment Summary (Unaudited)
The information in the following tables is based on the direct investments of the Fund.
Top Holdings as of March 31, 2022
| | % of fund's net assets |
| Fidelity Series 0-5 Year Inflation-Protected Bond Index Fund | 15.9 |
| Fidelity Series Investment Grade Bond Fund | 11.9 |
| Fidelity Series Government Bond Index Fund | 11.3 |
| Fidelity Series Investment Grade Securitized Fund | 8.4 |
| Fidelity Series Corporate Bond Fund | 8.1 |
| Fidelity Series Treasury Bill Index Fund | 7.5 |
| Fidelity Series Emerging Markets Opportunities Fund | 5.7 |
| Fidelity Series Long-Term Treasury Bond Index Fund | 3.7 |
| Fidelity Series International Developed Markets Bond Index Fund | 3.1 |
| Fidelity Series Short-Term Credit Fund | 2.5 |
| | 78.1 |
Asset Allocation (% of fund's net assets)
| Period end |
| | Domestic Equity Funds | 7.3% |
| | International Equity Funds | 13.9% |
| | Bond Funds | 66.3% |
| | Short-Term Funds | 12.5% |

Domestic Equity Funds category includes Fidelity Series Commodity Strategy Fund which invests in commodity-related investments.
Fidelity Flex® Freedom Blend Income Fund
Schedule of Investments March 31, 2022
Showing Percentage of Net Assets
| Domestic Equity Funds - 7.3% | | | |
| | | Shares | Value |
| Fidelity Series Blue Chip Growth Fund (a) | | 135 | $1,939 |
| Fidelity Series Commodity Strategy Fund (a) | | 437 | 2,234 |
| Fidelity Series Large Cap Growth Index Fund (a) | | 69 | 1,222 |
| Fidelity Series Large Cap Stock Fund (a) | | 72 | 1,363 |
| Fidelity Series Large Cap Value Index Fund (a) | | 170 | 2,612 |
| Fidelity Series Small Cap Opportunities Fund (a) | | 48 | 656 |
| Fidelity Series Value Discovery Fund (a) | | 60 | 965 |
| TOTAL DOMESTIC EQUITY FUNDS | | | |
| (Cost $8,920) | | | 10,991 |
|
| International Equity Funds - 13.9% | | | |
| Fidelity Series Canada Fund (a) | | 86 | 1,328 |
| Fidelity Series Emerging Markets Fund (a) | | 103 | 952 |
| Fidelity Series Emerging Markets Opportunities Fund (a) | | 466 | 8,577 |
| Fidelity Series International Growth Fund (a) | | 162 | 2,694 |
| Fidelity Series International Index Fund (a) | | 99 | 1,138 |
| Fidelity Series International Small Cap Fund (a) | | 47 | 842 |
| Fidelity Series International Value Fund (a) | | 246 | 2,710 |
| Fidelity Series Overseas Fund (a) | | 215 | 2,719 |
| TOTAL INTERNATIONAL EQUITY FUNDS | | | |
| (Cost $20,428) | | | 20,960 |
|
| Bond Funds - 66.3% | | | |
| Fidelity Series 0-5 Year Inflation-Protected Bond Index Fund (a) | | 2,402 | 24,097 |
| Fidelity Series 5+ Year Inflation-Protected Bond Index Fund (a) | | 16 | 150 |
| Fidelity Series Corporate Bond Fund (a) | | 1,211 | 12,233 |
| Fidelity Series Emerging Markets Debt Fund (a) | | 95 | 783 |
| Fidelity Series Emerging Markets Debt Local Currency Fund (a) | | 28 | 255 |
| Fidelity Series Floating Rate High Income Fund (a) | | 17 | 153 |
| Fidelity Series Government Bond Index Fund (a) | | 1,714 | 17,110 |
| Fidelity Series High Income Fund (a) | | 100 | 909 |
| Fidelity Series Inflation-Protected Bond Index Fund (a) | | 296 | 3,009 |
| Fidelity Series International Credit Fund (a) | | 6 | 60 |
| Fidelity Series International Developed Markets Bond Index Fund (a) | | 508 | 4,735 |
| Fidelity Series Investment Grade Bond Fund (a) | | 1,649 | 17,995 |
| Fidelity Series Investment Grade Securitized Fund (a) | | 1,297 | 12,610 |
| Fidelity Series Long-Term Treasury Bond Index Fund (a) | | 734 | 5,590 |
| Fidelity Series Real Estate Income Fund (a) | | 49 | 557 |
| TOTAL BOND FUNDS | | | |
| (Cost $104,249) | | | 100,246 |
|
| Short-Term Funds - 12.5% | | | |
| Fidelity Series Government Money Market Fund 0.31% (a)(b) | | 3,791 | 3,791 |
| Fidelity Series Short-Term Credit Fund (a) | | 389 | 3,798 |
| Fidelity Series Treasury Bill Index Fund (a) | | 1,138 | 11,373 |
| TOTAL SHORT-TERM FUNDS | | | |
| (Cost $19,060) | | | 18,962 |
| TOTAL INVESTMENT IN SECURITIES - 100.0% | | | |
| (Cost $152,657) | | | 151,159 |
| NET OTHER ASSETS (LIABILITIES) - 0.0% | | | 3 |
| NET ASSETS - 100% | | | $151,162 |
Legend
(a) Affiliated Fund
(b) The rate quoted is the annualized seven-day yield of the fund at period end.
Affiliated Underlying Funds
Fiscal year to date information regarding the Fund's investments in affiliated Underlying Funds is presented below. Exchanges between classes of the same affiliated Underlying Funds may occur. If an underlying Fund changes its name, the name presented below is the name in effect at period end.
| Fund | Value, beginning of period | Purchases(a) | Sales Proceeds(a) | Dividend Income | Realized Gain (loss) | Change in Unrealized appreciation (depreciation) | Value, end of period |
| Fidelity Series 0-5 Year Inflation-Protected Bond Index Fund | $-- | $24,201 | $49 | $89 | $-- | $(43) | $24,097 |
| Fidelity Series 5+ Year Inflation-Protected Bond Index Fund | -- | 4,051 | 3,878 | 10 | (23) | -- | 150 |
| Fidelity Series Blue Chip Growth Fund | 1,772 | 1,387 | 887 | 382 | 22 | (355) | 1,939 |
| Fidelity Series Canada Fund | 630 | 595 | 77 | 24 | 2 | 178 | 1,328 |
| Fidelity Series Commodity Strategy Fund | 3,411 | 1,685 | 3,117 | 1,070 | (11) | 266 | 2,234 |
| Fidelity Series Corporate Bond Fund | 10,413 | 3,542 | 853 | 316 | (17) | (852) | 12,233 |
| Fidelity Series Emerging Markets Debt Fund | 669 | 232 | 44 | 33 | (5) | (69) | 783 |
| Fidelity Series Emerging Markets Debt Local Currency Fund | 220 | 74 | 12 | 9 | (1) | (26) | 255 |
| Fidelity Series Emerging Markets Fund | 877 | 470 | 204 | 27 | 19 | (210) | 952 |
| Fidelity Series Emerging Markets Opportunities Fund | 7,928 | 5,216 | 2,109 | 885 | 218 | (2,676) | 8,577 |
| Fidelity Series Floating Rate High Income Fund | 132 | 40 | 19 | 6 | -- | -- | 153 |
| Fidelity Series Government Bond Index Fund | 12,839 | 5,306 | 210 | 157 | (6) | (819) | 17,110 |
| Fidelity Series Government Money Market Fund 0.31% | 9,303 | 1,091 | 6,603 | 5 | -- | -- | 3,791 |
| Fidelity Series High Income Fund | 781 | 241 | 82 | 45 | (3) | (28) | 909 |
| Fidelity Series Inflation-Protected Bond Index Fund | 14,775 | 2,267 | 13,967 | 720 | 1,066 | (1,132) | 3,009 |
| Fidelity Series International Credit Fund | 63 | 2 | -- | 2 | -- | (5) | 60 |
| Fidelity Series International Developed Markets Bond Index Fund | -- | 4,945 | 8 | 1 | -- | (202) | 4,735 |
| Fidelity Series International Growth Fund | 1,548 | 1,655 | 218 | 193 | 1 | (292) | 2,694 |
| Fidelity Series International Index Fund | 646 | 599 | 64 | 25 | 2 | (45) | 1,138 |
| Fidelity Series International Small Cap Fund | 558 | 469 | 40 | 101 | (1) | (144) | 842 |
| Fidelity Series International Value Fund | 1,547 | 1,410 | 253 | 121 | 3 | 3 | 2,710 |
| Fidelity Series Investment Grade Bond Fund | 14,251 | 5,122 | 396 | 352 | (6) | (976) | 17,995 |
| Fidelity Series Investment Grade Securitized Fund | 9,984 | 3,516 | 192 | 96 | (3) | (695) | 12,610 |
| Fidelity Series Large Cap Growth Index Fund | 1,118 | 588 | 609 | 38 | 46 | 79 | 1,222 |
| Fidelity Series Large Cap Stock Fund | 1,221 | 566 | 463 | 117 | 13 | 26 | 1,363 |
| Fidelity Series Large Cap Value Index Fund | 2,332 | 1,235 | 1,056 | 177 | 9 | 92 | 2,612 |
| Fidelity Series Long-Term Treasury Bond Index Fund | 3,362 | 3,024 | 603 | 93 | (71) | (122) | 5,590 |
| Fidelity Series Overseas Fund | 1,551 | 1,501 | 236 | 72 | 23 | (120) | 2,719 |
| Fidelity Series Real Estate Income Fund | 469 | 134 | 58 | 20 | -- | 12 | 557 |
| Fidelity Series Short-Term Credit Fund | 4,588 | 1,874 | 2,471 | 86 | (26) | (167) | 3,798 |
| Fidelity Series Small Cap Opportunities Fund | 590 | 412 | 203 | 153 | 4 | (147) | 656 |
| Fidelity Series Treasury Bill Index Fund | 14,780 | 5,762 | 9,156 | 13 | (2) | (11) | 11,373 |
| Fidelity Series Value Discovery Fund | 862 | 412 | 309 | 115 | 4 | (4) | 965 |
| | $123,220 | $83,624 | $48,446 | $5,553 | $1,257 | $(8,484) | $151,159 |
(a) Includes the value of shares purchased or redeemed through in-kind transactions, as applicable.
Amounts in the income column in the above table include any capital gain distributions from underlying funds, which are presented in the corresponding line-item in the Statement of Operations, if applicable.
Investment Valuation
The following is a summary of the inputs used, as of March 31, 2022, involving the Fund's assets and liabilities carried at fair value. The inputs or methodology used for valuing securities may not be an indication of the risk associated with investing in those securities. For more information on valuation inputs, and their aggregation into the levels used below, please refer to the Investment Valuation section in the accompanying Notes to Financial Statements.
| | Valuation Inputs at Reporting Date: |
| Description | Total | Level 1 | Level 2 | Level 3 |
| Investments in Securities: | | | | |
| Domestic Equity Funds | $10,991 | $10,991 | $-- | $-- |
| International Equity Funds | 20,960 | 20,960 | -- | -- |
| Bond Funds | 100,246 | 100,246 | -- | -- |
| Short-Term Funds | 18,962 | 18,962 | -- | -- |
| Total Investments in Securities: | $151,159 | $151,159 | $-- | $-- |
See accompanying notes which are an integral part of the financial statements.
Fidelity Flex® Freedom Blend Income Fund
Financial Statements
Statement of Assets and Liabilities
| | | March 31, 2022 |
| Assets | | |
Investment in securities, at value — See accompanying schedule:
| | |
| Affiliated issuers (cost $152,657) | $151,159 | |
| Total Investment in Securities (cost $152,657) | | $151,159 |
| Cash | | 3 |
| Receivable for investments sold | | 4,405 |
| Receivable for fund shares sold | | 392 |
| Total assets | | 155,959 |
| Liabilities | | |
| Payable for investments purchased | $4,797 | |
| Total liabilities | | 4,797 |
| Net Assets | | $151,162 |
| Net Assets consist of: | | |
| Paid in capital | | $151,283 |
| Total accumulated earnings (loss) | | (121) |
| Net Assets | | $151,162 |
| Net Asset Value, offering price and redemption price per share ($151,162 ÷ 14,887 shares) | | $10.15 |
See accompanying notes which are an integral part of the financial statements.
Statement of Operations
| | | Year ended March 31, 2022 |
| Investment Income | | |
| Dividends: | | |
| Affiliated issuers | | $3,510 |
| Expenses | | |
| Independent trustees' fees and expenses | $1 | |
| Total expenses | | 1 |
| Net investment income (loss) | | 3,509 |
| Realized and Unrealized Gain (Loss) | | |
| Net realized gain (loss) on: | | |
| Investment securities: | | |
| Affiliated issuers | 1,257 | |
| Capital gain distributions from underlying funds: | | |
| Affiliated issuers | 2,043 | |
| Total net realized gain (loss) | | 3,300 |
| Change in net unrealized appreciation (depreciation) on: | | |
| Investment securities: | | |
| Affiliated issuers | (8,484) | |
| Total change in net unrealized appreciation (depreciation) | | (8,484) |
| Net gain (loss) | | (5,184) |
| Net increase (decrease) in net assets resulting from operations | | $(1,675) |
See accompanying notes which are an integral part of the financial statements.
Statement of Changes in Net Assets
| | Year ended March 31, 2022 | Year ended March 31, 2021 |
| Increase (Decrease) in Net Assets | | |
| Operations | | |
| Net investment income (loss) | $3,509 | $1,626 |
| Net realized gain (loss) | 3,300 | 2,607 |
| Change in net unrealized appreciation (depreciation) | (8,484) | 9,750 |
| Net increase (decrease) in net assets resulting from operations | (1,675) | 13,983 |
| Distributions to shareholders | (6,523) | (3,583) |
| Share transactions | | |
| Proceeds from sales of shares | 32,567 | – |
| Reinvestment of distributions | 6,523 | 3,583 |
| Cost of shares redeemed | (2,952) | – |
| Net increase (decrease) in net assets resulting from share transactions | 36,138 | 3,583 |
| Total increase (decrease) in net assets | 27,940 | 13,983 |
| Net Assets | | |
| Beginning of period | 123,222 | 109,239 |
| End of period | $151,162 | $123,222 |
| Other Information | | |
| Shares | | |
| Sold | 3,057 | – |
| Issued in reinvestment of distributions | 610 | 340 |
| Redeemed | (275) | – |
| Net increase (decrease) | 3,392 | 340 |
See accompanying notes which are an integral part of the financial statements.
Financial Highlights
Fidelity Flex Freedom Blend Income Fund
| | | | | | |
| Years ended March 31, | 2022 | 2021 | 2020 | 2019 | 2018 A |
| Selected Per–Share Data | | | | | |
| Net asset value, beginning of period | $10.72 | $9.79 | $10.01 | $10.09 | $10.00 |
| Income from Investment Operations | | | | | |
| Net investment income (loss)B,C | .28 | .14 | .23 | .25 | .18 |
| Net realized and unrealized gain (loss) | (.33) | 1.11 | –D | .10 | .13 |
| Total from investment operations | (.05) | 1.25 | .23 | .35 | .31 |
| Distributions from net investment income | (.28) | (.15) | (.24) | (.25) | (.16) |
| Distributions from net realized gain | (.24) | (.17) | (.21) | (.18) | (.06) |
| Total distributions | (.52) | (.32) | (.45) | (.43) | (.22) |
| Net asset value, end of period | $10.15 | $10.72 | $9.79 | $10.01 | $10.09 |
| Total ReturnE | (.61)% | 12.84% | 2.17% | 3.63% | 3.14% |
| Ratios to Average Net AssetsC,F,G | | | | | |
| Expenses before reductions | - %H | - %H | - %H | - %H | - %I |
| Expenses net of fee waivers, if any | - %H | - %H | - %H | - %H | - %I |
| Expenses net of all reductions | - %H | - %H | - %H | - %H | - %I |
| Net investment income (loss) | 2.62% | 1.37% | 2.31% | 2.51% | 2.21%I |
| Supplemental Data | | | | | |
| Net assets, end of period (000 omitted) | $151 | $123 | $109 | $107 | $103 |
| Portfolio turnover rateJ | 36% | 25% | 63% | 23% | 10%I |
A For the period June 8, 2017 (commencement of operations) through March 31, 2018.
B Calculated based on average shares outstanding during the period.
C Net investment income (loss) is affected by the timing of the declaration of dividends by any underlying mutual funds or exchange-traded funds (ETFs). Net investment income (loss) of any such underlying funds is not included in the Fund's net investment income (loss) ratio.
D Amount represents less than $.005 per share.
E Total returns for periods of less than one year are not annualized.
F Fees and expenses of any underlying mutual funds or exchange-traded funds (ETFs) are not included in the Fund's expense ratio. The Fund indirectly bears its proportionate share of these expenses.
G Expense ratios reflect operating expenses of the class. Expenses before reductions do not reflect amounts reimbursed, waived, or reduced through arrangements with the investment adviser, brokerage services, or other offset arrangements, if applicable, and do not represent the amount paid by the class during periods when reimbursements, waivers or reductions occur.
H Amount represents less than .005%.
I Annualized
J Amount does not include the portfolio activity of any underlying mutual funds or exchange-traded funds (ETFs).
See accompanying notes which are an integral part of the financial statements.
Fidelity Flex® Freedom Blend 2005 Fund
Investment Summary (Unaudited)
The information in the following tables is based on the direct investments of the Fund.
Top Holdings as of March 31, 2022
| | % of fund's net assets |
| Fidelity Series 0-5 Year Inflation-Protected Bond Index Fund | 14.6 |
| Fidelity Series Investment Grade Bond Fund | 11.6 |
| Fidelity Series Government Bond Index Fund | 11.0 |
| Fidelity Series Investment Grade Securitized Fund | 8.1 |
| Fidelity Series Corporate Bond Fund | 7.9 |
| Fidelity Series Treasury Bill Index Fund | 7.1 |
| Fidelity Series Emerging Markets Opportunities Fund | 5.9 |
| Fidelity Series Long-Term Treasury Bond Index Fund | 3.8 |
| Fidelity Series International Developed Markets Bond Index Fund | 3.1 |
| Fidelity Series Short-Term Credit Fund | 2.4 |
| | 75.5 |
Asset Allocation (% of fund's net assets)
| Period end |
| | Domestic Equity Funds | 8.8% |
| | International Equity Funds | 14.9% |
| | Bond Funds | 64.5% |
| | Short-Term Funds | 11.8% |

Domestic Equity Funds category includes Fidelity Series Commodity Strategy Fund which invests in commodity-related investments.
Fidelity Flex® Freedom Blend 2005 Fund
Schedule of Investments March 31, 2022
Showing Percentage of Net Assets
| Domestic Equity Funds - 8.8% | | | |
| | | Shares | Value |
| Fidelity Series Blue Chip Growth Fund (a) | | 149 | $2,135 |
| Fidelity Series Commodity Strategy Fund (a) | | 382 | 1,950 |
| Fidelity Series Large Cap Growth Index Fund (a) | | 76 | 1,346 |
| Fidelity Series Large Cap Stock Fund (a) | | 79 | 1,501 |
| Fidelity Series Large Cap Value Index Fund (a) | | 187 | 2,876 |
| Fidelity Series Small Cap Opportunities Fund (a) | | 53 | 723 |
| Fidelity Series Value Discovery Fund (a) | | 66 | 1,063 |
| TOTAL DOMESTIC EQUITY FUNDS | | | |
| (Cost $9,184) | | | 11,594 |
|
| International Equity Funds - 14.9% | | | |
| Fidelity Series Canada Fund (a) | | 83 | 1,294 |
| Fidelity Series Emerging Markets Fund (a) | | 94 | 869 |
| Fidelity Series Emerging Markets Opportunities Fund (a) | | 425 | 7,826 |
| Fidelity Series International Growth Fund (a) | | 156 | 2,584 |
| Fidelity Series International Index Fund (a) | | 96 | 1,099 |
| Fidelity Series International Small Cap Fund (a) | | 45 | 805 |
| Fidelity Series International Value Fund (a) | | 237 | 2,609 |
| Fidelity Series Overseas Fund (a) | | 206 | 2,598 |
| TOTAL INTERNATIONAL EQUITY FUNDS | | | |
| (Cost $18,524) | | | 19,684 |
|
| Bond Funds - 64.5% | | | |
| Fidelity Series 0-5 Year Inflation-Protected Bond Index Fund (a) | | 1,918 | 19,241 |
| Fidelity Series 5+ Year Inflation-Protected Bond Index Fund (a) | | 99 | 949 |
| Fidelity Series Corporate Bond Fund (a) | | 1,029 | 10,394 |
| Fidelity Series Emerging Markets Debt Fund (a) | | 83 | 682 |
| Fidelity Series Emerging Markets Debt Local Currency Fund (a) | | 25 | 222 |
| Fidelity Series Floating Rate High Income Fund (a) | | 15 | 133 |
| Fidelity Series Government Bond Index Fund (a) | | 1,457 | 14,540 |
| Fidelity Series High Income Fund (a) | | 87 | 793 |
| Fidelity Series Inflation-Protected Bond Index Fund (a) | | 248 | 2,514 |
| Fidelity Series International Credit Fund (a) | | 7 | 61 |
| Fidelity Series International Developed Markets Bond Index Fund (a) | | 440 | 4,108 |
| Fidelity Series Investment Grade Bond Fund (a) | | 1,402 | 15,293 |
| Fidelity Series Investment Grade Securitized Fund (a) | | 1,102 | 10,715 |
| Fidelity Series Long-Term Treasury Bond Index Fund (a) | | 649 | 4,944 |
| Fidelity Series Real Estate Income Fund (a) | | 43 | 484 |
| TOTAL BOND FUNDS | | | |
| (Cost $88,550) | | | 85,073 |
|
| Short-Term Funds - 11.8% | | | |
| Fidelity Series Government Money Market Fund 0.31% (a)(b) | | 3,104 | 3,104 |
| Fidelity Series Short-Term Credit Fund (a) | | 319 | 3,109 |
| Fidelity Series Treasury Bill Index Fund (a) | | 932 | 9,312 |
| TOTAL SHORT-TERM FUNDS | | | |
| (Cost $15,603) | | | 15,525 |
| TOTAL INVESTMENT IN SECURITIES - 100.0% | | | |
| (Cost $131,861) | | | 131,876 |
| NET OTHER ASSETS (LIABILITIES) - 0.0% | | | 1 |
| NET ASSETS - 100% | | | $131,877 |
Legend
(a) Affiliated Fund
(b) The rate quoted is the annualized seven-day yield of the fund at period end.
Affiliated Underlying Funds
Fiscal year to date information regarding the Fund's investments in affiliated Underlying Funds is presented below. Exchanges between classes of the same affiliated Underlying Funds may occur. If an underlying Fund changes its name, the name presented below is the name in effect at period end.
| Fund | Value, beginning of period | Purchases(a) | Sales Proceeds(a) | Dividend Income | Realized Gain (loss) | Change in Unrealized appreciation (depreciation) | Value, end of period |
| Fidelity Series 0-5 Year Inflation-Protected Bond Index Fund | $-- | $19,320 | $34 | $82 | $-- | $(35) | $19,241 |
| Fidelity Series 5+ Year Inflation-Protected Bond Index Fund | -- | 3,843 | 2,837 | 13 | (44) | (13) | 949 |
| Fidelity Series Blue Chip Growth Fund | 2,554 | 1,273 | 1,318 | 514 | 80 | (454) | 2,135 |
| Fidelity Series Canada Fund | 792 | 425 | 122 | 25 | 6 | 193 | 1,294 |
| Fidelity Series Commodity Strategy Fund | 3,501 | 1,303 | 3,018 | 1,100 | (78) | 242 | 1,950 |
| Fidelity Series Corporate Bond Fund | 10,269 | 1,683 | 830 | 299 | (17) | (711) | 10,394 |
| Fidelity Series Emerging Markets Debt Fund | 687 | 106 | 46 | 32 | (5) | (60) | 682 |
| Fidelity Series Emerging Markets Debt Local Currency Fund | 227 | 35 | 15 | 9 | (1) | (24) | 222 |
| Fidelity Series Emerging Markets Fund | 968 | 290 | 200 | 28 | 22 | (211) | 869 |
| Fidelity Series Emerging Markets Opportunities Fund | 8,739 | 3,860 | 2,345 | 894 | 250 | (2,678) | 7,826 |
| Fidelity Series Floating Rate High Income Fund | 136 | 17 | 20 | 6 | (1) | 1 | 133 |
| Fidelity Series Government Bond Index Fund | 12,661 | 2,837 | 267 | 148 | (6) | (685) | 14,540 |
| Fidelity Series Government Money Market Fund 0.31% | 8,699 | 380 | 5,975 | 5 | -- | -- | 3,104 |
| Fidelity Series High Income Fund | 799 | 105 | 85 | 41 | (3) | (23) | 793 |
| Fidelity Series Inflation-Protected Bond Index Fund | 14,193 | 1,317 | 13,001 | 640 | 1,052 | (1,047) | 2,514 |
| Fidelity Series International Credit Fund | 63 | 3 | -- | 2 | -- | (5) | 61 |
| Fidelity Series International Developed Markets Bond Index Fund | -- | 4,294 | 8 | 1 | -- | (178) | 4,108 |
| Fidelity Series International Growth Fund | 1,947 | 1,271 | 387 | 206 | 3 | (250) | 2,584 |
| Fidelity Series International Index Fund | 813 | 441 | 122 | 27 | 3 | (36) | 1,099 |
| Fidelity Series International Small Cap Fund | 702 | 307 | 74 | 108 | -- | (130) | 805 |
| Fidelity Series International Value Fund | 1,945 | 1,109 | 471 | 130 | 5 | 21 | 2,609 |
| Fidelity Series Investment Grade Bond Fund | 14,053 | 2,510 | 442 | 332 | (6) | (822) | 15,293 |
| Fidelity Series Investment Grade Securitized Fund | 9,845 | 1,717 | 245 | 88 | (3) | (599) | 10,715 |
| Fidelity Series Large Cap Growth Index Fund | 1,612 | 429 | 900 | 48 | 192 | 13 | 1,346 |
| Fidelity Series Large Cap Stock Fund | 1,759 | 371 | 690 | 156 | 78 | (17) | 1,501 |
| Fidelity Series Large Cap Value Index Fund | 3,361 | 875 | 1,524 | 215 | 106 | 58 | 2,876 |
| Fidelity Series Long-Term Treasury Bond Index Fund | 3,451 | 2,237 | 607 | 92 | (79) | (58) | 4,944 |
| Fidelity Series Overseas Fund | 1,950 | 1,120 | 431 | 76 | 34 | (75) | 2,598 |
| Fidelity Series Real Estate Income Fund | 481 | 46 | 57 | 19 | 1 | 13 | 484 |
| Fidelity Series Short-Term Credit Fund | 4,290 | 1,102 | 2,116 | 79 | (22) | (145) | 3,109 |
| Fidelity Series Small Cap Opportunities Fund | 850 | 392 | 338 | 208 | 18 | (199) | 723 |
| Fidelity Series Treasury Bill Index Fund | 13,813 | 3,506 | 7,996 | 12 | (2) | (9) | 9,312 |
| Fidelity Series Value Discovery Fund | 1,242 | 281 | 478 | 137 | 44 | (26) | 1,063 |
| | $126,402 | $58,805 | $46,999 | $5,772 | $1,627 | $(7,949) | $131,876 |
(a) Includes the value of shares purchased or redeemed through in-kind transactions, as applicable.
Amounts in the income column in the above table include any capital gain distributions from underlying funds, which are presented in the corresponding line-item in the Statement of Operations, if applicable.
Investment Valuation
The following is a summary of the inputs used, as of March 31, 2022, involving the Fund's assets and liabilities carried at fair value. The inputs or methodology used for valuing securities may not be an indication of the risk associated with investing in those securities. For more information on valuation inputs, and their aggregation into the levels used below, please refer to the Investment Valuation section in the accompanying Notes to Financial Statements.
| | Valuation Inputs at Reporting Date: |
| Description | Total | Level 1 | Level 2 | Level 3 |
| Investments in Securities: | | | | |
| Domestic Equity Funds | $11,594 | $11,594 | $-- | $-- |
| International Equity Funds | 19,684 | 19,684 | -- | -- |
| Bond Funds | 85,073 | 85,073 | -- | -- |
| Short-Term Funds | 15,525 | 15,525 | -- | -- |
| Total Investments in Securities: | $131,876 | $131,876 | $-- | $-- |
See accompanying notes which are an integral part of the financial statements.
Fidelity Flex® Freedom Blend 2005 Fund
Financial Statements
Statement of Assets and Liabilities
| | | March 31, 2022 |
| Assets | | |
Investment in securities, at value — See accompanying schedule:
| | |
| Affiliated issuers (cost $131,861) | $131,876 | |
| Total Investment in Securities (cost $131,861) | | $131,876 |
| Receivable for investments sold | | 3,914 |
| Total assets | | 135,790 |
| Liabilities | | |
| Payable for investments purchased | $3,913 | |
| Total liabilities | | 3,913 |
| Net Assets | | $131,877 |
| Net Assets consist of: | | |
| Paid in capital | | $130,134 |
| Total accumulated earnings (loss) | | 1,743 |
| Net Assets | | $131,877 |
| Net Asset Value, offering price and redemption price per share ($131,877 ÷ 12,911 shares) | | $10.21 |
See accompanying notes which are an integral part of the financial statements.
Statement of Operations
| | | Year ended March 31, 2022 |
| Investment Income | | |
| Dividends: | | |
| Affiliated issuers | | $3,466 |
| Expenses | | |
| Independent trustees' fees and expenses | $1 | |
| Total expenses | | 1 |
| Net investment income (loss) | | 3,465 |
| Realized and Unrealized Gain (Loss) | | |
| Net realized gain (loss) on: | | |
| Investment securities: | | |
| Affiliated issuers | 1,627 | |
| Capital gain distributions from underlying funds: | | |
| Affiliated issuers | 2,306 | |
| Total net realized gain (loss) | | 3,933 |
| Change in net unrealized appreciation (depreciation) on: | | |
| Investment securities: | | |
| Affiliated issuers | (7,949) | |
| Total change in net unrealized appreciation (depreciation) | | (7,949) |
| Net gain (loss) | | (4,016) |
| Net increase (decrease) in net assets resulting from operations | | $(551) |
See accompanying notes which are an integral part of the financial statements.
Statement of Changes in Net Assets
| | Year ended March 31, 2022 | Year ended March 31, 2021 |
| Increase (Decrease) in Net Assets | | |
| Operations | | |
| Net investment income (loss) | $3,465 | $1,683 |
| Net realized gain (loss) | 3,933 | 3,320 |
| Change in net unrealized appreciation (depreciation) | (7,949) | 12,173 |
| Net increase (decrease) in net assets resulting from operations | (551) | 17,176 |
| Distributions to shareholders | (7,262) | (4,220) |
| Share transactions | | |
| Proceeds from sales of shares | 6,698 | – |
| Reinvestment of distributions | 7,262 | 4,220 |
| Cost of shares redeemed | (673) | – |
| Net increase (decrease) in net assets resulting from share transactions | 13,287 | 4,220 |
| Total increase (decrease) in net assets | 5,474 | 17,176 |
| Net Assets | | |
| Beginning of period | 126,403 | 109,227 |
| End of period | $131,877 | $126,403 |
| Other Information | | |
| Shares | | |
| Sold | 633 | – |
| Issued in reinvestment of distributions | 676 | 398 |
| Redeemed | (61) | – |
| Net increase (decrease) | 1,248 | 398 |
See accompanying notes which are an integral part of the financial statements.
Financial Highlights
Fidelity Flex Freedom Blend 2005 Fund
| | | | | | |
| Years ended March 31, | 2022 | 2021 | 2020 | 2019 | 2018 A |
| Selected Per–Share Data | | | | | |
| Net asset value, beginning of period | $10.84 | $9.70 | $10.05 | $10.21 | $10.00 |
| Income from Investment Operations | | | | | |
| Net investment income (loss)B,C | .29 | .15 | .24 | .25 | .18 |
| Net realized and unrealized gain (loss) | (.31) | 1.36 | (.09) | .08 | .25 |
| Total from investment operations | (.02) | 1.51 | .15 | .33 | .43 |
| Distributions from net investment income | (.29) | (.16) | (.25) | (.25) | (.14) |
| Distributions from net realized gain | (.32) | (.21) | (.25) | (.24) | (.08) |
| Total distributions | (.61) | (.37) | (.50) | (.49) | (.22) |
| Net asset value, end of period | $10.21 | $10.84 | $9.70 | $10.05 | $10.21 |
| Total ReturnD | (.41)% | 15.70% | 1.29% | 3.43% | 4.29% |
| Ratios to Average Net AssetsC,E,F | | | | | |
| Expenses before reductions | - %G | - %G | - %G | - %G | - %H |
| Expenses net of fee waivers, if any | - %G | - %G | - %G | - %G | - %H |
| Expenses net of all reductions | - %G | - %G | - %G | - %G | - %H |
| Net investment income (loss) | 2.64% | 1.39% | 2.31% | 2.49% | 2.21%H |
| Supplemental Data | | | | | |
| Net assets, end of period (000 omitted) | $132 | $126 | $109 | $108 | $104 |
| Portfolio turnover rateI | 36% | 25% | 65% | 23% | 13%H |
A For the period June 8, 2017 (commencement of operations) through March 31, 2018.
B Calculated based on average shares outstanding during the period.
C Net investment income (loss) is affected by the timing of the declaration of dividends by any underlying mutual funds or exchange-traded funds (ETFs). Net investment income (loss) of any such underlying funds is not included in the Fund's net investment income (loss) ratio.
D Total returns for periods of less than one year are not annualized.
E Fees and expenses of any underlying mutual funds or exchange-traded funds (ETFs) are not included in the Fund's expense ratio. The Fund indirectly bears its proportionate share of these expenses.
F Expense ratios reflect operating expenses of the class. Expenses before reductions do not reflect amounts reimbursed, waived, or reduced through arrangements with the investment adviser, brokerage services, or other offset arrangements, if applicable, and do not represent the amount paid by the class during periods when reimbursements, waivers or reductions occur.
G Amount represents less than .005%.
H Annualized
I Amount does not include the portfolio activity of any underlying mutual funds or exchange-traded funds (ETFs).
See accompanying notes which are an integral part of the financial statements.
Fidelity Flex® Freedom Blend 2010 Fund
Investment Summary (Unaudited)
The information in the following tables is based on the direct investments of the Fund.
Top Holdings as of March 31, 2022
| | % of fund's net assets |
| Fidelity Series Investment Grade Bond Fund | 10.6 |
| Fidelity Series 0-5 Year Inflation-Protected Bond Index Fund | 10.1 |
| Fidelity Series Government Bond Index Fund | 10.0 |
| Fidelity Series Investment Grade Securitized Fund | 7.4 |
| Fidelity Series Corporate Bond Fund | 7.2 |
| Fidelity Series Emerging Markets Opportunities Fund | 6.8 |
| Fidelity Series Treasury Bill Index Fund | 5.3 |
| Fidelity Series Long-Term Treasury Bond Index Fund | 4.0 |
| Fidelity Series Large Cap Value Index Fund | 3.8 |
| Fidelity Series International Developed Markets Bond Index Fund | 3.1 |
| | 68.3 |
Asset Allocation (% of fund's net assets)
| Period end |
| | Domestic Equity Funds | 14.1% |
| | International Equity Funds | 18.5% |
| | Bond Funds | 58.6% |
| | Short-Term Funds | 8.8% |

Domestic Equity Funds category includes Fidelity Series Commodity Strategy Fund which invests in commodity-related investments.
Fidelity Flex® Freedom Blend 2010 Fund
Schedule of Investments March 31, 2022
Showing Percentage of Net Assets
| Domestic Equity Funds - 14.1% | | | |
| | | Shares | Value |
| Fidelity Series Blue Chip Growth Fund (a) | | 263 | $3,773 |
| Fidelity Series Commodity Strategy Fund (a) | | 391 | 1,998 |
| Fidelity Series Large Cap Growth Index Fund (a) | | 135 | 2,378 |
| Fidelity Series Large Cap Stock Fund (a) | | 140 | 2,652 |
| Fidelity Series Large Cap Value Index Fund (a) | | 331 | 5,082 |
| Fidelity Series Small Cap Opportunities Fund (a) | | 94 | 1,277 |
| Fidelity Series Value Discovery Fund (a) | | 117 | 1,878 |
| TOTAL DOMESTIC EQUITY FUNDS | | | |
| (Cost $15,386) | | | 19,038 |
|
| International Equity Funds - 18.5% | | | |
| Fidelity Series Canada Fund (a) | | 112 | 1,732 |
| Fidelity Series Emerging Markets Fund (a) | | 111 | 1,026 |
| Fidelity Series Emerging Markets Opportunities Fund (a) | | 502 | 9,243 |
| Fidelity Series International Growth Fund (a) | | 209 | 3,458 |
| Fidelity Series International Index Fund (a) | | 129 | 1,472 |
| Fidelity Series International Small Cap Fund (a) | | 60 | 1,077 |
| Fidelity Series International Value Fund (a) | | 317 | 3,493 |
| Fidelity Series Overseas Fund (a) | | 276 | 3,477 |
| TOTAL INTERNATIONAL EQUITY FUNDS | | | |
| (Cost $23,394) | | | 24,978 |
|
| Bond Funds - 58.6% | | | |
| Fidelity Series 0-5 Year Inflation-Protected Bond Index Fund (a) | | 1,362 | 13,662 |
| Fidelity Series 5+ Year Inflation-Protected Bond Index Fund (a) | | 397 | 3,813 |
| Fidelity Series Corporate Bond Fund (a) | | 958 | 9,674 |
| Fidelity Series Emerging Markets Debt Fund (a) | | 84 | 697 |
| Fidelity Series Emerging Markets Debt Local Currency Fund (a) | | 25 | 227 |
| Fidelity Series Floating Rate High Income Fund (a) | | 15 | 137 |
| Fidelity Series Government Bond Index Fund (a) | | 1,356 | 13,533 |
| Fidelity Series High Income Fund (a) | | 89 | 810 |
| Fidelity Series Inflation-Protected Bond Index Fund (a) | | 214 | 2,167 |
| Fidelity Series International Credit Fund (a) | | 7 | 62 |
| Fidelity Series International Developed Markets Bond Index Fund (a) | | 452 | 4,214 |
| Fidelity Series Investment Grade Bond Fund (a) | | 1,305 | 14,232 |
| Fidelity Series Investment Grade Securitized Fund (a) | | 1,026 | 9,972 |
| Fidelity Series Long-Term Treasury Bond Index Fund (a) | | 699 | 5,328 |
| Fidelity Series Real Estate Income Fund (a) | | 44 | 496 |
| TOTAL BOND FUNDS | | | |
| (Cost $82,544) | | | 79,024 |
|
| Short-Term Funds - 8.8% | | | |
| Fidelity Series Government Money Market Fund 0.31% (a)(b) | | 2,376 | 2,376 |
| Fidelity Series Short-Term Credit Fund (a) | | 244 | 2,381 |
| Fidelity Series Treasury Bill Index Fund (a) | | 714 | 7,129 |
| TOTAL SHORT-TERM FUNDS | | | |
| (Cost $11,944) | | | 11,886 |
| TOTAL INVESTMENT IN SECURITIES - 100.0% | | | |
| (Cost $133,268) | | | 134,926 |
| NET OTHER ASSETS (LIABILITIES) - 0.0% | | | (1) |
| NET ASSETS - 100% | | | $134,925 |
Legend
(a) Affiliated Fund
(b) The rate quoted is the annualized seven-day yield of the fund at period end.
Affiliated Underlying Funds
Fiscal year to date information regarding the Fund's investments in affiliated Underlying Funds is presented below. Exchanges between classes of the same affiliated Underlying Funds may occur. If an underlying Fund changes its name, the name presented below is the name in effect at period end.
| Fund | Value, beginning of period | Purchases(a) | Sales Proceeds(a) | Dividend Income | Realized Gain (loss) | Change in Unrealized appreciation (depreciation) | Value, end of period |
| Fidelity Series 0-5 Year Inflation-Protected Bond Index Fund | $-- | $13,697 | $3 | $50 | $-- | $(24) | $13,662 |
| Fidelity Series 5+ Year Inflation-Protected Bond Index Fund | -- | 4,599 | 627 | 24 | (28) | (131) | 3,813 |
| Fidelity Series Blue Chip Growth Fund | 4,251 | 2,073 | 1,893 | 878 | 108 | (766) | 3,773 |
| Fidelity Series Canada Fund | 1,142 | 472 | 159 | 35 | 8 | 269 | 1,732 |
| Fidelity Series Commodity Strategy Fund | 3,632 | 1,328 | 3,120 | 1,149 | (118) | 276 | 1,998 |
| Fidelity Series Corporate Bond Fund | 9,655 | 1,557 | 855 | 282 | (19) | (664) | 9,674 |
| Fidelity Series Emerging Markets Debt Fund | 713 | 99 | 48 | 33 | (6) | (61) | 697 |
| Fidelity Series Emerging Markets Debt Local Currency Fund | 236 | 33 | 16 | 9 | (1) | (25) | 227 |
| Fidelity Series Emerging Markets Fund | 1,148 | 310 | 203 | 34 | 22 | (251) | 1,026 |
| Fidelity Series Emerging Markets Opportunities Fund | 10,376 | 4,252 | 2,446 | 1,079 | 259 | (3,198) | 9,243 |
| Fidelity Series Floating Rate High Income Fund | 140 | 17 | 20 | 6 | (1) | 1 | 137 |
| Fidelity Series Government Bond Index Fund | 11,904 | 2,622 | 346 | 139 | (12) | (635) | 13,533 |
| Fidelity Series Government Money Market Fund 0.31% | 7,262 | 246 | 5,132 | 4 | -- | -- | 2,376 |
| Fidelity Series High Income Fund | 825 | 97 | 85 | 46 | (3) | (24) | 810 |
| Fidelity Series Inflation-Protected Bond Index Fund | 12,732 | 1,117 | 11,699 | 564 | 923 | (906) | 2,167 |
| Fidelity Series International Credit Fund | 64 | 3 | -- | 2 | -- | (5) | 62 |
| Fidelity Series International Developed Markets Bond Index Fund | -- | 4,399 | -- | 1 | -- | (185) | 4,214 |
| Fidelity Series International Growth Fund | 2,809 | 1,469 | 499 | 281 | 3 | (324) | 3,458 |
| Fidelity Series International Index Fund | 1,173 | 498 | 158 | 37 | 4 | (45) | 1,472 |
| Fidelity Series International Small Cap Fund | 1,013 | 331 | 96 | 146 | 1 | (172) | 1,077 |
| Fidelity Series International Value Fund | 2,806 | 1,272 | 629 | 176 | 8 | 36 | 3,493 |
| Fidelity Series Investment Grade Bond Fund | 13,214 | 2,314 | 519 | 313 | (9) | (768) | 14,232 |
| Fidelity Series Investment Grade Securitized Fund | 9,257 | 1,599 | 320 | 83 | (5) | (559) | 9,972 |
| Fidelity Series Large Cap Growth Index Fund | 2,683 | 693 | 1,337 | 82 | 258 | 81 | 2,378 |
| Fidelity Series Large Cap Stock Fund | 2,930 | 492 | 871 | 266 | 92 | 9 | 2,652 |
| Fidelity Series Large Cap Value Index Fund | 5,596 | 1,358 | 2,146 | 369 | 131 | 143 | 5,082 |
| Fidelity Series Long-Term Treasury Bond Index Fund | 3,579 | 2,527 | 615 | 97 | (97) | (66) | 5,328 |
| Fidelity Series Overseas Fund | 2,814 | 1,336 | 634 | 104 | 47 | (86) | 3,477 |
| Fidelity Series Real Estate Income Fund | 498 | 40 | 57 | 20 | 1 | 14 | 496 |
| Fidelity Series Short-Term Credit Fund | 3,580 | 878 | 1,943 | 65 | (18) | (116) | 2,381 |
| Fidelity Series Small Cap Opportunities Fund | 1,415 | 638 | 464 | 356 | 19 | (331) | 1,277 |
| Fidelity Series Treasury Bill Index Fund | 11,541 | 2,705 | 7,108 | 9 | (2) | (7) | 7,129 |
| Fidelity Series Value Discovery Fund | 2,068 | 438 | 655 | 234 | 52 | (25) | 1,878 |
| | $131,056 | $55,509 | $44,703 | $6,973 | $1,617 | $(8,545) | $134,926 |
(a) Includes the value of shares purchased or redeemed through in-kind transactions, as applicable.
Amounts in the income column in the above table include any capital gain distributions from underlying funds, which are presented in the corresponding line-item in the Statement of Operations, if applicable.
Investment Valuation
The following is a summary of the inputs used, as of March 31, 2022, involving the Fund's assets and liabilities carried at fair value. The inputs or methodology used for valuing securities may not be an indication of the risk associated with investing in those securities. For more information on valuation inputs, and their aggregation into the levels used below, please refer to the Investment Valuation section in the accompanying Notes to Financial Statements.
| | Valuation Inputs at Reporting Date: |
| Description | Total | Level 1 | Level 2 | Level 3 |
| Investments in Securities: | | | | |
| Domestic Equity Funds | $19,038 | $19,038 | $-- | $-- |
| International Equity Funds | 24,978 | 24,978 | -- | -- |
| Bond Funds | 79,024 | 79,024 | -- | -- |
| Short-Term Funds | 11,886 | 11,886 | -- | -- |
| Total Investments in Securities: | $134,926 | $134,926 | $-- | $-- |
See accompanying notes which are an integral part of the financial statements.
Fidelity Flex® Freedom Blend 2010 Fund
Financial Statements
Statement of Assets and Liabilities
| | | March 31, 2022 |
| Assets | | |
Investment in securities, at value — See accompanying schedule:
| | |
| Affiliated issuers (cost $133,268) | $134,926 | |
| Total Investment in Securities (cost $133,268) | | $134,926 |
| Receivable for investments sold | | 3,469 |
| Total assets | | 138,395 |
| Liabilities | | |
| Payable for investments purchased | $3,470 | |
| Total liabilities | | 3,470 |
| Net Assets | | $134,925 |
| Net Assets consist of: | | |
| Paid in capital | | $131,271 |
| Total accumulated earnings (loss) | | 3,654 |
| Net Assets | | $134,925 |
| Net Asset Value, offering price and redemption price per share ($134,925 ÷ 12,995 shares) | | $10.38 |
See accompanying notes which are an integral part of the financial statements.
Statement of Operations
| | | Year ended March 31, 2022 |
| Investment Income | | |
| Dividends: | | |
| Affiliated issuers | | $3,640 |
| Expenses | | |
| Independent trustees' fees and expenses | $1 | |
| Total expenses | | 1 |
| Net investment income (loss) | | 3,639 |
| Realized and Unrealized Gain (Loss) | | |
| Net realized gain (loss) on: | | |
| Investment securities: | | |
| Affiliated issuers | 1,617 | |
| Capital gain distributions from underlying funds: | | |
| Affiliated issuers | 3,333 | |
| Total net realized gain (loss) | | 4,950 |
| Change in net unrealized appreciation (depreciation) on: | | |
| Investment securities: | | |
| Affiliated issuers | (8,545) | |
| Total change in net unrealized appreciation (depreciation) | | (8,545) |
| Net gain (loss) | | (3,595) |
| Net increase (decrease) in net assets resulting from operations | | $44 |
See accompanying notes which are an integral part of the financial statements.
Statement of Changes in Net Assets
| | Year ended March 31, 2022 | Year ended March 31, 2021 |
| Increase (Decrease) in Net Assets | | |
| Operations | | |
| Net investment income (loss) | $3,639 | $1,782 |
| Net realized gain (loss) | 4,950 | 4,170 |
| Change in net unrealized appreciation (depreciation) | (8,545) | 16,653 |
| Net increase (decrease) in net assets resulting from operations | 44 | 22,605 |
| Distributions to shareholders | (8,595) | (4,973) |
| Share transactions | | |
| Proceeds from sales of shares | 3,866 | – |
| Reinvestment of distributions | 8,595 | 4,973 |
| Cost of shares redeemed | (40) | – |
| Net increase (decrease) in net assets resulting from share transactions | 12,421 | 4,973 |
| Total increase (decrease) in net assets | 3,870 | 22,605 |
| Net Assets | | |
| Beginning of period | 131,055 | 108,450 |
| End of period | $134,925 | $131,055 |
| Other Information | | |
| Shares | | |
| Sold | 361 | – |
| Issued in reinvestment of distributions | 784 | 467 |
| Redeemed | (4) | – |
| Net increase (decrease) | 1,141 | 467 |
See accompanying notes which are an integral part of the financial statements.
Financial Highlights
Fidelity Flex Freedom Blend 2010 Fund
| | | | | | |
| Years ended March 31, | 2022 | 2021 | 2020 | 2019 | 2018 A |
| Selected Per–Share Data | | | | | |
| Net asset value, beginning of period | $11.06 | $9.52 | $10.07 | $10.28 | $10.00 |
| Income from Investment Operations | | | | | |
| Net investment income (loss)B,C | .30 | .15 | .24 | .25 | .19 |
| Net realized and unrealized gain (loss) | (.27) | 1.82 | (.24) | .07 | .33 |
| Total from investment operations | .03 | 1.97 | –D | .32 | .52 |
| Distributions from net investment income | (.30) | (.17) | (.25) | (.25) | (.15) |
| Distributions from net realized gain | (.41) | (.27) | (.30) | (.29) | (.10) |
| Total distributions | (.71) | (.43)E | (.55) | (.53)E | (.24)E |
| Net asset value, end of period | $10.38 | $11.06 | $9.52 | $10.07 | $10.28 |
| Total ReturnF | .02% | 20.94% | (.34)% | 3.40% | 5.20% |
| Ratios to Average Net AssetsC,G,H | | | | | |
| Expenses before reductions | - %I | - %I | - %I | - %I | - %J |
| Expenses net of fee waivers, if any | - %I | - %I | - %I | - %I | - %J |
| Expenses net of all reductions | - %I | - %I | - %I | - %I | - %J |
| Net investment income (loss) | 2.67% | 1.45% | 2.32% | 2.46% | 2.22%J |
| Supplemental Data | | | | | |
| Net assets, end of period (000 omitted) | $135 | $131 | $108 | $109 | $105 |
| Portfolio turnover rateK | 33% | 26% | 65% | 23% | 13%J |
A For the period June 8, 2017 (commencement of operations) through March 31, 2018.
B Calculated based on average shares outstanding during the period.
C Net investment income (loss) is affected by the timing of the declaration of dividends by any underlying mutual funds or exchange-traded funds (ETFs). Net investment income (loss) of any such underlying funds is not included in the Fund's net investment income (loss) ratio.
D Amount represents less than $.005 per share.
E Total distributions per share do not sum due to rounding.
F Total returns for periods of less than one year are not annualized.
G Fees and expenses of any underlying mutual funds or exchange-traded funds (ETFs) are not included in the Fund's expense ratio. The Fund indirectly bears its proportionate share of these expenses.
H Expense ratios reflect operating expenses of the class. Expenses before reductions do not reflect amounts reimbursed, waived, or reduced through arrangements with the investment adviser, brokerage services, or other offset arrangements, if applicable, and do not represent the amount paid by the class during periods when reimbursements, waivers or reductions occur.
I Amount represents less than .005%.
J Annualized
K Amount does not include the portfolio activity of any underlying mutual funds or exchange-traded funds (ETFs).
See accompanying notes which are an integral part of the financial statements.
Fidelity Flex® Freedom Blend 2015 Fund
Investment Summary (Unaudited)
The information in the following tables is based on the direct investments of the Fund.
Top Holdings as of March 31, 2022
| | % of fund's net assets |
| Fidelity Series Investment Grade Bond Fund | 9.5 |
| Fidelity Series Government Bond Index Fund | 9.0 |
| Fidelity Series Emerging Markets Opportunities Fund | 7.8 |
| Fidelity Series Investment Grade Securitized Fund | 6.6 |
| Fidelity Series Corporate Bond Fund | 6.4 |
| Fidelity Series 0-5 Year Inflation-Protected Bond Index Fund | 5.7 |
| Fidelity Series Large Cap Value Index Fund | 5.4 |
| Fidelity Series 5+ Year Inflation-Protected Bond Index Fund | 4.9 |
| Fidelity Series Long-Term Treasury Bond Index Fund | 4.2 |
| Fidelity Series Blue Chip Growth Fund | 4.0 |
| | 63.5 |
Asset Allocation (% of fund's net assets)
| Period end |
| | Domestic Equity Funds | 19.6% |
| | International Equity Funds | 22.1% |
| | Bond Funds | 52.6% |
| | Short-Term Funds | 5.7% |

Domestic Equity Funds category includes Fidelity Series Commodity Strategy Fund which invests in commodity-related investments.
Fidelity Flex® Freedom Blend 2015 Fund
Schedule of Investments March 31, 2022
Showing Percentage of Net Assets
| Domestic Equity Funds - 19.6% | | | |
| | | Shares | Value |
| Fidelity Series Blue Chip Growth Fund (a) | | 473 | $6,799 |
| Fidelity Series Commodity Strategy Fund (a) | | 493 | 2,518 |
| Fidelity Series Large Cap Growth Index Fund (a) | | 244 | 4,286 |
| Fidelity Series Large Cap Stock Fund (a) | | 251 | 4,780 |
| Fidelity Series Large Cap Value Index Fund (a) | | 596 | 9,158 |
| Fidelity Series Small Cap Opportunities Fund (a) | | 169 | 2,301 |
| Fidelity Series Value Discovery Fund (a) | | 211 | 3,384 |
| TOTAL DOMESTIC EQUITY FUNDS | | | |
| (Cost $27,906) | | | 33,226 |
|
| International Equity Funds - 22.1% | | | |
| Fidelity Series Canada Fund (a) | | 173 | 2,683 |
| Fidelity Series Emerging Markets Fund (a) | | 158 | 1,467 |
| Fidelity Series Emerging Markets Opportunities Fund (a) | | 719 | 13,222 |
| Fidelity Series International Growth Fund (a) | | 324 | 5,379 |
| Fidelity Series International Index Fund (a) | | 199 | 2,277 |
| Fidelity Series International Small Cap Fund (a) | | 94 | 1,682 |
| Fidelity Series International Value Fund (a) | | 495 | 5,454 |
| Fidelity Series Overseas Fund (a) | | 430 | 5,427 |
| TOTAL INTERNATIONAL EQUITY FUNDS | | | |
| (Cost $36,114) | | | 37,591 |
|
| Bond Funds - 52.6% | | | |
| Fidelity Series 0-5 Year Inflation-Protected Bond Index Fund (a) | | 958 | 9,607 |
| Fidelity Series 5+ Year Inflation-Protected Bond Index Fund (a) | | 865 | 8,300 |
| Fidelity Series Corporate Bond Fund (a) | | 1,084 | 10,953 |
| Fidelity Series Emerging Markets Debt Fund (a) | | 106 | 875 |
| Fidelity Series Emerging Markets Debt Local Currency Fund (a) | | 32 | 285 |
| Fidelity Series Floating Rate High Income Fund (a) | | 19 | 172 |
| Fidelity Series Government Bond Index Fund (a) | | 1,535 | 15,320 |
| Fidelity Series High Income Fund (a) | | 112 | 1,020 |
| Fidelity Series Inflation-Protected Bond Index Fund (a) | | 224 | 2,274 |
| Fidelity Series International Credit Fund (a) | | 7 | 62 |
| Fidelity Series International Developed Markets Bond Index Fund (a) | | 575 | 5,364 |
| Fidelity Series Investment Grade Bond Fund (a) | | 1,477 | 16,115 |
| Fidelity Series Investment Grade Securitized Fund (a) | | 1,162 | 11,291 |
| Fidelity Series Long-Term Treasury Bond Index Fund (a) | | 927 | 7,061 |
| Fidelity Series Real Estate Income Fund (a) | | 55 | 622 |
| TOTAL BOND FUNDS | | | |
| (Cost $93,474) | | | 89,321 |
|
| Short-Term Funds - 5.7% | | | |
| Fidelity Series Government Money Market Fund 0.31% (a)(b) | | 1,928 | 1,928 |
| Fidelity Series Short-Term Credit Fund (a) | | 198 | 1,932 |
| Fidelity Series Treasury Bill Index Fund (a) | | 579 | 5,785 |
| TOTAL SHORT-TERM FUNDS | | | |
| (Cost $9,693) | | | 9,645 |
| TOTAL INVESTMENT IN SECURITIES - 100.0% | | | |
| (Cost $167,187) | | | 169,783 |
| NET OTHER ASSETS (LIABILITIES) - 0.0% | | | (1) |
| NET ASSETS - 100% | | | $169,782 |
Legend
(a) Affiliated Fund
(b) The rate quoted is the annualized seven-day yield of the fund at period end.
Affiliated Underlying Funds
Fiscal year to date information regarding the Fund's investments in affiliated Underlying Funds is presented below. Exchanges between classes of the same affiliated Underlying Funds may occur. If an underlying Fund changes its name, the name presented below is the name in effect at period end.
| Fund | Value, beginning of period | Purchases(a) | Sales Proceeds(a) | Dividend Income | Realized Gain (loss) | Change in Unrealized appreciation (depreciation) | Value, end of period |
| Fidelity Series 0-5 Year Inflation-Protected Bond Index Fund | $-- | $9,633 | $7 | $31 | $-- | $(14) | $9,607 |
| Fidelity Series 5+ Year Inflation-Protected Bond Index Fund | -- | 9,057 | 452 | 48 | (21) | (284) | 8,300 |
| Fidelity Series Blue Chip Growth Fund | 6,080 | 4,398 | 2,606 | 1,336 | 38 | (1,111) | 6,799 |
| Fidelity Series Canada Fund | 1,517 | 998 | 226 | 49 | 2 | 392 | 2,683 |
| Fidelity Series Commodity Strategy Fund | 3,763 | 2,120 | 3,587 | 1,245 | (109) | 331 | 2,518 |
| Fidelity Series Corporate Bond Fund | 8,894 | 3,726 | 909 | 279 | (22) | (736) | 10,953 |
| Fidelity Series Emerging Markets Debt Fund | 739 | 281 | 63 | 37 | (6) | (76) | 875 |
| Fidelity Series Emerging Markets Debt Local Currency Fund | 245 | 92 | 21 | 11 | (2) | (29) | 285 |
| Fidelity Series Emerging Markets Fund | 1,342 | 647 | 214 | 44 | 16 | (324) | 1,467 |
| Fidelity Series Emerging Markets Opportunities Fund | 12,136 | 7,546 | 2,535 | 1,397 | 177 | (4,102) | 13,222 |
| Fidelity Series Floating Rate High Income Fund | 144 | 54 | 25 | 7 | (1) | -- | 172 |
| Fidelity Series Government Bond Index Fund | 10,967 | 5,602 | 528 | 139 | (21) | (700) | 15,320 |
| Fidelity Series Government Money Market Fund 0.31% | 5,693 | 808 | 4,573 | 3 | -- | -- | 1,928 |
| Fidelity Series High Income Fund | 854 | 305 | 106 | 51 | (3) | (30) | 1,020 |
| Fidelity Series Inflation-Protected Bond Index Fund | 11,440 | 2,551 | 11,704 | 544 | 749 | (762) | 2,274 |
| Fidelity Series International Credit Fund | 65 | 2 | -- | 2 | -- | (5) | 62 |
| Fidelity Series International Developed Markets Bond Index Fund | -- | 5,590 | 4 | 2 | -- | (222) | 5,364 |
| Fidelity Series International Growth Fund | 3,732 | 2,829 | 674 | 398 | (14) | (494) | 5,379 |
| Fidelity Series International Index Fund | 1,558 | 989 | 198 | 53 | 2 | (74) | 2,277 |
| Fidelity Series International Small Cap Fund | 1,346 | 724 | 127 | 207 | (7) | (254) | 1,682 |
| Fidelity Series International Value Fund | 3,728 | 2,529 | 842 | 249 | 2 | 37 | 5,454 |
| Fidelity Series Investment Grade Bond Fund | 12,173 | 5,469 | 669 | 311 | (18) | (840) | 16,115 |
| Fidelity Series Investment Grade Securitized Fund | 8,528 | 3,829 | 455 | 85 | (9) | (602) | 11,291 |
| Fidelity Series Large Cap Growth Index Fund | 3,837 | 1,862 | 1,890 | 129 | 192 | 285 | 4,286 |
| Fidelity Series Large Cap Stock Fund | 4,191 | 1,766 | 1,310 | 406 | 35 | 98 | 4,780 |
| Fidelity Series Large Cap Value Index Fund | 8,005 | 3,675 | 2,900 | 595 | 25 | 353 | 9,158 |
| Fidelity Series Long-Term Treasury Bond Index Fund | 3,708 | 4,292 | 674 | 110 | (94) | (171) | 7,061 |
| Fidelity Series Overseas Fund | 3,738 | 2,624 | 825 | 147 | 42 | (152) | 5,427 |
| Fidelity Series Real Estate Income Fund | 516 | 160 | 67 | 22 | (1) | 14 | 622 |
| Fidelity Series Short-Term Credit Fund | 2,807 | 1,256 | 2,021 | 52 | (17) | (93) | 1,932 |
| Fidelity Series Small Cap Opportunities Fund | 2,025 | 1,377 | 613 | 539 | (3) | (485) | 2,301 |
| Fidelity Series Treasury Bill Index Fund | 9,048 | 3,826 | 7,082 | 8 | (1) | (6) | 5,785 |
| Fidelity Series Value Discovery Fund | 2,958 | 1,344 | 926 | 385 | 15 | (7) | 3,384 |
| | $135,777 | $91,961 | $48,833 | $8,921 | $946 | $(10,063) | $169,783 |
(a) Includes the value of shares purchased or redeemed through in-kind transactions, as applicable.
Amounts in the income column in the above table include any capital gain distributions from underlying funds, which are presented in the corresponding line-item in the Statement of Operations, if applicable.
Investment Valuation
The following is a summary of the inputs used, as of March 31, 2022, involving the Fund's assets and liabilities carried at fair value. The inputs or methodology used for valuing securities may not be an indication of the risk associated with investing in those securities. For more information on valuation inputs, and their aggregation into the levels used below, please refer to the Investment Valuation section in the accompanying Notes to Financial Statements.
| | Valuation Inputs at Reporting Date: |
| Description | Total | Level 1 | Level 2 | Level 3 |
| Investments in Securities: | | | | |
| Domestic Equity Funds | $33,226 | $33,226 | $-- | $-- |
| International Equity Funds | 37,591 | 37,591 | -- | -- |
| Bond Funds | 89,321 | 89,321 | -- | -- |
| Short-Term Funds | 9,645 | 9,645 | -- | -- |
| Total Investments in Securities: | $169,783 | $169,783 | $-- | $-- |
See accompanying notes which are an integral part of the financial statements.
Fidelity Flex® Freedom Blend 2015 Fund
Financial Statements
Statement of Assets and Liabilities
| | | March 31, 2022 |
| Assets | | |
Investment in securities, at value — See accompanying schedule:
| | |
| Affiliated issuers (cost $167,187) | $169,783 | |
| Total Investment in Securities (cost $167,187) | | $169,783 |
| Receivable for investments sold | | 4,208 |
| Receivable for fund shares sold | | 208 |
| Total assets | | 174,199 |
| Liabilities | | |
| Payable for investments purchased | $4,417 | |
| Total liabilities | | 4,417 |
| Net Assets | | $169,782 |
| Net Assets consist of: | | |
| Paid in capital | | $164,908 |
| Total accumulated earnings (loss) | | 4,874 |
| Net Assets | | $169,782 |
| Net Asset Value, offering price and redemption price per share ($169,782 ÷ 15,981 shares) | | $10.62 |
See accompanying notes which are an integral part of the financial statements.
Statement of Operations
| | | Year ended March 31, 2022 |
| Investment Income | | |
| Dividends: | | |
| Affiliated issuers | | $4,118 |
| Expenses | | |
| Independent trustees' fees and expenses | $1 | |
| Total expenses | | 1 |
| Net investment income (loss) | | 4,117 |
| Realized and Unrealized Gain (Loss) | | |
| Net realized gain (loss) on: | | |
| Investment securities: | | |
| Affiliated issuers | 946 | |
| Capital gain distributions from underlying funds: | | |
| Affiliated issuers | 4,803 | |
| Total net realized gain (loss) | | 5,749 |
| Change in net unrealized appreciation (depreciation) on: | | |
| Investment securities: | | |
| Affiliated issuers | (10,063) | |
| Total change in net unrealized appreciation (depreciation) | | (10,063) |
| Net gain (loss) | | (4,314) |
| Net increase (decrease) in net assets resulting from operations | | $(197) |
See accompanying notes which are an integral part of the financial statements.
Statement of Changes in Net Assets
| | Year ended March 31, 2022 | Year ended March 31, 2021 |
| Increase (Decrease) in Net Assets | | |
| Operations | | |
| Net investment income (loss) | $4,117 | $1,880 |
| Net realized gain (loss) | 5,749 | 5,076 |
| Change in net unrealized appreciation (depreciation) | (10,063) | 21,211 |
| Net increase (decrease) in net assets resulting from operations | (197) | 28,167 |
| Distributions to shareholders | (9,990) | (5,633) |
| Share transactions | | |
| Proceeds from sales of shares | 34,434 | – |
| Reinvestment of distributions | 9,990 | 5,633 |
| Cost of shares redeemed | (233) | – |
| Net increase (decrease) in net assets resulting from share transactions | 44,191 | 5,633 |
| Total increase (decrease) in net assets | 34,004 | 28,167 |
| Net Assets | | |
| Beginning of period | 135,778 | 107,611 |
| End of period | $169,782 | $135,778 |
| Other Information | | |
| Shares | | |
| Sold | 3,087 | – |
| Issued in reinvestment of distributions | 887 | 524 |
| Redeemed | (21) | – |
| Net increase (decrease) | 3,953 | 524 |
See accompanying notes which are an integral part of the financial statements.
Financial Highlights
Fidelity Flex Freedom Blend 2015 Fund
| | | | | | |
| Years ended March 31, | 2022 | 2021 | 2020 | 2019 | 2018 A |
| Selected Per–Share Data | | | | | |
| Net asset value, beginning of period | $11.29 | $9.35 | $10.09 | $10.35 | $10.00 |
| Income from Investment Operations | | | | | |
| Net investment income (loss)B,C | .31 | .16 | .24 | .24 | .19 |
| Net realized and unrealized gain (loss) | (.22) | 2.27 | (.39) | .08 | .42 |
| Total from investment operations | .09 | 2.43 | (.15) | .32 | .61 |
| Distributions from net investment income | (.30) | (.17) | (.25) | (.24) | (.15) |
| Distributions from net realized gain | (.46) | (.31) | (.34) | (.33) | (.11) |
| Total distributions | (.76) | (.49)D | (.59) | (.58)D | (.26) |
| Net asset value, end of period | $10.62 | $11.29 | $9.35 | $10.09 | $10.35 |
| Total ReturnE | .49% | 26.24% | (1.91)% | 3.37% | 6.09% |
| Ratios to Average Net AssetsC,F,G | | | | | |
| Expenses before reductions | - %H | - %H | - %H | - %H | - %I |
| Expenses net of fee waivers, if any | - %H | - %H | - %H | - %H | - %I |
| Expenses net of all reductions | - %H | - %H | - %H | - %H | - %I |
| Net investment income (loss) | 2.72% | 1.50% | 2.34% | 2.43% | 2.21%I |
| Supplemental Data | | | | | |
| Net assets, end of period (000 omitted) | $170 | $136 | $108 | $110 | $106 |
| Portfolio turnover rateJ | 32% | 26% | 66% | 23% | 14%I |
A For the period June 8, 2017 (commencement of operations) through March 31, 2018.
B Calculated based on average shares outstanding during the period.
C Net investment income (loss) is affected by the timing of the declaration of dividends by any underlying mutual funds or exchange-traded funds (ETFs). Net investment income (loss) of any such underlying funds is not included in the Fund's net investment income (loss) ratio.
D Total distributions per share do not sum due to rounding.
E Total returns for periods of less than one year are not annualized.
F Fees and expenses of any underlying mutual funds or exchange-traded funds (ETFs) are not included in the Fund's expense ratio. The Fund indirectly bears its proportionate share of these expenses.
G Expense ratios reflect operating expenses of the class. Expenses before reductions do not reflect amounts reimbursed, waived, or reduced through arrangements with the investment adviser, brokerage services, or other offset arrangements, if applicable, and do not represent the amount paid by the class during periods when reimbursements, waivers or reductions occur.
H Amount represents less than .005%.
I Annualized
J Amount does not include the portfolio activity of any underlying mutual funds or exchange-traded funds (ETFs).
See accompanying notes which are an integral part of the financial statements.
Fidelity Flex® Freedom Blend 2020 Fund
Investment Summary (Unaudited)
The information in the following tables is based on the direct investments of the Fund.
Top Holdings as of March 31, 2022
| | % of fund's net assets |
| Fidelity Series Emerging Markets Opportunities Fund | 8.7 |
| Fidelity Series Investment Grade Bond Fund | 8.4 |
| Fidelity Series Government Bond Index Fund | 8.0 |
| Fidelity Series Large Cap Value Index Fund | 7.0 |
| Fidelity Series 5+ Year Inflation-Protected Bond Index Fund | 6.9 |
| Fidelity Series Investment Grade Securitized Fund | 5.9 |
| Fidelity Series Corporate Bond Fund | 5.7 |
| Fidelity Series Blue Chip Growth Fund | 5.2 |
| Fidelity Series Long-Term Treasury Bond Index Fund | 4.3 |
| Fidelity Series International Value Fund | 3.9 |
| | 64.0 |
Asset Allocation (% of fund's net assets)
| Period end |
| | Domestic Equity Funds | 25.1% |
| | International Equity Funds | 25.9% |
| | Bond Funds | 46.4% |
| | Short-Term Funds | 2.6% |

Domestic Equity Funds category includes Fidelity Series Commodity Strategy Fund which invests in commodity-related investments.
Fidelity Flex® Freedom Blend 2020 Fund
Schedule of Investments March 31, 2022
Showing Percentage of Net Assets
| Domestic Equity Funds - 25.1% | | | |
| | | Shares | Value |
| Fidelity Series Blue Chip Growth Fund (a) | | 956 | $13,744 |
| Fidelity Series Commodity Strategy Fund (a) | | 763 | 3,900 |
| Fidelity Series Large Cap Growth Index Fund (a) | | 492 | 8,667 |
| Fidelity Series Large Cap Stock Fund (a) | | 508 | 9,662 |
| Fidelity Series Large Cap Value Index Fund (a) | | 1,205 | 18,511 |
| Fidelity Series Small Cap Opportunities Fund (a) | | 341 | 4,650 |
| Fidelity Series Value Discovery Fund (a) | | 427 | 6,839 |
| TOTAL DOMESTIC EQUITY FUNDS | | | |
| (Cost $59,371) | | | 65,973 |
|
| International Equity Funds - 25.9% | | | |
| Fidelity Series Canada Fund (a) | | 320 | 4,972 |
| Fidelity Series Emerging Markets Fund (a) | | 274 | 2,546 |
| Fidelity Series Emerging Markets Opportunities Fund (a) | | 1,247 | 22,940 |
| Fidelity Series International Growth Fund (a) | | 601 | 9,960 |
| Fidelity Series International Index Fund (a) | | 369 | 4,220 |
| Fidelity Series International Small Cap Fund (a) | | 173 | 3,111 |
| Fidelity Series International Value Fund (a) | | 915 | 10,091 |
| Fidelity Series Overseas Fund (a) | | 796 | 10,045 |
| TOTAL INTERNATIONAL EQUITY FUNDS | | | |
| (Cost $67,594) | | | 67,885 |
|
| Bond Funds - 46.4% | | | |
| Fidelity Series 0-5 Year Inflation-Protected Bond Index Fund (a) | | 296 | 2,970 |
| Fidelity Series 5+ Year Inflation-Protected Bond Index Fund (a) | | 1,897 | 18,212 |
| Fidelity Series Corporate Bond Fund (a) | | 1,484 | 14,991 |
| Fidelity Series Emerging Markets Debt Fund (a) | | 164 | 1,351 |
| Fidelity Series Emerging Markets Debt Local Currency Fund (a) | | 49 | 440 |
| Fidelity Series Floating Rate High Income Fund (a) | | 29 | 265 |
| Fidelity Series Government Bond Index Fund (a) | | 2,101 | 20,971 |
| Fidelity Series High Income Fund (a) | | 174 | 1,580 |
| Fidelity Series Inflation-Protected Bond Index Fund (a) | | 285 | 2,897 |
| Fidelity Series International Credit Fund (a) | | 8 | 76 |
| Fidelity Series International Developed Markets Bond Index Fund (a) | | 890 | 8,303 |
| Fidelity Series Investment Grade Bond Fund (a) | | 2,022 | 22,056 |
| Fidelity Series Investment Grade Securitized Fund (a) | | 1,590 | 15,455 |
| Fidelity Series Long-Term Treasury Bond Index Fund (a) | | 1,500 | 11,428 |
| Fidelity Series Real Estate Income Fund (a) | | 82 | 936 |
| TOTAL BOND FUNDS | | | |
| (Cost $127,510) | | | 121,931 |
|
| Short-Term Funds - 2.6% | | | |
| Fidelity Series Government Money Market Fund 0.31% (a)(b) | | 1,348 | 1,348 |
| Fidelity Series Short-Term Credit Fund (a) | | 139 | 1,351 |
| Fidelity Series Treasury Bill Index Fund (a) | | 405 | 4,046 |
| TOTAL SHORT-TERM FUNDS | | | |
| (Cost $6,776) | | | 6,745 |
| TOTAL INVESTMENT IN SECURITIES - 100.0% | | | |
| (Cost $261,251) | | | 262,534 |
| NET OTHER ASSETS (LIABILITIES) - 0.0% | | | (1) |
| NET ASSETS - 100% | | | $262,533 |
Legend
(a) Affiliated Fund
(b) The rate quoted is the annualized seven-day yield of the fund at period end.
Affiliated Underlying Funds
Fiscal year to date information regarding the Fund's investments in affiliated Underlying Funds is presented below. Exchanges between classes of the same affiliated Underlying Funds may occur. If an underlying Fund changes its name, the name presented below is the name in effect at period end.
| Fund | Value, beginning of period | Purchases(a) | Sales Proceeds(a) | Dividend Income | Realized Gain (loss) | Change in Unrealized appreciation (depreciation) | Value, end of period |
| Fidelity Series 0-5 Year Inflation-Protected Bond Index Fund | $-- | $5,001 | $2,028 | $6 | $(6) | $4 | $2,970 |
| Fidelity Series 5+ Year Inflation-Protected Bond Index Fund | -- | 20,324 | 1,529 | 75 | (69) | (514) | 18,212 |
| Fidelity Series Blue Chip Growth Fund | 7,910 | 11,774 | 4,076 | 1,858 | (89) | (1,775) | 13,744 |
| Fidelity Series Canada Fund | 1,901 | 2,968 | 507 | 70 | 2 | 608 | 4,972 |
| Fidelity Series Commodity Strategy Fund | 3,879 | 4,082 | 4,600 | 1,322 | 31 | 508 | 3,900 |
| Fidelity Series Corporate Bond Fund | 8,023 | 9,621 | 1,625 | 292 | (72) | (956) | 14,991 |
| Fidelity Series Emerging Markets Debt Fund | 761 | 851 | 140 | 41 | (16) | (105) | 1,351 |
| Fidelity Series Emerging Markets Debt Local Currency Fund | 251 | 277 | 48 | 13 | (4) | (36) | 440 |
| Fidelity Series Emerging Markets Fund | 1,538 | 1,772 | 300 | 59 | (9) | (455) | 2,546 |
| Fidelity Series Emerging Markets Opportunities Fund | 13,905 | 17,896 | 3,095 | 1,873 | (186) | (5,580) | 22,940 |
| Fidelity Series Floating Rate High Income Fund | 148 | 161 | 43 | 8 | (1) | -- | 265 |
| Fidelity Series Government Bond Index Fund | 9,893 | 13,592 | 1,529 | 147 | (81) | (904) | 20,971 |
| Fidelity Series Government Money Market Fund 0.31% | 4,074 | 1,525 | 4,251 | 2 | -- | -- | 1,348 |
| Fidelity Series High Income Fund | 880 | 952 | 200 | 61 | (8) | (44) | 1,580 |
| Fidelity Series Inflation-Protected Bond Index Fund | 10,047 | 5,066 | 12,081 | 601 | 460 | (595) | 2,897 |
| Fidelity Series International Credit Fund | 79 | 3 | -- | 3 | -- | (6) | 76 |
| Fidelity Series International Developed Markets Bond Index Fund | -- | 8,929 | 299 | 2 | (18) | (309) | 8,303 |
| Fidelity Series International Growth Fund | 4,676 | 7,306 | 1,051 | 563 | (94) | (877) | 9,960 |
| Fidelity Series International Index Fund | 1,952 | 2,774 | 351 | 75 | (19) | (136) | 4,220 |
| Fidelity Series International Small Cap Fund | 1,686 | 2,117 | 217 | 293 | (46) | (429) | 3,111 |
| Fidelity Series International Value Fund | 4,671 | 6,741 | 1,321 | 353 | (36) | 36 | 10,091 |
| Fidelity Series Investment Grade Bond Fund | 10,981 | 14,023 | 1,793 | 330 | (79) | (1,076) | 22,056 |
| Fidelity Series Investment Grade Securitized Fund | 7,693 | 9,746 | 1,193 | 97 | (44) | (747) | 15,455 |
| Fidelity Series Large Cap Growth Index Fund | 5,022 | 5,982 | 2,847 | 193 | 77 | 433 | 8,667 |
| Fidelity Series Large Cap Stock Fund | 5,486 | 5,904 | 1,901 | 573 | (3) | 176 | 9,662 |
| Fidelity Series Large Cap Value Index Fund | 10,478 | 11,670 | 4,105 | 934 | (52) | 520 | 18,511 |
| Fidelity Series Long-Term Treasury Bond Index Fund | 3,823 | 9,288 | 1,123 | 135 | (160) | (400) | 11,428 |
| Fidelity Series Overseas Fund | 4,684 | 7,003 | 1,254 | 209 | (22) | (366) | 10,045 |
| Fidelity Series Real Estate Income Fund | 532 | 520 | 124 | 26 | (3) | 11 | 936 |
| Fidelity Series Short-Term Credit Fund | 2,008 | 1,713 | 2,287 | 38 | (17) | (66) | 1,351 |
| Fidelity Series Small Cap Opportunities Fund | 2,650 | 3,598 | 870 | 741 | (31) | (697) | 4,650 |
| Fidelity Series Treasury Bill Index Fund | 6,476 | 5,273 | 7,696 | 6 | (3) | (4) | 4,046 |
| Fidelity Series Value Discovery Fund | 3,919 | 4,437 | 1,447 | 640 | (19) | (51) | 6,839 |
| | $140,026 | $202,889 | $65,931 | $11,639 | $(617) | $(13,832) | $262,534 |
(a) Includes the value of shares purchased or redeemed through in-kind transactions, as applicable.
Amounts in the income column in the above table include any capital gain distributions from underlying funds, which are presented in the corresponding line-item in the Statement of Operations, if applicable.
Investment Valuation
The following is a summary of the inputs used, as of March 31, 2022, involving the Fund's assets and liabilities carried at fair value. The inputs or methodology used for valuing securities may not be an indication of the risk associated with investing in those securities. For more information on valuation inputs, and their aggregation into the levels used below, please refer to the Investment Valuation section in the accompanying Notes to Financial Statements.
| | Valuation Inputs at Reporting Date: |
| Description | Total | Level 1 | Level 2 | Level 3 |
| Investments in Securities: | | | | |
| Domestic Equity Funds | $65,973 | $65,973 | $-- | $-- |
| International Equity Funds | 67,885 | 67,885 | -- | -- |
| Bond Funds | 121,931 | 121,931 | -- | -- |
| Short-Term Funds | 6,745 | 6,745 | -- | -- |
| Total Investments in Securities: | $262,534 | $262,534 | $-- | $-- |
See accompanying notes which are an integral part of the financial statements.
Fidelity Flex® Freedom Blend 2020 Fund
Financial Statements
Statement of Assets and Liabilities
| | | March 31, 2022 |
| Assets | | |
Investment in securities, at value — See accompanying schedule:
| | |
| Affiliated issuers (cost $261,251) | $262,534 | |
| Total Investment in Securities (cost $261,251) | | $262,534 |
| Receivable for investments sold | | 5,731 |
| Receivable for fund shares sold | | 1,130 |
| Total assets | | 269,395 |
| Liabilities | | |
| Payable for investments purchased | $6,862 | |
| Total liabilities | | 6,862 |
| Net Assets | | $262,533 |
| Net Assets consist of: | | |
| Paid in capital | | $259,109 |
| Total accumulated earnings (loss) | | 3,424 |
| Net Assets | | $262,533 |
| Net Asset Value, offering price and redemption price per share ($262,533 ÷ 24,028 shares) | | $10.93 |
See accompanying notes which are an integral part of the financial statements.
Statement of Operations
| | | Year ended March 31, 2022 |
| Investment Income | | |
| Dividends: | | |
| Affiliated issuers | | $4,871 |
| Expenses | | |
| Independent trustees' fees and expenses | $1 | |
| Total expenses | | 1 |
| Net investment income (loss) | | 4,870 |
| Realized and Unrealized Gain (Loss) | | |
| Net realized gain (loss) on: | | |
| Investment securities: | | |
| Affiliated issuers | (617) | |
| Capital gain distributions from underlying funds: | | |
| Affiliated issuers | 6,768 | |
| Total net realized gain (loss) | | 6,151 |
| Change in net unrealized appreciation (depreciation) on: | | |
| Investment securities: | | |
| Affiliated issuers | (13,832) | |
| Total change in net unrealized appreciation (depreciation) | | (13,832) |
| Net gain (loss) | | (7,681) |
| Net increase (decrease) in net assets resulting from operations | | $(2,811) |
See accompanying notes which are an integral part of the financial statements.
Statement of Changes in Net Assets
| | Year ended March 31, 2022 | Year ended March 31, 2021 |
| Increase (Decrease) in Net Assets | | |
| Operations | | |
| Net investment income (loss) | $4,870 | $1,976 |
| Net realized gain (loss) | 6,151 | 5,713 |
| Change in net unrealized appreciation (depreciation) | (13,832) | 25,706 |
| Net increase (decrease) in net assets resulting from operations | (2,811) | 33,395 |
| Distributions to shareholders | (11,561) | (6,234) |
| Share transactions | | |
| Proceeds from sales of shares | 138,083 | – |
| Reinvestment of distributions | 11,561 | 6,233 |
| Cost of shares redeemed | (12,764) | – |
| Net increase (decrease) in net assets resulting from share transactions | 136,880 | 6,233 |
| Total increase (decrease) in net assets | 122,508 | 33,394 |
| Net Assets | | |
| Beginning of period | 140,025 | 106,631 |
| End of period | $262,533 | $140,025 |
| Other Information | | |
| Shares | | |
| Sold | 12,024 | – |
| Issued in reinvestment of distributions | 996 | 576 |
| Redeemed | (1,162) | – |
| Net increase (decrease) | 11,858 | 576 |
See accompanying notes which are an integral part of the financial statements.
Financial Highlights
Fidelity Flex Freedom Blend 2020 Fund
| | | | | | |
| Years ended March 31, | 2022 | 2021 | 2020 | 2019 | 2018 A |
| Selected Per–Share Data | | | | | |
| Net asset value, beginning of period | $11.51 | $9.20 | $10.10 | $10.40 | $10.00 |
| Income from Investment Operations | | | | | |
| Net investment income (loss)B,C | .31 | .17 | .24 | .24 | .19 |
| Net realized and unrealized gain (loss) | (.16) | 2.67 | (.51) | .07 | .48 |
| Total from investment operations | .15 | 2.84 | (.27) | .31 | .67 |
| Distributions from net investment income | (.27) | (.18) | (.25) | (.24) | (.16) |
| Distributions from net realized gain | (.46) | (.36) | (.38) | (.36) | (.12) |
| Total distributions | (.73) | (.53)D | (.63) | (.61)D | (.27)D |
| Net asset value, end of period | $10.93 | $11.51 | $9.20 | $10.10 | $10.40 |
| Total ReturnE | .98% | 31.33% | (3.23)% | 3.28% | 6.72% |
| Ratios to Average Net AssetsC,F,G | | | | | |
| Expenses before reductions | - %H | - %H | - %H | - %H | - %I |
| Expenses net of fee waivers, if any | - %H | - %H | - %H | - %H | - %I |
| Expenses net of all reductions | - %H | - %H | - %H | - %H | - %I |
| Net investment income (loss) | 2.70% | 1.55% | 2.35% | 2.41% | 2.22%I |
| Supplemental Data | | | | | |
| Net assets, end of period (000 omitted) | $263 | $140 | $107 | $110 | $107 |
| Portfolio turnover rateJ | 36% | 26% | 67% | 22% | 14%I |
A For the period June 8, 2017 (commencement of operations) through March 31, 2018.
B Calculated based on average shares outstanding during the period.
C Net investment income (loss) is affected by the timing of the declaration of dividends by any underlying mutual funds or exchange-traded funds (ETFs). Net investment income (loss) of any such underlying funds is not included in the Fund's net investment income (loss) ratio.
D Total distributions per share do not sum due to rounding.
E Total returns for periods of less than one year are not annualized.
F Fees and expenses of any underlying mutual funds or exchange-traded funds (ETFs) are not included in the Fund's expense ratio. The Fund indirectly bears its proportionate share of these expenses.
G Expense ratios reflect operating expenses of the class. Expenses before reductions do not reflect amounts reimbursed, waived, or reduced through arrangements with the investment adviser, brokerage services, or other offset arrangements, if applicable, and do not represent the amount paid by the class during periods when reimbursements, waivers or reductions occur.
H Amount represents less than .005%.
I Annualized
J Amount does not include the portfolio activity of any underlying mutual funds or exchange-traded funds (ETFs).
See accompanying notes which are an integral part of the financial statements.
Fidelity Flex® Freedom Blend 2025 Fund
Investment Summary (Unaudited)
The information in the following tables is based on the direct investments of the Fund.
Top Holdings as of March 31, 2022
| | % of fund's net assets |
| Fidelity Series Emerging Markets Opportunities Fund | 9.4 |
| Fidelity Series Large Cap Value Index Fund | 8.3 |
| Fidelity Series Investment Grade Bond Fund | 7.4 |
| Fidelity Series Government Bond Index Fund | 7.1 |
| Fidelity Series Blue Chip Growth Fund | 6.1 |
| Fidelity Series 5+ Year Inflation-Protected Bond Index Fund | 5.9 |
| Fidelity Series Investment Grade Securitized Fund | 5.2 |
| Fidelity Series Corporate Bond Fund | 5.0 |
| Fidelity Series Long-Term Treasury Bond Index Fund | 4.8 |
| Fidelity Series Large Cap Stock Fund | 4.3 |
| | 63.5 |
Asset Allocation (% of fund's net assets)
| Period end |
| | Domestic Equity Funds | 29.2% |
| | International Equity Funds | 28.5% |
| | Bond Funds | 41.1% |
| | Short-Term Funds | 1.2% |

Domestic Equity Funds category includes Fidelity Series Commodity Strategy Fund which invests in commodity-related investments.
Fidelity Flex® Freedom Blend 2025 Fund
Schedule of Investments March 31, 2022
Showing Percentage of Net Assets
| Domestic Equity Funds - 29.2% | | | |
| | | Shares | Value |
| Fidelity Series Blue Chip Growth Fund (a) | | 1,858 | $26,697 |
| Fidelity Series Commodity Strategy Fund (a) | | 1,268 | 6,482 |
| Fidelity Series Large Cap Growth Index Fund (a) | | 957 | 16,838 |
| Fidelity Series Large Cap Stock Fund (a) | | 987 | 18,766 |
| Fidelity Series Large Cap Value Index Fund (a) | | 2,341 | 35,956 |
| Fidelity Series Small Cap Opportunities Fund (a) | | 663 | 9,030 |
| Fidelity Series Value Discovery Fund (a) | | 830 | 13,283 |
| TOTAL DOMESTIC EQUITY FUNDS | | | |
| (Cost $119,702) | | | 127,052 |
|
| International Equity Funds - 28.5% | | | |
| Fidelity Series Canada Fund (a) | | 596 | 9,252 |
| Fidelity Series Emerging Markets Fund (a) | | 487 | 4,516 |
| Fidelity Series Emerging Markets Opportunities Fund (a) | | 2,233 | 41,086 |
| Fidelity Series International Growth Fund (a) | | 1,117 | 18,521 |
| Fidelity Series International Index Fund (a) | | 687 | 7,856 |
| Fidelity Series International Small Cap Fund (a) | | 322 | 5,780 |
| Fidelity Series International Value Fund (a) | | 1,700 | 18,746 |
| Fidelity Series Overseas Fund (a) | | 1,475 | 18,620 |
| TOTAL INTERNATIONAL EQUITY FUNDS | | | |
| (Cost $126,869) | | | 124,377 |
|
| Bond Funds - 41.1% | | | |
| Fidelity Series 5+ Year Inflation-Protected Bond Index Fund (a) | | 2,679 | 25,717 |
| Fidelity Series Corporate Bond Fund (a) | | 2,174 | 21,961 |
| Fidelity Series Emerging Markets Debt Fund (a) | | 272 | 2,244 |
| Fidelity Series Emerging Markets Debt Local Currency Fund (a) | | 81 | 732 |
| Fidelity Series Floating Rate High Income Fund (a) | | 48 | 439 |
| Fidelity Series Government Bond Index Fund (a) | | 3,079 | 30,727 |
| Fidelity Series High Income Fund (a) | | 289 | 2,625 |
| Fidelity Series Inflation-Protected Bond Index Fund (a) | | 393 | 3,987 |
| Fidelity Series International Credit Fund (a) | | 8 | 76 |
| Fidelity Series International Developed Markets Bond Index Fund (a) | | 1,453 | 13,553 |
| Fidelity Series Investment Grade Bond Fund (a) | | 2,962 | 32,314 |
| Fidelity Series Investment Grade Securitized Fund (a) | | 2,329 | 22,641 |
| Fidelity Series Long-Term Treasury Bond Index Fund (a) | | 2,720 | 20,726 |
| Fidelity Series Real Estate Income Fund (a) | | 133 | 1,511 |
| TOTAL BOND FUNDS | | | |
| (Cost $186,433) | | | 179,253 |
|
| Short-Term Funds - 1.2% | | | |
| Fidelity Series Government Money Market Fund 0.31% (a)(b) | | 1,025 | 1,025 |
| Fidelity Series Short-Term Credit Fund (a) | | 105 | 1,028 |
| Fidelity Series Treasury Bill Index Fund (a) | | 308 | 3,077 |
| TOTAL SHORT-TERM FUNDS | | | |
| (Cost $5,152) | | | 5,130 |
| TOTAL INVESTMENT IN SECURITIES - 100.0% | | | |
| (Cost $438,156) | | | 435,812 |
| NET OTHER ASSETS (LIABILITIES) - 0.0% | | | (3) |
| NET ASSETS - 100% | | | $435,809 |
Legend
(a) Affiliated Fund
(b) The rate quoted is the annualized seven-day yield of the fund at period end.
Affiliated Underlying Funds
Fiscal year to date information regarding the Fund's investments in affiliated Underlying Funds is presented below. Exchanges between classes of the same affiliated Underlying Funds may occur. If an underlying Fund changes its name, the name presented below is the name in effect at period end.
| Fund | Value, beginning of period | Purchases(a) | Sales Proceeds(a) | Dividend Income | Realized Gain (loss) | Change in Unrealized appreciation (depreciation) | Value, end of period |
| Fidelity Series 0-5 Year Inflation-Protected Bond Index Fund | $-- | $4,560 | $4,563 | $4 | $3 | $-- | $-- |
| Fidelity Series 5+ Year Inflation-Protected Bond Index Fund | -- | 28,272 | 1,901 | 74 | (75) | (579) | 25,717 |
| Fidelity Series Blue Chip Growth Fund | 9,315 | 26,398 | 6,136 | 2,715 | (422) | (2,458) | 26,697 |
| Fidelity Series Canada Fund | 2,198 | 7,030 | 863 | 102 | (3) | 890 | 9,252 |
| Fidelity Series Commodity Strategy Fund | 3,975 | 7,903 | 6,068 | 1,664 | (25) | 697 | 6,482 |
| Fidelity Series Corporate Bond Fund | 7,416 | 18,370 | 2,540 | 329 | (102) | (1,183) | 21,961 |
| Fidelity Series Emerging Markets Debt Fund | 780 | 1,892 | 260 | 52 | (24) | (144) | 2,244 |
| Fidelity Series Emerging Markets Debt Local Currency Fund | 258 | 616 | 84 | 17 | (6) | (52) | 732 |
| Fidelity Series Emerging Markets Fund | 1,690 | 4,026 | 500 | 84 | (48) | (652) | 4,516 |
| Fidelity Series Emerging Markets Opportunities Fund | 15,266 | 38,621 | 4,200 | 2,651 | (649) | (7,952) | 41,086 |
| Fidelity Series Floating Rate High Income Fund | 152 | 360 | 72 | 10 | (1) | -- | 439 |
| Fidelity Series Government Bond Index Fund | 9,145 | 25,779 | 2,926 | 167 | (102) | (1,169) | 30,727 |
| Fidelity Series Government Money Market Fund 0.31% | 2,739 | 2,039 | 3,752 | 1 | (1) | -- | 1,025 |
| Fidelity Series High Income Fund | 902 | 2,150 | 358 | 76 | (11) | (58) | 2,625 |
| Fidelity Series Inflation-Protected Bond Index Fund | 9,106 | 9,621 | 14,564 | 610 | 292 | (468) | 3,987 |
| Fidelity Series International Credit Fund | 80 | 2 | -- | 3 | -- | (6) | 76 |
| Fidelity Series International Developed Markets Bond Index Fund | -- | 14,619 | 615 | 2 | (29) | (422) | 13,553 |
| Fidelity Series International Growth Fund | 5,407 | 16,470 | 1,755 | 823 | (162) | (1,439) | 18,521 |
| Fidelity Series International Index Fund | 2,257 | 6,583 | 702 | 110 | (39) | (243) | 7,856 |
| Fidelity Series International Small Cap Fund | 1,950 | 5,060 | 464 | 428 | (77) | (689) | 5,780 |
| Fidelity Series International Value Fund | 5,401 | 15,829 | 2,371 | 517 | (87) | (26) | 18,746 |
| Fidelity Series Investment Grade Bond Fund | 10,150 | 26,840 | 3,211 | 370 | (108) | (1,357) | 32,314 |
| Fidelity Series Investment Grade Securitized Fund | 7,111 | 18,727 | 2,209 | 114 | (58) | (930) | 22,641 |
| Fidelity Series Large Cap Growth Index Fund | 5,937 | 14,533 | 4,270 | 286 | (64) | 702 | 16,838 |
| Fidelity Series Large Cap Stock Fund | 6,578 | 15,164 | 3,142 | 815 | (22) | 188 | 18,766 |
| Fidelity Series Large Cap Value Index Fund | 12,387 | 29,150 | 6,124 | 1,450 | (157) | 700 | 35,956 |
| Fidelity Series Long-Term Treasury Bond Index Fund | 3,917 | 19,413 | 1,638 | 180 | (189) | (777) | 20,726 |
| Fidelity Series Overseas Fund | 5,416 | 15,860 | 1,917 | 305 | (92) | (647) | 18,620 |
| Fidelity Series Real Estate Income Fund | 546 | 1,163 | 201 | 34 | (4) | 7 | 1,511 |
| Fidelity Series Short-Term Credit Fund | 1,349 | 2,045 | 2,301 | 30 | (21) | (44) | 1,028 |
| Fidelity Series Small Cap Opportunities Fund | 3,130 | 8,237 | 1,242 | 1,080 | (129) | (966) | 9,030 |
| Fidelity Series Treasury Bill Index Fund | 4,354 | 6,264 | 7,537 | 4 | (2) | (2) | 3,077 |
| Fidelity Series Value Discovery Fund | 4,577 | 11,091 | 2,121 | 1,036 | (67) | (197) | 13,283 |
| | $143,489 | $404,687 | $90,607 | $16,143 | $(2,481) | $(19,276) | $435,812 |
(a) Includes the value of shares purchased or redeemed through in-kind transactions, as applicable.
Amounts in the income column in the above table include any capital gain distributions from underlying funds, which are presented in the corresponding line-item in the Statement of Operations, if applicable.
Investment Valuation
The following is a summary of the inputs used, as of March 31, 2022, involving the Fund's assets and liabilities carried at fair value. The inputs or methodology used for valuing securities may not be an indication of the risk associated with investing in those securities. For more information on valuation inputs, and their aggregation into the levels used below, please refer to the Investment Valuation section in the accompanying Notes to Financial Statements.
| | Valuation Inputs at Reporting Date: |
| Description | Total | Level 1 | Level 2 | Level 3 |
| Investments in Securities: | | | | |
| Domestic Equity Funds | $127,052 | $127,052 | $-- | $-- |
| International Equity Funds | 124,377 | 124,377 | -- | -- |
| Bond Funds | 179,253 | 179,253 | -- | -- |
| Short-Term Funds | 5,130 | 5,130 | -- | -- |
| Total Investments in Securities: | $435,812 | $435,812 | $-- | $-- |
See accompanying notes which are an integral part of the financial statements.
Fidelity Flex® Freedom Blend 2025 Fund
Financial Statements
Statement of Assets and Liabilities
| | | March 31, 2022 |
| Assets | | |
Investment in securities, at value — See accompanying schedule:
| | |
| Affiliated issuers (cost $438,156) | $435,812 | |
| Total Investment in Securities (cost $438,156) | | $435,812 |
| Receivable for investments sold | | 7,732 |
| Receivable for fund shares sold | | 6,031 |
| Total assets | | 449,575 |
| Liabilities | | |
| Payable for investments purchased | $13,766 | |
| Total liabilities | | 13,766 |
| Net Assets | | $435,809 |
| Net Assets consist of: | | |
| Paid in capital | | $435,705 |
| Total accumulated earnings (loss) | | 104 |
| Net Assets | | $435,809 |
| Net Asset Value, offering price and redemption price per share ($435,809 ÷ 39,267 shares) | | $11.10 |
See accompanying notes which are an integral part of the financial statements.
Statement of Operations
| | | Year ended March 31, 2022 |
| Investment Income | | |
| Dividends: | | |
| Affiliated issuers | | $6,249 |
| Expenses | | |
| Independent trustees' fees and expenses | $1 | |
| Total expenses | | 1 |
| Net investment income (loss) | | 6,248 |
| Realized and Unrealized Gain (Loss) | | |
| Net realized gain (loss) on: | | |
| Investment securities: | | |
| Affiliated issuers | (2,481) | |
| Capital gain distributions from underlying funds: | | |
| Affiliated issuers | 9,894 | |
| Total net realized gain (loss) | | 7,413 |
| Change in net unrealized appreciation (depreciation) on: | | |
| Investment securities: | | |
| Affiliated issuers | (19,276) | |
| Total change in net unrealized appreciation (depreciation) | | (19,276) |
| Net gain (loss) | | (11,863) |
| Net increase (decrease) in net assets resulting from operations | | $(5,615) |
See accompanying notes which are an integral part of the financial statements.
Statement of Changes in Net Assets
| | Year ended March 31, 2022 | Year ended March 31, 2021 |
| Increase (Decrease) in Net Assets | | |
| Operations | | |
| Net investment income (loss) | $6,248 | $2,052 |
| Net realized gain (loss) | 7,413 | 6,348 |
| Change in net unrealized appreciation (depreciation) | (19,276) | 29,103 |
| Net increase (decrease) in net assets resulting from operations | (5,615) | 37,503 |
| Distributions to shareholders | (14,198) | (6,685) |
| Share transactions | | |
| Proceeds from sales of shares | 348,051 | – |
| Reinvestment of distributions | 14,198 | 6,685 |
| Cost of shares redeemed | (50,115) | – |
| Net increase (decrease) in net assets resulting from share transactions | 312,134 | 6,685 |
| Total increase (decrease) in net assets | 292,321 | 37,503 |
| Net Assets | | |
| Beginning of period | 143,488 | 105,985 |
| End of period | $435,809 | $143,488 |
| Other Information | | |
| Shares | | |
| Sold | 30,124 | – |
| Issued in reinvestment of distributions | 1,202 | 614 |
| Redeemed | (4,354) | – |
| Net increase (decrease) | 26,972 | 614 |
See accompanying notes which are an integral part of the financial statements.
Financial Highlights
Fidelity Flex Freedom Blend 2025 Fund
| | | | | | |
| Years ended March 31, | 2022 | 2021 | 2020 | 2019 | 2018 A |
| Selected Per–Share Data | | | | | |
| Net asset value, beginning of period | $11.67 | $9.07 | $10.11 | $10.44 | $10.00 |
| Income from Investment Operations | | | | | |
| Net investment income (loss)B,C | .32 | .17 | .24 | .24 | .19 |
| Net realized and unrealized gain (loss) | (.12) | 3.00 | (.61) | .06 | .54 |
| Total from investment operations | .20 | 3.17 | (.37) | .30 | .73 |
| Distributions from net investment income | (.28) | (.18) | (.24) | (.24) | (.16) |
| Distributions from net realized gain | (.49) | (.39) | (.42) | (.39) | (.13) |
| Total distributions | (.77) | (.57) | (.67)D | (.63) | (.29) |
| Net asset value, end of period | $11.10 | $11.67 | $9.07 | $10.11 | $10.44 |
| Total ReturnE | 1.41% | 35.43% | (4.34)% | 3.28% | 7.24% |
| Ratios to Average Net AssetsC,F,G | | | | | |
| Expenses before reductions | - %H | - %H | - %H | - %H | - %I |
| Expenses net of fee waivers, if any | - %H | - %H | - %H | - %H | - %I |
| Expenses net of all reductions | - %H | - %H | - %H | - %H | - %I |
| Net investment income (loss) | 2.78% | 1.59% | 2.35% | 2.37% | 2.20%I |
| Supplemental Data | | | | | |
| Net assets, end of period (000 omitted) | $436 | $143 | $106 | $111 | $107 |
| Portfolio turnover rateJ | 39% | 25% | 68% | 22% | 14%I |
A For the period June 8, 2017 (commencement of operations) through March 31, 2018.
B Calculated based on average shares outstanding during the period.
C Net investment income (loss) is affected by the timing of the declaration of dividends by any underlying mutual funds or exchange-traded funds (ETFs). Net investment income (loss) of any such underlying funds is not included in the Fund's net investment income (loss) ratio.
D Total distributions per share do not sum due to rounding.
E Total returns for periods of less than one year are not annualized.
F Fees and expenses of any underlying mutual funds or exchange-traded funds (ETFs) are not included in the Fund's expense ratio. The Fund indirectly bears its proportionate share of these expenses.
G Expense ratios reflect operating expenses of the class. Expenses before reductions do not reflect amounts reimbursed, waived, or reduced through arrangements with the investment adviser, brokerage services, or other offset arrangements, if applicable, and do not represent the amount paid by the class during periods when reimbursements, waivers or reductions occur.
H Amount represents less than .005%.
I Annualized
J Amount does not include the portfolio activity of any underlying mutual funds or exchange-traded funds (ETFs).
See accompanying notes which are an integral part of the financial statements.
Fidelity Flex® Freedom Blend 2030 Fund
Investment Summary (Unaudited)
The information in the following tables is based on the direct investments of the Fund.
Top Holdings as of March 31, 2022
| | % of fund's net assets |
| Fidelity Series Emerging Markets Opportunities Fund | 10.1 |
| Fidelity Series Large Cap Value Index Fund | 9.4 |
| Fidelity Series Blue Chip Growth Fund | 7.0 |
| Fidelity Series Investment Grade Bond Fund | 6.6 |
| Fidelity Series Government Bond Index Fund | 6.3 |
| Fidelity Series Long-Term Treasury Bond Index Fund | 5.1 |
| Fidelity Series Large Cap Stock Fund | 4.9 |
| Fidelity Series International Value Fund | 4.7 |
| Fidelity Series Overseas Fund | 4.7 |
| Fidelity Series International Growth Fund | 4.7 |
| | 63.5 |
Asset Allocation (% of fund's net assets)
| Period end |
| | Domestic Equity Funds | 33.1% |
| | International Equity Funds | 31.2% |
| | Bond Funds | 35.2% |
| | Short-Term Funds | 0.5% |

Domestic Equity Funds category includes Fidelity Series Commodity Strategy Fund which invests in commodity-related investments.
Fidelity Flex® Freedom Blend 2030 Fund
Schedule of Investments March 31, 2022
Showing Percentage of Net Assets
| Domestic Equity Funds - 33.1% | | | |
| | | Shares | Value |
| Fidelity Series Blue Chip Growth Fund (a) | | 5,181 | $74,453 |
| Fidelity Series Commodity Strategy Fund (a) | | 3,103 | 15,854 |
| Fidelity Series Large Cap Growth Index Fund (a) | | 2,667 | 46,947 |
| Fidelity Series Large Cap Stock Fund (a) | | 2,753 | 52,337 |
| Fidelity Series Large Cap Value Index Fund (a) | | 6,528 | 100,274 |
| Fidelity Series Small Cap Opportunities Fund (a) | | 1,849 | 25,188 |
| Fidelity Series Value Discovery Fund (a) | | 2,315 | 37,046 |
| TOTAL DOMESTIC EQUITY FUNDS | | | |
| (Cost $345,235) | | | 352,099 |
|
| International Equity Funds - 31.2% | | | |
| Fidelity Series Canada Fund (a) | | 1,613 | 25,037 |
| Fidelity Series Emerging Markets Fund (a) | | 1,248 | 11,584 |
| Fidelity Series Emerging Markets Opportunities Fund (a) | | 5,846 | 107,558 |
| Fidelity Series International Growth Fund (a) | | 3,019 | 50,057 |
| Fidelity Series International Index Fund (a) | | 1,859 | 21,266 |
| Fidelity Series International Small Cap Fund (a) | | 869 | 15,606 |
| Fidelity Series International Value Fund (a) | | 4,583 | 50,554 |
| Fidelity Series Overseas Fund (a) | | 3,988 | 50,330 |
| TOTAL INTERNATIONAL EQUITY FUNDS | | | |
| (Cost $351,735) | | | 331,992 |
|
| Bond Funds - 35.2% | | | |
| Fidelity Series 5+ Year Inflation-Protected Bond Index Fund (a) | | 2,867 | 27,521 |
| Fidelity Series Corporate Bond Fund (a) | | 4,728 | 47,752 |
| Fidelity Series Emerging Markets Debt Fund (a) | | 662 | 5,463 |
| Fidelity Series Emerging Markets Debt Local Currency Fund (a) | | 198 | 1,781 |
| Fidelity Series Floating Rate High Income Fund (a) | | 117 | 1,071 |
| Fidelity Series Government Bond Index Fund (a) | | 6,693 | 66,801 |
| Fidelity Series High Income Fund (a) | | 707 | 6,425 |
| Fidelity Series Inflation-Protected Bond Index Fund (a) | | 759 | 7,704 |
| Fidelity Series International Credit Fund (a) | | 7 | 65 |
| Fidelity Series International Developed Markets Bond Index Fund (a) | | 3,556 | 33,178 |
| Fidelity Series Investment Grade Bond Fund (a) | | 6,439 | 70,254 |
| Fidelity Series Investment Grade Securitized Fund (a) | | 5,065 | 49,227 |
| Fidelity Series Long-Term Treasury Bond Index Fund (a) | | 7,148 | 54,465 |
| Fidelity Series Real Estate Income Fund (a) | | 336 | 3,816 |
| TOTAL BOND FUNDS | | | |
| (Cost $391,347) | | | 375,523 |
|
| Short-Term Funds - 0.5% | | | |
| Fidelity Series Government Money Market Fund 0.31% (a)(b) | | 1,081 | 1,081 |
| Fidelity Series Short-Term Credit Fund (a) | | 111 | 1,083 |
| Fidelity Series Treasury Bill Index Fund (a) | | 324 | 3,241 |
| TOTAL SHORT-TERM FUNDS | | | |
| (Cost $5,430) | | | 5,405 |
| TOTAL INVESTMENT IN SECURITIES - 100.0% | | | |
| (Cost $1,093,747) | | | 1,065,019 |
| NET OTHER ASSETS (LIABILITIES) - 0.0% | | | (4) |
| NET ASSETS - 100% | | | $1,065,015 |
Legend
(a) Affiliated Fund
(b) The rate quoted is the annualized seven-day yield of the fund at period end.
Affiliated Underlying Funds
Fiscal year to date information regarding the Fund's investments in affiliated Underlying Funds is presented below. Exchanges between classes of the same affiliated Underlying Funds may occur. If an underlying Fund changes its name, the name presented below is the name in effect at period end.
| Fund | Value, beginning of period | Purchases(a) | Sales Proceeds(a) | Dividend Income | Realized Gain (loss) | Change in Unrealized appreciation (depreciation) | Value, end of period |
| Fidelity Series 0-5 Year Inflation-Protected Bond Index Fund | $-- | $7,508 | $7,513 | $7 | $6 | $-- | $-- |
| Fidelity Series 5+ Year Inflation-Protected Bond Index Fund | -- | 32,203 | 4,055 | 68 | (157) | (470) | 27,521 |
| Fidelity Series Blue Chip Growth Fund | 11,225 | 85,779 | 16,605 | 3,894 | (1,228) | (4,718) | 74,453 |
| Fidelity Series Canada Fund | 2,572 | 23,385 | 2,888 | 200 | 8 | 1,960 | 25,037 |
| Fidelity Series Commodity Strategy Fund | 4,113 | 23,620 | 14,856 | 1,873 | 357 | 2,620 | 15,854 |
| Fidelity Series Corporate Bond Fund | 6,713 | 49,835 | 5,743 | 534 | (267) | (2,786) | 47,752 |
| Fidelity Series Emerging Markets Debt Fund | 808 | 5,802 | 727 | 102 | (92) | (328) | 5,463 |
| Fidelity Series Emerging Markets Debt Local Currency Fund | 267 | 1,889 | 247 | 30 | (15) | (113) | 1,781 |
| Fidelity Series Emerging Markets Fund | 1,892 | 12,447 | 1,064 | 161 | (131) | (1,560) | 11,584 |
| Fidelity Series Emerging Markets Opportunities Fund | 17,020 | 120,587 | 9,986 | 5,061 | (1,807) | (18,256) | 107,558 |
| Fidelity Series Floating Rate High Income Fund | 156 | 1,085 | 161 | 18 | (3) | (6) | 1,071 |
| Fidelity Series Government Bond Index Fund | 8,278 | 68,765 | 7,395 | 281 | (273) | (2,574) | 66,801 |
| Fidelity Series Government Money Market Fund 0.31% | 1,026 | 3,175 | 3,120 | 1 | -- | -- | 1,081 |
| Fidelity Series High Income Fund | 934 | 6,554 | 837 | 139 | (30) | (196) | 6,425 |
| Fidelity Series Inflation-Protected Bond Index Fund | 8,310 | 27,499 | 27,485 | 1,091 | (216) | (404) | 7,704 |
| Fidelity Series International Credit Fund | 67 | 3 | -- | 2 | -- | (5) | 65 |
| Fidelity Series International Developed Markets Bond Index Fund | -- | 36,049 | 1,682 | 3 | (81) | (1,108) | 33,178 |
| Fidelity Series International Growth Fund | 6,326 | 54,089 | 5,421 | 1,616 | (557) | (4,380) | 50,057 |
| Fidelity Series International Index Fund | 2,641 | 22,021 | 2,362 | 215 | (122) | (912) | 21,266 |
| Fidelity Series International Small Cap Fund | 2,282 | 17,520 | 1,953 | 839 | (275) | (1,968) | 15,606 |
| Fidelity Series International Value Fund | 6,319 | 51,864 | 6,362 | 1,014 | (206) | (1,061) | 50,554 |
| Fidelity Series Investment Grade Bond Fund | 9,188 | 72,356 | 7,960 | 614 | (266) | (3,064) | 70,254 |
| Fidelity Series Investment Grade Securitized Fund | 6,437 | 50,341 | 5,384 | 219 | (172) | (1,995) | 49,227 |
| Fidelity Series Large Cap Growth Index Fund | 7,061 | 51,002 | 11,509 | 556 | (304) | 697 | 46,947 |
| Fidelity Series Large Cap Stock Fund | 7,760 | 53,296 | 8,650 | 1,258 | (94) | 25 | 52,337 |
| Fidelity Series Large Cap Value Index Fund | 14,782 | 104,682 | 19,292 | 3,127 | (415) | 517 | 100,274 |
| Fidelity Series Long-Term Treasury Bond Index Fund | 4,054 | 57,363 | 4,054 | 357 | (370) | (2,528) | 54,465 |
| Fidelity Series Overseas Fund | 6,337 | 52,695 | 5,543 | 599 | (367) | (2,792) | 50,330 |
| Fidelity Series Real Estate Income Fund | 564 | 3,851 | 553 | 55 | (12) | (34) | 3,816 |
| Fidelity Series Short-Term Credit Fund | 505 | 2,923 | 2,283 | 20 | (35) | (27) | 1,083 |
| Fidelity Series Small Cap Opportunities Fund | 3,740 | 27,099 | 3,829 | 1,457 | (353) | (1,469) | 25,188 |
| Fidelity Series Treasury Bill Index Fund | 1,632 | 8,955 | 7,340 | 4 | (4) | (2) | 3,241 |
| Fidelity Series Value Discovery Fund | 5,462 | 39,132 | 6,374 | 2,486 | (199) | (975) | 37,046 |
| | $148,471 | $1,175,374 | $203,233 | $27,901 | $(7,680) | $(47,912) | $1,065,019 |
(a) Includes the value of shares purchased or redeemed through in-kind transactions, as applicable.
Amounts in the income column in the above table include any capital gain distributions from underlying funds, which are presented in the corresponding line-item in the Statement of Operations, if applicable.
Investment Valuation
The following is a summary of the inputs used, as of March 31, 2022, involving the Fund's assets and liabilities carried at fair value. The inputs or methodology used for valuing securities may not be an indication of the risk associated with investing in those securities. For more information on valuation inputs, and their aggregation into the levels used below, please refer to the Investment Valuation section in the accompanying Notes to Financial Statements.
| | Valuation Inputs at Reporting Date: |
| Description | Total | Level 1 | Level 2 | Level 3 |
| Investments in Securities: | | | | |
| Domestic Equity Funds | $352,099 | $352,099 | $-- | $-- |
| International Equity Funds | 331,992 | 331,992 | -- | -- |
| Bond Funds | 375,523 | 375,523 | -- | -- |
| Short-Term Funds | 5,405 | 5,405 | -- | -- |
| Total Investments in Securities: | $1,065,019 | $1,065,019 | $-- | $-- |
See accompanying notes which are an integral part of the financial statements.
Fidelity Flex® Freedom Blend 2030 Fund
Financial Statements
Statement of Assets and Liabilities
| | | March 31, 2022 |
| Assets | | |
Investment in securities, at value — See accompanying schedule:
| | |
| Affiliated issuers (cost $1,093,747) | $1,065,019 | |
| Total Investment in Securities (cost $1,093,747) | | $1,065,019 |
| Receivable for investments sold | | 19,679 |
| Receivable for fund shares sold | | 4,254 |
| Total assets | | 1,088,952 |
| Liabilities | | |
| Payable for investments purchased | $23,937 | |
| Total liabilities | | 23,937 |
| Net Assets | | $1,065,015 |
| Net Assets consist of: | | |
| Paid in capital | | $1,090,216 |
| Total accumulated earnings (loss) | | (25,201) |
| Net Assets | | $1,065,015 |
| Net Asset Value, offering price and redemption price per share ($1,065,015 ÷ 93,703 shares) | | $11.37 |
See accompanying notes which are an integral part of the financial statements.
Statement of Operations
| | | Year ended March 31, 2022 |
| Investment Income | | |
| Dividends: | | |
| Affiliated issuers | | $10,242 |
| Expenses | | |
| Independent trustees' fees and expenses | $1 | |
| Total expenses | | 1 |
| Net investment income (loss) | | 10,241 |
| Realized and Unrealized Gain (Loss) | | |
| Net realized gain (loss) on: | | |
| Investment securities: | | |
| Affiliated issuers | (7,680) | |
| Capital gain distributions from underlying funds: | | |
| Affiliated issuers | 17,659 | |
| Total net realized gain (loss) | | 9,979 |
| Change in net unrealized appreciation (depreciation) on: | | |
| Investment securities: | | |
| Affiliated issuers | (47,912) | |
| Total change in net unrealized appreciation (depreciation) | | (47,912) |
| Net gain (loss) | | (37,933) |
| Net increase (decrease) in net assets resulting from operations | | $(27,692) |
See accompanying notes which are an integral part of the financial statements.
Statement of Changes in Net Assets
| | Year ended March 31, 2022 | Year ended March 31, 2021 |
| Increase (Decrease) in Net Assets | | |
| Operations | | |
| Net investment income (loss) | $10,241 | $2,156 |
| Net realized gain (loss) | 9,979 | 7,098 |
| Change in net unrealized appreciation (depreciation) | (47,912) | 33,821 |
| Net increase (decrease) in net assets resulting from operations | (27,692) | 43,075 |
| Distributions to shareholders | (19,959) | (7,511) |
| Share transactions | | |
| Proceeds from sales of shares | 1,038,694 | – |
| Reinvestment of distributions | 19,959 | 7,510 |
| Cost of shares redeemed | (94,458) | – |
| Net increase (decrease) in net assets resulting from share transactions | 964,195 | 7,510 |
| Total increase (decrease) in net assets | 916,544 | 43,074 |
| Net Assets | | |
| Beginning of period | 148,471 | 105,397 |
| End of period | $1,065,015 | $148,471 |
| Other Information | | |
| Shares | | |
| Sold | 87,666 | – |
| Issued in reinvestment of distributions | 1,651 | 691 |
| Redeemed | (8,148) | – |
| Net increase (decrease) | 81,169 | 691 |
See accompanying notes which are an integral part of the financial statements.
Financial Highlights
Fidelity Flex Freedom Blend 2030 Fund
| | | | | | |
| Years ended March 31, | 2022 | 2021 | 2020 | 2019 | 2018 A |
| Selected Per–Share Data | | | | | |
| Net asset value, beginning of period | $11.85 | $8.90 | $10.13 | $10.55 | $10.00 |
| Income from Investment Operations | | | | | |
| Net investment income (loss)B,C | .29 | .18 | .24 | .24 | .18 |
| Net realized and unrealized gain (loss) | (.03) | 3.40 | (.75) | .04 | .68 |
| Total from investment operations | .26 | 3.58 | (.51) | .28 | .86 |
| Distributions from net investment income | (.26) | (.18) | (.24) | (.24) | (.17) |
| Distributions from net realized gain | (.48) | (.44) | (.47) | (.46) | (.15) |
| Total distributions | (.74) | (.63)D | (.72)D | (.70)D | (.31)D |
| Net asset value, end of period | $11.37 | $11.85 | $8.90 | $10.13 | $10.55 |
| Total ReturnE | 1.87% | 40.91% | (5.88)% | 3.09% | 8.63% |
| Ratios to Average Net AssetsC,F,G | | | | | |
| Expenses before reductions | - %H | - %H | - %H | - %H | - %I |
| Expenses net of fee waivers, if any | - %H | - %H | - %H | - %H | - %I |
| Expenses net of all reductions | - %H | - %H | - %H | - %H | - %I |
| Net investment income (loss) | 2.49% | 1.64% | 2.36% | 2.32% | 2.15%I |
| Supplemental Data | | | | | |
| Net assets, end of period (000 omitted) | $1,065 | $148 | $105 | $112 | $109 |
| Portfolio turnover rateJ | 47% | 25% | 68% | 20% | 15%I |
A For the period June 8, 2017 (commencement of operations) through March 31, 2018.
B Calculated based on average shares outstanding during the period.
C Net investment income (loss) is affected by the timing of the declaration of dividends by any underlying mutual funds or exchange-traded funds (ETFs). Net investment income (loss) of any such underlying funds is not included in the Fund's net investment income (loss) ratio.
D Total distributions per share do not sum due to rounding.
E Total returns for periods of less than one year are not annualized.
F Fees and expenses of any underlying mutual funds or exchange-traded funds (ETFs) are not included in the Fund's expense ratio. The Fund indirectly bears its proportionate share of these expenses.
G Expense ratios reflect operating expenses of the class. Expenses before reductions do not reflect amounts reimbursed, waived, or reduced through arrangements with the investment adviser, brokerage services, or other offset arrangements, if applicable, and do not represent the amount paid by the class during periods when reimbursements, waivers or reductions occur.
H Amount represents less than .005%.
I Annualized
J Amount does not include the portfolio activity of any underlying mutual funds or exchange-traded funds (ETFs).
See accompanying notes which are an integral part of the financial statements.
Fidelity Flex® Freedom Blend 2035 Fund
Investment Summary (Unaudited)
The information in the following tables is based on the direct investments of the Fund.
Top Holdings as of March 31, 2022
| | % of fund's net assets |
| Fidelity Series Large Cap Value Index Fund | 12.1 |
| Fidelity Series Emerging Markets Opportunities Fund | 11.6 |
| Fidelity Series Blue Chip Growth Fund | 9.0 |
| Fidelity Series Large Cap Stock Fund | 6.3 |
| Fidelity Series International Value Fund | 5.8 |
| Fidelity Series Overseas Fund | 5.7 |
| Fidelity Series International Growth Fund | 5.7 |
| Fidelity Series Large Cap Growth Index Fund | 5.6 |
| Fidelity Series Long-Term Treasury Bond Index Fund | 5.4 |
| Fidelity Series Value Discovery Fund | 4.5 |
| | 71.7 |
Asset Allocation (% of fund's net assets)
| Period end |
| | Domestic Equity Funds | 42.0% |
| | International Equity Funds | 37.2% |
| | Bond Funds | 20.8% |

Domestic Equity Funds category includes Fidelity Series Commodity Strategy Fund which invests in commodity-related investments.
Fidelity Flex® Freedom Blend 2035 Fund
Schedule of Investments March 31, 2022
Showing Percentage of Net Assets
| Domestic Equity Funds - 42.0% | | | |
| | | Shares | Value |
| Fidelity Series Blue Chip Growth Fund (a) | | 6,918 | $99,415 |
| Fidelity Series Commodity Strategy Fund (a) | | 3,242 | 16,565 |
| Fidelity Series Large Cap Growth Index Fund (a) | | 3,562 | 62,697 |
| Fidelity Series Large Cap Stock Fund (a) | | 3,676 | 69,883 |
| Fidelity Series Large Cap Value Index Fund (a) | | 8,717 | 133,887 |
| Fidelity Series Small Cap Opportunities Fund (a) | | 2,469 | 33,627 |
| Fidelity Series Value Discovery Fund (a) | | 3,092 | 49,464 |
| TOTAL DOMESTIC EQUITY FUNDS | | | |
| (Cost $457,587) | | | 465,538 |
|
| International Equity Funds - 37.2% | | | |
| Fidelity Series Canada Fund (a) | | 2,039 | 31,650 |
| Fidelity Series Emerging Markets Fund (a) | | 1,515 | 14,061 |
| Fidelity Series Emerging Markets Opportunities Fund (a) | | 6,995 | 128,709 |
| Fidelity Series International Growth Fund (a) | | 3,817 | 63,289 |
| Fidelity Series International Index Fund (a) | | 2,350 | 26,880 |
| Fidelity Series International Small Cap Fund (a) | | 1,099 | 19,731 |
| Fidelity Series International Value Fund (a) | | 5,793 | 63,899 |
| Fidelity Series Overseas Fund (a) | | 5,042 | 63,626 |
| TOTAL INTERNATIONAL EQUITY FUNDS | | | |
| (Cost $447,495) | | | 411,845 |
|
| Bond Funds - 20.8% | | | |
| Fidelity Series 5+ Year Inflation-Protected Bond Index Fund (a) | | 115 | 1,109 |
| Fidelity Series Corporate Bond Fund (a) | | 2,659 | 26,860 |
| Fidelity Series Emerging Markets Debt Fund (a) | | 687 | 5,664 |
| Fidelity Series Emerging Markets Debt Local Currency Fund (a) | | 205 | 1,847 |
| Fidelity Series Floating Rate High Income Fund (a) | | 121 | 1,109 |
| Fidelity Series Government Bond Index Fund (a) | | 3,768 | 37,609 |
| Fidelity Series High Income Fund (a) | | 737 | 6,703 |
| Fidelity Series International Credit Fund (a) | | 6 | 53 |
| Fidelity Series International Developed Markets Bond Index Fund (a) | | 2,078 | 19,389 |
| Fidelity Series Investment Grade Bond Fund (a) | | 3,626 | 39,556 |
| Fidelity Series Investment Grade Securitized Fund (a) | | 2,849 | 27,696 |
| Fidelity Series Long-Term Treasury Bond Index Fund (a) | | 7,808 | 59,496 |
| Fidelity Series Real Estate Income Fund (a) | | 345 | 3,916 |
| TOTAL BOND FUNDS | | | |
| (Cost $244,475) | | | 231,007 |
| TOTAL INVESTMENT IN SECURITIES - 100.0% | | | |
| (Cost $1,149,557) | | | 1,108,390 |
| NET OTHER ASSETS (LIABILITIES) - 0.0% | | | 0 |
| NET ASSETS - 100% | | | $1,108,390 |
Legend
(a) Affiliated Fund
Affiliated Underlying Funds
Fiscal year to date information regarding the Fund's investments in affiliated Underlying Funds is presented below. Exchanges between classes of the same affiliated Underlying Funds may occur. If an underlying Fund changes its name, the name presented below is the name in effect at period end.
| Fund | Value, beginning of period | Purchases(a) | Sales Proceeds(a) | Dividend Income | Realized Gain (loss) | Change in Unrealized appreciation (depreciation) | Value, end of period |
| Fidelity Series 0-5 Year Inflation-Protected Bond Index Fund | $-- | $3,174 | $3,162 | $11 | $(10) | $-- | $-- |
| Fidelity Series 5+ Year Inflation-Protected Bond Index Fund | -- | 9,446 | 8,057 | 40 | (268) | (12) | 1,109 |
| Fidelity Series Blue Chip Growth Fund | 14,930 | 119,803 | 23,565 | 7,546 | (1,982) | (9,771) | 99,415 |
| Fidelity Series Canada Fund | 3,328 | 29,517 | 4,499 | 464 | 2 | 3,302 | 31,650 |
| Fidelity Series Commodity Strategy Fund | 4,295 | 27,443 | 18,552 | 2,530 | (302) | 3,681 | 16,565 |
| Fidelity Series Corporate Bond Fund | 3,459 | 29,602 | 4,102 | 390 | (149) | (1,950) | 26,860 |
| Fidelity Series Emerging Markets Debt Fund | 844 | 6,264 | 881 | 140 | (76) | (487) | 5,664 |
| Fidelity Series Emerging Markets Debt Local Currency Fund | 279 | 2,055 | 295 | 56 | (19) | (173) | 1,847 |
| Fidelity Series Emerging Markets Fund | 2,269 | 15,538 | 1,464 | 355 | (171) | (2,111) | 14,061 |
| Fidelity Series Emerging Markets Opportunities Fund | 20,427 | 152,368 | 13,108 | 11,141 | (2,324) | (28,654) | 128,709 |
| Fidelity Series Floating Rate High Income Fund | 163 | 1,197 | 244 | 26 | (5) | (2) | 1,109 |
| Fidelity Series Government Bond Index Fund | 4,267 | 40,375 | 5,050 | 195 | (156) | (1,827) | 37,609 |
| Fidelity Series Government Money Market Fund 0.31% | 402 | 529 | 931 | -- | -- | -- | -- |
| Fidelity Series High Income Fund | 976 | 7,161 | 1,153 | 198 | (37) | (244) | 6,703 |
| Fidelity Series Inflation-Protected Bond Index Fund | 3,097 | 13,628 | 16,816 | 161 | 253 | (162) | -- |
| Fidelity Series International Credit Fund | 55 | 2 | -- | 2 | -- | (4) | 53 |
| Fidelity Series International Developed Markets Bond Index Fund | -- | 20,972 | 873 | 4 | (39) | (671) | 19,389 |
| Fidelity Series International Growth Fund | 8,184 | 70,789 | 6,821 | 3,741 | (590) | (8,273) | 63,289 |
| Fidelity Series International Index Fund | 3,417 | 28,311 | 3,297 | 499 | (144) | (1,407) | 26,880 |
| Fidelity Series International Small Cap Fund | 2,952 | 23,098 | 2,040 | 1,936 | (285) | (3,994) | 19,731 |
| Fidelity Series International Value Fund | 8,175 | 66,246 | 9,672 | 2,347 | (189) | (661) | 63,899 |
| Fidelity Series Investment Grade Bond Fund | 4,736 | 42,777 | 5,680 | 443 | (156) | (2,121) | 39,556 |
| Fidelity Series Investment Grade Securitized Fund | 3,318 | 29,615 | 3,812 | 151 | (95) | (1,330) | 27,696 |
| Fidelity Series Large Cap Growth Index Fund | 9,424 | 68,748 | 15,788 | 1,322 | (281) | 594 | 62,697 |
| Fidelity Series Large Cap Stock Fund | 10,296 | 71,616 | 13,810 | 2,677 | (203) | 1,984 | 69,883 |
| Fidelity Series Large Cap Value Index Fund | 19,667 | 140,670 | 27,729 | 6,917 | (366) | 1,645 | 133,887 |
| Fidelity Series Long-Term Treasury Bond Index Fund | 4,234 | 63,578 | 4,078 | 512 | (378) | (3,860) | 59,496 |
| Fidelity Series Overseas Fund | 8,197 | 68,105 | 7,384 | 1,386 | (425) | (4,867) | 63,626 |
| Fidelity Series Real Estate Income Fund | 589 | 4,075 | 699 | 84 | (12) | (37) | 3,916 |
| Fidelity Series Short-Term Credit Fund | 198 | 459 | 652 | 3 | 1 | (6) | -- |
| Fidelity Series Small Cap Opportunities Fund | 4,975 | 36,676 | 5,229 | 2,673 | (666) | (2,129) | 33,627 |
| Fidelity Series Treasury Bill Index Fund | 638 | 1,427 | 2,065 | -- | -- | -- | -- |
| Fidelity Series Value Discovery Fund | 7,267 | 53,352 | 9,724 | 4,666 | (264) | (1,167) | 49,464 |
| | $155,058 | $1,248,616 | $221,232 | $52,616 | $(9,336) | $(64,714) | $1,108,390 |
(a) Includes the value of shares purchased or redeemed through in-kind transactions, as applicable.
Amounts in the income column in the above table include any capital gain distributions from underlying funds, which are presented in the corresponding line-item in the Statement of Operations, if applicable.
Investment Valuation
The following is a summary of the inputs used, as of March 31, 2022, involving the Fund's assets and liabilities carried at fair value. The inputs or methodology used for valuing securities may not be an indication of the risk associated with investing in those securities. For more information on valuation inputs, and their aggregation into the levels used below, please refer to the Investment Valuation section in the accompanying Notes to Financial Statements.
| | Valuation Inputs at Reporting Date: |
| Description | Total | Level 1 | Level 2 | Level 3 |
| Investments in Securities: | | | | |
| Domestic Equity Funds | $465,538 | $465,538 | $-- | $-- |
| International Equity Funds | 411,845 | 411,845 | -- | -- |
| Bond Funds | 231,007 | 231,007 | -- | -- |
| Total Investments in Securities: | $1,108,390 | $1,108,390 | $-- | $-- |
See accompanying notes which are an integral part of the financial statements.
Fidelity Flex® Freedom Blend 2035 Fund
Financial Statements
Statement of Assets and Liabilities
| | | March 31, 2022 |
| Assets | | |
Investment in securities, at value — See accompanying schedule:
| | |
| Affiliated issuers (cost $1,149,557) | $1,108,390 | |
| Total Investment in Securities (cost $1,149,557) | | $1,108,390 |
| Receivable for investments sold | | 17,772 |
| Receivable for fund shares sold | | 11,917 |
| Total assets | | 1,138,079 |
| Liabilities | | |
| Payable for investments purchased | $29,689 | |
| Total liabilities | | 29,689 |
| Net Assets | | $1,108,390 |
| Net Assets consist of: | | |
| Paid in capital | | $1,136,435 |
| Total accumulated earnings (loss) | | (28,045) |
| Net Assets | | $1,108,390 |
| Net Asset Value, offering price and redemption price per share ($1,108,390 ÷ 93,630 shares) | | $11.84 |
See accompanying notes which are an integral part of the financial statements.
Statement of Operations
| | | Year ended March 31, 2022 |
| Investment Income | | |
| Dividends: | | |
| Affiliated issuers | | $16,953 |
| Expenses | | |
| Independent trustees' fees and expenses | $1 | |
| Total expenses | | 1 |
| Net investment income (loss) | | 16,952 |
| Realized and Unrealized Gain (Loss) | | |
| Net realized gain (loss) on: | | |
| Investment securities: | | |
| Affiliated issuers | (9,336) | |
| Capital gain distributions from underlying funds: | | |
| Affiliated issuers | 35,663 | |
| Total net realized gain (loss) | | 26,327 |
| Change in net unrealized appreciation (depreciation) on: | | |
| Investment securities: | | |
| Affiliated issuers | (64,714) | |
| Total change in net unrealized appreciation (depreciation) | | (64,714) |
| Net gain (loss) | | (38,387) |
| Net increase (decrease) in net assets resulting from operations | | $(21,435) |
See accompanying notes which are an integral part of the financial statements.
Statement of Changes in Net Assets
| | Year ended March 31, 2022 | Year ended March 31, 2021 |
| Increase (Decrease) in Net Assets | | |
| Operations | | |
| Net investment income (loss) | $16,952 | $2,242 |
| Net realized gain (loss) | 26,327 | 8,031 |
| Change in net unrealized appreciation (depreciation) | (64,714) | 41,816 |
| Net increase (decrease) in net assets resulting from operations | (21,435) | 52,089 |
| Distributions to shareholders | (33,819) | (8,194) |
| Share transactions | | |
| Proceeds from sales of shares | 1,081,834 | – |
| Reinvestment of distributions | 33,819 | 8,194 |
| Cost of shares redeemed | (107,068) | – |
| Net increase (decrease) in net assets resulting from share transactions | 1,008,585 | 8,194 |
| Total increase (decrease) in net assets | 953,331 | 52,089 |
| Net Assets | | |
| Beginning of period | 155,059 | 102,970 |
| End of period | $1,108,390 | $155,059 |
| Other Information | | |
| Shares | | |
| Sold | 86,853 | – |
| Issued in reinvestment of distributions | 2,679 | 747 |
| Redeemed | (8,604) | – |
| Net increase (decrease) | 80,928 | 747 |
See accompanying notes which are an integral part of the financial statements.
Financial Highlights
Fidelity Flex Freedom Blend 2035 Fund
| | | | | | |
| Years ended March 31, | 2022 | 2021 | 2020 | 2019 | 2018 A |
| Selected Per–Share Data | | | | | |
| Net asset value, beginning of period | $12.21 | $8.61 | $10.15 | $10.65 | $10.00 |
| Income from Investment Operations | | | | | |
| Net investment income (loss)B,C | .37 | .18 | .24 | .22 | .17 |
| Net realized and unrealized gain (loss) | .02D | 4.10 | (1.02) | .02 | .81 |
| Total from investment operations | .39 | 4.28 | (.78) | .24 | .98 |
| Distributions from net investment income | (.25) | (.18) | (.24) | (.22) | (.16) |
| Distributions from net realized gain | (.51) | (.49) | (.52) | (.52) | (.16) |
| Total distributions | (.76) | (.68)E | (.76) | (.74) | (.33)E |
| Net asset value, end of period | $11.84 | $12.21 | $8.61 | $10.15 | $10.65 |
| Total ReturnF | 2.94% | 50.67% | (8.74)% | 2.75% | 9.77% |
| Ratios to Average Net AssetsC,G,H | | | | | |
| Expenses before reductions | - %I | - %I | - %I | - %I | - %J |
| Expenses net of fee waivers, if any | - %I | - %I | - %I | - %I | - %J |
| Expenses net of all reductions | - %I | - %I | - %I | - %I | - %J |
| Net investment income (loss) | 3.00% | 1.68% | 2.32% | 2.16% | 2.02%J |
| Supplemental Data | | | | | |
| Net assets, end of period (000 omitted) | $1,108 | $155 | $103 | $113 | $110 |
| Portfolio turnover rateK | 38% | 23% | 65% | 20% | 14%J |
A For the period June 8, 2017 (commencement of operations) through March 31, 2018.
B Calculated based on average shares outstanding during the period.
C Net investment income (loss) is affected by the timing of the declaration of dividends by any underlying mutual funds or exchange-traded funds (ETFs). Net investment income (loss) of any such underlying funds is not included in the Fund's net investment income (loss) ratio.
D The amount shown for a share outstanding does not correspond with the aggregate net gain (loss) on investments for the period due to the timing of sales and repurchases of shares in relation to fluctuating market values of the investments of the Fund.
E Total distributions per share do not sum due to rounding.
F Total returns for periods of less than one year are not annualized.
G Fees and expenses of any underlying mutual funds or exchange-traded funds (ETFs) are not included in the Fund's expense ratio. The Fund indirectly bears its proportionate share of these expenses.
H Expense ratios reflect operating expenses of the class. Expenses before reductions do not reflect amounts reimbursed, waived, or reduced through arrangements with the investment adviser, brokerage services, or other offset arrangements, if applicable, and do not represent the amount paid by the class during periods when reimbursements, waivers or reductions occur.
I Amount represents less than .005%.
J Annualized
K Amount does not include the portfolio activity of any underlying mutual funds or exchange-traded funds (ETFs).
See accompanying notes which are an integral part of the financial statements.
Fidelity Flex® Freedom Blend 2040 Fund
Investment Summary (Unaudited)
The information in the following tables is based on the direct investments of the Fund.
Top Holdings as of March 31, 2022
| | % of fund's net assets |
| Fidelity Series Large Cap Value Index Fund | 14.2 |
| Fidelity Series Emerging Markets Opportunities Fund | 12.9 |
| Fidelity Series Blue Chip Growth Fund | 10.6 |
| Fidelity Series Large Cap Stock Fund | 7.4 |
| Fidelity Series Large Cap Growth Index Fund | 6.7 |
| Fidelity Series International Value Fund | 6.6 |
| Fidelity Series Overseas Fund | 6.6 |
| Fidelity Series International Growth Fund | 6.5 |
| Fidelity Series Long-Term Treasury Bond Index Fund | 5.4 |
| Fidelity Series Value Discovery Fund | 5.3 |
| | 82.2 |
Asset Allocation (% of fund's net assets)
| Period end |
| | Domestic Equity Funds | 49.3% |
| | International Equity Funds | 42.1% |
| | Bond Funds | 8.6% |

Domestic Equity Funds category includes Fidelity Series Commodity Strategy Fund which invests in commodity-related investments.
Fidelity Flex® Freedom Blend 2040 Fund
Schedule of Investments March 31, 2022
Showing Percentage of Net Assets
| Domestic Equity Funds - 49.3% | | | |
| | | Shares | Value |
| Fidelity Series Blue Chip Growth Fund (a) | | 6,235 | $89,590 |
| Fidelity Series Commodity Strategy Fund (a) | | 2,480 | 12,672 |
| Fidelity Series Large Cap Growth Index Fund (a) | | 3,211 | 56,512 |
| Fidelity Series Large Cap Stock Fund (a) | | 3,313 | 62,975 |
| Fidelity Series Large Cap Value Index Fund (a) | | 7,855 | 120,656 |
| Fidelity Series Small Cap Opportunities Fund (a) | | 2,225 | 30,301 |
| Fidelity Series Value Discovery Fund (a) | | 2,786 | 44,575 |
| TOTAL DOMESTIC EQUITY FUNDS | | | |
| (Cost $411,052) | | | 417,281 |
|
| International Equity Funds - 42.1% | | | |
| Fidelity Series Canada Fund (a) | | 1,782 | 27,659 |
| Fidelity Series Emerging Markets Fund (a) | | 1,283 | 11,904 |
| Fidelity Series Emerging Markets Opportunities Fund (a) | | 5,912 | 108,788 |
| Fidelity Series International Growth Fund (a) | | 3,335 | 55,299 |
| Fidelity Series International Index Fund (a) | | 2,053 | 23,490 |
| Fidelity Series International Small Cap Fund (a) | | 960 | 17,235 |
| Fidelity Series International Value Fund (a) | | 5,061 | 55,826 |
| Fidelity Series Overseas Fund (a) | | 4,405 | 55,591 |
| TOTAL INTERNATIONAL EQUITY FUNDS | | | |
| (Cost $375,312) | | | 355,792 |
|
| Bond Funds - 8.6% | | | |
| Fidelity Series 5+ Year Inflation-Protected Bond Index Fund (a) | | 88 | 848 |
| Fidelity Series Corporate Bond Fund (a) | | 223 | 2,251 |
| Fidelity Series Emerging Markets Debt Fund (a) | | 522 | 4,308 |
| Fidelity Series Emerging Markets Debt Local Currency Fund (a) | | 156 | 1,404 |
| Fidelity Series Floating Rate High Income Fund (a) | | 92 | 843 |
| Fidelity Series Government Bond Index Fund (a) | | 319 | 3,187 |
| Fidelity Series High Income Fund (a) | | 564 | 5,127 |
| Fidelity Series International Credit Fund (a) | | 6 | 53 |
| Fidelity Series International Developed Markets Bond Index Fund (a) | | 78 | 725 |
| Fidelity Series Investment Grade Bond Fund (a) | | 307 | 3,354 |
| Fidelity Series Investment Grade Securitized Fund (a) | | 239 | 2,324 |
| Fidelity Series Long-Term Treasury Bond Index Fund (a) | | 5,965 | 45,457 |
| Fidelity Series Real Estate Income Fund (a) | | 261 | 2,959 |
| TOTAL BOND FUNDS | | | |
| (Cost $76,622) | | | 72,840 |
| TOTAL INVESTMENT IN SECURITIES - 100.0% | | | |
| (Cost $862,986) | | | 845,913 |
| NET OTHER ASSETS (LIABILITIES) - 0.0% | | | (2) |
| NET ASSETS - 100% | | | $845,911 |
Legend
(a) Affiliated Fund
Affiliated Underlying Funds
Fiscal year to date information regarding the Fund's investments in affiliated Underlying Funds is presented below. Exchanges between classes of the same affiliated Underlying Funds may occur. If an underlying Fund changes its name, the name presented below is the name in effect at period end.
| Fund | Value, beginning of period | Purchases(a) | Sales Proceeds(a) | Dividend Income | Realized Gain (loss) | Change in Unrealized appreciation (depreciation) | Value, end of period |
| Fidelity Series 0-5 Year Inflation-Protected Bond Index Fund | $-- | $2,442 | $2,438 | $5 | $(2) | $-- | $-- |
| Fidelity Series 5+ Year Inflation-Protected Bond Index Fund | -- | 7,070 | 6,047 | 22 | (163) | (12) | 848 |
| Fidelity Series Blue Chip Growth Fund | 17,406 | 96,311 | 14,013 | 6,611 | (1,908) | (8,206) | 89,590 |
| Fidelity Series Canada Fund | 3,830 | 24,716 | 3,152 | 267 | (10) | 2,275 | 27,659 |
| Fidelity Series Commodity Strategy Fund | 4,388 | 17,562 | 11,125 | 2,237 | (81) | 1,928 | 12,672 |
| Fidelity Series Corporate Bond Fund | 16 | 2,746 | 441 | 8 | (12) | (58) | 2,251 |
| Fidelity Series Emerging Markets Debt Fund | 863 | 4,332 | 545 | 88 | (53) | (289) | 4,308 |
| Fidelity Series Emerging Markets Debt Local Currency Fund | 286 | 1,407 | 184 | 29 | (14) | (91) | 1,404 |
| Fidelity Series Emerging Markets Fund | 2,515 | 12,030 | 878 | 199 | (125) | (1,638) | 11,904 |
| Fidelity Series Emerging Markets Opportunities Fund | 22,634 | 116,549 | 8,854 | 6,237 | (1,769) | (19,772) | 108,788 |
| Fidelity Series Floating Rate High Income Fund | 168 | 811 | 132 | 16 | (2) | (2) | 843 |
| Fidelity Series Government Bond Index Fund | 20 | 3,920 | 673 | 4 | (12) | (68) | 3,187 |
| Fidelity Series Government Money Market Fund 0.31% | 410 | 113 | 523 | -- | -- | -- | -- |
| Fidelity Series High Income Fund | 999 | 4,929 | 640 | 120 | (22) | (139) | 5,127 |
| Fidelity Series Inflation-Protected Bond Index Fund | 3,157 | 3,533 | 6,805 | 66 | 273 | (158) | -- |
| Fidelity Series International Credit Fund | 55 | 2 | -- | 2 | -- | (4) | 53 |
| Fidelity Series International Developed Markets Bond Index Fund | -- | 826 | 75 | -- | (3) | (23) | 725 |
| Fidelity Series International Growth Fund | 9,418 | 56,048 | 4,303 | 2,157 | (517) | (5,347) | 55,299 |
| Fidelity Series International Index Fund | 3,932 | 22,736 | 2,096 | 287 | (131) | (951) | 23,490 |
| Fidelity Series International Small Cap Fund | 3,368 | 17,803 | 1,299 | 1,121 | (256) | (2,381) | 17,235 |
| Fidelity Series International Value Fund | 9,431 | 53,420 | 6,246 | 1,354 | (187) | (592) | 55,826 |
| Fidelity Series Investment Grade Bond Fund | 22 | 4,169 | 753 | 10 | (14) | (70) | 3,354 |
| Fidelity Series Investment Grade Securitized Fund | 15 | 2,796 | 434 | 4 | (7) | (46) | 2,324 |
| Fidelity Series Large Cap Growth Index Fund | 10,983 | 54,933 | 9,299 | 807 | (535) | 430 | 56,512 |
| Fidelity Series Large Cap Stock Fund | 12,008 | 58,385 | 7,590 | 1,880 | (170) | 342 | 62,975 |
| Fidelity Series Large Cap Value Index Fund | 22,938 | 114,830 | 17,134 | 4,294 | (529) | 551 | 120,656 |
| Fidelity Series Long-Term Treasury Bond Index Fund | 4,326 | 46,230 | 2,437 | 307 | (323) | (2,339) | 45,457 |
| Fidelity Series Overseas Fund | 9,434 | 54,201 | 4,448 | 799 | (392) | (3,204) | 55,591 |
| Fidelity Series Real Estate Income Fund | 602 | 2,867 | 479 | 54 | (12) | (19) | 2,959 |
| Fidelity Series Short-Term Credit Fund | 202 | 98 | 300 | 1 | 6 | (6) | -- |
| Fidelity Series Small Cap Opportunities Fund | 5,814 | 30,104 | 2,490 | 2,541 | (436) | (2,691) | 30,301 |
| Fidelity Series Treasury Bill Index Fund | 652 | 332 | 984 | -- | -- | -- | -- |
| Fidelity Series Value Discovery Fund | 8,475 | 42,852 | 5,342 | 3,177 | (248) | (1,162) | 44,575 |
| | $158,367 | $861,103 | $122,159 | $34,704 | $(7,654) | $(43,742) | $845,913 |
(a) Includes the value of shares purchased or redeemed through in-kind transactions, as applicable.
Amounts in the income column in the above table include any capital gain distributions from underlying funds, which are presented in the corresponding line-item in the Statement of Operations, if applicable.
Investment Valuation
The following is a summary of the inputs used, as of March 31, 2022, involving the Fund's assets and liabilities carried at fair value. The inputs or methodology used for valuing securities may not be an indication of the risk associated with investing in those securities. For more information on valuation inputs, and their aggregation into the levels used below, please refer to the Investment Valuation section in the accompanying Notes to Financial Statements.
| | Valuation Inputs at Reporting Date: |
| Description | Total | Level 1 | Level 2 | Level 3 |
| Investments in Securities: | | | | |
| Domestic Equity Funds | $417,281 | $417,281 | $-- | $-- |
| International Equity Funds | 355,792 | 355,792 | -- | -- |
| Bond Funds | 72,840 | 72,840 | -- | -- |
| Total Investments in Securities: | $845,913 | $845,913 | $-- | $-- |
See accompanying notes which are an integral part of the financial statements.
Fidelity Flex® Freedom Blend 2040 Fund
Financial Statements
Statement of Assets and Liabilities
| | | March 31, 2022 |
| Assets | | |
Investment in securities, at value — See accompanying schedule:
| | |
| Affiliated issuers (cost $862,986) | $845,913 | |
| Total Investment in Securities (cost $862,986) | | $845,913 |
| Receivable for investments sold | | 13,399 |
| Receivable for fund shares sold | | 4,453 |
| Total assets | | 863,765 |
| Liabilities | | |
| Payable for investments purchased | $17,854 | |
| Total liabilities | | 17,854 |
| Net Assets | | $845,911 |
| Net Assets consist of: | | |
| Paid in capital | | $857,679 |
| Total accumulated earnings (loss) | | (11,768) |
| Net Assets | | $845,911 |
| Net Asset Value, offering price and redemption price per share ($845,911 ÷ 70,108 shares) | | $12.07 |
See accompanying notes which are an integral part of the financial statements.
Statement of Operations
| | | Year ended March 31, 2022 |
| Investment Income | | |
| Dividends: | | |
| Affiliated issuers | | $10,076 |
| Expenses | | |
| Independent trustees' fees and expenses | $1 | |
| Total expenses | | 1 |
| Net investment income (loss) | | 10,075 |
| Realized and Unrealized Gain (Loss) | | |
| Net realized gain (loss) on: | | |
| Investment securities: | | |
| Affiliated issuers | (7,654) | |
| Capital gain distributions from underlying funds: | | |
| Affiliated issuers | 24,628 | |
| Total net realized gain (loss) | | 16,974 |
| Change in net unrealized appreciation (depreciation) on: | | |
| Investment securities: | | |
| Affiliated issuers | (43,742) | |
| Total change in net unrealized appreciation (depreciation) | | (43,742) |
| Net gain (loss) | | (26,768) |
| Net increase (decrease) in net assets resulting from operations | | $(16,693) |
See accompanying notes which are an integral part of the financial statements.
Statement of Changes in Net Assets
| | Year ended March 31, 2022 | Year ended March 31, 2021 |
| Increase (Decrease) in Net Assets | | |
| Operations | | |
| Net investment income (loss) | $10,075 | $2,235 |
| Net realized gain (loss) | 16,974 | 8,341 |
| Change in net unrealized appreciation (depreciation) | (43,742) | 46,701 |
| Net increase (decrease) in net assets resulting from operations | (16,693) | 57,277 |
| Distributions to shareholders | (25,541) | (8,303) |
| Share transactions | | |
| Proceeds from sales of shares | 768,184 | – |
| Reinvestment of distributions | 25,541 | 8,302 |
| Cost of shares redeemed | (63,945) | – |
| Net increase (decrease) in net assets resulting from share transactions | 729,780 | 8,302 |
| Total increase (decrease) in net assets | 687,546 | 57,276 |
| Net Assets | | |
| Beginning of period | 158,365 | 101,089 |
| End of period | $845,911 | $158,365 |
| Other Information | | |
| Shares | | |
| Sold | 60,574 | – |
| Issued in reinvestment of distributions | 1,981 | 751 |
| Redeemed | (5,153) | – |
| Net increase (decrease) | 57,402 | 751 |
See accompanying notes which are an integral part of the financial statements.
Financial Highlights
Fidelity Flex Freedom Blend 2040 Fund
| | | | | | |
| Years ended March 31, | 2022 | 2021 | 2020 | 2019 | 2018 A |
| Selected Per–Share Data | | | | | |
| Net asset value, beginning of period | $12.46 | $8.46 | $10.13 | $10.66 | $10.00 |
| Income from Investment Operations | | | | | |
| Net investment income (loss)B,C | .35 | .18 | .23 | .22 | .17 |
| Net realized and unrealized gain (loss) | .18D | 4.51 | (1.16) | –E | .82 |
| Total from investment operations | .53 | 4.69 | (.93) | .22 | .99 |
| Distributions from net investment income | (.27) | (.18) | (.24) | (.22) | (.17) |
| Distributions from net realized gain | (.65) | (.50) | (.51) | (.53) | (.17) |
| Total distributions | (.92) | (.69)F | (.74)F | (.75) | (.33)F |
| Net asset value, end of period | $12.07 | $12.46 | $8.46 | $10.13 | $10.66 |
| Total ReturnG | 3.91% | 56.53% | (10.27)% | 2.57% | 9.89% |
| Ratios to Average Net AssetsC,H,I | | | | | |
| Expenses before reductions | - %J | - %J | - %J | - %J | - %K |
| Expenses net of fee waivers, if any | - %J | - %J | - %J | - %J | - %K |
| Expenses net of all reductions | - %J | - %J | - %J | - %J | - %K |
| Net investment income (loss) | 2.84% | 1.67% | 2.30% | 2.13% | 2.01%K |
| Supplemental Data | | | | | |
| Net assets, end of period (000 omitted) | $846 | $158 | $101 | $113 | $110 |
| Portfolio turnover rateL | 33% | 18% | 61% | 20% | 13%K |
A For the period June 8, 2017 (commencement of operations) through March 31, 2018.
B Calculated based on average shares outstanding during the period.
C Net investment income (loss) is affected by the timing of the declaration of dividends by any underlying mutual funds or exchange-traded funds (ETFs). Net investment income (loss) of any such underlying funds is not included in the Fund's net investment income (loss) ratio.
D The amount shown for a share outstanding does not correspond with the aggregate net gain (loss) on investments for the period due to the timing of sales and repurchases of shares in relation to fluctuating market values of the investments of the Fund.
E Amount represents less than $.005 per share.
F Total distributions per share do not sum due to rounding.
G Total returns for periods of less than one year are not annualized.
H Fees and expenses of any underlying mutual funds or exchange-traded funds (ETFs) are not included in the Fund's expense ratio. The Fund indirectly bears its proportionate share of these expenses.
I Expense ratios reflect operating expenses of the class. Expenses before reductions do not reflect amounts reimbursed, waived, or reduced through arrangements with the investment adviser, brokerage services, or other offset arrangements, if applicable, and do not represent the amount paid by the class during periods when reimbursements, waivers or reductions occur.
J Amount represents less than .005%.
K Annualized
L Amount does not include the portfolio activity of any underlying mutual funds or exchange-traded funds (ETFs).
See accompanying notes which are an integral part of the financial statements.
Fidelity Flex® Freedom Blend 2045 Fund
Investment Summary (Unaudited)
The information in the following tables is based on the direct investments of the Fund.
Top Holdings as of March 31, 2022
| | % of fund's net assets |
| Fidelity Series Large Cap Value Index Fund | 14.4 |
| Fidelity Series Emerging Markets Opportunities Fund | 12.9 |
| Fidelity Series Blue Chip Growth Fund | 10.7 |
| Fidelity Series Large Cap Stock Fund | 7.5 |
| Fidelity Series Large Cap Growth Index Fund | 6.8 |
| Fidelity Series International Value Fund | 6.7 |
| Fidelity Series Overseas Fund | 6.6 |
| Fidelity Series International Growth Fund | 6.6 |
| Fidelity Series Long-Term Treasury Bond Index Fund | 5.4 |
| Fidelity Series Value Discovery Fund | 5.3 |
| | 82.9 |
Asset Allocation (% of fund's net assets)
| Period end |
| | Domestic Equity Funds | 49.8% |
| | International Equity Funds | 42.4% |
| | Bond Funds | 7.8% |

Domestic Equity Funds category includes Fidelity Series Commodity Strategy Fund which invests in commodity-related investments.
Fidelity Flex® Freedom Blend 2045 Fund
Schedule of Investments March 31, 2022
Showing Percentage of Net Assets
| Domestic Equity Funds - 49.8% | | | |
| | | Shares | Value |
| Fidelity Series Blue Chip Growth Fund (a) | | 7,199 | $103,446 |
| Fidelity Series Commodity Strategy Fund (a) | | 2,834 | 14,484 |
| Fidelity Series Large Cap Growth Index Fund (a) | | 3,707 | 65,236 |
| Fidelity Series Large Cap Stock Fund (a) | | 3,825 | 72,716 |
| Fidelity Series Large Cap Value Index Fund (a) | | 9,070 | 139,308 |
| Fidelity Series Small Cap Opportunities Fund (a) | | 2,569 | 34,990 |
| Fidelity Series Value Discovery Fund (a) | | 3,217 | 51,470 |
| TOTAL DOMESTIC EQUITY FUNDS | | | |
| (Cost $476,238) | | | 481,650 |
|
| International Equity Funds - 42.4% | | | |
| Fidelity Series Canada Fund (a) | | 2,055 | 31,889 |
| Fidelity Series Emerging Markets Fund (a) | | 1,471 | 13,652 |
| Fidelity Series Emerging Markets Opportunities Fund (a) | | 6,804 | 125,198 |
| Fidelity Series International Growth Fund (a) | | 3,846 | 63,775 |
| Fidelity Series International Index Fund (a) | | 2,367 | 27,083 |
| Fidelity Series International Small Cap Fund (a) | | 1,108 | 19,886 |
| Fidelity Series International Value Fund (a) | | 5,838 | 64,392 |
| Fidelity Series Overseas Fund (a) | | 5,080 | 64,116 |
| TOTAL INTERNATIONAL EQUITY FUNDS | | | |
| (Cost $435,526) | | | 409,991 |
|
| Bond Funds - 7.8% | | | |
| Fidelity Series 5+ Year Inflation-Protected Bond Index Fund (a) | | 101 | 969 |
| Fidelity Series Corporate Bond Fund (a) | | 106 | 1,067 |
| Fidelity Series Emerging Markets Debt Fund (a) | | 595 | 4,908 |
| Fidelity Series Emerging Markets Debt Local Currency Fund (a) | | 178 | 1,604 |
| Fidelity Series Floating Rate High Income Fund (a) | | 105 | 964 |
| Fidelity Series Government Bond Index Fund (a) | | 155 | 1,550 |
| Fidelity Series High Income Fund (a) | | 645 | 5,862 |
| Fidelity Series International Credit Fund (a) | | 6 | 53 |
| Fidelity Series Investment Grade Bond Fund (a) | | 150 | 1,636 |
| Fidelity Series Investment Grade Securitized Fund (a) | | 114 | 1,106 |
| Fidelity Series Long-Term Treasury Bond Index Fund (a) | | 6,819 | 51,964 |
| Fidelity Series Real Estate Income Fund (a) | | 301 | 3,425 |
| TOTAL BOND FUNDS | | | |
| (Cost $79,141) | | | 75,108 |
| TOTAL INVESTMENT IN SECURITIES - 100.0% | | | |
| (Cost $990,905) | | | 966,749 |
| NET OTHER ASSETS (LIABILITIES) - 0.0% | | | 1 |
| NET ASSETS - 100% | | | $966,750 |
Legend
(a) Affiliated Fund
Affiliated Underlying Funds
Fiscal year to date information regarding the Fund's investments in affiliated Underlying Funds is presented below. Exchanges between classes of the same affiliated Underlying Funds may occur. If an underlying Fund changes its name, the name presented below is the name in effect at period end.
| Fund | Value, beginning of period | Purchases(a) | Sales Proceeds(a) | Dividend Income | Realized Gain (loss) | Change in Unrealized appreciation (depreciation) | Value, end of period |
| Fidelity Series 0-5 Year Inflation-Protected Bond Index Fund | $-- | $3,068 | $3,064 | $6 | $(2) | $-- | $-- |
| Fidelity Series 5+ Year Inflation-Protected Bond Index Fund | -- | 8,156 | 6,998 | 24 | (178) | (11) | 969 |
| Fidelity Series Blue Chip Growth Fund | 17,406 | 127,655 | 29,776 | 10,077 | (2,353) | (9,486) | 103,446 |
| Fidelity Series Canada Fund | 3,830 | 30,859 | 5,670 | 324 | 13 | 2,857 | 31,889 |
| Fidelity Series Commodity Strategy Fund | 4,388 | 24,405 | 15,465 | 3,656 | (700) | 1,856 | 14,484 |
| Fidelity Series Corporate Bond Fund | 16 | 1,517 | 455 | 3 | (11) | -- | 1,067 |
| Fidelity Series Emerging Markets Debt Fund | 863 | 5,394 | 923 | 115 | (87) | (339) | 4,908 |
| Fidelity Series Emerging Markets Debt Local Currency Fund | 286 | 1,725 | 267 | 35 | (13) | (127) | 1,604 |
| Fidelity Series Emerging Markets Fund | 2,515 | 15,832 | 2,451 | 241 | (141) | (2,103) | 13,652 |
| Fidelity Series Emerging Markets Opportunities Fund | 22,635 | 151,827 | 21,995 | 7,580 | (2,044) | (25,225) | 125,198 |
| Fidelity Series Floating Rate High Income Fund | 168 | 1,016 | 215 | 21 | (4) | (1) | 964 |
| Fidelity Series Government Bond Index Fund | 20 | 2,290 | 743 | 1 | (11) | (6) | 1,550 |
| Fidelity Series Government Money Market Fund 0.31% | 410 | 467 | 877 | -- | -- | -- | -- |
| Fidelity Series High Income Fund | 999 | 6,133 | 1,079 | 156 | (28) | (163) | 5,862 |
| Fidelity Series Inflation-Protected Bond Index Fund | 3,157 | 8,560 | 11,855 | 103 | 296 | (158) | -- |
| Fidelity Series International Credit Fund | 55 | 2 | -- | 2 | -- | (4) | 53 |
| Fidelity Series International Growth Fund | 9,419 | 71,603 | 10,849 | 2,624 | (562) | (5,836) | 63,775 |
| Fidelity Series International Index Fund | 3,932 | 28,481 | 4,122 | 348 | (108) | (1,100) | 27,083 |
| Fidelity Series International Small Cap Fund | 3,367 | 22,894 | 3,554 | 1,360 | (239) | (2,582) | 19,886 |
| Fidelity Series International Value Fund | 9,432 | 66,469 | 10,781 | 1,648 | (179) | (549) | 64,392 |
| Fidelity Series Investment Grade Bond Fund | 22 | 2,460 | 830 | 3 | (12) | (4) | 1,636 |
| Fidelity Series Investment Grade Securitized Fund | 15 | 1,550 | 450 | 1 | (5) | (4) | 1,106 |
| Fidelity Series Large Cap Growth Index Fund | 10,984 | 72,623 | 19,397 | 981 | (262) | 1,288 | 65,236 |
| Fidelity Series Large Cap Stock Fund | 12,008 | 76,443 | 15,558 | 3,050 | (150) | (27) | 72,716 |
| Fidelity Series Large Cap Value Index Fund | 22,940 | 149,301 | 33,959 | 5,224 | (372) | 1,398 | 139,308 |
| Fidelity Series Long-Term Treasury Bond Index Fund | 4,326 | 57,163 | 6,414 | 399 | (381) | (2,730) | 51,964 |
| Fidelity Series Overseas Fund | 9,434 | 68,984 | 10,803 | 971 | (373) | (3,126) | 64,116 |
| Fidelity Series Real Estate Income Fund | 602 | 3,489 | 631 | 73 | (6) | (29) | 3,425 |
| Fidelity Series Short-Term Credit Fund | 202 | 295 | 497 | 1 | 6 | (6) | -- |
| Fidelity Series Small Cap Opportunities Fund | 5,814 | 40,037 | 7,014 | 4,034 | (488) | (3,359) | 34,990 |
| Fidelity Series Treasury Bill Index Fund | 652 | 1,016 | 1,668 | -- | -- | -- | -- |
| Fidelity Series Value Discovery Fund | 8,475 | 55,568 | 11,073 | 3,855 | (214) | (1,286) | 51,470 |
| | $158,372 | $1,107,282 | $239,433 | $46,916 | $(8,608) | $(50,862) | $966,749 |
(a) Includes the value of shares purchased or redeemed through in-kind transactions, as applicable.
Amounts in the income column in the above table include any capital gain distributions from underlying funds, which are presented in the corresponding line-item in the Statement of Operations, if applicable.
Investment Valuation
The following is a summary of the inputs used, as of March 31, 2022, involving the Fund's assets and liabilities carried at fair value. The inputs or methodology used for valuing securities may not be an indication of the risk associated with investing in those securities. For more information on valuation inputs, and their aggregation into the levels used below, please refer to the Investment Valuation section in the accompanying Notes to Financial Statements.
| | Valuation Inputs at Reporting Date: |
| Description | Total | Level 1 | Level 2 | Level 3 |
| Investments in Securities: | | | | |
| Domestic Equity Funds | $481,650 | $481,650 | $-- | $-- |
| International Equity Funds | 409,991 | 409,991 | -- | -- |
| Bond Funds | 75,108 | 75,108 | -- | -- |
| Total Investments in Securities: | $966,749 | $966,749 | $-- | $-- |
See accompanying notes which are an integral part of the financial statements.
Fidelity Flex® Freedom Blend 2045 Fund
Financial Statements
Statement of Assets and Liabilities
| | | March 31, 2022 |
| Assets | | |
Investment in securities, at value — See accompanying schedule:
| | |
| Affiliated issuers (cost $990,905) | $966,749 | |
| Total Investment in Securities (cost $990,905) | | $966,749 |
| Receivable for investments sold | | 15,710 |
| Receivable for fund shares sold | | 3,195 |
| Total assets | | 985,654 |
| Liabilities | | |
| Payable for investments purchased | $18,904 | |
| Total liabilities | | 18,904 |
| Net Assets | | $966,750 |
| Net Assets consist of: | | |
| Paid in capital | | $984,190 |
| Total accumulated earnings (loss) | | (17,440) |
| Net Assets | | $966,750 |
| Net Asset Value, offering price and redemption price per share ($966,750 ÷ 81,188 shares) | | $11.91 |
See accompanying notes which are an integral part of the financial statements.
Statement of Operations
| | | Year ended March 31, 2022 |
| Investment Income | | |
| Dividends: | | |
| Affiliated issuers | | $13,377 |
| Expenses | | |
| Independent trustees' fees and expenses | $1 | |
| Total expenses | | 1 |
| Net investment income (loss) | | 13,376 |
| Realized and Unrealized Gain (Loss) | | |
| Net realized gain (loss) on: | | |
| Investment securities: | | |
| Affiliated issuers | (8,608) | |
| Capital gain distributions from underlying funds: | | |
| Affiliated issuers | 33,539 | |
| Total net realized gain (loss) | | 24,931 |
| Change in net unrealized appreciation (depreciation) on: | | |
| Investment securities: | | |
| Affiliated issuers | (50,862) | |
| Total change in net unrealized appreciation (depreciation) | | (50,862) |
| Net gain (loss) | | (25,931) |
| Net increase (decrease) in net assets resulting from operations | | $(12,555) |
See accompanying notes which are an integral part of the financial statements.
Statement of Changes in Net Assets
| | Year ended March 31, 2022 | Year ended March 31, 2021 |
| Increase (Decrease) in Net Assets | | |
| Operations | | |
| Net investment income (loss) | $13,376 | $2,235 |
| Net realized gain (loss) | 24,931 | 8,320 |
| Change in net unrealized appreciation (depreciation) | (50,862) | 46,717 |
| Net increase (decrease) in net assets resulting from operations | (12,555) | 57,272 |
| Distributions to shareholders | (35,417) | (8,230) |
| Share transactions | | |
| Proceeds from sales of shares | 977,005 | – |
| Reinvestment of distributions | 35,417 | 8,230 |
| Cost of shares redeemed | (156,072) | – |
| Net increase (decrease) in net assets resulting from share transactions | 856,350 | 8,230 |
| Total increase (decrease) in net assets | 808,378 | 57,272 |
| Net Assets | | |
| Beginning of period | 158,372 | 101,100 |
| End of period | $966,750 | $158,372 |
| Other Information | | |
| Shares | | |
| Sold | 78,018 | – |
| Issued in reinvestment of distributions | 2,778 | 744 |
| Redeemed | (12,308) | – |
| Net increase (decrease) | 68,488 | 744 |
See accompanying notes which are an integral part of the financial statements.
Financial Highlights
Fidelity Flex Freedom Blend 2045 Fund
| | | | | | |
| Years ended March 31, | 2022 | 2021 | 2020 | 2019 | 2018 A |
| Selected Per–Share Data | | | | | |
| Net asset value, beginning of period | $12.47 | $8.46 | $10.13 | $10.66 | $10.00 |
| Income from Investment Operations | | | | | |
| Net investment income (loss)B,C | .36 | .18 | .23 | .22 | .17 |
| Net realized and unrealized gain (loss) | .18D | 4.51 | (1.16) | –E | .82 |
| Total from investment operations | .54 | 4.69 | (.93) | .22 | .99 |
| Distributions from net investment income | (.32) | (.19) | (.23) | (.22) | (.17) |
| Distributions from net realized gain | (.78) | (.49) | (.51) | (.53) | (.17) |
| Total distributions | (1.10) | (.68) | (.74) | (.75) | (.33)F |
| Net asset value, end of period | $11.91 | $12.47 | $8.46 | $10.13 | $10.66 |
| Total ReturnG | 3.89% | 56.58% | (10.26)% | 2.55% | 9.91% |
| Ratios to Average Net AssetsC,H,I | | | | | |
| Expenses before reductions | - %J | - %J | - %J | - %J | - %K |
| Expenses net of fee waivers, if any | - %J | - %J | - %J | - %J | - %K |
| Expenses net of all reductions | - %J | - %J | - %J | - %J | - %K |
| Net investment income (loss) | 2.89% | 1.67% | 2.30% | 2.13% | 2.00%K |
| Supplemental Data | | | | | |
| Net assets, end of period (000 omitted) | $967 | $158 | $101 | $113 | $110 |
| Portfolio turnover rateL | 50% | 18% | 61% | 20% | 13%K |
A For the period June 8, 2017 (commencement of operations) through March 31, 2018.
B Calculated based on average shares outstanding during the period.
C Net investment income (loss) is affected by the timing of the declaration of dividends by any underlying mutual funds or exchange-traded funds (ETFs). Net investment income (loss) of any such underlying funds is not included in the Fund's net investment income (loss) ratio.
D The amount shown for a share outstanding does not correspond with the aggregate net gain (loss) on investments for the period due to the timing of sales and repurchases of shares in relation to fluctuating market values of the investments of the Fund.
E Amount represents less than $.005 per share.
F Total distributions per share do not sum due to rounding.
G Total returns for periods of less than one year are not annualized.
H Fees and expenses of any underlying mutual funds or exchange-traded funds (ETFs) are not included in the Fund's expense ratio. The Fund indirectly bears its proportionate share of these expenses.
I Expense ratios reflect operating expenses of the class. Expenses before reductions do not reflect amounts reimbursed, waived, or reduced through arrangements with the investment adviser, brokerage services, or other offset arrangements, if applicable, and do not represent the amount paid by the class during periods when reimbursements, waivers or reductions occur.
J Amount represents less than .005%.
K Annualized
L Amount does not include the portfolio activity of any underlying mutual funds or exchange-traded funds (ETFs).
See accompanying notes which are an integral part of the financial statements.
Fidelity Flex® Freedom Blend 2050 Fund
Investment Summary (Unaudited)
The information in the following tables is based on the direct investments of the Fund.
Top Holdings as of March 31, 2022
| | % of fund's net assets |
| Fidelity Series Large Cap Value Index Fund | 14.4 |
| Fidelity Series Emerging Markets Opportunities Fund | 12.9 |
| Fidelity Series Blue Chip Growth Fund | 10.7 |
| Fidelity Series Large Cap Stock Fund | 7.5 |
| Fidelity Series Large Cap Growth Index Fund | 6.8 |
| Fidelity Series International Value Fund | 6.7 |
| Fidelity Series Overseas Fund | 6.6 |
| Fidelity Series International Growth Fund | 6.6 |
| Fidelity Series Long-Term Treasury Bond Index Fund | 5.4 |
| Fidelity Series Value Discovery Fund | 5.3 |
| | 82.9 |
Asset Allocation (% of fund's net assets)
| Period end |
| | Domestic Equity Funds | 49.8% |
| | International Equity Funds | 42.4% |
| | Bond Funds | 7.8% |

Domestic Equity Funds category includes Fidelity Series Commodity Strategy Fund which invests in commodity-related investments.
Fidelity Flex® Freedom Blend 2050 Fund
Schedule of Investments March 31, 2022
Showing Percentage of Net Assets
| Domestic Equity Funds - 49.8% | | | |
| | | Shares | Value |
| Fidelity Series Blue Chip Growth Fund (a) | | 4,933 | $70,889 |
| Fidelity Series Commodity Strategy Fund (a) | | 1,942 | 9,922 |
| Fidelity Series Large Cap Growth Index Fund (a) | | 2,540 | 44,711 |
| Fidelity Series Large Cap Stock Fund (a) | | 2,621 | 49,830 |
| Fidelity Series Large Cap Value Index Fund (a) | | 6,215 | 95,463 |
| Fidelity Series Small Cap Opportunities Fund (a) | | 1,760 | 23,977 |
| Fidelity Series Value Discovery Fund (a) | | 2,204 | 35,271 |
| TOTAL DOMESTIC EQUITY FUNDS | | | |
| (Cost $322,052) | | | 330,063 |
|
| International Equity Funds - 42.4% | | | |
| Fidelity Series Canada Fund (a) | | 1,407 | 21,842 |
| Fidelity Series Emerging Markets Fund (a) | | 1,008 | 9,352 |
| Fidelity Series Emerging Markets Opportunities Fund (a) | | 4,661 | 85,753 |
| Fidelity Series International Growth Fund (a) | | 2,635 | 43,682 |
| Fidelity Series International Index Fund (a) | | 1,621 | 18,549 |
| Fidelity Series International Small Cap Fund (a) | | 759 | 13,621 |
| Fidelity Series International Value Fund (a) | | 3,998 | 44,101 |
| Fidelity Series Overseas Fund (a) | | 3,480 | 43,914 |
| TOTAL INTERNATIONAL EQUITY FUNDS | | | |
| (Cost $298,124) | | | 280,814 |
|
| Bond Funds - 7.8% | | | |
| Fidelity Series 5+ Year Inflation-Protected Bond Index Fund (a) | | 69 | 664 |
| Fidelity Series Corporate Bond Fund (a) | | 72 | 731 |
| Fidelity Series Emerging Markets Debt Fund (a) | | 407 | 3,360 |
| Fidelity Series Emerging Markets Debt Local Currency Fund (a) | | 122 | 1,099 |
| Fidelity Series Floating Rate High Income Fund (a) | | 72 | 660 |
| Fidelity Series Government Bond Index Fund (a) | | 106 | 1,061 |
| Fidelity Series High Income Fund (a) | | 442 | 4,015 |
| Fidelity Series International Credit Fund (a) | | 6 | 53 |
| Fidelity Series Investment Grade Bond Fund (a) | | 103 | 1,119 |
| Fidelity Series Investment Grade Securitized Fund (a) | | 78 | 757 |
| Fidelity Series Long-Term Treasury Bond Index Fund (a) | | 4,666 | 35,558 |
| Fidelity Series Real Estate Income Fund (a) | | 204 | 2,320 |
| TOTAL BOND FUNDS | | | |
| (Cost $54,317) | | | 51,397 |
| TOTAL INVESTMENT IN SECURITIES - 100.0% | | | |
| (Cost $674,493) | | | 662,274 |
| NET OTHER ASSETS (LIABILITIES) - 0.0% | | | 0 |
| NET ASSETS - 100% | | | $662,274 |
Legend
(a) Affiliated Fund
Affiliated Underlying Funds
Fiscal year to date information regarding the Fund's investments in affiliated Underlying Funds is presented below. Exchanges between classes of the same affiliated Underlying Funds may occur. If an underlying Fund changes its name, the name presented below is the name in effect at period end.
| Fund | Value, beginning of period | Purchases(a) | Sales Proceeds(a) | Dividend Income | Realized Gain (loss) | Change in Unrealized appreciation (depreciation) | Value, end of period |
| Fidelity Series 0-5 Year Inflation-Protected Bond Index Fund | $-- | $2,431 | $2,425 | $7 | $(6) | $-- | $-- |
| Fidelity Series 5+ Year Inflation-Protected Bond Index Fund | -- | 5,760 | 4,926 | 22 | (165) | (5) | 664 |
| Fidelity Series Blue Chip Growth Fund | 17,418 | 74,859 | 13,122 | 5,959 | (951) | (7,315) | 70,889 |
| Fidelity Series Canada Fund | 3,832 | 18,931 | 2,830 | 305 | (6) | 1,915 | 21,842 |
| Fidelity Series Commodity Strategy Fund | 4,391 | 14,736 | 10,500 | 1,857 | (222) | 1,517 | 9,922 |
| Fidelity Series Corporate Bond Fund | 16 | 1,041 | 317 | 2 | (9) | -- | 731 |
| Fidelity Series Emerging Markets Debt Fund | 864 | 3,250 | 463 | 84 | (42) | (249) | 3,360 |
| Fidelity Series Emerging Markets Debt Local Currency Fund | 287 | 1,058 | 144 | 33 | (11) | (91) | 1,099 |
| Fidelity Series Emerging Markets Fund | 2,517 | 9,170 | 733 | 226 | (99) | (1,503) | 9,352 |
| Fidelity Series Emerging Markets Opportunities Fund | 22,651 | 91,143 | 7,380 | 7,118 | (1,407) | (19,254) | 85,753 |
| Fidelity Series Floating Rate High Income Fund | 168 | 618 | 122 | 15 | (2) | (2) | 660 |
| Fidelity Series Government Bond Index Fund | 20 | 1,589 | 535 | 1 | (9) | (4) | 1,061 |
| Fidelity Series Government Money Market Fund 0.31% | 411 | 66 | 477 | -- | -- | -- | -- |
| Fidelity Series High Income Fund | 1,000 | 3,744 | 591 | 118 | (18) | (120) | 4,015 |
| Fidelity Series Inflation-Protected Bond Index Fund | 3,159 | 5,743 | 8,991 | 96 | 247 | (158) | -- |
| Fidelity Series International Credit Fund | 55 | 2 | -- | 2 | -- | (4) | 53 |
| Fidelity Series International Growth Fund | 9,425 | 43,183 | 3,795 | 2,464 | (415) | (4,716) | 43,682 |
| Fidelity Series International Index Fund | 3,935 | 17,214 | 1,729 | 328 | (104) | (767) | 18,549 |
| Fidelity Series International Small Cap Fund | 3,370 | 13,760 | 1,068 | 1,278 | (194) | (2,247) | 13,621 |
| Fidelity Series International Value Fund | 9,439 | 40,850 | 5,586 | 1,547 | (187) | (415) | 44,101 |
| Fidelity Series Investment Grade Bond Fund | 22 | 1,705 | 595 | 3 | (10) | (3) | 1,119 |
| Fidelity Series Investment Grade Securitized Fund | 15 | 1,062 | 314 | 1 | (4) | (2) | 757 |
| Fidelity Series Large Cap Growth Index Fund | 10,991 | 42,033 | 8,987 | 915 | (273) | 947 | 44,711 |
| Fidelity Series Large Cap Stock Fund | 12,017 | 43,961 | 6,533 | 2,038 | (138) | 523 | 49,830 |
| Fidelity Series Large Cap Value Index Fund | 22,954 | 85,807 | 13,412 | 4,680 | (400) | 514 | 95,463 |
| Fidelity Series Long-Term Treasury Bond Index Fund | 4,329 | 35,597 | 2,274 | 305 | (281) | (1,813) | 35,558 |
| Fidelity Series Overseas Fund | 9,441 | 41,113 | 3,899 | 912 | (318) | (2,423) | 43,914 |
| Fidelity Series Real Estate Income Fund | 602 | 2,130 | 394 | 52 | (8) | (10) | 2,320 |
| Fidelity Series Short-Term Credit Fund | 202 | 50 | 252 | 1 | 6 | (6) | -- |
| Fidelity Series Small Cap Opportunities Fund | 5,818 | 23,080 | 2,287 | 2,196 | (302) | (2,332) | 23,977 |
| Fidelity Series Treasury Bill Index Fund | 652 | 183 | 835 | -- | -- | -- | -- |
| Fidelity Series Value Discovery Fund | 8,481 | 32,900 | 4,981 | 3,165 | (218) | (911) | 35,271 |
| | $158,482 | $658,769 | $110,497 | $35,730 | $(5,546) | $(38,934) | $662,274 |
(a) Includes the value of shares purchased or redeemed through in-kind transactions, as applicable.
Amounts in the income column in the above table include any capital gain distributions from underlying funds, which are presented in the corresponding line-item in the Statement of Operations, if applicable.
Investment Valuation
The following is a summary of the inputs used, as of March 31, 2022, involving the Fund's assets and liabilities carried at fair value. The inputs or methodology used for valuing securities may not be an indication of the risk associated with investing in those securities. For more information on valuation inputs, and their aggregation into the levels used below, please refer to the Investment Valuation section in the accompanying Notes to Financial Statements.
| | Valuation Inputs at Reporting Date: |
| Description | Total | Level 1 | Level 2 | Level 3 |
| Investments in Securities: | | | | |
| Domestic Equity Funds | $330,063 | $330,063 | $-- | $-- |
| International Equity Funds | 280,814 | 280,814 | -- | -- |
| Bond Funds | 51,397 | 51,397 | -- | -- |
| Total Investments in Securities: | $662,274 | $662,274 | $-- | $-- |
See accompanying notes which are an integral part of the financial statements.
Fidelity Flex® Freedom Blend 2050 Fund
Financial Statements
Statement of Assets and Liabilities
| | | March 31, 2022 |
| Assets | | |
Investment in securities, at value — See accompanying schedule:
| | |
| Affiliated issuers (cost $674,493) | $662,274 | |
| Total Investment in Securities (cost $674,493) | | $662,274 |
| Receivable for investments sold | | 10,269 |
| Receivable for fund shares sold | | 2,926 |
| Total assets | | 675,469 |
| Liabilities | | |
| Payable for investments purchased | $13,195 | |
| Total liabilities | | 13,195 |
| Net Assets | | $662,274 |
| Net Assets consist of: | | |
| Paid in capital | | $665,967 |
| Total accumulated earnings (loss) | | (3,693) |
| Net Assets | | $662,274 |
| Net Asset Value, offering price and redemption price per share ($662,274 ÷ 54,769 shares) | | $12.09 |
See accompanying notes which are an integral part of the financial statements.
Statement of Operations
| | | Year ended March 31, 2022 |
| Investment Income | | |
| Dividends: | | |
| Affiliated issuers | | $10,625 |
| Expenses | | |
| Independent trustees' fees and expenses | $1 | |
| Total expenses | | 1 |
| Net investment income (loss) | | 10,624 |
| Realized and Unrealized Gain (Loss) | | |
| Net realized gain (loss) on: | | |
| Investment securities: | | |
| Affiliated issuers | (5,546) | |
| Capital gain distributions from underlying funds: | | |
| Affiliated issuers | 25,105 | |
| Total net realized gain (loss) | | 19,559 |
| Change in net unrealized appreciation (depreciation) on: | | |
| Investment securities: | | |
| Affiliated issuers | (38,934) | |
| Total change in net unrealized appreciation (depreciation) | | (38,934) |
| Net gain (loss) | | (19,375) |
| Net increase (decrease) in net assets resulting from operations | | $(8,751) |
See accompanying notes which are an integral part of the financial statements.
Statement of Changes in Net Assets
| | Year ended March 31, 2022 | Year ended March 31, 2021 |
| Increase (Decrease) in Net Assets | | |
| Operations | | |
| Net investment income (loss) | $10,624 | $2,234 |
| Net realized gain (loss) | 19,559 | 8,293 |
| Change in net unrealized appreciation (depreciation) | (38,934) | 46,731 |
| Net increase (decrease) in net assets resulting from operations | (8,751) | 57,258 |
| Distributions to shareholders | (25,409) | (8,277) |
| Share transactions | | |
| Proceeds from sales of shares | 561,385 | 140 |
| Reinvestment of distributions | 25,409 | 8,277 |
| Cost of shares redeemed | (48,842) | – |
| Net increase (decrease) in net assets resulting from share transactions | 537,952 | 8,417 |
| Total increase (decrease) in net assets | 503,792 | 57,398 |
| Net Assets | | |
| Beginning of period | 158,482 | 101,084 |
| End of period | $662,274 | $158,482 |
| Other Information | | |
| Shares | | |
| Sold | 44,029 | 11 |
| Issued in reinvestment of distributions | 1,968 | 748 |
| Redeemed | (3,942) | – |
| Net increase (decrease) | 42,055 | 759 |
See accompanying notes which are an integral part of the financial statements.
Financial Highlights
Fidelity Flex Freedom Blend 2050 Fund
| | | | | | |
| Years ended March 31, | 2022 | 2021 | 2020 | 2019 | 2018 A |
| Selected Per–Share Data | | | | | |
| Net asset value, beginning of period | $12.46 | $8.46 | $10.13 | $10.66 | $10.00 |
| Income from Investment Operations | | | | | |
| Net investment income (loss)B,C | .39 | .18 | .23 | .22 | .17 |
| Net realized and unrealized gain (loss) | .14D | 4.50 | (1.15) | –E | .82 |
| Total from investment operations | .53 | 4.68 | (.92) | .22 | .99 |
| Distributions from net investment income | (.28) | (.18) | (.23) | (.22) | (.17) |
| Distributions from net realized gain | (.61) | (.50) | (.51) | (.53) | (.16) |
| Total distributions | (.90)F | (.68) | (.75)F | (.75) | (.33) |
| Net asset value, end of period | $12.09 | $12.46 | $8.46 | $10.13 | $10.66 |
| Total ReturnG | 3.89% | 56.50% | (10.25)% | 2.55% | 9.89% |
| Ratios to Average Net AssetsC,H,I | | | | | |
| Expenses before reductions | - %J | - %J | - %J | - %J | - %K |
| Expenses net of fee waivers, if any | - %J | - %J | - %J | - %J | - %K |
| Expenses net of all reductions | - %J | - %J | - %J | - %J | - %K |
| Net investment income (loss) | 3.11% | 1.67% | 2.30% | 2.13% | 2.00%K |
| Supplemental Data | | | | | |
| Net assets, end of period (000 omitted) | $662 | $158 | $101 | $113 | $110 |
| Portfolio turnover rateL | 32% | 19% | 61% | 20% | 13%K |
A For the period June 8, 2017 (commencement of operations) through March 31, 2018.
B Calculated based on average shares outstanding during the period.
C Net investment income (loss) is affected by the timing of the declaration of dividends by any underlying mutual funds or exchange-traded funds (ETFs). Net investment income (loss) of any such underlying funds is not included in the Fund's net investment income (loss) ratio.
D The amount shown for a share outstanding does not correspond with the aggregate net gain (loss) on investments for the period due to the timing of sales and repurchases of shares in relation to fluctuating market values of the investments of the Fund.
E Amount represents less than $.005 per share.
F Total distributions per share do not sum due to rounding.
G Total returns for periods of less than one year are not annualized.
H Fees and expenses of any underlying mutual funds or exchange-traded funds (ETFs) are not included in the Fund's expense ratio. The Fund indirectly bears its proportionate share of these expenses.
I Expense ratios reflect operating expenses of the class. Expenses before reductions do not reflect amounts reimbursed, waived, or reduced through arrangements with the investment adviser, brokerage services, or other offset arrangements, if applicable, and do not represent the amount paid by the class during periods when reimbursements, waivers or reductions occur.
J Amount represents less than .005%.
K Annualized
L Amount does not include the portfolio activity of any underlying mutual funds or exchange-traded funds (ETFs).
See accompanying notes which are an integral part of the financial statements.
Fidelity Flex® Freedom Blend 2055 Fund
Investment Summary (Unaudited)
The information in the following tables is based on the direct investments of the Fund.
Top Holdings as of March 31, 2022
| | % of fund's net assets |
| Fidelity Series Large Cap Value Index Fund | 14.4 |
| Fidelity Series Emerging Markets Opportunities Fund | 12.9 |
| Fidelity Series Blue Chip Growth Fund | 10.7 |
| Fidelity Series Large Cap Stock Fund | 7.5 |
| Fidelity Series Large Cap Growth Index Fund | 6.8 |
| Fidelity Series International Value Fund | 6.7 |
| Fidelity Series Overseas Fund | 6.6 |
| Fidelity Series International Growth Fund | 6.6 |
| Fidelity Series Long-Term Treasury Bond Index Fund | 5.4 |
| Fidelity Series Value Discovery Fund | 5.3 |
| | 82.9 |
Asset Allocation (% of fund's net assets)
| Period end |
| | Domestic Equity Funds | 49.8% |
| | International Equity Funds | 42.4% |
| | Bond Funds | 7.8% |

Domestic Equity Funds category includes Fidelity Series Commodity Strategy Fund which invests in commodity-related investments.
Fidelity Flex® Freedom Blend 2055 Fund
Schedule of Investments March 31, 2022
Showing Percentage of Net Assets
| Domestic Equity Funds - 49.8% | | | |
| | | Shares | Value |
| Fidelity Series Blue Chip Growth Fund (a) | | 2,587 | $37,181 |
| Fidelity Series Commodity Strategy Fund (a) | | 1,019 | 5,206 |
| Fidelity Series Large Cap Growth Index Fund (a) | | 1,332 | 23,448 |
| Fidelity Series Large Cap Stock Fund (a) | | 1,375 | 26,136 |
| Fidelity Series Large Cap Value Index Fund (a) | | 3,260 | 50,072 |
| Fidelity Series Small Cap Opportunities Fund (a) | | 923 | 12,576 |
| Fidelity Series Value Discovery Fund (a) | | 1,156 | 18,500 |
| TOTAL DOMESTIC EQUITY FUNDS | | | |
| (Cost $159,864) | | | 173,119 |
|
| International Equity Funds - 42.4% | | | |
| Fidelity Series Canada Fund (a) | | 738 | 11,461 |
| Fidelity Series Emerging Markets Fund (a) | | 529 | 4,905 |
| Fidelity Series Emerging Markets Opportunities Fund (a) | | 2,446 | 44,999 |
| Fidelity Series International Growth Fund (a) | | 1,383 | 22,922 |
| Fidelity Series International Index Fund (a) | | 851 | 9,734 |
| Fidelity Series International Small Cap Fund (a) | | 398 | 7,148 |
| Fidelity Series International Value Fund (a) | | 2,098 | 23,144 |
| Fidelity Series Overseas Fund (a) | | 1,826 | 23,045 |
| TOTAL INTERNATIONAL EQUITY FUNDS | | | |
| (Cost $147,265) | | | 147,358 |
|
| Bond Funds - 7.8% | | | |
| Fidelity Series 5+ Year Inflation-Protected Bond Index Fund (a) | | 36 | 348 |
| Fidelity Series Corporate Bond Fund (a) | | 38 | 382 |
| Fidelity Series Emerging Markets Debt Fund (a) | | 213 | 1,760 |
| Fidelity Series Emerging Markets Debt Local Currency Fund (a) | | 64 | 577 |
| Fidelity Series Floating Rate High Income Fund (a) | | 38 | 346 |
| Fidelity Series Government Bond Index Fund (a) | | 56 | 556 |
| Fidelity Series High Income Fund (a) | | 232 | 2,107 |
| Fidelity Series International Credit Fund (a) | | 4 | 39 |
| Fidelity Series Investment Grade Bond Fund (a) | | 54 | 587 |
| Fidelity Series Investment Grade Securitized Fund (a) | | 41 | 397 |
| Fidelity Series Long-Term Treasury Bond Index Fund (a) | | 2,451 | 18,674 |
| Fidelity Series Real Estate Income Fund (a) | | 108 | 1,232 |
| TOTAL BOND FUNDS | | | |
| (Cost $28,549) | | | 27,005 |
| TOTAL INVESTMENT IN SECURITIES - 100.0% | | | |
| (Cost $335,678) | | | 347,482 |
| NET OTHER ASSETS (LIABILITIES) - 0.0% | | | 4 |
| NET ASSETS - 100% | | | $347,486 |
Legend
(a) Affiliated Fund
Affiliated Underlying Funds
Fiscal year to date information regarding the Fund's investments in affiliated Underlying Funds is presented below. Exchanges between classes of the same affiliated Underlying Funds may occur. If an underlying Fund changes its name, the name presented below is the name in effect at period end.
| Fund | Value, beginning of period | Purchases(a) | Sales Proceeds(a) | Dividend Income | Realized Gain (loss) | Change in Unrealized appreciation (depreciation) | Value, end of period |
| Fidelity Series 0-5 Year Inflation-Protected Bond Index Fund | $-- | $1,248 | $1,245 | $4 | $(3) | $-- | $-- |
| Fidelity Series 5+ Year Inflation-Protected Bond Index Fund | -- | 3,056 | 2,623 | 11 | (79) | (6) | 348 |
| Fidelity Series Blue Chip Growth Fund | 17,410 | 33,594 | 9,430 | 4,514 | (514) | (3,879) | 37,181 |
| Fidelity Series Canada Fund | 3,831 | 8,562 | 2,204 | 145 | (12) | 1,284 | 11,461 |
| Fidelity Series Commodity Strategy Fund | 4,390 | 6,254 | 5,968 | 1,629 | (23) | 553 | 5,206 |
| Fidelity Series Corporate Bond Fund | 16 | 557 | 187 | 1 | (5) | 1 | 382 |
| Fidelity Series Emerging Markets Debt Fund | 864 | 1,408 | 368 | 53 | (22) | (122) | 1,760 |
| Fidelity Series Emerging Markets Debt Local Currency Fund | 287 | 455 | 116 | 16 | (7) | (42) | 577 |
| Fidelity Series Emerging Markets Fund | 2,516 | 4,083 | 860 | 108 | (72) | (762) | 4,905 |
| Fidelity Series Emerging Markets Opportunities Fund | 22,641 | 40,504 | 7,699 | 3,395 | (1,013) | (9,434) | 44,999 |
| Fidelity Series Floating Rate High Income Fund | 170 | 261 | 85 | 10 | (1) | 1 | 346 |
| Fidelity Series Government Bond Index Fund | 20 | 850 | 308 | 1 | (5) | (1) | 556 |
| Fidelity Series Government Money Market Fund 0.31% | 410 | 38 | 448 | -- | -- | -- | -- |
| Fidelity Series High Income Fund | 1,001 | 1,614 | 450 | 73 | (9) | (49) | 2,107 |
| Fidelity Series Inflation-Protected Bond Index Fund | 3,159 | 1,296 | 4,580 | 42 | 284 | (159) | -- |
| Fidelity Series International Credit Fund | 41 | 1 | -- | 1 | -- | (3) | 39 |
| Fidelity Series International Growth Fund | 9,385 | 19,331 | 3,831 | 1,175 | (262) | (1,701) | 22,922 |
| Fidelity Series International Index Fund | 3,933 | 7,677 | 1,579 | 156 | (64) | (233) | 9,734 |
| Fidelity Series International Small Cap Fund | 3,380 | 5,853 | 1,133 | 609 | (131) | (821) | 7,148 |
| Fidelity Series International Value Fund | 9,461 | 18,218 | 4,616 | 738 | (121) | 202 | 23,144 |
| Fidelity Series Investment Grade Bond Fund | 23 | 912 | 341 | 1 | (6) | (1) | 587 |
| Fidelity Series Investment Grade Securitized Fund | 15 | 571 | 186 | 1 | (2) | (1) | 397 |
| Fidelity Series Large Cap Growth Index Fund | 10,986 | 18,128 | 6,915 | 462 | (109) | 1,358 | 23,448 |
| Fidelity Series Large Cap Stock Fund | 12,011 | 19,307 | 5,623 | 1,358 | (62) | 503 | 26,136 |
| Fidelity Series Large Cap Value Index Fund | 22,946 | 37,020 | 11,020 | 2,253 | (207) | 1,333 | 50,072 |
| Fidelity Series Long-Term Treasury Bond Index Fund | 4,329 | 17,755 | 2,458 | 181 | (234) | (718) | 18,674 |
| Fidelity Series Overseas Fund | 9,437 | 18,246 | 3,906 | 435 | (172) | (560) | 23,045 |
| Fidelity Series Real Estate Income Fund | 602 | 904 | 283 | 32 | (5) | 14 | 1,232 |
| Fidelity Series Short-Term Credit Fund | 202 | 27 | 229 | 1 | 6 | (6) | -- |
| Fidelity Series Small Cap Opportunities Fund | 5,815 | 10,726 | 2,214 | 1,799 | (190) | (1,561) | 12,576 |
| Fidelity Series Treasury Bill Index Fund | 652 | 114 | 766 | -- | -- | -- | -- |
| Fidelity Series Value Discovery Fund | 8,477 | 14,213 | 3,986 | 1,553 | (137) | (67) | 18,500 |
| | $158,410 | $292,783 | $85,657 | $20,757 | $(3,177) | $(14,877) | $347,482 |
(a) Includes the value of shares purchased or redeemed through in-kind transactions, as applicable.
Amounts in the income column in the above table include any capital gain distributions from underlying funds, which are presented in the corresponding line-item in the Statement of Operations, if applicable.
Investment Valuation
The following is a summary of the inputs used, as of March 31, 2022, involving the Fund's assets and liabilities carried at fair value. The inputs or methodology used for valuing securities may not be an indication of the risk associated with investing in those securities. For more information on valuation inputs, and their aggregation into the levels used below, please refer to the Investment Valuation section in the accompanying Notes to Financial Statements.
| | Valuation Inputs at Reporting Date: |
| Description | Total | Level 1 | Level 2 | Level 3 |
| Investments in Securities: | | | | |
| Domestic Equity Funds | $173,119 | $173,119 | $-- | $-- |
| International Equity Funds | 147,358 | 147,358 | -- | -- |
| Bond Funds | 27,005 | 27,005 | -- | -- |
| Total Investments in Securities: | $347,482 | $347,482 | $-- | $-- |
See accompanying notes which are an integral part of the financial statements.
Fidelity Flex® Freedom Blend 2055 Fund
Financial Statements
Statement of Assets and Liabilities
| | | March 31, 2022 |
| Assets | | |
Investment in securities, at value — See accompanying schedule:
| | |
| Affiliated issuers (cost $335,678) | $347,482 | |
| Total Investment in Securities (cost $335,678) | | $347,482 |
| Receivable for investments sold | | 5,800 |
| Receivable for fund shares sold | | 829 |
| Total assets | | 354,111 |
| Liabilities | | |
| Payable for investments purchased | $6,625 | |
| Total liabilities | | 6,625 |
| Net Assets | | $347,486 |
| Net Assets consist of: | | |
| Paid in capital | | $332,490 |
| Total accumulated earnings (loss) | | 14,996 |
| Net Assets | | $347,486 |
| Net Asset Value, offering price and redemption price per share ($347,486 ÷ 29,033 shares) | | $11.97 |
See accompanying notes which are an integral part of the financial statements.
Statement of Operations
| | | Year ended March 31, 2022 |
| Investment Income | | |
| Dividends: | | |
| Affiliated issuers | | $5,982 |
| Expenses | | |
| Independent trustees' fees and expenses | $1 | |
| Total expenses | | 1 |
| Net investment income (loss) | | 5,981 |
| Realized and Unrealized Gain (Loss) | | |
| Net realized gain (loss) on: | | |
| Investment securities: | | |
| Affiliated issuers | (3,177) | |
| Capital gain distributions from underlying funds: | | |
| Affiliated issuers | 14,775 | |
| Total net realized gain (loss) | | 11,598 |
| Change in net unrealized appreciation (depreciation) on: | | |
| Investment securities: | | |
| Affiliated issuers | (14,877) | |
| Total change in net unrealized appreciation (depreciation) | | (14,877) |
| Net gain (loss) | | (3,279) |
| Net increase (decrease) in net assets resulting from operations | | $2,702 |
See accompanying notes which are an integral part of the financial statements.
Statement of Changes in Net Assets
| | Year ended March 31, 2022 | Year ended March 31, 2021 |
| Increase (Decrease) in Net Assets | | |
| Operations | | |
| Net investment income (loss) | $5,981 | $2,236 |
| Net realized gain (loss) | 11,598 | 8,325 |
| Change in net unrealized appreciation (depreciation) | (14,877) | 46,731 |
| Net increase (decrease) in net assets resulting from operations | 2,702 | 57,292 |
| Distributions to shareholders | (18,212) | (8,270) |
| Share transactions | | |
| Proceeds from sales of shares | 226,690 | – |
| Reinvestment of distributions | 18,212 | 8,270 |
| Cost of shares redeemed | (40,317) | – |
| Net increase (decrease) in net assets resulting from share transactions | 204,585 | 8,270 |
| Total increase (decrease) in net assets | 189,075 | 57,292 |
| Net Assets | | |
| Beginning of period | 158,411 | 101,119 |
| End of period | $347,486 | $158,411 |
| Other Information | | |
| Shares | | |
| Sold | 18,191 | – |
| Issued in reinvestment of distributions | 1,423 | 749 |
| Redeemed | (3,289) | – |
| Net increase (decrease) | 16,325 | 749 |
See accompanying notes which are an integral part of the financial statements.
Financial Highlights
Fidelity Flex Freedom Blend 2055 Fund
| | | | | | |
| Years ended March 31, | 2022 | 2021 | 2020 | 2019 | 2018 A |
| Selected Per–Share Data | | | | | |
| Net asset value, beginning of period | $12.47 | $8.46 | $10.13 | $10.66 | $10.00 |
| Income from Investment Operations | | | | | |
| Net investment income (loss)B,C | .35 | .18 | .23 | .22 | .17 |
| Net realized and unrealized gain (loss) | .18D | 4.51 | (1.15) | –E | .82 |
| Total from investment operations | .53 | 4.69 | (.92) | .22 | .99 |
| Distributions from net investment income | (.29) | (.18) | (.24) | (.22) | (.17) |
| Distributions from net realized gain | (.74) | (.50) | (.51) | (.53) | (.17) |
| Total distributions | (1.03) | (.68) | (.75) | (.75) | (.33)F |
| Net asset value, end of period | $11.97 | $12.47 | $8.46 | $10.13 | $10.66 |
| Total ReturnG | 3.84% | 56.63% | (10.24)% | 2.56% | 9.90% |
| Ratios to Average Net AssetsC,H,I | | | | | |
| Expenses before reductions | - %J | - %J | - %J | - %J | - %K |
| Expenses net of fee waivers, if any | - %J | - %J | - %J | - %J | - %K |
| Expenses net of all reductions | - %J | - %J | - %J | - %J | - %K |
| Net investment income (loss) | 2.77% | 1.67% | 2.30% | 2.13% | 2.00%K |
| Supplemental Data | | | | | |
| Net assets, end of period (000 omitted) | $347 | $158 | $101 | $113 | $110 |
| Portfolio turnover rateL | 39% | 18% | 61% | 20% | 13%K |
A For the period June 8, 2017 (commencement of operations) through March 31, 2018.
B Calculated based on average shares outstanding during the period.
C Net investment income (loss) is affected by the timing of the declaration of dividends by any underlying mutual funds or exchange-traded funds (ETFs). Net investment income (loss) of any such underlying funds is not included in the Fund's net investment income (loss) ratio.
D The amount shown for a share outstanding does not correspond with the aggregate net gain (loss) on investments for the period due to the timing of sales and repurchases of shares in relation to fluctuating market values of the investments of the Fund.
E Amount represents less than $.005 per share.
F Total distributions per share do not sum due to rounding.
G Total returns for periods of less than one year are not annualized.
H Fees and expenses of any underlying mutual funds or exchange-traded funds (ETFs) are not included in the Fund's expense ratio. The Fund indirectly bears its proportionate share of these expenses.
I Expense ratios reflect operating expenses of the class. Expenses before reductions do not reflect amounts reimbursed, waived, or reduced through arrangements with the investment adviser, brokerage services, or other offset arrangements, if applicable, and do not represent the amount paid by the class during periods when reimbursements, waivers or reductions occur.
J Amount represents less than .005%.
K Annualized
L Amount does not include the portfolio activity of any underlying mutual funds or exchange-traded funds (ETFs).
See accompanying notes which are an integral part of the financial statements.
Fidelity Flex® Freedom Blend 2060 Fund
Investment Summary (Unaudited)
The information in the following tables is based on the direct investments of the Fund.
Top Holdings as of March 31, 2022
| | % of fund's net assets |
| Fidelity Series Large Cap Value Index Fund | 14.4 |
| Fidelity Series Emerging Markets Opportunities Fund | 12.9 |
| Fidelity Series Blue Chip Growth Fund | 10.7 |
| Fidelity Series Large Cap Stock Fund | 7.5 |
| Fidelity Series Large Cap Growth Index Fund | 6.8 |
| Fidelity Series International Value Fund | 6.7 |
| Fidelity Series Overseas Fund | 6.6 |
| Fidelity Series International Growth Fund | 6.6 |
| Fidelity Series Long-Term Treasury Bond Index Fund | 5.4 |
| Fidelity Series Value Discovery Fund | 5.3 |
| | 82.9 |
Asset Allocation (% of fund's net assets)
| Period end |
| | Domestic Equity Funds | 49.8% |
| | International Equity Funds | 42.4% |
| | Bond Funds | 7.8% |

Domestic Equity Funds category includes Fidelity Series Commodity Strategy Fund which invests in commodity-related investments.
Fidelity Flex® Freedom Blend 2060 Fund
Schedule of Investments March 31, 2022
Showing Percentage of Net Assets
| Domestic Equity Funds - 49.8% | | | |
| | | Shares | Value |
| Fidelity Series Blue Chip Growth Fund (a) | | 2,445 | $35,135 |
| Fidelity Series Commodity Strategy Fund (a) | | 963 | 4,920 |
| Fidelity Series Large Cap Growth Index Fund (a) | | 1,259 | 22,158 |
| Fidelity Series Large Cap Stock Fund (a) | | 1,299 | 24,697 |
| Fidelity Series Large Cap Value Index Fund (a) | | 3,080 | 47,316 |
| Fidelity Series Small Cap Opportunities Fund (a) | | 873 | 11,884 |
| Fidelity Series Value Discovery Fund (a) | | 1,093 | 17,481 |
| TOTAL DOMESTIC EQUITY FUNDS | | | |
| (Cost $150,298) | | | 163,591 |
|
| International Equity Funds - 42.4% | | | |
| Fidelity Series Canada Fund (a) | | 698 | 10,833 |
| Fidelity Series Emerging Markets Fund (a) | | 500 | 4,644 |
| Fidelity Series Emerging Markets Opportunities Fund (a) | | 2,311 | 42,527 |
| Fidelity Series International Growth Fund (a) | | 1,307 | 21,662 |
| Fidelity Series International Index Fund (a) | | 804 | 9,201 |
| Fidelity Series International Small Cap Fund (a) | | 376 | 6,754 |
| Fidelity Series International Value Fund (a) | | 1,983 | 21,872 |
| Fidelity Series Overseas Fund (a) | | 1,726 | 21,778 |
| TOTAL INTERNATIONAL EQUITY FUNDS | | | |
| (Cost $138,254) | | | 139,271 |
|
| Bond Funds - 7.8% | | | |
| Fidelity Series 5+ Year Inflation-Protected Bond Index Fund (a) | | 34 | 329 |
| Fidelity Series Corporate Bond Fund (a) | | 36 | 366 |
| Fidelity Series Emerging Markets Debt Fund (a) | | 202 | 1,670 |
| Fidelity Series Emerging Markets Debt Local Currency Fund (a) | | 61 | 547 |
| Fidelity Series Floating Rate High Income Fund (a) | | 36 | 327 |
| Fidelity Series Government Bond Index Fund (a) | | 53 | 530 |
| Fidelity Series High Income Fund (a) | | 219 | 1,990 |
| Fidelity Series International Credit Fund (a) | | 4 | 39 |
| Fidelity Series Investment Grade Bond Fund (a) | | 51 | 559 |
| Fidelity Series Investment Grade Securitized Fund (a) | | 39 | 380 |
| Fidelity Series Long-Term Treasury Bond Index Fund (a) | | 2,318 | 17,660 |
| Fidelity Series Real Estate Income Fund (a) | | 94 | 1,071 |
| TOTAL BOND FUNDS | | | |
| (Cost $26,778) | | | 25,468 |
| TOTAL INVESTMENT IN SECURITIES - 100.0% | | | |
| (Cost $315,330) | | | 328,330 |
| NET OTHER ASSETS (LIABILITIES) - 0.0% | | | (1) |
| NET ASSETS - 100% | | | $328,329 |
Legend
(a) Affiliated Fund
Affiliated Underlying Funds
Fiscal year to date information regarding the Fund's investments in affiliated Underlying Funds is presented below. Exchanges between classes of the same affiliated Underlying Funds may occur. If an underlying Fund changes its name, the name presented below is the name in effect at period end.
| Fund | Value, beginning of period | Purchases(a) | Sales Proceeds(a) | Dividend Income | Realized Gain (loss) | Change in Unrealized appreciation (depreciation) | Value, end of period |
| Fidelity Series 0-5 Year Inflation-Protected Bond Index Fund | $-- | $1,073 | $1,070 | $3 | $(3) | $-- | $-- |
| Fidelity Series 5+ Year Inflation-Protected Bond Index Fund | -- | 2,582 | 2,181 | 10 | (67) | (5) | 329 |
| Fidelity Series Blue Chip Growth Fund | 17,409 | 29,654 | 7,985 | 4,329 | (357) | (3,586) | 35,135 |
| Fidelity Series Canada Fund | 3,830 | 7,293 | 1,419 | 134 | (1) | 1,130 | 10,833 |
| Fidelity Series Commodity Strategy Fund | 4,390 | 5,340 | 5,194 | 1,571 | (141) | 525 | 4,920 |
| Fidelity Series Corporate Bond Fund | 16 | 496 | 143 | 1 | (4) | 1 | 366 |
| Fidelity Series Emerging Markets Debt Fund | 864 | 1,166 | 240 | 49 | (16) | (104) | 1,670 |
| Fidelity Series Emerging Markets Debt Local Currency Fund | 287 | 376 | 73 | 14 | (5) | (38) | 547 |
| Fidelity Series Emerging Markets Fund | 2,516 | 3,411 | 543 | 100 | (41) | (699) | 4,644 |
| Fidelity Series Emerging Markets Opportunities Fund | 22,639 | 34,260 | 5,030 | 3,146 | (565) | (8,777) | 42,527 |
| Fidelity Series Floating Rate High Income Fund | 170 | 215 | 58 | 9 | (1) | 1 | 327 |
| Fidelity Series Government Bond Index Fund | 20 | 758 | 243 | 1 | (4) | (1) | 530 |
| Fidelity Series Government Money Market Fund 0.31% | 410 | 23 | 433 | -- | -- | -- | -- |
| Fidelity Series High Income Fund | 1,000 | 1,345 | 309 | 67 | (8) | (38) | 1,990 |
| Fidelity Series Inflation-Protected Bond Index Fund | 3,159 | 1,067 | 4,341 | 39 | 274 | (159) | - |
| Fidelity Series International Credit Fund | 41 | 1 | -- | 1 | -- | (3) | 39 |
| Fidelity Series International Growth Fund | 9,384 | 16,176 | 2,262 | 1,089 | (160) | (1,476) | 21,662 |
| Fidelity Series International Index Fund | 3,933 | 6,426 | 912 | 145 | (40) | (206) | 9,201 |
| Fidelity Series International Small Cap Fund | 3,398 | 4,763 | 601 | 565 | (81) | (725) | 6,754 |
| Fidelity Series International Value Fund | 9,441 | 15,469 | 3,095 | 684 | (67) | 124 | 21,872 |
| Fidelity Series Investment Grade Bond Fund | 23 | 811 | 271 | 1 | (4) | -- | 559 |
| Fidelity Series Investment Grade Securitized Fund | 15 | 509 | 141 | -- | (2) | (1) | 380 |
| Fidelity Series Large Cap Growth Index Fund | 10,985 | 15,265 | 5,384 | 431 | (49) | 1,341 | 22,158 |
| Fidelity Series Large Cap Stock Fund | 12,010 | 16,163 | 3,849 | 1,279 | (31) | 404 | 24,697 |
| Fidelity Series Large Cap Value Index Fund | 22,942 | 31,073 | 7,705 | 2,070 | (194) | 1,200 | 47,316 |
| Fidelity Series Long-Term Treasury Bond Index Fund | 4,328 | 15,493 | 1,459 | 166 | (183) | (519) | 17,660 |
| Fidelity Series Overseas Fund | 9,436 | 15,233 | 2,379 | 403 | (113) | (399) | 21,778 |
| Fidelity Series Real Estate Income Fund | 602 | 650 | 193 | 30 | (3) | 15 | 1,071 |
| Fidelity Series Short-Term Credit Fund | 202 | 23 | 225 | 1 | 6 | (6) | -- |
| Fidelity Series Small Cap Opportunities Fund | 5,815 | 9,133 | 1,412 | 1,728 | (132) | (1,520) | 11,884 |
| Fidelity Series Treasury Bill Index Fund | 652 | 93 | 745 | -- | -- | -- | -- |
| Fidelity Series Value Discovery Fund | 8,476 | 11,703 | 2,519 | 1,403 | (78) | (101) | 17,481 |
| | $158,393 | $248,043 | $62,414 | $19,469 | $(2,070) | $(13,622) | $328,330 |
(a) Includes the value of shares purchased or redeemed through in-kind transactions, as applicable.
Amounts in the income column in the above table include any capital gain distributions from underlying funds, which are presented in the corresponding line-item in the Statement of Operations, if applicable.
Investment Valuation
The following is a summary of the inputs used, as of March 31, 2022, involving the Fund's assets and liabilities carried at fair value. The inputs or methodology used for valuing securities may not be an indication of the risk associated with investing in those securities. For more information on valuation inputs, and their aggregation into the levels used below, please refer to the Investment Valuation section in the accompanying Notes to Financial Statements.
| | Valuation Inputs at Reporting Date: |
| Description | Total | Level 1 | Level 2 | Level 3 |
| Investments in Securities: | | | | |
| Domestic Equity Funds | $163,591 | $163,591 | $-- | $-- |
| International Equity Funds | 139,271 | 139,271 | -- | -- |
| Bond Funds | 25,468 | 25,468 | -- | -- |
| Total Investments in Securities: | $328,330 | $328,330 | $-- | $-- |
See accompanying notes which are an integral part of the financial statements.
Fidelity Flex® Freedom Blend 2060 Fund
Financial Statements
Statement of Assets and Liabilities
| | | March 31, 2022 |
| Assets | | |
Investment in securities, at value — See accompanying schedule:
| | |
| Affiliated issuers (cost $315,330) | $328,330 | |
| Total Investment in Securities (cost $315,330) | | $328,330 |
| Receivable for investments sold | | 5,216 |
| Receivable for fund shares sold | | 845 |
| Total assets | | 334,391 |
| Liabilities | | |
| Payable for investments purchased | $6,062 | |
| Total liabilities | | 6,062 |
| Net Assets | | $328,329 |
| Net Assets consist of: | | |
| Paid in capital | | $311,745 |
| Total accumulated earnings (loss) | | 16,584 |
| Net Assets | | $328,329 |
| Net Asset Value, offering price and redemption price per share ($328,329 ÷ 27,700 shares) | | $11.85 |
See accompanying notes which are an integral part of the financial statements.
Statement of Operations
| | | Year ended March 31, 2022 |
| Investment Income | | |
| Dividends: | | |
| Affiliated issuers | | $5,614 |
| Expenses | | |
| Independent trustees' fees and expenses | $1 | |
| Total expenses | | 1 |
| Net investment income (loss) | | 5,613 |
| Realized and Unrealized Gain (Loss) | | |
| Net realized gain (loss) on: | | |
| Investment securities: | | |
| Affiliated issuers | (2,070) | |
| Capital gain distributions from underlying funds: | | |
| Affiliated issuers | 13,855 | |
| Total net realized gain (loss) | | 11,785 |
| Change in net unrealized appreciation (depreciation) on: | | |
| Investment securities: | | |
| Affiliated issuers | (13,622) | |
| Total change in net unrealized appreciation (depreciation) | | (13,622) |
| Net gain (loss) | | (1,837) |
| Net increase (decrease) in net assets resulting from operations | | $3,776 |
See accompanying notes which are an integral part of the financial statements.
Statement of Changes in Net Assets
| | Year ended March 31, 2022 | Year ended March 31, 2021 |
| Increase (Decrease) in Net Assets | | |
| Operations | | |
| Net investment income (loss) | $5,613 | $2,237 |
| Net realized gain (loss) | 11,785 | 8,401 |
| Change in net unrealized appreciation (depreciation) | (13,622) | 46,633 |
| Net increase (decrease) in net assets resulting from operations | 3,776 | 57,271 |
| Distributions to shareholders | (17,646) | (8,330) |
| Share transactions | | |
| Proceeds from sales of shares | 192,631 | – |
| Reinvestment of distributions | 17,646 | 8,330 |
| Cost of shares redeemed | (26,471) | – |
| Net increase (decrease) in net assets resulting from share transactions | 183,806 | 8,330 |
| Total increase (decrease) in net assets | 169,936 | 57,271 |
| Net Assets | | |
| Beginning of period | 158,393 | 101,122 |
| End of period | $328,329 | $158,393 |
| Other Information | | |
| Shares | | |
| Sold | 15,744 | – |
| Issued in reinvestment of distributions | 1,388 | 755 |
| Redeemed | (2,144) | – |
| Net increase (decrease) | 14,988 | 755 |
See accompanying notes which are an integral part of the financial statements.
Financial Highlights
Fidelity Flex Freedom Blend 2060 Fund
| | | | | | |
| Years ended March 31, | 2022 | 2021 | 2020 | 2019 | 2018 A |
| Selected Per–Share Data | | | | | |
| Net asset value, beginning of period | $12.46 | $8.46 | $10.13 | $10.66 | $10.00 |
| Income from Investment Operations | | | | | |
| Net investment income (loss)B,C | .36 | .18 | .23 | .22 | .17 |
| Net realized and unrealized gain (loss) | .18D | 4.51 | (1.15) | –E | .82 |
| Total from investment operations | .54 | 4.69 | (.92) | .22 | .99 |
| Distributions from net investment income | (.34) | (.18) | (.24) | (.22) | (.17) |
| Distributions from net realized gain | (.81) | (.50) | (.51) | (.53) | (.17) |
| Total distributions | (1.15) | (.69)F | (.75) | (.75) | (.33)F |
| Net asset value, end of period | $11.85 | $12.46 | $8.46 | $10.13 | $10.66 |
| Total ReturnG | 3.84% | 56.58% | (10.24)% | 2.55% | 9.89% |
| Ratios to Average Net AssetsC,H,I | | | | | |
| Expenses before reductions | - %J | - %J | - %J | - %J | - %K |
| Expenses net of fee waivers, if any | - %J | - %J | - %J | - %J | - %K |
| Expenses net of all reductions | - %J | - %J | - %J | - %J | - %K |
| Net investment income (loss) | 2.81% | 1.67% | 2.30% | 2.13% | 2.00%K |
| Supplemental Data | | | | | |
| Net assets, end of period (000 omitted) | $328 | $158 | $101 | $113 | $110 |
| Portfolio turnover rateL | 31% | 19% | 62% | 20% | 13%K |
A For the period June 8, 2017 (commencement of operations) through March 31, 2018.
B Calculated based on average shares outstanding during the period.
C Net investment income (loss) is affected by the timing of the declaration of dividends by any underlying mutual funds or exchange-traded funds (ETFs). Net investment income (loss) of any such underlying funds is not included in the Fund's net investment income (loss) ratio.
D The amount shown for a share outstanding does not correspond with the aggregate net gain (loss) on investments for the period due to the timing of sales and repurchases of shares in relation to fluctuating market values of the investments of the Fund.
E Amount represents less than $.005 per share.
F Total distributions per share do not sum due to rounding.
G Total returns for periods of less than one year are not annualized.
H Fees and expenses of any underlying mutual funds or exchange-traded funds (ETFs) are not included in the Fund's expense ratio. The Fund indirectly bears its proportionate share of these expenses.
I Expense ratios reflect operating expenses of the class. Expenses before reductions do not reflect amounts reimbursed, waived, or reduced through arrangements with the investment adviser, brokerage services, or other offset arrangements, if applicable, and do not represent the amount paid by the class during periods when reimbursements, waivers or reductions occur.
J Amount represents less than .005%.
K Annualized
L Amount does not include the portfolio activity of any underlying mutual funds or exchange-traded funds (ETFs).
See accompanying notes which are an integral part of the financial statements.
Fidelity Flex® Freedom Blend 2065 Fund
Investment Summary (Unaudited)
The information in the following tables is based on the direct investments of the Fund.
Top Holdings as of March 31, 2022
| | % of fund's net assets |
| Fidelity Series Large Cap Value Index Fund | 14.4 |
| Fidelity Series Emerging Markets Opportunities Fund | 12.9 |
| Fidelity Series Blue Chip Growth Fund | 10.7 |
| Fidelity Series Large Cap Stock Fund | 7.5 |
| Fidelity Series Large Cap Growth Index Fund | 6.8 |
| Fidelity Series International Value Fund | 6.7 |
| Fidelity Series Overseas Fund | 6.6 |
| Fidelity Series International Growth Fund | 6.6 |
| Fidelity Series Long-Term Treasury Bond Index Fund | 5.4 |
| Fidelity Series Value Discovery Fund | 5.3 |
| | 82.9 |
Asset Allocation (% of fund's net assets)
| Period end |
| | Domestic Equity Funds | 49.8% |
| | International Equity Funds | 42.4% |
| | Bond Funds | 7.8% |

Domestic Equity Funds category includes Fidelity Series Commodity Strategy Fund which invests in commodity-related investments.
Fidelity Flex® Freedom Blend 2065 Fund
Schedule of Investments March 31, 2022
Showing Percentage of Net Assets
| Domestic Equity Funds - 49.8% | | | |
| | | Shares | Value |
| Fidelity Series Blue Chip Growth Fund (a) | | 2,244 | $32,246 |
| Fidelity Series Commodity Strategy Fund (a) | | 883 | 4,514 |
| Fidelity Series Large Cap Growth Index Fund (a) | | 1,156 | 20,337 |
| Fidelity Series Large Cap Stock Fund (a) | | 1,192 | 22,667 |
| Fidelity Series Large Cap Value Index Fund (a) | | 2,827 | 43,427 |
| Fidelity Series Small Cap Opportunities Fund (a) | | 801 | 10,907 |
| Fidelity Series Value Discovery Fund (a) | | 1,003 | 16,044 |
| TOTAL DOMESTIC EQUITY FUNDS | | | |
| (Cost $139,264) | | | 150,142 |
|
| International Equity Funds - 42.4% | | | |
| Fidelity Series Canada Fund (a) | | 640 | 9,935 |
| Fidelity Series Emerging Markets Fund (a) | | 458 | 4,252 |
| Fidelity Series Emerging Markets Opportunities Fund (a) | | 2,120 | 39,007 |
| Fidelity Series International Growth Fund (a) | | 1,198 | 19,870 |
| Fidelity Series International Index Fund (a) | | 738 | 8,437 |
| Fidelity Series International Small Cap Fund (a) | | 345 | 6,196 |
| Fidelity Series International Value Fund (a) | | 1,819 | 20,061 |
| Fidelity Series Overseas Fund (a) | | 1,583 | 19,976 |
| TOTAL INTERNATIONAL EQUITY FUNDS | | | |
| (Cost $128,360) | | | 127,734 |
|
| Bond Funds - 7.8% | | | |
| Fidelity Series 5+ Year Inflation-Protected Bond Index Fund (a) | | 31 | 302 |
| Fidelity Series Corporate Bond Fund (a) | | 33 | 331 |
| Fidelity Series Emerging Markets Debt Fund (a) | | 185 | 1,523 |
| Fidelity Series Emerging Markets Debt Local Currency Fund (a) | | 55 | 500 |
| Fidelity Series Floating Rate High Income Fund (a) | | 33 | 300 |
| Fidelity Series Government Bond Index Fund (a) | | 48 | 481 |
| Fidelity Series High Income Fund (a) | | 201 | 1,827 |
| Fidelity Series International Credit Fund (a) | | 3 | 32 |
| Fidelity Series Investment Grade Bond Fund (a) | | 47 | 508 |
| Fidelity Series Investment Grade Securitized Fund (a) | | 35 | 343 |
| Fidelity Series Long-Term Treasury Bond Index Fund (a) | | 2,122 | 16,173 |
| Fidelity Series Real Estate Income Fund (a) | | 93 | 1,054 |
| TOTAL BOND FUNDS | | | |
| (Cost $24,786) | | | 23,374 |
|
| Short-Term Funds - 0.0% | | | |
| Fidelity Cash Central Fund 0.31% (b) | | | |
| (Cost $19) | | 19 | 19 |
| TOTAL INVESTMENT IN SECURITIES - 100.0% | | | |
| (Cost $292,429) | | | 301,269 |
| NET OTHER ASSETS (LIABILITIES) - 0.0% | | | (1) |
| NET ASSETS - 100% | | | $301,268 |
Legend
(a) Affiliated Fund
(b) Affiliated fund that is generally available only to investment companies and other accounts managed by Fidelity Investments. The rate quoted is the annualized seven-day yield of the fund at period end. A complete unaudited listing of the fund's holdings as of its most recent quarter end is available upon request. In addition, each Fidelity Central Fund's financial statements, which are not covered by the Fund's Report of Independent Registered Public Accounting Firm, are available on the SEC's website or upon request.
Affiliated Central Funds
Fiscal year to date information regarding the Fund's investments in Fidelity Central Funds, including the ownership percentage, is presented below.
| Fund | Value, beginning of period | Purchases | Sales Proceeds | Dividend Income | Realized Gain/Loss | Change in Unrealized appreciation (depreciation) | Value, end of period | % ownership, end of period |
| Fidelity Cash Central Fund 0.31% | $19 | $-- | $-- | $-- | $-- | $-- | $19 | 0.0% |
| Total | $19 | $-- | $-- | $-- | $-- | $-- | $19 | |
Amounts in the income column in the above table include any capital gain distributions from underlying funds, which are presented in the corresponding line-item in the Statement of Operations, if applicable.
Affiliated Underlying Funds
Fiscal year to date information regarding the Fund's investments in affiliated Underlying Funds is presented below. Exchanges between classes of the same affiliated Underlying Funds may occur. If an underlying Fund changes its name, the name presented below is the name in effect at period end.
| Fund | Value, beginning of period | Purchases(a) | Sales Proceeds(a) | Dividend Income | Realized Gain (loss) | Change in Unrealized appreciation (depreciation) | Value, end of period |
| Fidelity Series 0-5 Year Inflation-Protected Bond Index Fund | $-- | $1,062 | $1,059 | $3 | $(3) | $-- | $-- |
| Fidelity Series 5+ Year Inflation-Protected Bond Index Fund | -- | 2,612 | 2,239 | 9 | (67) | (4) | 302 |
| Fidelity Series Blue Chip Growth Fund | 14,957 | 28,359 | 7,239 | 3,991 | (335) | (3,496) | 32,246 |
| Fidelity Series Canada Fund | 3,291 | 7,117 | 1,557 | 127 | (8) | 1,092 | 9,935 |
| Fidelity Series Commodity Strategy Fund | 3,772 | 5,332 | 4,997 | 1,444 | (31) | 438 | 4,514 |
| Fidelity Series Corporate Bond Fund | 14 | 467 | 146 | 1 | (4) | -- | 331 |
| Fidelity Series Emerging Markets Debt Fund | 742 | 1,137 | 232 | 43 | (13) | (111) | 1,523 |
| Fidelity Series Emerging Markets Debt Local Currency Fund | 247 | 368 | 72 | 14 | (5) | (38) | 500 |
| Fidelity Series Emerging Markets Fund | 2,162 | 3,329 | 505 | 94 | (46) | (688) | 4,252 |
| Fidelity Series Emerging Markets Opportunities Fund | 19,451 | 33,557 | 4,829 | 2,961 | (619) | (8,553) | 39,007 |
| Fidelity Series Floating Rate High Income Fund | 146 | 214 | 59 | 8 | (1) | -- | 300 |
| Fidelity Series Government Bond Index Fund | 18 | 714 | 246 | -- | (4) | (1) | 481 |
| Fidelity Series Government Money Market Fund 0.31% | 353 | 42 | 395 | -- | -- | -- | -- |
| Fidelity Series High Income Fund | 860 | 1,331 | 313 | 63 | (8) | (43) | 1,827 |
| Fidelity Series Inflation-Protected Bond Index Fund | 2,714 | 1,219 | 4,051 | 36 | 247 | (129) | -- |
| Fidelity Series International Credit Fund | 33 | 1 | -- | 1 | -- | (2) | 32 |
| Fidelity Series International Growth Fund | 8,062 | 15,838 | 2,337 | 1,025 | (170) | (1,523) | 19,870 |
| Fidelity Series International Index Fund | 3,379 | 6,281 | 956 | 136 | (47) | (220) | 8,437 |
| Fidelity Series International Small Cap Fund | 2,919 | 4,821 | 722 | 532 | (85) | (737) | 6,196 |
| Fidelity Series International Value Fund | 8,112 | 14,950 | 3,025 | 644 | (98) | 122 | 20,061 |
| Fidelity Series Investment Grade Bond Fund | 20 | 764 | 271 | 1 | (4) | (1) | 508 |
| Fidelity Series Investment Grade Securitized Fund | 13 | 477 | 144 | -- | (2) | (1) | 343 |
| Fidelity Series Large Cap Growth Index Fund | 9,438 | 14,730 | 4,933 | 403 | (139) | 1,241 | 20,337 |
| Fidelity Series Large Cap Stock Fund | 10,319 | 15,714 | 3,687 | 1,197 | (57) | 378 | 22,667 |
| Fidelity Series Large Cap Value Index Fund | 19,714 | 29,827 | 7,008 | 1,964 | (170) | 1,064 | 43,427 |
| Fidelity Series Long-Term Treasury Bond Index Fund | 3,719 | 14,654 | 1,403 | 157 | (176) | (621) | 16,173 |
| Fidelity Series Overseas Fund | 8,107 | 15,006 | 2,507 | 379 | (139) | (491) | 19,976 |
| Fidelity Series Real Estate Income Fund | 517 | 733 | 203 | 28 | (4) | 11 | 1,054 |
| Fidelity Series Short-Term Credit Fund | 174 | 32 | 206 | 1 | 2 | (2) | -- |
| Fidelity Series Small Cap Opportunities Fund | 4,996 | 8,883 | 1,421 | 1,592 | (151) | (1,400) | 10,907 |
| Fidelity Series Treasury Bill Index Fund | 560 | 120 | 680 | -- | -- | -- | -- |
| Fidelity Series Value Discovery Fund | 7,283 | 11,644 | 2,672 | 1,351 | (88) | (123) | 16,044 |
| | $136,092 | $241,335 | $60,114 | $18,205 | $(2,225) | $(13,838) | $301,250 |
(a) Includes the value of shares purchased or redeemed through in-kind transactions, as applicable.
Amounts in the income column in the above table include any capital gain distributions from underlying funds, which are presented in the corresponding line-item in the Statement of Operations, if applicable.
Investment Valuation
The following is a summary of the inputs used, as of March 31, 2022, involving the Fund's assets and liabilities carried at fair value. The inputs or methodology used for valuing securities may not be an indication of the risk associated with investing in those securities. For more information on valuation inputs, and their aggregation into the levels used below, please refer to the Investment Valuation section in the accompanying Notes to Financial Statements.
| | Valuation Inputs at Reporting Date: |
| Description | Total | Level 1 | Level 2 | Level 3 |
| Investments in Securities: | | | | |
| Domestic Equity Funds | $150,142 | $150,142 | $-- | $-- |
| International Equity Funds | 127,734 | 127,734 | -- | -- |
| Bond Funds | 23,374 | 23,374 | -- | -- |
| Short-Term Funds | 19 | 19 | -- | -- |
| Total Investments in Securities: | $301,269 | $301,269 | $-- | $-- |
See accompanying notes which are an integral part of the financial statements.
Fidelity Flex® Freedom Blend 2065 Fund
Financial Statements
Statement of Assets and Liabilities
| | | March 31, 2022 |
| Assets | | |
Investment in securities, at value — See accompanying schedule:
| | |
| Fidelity Central Funds (cost $19) | $19 | |
| Other affiliated issuers (cost $292,410) | 301,250 | |
| Total Investment in Securities (cost $292,429) | | $301,269 |
| Receivable for investments sold | | 5,000 |
| Receivable for fund shares sold | | 648 |
| Total assets | | 306,917 |
| Liabilities | | |
| Payable for investments purchased | $5,649 | |
| Total liabilities | | 5,649 |
| Net Assets | | $301,268 |
| Net Assets consist of: | | |
| Paid in capital | | $288,971 |
| Total accumulated earnings (loss) | | 12,297 |
| Net Assets | | $301,268 |
| Net Asset Value, offering price and redemption price per share ($301,268 ÷ 25,274 shares) | | $11.92 |
See accompanying notes which are an integral part of the financial statements.
Statement of Operations
| | | Year ended March 31, 2022 |
| Investment Income | | |
| Dividends: | | |
| Affiliated issuers | | $5,238 |
| Expenses | | |
| Independent trustees' fees and expenses | $1 | |
| Total expenses | | 1 |
| Net investment income (loss) | | 5,237 |
| Realized and Unrealized Gain (Loss) | | |
| Net realized gain (loss) on: | | |
| Investment securities: | | |
| Affiliated issuers | (2,225) | |
| Capital gain distributions from underlying funds: | | |
| Affiliated issuers | 12,967 | |
| Total net realized gain (loss) | | 10,742 |
| Change in net unrealized appreciation (depreciation) on: | | |
| Investment securities: | | |
| Affiliated issuers | (13,838) | |
| Total change in net unrealized appreciation (depreciation) | | (13,838) |
| Net gain (loss) | | (3,096) |
| Net increase (decrease) in net assets resulting from operations | | $2,141 |
See accompanying notes which are an integral part of the financial statements.
Statement of Changes in Net Assets
| | Year ended March 31, 2022 | Year ended March 31, 2021 |
| Increase (Decrease) in Net Assets | | |
| Operations | | |
| Net investment income (loss) | $5,237 | $1,920 |
| Net realized gain (loss) | 10,742 | 7,105 |
| Change in net unrealized appreciation (depreciation) | (13,838) | 40,195 |
| Net increase (decrease) in net assets resulting from operations | 2,141 | 49,220 |
| Distributions to shareholders | (15,925) | (6,651) |
| Share transactions | | |
| Proceeds from sales of shares | 189,639 | – |
| Reinvestment of distributions | 15,925 | 6,651 |
| Cost of shares redeemed | (26,623) | – |
| Net increase (decrease) in net assets resulting from share transactions | 178,941 | 6,651 |
| Total increase (decrease) in net assets | 165,157 | 49,220 |
| Net Assets | | |
| Beginning of period | 136,111 | 86,891 |
| End of period | $301,268 | $136,111 |
| Other Information | | |
| Shares | | |
| Sold | 15,261 | – |
| Issued in reinvestment of distributions | 1,247 | 597 |
| Redeemed | (2,151) | – |
| Net increase (decrease) | 14,357 | 597 |
See accompanying notes which are an integral part of the financial statements.
Financial Highlights
Fidelity Flex Freedom Blend 2065 Fund
| | | | |
| Years ended March 31, | 2022 | 2021 | 2020 A |
| Selected Per–Share Data | | | |
| Net asset value, beginning of period | $12.47 | $8.42 | $10.00 |
| Income from Investment Operations | | | |
| Net investment income (loss)B,C | .35 | .18 | .22 |
| Net realized and unrealized gain (loss) | .19D | 4.51 | (1.46) |
| Total from investment operations | .54 | 4.69 | (1.24) |
| Distributions from net investment income | (.32) | (.18) | (.22) |
| Distributions from net realized gain | (.76) | (.45) | (.12) |
| Total distributions | (1.09)E | (.64)E | (.34) |
| Net asset value, end of period | $11.92 | $12.47 | $8.42 |
| Total ReturnF | 3.86% | 56.66% | (13.10)% |
| Ratios to Average Net AssetsC,G,H | | | |
| Expenses before reductionsI | -% | -% | - %J |
| Expenses net of fee waivers, if anyI | -% | -% | - %J |
| Expenses net of all reductionsI | -% | -% | - %J |
| Net investment income (loss) | 2.78% | 1.67% | 2.88%J |
| Supplemental Data | | | |
| Net assets, end of period (000 omitted) | $301 | $136 | $87 |
| Portfolio turnover rateK | 31% | 19% | 208%J |
A For the period June 28, 2019 (commencement of operations) through March 31, 2020.
B Calculated based on average shares outstanding during the period.
C Net investment income (loss) is affected by the timing of the declaration of dividends by any underlying mutual funds or exchange-traded funds (ETFs). Net investment income (loss) of any such underlying funds is not included in the Fund's net investment income (loss) ratio.
D The amount shown for a share outstanding does not correspond with the aggregate net gain (loss) on investments for the period due to the timing of sales and repurchases of shares in relation to fluctuating market values of the investments of the Fund.
E Total distributions per share do not sum due to rounding.
F Total returns for periods of less than one year are not annualized.
G Fees and expenses of any underlying mutual funds or exchange-traded funds (ETFs) are not included in the Fund's expense ratio. The Fund indirectly bears its proportionate share of these expenses.
H Expense ratios reflect operating expenses of the class. Expenses before reductions do not reflect amounts reimbursed, waived, or reduced through arrangements with the investment adviser, brokerage services, or other offset arrangements, if applicable, and do not represent the amount paid by the class during periods when reimbursements, waivers or reductions occur.
I Amount represents less than .005%.
J Annualized
K Amount does not include the portfolio activity of any underlying mutual funds or exchange-traded funds (ETFs).
See accompanying notes which are an integral part of the financial statements.
Notes to Financial Statements
For the period ended March 31, 2022
1. Organization.
Fidelity Flex Freedom Blend Income Fund, Fidelity Flex Freedom Blend 2005 Fund, Fidelity Flex Freedom Blend 2010 Fund, Fidelity Flex Freedom Blend 2015 Fund, Fidelity Flex Freedom Blend 2020 Fund, Fidelity Flex Freedom Blend 2025 Fund, Fidelity Flex Freedom Blend 2030 Fund, Fidelity Flex Freedom Blend 2035 Fund, Fidelity Flex Freedom Blend 2040 Fund, Fidelity Flex Freedom Blend 2045 Fund, Fidelity Flex Freedom Blend 2050 Fund, Fidelity Flex Freedom Blend 2055 Fund, Fidelity Flex Freedom Blend 2060 Fund and Fidelity Flex Freedom Blend 2065 Fund (the Funds) are funds of Fidelity Aberdeen Street Trust (the Trust). The Trust is registered under the Investment Company Act of 1940, as amended (the 1940 Act), as an open-end management investment company organized as a Delaware statutory trust. Each Fund is authorized to issue an unlimited number of shares. The Funds are available only to certain fee-based accounts and advisory programs offered by Fidelity. Share transactions on the Statement of Changes in Net Assets may contain exchanges between affiliated funds.
2. Investments in Fidelity Central Funds.
Funds may invest in Fidelity Central Funds, which are open-end investment companies generally available only to other investment companies and accounts managed by the investment adviser and its affiliates. The Schedule of Investments lists any Fidelity Central Funds held as an investment as of period end, but does not include the underlying holdings of each Fidelity Central Fund. An investing fund indirectly bears its proportionate share of the expenses of the underlying Fidelity Central Funds.
Based on its investment objective, each Fidelity Central Fund may invest or participate in various investment vehicles or strategies that are similar to those of the investing fund. These strategies are consistent with the investment objectives of the investing fund and may involve certain economic risks which may cause a decline in value of each of the Fidelity Central Funds and thus a decline in the value of the investing fund.
| Fidelity Central Fund | Investment Manager | Investment Objective | Investment Practices | Expense Ratio(a) |
Fidelity Money Market Central Funds
| Fidelity Management & Research Company LLC (FMR) | Each fund seeks to obtain a high level of current income consistent with the preservation of capital and liquidity. | Short-term Investments | Less than .005% |
(a) Expenses expressed as a percentage of average net assets and are as of each underlying Central Fund's most recent annual or semi-annual shareholder report.
A complete unaudited list of holdings for each Fidelity Central Fund is available upon request or at the Securities and Exchange Commission website at www.sec.gov. In addition, the financial statements of the Fidelity Central Funds which contain the significant accounting policies (including investment valuation policies) of those funds, and are not covered by the Report of Independent Registered Public Accounting Firm, are available on the Securities and Exchange Commission website or upon request.
3. Significant Accounting Policies.
Each Fund is an investment company and applies the accounting and reporting guidance of the Financial Accounting Standards Board (FASB) Accounting Standards Codification Topic 946 Financial Services - Investment Companies. The financial statements have been prepared in conformity with accounting principles generally accepted in the United States of America (GAAP), which require management to make certain estimates and assumptions at the date of the financial statements. Actual results could differ from those estimates. Subsequent events, if any, through the date that the financial statements were issued have been evaluated in the preparation of the financial statements. Each Fund's Schedule of Investments lists any underlying mutual funds or exchange-traded funds (ETFs) but does not include the underlying holdings of these funds. The following summarizes the significant accounting policies of each Fund:
Investment Valuation. Investments are valued as of 4:00 p.m. Eastern time on the last calendar day of the period. Each Fund categorizes the inputs to valuation techniques used to value its investments into a disclosure hierarchy consisting of three levels as shown below:
- Level 1 – unadjusted quoted prices in active markets for identical investments
- Level 2 – other significant observable inputs (including quoted prices for similar investments, interest rates, prepayment speeds, etc.)
- Level 3 – unobservable inputs (including the Fund's own assumptions based on the best information available)
Valuation techniques used to value each Fund's investments by major category are as follows. Investments in open-end mutual funds are valued at their closing net asset value (NAV) each business day and are categorized as Level 1 in the hierarchy. The aggregate value of investments by input level as of March 31, 2022 is included at the end of each Fund's Schedule of Investments.
Investment Transactions and Income. For financial reporting purposes, the Funds' investment holdings and NAV include trades executed through the end of the last business day of the period. The NAV per share for processing shareholder transactions is calculated as of the close of business of the New York Stock Exchange (NYSE), normally 4:00 p.m. Eastern time and includes trades executed through the end of the prior business day. Gains and losses on securities sold are determined on the basis of identified cost. Income and capital gain distributions from any underlying mutual funds or ETFs are recorded on the ex-dividend date.
Expenses. Expenses directly attributable to a fund are charged to that fund. Expenses attributable to more than one fund are allocated among the respective funds on the basis of relative net assets or other appropriate methods. Expenses included in the accompanying financial statements reflect the expenses of that fund and do not include any expenses associated with any underlying mutual funds or exchange-traded funds. Although not included in a fund's expenses, a fund indirectly bears its proportionate share of these expenses through the net asset value of each underlying mutual fund or exchange-traded fund. Expense estimates are accrued in the period to which they relate and adjustments are made when actual amounts are known.
Income Tax Information and Distributions to Shareholders. Each year, each Fund intends to qualify as a regulated investment company under Subchapter M of the Internal Revenue Code, including distributing substantially all of its taxable income and realized gains. As a result, no provision for U.S. Federal income taxes is required. As of March 31, 2022, each Fund did not have any unrecognized tax benefits in the financial statements; nor is each Fund aware of any tax positions for which it is reasonably possible that the total amounts of unrecognized tax benefits will significantly change in the next twelve months. Each Fund files a U.S. federal tax return, in addition to state and local tax returns as required. Each Fund's federal income tax returns are subject to examination by the Internal Revenue Service (IRS) for a period of three fiscal years after they are filed. State and local tax returns may be subject to examination for an additional fiscal year depending on the jurisdiction.
Distributions are declared and recorded on the ex-dividend date. Income and capital gain distributions are determined in accordance with income tax regulations, which may differ from GAAP.
Capital accounts within the financial statements are adjusted for permanent book-tax differences. These adjustments have no impact on net assets or the results of operations. Capital accounts are not adjusted for temporary book-tax differences which will reverse in a subsequent period.
Book-tax differences are primarily due to the short-term gain distributions from the underlying mutual funds or ETFs and losses deferred due to wash sales.
As of period end, the cost and unrealized appreciation (depreciation) in securities, and derivatives if applicable, for federal income tax purposes were as follows for each Fund:
| | Tax cost | Gross unrealized appreciation | Gross unrealized depreciation | Net unrealized appreciation (depreciation) |
| Fidelity Flex Freedom Blend Income Fund | $153,228 | $3,660 | $(5,729) | $(2,069) |
| Fidelity Flex Freedom Blend 2005 Fund | 132,398 | 4,123 | (4,645) | (522) |
| Fidelity Flex Freedom Blend 2010 Fund | 133,905 | 5,894 | (4,873) | 1,021 |
| Fidelity Flex Freedom Blend 2015 Fund | 168,049 | 8,319 | (6,585) | 1,734 |
| Fidelity Flex Freedom Blend 2020 Fund | 263,402 | 10,983 | (11,851) | (868) |
| Fidelity Flex Freedom Blend 2025 Fund | 441,653 | 13,908 | (19,749) | (5,841) |
| Fidelity Flex Freedom Blend 2030 Fund | 1,102,425 | 19,538 | (56,944) | (37,406) |
| Fidelity Flex Freedom Blend 2035 Fund | 1,159,477 | 28,679 | (79,766) | (51,087) |
| Fidelity Flex Freedom Blend 2040 Fund | 871,505 | 26,912 | (52,504) | (25,592) |
| Fidelity Flex Freedom Blend 2045 Fund | 1,000,633 | 26,826 | (60,710) | (33,884) |
| Fidelity Flex Freedom Blend 2050 Fund | 680,661 | 25,384 | (43,771) | (18,387) |
| Fidelity Flex Freedom Blend 2055 Fund | 339,837 | 22,274 | (14,629) | 7,645 |
| Fidelity Flex Freedom Blend 2060 Fund | 318,352 | 21,516 | (11,538) | 9,978 |
| Fidelity Flex Freedom Blend 2065 Fund | 295,342 | 18,973 | (13,046) | 5,927 |
The tax-based components of distributable earnings as of period end were as follows for each Fund:
| | Undistributed ordinary income | Undistributed long-term capital gain | Net unrealized appreciation (depreciation) on securities and other investments |
| Fidelity Flex Freedom Blend Income Fund | $129 | $1,818 | $(2,069) |
| Fidelity Flex Freedom Blend 2005 Fund | 264 | 2,000 | (522) |
| Fidelity Flex Freedom Blend 2010 Fund | 280 | 2,351 | 1,021 |
| Fidelity Flex Freedom Blend 2015 Fund | 308 | 2,835 | 1,734 |
| Fidelity Flex Freedom Blend 2020 Fund | 700 | 3,595 | (868) |
| Fidelity Flex Freedom Blend 2025 Fund | 983 | 4,963 | (5,841) |
| Fidelity Flex Freedom Blend 2030 Fund | 2,512 | 9,696 | (37,406) |
| Fidelity Flex Freedom Blend 2035 Fund | 2,629 | 20,414 | (51,087) |
| Fidelity Flex Freedom Blend 2040 Fund | 838 | 12,987 | (25,592) |
| Fidelity Flex Freedom Blend 2045 Fund | 1,240 | 15,205 | (33,884) |
| Fidelity Flex Freedom Blend 2050 Fund | 849 | 13,845 | (18,387) |
| Fidelity Flex Freedom Blend 2055 Fund | 837 | 6,515 | 7,645 |
| Fidelity Flex Freedom Blend 2060 Fund | 342 | 6,265 | 9,978 |
| Fidelity Flex Freedom Blend 2065 Fund | 365 | 6,005 | 5,927 |
The tax character of distributions paid was as follows:
| March 31, 2022 | | | |
| | Ordinary Income | Long-term Capital Gains | Total |
| Fidelity Flex Freedom Blend Income Fund | $3,908 | $2,615 | $6,523 |
| Fidelity Flex Freedom Blend 2005 Fund | 4,040 | 3,222 | 7,262 |
| Fidelity Flex Freedom Blend 2010 Fund | 4,525 | 4,070 | 8,595 |
| Fidelity Flex Freedom Blend 2015 Fund | 5,405 | 4,585 | 9,990 |
| Fidelity Flex Freedom Blend 2020 Fund | 6,376 | 5,185 | 11,561 |
| Fidelity Flex Freedom Blend 2025 Fund | 8,290 | 5,908 | 14,198 |
| Fidelity Flex Freedom Blend 2030 Fund | 13,050 | 6,909 | 19,959 |
| Fidelity Flex Freedom Blend 2035 Fund | 24,516 | 9,303 | 33,819 |
| Fidelity Flex Freedom Blend 2040 Fund | 16,031 | 9,510 | 25,541 |
| Fidelity Flex Freedom Blend 2045 Fund | 21,493 | 13,924 | 35,417 |
| Fidelity Flex Freedom Blend 2050 Fund | 16,369 | 9,040 | 25,409 |
| Fidelity Flex Freedom Blend 2055 Fund | 9,605 | 8,607 | 18,212 |
| Fidelity Flex Freedom Blend 2060 Fund | 9,163 | 8,483 | 17,646 |
| Fidelity Flex Freedom Blend 2065 Fund | 8,442 | 7,483 | 15,925 |
| March 31, 2021 | | | |
| | Ordinary Income | Long-term Capital Gains | Total |
| Fidelity Flex Freedom Blend Income Fund | $2,684 | $899 | $3,583 |
| Fidelity Flex Freedom Blend 2005 Fund | 2,883 | 1,337 | 4,220 |
| Fidelity Flex Freedom Blend 2010 Fund | 3,070 | 1,903 | 4,973 |
| Fidelity Flex Freedom Blend 2015 Fund | 3,058 | 2,575 | 5,633 |
| Fidelity Flex Freedom Blend 2020 Fund | 3,145 | 3,089 | 6,234 |
| Fidelity Flex Freedom Blend 2025 Fund | 3,158 | 3,527 | 6,685 |
| Fidelity Flex Freedom Blend 2030 Fund | 3,295 | 4,216 | 7,511 |
| Fidelity Flex Freedom Blend 2035 Fund | 3,100 | 5,094 | 8,194 |
| Fidelity Flex Freedom Blend 2040 Fund | 2,920 | 5,383 | 8,303 |
| Fidelity Flex Freedom Blend 2045 Fund | 2,896 | 5,334 | 8,230 |
| Fidelity Flex Freedom Blend 2050 Fund | 2,894 | 5,383 | 8,277 |
| Fidelity Flex Freedom Blend 2055 Fund | 2,969 | 5,301 | 8,270 |
| Fidelity Flex Freedom Blend 2060 Fund | 2,981 | 5,349 | 8,330 |
| Fidelity Flex Freedom Blend 2065 Fund | 2,605 | 4,046 | 6,651 |
4. Purchases and Sales of Investments.
Purchases and sales of securities, other than short-term securities and in-kind transactions, as applicable, are noted in the table below.
| | Purchases ($) | Sales ($) |
| Fidelity Flex Freedom Blend Income Fund | 83,624 | 48,446 |
| Fidelity Flex Freedom Blend 2005 Fund | 58,805 | 46,999 |
| Fidelity Flex Freedom Blend 2010 Fund | 55,509 | 44,703 |
| Fidelity Flex Freedom Blend 2015 Fund | 91,961 | 48,833 |
| Fidelity Flex Freedom Blend 2020 Fund | 202,889 | 65,931 |
| Fidelity Flex Freedom Blend 2025 Fund | 404,687 | 90,607 |
| Fidelity Flex Freedom Blend 2030 Fund | 1,175,374 | 203,233 |
| Fidelity Flex Freedom Blend 2035 Fund | 1,248,616 | 221,232 |
| Fidelity Flex Freedom Blend 2040 Fund | 861,103 | 122,159 |
| Fidelity Flex Freedom Blend 2045 Fund | 1,107,282 | 239,433 |
| Fidelity Flex Freedom Blend 2050 Fund | 658,769 | 110,497 |
| Fidelity Flex Freedom Blend 2055 Fund | 292,783 | 85,657 |
| Fidelity Flex Freedom Blend 2060 Fund | 248,043 | 62,414 |
| Fidelity Flex Freedom Blend 2065 Fund | 241,335 | 60,114 |
5. Fees and Other Transactions with Affiliates.
Management Fee. Fidelity Management & Research Company LLC (the investment adviser) and its affiliates provide the Funds with investment management related services and the Funds do not pay any fees for these services. Under the management contract, the investment adviser or an affiliate pays all other expenses of the Funds, excluding fees and expenses of the independent Trustees, and certain miscellaneous expenses such as proxy and shareholder meeting expenses.
Interfund Trades. Funds may purchase from or sell securities to other Fidelity Funds under procedures adopted by the Board. The procedures have been designed to ensure these interfund trades are executed in accordance with Rule 17a-7 of the 1940 Act. Any interfund trades are included within the respective purchases and sales amounts shown in the Purchases and Sales of Investments note.
Reallocation of Underlying Fund Investments. During the period, the investment adviser reallocated investments of the Funds. This involved taxable redemptions of the Funds' interest in Fidelity Series Inflation-Protected Bond Index Fund, ("Underlying Fund") for investments and cash and non-taxable exchanges of those investments and cash for shares of Fidelity Series 0-5 Year Inflation-Protected Bond Index Fund and Fidelity Series 5+ Year Inflation-Protected Bond Index Fund which are affiliated investment companies managed by FMR. Net realized gain (loss) on the redemptions of the Underlying Fund in connection with the reallocation is included in the accompanying Statements of Operations as "Net realized gain (loss) on Affiliated issuers."
Details of these transactions with the net related gain (loss) for the Funds are presented in the accompanying table:
| | Value of Investments and Cash reallocated ($) | Net realized Gain (Loss) on redemptions of Underlying Fund ($) |
| Fidelity Flex Freedom Blend Income Fund | 8,733 | 643 |
| Fidelity Flex Freedom Blend 2005 Fund | 7,726 | 626 |
| Fidelity Flex Freedom Blend 2010 Fund | 6,905 | 549 |
| Fidelity Flex Freedom Blend 2015 Fund | 6,973 | 440 |
| Fidelity Flex Freedom Blend 2020 Fund | 7,628 | 209 |
| Fidelity Flex Freedom Blend 2025 Fund | 8,365 | 117 |
| Fidelity Flex Freedom Blend 2030 Fund | 11,262 | (137) |
| Fidelity Flex Freedom Blend 2035 Fund | 4,968 | 120 |
| Fidelity Flex Freedom Blend 2040 Fund | 2,702 | 62 |
| Fidelity Flex Freedom Blend 2045 Fund | 4,145 | 103 |
| Fidelity Flex Freedom Blend 2050 Fund | 3,850 | 77 |
| Fidelity Flex Freedom Blend 2055 Fund | 1,816 | 85 |
| Fidelity Flex Freedom Blend 2060 Fund | 1,707 | 89 |
| Fidelity Flex Freedom Blend 2065 Fund | 1,598 | 71 |
6. Other.
A fund's organizational documents provide former and current trustees and officers with a limited indemnification against liabilities arising in connection with the performance of their duties to the fund. In the normal course of business, a fund may also enter into contracts that provide general indemnifications. A fund's maximum exposure under these arrangements is unknown as this would be dependent on future claims that may be made against a fund. The risk of material loss from such claims is considered remote.
At the end of the period the investment adviser or its affiliates were owners of record of more than 10% of the outstanding shares of the following Funds:
| | Affiliated % |
| Fidelity Flex Freedom Blend Income Fund | 81% |
| Fidelity Flex Freedom Blend 2005 Fund | 96% |
| Fidelity Flex Freedom Blend 2010 Fund | 97% |
| Fidelity Flex Freedom Blend 2015 Fund | 81% |
| Fidelity Flex Freedom Blend 2020 Fund | 49% |
| Fidelity Flex Freedom Blend 2025 Fund | 28% |
| Fidelity Flex Freedom Blend 2040 Fund | 14% |
| Fidelity Flex Freedom Blend 2050 Fund | 19% |
| Fidelity Flex Freedom Blend 2055 Fund | 41% |
| Fidelity Flex Freedom Blend 2060 Fund | 44% |
| Fidelity Flex Freedom Blend 2065 Fund | 40% |
7. Coronavirus (COVID-19) Pandemic.
An outbreak of COVID-19 first detected in China during December 2019 has since spread globally and was declared a pandemic by the World Health Organization during March 2020. Developments that disrupt global economies and financial markets, such as the COVID-19 pandemic, may magnify factors that affect the Funds' performance.
Report of Independent Registered Public Accounting Firm
To the Board of Trustees of Fidelity Aberdeen Street Trust and Shareholders of Fidelity Flex Freedom Blend Income Fund, Fidelity Flex Freedom Blend 2005 Fund, Fidelity Flex Freedom Blend 2010 Fund, Fidelity Flex Freedom Blend 2015 Fund, Fidelity Flex Freedom Blend 2020 Fund, Fidelity Flex Freedom Blend 2025 Fund, Fidelity Flex Freedom Blend 2030 Fund, Fidelity Flex Freedom Blend 2035 Fund, Fidelity Flex Freedom Blend 2040 Fund, Fidelity Flex Freedom Blend 2045 Fund, Fidelity Flex Freedom Blend 2050 Fund, Fidelity Flex Freedom Blend 2055 Fund, Fidelity Flex Freedom Blend 2060 Fund and Fidelity Flex Freedom Blend 2065 Fund
Opinions on the Financial Statements
We have audited the accompanying statements of assets and liabilities, including the schedules of investments, of Fidelity Flex Freedom Blend Income Fund, Fidelity Flex Freedom Blend 2005 Fund, Fidelity Flex Freedom Blend 2010 Fund, Fidelity Flex Freedom Blend 2015 Fund, Fidelity Flex Freedom Blend 2020 Fund, Fidelity Flex Freedom Blend 2025 Fund, Fidelity Flex Freedom Blend 2030 Fund, Fidelity Flex Freedom Blend 2035 Fund, Fidelity Flex Freedom Blend 2040 Fund, Fidelity Flex Freedom Blend 2045 Fund, Fidelity Flex Freedom Blend 2050 Fund, Fidelity Flex Freedom Blend 2055 Fund, Fidelity Flex Freedom Blend 2060 Fund and Fidelity Flex Freedom Blend 2065 Fund (fourteen of the funds constituting Fidelity Aberdeen Street Trust, hereafter collectively referred to as the “Funds”) as of March 31, 2022, the related statements of operations for the year ended March 31, 2022, the statements of changes in net assets for each of the two years in the period ended March 31, 2022, including the related notes, and the financial highlights for each of the periods indicated therein (collectively referred to as the “financial statements”). In our opinion, the financial statements present fairly, in all material respects, the financial position of each of the Funds as of March 31, 2022, the results of each of their operations for the year then ended, the changes in each of their net assets for each of the two years in the period ended March 31, 2022, and each of the financial highlights for each of the periods indicated therein, in conformity with accounting principles generally accepted in the United States of America.
Basis for Opinions
These financial statements are the responsibility of the Funds’ management. Our responsibility is to express an opinion on the Funds’ financial statements based on our audits. We are a public accounting firm registered with the Public Company Accounting Oversight Board (United States) (PCAOB) and are required to be independent with respect to the Funds in accordance with the U.S. federal securities laws and the applicable rules and regulations of the Securities and Exchange Commission and the PCAOB.
We conducted our audits of these financial statements in accordance with the standards of the PCAOB. Those standards require that we plan and perform the audit to obtain reasonable assurance about whether the financial statements are free of material misstatement, whether due to error or fraud.
Our audits included performing procedures to assess the risks of material misstatement of the financial statements, whether due to error or fraud, and performing procedures that respond to those risks. Such procedures included examining, on a test basis, evidence regarding the amounts and disclosures in the financial statements. Our audits also included evaluating the accounting principles used and significant estimates made by management, as well as evaluating the overall presentation of the financial statements. Our procedures included confirmation of securities owned as of March 31, 2022 by correspondence with the custodian and brokers; when replies were not received from brokers, we performed other auditing procedures. We believe that our audits provide a reasonable basis for our opinions.
/s/ PricewaterhouseCoopers LLP
Boston, Massachusetts
May 12, 2022
We have served as the auditor of one or more investment companies in the Fidelity group of funds since 1932.
Trustees and Officers
The Trustees, Members of the Advisory Board (if any), and officers of the trust and funds, as applicable, are listed below. The Board of Trustees governs each fund and is responsible for protecting the interests of shareholders. The Trustees are experienced executives who meet periodically throughout the year to oversee each fund's activities, review contractual arrangements with companies that provide services to each fund, oversee management of the risks associated with such activities and contractual arrangements, and review each fund's performance. If the interests of a fund and an underlying Fidelity® fund were to diverge, a conflict of interest could arise and affect how the Trustees and Members of the Advisory Board fulfill their fiduciary duties to the affected funds. FMR has structured the funds to avoid these potential conflicts, although there may be situations where a conflict of interest is unavoidable. In such instances, FMR, the Trustees, and Members of the Advisory Board would take reasonable steps to minimize and, if possible, eliminate the conflict. Each of the Trustees oversees 317 funds.
The Trustees hold office without limit in time except that (a) any Trustee may resign; (b) any Trustee may be removed by written instrument, signed by at least two-thirds of the number of Trustees prior to such removal; (c) any Trustee who requests to be retired or who has become incapacitated by illness or injury may be retired by written instrument signed by a majority of the other Trustees; and (d) any Trustee may be removed at any special meeting of shareholders by a two-thirds vote of the outstanding voting securities of the trust. Each Trustee who is not an interested person (as defined in the 1940 Act) of the trust and the funds is referred to herein as an Independent Trustee. Each Independent Trustee shall retire not later than the last day of the calendar year in which his or her 75th birthday occurs. The Independent Trustees may waive this mandatory retirement age policy with respect to individual Trustees. Officers and Advisory Board Members hold office without limit in time, except that any officer or Advisory Board Member may resign or may be removed by a vote of a majority of the Trustees at any regular meeting or any special meeting of the Trustees. Except as indicated, each individual has held the office shown or other offices in the same company for the past five years.
The fund’s Statement of Additional Information (SAI) includes more information about the Trustees. To request a free copy, call Fidelity at 1-800-544-3455 (for managed account clients) or 1-800-835-5092 (for retirement plan participants).
Experience, Skills, Attributes, and Qualifications of the Trustees. The Governance and Nominating Committee has adopted a statement of policy that describes the experience, qualifications, attributes, and skills that are necessary and desirable for potential Independent Trustee candidates (Statement of Policy). The Board believes that each Trustee satisfied at the time he or she was initially elected or appointed a Trustee, and continues to satisfy, the standards contemplated by the Statement of Policy. The Governance and Nominating Committee also engages professional search firms to help identify potential Independent Trustee candidates who have the experience, qualifications, attributes, and skills consistent with the Statement of Policy. From time to time, additional criteria based on the composition and skills of the current Independent Trustees, as well as experience or skills that may be appropriate in light of future changes to board composition, business conditions, and regulatory or other developments, have also been considered by the professional search firms and the Governance and Nominating Committee. In addition, the Board takes into account the Trustees' commitment and participation in Board and committee meetings, as well as their leadership of standing and ad hoc committees throughout their tenure.
In determining that a particular Trustee was and continues to be qualified to serve as a Trustee, the Board has considered a variety of criteria, none of which, in isolation, was controlling. The Board believes that, collectively, the Trustees have balanced and diverse experience, qualifications, attributes, and skills, which allow the Board to operate effectively in governing each fund and protecting the interests of shareholders. Information about the specific experience, skills, attributes, and qualifications of each Trustee, which in each case led to the Board's conclusion that the Trustee should serve (or continue to serve) as a trustee of the funds, is provided below.
Board Structure and Oversight Function. Abigail P. Johnson is an interested person and currently serves as Chairman. The Trustees have determined that an interested Chairman is appropriate and benefits shareholders because an interested Chairman has a personal and professional stake in the quality and continuity of services provided to the funds. Independent Trustees exercise their informed business judgment to appoint an individual of their choosing to serve as Chairman, regardless of whether the Trustee happens to be independent or a member of management. The Independent Trustees have determined that they can act independently and effectively without having an Independent Trustee serve as Chairman and that a key structural component for assuring that they are in a position to do so is for the Independent Trustees to constitute a substantial majority for the Board. The Independent Trustees also regularly meet in executive session. Michael E. Kenneally serves as Chairman of the Independent Trustees and as such (i) acts as a liaison between the Independent Trustees and management with respect to matters important to the Independent Trustees and (ii) with management prepares agendas for Board meetings.
Fidelity® funds are overseen by different Boards of Trustees. The funds' Board oversees Fidelity's investment-grade bond, money market, asset allocation and certain equity funds, and other Boards oversee Fidelity's high income and other equity funds. The asset allocation funds may invest in Fidelity® funds that are overseen by such other Boards. The use of separate Boards, each with its own committee structure, allows the Trustees of each group of Fidelity® funds to focus on the unique issues of the funds they oversee, including common research, investment, and operational issues. On occasion, the separate Boards establish joint committees to address issues of overlapping consequences for the Fidelity® funds overseen by each Board.
The Trustees operate using a system of committees to facilitate the timely and efficient consideration of all matters of importance to the Trustees, each fund, and fund shareholders and to facilitate compliance with legal and regulatory requirements and oversight of the funds' activities and associated risks. The Board, acting through its committees, has charged FMR and its affiliates with (i) identifying events or circumstances the occurrence of which could have demonstrably adverse effects on the funds' business and/or reputation; (ii) implementing processes and controls to lessen the possibility that such events or circumstances occur or to mitigate the effects of such events or circumstances if they do occur; and (iii) creating and maintaining a system designed to evaluate continuously business and market conditions in order to facilitate the identification and implementation processes described in (i) and (ii) above. Because the day-to-day operations and activities of the funds are carried out by or through FMR, its affiliates, and other service providers, the funds' exposure to risks is mitigated but not eliminated by the processes overseen by the Trustees. While each of the Board's committees has responsibility for overseeing different aspects of the funds' activities, oversight is exercised primarily through the Operations and Audit Committees. In addition, an ad hoc Board committee of Independent Trustees has worked with FMR to enhance the Board's oversight of investment and financial risks, legal and regulatory risks, technology risks, and operational risks, including the development of additional risk reporting to the Board. Appropriate personnel, including but not limited to the funds' Chief Compliance Officer (CCO), FMR's internal auditor, the independent accountants, the funds' Treasurer and portfolio management personnel, make periodic reports to the Board's committees, as appropriate, including an annual review of Fidelity's risk management program for the Fidelity® funds. The responsibilities of each standing committee, including their oversight responsibilities, are described further under "Standing Committees of the Trustees."
Interested Trustees*:
Correspondence intended for a Trustee who is an interested person may be sent to Fidelity Investments, 245 Summer Street, Boston, Massachusetts 02210.
Name, Year of Birth; Principal Occupations and Other Relevant Experience+
Abigail P. Johnson (1961)
Year of Election or Appointment: 2009
Trustee
Chairman of the Board of Trustees
Ms. Johnson also serves as Trustee of other Fidelity® funds. Ms. Johnson serves as Chairman (2016-present), Chief Executive Officer (2014-present), and Director (2007-present) of FMR LLC (diversified financial services company), President of Fidelity Financial Services (2012-present) and President of Personal, Workplace and Institutional Services (2005-present). Ms. Johnson is Chairman and Director of Fidelity Management & Research Company LLC (investment adviser firm, 2011-present). Previously, Ms. Johnson served as Chairman and Director of FMR Co., Inc. (investment adviser firm, 2011-2019), Vice Chairman (2007-2016) and President (2013-2016) of FMR LLC, President and a Director of Fidelity Management & Research Company (2001-2005), a Trustee of other investment companies advised by Fidelity Management & Research Company, Fidelity Investments Money Management, Inc. (investment adviser firm), and FMR Co., Inc. (2001-2005), Senior Vice President of the Fidelity® funds (2001-2005), and managed a number of Fidelity® funds. Ms. Abigail P. Johnson and Mr. Arthur E. Johnson are not related.
Jennifer Toolin McAuliffe (1959)
Year of Election or Appointment: 2016
Trustee
Ms. McAuliffe also serves as Trustee of other Fidelity® funds and as Trustee of Fidelity Charitable (2020-present). Previously, Ms. McAuliffe served as Co-Head of Fixed Income of Fidelity Investments Limited (now known as FIL Limited (FIL)) (diversified financial services company), Director of Research for FIL’s credit and quantitative teams in London, Hong Kong and Tokyo and Director of Research for taxable and municipal bonds at Fidelity Investments Money Management, Inc. Ms. McAuliffe previously served as a member of the Advisory Board of certain Fidelity® funds (2016). Ms. McAuliffe was previously a lawyer at Ropes & Gray LLP and currently serves as director or trustee of several not-for-profit entities.
* Determined to be an “Interested Trustee” by virtue of, among other things, his or her affiliation with the trust or various entities under common control with FMR.
+ The information includes the Trustee's principal occupation during the last five years and other information relating to the experience, attributes, and skills relevant to the Trustee's qualifications to serve as a Trustee, which led to the conclusion that the Trustee should serve as a Trustee for each fund.
Independent Trustees:
Correspondence intended for an Independent Trustee may be sent to Fidelity Investments, P.O. Box 55235, Boston, Massachusetts 02205-5235.
Name, Year of Birth; Principal Occupations and Other Relevant Experience+
Elizabeth S. Acton (1951)
Year of Election or Appointment: 2013
Trustee
Ms. Acton also serves as Trustee of other Fidelity® funds. Prior to her retirement, Ms. Acton served as Executive Vice President, Finance (2011-2012), Executive Vice President, Chief Financial Officer (2002-2011) and Treasurer (2004-2005) of Comerica Incorporated (financial services). Prior to joining Comerica, Ms. Acton held a variety of positions at Ford Motor Company (1983-2002), including Vice President and Treasurer (2000-2002) and Executive Vice President and Chief Financial Officer of Ford Motor Credit Company (1998-2000). Ms. Acton currently serves as a member of the Board and Audit and Finance Committees of Beazer Homes USA, Inc. (homebuilding, 2012-present). Ms. Acton previously served as a member of the Advisory Board of certain Fidelity® funds (2013-2016).
Ann E. Dunwoody (1953)
Year of Election or Appointment: 2018
Trustee
General Dunwoody also serves as Trustee of other Fidelity® funds. General Dunwoody (United States Army, Retired) was the first woman in U.S. military history to achieve the rank of four-star general and prior to her retirement in 2012 held a variety of positions within the U.S. Army, including Commanding General, U.S. Army Material Command (2008-2012). General Dunwoody currently serves as President of First to Four LLC (leadership and mentoring services, 2012-present), a member of the Board and Nomination and Corporate Governance Committees of Kforce Inc. (professional staffing services, 2016-present) and a member of the Board of Automattic Inc. (software engineering, 2018-present). Previously, General Dunwoody served as a member of the Advisory Board and Nominating and Corporate Governance Committee of L3 Technologies, Inc. (communication, electronic, sensor and aerospace systems, 2013-2019) and a member of the Board and Audit and Sustainability and Corporate Responsibility Committees of Republic Services, Inc. (waste collection, disposal and recycling, 2013-2016). Ms. Dunwoody also serves on several boards for non-profit organizations, including as a member of the Board, Chair of the Nomination and Governance Committee and a member of the Audit Committee of Logistics Management Institute (consulting non-profit, 2012-present), a member of the Council of Trustees for the Association of the United States Army (advocacy non-profit, 2013-present), a member of the Board of Florida Institute of Technology (2015-present) and a member of the Board of ThanksUSA (military family education non-profit, 2014-present). General Dunwoody previously served as a member of the Advisory Board of certain Fidelity® funds (2018).
John Engler (1948)
Year of Election or Appointment: 2014
Trustee
Mr. Engler also serves as Trustee of other Fidelity® funds. Previously, Mr. Engler served as Governor of Michigan (1991-2003), President of the Business Roundtable (2011-2017) and interim President of Michigan State University (2018-2019). Mr. Engler currently serves as a member of the Board of Stride, Inc. (formerly K12 Inc.) (technology-based education company, 2012-present). Previously, Mr. Engler served as a member of the Board of Universal Forest Products (manufacturer and distributor of wood and wood-alternative products, 2003-2019) and Trustee of The Munder Funds (2003-2014). Mr. Engler previously served as a member of the Advisory Board of certain Fidelity® funds (2014-2016).
Robert F. Gartland (1951)
Year of Election or Appointment: 2010
Trustee
Mr. Gartland also serves as Trustee of other Fidelity® funds. Prior to his retirement, Mr. Gartland held a variety of positions at Morgan Stanley (financial services, 1979-2007), including Managing Director (1987-2007) and Chase Manhattan Bank (1975-1978). Mr. Gartland previously served as Chairman and an investor in Gartland & Mellina Group Corp. (consulting, 2009-2019), as a member of the Board of National Securities Clearing Corporation (1993-1996) and as Chairman of TradeWeb (2003-2004).
Arthur E. Johnson (1947)
Year of Election or Appointment: 2008
Trustee
Mr. Johnson also serves as Trustee of other Fidelity® funds. Prior to his retirement, Mr. Johnson served as Senior Vice President of Corporate Strategic Development of Lockheed Martin Corporation (defense contractor, 1999-2009). Mr. Johnson currently serves as a member of the Board of Booz Allen Hamilton (management consulting, 2011-present). Mr. Johnson previously served as a member of the Board of Eaton Corporation plc (diversified power management, 2009-2019) and a member of the Board of AGL Resources, Inc. (holding company, 2002-2016). Mr. Johnson previously served as Chairman (2018-2021) and Vice Chairman (2015-2018) of the Independent Trustees of certain Fidelity® funds. Mr. Arthur E. Johnson is not related to Ms. Abigail P. Johnson.
Michael E. Kenneally (1954)
Year of Election or Appointment: 2009
Trustee
Chairman of the Independent Trustees
Mr. Kenneally also serves as Trustee of other Fidelity® funds and was Vice Chairman (2018-2021) of the Independent Trustees of certain Fidelity® funds. Prior to retirement in 2005, he was Chairman and Global Chief Executive Officer of Credit Suisse Asset Management, the worldwide fund management and institutional investment business of Credit Suisse Group. Previously, Mr. Kenneally was an Executive Vice President and the Chief Investment Officer for Bank of America. In this role, he was responsible for the investment management, strategy and products delivered to the bank’s institutional, high-net-worth and retail clients. Earlier, Mr. Kenneally directed the organization’s equity and quantitative research groups. He began his career as a research analyst and then spent more than a dozen years as a portfolio manager for endowments, pension plans and mutual funds. He earned the Chartered Financial Analyst (CFA) designation in 1991.
Marie L. Knowles (1946)
Year of Election or Appointment: 2001
Trustee
Ms. Knowles also serves as Trustee of other Fidelity® funds. Prior to her retirement, Ms. Knowles held several positions at Atlantic Richfield Company (diversified energy), including Executive Vice President and Chief Financial Officer (1996-2000), Senior Vice President (1993-1996) and President of ARCO Transportation Company (pipeline and tanker operations, 1993-1996). Ms. Knowles currently serves as a member of the Board of the Santa Catalina Island Company (real estate, 2009-present), a member of the Investment Company Institute Board of Governors and a member of the Governing Council of the Independent Directors Council (2014-present). Ms. Knowles also serves as a member of the Advisory Board for the School of Engineering of the University of Southern California. Ms. Knowles previously served as a member of the Board of McKesson Corporation (healthcare service, 2002-2021). In addition, Ms. Knowles previously served as Chairman (2015-2018) and Vice Chairman (2012-2015) of the Independent Trustees of certain Fidelity® funds.
Mark A. Murray (1954)
Year of Election or Appointment: 2016
Trustee
Mr. Murray also serves as Trustee of other Fidelity® funds. Previously, Mr. Murray served as Co-Chief Executive Officer (2013-2016), President (2006-2013) and Vice Chairman (2013-2020) of Meijer, Inc. Mr. Murray serves as a member of the Board (2009-present) and Public Policy and Responsibility Committee (2009-present) and Chair of the Nuclear Review Committee (2019-present) of DTE Energy Company (diversified energy company). Mr. Murray previously served as a member of the Board of Spectrum Health (not-for-profit health system, 2015-2019) and as a member of the Board and Audit Committee and Chairman of the Nominating and Corporate Governance Committee of Universal Forest Products, Inc. (manufacturer and distributor of wood and wood-alternative products, 2004-2016). Mr. Murray also serves as a member of the Board of many community and professional organizations. Mr. Murray previously served as a member of the Advisory Board of certain Fidelity® funds (2016).
+ The information includes the Trustee's principal occupation during the last five years and other information relating to the experience, attributes, and skills relevant to the Trustee's qualifications to serve as a Trustee, which led to the conclusion that the Trustee should serve as a Trustee for each fund.
Advisory Board Members and Officers:
Correspondence intended for an officer may be sent to Fidelity Investments, 245 Summer Street, Boston, Massachusetts 02210. Officers appear below in alphabetical order.
Name, Year of Birth; Principal Occupation
Robert W. Helm (1957)
Year of Election or Appointment: 2021
Member of the Advisory Board
Mr. Helm also serves as a Member of the Advisory Board of other Fidelity® funds. Mr. Helm was formerly Deputy Chairman (2003-2020), partner (1991-2020) and an associate (1984-1991) of Dechert LLP (formerly Dechert Price & Rhoads). Mr. Helm currently serves on boards and committees of several not-for-profit organizations.
Craig S. Brown (1977)
Year of Election or Appointment: 2019
Assistant Treasurer
Mr. Brown also serves as an officer of other funds. Mr. Brown serves as Assistant Treasurer of FIMM, LLC (2021-present) and is an employee of Fidelity Investments (2013-present).
John J. Burke III (1964)
Year of Election or Appointment: 2018
Chief Financial Officer
Mr. Burke also serves as Chief Financial Officer of other funds. Mr. Burke serves as Head of Investment Operations for Fidelity Fund and Investment Operations (2018-present) and is an employee of Fidelity Investments (1998-present). Previously Mr. Burke served as head of Asset Management Investment Operations (2012-2018).
David J. Carter (1973)
Year of Election or Appointment: 2020
Assistant Secretary
Mr. Carter also serves as Assistant Secretary of other funds. Mr. Carter serves as Senior Vice President, Deputy General Counsel (2022-present) and is an employee of Fidelity Investments (2005-present).
Jonathan Davis (1968)
Year of Election or Appointment: 2010
Assistant Treasurer
Mr. Davis also serves as an officer of other funds. Mr. Davis serves as Assistant Treasurer of FIMM, LLC (2021-present), FMR Capital, Inc. (2017-present), FD Funds GP LLC (2021-present), FD Funds Holding LLC (2021-present), and FD Funds Management LLC (2021-present); and is an employee of Fidelity Investments. Previously, Mr. Davis served as Vice President and Associate General Counsel of FMR LLC (diversified financial services company, 2003-2010).
Laura M. Del Prato (1964)
Year of Election or Appointment: 2018
President and Treasurer
Ms. Del Prato also serves as an officer of other funds. Ms. Del Prato serves as Assistant Treasurer of FIMM, LLC (2021-present) and is an employee of Fidelity Investments (2017-present). Previously, Ms. Del Prato served as President and Treasurer of The North Carolina Capital Management Trust: Cash Portfolio and Term Portfolio (2018-2020). Prior to joining Fidelity Investments, Ms. Del Prato served as a Managing Director and Treasurer of the JPMorgan Mutual Funds (2014-2017). Prior to JPMorgan, Ms. Del Prato served as a partner at Cohen Fund Audit Services (accounting firm, 2012-2013) and KPMG LLP (accounting firm, 2004-2012).
Colm A. Hogan (1973)
Year of Election or Appointment: 2016
Assistant Treasurer
Mr. Hogan also serves as an officer of other funds. Mr. Hogan serves as Assistant Treasurer of FIMM, LLC (2021-present) and FMR Capital, Inc. (2017-present) and is an employee of Fidelity Investments (2005-present). Previously, Mr. Hogan served as Deputy Treasurer of certain Fidelity® funds (2016-2020) and Assistant Treasurer of certain Fidelity® funds (2016-2018).
Cynthia Lo Bessette (1969)
Year of Election or Appointment: 2019
Secretary and Chief Legal Officer (CLO)
Ms. Lo Bessette also serves as an officer of other funds. Ms. Lo Bessette serves as CLO, Secretary, and Senior Vice President of Fidelity Management & Research Company LLC (investment adviser firm, 2019-present); CLO of Fidelity Management & Research (Hong Kong) Limited, FMR Investment Management (UK) Limited, and Fidelity Management & Research (Japan) Limited (investment adviser firms, 2019-present); Secretary of FD Funds GP LLC (2021-present), FD Funds Holding LLC (2021-present), and FD Funds Management LLC (2021-present); and Assistant Secretary of FIMM, LLC (2019-present). She is a Senior Vice President and Deputy General Counsel of FMR LLC (diversified financial services company, 2019-present), and is an employee of Fidelity Investments. Previously, Ms. Lo Bessette served as CLO, Secretary, and Senior Vice President of FMR Co., Inc. (investment adviser firm, 2019); Secretary of Fidelity SelectCo, LLC and Fidelity Investments Money Management, Inc. (investment adviser firms, 2019). Prior to joining Fidelity Investments, Ms. Lo Bessette was Executive Vice President, General Counsel (2016-2019) and Senior Vice President, Deputy General Counsel (2015-2016) of OppenheimerFunds (investment management company) and Deputy Chief Legal Officer (2013-2015) of Jennison Associates LLC (investment adviser firm).
Chris Maher (1972)
Year of Election or Appointment: 2013
Assistant Treasurer
Mr. Maher also serves as an officer of other funds. Mr. Maher serves as Assistant Treasurer of FIMM, LLC (2021-present) and FMR Capital, Inc. (2017-present), and is an employee of Fidelity Investments (2008-present). Previously, Mr. Maher served as Assistant Treasurer of certain funds (2013-2020); Vice President of Asset Management Compliance (2013), Vice President of the Program Management Group of FMR (investment adviser firm, 2010-2013), and Vice President of Valuation Oversight (2008-2010).
Kenneth B. Robins (1969)
Year of Election or Appointment: 2020
Chief Compliance Officer
Mr. Robins also serves as an officer of other funds. Mr. Robins serves as Compliance Officer of Fidelity Management & Research Company LLC (investment adviser firm, 2016-present) and is an employee of Fidelity Investments (2004-present). Previously, Mr. Robins served as Compliance Officer of FMR Co., Inc. (investment adviser firm, 2016-2019), as Executive Vice President of Fidelity Investments Money Management, Inc. (investment adviser firm, 2013-2016) and served in other fund officer roles.
Brett Segaloff (1972)
Year of Election or Appointment: 2021
Anti-Money Laundering (AML) Officer
Mr. Segaloff also serves as an AML Officer of other funds and other related entities. He is Director, Anti-Money Laundering (2007-present) of FMR LLC (diversified financial services company) and is an employee of Fidelity Investments (1996-present).
Stacie M. Smith (1974)
Year of Election or Appointment: 2013
Assistant Treasurer
Ms. Smith also serves as an officer of other funds. Ms. Smith serves as Assistant Treasurer of FIMM, LLC (2021-present) and FMR Capital, Inc. (2017-present), is an employee of Fidelity Investments (2009-present), and has served in other fund officer roles. Prior to joining Fidelity Investments, Ms. Smith served as Senior Audit Manager of Ernst & Young LLP (accounting firm, 1996-2009). Previously, Ms. Smith served as Assistant Treasurer (2013-2019) and Deputy Treasurer (2013-2016) of certain Fidelity® funds.
Jim Wegmann (1979)
Year of Election or Appointment: 2021
Deputy Treasurer
Mr. Wegmann also serves as an officer of other funds. Mr. Wegmann serves as Assistant Treasurer of FIMM, LLC (2021-present) and is an employee of Fidelity Investments (2011-present). Previously, Mr. Wegmann served as Assistant Treasurer of certain Fidelity® funds (2019-2021).
Vadim Zlotnikov (1962)
Year of Election or Appointment: 2019
Vice President
Mr. Zlotnikov also serves as Vice President of other funds. Mr. Zlotnikov serves as President and Director of Fidelity Diversifying Solutions LLC (investment adviser firm, 2021-present), President and Director of FIAM LLC (investment adviser firm, 2020-present), and is an employee of Fidelity Investments (2018-present). Previously, Mr. Zlotnikov served as President and Chief Investment Officer of Global Asset Allocation (2018-2020). Prior to joining Fidelity Investments, Mr. Zlotnikov served as Co-Head of Multi-Asset Solutions, Chief Market Strategist, and CIO of Systematic Strategies with AllianceBernstein (investment adviser firm, 2002-2018).
Shareholder Expense Example
As a shareholder, you incur two types of costs: (1) transaction costs, which may include sales charges (loads) on purchase payments or redemption proceeds, as applicable and (2) ongoing costs, which generally include management fees, distribution and/or service (12b-1) fees and other Fund expenses. This Example is intended to help you understand your ongoing costs (in dollars) of investing in a fund and to compare these costs with the ongoing costs of investing in other mutual funds.
The Example is based on an investment of $1,000 invested at the beginning of the period and held for the entire period (October 1, 2021 to March 31, 2022).
Actual Expenses
The first line of the accompanying table provides information about actual account values and actual expenses. You may use the information in this line, together with the amount you invested, to estimate the expenses that you paid over the period. Simply divide your account value by $1,000.00 (for example, an $8,600 account value divided by $1,000.00 = 8.6), then multiply the result by the number in the first line for a class/Fund under the heading entitled "Expenses Paid During Period" to estimate the expenses you paid on your account during this period. If any fund is a shareholder of any underlying mutual funds or exchange-traded funds (ETFs) (the Underlying Funds), such fund indirectly bears its proportional share of the expenses of the Underlying Funds in addition to the direct expenses incurred presented in the table. These fees and expenses are not included in the annualized expense ratio used to calculate the expense estimate in the table below.
Hypothetical Example for Comparison Purposes
The second line of the accompanying table provides information about hypothetical account values and hypothetical expenses based on the actual expense ratio and an assumed rate of return of 5% per year before expenses, which is not the actual return. The hypothetical account values and expenses may not be used to estimate the actual ending account balance or expenses you paid for the period. You may use this information to compare the ongoing costs of investing in the Fund and other funds. To do so, compare this 5% hypothetical example with the 5% hypothetical examples that appear in the shareholder reports of the other funds. If any fund is a shareholder of any Underlying Funds, such fund indirectly bears its proportional share of the expenses of the Underlying Funds in addition to the direct expenses as presented in the table. These fees and expenses are not included in the annualized expense ratio used to calculate the expense estimate in the table below.
Please note that the expenses shown in the table are meant to highlight your ongoing costs only and do not reflect any transaction costs. Therefore, the second line of the table is useful in comparing ongoing costs only, and will not help you determine the relative total costs of owning different funds. In addition, if these transactional costs were included, your costs would have been higher.
| | Annualized Expense Ratio-A,B | Beginning
Account Value
October 1, 2021 | Ending
Account Value
March 31, 2022 | Expenses Paid
During Period-October 1, 2021
to March 31, 2022-C,D |
| Fidelity Flex Freedom Blend Income Fund | - % | | | |
| Actual | | $1,000.00 | $967.30 | $- |
| Hypothetical-E | | $1,000.00 | $1,024.93 | $- |
| Fidelity Flex Freedom Blend 2005 Fund | - % | | | |
| Actual | | $1,000.00 | $967.20 | $- |
| Hypothetical-E | | $1,000.00 | $1,024.93 | $- |
| Fidelity Flex Freedom Blend 2010 Fund | - % | | | |
| Actual | | $1,000.00 | $968.20 | $- |
| Hypothetical-E | | $1,000.00 | $1,024.93 | $- |
| Fidelity Flex Freedom Blend 2015 Fund | - % | | | |
| Actual | | $1,000.00 | $968.20 | $- |
| Hypothetical-E | | $1,000.00 | $1,024.93 | $- |
| Fidelity Flex Freedom Blend 2020 Fund | - % | | | |
| Actual | | $1,000.00 | $969.70 | $- |
| Hypothetical-E | | $1,000.00 | $1,024.93 | $- |
| Fidelity Flex Freedom Blend 2025 Fund | - % | | | |
| Actual | | $1,000.00 | $971.30 | $- |
| Hypothetical-E | | $1,000.00 | $1,024.93 | $- |
| Fidelity Flex Freedom Blend 2030 Fund | - % | | | |
| Actual | | $1,000.00 | $972.10 | $- |
| Hypothetical-E | | $1,000.00 | $1,024.93 | $- |
| Fidelity Flex Freedom Blend 2035 Fund | - % | | | |
| Actual | | $1,000.00 | $977.90 | $- |
| Hypothetical-E | | $1,000.00 | $1,024.93 | $- |
| Fidelity Flex Freedom Blend 2040 Fund | - % | | | |
| Actual | | $1,000.00 | $983.00 | $- |
| Hypothetical-E | | $1,000.00 | $1,024.93 | $- |
| Fidelity Flex Freedom Blend 2045 Fund | - % | | | |
| Actual | | $1,000.00 | $982.70 | $- |
| Hypothetical-E | | $1,000.00 | $1,024.93 | $- |
| Fidelity Flex Freedom Blend 2050 Fund | - % | | | |
| Actual | | $1,000.00 | $982.40 | $- |
| Hypothetical-E | | $1,000.00 | $1,024.93 | $- |
| Fidelity Flex Freedom Blend 2055 Fund | - % | | | |
| Actual | | $1,000.00 | $983.00 | $- |
| Hypothetical-E | | $1,000.00 | $1,024.93 | $- |
| Fidelity Flex Freedom Blend 2060 Fund | - % | | | |
| Actual | | $1,000.00 | $982.20 | $- |
| Hypothetical-E | | $1,000.00 | $1,024.93 | $- |
| Fidelity Flex Freedom Blend 2065 Fund | - % | | | |
| Actual | | $1,000.00 | $982.80 | $- |
| Hypothetical-E | | $1,000.00 | $1,024.93 | $- |
A Annualized expense ratio reflects expenses net of applicable fee waivers.
B Amount represents less than .005%.
C Expenses are equal to the annualized expense ratio, multiplied by the average account value over the period, multiplied by 182/ 365 (to reflect the one-half year period). The fees and expenses of any Underlying Funds are not included in each annualized expense ratio.
D Amount represents less than $.005.
E 5% return per year before expenses
Distributions (Unaudited)
The dividend and capital gains distributions for the fund(s) are available on Fidelity.com or Institutional.Fidelity.com.
The funds hereby designate as capital gain dividend the amounts noted below for the taxable year ended March 31, 2022, or, if subsequently determined to be different, the net capital gain of such year.
| Fidelity Flex Freedom Blend Income Fund | $3,095 |
| Fidelity Flex Freedom Blend 2005 Fund | $3,584 |
| Fidelity Flex Freedom Blend 2010 Fund | $4,355 |
| Fidelity Flex Freedom Blend 2015 Fund | $4,949 |
| Fidelity Flex Freedom Blend 2020 Fund | $5,938 |
| Fidelity Flex Freedom Blend 2025 Fund | $7,731 |
| Fidelity Flex Freedom Blend 2030 Fund | $13,031 |
| Fidelity Flex Freedom Blend 2035 Fund | $25,810 |
| Fidelity Flex Freedom Blend 2040 Fund | $18,331 |
| Fidelity Flex Freedom Blend 2045 Fund | $24,928 |
| Fidelity Flex Freedom Blend 2050 Fund | $18,761 |
| Fidelity Flex Freedom Blend 2055 Fund | $10,865 |
| Fidelity Flex Freedom Blend 2060 Fund | $10,533 |
| Fidelity Flex Freedom Blend 2065 Fund | $9,819 |
A percentage of the dividends distributed during the fiscal year for the following funds were derived from interest on U.S. Government securities which is generally exempt from state income tax:
| Fidelity Flex Freedom Blend Income Fund | 28.84% |
| Fidelity Flex Freedom Blend 2005 Fund | 21.15% |
| Fidelity Flex Freedom Blend 2010 Fund | 16.21% |
| Fidelity Flex Freedom Blend 2015 Fund | 12.68% |
| Fidelity Flex Freedom Blend 2020 Fund | 10.66% |
| Fidelity Flex Freedom Blend 2025 Fund | 8.43% |
| Fidelity Flex Freedom Blend 2030 Fund | 7.93% |
| Fidelity Flex Freedom Blend 2035 Fund | 2.62% |
| Fidelity Flex Freedom Blend 2040 Fund | 2.09% |
| Fidelity Flex Freedom Blend 2045 Fund | 1.94% |
| Fidelity Flex Freedom Blend 2050 Fund | 2.26% |
| Fidelity Flex Freedom Blend 2055 Fund | 2.26% |
| Fidelity Flex Freedom Blend 2060 Fund | 2.26% |
| Fidelity Flex Freedom Blend 2065 Fund | 2.25% |
|
A percentage of the dividends distributed during the fiscal year for the following funds qualify for the dividends–received deduction for corporate shareholders:
| Fidelity Flex Freedom Blend Income Fund | |
| April 2021 | 0% |
| May 2021 | 2% |
| June 2021 | 3% |
| July 2021 | 3% |
| August 2021 | 3% |
| September 2021 | 3% |
| October 2021 | 3% |
| November 2021 | 3% |
| December 2021 | 3% |
| February 2022 | 1% |
| March 2022 | - |
| Fidelity Flex Freedom Blend 2005 Fund | |
| May 2021 | 1% |
| December 2021 | 3% |
| Fidelity Flex Freedom Blend 2010 Fund | |
| May 2021 | 2% |
| December 2021 | 5% |
| Fidelity Flex Freedom Blend 2015 Fund | |
| May 2021 | 3% |
| December 2021 | 6% |
| Fidelity Flex Freedom Blend 2020 Fund | |
| May 2021 | 5% |
| December 2021 | 8% |
| Fidelity Flex Freedom Blend 2025 Fund | |
| May 2021 | 8% |
| December 2021 | 9% |
| Fidelity Flex Freedom Blend 2030 Fund | |
| May 2021 | 10% |
| December 2021 | 11% |
| Fidelity Flex Freedom Blend 2035 Fund | |
| May 2021 | 9% |
| December 2021 | 13% |
| Fidelity Flex Freedom Blend 2040 Fund | |
| May 2021 | 15% |
| December 2021 | 13% |
| Fidelity Flex Freedom Blend 2045 Fund | |
| May 2021 | 17% |
| December 2021 | 12% |
| Fidelity Flex Freedom Blend 2050 Fund | |
| May 2021 | 12% |
| December 2021 | 14% |
| Fidelity Flex Freedom Blend 2055 Fund | |
| May 2021 | 27% |
| December 2021 | 12% |
| Fidelity Flex Freedom Blend 2060 Fund | |
| May 2021 | 18% |
| December 2021 | 12% |
| Fidelity Flex Freedom Blend 2065 Fund | |
| May 2021 | 18% |
| December 2021 | 12% |
|
A percentage of the dividends distributed during the fiscal year for the following funds may be taken into account as a dividend for purposes of the maximum rate under section 1(h)(11) of the Internal Revenue Code.
| Fidelity Flex Freedom Blend Income Fund | |
| April 2021 | 0% |
| May 2021 | 7% |
| June 2021 | 11% |
| July 2021 | 11% |
| August 2021 | 11% |
| September 2021 | 11% |
| October 2021 | 11% |
| November 2021 | 11% |
| December 2021 | 11% |
| February 2022 | 0% |
| March 2022 | - |
| Fidelity Flex Freedom Blend 2005 Fund | |
| May 2021 | 2% |
| December 2021 | 11% |
| Fidelity Flex Freedom Blend 2010 Fund | |
| May 2021 | 3% |
| December 2021 | 14% |
| Fidelity Flex Freedom Blend 2015 Fund | |
| May 2021 | 3% |
| December 2021 | 17% |
| Fidelity Flex Freedom Blend 2020 Fund | |
| May 2021 | 6% |
| December 2021 | 20% |
| Fidelity Flex Freedom Blend 2025 Fund | |
| May 2021 | 9% |
| December 2021 | 22% |
| Fidelity Flex Freedom Blend 2030 Fund | |
| May 2021 | 10% |
| December 2021 | 27% |
| Fidelity Flex Freedom Blend 2035 Fund | |
| May 2021 | 10% |
| December 2021 | 32% |
| Fidelity Flex Freedom Blend 2040 Fund | |
| May 2021 | 17% |
| December 2021 | 29% |
| Fidelity Flex Freedom Blend 2045 Fund | |
| May 2021 | 19% |
| December 2021 | 27% |
| Fidelity Flex Freedom Blend 2050 Fund | |
| May 2021 | 14% |
| December 2021 | 33% |
| Fidelity Flex Freedom Blend 2055 Fund | |
| May 2021 | 29% |
| December 2021 | 27% |
| Fidelity Flex Freedom Blend 2060 Fund | |
| May 2021 | 19% |
| December 2021 | 27% |
| Fidelity Flex Freedom Blend 2065 Fund | |
| May 2021 | 19% |
| December 2021 | 27% |
|
A percentage of the dividends distributed during the fiscal year for the following funds qualify as a section 199A dividend:
| Fidelity Flex Freedom Blend Income Fund | |
| April 2021 | 0% |
| May 2021 | 1% |
| June 2021 | 1% |
| July 2021 | 1% |
| August 2021 | 1% |
| September 2021 | 1% |
| October 2021 | 1% |
| November 2021 | 1% |
| December 2021 | 1% |
| February 2022 | 1% |
| March 2022 | - |
| Fidelity Flex Freedom Blend 2005 Fund | |
| May 2021 | 1% |
| December 2021 | 1% |
| Fidelity Flex Freedom Blend 2010 Fund | |
| May 2021 | 1% |
| December 2021 | 1% |
| Fidelity Flex Freedom Blend 2015 Fund | |
| May 2021 | 1% |
| December 2021 | 1% |
| Fidelity Flex Freedom Blend 2020 Fund | |
| May 2021 | 1% |
| December 2021 | 1% |
| Fidelity Flex Freedom Blend 2025 Fund | |
| May 2021 | 1% |
| December 2021 | 1% |
| Fidelity Flex Freedom Blend 2030 Fund | |
| May 2021 | 1% |
| December 2021 | 1% |
| Fidelity Flex Freedom Blend 2035 Fund | |
| May 2021 | 1% |
| December 2021 | 1% |
| Fidelity Flex Freedom Blend 2040 Fund | |
| May 2021 | 1% |
| December 2021 | 1% |
| Fidelity Flex Freedom Blend 2045 Fund | |
| May 2021 | 1% |
| December 2021 | 1% |
| Fidelity Flex Freedom Blend 2050 Fund | |
| May 2021 | 1% |
| December 2021 | 1% |
| Fidelity Flex Freedom Blend 2055 Fund | |
| May 2021 | 1% |
| December 2021 | 1% |
| Fidelity Flex Freedom Blend 2060 Fund | |
| May 2021 | 1% |
| December 2021 | 1% |
| Fidelity Flex Freedom Blend 2065 Fund | |
| May 2021 | 1% |
| December 2021 | 1% |
|
The funds will notify shareholders in January 2023 of amounts for use in preparing 2022 income tax returns.
Liquidity Risk Management Program
The Securities and Exchange Commission adopted Rule 22e-4 under the Investment Company Act of 1940 (the Liquidity Rule) to promote effective liquidity risk management throughout the open-end investment company industry, thereby reducing the risk that funds will be unable to meet their redemption obligations and mitigating dilution of the interests of fund shareholders.
The Funds have adopted and implemented a liquidity risk management program pursuant to the Liquidity Rule (the Program) effective December 1, 2018. The Program is reasonably designed to assess and manage each Fund’s liquidity risk and to comply with the requirements of the Liquidity Rule. Each Fund’s Board of Trustees (the Board) has designated each Fund’s investment adviser as administrator of the Program. The Fidelity advisers have established a Liquidity Risk Management Committee (the LRM Committee) to manage the Program for each of the Fidelity Funds. The LRM Committee monitors the adequacy and effectiveness of implementation of the Program and on a periodic basis assesses each Fund’s liquidity risk based on a variety of factors including (1) the Fund’s investment strategy, (2) portfolio liquidity and cash flow projections during normal and reasonably foreseeable stressed conditions, (3) shareholder redemptions, (4) borrowings and other funding sources and (5) in the case of exchange-traded funds, certain additional factors including the effect of the Fund’s prices and spreads, market participants, and basket compositions on the overall liquidity of the Fund’s portfolio, as applicable.
In accordance with the Program, each of the Fund’s portfolio investments is classified into one of four liquidity categories described below based on a determination of a reasonable expectation for how long it would take to convert the investment to cash (or sell or dispose of the investment) without significantly changing its market value.
- Highly liquid investments – cash or convertible to cash within three business days or less
- Moderately liquid investments – convertible to cash in three to seven calendar days
- Less liquid investments – can be sold or disposed of, but not settled, within seven calendar days
- Illiquid investments – cannot be sold or disposed of within seven calendar days
Liquidity classification determinations take into account a variety of factors including various market, trading and investment-specific considerations, as well as market depth, and generally utilize analysis from a third-party liquidity metrics service.
The Liquidity Rule places a 15% limit on a fund’s illiquid investments and requires funds that do not primarily hold assets that are highly liquid investments to determine and maintain a minimum percentage of the fund’s net assets to be invested in highly liquid investments (highly liquid investment minimum or HLIM). The Program includes provisions reasonably designed to comply with the 15% limit on illiquid investments and for determining, periodically reviewing and complying with the HLIM requirement as applicable.
At a recent meeting of the Fund’s Board of Trustees, the LRM Committee provided a written report to the Board pertaining to the operation, adequacy, and effectiveness of implementation of the Program for the annual period from December 1, 2020 through November 30, 2021. The report concluded that the Program has been implemented and is operating effectively and is reasonably designed to assess and manage the Fund’s liquidity risk.
XFC-ANN-0522
1.9884226.104
Item 2.
Code of Ethics
As of the end of the period, March 31, 2022, Fidelity Aberdeen Street Trust (the trust) has adopted a code of ethics, as defined in Item 2 of Form N-CSR, that applies to its President and Treasurer and its Chief Financial Officer. A copy of the code of ethics is filed as an exhibit to this Form N-CSR.
Item 3.
Audit Committee Financial Expert
The Board of Trustees of the trust has determined that Elizabeth S. Acton is an audit committee financial expert, as defined in Item 3 of Form N-CSR. Ms. Acton is independent for purposes of Item 3 of Form N-CSR.
Item 4.
Principal Accountant Fees and Services
Fees and Services
The following table presents fees billed by Deloitte & Touche LLP, the member firms of Deloitte Touche Tohmatsu, and their respective affiliates (collectively, “Deloitte Entities”) in each of the last two fiscal years for services rendered to Fidelity Advisor Freedom Income Fund, Fidelity Advisor Freedom 2005 Fund, Fidelity Advisor Freedom 2010 Fund, Fidelity Advisor Freedom 2015 Fund, Fidelity Advisor Freedom 2020 Fund, Fidelity Advisor Freedom 2025 Fund, Fidelity Advisor Freedom 2030 Fund, Fidelity Advisor Freedom 2035 Fund, Fidelity Advisor Freedom 2040 Fund, Fidelity Advisor Freedom 2045 Fund, Fidelity Advisor Freedom 2050 Fund, Fidelity Advisor Freedom 2055 Fund, Fidelity Advisor Freedom 2060 Fund, Fidelity Advisor Freedom 2065 Fund, Fidelity Freedom Index Income Fund, Fidelity Freedom Index 2005 Fund, Fidelity Freedom Index 2010 Fund, Fidelity Freedom Index 2015 Fund, Fidelity Freedom Index 2020 Fund, Fidelity Freedom Index 2025 Fund, Fidelity Freedom Index 2030 Fund, Fidelity Freedom Index 2035 Fund, Fidelity Freedom Index 2040 Fund, Fidelity Freedom Index 2045 Fund, Fidelity Freedom Index 2050 Fund, Fidelity Freedom Index 2055 Fund, Fidelity Freedom Index 2060 Fund and Fidelity Freedom Index 2065 Fund (the “Funds”):
Services Billed by Deloitte Entities
March 31, 2022 FeesA
| | | | |
| Audit Fees | Audit-Related Fees | Tax Fees | All Other Fees |
Fidelity Advisor Freedom Income Fund | $23,000 | $- | $7,600 | $600 |
Fidelity Advisor Freedom 2005 Fund | $21,800 | $- | $7,600 | $600 |
Fidelity Advisor Freedom 2010 Fund | $21,800 | $- | $7,600 | $600 |
Fidelity Advisor Freedom 2015 Fund | $21,800 | $- | $7,600 | $600 |
Fidelity Advisor Freedom 2020 Fund | $21,800 | $- | $7,600 | $600 |
Fidelity Advisor Freedom 2025 Fund | $21,800 | $- | $7,600 | $600 |
Fidelity Advisor Freedom 2030 Fund | $21,800 | $- | $7,600 | $600 |
Fidelity Advisor Freedom 2035 Fund | $21,800 | $- | $7,600 | $600 |
Fidelity Advisor Freedom 2040 Fund | $21,800 | $- | $7,600 | $600 |
Fidelity Advisor Freedom 2045 Fund | $23,000 | $- | $7,600 | $600 |
Fidelity Advisor Freedom 2050 Fund | $21,800 | $- | $7,600 | $600 |
Fidelity Advisor Freedom 2055 Fund | $23,000 | $- | $7,600 | $600 |
Fidelity Advisor Freedom 2060 Fund | $23,000 | $- | $7,600 | $600 |
Fidelity Advisor Freedom 2065 Fund | $21,500 | $- | $7,900 | $600 |
Fidelity Freedom Index Income Fund | $18,600 | $- | $7,100 | $500 |
Fidelity Freedom Index 2005 Fund | $18,600 | $- | $7,100 | $500 |
Fidelity Freedom Index 2010 Fund | $18,600 | $- | $7,100 | $500 |
Fidelity Freedom Index 2015 Fund | $18,600 | $- | $7,100 | $500 |
Fidelity Freedom Index 2020 Fund | $18,600 | $- | $7,100 | $500 |
Fidelity Freedom Index 2025 Fund | $18,600 | $- | $7,100 | $500 |
Fidelity Freedom Index 2030 Fund | $18,600 | $- | $7,100 | $500 |
Fidelity Freedom Index 2035 Fund | $18,600 | $- | $7,100 | $500 |
Fidelity Freedom Index 2040 Fund | $18,600 | $- | $7,100 | $500 |
Fidelity Freedom Index 2045 Fund | $18,600 | $- | $7,100 | $500 |
Fidelity Freedom Index 2050 Fund | $18,600 | $- | $7,100 | $500 |
Fidelity Freedom Index 2055 Fund | $18,700 | $- | $7,100 | $500 |
Fidelity Freedom Index 2060 Fund | $18,700 | $- | $7,100 | $500 |
Fidelity Freedom Index 2065 Fund | $18,800 | $- | $7,900 | $500 |
| | | | |
| Audit Fees | Audit-Related Fees | Tax Fees | All Other Fees |
Fidelity Advisor Freedom Income Fund | $22,400 | $- | $7,100 | $600 |
Fidelity Advisor Freedom 2005 Fund | $21,300 | $- | $7,400 | $600 |
Fidelity Advisor Freedom 2010 Fund | $21,300 | $- | $7,100 | $600 |
Fidelity Advisor Freedom 2015 Fund | $21,300 | $- | $7,100 | $600 |
Fidelity Advisor Freedom 2020 Fund | $21,300 | $- | $7,100 | $600 |
Fidelity Advisor Freedom 2025 Fund | $21,300 | $- | $7,100 | $600 |
Fidelity Advisor Freedom 2030 Fund | $21,300 | $- | $7,100 | $600 |
Fidelity Advisor Freedom 2035 Fund | $21,300 | $- | $7,100 | $600 |
Fidelity Advisor Freedom 2040 Fund | $21,300 | $- | $7,400 | $600 |
Fidelity Advisor Freedom 2045 Fund | $22,400 | $- | $7,100 | $600 |
Fidelity Advisor Freedom 2050 Fund | $21,300 | $- | $7,400 | $600 |
Fidelity Advisor Freedom 2055 Fund | $22,400 | $- | $7,100 | $600 |
Fidelity Advisor Freedom 2060 Fund | $22,400 | $- | $7,400 | $600 |
Fidelity Advisor Freedom 2065 Fund | $20,900 | $- | $7,400 | $500 |
Fidelity Freedom Index Income Fund | $19,400 | $- | $6,900 | $500 |
Fidelity Freedom Index 2005 Fund | $19,400 | $- | $6,900 | $500 |
Fidelity Freedom Index 2010 Fund | $19,400 | $- | $6,900 | $500 |
Fidelity Freedom Index 2015 Fund | $19,400 | $- | $6,900 | $500 |
Fidelity Freedom Index 2020 Fund | $19,400 | $- | $6,900 | $500 |
Fidelity Freedom Index 2025 Fund | $19,400 | $- | $6,900 | $500 |
Fidelity Freedom Index 2030 Fund | $19,400 | $- | $6,900 | $500 |
Fidelity Freedom Index 2035 Fund | $19,400 | $- | $6,900 | $500 |
Fidelity Freedom Index 2040 Fund | $19,400 | $- | $6,900 | $500 |
Fidelity Freedom Index 2045 Fund | $19,400 | $- | $6,900 | $500 |
Fidelity Freedom Index 2050 Fund | $19,400 | $- | $6,900 | $500 |
Fidelity Freedom Index 2055 Fund | $19,500 | $- | $6,900 | $500 |
Fidelity Freedom Index 2060 Fund | $19,500 | $- | $6,900 | $500 |
Fidelity Freedom Index 2065 Fund | $18,900 | $- | $7,400 | $500 |
A Amounts may reflect rounding.
The following table presents fees billed by PricewaterhouseCoopers LLP (“PwC”) in each of the last two fiscal years for services rendered to Fidelity Flex Freedom Blend Income Fund, Fidelity Flex Freedom Blend 2005 Fund, Fidelity Flex Freedom Blend 2010 Fund, Fidelity Flex Freedom Blend 2015 Fund, Fidelity Flex Freedom Blend 2020 Fund, Fidelity Flex Freedom Blend 2025 Fund, Fidelity Flex Freedom Blend 2030 Fund, Fidelity Flex Freedom Blend 2035 Fund, Fidelity Flex Freedom Blend 2040 Fund, Fidelity Flex Freedom Blend 2045 Fund, Fidelity Flex Freedom Blend 2050 Fund, Fidelity Flex Freedom Blend 2055 Fund, Fidelity Flex Freedom Blend 2060 Fund, Fidelity Flex Freedom Blend 2065 Fund, Fidelity Freedom Income Fund, Fidelity Freedom 2005 Fund, Fidelity Freedom 2010 Fund, Fidelity Freedom 2015 Fund, Fidelity Freedom 2020 Fund, Fidelity Freedom 2025 Fund, Fidelity Freedom 2030 Fund, Fidelity Freedom 2035 Fund, Fidelity Freedom 2040 Fund, Fidelity Freedom 2045 Fund, Fidelity Freedom 2050 Fund, Fidelity Freedom 2055 Fund, Fidelity Freedom 2060 Fund, Fidelity Freedom 2065 Fund, Fidelity Freedom Blend Income Fund, Fidelity Freedom Blend 2005 Fund, Fidelity Freedom Blend 2010 Fund, Fidelity Freedom Blend 2015 Fund, Fidelity Freedom Blend 2020 Fund, Fidelity Freedom Blend 2025 Fund, Fidelity Freedom Blend 2030 Fund, Fidelity Freedom Blend 2035 Fund, Fidelity Freedom Blend 2040 Fund, Fidelity Freedom Blend 2045 Fund, Fidelity Freedom Blend 2050 Fund, Fidelity Freedom Blend 2055 Fund, Fidelity Freedom Blend 2060 Fund and Fidelity Freedom Blend 2065 Fund (the “Funds”):
Services Billed by PwC
March 31, 2022 FeesA
| | | | |
| Audit Fees | Audit-Related Fees | Tax Fees | All Other Fees |
Fidelity Flex Freedom Blend Income Fund | $14,300 | $1,500 | $5,500 | $600 |
Fidelity Flex Freedom Blend 2005 Fund | $16,500 | $1,600 | $5,500 | $700 |
Fidelity Flex Freedom Blend 2010 Fund | $16,500 | $1,600 | $5,500 | $700 |
Fidelity Flex Freedom Blend 2015 Fund | $16,500 | $1,600 | $5,500 | $700 |
Fidelity Flex Freedom Blend 2020 Fund | $16,500 | $1,600 | $5,500 | $700 |
Fidelity Flex Freedom Blend 2025 Fund | $16,500 | $1,600 | $5,500 | $700 |
Fidelity Flex Freedom Blend 2030 Fund | $16,500 | $1,600 | $5,500 | $700 |
Fidelity Flex Freedom Blend 2035 Fund | $16,500 | $1,600 | $5,500 | $700 |
Fidelity Flex Freedom Blend 2040 Fund | $16,500 | $1,600 | $5,500 | $700 |
Fidelity Flex Freedom Blend 2045 Fund | $16,500 | $1,600 | $5,500 | $700 |
Fidelity Flex Freedom Blend 2050 Fund | $16,500 | $1,600 | $5,500 | $700 |
Fidelity Flex Freedom Blend 2055 Fund | $16,500 | $1,600 | $5,500 | $700 |
Fidelity Flex Freedom Blend 2060 Fund | $16,500 | $1,600 | $5,500 | $700 |
Fidelity Flex Freedom Blend 2065 Fund | $16,500 | $1,600 | $5,500 | $700 |
Fidelity Freedom Income Fund | $18,600 | $1,800 | $5,200 | $800 |
Fidelity Freedom 2005 Fund | $18,600 | $1,800 | $5,200 | $800 |
Fidelity Freedom 2010 Fund | $18,600 | $1,800 | $5,200 | $800 |
Fidelity Freedom 2015 Fund | $18,600 | $1,800 | $5,200 | $800 |
Fidelity Freedom 2020 Fund | $18,600 | $1,800 | $5,200 | $800 |
Fidelity Freedom 2025 Fund | $18,600 | $1,800 | $5,200 | $800 |
Fidelity Freedom 2030 Fund | $18,600 | $1,800 | $5,200 | $800 |
Fidelity Freedom 2035 Fund | $18,600 | $1,800 | $5,200 | $800 |
Fidelity Freedom 2040 Fund | $18,600 | $1,800 | $5,200 | $800 |
Fidelity Freedom 2045 Fund | $18,600 | $1,800 | $5,200 | $800 |
Fidelity Freedom 2050 Fund | $18,600 | $1,800 | $5,200 | $800 |
Fidelity Freedom 2055 Fund | $18,600 | $1,800 | $5,200 | $800 |
Fidelity Freedom 2060 Fund | $18,600 | $1,800 | $5,200 | $800 |
Fidelity Freedom 2065 Fund | $18,600 | $1,800 | $7,000 | $800 |
Fidelity Freedom Blend Income Fund | $22,200 | $1,800 | $5,800 | $800 |
Fidelity Freedom Blend 2005 Fund | $22,200 | $1,800 | $5,800 | $800 |
Fidelity Freedom Blend 2010 Fund | $22,200 | $1,800 | $5,800 | $800 |
Fidelity Freedom Blend 2015 Fund | $22,200 | $1,800 | $7,600 | $800 |
Fidelity Freedom Blend 2020 Fund | $22,200 | $1,800 | $7,600 | $800 |
Fidelity Freedom Blend 2025 Fund | $22,200 | $1,800 | $7,600 | $800 |
Fidelity Freedom Blend 2030 Fund | $22,200 | $1,800 | $7,600 | $800 |
Fidelity Freedom Blend 2035 Fund | $22,200 | $1,800 | $7,600 | $800 |
Fidelity Freedom Blend 2040 Fund | $22,200 | $1,800 | $7,600 | $800 |
Fidelity Freedom Blend 2045 Fund | $22,200 | $1,800 | $7,600 | $800 |
Fidelity Freedom Blend 2050 Fund | $22,200 | $1,800 | $7,600 | $800 |
Fidelity Freedom Blend 2055 Fund | $22,200 | $1,800 | $7,600 | $800 |
Fidelity Freedom Blend 2060 Fund | $22,200 | $1,800 | $7,600 | $800 |
Fidelity Freedom Blend 2065 Fund | $22,200 | $1,800 | $7,500 | $800 |
| | | | |
| Audit Fees | Audit-Related Fees | Tax Fees | All Other Fees |
Fidelity Flex Freedom Blend Income Fund | $14,000 | $1,400 | $5,400 | $800 |
Fidelity Flex Freedom Blend 2005 Fund | $16,200 | $1,600 | $5,400 | $800 |
Fidelity Flex Freedom Blend 2010 Fund | $16,200 | $1,600 | $5,400 | $800 |
Fidelity Flex Freedom Blend 2015 Fund | $16,200 | $1,600 | $5,400 | $800 |
Fidelity Flex Freedom Blend 2020 Fund | $16,200 | $1,600 | $5,400 | $800 |
Fidelity Flex Freedom Blend 2025 Fund | $16,200 | $1,600 | $5,400 | $800 |
Fidelity Flex Freedom Blend 2030 Fund | $16,200 | $1,600 | $5,400 | $800 |
Fidelity Flex Freedom Blend 2035 Fund | $16,200 | $1,600 | $5,400 | $800 |
Fidelity Flex Freedom Blend 2040 Fund | $16,200 | $1,600 | $5,400 | $800 |
Fidelity Flex Freedom Blend 2045 Fund | $16,200 | $1,600 | $5,400 | $800 |
Fidelity Flex Freedom Blend 2050 Fund | $16,200 | $1,600 | $5,400 | $800 |
Fidelity Flex Freedom Blend 2055 Fund | $16,200 | $1,600 | $5,400 | $800 |
Fidelity Flex Freedom Blend 2060 Fund | $16,200 | $1,600 | $5,400 | $800 |
Fidelity Flex Freedom Blend 2065 Fund | $16,200 | $1,500 | $5,400 | $800 |
Fidelity Freedom Income Fund | $18,100 | $1,800 | $5,100 | $900 |
Fidelity Freedom 2005 Fund | $18,100 | $1,800 | $5,100 | $900 |
Fidelity Freedom 2010 Fund | $18,100 | $1,800 | $5,100 | $900 |
Fidelity Freedom 2015 Fund | $18,100 | $1,800 | $5,100 | $900 |
Fidelity Freedom 2020 Fund | $18,100 | $1,800 | $5,100 | $900 |
Fidelity Freedom 2025 Fund | $18,100 | $1,800 | $5,100 | $900 |
Fidelity Freedom 2030 Fund | $18,100 | $1,800 | $5,100 | $900 |
Fidelity Freedom 2035 Fund | $18,100 | $1,800 | $5,100 | $900 |
Fidelity Freedom 2040 Fund | $18,100 | $1,800 | $5,100 | $900 |
Fidelity Freedom 2045 Fund | $18,100 | $1,800 | $5,100 | $900 |
Fidelity Freedom 2050 Fund | $18,100 | $1,800 | $5,100 | $900 |
Fidelity Freedom 2055 Fund | $18,100 | $1,800 | $5,100 | $900 |
Fidelity Freedom 2060 Fund | $18,100 | $1,800 | $5,100 | $900 |
Fidelity Freedom 2065 Fund | $19,800 | $1,600 | $5,100 | $800 |
Fidelity Freedom Blend Income Fund | $19,000 | $1,800 | $5,700 | $900 |
Fidelity Freedom Blend 2005 Fund | $19,000 | $1,800 | $5,700 | $900 |
Fidelity Freedom Blend 2010 Fund | $19,000 | $1,800 | $5,700 | $900 |
Fidelity Freedom Blend 2015 Fund | $20,800 | $1,800 | $7,400 | $900 |
Fidelity Freedom Blend 2020 Fund | $20,800 | $1,800 | $7,400 | $900 |
Fidelity Freedom Blend 2025 Fund | $20,800 | $1,800 | $7,400 | $900 |
Fidelity Freedom Blend 2030 Fund | $20,800 | $1,800 | $7,400 | $900 |
Fidelity Freedom Blend 2035 Fund | $20,800 | $1,800 | $7,400 | $900 |
Fidelity Freedom Blend 2040 Fund | $20,800 | $1,800 | $5,700 | $900 |
Fidelity Freedom Blend 2045 Fund | $20,800 | $1,800 | $7,400 | $900 |
Fidelity Freedom Blend 2050 Fund | $20,800 | $1,800 | $5,700 | $900 |
Fidelity Freedom Blend 2055 Fund | $20,800 | $1,800 | $7,400 | $900 |
Fidelity Freedom Blend 2060 Fund | $20,800 | $1,800 | $7,400 | $900 |
Fidelity Freedom Blend 2065 Fund | $20,800 | $1,600 | $7,400 | $800 |
A Amounts may reflect rounding.
The following table(s) present(s) fees billed by Deloitte Entities and PwC that were required to be approved by the Audit Committee for services that relate directly to the operations and financial reporting of the Fund(s) and that are rendered on behalf of Fidelity Management & Research Company LLC ("FMR") and entities controlling, controlled by, or under common control with FMR (not including any sub-adviser whose role is primarily portfolio management and is subcontracted with or overseen by another investment adviser) that provide ongoing services to the Fund(s) (“Fund Service Providers”):
Services Billed by Deloitte Entities
| | |
| March 31, 2022A | March 31, 2021A |
Audit-Related Fees | $- | $- |
Tax Fees | $- | $- |
All Other Fees | $- | $- |
A Amounts may reflect rounding.
Services Billed by PwC
| | |
| March 31, 2022A | March 31, 2021A |
Audit-Related Fees | $7,914,600 | $9,015,700 |
Tax Fees | $353,200 | $14,300 |
All Other Fees | $- | $- |
A Amounts may reflect rounding.
“Audit-Related Fees” represent fees billed for assurance and related services that are reasonably related to the performance of the fund audit or the review of the fund's financial statements and that are not reported under Audit Fees.
“Tax Fees” represent fees billed for tax compliance, tax advice or tax planning that relate directly to the operations and financial reporting of the fund.
“All Other Fees” represent fees billed for services provided to the fund or Fund Service Provider, a significant portion of which are assurance related, that relate directly to the operations and financial reporting of the fund, excluding those services that are reported under Audit Fees, Audit-Related Fees or Tax Fees.
Assurance services must be performed by an independent public accountant.
* * *
The aggregate non-audit fees billed by Deloitte Entities and PwC for services rendered to the Fund(s), FMR (not including any sub-adviser whose role is primarily portfolio management and is subcontracted with or overseen by another investment adviser), and any Fund Service Provider for each of the last two fiscal years of the Fund(s) are as follows:
| | |
Billed By | March 31, 2022A | March 31, 2021A |
Deloitte Entities | $679,900 | $734,900 |
PwC | $13,774,500 | $14,501,100 |
|
|
|
A Amounts may reflect rounding.
The trust's Audit Committee has considered non-audit services that were not pre-approved that were provided by Deloitte Entities and PwC to Fund Service Providers to be compatible with maintaining the independence of Deloitte Entities and PwC in its(their) audit of the Fund(s), taking into account representations from Deloitte Entities and PwC, in accordance with Public Company Accounting Oversight Board rules, regarding its independence from the Fund(s) and its(their) related entities and FMR’s review of the appropriateness and permissibility under applicable law of such non-audit services prior to their provision to the Fund(s) Service Providers.
Audit Committee Pre-Approval Policies and Procedures
The trust’s Audit Committee must pre-approve all audit and non-audit services provided by a fund’s independent registered public accounting firm relating to the operations or financial reporting of the fund. Prior to the commencement of any audit or non-audit services to a fund, the Audit Committee reviews the services to determine whether they are appropriate and permissible under applicable law.
The Audit Committee has adopted policies and procedures to, among other purposes, provide a framework for the Committee’s consideration of non-audit services by the audit firms that audit the Fidelity funds. The policies and procedures require that any non-audit service provided by a fund audit firm to a Fidelity fund and any non-audit service provided by a fund auditor to a Fund Service Provider that relates directly to the operations and financial reporting of a Fidelity fund (“Covered Service”) are subject to approval by the Audit Committee before such service is provided.
All Covered Services must be approved in advance of provision of the service either: (i) by formal resolution of the Audit Committee, or (ii) by oral or written approval of the service by the Chair of the Audit Committee (or if the Chair is unavailable, such other member of the Audit Committee as may be designated by the Chair to act in the Chair’s absence). The approval contemplated by (ii) above is permitted where the Treasurer determines that action on such an engagement is necessary before the next meeting of the Audit Committee.
Non-audit services provided by a fund audit firm to a Fund Service Provider that do not relate directly to the operations and financial reporting of a Fidelity fund are reported to the Audit Committee periodically.
Non-Audit Services Approved Pursuant to Rule 2-01(c)(7)(i)(C) and (ii) of Regulation S-X (“De Minimis Exception”)
There were no non-audit services approved or required to be approved by the Audit Committee pursuant to the De Minimis Exception during the Fund’s(s’) last two fiscal years relating to services provided to (i) the Fund(s) or (ii) any Fund Service Provider that relate directly to the operations and financial reporting of the Fund(s).
Item 5.
Audit Committee of Listed Registrants
Not applicable.
Item 6.
Investments
(a)
Not applicable.
(b)
Not applicable.
Item 7.
Disclosure of Proxy Voting Policies and Procedures for Closed-End Management Investment Companies
Not applicable.
Item 8.
Portfolio Managers of Closed-End Management Investment Companies
Not applicable.
Item 9.
Purchase of Equity Securities by Closed-End Management Investment Company and Affiliated Purchasers
Not applicable.
Item 10.
Submission of Matters to a Vote of Security Holders
There were no material changes to the procedures by which shareholders may recommend nominees to the trust’s Board of Trustees.
Item 11.
Controls and Procedures
(a)(i) The President and Treasurer and the Chief Financial Officer have concluded that the trust’s disclosure controls and procedures (as defined in Rule 30a-3(c) under the Investment Company Act) provide reasonable assurances that material information relating to the trust is made known to them by the appropriate persons, based on their evaluation of these controls and procedures as of a date within 90 days of the filing date of this report.
(a)(ii) There was no change in the trust’s internal control over financial reporting (as defined in Rule 30a-3(d) under the Investment Company Act) that occurred during the period covered by this report that has materially affected, or is reasonably likely to materially affect, the trust’s internal control over financial reporting.
Item 12.
Disclosure of Securities Lending Activities for Closed-End Management
Investment Companies
Not applicable.
Item 13.
Exhibits
SIGNATURES
Pursuant to the requirements of the Securities Exchange Act of 1934 and the Investment Company Act of 1940, the registrant has duly caused this report to be signed on its behalf by the undersigned, thereunto duly authorized.
Fidelity Aberdeen Street Trust
| |
By: | /s/Laura M. Del Prato |
| Laura M. Del Prato |
| President and Treasurer |
|
|
Date: | May 19, 2022 |
Pursuant to the requirements of the Securities Exchange Act of 1934 and the Investment Company Act of 1940, this report has been signed below by the following persons on behalf of the registrant and in the capacities and on the dates indicated.
| |
By: | /s/Laura M. Del Prato |
| Laura M. Del Prato |
| President and Treasurer |
|
|
Date: | May 19, 2022 |
| |
By: | /s/John J. Burke III |
| John J. Burke III |
| Chief Financial Officer |
|
|
Date: | May 19, 2022 |