                               UNITED STATES
                      SECURITIES AND EXCHANGE COMMISSION
                            Washington, D.C. 20549

                                  FORM N-CSR

                  CERTIFIED SHAREHOLDER REPORT OF REGISTERED
                       MANAGEMENT INVESTMENT COMPANIES

Investment Company Act file number    811-6441
                                  ---------------------------------------------

                    AMERICAN CENTURY INTERNATIONAL BOND FUNDS
- -------------------------------------------------------------------------------
               (Exact name of registrant as specified in charter)

 4500 MAIN STREET, KANSAS CITY, MISSOURI                        64111
- -------------------------------------------------------------------------------
      (Address of principal executive offices)                (Zip code)

DAVID C. TUCKER, ESQ., 4500 MAIN STREET, 9TH FLOOR, KANSAS CITY, MISSOURI 64111
- -------------------------------------------------------------------------------
                     (Name and address of agent for service)

Registrant's telephone number, including area code:       816-531-5575
                                                   ----------------------------

Date of fiscal year end:   DECEMBER 31, 2003
                        --------------------------------------------------------
Date of reporting period:  DECEMBER 31, 2003
                         -------------------------------------------------------


ITEM 1.  REPORTS TO STOCKHOLDERS.


DECEMBER 31, 2003

American Century
Annual Report

[graphic of market line chart]
[graphic of starfish]
[graphic of bridge over creek]

International Bond

[american century logo and text logo (reg.sm)]


Table of Contents

Our Message to You.......................................................   1

INTERNATIONAL BOND
Performance..............................................................   2
Portfolio Commentary.....................................................   3
   Portfolio at a Glance.................................................   3
   Bond Holdings by Country..............................................   4
Schedule of Investments..................................................   5

FINANCIAL STATEMENTS
Statement of Assets and Liabilities......................................   8
Statement of Operations..................................................   9
Statement of Changes in Net Assets.......................................  10
Notes to Financial Statements............................................  11
Financial Highlights.....................................................  15
Report of Independent Auditors...........................................  17

OTHER INFORMATION
Management...............................................................  18
Share Class Information..................................................  21
Additional Information...................................................  22
Index Definition.........................................................  23

The opinions expressed in the Portfolio Commentary reflect those of the
portfolio management team as of the date of the report, and do not necessarily
represent the opinions of American Century or any other person in the American
Century organization. Any such opinions are subject to change at any time based
upon market or other conditions and American Century disclaims any
responsibility to update such opinions. These opinions may not be relied upon as
investment advice and, because investment decisions made by American Century
funds are based on numerous factors, may not be relied upon as an indication of
trading intent on behalf of any American Century fund. Security examples are
used for representational purposes only and are not intended as recommendations
to purchase or sell securities. Performance information for comparative indices
and securities is provided to American Century by third party vendors. To the
best of American Century's knowledge, such information is accurate at the time
of printing.


Our Message to You

[photo of James E. Stowers III and James E. Stowers, Jr.]

                JAMES E. STOWERS III WITH JAMES E. STOWERS, JR.

We are pleased to provide you with the annual report for American Century
International Bond for the year ended December 31, 2003.

The report includes comparative performance figures, portfolio and market
commentary, summary tables, a full list of portfolio holdings, and financial
statements and highlights. We hope you find this information helpful in
monitoring your investment.

Many of you have called or written to express your concern about allegations of
wrongdoing by other mutual fund investment management firms. We share your
concern--fund companies must put investors first and do everything possible to
maintain investor trust. Through the Investment Company Institute, the mutual
fund trade association, American Century has advocated industry-wide proposals
that strengthen protections for fund investors. We believe that decisive action
is needed to show that we are committed, as an industry, to the interests of the
95 million investors we serve.

As information about alleged trading abuses in the mutual fund industry has come
to light, we have posted messages and commentary about these issues on
www.americancentury.com. Beyond what's currently in the headlines, American
Century has been a champion of many important investor and industry issues,
which are outlined in a document titled PUTTING INVESTORS FIRST. We invite you
to visit our Web site and read about how our values have influenced these
positions.

As always, we deeply appreciate your investment with American Century.

Sincerely,

      /s/James E. Stowers, Jr.
      James E. Stowers, Jr.
      FOUNDER AND CHAIRMAN

      /s/James E. Stowers III
      James E. Stowers III
      CO-CHAIRMAN OF THE BOARD


- ------
1


International Bond - Performance

TOTAL RETURNS AS OF DECEMBER 31, 2003
                                    --------------------------------
                                        AVERAGE ANNUAL RETURNS
- --------------------------------------------------------------------------------
                                                            SINCE     INCEPTION
                            1 YEAR   5 YEARS   10 YEARS   INCEPTION      DATE
- --------------------------------------------------------------------------------
INVESTOR CLASS              19.91%    5.23%      6.76%      7.21%        1/7/92
- --------------------------------------------------------------------------------
FUND BENCHMARK              21.97%    6.37%      7.98%      7.62%(1)      --
- --------------------------------------------------------------------------------
J.P. MORGAN GLOBAL TRADED
GOVERNMENT BOND INDEX       14.53%    5.66%      6.87%      7.11%(1)      --
- --------------------------------------------------------------------------------
Advisor Class               19.60%    4.97%       --        5.22%      10/27/98
- --------------------------------------------------------------------------------

(1) Since 12/31/91, the date nearest the Investor Class's inception for which
    data are available.


GROWTH OF $10,000 OVER 10 YEARS


$10,000 investment made December 31, 1993
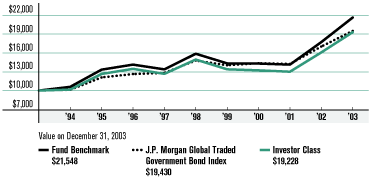
ONE-YEAR RETURNS OVER 10 YEARS
Periods ended December 31
- ---------------------------------------------------------------------------------------------------
1994 1995 1996 1997 1998 1999 2000 2001 2002 2003
- ---------------------------------------------------------------------------------------------------
Investor Class 1.52% 24.40% 6.38% -5.88% 17.87% -10.36% -1.20% -1.66% 23.53% 19.91%
- ---------------------------------------------------------------------------------------------------
Fund Benchmark 5.92% 25.65% 5.98% -5.33% 18.49% -9.61% -0.23% -1.16% 25.26% 21.97%
- ---------------------------------------------------------------------------------------------------
J.P. Morgan Global
Traded Government
Bond Index 1.28% 19.31% 4.40% 1.40% 15.31% -5.08% 2.32% -0.80% 19.37% 14.53%
- ---------------------------------------------------------------------------------------------------
The charts on the performance page give historical return data for the fund.
Returns for the indices are provided for comparison. From the fund's inception
to December 31, 1997, the benchmark was the J.P. Morgan ECU-Weighted European
Index. Since January 1, 1998, the benchmark has been the J.P. Morgan Global
Traded Government Bond Index (excluding the U.S. and with Japan weighted at 15%).
The fund's total returns include operating expenses (such as transaction costs
and management fees) that reduce returns, while the total returns of the indices
do not. Unless otherwise indicated, the charts are based on Investor Class
shares; performance for other classes will vary due to differences in fee
structures. Past performance does not guarantee future results. None of the
charts reflect the deduction of taxes that a shareholder would pay on fund
distributions or the redemption of fund shares. Investment return and principal
value will fluctuate, and redemption value may be more or less than original
cost.
- ------
2
International Bond - Portfolio Commentary
BY DAVID M. GIBBON, PORTFOLIO MANAGER
PERFORMANCE SUMMARY
International Bond returned 19.91%* for 2003, marking its third-highest
calendar-year return on record and second consecutive year of double-digit
gains. Continued U.S. dollar weakness against major world currencies helped to
make that return possible, as did a modest performance by international bonds.
By comparison, the fund's benchmark--the J.P. Morgan Global Traded Government
Bond Index (excluding the U.S. and with Japan weighted at 15%)--returned
21.97%.
ECONOMIC BACKDROP
Global economic activity generally increased. In the euro zone, growth gained
momentum during the latter half of the year after a weak first half. Two
interest rate cuts by the European Central Bank (ECB) helped that performance
along, as did generally favorable financing and accelerating trade. But
structural workforce issues persisted, with November unemployment at a
seasonally adjusted 8.8%.
As a result, the euro zone's economy expanded an estimated 0.4% (as gauged by
seasonally adjusted gross domestic product) in the most recently measured third
quarter of 2003. Yet inflation (as measured by harmonized indices of consumer
prices) rose a well-controlled 2.0% last year, down from 2.3% in 2002.
In other areas, a broad-based improvement in business conditions helped Japan's
economy expand in spite of mild deflation--falling prices. The U.K.'s economy
grew as well due to stronger consumer demand and low interest rates, while
Sweden's economy expanded amid better times for the country's hi-tech equity
market.
BOND AND CURRENCY RETURNS
High-credit-quality international bonds provided modest returns in
local-currency terms. Better economic times and yields at record lows limited
benchmark euro-zone government bond indices to gains of 3.9-4.6%. Sweden's
benchmark bond index returned approximately 5.0%, compared with the U.K.'s 2.1%
and Japan's -0.80%.
On the foreign-exchange front, the global appeal of the U.S. dollar dwindled
further, courtesy of the nation's growing budget deficit. That allowed room for
the euro to race up a powerful gain of approximately 20.2% versus the greenback.
The U.K. pound crossed the finish line with an appealing advance of
approximately 11.2% at the dollar's expense, while Japan's yen rose roughly
10.7%.
Although nothing spectacular in local-currency terms, dollar-converted
international bond gains were impressive. Benchmark euro-zone government bond
indices returned an average of approximately 25.2% in dollar terms, outpacing
the U.K.'s returns of 13.5% and Japan's returns of 9.8%. Benchmark bonds from
Sweden paced the pack at approximately 27.2%, riding on the country's
dollar-compared currency appreciation.
PORTFOLIO AT A GLANCE
- --------------------------------------------------------------------------------
AS OF AS OF
12/31/03 6/30/03
- --------------------------------------------------------------------------------
Weighted Average
Maturity 7.2 yrs 7.4 yrs
- --------------------------------------------------------------------------------
Average Duration 5.1 yrs 5.1 yrs
- --------------------------------------------------------------------------------
*All fund returns referenced in this commentary
are for Investor Class shares. (continued)
- ------
3
International Bond - Portfolio Commentary
PORTFOLIO STRATEGIES
Turning to the strategies that we employed, our choices regarding Japan boosted
benchmark-compared performance. We sharply curtailed holdings in Japanese
government bonds early in the year because of expectations for a healthier
economic climate and diminished deflation. We weren't as bearish about the yen,
which we thought likely to appreciate further against the dollar.
As enthusiasm grew regarding Japan's prospects, the country's bonds suffered,
falling in value during August in particular. Once we felt that the sell-off was
abating, we moderated the portfolio's underweight by adding back Japanese
government bonds at the prevailing higher yields.
Euro-zone bonds sold off in late June and in July, creating what we believed to
be an attractive buying opportunity. Specifically, we added bonds that we felt
would benefit if the yield difference between short- and long-term bonds grew as
interest rates stayed low while signs of improving global growth pressured
long-term bond yields higher. That part of our plan worked out well. But in
adding those securities, we increased the portfolio's interest rate sensitivity
to the region compared with the benchmark's, which didn't yield the benefits for
which we were hoping.
We made some other adjustments as well. In particular, we increased the
portfolio's benchmark-compared overweight in Sweden, which helped. With the U.K.
economy looking to pick up steam, we underweighted holdings there, which proved
a sound decision as well. Lastly, the portfolio enjoyed some respectable
Canadian-dollar gains early in the year that we locked in by selling some
Canadian bonds.
Unfortunately, not all of our strategies proved as successful. Most notably, the
euro's impressive appreciation versus the U.S. dollar in recent times valued the
12-nation currency at what we perceived to be overpriced levels. So the
portfolio's benchmark-compared underweighting in the euro limited performance
as the currency continued to rally.
BOND HOLDINGS BY COUNTRY
- --------------------------------------------------------------------------------
% OF FUND % OF FUND
INVESTMENTS INVESTMENTS
AS OF AS OF
12/31/03 6/30/03
- --------------------------------------------------------------------------------
Germany* 29.9% 29.4%
- --------------------------------------------------------------------------------
France*
(including temporary
cash investments) 16.7% 17.0%
- --------------------------------------------------------------------------------
Japan 8.8% 1.1%
- --------------------------------------------------------------------------------
Multi-National 6.2% 5.9%
- --------------------------------------------------------------------------------
United States
(including temporary
cash investments) 5.4% --
- --------------------------------------------------------------------------------
Netherlands* 4.7% 9.0%
- --------------------------------------------------------------------------------
Austria* 4.7% 4.6%
- --------------------------------------------------------------------------------
Spain* 4.6% 6.2%
- --------------------------------------------------------------------------------
Belgium* 4.6% 4.8%
- --------------------------------------------------------------------------------
Sweden 3.7% 4.3%
- --------------------------------------------------------------------------------
United Kingdom 3.4% 3.0%
- --------------------------------------------------------------------------------
Italy* 3.1% 3.7%
- --------------------------------------------------------------------------------
Denmark 2.2% 2.6%
- --------------------------------------------------------------------------------
Australia 1.3% 1.1%
- --------------------------------------------------------------------------------
Canada
(including temporary
cash investments) 0.7% 6.4%
- --------------------------------------------------------------------------------
New Zealand -- 0.9%
- --------------------------------------------------------------------------------
*These are euro-zone member countries.
- ------
4
International Bond -
Schedule of Investments
DECEMBER 31, 2003
Principal Amount Value
- --------------------------------------------------------------------------------
GOVERNMENT BONDS -- 63.9%
AUSTRALIA -- 1.3%
- --------------------------------------------------------------------------------
AUD 10,100,000 Australia Commonwealth,
7.50%, 9/15/09 $ 8,297,977
- --------------------------------------------------------------------------------
AUSTRIA -- 4.7%
- --------------------------------------------------------------------------------
EURO 17,400,000 Republic of Austria,
3.90%, 10/20/05 22,385,177
- --------------------------------------------------------------------------------
EURO 5,400,000 Republic of Austria,
6.25%, 7/15/27 8,022,002
- --------------------------------------------------------------------------------
30,407,179
- --------------------------------------------------------------------------------
BELGIUM -- 4.6%
- --------------------------------------------------------------------------------
EURO 15,970,000 Kingdom of Belgium,
3.75%, 3/28/09 20,154,212
- --------------------------------------------------------------------------------
EURO 5,710,000 Kingdom of Belgium,
8.00%, 3/28/15 9,461,721
- --------------------------------------------------------------------------------
29,615,933
- --------------------------------------------------------------------------------
CANADA -- 0.7%
- --------------------------------------------------------------------------------
EURO 3,500,000 Government of Canada,
4.875%, 7/7/08 4,648,808
- --------------------------------------------------------------------------------
DENMARK -- 2.2%
- --------------------------------------------------------------------------------
DKK 54,600,000 Kingdom of Denmark,
8.00%, 3/15/06 10,197,626
- --------------------------------------------------------------------------------
DKK 20,000,000 Kingdom of Denmark,
6.00%, 11/15/09 3,740,320
- --------------------------------------------------------------------------------
13,937,946
- --------------------------------------------------------------------------------
FRANCE -- 9.0%
- --------------------------------------------------------------------------------
EURO 12,430,000 Government of France,
5.00%, 10/25/11 16,544,614
- --------------------------------------------------------------------------------
EURO 10,900,000 Government of France,
5.00%, 10/25/16 14,360,868
- --------------------------------------------------------------------------------
EURO 19,060,000 Government of France,
5.75%, 10/25/32 26,890,454
- --------------------------------------------------------------------------------
57,795,936
- --------------------------------------------------------------------------------
GERMANY -- 13.1%
- --------------------------------------------------------------------------------
EURO 25,700,000 German Federal Republic,
3.00%, 4/11/08 31,772,402
- --------------------------------------------------------------------------------
EURO 10,830,000 German Federal Republic,
4.125%, 7/4/08 13,986,672
- --------------------------------------------------------------------------------
EURO 13,970,000 German Federal Republic,
4.50%, 1/4/13 17,927,669
- --------------------------------------------------------------------------------
EURO 4,700,000 German Federal Republic,
6.25%, 1/4/24 6,972,884
- --------------------------------------------------------------------------------
EURO 6,190,000 German Federal Republic,
5.625%, 1/4/28 8,526,498
- --------------------------------------------------------------------------------
EURO 4,350,000 German Federal Republic,
4.75%, 7/4/34 5,306,219
- --------------------------------------------------------------------------------
84,492,344
- --------------------------------------------------------------------------------
Principal Amount Value
- --------------------------------------------------------------------------------
ITALY -- 3.1%
- --------------------------------------------------------------------------------
EURO 11,940,000 Republic of Italy,
7.25%, 11/1/26 $ 19,634,803
- --------------------------------------------------------------------------------
JAPAN -- 8.8%
- --------------------------------------------------------------------------------
JPY 3,788,000,000 Government of Japan,
0.30%, 6/20/08 34,983,008
- --------------------------------------------------------------------------------
JPY 2,250,000,000 Government of Japan,
1.60%, 3/21/11 21,802,241
- --------------------------------------------------------------------------------
56,785,249
- --------------------------------------------------------------------------------
NETHERLANDS -- 4.7%
- --------------------------------------------------------------------------------
EURO 9,400,000 Kingdom of Netherlands,
4.00%, 7/15/05 12,087,872
- --------------------------------------------------------------------------------
EURO 5,250,000 Kingdom of Netherlands,
5.25%, 7/15/08 7,084,777
- --------------------------------------------------------------------------------
EURO 8,170,000 Kingdom of Netherlands,
5.00%, 7/15/11 10,902,885
- --------------------------------------------------------------------------------
30,075,534
- --------------------------------------------------------------------------------
SPAIN -- 4.6%
- --------------------------------------------------------------------------------
EURO 10,372,007 Government of Spain,
7.35%, 3/31/07 14,729,796
- --------------------------------------------------------------------------------
EURO 10,940,000 Government of Spain,
5.00%, 7/30/12 14,553,015
- --------------------------------------------------------------------------------
29,282,811
- --------------------------------------------------------------------------------
SWEDEN -- 3.7%
- --------------------------------------------------------------------------------
SEK 34,400,000 Kingdom of Sweden,
3.50%, 4/20/06 4,784,094
- --------------------------------------------------------------------------------
SEK 124,700,000 Kingdom of Sweden,
6.50%, 5/5/08 19,002,989
- --------------------------------------------------------------------------------
23,787,083
- --------------------------------------------------------------------------------
UNITED KINGDOM -- 3.4%
- --------------------------------------------------------------------------------
GBP 1,760,000 U.K. Treasury Stock,
6.75%, 11/26/04 3,214,507
- --------------------------------------------------------------------------------
GBP 5,290,000 U.K. Treasury Stock,
7.50%, 12/7/06 10,213,753
- --------------------------------------------------------------------------------
GBP 4,150,000 U.K. Treasury Stock,
5.00%, 9/7/14 7,536,155
- --------------------------------------------------------------------------------
GBP 550,000 U.K. Treasury Stock,
4.25%, 6/7/32 915,531
- --------------------------------------------------------------------------------
21,879,946
- --------------------------------------------------------------------------------
TOTAL GOVERNMENT BONDS
(Cost $365,044,994) 410,641,549
- --------------------------------------------------------------------------------
See Notes to Financial Statements. (continued)
- ------
5
International Bond -
Schedule of Investments
DECEMBER 31, 2003
Principal Amount Value
- --------------------------------------------------------------------------------
CORPORATE BONDS -- 26.7%
FRANCE -- 3.7%
- --------------------------------------------------------------------------------
EURO 17,000,000 Caisse D'Amortissement
de la Dette Sociale,
6.25%, 10/25/07 $ 23,554,905
- --------------------------------------------------------------------------------
GERMANY -- 16.8%
- --------------------------------------------------------------------------------
EURO 8,000,000 DEPFA Deutsche
Pfandbriefbank AG,
5.00%, 2/3/05 10,344,077
- --------------------------------------------------------------------------------
EURO 9,750,000 DEPFA Deutsche
Pfandbriefbank AG,
5.50%, 2/12/08 13,194,556
- --------------------------------------------------------------------------------
EURO 21,950,000 Eurohypo AG,
5.25%, 9/21/07 29,394,528
- --------------------------------------------------------------------------------
EURO 20,200,000 Kreditanstalt fuer
Wiederaufbau,
5.25%, 1/4/10 27,274,988
- --------------------------------------------------------------------------------
EURO 21,500,000 Landwirtschaftliche
Rentenbank,
4.125%, 1/24/05 27,524,091
- --------------------------------------------------------------------------------
107,732,240
- --------------------------------------------------------------------------------
MULTI-NATIONAL -- 6.2%
- --------------------------------------------------------------------------------
GBP 2,050,000 European Investment Bank,
5.50%, 12/7/09 3,765,025
- --------------------------------------------------------------------------------
EURO 11,700,000 European Investment Bank,
5.625%, 10/15/10 16,153,664
- --------------------------------------------------------------------------------
GBP 4,920,000 European Investment Bank,
6.25%, 4/15/14 9,590,075
- --------------------------------------------------------------------------------
GBP 3,930,000 International Bank
for Reconstruction &
Development (the World
Bank), 6.125%, 12/7/09 7,418,374
- --------------------------------------------------------------------------------
GBP 1,600,000 International Finance Corp.,
5.375%, 12/7/28 3,006,566
- --------------------------------------------------------------------------------
39,933,704
- --------------------------------------------------------------------------------
TOTAL CORPORATE BONDS
(Cost $147,208,828) 171,220,849
- --------------------------------------------------------------------------------
Principal Amount Value
- --------------------------------------------------------------------------------
SHORT-TERM INVESTMENTS(1) -- 9.4%
FRANCE -- 4.0%
- --------------------------------------------------------------------------------
EURO 2,500,000 Government of France,
2.02%, 2/12/04 $ 3,135,367
- --------------------------------------------------------------------------------
EURO 18,000,000 Government of France,
2.02%, 2/12/04 22,573,495
- --------------------------------------------------------------------------------
25,708,862
- --------------------------------------------------------------------------------
UNITED STATES -- 5.4%
- --------------------------------------------------------------------------------
USD 34,600,000 FNMA Discount Notes,
0.70%, 1/2/04 34,599,327
- --------------------------------------------------------------------------------
TOTAL SHORT-TERM INVESTMENTS
(Cost $59,545,823) 60,308,189
- --------------------------------------------------------------------------------
TOTAL INVESTMENT SECURITIES -- 100.0%
(Cost $571,799,645) $642,170,587
================================================================================
See Notes to Financial Statements. (continued)
- ------
6
International Bond -
Schedule of Investments
DECEMBER 31, 2003
FORWARD FOREIGN CURRENCY EXCHANGE CONTRACTS*
Contracts to Sell Settlement Date Value Unrealized Gain/(Loss)
- --------------------------------------------------------------------------------
5,015,886 AUD 1/28/04 $ 3,764,181 $ (157,007)
- --------------------------------------------------------------------------------
3,453,632 CAD 1/28/04 2,668,961 (48,961)
- --------------------------------------------------------------------------------
3,958,640 CAD 1/28/04 3,059,231 (69,231)
- --------------------------------------------------------------------------------
3,984,773 CAD 1/28/04 3,079,427 (89,427)
- --------------------------------------------------------------------------------
4,277,858 CAD 1/28/04 3,305,922 (95,922)
- --------------------------------------------------------------------------------
60,877,184 DKK 1/28/04 10,291,944 (541,142)
- --------------------------------------------------------------------------------
7,251,923 EURO 1/28/04 9,129,982 (309,527)
- --------------------------------------------------------------------------------
7,290,736 EURO 1/28/04 9,178,847 (42,314)
- --------------------------------------------------------------------------------
20,807,575 EURO 1/28/04 26,196,196 (1,425,575)
- --------------------------------------------------------------------------------
24,692,146 EURO 1/28/04 31,086,769 (978,477)
- --------------------------------------------------------------------------------
1,224,753 GBP 1/28/04 2,181,593 (120,224)
- --------------------------------------------------------------------------------
2,657,089 GBP 1/28/04 4,732,945 (87,238)
- --------------------------------------------------------------------------------
2,337,630,410 JPY 1/28/04 21,838,448 (173,060)
- --------------------------------------------------------------------------------
104,547,463 SEK 1/28/04 14,514,512 (657,622)
- --------------------------------------------------------------------------------
$145,028,958 $(4,795,727)
=========================================
(Value on Settlement Date $140,233,231)
Contracts to Buy Settlement Date Value Unrealized Gain/(Loss)
- --------------------------------------------------------------------------------
5,015,886 AUD 1/28/04 $ 3,764,181 $ 68,426
- --------------------------------------------------------------------------------
3,301,207 CAD 1/28/04 2,551,168 81,168
- --------------------------------------------------------------------------------
3,583,570 CAD 1/28/04 2,769,377 22,610
- --------------------------------------------------------------------------------
21,659,972 CAD 1/28/04 16,738,794 497,063
- --------------------------------------------------------------------------------
8,623,000 EURO 1/28/04 10,856,133 428,539
- --------------------------------------------------------------------------------
10,925,781 EURO 1/28/04 13,755,274 406,787
- --------------------------------------------------------------------------------
10,990,513 EURO 1/28/04 13,836,770 699,481
- --------------------------------------------------------------------------------
1,800,000 GBP 1/28/04 3,206,254 106,906
- --------------------------------------------------------------------------------
6,773,632 GBP 1/28/04 12,065,547 545,229
- --------------------------------------------------------------------------------
243,017,600 JPY 1/28/04 2,270,302 30,302
- --------------------------------------------------------------------------------
249,849,000 JPY 1/28/04 2,334,122 34,122
- --------------------------------------------------------------------------------
329,417,140 JPY 1/28/04 3,077,458 7,458
- --------------------------------------------------------------------------------
337,746,150 JPY 1/28/04 3,155,269 5,269
- --------------------------------------------------------------------------------
4,954,598,548 JPY 1/28/04 46,286,505 713,568
- --------------------------------------------------------------------------------
$136,667,154 $3,646,928
=========================================
(Value on Settlement Date $133,020,226)
*Forward foreign currency exchange contracts are designed to protect the fund's
foreign investments against declines in foreign currencies (also known as
hedging). The contracts are called "forward" because they allow the fund to
exchange a foreign currency for U.S. dollars on a specific date in the future --
and at a prearranged exchange rate.
NOTES TO SCHEDULE OF INVESTMENTS
AUD = Australian Dollar
DKK = Danish Krone
GBP = British Pound
JPY = Japanese Yen
SEK = Swedish Krona
USD = United States Dollar
(1) The rate indicated is the yield to maturity at purchase.
See Notes to Financial Statements.
- ------
7
Statement of Assets and Liabilities
DECEMBER 31, 2003
- --------------------------------------------------------------------------------
ASSETS
- --------------------------------------------------------------------------------
Investment securities, at value (cost of $571,799,645) $642,170,587
- ----------------------------------------------------------------
Foreign currency holdings, at value (cost $52,696) 52,900
- ----------------------------------------------------------------
Receivable for forward foreign currency exchange contracts 3,646,928
- ----------------------------------------------------------------
Receivable for capital shares sold 6,181,756
- ----------------------------------------------------------------
Interest receivable 13,236,858
- --------------------------------------------------------------------------------
665,289,029
- --------------------------------------------------------------------------------
LIABILITIES
- --------------------------------------------------------------------------------
Disbursements in excess of demand deposit cash 5,643,975
- ----------------------------------------------------------------
Payable for investments purchased 6,734,944
- ----------------------------------------------------------------
Payable for forward foreign currency exchange contracts 4,795,727
- ----------------------------------------------------------------
Payable for capital shares redeemed 3,881,322
- ----------------------------------------------------------------
Accrued management fees 430,178
- ----------------------------------------------------------------
Distribution fees payable 4,294
- ----------------------------------------------------------------
Service fees payable 4,294
- --------------------------------------------------------------------------------
21,494,734
- --------------------------------------------------------------------------------
NET ASSETS $643,794,295
================================================================================
NET ASSETS CONSIST OF:
- --------------------------------------------------------------------------------
Capital paid-in $572,269,568
- ----------------------------------------------------------------
Undistributed net investment income 1,426,892
- ----------------------------------------------------------------
Undistributed net realized gain on investment
and foreign currency transactions (20,056)
- ----------------------------------------------------------------
Net unrealized appreciation on investments and
translation of assets and liabilities in foreign currencies 70,117,891
- --------------------------------------------------------------------------------
$643,794,295
================================================================================
INVESTOR CLASS
- --------------------------------------------------------------------------------
Net assets $622,656,905
- ----------------------------------------------------------------
Shares outstanding 45,634,269
- ----------------------------------------------------------------
Net asset value per share $13.64
- --------------------------------------------------------------------------------
ADVISOR CLASS
- --------------------------------------------------------------------------------
Net assets $21,137,390
- ----------------------------------------------------------------
Shares outstanding 1,551,669
- ----------------------------------------------------------------
Net asset value per share $13.62
- --------------------------------------------------------------------------------
See Notes to Financial Statements.
- ------
8
Statement of Operations
YEAR ENDED DECEMBER 31, 2003
- --------------------------------------------------------------------------------
INVESTMENT INCOME
- --------------------------------------------------------------------------------
INCOME:
- ----------------------------------------------------------------
Interest (net of foreign taxes withheld $45,829) $18,335,246
- --------------------------------------------------------------------------------
EXPENSES:
- ----------------------------------------------------------------
Management fees 4,144,915
- ----------------------------------------------------------------
Distribution fees -- Advisor Class 24,368
- ----------------------------------------------------------------
Service fees -- Advisor Class 24,368
- ----------------------------------------------------------------
Trustees' fees and expenses 62,631
- ----------------------------------------------------------------
Other expenses 19,720
- --------------------------------------------------------------------------------
4,276,002
- --------------------------------------------------------------------------------
NET INVESTMENT INCOME 14,059,244
- --------------------------------------------------------------------------------
REALIZED AND UNREALIZED GAIN (LOSS)
- --------------------------------------------------------------------------------
NET REALIZED GAIN ON:
- ----------------------------------------------------------------
Investment transactions 4,414,159
- ----------------------------------------------------------------
Foreign currency transactions 24,173,163
- --------------------------------------------------------------------------------
28,587,322
- --------------------------------------------------------------------------------
CHANGE IN NET UNREALIZED APPRECIATION ON:
- ----------------------------------------------------------------
Investments (5,747,486)
- ----------------------------------------------------------------
Translation of assets and liabilities in foreign currencies 50,113,970
- --------------------------------------------------------------------------------
44,366,484
- --------------------------------------------------------------------------------
NET REALIZED AND UNREALIZED GAIN 72,953,806
- --------------------------------------------------------------------------------
NET INCREASE IN NET ASSETS RESULTING FROM OPERATIONS $87,013,050
================================================================================
See Notes to Financial Statements.
- ------
9
Statement of Changes in Net Assets
YEARS ENDED DECEMBER 31, 2003 AND DECEMBER 31, 2002
- --------------------------------------------------------------------------------
INCREASE IN NET ASSETS 2003 2002
- --------------------------------------------------------------------------------
OPERATIONS
- --------------------------------------------------------------------------------
Net investment income $ 14,059,244 $ 5,815,830
- -----------------------------------------------
Net realized gain 28,587,322 3,282,837
- -----------------------------------------------
Change in net unrealized appreciation 44,366,484 29,237,799
- --------------------------------------------------------------------------------
Net increase in net assets
resulting from operations 87,013,050 38,336,466
- --------------------------------------------------------------------------------
DISTRIBUTIONS TO SHAREHOLDERS
- --------------------------------------------------------------------------------
From net investment income:
- -----------------------------------------------
Investor Class (13,511,035) (5,950,313)
- -----------------------------------------------
Advisor Class (422,220) (51,945)
- -----------------------------------------------
From net realized gains:
- -----------------------------------------------
Investor Class (27,492,399) --
- -----------------------------------------------
Advisor Class (870,833) --
- --------------------------------------------------------------------------------
Decrease in net assets from distributions (42,296,487) (6,002,258)
- --------------------------------------------------------------------------------
CAPITAL SHARE TRANSACTIONS
- --------------------------------------------------------------------------------
Net increase in net assets
from capital share transactions 280,394,380 169,194,508
- --------------------------------------------------------------------------------
NET INCREASE IN NET ASSETS 325,110,943 201,528,716
NET ASSETS
- --------------------------------------------------------------------------------
Beginning of period 318,683,352 117,154,636
- --------------------------------------------------------------------------------
End of period $643,794,295 $318,683,352
================================================================================
Undistributed net investment income $1,426,892 $2,041,520
================================================================================
See Notes to Financial Statements.
- ------
10
Notes to Financial Statements
DECEMBER 31, 2003
1. ORGANIZATION AND SUMMARY OF SIGNIFICANT ACCOUNTING POLICIES
ORGANIZATION -- American Century International Bond Funds (the trust) is
registered under the Investment Company Act of 1940 (the 1940 Act) as an
open-end management investment company. International Bond Fund (the fund) is
the sole fund issued by the trust. The fund is non-diversified under the 1940
Act. The fund's investment objective is to seek high total return. The fund
pursues its objective by investing in high-quality, nondollar-denominated
government and corporate debt securities issued outside the United States. The
following is a summary of the fund's significant accounting policies.
MULTIPLE CLASS -- The fund is authorized to issue the Investor Class and the
Advisor Class. The share classes differ principally in their respective
shareholder servicing and distribution expenses and arrangements. All shares of
the fund represent an equal pro rata interest in the assets of the class to
which such shares belong, and have identical voting, dividend, liquidation and
other rights and the same terms and conditions, except for class specific
expenses and exclusive rights to vote on matters affecting only individual
classes. Income, non-class specific expenses, and realized and unrealized
capital gains and losses of the fund are allocated to each class of shares based
on their relative net assets.
SECURITY VALUATIONS -- Securities are valued through a commercial pricing
service or at the mean of the most recent bid and asked prices. When valuations
are not readily available, securities are valued at fair value as determined in
accordance with procedures adopted by the Board of Trustees.
SECURITY TRANSACTIONS -- Security transactions are accounted for as of the trade
date. Net realized gains and losses are determined on the identified cost basis,
which is also used for federal income tax purposes.
INVESTMENT INCOME -- Interest income less foreign taxes withheld, if any, is
recorded on the accrual basis and includes accretion of discounts and
amortization of premiums.
FOREIGN CURRENCY TRANSACTIONS -- All assets and liabilities initially expressed
in foreign currencies are translated into U.S. dollars at prevailing exchange
rates at period end. Purchases and sales of investment securities, dividend and
interest income, and certain expenses are translated at the rates of exchange
prevailing on the respective dates of such transactions. Realized and unrealized
gains and losses from foreign currency translations arise from changes in
currency exchange rates.
Net realized and unrealized foreign currency exchange gains or losses occurring
during the holding period of investment securities are a component of realized
gain (loss) on foreign currency transactions and unrealized appreciation
(depreciation) on translation of assets and liabilities in foreign currencies,
respectively. Certain countries may impose taxes on the contract amount of
purchases and sales of foreign currency contracts in their currency. The fund
records the foreign tax expense, if any, as a reduction to the net realized gain
(loss) on foreign currency transactions.
FORWARD FOREIGN CURRENCY EXCHANGE CONTRACTS -- The fund may enter into forward
foreign currency exchange contracts to facilitate transactions of securities
denominated in a foreign currency or to hedge the fund's exposure to foreign
currency exchange rate fluctuations. The net U.S. dollar value of foreign
currency underlying all contractual commitments held by the fund and the
resulting unrealized appreciation or depreciation are determined daily using
prevailing exchange rates. The fund bears the risk of an unfavorable change in
the foreign currency exchange rate underlying the forward contract.
Additionally, losses may arise if the counterparties do not perform under the
contract terms.
REPURCHASE AGREEMENTS -- The fund may enter into repurchase agreements with
institutions that the fund's investment manager, American Century Investment
Management, Inc. (ACIM), has determined are creditworthy pursuant to criteria
adopted by the Board of Trustees. Each repurchase agreement is recorded at cost.
The fund requires that the collateral, represented by securities, received in a
repurchase transaction be transferred to the custodian in a manner sufficient to
enable the fund to obtain those securities in the event of a default under the
repurchase agreement. ACIM monitors, on a daily basis, the securities
transferred to ensure the value, including accrued interest, of the securities
under each repurchase agreement is equal to or greater than amounts owed to the
fund under each repurchase agreement.
(continued)
- ------
11
Notes to Financial Statements
DECEMBER 31, 2003
1. ORGANIZATION AND SUMMARY OF SIGNIFICANT ACCOUNTING POLICIES (CONTINUED)
INCOME TAX STATUS -- It is the fund's policy to distribute all net investment
income and net realized gains to shareholders and to otherwise qualify as a
regulated investment company under provisions of the Internal Revenue Code.
Accordingly, no provision has been made for federal or state income taxes.
DISTRIBUTIONS TO SHAREHOLDERS -- Distributions to shareholders are recorded on
the ex-dividend date. Distributions from net investment income are expected to
be declared and paid quarterly. Distributions from net realized gains, if any,
are generally declared and paid twice a year.
USE OF ESTIMATES -- The financial statements are prepared in conformity with
accounting principles generally accepted in the United States of America, which
may require management to make certain estimates and assumptions at the date of
the financial statements. Actual results could differ from these estimates.
2. FEES AND TRANSACTIONS WITH RELATED PARTIES
MANAGEMENT FEES -- The trust has entered into a Management Agreement with ACIM,
under which ACIM provides the fund with investment advisory and management
services in exchange for a single, unified management fee per class. The
Agreement provides that all expenses of the fund, except brokerage commissions,
taxes, portfolio insurance, interest, fees and expenses of those trustees who
are not considered "interested persons" as defined in the 1940 Act (including
counsel fees) and extraordinary expenses, will be paid by ACIM. The fee is
computed daily and paid monthly in arrears. It consists of an Investment
Category Fee based on the average net assets of the funds in a specific fund's
investment category and a Complex Fee based on the average net assets of all the
funds managed by ACIM. The rates for the Investment Category Fee range from
0.4925% to 0.6100% and the rates for the Complex Fee (Investor Class) range from
0.2900% to 0.3100%. The Advisor Class is 0.2500% less at each point within the
Complex Fee range. For the year ended December 31, 2003, the effective annual
management fee was 0.83% and 0.58% for the Investor and Advisor Classes,
respectively.
DISTRIBUTION AND SERVICE FEES -- The Board of Trustees has adopted a Master
Distribution and Shareholder Services Plan (the plan) for the Advisor Class,
pursuant to Rule 12b-1 of the 1940 Act. The plan provides that the Advisor Class
will pay American Century Investment Services, Inc. (ACIS) an annual
distribution fee equal to 0.25% and an annual service fee equal to 0.25%. The
fees are computed daily and paid monthly in arrears based on the Advisor Class's
average daily closing net assets during the previous month. The distribution fee
provides compensation for expenses incurred by financial intermediaries in
connection with distributing shares of the Advisor Class including, but not
limited to, payments to brokers, dealers, and financial institutions that have
entered into sales agreements with respect to shares of the fund. The service
fee provides compensation for shareholder and administrative services rendered
by ACIS, its affiliates or independent third party providers. Fees incurred
under the plan during the year ended December 31, 2003, are detailed in the
Statement of Operations.
RELATED PARTIES -- Certain officers and trustees of the trust are also officers
and/or directors, and, as a group, controlling stockholders of American Century
Companies, Inc. (ACC), the parent of the trust's investment manager, ACIM, the
distributor of the trust, American Century Investment Services, Inc., and the
trust's transfer agent, American Century Services Corporation.
ACIM has entered into a Subadvisory Agreement with J.P. Morgan Investment
Management, Inc. (JPMIM) on behalf of the fund. The subadvisor makes investment
decisions for the fund in accordance with the fund's investment objectives,
policies, and restrictions under the supervision of ACIM and the Board of
Trustees. ACIM pays all costs associated with retaining JPMIM as the subadvisor
of the fund. JPMIM is a wholly owned subsidiary of J.P. Morgan Chase & Co.
(JPM). JPM is an equity investor in ACC. The fund has a bank line of credit
agreement with JPMorgan Chase Bank (JPMCB). JPMCB is a wholly owned subsidiary
of JPM.
(continued)
- ------
12
Notes to Financial Statements
DECEMBER 31, 2003
3. INVESTMENT TRANSACTIONS
Purchases and sales of investment securities, excluding short-term investments,
for the year ended December 31, 2003, were $749,488,378 and $516,988,571,
respectively.
4. CAPITAL SHARE TRANSACTIONS
The trust has an unlimited number of shares authorized. Transactions in shares
of the fund were as follows:
- --------------------------------------------------------------------------------
SHARES AMOUNT
- --------------------------------------------------------------------------------
INVESTOR CLASS
- --------------------------------------------------------------------------------
YEAR ENDED DECEMBER 31, 2003
- -----------------------------------------------
Sold 58,294,262 $ 763,965,167
- -----------------------------------------------
Issued in reinvestment of distributions 2,529,876 34,452,587
- -----------------------------------------------
Redeemed (41,073,613) (535,200,227)
- --------------------------------------------------------------------------------
Net increase 19,750,525 $ 263,217,527
================================================================================
YEAR ENDED DECEMBER 31, 2002
- -----------------------------------------------
Sold 28,826,187 $ 328,873,464
- -----------------------------------------------
Issued in reinvestment of distributions 443,726 5,349,062
- -----------------------------------------------
Redeemed (14,813,882) (165,744,178)
- --------------------------------------------------------------------------------
Net increase 14,456,031 $ 168,478,348
================================================================================
ADVISOR CLASS
- --------------------------------------------------------------------------------
YEAR ENDED DECEMBER 31, 2003
- -----------------------------------------------
Sold 1,505,909 $19,998,856
- -----------------------------------------------
Issued in reinvestment of distributions 93,733 1,278,566
- -----------------------------------------------
Redeemed (310,436) (4,100,569)
- --------------------------------------------------------------------------------
Net increase 1,289,206 $17,176,853
================================================================================
YEAR ENDED DECEMBER 31, 2002
- -----------------------------------------------
Sold 189,748 $ 2,089,358
- -----------------------------------------------
Issued in reinvestment of distributions 4,238 51,498
- -----------------------------------------------
Redeemed (129,211) (1,424,696)
- --------------------------------------------------------------------------------
Net increase 64,775 $ 716,160
================================================================================
5. BANK LINE OF CREDIT
The fund, along with certain other funds managed by ACIM, has a $650,000,000
unsecured bank line of credit agreement with JPMCB, which was renewed from
$620,000,000 effective December 17, 2003. The fund may borrow money for
temporary or emergency purposes to fund shareholder redemptions. Borrowings
under the agreement bear interest at the Federal Funds rate plus 0.50%. The fund
did not borrow from the line during the year ended December 31, 2003.
(continued)
- ------
13
Notes to Financial Statements
DECEMBER 31, 2003
6. FEDERAL TAX INFORMATION
The tax character of distributions paid during the years ended December 31, 2003
and December 31, 2002 were as follows:
2003 2002
- --------------------------------------------------------------------------------
DISTRIBUTIONS PAID FROM
- --------------------------------------------------------------------------------
Ordinary income $39,741,884 $6,002,258
- --------------------------------------------------------------------------------
Long-term capital gain $2,554,603 --
- --------------------------------------------------------------------------------
The character of distributions made during the year from net investment income
or net realized gains may differ from their ultimate characterization for
federal income tax purposes. These differences reflect the differing character
of certain income items and net realized gains and losses for financial
statement and tax purposes, and may result in reclassification among certain
capital accounts on the financial statements.
As of December 31, 2003, the components of distributable earnings on a tax-basis
and the federal tax cost of investments were as follows:
- --------------------------------------------------------------------------------
COMPONENTS OF DISTRIBUTABLE EARNINGS AND TAX COST
- --------------------------------------------------------------------------------
Federal tax cost of investments $572,865,371
================================================================================
Gross tax appreciation of investments $69,305,216
- ----------------------------------------------------------------
Gross tax depreciation of investments --
- --------------------------------------------------------------------------------
Net tax appreciation of investments $69,305,216
================================================================================
Net tax appreciation (depreciation) on derivatives and
translation of assets and liabilities in foreign currencies $ 374,641
- --------------------------------------------------------------------------------
Net tax appreciation $69,679,857
================================================================================
Undistributed ordinary income $1,693,611
- ----------------------------------------------------------------
Accumulated long-term gains $151,259
- --------------------------------------------------------------------------------
The difference between book-basis and tax-basis cost and unrealized appreciation
(depreciation) is attributable primarily to the tax deferral of losses on wash
sales.
7. OTHER TAX INFORMATION (UNAUDITED)
The following information is provided pursuant to provisions of the Internal
Revenue Code. During the fiscal year ended December 31, 2003, the fund
distributed $2,554,604, which was designated as capital gains dividends.
8. GEOGRAPHIC RISK FACTORS
There are certain risks involved in investing in foreign securities. These risks
include those resulting from future adverse political and economic developments
and the possible imposition of currency exchange restrictions or other foreign
laws or restrictions.
- ------
14
International Bond - Financial Highlights
For a Share Outstanding Throughout the Years Ended December 31
- --------------------------------------------------------------------------------
INVESTOR CLASS
- --------------------------------------------------------------------------------
2003 2002 2001 2000 1999
- --------------------------------------------------------------------------------
PER-SHARE DATA
- --------------------------------------------------------------------------------
Net Asset Value,
Beginning of Period $12.19 $10.08 $10.25 $10.55 $12.44
- --------------------------------------------------------------------------------
Income From
Investment Operations
- -------------------------
Net Investment
Income(1) 0.37 0.36 0.39 0.38 0.36
- -------------------------
Net Realized and
Unrealized Gain (Loss) 2.03 2.01 (0.56) (0.51) (1.62)
- --------------------------------------------------------------------------------
Total From
Investment Operations 2.40 2.37 (0.17) (0.13) (1.26)
- --------------------------------------------------------------------------------
Distributions
- -------------------------
From Net
Investment Income (0.31) (0.26) -- (0.11) (0.43)
- -------------------------
From Net Realized Gains (0.64) -- -- (0.06) (0.20)
- --------------------------------------------------------------------------------
Total Distributions (0.95) (0.26) -- (0.17) (0.63)
- --------------------------------------------------------------------------------
Net Asset Value,
End of Period $13.64 $12.19 $10.08 $10.25 $10.55
================================================================================
TOTAL RETURN(2) 19.91% 23.53% (1.66)% (1.20)% (10.36)%
RATIOS/SUPPLEMENTAL DATA
- --------------------------------------------------------------------------------
Ratio of Operating
Expenses to Average
Net Assets 0.84% 0.85% 0.86% 0.87% 0.85%
- -------------------------
Ratio of Net
Investment Income
to Average Net Assets 2.80% 3.28% 3.87% 3.85% 3.27%
- -------------------------
Portfolio Turnover Rate 112% 137% 147% 221% 239%
- -------------------------
Net Assets,
End of Period
(in thousands) $622,657 $315,491 $115,172 $111,320 $112,968
- --------------------------------------------------------------------------------
(1) Computed using average shares outstanding throughout the period.
(2) Total return assumes reinvestment of net investment income and capital
gains distributions, if any. Total returns for periods less than one year
are not annualized. The total return of the classes may not precisely
reflect the class expense differences because of the impact of calculating
the net asset values to two decimal places. If net asset values were
calculated to three decimal places, the total return differences would more
closely reflect the class expense differences. The calculation of net asset
values to two decimal places is made in accordance with SEC guidelines and
does not result in any gain or loss of value between one class and another.
See Notes to Financial Statements.
- ------
15
International Bond - Financial Highlights
For a Share Outstanding Throughout the Years Ended December 31
- --------------------------------------------------------------------------------
ADVISOR CLASS
- --------------------------------------------------------------------------------
2003 2002 2001 2000 1999
- --------------------------------------------------------------------------------
PER-SHARE DATA
- --------------------------------------------------------------------------------
Net Asset Value,
Beginning of Period $12.16 $10.03 $10.23 $10.52 $12.44
- --------------------------------------------------------------------------------
Income From
Investment Operations
- -------------------------
Net Investment
Income(1) 0.29 0.33 0.36 0.35 0.45
- -------------------------
Net Realized and
Unrealized Gain (Loss) 2.08 2.00 (0.56) (0.50) (1.74)
- --------------------------------------------------------------------------------
Total From
Investment Operations 2.37 2.33 (0.20) (0.15) (1.29)
- --------------------------------------------------------------------------------
Distributions
- -------------------------
From Net
Investment Income (0.27) (0.20) -- (0.08) (0.43)
- -------------------------
From Net
Realized Gains (0.64) -- -- (0.06) (0.20)
- --------------------------------------------------------------------------------
Total Distributions (0.91) (0.20) -- (0.14) (0.63)
- --------------------------------------------------------------------------------
Net Asset Value,
End of Period $13.62 $12.16 $10.03 $10.23 $10.52
================================================================================
TOTAL RETURN(2) 19.60% 23.24% (1.96)% (1.35)% (10.61)%
RATIOS/SUPPLEMENTAL DATA
- --------------------------------------------------------------------------------
Ratio of Operating
Expenses to Average
Net Assets 1.09% 1.10% 1.11% 1.12% 1.10%
- -------------------------
Ratio of Net
Investment Income
to Average Net Assets 2.55% 3.03% 3.62% 3.60% 3.02%
- -------------------------
Portfolio Turnover Rate 112% 137% 147% 221% 239%
- -------------------------
Net Assets,
End of Period
(in thousands) $21,137 $3,192 $1,983 $918 $727
- --------------------------------------------------------------------------------
(1) Computed using average shares outstanding throughout the period.
(2) Total return assumes reinvestment of net investment income and capital
gains distributions, if any. Total returns for periods less than one year
are not annualized. The total return of the classes may not precisely
reflect the class expense differences because of the impact of calculating
the net asset values to two decimal places. If net asset values were
calculated to three decimal places, the total return differences would more
closely reflect the class expense differences. The calculation of net asset
values to two decimal places is made in accordance with SEC guidelines and
does not result in any gain or loss of value between one class and another.
See Notes to Financial Statements.
- ------
16
Report of Independent Auditors
To the Trustees of the American Century International Bond Funds
and Shareholders of the American Century International Bond Fund:
In our opinion, the accompanying statement of assets and liabilities, including
the schedule of investments, and the related statements of operations and of
changes in net assets and the financial highlights present fairly, in all
material respects, the financial position of the American Century International
Bond Fund (the sole fund comprising the American Century International Bond
Funds, hereafter referred to as the "Fund") at December 31, 2003, the results of
its operations for the year then ended, the changes in its net assets for each
of the two years in the period then ended and the financial highlights for each
of the five years in the period then ended, in conformity with accounting
principles generally accepted in the United States of America. These financial
statements and financial highlights (hereafter referred to as "financial
statements") are the responsibility of the Fund's management; our responsibility
is to express an opinion on these financial statements based on our audits. We
conducted our audits of these financial statements in accordance with auditing
standards generally accepted in the United States of America, which require that
we plan and perform the audit to obtain reasonable assurance about whether the
financial statements are free of material misstatement. An audit includes
examining, on a test basis, evidence supporting the amounts and disclosures in
the financial statements, assessing the accounting principles used and
significant estimates made by management, and evaluating the overall financial
statement presentation. We believe that our audits, which included confirmation
of securities at December 31, 2003 by correspondence with the custodian and
brokers and the application of alternative auditing procedures where securities
purchased had not been received, provide a reasonable basis for our opinion.
PricewaterhouseCoopers LLP
Kansas City, Missouri
February 19, 2004
- ------
17
Management
The individuals listed below serve as trustees or officers of the fund. Each
trustee serves until his or her successor is duly elected and qualified or until
he or she retires. Mandatory retirement age for independent trustees is 75,
although the remaining independent trustees may temporarily waive this
requirement on a case-by-case basis. Those listed as interested trustees are
"interested" primarily by virtue of their engagement as officers of American
Century Companies, Inc. (ACC) or its wholly-owned subsidiaries, including the
fund's investment advisor, American Century Investment Management, Inc. (ACIM);
the fund's principal underwriter, American Century Investment Services, Inc.
(ACIS); and the fund's transfer agent, American Century Services Corporation
(ACSC).
The other trustees (more than two-thirds of the total number) are independent;
that is, they are not employees or officers of, and have no financial interest
in, ACC or any of its wholly-owned subsidiaries, including ACIM, ACIS, and ACSC.
The trustees serve in this capacity for eight registered investment companies in
the American Century family of funds.
All persons named as officers of the fund also serve in similar capacities for
the other 12 investment companies advised by ACIM, unless otherwise noted. Only
officers with policy-making functions are listed. No officer is compensated for
his or her service as an officer of the fund. The listed officers are interested
persons of the fund and are appointed or re-appointed on an annual basis.
INDEPENDENT TRUSTEES
- --------------------------------------------------------------------------------
ALBERT EISENSTAT (73), 1665 Charleston Road, Mountain View, CA 94043
POSITION(S) HELD WITH FUND: Trustee
LENGTH OF TIME SERVED (YEARS): 7
PRINCIPAL OCCUPATION(S) DURING PAST 5 YEARS: General Partner, Discovery Ventures
(Venture capital firm, 1996 to 1998)
NUMBER OF PORTFOLIOS IN FUND COMPLEX OVERSEEN BY TRUSTEE: 35
OTHER DIRECTORSHIPS HELD BY TRUSTEE: Independent Director, Sungard Data Systems
(1991 to present); Independent Director, Business Objects S/A (1994 to present);
Independent Director, Commercial Metals (1983 to 2001)
- --------------------------------------------------------------------------------
RONALD J. GILSON (57), 1665 Charleston Road, Mountain View, CA 94043
POSITION(S) HELD WITH FUND: Trustee
LENGTH OF TIME SERVED (YEARS): 7
PRINCIPAL OCCUPATION(S) DURING PAST 5 YEARS: Charles J. Meyers Professor of Law
and Business, Stanford Law School (1979 to present); Mark and Eva Stern
Professor of Law and Business, Columbia University School of Law (1992 to
present); Counsel, Marron, Reid & Sheehy (a San Francisco law firm, 1984 to
present)
NUMBER OF PORTFOLIOS IN FUND COMPLEX OVERSEEN BY TRUSTEE: 35
OTHER DIRECTORSHIPS HELD BY TRUSTEE: None
- --------------------------------------------------------------------------------
KATHRYN A. HALL (45), 1665 Charleston Road, Mountain View, CA 94043
POSITION(S) HELD WITH FUND: Trustee
LENGTH OF TIME SERVED (YEARS): 1
PRINCIPAL OCCUPATION(S) DURING PAST 5 YEARS: President and Chief Investment
Officer, Offit Hall Capital Management, LLC (April 2002 to present); President
and Managing Director, Laurel Management Company, L.L.C. (1996 to April 2002)
NUMBER OF PORTFOLIOS IN FUND COMPLEX OVERSEEN BY TRUSTEE: 35
OTHER DIRECTORSHIPS HELD BY TRUSTEE: Director, Princeton University Investment
Company (1997 to present); Director, Stanford Management Company (2001 to
present); Director, UCSF Foundation (2000 to present); Director, San Francisco
Day School (1999 to present)
- --------------------------------------------------------------------------------
(continued)
- ------
18
Management
INDEPENDENT TRUSTEES (CONTINUED)
- --------------------------------------------------------------------------------
MYRON S. SCHOLES (62), 1665 Charleston Road, Mountain View, CA 94043
POSITION(S) HELD WITH FUND: Trustee
LENGTH OF TIME SERVED (YEARS): 22
PRINCIPAL OCCUPATION(S) DURING PAST 5 YEARS: Partner, Oak Hill Capital
Management (1999 to present); Principal, Long-Term Capital Management
(investment advisor, 1993 to January 1999); Frank E. Buck Professor of Finance,
Stanford Graduate School of Business (1981 to present)
NUMBER OF PORTFOLIOS IN FUND COMPLEX OVERSEEN BY TRUSTEE: 35
OTHER DIRECTORSHIPS HELD BY TRUSTEE: Director, Dimensional Fund Advisors
(investment advisor, 1982 to present); Director, Smith Breeden Family of Funds
(1992 to present)
- --------------------------------------------------------------------------------
KENNETH E. SCOTT (75), 1665 Charleston Road, Mountain View, CA 94043
POSITION(S) HELD WITH FUND: Trustee
LENGTH OF TIME SERVED (YEARS): 31
PRINCIPAL OCCUPATION(S) DURING PAST 5 YEARS: Ralph M. Parsons Professor of Law
and Business, Stanford Law School (1972 to present)
NUMBER OF PORTFOLIOS IN FUND COMPLEX OVERSEEN BY TRUSTEE: 35
OTHER DIRECTORSHIPS HELD BY TRUSTEE: None
- --------------------------------------------------------------------------------
JOHN B. SHOVEN (56), 1665 Charleston Road, Mountain View, CA 94043
POSITION(S) HELD WITH FUND: Trustee
LENGTH OF TIME SERVED (YEARS): Less than 1
PRINCIPAL OCCUPATION(S) DURING PAST 5 YEARS: Professor of Economics, Stanford
University (1977 to present)
NUMBER OF PORTFOLIOS IN FUND COMPLEX OVERSEEN BY TRUSTEE: 35
OTHER DIRECTORSHIPS HELD BY TRUSTEE: Director, Cadence Design Systems (1992 to
present); Director, Watson Wyatt Worldwide (2002 to present); Director,
Palmsource Inc. (2002 to present)
- --------------------------------------------------------------------------------
JEANNE D. WOHLERS (58), 1665 Charleston Road, Mountain View, CA 94043
POSITION(S) HELD WITH FUND: Trustee
LENGTH OF TIME SERVED (YEARS): 18
PRINCIPAL OCCUPATION(S) DURING PAST 5 YEARS: Director and Partner, Windy Hill
Productions, LP (educational software, 1994 to 1998)
NUMBER OF PORTFOLIOS IN FUND COMPLEX OVERSEEN BY TRUSTEE: 35
OTHER DIRECTORSHIPS HELD BY TRUSTEE: Director, Indus International (software
solutions, January 1999 to present); Director, Quintus Corporation (automation
solutions, 1995 to present)
- --------------------------------------------------------------------------------
INTERESTED TRUSTEE
- --------------------------------------------------------------------------------
WILLIAM M. LYONS (48), 4500 Main Street, Kansas City, MO 64111
POSITION(S) HELD WITH FUND: Trustee, Chairman of the Board
LENGTH OF TIME SERVED (YEARS): 5
PRINCIPAL OCCUPATION(S) DURING PAST 5 YEARS: Chief Executive Officer, ACC and
other ACC subsidiaries (September 2000 to present); President, ACC (June 1997 to
present); President, ACIM (September 2002 to present); President, ACIS (July
2003 to present); Chief Operating Officer, ACC (June 1996 to September 2000);
Also serves as: Executive Vice President, ACSC and other ACC subsidiaries
NUMBER OF PORTFOLIOS IN FUND COMPLEX OVERSEEN BY TRUSTEE: 35
OTHER DIRECTORSHIPS HELD BY TRUSTEE: None
- --------------------------------------------------------------------------------
(continued)
- ------
19
Management
OFFICERS
- --------------------------------------------------------------------------------
WILLIAM M. LYONS (48), 4500 Main Street, Kansas City, MO 64111
POSITION(S) HELD WITH FUND: President
LENGTH OF TIME SERVED (YEARS): 2
PRINCIPAL OCCUPATION(S) DURING PAST 5 YEARS: See entry under "Interested
Trustees."
- --------------------------------------------------------------------------------
ROBERT T. JACKSON (57), 4500 Main Street, Kansas City, MO 64111
POSITION(S) HELD WITH FUND: Executive Vice President
LENGTH OF TIME SERVED (YEARS): 2
PRINCIPAL OCCUPATION(S) DURING PAST 5 YEARS: Chief Administrative Officer, ACC
(August 1997 to present); Chief Financial Officer, ACC (May 1995 to October
2002); President, ACSC (January 1999 to present); Executive Vice President, ACC
(May 1995 to present); Also serves as: Executive Vice President and Chief
Financial Officer, ACIM, ACIS, and other ACC subsidiaries; and Treasurer, ACIM
- --------------------------------------------------------------------------------
MARYANNE ROEPKE, CPA (47), 4500 Main Street, Kansas City, MO 64111
POSITION(S) HELD WITH FUND: Senior Vice President, Treasurer and Chief
Accounting Officer
LENGTH OF TIME SERVED (YEARS): 2
PRINCIPAL OCCUPATION(S) DURING PAST 5 YEARS: Senior Vice President (April 1998
to present) and Assistant Treasurer (September 1985 to present), ACSC
- --------------------------------------------------------------------------------
DAVID C. TUCKER (45), 4500 Main Street, Kansas City, MO 64111
POSITION(S) HELD WITH FUND: Senior Vice President and General Counsel
LENGTH OF TIME SERVED (YEARS): 4
PRINCIPAL OCCUPATION(S) DURING PAST 5 YEARS: Senior Vice President, ACIM, ACIS,
ACSC, and other ACC subsidiaries (June 1998 to present); General Counsel, ACC,
ACIM, ACIS, ACSC, and other ACC subsidiaries (June 1998 to present)
- --------------------------------------------------------------------------------
ROBERT LEACH (37), 4500 Main Street, Kansas City, MO 64111
POSITION(S) HELD WITH FUND: Controller
LENGTH OF TIME SERVED (YEARS): 6
PRINCIPAL OCCUPATION(S) DURING PAST 5 YEARS: Vice President, ACSC (February 2000
to present); Controller-Fund Accounting, ACSC (June 1997 to present)
- --------------------------------------------------------------------------------
C. JEAN WADE (39), 4500 Main Street, Kansas City, MO 64111
POSITION(S) HELD WITH FUND: Controller(1)
LENGTH OF TIME SERVED (YEARS): 6
PRINCIPAL OCCUPATION(S) DURING PAST 5 YEARS: Vice President, ACSC (February 2000
to present); Controller-Fund Accounting, ACSC (June 1997 to present)
- --------------------------------------------------------------------------------
JON ZINDEL (36), 4500 Main Street, Kansas City, MO 64111
POSITION(S) HELD WITH FUND: Tax Officer
LENGTH OF TIME SERVED (YEARS): 5
PRINCIPAL OCCUPATION(S) DURING PAST 5 YEARS: Vice President, Corporate Tax, ACSC
(April 1998 to present); Vice President, ACIM, ACIS, and other ACC subsidiaries
(April 1999 to present); President, American Century Employee Benefit Services,
Inc. (January 2000 to December 2000); Treasurer, American Century Ventures, Inc.
(December 1999 to January 2001); Treasurer, American Century Employee Benefit
Services, Inc. (December 2000 to December 2003)
- --------------------------------------------------------------------------------
(1) Ms. Wade serves in a similar capacity for the other seven investment
companies advised by ACIM.
The SAI has additional information about the fund's trustees and is available
without charge upon request by calling 1-800-345-2021.
- ------
20
Share Class Information
Two classes of shares are authorized for sale by the fund: Investor Class and
Advisor Class. The total expense ratio for Advisor Class is higher than that of
Investor Class.
INVESTOR CLASS shares are available for purchase in two ways: 1) directly from
American Century without any commissions or other fees; or 2) through a
broker-dealer, which may require payment of a transaction fee to the broker.
ADVISOR CLASS shares are sold primarily through institutions such as investment
advisors, banks, broker-dealers, insurance companies, and financial advisors.
Advisor Class shares are subject to a 0.50% annual Rule 12b-1 service and
distribution fee. The total expense ratio of Advisor Class shares is 0.25%
higher than the total expense ratio of Investor Class shares.
All classes of shares represent a pro rata interest in the fund and generally
have the same rights and preferences.
- ------
21
Additional Information
RETIREMENT ACCOUNT INFORMATION
As required by law, any distributions you receive from an IRA or certain 403(b),
457 and qualified plans [those not eligible for rollover to an IRA or to another
qualified plan] are subject to federal income tax withholding, unless you elect
not to have withholding apply. Tax will be withheld on the total amount
withdrawn even though you may be receiving amounts that are not subject to
withholding, such as nondeductible contributions. In such case, excess amounts
of withholding could occur. You may adjust your withholding election so that a
greater or lesser amount will be withheld.
If you don't want us to withhold on this amount, you must notify us to not
withhold the federal income tax. Even if you plan to roll over the amount you
withdraw to another tax-deferred account, the withholding rate still applies to
the withdrawn amount unless we have received notice not to withhold federal
income tax prior to the withdrawal. You may notify us in writing or in certain
situations by telephone or through other electronic means. You have the right to
revoke your withholding election at any time and any election you make may
remain in effect until revoked by filing a new election.
Remember, even if you elect not to have income tax withheld, you are liable for
paying income tax on the taxable portion of your withdrawal. If you elect not to
have income tax withheld or you don't have enough income tax withheld, you may
be responsible for payment of estimated tax. You may incur penalties under the
estimated tax rules if your withholding and estimated tax payments are not
sufficient.
State tax will be withheld if, at the time of your distribution, your address is
within one of the mandatory withholding states and you have federal income tax
withheld. State taxes will be withheld from your distribution in accordance with
the respective state rules.
PROXY VOTING GUIDELINES
American Century Investment Management, Inc., the fund's manager, is responsible
for exercising the voting rights associated with the securities purchased and/or
held by the fund. A description of the policies and procedures the manager uses
in fulfilling this responsibility is available without charge, upon request, by
calling 1-800-345-2021. It is also available on American Century's Web site at
www.americancentury.com and on the Securities and Exchange Commission's Web site
at www.sec.gov.
- ------
22
Index Definition
The following index is used to illustrate investment market, sector, or style
performance or to serve as fund performance comparisons. It is not an investment
product available for purchase.
The J.P. MORGAN GLOBAL TRADED GOVERNMENT BOND INDEX (JPM GTGBI) is a
market-capitalization weighted index consisting of regularly traded, fixed-rate
government bonds from certain developed foreign countries in North America,
Europe, Asia, and Australia.
Since January 1998, the FUND BENCHMARK has been the JPM GTGBI with the U.S.
excluded and Japan weighted at 15%.
Prior to January 1998, the FUND BENCHMARK was the J.P. Morgan ECU-Weighted
European Index.
- ------
23
Notes
- ------
24
CONTACT US
WWW.AMERICANCENTURY.COM
AUTOMATED INFORMATION LINE:
1-800-345-8765
INVESTOR RELATIONS:
1-800-345-2021 or 816-531-5575
BUSINESS, NOT-FOR-PROFIT,
EMPLOYER-SPONSORED RETIREMENT PLANS:
1-800-345-3533
BANKS AND TRUST COMPANIES, BROKER-DEALERS,
FINANCIAL ADVISORS, INSURANCE COMPANIES:
1-800-345-6488
TELECOMMUNICATIONS DEVICE FOR THE DEAF:
1-800-634-4113 or 816-444-3485
AMERICAN CENTURY INTERNATIONAL BOND FUNDS
INVESTMENT MANAGER:
American Century Investment Management, Inc.
Kansas City, Missouri
THIS REPORT AND THE STATEMENTS IT CONTAINS ARE SUBMITTED FOR THE GENERAL
INFORMATION OF OUR SHAREHOLDERS. THE REPORT IS NOT AUTHORIZED FOR DISTRIBUTION
TO PROSPECTIVE INVESTORS UNLESS PRECEDED OR ACCOMPANIED BY AN EFFECTIVE
PROSPECTUS.
0402 American Century Investment Services, Inc.
SH-ANN-36974N (c)2004 American Century Services Corporation
ITEM 2. CODE OF ETHICS.
(a) The registrant has adopted a Code of Ethics for Senior Financial
Officers that applies to the registrant's principal executive officer,
principal financial officer, principal accounting officer, and persons
performing similar functions.
(b) No response required.
(c) None.
(d) None.
(e) Not applicable.
(f) The registrant's Code of Ethics for Senior Financial Officers was
filed as Exhibit 10(a) to American Century Mutual Fund, Inc.'s Annual
Certified Shareholder Report on Form N-CSR, File No. 811-0816, on
December 23, 2003, and is incorporated herein by reference.
ITEM 3. AUDIT COMMITTEE FINANCIAL EXPERT.
(a)(1) The registrant's board has determined that the registrant has at least
one audit committee financial expert serving on its audit committee.
(a)(2) Albert Eisenstat is the registrant's designated audit committee
financial expert. He is "independent" as defined in Item 3 of Form
N-CSR.
(a)(3) Not applicable.
(b) No response required.
(c) No response required.
(d) No response required.
ITEM 4. PRINCIPAL ACCOUNTANT FEES AND SERVICES.
(a) Audit Fees.
The aggregate fees billed for each of the last two fiscal years for
professional services rendered by the principal accountant for the audit of the
registrant's annual financial statements or services that are normally provided
by the accountant in connection with statutory and regulatory filings or
engagements for those fiscal years were as follows:
FY 2002: $21,798
FY 2003: $20,076
(b) Audit-Related Fees.
The aggregate fees billed in each of the last two fiscal years for
assurance and related services by the principal accountant that are reasonably
related to the performance of the audit of the registrant's financial statements
and are not reported under paragraph (a) of this Item were as follows:
For services rendered to the registrant:
FY 2002: $ 0
FY 2003: $ 0
Fees required to be approved pursuant to paragraph (c)(7)(ii) of Rule
2-01 of Regulation S-X (relating to certain engagements for non-audit services
with the registrant's investment adviser and its affiliates):
FY 2002: $ 0
FY 2003: $ 0
(c) Tax Fees.
The aggregate fees billed in each of the last two fiscal years for
professional services rendered by the principal accountant for tax compliance,
tax advice, and tax planning were as follows:
For services rendered to the registrant:
FY 2002: $4,000
FY 2003: $4,200
These services included review of federal and state income tax forms
and federal excise tax forms.
Fees required to be approved pursuant to paragraph (c)(7)(ii) of Rule
2-01 of Regulation S-X (relating to certain engagements for non-audit services
with the registrant's investment adviser and its affiliates):
FY 2002: $ 0
FY 2003: $ 0
(d) All Other Fees.
The aggregate fees billed in each of the last two fiscal years for
products and services provided by the principal accountant, other than the
services reported in paragraphs (a) through (c) of this Item were as follows:
For services rendered to the registrant:
FY 2002: $ 0
FY 2003: $ 0
Fees required to be approved pursuant to paragraph (c)(7)(ii) of Rule
2-01 of Regulation S-X (relating to certain engagements for non-audit services
with the registrant's investment adviser and its affiliates):
FY 2002: $ 0
FY 2003: $ 0
(e)(1) In accordance with paragraph (c)(7)(i)(A) of Rule 2-01 of Regulation
S-X, before the accountant is engaged by the registrant to render
audit or non-audit services, the engagement is approved by the
registrant's audit committee of the board of directors. Pursuant to
paragraph (c)(7)(ii) of Rule 2-01 of Regulation S-X, the registrant's
audit committee also pre-approves its accountant's engagements for
non-audit services with the registrant's investment adviser, its
parent company, and any entity controlled by, or under common control
with the investment adviser that provides ongoing services to the
registrant, if the engagement relates directly to the operations and
financial reporting of the registrant.
(e)(2) All services described in each of paragraphs (b) through (d) of this
Item were pre-approved before the engagement by the registrant's audit
committee pursuant to paragraph (c)(7)(i)(A) of Rule 2-01 of
Regulation S-X. Consequently, none of such services were required to
be approved by the audit committee pursuant to paragraph (c)(7)(i)(C).
(f) The percentage of hours expended on the principal accountant's
engagement to audit the registrant's financial statements for the most
recent fiscal year that were attributed to work performed by persons
other than the principal accountant's full-time, permanent employees
was less than 50%.
(g) The aggregate non-audit fees billed by the registrant's accountant for
services rendered to the registrant, and rendered to the registrant's
investment adviser (not including any sub-adviser whose role is
primarily portfolio management and is subcontracted with or overseen
by another investment adviser), and any entity controlling, controlled
by, or under common control with the adviser that provides ongoing
services to the registrant for each of the last two fiscal years of
the registrant were as follows:
FY 2002: $ 435,432
FY 2003: $ 85,450
(h) The registrant's investment adviser and accountant have notified the
registrant's audit committee of all non-audit services that were
rendered by the registrant's accountant to the registrant's investment
adviser, its parent company, and any entity controlled by, or under
common control with the investment adviser that provides services to
the registrant, which services were not required to be pre-approved
pursuant to paragraph (c)(7)(ii) of Rule 2-01 of Regulation S-X. The
notification provided to the registrant's audit committee included
sufficient details regarding such services to allow the registrant's
audit committee to consider the continuing independence of its
principal accountant.
ITEM 5. AUDIT COMMITTEE OF LISTED REGISTRANTS.
Not applicable.
ITEM 6. [RESERVED].
ITEM 7. DISCLOSURE OF PROXY VOTING POLICIES AND PROCEDURES FOR CLOSED-END
MANAGEMENT INVESTMENT COMPANIES.
Not applicable.
ITEM 8. PURCHASES OF EQUITY SECURITIES BY CLOSED-END MANAGEMENT INVESTMENT
COMPANY AND AFFILIATED PURCHASERS.
Not applicable.
ITEM 9. SUBMISSION OF MATTERS TO A VOTE OF SECURITY HOLDERS.
Not applicable prior to the first reporting period ending after January
1, 2004.
ITEM 10. CONTROLS AND PROCEDURES.
(a) The registrant's principal executive officer and principal financial
officer have concluded that the registrant's disclosure controls and
procedures (as defined in Rule 30a-3(c) under the Investment Company
Act of 1940) are effective based on their evaluation of these controls
and procedures as of a date within 90 days of the filing date of this
report.
(b) There were no changes in the registrant's internal control over
financial reporting (as defined in Rule 30a-3(d) under the Investment
Company Act of 1940) that occurred during the registrant's last fiscal
half-year that have materially affected, or are reasonably likely to
materially affect, the registrant's internal control over financial
reporting.
ITEM 11. EXHIBITS.
(a)(1) Registrant's Code of Ethics for Senior Financial Officers, which is
the subject of the disclosure required by Item 2 of Form N-CSR, was
filed as Exhibit 10(a) to American Century Mutual Fund, Inc.'s
Certified Shareholder Report on Form N-CSR, File No. 811-3706, on
December 23, 2003.
(a)(2) Separate certifications by the registrant's principal executive
officer and principal financial officer, pursuant to Section 302 of
the Sarbanes-Oxley Act of 2002 and Rule 30a-2(a) under the Investment
Company Act of 1940, are filed and attached hereto as Exhibit
99.302CERT.
(a)(3) Not applicable.
(b) A certification by the registrant's chief executive officer and chief
financial officer, pursuant to Section 906 of the Sarbanes-Oxley Act
of 2002, is furnished and attached hereto as Exhibit 99.906CERT.
SIGNATURES
Pursuant to the requirements of the Securities Exchange Act of 1934 and the
Investment Company Act of 1940, the registrant has duly caused this report to be
signed on its behalf by the undersigned, thereunto duly authorized.
Registrant: American Century International Bond Funds
By: /s/ William M. Lyons
-----------------------------------------------------------
Name: William M. Lyons
Title: President
Date: February 28, 2004
Pursuant to the requirements of the Securities Exchange Act of 1934 and
the Investment Company Act of 1940, this report has been signed below by the
following persons on behalf of the registrant and in the capacities and on the
dates indicated.
By: /s/ William M. Lyons
-----------------------------------------------------------
Name: William M. Lyons
Title: President
(principal executive officer)
Date: February 28, 2004
By: /s/ Maryanne L. Roepke
-----------------------------------------------------------
Name: Maryanne L. Roepke
Title: Sr. Vice President, Treasurer, and
Chief Accounting Officer
(principal financial officer)
Date: February 28, 2004