                                  UNITED STATES
                       SECURITIES AND EXCHANGE COMMISSION
                             Washington, D.C. 20549


                                   FORM N-CSR
                   CERTIFIED SHAREHOLDER REPORT OF REGISTERED
                         MANAGEMENT INVESTMENT COMPANIES


Investment Company Act file number  811-06441
                                  ----------------------------------------------


                   AMERICAN CENTURY INTERNATIONAL BOND FUNDS
- --------------------------------------------------------------------------------
               (Exact name of registrant as specified in charter)


4500 MAIN STREET, KANSAS CITY, MISSOURI                               64111
- --------------------------------------------------------------------------------
(Address of principal executive offices)                           (Zip code)


      CHARLES A. ETHERINGTON, 4500 MAIN STREET, KANSAS CITY, MISSOURI 64111
- --------------------------------------------------------------------------------
                    (Name and address of agent for service)


Registrant's telephone number, including area code:  816-531-5575
                                                   -----------------------------


Date of fiscal year end:  06-30
                        --------------------------------------------------------


Date of reporting period:  12-31-2008
                         -------------------------------------------------------


ITEM 1.  REPORTS TO STOCKHOLDERS.

[front cover]

SEMIANNUAL REPORT
DECEMBER 31, 2008

[american century investments logo and text logo ®]

AMERICAN CENTURY INVESTMENTS

INTERNATIONAL BOND FUND


PRESIDENT'S LETTER

[photo of Jonathan Thomas]

JONATHAN THOMAS

Dear Investor:

Thank you for taking time to review the following discussions, from our
experienced portfolio management team, of the fund reporting period ended
December 31, 2008. It was a time of enormous upheaval and change. We understand
and appreciate the challenges you have faced during this historic period, and
share your concerns about the economy, the markets, and fund holdings. To help
address these issues, I'd like to provide my perspective on how we have
managed--and continue to manage--your investments in these uncertain times.

As a company, American Century Investments(R) is well positioned to deal with
market turmoil. We are financially strong and privately held, which allows us to
align our resources with your long-term investment interests. In addition, our
actively managed, team-based approach allows our portfolio teams to identify
attractive investment opportunities regardless of market conditions.

Our seasoned investment professionals have substantial experience and have
successfully navigated previous market crises. These portfolio managers and
analysts continue to use a team approach and follow disciplined investment
processes designed to produce the best possible long-term results for you. For
example, our equity investment teams are working closely with our fixed income
group to monitor and assess credit crisis developments. The fixed income team
anticipated dislocation in the credit markets and--through its disciplined
processes and teamwork--helped reduce our exposure to investments that suffered
substantial losses.

How soon a sustainable recovery will occur is uncertain. But I am certain of
this: Since 1958, we've demonstrated a consistent ability to execute solid,
long-term investment strategies and the discipline to remain focused during
times of volatility or shifts in the markets. We've stayed true to our
principles, especially our belief that your success is the ultimate measure of
our success.

Thank you for your continued confidence in us.

Sincerely,

/s/ Jonathan Thomas

Jonathan S. Thomas
President and Chief Executive Officer
American Century Investments


TABLE OF CONTENTS

     Market Perspective. . . . . . . . . . . . . . . . . . . .
     . . . . . .                                                  2
      Major Currency and Global Bond Market Returns. . . . . .
     . . . . . .                                                  2

INTERNATIONAL BOND

     Performance . . . . . . . . . . . . . . . . . . . . . . .
     . . . . . .                                                  3
     Portfolio Commentary. . . . . . . . . . . . . . . . . . .
     . . . . . .                                                  5
      Portfolio at a Glance. . . . . . . . . . . . . . . . . .
     . . . . . .                                                  5
      Types of Investments in Portfolio. . . . . . . . . . . .
     . . . . . .                                                  5
      Bond Holdings by Country . . . . . . . . . . . . . . . .
     . . . . . .                                                  6
     Shareholder Fee Example . . . . . . . . . . . . . . . . .
     . . . . . .                                                  7

FINANCIAL STATEMENTS

     Schedule of Investments . . . . . . . . . . . . . . . . .
     . . . . . .                                                  9
     Statement of Assets and Liabilities . . . . . . . . . . .
     . . . . . .                                                 14
     Statement of Operations . . . . . . . . . . . . . . . . .
     . . . . . .                                                 16
     Statement of Changes in Net Assets. . . . . . . . . . . .
     . . . . . .                                                 17
     Notes to Financial Statements . . . . . . . . . . . . . .
     . . . . . .                                                 18
     Financial Highlights. . . . . . . . . . . . . . . . . . .
     . . . . . .                                                 24

OTHER INFORMATION

     Additional Information. . . . . . . . . . . . . . . . . .
     . . . . . .                                                 30
     Index Definitions . . . . . . . . . . . . . . . . . . . .
     . . . . . .                                                 31

The opinions expressed in the Market Perspective and the Portfolio Commentary
reflect those of the portfolio management team as of the date of the report, and
do not necessarily represent the opinions of American Century Investments or any
other person in the American Century Investments organization. Any such opinions
are subject to change at any time based upon market or other conditions and
American Century Investments disclaims any responsibility to update such
opinions. These opinions may not be relied upon as investment advice and,
because investment decisions made by American Century Investments funds are
based on numerous factors, may not be relied upon as an indication of trading
intent on behalf of any American Century Investments fund. Security examples are
used for representational purposes only and are not intended as recommendations
to purchase or sell securities. Performance information for comparative indices
and securities is provided to American Century Investments by third party
vendors. To the best of American Century Investments' knowledge, such
information is accurate at the time of printing.


MARKET PERSPECTIVE

[photo of Chief Investment Officer]

By David MacEwen, Chief Investment Officer, Fixed Income

INTERNATIONAL BONDS ADVANCED AMID RECESSION AND FINANCIAL TUMULT

Government bond markets worldwide enjoyed solid gains for the last six months of
2008 in an increasingly turbulent economic and financial environment. Widespread
liquidity problems in the credit markets led to an increasingly desperate need
for capital in the financial sector. The crisis ultimately resulted in an
unprecedented series of failures and takeovers of some of the world's largest
financial institutions.

The credit difficulties contributed to a significant global economic downturn as
the U.S., Europe, and Japan plunged into their first simultaneous recession
since World War II. The economic weakness spread to many emerging economies as
well, particularly those dependent on exports to developed countries. The
slowdown also brought a sharp decline in commodity prices, easing the
inflationary pressures that had emerged in the first half of 2008.

Central banks around the world launched a coordinated response to combat the
mounting credit crisis and restore global market liquidity. The banks slashed
overnight rates to historic lows and injected capital into the financial system.
The combination of central bank action and increased demand for government bonds
amid a flight to quality produced a strong rally in the global government bond
markets as yields fell and prices rose around the globe.

U.S. DOLLAR WAS MIXED

The U.S. dollar rallied sharply against the euro and British pound as investors
worldwide fled to the U.S. Treasury bond market as the safest haven against
volatility and chaos in the global financial markets. However, late in the
period, the Japanese yen became the safe haven of choice as interest rates
around the world converged with already-low rates in Japan. This yield
convergence--most notably in the U.S. as the Federal Reserve cut rates to
essentially 0%--caused investors to unwind the "yen carry" trade, which involved
borrowing at low rates in Japan and investing in higher-yielding debt elsewhere
in the world. As a result, the dollar lost ground overall against the Japanese
yen.

Major Currency and Global Bond Market Returns
For the six months ended December 31, 2008*

CURRENCY RETURNS
U.S. Dollar vs. Euro 12.76% U.S. Dollar vs. Japanese Yen -14.66%

INTERNATIONAL BOND MARKET RETURNS (IN DOLLARS)
JPMorgan Government Bond Index--Global,
excluding U.S.                                     5.61%
JPMorgan Global Traded Government Bond Index       6.91%

*Total returns for periods less than one year are not annualized.


- ------
2


PERFORMANCE
International Bond

Total Returns as of December 31, 2008
                                          Average Annual
                                              Returns
                         6      1       5     10     Since    Inception
                      months(1) year   years years  Inception   Date

INVESTOR CLASS         -1.72%   2.41%  4.80% 5.01%   6.49%     1/7/92

FUND BENCHMARK(2)      -1.06%   4.43%  6.17% 6.27%  7.19%(3)     --

JPMORGAN GLOBAL
TRADED GOVERNMENT
BOND INDEX             6.91%    12.00% 6.24% 5.95%  6.85%(3)     --

Institutional Class    -1.61%   2.66%   --    --     6.12%     8/2/04

A Class(4)
 No sales charge*      -1.83%   2.24%  4.52% 4.74%   4.88%
 With sales charge*    -6.25%   -2.35% 3.57% 4.26%   4.40%    10/27/98

B Class
 No sales charge*      -2.20%   1.44%   --    --     3.20%
 With sales charge*    -7.20%   -2.56%  --    --     0.04%    9/28/07

C Class
 No sales charge*      -2.20%   1.44%   --    --     3.20%
 With sales charge*    -3.14%   1.44%   --    --     3.20%    9/28/07

R Class                -1.99%   1.85%   --    --     3.66%    9/28/07

* Sales charges include initial sales charges and contingent deferred sales
charges (CDSCs), as applicable. A Class shares have a 4.50% maximum initial
sales charge for fixed-income funds and may be subject to a maximum CDSC of
1.00%. B Class shares redeemed within six years of purchase are subject to a
CDSC that declines from 5.00% during the first year after purchase to 0.00% the
sixth year after purchase. C Class shares redeemed within 12 months of purchase
are subject to a maximum CDSC of 1.00%. The SEC requires that mutual funds
provide performance information net of maximum sales charges in all cases where
charges could be applied.

(1) Total returns for periods less than one year are not annualized.

(2) See Index Definitions page.

(3) Since 12/31/91, the date nearest the Investor Class's inception for which
data are available.

(4) Prior to September 4, 2007, the A Class was referred to as the Advisor
Class. Performance, with sales charge, prior to that date has been adjusted to
reflect the A Class's current sales charge.

Data presented reflect past performance. Past performance is no guarantee of
future results. Current performance may be higher or lower than the performance
shown. Investment return and principal value will fluctuate, and redemption
value may be more or less than original cost. To obtain performance data current
to the most recent month end, please call 1-800-345-2021 or visit
americancentury.com. As interest rates rise, bond values will decline.
International investing involves special risks, such as political instability
and currency fluctuations.

Unless otherwise indicated, performance reflects Investor Class shares;
performance for other share classes will vary due to differences in fee
structure. For information about other share classes available, please consult
the prospectus. Data assumes reinvestment of dividends and capital gains, and
none of the charts reflect the deduction of taxes that a shareholder would pay
on fund distributions or the redemption of fund shares. Returns for the index
are provided for comparison. The fund's total returns include operating expenses
(such as transaction costs and management fees) that reduce returns, while the
total returns of the index do not.


- ------
3


International Bond

Growth of $10,000 Over 10 Years


$10,000 investment made December 31, 1998
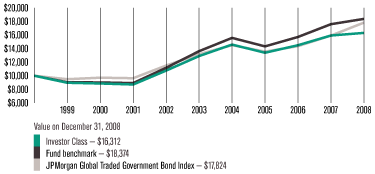
One-Year Returns Over 10 Years
Periods ended December 31
1999 2000 2001 2002 2003 2004 2005 2006 2007 2008
Investor
Class -10.36% -1.20% -1.66% 23.53% 19.91% 13.10% -8.23% 8.25% 9.89% 2.41%
Fund
benchmark -9.61% -0.23% -1.16% 25.26% 21.97% 14.39% -8.04% 9.68% 11.98% 4.43%
JPMorgan
Global
Traded
Government
Bond
Index -5.08% 2.32% -0.80% 19.37% 14.53% 10.11% -6.53% 5.94% 10.81% 12.00%
Data presented reflect past performance. Past performance is no guarantee of
future results. Current performance may be higher or lower than the performance
shown. Investment return and principal value will fluctuate, and redemption
value may be more or less than original cost. To obtain performance data current
to the most recent month end, please call 1-800-345-2021 or visit
americancentury.com. As interest rates rise, bond values will decline.
International investing involves special risks, such as political instability
and currency fluctuations.
Unless otherwise indicated, performance reflects Investor Class shares;
performance for other share classes will vary due to differences in fee
structure. For information about other share classes available, please consult
the prospectus. Data assumes reinvestment of dividends and capital gains, and
none of the charts reflect the deduction of taxes that a shareholder would pay
on fund distributions or the redemption of fund shares. Returns for the index
are provided for comparison. The fund's total returns include operating expenses
(such as transaction costs and management fees) that reduce returns, while the
total returns of the index do not.
- ------
4
PORTFOLIO COMMENTARY
International Bond
Portfolio Manager: Jon Jonsson, J.P. Morgan Investment Management, Inc.
PERFORMANCE SUMMARY
International Bond returned -1.72%* for the six months ended December 31, 2008.
By comparison, the JPMorgan Global Traded Government Bond Index (JPM GTGBI)
returned 6.91%, while the fund's benchmark--the JPM GTGBI with the U.S. excluded
and Japan weighted at 15%--returned -1.06%.
The robust positive return of the JPM GTGBI reflected the generally positive
environment for government bonds worldwide. The fund and its benchmark, however,
posted a modestly negative return as the U.S. dollar strengthened, particularly
against the euro and British pound, weakening returns on European government
bonds. The smaller Japanese weighting than in the JPM GTGBI also weighed on
results as the dollar declined versus the Japanese yen, boosting returns on
Japanese securities.
On a relative basis, the fund slightly underperformed its custom benchmark for
the six-month period. While the fund's duration and currency positioning
contributed positively to relative results, our yield curve positioning and a
meaningful weighting in non-government bond holdings led to the overall
underperformance of the benchmark.
PORTFOLIO STRATEGY AND POSITIONING
We maintained a longer duration (greater interest rate sensitivity) than the
benchmark during the six-month period, reflecting our expectation that weaker
global economic conditions would eventually force central banks to reduce
interest rates. This in fact came to pass, so our longer duration added value to
performance as bond yields declined.
The portfolio was also positioned to benefit from a steeper yield curve--that
is, a wider gap between short- and long-term government bond yields. This
strategy paid off in the third quarter of 2008 but detracted from results in the
fourth quarter of the year as the yield curve flattened. Given expectations of
further curve flattening as central banks inject more capital into the financial
system, we reduced our bias toward a steeper yield curve near the end of the
period.
Our position in non-government bonds, which comprised more than a quarter of the
portfolio throughout the six-month period, hurt performance compared with the
benchmark. Non-government bonds underperformed as stress and illiquidity in the
credit markets weighed on this segment of the bond market.
Portfolio at a Glance
As of As of
12/31/08 6/30/08
Weighted Average Maturity 10.0 years 9.0 years
Average Duration
(Modified) 7.1 years 6.7 years
Types of Investments in Portfolio
% of net % of net
assets as assets as
of of
12/31/08 6/30/08
Government Bonds 69.2% 70.9%
Credit 26.0% 26.3%
Short-Term Investments 0.6% 0.5%
Temporary Cash Investments 3.3% 2.6%
Other Assets and
Liabilities 0.9% (0.3)%
*All fund returns referenced in this commentary are for Investor Class shares.
Total returns for periods less than one year are not annualized.
- ------
5
International Bond
Our currency positioning contributed positively to relative results during the
period. The portfolio was consistently overweight the Japanese yen, which
rallied sharply versus both the U.S. dollar and the euro for the six-month
period. We were also short the euro, which was generally positive for
performance, though the euro's rebound late in the period--as the rest of the
world took more aggressive steps to cut interest rates--hurt results.
OUTLOOK
A severe global recession is under way, and we are at the point where
unemployment and defaults are likely to accelerate. However, aggressively low
central bank rates, government capital infusions into the financial system, and
a significant revaluation in asset prices should all stimulate better liquidity
in the markets.
In Europe, we believe that weaker economic data and declining inflation will
convince the European Central Bank that lower interest rates are required,
leading to lower bond yields and further declines in the euro. Despite nearly
record-low interest rates in the U.K., economic indicators point toward an
extended recession, which we think will result in additional interest rate cuts
from the Bank of England. Meanwhile, we expect the Japanese yen to continue to
benefit as a safe haven from financial market volatility.
UNDER NEW MANAGEMENT
As part of American Century Investments' ongoing effort to add long-term value
for fund shareholders, the fund's investment advisor will be ending its
subadvisory relationship with J.P. Morgan Investment Management effective
January 30, 2009, and bringing the management of the International Bond fund
in-house under the leadership of a new portfolio management team. Portfolio
managers John Lovito and Federico Garcia Zamora have extensive experience in the
global fixed-income markets and a proven track record of outperformance managing
a similar strategy.
While the fund's investment objectives will remain the same, the new managers
intend to enhance the existing management approach through greater
diversification, a focus on relative value, and improved risk management.
Bond Holdings by Country
% of net % of net
assets as of assets as of
12/31/08 6/30/08
Japan 15.0% 13.4%
Germany* 15.0% 13.5%
United Kingdom 9.5% 19.5%
Spain* 8.7% 8.5%
Italy* 7.5% 6.6%
France* 6.6% 8.7%
Finland* 4.9% 1.4%
Canada 4.9% 3.8%
Belgium* 4.8% 4.7%
Multi-National 4.2% 3.8%
Denmark 4.2% 4.3%
Netherlands* 4.1% 4.4%
Sweden 3.6% 2.7%
Ireland* 2.3% 2.1%
Australia 0.5% 0.3%
Cash and Equivalents** 4.2% 2.3%
* These countries are members of the euro-zone.
** Includes temporary cash investments and other assets and liabilities.
- ------
6
SHAREHOLDER FEE EXAMPLE (UNAUDITED)
Fund shareholders may incur two types of costs: (1) transaction costs, including
sales charges (loads) on purchase payments and redemption/exchange fees; and (2)
ongoing costs, including management fees; distribution and service (12b-1) fees;
and other fund expenses. This example is intended to help you understand your
ongoing costs (in dollars) of investing in your fund and to compare these costs
with the ongoing cost of investing in other mutual funds.
The example is based on an investment of $1,000 made at the beginning of the
period and held for the entire period from July 1, 2008 to December 31, 2008.
ACTUAL EXPENSES
The table provides information about actual account values and actual expenses
for each class. You may use the information, together with the amount you
invested, to estimate the expenses that you paid over the period. First,
identify the share class you own. Then simply divide your account value by
$1,000 (for example, an $8,600 account value divided by $1,000 = 8.6), then
multiply the result by the number under the heading "Expenses Paid During
Period" to estimate the expenses you paid on your account during this period.
If you hold Investor Class shares of any American Century Investments fund, or
Institutional Class shares of the American Century Diversified Bond Fund, in an
American Century Investments account (i.e., not a financial intermediary or
retirement plan account), American Century Investments may charge you a $12.50
semiannual account maintenance fee if the value of those shares is less than
$10,000. We will redeem shares automatically in one of your accounts to pay the
$12.50 fee. In determining your total eligible investment amount, we will
include your investments in all PERSONAL ACCOUNTS (including American Century
Investments Brokerage accounts) registered under your Social Security number.
PERSONAL ACCOUNTS include individual accounts, joint accounts, UGMA/UTMA
accounts, personal trusts, Coverdell Education Savings Accounts and IRAs
(including traditional, Roth, Rollover, SEP-, SARSEP- and SIMPLE-IRAs), and
certain other retirement accounts. If you have only business, business
retirement, employer-sponsored or American Century Investments Brokerage
accounts, you are currently not subject to this fee. We will not charge the fee
as long as you choose to manage your accounts exclusively online. If you are
subject to the Account Maintenance Fee, your account value could be reduced by
the fee amount.
HYPOTHETICAL EXAMPLE FOR COMPARISON PURPOSES
The table also provides information about hypothetical account values and
hypothetical expenses based on the actual expense ratio of each class of your
fund and an assumed rate of return of 5% per year before expenses, which is not
the actual return of a fund's share class. The hypothetical account values and
expenses may not be used to estimate the actual ending account balance or
expenses you paid for the period. You may use this information to compare the
ongoing costs of investing in your fund and other funds. To do so, compare this
5% hypothetical example with the 5% hypothetical examples that appear in the
shareholder reports of the other funds.
Please note that the expenses shown in the table are meant to highlight your
ongoing costs only and do not reflect any transactional costs, such as sales
charges (loads) or redemption/exchange fees. Therefore, the table is useful in
comparing ongoing costs only, and will not help you determine the relative total
costs of owning different funds. In addition, if these transactional costs were
included, your costs would have been higher.
- ------
7
Beginning Ending Expenses Paid
Account Account During Period* Annualized
Value Value 7/1/08 - Expense
7/1/08 12/31/08 12/31/08 Ratio*
ACTUAL
Investor Class $1,000 $982.80 $4.10 0.82%
Institutional Class $1,000 $983.90 $3.10 0.62%
A Class $1,000 $981.70 $5.34 1.07%
B Class $1,000 $978.00 $9.07 1.82%
C Class $1,000 $978.00 $9.07 1.82%
R Class $1,000 $980.10 $6.59 1.32%
HYPOTHETICAL
Investor Class $1,000 $1,021.07 $4.18 0.82%
Institutional Class $1,000 $1,022.08 $3.16 0.62%
A Class $1,000 $1,019.81 $5.45 1.07%
B Class $1,000 $1,016.03 $9.25 1.82%
C Class $1,000 $1,016.03 $9.25 1.82%
R Class $1,000 $1,018.55 $6.72 1.32%
* Expenses are equal to the class's annualized expense ratio listed in the table
above, multiplied by the average account value over the period, multiplied by
184, the number of days in the most recent fiscal half-year, divided by 365, to
reflect the one-half year period.
- ------
8
SCHEDULE OF INVESTMENTS
International Bond
DECEMBER 31, 2008 (UNAUDITED)
Principal Amount Value
Government Bonds -- 69.2%
BELGIUM -- 4.8%
EUR 6,350,000 Kingdom of Belgium, 8.00%,
3/28/15 $ 10,990,791
EUR 52,000,000 Kingdom of Belgium, 4.00%,
3/28/18 73,464,566
--------------
84,455,357
--------------
CANADA -- 3.3%
CAD 22,000,000 Government of Canada, 3.75%,
6/1/12(1) 19,139,733
CAD 28,500,000 Government of Canada, 5.00%,
6/1/14(1) 26,716,586
CAD 11,301,000 Government of Canada, 5.75%,
6/1/33(1) 12,458,654
--------------
58,314,973
--------------
DENMARK -- 4.2%
DKK 197,000,000 Kingdom of Denmark, 6.00%,
11/15/09 37,711,428
DKK 180,000,000 Kingdom of Denmark, 5.00%,
11/15/13(1) 36,493,713
--------------
74,205,141
--------------
FINLAND -- 4.9%
EUR 60,000,000 Government of Finland, 4.25%,
9/15/12 87,132,032
--------------
FRANCE -- 4.4%
EUR 17,900,000 Government of France, 5.50%,
4/25/29 30,251,881
EUR 10,700,000 Government of France, 5.75%,
10/25/32(1) 18,961,407
EUR 18,180,000 Government of France, 4.75%,
4/25/35 29,146,383
--------------
78,359,671
--------------
GERMANY -- 7.4%
EUR 56,500,000 German Federal Republic,
3.50%, 1/4/16(1) 82,348,795
EUR 19,340,000 German Federal Republic,
5.625%, 1/4/28 33,483,321
EUR 9,380,000 German Federal Republic,
4.75%, 7/4/34 15,064,657
--------------
130,896,773
--------------
ITALY -- 7.5%
EUR 44,550,000 Republic of Italy, 5.25%,
8/1/17(1) 66,223,576
EUR 32,070,000 Republic of Italy, 5.00%,
8/1/34(1) 44,136,012
EUR 20,100,000 Republic of Italy, 4.00%,
2/1/37(1) 23,744,199
--------------
134,103,787
--------------
Principal Amount Value
JAPAN -- 14.2%
JPY 6,670,000,000 Government of Japan, 1.20%,
3/20/12(1) $ 75,127,525
JPY 7,186,400,000 Government of Japan, 1.30%,
3/20/15(1) 81,861,380
JPY 1,918,000,000 Government of Japan, 1.70%,
12/20/16(1) 22,550,306
JPY 1,580,000,000 Government of Japan, 1.80%,
6/20/18(1) 18,552,355
JPY 2,950,000,000 Government of Japan, 1.50%,
9/20/18 33,665,276
JPY 1,701,000,000 Government of Japan, 2.10%,
12/20/26(1) 19,799,302
--------------
251,556,144
--------------
NETHERLANDS -- 4.1%
EUR 27,000,000 Kingdom of Netherlands, 4.25%,
7/15/13 39,636,784
EUR 22,450,000 Kingdom of Netherlands, 4.00%,
1/15/37 32,572,630
--------------
72,209,414
--------------
SPAIN -- 4.5%
EUR 54,550,000 Government of Spain, 5.40%,
7/30/11(1) 80,611,698
--------------
SWEDEN -- 3.6%
SEK 100,000,000 Government of Sweden, 5.25%,
3/15/11 13,667,246
SEK 352,860,000 Government of Sweden, 5.50%,
10/8/12 50,587,317
--------------
64,254,563
--------------
UNITED KINGDOM -- 6.3%
GBP 33,000,000 Government of United Kingdom,
5.00%, 3/7/12 51,402,726
GBP 3,100,000 Government of United Kingdom,
8.00%, 6/7/21 6,514,566
GBP 5,850,000 Government of United Kingdom,
4.25%, 6/7/32(1) 8,850,859
GBP 27,700,000 Government of United Kingdom,
4.50%, 12/7/42 45,351,288
--------------
112,119,439
--------------
TOTAL GOVERNMENT BONDS
(Cost $1,201,498,506) 1,228,218,992
--------------
- ------
9
International Bond
Principal Amount Value
Credit -- 26.0%
AUSTRALIA -- 0.5%
AUD 12,100,000 New South Wales Treasury
Corp., 5.50%, 3/1/17 $ 8,806,078
--------------
CANADA -- 1.6%
EUR 20,000,000 Royal Bank of Canada, MTN,
4.50%, 11/5/12 28,264,582
--------------
FRANCE -- 1.6%
JPY 2,750,000,000 Compagnie de Financement
Foncier, MTN, 1.25%, 12/1/11 29,320,157
--------------
GERMANY -- 7.6%
EUR 44,300,000 Eurohypo AG, (Covered Bond),
3.75%, 4/11/11 62,129,672
GBP 21,900,000 KfW, MTN, 5.50%, 9/15/09 32,391,118
JPY 1,100,000,000 KfW, 2.60%, 6/20/37 12,461,040
EUR 19,000,000 Landesbank Baden-Wurttemberg,
MTN, 4.50%, 10/5/12 27,486,457
--------------
134,468,287
--------------
IRELAND -- 2.3%
EUR 19,800,000 AIB Mortgage Bank, MTN, 3.50%,
4/30/09 27,527,146
EUR 10,000,000 Ulster Bank Finance plc, MTN,
VRN, 3.11%, 3/30/09, resets
quarterly off the 3-month
Euribor plus 0.09% with no caps 13,788,559
--------------
41,315,705
--------------
JAPAN -- 0.8%
JPY 1,280,000,000 Development Bank of Japan,
2.30%, 3/19/26 14,551,658
--------------
MULTI-NATIONAL -- 4.2%
GBP 10,550,000 European Investment Bank, MTN,
4.75%, 6/6/12 15,982,480
EUR 39,000,000 European Investment Bank,
5.375%, 10/15/12 58,602,793
--------------
74,585,273
--------------
SPAIN -- 4.2%
EUR 43,400,000 AYT Cedulas Cajas VII, 4.00%,
6/23/11 59,089,995
EUR 1,818,817 FTA Santander Auto, VRN, 4.08%, 2/25/09, resets
quarterly off the 3-month Euribor plus 0.06% with no
caps(1) 2,461,452
Principal Amount Value
EUR 12,491,743 UCI, VRN, 3.34%, 3/18/09,
resets quarterly off the
3-month Euribor plus 0.14%
with no caps(1) $ 12,713,751
--------------
74,265,198
--------------
UNITED KINGDOM -- 3.2%
EUR 10,000,000 Barclays Bank plc, MTN, VRN,
5.27%, 1/20/09, resets
quarterly off the 3-month
Euribor plus 0.18% with no caps 11,276,475
GBP 12,550,000 Network Rail Infrastructure
Finance plc, MTN, 4.75%,
11/29/35 19,646,410
EUR 20,000,000 Royal Bank of Scotland Group
plc, MTN, 3.25%, 1/25/13 26,027,435
--------------
56,950,320
--------------
TOTAL CREDIT
(Cost $462,628,034) 462,527,258
--------------
Short-Term Investments -- 0.6%
FRANCE -- 0.6%
EUR 8,215,000 Government of France Treasury
Bill, 2.17%, 5/20/09(2)
(Cost $10,364,108) 11,343,893
--------------
Shares
Temporary Cash Investments -- 3.3%
58 JPMorgan U.S. Treasury Plus
Money Market Fund Agency
Shares(1) 58
Repurchase Agreement, Goldman Sachs Group, Inc.
(The), (collateralized by various U.S. Treasury
obligations, 8.125%, 8/15/19, valued at
$58,868,262), in a joint trading account at 0.005%,
dated 12/31/08, due 1/2/09 (Delivery value
$57,762,016) 57,762,000
--------------
TOTAL TEMPORARY CASH INVESTMENTS
(Cost $57,762,058) 57,762,058
--------------
TOTAL INVESTMENT SECURITIES -- 99.1%
(Cost $1,732,252,706) 1,759,852,201
--------------
OTHER ASSETS AND LIABILITIES -- 0.9% 15,475,382
--------------
TOTAL NET ASSETS -- 100.0% $1,775,327,583
==============
- ------
10
International Bond
Futures Contracts
Underlying
Face Unrealized
Expiration Amount Gain
Contracts Purchased Date at Value (Loss)
87 Canada 10-year 6% Bond March 2009 $ $ 284,504
Future 8,933,269
767 Euro-Bund 10-year 6% March 2009 133,100,457 711,122
Future
2,589 Euro-Schatz 2-year 6% March 2009
Future 386,767,277 2,484,548
5 Japan 10-year 6% Bond March 2009 7,728,627 58,844
Future
174 U.K. Treasury 10-year 6% March 2009 30,888,305
Future 2,047,648
----------------------
$567,417,935$5,586,666
======================
Underlying
Face Unrealized
Expiration Amount at Gain
Contracts Sold Date Value (Loss)
219 Euro-Bobl 5-year 6% Bond March 2009 $35,376,759 $1,386
Future
======================
Forward Foreign Currency Exchange Contracts
Settlement Unrealized
Contracts to Sell Date Value Gain (Loss)
250,307,128 JPY for AUD 1/13/09 $ 2,761,712 $ (71,191)
806,757,262 JPY for AUD 1/13/09 8,901,190 94,198
5,170,013 EUR for CAD 1/13/09 7,183,957 114,784
314,283,757 JPY for CAD 1/13/09 3,467,585 (81,396)
5,138,683 AUD for EUR 1/13/09 3,579,401 (185,197)
10,855,955 CAD for EUR 1/13/09 8,792,668 (159,728)
17,558,152 CHF for EUR 1/13/09 16,497,836 (1,952,988)
2,282,836 GBP for EUR 1/13/09 3,281,418 112,787
11,302,047 GBP for EUR 1/13/09 16,245,901 734,880
480,839,555 JPY for EUR 1/13/09 5,305,244 (125,480)
18,906,318 NOK for EUR 1/13/09 2,698,390 86,906
64,152,411 NOK for EUR 1/13/09 9,156,103 148,321
173,978,042 SEK for EUR 1/13/09 21,996,912 612,159
26,630,433 SEK for GBP 1/13/09 3,367,019 43,354
28,279,879 SEK for GBP 1/13/09 3,575,566 (146,684)
10,573,467 CHF for JPY 1/13/09 9,934,948 (1,157,301)
2,837,890 GBP for JPY 1/13/09 4,079,269 308,552
8,963,157 AUD for NOK 1/13/09 6,243,377 (343,409)
3,356,037 CHF for NOK 1/13/09 3,153,370 (346,479)
3,490,702 CHF for NOK 1/13/09 3,279,903 (383,606)
82,807,169 NOK for SEK 1/13/09 11,818,589 291,791
4,258,420 CAD for USD 1/13/09 3,449,063 (61,929)
25,772,127 CAD for USD 1/13/09 20,873,867 (456,225)
4,297,713 CHF for USD 1/13/09 4,038,179 (482,413)
6,103,974 CHF for USD 1/13/09 5,735,362 (671,715)
280,252,921 DKK for USD 1/13/09 52,303,134 (4,970,950)
1,550,929 EUR for USD 1/13/09 2,155,083 9,117
5,239,388 EUR for USD 1/13/09 7,280,357 (548,686)
1,477,520 GBP for USD 1/13/09 2,123,831 58,155
3,930,688 GBP for USD 1/13/09 5,650,090 130,294
294,855,320 JPY for USD 1/13/09 3,253,225 79,727
760,000,000 JPY for USD 1/13/09 8,385,303 (173,703)
1,640,809,055 JPY for USD 1/13/09 18,103,529 (419,043)
- ------
11
International Bond
Settlement Unrealized
Contracts to Sell Date Value Gain (Loss)
13,806,616 NOK for USD 1/13/09 $ 1,970,539 $ 85,902
16,571,617 NOK for USD 1/13/09 2,365,171 20,146
18,780,966 NOK for USD 1/13/09 2,680,499 4,740
365,720,768 SEK for USD 1/13/09 46,239,903 (2,545,666)
------------- -------------
$341,927,493 $(12,347,976)
============= =============
(Value on Settlement Date $329,579,517)
Unrealized
Contracts to Buy Settlement Date Value Gain (Loss)
AUD for
4,192,475 JPY 1/13/09 $ 2,920,311 $ 229,790
AUD for
13,151,793 JPY 1/13/09 9,161,013 165,625
CAD for
8,820,601 EUR 1/13/09 7,144,154 (154,587)
CAD for
4,243,064 JPY 1/13/09 3,436,626 50,437
EUR for
2,608,565 AUD 1/13/09 3,624,715 230,510
EUR for
6,678,327 CAD 1/13/09 9,279,825 646,885
EUR for
11,264,685 CHF 1/13/09 15,652,768 1,107,919
EUR for
2,608,565 GBP 1/13/09 3,624,715 230,510
EUR for
13,370,694 GBP 1/13/09 18,579,159 1,598,377
EUR for
4,006,996 JPY 1/13/09 5,567,895 388,131
EUR for
2,033,552 NOK 1/13/09 2,825,709 40,413
EUR for
6,984,027 NOK 1/13/09 9,704,609 400,185
EUR for
15,725,862 SEK 1/13/09 21,851,767 (757,305)
GBP for
2,201,590 SEK 1/13/09 3,164,632 (245,741)
GBP for
2,328,138 SEK 1/13/09 3,346,536 (82,346)
JPY for
807,897,463 CHF 1/13/09 8,913,770 136,123
JPY for
389,444,242 GBP 1/13/09 4,296,853 (90,968)
NOK for
41,670,613 AUD 1/13/09 5,947,406 47,439
NOK for
19,815,847 CHF 1/13/09 2,828,201 21,310
NOK for
20,617,568 CHF 1/13/09 2,942,627 46,330
SEK for
93,788,394 NOK 1/13/09 11,858,135 (252,245)
AUD for
17,164,543 USD 1/13/09 11,956,134 932,344
CAD for
3,650,937 USD 1/13/09 2,957,039 59,469
CAD for
4,441,000 USD 1/13/09 3,596,942 (106,339)
CHF for
45,557,483 USD 1/13/09 42,806,321 5,332,042
EUR for
16,000,000 USD 1/13/09 22,232,693 1,897,142
EUR for
2,918,639 USD 1/13/09 4,055,575 369,334
EUR for
7,649,798 USD 1/13/09 10,629,726 996,741
EUR for
9,000,000 USD 1/13/09 12,505,890 829,290
GBP for
1,700,000 USD 1/13/09 2,443,631 (68,680)
GBP for
2,000,000 USD 1/13/09 2,874,860 (367,154)
GBP for
32,561,790 USD 1/13/09 46,805,294 (580,739)
JPY for
1,690,000,000 USD 1/13/09 18,646,267 4,430
NOK for
453,805,179 USD 1/13/09 64,768,993 1,766,747
--------------------------
$402,950,791 $14,821,419
==========================
(Value on Settlement Date $388,129,372)
- ------
12
International Bond
Notes to Schedule of Investments
AUD = Australian Dollar
CAD = Canadian Dollar
CHF = Swiss Franc
DKK = Danish Krone
EUR = Euro
Euribor = Euro Interbank Offered Rate
GBP = British Pound
JPY = Japanese Yen
MTN = Medium Term Note
NOK = Norwegian Krona
resets = The frequency with which a security's coupon changes, based on current
market conditions or an underlying index. The more frequently a security resets,
the less risk the investor is taking that the coupon will vary significantly
from current market rates.
SEK = Swedish Krona
USD = United States Dollar
VRN = Variable Rate Note. Interest reset date is indicated. Rate shown is
effective December 31, 2008.
(1) Security, or a portion thereof, has been segregated for futures contracts.
At the period end, the aggregate value of securities pledged was $602,795,000.
(2) The rate indicated is the yield to maturity at purchase.
See Notes to Financial Statements.
- ------
13
STATEMENT OF ASSETS AND LIABILITIES
DECEMBER 31, 2008 (UNAUDITED)
ASSETS
Investment securities, at value (cost of
$1,732,252,706) $1,759,852,201
Foreign currency holdings, at value (cost of
$3,011,033) 2,988,847
Receivable for forward foreign currency exchange
contracts 20,463,336
Receivable for capital shares sold 2,173,608
Receivable for investments sold 99,756
Receivable for variation margin on futures contracts 138,121
Interest receivable 27,144,994
--------------
1,812,860,863
--------------
LIABILITIES
Disbursements in excess of demand deposit cash 29,146
Payable for investments purchased 101,436
Payable for forward foreign currency exchange
contracts 17,989,893
Payable for capital shares redeemed 18,209,786
Accrued management fees 1,180,067
Distribution fees payable 1,325
Service fees (and distribution fees -- A Class and R
Class) payable 21,627
--------------
37,533,280
--------------
NET ASSETS $1,775,327,583
==============
See Notes to Financial Statements.
- ------
14
DECEMBER 31, 2008 (UNAUDITED)
NET ASSETS CONSIST OF:
Capital paid in $1,728,117,498
Undistributed net investment income 13,516,334
Accumulated net realized loss on investment and
foreign currency transactions (1,262,623)
Net unrealized appreciation on investments and
translation of assets and liabilities in foreign
currencies 34,956,374
--------------
$1,775,327,583
==============
INVESTOR CLASS
Net assets $1,481,414,346
Shares outstanding 104,969,894
Net asset value per share $14.11
INSTITUTIONAL CLASS
Net assets $191,565,916
Shares outstanding 13,580,903
Net asset value per share $14.11
A CLASS
Net assets $99,873,718
Shares outstanding 7,094,406
Net asset value per share $14.08
Maximum offering price (net asset value divided by
0.955) $14.74
B CLASS
Net assets $195,954
Shares outstanding 13,860
Net asset value per share $14.14
C CLASS
Net assets $2,218,403
Shares outstanding 156,926
Net asset value per share $14.14
R CLASS
Net assets $59,246
Shares outstanding 4,196
Net asset value per share $14.12
See Notes to Financial Statements.
- ------
15
STATEMENT OF OPERATIONS
FOR THE SIX MONTHS ENDED DECEMBER 31, 2008 (UNAUDITED)
INVESTMENT INCOME (LOSS)
INCOME:
Interest (net of foreign taxes withheld of $268,480) $ 39,966,265
-------------
EXPENSES:
Management fees 7,822,042
Distribution fees:
B Class 881
C Class 5,883
Service fees:
B Class 294
C Class 1,961
A Class 143,095
R Class 88
Trustees' fees and expenses 73,405
Other expenses 1,869
-------------
8,049,518
-------------
NET INVESTMENT INCOME (LOSS) 31,916,747
-------------
REALIZED AND UNREALIZED GAIN (LOSS)
NET REALIZED GAIN (LOSS) ON:
Investment transactions (5,886,024)
Futures transactions 26,481,803
Foreign currency transactions (21,295,831)
-------------
(700,052)
-------------
CHANGE IN NET UNREALIZED APPRECIATION (DEPRECIATION)
ON:
Investments 128,204,761
Futures 12,003,186
Translation of assets and liabilities in foreign
currencies (233,347,324)
-------------
(93,139,377)
-------------
NET REALIZED AND UNREALIZED GAIN (LOSS) (93,839,429)
-------------
NET INCREASE (DECREASE) IN NET ASSETS RESULTING FROM
OPERATIONS $(61,922,682)
=============
See Notes to Financial Statements.
- ------
16
STATEMENT OF CHANGES IN NET ASSETS
SIX MONTHS ENDED DECEMBER 31, 2008 (UNAUDITED) AND YEAR ENDED JUNE
30, 2008
December 31, June 30,
Increase (Decrease) in Net Assets 2008 2008
OPERATIONS
Net investment income (loss) $ 31,916,747 $ 59,286,588
Net realized gain (loss) (700,052) 91,922,479
Change in net unrealized appreciation
(depreciation) (93,139,377) 100,361,094
----------------------------
Net increase (decrease) in net assets
resulting from operations (61,922,682) 251,570,161
----------------------------
DISTRIBUTIONS TO SHAREHOLDERS
From net investment income:
Investor Class (60,872,114) (66,007,588)
Institutional Class (10,199,244) (6,253,078)
A Class (3,968,570) (3,465,855)
B Class (6,286) (1,894)
C Class (42,029) (9,293)
R Class (1,257) (738)
From net realized gains:
Investor Class (22,068,352) --
Institutional Class (3,027,689) --
A Class (1,504,198) --
B Class (3,188) --
C Class (26,835) --
R Class (651) --
----------------------------
Decrease in net assets from
distributions (101,720,413) (75,738,446)
----------------------------
CAPITAL SHARE TRANSACTIONS
Net increase (decrease) in net assets
from capital share transactions (249,135,891) 389,376,027
----------------------------
NET INCREASE (DECREASE) IN NET ASSETS (412,778,986) 565,207,742
NET ASSETS
Beginning of period 2,188,106,569 1,622,898,827
----------------------------
End of period $1,775,327,583$2,188,106,569
============================
Undistributed net investment income $13,516,334 $56,689,087
============================
See Notes to Financial Statements.
- ------
17
NOTES TO FINANCIAL STATEMENTS
DECEMBER 31, 2008 (UNAUDITED)
1. ORGANIZATION AND SUMMARY OF SIGNIFICANT ACCOUNTING POLICIES
ORGANIZATION -- American Century International Bond Funds (the trust) is
registered under the Investment Company Act of 1940 (the 1940 Act) as an
open-end management investment company. International Bond Fund (the fund) is
the sole fund issued by the trust. The fund is nondiversified under the 1940
Act. The fund's investment objective is to seek high total return. The fund
pursues its objective by investing in high-quality, non-dollar-denominated
government and corporate debt securities issued outside the United States. The
following is a summary of the fund's significant accounting policies.
MULTIPLE CLASS -- The fund is authorized to issue the Investor Class, the
Institutional Class, the A Class, the B Class, the C Class and the R Class. The
A Class may incur an initial sales charge. The A Class, B Class and C Class may
be subject to a contingent deferred sales charge. The share classes differ
principally in their respective sales charges and distribution and shareholder
servicing expenses and arrangements. All shares of the fund represent an equal
pro rata interest in the net assets of the class to which such shares belong,
and have identical voting, dividend, liquidation and other rights and the same
terms and conditions, except for class specific expenses and exclusive rights to
vote on matters affecting only individual classes. Income, non-class specific
expenses, and realized and unrealized capital gains and losses of the fund are
allocated to each class of shares based on their relative net assets. Sale of
the B Class, C Class and R Class commenced on September 28, 2007.
SECURITY VALUATIONS -- Securities are valued through a commercial pricing
service or at the mean of the most recent bid and asked prices. Debt securities
maturing in greater than 60 days at the time of purchase are valued at current
market value as provided by a commercial pricing service or at the mean of the
most recent bid and asked prices. Debt securities maturing within 60 days at the
time of purchase may be valued at cost, plus or minus any amortized discount or
premium. Discount notes may be valued through a commercial pricing service or at
amortized cost, which approximates fair value. Securities traded on foreign
securities exchanges and over-the-counter markets are normally completed before
the close of business on days that the New York Stock Exchange (the Exchange) is
open and may also take place on days when the Exchange is not open. If an event
occurs after the value of a security was established but before the net asset
value per share was determined that was likely to materially change the net
asset value, that security would be valued as determined in accordance with
procedures adopted by the Board of Trustees. If the fund determines that the
market price of a portfolio security is not readily available, or that the
valuation methods mentioned above do not reflect the security's fair value, such
security is valued as determined by the Board of Trustees or its designee, in
accordance with procedures adopted by the Board of Trustees, if such
determination would materially impact a fund's net asset value. Certain other
circumstances may cause the fund to use alternative procedures to value a
security such as: a security has been declared in default; trading in a security
has been halted during the trading day; or there is a foreign market holiday and
no trading will commence.
SECURITY TRANSACTIONS -- For financial reporting purposes, security transactions
are accounted for as of the trade date. Net realized gains and losses are
determined on the identified cost basis, which is also used for federal income
tax purposes.
INVESTMENT INCOME -- Interest income less foreign taxes withheld, if any, is
recorded on the accrual basis and includes accretion of discounts and
amortization of premiums.
FUTURES CONTRACTS -- The fund may enter into futures contracts in order to
manage the fund's exposure to changes in market conditions. One of the risks of
entering into futures contracts is the possibility that the change in value of
the contract may not correlate with the changes in value of the underlying
securities. Upon entering into a futures contract, the fund is required to
deposit either cash or securities in an amount equal to a certain percentage of
the contract value (initial margin). Subsequent payments (variation margin) are
made or received daily, in cash, by the fund. The variation margin is equal to
the daily change in the contract value and is recorded as unrealized gains and
losses. The fund recognizes a realized gain or loss when the contract is closed
or expires. Net realized and unrealized gains or losses occurring during the
holding period of futures contracts are a component of realized gain (loss) on
futures transactions and unrealized appreciation (depreciation) on futures,
respectively.
- ------
18
FOREIGN CURRENCY TRANSACTIONS -- All assets and liabilities initially expressed
in foreign currencies are translated into U.S. dollars at prevailing exchange
rates at period end. Purchases and sales of investment securities, dividend and
interest income, and certain expenses are translated at the rates of exchange
prevailing on the respective dates of such transactions. Realized and unrealized
gains and losses from foreign currency translations arise from changes in
currency exchange rates.
Net realized and unrealized foreign currency exchange gains or losses occurring
during the holding period of investment securities are a component of realized
gain (loss) on foreign currency transactions and unrealized appreciation
(depreciation) on translation of assets and liabilities in foreign currencies,
respectively. Certain countries may impose taxes on the contract amount of
purchases and sales of foreign currency contracts in their currency. The fund
records the foreign tax expense, if any, as a reduction to the net realized gain
(loss) on foreign currency transactions.
FORWARD FOREIGN CURRENCY EXCHANGE CONTRACTS -- The fund may enter into forward
foreign currency exchange contracts to facilitate transactions of securities
denominated in a foreign currency or to hedge the fund's exposure to foreign
currency exchange rate fluctuations. The net U.S. dollar value of foreign
currency underlying all contractual commitments held by the fund and the
resulting unrealized appreciation or depreciation are determined daily using
prevailing exchange rates. The fund bears the risk of an unfavorable change in
the foreign currency exchange rate underlying the forward contract.
Additionally, losses may arise if the counterparties do not perform under the
contract terms.
REPURCHASE AGREEMENTS -- The fund may enter into repurchase agreements with
institutions that American Century Investment Management, Inc. (ACIM) (the
investment advisor) has determined are creditworthy pursuant to criteria adopted
by the Board of Trustees. Each repurchase agreement is recorded at cost. The
fund requires that the collateral, represented by securities, received in a
repurchase transaction be transferred to the custodian in a manner sufficient to
enable the fund to obtain those securities in the event of a default under the
repurchase agreement. ACIM monitors, on a daily basis, the securities
transferred to ensure the value, including accrued interest, of the securities
under each repurchase agreement is equal to or greater than amounts owed to the
fund under each repurchase agreement.
JOINT TRADING ACCOUNT -- Pursuant to an Exemptive Order issued by the Securities
and Exchange Commission, the fund, along with certain other funds in the
American Century Investments family of funds, may transfer uninvested cash
balances into a joint trading account. These balances are invested in one or
more repurchase agreements that are collateralized by U.S. Treasury or Agency
obligations.
INCOME TAX STATUS -- It is the fund's policy to distribute substantially all net
investment income and net realized gains to shareholders and to otherwise
qualify as a regulated investment company under provisions of the Internal
Revenue Code. The fund is no longer subject to examination by tax authorities
for years prior to 2005. At this time, management believes there are no
uncertain tax positions which, based on their technical merit, would not be
sustained upon examination and for which it is reasonably possible that the
total amounts of unrecognized tax benefits will significantly change in the next
twelve months. Accordingly, no provision has been made for federal or state
income taxes. Interest and penalties associated with any federal or state income
tax obligations, if any, are recorded as interest expense.
DISTRIBUTIONS TO SHAREHOLDERS -- Distributions to shareholders are recorded on
the ex-dividend date. Distributions from net investment income, if any, are
generally declared and paid quarterly, but may be paid less frequently.
Distributions from net realized gains, if any, are generally declared and paid
annually.
INDEMNIFICATIONS -- Under the trust's organizational documents, its officers and
trustees are indemnified against certain liabilities arising out of the
performance of their duties to the fund. In addition, in the normal course of
business, the fund enters into contracts that provide general indemnifications.
The fund's maximum exposure under these arrangements is unknown as this would
involve future claims that may be made against the fund. The risk of material
loss from such claims is considered by management to be remote.
USE OF ESTIMATES -- The financial statements are prepared in conformity with
accounting principles generally accepted in the United States of America, which
may require management to make certain estimates and assumptions at the date of
the financial statements. Actual results could differ from these estimates.
- ------
19
2. FEES AND TRANSACTIONS WITH RELATED PARTIES
MANAGEMENT FEES -- The trust has entered into a Management Agreement with ACIM,
under which ACIM provides the fund with investment advisory and management
services in exchange for a single, unified management fee (the fee) per class.
The Agreement provides that all expenses of the fund, except brokerage
commissions, taxes, interest, fees and expenses of those trustees who are not
considered "interested persons" as defined in the 1940 Act (including counsel
fees) and extraordinary expenses, will be paid by ACIM. The fee is computed and
accrued daily based on the daily net assets of the specific class of shares of
the fund and paid monthly in arrears. The fee consists of (1) an Investment
Category Fee based on the daily net assets of the fund and certain other
accounts managed by the investment advisor that are in the same broad investment
category as the fund and (2) a Complex Fee based on the assets of all the funds
in the American Century Investments family of funds. The rates for the
Investment Category Fee range from 0.4925% to 0.6100% and the rates for the
Complex Fee (Investor Class, A Class, B Class, C Class and R Class) range from
0.2500% to 0.3100%. The Institutional Class is 0.2000% less at each point within
the Complex Fee range. The effective annual management fee for each class of the
fund for the six months ended December 31, 2008 was 0.81% for all classes except
Institutional Class, which was 0.61%.
DISTRIBUTION AND SERVICE FEES -- The Board of Trustees has adopted a separate
Master Distribution and Individual Shareholder Services Plan for each of the A
Class, B Class, C Class and R Class (collectively the plans), pursuant to Rule
12b-1 of the 1940 Act. The plans provide that the A Class will pay American
Century Investment Services, Inc. (ACIS) an annual distribution and service fee
of 0.25%. The plans provide that the B Class and the C Class will each pay ACIS
an annual distribution fee of 0.75% and service fee of 0.25%. The plans provide
that the R Class will pay ACIS an annual distribution and service fee of 0.50%.
The fees are computed and accrued daily based on each class's daily net assets
and paid monthly in arrears. The fees are used to pay financial intermediaries
for distribution and individual shareholder services. Fees incurred under the
plans during the six months ended December 31, 2008, are detailed in the
Statement of Operations.
RELATED PARTIES -- Certain officers and trustees of the trust are also officers
and/or directors of American Century Companies, Inc. (ACC), the parent of the
trust's investment advisor, ACIM, the distributor of the trust, ACIS, and the
trust's transfer agent, American Century Services, LLC.
ACIM has entered into a Subadvisory Agreement with J.P. Morgan Investment
Management, Inc. (JPMIM) (the subadvisor) on behalf of the fund. The subadvisor
makes investment decisions for the fund in accordance with the fund's investment
objectives, policies, and restrictions under the supervision of ACIM and the
Board of Trustees. ACIM pays all costs associated with retaining JPMIM as the
subadvisor of the fund. The fund is eligible to invest in a money market fund
for temporary purposes, which is managed by JPMIM. JPMIM is a wholly owned
subsidiary of JPMorgan Chase & Co. (JPM). JPM is an equity investor in ACC.
Effective September 6, 2008, JPMorgan Chase Bank (JPMCB) is a custodian of the
fund. JPMCB is a wholly owned subsidiary of JPM.
3. INVESTMENT TRANSACTIONS
Purchases and sales of investment securities, excluding short-term investments,
for the six months ended December 31, 2008, were $600,623,074 and $878,296,036,
respectively.
- ------
20
4. CAPITAL SHARE TRANSACTIONS
Transactions in shares of the fund were as follows (unlimited number of shares
authorized):
Six months ended Year ended
December 31, 2008 June 30, 2008(1)
Shares Amount Shares Amount
INVESTOR CLASS
Sold 15,146,482 $ 217,594,310 58,703,188 $ 880,473,144
Issued in
reinvestment
of
distributions 5,338,393 75,453,056 3,769,662 54,589,092
Redeemed (35,197,585) (489,572,658) (48,003,046) (719,473,998)
-----------------------------------------------------
(14,712,710) (196,525,292) 14,469,804) 215,588,238
-----------------------------------------------------
INSTITUTIONAL
CLASS
Sold 5,433,341 79,951,766 11,397,882 170,946,406
Issued in
reinvestment
of
distributions 443,728 6,279,180 119,470 1,730,588
Redeemed (8,811,071) (124,151,645) (2,981,828) (45,027,507)
------------------------------------------------------
(2,934,002) (37,920,699) 8,535,524 127,649,487
------------------------------------------------------
A CLASS
Sold 1,661,584 23,875,535 5,580,843 83,449,898
Issued in
reinvestment
of
distributions 370,978 5,228,461 223,013 3,221,526
Redeemed (3,221,628) (44,606,721) (2,844,388) (42,344,326)
------------------------------------------------------
(1,189,066) (15,502,725) 2,959,468 44,327,098
------------------------------------------------------
B CLASS
Sold 2,357 33,416 20,724 314,737
Issued in
reinvestment
of
distributions 347 4,892 75 1,085
Redeemed (6,017) (82,916) (3,626) (56,152)
------------------------------------------------------
(3,313) (44,608) 17,173 259,670
------------------------------------------------------
C CLASS
Sold 89,628 1,277,814 131,172 2,009,242
Issued in
reinvestment
of
distributions 3,313 46,989 524 7,632
Redeemed (35,517) (500,566) (32,194) (492,185)
------------------------------------------------------
57,424 824,237 99,502 1,524,689
------------------------------------------------------
R CLASS
Sold 2,257 31,909 1,872 27,300
Issued in
reinvestment
of
distributions 135 1,908 51 738
Redeemed (44) (621) (75) (1,193)
------------------------------------------------------
2,348 33,196 1,848 26,845
------------------------------------------------------
Net increase
(decrease) (18,779,319) $(249,135,891) 26,083,319 $389,376,027
======================================================
(1) September 28, 2007 (commencement of sale) through June 30, 2008 for the B
Class, C Class and R Class.
- ------
21
5. FAIR VALUE MEASUREMENTS
The fund's securities valuation process is based on several considerations and
may use multiple inputs to determine the fair value of the positions held by the
fund. In conformity with accounting principles generally accepted in the United
States of America, the inputs used to determine a valuation are classified into
three broad levels as follows:
* Level 1 valuation inputs consist of actual quoted prices based on an active
market;
* Level 2 valuation inputs consist of significant direct or indirect observable
market data; or
* Level 3 valuation inputs consist of significant unobservable inputs such as a
fund's own assumptions.
The level classification is based on the lowest level input that is significant
to the fair valuation measurement. The valuation inputs are not an indication of
the risks associated with investing in these securities or other financial
instruments.
The following is a summary of the valuation inputs used to determine the fair
value of the fund's securities and other financial instruments as of December
31, 2008:
Unrealized
Gain
(Loss)
Value of on Other
Investment Financial
Valuation Inputs Securities Instruments*
Level 1 -- Quoted Prices $ 58 --
Level 2 -- Other Significant Observable
Inputs 1,759,852,143 $8,061,495
Level 3 -- Significant Unobservable Inputs -- --
---------------------------
$1,759,852,201 $8,061,495
============================
*Includes forward foreign currency exchange contracts and futures contracts.
6. BANK LINE OF CREDIT
The fund, along with certain other funds in the American Century Investments
family of funds, had a $500,000,000 unsecured bank line of credit agreement with
Bank of America, N.A. The line expired December 10, 2008, and was not renewed.
The agreement allowed the fund to borrow money for temporary or emergency
purposes to fund shareholder redemptions. Borrowings under the agreement were
subject to interest at the Federal Funds rate plus 0.40%. The fund did not
borrow from the line during the six months ended December 31, 2008.
7. INTERFUND LENDING
The fund, along with certain other funds in the American Century Investments
family of funds, may participate in an interfund lending program, pursuant to an
Exemptive Order issued by the Securities and Exchange Commission (SEC). This
program provides an alternative credit facility allowing the fund to borrow from
or lend to other funds in the American Century Investments family of funds that
permit such transactions. Interfund lending transactions are subject to each
fund's investment policies and borrowing and lending limits. The interfund loan
rate earned/paid on interfund lending transactions is determined daily based on
the average of certain current market rates. Interfund lending transactions
normally extend only overnight, but can have a maximum duration of seven days.
The program is subject to annual approval by the Board of Trustees. During the
six months ended December 31, 2008, the fund did not utilize the program.
8. RISK FACTORS
There are certain risks involved in investing in foreign securities. These risks
include those resulting from future adverse political, social, and economic
developments, fluctuations in currency exchange rates, the possible imposition
of exchange controls, and other foreign laws or restrictions.
- ------
22
9. FEDERAL TAX INFORMATION
The book-basis character of distributions made during the year from net
investment income or net realized gains may differ from their ultimate
characterization for federal income tax purposes. These differences reflect the
differing character of foreign currency gains, certain income items and net
realized gains and losses for financial statement and tax purposes, and may
result in reclassification among certain capital accounts on the financial
statements.
As of December 31, 2008, the components of investments for federal income tax
purposes were as follows:
Federal tax cost of investments $1,733,611,580
==============
Gross tax appreciation of investments $117,141,695
Gross tax depreciation of investments (90,901,074)
--------------
Net tax appreciation (depreciation) of
investments $ 26,240,621
==============
The difference between book-basis and tax-basis cost and unrealized appreciation
(depreciation) is attributable primarily to the tax deferral of losses on wash
sales.
As of June 30, 2008 the fund had a currency loss deferral of $(6,128,923). The
currency loss deferral represents net foreign currency losses incurred in the
eight-month period ended June 30, 2008. The fund has elected to treat such
losses as having been incurred in the following fiscal year for federal income
tax purposes.
10. CORPORATE EVENT
Effective January 30, 2009, ACIM will terminate the Subadvisory Agreement with
JPMIM on behalf of the fund. ACIM will assume the day-to-day management
responsibilities performed by the subadvisor. The termination of the Subadvisory
Agreement was approved by the Board of Trustees on November 5, 2008.
11. RECENTLY ISSUED ACCOUNTING STANDARDS
The Financial Accounting Standards Board (FASB) issued Statement of Financial
Accounting Standards No. 157, "Fair Value Measurements" (FAS 157), in September
2006, which is effective for fiscal years beginning after November 15, 2007. FAS
157 defines fair value, establishes a framework for measuring fair value and
expands the required financial statement disclosures about fair value
measurements. The adoption of FAS 157 did not materially impact the
determination of fair value.
In March 2008, the FASB issued Statement of Financial Accounting Standards No.
161, "Disclosures about Derivative Instruments and Hedging Activities--an
amendment of FASB Statement No. 133" (FAS 161). FAS 161 is effective for interim
periods beginning after November 15, 2008. FAS 161 amends and expands
disclosures about derivative instruments and hedging activities. FAS 161
requires qualitative disclosures about the objectives and strategies of
derivative instruments, quantitative disclosures about the fair value amounts of
and gains and losses on derivative instruments, and disclosures of
credit-risk-related contingent features in hedging activities. Management is
currently evaluating the impact that adopting FAS 161 will have on the financial
statement disclosures.
- ------
23
FINANCIAL HIGHLIGHTS
International Bond
Investor Class
For a Share Outstanding Throughout the Years Ended June 30 (except as noted)
2008(1) 2008 2007(2) 2006 2005 2004(3) 2003(3)
PER-SHARE DATA
Net Asset
Value,
Beginning
of Period $15.13 $13.69 $13.78 $13.03 $14.76 $13.64 $12.19
-------- -------- -------- -------- -------- ----------------
Income From
Investment
Operations
Net
Investment
Income
(Loss)(4) 0.23 0.45 0.20 0.34 0.30 0.36 0.37
Net Realized
and
Unrealized
Gain (Loss) (0.50) 1.58 (0.26) 0.73 (1.49) 1.40 2.03
-------- -------- -------- -------- -------- ----------------
Total From
Investment
Operations (0.27) 2.03 (0.06) 1.07 (1.19) 1.76 2.40
-------- -------- -------- -------- -------- ----------------
Distributions
From Net
Investment
Income (0.54) (0.59) (0.03) (0.31) (0.41) (0.59) (0.85)
From Net
Realized
Gains (0.21) -- -- (0.01) (0.13) (0.05) (0.10)
-------- -------- -------- -------- -------- ----------------
Total
Distributions (0.75) (0.59) (0.03) (0.32) (0.54) (0.64) (0.95)
-------- -------- -------- -------- -------- ----------------
Net Asset
Value, End
of Period $14.11 $15.13 $13.69 $13.78 $13.03 $14.76 $13.64
======== ======== ======== ======== ======== ================
TOTAL
RETURN(5) (1.72)% 15.03% (0.45)% 8.25% (8.23)% 13.10% 19.91%
RATIOS/SUPPLEMENTAL DATA
Ratio of
Operating
Expenses to
Average Net
Assets 0.82%(6) 0.82% 0.83%(6) 0.82% 0.82% 0.83% 0.84%
Ratio of Net
Investment
Income (Loss)
to Average
Net Assets 3.21%(6) 3.01% 2.95%(6) 2.51% 2.17% 2.60% 2.80%
Portfolio
Turnover Rate 33% 74% 37% 206% 226% 104% 112%
4 2 8
Net Assets,
End of Period
(in thousands) $1,481,41 $1,811,299 $1,440,76 $1,317,505 $1,040,576 $976,82 $622,657
(1) Six months ended December 31, 2008 (unaudited).
(2) January 1, 2007 through June 30, 2007. The fund's fiscal year end was
changed from December 31 to June 30, resulting in a six-month annual reporting
period. For the years before June 30, 2007, the fund's fiscal year end was
December 31.
(3) Certain distributions in 2004 and 2003 were reclassified between net
investment income and net realized gains to conform to current year
presentation.
(4) Computed using average shares outstanding throughout the period.
(5) Total return assumes reinvestment of net investment income and capital gains
distributions, if any. Total returns for periods less than one year are not
annualized. The total return of the classes may not precisely reflect the class
expense differences because of the impact of calculating the net asset values to
two decimal places. If net asset values were calculated to three decimal places,
the total return differences would more closely reflect the class expense
differences. The calculation of net asset values to two decimal places is made
in accordance with SEC guidelines and does not result in any gain or loss of
value between one class and another.
(6) Annualized.
See Notes to Financial Statements.
- ------
24
International Bond
Institutional Class
For a Share Outstanding Throughout the Years Ended June 30 (except as
noted)
2008(1) 2008 2007(2) 2006 2005 2004(3)(4)
PER-SHARE DATA
Net Asset
Value,
Beginning
of Period $15.15 $13.70 $13.78 $13.04 $14.77 $13.37
-------- -------- -------- -------- -------- --------
Income From
Investment
Operations
Net
Investment
Income
(Loss)(5) 0.24 0.48 0.21 0.35 0.36 0.17
Net
Realized and
Unrealized
Gain (Loss) (0.50) 1.58 (0.26) 0.74 (1.52) 1.84
-------- -------- -------- -------- -------- --------
Total From
Investment
Operations (0.26) 2.06 (0.05) 1.09 (1.16) 2.01
-------- -------- -------- -------- -------- --------
Distributions
From Net
Investment
Income (0.57) (0.61) (0.03) (0.34) (0.44) (0.57)
From Net
Realized
Gains (0.21) -- -- (0.01) (0.13) (0.04)
-------- -------- -------- -------- -------- --------
Total
Distributions (0.78) (0.61) (0.03) (0.35) (0.57) (0.61)
-------- -------- -------- -------- -------- --------
Net Asset
Value, End
of Period $14.11 $15.15 $13.70 $13.78 $13.04 $14.77
======== ======== ======== ======== ======== ========
TOTAL RETURN(6) (1.61)% 15.29% (0.34)% 8.43% (7.98)% 15.25%
RATIOS/SUPPLEMENTAL DATA
Ratio of
Operating
Expenses to
Average Net
Assets 0.62%(7) 0.62% 0.63%(7) 0.62% 0.62% 0.63%(7)
Ratio of Net
Investment
Income (Loss)
to Average
Net Assets 3.41%(7) 3.21% 3.15%(7) 2.71% 2.37% 2.88%(7)
Portfolio
Turnover Rate 33% 74% 37% 206% 226% 104%(8)
Net Assets,
End of
Period (in
thousands) $191,566 $250,179 $109,350 $88,812 $6,329 $1,263
(1) Six months ended December 31, 2008 (unaudited).
(2) January 1, 2007 through June 30, 2007. The fund's fiscal year end was
changed from December 31 to June 30, resulting in a six-month annual reporting
period. For the years before June 30, 2007, the fund's fiscal year end was
December 31.
(3) August 2, 2004 (commencement of sale) through December 31, 2004.
(4) Certain distributions in 2004 were reclassified between net investment
income and net realized gains to conform to current year presentation.
(5) Computed using average shares outstanding throughout the period.
(6) Total return assumes reinvestment of net investment income and capital gains
distributions, if any. Total returns for periods less than one year are not
annualized. The total return of the classes may not precisely reflect the class
expense differences because of the impact of calculating the net asset values to
two decimal places. If net asset values were calculated to three decimal places,
the total return differences would more closely reflect the class expense
differences. The calculation of net asset values to two decimal places is made
in accordance with SEC guidelines and does not result in any gain or loss of
value between one class and another.
(7) Annualized.
(8) Portfolio turnover is calculated at the fund level. Percentage indicated was
calculated for the year ended December 31, 2004.
See Notes to Financial Statements.
- ------
25
International Bond
A Class(1)
For a Share Outstanding Throughout the Years Ended June 30 (except as
noted)
2008(2) 2008 2007(3) 2006 2005 2004(4) 2003(4)
PER-SHARE DATA
Net Asset
Value,
Beginning
of Period $15.07 $13.67 $13.77 $13.01 $14.75 $13.62 $12.16
-------- -------- -------- -------- -------- -------- --------
Income From
Investment
Operations
Net
Investment
Income
(Loss)(5) 0.21 0.41 0.18 0.30 0.27 0.32 0.29
Net Realized
and
Unrealized
Gain (Loss) (0.50) 1.54 (0.26) 0.74 (1.51) 1.42 2.08
-------- -------- -------- -------- -------- -------- --------
Total From
Investment
Operations (0.29) 1.95 (0.08) 1.04 (1.24) 1.74 2.37
-------- -------- -------- -------- -------- -------- --------
Distributions
From Net
Investment
Income (0.49) (0.55) (0.02) (0.27) (0.37) (0.56) (0.81)
From Net
Realized
Gains (0.21) -- -- (0.01) (0.13) (0.05) (0.10)
-------- -------- -------- -------- -------- -------- --------
Total
Distributions (0.70) (0.55) (0.02) (0.28) (0.50) (0.61) (0.91)
-------- -------- -------- -------- -------- -------- --------
Net Asset
Value, End
of Period $14.08 $15.07 $13.67 $13.77 $13.01 $14.75 $13.62
======== ======== ======== ======== ======== ======== ========
TOTAL RETURN(6) (1.83)% 14.50% (0.57)% 8.03% (8.47)% 12.93% 19.60%
RATIOS/SUPPLEMENTAL DATA
Ratio of
Operating
Expenses to
Average Net
Assets 1.07%(7) 1.07% 1.08%(7) 1.07% 1.07% 1.08% 1.09%
Ratio of Net
Investment
Income (Loss)
to Average
Net Assets 2.96%(7) 2.76% 2.70%(7) 2.26% 1.92% 2.35% 2.55%
Portfolio
Turnover Rate 33% 74% 37% 206% 226% 104% 112%
Net Assets,
End of Period
(in thousands) $99,874 $124,844 $72,787 $65,452 $61,663 $42,736 $21,137
(1) Prior to September 4, 2007, the A Class was referred to as the Advisor
Class.
(2) Six months ended December 31, 2008 (unaudited).
(3) January 1, 2007 through June 30, 2007. The fund's fiscal year end was
changed from December 31 to June 30, resulting in a six-month annual reporting
period. For the years before June 30, 2007, the fund's fiscal year end was
December 31.
(4) Certain distributions in 2004 and 2003 were reclassified between net
investment income and net realized gains to conform to current year presentation
(5) Computed using average shares outstanding throughout the period.
(6) Total return assumes reinvestment of net investment income and capital gains
distributions, if any, and does not reflect applicable sales charges. Total
returns for periods less than one year are not annualized. The total return of
the classes may not precisely reflect the class expense differences because of
the impact of calculating the net asset values to two decimal places. If net
asset values were calculated to three decimal places, the total return
differences would more closely reflect the class expense differences. The
calculation of net asset values to two decimal places is made in accordance with
SEC guidelines and does not result in any gain or loss of value between one
class and another.
(7) Annualized.
See Notes to Financial Statements.
- ------
26
International Bond
B Class
For a Share Outstanding Throughout the Periods Indicated
2008(1) 2008(2)
PER-SHARE DATA
Net Asset Value, Beginning of Period $15.05 $14.55
-------- --------
Income From Investment Operations
Net Investment Income (Loss)(3) 0.16 0.22
Net Realized and Unrealized Gain (Loss) (0.50) 0.69
-------- --------
Total From Investment Operations (0.34) 0.91
-------- --------
Distributions
From Net Investment Income (0.36) (0.41)
From Net Realized Gains (0.21) --
-------- --------
Total Distributions (0.57) (0.41)
-------- --------
Net Asset Value, End of Period $14.14 $15.05
======== ========
TOTAL RETURN(4) (2.20)% 6.38%
RATIOS/SUPPLEMENTAL DATA
Ratio of Operating Expenses to Average Net
Assets 1.82%(5) 1.82%(5)
Ratio of Net Investment Income (Loss)
to Average Net Assets 2.21%(5) 1.96%(5)
Portfolio Turnover Rate 33% 74%(6)
Net Assets, End of Period (in thousands) $196 $258
(1) Six months ended December 31, 2008 (unaudited).
(2) September 28, 2007 (commencement of sale) through June 30, 2008.
(3) Computed using average shares outstanding throughout the period.
(4) Total return assumes reinvestment of net investment income and capital gains
distributions, if any, and does not reflect applicable sales charges. Total
returns for periods less than one year are not annualized. The total return of
the classes may not precisely reflect the class expense differences because of
the impact of calculating the net asset values to two decimal places. If net
asset values were calculated to three decimal places, the total return
differences would more closely reflect the class expense differences. The
calculation of net asset values to two decimal places is made in accordance with
SEC guidelines and does not result in any gain or loss of value between one
class and another.
(5) Annualized.
(6) Portfolio turnover is calculated at the fund level. Percentage indicated was
calculated for the year ended June 30, 2008.
See Notes to Financial Statements.
- ------
27
International Bond
C Class
For a Share Outstanding Throughout the Periods Indicated
2008(1) 2008(2)
PER-SHARE DATA
Net Asset Value, Beginning of Period $15.05 $14.55
-------- --------
Income From Investment Operations
Net Investment Income (Loss)(3) 0.17 0.22
Net Realized and Unrealized Gain (Loss) (0.51) 0.69
-------- --------
Total From Investment Operations (0.34) 0.91
-------- --------
Distributions
From Net Investment Income (0.36) (0.41)
From Net Realized Gains (0.21) --
-------- --------
Total Distributions (0.57) (0.41)
-------- --------
Net Asset Value, End of Period $14.14 $15.05
======== ========
TOTAL RETURN(4) (2.20)% 6.38%
RATIOS/SUPPLEMENTAL DATA
Ratio of Operating Expenses to Average Net
Assets 1.82%(5) 1.82%(5)
Ratio of Net Investment Income (Loss)
to Average Net Assets 2.21%(5) 1.93%(5)
Portfolio Turnover Rate 33% 74%(6)
Net Assets, End of Period (in thousands) $2,218 $1,497
(1) Six months ended December 31, 2008 (unaudited).
(2) September 28, 2007 (commencement of sale) through June 30, 2008.
(3) Computed using average shares outstanding throughout the period.
(4) Total return assumes reinvestment of net investment income and capital gains
distributions, if any, and does not reflect applicable sales charges. Total
returns for periods less than one year are not annualized. The total return of
the classes may not precisely reflect the class expense differences because of
the impact of calculating the net asset values to two decimal places. If net
asset values were calculated to three decimal places, the total return
differences would more closely reflect the class expense differences. The
calculation of net asset values to two decimal places is made in accordance with
SEC guidelines and does not result in any gain or loss of value between one
class and another.
(5) Annualized.
(6) Portfolio turnover is calculated at the fund level. Percentage indicated was
calculated for the year ended June 30, 2008.
See Notes to Financial Statements.
- ------
28
International Bond
R Class
For a Share Outstanding Throughout the Periods Indicated
2008(1) 2008(2)
PER-SHARE DATA
Net Asset Value, Beginning of Period $15.09 $14.55
-------- --------
Income From Investment Operations
Net Investment Income (Loss)(3) 0.19 0.28
Net Realized and Unrealized Gain (Loss) (0.50) 0.69
-------- --------
Total From Investment Operations (0.31) 0.97
-------- --------
Distributions
From Net Investment Income (0.45) (0.43)
From Net Realized Gains (0.21) --
-------- --------
Total Distributions (0.66) (0.43)
-------- --------
Net Asset Value, End of Period $14.12 $15.09
======== ========
TOTAL RETURN(4) (1.99)% 6.76%
RATIOS/SUPPLEMENTAL DATA
Ratio of Operating Expenses to Average Net
Assets 1.32%(5) 1.32%(5)
Ratio of Net Investment Income (Loss)
to Average Net Assets 2.71%(5) 2.45%(5)
Portfolio Turnover Rate 33% 74%(6)
Net Assets, End of Period (in thousands) $59 $28
(1) Six months ended December 31, 2008 (unaudited).
(2) September 28, 2007 (commencement of sale) through June 30, 2008.
(3) Computed using average shares outstanding throughout the period.
(4) Total return assumes reinvestment of net investment income and capital gains
distributions, if any. Total returns for periods less than one year are not
annualized. The total return of the classes may not precisely reflect the class
expense differences because of the impact of calculating the net asset values to
two decimal places. If net asset values were calculated to three decimal places,
the total return differences would more closely reflect the class expense
differences. The calculation of net asset values to two decimal places is made
in accordance with SEC guidelines and does not result in any gain or loss of
value between one class and another.
(5) Annualized.
(6) Portfolio turnover is calculated at the fund level. Percentage indicated was
calculated for the year ended June 30, 2008.
See Notes to Financial Statements.
- ------
29
ADDITIONAL INFORMATION
RETIREMENT ACCOUNT INFORMATION
As required by law, distributions you receive from certain IRAs, or 403(b), 457
and qualified plans are subject to federal income tax withholding, unless you
elect not to have withholding apply. Tax will be withheld on the total amount
withdrawn even though you may be receiving amounts that are not subject to
withholding, such as nondeductible contributions. In such case, excess amounts
of withholding could occur. You may adjust your withholding election so that a
greater or lesser amount will be withheld.
If you don't want us to withhold on this amount, you must notify us to not
withhold the federal income tax. You may notify us in writing or in certain
situations by telephone or through other electronic means. You have the right to
revoke your withholding election at any time and any election you make may
remain in effect until revoked by filing a new election.
Remember, even if you elect not to have income tax withheld, you are liable for
paying income tax on the taxable portion of your withdrawal. If you elect not to
have income tax withheld or you don't have enough income tax withheld, you may
be responsible for payment of estimated tax. You may incur penalties under the
estimated tax rules if your withholding and estimated tax payments are not
sufficient. You can reduce or defer the income tax on a distribution by directly
or indirectly rolling such distribution over to another IRA or eligible plan.
You should consult your tax advisor for additional information.
State tax will be withheld if, at the time of your distribution, your address is
within one of the mandatory withholding states and you have federal income tax
withheld. State taxes will be withheld from your distribution in accordance with
the respective state rules.
PROXY VOTING GUIDELINES
American Century Investment Management, Inc., the fund's investment advisor, is
responsible for exercising the voting rights associated with the securities
purchased and/or held by the fund. A description of the policies and procedures
the advisor uses in fulfilling this responsibility is available without charge,
upon request, by calling 1-800-345-2021. It is also available on American
Century Investments' website at americancentury.com and on the Securities and
Exchange Commission's website at sec.gov. Information regarding how the
investment advisor voted proxies relating to portfolio securities during the
most recent 12-month period ended June 30 is available on the "About Us" page at
americancentury.com. It is also available at sec.gov.
QUARTERLY PORTFOLIO DISCLOSURE
The fund files its complete schedule of portfolio holdings with the Securities
and Exchange Commission (SEC) for the first and third quarters of each fiscal
year on Form N-Q. The fund's Form N-Q is available on the SEC's website at
sec.gov, and may be reviewed and copied at the SEC's Public Reference Room in
Washington, DC. Information on the operation of the Public Reference Room may be
obtained by calling 1-800-SEC-0330. The fund also makes its complete schedule of
portfolio holdings for the most recent quarter of its fiscal year available on
its website at americancentury.com and, upon request, by calling 1-800-345-2021.
- ------
30
INDEX DEFINITIONS
The following indices are used to illustrate investment market, sector, or style
performance or to serve as fund performance comparisons. They are not investment
products available for purchase.
The JPMORGAN GLOBAL TRADED GOVERNMENT BOND INDEX (JPM GTGBI) is a
market-capitalization weighted index consisting of regularly traded, fixed-rate
government bonds from certain developed foreign countries in North America,
Europe, Asia, and Australia.
The JPMORGAN GOVERNMENT BOND INDEX - GLOBAL (GBI GLOBAL), EXCLUDING U.S. is a
market-capitalization weighted index consisting of returns from investing in 13
developed government bond markets with the U.S. excluded.
The FUND BENCHMARK is the JPM GTGBI with the U.S. excluded and Japan weighted at
15%.
- ------
31
NOTES
- ------
32
[back cover]
[american century investments logo and text logo (R)]
CONTACT US
AMERICANCENTURY.COM
AUTOMATED INFORMATION LINE . . . . . . . . . . . . 1-800-345-8765
INVESTOR SERVICES REPRESENTATIVE . . . . . . . . . 1-800-345-2021 or
816-531-5575
INVESTORS USING ADVISORS . . . . . . . . . . . . . 1-800-378-9878
.. .
BUSINESS, NOT-FOR-PROFIT, EMPLOYER-SPONSORED
RETIREMENT PLANS . . . . . . . . . . . . . . . . . 1-800-345-3533
.. .
BANKS AND TRUST COMPANIES, BROKER-DEALERS,
FINANCIAL PROFESSIONALS, INSURANCE COMPANIES . . . 1-800-345-6488
.. .
TELECOMMUNICATIONS DEVICE FOR THE DEAF . . . . . . 1-800-634-4113
.. .
AMERICAN CENTURY INTERNATIONAL BOND FUNDS
INVESTMENT ADVISOR:
American Century Investment Management, Inc.
Kansas City, Missouri
This report and the statements it contains are submitted for the general
information of our shareholders. The report is not authorized for distribution
to prospective investors unless preceded or accompanied by an effective
prospectus.
American Century Investment Services, Inc., Distributor
©2009 American Century Proprietary Holdings, Inc. All rights reserved.
0902
CL-SAN-64105N
ITEM 2. CODE OF ETHICS.
Not applicable for semiannual report filings.
ITEM 3. AUDIT COMMITTEE FINANCIAL EXPERT.
Not applicable for semiannual report filings.
ITEM 4. PRINCIPAL ACCOUNTANT FEES AND SERVICES.
Not applicable for semiannual report filings.
ITEM 5. AUDIT COMMITTEE OF LISTED REGISTRANTS.
Not applicable.
ITEM 6. INVESTMENTS.
(a) The schedule of investments is included as part of the report to
stockholders filed under Item 1 of this Form.
(b) Not applicable.
ITEM 7. DISCLOSURE OF PROXY VOTING POLICIES AND PROCEDURES FOR CLOSED-END
MANAGEMENT INVESTMENT COMPANIES.
Not applicable.
ITEM 8. PORTFOLIO MANAGERS OF CLOSED-END MANAGEMENT INVESTMENT COMPANIES.
Not applicable.
ITEM 9. PURCHASES OF EQUITY SECURITIES BY CLOSED-END MANAGEMENT INVESTMENT
COMPANY AND AFFILIATED PURCHASERS.
Not applicable.
ITEM 10. SUBMISSION OF MATTERS TO A VOTE OF SECURITY HOLDERS.
During the reporting period, there were no material changes to the procedures by
which shareholders may recommend nominees to the registrant's board.
ITEM 11. CONTROLS AND PROCEDURES.
(a) The registrant's principal executive officer and principal financial
officer have concluded that the registrant's disclosure controls and
procedures (as defined in Rule 30a-3(c) under the Investment Company Act of
1940) are effective based on their evaluation of these controls and
procedures as of a date within 90 days of the filing date of this report.
(b) There were no changes in the registrant's internal control over financial
reporting (as defined in Rule 30a-3(d) under the Investment Company Act of
1940) that occurred during the registrant's second fiscal quarter of the
period covered by this report that have materially affected, or are
reasonably likely to materially affect, the registrant's internal control
over financial reporting.
ITEM 12. EXHIBITS.
(a)(1) Not applicable for semiannual report filings.
(a)(2) Separate certifications by the registrant's principal executive
officer and principal financial officer, pursuant to Section 302 of
the Sarbanes-Oxley Act of 2002 and Rule 30a-2(a) under the Investment
Company Act of 1940, are filed and attached hereto as Exhibit
99.302CERT.
(a)(3) Not applicable.
(b) A certification by the registrant's chief executive officer and chief
financial officer, pursuant to Section 906 of the Sarbanes-Oxley Act
of 2002, is furnished and attached hereto as Exhibit 99.906CERT.
SIGNATURES
Pursuant to the requirements of the Securities Exchange Act of 1934 and the
Investment Company Act of 1940, the registrant has duly caused this report to be
signed on its behalf by the undersigned, thereunto duly authorized.
Registrant: AMERICAN CENTURY INTERNATIONAL BOND FUNDS
By: /s/ Jonathan S. Thomas
-----------------------------------------
Name: Jonathan S. Thomas
Title: President
Date: February 27, 2009
Pursuant to the requirements of the Securities Exchange Act of 1934 and the
Investment Company Act of 1940, this report has been signed below by the
following persons on behalf of the registrant and in the capacities and on the
dates indicated.
By: /s/ Jonathan S. Thomas
-----------------------------------------
Name: Jonathan S. Thomas
Title: President
(principal executive officer)
Date: February 27, 2009
By: /s/ Robert J. Leach
-----------------------------------------
Name: Robert J. Leach
Title: Vice President, Treasurer, and
Chief Financial Officer
(principal financial officer)
Date: February 27, 2009