Searchable text section of graphics shown above
Enbridge Energy Partners
[LOGO]
Dan C. Tutcher
President, Enbridge Energy Partners
Business Strategy
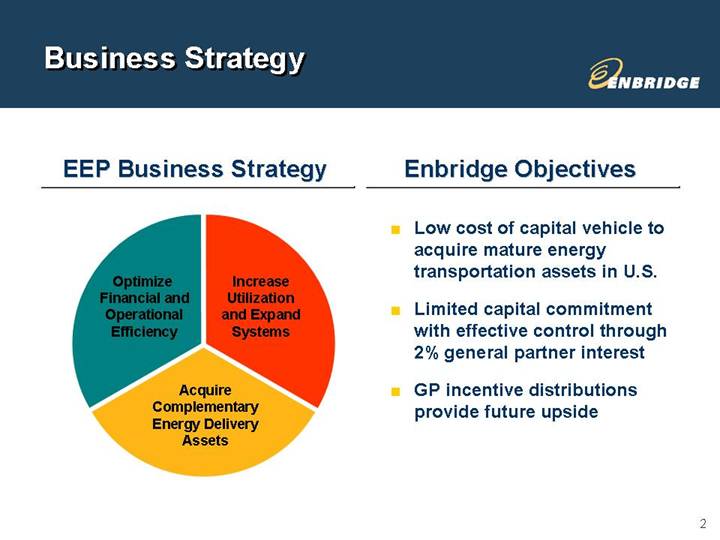
EEP Business Strategy | | Enbridge Objectives |
| | |
[CHART] | | • Low cost of capital vehicle to acquire mature energy transportation assets in U.S. |
| |
| • Limited capital commitment with effective control through 2% general partner interest |
| |
| • GP incentive distributions provide future upside |
2
Investment in Growth Opportunities
• Disciplined Acquisition Program Spawns Additional Acquisitive and Organic Growth Opportunities
[CHART]
Note: Acquisitions shown as of date announced.
3
Spawning Growth
[GRAPHIC]
4
Spawning Growth:
Natural Gas Example
[GRAPHIC]
| ETX | NETX | | |
| | | ETX Transmission | |
| ANADARKO | ZYBACH | | |
PRODUCERS | | | | MARKETS |
| PALO DURO | | | |
| | | | |
| NTX1 | NTX2 | | |
| | | | |
| | NTX Link | | |
| | | | | |
Abbreviations: East Texas (ETX), Northeast Texas (NETX), North Texas (NTX)
5
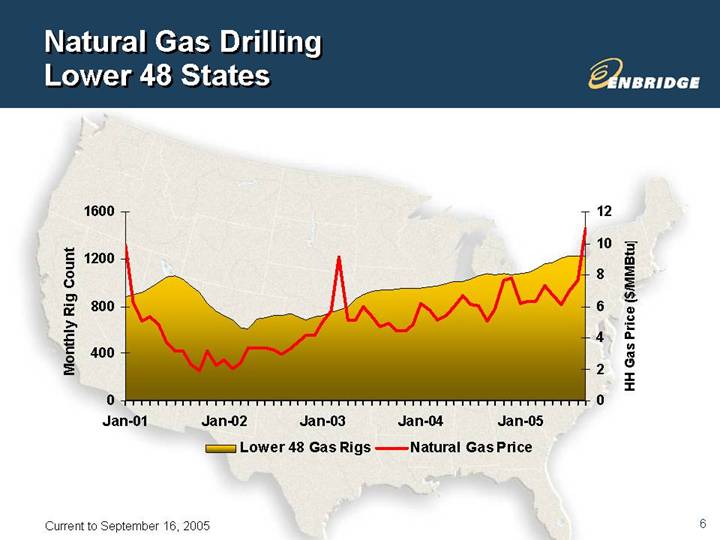
Natural Gas Drilling
Lower 48 States
[CHART]
Current to September 16, 2005
6
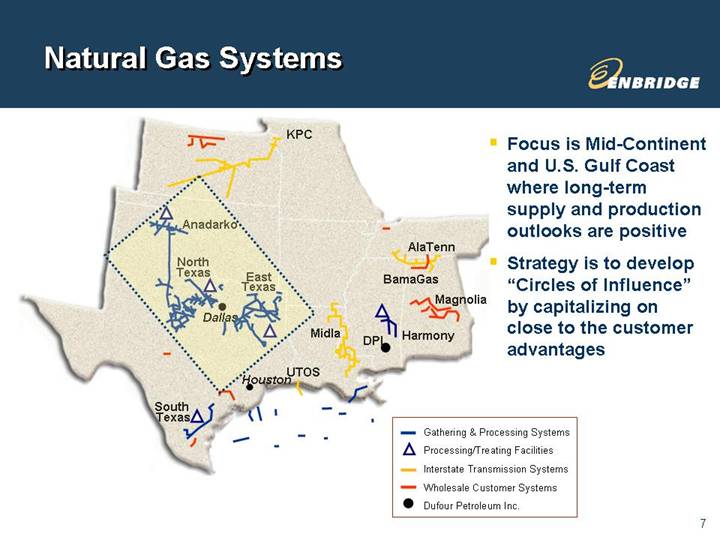
Natural Gas Systems
| | • Focus is Mid-Continent and U.S. Gulf Coast where long-term supply and production outlooks are positive |
[GRAPHIC] | | |
| | • Strategy is to develop “Circles of Influence” by capitalizing on close to the customer advantages |
7
Natural Gas
Access to Multiple Markets
[GRAPHIC]
8
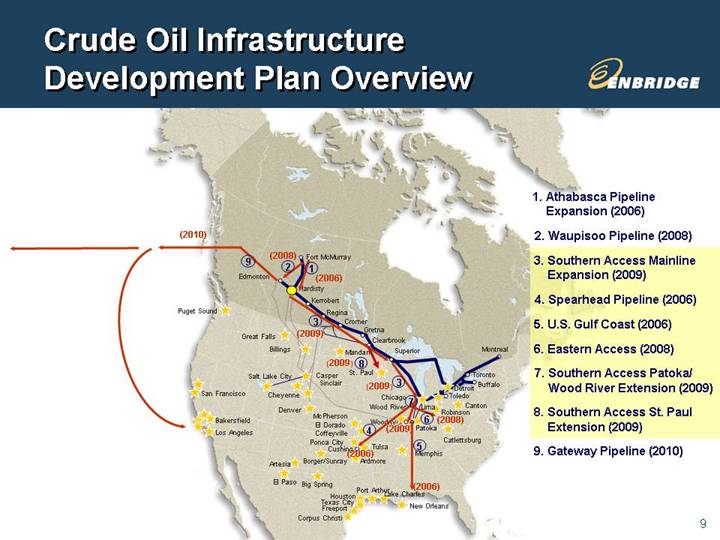
Crude Oil Infrastructure
Development Plan Overview
[GRAPHIC] | 1. Athabasca Pipeline Expansion (2006) |
|
2. Waupisoo Pipeline (2008) |
|
3. Southern Access Mainline Expansion (2009) |
|
4. Spearhead Pipeline (2006) |
|
5. U.S. Gulf Coast (2006) |
|
6. Eastern Access (2008) |
|
7. Southern Access Patoka/ Wood River Extension (2009) |
|
8. Southern Access St. Paul Extension (2009) |
|
9. Gateway Pipeline (2010) |
9
Southern Access Expansion & Extension Program
[GRAPHIC]
10
Stable Distributions
• Long-life Assets Underpin Stable Distributions to Partners
[CHART]
• Projected high level of capital expenditures on internal growth projects over the next few years is anticipated to limit distribution increase potential
Note: Annualized fourth quarter distribution, except 2005 is annualized current rate
11
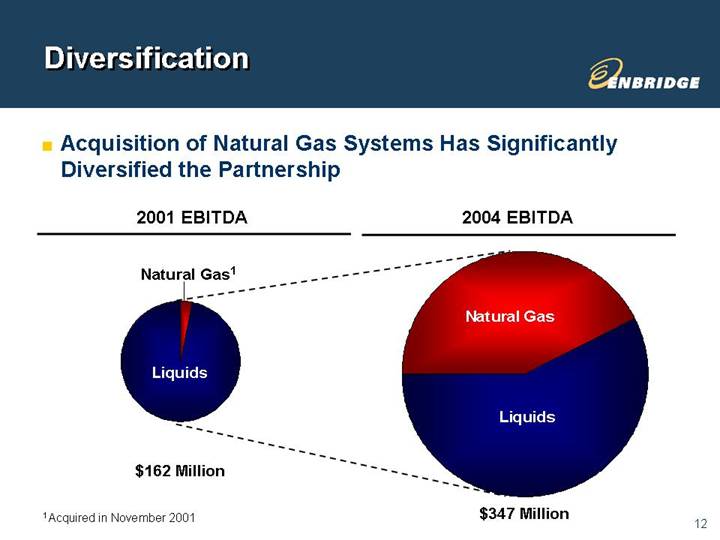
Diversification
• Acquisition of Natural Gas Systems Has Significantly Diversified the Partnership
2001 EBITDA | | 2004 EBITDA |
| | |
[CHART] | | [CHART] |
(1) Acquired in November 2001
12
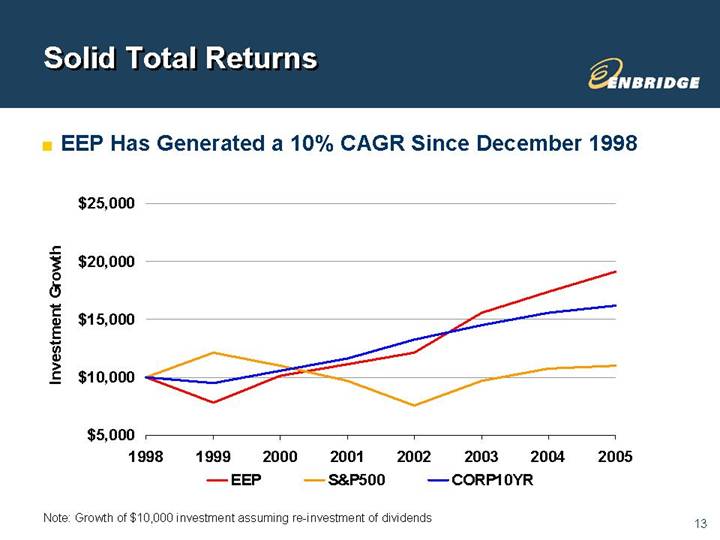
Solid Total Returns
• EEP Has Generated a 10% CAGR Since December 1998
[CHART]
Note: Growth of $10,000 investment assuming re-investment of dividends
13
Enbridge Energy Partners
[GRAPHIC]
Dan C. Tutcher
President, Enbridge Energy Partners
Appendix
MLP Structure
[CHART] | | • Enbridge is General Partner, through indirect subsidiary EECI, and has effective 11% interest in the Partnership |
| |
| • EEM is limited liability company - only asset is interest in EEP. EEM pays nontaxable in-kind quarterly distributions - sale of EEM shares taxed as capital gains |
| |
| • EEP is nontaxable master limited partnership - allocates taxable income to partners. EEP makes quarterly cash distributions - treated as reductions of tax cost basis |
A
Appendix
Natural Gas Demand & Supply
Source: Purvin & Gertz 2005 Market Outlook
B
Appendix
Commodity Price Exposure
• Cash Flow at Risk (CFaR) is Closely Monitored to Control Exposure Within Tolerance Limit
[CHART] | | • Major portion of cash flow derived from predictable fixed fee or cost of service revenue arrangements |
| |
| • Direct commodity price exposure is reduced through hedging program |
| |
| • Exposure to interest rate volatility is subject to conservative debt structure policy (0-20% floating debt target) |
| |
| • Largest exposure to non-controllable risk is commodity volumes |
C
Enbridge Energy Partners
[GRAPHIC]
Dan C. Tutcher
President, Enbridge Energy Partners