UNITED STATES
SECURITIES AND EXCHANGE COMMISSION
Washington, D.C. 20549
FORM N-CSR
CERTIFIED SHAREHOLDER REPORT OF REGISTERED
MANAGEMENT INVESTMENT COMPANIES
Investment Company Act file number 811-06444
Legg Mason Partners Equity Trust
(Exact name of registrant as specified in charter)
620 Eighth Avenue, 47th Floor,
New York, NY 10018
(Address of principal executive offices) (Zip code)
Marc A. De Oliveira,
Legg Mason & Co., LLC
100 First Stamford Place
Stamford, CT 06902
(Name and address of agent for service)
Registrant’s telephone number, including area code: 1-877-721-1926
Date of fiscal year end: September 30
Date of reporting period: September 30, 2020
| ITEM 1. | REPORT TO STOCKHOLDERS. |
The Annual Report to Stockholders is filed herewith.

| Annual Report | September 30, 2020 |
QS
S&P 500 INDEX FUND
Beginning in or after March 2021, as permitted by regulations adopted by the Securities and Exchange Commission, the Fund intends to no longer mail paper copies of the Fund’s shareholder reports like this one, unless you specifically request paper copies of the reports from the Fund or from your Service Agent or financial intermediary (such as a broker-dealer or bank). Instead, the reports will be made available on a website, and you will be notified by mail each time a report is posted and provided with a website link to access the report.
If you already elected to receive shareholder reports electronically (“e-delivery”), you will not be affected by this change and you need not take any action. If you have not already elected e-delivery, you may elect to receive shareholder reports and other communications from the Fund electronically by contacting your Service Agent or, if you are a direct shareholder with the Fund, by calling 1-877-721-1926.
You may elect to receive all future reports in paper free of charge. If you invest through a Service Agent, you can contact your Service Agent to request that you continue to receive paper copies of your shareholder reports. That election will apply to all Legg Mason Funds held in your account at that Service Agent. If you are a direct shareholder with the Fund, you can call the Fund at 1-877-721-1926, or write to the Fund by regular mail at Legg Mason Funds, P.O. Box 9699, Providence, RI 02940-9699 or by express, certified or registered mail to Legg Mason Funds, 4400 Computer Drive, Westborough, MA 01581 to let the Fund know you wish to continue receiving paper copies of your shareholder reports. That election will apply to all Legg Mason Funds held in your account held directly with the fund complex.

| INVESTMENT PRODUCTS: NOT FDIC INSURED • NO BANK GUARANTEE • MAY LOSE VALUE |
“Standard & Poor’s®”, “S&P®”, “S&P 500®”, “Standard & Poor’s 500” and “500” are trademarks of The McGraw-Hill Companies, Inc. and have been licensed for use by Legg Mason Partners Fund Advisor, LLC (“LMPFA”). The Fund is not sponsored, endorsed, sold or promoted by Standard & Poor’s and Standard & Poor’s makes no representation regarding the advisability of investing in the Fund.
Fund objective
The Fund seeks to provide investment results that, before fees and expenses, correspond to the price and yield performance of the S&P 500® Index.

Dear Shareholder,
We are pleased to provide the annual report of QS S&P 500 Index Fund for the twelve-month reporting period ended September 30, 2020. Please read on for a detailed look at prevailing economic and market conditions during the Fund’s reporting period and to learn how those conditions have affected Fund performance.
Special shareholder notices
Effective March 31, 2020, Russell Shtern, CFA and Michael Ripper, CFA, UK are the Fund’s portfolio managers and have primary responsibility for the day-to-day management of the Fund. Each is employed by QS Investors, LLC, the Fund’s subadviser, and is responsible for the strategic oversight of the Fund’s investments. Mr. Shtern and Mr. Ripper have been portfolio managers of the Fund since May 2014 and March 2020, respectively. For more information regarding the Fund’s portfolio managers, please see the Fund’s prospectus.
On July 31, 2020, Franklin Resources, Inc. (“Franklin Resources”) acquired Legg Mason, Inc. (“Legg Mason”) in an all-cash transaction. As a result of the transaction, Legg Mason Partners Fund Advisor, LLC (“LMPFA”) and the subadviser(s) became indirect, wholly-owned subsidiaries of Franklin Resources. Under the Investment Company Act of 1940, as amended, consummation of the transaction automatically terminated the management and subadvisory agreements that were in place for the Fund prior to the transaction. The Fund’s manager and subadviser(s) continue to provide uninterrupted services with respect to the Fund pursuant to new management and subadvisory agreements that were approved by Fund shareholders.
| II | QS S&P 500 Index Fund |
Franklin Resources, whose principal executive offices are at One Franklin Parkway, San Mateo, California 94403, is a global investment management organization operating, together with its subsidiaries, as Franklin Templeton. As of September 30, 2020, after giving effect to the transaction described above, Franklin Templeton’s asset management operations had aggregate assets under management of approximately $1.4 trillion.
As always, we remain committed to providing you with excellent service and a full spectrum of investment choices. We also remain committed to supplementing the support you receive from your financial advisor. One way we accomplish this is through our website, www.leggmason.com. Here you can gain immediate access to market and investment information, including:
| • | Fund prices and performance, |
| • | Market insights and commentaries from our portfolio managers, and |
| • | A host of educational resources. |
We look forward to helping you meet your financial goals.
Sincerely,

Jane Trust, CFA
President and Chief Executive Officer
October 30, 2020
| QS S&P 500 Index Fund | III |
(This page intentionally left blank.)
Q. What is the Fund’s investment strategy?
A. The Fund seeks to provide investment results that, before fees and expenses, correspond to the price and yield performance of the S&P 500 Index (the “Index”)i. Under normal circumstances, the Fund invests at least 80% of its net assets, plus any borrowings for investment purposes, in equity securities, or other investments with similar economic characteristics, included in the Index. The Fund generally is fully invested in stocks included in the Index. The Fund holds a broadly diversified portfolio of common stocks that is comparable to the Index in terms of economic sector weightings, market capitalization and liquidity. The Fund may use derivatives to track the performance of or to simulate full investment in the Index.
The Fund is managed as a “pure” index fund. As portfolio managers, we do not evaluate individual companies to identify attractive investment candidates for the Fund. Instead, we attempt to mirror the investment performance of the Index as closely as possible by reviewing daily and adjusting when necessary the Fund’s portfolio to reflect the companies included in the Index and their weightings.
Like most index funds, the Fund does not mirror the Index exactly because, unlike the Index, the Fund must maintain a portion of its assets in cash and liquid short-term securities to meet redemptions requests and pay the Fund’s expenses. The Fund’s returns may be below those of the Index because of the Fund’s operating expenses. The Fund’s ability to replicate the performance of the Index will depend, to some extent, on the size of cash flows into and out of the Fund. The Fund will make investment changes to accommodate these cash flows and to maximize the similarity of the Fund’s assets to those of the Index.
Q. What were the overall market conditions during the Fund’s reporting period?
A. The S&P 500 Index returned 15.15% for the twelve-month reporting period ended September 30, 2020, with considerable volatility within and across quarters. The U.S. equity market finished 2019 with a strong final quarter return, propelled by progress in U.S. and China trade discussions and an increasingly dovish U.S. Federal Reserve Board (the “Fed”)ii. In October 2019, the Fed cut interest rates by twenty-five basis pointsiii for the third time in that calendar year.
With the arrival of COVID-19 in the first quarter of 2020, U.S. equities declined almost 20% despite a series of moves by the Fed to mitigate the impact of the pandemic; on March 15, it embarked on a large-scale program employing emergency powers in order to stabilize the economy. Chief among these emergency actions was cutting interest rates effectively to zero and a U.S. dollar 700 billion round of quantitative easing. Despite these actions, stock prices continued their steep decline. At the end of the first quarter, the White House and Congress reached a deal on a two trillion-dollar stimulus package (approximately 10% of U.S. GDPiv), against the backdrop of the largest ever unemployment claims number.
U.S. retail sales increased 17% between April 2020 and May 2020, as states began to lift restrictions. This led to a strong recovery in equity markets in the second calendar quarter
| QS S&P 500 Index Fund 2020 Annual Report | 1 |
Fund overview (cont’d)
of 2020, which persisted into the summer. News of a potential treatment for the virus seemed to offset the impact of a summer surge in COVID-19 in parts of the country. August 2020 saw an increase in manufacturing activity, better-than-expected factory orders and fewer jobless claims, pushing U.S. equity markets as measured by the S&P 500 Index to record highs. In addition, the Fed indicated a shift in approach with respect to inflation, suggesting that interest rates may remain low for longer than expected. September 2020 saw a modest pullback, driven by a rise in COVID-19 cases, delays regarding additional fiscal stimulus and rising political uncertainty with the upcoming U.S. presidential election.
Sector returns varied greatly for the full reporting period. Information Technology stocks led the way and were largely responsible for the strong return for the twelve-month period, returning over 47%. The Energy sector was especially hard hit by the pandemic and posted a negative return. A supply side price war between Saudi Arabia and Russia dominated the market in the first quarter of 2020, as did a deteriorating demand for oil due to the impact of the coronavirus on global economic growth. Losses in the Energy sector were only partially mitigated by second calendar quarter outperformance as economies began to ease lockdown restrictions and oil companies in North America reduced supply. At the end of the final quarter of the reporting period, a second wave of COVID-19 was brought back to light. Additionally, crude oil was largely affected by Saudi Arabia’s announcement to markedly cut its price, and Libya began to export the commodity again.
The Financials sector also posted a negative return. Despite measures being taken by the federal government and the Fed, bank asset quality, net interest margins and earnings came under pressure, and banks were faced with credit losses and capital declines.
Q. How did we respond to these changing market conditions?
A. The Fund is not actively managed. It is managed as a “pure” index fund. Like most index funds, we replicate the holdings of the Index to the extent possible, given cash flows into and out of the Fund. No change in the investment process was required due to changing conditions. The Fund utilized S&P 500 Index futures contracts to equitize its cash position. These derivative positions contributed to results for the reporting period.
Performance review
For the twelve months ended September 30, 2020, Class A shares of QS S&P 500 Index Fund returned 14.55%. The Fund’s unmanaged benchmark, the S&P 500 Index, returned 15.15% for the same period. The Lipper S&P 500 Index Funds Category Averagev returned 14.69% over the same time frame.
| 2 | QS S&P 500 Index Fund 2020 Annual Report |
Performance Snapshot as of September 30, 2020 (unaudited) | ||||||||
| 6 months | 12 months | |||||||
| QS S&P 500 Index Fund: | ||||||||
Class A | 30.94 | % | 14.55 | % | ||||
Class D | 31.09 | % | 14.78 | % | ||||
| S&P 500 Index | 31.31 | % | 15.15 | % | ||||
| Lipper S&P 500 Index Funds Category Average | 31.05 | % | 14.69 | % | ||||
The performance shown represents past performance. Past performance is no guarantee of future results and current performance may be higher or lower than the performance shown above. Principal value and investment returns will fluctuate and investors’ shares, when redeemed, may be worth more or less than their original cost. To obtain performance data current to the most recent month-end, please visit our website at www.leggmason.com/mutualfunds.
All share class returns assume the reinvestment of all distributions at net asset value and the deduction of all Fund expenses. Returns have not been adjusted to include the deduction of taxes that a shareholder would pay on Fund distributions. Performance figures for periods shorter than one year represent cumulative figures and are not annualized.
Fund performance figures reflect fee waivers and/or expense reimbursements, without which the performance would have been lower.
| Total Annual Operating Expenses (unaudited) |
As of the Fund’s current prospectus dated February 1, 2020, the gross total annual fund operating expense ratios for Class A and Class D shares were 0.61% and 0.43%, respectively.
Actual expenses may be higher. For example, expenses may be higher than those shown if average net assets decrease. Net assets are more likely to decrease and Fund expense ratios are more likely to increase when markets are volatile.
As a result of expense limitation arrangements, the ratio of total annual fund operating expenses, other than interest, brokerage, taxes, extraordinary expenses and acquired fund fees and expenses, to average net assets will not exceed 0.59% for Class A shares and 0.39% for Class D shares. These expense limitation arrangements cannot be terminated prior to December 31, 2021 without the Board of Trustees’ consent.
The manager is permitted to recapture amounts waived and/or reimbursed to a class during the same fiscal year if the class’ total annual operating fund expenses have fallen to a level below the expense limitation (“expense cap”) in effect at the time the fees were earned or the expenses incurred. In no case will the manager recapture any amount that would result, on any particular business day of the Fund, in the class’ total annual fund operating expenses exceeding the expense cap or any other lower limit then in effect.
Q. What were the leading contributors to performance?
A. The Information Technology sector had the best return in the Index by a significant margin for the period, followed by Consumer Discretionary and Health Care sectors; all had double-digit returns and meaningful Index weights. The strongest contributor at the security level with a meaningful weight in the Index and a return of over 47% for the period was
| QS S&P 500 Index Fund 2020 Annual Report | 3 |
Fund overview (cont’d)
Facebook Inc., despite a pullback in September along with other tech names. Facebook benefited from strong fundamentals and an expectation of continued growth. Another leading contributor was PayPal Holdings, Inc. which benefited from the trend toward e-commerce. In addition, PayPal is in the process of providing functionality with merchants to allow customers to point their phones at checkout scanners in stores. Netflix, Inc. was also a leading contributor to the performance benefiting from the coronavirus pandemic, with a commanding lead in the video streaming market.
Q. What were the leading detractors from performance?
A. The Energy and Financials sectors posted double digit negative returns in the Index for the period. By virtue of return and weight in the Index, these sectors were also the largest detractors from performance. The biggest detractor at the security level was Simon Property Group, Inc. Even before the global coronavirus pandemic, Simon was dealing with the shift toward online shopping, with retailers choosing to close stores. With the outbreak of COVID-19, malls were forced to close, and Simon’s rent collection rates fell dramatically.
Other leading detractors were in Financials sector such as Bank of America, Citigroup Inc. and JPMorgan Chase & Co. The widespread halting of business activity and the surge in unemployment weighed on their revenue streams and earnings, weakened the creditworthiness of their borrowers and forced them to sharply increase the allowances they set aside for future losses on their loans.
Thank you for your investment in QS S&P 500 Index Fund. As always, we appreciate that you have chosen us to manage your assets and we remain focused on achieving the Fund’s investment goals.
Sincerely,
QS Investors, LLC
October 30, 2020
RISKS: Stock prices are subject to market fluctuations. The Fund normally buys or sells a portfolio security only to reflect additions or deletions of stocks that comprise the S&P 500 Index or to adjust for relative weightings. The Fund does not mirror the S&P 500 Index exactly because, unlike the S&P 500 Index, the Fund must maintain a portion of its assets in cash and liquid short-term securities to meet redemption requests and pay the Fund’s expenses. The Fund’s performance will be influenced by political, social and economic factors affecting investments in companies in foreign countries. The Fund may use derivatives, such as futures and options on securities or securities indexes and options on futures, which can be illiquid, may disproportionately increase losses, and have a potentially large impact on Fund performance. Please see the Fund’s prospectus for a more complete discussion of these and other risks and the Fund’s investment strategies.
Portfolio holdings and breakdowns are as of September 30, 2020 and are subject to change and may not be representative of the portfolio manager’s current or future investments. The Fund’s top ten holdings (as a percentage of net assets) as of September 30, 2020 were: Apple Inc. (6.6%), Microsoft
| 4 | QS S&P 500 Index Fund 2020 Annual Report |
Corp. (5.7%), Amazon.com Inc. (4.8%), Facebook Inc. (2.2%), Alphabet Inc., Class A Shares (1.6%), Alphabet Inc., Class C Shares (1.5%), Berkshire Hathaway Inc. (1.5%), Johnson & Johnson (1.4%), Procter & Gamble Co. (1.2%), Visa Inc. (1.2%). Please refer to pages 11 through 27 for a list and percentage breakdown of the Fund’s holdings.
The mention of sector breakdowns is for informational purposes only and should not be construed as a recommendation to purchase or sell any securities. The information provided regarding such sectors is not a sufficient basis upon which to make an investment decision. Investors seeking financial advice regarding the appropriateness of investing in any securities or investment strategies discussed should consult their financial professional. The Fund’s top five sector holdings (as a percentage of net assets) as of September 30, 2020 were: Information Technology (27.9%), Health Care (14.1%), Consumer Discretionary (11.4%), Communication Services (10.7%), Financials (9.5%). The Fund’s portfolio composition is subject to change at any time.
All investments are subject to risk including the possible loss of principal. Past performance is no guarantee of future results. All index performance reflects no deduction for fees, expenses or taxes. Please note that an investor cannot invest directly in an index.
The information provided is not intended to be a forecast of future events, a guarantee of future results or investment advice. Views expressed may differ from those of the firm as a whole.
| i | The S&P 500 Index is an unmanaged index of the stocks of 500 leading companies, and is generally representative of the performance of larger companies in the U.S. |
| ii | The Federal Reserve Board (the “Fed”) is responsible for the formulation of U.S. policies designed to promote economic growth, full employment, stable prices and a sustainable pattern of international trade and payments. |
| iii | A basis point is one-hundredth (1/100 or 0.01) of one percent. |
| iv | Gross domestic product (“GDP”) is the market value of all final goods and services produced within a country in a given period of time. |
| v | Lipper, Inc., a wholly-owned subsidiary of Reuters, provides independent insight on global collective investments. Returns are based on the period ended September 30, 2020, including the reinvestment of all distributions, including returns of capital, if any, calculated among the 117 funds for the six-month period and among the 116 funds for the twelve-month period in the Fund’s Lipper category, and excluding sales charges, if any. |
| QS S&P 500 Index Fund 2020 Annual Report | 5 |
Investment breakdown (%) as a percent of total investments
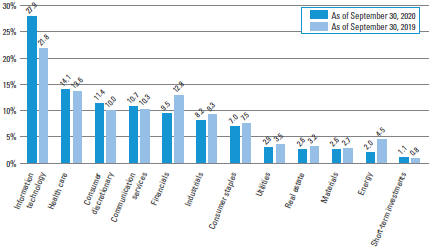
| † | The bar graph above represents the composition of the Fund’s investments as of September 30, 2020 and September 30, 2019 and does not include futures contracts. The composition of the Fund’s investments is subject to change at any time. |
| 6 | QS S&P 500 Index Fund 2020 Annual Report |
Example
As a shareholder of the Fund, you may incur two types of costs: (1) transaction costs and (2) ongoing costs, including management fees; service and/or distribution (12b-1) fees; and other Fund expenses. This example is intended to help you understand your ongoing costs (in dollars) of investing in the Fund and to compare these costs with the ongoing costs of investing in other mutual funds.
This example is based on an investment of $1,000 invested on April 1, 2020 and held for the six months ended September 30, 2020.
Actual expenses
The table below titled “Based on Actual Total Return” provides information about actual account values and actual expenses. You may use the information provided in this table, together with the amount you invested, to estimate the expenses that you paid over the period. To estimate the expenses you paid on your account, divide your ending account value by $1,000 (for example, an $8,600 ending account value divided by $1,000 = 8.6), then multiply the result by the number under the heading entitled “Expenses Paid During the Period”.
Hypothetical example for comparison purposes
The table below titled “Based on Hypothetical Total Return” provides information about hypothetical account values and hypothetical expenses based on the actual expense ratio and an assumed rate of return of 5.00% per year before expenses, which is not the Fund’s actual return. The hypothetical account values and expenses may not be used to estimate the actual ending account balance or expenses you paid for the period. You may use the information provided in this table to compare the ongoing costs of investing in the Fund and other funds. To do so, compare the 5.00% hypothetical example relating to the Fund with the 5.00% hypothetical examples that appear in the shareholder reports of the other funds.
Please note that the expenses shown in the table below are meant to highlight your ongoing costs only and do not reflect any transactional costs. Therefore, the table is useful in comparing ongoing costs only, and will not help you determine the relative total costs of owning different funds. In addition, if these transaction costs were included, your costs would have been higher.
| Based on actual total return1 | Based on hypothetical total return1 | |||||||||||||||||||||||||||||||||||||||||||||
Actual Total Return2 | Beginning Account Value | Ending Account Value | Annualized Expense Ratio | Expenses Paid During the Period3 | Hypothetical Annualized Total Return | Beginning Account Value | Ending Account Value | Annualized Expense Ratio | Expenses Paid During the Period3 | |||||||||||||||||||||||||||||||||||||
| Class A | 30.94 | % | $ | 1,000.00 | $ | 1,309.40 | 0.59 | % | $ | 3.41 | Class A | 5.00 | % | $ | 1,000.00 | $ | 1,022.05 | 0.59 | % | $ | 2.98 | |||||||||||||||||||||||||
| Class D | 31.09 | 1,000.00 | 1,310.90 | 0.39 | 2.25 | Class D | 5.00 | 1,000.00 | 1,023.05 | 0.39 | 1.97 | |||||||||||||||||||||||||||||||||||
| QS S&P 500 Index Fund 2020 Annual Report | 7 |
Fund expenses (unaudited) (cont’d)
| 1 | For the six months ended September 30, 2020. |
| 2 | Assumes the reinvestment of all distributions, including returns of capital, if any, at net asset value. Total return is not annualized, as it may not be representative of the total return for the year. Performance figures may reflect compensating balance arrangements, fee waivers and/or expense reimbursements. In the absence of compensating balance arrangements, fee waivers and/or expense reimbursements, the total return would have been lower. Past performance is no guarantee of future results. |
| 3 | Expenses (net of compensating balance arrangements, fee waivers and/or expense reimbursements) are equal to each class’ respective annualized expense ratio multiplied by the average account value over the period, multiplied by the number of days in the most recent fiscal half-year (183), then divided by 366. |
| 8 | QS S&P 500 Index Fund 2020 Annual Report |
| Average annual total returns1 | ||||||||||||
| Without sales charges | Class A | Class D | ||||||||||
| Twelve Months Ended 9/30/20 | 14.55 | % | 14.78 | % | ||||||||
| Five Years Ended 9/30/20 | 13.51 | 13.74 | ||||||||||
| Ten Years Ended 9/30/20 | 13.10 | 13.34 | ||||||||||
| Cumulative total returns1 | ||||
| Without sales charges | ||||
| Class A (9/30/10 through 9/30/20) | 242.58 | % | ||
| Class D (9/30/10 through 9/30/20) | 249.70 | |||
All figures represent past performance and are not a guarantee of future results. Investment return and principal value of an investment will fluctuate so that an investor’s shares, when redeemed, may be worth more or less than their original cost. The returns shown do not reflect the deduction of taxes that a shareholder would pay on Fund distributions or the redemption of Fund shares. Performance figures may reflect compensating balance arrangements, fee waivers and/or expense reimbursements. In the absence of compensating balance arrangements, fee waivers and/or expense reimbursements, the total return would have been lower.
| 1 | Assumes the reinvestment of all distributions, including returns of capital, if any, at net asset value. |
| QS S&P 500 Index Fund 2020 Annual Report | 9 |
Fund performance (unaudited) (cont’d)
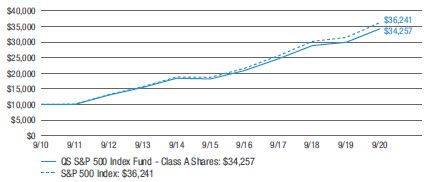
Historical performance
Value of $10,000 invested
Class A Shares of QS S&P 500 Index Fund vs. S&P 500 Index† — September 2010 — September 2020
All figures represent past performance and are not a guarantee of future results. Investment return and principal value of an investment will fluctuate so that an investor’s shares, when redeemed, may be worth more or less than their original cost. The returns shown do not reflect the deduction of taxes that a shareholder would pay on Fund distributions or the redemption of Fund shares. Performance figures may reflect compensating balance arrangements, fee waivers and/or expense reimbursements. In the absence of compensating balance arrangements, fee waivers and/or expense reimbursements, the total return would have been lower.
| † | Hypothetical illustration of $10,000 invested in Class A shares of QS S&P 500 Index Fund on September 30, 2010, assuming the reinvestment of all distributions, including returns of capital, if any, at net asset value through September 30, 2020. The hypothetical illustration also assumes a $10,000 investment in the S&P 500 Index. The S&P 500 Index (the “Index”) is an unmanaged index of 500 stocks and is generally representative of the performance of larger companies in the U.S. The Index is unmanaged and is not subject to the same management and trading expenses as a mutual fund. Please note that an investor cannot invest directly in an index. The performance of the Fund’s other class may be greater or less than the Class A shares performance indicated on this chart, depending on whether greater or lesser fees were incurred by shareholders investing in the other class. |
| 10 | QS S&P 500 Index Fund 2020 Annual Report |
September 30, 2020
QS S&P 500 Index Fund
| Security | Shares | Value | ||||||
| Common Stocks — 98.9% | ||||||||
| Communication Services — 10.7% | ||||||||
Diversified Telecommunication Services — 1.6% | ||||||||
AT&T Inc. | 72,620 | $ | 2,070,396 | |||||
CenturyLink Inc. | 9,599 | 96,854 | ||||||
Verizon Communications Inc. | 42,186 | 2,509,645 | ||||||
Total Diversified Telecommunication Services | 4,676,895 | |||||||
Entertainment — 2.0% | ||||||||
Activision Blizzard Inc. | 7,764 | 628,496 | ||||||
Electronic Arts Inc. | 2,969 | 387,187 | * | |||||
Live Nation Entertainment Inc. | 1,353 | 72,900 | * | |||||
Netflix Inc. | 4,487 | 2,243,634 | * | |||||
Take-Two Interactive Software Inc. | 1,162 | 191,986 | * | |||||
Walt Disney Co. | 18,291 | 2,269,547 | ||||||
Total Entertainment | 5,793,750 | |||||||
Interactive Media & Services — 5.5% | ||||||||
Alphabet Inc., Class A Shares | 3,052 | 4,473,011 | * | |||||
Alphabet Inc., Class C Shares | 2,991 | 4,395,574 | * | |||||
Facebook Inc., Class A Shares | 24,394 | 6,388,789 | * | |||||
Twitter Inc. | 7,927 | 352,751 | * | |||||
Total Interactive Media & Services | 15,610,125 | |||||||
Media — 1.3% | ||||||||
Charter Communications Inc., Class A Shares | 1,537 | 959,611 | * | |||||
Comcast Corp., Class A Shares | 46,214 | 2,137,860 | ||||||
Discovery Inc., Class A Shares | 1,990 | 43,322 | * | |||||
Discovery Inc., Class C Shares | 3,114 | 61,034 | * | |||||
DISH Network Corp., Class A Shares | 2,268 | 65,840 | * | |||||
Fox Corp., Class A Shares | 3,060 | 85,160 | ||||||
Fox Corp., Class B Shares | 1,790 | 50,066 | ||||||
Interpublic Group of Cos. Inc. | 3,892 | 64,880 | ||||||
News Corp., Class A Shares | 4,518 | 63,342 | ||||||
News Corp., Class B Shares | 1,815 | 25,374 | ||||||
Omnicom Group Inc. | 1,979 | 97,960 | ||||||
ViacomCBS Inc., Class B Shares | 5,259 | 147,305 | ||||||
Total Media | 3,801,754 | |||||||
Wireless Telecommunication Services — 0.3% | ||||||||
T-Mobile US Inc. | 5,863 | 670,493 | * | |||||
Total Communication Services | 30,553,017 | |||||||
See Notes to Financial Statements.
| QS S&P 500 Index Fund 2020 Annual Report | 11 |
Schedule of investments (cont’d)
September 30, 2020
QS S&P 500 Index Fund
| Security | Shares | Value | ||||||
| Consumer Discretionary — 11.4% | ||||||||
Auto Components — 0.1% | ||||||||
Aptiv PLC | 2,828 | $ | 259,271 | |||||
BorgWarner Inc. | 1,724 | 66,788 | ||||||
Total Auto Components | 326,059 | |||||||
Automobiles — 0.2% | ||||||||
Ford Motor Co. | 39,924 | 265,894 | ||||||
General Motors Co. | 13,139 | 388,783 | ||||||
Total Automobiles | 654,677 | |||||||
Distributors — 0.1% | ||||||||
Genuine Parts Co. | 1,579 | 150,273 | ||||||
LKQ Corp. | 3,026 | 83,911 | * | |||||
Total Distributors | 234,184 | |||||||
Hotels, Restaurants & Leisure — 1.6% | ||||||||
Carnival Corp. | 5,551 | 84,264 | ||||||
Chipotle Mexican Grill Inc. | 277 | 344,508 | * | |||||
Darden Restaurants Inc. | 1,259 | 126,832 | ||||||
Domino’s Pizza Inc. | 414 | 176,066 | ||||||
Hilton Worldwide Holdings Inc. | 2,886 | 246,233 | ||||||
Las Vegas Sands Corp. | 3,021 | 140,960 | ||||||
Marriott International Inc., Class A Shares | 2,532 | 234,413 | ||||||
McDonald’s Corp. | 7,495 | 1,645,078 | ||||||
MGM Resorts International | 4,649 | 101,116 | ||||||
Norwegian Cruise Line Holdings Ltd. | 3,368 | 57,626 | * | |||||
Royal Caribbean Cruises Ltd. | 1,870 | 121,045 | ||||||
Starbucks Corp. | 11,911 | 1,023,393 | ||||||
Wynn Resorts Ltd. | 1,135 | 81,504 | ||||||
Yum! Brands Inc. | 3,070 | 280,291 | ||||||
Total Hotels, Restaurants & Leisure | 4,663,329 | |||||||
Household Durables — 0.4% | ||||||||
DR Horton Inc. | 3,421 | 258,730 | ||||||
Garmin Ltd. | 1,491 | 141,436 | ||||||
Leggett & Platt Inc. | 1,381 | 56,856 | ||||||
Lennar Corp., Class A Shares | 2,944 | 240,466 | ||||||
Mohawk Industries Inc. | 594 | 57,968 | * | |||||
Newell Brands Inc. | 3,236 | 55,530 | ||||||
NVR Inc. | 32 | 130,660 | * | |||||
PulteGroup Inc. | 2,747 | 127,159 | ||||||
Whirlpool Corp. | 607 | 111,621 | ||||||
Total Household Durables | 1,180,426 | |||||||
See Notes to Financial Statements.
| 12 | QS S&P 500 Index Fund 2020 Annual Report |
QS S&P 500 Index Fund
| Security | Shares | Value | ||||||
Internet & Direct Marketing Retail — 5.2% | ||||||||
Amazon.com Inc. | 4,324 | $ | 13,615,108 | * | ||||
Booking Holdings Inc. | 417 | 713,354 | * | |||||
eBay Inc. | 6,960 | 362,616 | ||||||
Etsy Inc. | 1,173 | 142,672 | * | |||||
Expedia Group Inc. | 1,487 | 136,343 | ||||||
Total Internet & Direct Marketing Retail | 14,970,093 | |||||||
Leisure Products — 0.1% | ||||||||
Hasbro Inc. | 1,422 | 117,628 | ||||||
Multiline Retail — 0.5% | ||||||||
Dollar General Corp. | 2,515 | 527,194 | ||||||
Dollar Tree Inc. | 2,422 | 221,226 | * | |||||
Target Corp. | 5,070 | 798,119 | ||||||
Total Multiline Retail | 1,546,539 | |||||||
Specialty Retail — 2.5% | ||||||||
Advance Auto Parts Inc. | 633 | 97,166 | ||||||
AutoZone Inc. | 235 | 276,745 | * | |||||
Best Buy Co. Inc. | 2,344 | 260,864 | ||||||
CarMax Inc. | 1,613 | 148,251 | * | |||||
Gap Inc. | 2,770 | 47,173 | ||||||
Home Depot Inc. | 10,913 | 3,030,649 | ||||||
L Brands Inc. | 2,013 | 64,034 | ||||||
Lowe’s Cos. Inc. | 7,719 | 1,280,273 | ||||||
O’Reilly Automotive Inc. | 775 | 357,337 | * | |||||
Ross Stores Inc. | 3,524 | 328,860 | ||||||
Tiffany & Co. | 1,065 | 123,380 | ||||||
TJX Cos. Inc. | 12,117 | 674,311 | ||||||
Tractor Supply Co. | 1,256 | 180,035 | ||||||
Ulta Beauty Inc. | 603 | 135,060 | * | |||||
Total Specialty Retail | 7,004,138 | |||||||
Textiles, Apparel & Luxury Goods — 0.7% | ||||||||
Hanesbrands Inc. | 3,098 | 48,794 | ||||||
NIKE Inc., Class B Shares | 12,615 | 1,583,687 | ||||||
PVH Corp. | 562 | 33,518 | ||||||
Ralph Lauren Corp. | 631 | 42,889 | ||||||
Tapestry Inc. | 3,278 | 51,235 | ||||||
Under Armour Inc., Class A Shares | 2,300 | 25,829 | * | |||||
Under Armour Inc., Class C Shares | 2,316 | 22,789 | * | |||||
VF Corp. | 3,226 | 226,626 | ||||||
Total Textiles, Apparel & Luxury Goods | 2,035,367 | |||||||
Total Consumer Discretionary | 32,732,440 | |||||||
See Notes to Financial Statements.
| QS S&P 500 Index Fund 2020 Annual Report | 13 |
Schedule of investments (cont’d)
September 30, 2020
QS S&P 500 Index Fund
| Security | Shares | Value | ||||||
| Consumer Staples — 7.0% | ||||||||
Beverages — 1.7% | ||||||||
Brown-Forman Corp., Class B Shares | 1,828 | $ | 137,685 | |||||
Coca-Cola Co. | 39,376 | 1,943,993 | ||||||
Constellation Brands Inc., Class A Shares | 1,721 | 326,147 | ||||||
Molson Coors Beverage Co., Class B Shares | 1,712 | 57,455 | ||||||
Monster Beverage Corp. | 3,842 | 308,128 | * | |||||
PepsiCo Inc. | 14,153 | 1,961,606 | ||||||
Total Beverages | 4,735,014 | |||||||
Food & Staples Retailing — 1.5% | ||||||||
Costco Wholesale Corp. | 4,475 | 1,588,625 | ||||||
Kroger Co. | 8,207 | 278,299 | ||||||
Sysco Corp. | 5,003 | 311,287 | ||||||
Walgreens Boots Alliance Inc. | 7,385 | 265,269 | ||||||
Walmart Inc. | 14,204 | 1,987,282 | ||||||
Total Food & Staples Retailing | 4,430,762 | |||||||
Food Products — 1.1% | ||||||||
Archer-Daniels-Midland Co. | 5,491 | 255,277 | ||||||
Campbell Soup Co. | 1,906 | 92,193 | ||||||
Conagra Brands Inc. | 5,012 | 178,978 | ||||||
General Mills Inc. | 6,326 | 390,188 | ||||||
Hershey Co. | 1,514 | 217,017 | ||||||
Hormel Foods Corp. | 2,729 | 133,421 | ||||||
JM Smucker Co. | 1,187 | 137,122 | ||||||
Kellogg Co. | 2,585 | 166,965 | ||||||
Kraft Heinz Co. | 6,359 | 190,452 | ||||||
Lamb Weston Holdings Inc. | 1,304 | 86,416 | ||||||
McCormick & Co. Inc., Non Voting Shares | 1,310 | 254,271 | ||||||
Mondelez International Inc., Class A Shares | 14,439 | 829,521 | ||||||
Tyson Foods Inc., Class A Shares | 2,883 | 171,481 | ||||||
Total Food Products | 3,103,302 | |||||||
Household Products — 1.8% | ||||||||
Church & Dwight Co. Inc. | 2,549 | 238,867 | ||||||
Clorox Co. | 1,276 | 268,177 | ||||||
Colgate-Palmolive Co. | 8,748 | 674,908 | ||||||
Kimberly-Clark Corp. | 3,526 | 520,649 | ||||||
Procter & Gamble Co. | 25,282 | 3,513,945 | ||||||
Total Household Products | 5,216,546 | |||||||
Personal Products — 0.2% | ||||||||
Estee Lauder Cos. Inc., Class A Shares | 2,333 | 509,177 | ||||||
See Notes to Financial Statements.
| 14 | QS S&P 500 Index Fund 2020 Annual Report |
QS S&P 500 Index Fund
| Security | Shares | Value | ||||||
Tobacco — 0.7% | ||||||||
Altria Group Inc. | 18,875 | $ | 729,330 | |||||
Philip Morris International Inc. | 15,777 | 1,183,117 | ||||||
Total Tobacco | 1,912,447 | |||||||
Total Consumer Staples | 19,907,248 | |||||||
| Energy — 2.0% | ||||||||
Energy Equipment & Services — 0.2% | ||||||||
Baker Hughes Co. | 7,272 | 96,645 | ||||||
Halliburton Co. | 8,525 | 102,726 | ||||||
National Oilwell Varco Inc. | 4,715 | 42,718 | ||||||
Schlumberger Ltd. | 14,671 | 228,281 | ||||||
TechnipFMC PLC | 4,355 | 27,480 | ||||||
Total Energy Equipment & Services | 497,850 | |||||||
Oil, Gas & Consumable Fuels — 1.8% | ||||||||
Apache Corp. | 3,374 | 31,952 | ||||||
Cabot Oil & Gas Corp. | 4,506 | 78,224 | ||||||
Chevron Corp. | 19,135 | 1,377,720 | ||||||
Concho Resources Inc. | 2,150 | 94,858 | ||||||
ConocoPhillips | 10,739 | 352,669 | ||||||
Devon Energy Corp. | 4,322 | 40,886 | ||||||
Diamondback Energy Inc. | 1,740 | 52,409 | ||||||
EOG Resources Inc. | 6,045 | 217,257 | ||||||
Exxon Mobil Corp. | 42,179 | 1,448,005 | ||||||
Hess Corp. | 2,453 | 100,401 | ||||||
HollyFrontier Corp. | 1,430 | 28,185 | ||||||
Kinder Morgan Inc. | 20,039 | 247,081 | ||||||
Marathon Oil Corp. | 7,830 | 32,025 | ||||||
Marathon Petroleum Corp. | 6,587 | 193,263 | ||||||
Noble Energy Inc. | 5,769 | 49,325 | ||||||
Occidental Petroleum Corp. | 9,308 | 93,173 | ||||||
ONEOK Inc. | 4,646 | 120,703 | ||||||
Phillips 66 | 4,482 | 232,347 | ||||||
Pioneer Natural Resources Co. | 1,653 | 142,141 | ||||||
Valero Energy Corp. | 4,157 | 180,081 | ||||||
Williams Cos. Inc. | 12,610 | 247,787 | ||||||
Total Oil, Gas & Consumable Fuels | 5,360,492 | |||||||
Total Energy | 5,858,342 | |||||||
| Financials — 9.5% | ||||||||
Banks — 3.3% | ||||||||
Bank of America Corp. | 76,962 | 1,854,015 | ||||||
Citigroup Inc. | 21,166 | 912,466 | ||||||
See Notes to Financial Statements.
| QS S&P 500 Index Fund 2020 Annual Report | 15 |
Schedule of investments (cont’d)
September 30, 2020
QS S&P 500 Index Fund
| Security | Shares | Value | ||||||
Banks — continued | ||||||||
Citizens Financial Group Inc. | 4,580 | $ | 115,782 | |||||
Comerica Inc. | 1,200 | 45,900 | ||||||
Fifth Third Bancorp | 6,582 | 140,328 | ||||||
First Republic Bank | 1,740 | 189,764 | ||||||
Huntington Bancshares Inc. | 11,548 | 105,895 | ||||||
JPMorgan Chase & Co. | 30,847 | 2,969,641 | ||||||
KeyCorp | 9,904 | 118,155 | ||||||
M&T Bank Corp. | 1,349 | 124,229 | ||||||
People’s United Financial Inc. | 4,395 | 45,312 | ||||||
PNC Financial Services Group Inc. | 4,445 | 488,550 | ||||||
Regions Financial Corp. | 10,481 | 120,846 | ||||||
SVB Financial Group | 517 | 124,401 | * | |||||
Truist Financial Corp. | 13,226 | 503,249 | ||||||
US Bancorp | 13,530 | 485,051 | ||||||
Wells Fargo & Co. | 41,238 | 969,505 | ||||||
Zions Bancorp NA | 1,866 | 54,525 | ||||||
Total Banks | 9,367,614 | |||||||
Capital Markets — 2.5% | ||||||||
Ameriprise Financial Inc. | 1,289 | 198,648 | ||||||
Bank of New York Mellon Corp. | 8,297 | 284,919 | ||||||
BlackRock Inc. | 1,469 | 827,855 | ||||||
Cboe Global Markets Inc. | 1,107 | 97,128 | ||||||
Charles Schwab Corp. | 11,353 | 411,319 | ||||||
CME Group Inc. | 3,618 | 605,328 | ||||||
E*TRADE Financial Corp. | 2,245 | 112,362 | ||||||
Franklin Resources Inc. | 2,964 | 60,317 | (a) | |||||
Goldman Sachs Group Inc. | 3,471 | 697,567 | ||||||
Intercontinental Exchange Inc. | 5,595 | 559,780 | ||||||
Invesco Ltd. | 3,260 | 37,197 | ||||||
MarketAxess Holdings Inc. | 397 | 191,191 | ||||||
Moody’s Corp. | 1,668 | �� | 483,470 | |||||
Morgan Stanley | 12,184 | 589,096 | ||||||
MSCI Inc. | 851 | 303,620 | ||||||
Nasdaq Inc. | 1,134 | 139,153 | ||||||
Northern Trust Corp. | 2,128 | 165,920 | ||||||
Raymond James Financial Inc. | 1,200 | 87,312 | ||||||
S&P Global Inc. | 2,445 | 881,667 | ||||||
State Street Corp. | 3,389 | 201,069 | ||||||
T. Rowe Price Group Inc. | 2,317 | 297,086 | ||||||
Total Capital Markets | 7,232,004 | |||||||
See Notes to Financial Statements.
| 16 | QS S&P 500 Index Fund 2020 Annual Report |
QS S&P 500 Index Fund
| Security | Shares | Value | ||||||
Consumer Finance — 0.4% | ||||||||
American Express Co. | 6,691 | $ | 670,773 | |||||
Capital One Financial Corp. | 4,708 | 338,317 | ||||||
Discover Financial Services | 3,174 | 183,394 | ||||||
Synchrony Financial | 5,420 | 141,841 | ||||||
Total Consumer Finance | 1,334,325 | |||||||
Diversified Financial Services — 1.5% | ||||||||
Berkshire Hathaway Inc., Class B Shares | 20,141 | 4,288,825 | * | |||||
Insurance — 1.8% | ||||||||
Aflac Inc. | 6,420 | 233,367 | ||||||
Allstate Corp. | 3,075 | 289,480 | ||||||
American International Group Inc. | 8,964 | 246,779 | ||||||
Aon PLC, Class A Shares | 2,313 | 477,172 | ||||||
Arthur J Gallagher & Co. | 1,865 | 196,907 | ||||||
Assurant Inc. | 545 | 66,114 | ||||||
Chubb Ltd. | 4,623 | 536,823 | ||||||
Cincinnati Financial Corp. | 1,588 | 123,816 | ||||||
Everest Re Group Ltd. | 424 | 83,757 | ||||||
Globe Life Inc. | 1,095 | 87,491 | ||||||
Hartford Financial Services Group Inc. | 3,849 | 141,874 | ||||||
Lincoln National Corp. | 2,197 | 68,832 | ||||||
Loews Corp. | 1,912 | 66,442 | ||||||
Marsh & McLennan Cos. Inc. | 5,113 | 586,461 | ||||||
MetLife Inc. | 7,887 | 293,160 | ||||||
Principal Financial Group Inc. | 2,504 | 100,836 | ||||||
Progressive Corp. | 6,035 | 571,333 | ||||||
Prudential Financial Inc. | 4,069 | 258,463 | ||||||
Travelers Cos. Inc. | 2,594 | 280,645 | ||||||
Unum Group | 1,562 | 26,288 | ||||||
Willis Towers Watson PLC | 1,283 | 267,916 | ||||||
WR Berkley Corp. | 1,500 | 91,725 | ||||||
Total Insurance | 5,095,681 | |||||||
Total Financials | 27,318,449 | |||||||
| Health Care — 14.1% | ||||||||
Biotechnology — 2.1% | ||||||||
AbbVie Inc. | 17,938 | 1,571,189 | ||||||
Alexion Pharmaceuticals Inc. | 2,168 | 248,084 | * | |||||
Amgen Inc. | 5,927 | 1,506,406 | ||||||
Biogen Inc. | 1,632 | 462,966 | * | |||||
Gilead Sciences Inc. | 12,750 | 805,673 | ||||||
Incyte Corp. | 1,919 | 172,211 | * | |||||
See Notes to Financial Statements.
| QS S&P 500 Index Fund 2020 Annual Report | 17 |
Schedule of investments (cont’d)
September 30, 2020
QS S&P 500 Index Fund
| Security | Shares | Value | ||||||
Biotechnology — continued | ||||||||
Regeneron Pharmaceuticals Inc. | 1,038 | $ | 581,052 | * | ||||
Vertex Pharmaceuticals Inc. | 2,664 | 724,928 | * | |||||
Total Biotechnology | 6,072,509 | |||||||
Health Care Equipment & Supplies — 3.9% | ||||||||
Abbott Laboratories | 17,963 | 1,954,913 | ||||||
ABIOMED Inc. | 423 | 117,196 | * | |||||
Align Technology Inc. | 732 | 239,628 | * | |||||
Baxter International Inc. | 5,097 | 409,901 | ||||||
Becton Dickinson and Co. | 2,922 | 679,891 | ||||||
Boston Scientific Corp. | 14,418 | 550,912 | * | |||||
Cooper Cos. Inc. | 527 | 177,662 | ||||||
Danaher Corp. | 6,456 | 1,390,171 | ||||||
DENTSPLY SIRONA Inc. | 2,099 | 91,789 | ||||||
DexCom Inc. | 976 | 402,336 | * | |||||
Edwards Lifesciences Corp. | 6,205 | 495,283 | * | |||||
Hologic Inc. | 2,539 | 168,767 | * | |||||
IDEXX Laboratories Inc. | 882 | 346,723 | * | |||||
Intuitive Surgical Inc. | 1,177 | 835,129 | * | |||||
Medtronic PLC | 13,663 | 1,419,859 | ||||||
ResMed Inc. | 1,526 | 261,602 | ||||||
STERIS PLC | 817 | 143,947 | ||||||
Stryker Corp. | 3,348 | 697,623 | ||||||
Teleflex Inc. | 453 | 154,210 | ||||||
Varian Medical Systems Inc. | 935 | 160,820 | * | |||||
West Pharmaceutical Services Inc. | 790 | 217,171 | ||||||
Zimmer Biomet Holdings Inc. | 2,026 | 275,820 | ||||||
Total Health Care Equipment & Supplies | 11,191,353 | |||||||
Health Care Providers & Services — 2.6% | ||||||||
AmerisourceBergen Corp. | 1,410 | 136,657 | ||||||
Anthem Inc. | 2,531 | 679,801 | ||||||
Cardinal Health Inc. | 3,152 | 147,986 | ||||||
Centene Corp. | 5,953 | 347,239 | * | |||||
Cigna Corp. | 3,745 | 634,440 | ||||||
CVS Health Corp. | 13,147 | 767,785 | ||||||
DaVita Inc. | 744 | 63,724 | * | |||||
HCA Healthcare Inc. | 2,617 | 326,288 | ||||||
Henry Schein Inc. | 1,268 | 74,533 | * | |||||
Humana Inc. | 1,325 | 548,404 | ||||||
Laboratory Corp. of America Holdings | 1,048 | 197,307 | * | |||||
McKesson Corp. | 1,659 | 247,075 | ||||||
See Notes to Financial Statements.
| 18 | QS S&P 500 Index Fund 2020 Annual Report |
QS S&P 500 Index Fund
| Security | Shares | Value | ||||||
Health Care Providers & Services — continued | ||||||||
Quest Diagnostics Inc. | 1,454 | $ | 166,468 | |||||
UnitedHealth Group Inc. | 9,687 | 3,020,116 | ||||||
Universal Health Services Inc., Class B Shares | 799 | 85,509 | ||||||
Total Health Care Providers & Services | 7,443,332 | |||||||
Health Care Technology — 0.1% | ||||||||
Cerner Corp. | 2,982 | 215,569 | ||||||
Life Sciences Tools & Services — 1.2% | ||||||||
Agilent Technologies Inc. | 3,103 | 313,217 | ||||||
Bio-Rad Laboratories Inc., Class A Shares | 220 | 113,401 | * | |||||
Illumina Inc. | 1,518 | 469,183 | * | |||||
IQVIA Holdings Inc. | 1,937 | 305,329 | * | |||||
Mettler-Toledo International Inc. | 246 | 237,575 | * | |||||
PerkinElmer Inc. | 1,221 | 153,248 | ||||||
Thermo Fisher Scientific Inc. | 4,031 | 1,779,767 | ||||||
Waters Corp. | 679 | 132,867 | * | |||||
Total Life Sciences Tools & Services | 3,504,587 | |||||||
Pharmaceuticals — 4.2% | ||||||||
Bristol-Myers Squibb Co. | 22,830 | 1,376,421 | ||||||
Catalent Inc. | 1,623 | 139,026 | * | |||||
Eli Lilly & Co. | 8,083 | 1,196,446 | ||||||
Johnson & Johnson | 26,861 | 3,999,066 | ||||||
Merck & Co. Inc. | 25,647 | 2,127,419 | ||||||
Mylan NV | 5,798 | 85,984 | * | |||||
Perrigo Co. PLC | 1,347 | 61,841 | ||||||
Pfizer Inc. | 56,595 | 2,077,036 | ||||||
Zoetis Inc. | 4,834 | 799,398 | ||||||
Total Pharmaceuticals | 11,862,637 | |||||||
Total Health Care | 40,289,987 | |||||||
| Industrials — 8.2% | ||||||||
Aerospace & Defense — 1.6% | ||||||||
Boeing Co. | 5,344 | 883,149 | ||||||
General Dynamics Corp. | 2,415 | 334,309 | ||||||
Howmet Aerospace Inc. | 4,439 | 74,220 | ||||||
Huntington Ingalls Industries Inc. | 455 | 64,041 | ||||||
L3Harris Technologies Inc. | 2,193 | 372,459 | ||||||
Lockheed Martin Corp. | 2,497 | 957,050 | ||||||
Northrop Grumman Corp. | 1,554 | 490,272 | ||||||
Raytheon Technologies Corp. | 15,350 | 883,239 | ||||||
Teledyne Technologies Inc. | 371 | 115,088 | * | |||||
See Notes to Financial Statements.
| QS S&P 500 Index Fund 2020 Annual Report | 19 |
Schedule of investments (cont’d)
September 30, 2020
QS S&P 500 Index Fund
| Security | Shares | Value | ||||||
Aerospace & Defense — continued | ||||||||
Textron Inc. | 2,115 | $ | 76,330 | |||||
TransDigm Group Inc. | 565 | 268,443 | ||||||
Total Aerospace & Defense | 4,518,600 | |||||||
Air Freight & Logistics — 0.7% | ||||||||
CH Robinson Worldwide Inc. | 1,271 | 129,883 | ||||||
Expeditors International of Washington Inc. | 1,657 | 149,992 | ||||||
FedEx Corp. | 2,417 | 607,924 | ||||||
United Parcel Service Inc., Class B Shares | 7,277 | 1,212,567 | ||||||
Total Air Freight & Logistics | 2,100,366 | |||||||
Airlines — 0.2% | ||||||||
Alaska Air Group Inc. | 1,196 | 43,809 | ||||||
American Airlines Group Inc. | 5,772 | 70,938 | ||||||
Delta Air Lines Inc. | 6,426 | 196,507 | ||||||
Southwest Airlines Co. | 6,004 | 225,150 | ||||||
United Airlines Holdings Inc. | 2,884 | 100,219 | * | |||||
Total Airlines | 636,623 | |||||||
Building Products — 0.5% | ||||||||
Allegion PLC | 914 | 90,404 | ||||||
AO Smith Corp. | 1,160 | 61,248 | ||||||
Carrier Global Corp. | 8,445 | 257,910 | ||||||
Fortune Brands Home & Security Inc. | 1,485 | 128,482 | ||||||
Johnson Controls International PLC | 7,349 | 300,207 | ||||||
Masco Corp. | 2,700 | 148,851 | ||||||
Trane Technologies PLC | 2,561 | 310,521 | ||||||
Total Building Products | 1,297,623 | |||||||
Commercial Services & Supplies — 0.4% | ||||||||
Cintas Corp. | 845 | 281,241 | ||||||
Copart Inc. | 2,048 | 215,368 | * | |||||
Republic Services Inc. | 2,129 | 198,742 | ||||||
Rollins Inc. | 1,302 | 70,555 | ||||||
Waste Management Inc. | 4,038 | 456,981 | ||||||
Total Commercial Services & Supplies | 1,222,887 | |||||||
Construction & Engineering — 0.1% | ||||||||
Jacobs Engineering Group Inc. | 1,331 | 123,477 | ||||||
Quanta Services Inc. | 1,444 | 76,330 | ||||||
Total Construction & Engineering | 199,807 | |||||||
Electrical Equipment — 0.5% | ||||||||
AMETEK Inc. | 2,384 | 236,969 | ||||||
Eaton Corp. PLC | 4,172 | 425,669 | ||||||
See Notes to Financial Statements.
| 20 | QS S&P 500 Index Fund 2020 Annual Report |
QS S&P 500 Index Fund
| Security | Shares | Value | ||||||
Electrical Equipment — continued | ||||||||
Emerson Electric Co. | 6,212 | $ | 407,321 | |||||
Rockwell Automation Inc. | 1,210 | 267,023 | ||||||
Total Electrical Equipment | 1,336,982 | |||||||
Industrial Conglomerates — 1.1% | ||||||||
3M Co. | 5,923 | 948,746 | ||||||
General Electric Co. | 88,061 | 548,620 | ||||||
Honeywell International Inc. | 7,178 | 1,181,571 | ||||||
Roper Technologies Inc. | 1,082 | 427,509 | ||||||
Total Industrial Conglomerates | 3,106,446 | |||||||
Machinery — 1.6% | ||||||||
Caterpillar Inc. | 5,430 | 809,885 | ||||||
Cummins Inc. | 1,530 | 323,075 | ||||||
Deere & Co. | 3,242 | 718,524 | ||||||
Dover Corp. | 1,584 | 171,611 | ||||||
Flowserve Corp. | 1,680 | 45,847 | ||||||
Fortive Corp. | 3,346 | 254,999 | ||||||
IDEX Corp. | 850 | 155,049 | ||||||
Illinois Tool Works Inc. | 2,954 | 570,742 | ||||||
Ingersoll Rand Inc. | 3,367 | 119,865 | * | |||||
Otis Worldwide Corp. | 4,222 | 263,537 | ||||||
PACCAR Inc. | 3,442 | 293,534 | ||||||
Parker-Hannifin Corp. | 1,369 | 277,003 | ||||||
Pentair PLC | 1,988 | 90,991 | ||||||
Snap-on Inc. | 634 | 93,280 | ||||||
Stanley Black & Decker Inc. | 1,600 | 259,520 | ||||||
Westinghouse Air Brake Technologies Corp. | 1,857 | 114,911 | ||||||
Xylem Inc. | 1,753 | 147,462 | ||||||
Total Machinery | 4,709,835 | |||||||
Professional Services — 0.3% | ||||||||
Equifax Inc. | 1,209 | 189,692 | ||||||
IHS Markit Ltd. | 3,666 | 287,818 | ||||||
Nielsen Holdings PLC | 3,464 | 49,120 | ||||||
Robert Half International Inc. | 1,065 | 56,381 | ||||||
Verisk Analytics Inc. | 1,678 | 310,950 | ||||||
Total Professional Services | 893,961 | |||||||
Road & Rail — 1.0% | ||||||||
CSX Corp. | 7,677 | 596,273 | ||||||
J.B. Hunt Transport Services Inc. | 931 | 117,660 | ||||||
Kansas City Southern | 1,010 | 182,638 | ||||||
Norfolk Southern Corp. | 2,570 | 549,954 | ||||||
See Notes to Financial Statements.
| QS S&P 500 Index Fund 2020 Annual Report | 21 |
Schedule of investments (cont’d)
September 30, 2020
QS S&P 500 Index Fund
| Security | Shares | Value | ||||||
Road & Rail — continued | ||||||||
Old Dominion Freight Line Inc. | 932 | $ | 168,617 | |||||
Union Pacific Corp. | 6,926 | 1,363,522 | ||||||
Total Road & Rail | 2,978,664 | |||||||
Trading Companies & Distributors — 0.2% | ||||||||
Fastenal Co. | 5,412 | 244,027 | ||||||
United Rentals Inc. | 788 | 137,506 | * | |||||
W.W. Grainger Inc. | 369 | 131,648 | ||||||
Total Trading Companies & Distributors | 513,181 | |||||||
Total Industrials | 23,514,975 | |||||||
| Information Technology — 27.9% | ||||||||
Communications Equipment — 0.8% | ||||||||
Arista Networks Inc. | 550 | 113,811 | * | |||||
Cisco Systems Inc. | 42,958 | 1,692,116 | ||||||
F5 Networks Inc. | 622 | 76,363 | * | |||||
Juniper Networks Inc. | 3,087 | 66,371 | ||||||
Motorola Solutions Inc. | 1,682 | 263,754 | ||||||
Total Communications Equipment | 2,212,415 | |||||||
Electronic Equipment, Instruments & Components — 0.5% | ||||||||
Amphenol Corp., Class A Shares | 3,042 | 329,357 | ||||||
CDW Corp. | 1,358 | 162,322 | ||||||
Corning Inc. | 7,867 | 254,969 | ||||||
FLIR Systems Inc. | 1,536 | 55,066 | ||||||
IPG Photonics Corp. | 314 | 53,371 | * | |||||
Keysight Technologies Inc. | 1,817 | 179,483 | * | |||||
TE Connectivity Ltd. | 3,450 | 337,203 | ||||||
Zebra Technologies Corp., Class A Shares | 523 | 132,037 | * | |||||
Total Electronic Equipment, Instruments & Components | 1,503,808 | |||||||
IT Services — 5.6% | ||||||||
Accenture PLC, Class A Shares | 6,459 | 1,459,669 | ||||||
Akamai Technologies Inc. | 1,641 | 181,396 | * | |||||
Automatic Data Processing Inc. | 4,411 | 615,290 | ||||||
Broadridge Financial Solutions Inc. | 1,203 | 158,796 | ||||||
Cognizant Technology Solutions Corp., Class A Shares | 5,615 | 389,793 | ||||||
DXC Technology Co. | 2,997 | 53,496 | ||||||
Fidelity National Information Services Inc. | 6,368 | 937,433 | ||||||
Fiserv Inc. | 5,711 | 588,519 | * | |||||
FleetCor Technologies Inc. | 880 | 209,528 | * | |||||
Gartner Inc. | 943 | 117,828 | * | |||||
Global Payments Inc. | 3,039 | 539,666 | ||||||
International Business Machines Corp. | 9,086 | 1,105,494 | ||||||
See Notes to Financial Statements.
| 22 | QS S&P 500 Index Fund 2020 Annual Report |
QS S&P 500 Index Fund
| Security | Shares | Value | ||||||
IT Services — continued | ||||||||
Jack Henry & Associates Inc. | 759 | $ | 123,406 | |||||
Leidos Holdings Inc. | 1,313 | 117,054 | ||||||
Mastercard Inc., Class A Shares | 8,975 | 3,035,076 | ||||||
Paychex Inc. | 3,314 | 264,358 | ||||||
PayPal Holdings Inc. | 11,968 | 2,358,055 | * | |||||
VeriSign Inc. | 1,050 | 215,093 | * | |||||
Visa Inc., Class A Shares | 17,156 | 3,430,685 | ||||||
Western Union Co. | 4,242 | 90,906 | ||||||
Total IT Services | 15,991,541 | |||||||
Semiconductors & Semiconductor Equipment — 5.0% | ||||||||
Advanced Micro Devices Inc. | 11,892 | 975,025 | * | |||||
Analog Devices Inc. | 3,704 | 432,405 | ||||||
Applied Materials Inc. | 9,148 | 543,849 | ||||||
Broadcom Inc. | 4,062 | 1,479,868 | ||||||
Intel Corp. | 43,105 | 2,231,977 | ||||||
KLA Corp. | 1,548 | 299,909 | ||||||
Lam Research Corp. | 1,477 | 489,995 | ||||||
Maxim Integrated Products Inc. | 2,474 | 167,267 | ||||||
Microchip Technology Inc. | 2,573 | 264,401 | ||||||
Micron Technology Inc. | 11,219 | 526,844 | * | |||||
NVIDIA Corp. | 6,287 | 3,402,650 | ||||||
Qorvo Inc. | 1,184 | 152,748 | * | |||||
QUALCOMM Inc. | 11,526 | 1,356,380 | ||||||
Skyworks Solutions Inc. | 1,742 | 253,461 | ||||||
Teradyne Inc. | 1,633 | 129,758 | ||||||
Texas Instruments Inc. | 9,276 | 1,324,520 | ||||||
Xilinx Inc. | 2,509 | 261,538 | ||||||
Total Semiconductors & Semiconductor Equipment | 14,292,595 | |||||||
Software — 9.1% | ||||||||
Adobe Inc. | 4,856 | 2,381,528 | * | |||||
ANSYS Inc. | 887 | 290,253 | * | |||||
Autodesk Inc. | 2,188 | 505,450 | * | |||||
Cadence Design Systems Inc. | 2,948 | 314,345 | * | |||||
Citrix Systems Inc. | 1,270 | 174,892 | ||||||
Fortinet Inc. | 1,400 | 164,934 | * | |||||
Intuit Inc. | 2,664 | 869,023 | ||||||
Microsoft Corp. | 76,899 | 16,174,167 | ||||||
NortonLifeLock Inc. | 6,186 | 128,916 | ||||||
Oracle Corp. | 19,537 | 1,166,359 | ||||||
Paycom Software Inc. | 530 | 164,989 | * | |||||
See Notes to Financial Statements.
| QS S&P 500 Index Fund 2020 Annual Report | 23 |
Schedule of investments (cont’d)
September 30, 2020
QS S&P 500 Index Fund
| Security | Shares | Value | ||||||
Software — continued | ||||||||
salesforce.com Inc. | 9,259 | $ | 2,326,972 | * | ||||
ServiceNow Inc. | 1,961 | 951,085 | * | |||||
Synopsys Inc. | 1,579 | 337,874 | * | |||||
Tyler Technologies Inc. | 414 | 144,304 | * | |||||
Total Software | 26,095,091 | |||||||
Technology Hardware, Storage & Peripherals — 6.9% | ||||||||
Apple Inc. | 163,331 | 18,915,363 | ||||||
Hewlett Packard Enterprise Co. | 13,767 | 128,997 | ||||||
HP Inc. | 13,932 | 264,569 | ||||||
NetApp Inc. | 2,380 | 104,339 | ||||||
Seagate Technology PLC | 2,176 | 107,211 | ||||||
Western Digital Corp. | 3,340 | 122,077 | ||||||
Xerox Holdings Corp. | 1,849 | 34,706 | ||||||
Total Technology Hardware, Storage & Peripherals | 19,677,262 | |||||||
Total Information Technology | 79,772,712 | |||||||
| Materials — 2.6% | ||||||||
Chemicals — 1.8% | ||||||||
Air Products & Chemicals Inc. | 2,254 | 671,377 | ||||||
Albemarle Corp. | 965 | 86,155 | ||||||
Celanese Corp. | 1,171 | 125,824 | ||||||
CF Industries Holdings Inc. | 2,121 | 65,136 | ||||||
Corteva Inc. | 7,551 | 217,544 | ||||||
Dow Inc. | 7,333 | 345,018 | ||||||
DuPont de Nemours Inc. | 7,165 | 397,514 | ||||||
Eastman Chemical Co. | 1,342 | 104,837 | ||||||
Ecolab Inc. | 2,467 | 493,005 | ||||||
FMC Corp. | 1,333 | 141,178 | ||||||
International Flavors & Fragrances Inc. | 1,136 | 139,103 | ||||||
Linde PLC | 5,401 | 1,286,140 | ||||||
LyondellBasell Industries NV, Class A Shares | 2,441 | 172,066 | ||||||
Mosaic Co. | 3,820 | 69,791 | ||||||
PPG Industries Inc. | 2,321 | 283,348 | ||||||
Sherwin-Williams Co. | 847 | 590,139 | ||||||
Total Chemicals | 5,188,175 | |||||||
Construction Materials — 0.1% | ||||||||
Martin Marietta Materials Inc. | 652 | 153,455 | ||||||
Vulcan Materials Co. | 1,369 | 185,554 | ||||||
Total Construction Materials | 339,009 | |||||||
Containers & Packaging — 0.4% | ||||||||
Amcor PLC | 15,613 | 172,523 | ||||||
See Notes to Financial Statements.
| 24 | QS S&P 500 Index Fund 2020 Annual Report |
QS S&P 500 Index Fund
| Security | Shares | Value | ||||||
Containers & Packaging — continued | ||||||||
Avery Dennison Corp. | 826 | $ | 105,596 | |||||
Ball Corp. | 3,157 | 262,410 | ||||||
International Paper Co. | 4,090 | 165,808 | ||||||
Packaging Corp. of America | 917 | 99,999 | ||||||
Sealed Air Corp. | 1,631 | 63,299 | ||||||
Westrock Co. | 2,409 | 83,689 | ||||||
Total Containers & Packaging | 953,324 | |||||||
Metals & Mining — 0.3% | ||||||||
Freeport-McMoRan Inc. | 14,366 | 224,684 | ||||||
Newmont Corp. | 8,280 | 525,366 | ||||||
Nucor Corp. | 2,812 | 126,147 | ||||||
Total Metals & Mining | 876,197 | |||||||
Total Materials | 7,356,705 | |||||||
| Real Estate — 2.6% | ||||||||
Equity Real Estate Investment Trusts (REITs) — 2.6% | ||||||||
Alexandria Real Estate Equities Inc. | 1,225 | 196,000 | ||||||
American Tower Corp. | 4,475 | 1,081,742 | ||||||
Apartment Investment & Management Co., Class A Shares | 1,440 | 48,557 | ||||||
AvalonBay Communities Inc. | 1,502 | 224,309 | ||||||
Boston Properties Inc. | 1,448 | 116,274 | ||||||
Crown Castle International Corp. | 4,204 | 699,966 | ||||||
Digital Realty Trust Inc. | 2,710 | 397,720 | ||||||
Duke Realty Corp. | 3,685 | 135,977 | ||||||
Equinix Inc. | 892 | 678,036 | ||||||
Equity Residential | 3,645 | 187,098 | ||||||
Essex Property Trust Inc. | 693 | 139,148 | ||||||
Extra Space Storage Inc. | 1,257 | 134,486 | ||||||
Federal Realty Investment Trust | 653 | 47,956 | ||||||
Healthpeak Properties Inc. | 5,726 | 155,461 | ||||||
Host Hotels & Resorts Inc. | 8,093 | 87,323 | ||||||
Iron Mountain Inc. | 2,809 | 75,253 | ||||||
Kimco Realty Corp. | 3,796 | 42,743 | ||||||
Mid-America Apartment Communities Inc. | 1,234 | 143,082 | ||||||
Prologis Inc. | 7,545 | 759,178 | ||||||
Public Storage | 1,540 | 342,989 | ||||||
Realty Income Corp. | 3,663 | 222,527 | ||||||
Regency Centers Corp. | 1,820 | 69,196 | ||||||
SBA Communications Corp. | 1,135 | 361,475 | ||||||
Simon Property Group Inc. | 3,079 | 199,150 | ||||||
SL Green Realty Corp. | 858 | 39,785 | ||||||
See Notes to Financial Statements.
| QS S&P 500 Index Fund 2020 Annual Report | 25 |
Schedule of investments (cont’d)
September 30, 2020
QS S&P 500 Index Fund
| Security | Shares | Value | ||||||
Equity Real Estate Investment Trusts (REITs) — continued | ||||||||
UDR Inc. | 2,877 | $93,819 | ||||||
Ventas Inc. | 3,955 | 165,952 | ||||||
Vornado Realty Trust | 1,688 | 56,903 | ||||||
Welltower Inc. | 4,037 | 222,398 | ||||||
Weyerhaeuser Co. | 7,195 | 205,201 | ||||||
Total Equity Real Estate Investment Trusts (REITs) | 7,329,704 | |||||||
Real Estate Management & Development — 0.0%†† | ||||||||
CBRE Group Inc., Class A Shares | 3,133 | 147,157 | * | |||||
Total Real Estate | 7,476,861 | |||||||
| Utilities — 2.9% | ||||||||
Electric Utilities — 1.8% | ||||||||
Alliant Energy Corp. | 2,384 | 123,134 | ||||||
American Electric Power Co. Inc. | 4,955 | 404,972 | ||||||
Duke Energy Corp. | 7,533 | 667,122 | ||||||
Edison International | 3,919 | 199,242 | ||||||
Entergy Corp. | 1,973 | 194,400 | ||||||
Evergy Inc. | 2,260 | 114,853 | ||||||
Eversource Energy | 3,504 | 292,759 | ||||||
Exelon Corp. | 10,016 | 358,172 | ||||||
FirstEnergy Corp. | 5,705 | 163,790 | ||||||
NextEra Energy Inc. | 4,951 | 1,374,200 | ||||||
NRG Energy Inc. | 2,314 | 71,132 | ||||||
Pinnacle West Capital Corp. | 1,201 | 89,535 | ||||||
PPL Corp. | 7,827 | 212,973 | ||||||
Southern Co. | 10,817 | 586,498 | ||||||
Xcel Energy Inc. | 5,372 | 370,722 | ||||||
Total Electric Utilities | 5,223,504 | |||||||
Gas Utilities — 0.1% | ||||||||
Atmos Energy Corp. | 1,300 | 124,267 | ||||||
Independent Power and Renewable Electricity Producers — 0.0%†† | ||||||||
AES Corp. | 6,395 | 115,813 | ||||||
Multi-Utilities — 0.9% | ||||||||
Ameren Corp. | 2,600 | 205,608 | ||||||
CenterPoint Energy Inc. | 5,012 | 96,982 | ||||||
CMS Energy Corp. | 2,834 | 174,036 | ||||||
Consolidated Edison Inc. | 3,408 | 265,142 | ||||||
Dominion Energy Inc. | 8,488 | 669,958 | ||||||
DTE Energy Co. | 2,014 | 231,691 | ||||||
NiSource Inc. | 4,429 | 97,438 | ||||||
Public Service Enterprise Group Inc. | 4,953 | 271,969 | ||||||
See Notes to Financial Statements.
| 26 | QS S&P 500 Index Fund 2020 Annual Report |
QS S&P 500 Index Fund
| Security | Shares | Value | ||||||||||
Multi-Utilities — continued | ||||||||||||
Sempra Energy | 2,904 | $ | 343,717 | |||||||||
WEC Energy Group Inc. | 3,224 | 312,406 | ||||||||||
Total Multi-Utilities | 2,668,947 | |||||||||||
Water Utilities — 0.1% | ||||||||||||
American Water Works Co. Inc. | 1,826 | 264,551 | ||||||||||
Total Utilities | 8,397,082 | |||||||||||
Total Investments before Short-Term Investments (Cost — $96,798,274) |
| 283,177,818 | ||||||||||
| Rate | ||||||||||||
| Short-Term Investments — 1.1% | ||||||||||||
Invesco Treasury Portfolio, Institutional Class | 0.010 | % | 3,088,745 | 3,088,745 | ||||||||
Total Investments — 100.0% (Cost — $99,887,019) | 286,266,563 | |||||||||||
Other Assets in Excess of Liabilities — 0.0%†† | 56,474 | |||||||||||
Total Net Assets — 100.0% | $ | 286,323,037 | ||||||||||
| †† | Represents less than 0.1%. |
| * | Non-income producing security. |
| (a) | Investment in affiliate. This security is a component of the S&P 500 Index in which the Fund invests (Note 8). |
At September 30, 2020, the Fund had the following open futures contracts:
Number of Contracts | Expiration Date | Notional Amount | Market Value | Unrealized Depreciation | ||||||||||||||||
| Contracts to Buy: | ||||||||||||||||||||
| E-mini S&P 500 Index | 21 | 12/20 | $ | 3,521,590 | $ | 3,519,600 | $ | (1,990) | ||||||||||||
See Notes to Financial Statements.
| QS S&P 500 Index Fund 2020 Annual Report | 27 |
Statement of assets and liabilities
September 30, 2020
| Assets: | ||||
Investments in unaffiliated securities, at value (Cost — $99,838,416) | $ | 286,206,246 | ||
Investments in affiliated securities, at value (Cost — $48,603) | 60,317 | |||
Cash | 1,650 | |||
Deposits with brokers for open futures contracts | 263,625 | |||
Dividends and interest receivable | 199,924 | |||
Receivable for Fund shares sold | 69,137 | |||
Receivable from broker — net variation margin on open futures contracts | 19,215 | |||
Prepaid expenses | 20,533 | |||
Total Assets | 286,840,647 | |||
| Liabilities: | ||||
Payable for Fund shares repurchased | 289,862 | |||
Investment management fee payable | 51,652 | |||
Service and/or distribution fees payable | 43,219 | |||
Audit and tax fees payable | 39,610 | |||
Transfer agent fees payable | 36,479 | |||
Legal fees payable | 28,380 | |||
Trustees’ fees payable | 3,072 | |||
Accrued expenses | 25,336 | |||
Total Liabilities | 517,610 | |||
| Total Net Assets | $ | 286,323,037 | ||
| Net Assets: | ||||
Par value (Note 7) | $97 | |||
Paid-in capital in excess of par value | 87,772,767 | |||
Total distributable earnings (loss) | 198,550,173 | |||
| Total Net Assets | $286,323,037 | |||
| Net Assets: | ||||
Class A | $262,767,788 | |||
Class D | $23,555,249 | |||
| Shares Outstanding: | ||||
Class A | 8,907,319 | |||
Class D | 791,193 | |||
| Net Asset Value: | ||||
Class A | $29.50 | |||
Class D | $29.77 | |||
See Notes to Financial Statements.
| 28 | QS S&P 500 Index Fund 2020 Annual Report |
For the Year Ended September 30, 2020
| Investment Income: | ||||
Dividends from unaffiliated investments | $ | 5,218,391 | ||
Dividends from affiliated investments | 3,331 | |||
Interest | 19,756 | |||
Total Investment Income | 5,241,478 | |||
| Expenses: | ||||
Investment management fee (Note 2) | 689,451 | |||
Service and/or distribution fees (Notes 2 and 5) | 508,041 | |||
Transfer agent fees (Note 5) | 178,777 | |||
Fund accounting fees | 70,155 | |||
Legal fees | 44,157 | |||
Registration fees | 42,612 | |||
Audit and tax fees | 39,610 | |||
Standard & Poor’s license fees | 27,574 | |||
Trustees’ fees | 21,400 | |||
Shareholder reports | 17,538 | |||
Custody fees | 8,422 | |||
Insurance | 4,353 | |||
Miscellaneous expenses | 3,862 | |||
Total Expenses | 1,655,952 | |||
Less: Fee waivers and/or expense reimbursements (Notes 2 and 5) | (74,091) | |||
Net Expenses | 1,581,861 | |||
| Net Investment Income | 3,659,617 | |||
| Realized and Unrealized Gain (Loss) on Investments and Futures Contracts (Notes 1, 3 and 4): | ||||
Net Realized Gain From: | ||||
Investment transactions in unaffiliated securities | 14,635,485 | |||
Investment transactions in affiliated securities | 2,163 | |||
Futures contracts | 338,378 | |||
Net Realized Gain | 14,976,026 | |||
Change in Net Unrealized Appreciation (Depreciation) From: | ||||
Investments in unaffiliated securities | 19,105,487 | |||
Investments in affiliated securities | (34,810) | |||
Futures contracts | 18,835 | |||
Change in Net Unrealized Appreciation (Depreciation) | 19,089,512 | |||
| Net Gain on Investments and Futures Contracts | 34,065,538 | |||
| Increase in Net Assets From Operations | $ | 37,725,155 | ||
See Notes to Financial Statements.
| QS S&P 500 Index Fund 2020 Annual Report | 29 |
Statements of changes in net assets
| For the Years Ended September 30, | 2020 | 2019 | ||||||
| Operations: | ||||||||
Net investment income | $ | 3,659,617 | $ | 3,841,988 | ||||
Net realized gain | 14,976,026 | 10,604,712 | ||||||
Change in net unrealized appreciation (depreciation) | 19,089,512 | (5,912,128 | ) | |||||
Increase in Net Assets From Operations | 37,725,155 | 8,534,572 | ||||||
| Distributions to Shareholders From (Notes 1 and 6): | ||||||||
Total distributable earnings | (15,508,417 | ) | (13,830,474 | ) | ||||
Decrease in Net Assets From Distributions to Shareholders | (15,508,417 | ) | (13,830,474 | ) | ||||
| Fund Share Transactions (Note 7): | ||||||||
Net proceeds from sale of shares | 18,621,759 | 12,007,177 | ||||||
Reinvestment of distributions | 15,399,646 | 13,721,737 | ||||||
Cost of shares repurchased | (43,331,145 | ) | (31,751,344 | ) | ||||
Decrease in Net Assets From Fund Share Transactions | (9,309,740 | ) | (6,022,430 | ) | ||||
Increase (Decrease) in Net Assets | 12,906,998 | (11,318,332 | ) | |||||
| Net Assets: | ||||||||
Beginning of year | 273,416,039 | 284,734,371 | ||||||
End of year | $ | 286,323,037 | $ | 273,416,039 | ||||
See Notes to Financial Statements.
| 30 | QS S&P 500 Index Fund 2020 Annual Report |
| For a share of each class of beneficial interest outstanding throughout each year ended September 30: | ||||||||||||||||||||
| Class A Shares1 | 2020 | 2019 | 2018 | 2017 | 2016 | |||||||||||||||
| Net asset value, beginning of year | $27.21 | $27.71 | $24.81 | $21.89 | $19.57 | |||||||||||||||
| Income from operations: |
| |||||||||||||||||||
Net investment income | 0.36 | 0.37 | 0.34 | 0.36 | 0.34 | |||||||||||||||
Net realized and unrealized gain | 3.47 | 0.48 | 3.78 | 3.45 | 2.52 | |||||||||||||||
Total income from operations | 3.83 | 0.85 | 4.12 | 3.81 | 2.86 | |||||||||||||||
| Less distributions from: | ||||||||||||||||||||
Net investment income | (0.40) | (0.34) | (0.34) | (0.38) | (0.40) | |||||||||||||||
Net realized gains | (1.14) | (1.01) | (0.88) | (0.51) | (0.14) | |||||||||||||||
Total distributions | (1.54) | (1.35) | (1.22) | (0.89) | (0.54) | |||||||||||||||
| Net asset value, end of year | $29.50 | $27.21 | $27.71 | $24.81 | $21.89 | |||||||||||||||
Total return2 | 14.55 | % | 3.64 | % | 17.19 | % | 17.95 | % | 14.82 | % | ||||||||||
| Net assets, end of year (millions) | $263 | $254 | $265 | $247 | $232 | |||||||||||||||
| Ratios to average net assets: | ||||||||||||||||||||
Gross expenses | 0.61 | % | 0.61 | % | 0.62 | % | 0.60 | % | 0.61 | % | ||||||||||
Net expenses3,4 | 0.59 | 0.59 | 0.59 | 0.59 | 0.59 | |||||||||||||||
Net investment income | 1.31 | 1.43 | 1.30 | 1.57 | 1.62 | |||||||||||||||
| Portfolio turnover rate | 3 | % | 3 | % | 2 | % | 2 | % | 3 | % | ||||||||||
| 1 | Per share amounts have been calculated using the average shares method. |
| 2 | Performance figures may reflect compensating balance arrangements, fee waivers and/or expense reimbursements. In the absence of compensating balance arrangements, fee waivers and/or expense reimbursements, the total return would have been lower. Past performance is no guarantee of future results. |
| 3 | Reflects fee waivers and/or expense reimbursements. |
| 4 | As a result of an expense limitation arrangement, the ratio of total annual fund operating expenses, other than interest, brokerage, taxes, extraordinary expenses and acquired fund fees and expenses, to average net assets of Class A shares did not exceed 0.59%. This expense limitation arrangement cannot be terminated prior to December 31, 2021 without the Board of Trustees’ consent. |
See Notes to Financial Statements.
| QS S&P 500 Index Fund 2020 Annual Report | 31 |
Financial highlights (cont’d)
| For a share of each class of beneficial interest outstanding throughout each year ended September 30: | ||||||||||||||||||||
| Class D Shares1 | 2020 | 2019 | 2018 | 2017 | 2016 | |||||||||||||||
| Net asset value, beginning of year | $27.44 | $27.94 | $25.01 | $22.05 | $19.71 | |||||||||||||||
| Income from operations: | ||||||||||||||||||||
Net investment income | 0.41 | 0.42 | 0.39 | 0.41 | 0.38 | |||||||||||||||
Net realized and unrealized gain | 3.51 | 0.48 | 3.81 | 3.48 | 2.54 | |||||||||||||||
Total income from operations | 3.92 | 0.90 | 4.20 | 3.89 | 2.92 | |||||||||||||||
| Less distributions from: |
| |||||||||||||||||||
Net investment income | (0.45) | (0.39) | (0.39) | (0.42) | (0.44) | |||||||||||||||
Net realized gains | (1.14) | (1.01) | (0.88) | (0.51) | (0.14) | |||||||||||||||
Total distributions | (1.59) | (1.40) | (1.27) | (0.93) | (0.58) | |||||||||||||||
| Net asset value, end of year | $29.77 | $27.44 | $27.94 | $25.01 | $22.05 | |||||||||||||||
| Total return2 | 14.78 | % | 3.83 | % | 17.40 | % | 18.24 | % | 15.05 | % | ||||||||||
| Net assets, end of year (000s) | $23,555 | $19,833 | $19,260 | $12,759 | $9,742 | |||||||||||||||
| Ratios to average net assets: | ||||||||||||||||||||
Gross expenses | 0.43 | % | 0.43 | % | 0.45 | % | 0.44 | % | 0.45 | % | ||||||||||
Net expenses3,4 | 0.39 | 0.39 | 0.39 | 0.39 | 0.39 | |||||||||||||||
Net investment income | 1.51 | 1.63 | 1.50 | 1.77 | 1.82 | |||||||||||||||
| Portfolio turnover rate | 3 | % | 3 | % | 2 | % | 2 | % | 3 | % | ||||||||||
| 1 | Per share amounts have been calculated using the average shares method. |
| 2 | Performance figures may reflect compensating balance arrangements, fee waivers and/or expense reimbursements. In the absence of compensating balance arrangements, fee waivers and/or expense reimbursements, the total return would have been lower. Past performance is no guarantee of future results. |
| 3 | Reflects fee waivers and/or expense reimbursements. |
| 4 | As a result of an expense limitation arrangement, the ratio of total annual fund operating expenses, other than interest, brokerage, taxes, extraordinary expenses and acquired fund fees and expenses, to average net assets of Class D shares did not exceed 0.39%. This expense limitation arrangement cannot be terminated prior to December 31, 2021 without the Board of Trustees’ consent. |
See Notes to Financial Statements.
| 32 | QS S&P 500 Index Fund 2020 Annual Report |
1. Organization and significant accounting policies
QS S&P 500 Index Fund (the “Fund”) is a separate diversified investment series of Legg Mason Partners Equity Trust (the “Trust”). The Trust, a Maryland statutory trust, is registered under the Investment Company Act of 1940, as amended (the “1940 Act”), as an open-end management investment company.
The following are significant accounting policies consistently followed by the Fund and are in conformity with U.S. generally accepted accounting principles (“GAAP”). Estimates and assumptions are required to be made regarding assets, liabilities and changes in net assets resulting from operations when financial statements are prepared. Changes in the economic environment, financial markets and any other parameters used in determining these estimates could cause actual results to differ. Subsequent events have been evaluated through the date the financial statements were issued.
(a) Investment valuation. Equity securities for which market quotations are available are valued at the last reported sales price or official closing price on the primary market or exchange on which they trade. The valuations for fixed income securities (which may include, but are not limited to, corporate, government, municipal, mortgage-backed, collateralized mortgage obligations and asset-backed securities) and certain derivative instruments are typically the prices supplied by independent third party pricing services, which may use market prices or broker/dealer quotations or a variety of valuation techniques and methodologies. The independent third party pricing services use inputs that are observable such as issuer details, interest rates, yield curves, prepayment speeds, credit risks/spreads, default rates and quoted prices for similar securities. Investments in open-end funds are valued at the closing net asset value per share of each fund on the day of valuation. Futures contracts are valued daily at the settlement price established by the board of trade or exchange on which they are traded. When the Fund holds securities or other assets that are denominated in a foreign currency, the Fund will normally use the currency exchange rates as of 4:00 p.m. (Eastern Time). If independent third party pricing services are unable to supply prices for a portfolio investment, or if the prices supplied are deemed by the manager to be unreliable, the market price may be determined by the manager using quotations from one or more broker/dealers or at the transaction price if the security has recently been purchased and no value has yet been obtained from a pricing service or pricing broker. When reliable prices are not readily available, such as when the value of a security has been significantly affected by events after the close of the exchange or market on which the security is principally traded, but before the Fund calculates its net asset value, the Fund values these securities as determined in accordance with procedures approved by the Fund’s Board of Trustees.
The Board of Trustees is responsible for the valuation process and has delegated the supervision of the daily valuation process to the Legg Mason North Atlantic Fund Valuation Committee (the “Valuation Committee”). The Valuation Committee, pursuant to the policies adopted by the Board of Trustees, is responsible for making fair value determinations,
| QS S&P 500 Index Fund 2020 Annual Report | 33 |
Notes to financial statements (cont’d)
evaluating the effectiveness of the Fund’s pricing policies, and reporting to the Board of Trustees. When determining the reliability of third party pricing information for investments owned by the Fund, the Valuation Committee, among other things, conducts due diligence reviews of pricing vendors, monitors the daily change in prices and reviews transactions among market participants.
The Valuation Committee will consider pricing methodologies it deems relevant and appropriate when making fair value determinations. Examples of possible methodologies include, but are not limited to, multiple of earnings; discount from market of a similar freely traded security; discounted cash-flow analysis; book value or a multiple thereof; risk premium/yield analysis; yield to maturity; and/or fundamental investment analysis. The Valuation Committee will also consider factors it deems relevant and appropriate in light of the facts and circumstances. Examples of possible factors include, but are not limited to, the type of security; the issuer’s financial statements; the purchase price of the security; the discount from market value of unrestricted securities of the same class at the time of purchase; analysts’ research and observations from financial institutions; information regarding any transactions or offers with respect to the security; the existence of merger proposals or tender offers affecting the security; the price and extent of public trading in similar securities of the issuer or comparable companies; and the existence of a shelf registration for restricted securities.
For each portfolio security that has been fair valued pursuant to the policies adopted by the Board of Trustees, the fair value price is compared against the last available and next available market quotations. The Valuation Committee reviews the results of such back testing monthly and fair valuation occurrences are reported to the Board of Trustees quarterly.
The Fund uses valuation techniques to measure fair value that are consistent with the market approach and/or income approach, depending on the type of security and the particular circumstance. The market approach uses prices and other relevant information generated by market transactions involving identical or comparable securities. The income approach uses valuation techniques to discount estimated future cash flows to present value.
GAAP establishes a disclosure hierarchy that categorizes the inputs to valuation techniques used to value assets and liabilities at measurement date. These inputs are summarized in the three broad levels listed below:
| • | Level 1 — quoted prices in active markets for identical investments |
| • | Level 2 — other significant observable inputs (including quoted prices for similar investments, interest rates, prepayment speeds, credit risk, etc.) |
| • | Level 3 — significant unobservable inputs (including the Fund’s own assumptions in determining the fair value of investments) |
| 34 | QS S&P 500 Index Fund 2020 Annual Report |
The inputs or methodologies used to value securities are not necessarily an indication of the risk associated with investing in those securities.
The following is a summary of the inputs used in valuing the Fund’s assets and liabilities carried at fair value:
| ASSETS | ||||||||||||||||
| Description | Quoted Prices (Level 1) | Other Significant Observable Inputs (Level 2) | Significant (Level 3) | Total | ||||||||||||
| Common Stocks† | $ | 283,177,818 | — | — | $ | 283,177,818 | ||||||||||
| Short-Term Investments† | 3,088,745 | — | — | 3,088,745 | ||||||||||||
| Total Investments | $ | 286,266,563 | — | — | $ | 286,266,563 | ||||||||||
| LIABILITIES | ||||||||||||||||
| Description | Quoted Prices (Level 1) | Other Significant Observable Inputs (Level 2) | Significant (Level 3) | Total | ||||||||||||
| Other Financial Instruments: | ||||||||||||||||
| Futures Contracts | $ | 1,990 | — | — | $ | 1,990 | ||||||||||
| † | See Schedule of Investments for additional detailed categorizations. |
(b) Futures contracts. The Fund uses futures contracts generally to gain exposure to, or hedge against, changes in interest rates or gain exposure to, or hedge against, changes in certain asset classes. A futures contract represents a commitment for the future purchase or sale of an asset at a specified price on a specified date.
Upon entering into a futures contract, the Fund is required to deposit cash or securities with a broker in an amount equal to a certain percentage of the contract amount. This is known as the ‘‘initial margin’’ and subsequent payments (‘‘variation margin’’) are made or received by the Fund each day, depending on the daily fluctuation in the value of the contract. For certain futures, including foreign denominated futures, variation margin is not settled daily, but is recorded as a net variation margin payable or receivable. The daily changes in contract value are recorded as unrealized gains or losses in the Statement of Operations and the Fund recognizes a realized gain or loss when the contract is closed.
Futures contracts involve, to varying degrees, risk of loss in excess of the amounts reflected in the financial statements. In addition, there is the risk that the Fund may not be able to enter into a closing transaction because of an illiquid secondary market.
(c) Foreign investment risks. The Fund’s investments in foreign securities may involve risks not present in domestic investments. Since securities may be denominated in foreign currencies, may require settlement in foreign currencies or pay interest or dividends in foreign currencies, changes in the relationship of these foreign currencies to the U.S. dollar can significantly affect the value of the investments and earnings of the Fund. Foreign
| QS S&P 500 Index Fund 2020 Annual Report | 35 |
Notes to financial statements (cont’d)
investments may also subject the Fund to foreign government exchange restrictions, expropriation, taxation or other political, social or economic developments, all of which affect the market and/or credit risk of the investments.
(d) Counterparty risk and credit-risk-related contingent features of derivative instruments. The Fund may invest in certain securities or engage in other transactions, where the Fund is exposed to counterparty credit risk in addition to broader market risks. The Fund may invest in securities of issuers, which may also be considered counterparties as trading partners in other transactions. This may increase the risk of loss in the event of default or bankruptcy by the counterparty or if the counterparty otherwise fails to meet its contractual obligations. The Fund’s subadviser attempts to mitigate counterparty risk by (i) periodically assessing the creditworthiness of its trading partners, (ii) monitoring and/or limiting the amount of its net exposure to each individual counterparty based on its assessment and (iii) requiring collateral from the counterparty for certain transactions. Market events and changes in overall economic conditions may impact the assessment of such counterparty risk by the subadviser. In addition, declines in the values of underlying collateral received may expose the Fund to increased risk of loss.
With exchange traded and centrally cleared derivatives, there is less counterparty risk to the Fund since the exchange or clearinghouse, as counterparty to such instruments, guarantees against a possible default. The clearinghouse stands between the buyer and the seller of the contract; therefore, the credit risk is limited to failure of the clearinghouse. While offset rights may exist under applicable law, the Fund does not have a contractual right of offset against a clearing broker or clearinghouse in the event of a default of the clearing broker or clearinghouse.
The Fund has entered into master agreements, such as an International Swaps and Derivatives Association, Inc. Master Agreement (“ISDA Master Agreement”) or similar agreement, with certain of its derivative counterparties that govern over-the-counter derivatives and provide for general obligations, representations, agreements, collateral posting terms, netting provisions in the event of default or termination and credit related contingent features. The credit related contingent features include, but are not limited to, a percentage decrease in the Fund’s net assets or NAV over a specified period of time. If these credit related contingent features were triggered, the derivatives counterparty could terminate the positions and demand payment or require additional collateral.
Under an ISDA Master Agreement, the Fund may, under certain circumstances, offset with the counterparty certain derivative financial instruments’ payables and/or receivables with collateral held and/or posted and create one single net payment. However, absent an event of default by the counterparty or a termination of the agreement, the terms of the ISDA Master Agreements do not result in an offset of reported amounts of financial assets and financial liabilities in the Statement of Assets and Liabilities across transactions between the Fund and the applicable counterparty. The enforceability of the right to offset may vary by jurisdiction.
| 36 | QS S&P 500 Index Fund 2020 Annual Report |
Collateral requirements differ by type of derivative. Collateral or margin requirements are set by the broker or exchange clearinghouse for exchange traded derivatives while collateral terms are contract specific for over-the-counter traded derivatives. Cash collateral that has been pledged to cover obligations of the Fund under derivative contracts, if any, will be reported separately in the Statement of Assets and Liabilities. Securities pledged as collateral, if any, for the same purpose are noted in the Schedule of Investments.
As of September 30, 2020, the Fund did not have any open OTC derivative transactions with credit related contingent features in a net liability position.
(e) Security transactions and investment income. Security transactions are accounted for on a trade date basis. Interest income (including interest income from payment-in-kind securities), adjusted for amortization of premium and accretion of discount, is recorded on the accrual basis. Dividend income is recorded on the ex-dividend date for dividends received in cash and/or securities. Foreign dividend income is recorded on the ex-dividend date or as soon as practicable after the Fund determines the existence of a dividend declaration after exercising reasonable due diligence. The cost of investments sold is determined by use of the specific identification method. To the extent any issuer defaults or a credit event occurs that impacts the issuer, the Fund may halt any additional interest income accruals and consider the realizability of interest accrued up to the date of default or credit event.
(f) REIT distributions. The character of distributions received from Real Estate Investment Trusts (‘‘REITs’’) held by the Fund is generally comprised of net investment income, capital gains, and return of capital. It is the policy of the Fund to estimate the character of distributions received from underlying REITs based on historical data provided by the REITs. After each calendar year end, REITs report the actual tax character of these distributions. Differences between the estimated and actual amounts reported by the REITs are reflected in the Fund’s records in the year in which they are reported by the REITs by adjusting related investment cost basis, capital gains and income, as necessary.
(g) Distributions to shareholders. Distributions from net investment income and distributions of net realized gains, if any, are declared at least annually. Distributions to shareholders of the Fund are recorded on the ex-dividend date and are determined in accordance with income tax regulations, which may differ from GAAP.
(h) Share class accounting. Investment income, common expenses and realized/ unrealized gains (losses) on investments are allocated to the various classes of the Fund on the basis of daily net assets of each class. Fees relating to a specific class are charged directly to that share class.
(i) Compensating balance arrangements. The Fund has an arrangement with its custodian bank whereby a portion of the custodian’s fees is paid indirectly by credits earned on the Fund’s cash on deposit with the bank.
| QS S&P 500 Index Fund 2020 Annual Report | 37 |
Notes to financial statements (cont’d)
(j) Federal and other taxes. It is the Fund’s policy to comply with the federal income and excise tax requirements of the Internal Revenue Code of 1986 (the “Code”), as amended, applicable to regulated investment companies. Accordingly, the Fund intends to distribute its taxable income and net realized gains, if any, to shareholders in accordance with timing requirements imposed by the Code. Therefore, no federal or state income tax provision is required in the Fund’s financial statements.
Management has analyzed the Fund’s tax positions taken on income tax returns for all open tax years and has concluded that as of September 30, 2020, no provision for income tax is required in the Fund’s financial statements. The Fund’s federal and state income and federal excise tax returns for tax years for which the applicable statutes of limitations have not expired are subject to examination by the Internal Revenue Service and state departments of revenue.
(k) Reclassification. GAAP requires that certain components of net assets be reclassified to reflect permanent differences between financial and tax reporting. These reclassifications have no effect on net assets or net asset value per share. During the current year, the Fund had no reclassifications.
2. Investment management agreement and other transactions with affiliates
Legg Mason Partners Fund Advisor, LLC (“LMPFA”) is the Fund’s investment manager and QS Investors, LLC (“QS Investors”) is the Fund’s subadviser. Western Asset Management Company, LLC (“Western Asset”) manages the portion of the Fund’s cash and short-term instruments allocated to it. As of July 31, 2020, LMPFA, QS Investors and Western Asset are indirect, wholly-owned subsidiaries of Franklin Resources, Inc. (“Franklin Resources”). Prior to July 31, 2020, LMPFA, QS Investors and Western Asset were wholly-owned subsidiaries of Legg Mason, Inc. (“Legg Mason”). As of July 31, 2020, Legg Mason is a subsidiary of Franklin Resources.
Under the investment management agreement, the Fund pays an investment management fee, calculated daily and paid monthly, at an annual rate of 0.25% of the Fund’s average daily net assets.
LMPFA provides administrative and certain oversight services to the Fund. LMPFA delegates to the subadviser the day-to-day portfolio management of the Fund, except for the management of the portion of the cash and short-term instruments allocated to Western Asset. For its services, LMPFA pays QS Investors a fee monthly, at an annual rate equal to 70% of the net management fee it receives from the Fund. For Western Asset’s services to the Fund, LMPFA pays Western Asset monthly 0.02% of the portion of the Fund’s average daily net assets that are allocated to Western Asset by LMPFA.
As a result of expense limitation arrangements between the Fund and LMPFA, the ratio of total annual fund operating expenses, other than interest, brokerage, taxes, extraordinary expenses and acquired fund fees and expenses, to average net assets of Class A and Class D shares did not exceed 0.59% and 0.39%, respectively. These expense limitation arrangements cannot be terminated prior to December 31, 2021 without the Board of Trustees’ consent.
| 38 | QS S&P 500 Index Fund 2020 Annual Report |
During the year ended September 30, 2020, fees waived and/or expenses reimbursed amounted to $74,091.
LMPFA is permitted to recapture amounts waived and/or reimbursed to a class during the same fiscal year if the class’ total annual fund operating expenses have fallen to a level below the expense limitation (“expense cap”) in effect at the time the fees were earned or the expenses incurred. In no case will LMPFA recapture any amount that would result, on any particular business day of the Fund, in the class’ total annual fund operating expenses exceeding the expense cap or any other lower limit then in effect.
As of July 31, 2020, Legg Mason Investor Services, LLC (“LMIS”) is an indirect, wholly-owned broker-dealer subsidiary of Franklin Resources and serves as the Fund’s sole and exclusive distributor. Prior to July 31, 2020, LMIS was a wholly-owned broker-dealer subsidiary of Legg Mason.
As of July 31, 2020, all officers and one Trustee of the Trust are employees of Franklin Resources or its affiliates and do not receive compensation from the Trust. Prior to July 31, 2020, all officers and one Trustee of the Trust were employees of Legg Mason and did not receive compensation from the Trust.
3. Investments
During the year ended September 30, 2020, the aggregate cost of purchases and proceeds from sales of investments (excluding short-term investments) were as follows:
| Purchases | $ | 8,185,584 | ||
| Sales | 30,061,257 |
At September 30, 2020, the aggregate cost of investments and the aggregate gross unrealized appreciation and depreciation of investments for federal income tax purposes were as follows:
| Cost | Gross Unrealized Appreciation | Gross Unrealized Depreciation | Net Unrealized Appreciation (Depreciation) | |||||||||||||
| Securities | $ | 103,377,697 | $ | 190,915,421 | $ | (8,026,555) | $ | 182,888,866 | ||||||||
| Futures contracts | — | — | (1,990) | (1,990) | ||||||||||||
| QS S&P 500 Index Fund 2020 Annual Report | 39 |
Notes to financial statements (cont’d)
4. Derivative instruments and hedging activities
Below is a table, grouped by derivative type, that provides information about the fair value and the location of derivatives within the Statement of Assets and Liabilities at September 30, 2020.
| LIABILITY DERIVATIVES1 | ||||||||
Equity Risk | ||||||||
| Futures contracts2 | $ | 1,990 | ||||||
| 1 | Generally, the balance sheet location for asset derivatives is receivables/net unrealized appreciation and for liability derivatives is payables/net unrealized depreciation. |
| 2 | Includes cumulative appreciation (depreciation) of futures contracts as reported in the Schedule of Investments. Only variation margin is reported within the receivables and/or payables on the Statement of Assets and Liabilities. |
The following tables provide information about the effect of derivatives and hedging activities on the Fund’s Statement of Operations for the year ended September 30, 2020. The first table provides additional detail about the amounts and sources of gains (losses) realized on derivatives during the period. The second table provides additional information about the change in unrealized appreciation (depreciation) resulting from the Fund’s derivatives and hedging activities during the period.
| AMOUNT OF REALIZED GAIN (LOSS) ON DERIVATIVES RECOGNIZED | ||||
Equity Risk | ||||
| Futures contracts | $ | 338,378 | ||
| CHANGE IN UNREALIZED APPRECIATION (DEPRECIATION) ON DERIVATIVES RECOGNIZED | ||||
Equity Risk | ||||
| Futures contracts | $ | 18,835 | ||
During the year ended September 30, 2020, the volume of derivative activity for the Fund was as follows:
Average Market Value | ||||
| Futures contracts (to buy) | $ | 3,062,857 | ||
5. Class specific expenses, waivers and/or expense reimbursements
The Fund has adopted a Rule 12b-1 shareholder services and distribution plan and under that plan the Fund pays service and/or distribution fees with respect to its Class A shares calculated at the annual rate of 0.20% of the average daily net assets of the class. Service and/or distribution fees are accrued daily and paid monthly.
| 40 | QS S&P 500 Index Fund 2020 Annual Report |
For the year ended September 30, 2020, class specific expenses were as follows:
Service and/or Distribution Fees | Transfer Agent Fees | |||||||
| Class A | $ | 508,041 | † | $ | 160,845 | |||
| Class D | — | 17,932 | ||||||
| Total | $ | 508,041 | $ | 178,777 | ||||
| † | Amount shown is exclusive of expense reimbursements. For the year ended September 30, 2020, the service and/or distribution fees reimbursed amounted to $3 for Class A shares. |
For the year ended September 30, 2020, waivers and/or expense reimbursements by class were as follows:
Waivers/Expense Reimbursements | ||||
| Class A | $ | 64,309 | ||
| Class D | 9,782 | |||
| Total | $ | 74,091 | ||
6. Distributions to shareholders by class
Year Ended September 30, 2020 | Year Ended September 30, 2019 | |||||||
| Net Investment Income: |
| |||||||
| Class A | $ | 3,810,108 | $ | 3,224,093 | ||||
| Class D | 339,898 | 275,912 | ||||||
| Total | $ | 4,150,006 | $ | 3,500,005 | ||||
| Net Realized Gains: |
| |||||||
| Class A | $ | 10,538,052 | $ | 9,617,304 | ||||
| Class D | 820,359 | 713,165 | ||||||
| Total | $ | 11,358,411 | $ | 10,330,469 | ||||
7. Shares of beneficial interest
At September 30, 2020, the Trust had an unlimited number of shares of beneficial interest authorized with a par value of $0.00001 per share. The Fund has the ability to issue multiple classes of shares. Each class of shares represents an identical interest and has the same rights, except that each class bears certain direct expenses, including those specifically related to the distribution of its shares.
| QS S&P 500 Index Fund 2020 Annual Report | 41 |
Notes to financial statements (cont’d)
Transactions in shares of each class were as follows:
| Year Ended September 30, 2020 | Year Ended September 30, 2019 | |||||||||||||||
| Shares | Amount | Shares | Amount | |||||||||||||
| Class A | ||||||||||||||||
| Shares sold | 545,722 | $ | 14,175,025 | 391,676 | $ | 9,862,608 | ||||||||||
| Shares issued on reinvestment | 517,641 | 14,239,389 | 522,473 | 12,732,660 | ||||||||||||
| Shares repurchased | (1,475,076) | (39,799,000) | (1,173,877) | (29,478,158) | ||||||||||||
| Net decrease | (411,713) | $ | (11,384,586) | (259,728) | $ | (6,882,890) | ||||||||||
| Class D | ||||||||||||||||
| Shares sold | 157,972 | $ | 4,446,734 | 81,482 | $ | 2,144,569 | ||||||||||
| Shares issued on reinvestment | 41,805 | 1,160,257 | 40,305 | 989,077 | ||||||||||||
| Shares repurchased | (131,247) | (3,532,145) | (88,404) | (2,273,186) | ||||||||||||
| Net increase | 68,530 | $ | 2,074,846 | 33,383 | $ | 860,460 | ||||||||||
8. Transactions with affiliated company
The Fund invests in securities that are components of the S&P 500 Index. Franklin
Resources Inc. is a component of the S&P 500 Index and is considered to be affiliated with the Fund. Investments in Franklin Resources Inc. were made in accordance to its proportional weighting in the S&P 500 Index. The following transactions were effected in shares of Franklin Resources Inc. for the year ended September 30, 2020:
| Affiliate Value at September 30, 2019 | Purchased | Sold | ||||||||||||||||||
| Cost | Shares | Cost | Shares | |||||||||||||||||
| Franklin Resources Inc.* | $ | 92,496 | $ | 21,169 | 964 | $ | 18,538 | 1,205 | ||||||||||||
| (cont’d) | Realized Gain (Loss) | Dividend Income | Net Increase (Decrease) in Unrealized Appreciation (Depreciation) | Affiliate Value at September 30, 2020 | ||||||||||||
| Franklin Resources Inc.* | $ | 2,163 | $ | 3,331 | $ | (34,810) | $ | 60,317 | ||||||||
| * | This security was not an affiliated company at September 30, 2019. |
| 42 | QS S&P 500 Index Fund 2020 Annual Report |
9. Income tax information and distributions to shareholders
The tax character of distributions paid during the fiscal years ended September 30, was as follows:
| 2020 | 2019 | |||||||
| Distributions paid from: |
| |||||||
| Ordinary income | $ | 4,181,993 | $ | 3,678,199 | ||||
| Net long-term capital gains | 11,326,424 | 10,152,275 | ||||||
| Total distributions paid | $ | 15,508,417 | $ | 13,830,474 | ||||
As of September 30, 2020, the components of distributable earnings (loss) on a tax basis were as follows:
| Undistributed ordinary income — net | $ | 2,806,061 | ||
| Undistributed long-term capital gains — net | 12,902,326 | |||
| Total undistributed earnings | $ | 15,708,387 | ||
| Other book/tax temporary differences(a) | (45,090) | |||
| Unrealized appreciation (depreciation)(b) | 182,886,876 | |||
| Total distributable earnings (loss) — net | $ | 198,550,173 |
| (a) | Other book/tax temporary differences are attributable to the realization for tax purposes of unrealized gains (losses) on certain futures contracts and book/tax differences in the timing of the deductibility of various expenses. |
| (b) | The difference between book-basis and tax-basis unrealized appreciation (depreciation) is attributable to the tax deferral of losses on wash sales and the difference between the estimated book and tax cost basis of investments in real estate investment trusts. |
10. Other matter
The outbreak of the respiratory illness COVID-19 (commonly referred to as “coronavirus”) has continued to rapidly spread around the world, causing considerable uncertainty for the global economy and financial markets. The ultimate economic fallout from the pandemic, and the long-term impact on economies, markets, industries and individual issuers, are not known. The COVID-19 pandemic could adversely affect the value and liquidity of the Fund’s investments, impair the Fund’s ability to satisfy redemption requests, and negatively impact the Fund’s performance. In addition, the outbreak of COVID-19, and measures taken to mitigate its effects, could result in disruptions to the services provided to the Fund by its service providers.
| QS S&P 500 Index Fund 2020 Annual Report | 43 |
Report of independent registered public accounting firm
To the Board of Trustees of Legg Mason Partners Equity Trust and Shareholders of QS S&P 500 Index Fund
Opinion on the Financial Statements
We have audited the accompanying statement of assets and liabilities, including the schedule of investments, of QS S&P 500 Index Fund (one of the funds constituting Legg Mason Partners Equity Trust, referred to hereafter as the “Fund”) as of September 30, 2020, the related statement of operations for the year ended September 30, 2020, the statement of changes in net assets for each of the two years in the period ended September 30, 2020, including the related notes, and the financial highlights for each of the four years in the period ended September 30, 2020 (collectively referred to as the “financial statements”). In our opinion, the financial statements present fairly, in all material respects, the financial position of the Fund as of September 30, 2020, the results of its operations for the year then ended, the changes in its net assets for each of the two years in the period ended September 30, 2020 and the financial highlights for each of the four years in the period ended September 30, 2020 in conformity with accounting principles generally accepted in the United States of America.
The financial statements of the Fund as of and for the year ended September 30, 2016 and the financial highlights for each of the periods ended on or prior to September 30, 2016 (not presented herein, other than the financial highlights) were audited by other auditors whose report dated November 15, 2016 expressed an unqualified opinion on those financial statements and financial highlights.
Basis for Opinion
These financial statements are the responsibility of the Fund’s management. Our responsibility is to express an opinion on the Fund’s financial statements based on our audits. We are a public accounting firm registered with the Public Company Accounting Oversight Board (United States) (PCAOB) and are required to be independent with respect to the Fund in accordance with the U.S. federal securities laws and the applicable rules and regulations of the Securities and Exchange Commission and the PCAOB.
We conducted our audits of these financial statements in accordance with the standards of the PCAOB. Those standards require that we plan and perform the audit to obtain reasonable assurance about whether the financial statements are free of material misstatement, whether due to error or fraud.
Our audits included performing procedures to assess the risks of material misstatement of the financial statements, whether due to error or fraud, and performing procedures that respond to those risks. Such procedures included examining, on a test basis, evidence regarding the amounts and disclosures in the financial statements. Our audits also included evaluating the accounting principles used and significant estimates made by management, as well as evaluating the overall presentation of the financial statements. Our procedures included confirmation of securities owned as of September 30, 2020 by correspondence with the custodian and brokers; when replies were not received from brokers, we performed other auditing procedures. We believe that our audits provide a reasonable basis for our opinion.
/s/PricewaterhouseCoopers LLP
Baltimore, Maryland
November 16, 2020
We have served as the auditor of one or more investment companies in the Franklin Templeton Group of Funds since 1948.
| 44 | QS S&P 500 Index Fund 2020 Annual Report |
Board approval of new management and new subadvisory agreements (unaudited)
At a meeting of the Trust’s Board of Trustees held on April 7, 2020, the Board, including a majority of the Trustees who are not “interested persons” (as defined in the Investment Company Act of 1940, as amended (the “Independent Trustees”)) of the Trust, approved new management and investment advisory agreements to take effect, subject to shareholder approval, upon the sale of Legg Mason, Inc. to Franklin Resources, Inc., a global investment management organization operating as Franklin Templeton.1 The agreements were a new management agreement pursuant to which Legg Mason Partners Fund Advisor, LLC (the “Manager”) provides the Fund with investment advisory and administrative services, a new sub-advisory agreement pursuant to which QS Investors, LLC (“QS Investors”) provides day-to-day management of the Fund’s portfolio, and a new sub-advisory agreement pursuant to which Western Asset Management Company, LLC (“Western Asset” and, together with QS Investors, the “Subadvisers”) provides day-to-day management of the Fund’s cash and short-term instruments allocated to it by the Manager. (The new management agreement and new sub-advisory agreements are collectively referred to as the “New Agreements.”) The prior management agreement and prior sub-advisory agreements are collectively referred to as the “Prior Agreements.” The New Agreements are identical to the Prior Agreements, except for the dates of execution, effectiveness and termination. The Board considered that the Prior Agreements were the product of multiple years of review and negotiation and information received and considered by the Board in the exercise of its business judgment during those years, including as recently as at a meeting of the Trust’s Board of Trustees held in November 2019.
The sale of Legg Mason, Inc. to Franklin Resources, Inc. (referred to herein as the “Transaction”) was consummated on July 31, 2020. The Manager and the Subadvisers, each a wholly-owned subsidiary of Legg Mason, Inc., became indirect wholly-owned subsidiaries of Franklin Templeton. The sale resulted in what is commonly called a “change of control” of Legg Mason and caused the Prior Agreements to terminate in accordance with applicable law.
The Board also approved an interim management agreement with the Manager and interim sub-advisory agreements between the Manager and the Subadvisers that took effect because shareholders did not approve the New Agreements before the Transaction was completed. This allowed the Manager and the Subadvisers to continue providing services to the Fund while shareholder approval of the New Agreements continued to be sought. (The interim management agreement and interim sub-advisory agreements are collectively referred to as the “Interim Agreements.”) The terms of the Interim Agreements were
| 1 | The meeting was held telephonically in reliance on an exemptive order issued by the Securities and Exchange Commission on March 25, 2020. Reliance on the exemptive order was necessary and appropriate due to circumstances related to the effects of COVID-19. All Trustees participating in the telephonic meeting were able to hear each other simultaneously during the meeting. Reliance on the exemptive order requires Trustees, including a majority of the Independent Trustees, to ratify actions taken pursuant to the exemptive order by vote cast at the next in-person meeting. |
| QS S&P 500 Index Fund | 45 |
Board approval of new management and new subadvisory agreements (unaudited) (cont’d)
identical to those of the Prior Agreements, except for the term and certain escrow provisions. At a meeting held on September 25, 2020, shareholders of the Fund approved the New Agreements, and the Agreements became effective on that date. Effective October 1, 2020, QS Investors and Franklin Templeton Multi-Asset Solutions formed a new business unit called Franklin Templeton Investment Solutions, but QS Investors retains its separate existence and continues as party to the Agreements.
At a telephonic meeting of the Trust’s Board of Trustees held on March 9, 2020, the Trustees discussed with Legg Mason management and certain Franklin Templeton representatives the Transaction and Franklin Templeton’s plans and intentions regarding the Legg Mason funds and Legg Mason’s asset management business, including the preservation and continued investment autonomy of the investment advisory businesses conducted by the Subadvisers and the combination of Legg Mason’s and Franklin Templeton’s distribution resources.
At the March and April meetings, the Independent Trustees considered, among other things, the anticipated impact of the Transaction on the Fund and its shareholders. To assist the Independent Trustees in their consideration of the New Agreements, Franklin Templeton provided materials and information about Franklin Templeton, including its financial condition and asset management capabilities and organization, Legg Mason provided materials and information about Legg Mason, including performance and expense comparison data and profitability information with respect to the Fund and the Legg Mason fund complex as a whole, and Franklin Templeton and Legg Mason provided materials and information about the proposed Transaction. The Independent Trustees were assisted in their review by Fund counsel and independent legal counsel and met with independent legal counsel in executive sessions separate from representatives of Franklin Templeton, Legg Mason, the Manager and the Subadvisers. The Independent Trustees requested and received information from Legg Mason and Franklin Templeton they deemed reasonably necessary for their review of the New Agreements. Included was information about the Transaction, distribution arrangements, Franklin Templeton’s business plan and other anticipated impacts of the Transaction on the Fund and its shareholders. This information was initially reviewed by a special committee of the Independent Trustees and then by the full Board. Following their review of this information, the Independent Trustees requested additional information from Franklin Templeton and Legg Mason. Franklin Templeton and Legg Mason provided further information in response to these requests, which the Board reviewed. Senior management representatives from Franklin Templeton and Legg Mason participated in portions of the meetings and addressed various questions raised by the Independent Trustees.
In voting to approve the New Agreements, the Independent Trustees considered whether the approval of the New Agreements would be in the best interests of the Fund and its
| 46 | QS S&P 500 Index Fund |
shareholders. The Trustees’ evaluation of the New Agreements reflected the information provided specifically in connection with its review of the New Agreements, as well as, where relevant, information that was previously furnished to the Board in connection with the most recent renewal of the Prior Agreements at in-person meetings held in November 2019 and at other prior Board meetings.
Among other things, the Trustees considered:
| (i) | the reputation, experience, financial strength and resources of Franklin Templeton and its investment advisory subsidiaries; |
| (ii) | that Franklin Templeton informed the Board that it intends to maintain the investment autonomy of the Legg Mason investment advisory subsidiaries; |
| (iii) | that Franklin Templeton and Legg Mason informed the Board that, following the Transaction, there is not expected to be any diminution in the nature, quality and extent of services provided to the Fund and its shareholders by the Manager and Subadvisers, including compliance and other non-advisory services, and represented that there are not expected to be any changes in the portfolio management personnel managing the Fund as a result of the Transaction; |
| (iv) | that Franklin Templeton and Legg Mason informed the Board regarding initial transition plans and that they are instituting long-term retention arrangements for key personnel; |
| (v) | that Franklin Templeton informed the Board that there are not expected to be any changes to the brokerage practices and standards applied by the Subadvisers in seeking best execution; |
| (vi) | that there are not expected to be any changes to the Fund’s custodian or other service providers as a result of the Transaction; |
| (vii) | that Franklin Templeton informed the Board that it has no present intention to alter currently effective expense waivers and reimbursement arrangements after their expiration, and, while it reserves the right to do so in the future, it would consult with the Board before making any changes; |
| (viii) | that Franklin Templeton does not expect to propose any changes to the investment objective of the Fund or any changes to the principal investment strategies of the Fund as a result of the Transaction; |
| (ix) | the potential benefits to Fund shareholders from being part of a combined fund family with Franklin Templeton-sponsored funds and access to a broader array of investment opportunities; |
| QS S&P 500 Index Fund | 47 |
Board approval of new management and new subadvisory agreements (unaudited) (cont’d)
| (x) | that Franklin Templeton’s distribution capabilities, particularly with respect to retail investors, and significant network of intermediary relationships may provide additional opportunities for the Fund to grow assets and lower expenses by spreading expenses over a larger asset base; |
| (xi) | that Franklin Templeton and Legg Mason will each derive direct and ancillary benefits from the Transaction and that, as a result, they have a financial interest in the matters that were being considered; |
| (xii) | the fact that the Fund’s contractual management fee rate will remain the same and will not increase by virtue of the New Agreements; |
| (xiii) | the terms and conditions of the New Agreements, including that each New Agreement is identical to its corresponding Prior Agreement except for their respective dates of execution, effectiveness and termination; |
| (xiv) | the support expressed by the current senior management team at Legg Mason for the Transaction and Legg Mason’s recommendation that the Board approve the New Agreements; |
| (xv) | that the Prior Agreements are the product of multiple years of review and negotiation and information received and considered by the Board in the exercise of its business judgment during those years. At the November 2019 meeting, the Board conducted a full review of the investment advisory and distribution arrangements for the Fund and approved the Prior Agreements in accordance with the provisions of the Investment Company Act of 1940, as amended. Without any one factor being dispositive, in approving the Prior Agreements, the Board determined, in the exercise of the Trustees’ business judgment, that: (a) overall, the Board was satisfied with the nature, extent and quality of services provided (and expected to be provided) under the respective Prior Agreement by the Manager and Subadvisers and their affiliates; (b) the overall performance of the Fund was satisfactory and that management was committed to providing the resources necessary to assist the Fund’s portfolio managers; (c) the Fund’s management fees and cost structure was reasonable in light of the comparative performance and expense information and in relation to the services provided; (d) in light of the costs of providing investment management and other services to the Fund and the Manager’s and Subadvisers’ ongoing commitment to the Fund, the profits that Legg Mason and its affiliates received were considered to be not excessive; (e) the benefits of any economies of scale would be appropriately shared with shareholders through increased investment in fund management and administration resources; and (f) the ancillary benefits that the Manager and Subadvisers and their affiliates received were considered reasonable; |
| 48 | QS S&P 500 Index Fund |
| (xvi) | that the Prior Agreements were considered and approved as recently as November 2019; |
| (xvii) | that the Fund would not bear the costs of obtaining shareholder approval of the New Agreements, including proxy solicitation costs, legal fees and the costs of printing and mailing the proxy statement, regardless of whether the Transaction was consummated; and |
| (xviii) | that under the definitive agreement between Legg Mason and Franklin Templeton (the “Transaction Agreement”), Franklin Templeton has acknowledged that Legg Mason had entered into the Transaction Agreement in reliance upon the benefits and protections provided by Section 15(f) of the Investment Company Act of 1940, as amended, and that, in furtherance of the foregoing, Franklin Templeton agreed to use reasonable best efforts to conduct its business so that (a) for a period of not less than three years after the closing of the Transaction no more than 25% of the members of the Board shall be “interested persons” (as defined in the Investment Company Act of 1940, as amended) of any investment adviser for the Fund, and (b) for a period of not less than two years after the closing, neither Franklin Templeton nor any of its affiliates shall impose an “unfair burden” (within the meaning of the Investment Company Act of 1940, as amended, including any interpretations or no-action letters of the Securities and Exchange Commission) on any Fund as a result of the transactions contemplated by the Transaction Agreement or any express or implied terms, conditions or understandings applicable thereto. |
Certain of these considerations are discussed in more detail below.
In connection with the most recent approval or continuation of each Current Agreement, and in connection with their review of each New Agreement, the Trustees did not identify any particular factor that was all-important or controlling, and each Trustee may have attributed different weights to the various factors.
The discussion below covers both the advisory and the administrative functions rendered by the Manager for the Fund, both of which functions are encompassed by the New Management Agreement for the Fund, as well as the advisory functions rendered by the Subadvisers pursuant to the New Sub-advisory Agreements for the Fund. The Independent Trustees considered the New Management Agreement and the New Sub-advisory Agreements separately in the course of their review. In doing so, they considered the respective roles and compensation of the Manager and the Subadvisers in providing services to the Fund.
The Independent Trustees were advised by separate independent legal counsel throughout the process. Prior to voting, the Independent Trustees received a memorandum from their independent legal counsel discussing the legal standards for their consideration of the New
| QS S&P 500 Index Fund | 49 |
Board approval of new management and new subadvisory agreements (unaudited) (cont’d)
Agreements for the Fund. The Independent Trustees discussed the Transaction and the proposed approval of the New Agreements for the Fund on multiple occasions with their independent legal counsel in private sessions at which no representatives of Franklin Templeton, Legg Mason, or the Manager or Subadvisers for the Fund were present.
Nature, Extent and Quality of the Services to be provided to the Fund under the New Management Agreement and New Sub-Advisory Agreements
The Board received and considered information regarding the nature, extent and quality of services provided to the Fund by the Manager and the Subadvisers under the Prior Agreements. In evaluating the nature, extent and quality of the services expected to be provided to the Fund by the Manager and the Subadvisers under the New Management Agreement and New Sub-advisory Agreements, respectively, the Trustees considered, among other things, the expected impact, if any, of the Transaction on the operations, facilities, organization and personnel of the Manager and the Subadvisers, and that Franklin Templeton and Legg Mason have advised the Board that, following the Transaction, there is not expected to be any diminution in the nature, extent and quality of services provided to the Fund and its shareholders by the Manager and the Subadvisers, including compliance and other non-advisory services, and that there are not expected to be any changes in portfolio management personnel as a result of the Transaction. The Board considered information Franklin Templeton and Legg Mason provided regarding initial transition plans and the institution of long-term retention arrangements for key personnel. The Board considered that Franklin Templeton informed the Boards that there are not expected to be any changes to the brokerage practices and standards applied by the Subadvisers in seeking best execution. The Board also considered the reputation, experience, financial strength and resources of Franklin Templeton and its investment advisory subsidiaries, its business and operating structure, scale of operation, distribution capabilities, and leadership, as well as the combined financial resources of Legg Mason, Inc. and Franklin Templeton and the benefits to the Fund of being part of a larger combined organization with greater financial resources following the Transaction, particularly during periods of market disruptions and volatility.
The Board’s evaluation of the services provided by the Manager and the Subadvisers took into account the Board’s knowledge and familiarity gained as Trustees of funds in the Legg Mason fund complex, including the scope and quality of the investment management and other capabilities of the Manager and the Subadvisers and the quality of the Manager’s administrative and other services rendered to the Fund and its shareholders by the Manager. The Board observed that the scope of services provided by the Manager and the Subadvisers, and the undertakings required of the Manager and Subadvisers in connection with those services, including maintaining and monitoring their own and the Fund’s compliance programs, liquidity management programs and cybersecurity programs, had expanded over time as a result of regulatory, market and other developments. The Board
| 50 | QS S&P 500 Index Fund |
received and reviewed on a regular basis information from the Manager and the Subadvisers regarding the Fund’s compliance policies and procedures established pursuant to Rule 38a-1 under the Investment Company Act of 1940, as amended, and took that information into account in its evaluation of the New Agreements. The Board also considered the risks associated with the Fund borne by the Manager and its affiliates (such as entrepreneurial, operational, reputational, litigation and regulatory risk), as well as the risk management processes of the Manager and Subadvisers.
The Board reviewed the qualifications, backgrounds and responsibilities of the Fund’s senior personnel and the portfolio management team primarily responsible for the day-to-day portfolio management of the Fund. The Board also considered the policies and practices of the Manager and the Subadvisers regarding the selection of brokers and dealers and the execution of portfolio transactions for the Fund (including policies and practices regarding soft dollars and brokerage allocation), and Franklin Templeton’s representations that the brokerage practices and standards applied by the Manager and Subadvisers in seeking best execution will continue.
Fund Performance
The Board received and reviewed performance information for the Fund and for all retail and institutional S&P 500 index funds (the “Performance Universe”) selected by Broadridge Financial Solutions Inc. (“Broadridge”), an independent provider of investment company data based on classifications provided by Thomson Reuters Lipper. The Board was provided with a description of the methodology Broadridge used to determine the similarity of the Fund with the funds included in the Performance Universe. It was noted that, while the Board has found the Broadridge data generally useful, the Trustees recognized the limitations of such data, including that the data may vary depending on the end date selected and that the results of the performance comparisons may vary depending on the selection of the peer group and its composition over time. The Trustees noted that they also had received and discussed with management at periodic intervals information on the investment performance of the Fund in comparison to similar mutual funds and its benchmark performance index. In addition, the Board considered the Fund’s performance in light of overall financial market conditions.
The information comparing the Fund’s performance to that of the Performance Universe was for the one-, three-, five- and ten-year periods ended December 31, 2019. The Fund’s Class A shares performed below the median performance of the funds in the Performance Universe for each period. The Board also reviewed performance information provided by the Manager for periods ended February 29, 2020 and March 31, 2020. The Board also reviewed information prepared by Broadridge comparing the Fund’s annualized total return for the three-year period ended December 31, 2019 in relation to the Fund’s standard deviation to that of the funds in the Performance Universe. The Trustees then discussed
| QS S&P 500 Index Fund | 51 |
Board approval of new management and new subadvisory agreements (unaudited) (cont’d)
with representatives of management the reasons for the Fund’s underperformance versus the Performance Universe during the periods under review. Based on its review, the Board generally was satisfied with the Fund’s performance relative to the S&P 500 Index.
* * * * * *
Based on their review of the materials provided and the assurances they had received from Franklin Templeton and Legg Mason, Inc., the Trustees determined that the Transaction was not expected to affect adversely the nature, extent and quality of services provided by the Manager and the Subadvisers and that the Transaction was not expected to have an adverse effect on the ability of the Manager and the Subadvisers to provide those services, and the Board concluded that, overall, the nature, extent and quality of services, including portfolio management, expected to be provided under the New Agreements for the Fund were sufficient and supported a decision to approve each New Agreement.
Management Fees and Expense Ratios
The Board considered that it had reviewed the Fund’s management fee and total expense ratio in connection with the November 2019 contract renewal meeting. The Board noted that the New Agreements do not change the Fund’s management fee rate or the computation method for calculating such fee, and that there is no present intention to alter expense waiver and reimbursement arrangements that are currently in effect.
The Board reviewed and considered the contractual management fee rate (the “Contractual Management Fee”) payable by the Fund to the Manager in light of the nature, extent and quality of the management and sub-advisory services provided and expected to be provided by the Manager and the Subadvisers, respectively. The Board noted that the Manager, and not the Fund, pays the sub-advisory fees to the Subadvisers. In addition, the Board also reviewed and considered the actual management fee rate (the “Actual Management Fee”) paid by the Fund over the Fund’s last fiscal year. The Board also considered the management fee, the fees of each Subadviser and the portion of the management fee retained by the Manager after payment of the subadvisory fees, in each case in light of the services rendered for those amounts.
The Board also reviewed information regarding the scope of services provided to the Fund by the Manager and its affiliates, noting that the Fund is provided with regulatory compliance and administrative services, office facilities and Fund officers (including the Fund’s chief financial, chief legal and chief compliance officers), and that the Manager coordinates and oversees the provision of services to the Fund by other fund service providers, including the Subadvisers.
The Board received an analysis of complex-wide management fees provided by the Manager, which, among other things, set out a framework of fees based on asset classes.
| 52 | QS S&P 500 Index Fund |
Additionally, the Board received and considered information comparing the Fund’s Contractual Management Fee and Actual Management Fee and the Fund’s overall expense ratio with those of a group of eight retail no-load pure index S&P 500 index funds selected by Broadridge as comparable to the Fund (the “Expense Group”), and a broader group of funds selected by Broadridge consisting of all retail no-load pure index S&P 500 index funds (the “Expense Universe”). It was noted that while the Board found the Broadridge data generally useful they recognized its limitations, including that the data may vary depending on the selection of the peer group. This information showed that the Fund’s Contractual Management Fee and Actual Management Fee were at the median of management fees paid by the funds in the Expense Group and that the Fund’s Actual Management Fee was higher than the median of management fees paid by the funds in the Expense Universe. This information also showed that the Fund’s total expense ratio was higher than the median of the total expense ratios of the funds in the Expense Group and the funds in the Expense Universe. The Trustees also noted the Manager’s fee waiver and/or expense reimbursement arrangement.
In evaluating the costs of the services to be provided by the Manager and the Subadvisers under the New Agreements, the Trustees considered, among other things, whether management fees or other expenses would change as a result of the Transaction. Based on their review of the materials provided and the assurances they had received from Franklin Templeton and Legg Mason, the Trustees determined that the Transaction would not increase the total fees payable by the Fund for management services.
Manager Profitability and Economies of Scale
The Board received and considered a profitability analysis of the Manager and its affiliates in providing services to the Fund. The Board also received profitability information with respect to the Legg Mason fund complex as a whole. In addition, the Board received information with respect to the Manager’s allocation methodologies used in preparing this profitability data. It was noted that the allocation methodologies had been previously reviewed by an outside consultant. The profitability of the Manager and its affiliates was considered by the Board not excessive in light of the nature, extent and quality of the services provided to the Fund.
The Board also received and considered information regarding whether there have been economies of scale with respect to the management of the Fund as the Fund’s assets grow. The Board noted that to the extent the Fund’s assets increase over time, the Fund and its shareholders should realize economies of scale or efficiencies as certain expenses, such as fixed fund fees, become a smaller percentage of overall assets. The Board noted that it appeared that the benefits of any economies of scale also would be appropriately shared with shareholders through increased investment in fund management and administration resources (e.g., enhanced cyber security oversight, enhanced risk management oversight, etc.).
| QS S&P 500 Index Fund | 53 |
Board approval of new management and new subadvisory agreements (unaudited) (cont’d)
The Trustees noted that Franklin Templeton and Legg Mason expected to realize cost savings from the Transaction based on synergies of operations, as well as to benefit from possible growth of the funds in the Legg Mason fund complex resulting from enhanced distribution capabilities. However, they noted that other factors could also affect profitability and potential economies of scale, and that it was not possible to predict with any degree of certainty how the Transaction would affect the profitability of the Manager and its affiliates in providing services to the Fund, nor to quantify any possible future economies of scale. The Trustees noted they will have the opportunity to periodically re-examine such profitability and any economies of scale going forward.
* * * * * *
Taking all of the above into consideration, the Board determined that the management fee was reasonable in light of the comparative performance and expense information and the nature, extent and quality of the services expected to be provided to the Fund under the New Agreements after the Transaction.
Other Benefits to the Manager
The Board considered other benefits received by the Manager and its affiliates, including the Subadvisers, as a result of their relationship with the Fund, including the opportunity to offer additional products and services to Fund shareholders. In light of the costs of providing investment management and other services to the Fund and the ongoing commitment of the Manager and the Subadvisers to the Fund, the Board considered that the ancillary benefits that the Manager, the Subadvisers and their affiliates receive were reasonable. In evaluating the fall-out benefits to be received by the Manager and the Subadvisers under the New Agreements, the Trustees considered whether the Transaction would have an impact on the fall-out benefits received by virtue of the Prior Agreements.
The Board also considered that Franklin Templeton may derive reputational and other benefits from its ability to use the Legg Mason investment affiliates’ names in connection with operating and marketing the Fund. The Board also considered that the Transaction, if completed, would significantly increase Franklin Templeton’s assets under management and expand Franklin Templeton’s investment capabilities. Such ancillary benefits were considered reasonable.
* * * * * *
After consideration of the factors described above as well as other factors, and in the exercise of their business judgment, the Trustees, including the Independent Trustees,
| 54 | QS S&P 500 Index Fund |
concluded that the New Agreements for the Fund, including the fees payable thereunder, were fair and reasonable and that entering into the New Agreements for the Fund was in the best interests of the Fund’s shareholders, and they voted to approve the New Agreements and to recommend that shareholders approve the New Agreements.
| QS S&P 500 Index Fund | 55 |
Additional shareholder information (unaudited)
Results of special meeting of shareholders
On September 25, 2020 a special meeting of shareholders was held for the following purposes: 1) to approve a new management agreement between the Fund and its investment manager; and 2) to approve a new subadvisory agreement with respect to each of the Fund’s subadvisers. The following table provides the number of votes cast for or against, as well as the number of abstentions and broker non-votes as to each matter voted on at the special meeting of shareholders. Each item voted on was approved.
| Item Voted On | Voted For | Voted Against | Abstentions | Broker Non-Votes | ||||||||||||
| To Approve a New Management Agreement with Legg Mason Partners Fund Advisor, LLC | 92,796,417.543 | 3,559,037.258 | 16,631,146.051 | 0 | ||||||||||||
| To Approve a New Subadvisory Agreement with QS Investors, LLC | 92,135,011.924 | 3,521,081.915 | 17,330,507.013 | 0 | ||||||||||||
| To Approve a New Subadvisory Agreement with Western Asset Management Company, LLC | 91,770,838.375 | 3,902,967.905 | 17,312,794.572 | 0 | ||||||||||||
| 56 | QS S&P 500 Index Fund |
Statement regarding liquidity risk management program (unaudited)
As required by law, the fund has adopted and implemented a liquidity risk management program (the “Program”) that is designed to assess and manage liquidity risk. Liquidity risk is the risk that the fund could not meet requests to redeem its shares without significant dilution of remaining investors’ interests in the fund. Legg Mason Partners Fund Advisor, LLC (the “Manager”), the fund’s manager, is the administrator of the Program. The Manager has established a liquidity risk management committee (the “Committee”) to administer the Program on a day-to-day basis.
The Committee, on behalf of the Manager, provided the fund’s Board of Trustees with a report that addressed the operation of the Program, assessed its adequacy and effectiveness of implementation, including, if applicable, the operation of any highly liquid investment minimum (“HLIM”), and described any material changes that had been made to the Program or were recommended (the “Report”). The Report covered the period from December 1, 2018 through December 31, 2019 (the “Reporting Period”).
The Report confirmed that there were no material changes to the Program during the Reporting Period and that no changes were recommended.
The Report also confirmed that, throughout the Reporting Period, the Committee had monitored the fund’s portfolio liquidity and liquidity risk on an ongoing basis, as described in the Program and in Board reporting throughout the Reporting Period.
The Report discussed the Committee’s annual review of the Program, which addressed, among other things, the following elements of the Program:
Assessment, Management, and Periodic Review of Liquidity Risk. The Committee reviewed the fund’s investment strategy and liquidity of portfolio investments during both normal and reasonably foreseeable stressed conditions. The Committee noted that the fund’s investment strategy continues to be appropriate for an open-end fund, taking into account, among other things, whether and to what extent the fund held less liquid and illiquid assets and the extent to which any such investments affected the fund’s ability to meet redemption requests. In managing and reviewing the fund’s liquidity risk, the Committee also considered the extent to which the fund’s investment strategy involves a relatively concentrated portfolio or large positions in particular issuers, the extent to which the fund uses borrowing for investment purposes, and the extent to which the fund uses derivatives (including for hedging purposes). The Committee also reviewed the fund’s short-term and long-term cash flow projections during both normal and reasonably foreseeable stressed conditions. In assessing the fund’s cash flow projections, the Committee considered, among other factors, historical net redemption activity, redemption policies, ownership concentration, distribution channels, and the degree of certainty associated with the fund’s short-term and long-term cash flow projections. The Committee also considered the fund’s holdings of cash and cash equivalents, as well as borrowing arrangements and other funding sources, including, if applicable, the fund’s participation in a credit facility, as components of the fund’s ability to meet redemption requests.
| QS S&P 500 Index Fund | 57 |
Statement regarding liquidity risk management program (unaudited) (cont’d)
Liquidity Classification. The Committee reviewed the Program’s liquidity classification methodology for categorizing the fund’s investments into one of four liquidity buckets. In reviewing the fund’s investments, the Committee considered, among other factors, whether trading varying portions of a position in a particular portfolio investment or asset class in sizes the fund would reasonably anticipate trading, would be reasonably expected to significantly affect liquidity.
Highly Liquid Investment Minimum. The Committee performed an analysis to determine whether the fund is required to maintain a Highly Liquid Investment Minimum, and determined that no such minimum is required because the fund primarily holds highly liquid investments.
Compliance with Limitation on Illiquid Investments. The Committee confirmed that during the Reporting Period, the fund did not acquire any illiquid investment such that, after the acquisition, the fund would have invested more than 15% of its assets in illiquid investments that are assets, in accordance with the Program and applicable SEC rules.
Redemptions in Kind. The Committee confirmed that no redemptions in-kind were effected by the fund during the Reporting Period.
The Report stated that the Committee concluded that the Program is reasonably designed and operated effectively to assess and manage the fund’s liquidity risk throughout the Reporting Period.
| 58 | QS S&P 500 Index Fund |
Additional information (unaudited)
Information about Trustees and Officers
The business and affairs of QS S&P 500 Index Fund (the “Fund”) are conducted by management under the supervision and subject to the direction of its Board of Trustees. The business address of each Trustee is c/o Jane Trust, Legg Mason, 100 International Drive, 11th Floor, Baltimore, Maryland 21202. Information pertaining to the Trustees and officers of the Fund is set forth below.
The Statement of Additional Information includes additional information about Trustees and is available, without charge, upon request by calling the Fund at 1-877-721-1926.
| Independent Trustees† | ||
| Paul R. Ades | ||
| Year of birth | 1940 | |
| Position(s) with Trust | Trustee | |
| Term of office1 and length of time served2 | Since 1983 | |
| Principal occupation(s) during the past five years | Paul R. Ades, PLLC (law firm) (since 2000) | |
| Number of funds in fund complex overseen by Trustee | 49 | |
| Other board memberships held by Trustee during the past five years | None | |
| Andrew L. Breech | ||
| Year of birth | 1952 | |
| Position(s) with Trust | Trustee | |
| Term of office1 and length of time served2 | Since 1991 | |
| Principal occupation(s) during the past five years | President, Dealer Operating Control Service, Inc. (automotive retail management) (since 1985) | |
| Number of funds in fund complex overseen by Trustee | 49 | |
| Other board memberships held by Trustee during the past five years | None | |
| Dwight B. Crane | ||
| Year of birth | 1937 | |
| Position(s) with Trust | Trustee | |
| Term of office1 and length of time served2 | Since 1981 | |
| Principal occupation(s) during the past five years | Professor Emeritus, Harvard Business School (since 2007); formerly, Professor, Harvard Business School (1969 to 2007); Independent Consultant (since 1969) | |
| Number of funds in fund complex overseen by Trustee | 49 | |
| Other board memberships held by Trustee during the past five years | None | |
| QS S&P 500 Index Fund | 59 |
Additional information (unaudited) (cont’d)
Information about Trustees and Officers
| Independent Trustees† (cont’d) | ||
| Althea L. Duersten | ||
| Year of birth | 1951 | |
| Position(s) with Trust | Trustee | |
| Term of office1 and length of time served2 | Since 2014 | |
| Principal occupation(s) during the past five years | Retired (since 2011); formerly, Chief Investment Officer, North America, JPMorgan Chase (investment bank) and member of JPMorgan Executive Committee (2007 to 2011) | |
| Number of funds in fund complex overseen by Trustee | 49 | |
| Other board memberships held by Trustee during the past five years | Non-Executive Director, Rokos Capital Management LLP (since 2019) | |
| Stephen R. Gross | ||
| Year of birth | 1947 | |
| Position(s) with Trust | Trustee | |
| Term of office1 and length of time served2 | Since 1986 | |
| Principal occupation(s) during the past five years | Chairman Emeritus (since 2011) and formerly, Chairman, HLB Gross Collins, P.C. (accounting and consulting firm) (1979 to 2011); Executive Director of Business Builders Team, LLC (since 2005); Principal, Gross Consulting Group, LLC (since 2011); CEO, Gross Capital Partners, LLC (since 2014); CEO, Trusted CFO Solutions, LLC (since 2011) | |
| Number of funds in fund complex overseen by Trustee | 49 | |
| Other board memberships held by Trustee during the past five years | None | |
| Susan M. Heilbron | ||
| Year of birth | 1945 | |
| Position(s) with Trust | Trustee | |
| Term of office1 and length of time served2 | Since 1991 | |
| Principal occupation(s) during the past five years | Retired; formerly, President, Lacey & Heilbron (communications consulting) (1990 to 2002); General Counsel and Executive Vice President, The Trump Organization (1986 to 1990); Senior Vice President, New York State Urban Development Corporation (1984 to 1986); Associate, Cravath, Swaine & Moore LLP (1980 to 1984) and (1977 to 1979) | |
| Number of funds in fund complex overseen by Trustee | 49 | |
| Other board memberships held by Trustee during the past five years | Formerly, Director, Lincoln Savings Bank, FSB (1991 to 1994); Director, Trump Shuttle, Inc. (air transportation) (1989 to 1990); Director, Alexander’s Inc. (department store) (1987 to 1990) | |
| 60 | QS S&P 500 Index Fund |
| Independent Trustees† (cont’d) | ||
| Frank G. Hubbard | ||
| Year of birth | 1937 | |
| Position(s) with Trust | Trustee | |
| Term of office1 and length of time served2 | Since 1993 | |
| Principal occupation(s) during the past five years | President, Fealds, Inc. (business development) (since 2016); formerly, President, Avatar International Inc. (business development) (1998 to 2015) | |
| Number of funds in fund complex overseen by Trustee | 49 | |
| Other board memberships held by Trustee during the past five years | None | |
| Howard J. Johnson | ||
| Year of birth | 1938 | |
| Position(s) with Trust | Trustee and Chairman | |
| Term of office1 and length of time served2 | From 1981 to 1998 and since 2000 (Chairman since 2013) | |
| Principal occupation(s) during the past five years | Retired; formerly, Chief Executive Officer, Genesis Imaging LLC (technology company) (2003 to 2012) | |
| Number of funds in fund complex overseen by Trustee | 49 | |
| Other board memberships held by Trustee during the past five years | None | |
| Jerome H. Miller | ||
| Year of birth | 1938 | |
| Position(s) with Trust | Trustee | |
| Term of office1 and length of time served2 | Since 1995 | |
| Principal occupation(s) during the past five years | Retired; formerly, President, Shearson Lehman Asset Management (1991 to 1993), Vice Chairman, Shearson Lehman Hutton Inc. (1989 to 1992) and Senior Executive Vice President, E.F. Hutton Group Inc. (1986 to 1989) | |
| Number of funds in fund complex overseen by Trustee | 49 | |
| Other board memberships held by Trustee during the past five years | None | |
| Ken Miller | ||
| Year of birth | 1942 | |
| Position(s) with Trust | Trustee | |
| Term of office1 and length of time served2 | Since 1983 | |
| Principal occupation(s) during the past five years | Retired; formerly, President, Young Stuff Apparel Group, Inc. (apparel manufacturer), division of Li & Fung (1963 to 2012) | |
| Number of funds in fund complex overseen by Trustee | 49 | |
| Other board memberships held by Trustee during the past five years | None | |
| QS S&P 500 Index Fund | 61 |
Additional information (unaudited) (cont’d)
Information about Trustees and Officers
| Independent Trustees† (cont’d) | ||
| Thomas F. Schlafly | ||
| Year of birth | 1948 | |
| Position(s) with Trust | Trustee | |
| Term of office1 and length of time served2 | Since 1983 | |
| Principal occupation(s) during the past five years | Chairman, The Saint Louis Brewery, LLC (brewery) (since 2012); formerly, President, The Saint Louis Brewery, Inc. (1989 to 2012); Senior Counsel (since 2017) and formerly, Partner (2009 to 2016), Thompson Coburn LLP (law firm) | |
| Number of funds in fund complex overseen by Trustee | 49 | |
| Other board memberships held by Trustee during the past five years | Director, CNB St. Louis Bank (since 2006) | |
| Interested Trustee and Officer | ||
| Jane Trust, CFA3 | ||
| Year of birth | 1962 | |
| Position(s) with Trust | Trustee, President and Chief Executive Officer | |
| Term of office1 and length of time served2 | Since 2015 | |
| Principal occupation(s) during the past five years | Senior Vice President, Fund Board Management, Franklin Templeton (since 2020); Officer and/or Trustee/Director of 150 funds associated with Legg Mason Partners Fund Advisor, LLC (“LMPFA”) or its affiliates (since 2015); President and Chief Executive Officer of LMPFA (since 2015); formerly, Senior Managing Director (2018 to 2020) and Managing Director (2016 to 2018) of Legg Mason & Co., LLC (“Legg Mason & Co.”); Senior Vice President of LMPFA (2015) | |
| Number of funds in fund complex overseen by Trustee | 147 | |
| Other board memberships held by Trustee during the past five years | None | |
| Additional Officers | ||
| Ted P. Becker | ||
| Legg Mason | ||
| 620 Eighth Avenue, 47th Floor, New York, NY 10018 | ||
| Year of birth | 1951 | |
| Position(s) with Trust | Chief Compliance Officer | |
| Term of office1 and length of time served2 | Since 2007 | |
| Principal occupation(s) during the past five years | Vice President, Global Compliance of Franklin Templeton (since 2020); Chief Compliance Officer of LMPFA (since 2006); Chief Compliance Officer of certain funds associated with Legg Mason & Co. or its affiliates (since 2006); formerly, Director of Global Compliance at Legg Mason, Inc. (2006 to 2020); Managing Director of Compliance of Legg Mason & Co. (2005 to 2020) | |
| 62 | QS S&P 500 Index Fund |
| Additional Officers (cont’d) | ||
| Susan Kerr | ||
| Legg Mason | ||
| 620 Eighth Avenue, 47th Floor, New York, NY 10018 | ||
| Year of birth | 1949 | |
| Position(s) with Trust | Chief Anti-Money Laundering Compliance Officer | |
| Term of office1 and length of time served2 | Since 2013 | |
| Principal occupation(s) during the past five years | Senior Compliance Analyst, Franklin Templeton (since 2020); Chief Anti-Money Laundering Compliance Officer of certain funds associated with Legg Mason & Co. or its affiliates (since 2013) and Anti-Money Laundering Compliance Officer (since 2012), Senior Compliance Officer (since 2011) and Assistant Vice President (since 2010) of Legg Mason Investor Services, LLC (“LMIS”); formerly, Assistant Vice President of Legg Mason & Co. (2010 to 2020) | |
| Jenna Bailey | ||
| Legg Mason | ||
| 100 First Stamford Place, 5th Floor, Stamford, CT 06902 | ||
| Year of birth | 1978 | |
| Position(s) with Trust | Identity Theft Prevention Officer | |
| Term of office1 and length of time served2 | Since 2015 | |
| Principal occupation(s) during the past five years | Senior Compliance Analyst of Franklin Templeton (since 2020); Identity Theft Prevention Officer of certain funds associated with Legg Mason & Co. or its affiliates (since 2015); formerly, Compliance Officer of Legg Mason & Co. (2013 to 2020); Assistant Vice President of Legg Mason & Co. (2011 to 2020) | |
| Marc A. De Oliveira* | ||
| Legg Mason | ||
| 100 First Stamford Place, 6th Floor, Stamford, CT 06902 | ||
| Year of birth | 1971 | |
| Position(s) with Trust | Secretary and Chief Legal Officer | |
| Term of office1 and length of time served2 | Since 2020 | |
| Principal occupation(s) during the past five years | Associate General Counsel of Franklin Templeton (since 2020); Assistant Secretary of certain funds associated with Legg Mason & Co. or its affiliates (since 2006); formerly, Managing Director (2016 to 2020) and Associate General Counsel of Legg Mason & Co. (2005 to 2020) | |
| QS S&P 500 Index Fund | 63 |
Additional information (unaudited) (cont’d)
Information about Trustees and Officers
| Additional Officers (cont’d) | ||
| Thomas C. Mandia | ||
| Legg Mason | ||
| 100 First Stamford Place, 6th Floor, Stamford, CT 06902 | ||
| Year of birth | 1962 | |
| Position(s) with Trust | Senior Vice President | |
| Term of office1 and length of time served2 | Since 2020 | |
| Principal occupation(s) during the past five years | Senior Associate General Counsel of Franklin Templeton (since 2020); Secretary of LMPFA (since 2006); Assistant Secretary of certain funds associated with Legg Mason & Co. or its affiliates (since 2006); Secretary of LM Asset Services, LLC (“LMAS”) (since 2002) and Legg Mason Fund Asset Management, Inc. (“LMFAM”) (since 2013) (formerly registered investment advisers); formerly, Managing Director and Deputy General Counsel of Legg Mason & Co. (2005 to 2020) | |
| Christopher Berarducci | ||
| Legg Mason | ||
| 620 Eighth Avenue, 47th Floor, New York, NY 10018 | ||
| Year of birth | 1974 | |
| Position(s) with Trust | Treasurer and Principal Financial Officer | |
| Term of office1 and length of time served2 | Since 2014 and 2019 | |
| Principal occupation(s) during the past five years | Vice President, Fund Administration and Reporting, Franklin Templeton (since 2020); Treasurer (since 2010) and Principal Financial Officer (since 2019) of certain funds associated with Legg Mason & Co. or its affiliates; formerly, Managing Director (2020), Director (2015 to 2020), and Vice President (2011 to 2015) of Legg Mason & Co. | |
| Jeanne M. Kelly | ||
| Legg Mason | ||
| 620 Eighth Avenue, 47th Floor, New York, NY 10018 | ||
| Year of birth | 1951 | |
| Position(s) with Trust | Senior Vice President | |
| Term of office1 and length of time served2 | Since 2007 | |
| Principal occupation(s) during the past five years | U.S. Fund Board Team Manager, Franklin Templeton (since 2020); Senior Vice President of certain funds associated with Legg Mason & Co. or its affiliates (since 2007); Senior Vice President of LMPFA (since 2006); President and Chief Executive Officer of LMAS and LMFAM (since 2015); formerly, Managing Director of Legg Mason & Co. (2005 to 2020); Senior Vice President of LMFAM (2013 to 2015) | |
| † | Trustees who are not “interested persons” of the Fund within the meaning of Section 2(a)(19) of the Investment Company Act of 1940, as amended (the “1940 Act”). |
| * | Effective August 6, 2020, Mr. De Oliveira became Secretary and Chief Legal Officer. |
| 1 | Each Trustee and officer serves until his or her respective successor has been duly elected and qualified or until his or her earlier death, resignation, retirement or removal. |
| 64 | QS S&P 500 Index Fund |
| 2 | Indicates the earliest year in which the Trustee became a board member for a fund in the Legg Mason fund complex or the officer took such office. |
| 3 | Ms. Trust is an “interested person” of the Fund, as defined in the 1940 Act, because of her position with LMPFA and/or certain of its affiliates. |
| QS S&P 500 Index Fund | 65 |
Important tax information (unaudited)
The following information is provided with respect to the distributions paid during the taxable year ended September 30, 2020:
| Record date: | 12/4/2019 | 12/17/2019 | ||||||
| Payable date: | 12/5/2019 | 12/18/2019 | ||||||
| Ordinary Income: | ||||||||
Qualified Dividend Income for Individuals | — | 100.00 | % | |||||
Dividends Qualifying for the Dividends | ||||||||
Received Deduction for Corporations | — | 100.00 | % | |||||
| Long-Term Capital Gain Dividend | $1.136640 | — | ||||||
| Qualified Short-Term Capital Gain Dividend* | $0.003210 | — |
| * | Qualified Short-Term Capital Gains eligible for exemption from U.S. withholding tax for non resident shareholders and foreign corporations. |
| 66 | QS S&P 500 Index Fund |
QS
S&P 500 Index Fund
Trustees
Paul R. Ades
Andrew L. Breech
Dwight B. Crane
Althea L. Duersten
Stephen R. Gross
Susan M. Heilbron
Frank G. Hubbard
Howard J. Johnson
Chairman
Jerome H. Miller
Ken Miller
Thomas F. Schlafly
Jane Trust
Investment manager
Legg Mason Partners Fund Advisor, LLC
Subadviser
QS Investors, LLC
Distributor
Legg Mason Investor Services, LLC
Custodian
The Bank of New York Mellon
Transfer agent
BNY Mellon Investment
Servicing (US) Inc.
4400 Computer Drive
Westborough, MA 01581
Independent registered public accounting firm
PricewaterhouseCoopers LLP
Baltimore, MD
QS S&P 500 Index Fund
The Fund is a separate investment series of Legg Mason Partners Equity Trust, a Maryland statutory trust.
QS S&P 500 Index Fund
Legg Mason Funds
620 Eighth Avenue, 47th Floor
New York, NY 10018
The Fund files its complete schedule of portfolio holdings with the Securities and Exchange Commission (“SEC”) for the first and third quarters of each fiscal year as an exhibit to its reports on Form N-PORT. The Fund’s Forms N-PORT are available on the SEC’s website at www.sec.gov. To obtain information on Form N-PORT, shareholders can call the Fund at 1-877-721-1926.
Information on how the Fund voted proxies relating to portfolio securities during the prior 12-month period ended June 30th of each year and a description of the policies and procedures that the Fund uses to determine how to vote proxies related to portfolio transactions are available (1) without charge, upon request, by calling the Fund at 1-877-721-1926, (2) at www.leggmason.com/mutualfunds and (3) on the SEC’s website at www.sec.gov.
This report is submitted for the general information of the shareholders of QS S&P 500 Index Fund. This report is not authorized for distribution to prospective investors in the Fund unless preceded or accompanied by a current prospectus.
Investors should consider the Fund’s investment objectives, risks, charges and expenses carefully before investing. The prospectus contains this and other important information about the Fund. Please read the prospectus carefully before investing.
www.leggmason.com
© 2020 Legg Mason Investor Services, LLC
Member FINRA, SIPC
Legg Mason Funds Privacy and Security Notice
Your Privacy and the Security of Your Personal Information is Very Important to the Legg Mason Funds
This Privacy and Security Notice (the “Privacy Notice”) addresses the Legg Mason Funds’ privacy and data protection practices with respect to nonpublic personal information the Funds receive. The Legg Mason Funds include any funds sold by the Funds’ distributor, Legg Mason Investor Services, LLC, as well as Legg Mason-sponsored closed-end funds. The provisions of this Privacy Notice apply to your information both while you are a shareholder and after you are no longer invested with the Funds.
The Type of Nonpublic Personal Information the Funds Collect About You
The Funds collect and maintain nonpublic personal information about you in connection with your shareholder account. Such information may include, but is not limited to:
| • | Personal information included on applications or other forms; |
| • | Account balances, transactions, and mutual fund holdings and positions; |
| • | Bank account information, legal documents, and identity verification documentation; |
| • | Online account access user IDs, passwords, security challenge question responses; and |
| • | Information received from consumer reporting agencies regarding credit history and creditworthiness (such as the amount of an individual’s total debt, payment history, etc.). |
How the Funds Use Nonpublic Personal Information About You
The Funds do not sell or share your nonpublic personal information with third parties or with affiliates for their marketing purposes, or with other financial institutions or affiliates for joint marketing purposes, unless you have authorized the Funds to do so. The Funds do not disclose any nonpublic personal information about you except as may be required to perform transactions or services you have authorized or as permitted or required by law. The Funds may disclose information about you to:
| • | Employees, agents, and affiliates on a “need to know” basis to enable the Funds to conduct ordinary business or to comply with obligations to government regulators; |
| • | Service providers, including the Funds’ affiliates, who assist the Funds as part of the ordinary course of business (such as printing, mailing services, or processing or servicing your account with us) or otherwise perform services on the Funds’ behalf, including companies that may perform statistical analysis, market research and marketing services solely for the Funds; |
| • | Permit access to transfer, whether in the United States or countries outside of the United States to such Funds’ employees, agents and affiliates and service providers as required to enable the Funds to conduct ordinary business, or to comply with obligations to government regulators; |
| • | The Funds’ representatives such as legal counsel, accountants and auditors to enable the Funds to conduct ordinary business, or to comply with obligations to government regulators; |
| • | Fiduciaries or representatives acting on your behalf, such as an IRA custodian or trustee of a grantor trust. |
| NOT PART OF THE ANNUAL REPORT |
Legg Mason Funds Privacy and Security Notice (cont’d)
Except as otherwise permitted by applicable law, companies acting on the Funds’ behalf, including those outside the United States, are contractually obligated to keep nonpublic personal information the Funds provide to them confidential and to use the information the Funds share only to provide the services the Funds ask them to perform.
The Funds may disclose nonpublic personal information about you when necessary to enforce their rights or protect against fraud, or as permitted or required by applicable law, such as in connection with a law enforcement or regulatory request, subpoena, or similar legal process. In the event of a corporate action or in the event a Fund service provider changes, the Funds may be required to disclose your nonpublic personal information to third parties. While it is the Funds’ practice to obtain protections for disclosed information in these types of transactions, the Funds cannot guarantee their privacy policy will remain unchanged.
Keeping You Informed of the Funds’ Privacy and Security Practices
The Funds will notify you annually of their privacy policy as required by federal law. While the Funds reserve the right to modify this policy at any time they will notify you promptly if this privacy policy changes.
The Funds’ Security Practices
The Funds maintain appropriate physical, electronic and procedural safeguards designed to guard your nonpublic personal information. The Funds’ internal data security policies restrict access to your nonpublic personal information to authorized employees, who may use your nonpublic personal information for Fund business purposes only.
Although the Funds strive to protect your nonpublic personal information, they cannot ensure or warrant the security of any information you provide or transmit to them, and you do so at your own risk. In the event of a breach of the confidentiality or security of your nonpublic personal information, the Funds will attempt to notify you as necessary so you can take appropriate protective steps. If you have consented to the Funds using electronic communications or electronic delivery of statements, they may notify you under such circumstances using the most current email address you have on record with them.
In order for the Funds to provide effective service to you, keeping your account information accurate is very important. If you believe that your account information is incomplete, not accurate or not current, if you have questions about the Funds’ privacy practices, or our use of your nonpublic personal information, write the Funds using the contact information on your account statements, email the Funds by clicking on the Contact Us section of the Funds’ website at www.leggmason.com, or contact the Funds at 1-877-721-1926.
Revised April 2018
| NOT PART OF THE ANNUAL REPORT |
www.leggmason.com
© 2020 Legg Mason Investor Services, LLC Member FINRA, SIPC
FD04121 11/20 SR20-3996
| ITEM 2. | CODE OF ETHICS. |
The registrant has adopted a code of ethics that applies to the registrant’s principal executive officer, principal financial officer, principal accounting officer or controller.
| ITEM 3. | AUDIT COMMITTEE FINANCIAL EXPERT. |
The Board of Trustees of the registrant has determined that Dwight B. Crane possesses the technical attributes identified in Instruction 2(b) of Item 3 to Form N-CSR to qualify as an “audit committee financial expert,” and has designated Dwight B. Crane as the Audit Committee’s financial expert Dwight B. Crane is an “independent” Trustees pursuant to paragraph (a)(2) of Item 3 to Form N-CSR.
| ITEM 4. | PRINCIPAL ACCOUNTANT FEES AND SERVICES. |
a) Audit Fees. The aggregate fees billed in the last two fiscal years ending September 30, 2019 and September 30, 2020 (the “Reporting Periods”) for professional services rendered by the Registrant’s principal accountant (the “Auditor”) for the audit of the Registrant’s annual financial statements, or services that are normally provided by the Auditor in connection with the statutory and regulatory filings or engagements for the Reporting Periods, were $158,701 in September 30, 2019 and $149,125 in September 30, 2020.
b) Audit-Related Fees. The aggregate fees billed in the Reporting Period for assurance and related services by the Auditor that are reasonably related to the performance of the Registrant’s financial statements were $3,000 in September 30, 2019 and $0 in September 30, 2020.
In addition, there were no Audit-Related Fees billed in the Reporting Period for assurance and related services by the Auditor to the Registrant’s investment adviser (not including any sub-adviser whose role is primarily portfolio management and is subcontracted with or overseen by another investment adviser), and any entity controlling, controlled by or under common control with the investment adviser that provides ongoing services to the Legg Mason Global Asset Management Trust (“service affiliates”), that were reasonably related to the performance of the annual audit of the service affiliates. Accordingly, there were no such fees that required pre-approval by the Audit Committee for the Reporting Period.
(c) Tax Fees. The aggregate fees billed in the Reporting Periods for professional services rendered by the Auditor for tax compliance, tax advice and tax planning (“Tax Services”) were $0 in September 30, 2019 and $0 in September 30, 2020. These services consisted of (i) review or preparation of U.S. federal, state, local and excise tax returns; (ii) U.S. federal, state and local tax planning, advice and assistance regarding statutory, regulatory or administrative developments, and (iii) tax advice regarding tax qualification matters and/or treatment of various financial instruments held or proposed to be acquired or held.
There were no fees billed for tax services by the Auditors to service affiliates during the Reporting Periods that required pre-approval by the Audit Committee.
d) All Other Fees.
The aggregate fees billed in the Reporting Periods for products and services provided by the Auditor, other than the services reported in paragraphs (a) through (c) for the Item 4 for the Legg Mason Partners Equity Trust., were $0 in September 30, 2019 and $0 in September 30, 2020.
All Other Fees. There were no other non-audit services rendered by the Auditor to Legg Mason Partners Fund Advisors, LLC (“LMPFA”), and any entity controlling, controlled by or under common control with LMPFA that provided ongoing services to Legg Mason Partners Equity Trust requiring pre-approval by the Audit Committee in the Reporting Period.
(e) Audit Committee’s pre–approval policies and procedures described in paragraph (c) (7) of Rule 2-01 of Regulation S-X.
(1) The Charter for the Audit Committee (the “Committee”) of the Board of each registered investment company (the “Fund”) advised by LMPFA or one of their affiliates (each, an “Adviser”) requires that the Committee shall approve (a) all audit and permissible non-audit services to be provided to the Fund and (b) all permissible non-audit services to be provided by the Fund’s independent auditors to the Adviser and any Covered Service Providers if the engagement relates directly to the operations and financial reporting of the Fund. The Committee may implement policies and procedures by which such services are approved other than by the full Committee.
The Committee shall not approve non-audit services that the Committee believes may impair the independence of the auditors. As of the date of the approval of this Audit Committee Charter, permissible non-audit services include any professional services (including tax services), that are not prohibited services as described below, provided to the Fund by the independent auditors, other than those provided to the Fund in connection with an audit or a review of the financial statements of the Fund. Permissible non-audit services may not include: (i) bookkeeping or other services related to the accounting records or financial statements of the Fund; (ii) financial information systems design and implementation; (iii) appraisal or valuation services, fairness opinions or contribution-in-kind reports; (iv) actuarial services; (v) internal audit outsourcing services; (vi) management functions or human resources; (vii) broker or dealer, investment adviser or investment banking services; (viii) legal services and expert services unrelated to the audit; and (ix) any other service the Public Company Accounting Oversight Board determines, by regulation, is impermissible.
Pre-approval by the Committee of any permissible non-audit services is not required so long as: (i) the aggregate amount of all such permissible non-audit services provided to the Fund, the Adviser and any service providers controlling, controlled by or under common control with the Adviser that provide ongoing services to the Fund (“Covered Service Providers”) constitutes not more than 5% of the total amount of revenues paid to the independent auditors during the fiscal year in which the permissible non-audit services are provided to (a) the Fund, (b) the Adviser and (c) any entity controlling, controlled by or under common control with the Adviser that provides ongoing services to the Fund during the fiscal year in which the services are provided that would have to be approved by the Committee; (ii) the permissible non-audit services were not recognized by the Fund at the time of the engagement to be non-audit services; and (iii) such services are promptly brought to the attention of the Committee and approved by the Committee (or its delegate(s)) prior to the completion of the audit.
(2) For the Legg Mason Partners Equity Trust, the percentage of fees that were approved by the audit committee, with respect to: Audit-Related Fees were 100% and 100% for September 30, 2019 and September 30, 2020; Tax Fees were 100% and 100% for September 30, 2019 and September 30, 2020; and Other Fees were 100% and 100% for September 30, 2019 and September 30, 2020.
(f) N/A
(g) Non-audit fees billed by the Auditor for services rendered to Legg Mason Partners Equity Trust, LMPFA and any entity controlling, controlled by, or under common control with LMPFA that provides ongoing services to Legg Mason Partners Equity Trust during the reporting period were $265,845 in September 30, 2019 and $857,833 in September 30, 2020.
(h) Yes. Legg Mason Partners Equity Trust’s Audit Committee has considered whether the provision of non-audit services that were rendered to Service Affiliates, which were not pre-approved (not requiring pre-approval), is compatible with maintaining the Accountant’s independence. All services provided by the Auditor to the Legg Mason Partners Equity Trust or to Service Affiliates, which were required to be pre-approved, were pre-approved as required.
| ITEM 5. | AUDIT COMMITTEE OF LISTED REGISTRANTS. |
| a) | The independent board members are acting as the registrant’s audit committee as specified in Section 3(a)(58)(B) of the Exchange Act. The Audit Committee consists of the following Board members: |
Paul R. Ades | ||
Andrew L. Breech | ||
Dwight B. Crane | ||
Althea L. Duersten | ||
Stephen R. Gross | ||
Susan M. Heilbron | ||
Frank G. Hubbard | ||
Howard J. Johnson | ||
Jerome H. Miller | ||
Ken Miller | ||
Thomas F. Schlafly |
| b) | Not applicable. |
| ITEM 6. | SCHEDULE OF INVESTMENTS. |
Included herein under Item 1.
| ITEM 7. | DISCLOSURE OF PROXY VOTING POLICIES AND PROCEDURES FOR CLOSED-END MANAGEMENT INVESTMENT COMPANIES. |
Not applicable.
| ITEM 8. | PORTFOLIO MANAGERS OF CLOSED-END MANAGEMENT INVESTMENT COMPANIES. |
Not applicable.
| ITEM 9. | PURCHASES OF EQUITY SECURITIES BY CLOSED-END MANAGEMENT INVESTMENT COMPANY AND AFFILIATED PURCHASERS. |
Not applicable.
| ITEM 10. | SUBMISSION OF MATTERS TO A VOTE OF SECURITY HOLDERS. |
Not applicable.
| ITEM 11. | CONTROLS AND PROCEDURES. |
| (a) | The registrant’s principal executive officer and principal financial officer have concluded that the registrant’s disclosure controls and procedures (as defined in Rule 30a- 3(c) under the Investment Company Act of 1940, as amended (the “1940 Act”)) are effective as of a date within 90 days of the filing date of this report that includes the disclosure required by this paragraph, based on their evaluation of the disclosure controls and procedures required by Rule 30a-3(b) under the 1940 Act and 15d-15(b) under the Securities Exchange Act of 1934. |
| (b) | There were no changes in the registrant’s internal control over financial reporting (as defined in Rule 30a-3(d) under the 1940 Act) that occurred during the second fiscal quarter of the period covered by this report that have materially affected, or are likely to materially affect the registrant’s internal control over financial reporting. |
| ITEM 12. | DISCLOSURE OF SECURITIES LENDING ACTIVITIES FOR CLOSED-END MANAGEMENT INVESTMENT COMPANIES. |
Not applicable.
| ITEM 13. | EXHIBITS. |
(a) (2) Certifications pursuant to section 302 of the Sarbanes-Oxley Act of 2002 attached hereto. | ||
(b) Certifications pursuant to Section 906 of the Sarbanes-Oxley Act of 2002 attached hereto. | ||
SIGNATURES
Pursuant to the requirements of the Securities Exchange Act of 1934 and the Investment Company Act of 1940, the registrant has duly caused this Report to be signed on its behalf by the undersigned, there unto duly authorized.
| Legg Mason Partners Equity Trust | ||
| By: | /s/ Jane Trust | |
| Jane Trust | ||
| Chief Executive Officer | ||
| Date: | November 24, 2020 | |
Pursuant to the requirements of the Securities Exchange Act of 1934 and the Investment Company Act of 1940, this report has been signed below by the following persons on behalf of the registrant and in the capacities and on the dates indicated.
| By: | /s/ Jane Trust | |
| Jane Trust | ||
| Chief Executive Officer | ||
| Date: | November 24, 2020 | |
| By: | /s/ Christopher Berarducci | |
| Christopher Berarducci | ||
| Principal Financial Officer | ||
| Date: | November 24, 2020 | |