Table of Contents
UNITED STATES
SECURITIES AND EXCHANGE COMMISSION
Washington, D.C. 20549
FORM N-CSR
CERTIFIED SHAREHOLDER REPORT OF REGISTERED
MANAGEMENT INVESTMENT COMPANIES
Investment Company Act file number 811-06444
Legg Mason Partners Equity Trust
(Exact name of registrant as specified in charter)
620 Eighth Avenue, 47th Floor, New York, NY 10018
(Address of principal executive offices) (Zip code)
Marc A. De Oliveira
Legg Mason & Co., LLC
100 First Stamford Place
Stamford, CT 06902
(Name and address of agent for service)
Registrant’s telephone number, including area code: 1-877-721-1926
Date of fiscal year end: October 31
Date of reporting period: October 31, 2020
Table of Contents
| ITEM 1. | REPORT TO STOCKHOLDERS. |
The Annual Report to Stockholders is filed herewith.
Table of Contents
![]()
| Annual Report | October 31, 2020 |
CLEARBRIDGE
SELECT FUND
Beginning in or after April 2021, as permitted by regulations adopted by the Securities and Exchange Commission, the Fund intends to no longer mail paper copies of the Fund’s shareholder reports like this one, unless you specifically request paper copies of the reports from the Fund or from your Service Agent or financial intermediary (such as a broker-dealer or bank). Instead, the reports will be made available on a website, and you will be notified by mail each time a report is posted and provided with a website link to access the report.
If you already elected to receive shareholder reports electronically (“e-delivery”), you will not be affected by this change and you need not take any action. If you have not already elected e-delivery, you may elect to receive shareholder reports and other communications from the Fund electronically by contacting your Service Agent or, if you are a direct shareholder with the Fund, by calling 1-877-721-1926.
You may elect to receive all future reports in paper free of charge. If you invest through a Service Agent, you can contact your Service Agent to request that you continue to receive paper copies of your shareholder reports. That election will apply to all Legg Mason Funds held in your account at that Service Agent. If you are a direct shareholder with the Fund, you can call the Fund at 1-877-721-1926, or write to the Fund by regular mail at Legg Mason Funds, P.O. Box 9699, Providence, RI 02940-9699 or by express, certified or registered mail to Legg Mason Funds, 4400 Computer Drive, Westborough, MA 01581 to let the Fund know you wish to continue receiving paper copies of your shareholder reports. That election will apply to all Legg Mason Funds held in your account held directly with the fund complex.

| INVESTMENT PRODUCTS: NOT FDIC INSURED • NO BANK GUARANTEE • MAY LOSE VALUE |
Table of Contents
Fund objective
The Fund seeks to provide long-term growth of capital

Dear Shareholder,
We are pleased to provide the annual report of ClearBridge Select Fund for the twelve-month reporting period ended October 31, 2020. Please read on for a detailed look at prevailing economic and market conditions during the Fund’s reporting period and to learn how those conditions have affected Fund performance.
Special shareholder notice
On July 31, 2020, Franklin Resources, Inc. (“Franklin Resources”) acquired Legg Mason, Inc. (“Legg Mason”) in an all-cash transaction. As a result of the transaction, Legg Mason Partners Fund Advisor, LLC (“LMPFA”) and the subadviser(s) became indirect, wholly-owned subsidiaries of Franklin Resources. Under the Investment Company Act of 1940, as amended, consummation of the transaction automatically terminated the management and subadvisory agreements that were in place for the Fund prior to the transaction. The Fund’s manager and subadviser(s) continue to provide uninterrupted services with respect to the Fund pursuant to new management and subadvisory agreements that were approved by Fund shareholders.
Franklin Resources, whose principal executive offices are at One Franklin Parkway, San Mateo, California 94403, is a global investment management organization operating, together with its subsidiaries, as Franklin Templeton. As of October 31, 2020, after giving effect to the transaction described above, Franklin Templeton’s asset management operations had aggregate assets under management of approximately $1.4 trillion.
| II | ClearBridge Select Fund |
Table of Contents
As always, we remain committed to providing you with excellent service and a full spectrum of investment choices. We also remain committed to supplementing the support you receive from your financial advisor. One way we accomplish this is through our website, www.leggmason.com. Here you can gain immediate access to market and investment information, including:
| • | Fund prices and performance, |
| • | Market insights and commentaries from our portfolio managers, and |
| • | A host of educational resources. |
We look forward to helping you meet your financial goals.
Sincerely,

Jane Trust, CFA
President and Chief Executive Officer
November 30, 2020
| ClearBridge Select Fund | III |
Table of Contents
Q. What is the Fund’s investment strategy?
A. The Fund seeks to provide long-term growth of capital. The Fund seeks to achieve its investment objective by taking an unconstrained approach to investing with an emphasis on equity securities. Under normal circumstances, the Fund invests primarily in publicly traded equity and equity-related securities of U.S. and non-U.S. companies or other instruments with similar economic characteristics. The Fund may invest in securities of issuers of any market capitalization. The Fund has no geographical limits on where it may invest — it may invest in both developed and emerging markets. The Fund may invest in securities issued through private placements.
While the Fund expects to invest primarily in equity and equity-related securities, the Fund may, at times, also invest to a significant extent in fixed income securities, including lower-rated, high yielding debt securities (commonly known as “junk bonds”), when we believe that such securities will provide more attractive total return opportunities compared to equity securities.
The Fund uses a bottom-up investment methodology for equity securities selection that relies extensively on fundamental research to identify companies with strong growth prospects and/or attractive valuations, without regard to a benchmark. As a result, the Fund’s holdings may deviate significantly from its performance benchmark.
The Fund uses a focused approach of investing in a smaller number of issuers, which may result in significant exposure to certain industries or sectors, such as information technology and internet technology services. If market conditions warrant, the Fund may enter into short positions on securities, indexes or other instruments.
The Fund uses a bottom-up investment methodology for fixed income securities selection that relies extensively on fundamental research to identify companies with strong growth prospects and/or attractive valuations. The Fund may invest in futures, options, forward contracts, and swaps, among other derivative instruments. Derivatives and short positions may be used as a hedging technique in an attempt to manage risk in the Fund’s portfolio, as a substitute for buying or selling securities, as a cash flow management technique, or as a means of enhancing returns.
Q. What were the overall market conditions during the Fund’s reporting period?
A. U.S. stocks endured a brief but sharp selloff due to a global coronavirus pandemic (COVID-19) in early 2020 and a milder correction in the last two months of the reporting period yet still managed gains for the fiscal year. The benchmark, Russell 3000 Indexi, advanced 10.15%, the S&P 500 Indexii added 9.71%, while the small cap Russell 2000 Indexiii declined 0.14%. Growth stocks handily outperformed value stocks with the Russell 3000 Growth Indexiv finishing up 28.20% compared to a loss of 8.00% for the Russell 3000 Value Indexv.
Information Technology (“IT”) (+34.32%) and Consumer Discretionary (+30.75%) were the best performing sectors as work from home (“WFH”) and e-commerce became the norm in a period of physical business shutdowns, while Health Care (+14.95%) and Communication Services (+14.92%) also outperformed.
| ClearBridge Select Fund 2020 Annual Report | 1 |
Table of Contents
Fund overview (cont’d)
Energy (-46.15%), Real Estate (-15.82%) and Financials (-15.25%) were the worst performers, with all three being directly impacted by the economic restrictions meant to curb the spread of the pandemic.
COVID-19 shocked world markets in the second half of the first quarter of 2020. The S&P 500 Index’s 30% decline in twenty-two trading days was the fastest drop of that magnitude in history. Cyclical stocks and companies with weak balance sheets led the decline. Oil prices collapsed from $61 dollars to below $0 in early April 2020.
Equities staged a historic rally in the second quarter of 2020, boosted by tremendous stimulus from the Federal Reserve Board (the “Fed”)vi that provided abundant liquidity to financial markets and a flattening of COVID-19 cases. Growth stocks dominated performance, while better results from smaller stocks reflected a greater confidence among investors that the worst was over in terms of business impacts from COVID-19. Consecutive months of record employment gains following an April 2020 crash in the job market and a robust rebound in retail sales were encouraging signs, but a spike in virus cases in areas of the U.S. that escaped the first wave of infections were a reminder of the economy’s expected uneven recovery.
A September 2020 correction for widely held momentum stocks did little to slow down the post-pandemic surge for equities. The S&P 500 Index advanced 8.9% in the third quarter, capping its best six-month run since 2009, while the tech-heavy NASDAQ Composite rose 11.0% to complete its best two-quarter performance since 2000. The benchmark, Russell 3000 Index, gained 9.2% for the quarter, with growth stocks again outperforming value stocks by a wide margin, continuing the leadership of companies aligned with business trends accelerated by the COVID-19 pandemic.
Q. How did we respond to these changing market conditions?
A. In a narrow market that remains concentrated in mega-cap stocks, the Fund managed to outperform through contributions from a diversified portfolio of small-, mid- and large-cap companies across ten sectors. Our fundamental research approach, which encompasses analysis of both public and private companies, often leads us to opportunities not recognized by investors more broadly while steering us away from those with deteriorating outlooks.
We were active both during the market selloff and the subsequent rally, taking advantage of higher volatility and dispersion, as not all stocks rebounded in line with the broad market. Portfolio performance and positioning changes covered several areas.
Stocks that are direct beneficiaries of changes necessitated by measures to combat COVID-19, such as those enabling e-commerce (Shopify Inc., Wix.com Ltd., Carvana Co. and MercadoLibre Inc.) and WFH capabilities (DocuSign Inc., ServiceNow Inc. and Datadog Inc.)
| 2 | ClearBridge Select Fund 2020 Annual Report |
Table of Contents
were among the Fund’s leading contributors. Many of these companies operate recurring revenue businesses with high returns on invested capital and are realizing revenues faster from onboarding customers more quickly. Livongo Health Inc. shares these qualities with exposure to the rising uptake for telemedicine. Trex Co. Inc. is a less obvious beneficiary of the pandemic lockdowns, but the manufacturer of decking made from recycled materials continues to take market share as stay-at-home consumers are putting more money into home renovation.
The Fund also saw solid results from overlooked recipients of the changing environment where there were concerns of slowing growth due to COVID-19. This has not been the case for such companies as casual footwear maker Crocs Inc., a new buy which has pivoted to e-commerce channels over the last several years; warehouse retailer BJ’s Wholesale Club Holdings Inc., which benefited from consumers stocking up on essential supplies during the lockdowns, and home improvement chain Lowe’s Cos. Inc., which saw the investment in online infrastructure pay off in its curbside pickup sales. These companies are what we consider evolving opportunities due to positive fundamental and operational developments in each company’s business.
The third area of focus was among companies suffering the worst hits from COVID-19, resulting in substantial declines in volume or revenue. We have targeted stocks dealing with what we view as temporary issues whereas their share prices were discounting a much longer recovery. New buy Performance Food Group Co. has a national presence in food distribution to restaurants and is positioned to take share from weaker local competitors by leveraging its technology advantages and strong balance sheet.
The success of growth stocks has given rise to record IPO issuance in 2020. The Fund participated in a number of IPOs during the reporting period, including several in special purpose acquisition companies or SPACs. Vertiv Holdings Co., a stock we acquired through an investment in a SPAC run by the former CEO of Honeywell, is the former HVAC business of Emerson Electric that provides cooling systems for servers, surge protectors and similar support functions to data centers. The business had been mismanaged and starved of research and development before being sold to the SPAC and taken public in February 2020.
The Fund can also invest in non-equity alternatives such as private placements, convertible securities, and options. We made a private placement investment in Brain Corp., which has developed deep expertise in advanced machine learning and computer vision systems for autonomous mobile robots. Brain’s first commercial applications are in the floor care/ cleaning market that includes hospitals, airports and malls and the company’s solutions are already being trialed for other autonomous use cases.
De-risking is a crucial part of our process, steering us away from companies running into operational or financial issues, overpromising or underdelivering on their growth forecasts or losing share due to product or service obsolescence. This step is just as important in ramping markets like the current one as in declining markets. We continuously de-risk
| ClearBridge Select Fund 2020 Annual Report | 3 |
Table of Contents
Fund overview (cont’d)
existing portfolio holdings as well, checking that the thesis for owning each company remains intact. When the thesis for improvement among these companies is not playing out at the pace and or magnitude we had anticipated, we are disciplined in selling and moving on to better ideas. This was the case with FireEye in cybersecurity, where poor sales execution led us to exit the stock, while at Advance Auto Parts, the margin turnaround story was taking too long, and at Outfront Media, the severe drop in commuting hurt the company’s advertising in metro markets and on mass transit.
Performance review
For the twelve months ended October 31, 2020, Class I shares of ClearBridge Select Fund returned 45.39%. The Fund’s unmanaged benchmark, the Russell 3000 Index, returned 10.15% for the same period. The Lipper Mid-Cap Core Funds Category Averagevii returned 25.14% over the same time frame.
| Performance Snapshot as of October 31, 2020 (unaudited) | ||||||||
| (excluding sales charges) | 6 months | 12 months | ||||||
| ClearBridge Select Fund: | ||||||||
Class A | 39.96 | % | 44.95 | % | ||||
Class A2 | 39.94 | % | 44.87 | % | ||||
Class C | 39.45 | % | 43.92 | % | ||||
Class FI | 40.01 | % | 45.00 | % | ||||
Class I | 40.17 | % | 45.39 | % | ||||
Class IS | 40.24 | % | 45.51 | % | ||||
| Russell 3000 Index | 15.14 | % | 10.15 | % | ||||
| Lipper Mid-Cap Core Funds Category Average | 25.70 | % | 25.14 | % | ||||
The performance shown represents past performance. Past performance is no guarantee of future results and current performance may be higher or lower than the performance shown above. Principal value and investment returns will fluctuate and investors’ shares, when redeemed, may be worth more or less than their original cost. To obtain performance data current to the most recent month end, please visit our website at www.leggmason.com/mutualfunds.
All share class returns assume the reinvestment of all distributions at net asset value and the deduction of all Fund expenses. Returns have not been adjusted to include sales charges that may apply or the deduction of taxes that a shareholder would pay on Fund distributions. If sales charges were reflected, the performance quoted would be lower. Performance figures for periods shorter than one year represent cumulative figures and are not annualized.
Fund performance figures reflect fee waivers and/or expense reimbursements, without which the performance would have been lower.
| Total Annual Operating Expenses (unaudited) |
As of the Fund’s current prospectus dated March 1, 2020, the gross total annual fund operating expense ratios for Class A, Class A2, Class C, Class FI, Class I and Class IS shares were 1.49%, 1.58%, 2.21%, 1.44%, 1.20% and 1.09%, respectively.
| 4 | ClearBridge Select Fund 2020 Annual Report |
Table of Contents
Actual expenses may be higher. For example, expenses may be higher than those shown if average net assets decrease. Net assets are more likely to decrease and Fund expense ratios are more likely to increase when markets are volatile.
As a result of expense limitation arrangements, the ratio of total annual fund operating expenses, other than interest, brokerage, taxes, extraordinary expenses, expenses related to short sales and acquired fund fees and expenses, to average net assets will not exceed 1.50% for Class A shares, 1.70% for Class A2 shares, 2.25% for Class C shares, 1.50% for Class FI shares, 1.15% for Class I shares and 1.05% for Class IS shares. In addition, the ratio of total annual fund operating expenses for Class IS shares will not exceed the ratio of total annual fund operating expenses for Class I shares. Total annual fund operating expenses after waving fees and/or reimbursing expenses exceed the expense cap for Class I and Class IS shares, as a result of acquired fund fees and expenses and dividend expenses on securities sold short. These expense limitation arrangements cannot be terminated prior to December 31, 2022 without the Board of Trustees’ consent. In addition, the manager has agreed to waive the Fund’s management fee to an extent sufficient to offset the net management fee payable in connection with any investment in an affiliated money market fund. This management fee waiver is not subject to the recapture provision discussed below.
The manager is permitted to recapture amounts waived and/or reimbursed to a class during the same fiscal year if the class’ total annual operating expenses have fallen to a level below the expense limitation (“expense cap”) in effect at the time the fees were earned or the expenses incurred. In no case will the manager recapture any amount that would result, on any particular business day of the Fund, in the class’ total annual operating expenses exceeding the expense cap or any other lower limit then in effect.
Q. What were the leading contributors to performance?
A. On an absolute basis, the Fund produced positive returns in eight of the ten sectors in which it was invested over the period, with the greatest contributions to returns coming from the IT sector.
Relative to the benchmark, overall stock selection and sector allocation contributed to performance for the period. In particular, stock selection in the IT and Health Care sectors was the primary driver of results. An overweight to IT, underweights to the Financials and Energy sectors as well as stock selection in the Industrials, Consumer Discretionary, Real Estate and Consumer Staples were also beneficial.
Leading stock contributors included positions in Shopify Inc. and DocuSign Inc. in the IT sector, Carvana Co. and MercadoLibre, Inc. in the Consumer Discretionary sector as well as Livongo Health Inc. in the Health Care sector.
Q. What were the leading detractors from performance?
A. Relative to the benchmark, stock selection in the Materials sector and an underweight to the Communication Services sector detracted from performance for the reporting period.
On an individual stock basis, the leading detractors from performance for the period included the Fund’s holdings in Advance Auto Parts Inc. and Expedia Group Inc. in the Consumer Discretionary sector, Outfront Media Inc. in the Real Estate sector as well as Cardtronics PLC and Cornerstone OnDemand, Inc. in the IT sector.
| ClearBridge Select Fund 2020 Annual Report | 5 |
Table of Contents
Fund overview (cont’d)
Q. Were there any significant changes to the Fund during the reporting period?
A. The Fund executed a number of buy and sell transactions over the reporting period. The largest additions to the Fund’s portfolio were XPO Logistics Inc. in the Industrials sector, Crocs Inc. in the Consumer Discretionary sector, Performance Food Group Co. and Monster Beverage Corp. in the Consumer Staples sector and Sprout Social Inc. in the IT sector. The largest positions closed during the period were Advance Auto Parts Inc. in the Consumer Discretionary sector, Interxion Holding NV and ForeScout Technologies Inc. in the IT sector, Spotify Technology SA in the Communication Services sector and Lyft Inc. in the Industrials sector.
Thank you for your investment in ClearBridge Select Fund. As always, we appreciate that you have chosen us to manage your assets and we remain focused on achieving the Fund’s investment goals.
Sincerely,

Aram Green
Portfolio Manager
ClearBridge Investments, LLC
November 18, 2020
RISKS: Equity securities are subject to market and price fluctuations. Small- and mid-cap stocks involve greater risks and volatility than large-cap stocks. International investments are subject to special risks including currency fluctuations and social, economic, and political uncertainties, which could increase volatility. These risks are magnified in emerging markets. Emerging market countries tend to have economic, political, and legal systems that are less developed and are less stable than those of more developed countries. Fixed income securities involve interest rate, credit, inflation, and reinvestment risks. As interest rate rise, the value of fixed income securities falls. High yield bonds, commonly known as “junk bonds,” are subject to a greater price volatility, illiquidity, and possibility of default. As a non-diversified fund, it is permitted to invest a larger percentage of its assets in a smaller number of issuers than a diversified fund, which may magnify the Fund’s losses from events affecting a particular issuer. Investments in privately placed securities involve additional risks, including that the issuers of such securities are not typically subject to the same disclosure and other regulatory requirements and oversight to which public issuers are subject. There may be very little public information available about the issuers and they may have limited liquidity. Derivatives, such as options and futures, can be illiquid, may disproportionately increase losses, and have a potentially large impact on Fund performance. Short positions involve leverage and there is no limit on the amount of loss on a
| 6 | ClearBridge Select Fund 2020 Annual Report |
Table of Contents
security that is sold short. The Fund may suffer significant losses if assets that the Fund sells short appreciate rather than depreciate in value. Please see the Fund’s prospectus for a more complete discussion of these and other risks and the Fund’s investment strategies.
Portfolio holdings and breakdowns are as of October 31, 2020 and are subject to change and may not be representative of the portfolio manager’s current or future investments. The Fund’s top ten holdings (as a percentage of net assets) as of October 31, 2020 were: DocuSign Inc. (3.6%), ServiceNow Inc. (3.4%), Shopify Inc. (3.0%), SBA Communications Corp. (2.7%), MercadoLibre Inc. (2.7%), Apple Inc. (2.5%), Wix.com Ltd. (2.4%), Carvana Co. (2.3%), Adobe Inc. (1.9%) and Syneos Health Inc. (1.8%). Please refer to pages 15 through 20 for a list and percentage breakdown of the Fund’s holdings.
The mention of sector breakdowns is for informational purposes only and should not be construed as a recommendation to purchase or sell any securities. The information provided regarding such sectors is not a sufficient basis upon which to make an investment decision. Investors seeking financial advice regarding the appropriateness of investing in any securities or investment strategies discussed should consult their financial professional. The Fund’s top five sector holdings (as a percentage of net assets) as of October 31, 2020 were: Information Technology (32.3%), Consumer Discretionary (16.4%), Health Care (11.9%), Industrials (11.4%) and Consumer Staples (7.2%). The Fund’s portfolio composition is subject to change at any time.
All investments are subject to risk including the possible loss of principal. Past performance is no guarantee of future results. All index performance reflects no deduction for fees, expenses, or taxes. Please note that an investor cannot invest directly in an index.
The information provided is not intended to be a forecast of future events, a guarantee of future results or investment advice. Views expressed may differ from those of the firm as a whole.
| ClearBridge Select Fund 2020 Annual Report | 7 |
Table of Contents
Fund overview (cont’d)
| i | The Russell 3000 Index measures the performance of the 3,000 largest U.S. companies based on total market capitalization, which represents approximately 98% of the U.S. equity market. |
| ii | The S&P 500 Index is an unmanaged index of the stocks of 500 leading companies, and is generally representative of the performance of larger companies in the U.S. |
| iii | The Russell 2000 Index measures the performance of the small-cap segment of the U.S. equity universe. The Russell 2000 is a subset of the Russell 3000 Index representing approximately 10% of the total market capitalization of that index. It includes approximately 2,000 of the smallest securities based on a combination of their market cap and current index membership. |
| iv | The Russell 3000 Growth Index measures the performance of the broad growth segment of the U.S. equity universe. It includes those Russell 3000 Index companies with higher price-to-book ratios and higher forecasted growth values. (A price-to-book ratio is the price of a stock compared to the difference between a company’s assets and liabilities.) |
| v | The Russell 3000 Value Index measures the performance of the broad value segment of the U.S. equity value universe. It includes those Russell 3000 Index companies with lower price-to-book ratios and lower forecasted growth values. |
| vi | The Federal Reserve Board (the “Fed”) is responsible for the formulation of U.S. policies designed to promote economic growth, full employment, stable prices and a sustainable pattern of international trade and payments. |
| vii | Lipper, Inc., a wholly-owned subsidiary of Reuters, provides independent insight on global collective investments. Returns are based on the period ended October 31, 2020, including the reinvestment of all distributions, including returns of capital, if any, calculated among the 415 funds for the six-month period and among the 409 funds for the twelve-month period in the Fund’s Lipper category, and excluding sales charges, if any. |
| 8 | ClearBridge Select Fund 2020 Annual Report |
Table of Contents
| Investment breakdown (%) as a percent of total investments |
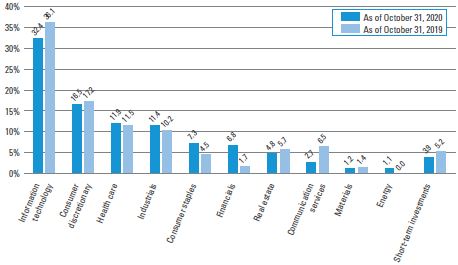
| † | The bar graph above represents the composition of the Fund’s investments as of October 31, 2020 and October 31, 2019 and does not include derivatives, such as written options and securities sold short. The Fund is actively managed. As a result, the composition of the Fund’s investments is subject to change at any time. |
| ClearBridge Select Fund 2020 Annual Report | 9 |
Table of Contents
Example
As a shareholder of the Fund, you may incur two types of costs: (1) transaction costs, including front-end and back-end sales charges (loads) on purchase payments; and (2) ongoing costs, including management fees; service and/or distribution (12b-1) fees; and other Fund expenses. This example is intended to help you understand your ongoing costs (in dollars) of investing in the Fund and to compare these costs with the ongoing costs of investing in other mutual funds.
This example is based on an investment of $1,000 invested on May 1, 2020 and held for the six months ended October 31, 2020.
Actual expenses
The table below titled “Based on Actual Total Return” provides information about actual account values and actual expenses. You may use the information provided in this table, together with the amount you invested, to estimate the expenses that you paid over the period. To estimate the expenses you paid on your account, divide your ending account value by $1,000 (for example, an $8,600 ending account value divided by $1,000 = 8.6), then multiply the result by the number under the heading entitled “Expenses Paid During the Period”.
Hypothetical example for comparison purposes
The table below titled “Based on Hypothetical Total Return” provides information about hypothetical account values and hypothetical expenses based on the actual expense ratio and an assumed rate of return of 5.00% per year before expenses, which is not the Fund’s actual return. The hypothetical account values and expenses may not be used to estimate the actual ending account balance or expenses you paid for the period. You may use the information provided in this table to compare the ongoing costs of investing in the Fund and other funds. To do so, compare the 5.00% hypothetical example relating to the Fund with the 5.00% hypothetical examples that appear in the shareholder reports of the other funds.
Please note that the expenses shown in the table below are meant to highlight your ongoing costs only and do not reflect any transactional costs, such as front-end or back-end sales charges (loads). Therefore, the table is useful in comparing ongoing costs only, and will not help you determine the relative total costs of owning different funds. In addition, if these transaction costs were included, your costs would have been higher.
| Based on actual total return1 | Based on hypothetical total return1 | |||||||||||||||||||||||||||||||||||||||||||||
| Actual Total Return Without Sales Charge2 | Beginning Account Value | Ending Account Value | Annualized Expense Ratio | Expenses Paid During the Period3 | Hypothetical Annualized Total Return | Beginning Account Value | Ending Account Value | Annualized Expense Ratio | Expenses Paid During the Period3 | |||||||||||||||||||||||||||||||||||||
| Class A | 39.96 | % | $ | 1,000.00 | $ | 1,399.60 | 1.37 | % | $ | 8.26 | Class A | 5.00 | % | $ | 1,000.00 | $ | 1,018.25 | 1.37 | % | $ | 6.95 | |||||||||||||||||||||||||
| Class A2 | 39.94 | 1,000.00 | 1,399.40 | 1.48 | 8.93 | Class A2 | 5.00 | 1,000.00 | 1,017.70 | 1.48 | 7.51 | |||||||||||||||||||||||||||||||||||
| Class C | 39.45 | 1,000.00 | 1,394.50 | 2.11 | 12.70 | Class C | 5.00 | 1,000.00 | 1,014.53 | 2.11 | 10.68 | |||||||||||||||||||||||||||||||||||
| Class FI | 40.01 | 1,000.00 | 1,400.10 | 1.33 | 8.02 | Class FI | 5.00 | 1,000.00 | 1,018.45 | 1.33 | 6.75 | |||||||||||||||||||||||||||||||||||
| Class I | 40.17 | 1,000.00 | 1,401.70 | 1.10 | 6.64 | Class I | 5.00 | 1,000.00 | 1,019.61 | 1.10 | 5.58 | |||||||||||||||||||||||||||||||||||
| Class IS | 40.24 | 1,000.00 | 1,402.40 | 1.01 | 6.10 | Class IS | 5.00 | 1,000.00 | 1,020.06 | 1.01 | 5.13 | |||||||||||||||||||||||||||||||||||
| 10 | ClearBridge Select Fund 2020 Annual Report |
Table of Contents
| 1 | For the six months ended October 31, 2020. |
| 2 | Assumes the reinvestment of all distributions, including returns of capital, if any, at net asset value and does not reflect the deduction of the applicable sales charge with respect to Class A and Class A2 shares or the applicable contingent deferred sales charge (“CDSC”) with respect to Class C shares. Total return is not annualized, as it may not be representative of the total return for the year. Performance figures may reflect compensating balance arrangements, fee waivers and/or expense reimbursements. In the absence of compensating balance arrangements, fee waivers and/or expense reimbursements, the total return would have been lower. Past performance is no guarantee of future results. |
| 3 | Expenses (net of compensating balance arrangements, fee waivers and/or expense reimbursements) are equal to each class’ respective annualized expense ratio multiplied by the average account value over the period, multiplied by the number of days in the most recent fiscal half-year (184), then divided by 366. |
| ClearBridge Select Fund 2020 Annual Report | 11 |
Table of Contents
| Average annual total returns | ||||||||||||||||||||||||
| Without sales charges1 | Class A | Class A2 | Class C | Class FI | Class I | Class IS | ||||||||||||||||||
| Twelve Months Ended 10/31/20 | 44.95 | % | 44.87 | % | 43.92 | % | 45.00 | % | 45.39 | % | 45.51 | % | ||||||||||||
| Five Years Ended 10/31/20 | 23.23 | N/A | 22.32 | 23.23 | 23.58 | 23.68 | ||||||||||||||||||
| Inception* through 10/31/20 | 18.42 | 20.30 | 17.52 | 21.47 | 21.90 | 21.93 | ||||||||||||||||||
| With sales charges2 | Class A | Class A2 | Class C | Class FI | Class I | Class IS | ||||||||||||||||||
| Twelve Months Ended 10/31/20 | 36.61 | % | 36.54 | % | 42.92 | % | 45.00 | % | 45.39 | % | 45.51 | % | ||||||||||||
| Five Years Ended 10/31/20 | 21.79 | N/A | 22.32 | 23.23 | 23.58 | 23.68 | ||||||||||||||||||
| Inception* through 10/31/20 | 17.44 | 17.01 | 17.52 | 21.47 | 21.90 | 21.93 | ||||||||||||||||||
| Cumulative total returns | ||||
| Without sales charges1 | ||||
| Class A (Inception date of 9/23/13 through 10/31/20) | 232.42 | % | ||
| Class A2 (Inception date of 9/14/18 through 10/31/20) | 48.22 | |||
| Class C (Inception date of 9/23/13 through 10/31/20) | 214.76 | |||
| Class FI (Inception date of 11/30/12 through 10/31/20) | 366.30 | |||
| Class I (Inception date of 11/30/12 through 10/31/20) | 379.69 | |||
| Class IS (Inception date of 11/30/12 through 10/31/20) | 380.48 | |||
All figures represent past performance and are not a guarantee of future results. Investment return and principal value of an investment will fluctuate so that an investor’s shares, when redeemed, may be worth more or less than their original cost. The returns shown do not reflect the deduction of taxes that a shareholder would pay on Fund distributions or the redemption of Fund shares. Performance figures may reflect compensating balance arrangements, fee waivers and/or expense reimbursements. In the absence of compensating balance arrangements, fee waivers and/or expense reimbursements, the total return would have been lower.
| 1 | Assumes the reinvestment of all distributions, including returns of capital, if any, at net asset value and does not reflect the deduction of the applicable sales charge with respect to Class A and Class A2 shares or the applicable contingent deferred sales charge (“CDSC”) with respect to Class C shares. |
| 2 | Assumes the reinvestment of all distributions, including returns of capital, if any, at net asset value. In addition, Class A and Class A2 shares reflect the deduction of the maximum initial sales charge of 5.75%. Class C shares reflect the deduction of a 1.00% CDSC, which applies if shares are redeemed within one year from purchase payment. |
| * | Inception dates for Class A, A2, C, FI, I and IS shares are September 23, 2013, September 14, 2018, September 23, 2013, November 30, 2012, November 30, 2012 and November 30, 2012, respectively. |
| 12 | ClearBridge Select Fund 2020 Annual Report |
Table of Contents
| Historical performance |
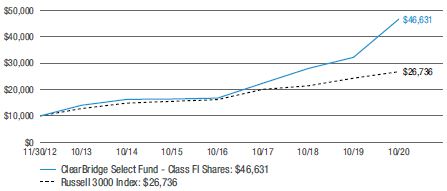
Value of $10,000 invested in
Class FI Shares of ClearBridge Select Fund vs. Russell 3000 Index† — November 30, 2012 - October 31, 2020
Value of $1,000,000 invested in
Class I and IS Shares of ClearBridge Select Fund vs. Russell 3000 Index† — November 30, 2012 - October 31, 2020
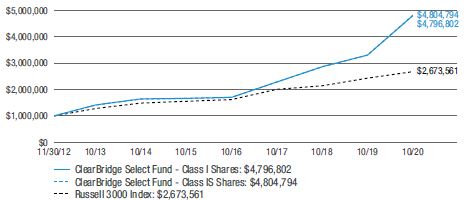
All figures represent past performance and are not a guarantee of future results. Investment return and principal value of an investment will fluctuate so that an investor’s shares, when redeemed, may be worth more or less than their original cost. The returns shown do not reflect the deduction of taxes that a shareholder would pay on Fund distributions or the redemption of Fund shares. Performance figures may reflect compensating balance arrangements, fee waivers and/or expense reimbursements. In the absence of compensating balance arrangements, fee waivers and/or expense reimbursements, the total return would have been lower.
| ClearBridge Select Fund 2020 Annual Report | 13 |
Table of Contents
Fund performance (unaudited) (cont’d)
| † | Hypothetical illustration of $10,000 invested in Class FI shares and $1,000,000 invested in Class I and Class IS shares of ClearBridge Select Fund on November 30, 2012 (inception date), assuming the reinvestment of all distributions, including returns of capital, if any, at net asset value through October 31, 2020. The hypothetical illustration also assumes a $10,000 or $1,000,000 investment, as applicable, in the Russell 3000 Index. The Russell 3000 Index (the “Index”) measures the performance of the 3,000 largest U.S. companies based on total market capitalization, which represents approximately 98% of the U.S. equity market. The Index is unmanaged and is not subject to the same management and trading expenses as a mutual fund. Please note that an investor cannot invest directly in an index. The performance of the Fund’s other classes may be greater or less than the Class FI, I and IS shares’ performance indicated on these charts, depending on whether greater or lesser sales charges and fees were incurred by shareholders investing in the other classes. |
| 14 | ClearBridge Select Fund 2020 Annual Report |
Table of Contents
October 31, 2020
ClearBridge Select Fund
| Security | Shares | Value | ||||||
| Common Stocks — 94.7% | ||||||||
| Communication Services — 2.7% | ||||||||
Entertainment — 1.4% | ||||||||
Zynga Inc., Class A Shares | 2,432,850 | $ | 21,871,321 | * | ||||
Interactive Media & Services — 1.2% | ||||||||
Pinterest Inc., Class A Shares | 314,570 | 18,543,902 | * | |||||
Media — 0.1% | ||||||||
comScore Inc. | 375,601 | 749,324 | * | |||||
Total Communication Services | 41,164,547 | |||||||
| Consumer Discretionary — 16.4% | ||||||||
Auto Components — 0.9% | ||||||||
Fox Factory Holding Corp. | 169,968 | 14,290,910 | * | |||||
Household Durables — 0.6% | ||||||||
Purple Innovation Inc. | 325,760 | 9,241,811 | * | |||||
Internet & Direct Marketing Retail — 6.5% | ||||||||
Alibaba Group Holding Ltd., ADR | 84,200 | 25,654,898 | * | |||||
Chewy Inc., Class A Shares | 227,530 | 14,015,848 | * | |||||
Expedia Group Inc. | 208,032 | 19,586,213 | ||||||
MercadoLibre Inc. | 33,941 | 41,206,071 | * | |||||
Total Internet & Direct Marketing Retail | 100,463,030 | |||||||
Specialty Retail — 6.8% | ||||||||
American Eagle Outfitters Inc. | 1,253,060 | 17,179,452 | ||||||
Carvana Co. | 191,554 | 35,504,534 | * | |||||
Lowe’s Cos. Inc. | 169,580 | 26,810,598 | ||||||
Ross Stores Inc. | 286,211 | 24,376,591 | ||||||
Total Specialty Retail | 103,871,175 | |||||||
Textiles, Apparel & Luxury Goods — 1.6% | ||||||||
Crocs Inc. | 468,860 | 24,535,444 | * | |||||
Total Consumer Discretionary | 252,402,370 | |||||||
| Consumer Staples — 7.2% | ||||||||
Beverages — 2.4% | ||||||||
Constellation Brands Inc., Class A Shares | 113,501 | 18,753,770 | ||||||
Monster Beverage Corp. | 246,540 | 18,877,568 | * | |||||
Total Beverages | 37,631,338 | |||||||
Food & Staples Retailing — 4.1% | ||||||||
BJ’s Wholesale Club Holdings Inc. | 641,870 | 24,577,202 | * | |||||
Casey’s General Stores Inc. | 80,535 | 13,575,785 | ||||||
Performance Food Group Co. | 731,270 | 24,577,985 | * | |||||
Total Food & Staples Retailing | 62,730,972 | |||||||
See Notes to Financial Statements.
| ClearBridge Select Fund 2020 Annual Report | 15 |
Table of Contents
Schedule of investments (cont’d)
October 31, 2020
ClearBridge Select Fund
| Security | Shares | Value | ||||||
Food Products — 0.7% | ||||||||
Vital Farms Inc. | 310,030 | $ | 10,714,637 | * | ||||
Total Consumer Staples | 111,076,947 | |||||||
| Energy — 0.8% | ||||||||
Oil, Gas & Consumable Fuels — 0.8% | ||||||||
Pioneer Natural Resources Co. | 154,610 | 12,300,772 | ||||||
| Financials — 6.8% | ||||||||
Banks — 2.2% | ||||||||
First Republic Bank | 111,590 | 14,075,963 | ||||||
Truist Financial Corp. | 466,730 | 19,658,667 | ||||||
Total Banks | 33,734,630 | |||||||
Capital Markets — 2.4% | ||||||||
Intercontinental Exchange Inc. | 139,670 | 13,184,848 | ||||||
KKR & Co. Inc. | 690,771 | 23,589,830 | ||||||
Total Capital Markets | 36,774,678 | |||||||
Diversified Financial Services — 1.8% | ||||||||
Altimeter Growth Corp. | 696,920 | 8,153,964 | * | |||||
Dragoneer Growth Opportunities Corp. | 915,410 | 10,710,297 | * | |||||
GS Acquisition Holdings Corp. II | 519,058 | 5,346,297 | * | |||||
Insurance Acquisition Corp. | 492,650 | 4,179,790 | *(a) | |||||
Total Diversified Financial Services | 28,390,348 | |||||||
Insurance — 0.4% | ||||||||
American Equity Investment Life Holding Co. | 225,960 | 5,608,327 | ||||||
Total Financials | 104,507,983 | |||||||
| Health Care — 11.9% | ||||||||
Biotechnology — 1.7% | ||||||||
BioMarin Pharmaceutical Inc. | 196,080 | 14,594,234 | * | |||||
Ultragenyx Pharmaceutical Inc. | 116,600 | 11,718,300 | * | |||||
Total Biotechnology | 26,312,534 | |||||||
Health Care Equipment & Supplies — 1.8% | ||||||||
Insulet Corp. | 104,960 | 23,327,360 | * | |||||
SmileDirectClub Inc. | 437,290 | 3,891,881 | * | |||||
Total Health Care Equipment & Supplies | 27,219,241 | |||||||
Health Care Providers & Services — 1.4% | ||||||||
Surgery Partners Inc. | 999,192 | 21,802,369 | * | |||||
Health Care Technology — 1.6% | ||||||||
Livongo Health Inc. | 197,201 | 25,169,616 | *(a) | |||||
Life Sciences Tools & Services — 5.2% | ||||||||
Bio-Rad Laboratories Inc., Class A Shares | 43,709 | 25,631,832 | * | |||||
Charles River Laboratories International Inc. | 20,220 | 4,604,094 | * | |||||
PerkinElmer Inc. | 121,955 | 15,799,270 | ||||||
See Notes to Financial Statements.
| 16 | ClearBridge Select Fund 2020 Annual Report |
Table of Contents
ClearBridge Select Fund
| Security | Shares | Value | ||||||
Life Sciences Tools & Services — continued | ||||||||
PPD Inc. | 173,820 | $ | 5,715,202 | * | ||||
Syneos Health Inc. | 534,986 | 28,397,057 | * | |||||
Total Life Sciences Tools & Services | 80,147,455 | |||||||
Pharmaceuticals — 0.2% | ||||||||
Caris Life Sciences Inc. | 837,315 | 2,310,989 | *(a)(b)(c) | |||||
Total Health Care | 182,962,204 | |||||||
| Industrials — 10.6% | ||||||||
Aerospace & Defense — 1.1% | ||||||||
L3Harris Technologies Inc. | 103,830 | 16,728,051 | ||||||
Air Freight & Logistics — 1.6% | ||||||||
XPO Logistics Inc. | 278,080 | 25,027,200 | * | |||||
Building Products — 1.7% | ||||||||
Trex Co. Inc. | 384,828 | 26,760,939 | * | |||||
Commercial Services & Supplies — 1.9% | ||||||||
Copart Inc. | 256,927 | 28,354,464 | * | |||||
Construction & Engineering — 0.5% | ||||||||
WillScot Mobile Mini Holdings Corp. | 420,190 | 7,807,130 | * | |||||
Electrical Equipment — 1.7% | ||||||||
Array Technologies Inc. | 233,090 | 8,589,367 | * | |||||
Vertiv Holdings Co. | 978,070 | 17,262,935 | * | |||||
Total Electrical Equipment | 25,852,302 | |||||||
Machinery — 0.4% | ||||||||
Tennant Co. | 108,949 | 6,495,539 | ||||||
Road & Rail — 1.1% | ||||||||
Uber Technologies Inc. | 509,240 | 17,013,709 | * | |||||
Trading Companies & Distributors — 0.6% | ||||||||
H&E Equipment Services Inc. | 449,587 | 9,459,311 | ||||||
Total Industrials | 163,498,645 | |||||||
| Information Technology — 32.3% | ||||||||
Electronic Equipment, Instruments & Components — 0.7% | ||||||||
Brain Corp. | 413,158 | 2,247,580 | *(a)(b)(c) | |||||
nLIGHT Inc. | 407,840 | 8,662,521 | * | |||||
Total Electronic Equipment, Instruments & Components | 10,910,101 | |||||||
IT Services — 7.1% | ||||||||
Cardtronics PLC, Class A Shares | 377,861 | 6,729,704 | * | |||||
Shopify Inc., Class A Shares | 50,440 | 46,678,689 | * | |||||
Visa Inc., Class A Shares | 105,083 | 19,094,632 | ||||||
Wix.com Ltd. | 148,533 | 36,735,182 | * | |||||
Total IT Services | 109,238,207 | |||||||
See Notes to Financial Statements.
| ClearBridge Select Fund 2020 Annual Report | 17 |
Table of Contents
Schedule of investments (cont’d)
October 31, 2020
ClearBridge Select Fund
| Security | Shares | Value | ||||||
Semiconductors & Semiconductor Equipment — 0.9% | ||||||||
NVIDIA Corp. | 27,270 | $ | 13,672,087 | |||||
Software — 21.1% | ||||||||
Adobe Inc. | 65,296 | 29,193,842 | * | |||||
Agora Inc., ADR | 111,410 | 4,289,285 | * | |||||
Cloudflare Inc., Class A Shares | 278,468 | 14,471,982 | * | |||||
Cornerstone OnDemand Inc. | 318,010 | 12,081,200 | * | |||||
Datadog Inc., Class A Shares | 136,220 | 12,361,965 | * | |||||
DataRobot Inc. | 279,847 | 3,677,741 | *(a)(c) | |||||
DocuSign Inc. | 270,399 | 54,688,198 | * | |||||
Dynatrace Inc. | 215,630 | 7,613,895 | *(d) | |||||
Fortinet Inc. | 210,334 | 23,214,564 | * | |||||
HubSpot Inc. | 60,500 | 17,549,235 | * | |||||
JFrog Ltd. | 117,110 | 8,482,277 | *(d) | |||||
New Relic Inc. | 221,474 | 13,434,613 | * | |||||
Qualys Inc. | 109,100 | 9,584,435 | * | |||||
ServiceNow Inc. | 104,979 | 52,234,401 | * | |||||
Splunk Inc. | 57,730 | 11,432,849 | * | |||||
Sprout Social Inc., Class A Shares | 559,648 | 24,456,618 | * | |||||
Unity Software Inc. | 17,440 | 1,654,707 | *(d) | |||||
Varonis Systems Inc. | 109,040 | 12,601,753 | * | |||||
Yext Inc. | 671,706 | 11,136,885 | * | |||||
Total Software | 324,160,445 | |||||||
Technology Hardware, Storage & Peripherals — 2.5% | ||||||||
Apple Inc. | 350,094 | 38,111,233 | ||||||
Total Information Technology | 496,092,073 | |||||||
| Materials — 1.2% | ||||||||
Construction Materials — 1.2% | ||||||||
Summit Materials Inc., Class A Shares | 1,051,560 | 18,602,096 | * | |||||
| Real Estate — 4.8% | ||||||||
Equity Real Estate Investment Trusts (REITs) — 4.1% | ||||||||
Digital Realty Trust Inc. | 145,958 | 21,061,739 | ||||||
SBA Communications Corp. | 142,231 | 41,299,616 | ||||||
Total Equity Real Estate Investment Trusts (REITs) | 62,361,355 | |||||||
Real Estate Management & Development — 0.7% | ||||||||
CBRE Group Inc., Class A Shares | 215,161 | 10,844,114 | * | |||||
Total Real Estate | 73,205,469 | |||||||
Total Common Stocks (Cost — $1,008,401,391) | 1,455,813,106 | |||||||
See Notes to Financial Statements.
| 18 | ClearBridge Select Fund 2020 Annual Report |
Table of Contents
ClearBridge Select Fund
| Security | Rate | Maturity Date | Face Amount | Value | ||||||||||||
| Convertible Bonds & Notes — 1.1% | ||||||||||||||||
| Energy — 0.3% | ||||||||||||||||
Energy Equipment & Services — 0.3% | ||||||||||||||||
Newpark Resources Inc., Senior Notes | 4.000 | % | 12/1/21 | $ | 5,108,000 | $ | 4,546,120 | |||||||||
| Industrials — 0.8% | ||||||||||||||||
Electrical Equipment — 0.8% | ||||||||||||||||
Bloom Energy Corp., Senior Notes | 2.500 | % | 8/15/25 | 10,970,000 | 11,864,055 | (e) | ||||||||||
Total Convertible Bonds & Notes (Cost — $15,172,828) |
| 16,410,175 | ||||||||||||||
Total Investments before Short-Term Investments (Cost — $1,023,574,219) |
| 1,472,223,281 | ||||||||||||||
| Shares | ||||||||||||||||
| Short-Term Investments — 3.9% | ||||||||||||||||
JPMorgan 100% U.S. Treasury Securities Money Market Fund, Institutional Class | 0.006 | % | 47,651,316 | 47,651,316 | ||||||||||||
Western Asset Premier Institutional U.S. Treasury Reserves, Premium Shares | 0.012 | % | 11,912,829 | 11,912,829 | (f) | |||||||||||
Total Short-Term Investments (Cost — $59,564,145) |
| 59,564,145 | ||||||||||||||
Total Investments — 99.7% (Cost — $1,083,138,364) |
| 1,531,787,426 | ||||||||||||||
Other Assets in Excess of Liabilities — 0.3% | 5,174,152 | |||||||||||||||
Total Net Assets — 100.0% | $ | 1,536,961,578 | ||||||||||||||
| * | Non-income producing security. |
| (a) | Security is valued in good faith in accordance with procedures approved by the Board of Trustees (Note 1). |
| (b) | Security is valued using significant unobservable inputs (Note 1). |
| (c) | Restricted security (Note 9). |
| (d) | All or a portion of this security is pledged as collateral for written options. |
| (e) | Security is exempt from registration under Rule 144A of the Securities Act of 1933. This security may be resold in transactions that are exempt from registration, normally to qualified institutional buyers. This security has been deemed liquid pursuant to guidelines approved by the Board of Trustees. |
| (f) | In this instance, as defined in the Investment Company Act of 1940, an “Affiliated Company” represents Fund ownership of at least 5% of the outstanding voting securities of an issuer, or a company which is under common ownership or control with the Fund. At October 31, 2020, the total market value of investments in Affiliated Companies was $11,912,829 and the cost was $11,912,829 (Note 8). |
Abbreviation(s) used in this schedule: | ||
| ADR | — American Depositary Receipts | |
| Schedule of Written Options | ||||||||||||||||||||
| Exchange-Traded Written Options | ||||||||||||||||||||
| Security | Expiration Date | Strike Price | Contracts | Notional Amount | Value | |||||||||||||||
| Dynatrace Inc., Call | 11/20/20 | $ | 48.00 | 2,156 | $ | 7,612,836 | $ | (10,780) | ||||||||||||
See Notes to Financial Statements.
| ClearBridge Select Fund 2020 Annual Report | 19 |
Table of Contents
Schedule of investments (cont’d)
October 31, 2020
ClearBridge Select Fund
| Schedule of Written Options (cont’d) | ||||||||||||||||||||
| Security | Expiration Date | Strike Price | Contracts | Notional Amount | Value | |||||||||||||||
| JFrog Ltd., Call | 11/20/20 | $ | 90.00 | 585 | $ | 4,237,155 | (160,875) | |||||||||||||
| JFrog Ltd., Put | 11/20/20 | 60.00 | 585 | 4,237,155 | (155,025) | |||||||||||||||
| Unity Software Inc., Call | 12/18/20 | 120.00 | 174 | 1,650,912 | (73,776) | |||||||||||||||
| Unity Software Inc., Put | 11/20/20 | 65.00 | 775 | 7,353,200 | (41,075) | |||||||||||||||
| Unity Software Inc., Put | 11/20/20 | 70.00 | 174 | 1,650,912 | (17,400) | |||||||||||||||
| Total Exchange-Traded Written Options (Premiums received — $1,006,285) |
| $ | (458,931) | |||||||||||||||||
See Notes to Financial Statements.
| 20 | ClearBridge Select Fund 2020 Annual Report |
Table of Contents
Statement of assets and liabilities
October 31, 2020
| Assets: | ||||
Investments in unaffiliated securities, at value (Cost — $1,071,225,535) | $ | 1,519,874,597 | ||
Investments in affiliated securities, at value (Cost — $11,912,829) | 11,912,829 | |||
Cash | 153,642 | |||
Deposits with brokers for open exchange-traded options | 9,765,500 | |||
Receivable for Fund shares sold | 5,611,531 | |||
Dividends and interest receivable | 305,415 | |||
Receivable for premiums on written options | 123,015 | |||
Receivable for securities sold | 9,352 | |||
Prepaid expenses | 129,042 | |||
Total Assets | 1,547,884,923 | |||
| Liabilities: | ||||
Payable for securities purchased | 5,915,670 | |||
Payable for Fund shares repurchased | 2,745,932 | |||
Investment management fee payable | 1,295,798 | |||
Written options, at value (premiums received — $1,006,285) | 458,931 | |||
Service and/or distribution fees payable | 160,941 | |||
Payable for written options closed | 153,642 | |||
Trustees’ fees payable | 4,807 | |||
Accrued expenses | 187,624 | |||
Total Liabilities | 10,923,345 | |||
| Total Net Assets | $ | 1,536,961,578 | ||
| Net Assets: | ||||
Par value (Note 7) | $ | 383 | ||
Paid-in capital in excess of par value | 1,100,754,030 | |||
Total distributable earnings (loss) | 436,207,165 | |||
| Total Net Assets | $ | 1,536,961,578 | ||
See Notes to Financial Statements.
| ClearBridge Select Fund 2020 Annual Report | 21 |
Table of Contents
Statement of assets and liabilities (cont’d)
October 31, 2020
| Net Assets: | ||||
Class A | $ | 256,622,419 | ||
Class A2 | $ | 246,563,182 | ||
Class C | $ | 56,196,662 | ||
Class FI | $ | 5,693,097 | ||
Class I | $ | 807,153,081 | ||
Class IS | $ | 164,733,137 | ||
| Shares Outstanding: | ||||
Class A | 6,506,206 | |||
Class A2 | 6,255,297 | |||
Class C | 1,508,070 | |||
Class FI | 144,361 | |||
Class I | 19,856,978 | |||
Class IS | 4,050,594 | |||
| Net Asset Value: | ||||
Class A (and redemption price) | $ | 39.44 | ||
Class A2 (and redemption price) | $ | 39.42 | ||
Class C* | $ | 37.26 | ||
Class FI (and redemption price) | $ | 39.44 | ||
Class I (and redemption price) | $ | 40.65 | ||
Class IS (and redemption price) | $ | 40.67 | ||
| Maximum Public Offering Price Per Share: | ||||
Class A (based on maximum initial sales charge of 5.75%) | $ | 41.85 | ||
Class A2 (based on maximum initial sales charge of 5.75%) | $ | 41.82 | ||
| * | Redemption price per share is NAV of Class C shares reduced by a 1.00% CDSC if shares are redeemed within one year from purchase payment (Note 2). |
See Notes to Financial Statements.
| 22 | ClearBridge Select Fund 2020 Annual Report |
Table of Contents
For the Year Ended October 31, 2020
| Investment Income: | ||||
Dividends | $ | 3,430,304 | ||
Interest from unaffiliated investments | 823,511 | |||
Interest from affiliated investments | 45,085 | |||
Total Investment Income | 4,298,900 | |||
| Expenses: | ||||
Investment management fee (Note 2) | 9,617,995 | |||
Service and/or distribution fees (Notes 2 and 5) | 1,294,244 | |||
Transfer agent fees (Note 5) | 1,191,076 | |||
Registration fees | 198,861 | |||
Fund accounting fees | 76,374 | |||
Trustees’ fees | 70,332 | |||
Legal fees | 65,567 | |||
Interest expense on securities sold short | 58,279 | |||
Audit and tax fees | 33,455 | |||
Shareholder reports | 30,320 | |||
Dividend expense on securities sold short | 27,437 | |||
Custody fees | 10,744 | |||
Insurance | 9,288 | |||
Miscellaneous expenses | 7,608 | |||
Total Expenses | 12,691,580 | |||
Less: Fee waivers and/or expense reimbursements (Notes 2 and 5) | (10,220) | |||
Net Expenses | 12,681,360 | |||
| Net Investment Loss | (8,382,460) | |||
| Realized and Unrealized Gain (Loss) on Investments, Written Options and Short Sales (Notes 1, 3 and 4): | ||||
Net Realized Gain (Loss) From: | ||||
Investment transactions in unaffiliated securities | 1,409,664 | |||
Written options | 887,436 | |||
Securities sold short | (1,973,673) | |||
Net Realized Gain | 323,427 | |||
Change in Net Unrealized Appreciation (Depreciation) From: | ||||
Investments in unaffiliated securities | 375,642,766 | |||
Written options | 515,760 | |||
Securities sold short | 248,523 | |||
Change in Net Unrealized Appreciation (Depreciation) | 376,407,049 | |||
| Net Gain on Investments, Written Options and Short Sales | 376,730,476 | |||
| Increase in Net Assets From Operations | $ | 368,348,016 | ||
See Notes to Financial Statements.
| ClearBridge Select Fund 2020 Annual Report | 23 |
Table of Contents
Statements of changes in net assets
| For the Years Ended October 31, | 2020 | 2019 | ||||||
| Operations: | ||||||||
Net investment loss | $ | (8,382,460) | $ | (3,627,893) | ||||
Net realized gain (loss) | 323,427 | (2,750,080) | ||||||
Change in net unrealized appreciation (depreciation) | 376,407,049 | 66,401,007 | ||||||
Increase in Net Assets From Operations | 368,348,016 | 60,023,034 | ||||||
| Distributions to Shareholders From (Notes 1 and 6): | ||||||||
Total distributable earnings | — | (2,752,370) | ||||||
Decrease in Net Assets From Distributions to Shareholders | — | (2,752,370) | ||||||
| Fund Share Transactions (Note 7): | ||||||||
Net proceeds from sale of shares | 884,189,679 | 655,749,497 | ||||||
Reinvestment of distributions | — | 2,708,954 | ||||||
Cost of shares repurchased | (385,784,326) | (257,714,286) | ||||||
Increase in Net Assets From Fund Share Transactions | 498,405,353 | 400,744,165 | ||||||
Increase in Net Assets | 866,753,369 | 458,014,829 | ||||||
| Net Assets: | ||||||||
Beginning of year | 670,208,209 | 212,193,380 | ||||||
End of year | $ | 1,536,961,578 | $ | 670,208,209 | ||||
See Notes to Financial Statements.
| 24 | ClearBridge Select Fund 2020 Annual Report |
Table of Contents
| For a share of each class of beneficial interest outstanding throughout each year ended October 31: |
| Class A Shares1 | 2020 | 2019 | 2018 | 2017 | 2016 | |||||||||||||||
| Net asset value, beginning of year | $27.21 | $23.92 | $19.61 | $14.81 | $15.30 | |||||||||||||||
| Income (loss) from operations: | ||||||||||||||||||||
Net investment loss | (0.31) | (0.23) | (0.25) | (0.16) | (0.16) | |||||||||||||||
Net realized and unrealized gain | 12.54 | 3.81 | 5.00 | 5.13 | 0.44 | |||||||||||||||
Total income from operations | 12.23 | 3.58 | 4.75 | 4.97 | 0.28 | |||||||||||||||
| Less distributions from: | ||||||||||||||||||||
Net realized gains | — | (0.29) | (0.44) | (0.17) | (0.77) | |||||||||||||||
Total distributions | — | (0.29) | (0.44) | (0.17) | (0.77) | |||||||||||||||
| Net asset value, end of year | $39.44 | $27.21 | $23.92 | $19.61 | $14.81 | |||||||||||||||
Total return2 | 44.95 | % | 15.05 | % | 24.83 | % | 33.89 | % | 1.97 | % | ||||||||||
| Net assets, end of year (000s) | $256,622 | $161,595 | $66,737 | $5,998 | $765 | |||||||||||||||
| Ratios to average net assets: | ||||||||||||||||||||
Gross expenses | 1.39 | % | 1.47 | % | 1.66 | % | 2.20 | % | 3.20 | % | ||||||||||
Net expenses3,4 | 1.39 | 1.47 | 1.49 | 1.24 | 1.49 | |||||||||||||||
Net investment loss | (0.95) | (0.90) | (1.00) | (0.88) | (1.15) | |||||||||||||||
| Portfolio turnover rate | 24 | %5 | 21 | %5 | 27 | %5 | 38 | %5 | 25 | % | ||||||||||
| 1 | Per share amounts have been calculated using the average shares method. |
| 2 | Performance figures, exclusive of sales charges, may reflect compensating balance arrangements, fee waivers and/or expense reimbursements. In the absence of compensating balance arrangements, fee waivers and/or expense reimbursements, the total return would have been lower. Past performance is no guarantee of future results. |
| 3 | As a result of an expense limitation arrangement, the ratio of total annual fund operating expenses, other than interest, brokerage, taxes, extraordinary expenses, expenses related to short sales, and acquired fund fees and expenses, to average net assets of Class A shares did not exceed 1.50%. This expense limitation arrangement cannot be terminated prior to December 31, 2022 without the Board of Trustees’ consent. In addition, the manager has agreed to waive the Fund’s management fee to an extent sufficient to offset the net management fee payable in connection with any investment in an affiliated money market fund. |
| 4 | Reflects fee waivers and/or expense reimbursements. |
| 5 | Excluding short sale transactions. If short sale transactions had been included, the portfolio turnover rate would have been 26%, 23%, 33% and 39% for the years ended October 31, 2020, October 31, 2019, October 31, 2018 and October 31, 2017, respectively. |
See Notes to Financial Statements.
| ClearBridge Select Fund 2020 Annual Report | 25 |
Table of Contents
Financial highlights (cont’d)
For a share of each class of beneficial interest outstanding throughout each year ended October 31, unless otherwise noted: |
| Class A2 Shares1 | 2020 | 2019 | 20182 | |||||||||
| Net asset value, beginning of year | $27.21 | $23.93 | $26.92 | |||||||||
| Income (loss) from operations: | ||||||||||||
Net investment loss | (0.35) | (0.27) | (0.03) | |||||||||
Net realized and unrealized gain (loss) | 12.56 | 3.84 | (2.96) | |||||||||
Total income (loss) from operations | 12.21 | 3.57 | (2.99) | |||||||||
| Less distributions from: | ||||||||||||
Net realized gains | — | (0.29) | — | |||||||||
Total distributions | — | (0.29) | — | |||||||||
| Net asset value, end of year | $39.42 | $27.21 | $23.93 | |||||||||
Total return3 | 44.87 | % | 15.05 | % | (11.07) | % | ||||||
| Net assets, end of year (000s) | $246,563 | $75,302 | $9,714 | |||||||||
| Ratios to average net assets: | ||||||||||||
Gross expenses | 1.48 | % | 1.56 | % | 1.70 | %4 | ||||||
Net expenses5 | 1.48 | 6 | 1.56 | 1.55 | 4,6 | |||||||
Net investment loss | (1.06) | (1.02) | (1.02) | 4 | ||||||||
| Portfolio turnover rate | 24 | %7 | 21 | %7 | 27 | %7,8 | ||||||
| 1 | Per share amounts have been calculated using the average shares method. |
| 2 | For the period September 14, 2018 (inception date) to October 31, 2018. |
| 3 | Performance figures, exclusive of sales charges, may reflect compensating balance arrangements, fee waivers and/or expense reimbursements. In the absence of compensating balance arrangements, fee waivers and/or expense reimbursements, the total return would have been lower. Past performance is no guarantee of future results. Total returns for periods of less than one year are not annualized. |
| 4 | Annualized. |
| 5 | As a result of an expense limitation arrangement, the ratio of total annual fund operating expenses, other than interest, brokerage, taxes, extraordinary expenses, expenses related to short sales and acquired fund fees and expenses, to average net assets of Class A2 shares did not exceed 1.70%. This expense limitation arrangement cannot be terminated prior to December 31, 2022 without the Board of Trustees’ consent. In addition, the manager has agreed to waive the Fund’s management fee to an extent sufficient to offset the net management fee payable in connection with any investment in an affiliated money market fund. |
| 6 | Reflects fee waivers and/or expense reimbursements. |
| 7 | Excluding short sale transactions. If short sale transactions had been included, the portfolio turnover rate would have been 26%, 23% and 33% for the years ended October 31, 2020, October 31, 2019 and October 31, 2018, respectively. |
| 8 | For the year ended October 31, 2018. |
See Notes to Financial Statements.
| 26 | ClearBridge Select Fund 2020 Annual Report |
Table of Contents
| For a share of each class of beneficial interest outstanding throughout each year ended October 31: |
| Class C Shares1 | 2020 | 2019 | 2018 | 2017 | 2016 | |||||||||||||||
| Net asset value, beginning of year | $25.89 | $22.94 | $18.96 | $14.46 | $15.03 | |||||||||||||||
| Income (loss) from operations: | ||||||||||||||||||||
Net investment loss | (0.52) | (0.41) | (0.42) | (0.32) | (0.26) | |||||||||||||||
Net realized and unrealized gain | 11.89 | 3.65 | 4.84 | 4.99 | 0.46 | |||||||||||||||
Total income from operations | 11.37 | 3.24 | 4.42 | 4.67 | 0.20 | |||||||||||||||
| Less distributions from: | ||||||||||||||||||||
Net realized gains | — | (0.29) | (0.44) | (0.17) | (0.77) | |||||||||||||||
Total distributions | — | (0.29) | (0.44) | (0.17) | (0.77) | |||||||||||||||
| Net asset value, end of year | $37.26 | $25.89 | $22.94 | $18.96 | $14.46 | |||||||||||||||
Total return2 | 43.92 | % | 14.25 | % | 23.87 | % | 32.63 | % | 1.38 | % | ||||||||||
| Net assets, end of year (000s) | $56,197 | $25,959 | $5,323 | $171 | $51 | |||||||||||||||
| Ratios to average net assets: | ||||||||||||||||||||
Gross expenses | 2.11 | % | 2.19 | % | 2.45 | % | 3.18 | % | 4.19 | % | ||||||||||
Net expenses3 | 2.11 | 4 | 2.19 | 2.27 | 4 | 2.22 | 4 | 2.25 | 4 | |||||||||||
Net investment loss | (1.69) | (1.64) | (1.77) | (1.89) | (1.96) | |||||||||||||||
| Portfolio turnover rate | 24 | %5 | 21 | %5 | 27 | %5 | 38 | %5 | 25 | % | ||||||||||
| 1 | Per share amounts have been calculated using the average shares method. |
| 2 | Performance figures, exclusive of CDSC, may reflect compensating balance arrangements, fee waivers and/or expense reimbursements. In the absence of compensating balance arrangements, fee waivers and/or expense reimbursements, the total return would have been lower. Past performance is no guarantee of future results. |
| 3 | As a result of an expense limitation arrangement, the ratio of total annual fund operating expenses, other than interest, brokerage, taxes, extraordinary expenses, expenses related to short sales, and acquired fund fees and expenses, to average net assets of Class C shares did not exceed 2.25%. Total annual fund operating expenses after waiving fees and/or reimbursing expenses exceed the expense cap as a result of dividend and interest expenses on securities sold short. This expense limitation arrangement cannot be terminated prior to December 31, 2022 without the Board of Trustees’ consent. In addition, the manager has agreed to waive the Fund’s management fee to an extent sufficient to offset the net management fee payable in connection with any investment in an affiliated money market fund. |
| 4 | Reflects fee waivers and/or expense reimbursements. |
| 5 | Excluding short sale transactions. If short sale transactions had been included, the portfolio turnover rate would have been 26%, 23%, 33% and 39% for the years ended October 31, 2020, October 31, 2019, October 31, 2018 and October 31, 2017, respectively. |
See Notes to Financial Statements.
| ClearBridge Select Fund 2020 Annual Report | 27 |
Table of Contents
Financial highlights (cont’d)
| For a share of each class of beneficial interest outstanding throughout each year ended October 31: |
| Class FI Shares1 | 2020 | 2019 | 2018 | 2017 | 2016 | |||||||||||||||
| Net asset value, beginning of year | $27.20 | $23.90 | $19.60 | $14.82 | $15.30 | |||||||||||||||
| Income (loss) from operations: | ||||||||||||||||||||
Net investment loss | (0.30) | (0.21) | (0.24) | (0.16) | (0.16) | |||||||||||||||
Net realized and unrealized gain | 12.54 | 3.80 | 4.98 | 5.11 | 0.45 | |||||||||||||||
Total income from operations | 12.24 | 3.59 | 4.74 | 4.95 | 0.29 | |||||||||||||||
| Less distributions from: | ||||||||||||||||||||
Net realized gains | — | (0.29) | (0.44) | (0.17) | (0.77) | |||||||||||||||
Total distributions | — | (0.29) | (0.44) | (0.17) | (0.77) | |||||||||||||||
| Net asset value, end of year | $39.44 | $27.20 | $23.90 | $19.60 | $14.82 | |||||||||||||||
Total return2 | 45.00 | % | 15.10 | % | 24.79 | % | 33.74 | % | 2.03 | % | ||||||||||
| Net assets, end of year (000s) | $5,693 | $10,675 | $17,592 | $49 | $37 | |||||||||||||||
| Ratios to average net assets: | ||||||||||||||||||||
Gross expenses | 1.37 | % | 1.42 | % | 1.63 | % | 2.22 | % | 3.32 | % | ||||||||||
Net expenses3 | 1.37 | 4 | 1.42 | 1.46 | 4 | 1.25 | 4 | 1.50 | 4 | |||||||||||
Net investment loss | (0.93) | (0.82) | (0.99) | (0.89) | (1.16) | |||||||||||||||
| Portfolio turnover rate | 24 | %5 | 21 | %5 | 27 | %5 | 38 | %5 | 25 | % | ||||||||||
| 1 | Per share amounts have been calculated using the average shares method. |
| 2 | Performance figures may reflect compensating balance arrangements, fee waivers and/or expense reimbursements. In the absence of compensating balance arrangements, fee waivers and/or expense reimbursements, the total return would have been lower. Past performance is no guarantee of future results. |
| 3 | As a result of an expense limitation arrangement, the ratio of total annual fund operating expenses, other than interest, brokerage, taxes, extraordinary expenses, expenses related to short sales and acquired fund fees and expenses, to average net assets of Class FI shares did not exceed 1.50%. This expense limitation arrangement cannot be terminated prior to December 31, 2022 without the Board of Trustees’ consent. In addition, the manager has agreed to waive the Fund’s management fee to an extent sufficient to offset the net management fee payable in connection with any investment in an affiliated money market fund. |
| 4 | Reflects fee waivers and/or expense reimbursements. |
| 5 | Excluding short sale transactions. If short sale transactions had been included, the portfolio turnover rate would have been 26%, 23%, 33% and 39% for the years ended October 31, 2020, October 31, 2019, October 31, 2018 and October 31, 2017, respectively. |
See Notes to Financial Statements.
| 28 | ClearBridge Select Fund 2020 Annual Report |
Table of Contents
| For a share of each class of beneficial interest outstanding throughout each year ended October 31: |
| Class I Shares1 | 2020 | 2019 | 2018 | 2017 | 2016 | |||||||||||||||
| Net asset value, beginning of year | $27.96 | $24.50 | $20.02 | $15.09 | $15.51 | |||||||||||||||
| Income (loss) from operations: | ||||||||||||||||||||
Net investment loss | (0.23) | (0.16) | (0.18) | (0.13) | (0.12) | |||||||||||||||
Net realized and unrealized gain | 12.92 | 3.91 | 5.10 | 5.23 | 0.47 | |||||||||||||||
Total income from operations | 12.69 | 3.75 | 4.92 | 5.10 | 0.35 | |||||||||||||||
| Less distributions from: | ||||||||||||||||||||
Net realized gains | — | (0.29) | (0.44) | (0.17) | (0.77) | |||||||||||||||
Total distributions | — | (0.29) | (0.44) | (0.17) | (0.77) | |||||||||||||||
| Net asset value, end of year | $40.65 | $27.96 | $24.50 | $20.02 | $15.09 | |||||||||||||||
Total return2 | 45.39 | % | 15.39 | % | 25.18 | % | 34.13 | % | 2.34 | % | ||||||||||
| Net assets, end of year (000s) | $807,153 | $348,681 | $109,197 | $8,364 | $2,221 | |||||||||||||||
| Ratios to average net assets: | ||||||||||||||||||||
Gross expenses | 1.11 | % | 1.18 | % | 1.45 | % | 2.08 | % | 2.87 | % | ||||||||||
Net expenses3,4 | 1.11 | 1.16 | 1.22 | 1.08 | 1.15 | |||||||||||||||
Net investment loss | (0.68) | (0.61) | (0.73) | (0.75) | (0.80) | |||||||||||||||
| Portfolio turnover rate | 24 | %5 | 21 | %5 | 27 | %5 | 38 | %5 | 25 | % | ||||||||||
| 1 | Per share amounts have been calculated using the average shares method. |
| 2 | Performance figures may reflect compensating balance arrangements, fee waivers and/or expense reimbursements. In the absence of compensating balance arrangements, fee waivers and/or expense reimbursements, the total return would have been lower. Past performance is no guarantee of future results. |
| 3 | As a result of an expense limitation arrangement, the ratio of total annual fund operating expenses, other than interest, brokerage, taxes, extraordinary expenses, expenses related to short sales, and acquired fund fees and expenses, to average net assets of Class I shares did not exceed 1.15%. Total annual fund operating expenses after waiving fees and/or reimbursing expenses exceed the expense cap as a result of dividend and interest expenses on securities sold short. This expense limitation arrangement cannot be terminated prior to December 31, 2022 without the Board of Trustees’ consent. In addition, the manager has agreed to waive the Fund’s management fee to an extent sufficient to offset the net management fee payable in connection with any investment in an affiliated money market fund. |
| 4 | Reflects fee waivers and/or expense reimbursements. |
| 5 | Excluding short sale transactions. If short sale transactions had been included, the portfolio turnover rate would have been 26%, 23%, 33% and 39% for the years ended October 31, 2020, October 31, 2019, October 31, 2018 and October 31, 2017, respectively. |
See Notes to Financial Statements.
| ClearBridge Select Fund 2020 Annual Report | 29 |
Table of Contents
Financial highlights (cont’d)
| For a share of each class of beneficial interest outstanding throughout each year ended October 31: |
| Class IS Shares1 | 2020 | 2019 | 2018 | 2017 | 2016 | |||||||||||||||
| Net asset value, beginning of year | $27.95 | $24.47 | $19.98 | $15.05 | $15.46 | |||||||||||||||
| Income (loss) from operations: | ||||||||||||||||||||
Net investment loss | (0.21) | (0.14) | (0.15) | (0.13) | (0.10) | |||||||||||||||
Net realized and unrealized gain | 12.93 | 3.91 | 5.08 |
| 5.23 |
| 0.46 | |||||||||||||
Total income from operations | 12.72 | 3.77 | 4.93 | 5.10 | 0.36 | |||||||||||||||
| Less distributions from: | ||||||||||||||||||||
Net realized gains | — | (0.29) | (0.44) | (0.17) | (0.77) | |||||||||||||||
Total distributions | — | (0.29) | (0.44) | (0.17) | (0.77) | |||||||||||||||
| Net asset value, end of year | $40.67 | $27.95 | $24.47 | $19.98 | $15.05 | |||||||||||||||
Total return2 | 45.51 | % | 15.58 | % | 25.18 | % | 34.22 | % | 2.42 | % | ||||||||||
| Net assets, end of year (000s) | $164,733 | $47,997 | $3,630 | $13,142 | $7,898 | |||||||||||||||
| Ratios to average net assets: | ||||||||||||||||||||
Gross expenses | 1.02 | % | 1.07 | % | 1.27 | % | 2.02 | % | 2.78 | % | ||||||||||
Net expenses3,4 | 1.02 | 1.07 | 1.09 | 1.05 | 1.05 | |||||||||||||||
Net investment loss | (0.60) | (0.52) | (0.66) | (0.72) | (0.70) | |||||||||||||||
| Portfolio turnover rate | 24 | %5 | 21 | %5 | 27 | %5 | 38 | %5 | 25 | % | ||||||||||
| 1 | Per share amounts have been calculated using the average shares method. |
| 2 | Performance figures may reflect compensating balance arrangements, fee waivers and/or expense reimbursements. In the absence of compensating balance arrangements, fee waivers and/or expense reimbursements, the total return would have been lower. Past performance is no guarantee of future results. |
| 3 | As a result of an expense limitation arrangement, the ratio of total annual fund operating expenses, other than interest, brokerage, taxes, extraordinary expenses, expenses related to short sales, and acquired fund fees and expenses, to average net assets of Class IS shares did not exceed 1.05%. In addition, the ratio of total annual fund operating expenses for Class IS shares did not exceed the ratio of total annual fund operating expenses for Class I shares. Total annual fund operating expenses after waiving fees and/or reimbursing expenses exceed the expense cap as a result of dividend and interest expenses on securities sold short. These expense limitation arrangements cannot be terminated prior to December 31, 2022 without the Board of Trustees’ consent. In addition, the manager has agreed to waive the Fund’s management fee to an extent sufficient to offset the net management fee payable in connection with any investment in an affiliated money market fund. |
| 4 | Reflects fee waivers and/or expense reimbursements. |
| 5 | Excluding short sale transactions. If short sale transactions had been included, the portfolio turnover rate would have been 26%, 23%, 33% and 39% for the years ended October 31, 2020, October 31, 2019, October 31, 2018 and October 31, 2017, respectively. |
See Notes to Financial Statements.
| 30 | ClearBridge Select Fund 2020 Annual Report |
Table of Contents
1. Organization and significant accounting policies
ClearBridge Select Fund (the “Fund”) is a separate non-diversified investment series of Legg Mason Partners Equity Trust (the “Trust”). The Trust, a Maryland statutory trust, is registered under the Investment Company Act of 1940, as amended (the “1940 Act”), as an open-end management investment company.
The following are significant accounting policies consistently followed by the Fund and are in conformity with U.S. generally accepted accounting principles (“GAAP”). Estimates and assumptions are required to be made regarding assets, liabilities and changes in net assets resulting from operations when financial statements are prepared. Changes in the economic environment, financial markets and any other parameters used in determining these estimates could cause actual results to differ. Subsequent events have been evaluated through the date the financial statements were issued.
(a) Investment valuation. Equity securities for which market quotations are available are valued at the last reported sales price or official closing price on the primary market or exchange on which they trade. The valuations for fixed income securities (which may include, but are not limited to, corporate, government, municipal, mortgage-backed, collateralized mortgage obligations and asset-backed securities) and certain derivative instruments are typically the prices supplied by independent third party pricing services, which may use market prices or broker/dealer quotations or a variety of valuation techniques and methodologies. The independent third party pricing services use inputs that are observable such as issuer details, interest rates, yield curves, prepayment speeds, credit risks/spreads, default rates and quoted prices for similar securities. Investments in open-end funds are valued at the closing net asset value per share of each fund on the day of valuation. When the Fund holds securities or other assets that are denominated in a foreign currency, the Fund will normally use the currency exchange rates as of 4:00 p.m. (Eastern Time). If independent third party pricing services are unable to supply prices for a portfolio investment, or if the prices supplied are deemed by the manager to be unreliable, the market price may be determined by the manager using quotations from one or more broker/dealers or at the transaction price if the security has recently been purchased and no value has yet been obtained from a pricing service or pricing broker. When reliable prices are not readily available, such as when the value of a security has been significantly affected by events after the close of the exchange or market on which the security is principally traded, but before the Fund calculates its net asset value, the Fund values these securities as determined in accordance with procedures approved by the Fund’s Board of Trustees.
The Board of Trustees is responsible for the valuation process and has delegated the supervision of the daily valuation process to the Legg Mason North Atlantic Fund Valuation Committee (the “Valuation Committee”). The Valuation Committee, pursuant to the policies adopted by the Board of Trustees, is responsible for making fair value determinations, evaluating the effectiveness of the Fund’s pricing policies, and reporting to the Board of Trustees. When determining the reliability of third party pricing information for investments owned by the Fund, the Valuation Committee, among other things, conducts due diligence reviews of pricing vendors, monitors the daily change in prices and reviews transactions among market participants.
| ClearBridge Select Fund 2020 Annual Report | 31 |
Table of Contents
Notes to financial statements (cont’d)
The Valuation Committee will consider pricing methodologies it deems relevant and appropriate when making fair value determinations. Examples of possible methodologies include, but are not limited to, multiple of earnings; discount from market of a similar freely traded security; discounted cash-flow analysis; book value or a multiple thereof; risk premium/yield analysis; yield to maturity; and/or fundamental investment analysis. The Valuation Committee will also consider factors it deems relevant and appropriate in light of the facts and circumstances. Examples of possible factors include, but are not limited to, the type of security; the issuer’s financial statements; the purchase price of the security; the discount from market value of unrestricted securities of the same class at the time of purchase; analysts’ research and observations from financial institutions; information regarding any transactions or offers with respect to the security; the existence of merger proposals or tender offers affecting the security; the price and extent of public trading in similar securities of the issuer or comparable companies; and the existence of a shelf registration for restricted securities.
For each portfolio security that has been fair valued pursuant to the policies adopted by the Board of Trustees, the fair value price is compared against the last available and next available market quotations. The Valuation Committee reviews the results of such back testing monthly and fair valuation occurrences are reported to the Board of Trustees quarterly.
The Fund uses valuation techniques to measure fair value that are consistent with the market approach and/or income approach, depending on the type of security and the particular circumstance. The market approach uses prices and other relevant information generated by market transactions involving identical or comparable securities. The income approach uses valuation techniques to discount estimated future cash flows to present value.
GAAP establishes a disclosure hierarchy that categorizes the inputs to valuation techniques used to value assets and liabilities at measurement date. These inputs are summarized in the three broad levels listed below:
| • | Level 1 — quoted prices in active markets for identical investments |
| • | Level 2 — other significant observable inputs (including quoted prices for similar investments, interest rates, prepayment speeds, credit risk, etc.) |
| • | Level 3 — significant unobservable inputs (including the Fund’s own assumptions in determining the fair value of investments) |
The inputs or methodologies used to value securities are not necessarily an indication of the risk associated with investing in those securities.
| 32 | ClearBridge Select Fund 2020 Annual Report |
Table of Contents
The following is a summary of the inputs used in valuing the Fund’s assets and liabilities carried at fair value:
| ASSETS | ||||||||||||||||
| Description | Quoted Prices (Level 1) | Other Significant Observable Inputs (Level 2) | Significant (Level 3) | Total | ||||||||||||
| Long-Term Investments†: | ||||||||||||||||
Common Stocks: | ||||||||||||||||
Financials | $ | 100,328,193 | $ | 4,179,790 | — | $ | 104,507,983 | |||||||||
Health Care | 155,481,599 | 25,169,616 | $ | 2,310,989 | 182,962,204 | |||||||||||
Information Technology | 490,166,752 | 3,677,741 | 2,247,580 | 496,092,073 | ||||||||||||
Other Common Stocks | 672,250,846 | — | — | 672,250,846 | ||||||||||||
Convertible Bonds & Notes | — | 16,410,175 | — | 16,410,175 | ||||||||||||
| Total Long-Term Investments | 1,418,227,390 | 49,437,322 | 4,558,569 | 1,472,223,281 | ||||||||||||
| Short-Term Investments† | 59,564,145 | — | — | 59,564,145 | ||||||||||||
| Total Investments | $ | 1,477,791,535 | $ | 49,437,322 | $ | 4,558,569 | $ | 1,531,787,426 | ||||||||
| LIABILITIES | ||||||||||||||||
| Description | Quoted Prices (Level 1) | Other Significant Observable Inputs (Level 2) | Significant (Level 3) | Total | ||||||||||||
| Other Financial Instruments: | ||||||||||||||||
Written Options | $ | 458,931 | — | — | $ | 458,931 | ||||||||||
| † | See Schedule of Investments for additional detailed categorizations. |
(b) Purchased options. When the Fund purchases an option, an amount equal to the premium paid by the Fund is recorded as an investment on the Statement of Assets and Liabilities, the value of which is marked-to-market to reflect the current market value of the option purchased. If the purchased option expires, the Fund realizes a loss equal to the amount of premium paid. When an instrument is purchased or sold through the exercise of an option, the related premium paid is added to the basis of the instrument acquired or deducted from the proceeds of the instrument sold. The risk associated with purchasing put and call options is limited to the premium paid.
(c) Written options. When the Fund writes an option, an amount equal to the premium received by the Fund is recorded as a liability, the value of which is marked-to-market daily to reflect the current market value of the option written. If the option expires, the premium received is recorded as a realized gain. When a written call option is exercised, the difference between the premium received plus the option exercise price and the Fund’s basis in the underlying security (in the case of a covered written call option), or the cost to purchase the underlying security (in the case of an uncovered written call option), including brokerage commission, is recognized as a realized gain or loss. When a written put option is exercised, the amount of the premium received is subtracted from the cost of the security purchased by the Fund from the exercise of the written put option to form the Fund’s basis
| ClearBridge Select Fund 2020 Annual Report | 33 |
Table of Contents
Notes to financial statements (cont’d)
in the underlying security purchased. The writer or buyer of an option traded on an exchange can liquidate the position before the exercise of the option by entering into a closing transaction. The cost of a closing transaction is deducted from the original premium received resulting in a realized gain or loss to the Fund.
The risk in writing a covered call option is that the Fund may forego the opportunity of profit if the market price of the underlying security increases and the option is exercised. The risk in writing a put option is that the Fund may incur a loss if the market price of the underlying security decreases and the option is exercised. The risk in writing an uncovered call option is that the Fund is exposed to the risk of loss if the market price of the underlying security increases. In addition, there is the risk that the Fund may not be able to enter into a closing transaction because of an illiquid secondary market.
(d) Short sale transactions. Short sales are transactions in which the Fund sells a security it does not own in anticipation of a decline in the market value of that security. To complete such a transaction, a Fund must borrow the security to deliver to the buyer. The Fund is then obligated to replace the security borrowed by purchasing it in the open market at the time of replacement. The proceeds received by the Fund for the short sale are retained by the broker as collateral until the Fund replaces the borrowed security. If the market value of the security sold short increases, additional collateral may be required. The amount of collateral required is determined daily by reference to the market value of the short positions. Liabilities for securities sold short are marked-to-market daily and reported at market value in the financial statements.
Short sale transactions may result in a risk of loss that may exceed the amount shown on the Statement of Assets and Liabilities. A gain, limited to the price at which the Fund sold the security short, or a loss, potentially unlimited in size, will be recognized upon termination of a short sale. Dividends on short positions are recorded as a liability on the ex-dividend date and are shown in the Statement of Operations as Dividend Expense because the Fund must pay the dividend to the lender of the security.
Short selling is a technique that may be considered speculative, involves risk beyond the amount of money used to secure each transaction and may represent a form of leverage.
(e) Foreign investment risks. The Fund’s investments in foreign securities may involve risks not present in domestic investments. Since securities may be denominated in foreign currencies, may require settlement in foreign currencies or pay interest or dividends in foreign currencies, changes in the relationship of these foreign currencies to the U.S. dollar can significantly affect the value of the investments and earnings of the Fund. Foreign investments may also subject the Fund to foreign government exchange restrictions, expropriation, taxation or other political, social or economic developments, all of which affect the market and/or credit risk of the investments.
(f) Counterparty risk and credit-risk-related contingent features of derivative instruments. The Fund may invest in certain securities or engage in other transactions, where the Fund is exposed to counterparty credit risk in addition to broader market risks. The Fund may invest in securities of issuers, which may also be considered counterparties
| 34 | ClearBridge Select Fund 2020 Annual Report |
Table of Contents
as trading partners in other transactions. This may increase the risk of loss in the event of default or bankruptcy by the counterparty or if the counterparty otherwise fails to meet its contractual obligations. The Fund’s subadviser attempts to mitigate counterparty risk by (i) periodically assessing the creditworthiness of its trading partners, (ii) monitoring and/or limiting the amount of its net exposure to each individual counterparty based on its assessment and (iii) requiring collateral from the counterparty for certain transactions. Market events and changes in overall economic conditions may impact the assessment of such counterparty risk by the subadviser. In addition, declines in the values of underlying collateral received may expose the Fund to increased risk of loss.
With exchange traded and centrally cleared derivatives, there is less counterparty risk to the Fund since the exchange or clearinghouse, as counterparty to such instruments, guarantees against a possible default. The clearinghouse stands between the buyer and the seller of the contract; therefore, the credit risk is limited to failure of the clearinghouse. While offset rights may exist under applicable law, the Fund does not have a contractual right of offset against a clearing broker or clearinghouse in the event of a default of the clearing broker or clearinghouse.
The Fund has entered into master agreements, such as an International Swaps and Derivatives Association, Inc. Master Agreement (“ISDA Master Agreement”) or similar agreement, with certain of its derivative counterparties that govern over-the-counter derivatives and provide for general obligations, representations, agreements, collateral posting terms, netting provisions in the event of default or termination and credit related contingent features. The credit related contingent features include, but are not limited to, a percentage decrease in the Fund’s net assets or NAV over a specified period of time. If these credit related contingent features were triggered, the derivatives counterparty could terminate the positions and demand payment or require additional collateral.
Under an ISDA Master Agreement, the Fund may, under certain circumstances, offset with the counterparty certain derivative financial instruments’ payables and/or receivables with collateral held and/or posted and create one single net payment. However, absent an event of default by the counterparty or a termination of the agreement, the terms of the ISDA Master Agreements do not result in an offset of reported amounts of financial assets and financial liabilities in the Statement of Assets and Liabilities across transactions between the Fund and the applicable counterparty. The enforceability of the right to offset may vary by jurisdiction.
Collateral requirements differ by type of derivative. Collateral or margin requirements are set by the broker or exchange clearinghouse for exchange traded derivatives while collateral terms are contract specific for over-the-counter traded derivatives. Cash collateral that has been pledged to cover obligations of the Fund under derivative contracts, if any, will be reported separately in the Statement of Assets and Liabilities. Securities pledged as collateral, if any, for the same purpose are noted in the Schedule of Investments.
As of October 31, 2020, the Fund did not have any open OTC derivative transactions with credit related contingent features in a net liability position.
| ClearBridge Select Fund 2020 Annual Report | 35 |
Table of Contents
Notes to financial statements (cont’d)
(g) Security transactions and investment income. Security transactions are accounted for on a trade date basis. Interest income (including interest income from payment-in-kind securities), adjusted for amortization of premium and accretion of discount, is recorded on the accrual basis. Dividend income is recorded on the ex-dividend date for dividends received in cash and/or securities. Foreign dividend income is recorded on the ex-dividend date or as soon as practicable after the Fund determines the existence of a dividend declaration after exercising reasonable due diligence. The cost of investments sold is determined by use of the specific identification method. To the extent any issuer defaults or a credit event occurs that impacts the issuer, the Fund may halt any additional interest income accruals and consider the realizability of interest accrued up to the date of default or credit event.
(h) REIT distributions. The character of distributions received from Real Estate Investment Trusts (‘‘REITs’’) held by the Fund is generally comprised of net investment income, capital gains, and return of capital. It is the policy of the Fund to estimate the character of distributions received from underlying REITs based on historical data provided by the REITs. After each calendar year end, REITs report the actual tax character of these distributions. Differences between the estimated and actual amounts reported by the REITs are reflected in the Fund’s records in the year in which they are reported by the REITs by adjusting related investment cost basis, capital gains and income, as necessary.
(i) Distributions to shareholders. Distributions from net investment income and distributions of net realized gains, if any, are declared at least annually. Distributions to shareholders of the Fund are recorded on the ex-dividend date and are determined in accordance with income tax regulations, which may differ from GAAP.
(j) Share class accounting. Investment income, common expenses and realized/ unrealized gains (losses) on investments are allocated to the various classes of the Fund on the basis of daily net assets of each class. Fees relating to a specific class are charged directly to that share class.
(k) Compensating balance arrangements. The Fund has an arrangement with its custodian bank whereby a portion of the custodian’s fees is paid indirectly by credits earned on the Fund’s cash on deposit with the bank.
(l) Federal and other taxes. It is the Fund’s policy to comply with the federal income and excise tax requirements of the Internal Revenue Code of 1986 (the “Code”), as amended, applicable to regulated investment companies. Accordingly, the Fund intends to distribute its taxable income and net realized gains, if any, to shareholders in accordance with timing requirements imposed by the Code. Therefore, no federal or state income tax provision is required in the Fund’s financial statements.
Management has analyzed the Fund’s tax positions taken on income tax returns for all open tax years and has concluded that as of October 31, 2020, no provision for income tax is required in the Fund’s financial statements. The Fund’s federal and state income and federal excise tax returns for tax years for which the applicable statutes of limitations have not expired are subject to examination by the Internal Revenue Service and state departments of revenue.
| 36 | ClearBridge Select Fund 2020 Annual Report |
Table of Contents
(m) Reclassification. GAAP requires that certain components of net assets be reclassified to reflect permanent differences between financial and tax reporting. These reclassifications have no effect on net assets or net asset value per share. During the current year, the following reclassifications have been made:
| �� | Total Distributable Earnings (Loss) | Paid-in Capital | ||||||
| (a) | $ | 1,485,618 | $ | (1,485,618) | ||||
| (a) | Reclassifications are due to a tax net operating loss. |
2. Investment management agreement and other transactions with affiliates
Legg Mason Partners Fund Advisor, LLC (“LMPFA”) is the Fund’s investment manager and ClearBridge Investments, LLC (“ClearBridge”) is the Fund’s subadviser. Western Asset Management Company, LLC (“Western Asset”) manages the portion of the Fund’s cash and short-term instruments allocated to it. As of July 31, 2020, LMPFA, ClearBridge and Western Asset are indirect, wholly-owned subsidiaries of Franklin Resources, Inc. (“Franklin Resources”). Prior to July 31, 2020, LMPFA, ClearBridge and Western Asset were wholly-owned subsidiaries of Legg Mason, Inc. (“Legg Mason”). As of July 31, 2020, Legg Mason is a subsidiary of Franklin Resources.
Under the investment management agreement, the Fund pays an investment management fee, calculated daily and paid monthly, at an annual rate of 0.95% of the Fund’s average daily net assets.
LMPFA provides administrative and certain oversight services to the Fund. LMPFA delegates to the subadviser the day-to-day portfolio management of the Fund, except for the management of the portion of the Fund’s cash and short-term instruments allocated to Western Asset. For its services, LMPFA pays ClearBridge a fee monthly, at an annual rate equal to 70% of the net management fee it receives from the Fund. For Western Asset’s services to the Fund, LMPFA pays Western Asset monthly 0.02% of the portion of the Fund’s average daily net assets that are allocated to Western Asset by LMPFA.
As a result of expense limitation arrangements between the Fund and LMPFA, the ratio of total annual fund operating expenses, other than interest, brokerage, taxes, extraordinary expenses, expenses related to short sales and acquired fund fees and expenses, to average net assets of Class A, Class A2, Class C, Class FI, Class I and Class IS shares did not exceed 1.50%, 1.70%, 2.25%, 1.50%, 1.15% and 1.05%, respectively. In addition, the ratio of total annual fund operating expenses for Class IS shares did not exceed the ratio of total annual fund operating expenses for Class I shares. These expense limitation arrangements cannot be terminated prior to December 31, 2022 without the Board of Trustees’ consent. In addition, the manager has agreed to waive the Fund’s management fee to an extent sufficient to offset the net management fee payable in connection with any investment in an affiliated money market fund (the “affiliated money market fund waiver”). The affiliated money market fund waiver is not subject to the recapture provision discussed below.
| ClearBridge Select Fund 2020 Annual Report | 37 |
Table of Contents
Notes to financial statements (cont’d)
During the year ended October 31, 2020, fees waived and/or expenses reimbursed amounted to $10,220, which included an affiliated money market fund waiver of $4,909.
LMPFA is permitted to recapture amounts waived and/or reimbursed to a class during the same fiscal year if the class’ total annual fund operating expenses have fallen to a level below the expense limitation (“expense cap”) in effect at the time the fees were earned or the expenses incurred. In no case will LMPFA recapture any amount that would result, on any particular business day of the Fund, in the class’ total annual fund operating expenses exceeding the expense cap or any other lower limit then in effect.
As of July 31, 2020, Legg Mason Investor Services, LLC (“LMIS”) is an indirect, wholly-owned broker-dealer subsidiary of Franklin Resources and serves as the Fund’s sole and exclusive distributor. Prior to July 31, 2020, LMIS was a wholly-owned broker-dealer subsidiary of Legg Mason.
There is a maximum initial sales charge of 5.75% for Class A and Class A2 shares. There is a contingent deferred sales charge (“CDSC”) of 1.00% on Class C shares, which applies if redemption occurs within 12 months from purchase payment. In certain cases, Class A and Class A2 shares have a 1.00% CDSC, which applies if redemption occurs within 18 months from purchase payment. This CDSC only applies to those purchases of Class A and Class A2 shares, which, when combined with current holdings of other shares of funds sold by LMIS, equal or exceed $1,000,000 in the aggregate. These purchases do not incur an initial sales charge.
For the year ended October 31, 2020, sales charges retained by and CDSCs paid to LMIS and its affiliates, if any, were as follows:
| Class A | Class A2 | Class C | ||||||||||
| Sales charges | $ | 91,403 | $ | 524,561 | — | |||||||
| CDSCs | 708 | — | $ | 11,901 | ||||||||
As of July 31, 2020, all officers and one Trustee of the Trust are employees of Franklin Resources or its affiliates and do not receive compensation from the Trust. Prior to July 31, 2020, all officers and one Trustee of the Trust were employees of Legg Mason and did not receive compensation from the Trust.
3. Investments
During the year ended October 31, 2020, the aggregate cost of purchases and proceeds from sales of investments (excluding short-term investments) were as follows:
| Investments* | ||||
| Purchases | $ | 698,602,599 | ||
| Sales | 233,804,333 | |||
| * | Excluding securities sold short and covers on securities sold short in the amount of $19,216,793 and $28,363,105, respectively. |
| 38 | ClearBridge Select Fund 2020 Annual Report |
Table of Contents
At October 31, 2020, the aggregate cost of investments and the aggregate gross unrealized appreciation and depreciation of investments for federal income tax purposes were as follows:
| Cost/ Premiums Paid (Received) | Gross Unrealized Appreciation | Gross Unrealized | Net Unrealized | |||||||||||||
| Securities | $ | 1,086,600,118 | $ | 478,879,602 | $ | (33,692,294) | $ | 445,187,308 | ||||||||
| Written options | (1,006,285) | 560,812 | (13,458) | 547,354 | ||||||||||||
4. Derivative instruments and hedging activities
Below is a table, grouped by derivative type, that provides information about the fair value and the location of derivatives within the Statement of Assets and Liabilities at October 31, 2020.
| LIABILITY DERIVATIVES1 | ||||
Equity Risk | ||||
| Written options | $ | 458,931 | ||
| 1 | Generally, the balance sheet location for asset derivatives is receivables/net unrealized appreciation and for liability derivatives is payables/net unrealized depreciation. |
The following tables provide information about the effect of derivatives and hedging activities on the Fund’s Statement of Operations for the year ended October 31, 2020. The first table provides additional detail about the amounts and sources of gains (losses) realized on derivatives during the period. The second table provides additional information about the change in unrealized appreciation (depreciation) resulting from the Fund’s derivatives and hedging activities during the period.
| AMOUNT OF REALIZED GAIN (LOSS) ON DERIVATIVES RECOGNIZED | ||||
Equity Risk | ||||
| Purchased options1 | $ | (121,403) | ||
| Written options | 887,436 | |||
| Total | $ | 766,033 | ||
| 1 | Net realized gain (loss) from purchased options is reported in Net Realized Gain (Loss) From Investment transactions in the Statement of Operations. |
| CHANGE IN UNREALIZED APPRECIATION (DEPRECIATION) ON DERIVATIVES RECOGNIZED | ||||
Equity Risk | ||||
| Written options | $ | 515,760 | ||
| ClearBridge Select Fund 2020 Annual Report | 39 |
Table of Contents
Notes to financial statements (cont’d)
During the year ended October 31, 2020, the volume of derivative activity for the Fund was as follows:
| Average Market Value | ||||
| Purchased options† | $ | 1,844 | ||
| Written options | 80,905 | |||
| † | At October 31, 2020, there were no open positions held in this derivative. |
5. Class specific expenses, waivers and/or expense reimbursements
The Fund has adopted a Rule 12b-1 shareholder services and distribution plan and under that plan the Fund pays service and/or distribution fees with respect to its Class A, Class A2, Class C and Class FI shares calculated at the annual rate of 0.25%, 0.25%, 1.00% and 0.25% of the average daily net assets of each class, respectively. Service and/or distribution fees are accrued daily and paid monthly.
For the year ended October 31, 2020, class specific expenses were as follows:
| Service and/or Distribution Fees | Transfer Agent Fees | |||||||
| Class A | $ | 503,442 | † | $ | 263,184 | |||
| Class A2 | 362,997 | 323,384 | ||||||
| Class C | 407,553 | 43,456 | ||||||
| Class FI | 20,252 | 9,378 | ||||||
| Class I | — | 546,227 | ||||||
| Class IS | — | 5,447 | ||||||
| Total | $ | 1,294,244 | $ | 1,191,076 | ||||
| † | Amount shown is exclusive of expense reimbursements. For the year ended October 31, 2020, the service and/or distribution fees reimbursed amounted to $324 for Class A shares. |
For the year ended October 31, 2020, waivers and/or expense reimbursements by class were as follows:
| Waivers/Expense Reimbursements | ||||
| Class A | $ | 2,293 | ||
| Class A2 | 1,470 | |||
| Class C | 413 | |||
| Class FI | 58 | |||
| Class I | 5,199 | |||
| Class IS | 787 | |||
| Total | $ | 10,220 | ||
| 40 | ClearBridge Select Fund 2020 Annual Report |
Table of Contents
6. Distributions to shareholders by class
| Year Ended October 31, 2020 | Year Ended October 31, 2019 | |||||||
| Net Realized Gains: | ||||||||
| Class A | — | $ | 919,111 | |||||
| Class A2 | — | 171,566 | ||||||
| Class C | — | 76,156 | ||||||
| Class FI | — | 229,340 | ||||||
| Class I | — | 1,304,205 | ||||||
| Class IS | — | 51,992 | ||||||
| Total | — | $ | 2,752,370 | |||||
7. Shares of beneficial interest
At October 31, 2020, the Trust had an unlimited number of shares of beneficial interest authorized with a par value of $0.00001 per share. The Fund has the ability to issue multiple classes of shares. Each class of shares represents an identical interest and has the same rights, except that each class bears certain direct expenses, including those specifically related to the distribution of its shares.
Transactions in shares of each class were as follows:
| Year Ended October 31, 2020 | Year Ended October 31, 2019 | |||||||||||||||
| Shares | Amount | Shares | Amount | |||||||||||||
| Class A | ||||||||||||||||
| Shares sold | 3,843,755 | $ | 124,986,206 | 6,465,165 | $ | 162,909,285 | ||||||||||
| Shares issued on reinvestment | — | — | 38,287 | 904,106 | ||||||||||||
| Shares repurchased | (3,276,388) | (99,523,879) | (3,354,730) | (85,623,306) | ||||||||||||
| Net increase | 567,367 | $ | 25,462,327 | 3,148,722 | $ | 78,190,085 | ||||||||||
| Class A2 | ||||||||||||||||
| Shares sold | 4,117,982 | $ | 136,570,498 | 2,569,729 | $ | 66,437,743 | ||||||||||
| Shares issued on reinvestment | — | — | 7,259 | 171,566 | ||||||||||||
| Shares repurchased | (629,896) | (20,939,562) | (215,650) | (5,603,777) | ||||||||||||
| Net increase | 3,488,086 | $ | 115,630,936 | 2,361,338 | $ | 61,005,532 | ||||||||||
| Class C | ||||||||||||||||
| Shares sold | 726,158 | $ | 21,279,884 | 848,677 | $ | 20,935,475 | ||||||||||
| Shares issued on reinvestment | — | — | 3,325 | 75,218 | ||||||||||||
| Shares repurchased | (220,646) | (6,568,997) | (81,502) | (1,972,114) | ||||||||||||
| Net increase | 505,512 | $ | 14,710,887 | 770,500 | $ | 19,038,579 | ||||||||||
| Class FI | ||||||||||||||||
| Shares sold | 196,074 | $ | 6,470,506 | 565,306 | $ | 13,877,266 | ||||||||||
| Shares issued on reinvestment | — | — | 9,711 | 229,105 | ||||||||||||
| Shares repurchased | (444,152) | (14,152,747) | (918,630) | (23,980,201) | ||||||||||||
| Net decrease | (248,078) | $ | (7,682,241) | (343,613) | $ | (9,873,830) | ||||||||||
| ClearBridge Select Fund 2020 Annual Report | 41 |
Table of Contents
Notes to financial statements (cont’d)
| Year Ended October 31, 2020 | Year Ended October 31, 2019 | |||||||||||||||
| Shares | Amount | Shares | Amount | |||||||||||||
| Class I | ||||||||||||||||
| Shares sold | 14,422,526 | $ | 486,262,866 | 13,112,538 | $ | 344,145,905 | ||||||||||
| Shares issued on reinvestment | — | — | 52,868 | 1,279,683 | ||||||||||||
| Shares repurchased | (7,035,076) | (223,906,043) | (5,152,905) | (134,296,610) | ||||||||||||
| Net increase | 7,387,450 | $ | 262,356,823 | 8,012,501 | $ | 211,128,978 | ||||||||||
| Class IS | ||||||||||||||||
| Shares sold | 2,946,670 | $ | 108,619,719 | 1,797,253 | $ | 47,443,823 | ||||||||||
| Shares issued on reinvestment | — | — | 2,038 | 49,276 | ||||||||||||
| Shares repurchased | (613,377) | (20,693,098) | (230,362) | (6,238,278) | ||||||||||||
| Net increase | 2,333,293 | $ | 87,926,621 | 1,568,929 | $ | 41,254,821 | ||||||||||
8. Transactions with affiliated company
As defined by the 1940 Act, an affiliated company is one in which the Fund owns 5% or more of the outstanding voting securities, or a company which is under common ownership or control with the Fund. The following company was considered an affiliated company for all or some portion of the year ended October 31, 2020. The following transactions were effected in such company for the year ended October 31, 2020.
Affiliate 2019 | Purchased | Sold | ||||||||||||||||||
| Cost | Shares | Cost | Shares | |||||||||||||||||
| Western Asset Premier Institutional U.S. Treasury Reserves, Premium Shares | — | $ | 102,497,275 | 102,497,275 | $ | 90,584,446 | 90,584,446 | |||||||||||||
| (cont’d) | Realized Gain (Loss) | Interest Income | Net Increase (Decrease) in Unrealized Appreciation (Depreciation) | Affiliate Value at | ||||||||||||||||
| Western Asset Premier Institutional U.S. Treasury Reserves, Premium Shares | — | $ | 45,085 | — | $ | 11,912,829 | ||||||||||||||
9. Restricted securities
The following Fund investments are restricted as to resale and, in the absence of a readily ascertainable market value, are valued in good faith in accordance with procedures approved by the Board of Trustees.
| Security | Number of Shares | Acquisition Date | Cost | Fair Value at 10/31/2020 | Value Per Share | Percent of Net Assets | ||||||||||||||||||
| Brain Corp. | 413,158 | 4/20 | $ | 2,179,615 | $ | 2,247,580 | $ | 5.44 | 0.15 | % | ||||||||||||||
| 42 | ClearBridge Select Fund 2020 Annual Report |
Table of Contents
| Security | Number of Shares | Acquisition Date | Cost | Fair Value at 10/31/2020 | Value Per Share | Percent of Net Assets | ||||||||||||||||||
| Caris Life Sciences Inc. | 837,315 | 10/20 | $ | 2,310,989 | $ | 2,310,989 | $ | 2.76 | 0.15 | % | ||||||||||||||
| DataRobot Inc. | 279,847 | 10/20 | 3,677,749 | 3,677,741 | 13.14 | 0.24 | ||||||||||||||||||
| $ | 8,168,353 | $ | 8,236,310 | 0.54 | % | |||||||||||||||||||
10. Income tax information and distributions to shareholders
The tax character of distributions paid during the fiscal years ended October 31, was as follows:
| 2020 | 2019 | |||||||
| Distributions paid from: | ||||||||
| Ordinary income | — | $ | 1,412,819 | |||||
| Net long-term capital gains | — | 1,339,551 | ||||||
| Total distributions paid | — | $ | 2,752,370 | |||||
As of October 31, 2020, the components of distributable earnings (loss) on a tax basis were as follows:
| Deferred capital losses* | $ | (1,655,809) | ||
| Other book/tax temporary differences(a) | (7,871,688) | |||
| Unrealized appreciation (depreciation)(b) | 445,734,662 | |||
| Total distributable earnings (loss) — net | $ | 436,207,165 |
| * | These capital losses have been deferred in the current year as either short-term or long-term losses. The losses will be deemed to occur on the first day of the next taxable year in the same character as they were originally deferred and will be available to offset future taxable capital gains. |
| (a) | Other book/tax temporary differences are attributable to the tax deferral of losses on straddles, the deferral of certain late year losses for tax purposes and book/tax differences in the timing of the deductibility of various expenses. |
| (b) | The difference between book-basis and tax-basis unrealized appreciation (depreciation) is attributable to the tax deferral of losses on wash sales, the realization for tax purposes of unrealized gains on investments in foreign passive investment companies and the difference between the book and tax cost basis of investments in real estate investment trusts and partnerships. |
11. Other matter
The outbreak of the respiratory illness COVID-19 (commonly referred to as “coronavirus”) has continued to rapidly spread around the world, causing considerable uncertainty for the global economy and financial markets. The ultimate economic fallout from the pandemic, and the long-term impact on economies, markets, industries and individual issuers, are not known. The COVID-19 pandemic could adversely affect the value and liquidity of the Fund’s investments, impair the Fund’s ability to satisfy redemption requests, and negatively impact the Fund’s performance. In addition, the outbreak of COVID-19, and measures taken to mitigate its effects, could result in disruptions to the services provided to the Fund by its service providers.
| ClearBridge Select Fund 2020 Annual Report | 43 |
Table of Contents
Report of independent registered public accounting firm
To the Board of Trustees of Legg Mason Partners Equity Trust and Shareholders of ClearBridge Select Fund
Opinion on the Financial Statements
We have audited the accompanying statement of assets and liabilities, including the schedule of investments, of ClearBridge Select Fund (one of the funds constituting Legg Mason Partners Equity Trust, referred to hereafter as the “Fund”) as of October 31, 2020, the related statement of operations for the year ended October 31, 2020, the statement of changes in net assets for each of the two years in the period ended October 31, 2020, including the related notes, and the financial highlights for each of the periods ended October 31, 2020, October 31, 2019, October 31, 2018 and October 31, 2017 (collectively referred to as the “financial statements”). In our opinion, the financial statements present fairly, in all material respects, the financial position of the Fund as of October 31, 2020, the results of its operations for the year then ended, the changes in its net assets for each of the two years in the period ended October 31, 2020 and the financial highlights for each of the periods ended October 31, 2020, October 31, 2019, October 31, 2018 and October 31, 2017 in conformity with accounting principles generally accepted in the United States of America.
The financial statements of the Fund as of and for the year ended October 31, 2016 and the financial highlights for the year then ended (not presented herein, other than the financial highlights) were audited by other auditors whose report dated December 19, 2016 expressed an unqualified opinion on those financial statements and financial highlights.
Basis for Opinion
These financial statements are the responsibility of the Fund’s management. Our responsibility is to express an opinion on the Fund’s financial statements based on our audits. We are a public accounting firm registered with the Public Company Accounting Oversight Board (United States) (PCAOB) and are required to be independent with respect to the Fund in accordance with the U.S. federal securities laws and the applicable rules and regulations of the Securities and Exchange Commission and the PCAOB.
We conducted our audits of these financial statements in accordance with the standards of the PCAOB. Those standards require that we plan and perform the audit to obtain reasonable assurance about whether the financial statements are free of material misstatement, whether due to error or fraud.
Our audits included performing procedures to assess the risks of material misstatement of the financial statements, whether due to error or fraud, and performing procedures that respond to those risks. Such procedures included examining, on a test basis, evidence regarding the amounts and disclosures in the financial statements. Our audits also included evaluating the accounting principles used and significant estimates made by management, as well as evaluating the overall presentation of the financial statements. Our procedures included confirmation of securities owned as of October 31, 2020 by correspondence with the custodian and brokers; when replies were not received from brokers, we performed other auditing procedures. We believe that our audits provide a reasonable basis for our opinion.
/s/PricewaterhouseCoopers LLP
Baltimore, Maryland
December 17, 2020
We have served as the auditor of one or more investment companies in the Franklin Templeton Group of Funds since 1948.
| 44 | ClearBridge Select Fund 2020 Annual Report |
Table of Contents
Additional shareholder information (unaudited)
Results of special meeting of shareholders
On July 14, 2020 a special meeting of shareholders was held for the following purposes: 1) to approve a new management agreement between the Fund and its investment manager; and 2) to approve a new subadvisory agreement with respect to each of the Fund’s subadvisers. The following table provides the number of votes cast for or against, as well as the number of abstentions and broker non-votes as to each matter voted on at the special meeting of shareholders. Each item voted on was approved.
| Item Voted On | Voted For | Voted Against | Abstentions | Broker Non-Votes | ||||||||||||
| To Approve a New Management Agreement with Legg Mason Partners Fund Advisor, LLC | 313,212,690.186 | 5,425,724.741 | 22,374,039.786 | 0 | ||||||||||||
| To Approve a New Subadvisory Agreement with ClearBridge Investments, LLC | 313,252,562.178 | 5,425,781.580 | 22,334,110.954 | 0 | ||||||||||||
| To Approve a New Subadvisory Agreement with Western Asset Management Company, LLC | 311,872,925.186 | 5,972,879.327 | 23,166,650.199 | 0 | ||||||||||||
| ClearBridge Select Fund | 45 |
Table of Contents
Statement regarding liquidity risk management program (unaudited)
As required by law, the fund has adopted and implemented a liquidity risk management program (the “Program”) that is designed to assess and manage liquidity risk. Liquidity risk is the risk that the fund could not meet requests to redeem its shares without significant dilution of remaining investors’ interests in the fund. Legg Mason Partners Fund Advisor, LLC (the “Manager”), the fund’s manager, is the administrator of the Program. The Manager has established a liquidity risk management committee (the “Committee”) to administer the Program on a day-to-day basis.
The Committee, on behalf of the Manager, provided the fund’s Board of Trustees with a report that addressed the operation of the Program, assessed its adequacy and effectiveness of implementation, including, if applicable, the operation of any highly liquid investment minimum (“HLIM”), and described any material changes that had been made to the Program or were recommended (the “Report”). The Report covered the period from December 1, 2018 through December 31, 2019 (the “Reporting Period”).
The Report confirmed that there were no material changes to the Program during the Reporting Period and that no changes were recommended.
The Report also confirmed that, throughout the Reporting Period, the Committee had monitored the fund’s portfolio liquidity and liquidity risk on an ongoing basis, as described in the Program and in Board reporting throughout the Reporting Period.
The Report discussed the Committee’s annual review of the Program, which addressed, among other things, the following elements of the Program:
Assessment, Management, and Periodic Review of Liquidity Risk. The Committee reviewed the fund’s investment strategy and liquidity of portfolio investments during both normal and reasonably foreseeable stressed conditions. The Committee noted that the fund’s investment strategy continues to be appropriate for an open-end fund, taking into account, among other things, whether and to what extent the fund held less liquid and illiquid assets and the extent to which any such investments affected the fund’s ability to meet redemption requests. In managing and reviewing the fund’s liquidity risk, the Committee also considered the extent to which the fund’s investment strategy involves a relatively concentrated portfolio or large positions in particular issuers, the extent to which the fund uses borrowing for investment purposes, and the extent to which the fund uses derivatives (including for hedging purposes). The Committee also reviewed the fund’s short-term and long-term cash flow projections during both normal and reasonably foreseeable stressed conditions. In assessing the fund’s cash flow projections, the Committee considered, among other factors, historical net redemption activity, redemption policies, ownership concentration, distribution channels, and the degree of certainty associated with the fund’s short-term and long-term cash flow projections. The Committee also considered the fund’s holdings of cash and cash equivalents, as well as borrowing arrangements and other funding sources, including, if applicable, the fund’s participation in a credit facility, as components of the fund’s ability to meet redemption requests.
| 46 | ClearBridge Select Fund |
Table of Contents
Liquidity Classification. The Committee reviewed the Program’s liquidity classification methodology for categorizing the fund’s investments into one of four liquidity buckets. In reviewing the fund’s investments, the Committee considered, among other factors, whether trading varying portions of a position in a particular portfolio investment or asset class in sizes the fund would reasonably anticipate trading, would be reasonably expected to significantly affect liquidity.
Highly Liquid Investment Minimum. The Committee performed an analysis to determine whether the fund is required to maintain a Highly Liquid Investment Minimum, and determined that no such minimum is required because the fund primarily holds highly liquid investments.
Compliance with Limitation on Illiquid Investments. The Committee confirmed that during the Reporting Period, the fund did not acquire any illiquid investment such that, after the acquisition, the fund would have invested more than 15% of its assets in illiquid investments that are assets, in accordance with the Program and applicable SEC rules.
Redemptions in Kind. The Committee confirmed that no redemptions in-kind were effected by the fund during the Reporting Period.
The Report stated that the Committee concluded that the Program is reasonably designed and operated effectively to assess and manage the fund’s liquidity risk throughout the Reporting Period.
| ClearBridge Select Fund | 47 |
Table of Contents
Additional information (unaudited)
Information about Trustees and Officers
The business and affairs of ClearBridge Select Fund (the “Fund”) are conducted by management under the supervision and subject to the direction of its Board of Trustees. The business address of each Trustee is c/o Jane Trust, Legg Mason, 100 International Drive, 11th Floor, Baltimore, Maryland 21202. Information pertaining to the Trustees and officers of the Fund is set forth below.
The Statement of Additional Information includes additional information about Trustees and is available, without charge, upon request by calling the Fund at 1-877-721-1926.
| Independent Trustees† | ||
| Paul R. Ades | ||
| Year of birth | 1940 | |
| Position(s) with Trust | Trustee | |
| Term of office1 and length of time served2 | Since 1983 | |
| Principal occupation(s) during the past five years | Paul R. Ades, PLLC (law firm) (since 2000) | |
| Number of funds in fund complex overseen by Trustee | 49 | |
| Other board memberships held by Trustee during the past five years | None | |
| Andrew L. Breech | ||
| Year of birth | 1952 | |
| Position(s) with Trust | Trustee | |
| Term of office1 and length of time served2 | Since 1991 | |
| Principal occupation(s) during the past five years | President, Dealer Operating Control Service, Inc. (automotive retail management) (since 1985) | |
| Number of funds in fund complex overseen by Trustee | 49 | |
| Other board memberships held by Trustee during the past five years | None | |
| Dwight B. Crane | ||
| Year of birth | 1937 | |
| Position(s) with Trust | Trustee | |
| Term of office1 and length of time served2 | Since 1981 | |
| Principal occupation(s) during the past five years | Professor Emeritus, Harvard Business School (since 2007); formerly, Professor, Harvard Business School (1969 to 2007); Independent Consultant (since 1969) | |
| Number of funds in fund complex overseen by Trustee | 49 | |
| Other board memberships held by Trustee during the past five years | None | |
| 48 | ClearBridge Select Fund |
Table of Contents
| Independent Trustees† (cont’d) | ||
| Althea L. Duersten | ||
| Year of birth | 1951 | |
| Position(s) with Trust | Trustee | |
| Term of office1 and length of time served2 | Since 2014 | |
| Principal occupation(s) during the past five years | Retired (since 2011); formerly, Chief Investment Officer, North America, JPMorgan Chase (investment bank) and member of JPMorgan Executive Committee (2007 to 2011) | |
| Number of funds in fund complex overseen by Trustee | 49 | |
| Other board memberships held by Trustee during the past five years | Non-Executive Director, Rokos Capital Management LLP (since 2019) | |
| Stephen R. Gross | ||
| Year of birth | 1947 | |
| Position(s) with Trust | Trustee | |
| Term of office1 and length of time served2 | Since 1986 | |
| Principal occupation(s) during the past five years | Chairman Emeritus (since 2011) and formerly, Chairman, HLB Gross Collins, P.C. (accounting and consulting firm) (1979 to 2011); Executive Director of Business Builders Team, LLC (since 2005); Principal, Gross Consulting Group, LLC (since 2011); CEO, Gross Capital Partners, LLC (since 2014); CEO, Trusted CFO Solutions, LLC (since 2011) | |
| Number of funds in fund complex overseen by Trustee | 49 | |
| Other board memberships held by Trustee during the past five years | None | |
| Susan M. Heilbron | ||
| Year of birth | 1945 | |
| Position(s) with Trust | Trustee | |
| Term of office1 and length of time served2 | Since 1991 | |
| Principal occupation(s) during the past five years | Retired; formerly, President, Lacey & Heilbron (communications consulting) (1990 to 2002); General Counsel and Executive Vice President, The Trump Organization (1986 to 1990); Senior Vice President, New York State Urban Development Corporation (1984 to 1986); Associate, Cravath, Swaine & Moore LLP (1980 to 1984) and (1977 to 1979) | |
| Number of funds in fund complex overseen by Trustee | 49 | |
| Other board memberships held by Trustee during the past five years | Formerly, Director, Lincoln Savings Bank, FSB (1991 to 1994); Director, Trump Shuttle, Inc. (air transportation) (1989 to 1990); Director, Alexander’s Inc. (department store) (1987 to 1990) | |
| ClearBridge Select Fund | 49 |
Table of Contents
Additional information (unaudited) (cont’d)
Information about Trustees and Officers
| Independent Trustees† (cont’d) | ||
| Frank G. Hubbard | ||
| Year of birth | 1937 | |
| Position(s) with Trust | Trustee | |
| Term of office1 and length of time served2 | Since 1993 | |
| Principal occupation(s) during the past five years | President, Fealds, Inc. (business development) (since 2016); formerly, President, Avatar International Inc. (business development) (1998 to 2015) | |
| Number of funds in fund complex overseen by Trustee | 49 | |
| Other board memberships held by Trustee during the past five years | None | |
| Howard J. Johnson | ||
| Year of birth | 1938 | |
| Position(s) with Trust | Trustee and Chairman | |
| Term of office1 and length of time served2 | From 1981 to 1998 and since 2000 (Chairman since 2013) | |
| Principal occupation(s) during the past five years | Retired; formerly, Chief Executive Officer, Genesis Imaging LLC (technology company) (2003 to 2012) | |
| Number of funds in fund complex overseen by Trustee | 49 | |
| Other board memberships held by Trustee during the past five years | None | |
| Jerome H. Miller | ||
| Year of birth | 1938 | |
| Position(s) with Trust | Trustee | |
| Term of office1 and length of time served2 | Since 1995 | |
| Principal occupation(s) during the past five years | Retired; formerly, President, Shearson Lehman Asset Management (1991 to 1993), Vice Chairman, Shearson Lehman Hutton Inc. (1989 to 1992) and Senior Executive Vice President, E.F. Hutton Group Inc. (1986 to 1989) | |
| Number of funds in fund complex overseen by Trustee | 49 | |
| Other board memberships held by Trustee during the past five years | None | |
| Ken Miller | ||
| Year of birth | 1942 | |
| Position(s) with Trust | Trustee | |
| Term of office1 and length of time served2 | Since 1983 | |
| Principal occupation(s) during the past five years | Retired; formerly, President, Young Stuff Apparel Group, Inc. (apparel manufacturer), division of Li & Fung (1963 to 2012) | |
| Number of funds in fund complex overseen by Trustee | 49 | |
| Other board memberships held by Trustee during the past five years | None | |
| 50 | ClearBridge Select Fund |
Table of Contents
| Independent Trustees† (cont’d) | ||
| Thomas F. Schlafly | ||
| Year of birth | 1948 | |
| Position(s) with Trust | Trustee | |
| Term of office1 and length of time served2 | Since 1983 | |
| Principal occupation(s) during the past five years | Chairman, The Saint Louis Brewery, LLC (brewery) (since 2012); formerly, President, The Saint Louis Brewery, Inc. (1989 to 2012); Senior Counsel (since 2017) and formerly, Partner (2009 to 2016), Thompson Coburn LLP (law firm) | |
| Number of funds in fund complex overseen by Trustee | 49 | |
| Other board memberships held by Trustee during the past five years | Director, CNB St. Louis Bank (since 2006) | |
| Interested Trustee and Officer | ||
| Jane Trust, CFA3 | ||
| Year of birth | 1962 | |
| Position(s) with Trust | Trustee, President and Chief Executive Officer | |
| Term of office1 and length of time served2 | Since 2015 | |
| Principal occupation(s) during the past five years | Senior Vice President, Fund Board Management, Franklin Templeton (since 2020); Officer and/or Trustee/Director of 150 funds associated with Legg Mason Partners Fund Advisor, LLC (“LMPFA”) or its affiliates (since 2015); President and Chief Executive Officer of LMPFA (since 2015); formerly, Senior Managing Director (2018 to 2020) and Managing Director (2016 to 2018) of Legg Mason & Co., LLC (“Legg Mason & Co.”); Senior Vice President of LMPFA (2015) | |
| Number of funds in fund complex overseen by Trustee | 147 | |
| Other board memberships held by Trustee during the past five years | None | |
| Additional Officers | ||
| Ted P. Becker | ||
Legg Mason 620 Eighth Avenue, 47th Floor, New York, NY 10018 | ||
| Year of birth | 1951 | |
| Position(s) with Trust | Chief Compliance Officer | |
| Term of office1 and length of time served2 | Since 2007 | |
| Principal occupation(s) during the past five years | Vice President, Global Compliance of Franklin Templeton (since 2020); Chief Compliance Officer of LMPFA (since 2006); Chief Compliance Officer of certain funds associated with Legg Mason & Co. or its affiliates (since 2006); formerly, Director of Global Compliance at Legg Mason, Inc. (2006 to 2020); Managing Director of Compliance of Legg Mason & Co. (2005 to 2020) | |
| ClearBridge Select Fund | 51 |
Table of Contents
Additional information (unaudited) (cont’d)
Information about Trustees and Officers
| Additional Officers (cont’d) | ||
| Susan Kerr | ||
Legg Mason 620 Eighth Avenue, 47th Floor, New York, NY 10018 | ||
| Year of birth | 1949 | |
| Position(s) with Trust | Chief Anti-Money Laundering Compliance Officer | |
| Term of office1 and length of time served2 | Since 2013 | |
| Principal occupation(s) during the past five years | Senior Compliance Analyst, Franklin Templeton (since 2020); Chief Anti-Money Laundering Compliance Officer of certain funds associated with Legg Mason & Co. or its affiliates (since 2013) and Anti-Money Laundering Compliance Officer (since 2012), Senior Compliance Officer (since 2011) and Assistant Vice President (since 2010) of Legg Mason Investor Services, LLC (“LMIS”); formerly, Assistant Vice President of Legg Mason & Co. (2010 to 2020) | |
| Jenna Bailey | ||
Legg Mason 100 First Stamford Place, 5th Floor, Stamford, CT 06902 | ||
| Year of birth | 1978 | |
| Position(s) with Trust | Identity Theft Prevention Officer | |
| Term of office1 and length of time served2 | Since 2015 | |
| Principal occupation(s) during the past five years | Senior Compliance Analyst of Franklin Templeton (since 2020); Identity Theft Prevention Officer of certain funds associated with Legg Mason & Co. or its affiliates (since 2015); formerly, Compliance Officer of Legg Mason & Co. (2013 to 2020); Assistant Vice President of Legg Mason & Co. (2011 to 2020) | |
| Marc A. De Oliveira* | ||
Legg Mason 100 First Stamford Place, 6th Floor, Stamford, CT 06902 | ||
| Year of birth | 1971 | |
| Position(s) with Trust | Secretary and Chief Legal Officer | |
| Term of office1 and length of time served2 | Since 2020 | |
| Principal occupation(s) during the past five years | Associate General Counsel of Franklin Templeton (since 2020); Assistant Secretary of certain funds associated with Legg Mason & Co. or its affiliates (since 2006); formerly, Managing Director (2016 to 2020) and Associate General Counsel of Legg Mason & Co. (2005 to 2020) | |
| 52 | ClearBridge Select Fund |
Table of Contents
| Additional Officers (cont’d) | ||
| Thomas C. Mandia | ||
Legg Mason 100 First Stamford Place, 6th Floor, Stamford, CT 06902 | ||
| Year of birth | 1962 | |
| Position(s) with Trust | Senior Vice President | |
| Term of office1 and length of time served2 | Since 2020 | |
| Principal occupation(s) during the past five years | Senior Associate General Counsel of Franklin Templeton (since 2020); Secretary of LMPFA (since 2006); Assistant Secretary of certain funds associated with Legg Mason & Co. or its affiliates (since 2006); Secretary of LM Asset Services, LLC (“LMAS”) (since 2002) and Legg Mason Fund Asset Management, Inc. (“LMFAM”) (since 2013) (formerly registered investment advisers); formerly, Managing Director and Deputy General Counsel of Legg Mason & Co. (2005 to 2020) | |
| Christopher Berarducci | ||
Legg Mason 620 Eighth Avenue, 47th Floor, New York, NY 10018 | ||
| Year of birth | 1974 | |
| Position(s) with Trust | Treasurer and Principal Financial Officer | |
| Term of office1 and length of time served2 | Since 2014 and 2019 | |
| Principal occupation(s) during the past five years | Vice President, Fund Administration and Reporting, Franklin Templeton (since 2020); Treasurer (since 2010) and Principal Financial Officer (since 2019) of certain funds associated with Legg Mason & Co. or its affiliates; formerly, Managing Director (2020), Director (2015 to 2020), and Vice President (2011 to 2015) of Legg Mason & Co. | |
| Jeanne M. Kelly | ||
Legg Mason 620 Eighth Avenue, 47th Floor, New York, NY 10018 | ||
| Year of birth | 1951 | |
| Position(s) with Trust | Senior Vice President | |
| Term of office1 and length of time served2 | Since 2007 | |
| Principal occupation(s) during the past five years | U.S. Fund Board Team Manager, Franklin Templeton (since 2020); Senior Vice President of certain funds associated with Legg Mason & Co. or its affiliates (since 2007); Senior Vice President of LMPFA (since 2006); President and Chief Executive Officer of LMAS and LMFAM (since 2015); formerly, Managing Director of Legg Mason & Co. (2005 to 2020); Senior Vice President of LMFAM (2013 to 2015) | |
| † | Trustees who are not “interested persons” of the Fund within the meaning of Section 2(a)(19) of the Investment Company Act of 1940, as amended (the “1940 Act”). |
| * | Effective August 6, 2020, Mr. De Oliveira became Secretary and Chief Legal Officer. |
| 1 | Each Trustee and officer serves until his or her respective successor has been duly elected and qualified or until his or her earlier death, resignation, retirement or removal. |
| ClearBridge Select Fund | 53 |
Table of Contents
Additional information (unaudited) (cont’d)
Information about Trustees and Officers
| 2 | Indicates the earliest year in which the Trustee became a board member for a fund in the Legg Mason fund complex or the officer took such office. |
| 3 | Ms. Trust is an “interested person” of the Fund, as defined in the 1940 Act, because of her position with LMPFA and/or certain of its affiliates. |
| 54 | ClearBridge Select Fund |
Table of Contents
ClearBridge
Select Fund
Trustees
Paul R. Ades
Andrew L. Breech
Dwight B. Crane
Althea L. Duersten
Stephen R. Gross
Susan M. Heilbron
Frank G. Hubbard
Howard J. Johnson
Chairman
Jerome H. Miller
Ken Miller
Thomas F. Schlafly
Jane Trust
Investment manager
Legg Mason Partners Fund Advisor, LLC
Subadviser
ClearBridge Investments, LLC
Distributor
Legg Mason Investor Services, LLC
Custodian
The Bank of New York Mellon
Transfer agent
BNY Mellon Investment
Servicing (US) Inc.
4400 Computer Drive
Westborough, MA 01581
Independent registered public accounting firm
PricewaterhouseCoopers LLP
Baltimore, MD
ClearBridge Select Fund
The Fund is a separate investment series of Legg Mason Partners Equity Trust, a Maryland statutory trust.
ClearBridge Select Fund
Legg Mason Funds
620 Eighth Avenue, 47th Floor
New York, NY 10018
The Fund files its complete schedule of portfolio holdings with the Securities and Exchange Commission (“SEC”) for the first and third quarters of each fiscal year as an exhibit to its reports on Form N-PORT. The Fund’s Forms N-PORT are available on the SEC’s website at www.sec.gov. To obtain information on Form N-PORT, shareholders can call the Fund at 1-877-721-1926.
Information on how the Fund voted proxies relating to portfolio securities during the prior 12-month period ended June 30th of each year and a description of the policies and procedures that the Fund uses to determine how to vote proxies related to portfolio transactions are available (1) without charge, upon request, by calling the Fund at 1-877-721-1926, (2) at www.leggmason.com/mutualfunds and (3) on the SEC’s website at www.sec.gov.
This report is submitted for the general information of the shareholders of ClearBridge Select Fund. This report is not authorized for distribution to prospective investors in the Fund unless preceded or accompanied by a current prospectus.
Investors should consider the Fund’s investment objectives, risks, charges and expenses carefully before investing. The prospectus contains this and other important information about the Fund. Please read the prospectus carefully before investing.
www.leggmason.com
© 2020 Legg Mason Investor Services, LLC
Member FINRA, SIPC
Table of Contents
Legg Mason Funds Privacy and Security Notice
Your Privacy and the Security of Your Personal Information is Very Important to the Legg Mason Funds
This Privacy and Security Notice (the “Privacy Notice”) addresses the Legg Mason Funds’ privacy and data protection practices with respect to nonpublic personal information the Funds receive. The Legg Mason Funds include any funds sold by the Funds’ distributor, Legg Mason Investor Services, LLC, as well as Legg Mason-sponsored closed-end funds. The provisions of this Privacy Notice apply to your information both while you are a shareholder and after you are no longer invested with the Funds.
The Type of Nonpublic Personal Information the Funds Collect About You
The Funds collect and maintain nonpublic personal information about you in connection with your shareholder account. Such information may include, but is not limited to:
| • | Personal information included on applications or other forms; |
| • | Account balances, transactions, and mutual fund holdings and positions; |
| • | Bank account information, legal documents, and identity verification documentation; |
| • | Online account access user IDs, passwords, security challenge question responses; and |
| • | Information received from consumer reporting agencies regarding credit history and creditworthiness (such as the amount of an individual’s total debt, payment history, etc.). |
How the Funds Use Nonpublic Personal Information About You
The Funds do not sell or share your nonpublic personal information with third parties or with affiliates for their marketing purposes, or with other financial institutions or affiliates for joint marketing purposes, unless you have authorized the Funds to do so. The Funds do not disclose any nonpublic personal information about you except as may be required to perform transactions or services you have authorized or as permitted or required by law.
The Funds may disclose information about you to:
| • | Employees, agents, and affiliates on a “need to know” basis to enable the Funds to conduct ordinary business, or to comply with obligations to government regulators; |
| • | Service providers, including the Funds’ affiliates, who assist the Funds as part of the ordinary course of business (such as printing, mailing services, or processing or servicing your account with us) or otherwise perform services on the Funds’ behalf, including companies that may perform statistical analysis, market research and marketing services solely for the Funds; |
| • | Permit access to transfer, whether in the United States or countries outside of the United States to such Funds’ employees, agents and affiliates and service providers as required to enable the Funds to conduct ordinary business, or to comply with obligations to government regulators; |
| • | The Funds’ representatives such as legal counsel, accountants and auditors to enable the Funds to conduct ordinary business, or to comply with obligations to government regulators; |
| • | Fiduciaries or representatives acting on your behalf, such as an IRA custodian or trustee of a grantor trust. |
| NOT PART OF THE ANNUAL REPORT |
Table of Contents
Legg Mason Funds Privacy and Security Notice (cont’d)
Except as otherwise permitted by applicable law, companies acting on the Funds’ behalf, including those outside the United States, are contractually obligated to keep nonpublic personal information the Funds provide to them confidential and to use the information the Funds share only to provide the services the Funds ask them to perform. The Funds may disclose nonpublic personal information about you when necessary to enforce their rights or protect against fraud, or as permitted or required by applicable law, such as in connection with a law enforcement or regulatory request, subpoena, or similar legal process. In the event of a corporate action or in the event a Fund service provider changes, the Funds may be required to disclose your nonpublic personal information to third parties. While it is the Funds’ practice to obtain protections for disclosed information in these types of transactions, the Funds cannot guarantee their privacy policy will remain unchanged.
Keeping You Informed of the Funds’ Privacy and Security Practices
The Funds will notify you annually of their privacy policy as required by federal law. While the Funds reserve the right to modify this policy at any time they will notify you promptly if this privacy policy changes.
The Funds’ Security Practices
The Funds maintain appropriate physical, electronic and procedural safeguards designed to guard your nonpublic personal information. The Funds’ internal data security policies restrict access to your nonpublic personal information to authorized employees, who may use your nonpublic personal information for Fund business purposes only.
Although the Funds strive to protect your nonpublic personal information, they cannot ensure or warrant the security of any information you provide or transmit to them, and you do so at your own risk. In the event of a breach of the confidentiality or security of your nonpublic personal information, the Funds will attempt to notify you as necessary, so you can take appropriate protective steps. If you have consented to the Funds using electronic communications or electronic delivery of statements, they may notify you under such circumstances using the most current email address you have on record with them.
In order for the Funds to provide effective service to you, keeping your account information accurate is very important. If you believe that your account information is incomplete, not accurate or not current, if you have questions about the Funds’ privacy practices, or our use of your nonpublic personal information, write the Funds using the contact information on your account statements, email the Funds by clicking on the Contact Us section of the Funds’ website at www.leggmason.com, or contact the Fund at 1-877-721-1926.
Revised April 2018
Legg Mason California Consumer Privacy Act Policy
Although much of the personal information we collect is “nonpublic personal information” subject to federal law, residents of California may, in certain circumstances, have additional rights under the California Consumer Privacy Act (“CCPA”). For example, if you are a broker,
| NOT PART OF THE ANNUAL REPORT |
Table of Contents
Legg Mason Funds Privacy and Security Notice (cont’d)
dealer, agent, fiduciary, or representative acting by or on behalf of, or for, the account of any other person(s) or household, or a financial advisor, or if you have otherwise provided personal information to us separate from the relationship we have with personal investors, the provisions of this Privacy Policy apply to your personal information (as defined by the CCPA).
| • | In addition to the provisions of the Legg Mason Funds Security and Privacy Notice, you may have the right to know the categories and specific pieces of personal information we have collected about you. |
| • | You also have the right to request the deletion of the personal information collected or maintained by the Funds. |
If you wish to exercise any of the rights you have in respect of your personal information, you should advise the Funds by contacting them as set forth below. The rights noted above are subject to our other legal and regulatory obligations and any exemptions under the CCPA. You may designate an authorized agent to make a rights request on your behalf, subject to the identification process described below. We do not discriminate based on requests for information related to our use of your personal information, and you have the right not to receive discriminatory treatment related to the exercise of your privacy rights.
We may request information from you in order to verify your identity or authority in making such a request. If you have appointed an authorized agent to make a request on your behalf, or you are an authorized agent making such a request (such as a power of attorney or other written permission), this process may include providing a password/passcode, a copy of government issued identification, affidavit or other applicable documentation, i.e. written permission. We may require you to verify your identity directly even when using an authorized agent, unless a power of attorney has been provided. We reserve the right to deny a request submitted by an agent if suitable and appropriate proof is not provided.
For the 12-month period prior to the date of this Privacy Policy, the Legg Mason Funds have not sold any of your personal information; nor do we have any plans to do so in the future.
Contact Information
Address: Data Privacy Officer, 100 International Dr., Baltimore, MD 21202
Email: DataProtectionOfficer@franklintempleton.com
Phone: 1-800-396-4748
Revised October 2020
| NOT PART OF THE ANNUAL REPORT |
Table of Contents
www.leggmason.com
© 2020 Legg Mason Investor Services, LLC Member FINRA, SIPC
CBAX016046 12/20 SR20-4022
Table of Contents
| ITEM 2. | CODE OF ETHICS. |
The registrant has adopted a code of ethics that applies to the registrant’s principal executive officer, principal financial officer, principal accounting officer or controller.
| ITEM 3. | AUDIT COMMITTEE FINANCIAL EXPERT. |
The Board of Trustees of the registrant has determined that Dwight B. Crane possesses the technical attributes identified in Instruction 2(b) of Item 3 to Form N-CSR to qualify as an “audit committee financial expert,” and has designated Dwight B. Crane as the Audit Committee’s financial expert Dwight B. Crane is an “independent” Trustees pursuant to paragraph (a)(2) of Item 3 to Form N-CSR.
| ITEM 4. | PRINCIPAL ACCOUNTANT FEES AND SERVICES. |
a) Audit Fees. The aggregate fees billed in the last two fiscal years ending October 31, 2019 and October 31, 2020 (the “Reporting Periods”) for professional services rendered by the Registrant’s principal accountant (the “Auditor”) for the audit of the Registrant’s annual financial statements, or services that are normally provided by the Auditor in connection with the statutory and regulatory filings or engagements for the Reporting Periods, were $343,735 in October 31, 2019 and $325,110 in October 31, 2020.
b) Audit-Related Fees. The aggregate fees billed in the Reporting Period for assurance and related services by the Auditor that are reasonably related to the performance of the Registrant’s financial statements were $0 in October 31, 2019 and $0 in October 31, 2020.
(c) Tax Fees. The aggregate fees billed in the Reporting Periods for professional services rendered by the Auditor for tax compliance, tax advice and tax planning (“Tax Services”) were $0 in October 31, 2019 and $0 in October 31, 2020. These services consisted of (i) review or preparation of U.S. federal, state, local and excise tax returns; (ii) U.S. federal, state and local tax planning, advice and assistance regarding statutory, regulatory or administrative developments, and (iii) tax advice regarding tax qualification matters and/or treatment of various financial instruments held or proposed to be acquired or held.
There were no fees billed for tax services by the Auditors to service affiliates during the Reporting Periods that required pre-approval by the Audit Committee.
d) All Other Fees.
The aggregate fees billed in the Reporting Periods for products and services provided by the Auditor, other than the services reported in paragraphs (a) through (c) for the Item 4 for the Legg Mason Partners Equity Trust., were $0 in October 31, 2019 and $0 in October 31, 2020.
All Other Fees. There were no other non-audit services rendered by the Auditor to Legg Mason Partners Fund Advisors, LLC (“LMPFA”), and any entity controlling, controlled by or under common control with LMPFA that provided ongoing services to Legg Mason Partners Equity Trust requiring pre-approval by the Audit Committee in the Reporting Period.
(e) Audit Committee’s pre–approval policies and procedures described in paragraph (c) (7) of Rule 2-01 of Regulation S-X.
Table of Contents
(1) The Charter for the Audit Committee (the “Committee”) of the Board of each registered investment company (the “Fund”) advised by LMPFA or one of their affiliates (each, an “Adviser”) requires that the Committee shall approve (a) all audit and permissible non-audit services to be provided to the Fund and (b) all permissible non-audit services to be provided by the Fund’s independent auditors to the Adviser and any Covered Service Providers if the engagement relates directly to the operations and financial reporting of the Fund. The Committee may implement policies and procedures by which such services are approved other than by the full Committee.
The Committee shall not approve non-audit services that the Committee believes may impair the independence of the auditors. As of the date of the approval of this Audit Committee Charter, permissible non-audit services include any professional services (including tax services), that are not prohibited services as described below, provided to the Fund by the independent auditors, other than those provided to the Fund in connection with an audit or a review of the financial statements of the Fund. Permissible non-audit services may not include: (i) bookkeeping or other services related to the accounting records or financial statements of the Fund; (ii) financial information systems design and implementation; (iii) appraisal or valuation services, fairness opinions or contribution-in-kind reports; (iv) actuarial services; (v) internal audit outsourcing services; (vi) management functions or human resources; (vii) broker or dealer, investment adviser or investment banking services; (viii) legal services and expert services unrelated to the audit; and (ix) any other service the Public Company Accounting Oversight Board determines, by regulation, is impermissible.
Pre-approval by the Committee of any permissible non-audit services is not required so long as: (i) the aggregate amount of all such permissible non-audit services provided to the Fund, the Adviser and any service providers controlling, controlled by or under common control with the Adviser that provide ongoing services to the Fund (“Covered Service Providers”) constitutes not more than 5% of the total amount of revenues paid to the independent auditors during the fiscal year in which the permissible non-audit services are provided to (a) the Fund, (b) the Adviser and (c) any entity controlling, controlled by or under common control with the Adviser that provides ongoing services to the Fund during the fiscal year in which the services are provided that would have to be approved by the Committee; (ii) the permissible non-audit services were not recognized by the Fund at the time of the engagement to be non-audit services; and (iii) such services are promptly brought to the attention of the Committee and approved by the Committee (or its delegate(s)) prior to the completion of the audit.
(2) For the Legg Mason Partners Equity Trust, the percentage of fees that were approved by the audit committee, with respect to: Audit-Related Fees were 100% and 100% for October 31, 2019 and October 31, 2020; Tax Fees were 100% and 100% for October 31, 2019 and October 31, 2020; and Other Fees were 100% and 100% for October 31, 2019 and October 31, 2020.
(f) N/A
(g) Non-audit fees billed by the Auditor for services rendered to Legg Mason Partners Equity Trust, LMPFA and any entity controlling, controlled by, or under common control with LMPFA that provides ongoing services to Legg Mason Partners Equity Trust during the reporting period were $262,345 in October 31, 2019 and $857,833 in October 31, 2020.
Table of Contents
(h) Yes. Legg Mason Partners Equity Trust’s Audit Committee has considered whether the provision of non-audit services that were rendered to Service Affiliates, which were not pre-approved (not requiring pre-approval), is compatible with maintaining the Accountant’s independence. All services provided by the Auditor to the Legg Mason Partners Equity Trust or to Service Affiliates, which were required to be pre-approved, were pre-approved as required.
| ITEM 5. | AUDIT COMMITTEE OF LISTED REGISTRANTS. |
| a) | The independent board members are acting as the registrant’s audit committee as specified in Section 3(a)(58)(B) of the Exchange Act. The Audit Committee consists of the following Board members: |
Paul R. Ades
Andrew L. Breech
Dwight B. Crane
Althea L. Duersten
Stephen R. Gross
Susan M. Heilbron
Frank G. Hubbard
Howard J. Johnson
Jerome H. Miller
Ken Miller
Thomas F. Schlafly
| b) | Not applicable. |
| ITEM 6. | SCHEDULE OF INVESTMENTS. |
Included herein under Item 1.
| ITEM 7. | DISCLOSURE OF PROXY VOTING POLICIES AND PROCEDURES FOR CLOSED-END MANAGEMENT INVESTMENT COMPANIES. |
Not applicable.
| ITEM 8. | PORTFOLIO MANAGERS OF CLOSED-END MANAGEMENT INVESTMENT COMPANIES. |
Not applicable.
| ITEM 9. | PURCHASES OF EQUITY SECURITIES BY CLOSED-END MANAGEMENT INVESTMENT COMPANY AND AFFILIATED PURCHASERS. |
Not applicable.
| ITEM 10. | SUBMISSION OF MATTERS TO A VOTE OF SECURITY HOLDERS. |
Not applicable.
Table of Contents
| ITEM 11. | CONTROLS AND PROCEDURES. |
| (a) | The registrant’s principal executive officer and principal financial officer have concluded that the registrant’s disclosure controls and procedures (as defined in Rule 30a- 3(c) under the Investment Company Act of 1940, as amended (the “1940 Act”)) are effective as of a date within 90 days of the filing date of this report that includes the disclosure required by this paragraph, based on their evaluation of the disclosure controls and procedures required by Rule 30a-3(b) under the 1940 Act and 15d-15(b) under the Securities Exchange Act of 1934. |
| (b) | There were no changes in the registrant’s internal control over financial reporting (as defined in Rule 30a-3(d) under the 1940 Act) that occurred during the second fiscal quarter of the period covered by this report that have materially affected, or are likely to materially affect the registrant’s internal control over financial reporting. |
| ITEM 12. | DISCLOSURE OF SECURITIES LENDING ACTIVITIES FOR CLOSED-END MANAGEMENT INVESTMENT COMPANIES. |
Not applicable.
| ITEM 13. | EXHIBITS. |
(a) (1) Code of Ethics attached hereto.
Exhibit 99.CODE ETH
(a) (2) Certifications pursuant to section 302 of the Sarbanes-Oxley Act of 2002 attached hereto.
Exhibit 99.CERT
(b) Certifications pursuant to Section 906 of the Sarbanes-Oxley Act of 2002 attached hereto.
Exhibit 99.906CERT
Table of Contents
SIGNATURES
Pursuant to the requirements of the Securities Exchange Act of 1934 and the Investment Company Act of 1940, the registrant has duly caused this Report to be signed on its behalf by the undersigned, there unto duly authorized.
| Legg Mason Partners Equity Trust | ||
| By: | /s/ Jane Trust | |
| Jane Trust | ||
| Chief Executive Officer | ||
| Date: | December 22, 2020 | |
Pursuant to the requirements of the Securities Exchange Act of 1934 and the Investment Company Act of 1940, this report has been signed below by the following persons on behalf of the registrant and in the capacities and on the dates indicated.
| By: | /s/ Jane Trust | |
| Jane Trust | ||
| Chief Executive Officer | ||
| Date: | December 22, 2020 | |
| By: | /s/ Christopher Berarducci | |
| Christopher Berarducci | ||
| Principal Financial Officer | ||
| Date: | December 22, 2020 | |