UNITED STATES
SECURITIES AND EXCHANGE COMMISSION
Washington, D.C. 20549
FORM N-CSR
CERTIFIED SHAREHOLDER REPORT OF REGISTERED
MANAGEMENT INVESTMENT COMPANIES
Investment Company Act file number 811-06444
Legg Mason Partners Investment Trust
(Exact name of registrant as specified in charter)
620 Eighth Avenue, 47th Floor, New York, NY 10018
(Address of principal executive offices) (Zip code)
Marc A. De Oliveira
Franklin Templeton
100 First Stamford Place
Stamford, CT 06902
(Name and address of agent for service)
Registrant’s telephone number, including area code: 877-6LM-FUND/656-3863
Date of fiscal year end: January 31
Date of reporting period: January 31, 2023
| ITEM 1. | REPORT TO STOCKHOLDERS. |
The Annual Report to Stockholders is filed herewith.

Annual Report
| January 31, 2023 |
Franklin
Multi-Asset Allocation Funds
Franklin Multi-Asset Growth Fund
Franklin Multi-Asset Moderate Growth Fund
Franklin Multi-Asset Conservative Growth Fund
Franklin Multi-Asset Defensive Growth Fund
| INVESTMENT PRODUCTS: NOT FDIC INSURED • NO BANK GUARANTEE • MAY LOSE VALUE |
Franklin Multi-Asset Allocation Funds
Franklin Multi-Asset Allocation Funds consist of four separate investment funds, each with its own investment objective and policies. Each Fund is a “fund of funds”, investing in other mutual funds and exchange-traded funds (“ETFs”), and is managed as an asset allocation program.
Each Fund is a separate investment series of Legg Mason Partners Investment Trust, a Maryland statutory trust.

Dear Shareholder,
We are pleased to provide the annual report of Franklin Multi-Asset Allocation Funds for the twelve-month reporting period ended January 31, 2023. Please read on for a detailed look at prevailing economic and market conditions during the Funds’ reporting period and to learn how those conditions have affected each Fund’s performance.
As always, we remain committed to providing you with excellent service and a full spectrum of investment choices. We also remain committed to supplementing the support you receive from your financial advisor. One way we accomplish this is through our website, www.franklintempleton.com. Here you can gain immediate access to market and investment information, including:
| • | Fund prices and performance, |
| • | Market insights and commentaries from our portfolio managers, and |
| • | A host of educational resources. |
We look forward to helping you meet your financial goals.
Sincerely,

Jane Trust, CFA
President and Chief Executive Officer
February 28, 2023
| II | Franklin Multi-Asset Allocation Funds |
Franklin Multi-Asset Allocation Funds (the “Asset Allocation Funds”) consist of four portfolio investment options (the “Funds”), each of which is a “fund of funds” that invests in other mutual funds and exchange-traded funds (“ETFs”). The Asset Allocation Funds offer a mix of equity funds categorized according to average market capitalization (size), investing style (e.g., value, core or growth) and global exposure (e.g., U.S. and/or international stocks). The various options within the Asset Allocation Funds also offer a mix of bond asset classes, such as U.S. and foreign government debt, corporate bonds, high-yield debt and emerging market debt — each of which carries a varying degree of risk/reward potential. Each Fund is managed as an asset allocation program and seeks to achieve its investment objective by allocating its assets among mutual funds and ETFs managed by the Funds’ manager, Legg Mason Partners Fund Advisor, LLC (“Legg Mason”), and its affiliates, including other Legg Mason and Franklin Templeton investment managers, and ETFs managed by unaffiliated investment advisers (“underlying funds”). When selecting investments to fulfill a desired asset class exposure, the portfolio managers expect to allocate to Legg Mason and Franklin Templeton affiliated mutual funds and ETFs, provided that appropriate products are available.
Q. What were the overall market conditions during the Funds’ reporting period?
A. Global equities fell during the twelve-month reporting period ended January 31, 2023, including finishing 2022 with the worst annual loss since the 2008 global financial crisis. Throughout the period, markets were influenced by concerns about inflation, monetary policy tightening by many central banks, the Russia-Ukraine war, China’s COVID-19 policy and slowing corporate profits. For the first time in more than a decade, value-style equities performed better than growth-style equities.
Pressured by high inflation, tightening monetary policy and geopolitical instability, global equity markets declined in the first quarter of 2022. Rebounding consumer demand, alongside continued supply-chain disruptions, drove inflation to the highest levels in decades in many countries. Russia’s invasion of Ukraine and the subsequent sanctions on Russia further tested financial markets. Escalating geopolitical risks and monetary policy shifts combined to lift financial market volatility and suppress U.S. equity values during the period. It was the first losing quarter since the pandemic bear market in early 2020. The U.S. Federal Reserve Board (the “Fed”) adopted a more hawkish policy stance and raised the federal funds target rate for the first time since 2018. The U.S. Treasury (“UST”) yield curve shifted substantially higher. Gold prices rose for the quarter. Crude oil prices fluctuated widely day-to-day due to supply-and-demand concerns surrounding the war in Ukraine, a surge in COVID-19 cases in China and other events.
During the second quarter of 2022, investor concerns about persistently high inflation, tightening monetary policy, geopolitical instability and slower global economic growth pressured global financial markets. Record-high inflation in multiple countries — driven by consumer demand and continued supply-chain disruptions — prompted many central banks to raise interest rates. The Fed tightened its monetary policy aggressively, and the market reflected a growing concern that the Fed might push the country into a recession before price stability was restored. U.S. equities weathered broad-based losses as investors sold riskier assets. The UST yield curve flattened as yields on very short-term U.S. Treasuries rose more than yields on intermediate- and longer-term notes and bonds. Gold prices declined during the quarter. Crude oil prices rose during much of the quarter but pared gains as the Organization of Petroleum Exporting Countries (OPEC) plus key oil-exporting allies (together, OPEC+) raised output and as U.S. recession fears intensified.
Global equities rallied early in the third quarter of 2022 before falling sharply during the latter half of the period as investors worried that central bank policy tightening would weaken the global economy or lead to a recession. Inflationary pressures began to ease as the prices of many commodities declined; however, annual inflation rates remained near or at record highs in multiple regions. The U.S. equity market rallied before Fed rate hikes and hawkish rhetoric caused optimism to vanish. Risk-off sentiment across asset classes and elevated trading volatility dominated the rest of the period. Yields moved higher across the UST yield curve. The increases were most pronounced at shorter-term maturities, leaving the yield curve significantly inverted. Gold prices declined despite persistent inflation. Crude oil futures prices receded significantly as escalating fears of a global economic slowdown and a stronger U.S. dollar overshadowed concerns of tightness in oil supplies.
During the fourth quarter of 2022, global equities collectively advanced. However, as the period wound down, investor concerns about slower global economic growth returned, driven by the aggressive rate-hiking actions of many central banks during the year, and global equities retreated. Following a solid rebound in October and November as inflation data improved, the U.S. equity market pulled back broadly in December, leaving major indexes with their strongest quarterly performance of 2022 but their worst calendar-year performance since 2008. UST yields increased on the shorter and longer ends of the UST yield curve, but fell slightly in the middle, increasing the yield curve inversion. Gold spot prices began to recover in November and rose substantially over the quarter. The U.S. benchmark crude oil futures prices rose, while international benchmark Brent crude futures fell.
Global equities staged a strong rally in January 2023 and posted the best start to a year since 2019. Better-than-feared corporate earnings reports, stronger-than-expected economic data in certain regions and China’s economic reopening bolstered investor sentiment. Additionally, moderating inflation in several regions, notably in the U.S., the eurozone and the United Kingdom, led many investors to
| Franklin Multi-Asset Allocation Funds 2023 Annual Report | 1 |
Funds overview (cont’d)
expect a continued deceleration in their central banks’ policy tightening. Yields moved lower across much of the UST yield curve in January 2023, particularly in intermediate- to long-term maturities, and the yield curve remained inverted.
Q. How did we respond to these changing market conditions?
A. For all four Funds, we employ a tactical strategy, based on both quantitative and qualitative inputs, that over- and underweights certain allocations in the Funds in response to various market, economic and valuation conditions. These tactical views are updated on a monthly basis. At the beginning of the reporting period, we were tactically overweight equities versus fixed income, and we subsequently trimmed that position to neutral at the end of April in the face of a challenging inflation environment, slowing global growth and aggressive central bank policies. At the end of July, the Funds’ portfolios moved to underweight equities versus fixed income, as the market outlook continued to deteriorate, and fixed income yields started to become more attractive. We were strategically underweight high-yield and had a modest off-benchmark allocation to international fixed income.
Franklin Multi-Asset Growth Fund
The Fund seeks capital appreciation. The Fund organizes its investments in underlying funds into two main asset classes: the equity class (equity securities of all types) and the fixed income class (fixed income securities of all types). The portfolio managers may invest across all asset classes and strategies. Under normal market conditions, the portfolio managers will allocate between 70% to 100% of the Fund’s assets to underlying funds that invest in equity and equity-like strategies and between 0% to 30% of the Fund’s assets to underlying funds that invest in fixed income strategies. The portfolio managers may, however, allocate assets to any underlying funds in varying amounts in a manner consistent with the Fund’s investment objective. The Fund’s allocation to each asset class will be measured at the time of purchase and may vary thereafter as a result of market movements.
Performance review
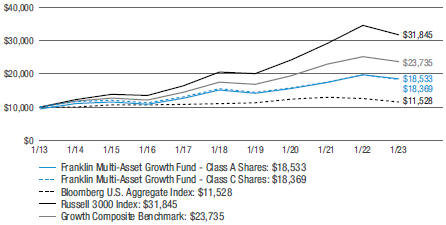
For the twelve months ended January 31, 2023, Class A shares of Franklin Multi-Asset Growth Fund, excluding sales charges, returned -6.19%. The Fund’s unmanaged benchmarks, the Bloomberg U.S. Aggregate Indexi, the Russell 3000 Indexii and the Growth Composite Benchmarkiii, returned -8.36%, -8.24% and -5.95%, respectively, for the same period. The Lipper Mixed-Asset Target Allocation Aggressive Growth Funds Category Averageiv returned -7.70% over the same time frame.
| Performance Snapshot as of January 31, 2023 (unaudited) | ||||||||
| (excluding sales charges) | 6 months | 12 months | ||||||
| Franklin Multi-Asset Growth Fund: | ||||||||
Class A | 2.05 | % | -6.19 | % | ||||
Class C | 1.69 | % | -6.90 | % | ||||
Class R | 1.92 | % | -6.45 | % | ||||
Class I | 2.11 | % | -5.94 | % | ||||
| Bloomberg U.S. Aggregate Index | -2.37 | % | -8.36 | % | ||||
| Russell 3000 Index | 0.06 | % | -8.24 | % | ||||
| Growth Composite Benchmark | 2.44 | % | -5.95 | % | ||||
| Lipper Mixed-Asset Target Allocation Aggressive Growth Funds Category Average | 2.30 | % | -7.70 | % | ||||
The performance shown represents past performance. Past performance is no guarantee of future results and current performance may be higher or lower than the performance shown above. Principal value and investment returns will fluctuate and investors’ shares, when redeemed, may be worth more or less than their original cost. To obtain performance data current to the most recent month-end, please visit our website at www.franklintempleton.com.
All share class returns assume the reinvestment of all distributions at net asset value and the deduction of all Fund expenses. Returns have not been adjusted to include sales charges that may apply or the deduction of taxes that a shareholder would pay on Fund distributions. If sales charges were reflected, the performance quoted would be lower. Performance figures for periods shorter than one year represent cumulative figures and are not annualized.
The portfolio managers periodically adjust the allocation of the Fund’s assets among different Legg Mason and Franklin Templeton affiliated mutual funds and ETFs and ETFs that are managed by unaffiliated investment advisers depending upon the portfolio managers’ outlook for the equity and bond markets in general, particular sectors of such markets and the performance outlook for the underlying funds. In assessing the equity and bond markets, the portfolio managers consider a broad range of market and economic trends and quantitative factors.
| 2 | Franklin Multi-Asset Allocation Funds 2023 Annual Report |
| Total Annual Operating Expenses (unaudited) |
As of the Fund’s current prospectus dated May 31, 2022, the gross total annual fund operating expense ratios for Class A, Class C, Class R and Class I shares were 1.27%, 1.99%, 2.11% and 1.00%, respectively.
Actual expenses may be higher. For example, expenses may be higher than those shown if average net assets decrease. Net assets are more likely to decrease and Fund expense ratios are more likely to increase when markets are volatile.
As a result of expense limitation arrangements, the ratio of total annual fund operating expenses, other than interest, brokerage, taxes, extraordinary expenses and acquired fund fees and expenses, to average net assets will not exceed 0.80% for Class A shares, 1.55% for Class C shares, 0.80% for Class R shares and 0.25% for Class I shares. Total annual fund operating expenses after waiving fees and/or reimbursing expenses exceed the expense limitation (“expense cap”) for each class as a result of acquired fund fees and expenses. These expense limitation arrangements cannot be terminated prior to December 31, 2024 without the Board of Trustees’ consent.
The manager is permitted to recapture amounts waived and/or reimbursed to a class during the same fiscal year if the class’ total annual fund operating expenses have fallen to a level below the expense cap in effect at the time the fees were earned, or the expenses incurred. In no case will the manager recapture any amount that would result, on any particular business day of the Fund, in the class’ total annual fund operating expenses exceeding the expense cap or any other lower limit then in effect.
| Franklin Multi-Asset Allocation Funds 2023 Annual Report | 3 |
Funds overview (cont’d)
Franklin Multi-Asset Moderate Growth Fund
The Fund seeks long-term growth of capital. The Fund organizes its investments in underlying funds into two main asset classes: the equity class (equity securities of all types) and the fixed income class (fixed income securities of all types). The portfolio managers may invest across all asset classes and strategies. Under normal market conditions, the portfolio managers will allocate between 55% to 85% of the Fund’s assets to underlying funds that invest in equity and equity-like strategies and between 15% to 45% of the Fund’s assets to underlying funds that invest in fixed income strategies. The portfolio managers may, however, allocate Fund assets to any underlying funds in varying amounts in a manner consistent with the Fund’s investment objective. The Fund’s allocation to each asset class will be measured at the time of purchase and may vary thereafter as a result of market movements.
Performance review
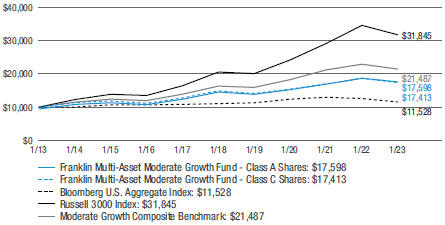
For the twelve months ended January 31, 2023, Class A shares of Franklin Multi-Asset Moderate Growth Fund, excluding sales charges, returned -5.99%. The Fund’s unmanaged benchmarks, the Bloomberg U.S. Aggregate Index, the Russell 3000 Index and the Moderate Growth Composite Benchmarkv, returned -8.36%, -8.24% and -6.37%, respectively, for the same period. The Lipper Mixed-Asset Target Allocation Growth Funds Category Averagevi returned -6.82% over the same time frame.
| Performance Snapshot as of January 31, 2023 (unaudited) | ||||||||
| (excluding sales charges) | 6 months | 12 months | ||||||
| Franklin Multi-Asset Moderate Growth Fund: | ||||||||
Class A | 1.64 | % | -5.99 | % | ||||
Class C | 1.29 | % | -6.70 | % | ||||
Class R | 1.46 | % | -6.34 | % | ||||
Class I | 1.86 | % | -5.68 | % | ||||
| Bloomberg U.S. Aggregate Index | -2.37 | % | -8.36 | % | ||||
| Russell 3000 Index | 0.06 | % | -8.24 | % | ||||
| Moderate Growth Composite Benchmark | 1.49 | % | -6.37 | % | ||||
| Lipper Mixed-Asset Target Allocation Growth Funds Category Average | 1.40 | % | -6.82 | % | ||||
The performance shown represents past performance. Past performance is no guarantee of future results and current performance may be higher or lower than the performance shown above. Principal value and investment returns will fluctuate and investors’ shares, when redeemed, may be worth more or less than their original cost. To obtain performance data current to the most recent month-end, please visit our website at www.franklintempleton.com.
All share class returns assume the reinvestment of all distributions at net asset value and the deduction of all Fund expenses. Returns have not been adjusted to include sales charges that may apply or the deduction of taxes that a shareholder would pay on Fund distributions. If sales charges were reflected, the performance quoted would be lower. Performance figures for periods shorter than one year represent cumulative figures and are not annualized.
Fund performance figures reflect fee waivers and/or expense reimbursements, without which the performance would have been lower.
The portfolio managers periodically adjust the allocation of the Fund’s assets among different Legg Mason and Franklin Templeton affiliated mutual funds and ETFs and ETFs that are managed by unaffiliated investment advisers depending upon the portfolio managers’ outlook for the equity and bond markets in general, particular sectors of such markets and the performance outlook for the underlying funds. In assessing the equity and bond markets, the portfolio managers consider a broad range of market and economic trends and quantitative factors.
| Total Annual Operating Expenses (unaudited) |
As of the Fund’s current prospectus dated May 31, 2022, the gross total annual fund operating expense ratios for Class A, Class C, Class R and Class I shares were 1.22%, 1.96%, 1.94% and 0.92%, respectively.
Actual expenses may be higher. For example, expenses may be higher than those shown if average net assets decrease. Net assets are more likely to decrease and Fund expense ratios are more likely to increase when markets are volatile.
As a result of expense limitation arrangements, the ratio of total annual fund operating expenses, other than interest, brokerage, taxes, extraordinary expenses and acquired fund fees and expenses, to average net assets will not exceed 0.80% for Class A shares, 1.55% for Class C shares, 0.80% for Class R shares and 0.25% for Class I shares. Total annual fund operating expenses after waiving fees and/or reimbursing expenses exceed the expense limitation (“expense cap”) for each class as a result of acquired fund fees and expenses. These expense limitation arrangements cannot be terminated prior to December 31, 2024 without the Board of Trustees’ consent.
| 4 | Franklin Multi-Asset Allocation Funds 2023 Annual Report |
The manager is permitted to recapture amounts waived and/or reimbursed to a class during the same fiscal year if the class’ total annual fund operating expenses have fallen to a level below the expense cap in effect at the time the fees were earned or the expenses incurred. In no case will the manager recapture any amount that would result, on any particular business day of the Fund, in the class’ total annual fund operating expenses exceeding the expense cap or any other lower limit then in effect.
| Franklin Multi-Asset Allocation Funds 2023 Annual Report | 5 |
Funds overview (cont’d)
Franklin Multi-Asset Conservative Growth Fund
The Fund seeks balance of growth of capital and income. The Fund organizes its investments in underlying funds into two main asset classes: the equity class (equity securities of all types) and the fixed income class (fixed income securities of all types). The portfolio managers may invest across all asset classes and strategies. Under normal market conditions, the portfolio managers will allocate between 35% to 65% of the Fund’s assets to underlying funds that invest in equity and equity-like strategies and between 35% to 65% of the Fund’s assets to underlying funds that invest in fixed income strategies. The portfolio managers may, however, allocate Fund assets to any underlying funds in varying amounts in a manner consistent with the Fund’s investment objective. The Fund’s allocation to each asset class will be measured at the time of purchase and may vary thereafter as a result of market movements.
Performance review
For the twelve months ended January 31, 2023, Class A shares of Franklin Multi-Asset Conservative Growth Fund, excluding sales charges, returned -6.63%. The Fund’s unmanaged benchmarks, the Bloomberg U.S. Aggregate Index, the Russell 1000 Indexvii and the Conservative Growth Composite Benchmarkviii, returned-8.36%-8.55% and-6.67%, respectively, for the same period. The Lipper Mixed-Asset Target Allocation Moderate Funds Category Averageix returned-6.67% over the same time frame.
| Performance Snapshot as of January 31, 2023 (unaudited) | ||||||||
| (excluding sales charges) | 6 months | 12 months | ||||||
| Franklin Multi-Asset Conservative Growth Fund: | ||||||||
Class A | 0.81 | % | -6.63 | % | ||||
Class C | 0.48 | % | -7.39 | % | ||||
Class R | 0.65 | % | -6.93 | % | ||||
Class I | 0.98 | % | -6.32 | % | ||||
| Bloomberg U.S. Aggregate Index | -2.37 | % | -8.36 | % | ||||
| Russell 1000 Index | -0.14 | % | -8.55 | % | ||||
| Conservative Growth Composite Benchmark | 0.57 | % | -6.67 | % | ||||
| Lipper Mixed-Asset Target Allocation Moderate Funds Category Average | 0.96 | % | -6.67 | % | ||||
The performance shown represents past performance. Past performance is no guarantee of future results and current performance may be higher or lower than the performance shown above. Principal value and investment returns will fluctuate and investors’ shares, when redeemed, may be worth more or less than their original cost. To obtain performance data current to the most recent month-end, please visit our website at www.franklintempleton.com.
All share class returns assume the reinvestment of all distributions at net asset value and the deduction of all Fund expenses. Returns have not been adjusted to include sales charges that may apply or the deduction of taxes that a shareholder would pay on Fund distributions. If sales charges were reflected, the performance quoted would be lower. Performance figures for periods shorter than one year represent cumulative figures and are not annualized.
Fund performance figures reflect fee waivers and/or expense reimbursements, without which the performance would have been lower.
The portfolio managers periodically adjust the allocation of the Fund’s assets among different Legg Mason and Franklin Templeton affiliated mutual funds and ETFs and ETFs that are managed by unaffiliated investment advisers depending upon the portfolio managers’ outlook for the equity and bond markets in general, particular sectors of such markets and the performance outlook for the underlying funds. In assessing the equity and bond markets, the portfolio managers consider a broad range of market and economic trends and quantitative factors.
| Total Annual Operating Expenses (unaudited) |
As of the Fund’s current prospectus dated May 31, 2022, the gross total annual fund operating expense ratios for Class A, Class C, Class R and Class I shares were 1.17%, 1.93%, 2.32% and 0.88%, respectively.
Actual expenses may be higher. For example, expenses may be higher than those shown if average net assets decrease. Net assets are more likely to decrease and Fund expense ratios are more likely to increase when markets are volatile.
As a result of expense limitation arrangements, the ratio of total annual fund operating expenses, other than interest, brokerage, taxes, extraordinary expenses and acquired fund fees and expenses, to average net assets will not exceed 0.80% for Class A shares, 1.55% for Class C shares, 0.80% for Class R shares and 0.25% for Class I shares. Total annual fund operating expenses after waiving fees and/or reimbursing expenses exceed the expense limitation (“expense cap”) for each class as a result of acquired fund fees and expenses. These expense limitation arrangements cannot be terminated prior to December 31, 2024 without the Board of Trustees’ consent.
| 6 | Franklin Multi-Asset Allocation Funds 2023 Annual Report |
The manager is permitted to recapture amounts waived and/or reimbursed to a class during the same fiscal year if the class’ total annual fund operating expenses have fallen to a level below the expense cap in effect at the time the fees were earned or the expenses incurred. In no case will the manager recapture any amount that would result, on any particular business day of the Fund, in the class’ total annual fund operating expenses exceeding the expense cap or any other lower limit then in effect.
| Franklin Multi-Asset Allocation Funds 2023 Annual Report | 7 |
Funds overview (cont’d)
Franklin Multi-Asset Defensive Growth Fund
The Fund seeks income as a primary objective and long-term growth of capital as a secondary objective. The Fund organizes its investments in underlying funds into two main asset classes: the equity class (equity securities of all types) and the fixed income class (fixed income securities of all types). The portfolio managers may invest across all asset classes and strategies. Under normal market conditions, the portfolio managers will allocate between 15% to 45% of the Fund’s assets to underlying funds that invest in equity and equity-like strategies and between 55% to 85% of the Fund’s assets to underlying funds that invest in fixed income strategies. The portfolio managers may, however, allocate Fund assets to any underlying funds in varying amounts in a manner consistent with the Fund’s investment objective. The Fund’s allocation to each asset class will be measured at the time of purchase and may vary thereafter as a result of market movements.
Performance review
For the twelve months ended January 31, 2023, Class A shares of Franklin Multi-Asset Defensive Growth Fund, excluding sales charges, returned -7.63%. The Fund’s unmanaged benchmarks, the Bloomberg U.S. Aggregate Index, the Russell 1000 Index and the Defensive Growth Composite Benchmarkx, returned -8.36%, -8.55% and -7.09%, respectively, for the same period. The Lipper Mixed-Asset Target Allocation Conservative Funds Category Averagexi returned -7.01% over the same time frame.
| Performance Snapshot as of January 31, 2023 (unaudited) | ||||||||
| (excluding sales charges) | 6 months | 12 months | ||||||
| Franklin Multi-Asset Defensive Growth Fund: | ||||||||
Class A | -0.09 | % | -7.63 | % | ||||
Class C | -0.44 | % | -8.34 | % | ||||
Class C11 | -1.46 | % | -9.21 | % | ||||
Class R | -0.09 | % | -7.77 | % | ||||
Class I | 0.08 | % | -7.35 | % | ||||
| Bloomberg U.S. Aggregate Index | -2.37 | % | -8.36 | % | ||||
| Russell 1000 Index | -0.14 | % | -8.55 | % | ||||
| Defensive Growth Composite Benchmark | -0.35 | % | -7.09 | % | ||||
| Lipper Mixed-Asset Target Allocation Conservative Funds Category Average | 0.01 | % | -7.01 | % | ||||
The performance shown represents past performance. Past performance is no guarantee of future results and current performance may be higher or lower than the performance shown above. Principal value and investment returns will fluctuate and investors’ shares, when redeemed, may be worth more or less than their original cost. To obtain performance data current to the most recent month-end, please visit our website at www.franklintempleton.com.
All share class returns assume the reinvestment of all distributions at net asset value and the deduction of all Fund expenses. Returns have not been adjusted to include sales charges that may apply or the deduction of taxes that a shareholder would pay on Fund distributions. If sales charges were reflected, the performance quoted would be lower. Performance figures for periods shorter than one year represent cumulative figures and are not annualized.
Fund performance figures reflect fee waivers and/or expense reimbursements, without which the performance would have been lower.
The portfolio managers periodically adjust the allocation of the Fund’s assets among different Legg Mason and Franklin Templeton affiliated mutual funds and ETFs and ETFs that are managed by unaffiliated investment advisers depending upon the portfolio managers’ outlook for the equity and bond markets in general, particular sectors of such markets and the performance outlook for the underlying funds. In assessing the equity and bond markets, the portfolio managers consider a broad range of market and economic trends and quantitative factors.
| Total Annual Operating Expenses (unaudited) |
As of the Fund’s current prospectus dated May 31, 2022, the gross total annual fund operating expense ratios for Class A, Class C, Class C1, Class R and Class I shares were 1.20%, 1.97%, 2.21%, 2.00% and 0.94%, respectively.
Actual expenses may be higher. For example, expenses may be higher than those shown if average net assets decrease. Net assets are more likely to decrease and Fund expense ratios are more likely to increase when markets are volatile.
| 1 | Class C1 shares are not available for purchase by new or existing investors (except for certain retirement plan programs authorized by the Fund’s distributor). Class C1 shares continue to be available for dividend reinvestment and incoming exchanges, if any. |
| 8 | Franklin Multi-Asset Allocation Funds 2023 Annual Report |
As a result of expense limitation arrangements, the ratio of total annual fund operating expenses, other than interest, brokerage, taxes, extraordinary expenses and acquired fund fees and expenses, to average net assets will not exceed 0.80% for Class A shares, 1.55% for Class C shares, 1.25% for Class C1 shares, 0.80% for Class R shares and 0.25% for Class I shares. Total annual fund operating expenses after waiving fees and/or reimbursing expenses exceed the expense limitation (“expense cap”) for each class as a result of acquired fund fees and expenses. These expense limitation arrangements cannot be terminated prior to December 31, 2024 without the Board of Trustees’ consent.
The manager is permitted to recapture amounts waived and/or reimbursed to a class during the same fiscal year if the class’ total annual fund operating expenses have fallen to a level below the expense cap in effect at the time the fees were earned or the expenses incurred. In no case will the manager recapture any amount that would result, on any particular business day of the Fund, in the class’ total annual fund operating expenses exceeding the expense cap or any other lower limit then in effect.
Q. What were the leading contributors to performance?
A. Taking into account the underlying fund returns and their weightings within the Funds’ portfolios, the top contributor to absolute performance came from international fixed income and equities, with returns less negative than their U.S. counterparts. An allocation to market neutral within the alternatives asset class was also a contributor.
Asset allocation was a strong contributor to relative performance, specifically an allocation to market neutral within alternatives, an overweight to international equities and an underweight to U.S. fixed income. Sub-asset class selection – specifically value funds within U.S. large cap equities – was a major contributor to relative performance.
Relative to their specific benchmarks, the leading contributors at the manager level were Franklin Global Dividend Fund, BrandywineGLOBAL—Dynamic US Large Cap Value Fund and the BrandywineGLOBAL—Global Opportunities Bond Fund (USD Hedged).
Q. What were the leading detractors from performance?
A. The leading detractors from absolute performance for the reporting period were U.S. fixed income, and the exposure to growth equity strategies within U.S. equities space. From an asset allocation perspective, an underweight to U.S. small cap equities was a detractor from relative return. From a sub-asset class perspective, dividend-paying and emerging market strategies in the international equity allocation were also detractors.
At the underlying manager level and relative to their specific benchmarks, the leading detractors were ClearBridge Large Cap Growth Fund, Western Asset Core Plus Bond Fund and Martin Currie Emerging Markets Fund.
Q. Were there any significant changes to the Funds during the reporting period?
A. Beginning in March 2022, we began incorporating the fundamental and quantitative asset allocation views developed by Franklin Templeton Investment Solutions in our tactical views. We believe the addition of fundamental views to our tactical asset allocation process provides for more robust and nimble tactical positioning to meet investors objectives and goals.
In June 2022, the Funds’ portfolios underwent their annual strategic asset allocation update, when allocation weights are re-established. At that time, we implemented an increase in our target equity allocations. Historically, our target equity allocations have been at the low end of the category range for each Fund (i.e., 50% for the 50-70% category). Over the longer term, this has put us at a disadvantage compared to peers as the median manager’s allocations are closer to the middle of each category range (i.e., 60% for 50-70% category, etc.). To align ourselves more competitively with peer managers, we implemented a 10% shift in our target equity allocations accordingly.
Also in June 2022, changes were made to the underlying managers (with six removed and two added) to improve overall diversification and efficiencies.
Thank you for your investment in the Franklin Multi-Asset Allocation Funds. As always, we appreciate that you have chosen us to manage your assets and we remain focused on achieving the Funds’ investment goals.
Sincerely,
Franklin Advisers, Inc.
February 14, 2023
RISKS: Equity securities are subject to market and price fluctuations. Fixed income securities are subject to interest rate, credit, inflation, and reinvestment risks. International investments are subject to certain risks of overseas investing including currency fluctuations, social, economic and political uncertainties, which could increase volatility; these risks are heightened for investments in emerging markets. Emerging market countries tend to have economic, political and legal systems that are less developed and are less stable than those of more developed countries. Investments in small- and mid- capitalization companies may involve a higher degree of risk and volatility than an investment in larger, more established
| Franklin Multi-Asset Allocation Funds 2023 Annual Report | 9 |
Funds overview (cont’d)
companies. As interest rates rise, the value of fixed income securities falls. High yield (“junk”) bonds are lower-rated issues and possess greater price volatility, illiquidity, and possibility of default than higher-rated, investment grade bonds.
Each Fund is a fund of funds – it invests primarily in other funds – and is subject to the risks of the underlying funds in which it invests. There are additional risks and other expenses associated with investing in other mutual funds and ETFs, rather than directly in portfolio securities. In addition to the Funds operating expenses, shareholders will indirectly bear the operating expenses of the underlying funds in which each Fund invests. The Funds pay brokerage commissions in connection with the purchase and sale of shares of ETFs. In addition, each Fund indirectly bears its pro rata share of the fees and expenses incurred by the underlying funds it invests in, including management fees and other expenses. These expenses are in addition to the expenses that each Fund bears directly in connection with its own operation. Certain underlying funds may use derivatives, such as options and futures, which can be illiquid, may disproportionately increase losses and have a potentially large impact on Fund performance. Also, the portfolio managers may invest in underlying funds that have a limited performance history.
Because these Funds have exposure to both stocks and bonds through the underlying funds in which they invest, the Funds may underperform stock funds when stocks are in favor and underperform bond funds when bonds are in favor. Each underlying fund may engage in active and frequent trading, resulting in higher portfolio turnover and transaction costs. This may lead to the distribution of higher capital gains to shareholders, increasing their tax liability. Certain of the underlying funds may sell securities short. Unlike the possible loss on a security that is purchased, there is no limit on the amount of loss on an appreciating security that is sold short. The market values of securities or other assets will fluctuate, sometimes sharply and unpredictably, due to changes in general market conditions, overall economic trends or events, governmental actions or intervention, actions taken by the U.S. Federal Reserve or foreign central banks, market disruptions caused by trade disputes or other factors, political developments, armed conflicts, economic sanctions and countermeasures in response to sanctions, major cybersecurity events, investor sentiment, the global and domestic effects of a pandemic, and other factors that may or may not be related to the issuer of the security or other asset. Please see each Fund’s prospectus for a more complete discussion of these and other risks and the Funds’ investment strategies.
All investments are subject to risk including the possible loss of principal. Past performance is no guarantee of future results. All index performance reflects no deduction for fees, expenses or taxes. Please note that an investor cannot invest directly in an index.
The information provided is not intended to be a forecast of future events, a guarantee of future results or investment advice. Views expressed may differ from those of the firm as a whole.
| 10 | Franklin Multi-Asset Allocation Funds 2023 Annual Report |
| i | The Bloomberg U.S. Aggregate Index is a broad-based bond index comprised of government, corporate, mortgage- and asset-backed issues, rated investment grade or higher, and having at least one year to maturity. |
| ii | The Russell 3000 Index measures the performance of the 3,000 largest U.S. companies based on total market capitalization, which represents approximately 98% of the U.S. equity market. |
| iii | The Growth Composite Benchmark is a hypothetical representation of the performance of the Fund’s major asset classes. It consists of 45% Russell 1000 Index, 20% Russell 2000 Index, 20% MSCI EAFE Index, 10% Bloomberg U.S. Aggregate Index and 5% Bloomberg U.S. Corporate High Yield — 2% Issuer Cap Index. The Russell 1000 Index measures the performance of the large-cap segment of the U.S. equity universe. It is a subset of the Russell 3000 Index and includes approximately 1,000 of the largest securities based on a combination of their market cap and current index membership. The Russell 1000 represents approximately 92% of the U.S. market. The Russell 2000 Index measures the performance of the small-cap segment of the U.S. equity universe. The Russell 2000 is a subset of the Russell 3000 Index representing approximately 10% of the total market capitalization of that index. It includes approximately 2,000 of the smallest securities based on a combination of their market cap and current index membership. The MSCI EAFE Index is a free float adjusted market capitalization index designed to measure developed market equity performance, excluding the U.S. and Canada. The Bloomberg U.S. Corporate High Yield — 2% Issuer Cap Index is an index of the 2% Issuer Cap component of the Bloomberg U.S. Corporate High Yield Index, which covers the U.S. dollar-denominated, non-investment grade, fixed-rate, taxable corporate bond market. |
| iv | Lipper, Inc., a wholly-owned subsidiary of Refinitiv, provides independent insight on global collective investments. Returns are based on the period ended January 31, 2023, including the reinvestment of all distributions, including returns of capital, if any, calculated among the 156 funds for the six-month period and among the 152 funds for the twelve-month period in the Fund’s Lipper category, and excluding sales charges, if any. |
| v | The Moderate Growth Composite Benchmark is a hypothetical representation of the performance of the Fund’s major asset classes. It consists of 40% Russell 1000 Index, 15% Russell 2000 Index, 15% MSCI EAFE Index, 25% Bloomberg U.S. Aggregate Index and 5% Bloomberg U.S. Corporate High Yield — 2% Issuer Cap Index. |
| vi | Lipper, Inc., a wholly-owned subsidiary of Refinitiv, provides independent insight on global collective investments. Returns are based on the period ended January 31, 2023, including the reinvestment of all distributions, including returns of capital, if any, calculated among the 480 funds for the six-month period and among the 468 funds for the twelve-month period in the Fund’s Lipper category, and excluding sales charges, if any. |
| vii | The Russell 1000 Index measures the performance of the large-cap segment of the U.S. equity universe. It is a subset of the Russell 3000 Index and includes approximately 1,000 of the largest securities based on a combination of their market cap and current index membership. The Russell 1000 represents approximately 92% of the U.S. market. |
| viii | The Conservative Growth Composite Benchmark is a hypothetical representation of the performance of the Fund’s major asset classes. It consists of 28% Russell 1000 Index, 12% Russell 2000 Index, 10% MSCI EAFE Index, 43% Bloomberg U.S. Aggregate Index and 7% Bloomberg U.S. Corporate High Yield — 2% Issuer Cap Index. |
| ix | Lipper, Inc., a wholly-owned subsidiary of Refinitiv, provides independent insight on global collective investments. Returns are based on the period ended January 31, 2023, including the reinvestment of all distributions, including returns of capital, if any, calculated among the 595 funds for the six-month period and among the 591 funds for the twelve-month period in the Fund’s Lipper category, and excluding sales charges, if any. |
| x | The Defensive Growth Composite Benchmark is a hypothetical representation of the performance of the Fund’s major asset classes. It consists of 17% Russell 1000 Index, 7% Russell 2000 Index, 6% MSCI EAFE Index, 60% Bloomberg U.S. Aggregate Index and 10% Bloomberg U.S. Corporate High Yield — 2% Issuer Cap Index. |
| xi | Lipper, Inc., a wholly-owned subsidiary of Refinitiv, provides independent insight on global collective investments. Returns are based on the period ended January 31, 2023, including the reinvestment of all distributions, including returns of capital, if any, calculated among the 324 funds for the six-month period and among the 321 funds for the twelve-month period in the Fund’s Lipper category, and excluding sales charges, if any. |
| Franklin Multi-Asset Allocation Funds 2023 Annual Report | 11 |
Franklin Multi-Asset Growth Fund Investment Breakdown† (%) as a percent of total investments
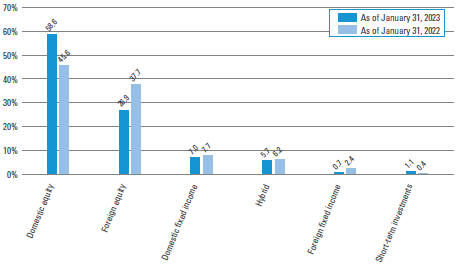
| † | The bar graph above represents the composition of the Fund’s investments as of January 31, 2023 and January 31, 2022. The Fund is actively managed. As a result, the composition of the Fund’s investments is subject to change at any time. |
| 12 | Franklin Multi-Asset Allocation Funds 2023 Annual Report |
Franklin Multi-Asset Moderate Growth Fund Investment Breakdown† (%) as a percent of total investments
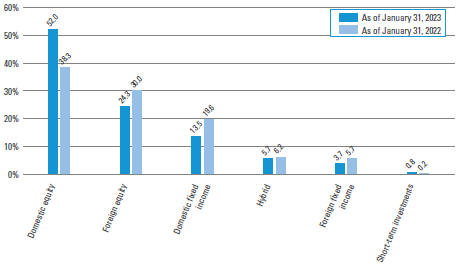
| † | The bar graph above represents the composition of the Fund’s investments as of January 31, 2023 and January 31, 2022. The Fund is actively managed. As a result, the composition of the Fund’s investments is subject to change at any time. |
| Franklin Multi-Asset Allocation Funds 2023 Annual Report | 13 |
Funds at a glance (unaudited) (cont’d)
Franklin Multi-Asset Conservative Growth Fund Investment Breakdown† (%) as a percent of total investments
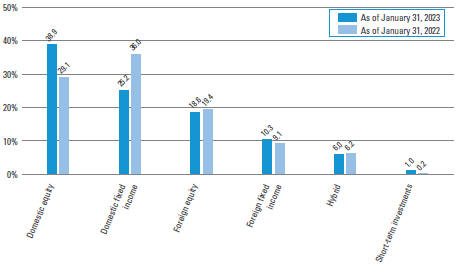
| † | The bar graph above represents the composition of the Fund’s investments as of January 31, 2023 and January 31, 2022. The Fund is actively managed. As a result, the composition of the Fund’s investments is subject to change at any time. |
| 14 | Franklin Multi-Asset Allocation Funds 2023 Annual Report |
Franklin Multi-Asset Defensive Growth Fund Investment Breakdown† (%) as a percent of total investments
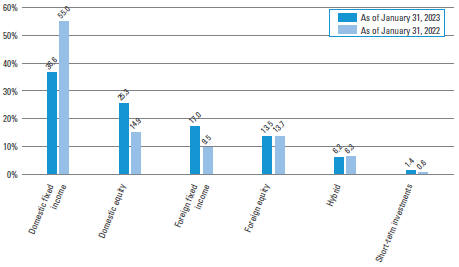
| † | The bar graph above represents the composition of the Fund’s investments as of January 31, 2023 and January 31, 2022. The Fund is actively managed. As a result, the composition of the Fund’s investments is subject to change at any time. |
| Franklin Multi-Asset Allocation Funds 2023 Annual Report | 15 |
Example
As a shareholder of the Fund, you may incur two types of costs: (1) transaction costs, including front-end and back-end sales charges (loads) on purchase payments; and (2) ongoing costs, including management fees; service and/or distribution (12b-1) fees; and other Fund expenses. This example is intended to help you understand your ongoing costs (in dollars) of investing in the Fund and to compare these costs with the ongoing costs of investing in other mutual funds.
This example is based on an investment of $1,000 invested on August 1, 2022 and held for the six months ended January 31, 2023.
Actual expenses
The table below titled “Based on actual total return” provides information about actual account values and actual expenses. You may use the information provided in this table, together with the amount you invested, to estimate the expenses that you paid over the period. To estimate the expenses you paid on your account, divide your ending account value by $1,000 (for example, an $8,600 ending account value divided by $1,000 = 8.6), then multiply the result by the number under the heading entitled “Expenses Paid During the Period”.
Hypothetical example for comparison purposes
The table below titled “Based on hypothetical total return” providesinformationabouthypotheticalaccountvaluesandhypothetical expenses based on the actual expense ratio and an assumed rate of return of 5.00% per year before expenses, which is not the Fund’s actual return. The hypothetical account values and expenses may not be used to estimate the actual ending account balance or expenses you paid for the period. You may use the information provided in this table to compare the ongoing costs of investing in the Fund and other funds. To do so, compare the 5.00% hypothetical example relating to the Fund with the 5.00% hypothetical examples that appear in the shareholder reports of the other funds.
Please note that the expenses shown in the table below are meant to highlight your ongoing costs only and do not reflect any transactional costs, such as front-end or back-end sales charges (loads). Therefore, the table is useful in comparing ongoing costs only, and will not help you determine the relative total costs of owning different funds. In addition, if these transaction costs were included, your costs would have been higher.
| Based on actual total return1 | Based on hypothetical total return1 | |||||||||||||||||||||||||||||||||||||||||||||
Franklin Multi-Asset Growth Fund | Actual Total Return Without Sales Charge2 | Beginning Account Value | Ending Account Value | Annualized Expense Ratio3 | Expenses Paid During the Period4 | Franklin Multi-Asset Growth Fund | Hypothetical Annualized Total Return | Beginning Account Value | Ending Account Value | Annualized Expense Ratio3 | Expenses Paid During the Period4 | |||||||||||||||||||||||||||||||||||
| Class A | 2.05 | % | $ | 1,000.00 | $ | 1,020.50 | 0.45 | % | $ | 2.29 | Class A | 5.00 | % | $ | 1,000.00 | $ | 1,022.94 | 0.45 | % | $ | 2.29 | |||||||||||||||||||||||||
| Class C | 1.69 | 1,000.00 | 1,016.90 | 1.14 | 5.80 | Class C | 5.00 | 1,000.00 | 1,019.46 | 1.14 | 5.80 | |||||||||||||||||||||||||||||||||||
| Class R | 1.92 | 1,000.00 | 1,019.20 | 0.74 | 3.77 | Class R | 5.00 | 1,000.00 | 1,021.48 | 0.74 | 3.77 | |||||||||||||||||||||||||||||||||||
| Class I | 2.11 | 1,000.00 | 1,021.10 | 0.14 | 0.71 | Class I | 5.00 | 1,000.00 | 1,024.50 | 0.14 | 0.71 | |||||||||||||||||||||||||||||||||||
| 1 | For the six months ended January 31, 2023. |
| 2 | Assumes the reinvestment of all distributions, including returns of capital, if any, at net asset value and does not reflect the deduction of the applicable sales charge with respect to Class A shares or the applicable contingent deferred sales charge (“CDSC”) with respect to Class C shares. Total return is not annualized, as it may not be representative of the total return for the year. Performance figures may reflect compensating balance arrangements, fee waivers and/or expense reimbursements. In the absence of compensating balance arrangements, fee waivers and/or expense reimbursements, the total return would have been lower. Past performance is no guarantee of future results. |
| 3 | Does not include fees and expenses of the Underlying Funds in which the Fund invests. |
| 4 | Expenses (net of compensating balance arrangements, fee waivers and/or expense reimbursements) are equal to each class’ respective annualized expense ratio multiplied by the average account value over the period, multiplied by the number of days in the most recent fiscal half-year (184), then divided by 365. |
| 16 | Franklin Multi-Asset Allocation Funds 2023 Annual Report |
Example
As a shareholder of the Fund, you may incur two types of costs: (1) transaction costs, including front-end and back-end sales charges (loads) on purchase payments; and (2) ongoing costs, including management fees; service and/or distribution (12b-1) fees; and other Fund expenses. This example is intended to help you understand your ongoing costs (in dollars) of investing in the Fund and to compare these costs with the ongoing costs of investing in other mutual funds.
This example is based on an investment of $1,000 invested on August 1, 2022 and held for the six months ended January 31, 2023.
Actual expenses
The table below titled “Based on actual total return” provides information about actual account values and actual expenses. You may use the information provided in this table, together with the amount you invested, to estimate the expenses that you paid over the period. To estimate the expenses you paid on your account, divide your ending account value by $1,000 (for example, an $8,600 ending account value divided by $1,000 = 8.6), then multiply the result by the number under the heading entitled “Expenses Paid During the Period”.
Hypothetical example for comparison purposes
The table below titled “Based on hypothetical total return” providesinformationabouthypotheticalaccountvaluesandhypothetical expenses based on the actual expense ratio and an assumed rate of return of 5.00% per year before expenses, which is not the Fund’s actual return. The hypothetical account values and expenses may not be used to estimate the actual ending account balance or expenses you paid for the period. You may use the information provided in this table to compare the ongoing costs of investing in the Fund and other funds. To do so, compare the 5.00% hypothetical example relating to the Fund with the 5.00% hypothetical examples that appear in the shareholder reports of the other funds.
Please note that the expenses shown in the table below are meant to highlight your ongoing costs only and do not reflect any transactional costs, such as front-end or back-end sales charges (loads). Therefore, the table is useful in comparing ongoing costs only, and will not help you determine the relative total costs of owning different funds. In addition, if these transaction costs were included, your costs would have been higher.
| Based on actual total return1 | Based on hypothetical total return1 | |||||||||||||||||||||||||||||||||||||||||||||
Franklin Multi-Asset Moderate Growth Fund | Actual Total Return Without Sales Charge2 | Beginning Account Value | Ending Account Value | Annualized Expense Ratio3 | Expenses Paid During the Period4 | Franklin Multi-Asset Moderate Growth Fund | Hypothetical Annualized Total Return | Beginning Account Value | Ending Account Value | Annualized Expense Ratio3 | Expenses Paid During the Period4 | |||||||||||||||||||||||||||||||||||
| Class A | 1.64 | % | $ | 1,000.00 | $ | 1,016.40 | 0.46 | % | $ | 2.34 | Class A | 5.00 | % | $ | 1,000.00 | $ | 1,022.89 | 0.46 | % | $ | 2.35 | |||||||||||||||||||||||||
| Class C | 1.29 | 1,000.00 | 1,012.90 | 1.17 | 5.94 | Class C | 5.00 | 1,000.00 | 1,019.31 | 1.17 | 5.96 | |||||||||||||||||||||||||||||||||||
| Class R | 1.46 | 1,000.00 | 1,014.60 | 0.80 | 4.06 | Class R | 5.00 | 1,000.00 | 1,021.17 | 0.80 | 4.08 | |||||||||||||||||||||||||||||||||||
| Class I | 1.86 | 1,000.00 | 1,018.60 | 0.11 | 0.56 | Class I | 5.00 | 1,000.00 | 1,024.65 | 0.11 | 0.56 | |||||||||||||||||||||||||||||||||||
| 1 | For the six months ended January 31, 2023. |
| 2 | Assumes the reinvestment of all distributions, including returns of capital, if any, at net asset value and does not reflect the deduction of the applicable sales charge with respect to Class A shares or the applicable contingent deferred sales charge (“CDSC”) with respect to Class C shares. Total return is not annualized, as it may not be representative of the total return for the year. Performance figures may reflect compensating balance arrangements, fee waivers and/or expense reimbursements. In the absence of compensating balance arrangements, fee waivers and/or expense reimbursements, the total return would have been lower. Past performance is no guarantee of future results. |
| 3 | Does not include fees and expenses of the Underlying Funds in which the Fund invests. |
| 4 | Expenses (net of compensating balance arrangements, fee waivers and/or expense reimbursements) are equal to each class’ respective annualized expense ratio multiplied by the average account value over the period, multiplied by the number of days in the most recent fiscal half-year (184), then divided by 365. |
| Franklin Multi-Asset Allocation Funds 2023 Annual Report | 17 |
Funds expenses (unaudited) (cont’d)
Example
As a shareholder of the Fund, you may incur two types of costs: (1) transaction costs, including front-end and back-end sales charges (loads) on purchase payments; and (2) ongoing costs, including management fees; service and/or distribution (12b-1) fees; and other Fund expenses. This example is intended to help you understand your ongoing costs (in dollars) of investing in the Fund and to compare these costs with the ongoing costs of investing in other mutual funds.
This example is based on an investment of $1,000 invested on August 1, 2022 and held for the six months ended January 31, 2023.
Actual expenses
The table below titled “Based on actual total return” provides information about actual account values and actual expenses. You may use the information provided in this table, together with the amount you invested, to estimate the expenses that you paid over the period. To estimate the expenses you paid on your account, divide your ending account value by $1,000 (for example, an $8,600 ending account value divided by $1,000 = 8.6), then multiply the result by the number under the heading entitled “Expenses Paid During the Period”.
Hypothetical example for comparison purposes
The table below titled “Based on hypothetical total return” providesinformationabouthypotheticalaccountvaluesandhypothetical expenses based on the actual expense ratio and an assumed rate of return of 5.00% per year before expenses, which is not the Fund’s actual return. The hypothetical account values and expenses may not be used to estimate the actual ending account balance or expenses you paid for the period. You may use the information provided in this table to compare the ongoing costs of investing in the Fund and other funds. To do so, compare the 5.00% hypothetical example relating to the Fund with the 5.00% hypothetical examples that appear in the shareholder reports of the other funds.
Please note that the expenses shown in the table below are meant to highlight your ongoing costs only and do not reflect any transactional costs, such as front-end or back-end sales charges (loads). Therefore, the table is useful in comparing ongoing costs only, and will not help you determine the relative total costs of owning different funds. In addition, if these transaction costs were included, your costs would have been higher.
| Based on actual total return1 | Based on hypothetical total return1 | |||||||||||||||||||||||||||||||||||||||||||||
Franklin Multi-Asset Conservative Growth Fund | Actual Total Return Without Sales Charge2 | Beginning Account Value | Ending Account Value | Annualized Expense Ratio3 | Expenses Paid During the Period4 | Franklin Multi-Asset Conservative Growth Fund | Hypothetical Annualized Total Return | Beginning Account Value | Ending Account Value | Annualized Expense Ratio3 | Expenses Paid During the Period4 | |||||||||||||||||||||||||||||||||||
| Class A | 0.81 | % | $ | 1,000.00 | $ | 1,008.10 | 0.47 | % | $ | 2.38 | Class A | 5.00 | % | $ | 1,000.00 | $ | 1,022.84 | 0.47 | % | $ | 2.40 | |||||||||||||||||||||||||
| Class C | 0.48 | 1,000.00 | 1,004.80 | 1.21 | 6.11 | Class C | 5.00 | 1,000.00 | 1,019.11 | 1.21 | 6.16 | |||||||||||||||||||||||||||||||||||
| Class R | 0.65 | 1,000.00 | 1,006.50 | 0.80 | 4.05 | Class R | 5.00 | 1,000.00 | 1,021.17 | 0.80 | 4.08 | |||||||||||||||||||||||||||||||||||
| Class I | 0.98 | 1,000.00 | 1,009.80 | 0.16 | 0.81 | Class I | 5.00 | 1,000.00 | 1,024.40 | 0.16 | 0.82 | |||||||||||||||||||||||||||||||||||
| 1 | For the six months ended January 31, 2023. |
| 2 | Assumes the reinvestment of all distributions, including returns of capital, if any, at net asset value and does not reflect the deduction of the applicable sales charge with respect to Class A shares or the applicable contingent deferred sales charge (“CDSC”) with respect to Class C shares. Total return is not annualized, as it may not be representative of the total return for the year. Performance figures may reflect compensating balance arrangements, fee waivers and/or expense reimbursements. In the absence of compensating balance arrangements, fee waivers and/or expense reimbursements, the total return would have been lower. Past performance is no guarantee of future results. |
| 3 | Does not include fees and expenses of the Underlying Funds in which the Fund invests. |
| 4 | Expenses (net of compensating balance arrangements, fee waivers and/or expense reimbursements) are equal to each class’ respective annualized expense ratio multiplied by the average account value over the period, multiplied by the number of days in the most recent fiscal half-year (184), then divided by 365. |
| 18 | Franklin Multi-Asset Allocation Funds 2023 Annual Report |
Example
As a shareholder of the Fund, you may incur two types of costs: (1) transaction costs, including front-end and back-end sales charges (loads) on purchase payments; and (2) ongoing costs, including management fees; service and/or distribution (12b-1) fees; and other Fund expenses. This example is intended to help you understand your ongoing costs (in dollars) of investing in the Fund and to compare these costs with the ongoing costs of investing in other mutual funds.
This example is based on an investment of $1,000 invested on August 1, 2022 and held for the six months ended January 31, 2023.
Actual expenses
The table below titled “Based on actual total return” provides information about actual account values and actual expenses. You may use the information provided in this table, together with the amount you invested, to estimate the expenses that you paid over the period. To estimate the expenses you paid on your account, divide your ending account value by $1,000 (for example, an $8,600 ending account value divided by $1,000 = 8.6), then multiply the result by the number under the heading entitled “Expenses Paid During the Period”.
Hypothetical example for comparison purposes
The table below titled “Based on hypothetical total return” providesinformationabouthypotheticalaccountvaluesandhypothetical expenses based on the actual expense ratio and an assumed rate of return of 5.00% per year before expenses, which is not the Fund’s actual return. The hypothetical account values and expenses may not be used to estimate the actual ending account balance or expenses you paid for the period. You may use the information provided in this table to compare the ongoing costs of investing in the Fund and other funds. To do so, compare the 5.00% hypothetical example relating to the Fund with the 5.00% hypothetical examples that appear in the shareholder reports of the other funds.
Please note that the expenses shown in the table below are meant to highlight your ongoing costs only and do not reflect any transactional costs, such as front-end or back-end sales charges (loads). Therefore, the table is useful in comparing ongoing costs only, and will not help you determine the relative total costs of owning different funds. In addition, if these transaction costs were included, your costs would have been higher.
| Based on actual total return1 | Based on hypothetical total return1 | |||||||||||||||||||||||||||||||||||||||||||||
Franklin Multi-Asset Defensive Growth Fund | Actual Total Return Without Sales Charge2 | Beginning Account Value | Ending Account Value | Annualized Expense Ratio3 | Expenses Paid During the Period4 | Franklin Multi-Asset Defensive Growth Fund | Hypothetical Annualized Total Return | Beginning Account Value | Ending Account Value | Annualized Expense Ratio3 | Expenses Paid During the Period4 | |||||||||||||||||||||||||||||||||||
| Class A | -0.09 | % | $ | 1,000.00 | $ | 999.10 | 0.59 | % | $ | 2.97 | Class A | 5.00 | % | $ | 1,000.00 | $ | 1,022.23 | 0.59 | % | $ | 3.01 | |||||||||||||||||||||||||
| Class C | -0.44 | 1,000.00 | 995.60 | 1.32 | 6.64 | Class C | 5.00 | 1,000.00 | 1,018.55 | 1.32 | 6.72 | |||||||||||||||||||||||||||||||||||
| Class C1 | -1.46 | 1,000.00 | 985.40 | 1.25 | 6.26 | Class C1 | 5.00 | 1,000.00 | 1,018.90 | 1.25 | 6.36 | |||||||||||||||||||||||||||||||||||
| Class R | -0.09 | 1,000.00 | 999.10 | 0.80 | 4.03 | Class R | 5.00 | 1,000.00 | 1,021.17 | 0.80 | 4.08 | |||||||||||||||||||||||||||||||||||
| Class I | 0.08 | 1,000.00 | 1,000.80 | 0.25 | 1.26 | Class I | 5.00 | 1,000.00 | 1,023.95 | 0.25 | 1.28 | |||||||||||||||||||||||||||||||||||
| 1 | For the six months ended January 31, 2023. |
| 2 | Assumes the reinvestment of all distributions, including returns of capital, if any, at net asset value and does not reflect the deduction of the applicable sales charge with respect to Class A shares or the applicable contingent deferred sales charge (“CDSC”) with respect to Class C shares and Class C1 shares. Total return is not annualized, as it may not be representative of the total return for the year. Performance figures may reflect compensating balance arrangements, fee waivers and/or expense reimbursements. In the absence of compensating balance arrangements, fee waivers and/or expense reimbursements, the total return would have been lower. Past performance is no guarantee of future results. |
| 3 | Does not include fees and expenses of the Underlying Funds in which the Fund invests. |
| 4 | Expenses (net of compensating balance arrangements, fee waivers and/or expense reimbursements) are equal to each class’ respective annualized expense ratio multiplied by the average account value over the period, multiplied by the number of days in the most recent fiscal half-year (184), then divided by 365. |
| Franklin Multi-Asset Allocation Funds 2023 Annual Report | 19 |
Franklin Multi-Asset Growth Fund
| Average annual total returns | ||||||||||||||||
| Without sales charges1 | Class A | Class C | Class R | Class I | ||||||||||||
| Twelve Months Ended 1/31/23 | -6.19 | % | -6.90 | % | -6.45 | % | -5.94 | % | ||||||||
| Five Years Ended 1/31/23 | 4.10 | 3.39 | 3.76 | 4.39 | ||||||||||||
| Ten Years Ended 1/31/23 | 6.99 | 6.27 | N/A | 7.30 | ||||||||||||
| Inception* through 1/31/23 | — | — | 5.15 | — | ||||||||||||
| With sales charges2 | Class A | Class C | Class R | Class I | ||||||||||||
| Twelve Months Ended 1/31/23 | -11.59 | % | -7.75 | % | -6.45 | % | -5.94 | % | ||||||||
| Five Years Ended 1/31/23 | 2.88 | 3.39 | 3.76 | 4.39 | ||||||||||||
| Ten Years Ended 1/31/23 | 6.36 | 6.27 | N/A | 7.30 | ||||||||||||
| Inception* through 1/31/23 | — | — | 5.15 | — | ||||||||||||
| Cumulative total returns | ||||
| Without sales charges1 | ||||
| Class A (1/31/13 through 1/31/23) | 96.60 | % | ||
| Class C (1/31/13 through 1/31/23) | 83.69 | |||
| Class R (Inception date of 6/2/14 through 1/31/23) | 54.58 | |||
| Class I (1/31/13 through 1/31/23) | 102.28 | |||
All figures represent past performance and are not a guarantee of future results. Investment return and principal value of an investment will fluctuate so that an investor’s shares, when redeemed, may be worth more or less than their original cost. The returns shown do not reflect the deduction of taxes that a shareholder would pay on Fund distributions or the redemption of Fund shares. Performance figures may reflect compensating balance arrangements, fee waivers and/or expense reimbursements. In the absence of compensating balance arrangements, fee waivers and/or expense reimbursements, the total return would have been lower.
| 1 | Assumes the reinvestment of all distributions, including returns of capital, if any, at net asset value and does not reflect the deduction of the applicable sales charge with respect to Class A shares or the applicable contingent deferred sales charge (“CDSC”) with respect to Class C shares. |
| 2 | Assumes the reinvestment of all distributions, including returns of capital, if any, at net asset value. In addition, Class A shares reflect the deduction of the maximum initial sales charge of 5.50% (5.75% prior to August 15, 2022). Class C shares reflect the deduction of a 1.00% CDSC, which applies if shares are redeemed within one year from purchase payment. |
| * | Inception dates for Class A, C, R and I shares are February 5, 1996, February 5, 1996, June 2, 2014 and December 16, 2008, respectively. |
| 20 | Franklin Multi-Asset Allocation Funds 2023 Annual Report |
Franklin Multi-Asset Growth Fund
Historical performance
Value of $10,000 invested in
Class A and C Shares of Franklin Multi-Asset Growth Fund vs. Benchmark Indices† — January 2013 - January 2023
All figures represent past performance and are not a guarantee of future results. Investment return and principal value of an investment will fluctuate so that an investor’s shares, when redeemed, may be worth more or less than their original cost. The returns shown do not reflect the deduction of taxes that a shareholder would pay on Fund distributions or the redemption of Fund shares. Performance figures may reflect compensating balance arrangements, fee waivers and/or expense reimbursements. In the absence of compensating balance arrangements, fee waivers and/or expense reimbursements, the total return would have been lower.
| † | Hypothetical illustration of $10,000 invested in Class A and C shares of Franklin Multi-Asset Growth Fund on January 31, 2013, assuming the deduction of the maximum initial sales charge of 5.50% (5.75% prior to August 15, 2022) at the time of investment for Class A shares and the reinvestment of all distributions, including returns of capital, if any, at net asset value through January 31, 2023. The hypothetical illustration also assumes a $10,000 investment in the Bloomberg U.S. Aggregate Index, Russell 3000 Index, and the Growth Composite Benchmark (together, the “Indices”). The Bloomberg U.S. Aggregate Index is a broad-based bond index comprised of government, corporate, mortgage- and asset-backed issues, rated investment grade or higher, and having at least one year to maturity. The Russell 3000 Index measures the performance of the 3,000 largest U.S. companies based on total market capitalization, which represents approximately 98% of the U.S. equity market. The Growth Composite Benchmark is a hypothetical representation of the performance of the Fund’s major asset classes. It consists of 45% Russell 1000 Index, 20% Russell 2000 Index, 20% MSCI EAFE Index, 10% Bloomberg U.S. Aggregate Index and 5% Bloomberg U.S. Corporate High Yield — 2% Issuer Cap Index. The Russell 1000 Index measures the performance of the large-cap segment of the U.S. equity universe. It is a subset of the Russell 3000 Index and includes approximately 1,000 of the largest securities based on a combination of their market cap and current index membership. The Russell 1000 represents approximately 92% of the U.S. market. The Russell 2000 Index measures the performance of the small-cap segment of the U.S. equity universe. The Russell 2000 is a subset of the Russell 3000 Index representing approximately 10% of the total market capitalization of that index. It includes approximately 2,000 of the smallest securities based on a combination of their market cap and current index membership. The MSCI EAFE Index is a free float-adjusted market capitalization index designed to measure developed market equity performance, excluding the U.S. and Canada. The Bloomberg U.S. Corporate High Yield — 2% Issuer Cap Index is an index of the 2% Issuer Cap component of the Bloomberg U.S. Corporate High Yield Index, which covers the U.S. dollar-denominated, non-investment grade, fixed-rate, taxable corporate bond market. The Indices are unmanaged and are not subject to the same management and trading expenses as a mutual fund. Please note that an investor cannot invest directly in an index. The performance of the Fund’s other classes may be greater or less than the Class A and C shares’ performance indicated on this chart, depending on whether greater or lesser sales charges and fees were incurred by shareholders investing in the other classes. |
Prior to June 1, 2015, the Fund followed different investment policies and strategies under the name QS Legg Mason Lifestyle Allocation 85%. |
| Franklin Multi-Asset Allocation Funds 2023 Annual Report | 21 |
Funds performance (unaudited) (cont’d)
Franklin Multi-Asset Moderate Growth Fund
| Average annual total returns | ||||||||||||||||
| Without sales charges1 | Class A | Class C | Class R | Class I | ||||||||||||
| Twelve Months Ended 1/31/23 | -5.99 | % | -6.70 | % | -6.34 | % | -5.68 | % | ||||||||
| Five Years Ended 1/31/23 | 3.90 | 3.17 | 3.55 | 4.23 | ||||||||||||
| Ten Years Ended 1/31/23 | 6.45 | 5.70 | N/A | 6.75 | ||||||||||||
| Inception* through 1/31/23 | — | — | 4.82 | — | ||||||||||||
| With sales charges2 | Class A | Class C | Class R | Class I | ||||||||||||
| Twelve Months Ended 1/31/23 | -11.41 | % | -7.58 | % | -6.34 | % | -5.68 | % | ||||||||
| Five Years Ended 1/31/23 | 2.68 | 3.17 | 3.55 | 4.23 | ||||||||||||
| Ten Years Ended 1/31/23 | 5.81 | 5.70 | N/A | 6.75 | ||||||||||||
| Inception* through 1/31/23 | — | — | 4.82 | — | ||||||||||||
| Cumulative total returns | ||||
| Without sales charges1 | ||||
| Class A (1/31/13 through 1/31/23) | 86.75 | % | ||
| Class C (1/31/13 through 1/31/23) | 74.14 | |||
| Class R (Inception date of 6/2/14 through 1/31/23) | 50.33 | |||
| Class I (1/31/13 through 1/31/23) | 92.19 | |||
All figures represent past performance and are not a guarantee of future results. Investment return and principal value of an investment will fluctuate so that an investor’s shares, when redeemed, may be worth more or less than their original cost. The returns shown do not reflect the deduction of taxes that a shareholder would pay on Fund distributions or the redemption of Fund shares. Performance figures may reflect compensating balance arrangements, fee waivers and/or expense reimbursements. In the absence of compensating balance arrangements, fee waivers and/or expense reimbursements, the total return would have been lower.
| 1 | Assumes the reinvestment of all distributions, including returns of capital, if any, at net asset value and does not reflect the deduction of the applicable sales charge with respect to Class A shares or the applicable contingent deferred sales charge (“CDSC”) with respect to Class C shares. |
| 2 | Assumes the reinvestment of all distributions, including returns of capital, if any, at net asset value. In addition, Class A shares reflect the deduction of the maximum initial sales charge of 5.50% (5.75% prior to August 15, 2022). Class C shares reflect the deduction of a 1.00% CDSC, which applies if shares are redeemed within one year from purchase payment. |
| * | Inception dates for Class A, C, R and I shares are February 5, 1996, February 5, 1996, June 2, 2014 and October 2, 2007, respectively. |
| 22 | Franklin Multi-Asset Allocation Funds 2023 Annual Report |
Franklin Multi-Asset Moderate Growth Fund
Historical performance
Value of $10,000 invested in
Class A and C Shares of Franklin Multi-Asset Moderate Growth Fund vs. Benchmark Indices† — January 2013 - January 2023
All figures represent past performance and are not a guarantee of future results. Investment return and principal value of an investment will fluctuate so that an investor’s shares, when redeemed, may be worth more or less than their original cost. The returns shown do not reflect the deduction of taxes that a shareholder would pay on Fund distributions or the redemption of Fund shares. Performance figures may reflect compensating balance arrangements, fee waivers and/or expense reimbursements. In the absence of compensating balance arrangements, fee waivers and/or expense reimbursements, the total return would have been lower.
| † | Hypothetical illustration of $10,000 invested in Class A and C shares of Franklin Multi-Asset Moderate Growth Fund on January 31, 2013, assuming the deduction of the maximum initial sales charge of 5.50% (5.75% prior to August 15, 2022) at the time of investment for Class A shares and the reinvestment of all distributions, including returns of capital, if any, at net asset value through January 31, 2023. The hypothetical illustration also assumes a $10,000 investment in the Bloomberg U.S. Aggregate Index, Russell 3000 Index, and the Moderate Growth Composite Benchmark (together, the “Indices”). The Bloomberg U.S. Aggregate Index is a broad-based bond index comprised of government, corporate, mortgage- and asset-backed issues, rated investment grade or higher, and having at least one year to maturity. The Russell 3000 Index measures the performance of the 3,000 largest U.S. companies based on total market capitalization, which represents approximately 98% of the U.S. equity market. The Moderate Growth Composite Benchmark is a hypothetical representation of the performance of the Fund’s major asset classes. It consists of 40% Russell 1000 Index, 15% Russell 2000 Index, 15% MSCI EAFE Index, 25% Bloomberg U.S. Aggregate Index and 5% Bloomberg U.S. Corporate High Yield — 2% Issuer Cap Index. The Russell 1000 Index measures the performance of the large-cap segment of the U.S. equity universe. It is a subset of the Russell 3000 Index and includes approximately 1,000 of the largest securities based on a combination of their market cap and current index membership. The Russell 1000 represents approximately 92% of the U.S. market. The Russell 2000 Index measures the performance of the small-cap segment of the U.S. equity universe. The Russell 2000 is a subset of the Russell 3000 Index representing approximately 10% of the total market capitalization of that index. It includes approximately 2,000 of the smallest securities based on a combination of their market cap and current index membership. The MSCI EAFE Index is a free float-adjusted market capitalization index designed to measure developed market equity performance, excluding the U.S. and Canada. The Bloomberg U.S. Corporate High Yield — 2% Issuer Cap Index is an index of the 2% Issuer Cap component of the Bloomberg U.S. Corporate High Yield Index, which covers the U.S. dollar-denominated, non-investment grade, fixed-rate, taxable corporate bond market. The Indices are unmanaged and are not subject to the same management and trading expenses as a mutual fund. Please note that an investor cannot invest directly in an index. The performance of the Fund’s other classes may be greater or less than the Class A and C shares’ performance indicated on this chart, depending on whether greater or lesser sales charges and fees were incurred by shareholders investing in the other classes. |
Prior to June 1, 2015, the Fund followed different investment policies and strategies under the name QS Legg Mason Lifestyle Allocation 70%. |
| Franklin Multi-Asset Allocation Funds 2023 Annual Report | 23 |
Funds performance (unaudited) (cont’d)
Franklin Multi-Asset Conservative Growth Fund
| Average annual total returns | ||||||||||||||||
| Without sales charges1 | Class A | Class C | Class R | Class I | ||||||||||||
| Twelve Months Ended 1/31/23 | -6.63 | % | -7.39 | % | -6.93 | % | -6.32 | % | ||||||||
| Five Years Ended 1/31/23 | 3.41 | 2.66 | 3.07 | 3.72 | ||||||||||||
| Ten Years Ended 1/31/23 | 5.35 | 4.58 | N/A | N/A | ||||||||||||
| Inception* through 1/31/23 | — | — | 4.09 | 4.61 | ||||||||||||
| With sales charges2 | Class A | Class C | Class R | Class I | ||||||||||||
| Twelve Months Ended 1/31/23 | -11.98 | % | -8.26 | % | -6.93 | % | -6.32 | % | ||||||||
| Five Years Ended 1/31/23 | 2.20 | 2.66 | 3.07 | 3.72 | ||||||||||||
| Ten Years Ended 1/31/23 | 4.72 | 4.58 | N/A | N/A | ||||||||||||
| Inception* through 1/31/23 | — | — | 4.09 | 4.61 | ||||||||||||
| Cumulative total returns | ||||
| Without sales charges1 | ||||
| Class A (1/31/13 through 1/31/23) | 68.37 | % | ||
| Class C (1/31/13 through 1/31/23) | 56.54 | |||
| Class R (Inception date of 6/2/14 through 1/31/23) | 41.52 | |||
| Class I (Inception date of 7/25/14 through 1/31/23) | 46.77 | |||
All figures represent past performance and are not a guarantee of future results. Investment return and principal value of an investment will fluctuate so that an investor’s shares, when redeemed, may be worth more or less than their original cost. The returns shown do not reflect the deduction of taxes that a shareholder would pay on Fund distributions or the redemption of Fund shares. Performance figures may reflect compensating balance arrangements, fee waivers and/or expense reimbursements. In the absence of compensating balance arrangements, fee waivers and/or expense reimbursements, the total return would have been lower.
| 1 | Assumes the reinvestment of all distributions, including returns of capital, if any, at net asset value and does not reflect the deduction of the applicable sales charge with respect to Class A shares or the applicable contingent deferred sales charge (“CDSC”) with respect to Class C shares. |
| 2 | Assumes the reinvestment of all distributions, including returns of capital, if any, at net asset value. In addition, Class A shares reflect the deduction of the maximum initial sales charge of 5.50% (5.75% prior to August 15, 2022). Class C shares reflect the deduction of a 1.00% CDSC, which applies if shares are redeemed within one year from purchase payment. |
| * | Inception dates for Class A, C, R and I shares are February 5, 1996, February 5, 1996, June 2, 2014 and July 25, 2014 (re-inception), respectively. |
| 24 | Franklin Multi-Asset Allocation Funds 2023 Annual Report |
Franklin Multi-Asset Conservative Growth Fund
Historical performance
Value of $10,000 invested in
Class A and C Shares of Franklin Multi-Asset Conservative Growth Fund vs. Benchmark Indices† — January 2013 - January 2023
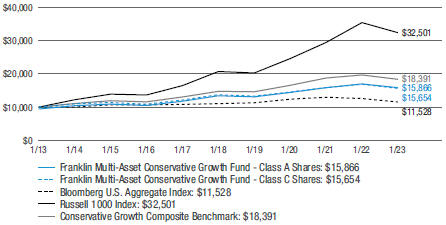
All figures represent past performance and are not a guarantee of future results. Investment return and principal value of an investment will fluctuate so that an investor’s shares, when redeemed, may be worth more or less than their original cost. The returns shown do not reflect the deduction of taxes that a shareholder would pay on Fund distributions or the redemption of Fund shares. Performance figures may reflect compensating balance arrangements, fee waivers and/or expense reimbursements. In the absence of compensating balance arrangements, fee waivers and/or expense reimbursements, the total return would have been lower.
| † | Hypothetical illustration of $10,000 invested in Class A and C shares of Franklin Multi-Asset Conservative Growth Fund on January 31, 2013, assuming the deduction of the maximum initial sales charge of 5.50% (5.75% prior to August 15, 2022) at the time of investment for Class A shares and the reinvestment of all distributions, including returns of capital, if any, at net asset value through January 31, 2023. The hypothetical illustration also assumes a $10,000 investment in the Bloomberg U.S. Aggregate Index, Russell 1000 Index, and the Conservative Growth Composite Benchmark (together, the “Indices”). The Bloomberg U.S. Aggregate Index is a broad-based bond index comprised of government, corporate, mortgage- and asset-backed issues, rated investment grade or higher, and having at least one year to maturity. The Russell 1000 Index measures the performance of the large-cap segment of the U.S. equity universe. It is a subset of the Russell 3000 Index and includes approximately 1,000 of the largest securities based on a combination of their market cap and current index membership. The Russell 1000 represents approximately 92% of the U.S. market. The Russell 3000 Index measures the performance of the 3,000 largest U.S. companies based on total market capitalization, which represents approximately 98% of the U.S. equity market. The Conservative Growth Composite Benchmark is a hypothetical representation of the performance of the Fund’s major asset classes. It consists of 28% Russell 1000 Index, 12% Russell 2000 Index, 10% MSCI EAFE Index, 43% Bloomberg U.S. Aggregate Index and 7% Bloomberg U.S. Corporate High Yield — 2% Issuer Cap Index. The Russell 2000 Index measures the performance of the small-cap segment of the U.S. equity universe. The Russell 2000 is a subset of the Russell 3000 Index representing approximately 10% of the total market capitalization of that index. It includes approximately 2,000 of the smallest securities based on a combination of their market cap and current index membership. The MSCI EAFE Index is a free float-adjusted market capitalization index designed to measure developed market equity performance, excluding the U.S. and Canada. The Bloomberg U.S. Corporate High Yield — 2% Issuer Cap Index is an index of the 2% Issuer Cap component of the Bloomberg U.S. Corporate High Yield Index, which covers the U.S. dollar-denominated, non-investment grade, fixed-rate, taxable corporate bond market. The Indices are unmanaged and are not subject to the same management and trading expenses as a mutual fund. Please note that an investor cannot invest directly in an index. The performance of the Fund’s other classes may be greater or less than the Class A and C shares’ performance indicated on this chart, depending on whether greater or lesser sales charges and fees were incurred by shareholders investing in the other classes. |
Prior to June 1, 2015, the Fund followed different investment policies and strategies under the name QS Legg Mason Lifestyle Allocation 50%. |
| Franklin Multi-Asset Allocation Funds 2023 Annual Report | 25 |
Funds performance (unaudited) (cont’d)
Franklin Multi-Asset Defensive Growth Fund
| Average annual total returns | ||||||||||||||||||||
| Without sales charges1 | Class A | Class C | Class C1 | Class R | Class I | |||||||||||||||
| Twelve Months Ended 1/31/23 | -7.63 | % | -8.34 | % | -9.21 | % | -7.77 | % | -7.35 | % | ||||||||||
| Five Years Ended 1/31/23 | 2.32 | 1.57 | 1.73 | 2.07 | 2.63 | |||||||||||||||
| Ten Years Ended 1/31/23 | 3.84 | 3.08 | 3.28 | N/A | 4.12 | |||||||||||||||
| Inception* through 1/31/23 | — | — | — | 2.97 | — | |||||||||||||||
| With sales charges2 | Class A | Class C | Class C1 | Class R | Class I | |||||||||||||||
| Twelve Months Ended 1/31/23 | -11.54 | % | -9.22 | % | -10.09 | % | -7.77 | % | -7.35 | % | ||||||||||
| Five Years Ended 1/31/23 | 1.43 | 1.57 | 1.73 | 2.07 | 2.63 | |||||||||||||||
| Ten Years Ended 1/31/23 | 3.39 | 3.08 | 3.28 | N/A | 4.12 | |||||||||||||||
| Inception* through 1/31/23 | — | — | — | 2.97 | — | |||||||||||||||
| Cumulative total returns | ||||
| Without sales charges1 | ||||
| Class A (1/31/13 through 1/31/23) | 45.78 | % | ||
| Class C (1/31/13 through 1/31/23) | 35.50 | |||
| Class C1 (1/31/13 through 1/31/23) | 38.08 | |||
| Class R (Inception date of 6/2/14 through 1/31/23) | 28.91 | |||
| Class I (1/31/13 through 1/31/23) | 49.68 | |||
All figures represent past performance and are not a guarantee of future results. Investment return and principal value of an investment will fluctuate so that an investor’s shares, when redeemed, may be worth more or less than their original cost. The returns shown do not reflect the deduction of taxes that a shareholder would pay on Fund distributions or the redemption of Fund shares. Performance figures may reflect compensating balance arrangements, fee waivers and/or expense reimbursements. In the absence of compensating balance arrangements, fee waivers and/or expense reimbursements, the total return would have been lower.
| 1 | Assumes the reinvestment of all distributions, including returns of capital, if any, at net asset value and does not reflect the deduction of the applicable sales charge with respect to Class A shares or the applicable contingent deferred sales charge (“CDSC”) with respect to Class C shares and Class C1 shares. |
| 2 | Assumes the reinvestment of all distributions, including returns of capital, if any, at net asset value. In addition, Class A shares reflect the deduction of the maximum initial sales charge of 3.75% (4.25% prior to August 15, 2022). Class C shares reflect the deduction of a 1.00% CDSC, which applies if shares are redeemed within one year from purchase payment. |
| * | Inception dates for Class A, C, C1, R and I shares are February 5, 1996, August 1, 2012, February 5, 1996, June 2, 2014 and March 15, 2012, respectively. |
| 26 | Franklin Multi-Asset Allocation Funds 2023 Annual Report |
Franklin Multi-Asset Defensive Growth Fund
Historical performance
Value of $10,000 invested in
Class A and C1 Shares of Franklin Multi-Asset Defensive Growth Fund vs. Benchmark Indices† — January 2013 - January 2023
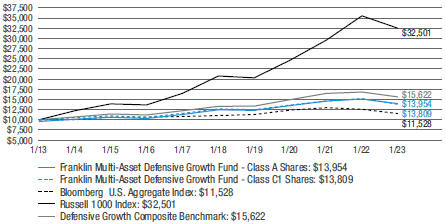
All figures represent past performance and are not a guarantee of future results. Investment return and principal value of an investment will fluctuate so that an investor’s shares, when redeemed, may be worth more or less than their original cost. The returns shown do not reflect the deduction of taxes that a shareholder would pay on Fund distributions or the redemption of Fund shares. Performance figures may reflect compensating balance arrangements, fee waivers and/or expense reimbursements. In the absence of compensating balance arrangements, fee waivers and/or expense reimbursements, the total return would have been lower.
| † | Hypothetical illustration of $10,000 invested in Class A and C1 shares of Franklin Multi-Asset Defensive Growth Fund on January 31, 2013, assuming the deduction of the maximum initial sales charge of 3.75% (4.25% prior to August 15, 2022) at the time of investment for Class A shares and the reinvestment of all distributions, including returns of capital, if any, at net asset value through January 31, 2023. On August 1, 2012, Class C shares were reclassified as C1 shares. The hypothetical illustration also assumes a $10,000 investment in the Bloomberg U.S. Aggregate Index, Russell 1000 Index, and the Defensive Growth Composite Benchmark (together, the “Indices”). The Bloomberg U.S. Aggregate Index is a broad-based bond index comprised of government, corporate, mortgage- and asset-backed issues, rated investment grade or higher, and having at least one year to maturity. The Russell 1000 Index measures the performance of the large-cap segment of the U.S. equity universe. It is a subset of the Russell 3000 Index and includes approximately 1,000 of the largest securities based on a combination of their market cap and current index membership. The Russell 1000 represents approximately 92% of the U.S. market. The Russell 3000 Index measures the performance of the 3,000 largest U.S. companies based on total market capitalization, which represents approximately 98% of the U.S. equity market. The Defensive Growth Composite Benchmark is a hypothetical representation of the performance of the Fund’s major asset classes. It consists of 17% Russell 1000 Index, 7% Russell 2000 Index, 6% MSCI EAFE Index, 60% Bloomberg U.S. Aggregate Index and 10% Bloomberg U.S. Corporate High Yield — 2% Issuer Cap Index. The Russell 2000 Index measures the performance of the small-cap segment of the U.S. equity universe. The Russell 2000 is a subset of the Russell 3000 Index representing approximately 10% of the total market capitalization of that index. It includes approximately 2,000 of the smallest securities based on a combination of their market cap and current index membership. The MSCI EAFE Index is a free float-adjusted market capitalization index designed to measure developed market equity performance, excluding the U.S. and Canada. The Bloomberg U.S. Corporate High Yield — 2% Issuer Cap Index is an index of the 2% Issuer Cap component of the Bloomberg U.S. Corporate High Yield Index, which covers the U.S. dollar-denominated, non-investment grade, fixed-rate, taxable corporate bond market. The Indices are unmanaged and are not subject to the same management and trading expenses as a mutual fund. Please note that an investor cannot invest directly in an index. The performance of the Fund’s other classes may be greater or less than the Class A and C1 shares’ performance indicated on this chart, depending on whether greater or less sales charges and fees were incurred by shareholders investing in the other classes. |
Prior to June 1, 2015, the Fund followed different investment policies and strategies under the name QS Legg Mason Lifestyle Allocation 30%. |
| Franklin Multi-Asset Allocation Funds 2023 Annual Report | 27 |
January 31, 2023
Franklin Multi-Asset Growth Fund
(Percentages shown based on Fund net assets)
| Description | Shares | Value | ||||||||||
| Investments in Underlying Funds(a) — 99.0% | ||||||||||||
| Domestic Equity — 58.6% | ||||||||||||
Franklin Custodian Funds — Franklin Growth Fund, Class R6 Shares | 464,467 | $ | 50,859,086 | |||||||||
Franklin Templeton ETF Trust — BrandywineGLOBAL — Dynamic US Large Cap Value ETF | 2,264,105 | 27,969,395 | (b) | |||||||||
Legg Mason Global Asset Management Trust: | ||||||||||||
BrandywineGLOBAL — Diversified US Large Cap Value Fund, Class IS Shares | 2,476,241 | 45,959,029 | ||||||||||
ClearBridge Small Cap Fund, Class IS Shares | 146,223 | 9,402,129 | ||||||||||
Franklin U.S. Small Cap Equity Fund, Class IS Shares | 1,710,954 | 20,343,245 | ||||||||||
Legg Mason Partners Investment Trust: | ||||||||||||
ClearBridge Appreciation Fund, Class IS Shares | 3,871,363 | 107,043,191 | ||||||||||
ClearBridge Large Cap Growth Fund, Class IS Shares | 1,153,244 | 59,265,220 | ||||||||||
ClearBridge Small Cap Growth Fund, Class IS Shares | 232,370 | 9,657,296 | * | |||||||||
Franklin U.S. Large Cap Equity Fund, Class IS Shares | 5,952,957 | 105,426,871 | ||||||||||
Total Domestic Equity | 435,925,462 | |||||||||||
| Foreign Equity — 26.9% | ||||||||||||
Legg Mason Global Asset Management Trust: | ||||||||||||
ClearBridge International Growth Fund, Class IS Shares | 516,023 | 30,104,777 | ||||||||||
Franklin Global Market Neutral Fund, Class IS Shares | 577,952 | 5,259,365 | ||||||||||
Franklin International Equity Fund, Class IS Shares | 3,222,456 | 52,236,018 | ||||||||||
Martin Currie Emerging Markets Fund, Class IS Shares | 3,571,623 | 46,181,079 | ||||||||||
Legg Mason Partners Investment Trust — Franklin Global Dividend Fund, Class IS Shares | 5,040,707 | 66,486,928 | ||||||||||
Total Foreign Equity | 200,268,167 | |||||||||||
| Domestic Fixed Income — 7.1% | ||||||||||||
Western Asset Funds, Inc.: | ||||||||||||
Western Asset Core Bond Fund, Class IS Shares | 3,144,151 | 34,679,986 | ||||||||||
Western Asset Core Plus Bond Fund, Class IS Shares | 1,324,503 | 12,966,887 | ||||||||||
Western Asset High Yield Fund, Class IS Shares | 689,778 | 4,821,549 | ||||||||||
Total Domestic Fixed Income | 52,468,422 | |||||||||||
| Hybrid — 5.7% | ||||||||||||
Legg Mason Global Asset Management Trust — Franklin Strategic Real Return Fund, Class IS Shares | 4,417,949 | 42,589,031 | ||||||||||
| Foreign Fixed Income — 0.7% | ||||||||||||
Legg Mason Global Asset Management Trust — BrandywineGLOBAL — Global Unconstrained Bond Fund, Class IS Shares | 469,551 | 5,531,304 | ||||||||||
Total Investments in Underlying Funds before Short-Term Investments (Cost — $652,215,857) |
| 736,782,386 | ||||||||||
| Rate | ||||||||||||
| Short-Term Investments — 1.1% | ||||||||||||
Invesco Government & Agency Portfolio, Institutional Class (Cost — $8,153,079) | 4.324 | % | 8,153,079 | 8,153,079 | (c) | |||||||
Total Investments — 100.1% (Cost — $660,368,936) | 744,935,465 | |||||||||||
Liabilities in Excess of Other Assets — (0.1)% | (940,236 | ) | ||||||||||
Total Net Assets — 100.0% | $ | 743,995,229 | ||||||||||
See Notes to Financial Statements.
| 28 | Franklin Multi-Asset Allocation Funds 2023 Annual Report |
Franklin Multi-Asset Growth Fund
| * | Non-income producing security. |
| (a) | Underlying Funds are affiliated with Franklin Resources, Inc. and more information about the Underlying Funds is available at www.franklintempleton.com (Note 8). |
| (b) | On October 28, 2022, BrandywineGLOBAL — Dynamic US Large Cap Value Fund reorganized into Franklin Templeton ETF Trust — BrandywineGLOBAL — Dynamic US Large Cap Value ETF. |
| (c) | Rate shown is one-day yield as of the end of the reporting period. |
See Notes to Financial Statements.
| Franklin Multi-Asset Allocation Funds 2023 Annual Report | 29 |
Schedules of investments (cont’d)
January 31, 2023
Franklin Multi-Asset Moderate Growth Fund
(Percentages shown based on Fund net assets)
| Description | Shares | Value | ||||||||||
| Investments in Underlying Funds(a) — 99.3% | ||||||||||||
| Domestic Equity — 52.0% | ||||||||||||
Franklin Custodian Funds — Franklin Growth Fund, Class R6 Shares | 252,763 | $ | 27,677,591 | |||||||||
Franklin Templeton ETF Trust — BrandywineGLOBAL — Dynamic US Large Cap Value ETF | 1,258,719 | 15,549,459 | (b) | |||||||||
Legg Mason Global Asset Management Trust: | ||||||||||||
BrandywineGLOBAL — Diversified US Large Cap Value Fund, Class IS Shares | 1,352,298 | 25,098,650 | ||||||||||
ClearBridge Small Cap Fund, Class IS Shares | 82,902 | 5,330,609 | ||||||||||
Franklin U.S. Small Cap Equity Fund, Class IS Shares | 938,448 | 11,158,142 | ||||||||||
Legg Mason Partners Investment Trust: | ||||||||||||
ClearBridge Appreciation Fund, Class IS Shares | 2,077,241 | 57,435,718 | ||||||||||
ClearBridge Large Cap Growth Fund, Class IS Shares | 628,874 | 32,317,808 | ||||||||||
ClearBridge Small Cap Growth Fund, Class IS Shares | 131,752 | 5,475,628 | * | |||||||||
Franklin U.S. Large Cap Equity Fund, Class IS Shares | 3,234,356 | 57,280,447 | ||||||||||
Total Domestic Equity | 237,324,052 | |||||||||||
| Foreign Equity — 24.4% | ||||||||||||
Legg Mason Global Asset Management Trust: | ||||||||||||
ClearBridge International Growth Fund, Class IS Shares | 274,113 | 15,991,771 | ||||||||||
Franklin Global Market Neutral Fund, Class IS Shares | 711,099 | 6,471,005 | ||||||||||
Franklin International Equity Fund, Class IS Shares | 1,668,572 | 27,047,544 | ||||||||||
Martin Currie Emerging Markets Fund, Class IS Shares | 1,952,979 | 25,252,023 | ||||||||||
Legg Mason Partners Investment Trust — Franklin Global Dividend Fund, Class IS Shares | 2,755,380 | 36,343,455 | ||||||||||
Total Foreign Equity | 111,105,798 | |||||||||||
| Domestic Fixed Income — 13.5% | ||||||||||||
Western Asset Funds, Inc.: | ||||||||||||
Western Asset Core Bond Fund, Class IS Shares | 3,403,227 | 37,537,587 | ||||||||||
Western Asset Core Plus Bond Fund, Class IS Shares | 2,024,713 | 19,821,943 | ||||||||||
Western Asset High Yield Fund, Class IS Shares | 571,093 | 3,991,938 | ||||||||||
Total Domestic Fixed Income | 61,351,468 | |||||||||||
| Hybrid — 5.7% | ||||||||||||
Legg Mason Global Asset Management Trust — Franklin Strategic Real Return Fund, Class IS Shares | 2,719,270 | 26,213,764 | ||||||||||
| Foreign Fixed Income — 3.7% | ||||||||||||
Legg Mason Global Asset Management Trust: | ||||||||||||
BrandywineGLOBAL — Global Opportunities Bond Fund (USD Hedged), Class IS Shares | 1,082,988 | 9,898,508 | * | |||||||||
BrandywineGLOBAL — Global Unconstrained Bond Fund, Class IS Shares | 577,640 | 6,804,600 | ||||||||||
Total Foreign Fixed Income | 16,703,108 | |||||||||||
Total Investments in Underlying Funds before Short-Term Investments (Cost — $411,886,709) |
| 452,698,190 | ||||||||||
| Rate | ||||||||||||
| Short-Term Investments — 0.8% | ||||||||||||
Invesco Government & Agency Portfolio, Institutional Class | 4.324 | % | 3,617,786 | 3,617,786 | (c) | |||||||
Total Investments — 100.1% (Cost — $415,504,495) | 456,315,976 | |||||||||||
Liabilities in Excess of Other Assets — (0.1)% | (409,180 | ) | ||||||||||
Total Net Assets — 100.0% | $ | 455,906,796 | ||||||||||
See Notes to Financial Statements.
| 30 | Franklin Multi-Asset Allocation Funds 2023 Annual Report |
Franklin Multi-Asset Moderate Growth Fund
| * | Non-income producing security. |
| (a) | Underlying Funds are affiliated with Franklin Resources, Inc. and more information about the Underlying Funds is available at www.franklintempleton.com (Note 8). |
| (b) | On October 28, 2022, BrandywineGLOBAL — Dynamic US Large Cap Value Fund reorganized into Franklin Templeton ETF Trust — BrandywineGLOBAL —Dynamic US Large Cap Value ETF. |
| (c) | Rate shown is one-day yield as of the end of the reporting period. |
See Notes to Financial Statements.
| Franklin Multi-Asset Allocation Funds 2023 Annual Report | 31 |
Schedules of investments (cont’d)
January 31, 2023
Franklin Multi-Asset Conservative Growth Fund
(Percentages shown based on Fund net assets)
| Description | Shares | Value | ||||||||||
| Investments in Underlying Funds(a) — 99.1% | ||||||||||||
| Domestic Equity — 39.0% | ||||||||||||
Franklin Custodian Funds — Franklin Growth Fund, Class R6 Shares | 119,665 | $ | 13,103,331 | |||||||||
Franklin Templeton ETF Trust — BrandywineGLOBAL — Dynamic US Large Cap Value ETF | 579,299 | 7,156,312 | (b) | |||||||||
Legg Mason Global Asset Management Trust: | ||||||||||||
BrandywineGLOBAL — Diversified US Large Cap Value Fund, Class IS Shares | 633,419 | 11,756,253 | ||||||||||
ClearBridge Small Cap Fund, Class IS Shares | 37,375 | 2,403,196 | ||||||||||
Franklin U.S. Small Cap Equity Fund, Class IS Shares | 437,816 | 5,205,632 | ||||||||||
Legg Mason Partners Investment Trust: | ||||||||||||
ClearBridge Appreciation Fund, Class IS Shares | 960,609 | 26,560,851 | ||||||||||
ClearBridge Large Cap Growth Fund, Class IS Shares | 293,106 | 15,062,690 | ||||||||||
ClearBridge Small Cap Growth Fund, Class IS Shares | 59,397 | 2,468,544 | * | |||||||||
Franklin U.S. Large Cap Equity Fund, Class IS Shares | 1,491,542 | 26,415,206 | ||||||||||
Total Domestic Equity | 110,132,015 | |||||||||||
| Domestic Fixed Income — 25.3% | ||||||||||||
Western Asset Funds, Inc.: | ||||||||||||
Western Asset Core Bond Fund, Class IS Shares | 4,004,037 | 44,164,531 | ||||||||||
Western Asset Core Plus Bond Fund, Class IS Shares | 2,324,345 | 22,755,338 | ||||||||||
Western Asset High Yield Fund, Class IS Shares | 635,126 | 4,439,527 | ||||||||||
Total Domestic Fixed Income | 71,359,396 | |||||||||||
| Foreign Equity — 18.6% | ||||||||||||
Legg Mason Global Asset Management Trust: | ||||||||||||
ClearBridge International Growth Fund, Class IS Shares | 116,734 | 6,810,290 | ||||||||||
Franklin Global Market Neutral Fund, Class IS Shares | 891,001 | 8,108,111 | ||||||||||
Franklin International Equity Fund, Class IS Shares | 656,050 | 10,634,567 | ||||||||||
Martin Currie Emerging Markets Fund, Class IS Shares | 838,842 | 10,846,220 | ||||||||||
Legg Mason Partners Investment Trust — Franklin Global Dividend Fund, Class IS Shares | 1,228,941 | 16,209,727 | ||||||||||
Total Foreign Equity | 52,608,915 | |||||||||||
| Foreign Fixed Income — 10.3% | ||||||||||||
Legg Mason Global Asset Management Trust: | ||||||||||||
BrandywineGLOBAL — Global Opportunities Bond Fund (USD Hedged), Class IS Shares | 2,249,083 | 20,556,615 | * | |||||||||
BrandywineGLOBAL — Global Unconstrained Bond Fund, Class IS Shares | 724,085 | 8,529,729 | ||||||||||
Total Foreign Fixed Income | 29,086,344 | |||||||||||
| Hybrid — 5.9% | ||||||||||||
Legg Mason Global Asset Management Trust — Franklin Strategic Real Return Fund, Class IS Shares | 1,743,654 | 16,808,829 | ||||||||||
Total Investments in Underlying Funds before Short-Term Investments (Cost — $261,515,458) | 279,995,499 | |||||||||||
| Rate | ||||||||||||
| Short-Term Investments — 1.0% | ||||||||||||
Invesco Government & Agency Portfolio, Institutional Class (Cost — $2,834,043) | 4.324 | % | 2,834,043 | 2,834,043 | (c) | |||||||
Total Investments — 100.1% (Cost — $264,349,501) | 282,829,542 | |||||||||||
Liabilities in Excess of Other Assets — (0.1)% | (234,833 | ) | ||||||||||
Total Net Assets — 100.0% | $ | 282,594,709 | ||||||||||
See Notes to Financial Statements.
| 32 | Franklin Multi-Asset Allocation Funds 2023 Annual Report |
Franklin Multi-Asset Conservative Growth Fund
| * | Non-income producing security. |
| (a) | Underlying Funds are affiliated with Franklin Resources, Inc. and more information about the Underlying Funds is available at www.franklintempleton.com (Note 8). |
| (b) | On October 28, 2022, BrandywineGLOBAL — Dynamic US Large Cap Value Fund reorganized into Franklin Templeton ETF Trust — BrandywineGLOBAL — Dynamic US Large Cap Value ETF. |
| (c) | Rate shown is one-day yield as of the end of the reporting period. |
See Notes to Financial Statements.
| Franklin Multi-Asset Allocation Funds 2023 Annual Report | 33 |
Schedules of investments (cont’d)
January 31, 2023
Franklin Multi-Asset Defensive Growth Fund
(Percentages shown based on Fund net assets)
| Description | Shares | Value | ||||||||||
| Investments in Underlying Funds(a) — 98.8% | ||||||||||||
| Domestic Fixed Income — 36.7% | ||||||||||||
Western Asset Funds, Inc.: | ||||||||||||
Western Asset Core Bond Fund, Class IS Shares | 2,282,514 | $ | 25,176,127 | |||||||||
Western Asset Core Plus Bond Fund, Class IS Shares | 1,315,873 | 12,882,393 | ||||||||||
Western Asset High Yield Fund, Class IS Shares | 366,811 | 2,564,010 | ||||||||||
Total Domestic Fixed Income | 40,622,530 | |||||||||||
| Domestic Equity — 25.4% | ||||||||||||
Franklin Custodian Funds — Franklin Growth Fund, Class R6 Shares | 31,259 | 3,422,875 | ||||||||||
Franklin Templeton ETF Trust — BrandywineGLOBAL — Dynamic US Large Cap Value ETF | 148,944 | 1,839,965 | (b) | |||||||||
Legg Mason Global Asset Management Trust: | ||||||||||||
BrandywineGLOBAL — Diversified US Large Cap Value Fund, Class IS Shares | 162,285 | 3,012,010 | ||||||||||
ClearBridge Small Cap Fund, Class IS Shares | 9,874 | 634,931 | ||||||||||
Franklin U.S. Small Cap Equity Fund, Class IS Shares | 115,163 | 1,369,288 | ||||||||||
Legg Mason Partners Investment Trust: | ||||||||||||
ClearBridge Appreciation Fund, Class IS Shares | 237,732 | 6,573,299 | ||||||||||
ClearBridge Large Cap Growth Fund, Class IS Shares | 78,790 | 4,048,998 | ||||||||||
ClearBridge Small Cap Growth Fund, Class IS Shares | 14,612 | 607,278 | * | |||||||||
Franklin U.S. Large Cap Equity Fund, Class IS Shares | 371,126 | 6,572,636 | ||||||||||
Total Domestic Equity | 28,081,280 | |||||||||||
| Foreign Fixed Income — 17.0% | ||||||||||||
Legg Mason Global Asset Management Trust: | ||||||||||||
BrandywineGLOBAL — Global Opportunities Bond Fund (USD Hedged), Class IS Shares | 1,509,792 | 13,799,500 | * | |||||||||
BrandywineGLOBAL — Global Unconstrained Bond Fund, Class IS Shares | 428,346 | 5,045,919 | ||||||||||
Total Foreign Fixed Income | 18,845,419 | |||||||||||
| Foreign Equity — 13.5% | ||||||||||||
Legg Mason Global Asset Management Trust: | ||||||||||||
ClearBridge International Growth Fund, Class IS Shares | 21,774 | 1,270,303 | ||||||||||
Franklin Global Market Neutral Fund, Class IS Shares | 533,383 | 4,853,784 | ||||||||||
Franklin International Equity Fund, Class IS Shares | 100,203 | 1,624,288 | ||||||||||
Martin Currie Emerging Markets Fund, Class IS Shares | 215,551 | 2,787,076 | ||||||||||
Legg Mason Partners Investment Trust — Franklin Global Dividend Fund, Class IS Shares | 337,718 | 4,454,497 | ||||||||||
Total Foreign Equity | 14,989,948 | |||||||||||
| Hybrid — 6.2% | ||||||||||||
Legg Mason Global Asset Management Trust — Franklin Strategic Real Return Fund, Class IS Shares | 707,906 | 6,824,215 | ||||||||||
Total Investments in Underlying Funds before Short-Term Investments (Cost — $105,621,847) | 109,363,392 | |||||||||||
| Rate | ||||||||||||
| Short-Term Investments — 1.4% | ||||||||||||
Invesco Government & Agency Portfolio, Institutional Class (Cost — $1,564,393) | 4.324 | % | 1,564,393 | 1,564,393 | (c) | |||||||
Total Investments — 100.2% (Cost — $107,186,240) | 110,927,785 | |||||||||||
Liabilities in Excess of Other Assets — (0.2)% | (201,168 | ) | ||||||||||
Total Net Assets — 100.0% | $ | 110,726,617 | ||||||||||
See Notes to Financial Statements.
| 34 | Franklin Multi-Asset Allocation Funds 2023 Annual Report |
Franklin Multi-Asset Defensive Growth Fund
| * | Non-income producing security. |
| (a) | Underlying Funds are affiliated with Franklin Resources, Inc. and more information about the Underlying Funds is available at www.franklintempleton.com (Note 8). |
| (b) | On October 28, 2022, BrandywineGLOBAL — Dynamic US Large Cap Value Fund reorganized into Franklin Templeton ETF Trust — BrandywineGLOBAL — Dynamic US Large Cap Value ETF. |
| (c) | Rate shown is one-day yield as of the end of the reporting period. |
See Notes to Financial Statements.
| Franklin Multi-Asset Allocation Funds 2023 Annual Report | 35 |
Statements of assets and liabilities
January 31, 2023
Franklin Multi-Asset Growth Fund | Franklin Multi-Asset Moderate Growth Fund | |||||||
| Assets: | ||||||||
Investments in affiliated Underlying Funds, at cost | $ | 652,215,857 | $ | 411,886,709 | ||||
Short-term investments, at cost | 8,153,079 | 3,617,786 | ||||||
Investments in affiliated Underlying Funds, at value | $ | 736,782,386 | $ | 452,698,190 | ||||
Short-term investments, at value | 8,153,079 | 3,617,786 | ||||||
Distributions receivable from affiliated Underlying Funds | 160,121 | 184,831 | ||||||
Distributions receivable from unaffiliated Underlying Funds | 33,632 | 18,760 | ||||||
Receivable for Fund shares sold | 18,112 | 7,940 | ||||||
Receivable from investment manager | — | 224 | ||||||
Prepaid expenses | 15,045 | 12,815 | ||||||
Total Assets | 745,162,375 | 456,540,546 | ||||||
| Liabilities: | ||||||||
Payable for Fund shares repurchased | 480,313 | 106,928 | ||||||
Transfer agent fees payable | 303,267 | 184,114 | ||||||
Payable for investments in affiliated Underlying Funds | 160,121 | 184,831 | ||||||
Service and/or distribution fees payable | 154,303 | 94,869 | ||||||
Audit and tax fees payable | 29,380 | 28,461 | ||||||
Trustees’ fees payable | 5,322 | 3,428 | ||||||
Payable to investment manager | 71 | — | ||||||
Accrued expenses | 34,369 | 31,119 | ||||||
Total Liabilities | 1,167,146 | 633,750 | ||||||
| Total Net Assets | $ | 743,995,229 | $ | 455,906,796 | ||||
| Net Assets: | ||||||||
Par value (Note 7) | $ | 489 | $ | 309 | ||||
Paid-in capital in excess of par value | 650,418,584 | 413,155,411 | ||||||
Total distributable earnings (loss) | 93,576,156 | 42,751,076 | ||||||
| Total Net Assets | $ | 743,995,229 | $ | 455,906,796 | ||||
| Net Assets: | ||||||||
Class A | $ | 737,283,105 | $ | 449,008,706 | ||||
Class C | $ | 2,090,406 | $ | 1,870,378 | ||||
Class R | $ | 88,148 | $ | 129,564 | ||||
Class I | $ | 4,533,570 | $ | 4,898,148 | ||||
| Shares Outstanding: | ||||||||
Class A | 48,452,540 | 30,422,527 | ||||||
Class C | 149,972 | 121,996 | ||||||
Class R | 5,860 | 8,930 | ||||||
Class I | 299,600 | 335,596 | ||||||
| Net Asset Value: | ||||||||
Class A (and redemption price) | $ | 15.22 | $ | 14.76 | ||||
Class C* | $ | 13.94 | $ | 15.33 | ||||
Class R (and redemption price) | $ | 15.04 | $ | 14.51 | ||||
Class I (and redemption price) | $ | 15.13 | $ | 14.60 | ||||
| Maximum Public Offering Price Per Share: | ||||||||
Class A (based on maximum initial sales charge of 5.50% and 5.50%, respectively; 5.75% and 5.75% prior to August 15, 2022, respectively) | $ | 16.11 | $ | 15.62 | ||||
| * | Redemption price per share is NAV of Class C shares reduced by a 1.00% CDSC if shares are redeemed within one year from purchase payment (Note 2). |
See Notes to Financial Statements.
| 36 | Franklin Multi-Asset Allocation Funds 2023 Annual Report |
January 31, 2023
| Franklin Multi-Asset Conservative Growth Fund | Franklin Multi-Asset Defensive Growth Fund | |||||||
| Assets: | ||||||||
Investments in affiliated Underlying Funds, at cost | $ | 261,515,458 | $ | 105,621,847 | ||||
Short-term investments, at cost | 2,834,043 | 1,564,393 | ||||||
Investments in affiliated Underlying Funds, at value | $ | 279,995,499 | $ | 109,363,392 | ||||
Short-term investments, at value | 2,834,043 | 1,564,393 | ||||||
Distributions receivable from affiliated Underlying Funds | 214,132 | 125,167 | ||||||
Distributions receivable from unaffiliated Underlying Funds | 13,701 | 3,250 | ||||||
Receivable for Fund shares sold | 13,432 | 2,053 | ||||||
Prepaid expenses | 10,244 | 13,087 | ||||||
Total Assets | 283,081,051 | 111,071,342 | ||||||
| Liabilities: | ||||||||
Payable for investments in affiliated Underlying Funds | 214,132 | 125,167 | ||||||
Transfer agent fees payable | 111,045 | 47,366 | ||||||
Service and/or distribution fees payable | 59,258 | 23,348 | ||||||
Payable for Fund shares repurchased | 43,263 | 95,031 | ||||||
Audit and tax fees payable | 27,851 | 27,199 | ||||||
Trustees’ fees payable | 2,390 | 1,225 | ||||||
Payable to investment manager | 75 | 737 | ||||||
Accrued expenses | 28,328 | 24,652 | ||||||
Total Liabilities | 486,342 | 344,725 | ||||||
| Total Net Assets | $ | 282,594,709 | $ | 110,726,617 | ||||
| Net Assets: | ||||||||
Par value (Note 7) | $ | 215 | $ | 92 | ||||
Paid-in capital in excess of par value | 265,904,759 | 111,287,439 | ||||||
Total distributable earnings (loss) | 16,689,735 | (560,914) | ||||||
| Total Net Assets | $ | 282,594,709 | $ | 110,726,617 | ||||
| Net Assets: | ||||||||
Class A | $ | 278,630,371 | $ | 108,851,541 | ||||
Class C | $ | 1,347,992 | $ | 544,869 | ||||
Class C1 | — | $ | 1,881 | |||||
Class R | $ | 83,792 | $ | 94,823 | ||||
Class I | $ | 2,532,554 | $ | 1,233,503 | ||||
| Shares Outstanding: | ||||||||
Class A | 21,208,073 | 9,045,208 | ||||||
Class C | 96,655 | 45,436 | ||||||
Class C1 | — | 149 | ||||||
Class R | 6,363 | 7,894 | ||||||
Class I | 192,952 | 102,782 | ||||||
| Net Asset Value: | ||||||||
Class A (and redemption price) | $ | 13.14 | $ | 12.03 | ||||
Class C* | $ | 13.95 | $ | 11.99 | ||||
Class C1* | — | $ | 12.62 | |||||
Class R (and redemption price) | $ | 13.17 | $ | 12.01 | ||||
Class I (and redemption price) | $ | 13.13 | $ | 12.00 | ||||
| Maximum Public Offering Price Per Share: | ||||||||
Class A (based on maximum initial sales charge of 5.50% and 3.75%, respectively; 5.75% and 4.25% prior to August 15, 2022, respectively) | $ | 13.90 | $ | 12.50 | ||||
| * | Redemption price per share is NAV of Class C and Class C1 shares reduced by a 1.00% CDSC if shares are redeemed within one year from purchase payment (Note 2). |
See Notes to Financial Statements.
| Franklin Multi-Asset Allocation Funds 2023 Annual Report | 37 |
For the Year Ended January 31, 2023
| Franklin Multi-Asset | Franklin Multi-Asset | |||||||
| Growth Fund | Moderate Growth Fund | |||||||
| Investment Income: | ||||||||
Income distributions from affiliated Underlying Funds | $ | 12,300,051 | $ | 8,852,818 | ||||
Income distributions from unaffiliated Underlying Funds | 149,003 | 92,945 | ||||||
Total Investment Income | 12,449,054 | 8,945,763 | ||||||
| Expenses: | ||||||||
Service and/or distribution fees (Notes 2 and 5) | 1,850,789 | 1,140,936 | ||||||
Transfer agent fees (Note 5) | 1,109,248 | 649,330 | ||||||
Registration fees | 88,090 | 80,331 | ||||||
Trustees’ fees | 58,001 | 36,006 | ||||||
Legal fees | 45,556 | 41,070 | ||||||
Fund accounting fees | 38,372 | 35,524 | ||||||
Audit and tax fees | 29,380 | 28,461 | ||||||
Shareholder reports | 25,299 | 20,931 | ||||||
Custody fees | 5,211 | 3,193 | ||||||
Commitment fees (Note 9) | 4,919 | 3,041 | ||||||
Miscellaneous expenses | 5,405 | 5,137 | ||||||
Total Expenses | 3,260,270 | 2,043,960 | ||||||
Less: Fee waivers and/or expense reimbursements (Notes 2 and 5) | — | (638) | ||||||
Net Expenses | 3,260,270 | 2,043,322 | ||||||
| Net Investment Income | 9,188,784 | 6,902,441 | ||||||
| Realized and Unrealized Gain (Loss) on Affiliated Underlying Funds and Capital Gain Distributions From Affiliated Underlying Funds (Notes 1 and 3): |
| |||||||
Net Realized Gain From: | ||||||||
Sale of affiliated Underlying Funds | 5,590,456 | (418,538) | ||||||
Capital gain distributions from affiliated Underlying Funds | 29,808,736 | 16,392,968 | ||||||
Net Realized Gain | 35,399,192 | 15,974,430 | ||||||
Change in Net Unrealized Appreciation (Depreciation) from Affiliated Underlying Funds | (96,829,301) | (54,048,901) | ||||||
| Net Loss on Affiliated Underlying Funds and Capital Gain Distributions From Affiliated Underlying Funds | (61,430,109) | (38,074,471) | ||||||
| Decrease in Net Assets From Operations | $ | (52,241,325) | $ | (31,172,030) | ||||
See Notes to Financial Statements.
| 38 | Franklin Multi-Asset Allocation Funds 2023 Annual Report |
For the Year Ended January 31, 2023
| Franklin Multi-Asset | Franklin Multi-Asset | |||||||
| Conservative Growth Fund | Defensive Growth Fund | |||||||
| Investment Income: | ||||||||
Income distributions from affiliated Underlying Funds | $ | 6,822,948 | $ | 3,255,763 | ||||
Income distributions from unaffiliated Underlying Funds | 55,774 | 18,352 | ||||||
Total Investment Income | 6,878,722 | 3,274,115 | ||||||
| Expenses: | ||||||||
Service and/or distribution fees (Notes 2 and 5) | 724,517 | 292,514 | ||||||
Transfer agent fees (Note 5) | 369,154 | 152,084 | ||||||
Registration fees | 78,852 | 83,245 | ||||||
Legal fees | 36,139 | 30,360 | ||||||
Fund accounting fees | 33,884 | 32,172 | ||||||
Audit and tax fees | 27,851 | 27,199 | ||||||
Trustees’ fees | 23,215 | 9,900 | ||||||
Shareholder reports | 19,159 | 16,763 | ||||||
Custody fees | 2,057 | 843 | ||||||
Commitment fees (Note 9) | 1,923 | 787 | ||||||
Miscellaneous expenses | 7,399 | 6,402 | ||||||
Total Expenses | 1,324,150 | 652,269 | ||||||
Less: Fee waivers and/or expense reimbursements | (30) | (851) | ||||||
Net Expenses | 1,324,120 | 651,418 | ||||||
| Net Investment Income | 5,554,602 | 2,622,697 | ||||||
| Realized and Unrealized Gain (Loss) on Affiliated Underlying Funds and Capital Gain Distributions From Affiliated Underlying Funds (Notes 1 and 3): |
| |||||||
Net Realized Gain (Loss) From: | ||||||||
Sale of affiliated Underlying Funds | (2,807,864) | (1,789,915) | ||||||
Capital gain distributions from affiliated Underlying Funds | 7,942,532 | 2,210,091 | ||||||
Net Realized Gain | 5,134,668 | 420,176 | ||||||
Change in Net Unrealized Appreciation (Depreciation) from Affiliated Underlying Funds | (32,848,869) | (13,464,517) | ||||||
| Net Loss on Affiliated Underlying Funds and Capital Gain Distributions From Affiliated Underlying Funds | (27,714,201) | (13,044,341) | ||||||
| Decrease in Net Assets From Operations | $ | (22,159,599) | $ | (10,421,644) | ||||
See Notes to Financial Statements.
| Franklin Multi-Asset Allocation Funds 2023 Annual Report | 39 |
Statements of changes in net assets
Franklin Multi-Asset Growth Fund
| For the Years Ended January 31, | 2023 | 2022 | ||||||
| Operations: | ||||||||
Net investment income | $ | 9,188,784 | $ | 12,523,050 | ||||
Net realized gain | 35,399,192 | 80,173,725 | ||||||
Change in net unrealized appreciation (depreciation) | (96,829,301) | 9,441,374 | ||||||
Increase (Decrease) in Net Assets From Operations | (52,241,325) | 102,138,149 | ||||||
| Distributions to Shareholders From (Notes 1 and 6): | ||||||||
Total distributable earnings | (58,793,191) | (59,936,733) | ||||||
Decrease in Net Assets From Distributions to Shareholders | (58,793,191) | (59,936,733) | ||||||
| Fund Share Transactions (Note 7): | ||||||||
Net proceeds from sale of shares | 31,970,431 | 35,914,074 | ||||||
Reinvestment of distributions | 58,673,085 | 59,775,701 | ||||||
Cost of shares repurchased | (62,419,692) | (85,692,137) | ||||||
Increase in Net Assets From Fund Share Transactions | 28,223,824 | 9,997,638 | ||||||
Increase (Decrease) in Net Assets | (82,810,692) | 52,199,054 | ||||||
| Net Assets: | ||||||||
Beginning of year | 826,805,921 | 774,606,867 | ||||||
End of year | $ | 743,995,229 | $ | 826,805,921 | ||||
See Notes to Financial Statements.
| 40 | Franklin Multi-Asset Allocation Funds 2023 Annual Report |
Franklin Multi-Asset Moderate Growth Fund
| For the Years Ended January 31, | 2023 | 2022 | ||||||
| Operations: | ||||||||
Net investment income | $ | 6,902,441 | $ | 8,790,604 | ||||
Net realized gain | 15,974,430 | 44,181,156 | ||||||
Change in net unrealized appreciation (depreciation) | (54,048,901) | (1,917,477) | ||||||
Increase (Decrease) in Net Assets From Operations | (31,172,030) | 51,054,283 | ||||||
| Distributions to Shareholders From (Notes 1 and 6): | ||||||||
Total distributable earnings | (33,071,322) | (36,943,615) | ||||||
Decrease in Net Assets From Distributions to Shareholders | (33,071,322) | (36,943,615) | ||||||
| Fund Share Transactions (Note 7): | ||||||||
Net proceeds from sale of shares | 28,951,067 | 32,111,711 | ||||||
Reinvestment of distributions | 32,961,133 | 36,788,987 | ||||||
Cost of shares repurchased | (51,596,573) | (58,700,101) | ||||||
Increase in Net Assets From Fund Share Transactions | 10,315,627 | 10,200,597 | ||||||
Increase (Decrease) in Net Assets | (53,927,725) | 24,311,265 | ||||||
| Net Assets: | ||||||||
Beginning of year | 509,834,521 | 485,523,256 | ||||||
End of year | $ | 455,906,796 | $ | 509,834,521 | ||||
See Notes to Financial Statements.
| Franklin Multi-Asset Allocation Funds 2023 Annual Report | 41 |
Statements of changes in net assets (cont’d)
Franklin Multi-Asset Conservative Growth Fund
| For the Years Ended January 31, | 2023 | 2022 | ||||||
| Operations: | ||||||||
Net investment income | $ | 5,554,602 | $ | 6,020,528 | ||||
Net realized gain | 5,134,668 | 23,416,143 | ||||||
Change in net unrealized appreciation (depreciation) | (32,848,869) | (7,186,218) | ||||||
Increase (Decrease) in Net Assets From Operations | (22,159,599) | 22,250,453 | ||||||
| Distributions to Shareholders From (Notes 1 and 6): | ||||||||
Total distributable earnings | (19,519,900) | (20,587,980) | ||||||
Decrease in Net Assets From Distributions to Shareholders | (19,519,900) | (20,587,980) | ||||||
| Fund Share Transactions (Note 7): | ||||||||
Net proceeds from sale of shares | 18,855,629 | 35,538,818 | ||||||
Reinvestment of distributions | 19,425,540 | 20,482,199 | ||||||
Cost of shares repurchased | (38,071,415) | (43,339,890) | ||||||
Increase in Net Assets From Fund Share Transactions | 209,754 | 12,681,127 | ||||||
Increase (Decrease) in Net Assets | (41,469,745) | 14,343,600 | ||||||
| Net Assets: | ||||||||
Beginning of year | 324,064,454 | 309,720,854 | ||||||
End of year | $ | 282,594,709 | $ | 324,064,454 | ||||
See Notes to Financial Statements.
| 42 | Franklin Multi-Asset Allocation Funds 2023 Annual Report |
Franklin Multi-Asset Defensive Growth Fund
| For the Years Ended January 31, | 2023 | 2022 | ||||||
| Operations: | ||||||||
Net investment income | $ | 2,622,697 | $ | 2,797,570 | ||||
Net realized gain | 420,176 | 6,201,244 | ||||||
Change in net unrealized appreciation (depreciation) | (13,464,517) | (4,178,905) | ||||||
Increase (Decrease) in Net Assets From Operations | (10,421,644) | 4,819,909 | ||||||
| Distributions to Shareholders From (Notes 1 and 6): | ||||||||
Total distributable earnings | (6,494,912) | (6,794,792) | ||||||
Decrease in Net Assets From Distributions to Shareholders | (6,494,912) | (6,794,792) | ||||||
| Fund Share Transactions (Note 7): | ||||||||
Net proceeds from sale of shares | 6,616,898 | 13,910,763 | ||||||
Reinvestment of distributions | 6,462,237 | 6,762,882 | ||||||
Cost of shares repurchased | (18,262,431) | (18,649,453) | ||||||
Increase (Decrease) in Net Assets From Fund Share Transactions | (5,183,296) | 2,024,192 | ||||||
Increase (Decrease) in Net Assets | (22,099,852) | 49,309 | ||||||
| Net Assets: | ||||||||
Beginning of year | 132,826,469 | 132,777,160 | ||||||
End of year | $ | 110,726,617 | $ | 132,826,469 | ||||
See Notes to Financial Statements.
| Franklin Multi-Asset Allocation Funds 2023 Annual Report | 43 |
Franklin Multi-Asset Growth Fund
| For a share of each class of beneficial interest outstanding throughout each year ended January 31: | ||||||||||||||||||||
| Class A Shares1 | 2023 | 2022 | 2021 | 2020 | 2019 | |||||||||||||||
| Net asset value, beginning of year | $17.70 | $16.79 | $15.85 | $15.28 | $17.34 | |||||||||||||||
| Income (loss) from operations: | ||||||||||||||||||||
Net investment income | 0.19 | 0.28 | 0.15 | 0.23 | 0.21 | |||||||||||||||
Net realized and unrealized gain (loss) | (1.40) | 1.97 | 1.62 | 1.28 | (1.37) | |||||||||||||||
Total income (loss) from operations | (1.21) | 2.25 | 1.77 | 1.51 | (1.16) | |||||||||||||||
| Less distributions from: | ||||||||||||||||||||
Net investment income | (0.26) | (0.66) | (0.17) | (0.23) | (0.29) | |||||||||||||||
Net realized gains | (1.01) | (0.68) | (0.66) | (0.71) | (0.61) | |||||||||||||||
Total distributions | (1.27) | (1.34) | (0.83) | (0.94) | (0.90) | |||||||||||||||
| Net asset value, end of year | $15.22 | $17.70 | $16.79 | $15.85 | $15.28 | |||||||||||||||
Total return2 | (6.19) | % | 13.27 | % | 11.84 | % | 10.09 | % | (6.53) | % | ||||||||||
| Net assets, end of year (millions) | $737 | $821 | $767 | $729 | $700 | |||||||||||||||
| Ratios to average net assets: | ||||||||||||||||||||
Gross expenses3 | 0.44 | % | 0.43 | % | 0.48 | % | 0.46 | % | 0.47 | % | ||||||||||
Net expenses3,4 | 0.44 | 0.43 | 0.48 | 5 | 0.46 | 5 | 0.47 | |||||||||||||
Net investment income | 1.25 | 1.49 | 0.98 | 1.46 | 1.33 | |||||||||||||||
| Portfolio turnover rate | 52 | % | 21 | % | 10 | % | 25 | % | 15 | % | ||||||||||
| 1 | Per share amounts have been calculated using the average shares method. |
| 2 | Performance figures, exclusive of sales charges, may reflect compensating balance arrangements, fee waivers and/or expense reimbursements. In the absence of compensating balance arrangements, fee waivers and/or expense reimbursements, the total return would have been lower. Past performance is no guarantee of future results. |
| 3 | Does not include fees and expenses of the Underlying Funds in which the Fund invests. |
| 4 | As a result of an expense limitation arrangement, the ratio of total annual fund operating expenses, other than interest, brokerage, taxes, extraordinary expenses and acquired fund fees and expenses, to average net assets of Class A shares did not exceed 0.80%. This expense limitation arrangement cannot be terminated prior to December 31, 2024 without the Board of Trustees’ consent. |
| 5 | Reflects fee waivers and/or expense reimbursements. |
See Notes to Financial Statements.
| 44 | Franklin Multi-Asset Allocation Funds 2023 Annual Report |
Franklin Multi-Asset Growth Fund
| For a share of each class of beneficial interest outstanding throughout each year ended January 31: | ||||||||||||||||||||
| Class C Shares1 | 2023 | 2022 | 2021 | 2020 | 2019 | |||||||||||||||
| Net asset value, beginning of year | $16.35 | $15.53 | $14.74 | $14.24 | $16.20 | |||||||||||||||
| Income (loss) from operations: | ||||||||||||||||||||
Net investment income | 0.07 | 0.07 | 0.03 | 0.06 | 0.09 | |||||||||||||||
Net realized and unrealized gain (loss) | (1.30) | 1.90 | 1.50 | 1.23 | (1.26) | |||||||||||||||
Total income (loss) from operations | (1.23) | 1.97 | 1.53 | 1.29 | (1.17) | |||||||||||||||
| Less distributions from: | ||||||||||||||||||||
Net investment income | (0.17) | (0.47) | (0.08) | (0.08) | (0.18) | |||||||||||||||
Net realized gains | (1.01) | (0.68) | (0.66) | (0.71) | (0.61) | |||||||||||||||
Total distributions | (1.18) | (1.15) | (0.74) | (0.79) | (0.79) | |||||||||||||||
| Net asset value, end of year | $13.94 | $16.35 | $15.53 | $14.74 | $14.24 | |||||||||||||||
Total return2 | (6.90) | % | 12.54 | % | 11.07 | % | 9.29 | % | (7.11) | % | ||||||||||
| Net assets, end of year (000s) | $2,090 | $2,626 | $5,242 | $6,547 | $14,674 | |||||||||||||||
| Ratios to average net assets: | ||||||||||||||||||||
Gross expenses3 | 1.17 | % | 1.15 | % | 1.16 | % | 1.14 | % | 1.15 | % | ||||||||||
Net expenses3,4 | 1.17 | 1.15 | 1.16 | 5 | 1.14 | 1.15 | ||||||||||||||
Net investment income | 0.47 | 0.43 | 0.24 | 0.44 | 0.61 | |||||||||||||||
| Portfolio turnover rate | 52 | % | 21 | % | 10 | % | 25 | % | 15 | % | ||||||||||
| 1 | Per share amounts have been calculated using the average shares method. |
| 2 | Performance figures, exclusive of CDSC, may reflect compensating balance arrangements, fee waivers and/or expense reimbursements. In the absence of compensating balance arrangements, fee waivers and/or expense reimbursements, the total return would have been lower. Past performance is no guarantee of future results. |
| 3 | Does not include fees and expenses of the Underlying Funds in which the Fund invests. |
| 4 | As a result of an expense limitation arrangement, the ratio of total annual fund operating expenses, other than interest, brokerage, taxes, extraordinary expenses and acquired fund fees and expenses, to average net assets of Class C shares did not exceed 1.55%. This expense limitation arrangement cannot be terminated prior to December 31, 2024 without the Board of Trustees’ consent. |
| 5 | Reflects fee waivers and/or expense reimbursements. |
See Notes to Financial Statements.
| Franklin Multi-Asset Allocation Funds 2023 Annual Report | 45 |
Financial highlights (cont’d)
Franklin Multi-Asset Growth Fund
| For a share of each class of beneficial interest outstanding throughout each year ended January 31: | ||||||||||||||||||||
| Class R Shares1 | 2023 | 2022 | 2021 | 2020 | 2019 | |||||||||||||||
| Net asset value, beginning of year | $17.52 | $16.64 | $15.73 | $15.20 | $17.23 | |||||||||||||||
| Income (loss) from operations: | ||||||||||||||||||||
Net investment income | 0.14 | 0.21 | 0.10 | 0.21 | 0.18 | |||||||||||||||
Net realized and unrealized gain (loss) | (1.39) | 1.95 | 1.60 | 1.23 | (1.37) | |||||||||||||||
Total income (loss) from operations | (1.25) | 2.16 | 1.70 | 1.44 | (1.19) | |||||||||||||||
| Less distributions from: | ||||||||||||||||||||
Net investment income | (0.22) | (0.60) | (0.13) | (0.20) | (0.23) | |||||||||||||||
Net realized gains | (1.01) | (0.68) | (0.66) | (0.71) | (0.61) | |||||||||||||||
Total distributions | (1.23) | (1.28) | (0.79) | (0.91) | (0.84) | |||||||||||||||
| Net asset value, end of year | $ | 15.04 | $ | 17.52 | $ | 16.64 | $ | 15.73 | $ | 15.20 | ||||||||||
Total return2 | (6.45) | % | 12.83 | % | 11.49 | % | 9.68 | % | (6.81) | % | ||||||||||
| Net assets, end of year (000s) | $ | 88 | $ | 116 | $ | 111 | $ | 89 | $ | 71 | ||||||||||
| Ratios to average net assets: | ||||||||||||||||||||
Gross expenses3 | 0.77 | % | 1.27 | % | 1.24 | % | 1.32 | % | 1.37 | % | ||||||||||
Net expenses3,4 | 0.77 | 0.80 | 5 | 0.80 | 5 | 0.80 | 5 | 0.80 | 5 | |||||||||||
Net investment income | 0.91 | 1.13 | 0.70 | 1.35 | 1.13 | |||||||||||||||
| Portfolio turnover rate | 52 | % | 21 | % | 10 | % | 25 | % | 15 | % | ||||||||||
| 1 | Per share amounts have been calculated using the average shares method. |
| 2 | Performance figures may reflect compensating balance arrangements, fee waivers and/or expense reimbursements. In the absence of compensating balance arrangements, fee waivers and/or expense reimbursements, the total return would have been lower. Past performance is no guarantee of future results. |
| 3 | Does not include fees and expenses of the Underlying Funds in which the Fund invests. |
| 4 | As a result of an expense limitation arrangement, the ratio of total annual fund operating expenses, other than interest, brokerage, taxes, extraordinary expenses and acquired fund fees and expenses, to average net assets of Class R shares did not exceed 0.80%. This expense limitation arrangement cannot be terminated prior to December 31, 2024 without the Board of Trustees’ consent. |
| 5 | Reflects fee waivers and/or expense reimbursements. |
See Notes to Financial Statements.
| 46 | Franklin Multi-Asset Allocation Funds 2023 Annual Report |
Franklin Multi-Asset Growth Fund
| For a share of each class of beneficial interest outstanding throughout each year ended January 31: | ||||||||||||||||||||
| Class I Shares1 | 2023 | 2022 | 2021 | 2020 | 2019 | |||||||||||||||
| Net asset value, beginning of year | $17.61 | $16.71 | $15.77 | $15.21 | $17.27 | |||||||||||||||
| Income (loss) from operations: | ||||||||||||||||||||
Net investment income | 0.28 | 0.35 | 0.20 | 0.28 | 0.27 | |||||||||||||||
Net realized and unrealized gain (loss) | (1.44) | 1.94 | 1.61 | 1.27 | (1.38) | |||||||||||||||
Total income (loss) from operations | (1.16) | 2.29 | 1.81 | 1.55 | (1.11) | |||||||||||||||
| Less distributions from: | ||||||||||||||||||||
Net investment income | (0.31) | (0.71) | (0.21) | (0.28) | (0.34) | |||||||||||||||
Net realized gains | (1.01) | (0.68) | (0.66) | (0.71) | (0.61) | |||||||||||||||
Total distributions | (1.32) | (1.39) | (0.87) | (0.99) | (0.95) | |||||||||||||||
| Net asset value, end of year | $ | 15.13 | $ | 17.61 | $ | 16.71 | $ | 15.77 | $ | 15.21 | ||||||||||
Total return2 | (5.94) | % | 13.56 | % | 12.18 | % | 10.36 | % | (6.24) | % | ||||||||||
| Net assets, end of year (000s) | $ | 4,534 | $ | 3,033 | $ | 2,315 | $ | 2,062 | $ | 1,733 | ||||||||||
| Ratios to average net assets: | ||||||||||||||||||||
Gross expenses3 | 0.15 | % | 0.16 | % | 0.19 | % | 0.18 | % | 0.18 | % | ||||||||||
Net expenses3,4 | 0.15 | 0.16 | 0.19 | 5 | 0.18 | 0.18 | ||||||||||||||
Net investment income | 1.82 | 1.90 | 1.32 | 1.81 | 1.71 | |||||||||||||||
| Portfolio turnover rate | 52 | % | 21 | % | 10 | % | 25 | % | 15 | % | ||||||||||
| 1 | Per share amounts have been calculated using the average shares method. |
| 2 | Performance figures may reflect compensating balance arrangements, fee waivers and/or expense reimbursements. In the absence of compensating balance arrangements, fee waivers and/or expense reimbursements, the total return would have been lower. Past performance is no guarantee of future results. |
| 3 | Does not include fees and expenses of the Underlying Funds in which the Fund invests. |
| 4 | As a result of an expense limitation arrangement, the ratio of total annual fund operating expenses, other than interest, brokerage, taxes, extraordinary expenses and acquired fund fees and expenses, to average net assets of Class I shares did not exceed 0.25%. This expense limitation arrangement cannot be terminated prior to December 31, 2024 without the Board of Trustees’ consent. |
| 5 | Reflects fee waivers and/or expense reimbursements. |
See Notes to Financial Statements.
| Franklin Multi-Asset Allocation Funds 2023 Annual Report | 47 |
Financial highlights (cont’d)
Franklin Multi-Asset Moderate Growth Fund
| For a share of each class of beneficial interest outstanding throughout each year ended January 31: | ||||||||||||||||||||
| Class A Shares1 | 2023 | 2022 | 2021 | 2020 | 2019 | |||||||||||||||
| Net asset value, beginning of year | $16.99 | $16.51 | $15.75 | $15.17 | $16.93 | |||||||||||||||
| Income (loss) from operations: | ||||||||||||||||||||
Net investment income | 0.23 | 0.30 | 0.18 | 0.26 | 0.28 | |||||||||||||||
Net realized and unrealized gain (loss) | (1.35) | 1.47 | 1.45 | 1.26 | (1.11) | |||||||||||||||
Total income (loss) from operations | (1.12) | 1.77 | 1.63 | 1.52 | (0.83) | |||||||||||||||
| Less distributions from: | ||||||||||||||||||||
Net investment income | (0.25) | (0.64) | (0.20) | (0.30) | (0.34) | |||||||||||||||
Net realized gains | (0.86) | (0.65) | (0.67) | (0.64) | (0.59) | |||||||||||||||
Total distributions | (1.11) | (1.29) | (0.87) | (0.94) | (0.93) | |||||||||||||||
| Net asset value, end of year | $14.76 | $16.99 | $16.51 | $15.75 | $15.17 | |||||||||||||||
Total return2 | (5.99) | % | 10.58 | % | 10.97 | % | 10.12 | % | (4.70) | % | ||||||||||
| Net assets, end of year (millions) | $449 | $503 | $477 | $456 | $438 | |||||||||||||||
| Ratios to average net assets: | ||||||||||||||||||||
Gross expenses3 | 0.45 | % | 0.43 | % | 0.47 | % | 0.45 | % | 0.46 | % | ||||||||||
Net expenses3,4 | 0.45 | 0.43 | 5 | 0.47 | 5 | 0.45 | 0.46 | |||||||||||||
Net investment income | 1.52 | 1.70 | 1.21 | 1.69 | 1.77 | |||||||||||||||
| Portfolio turnover rate | 51 | % | 24 | % | 16 | % | 24 | % | 15 | % | ||||||||||
| 1 | Per share amounts have been calculated using the average shares method. |
| 2 | Performance figures, exclusive of sales charges, may reflect compensating balance arrangements, fee waivers and/or expense reimbursements. In the absence of compensating balance arrangements, fee waivers and/or expense reimbursements, the total return would have been lower. Past performance is no guarantee of future results. |
| 3 | Does not include fees and expenses of the Underlying Funds in which the Fund invests. |
| 4 | As a result of an expense limitation arrangement, the ratio of total annual fund operating expenses, other than interest, brokerage, taxes, extraordinary expenses and acquired fund fees and expenses, to average net assets of Class A shares did not exceed 0.80%. This expense limitation arrangement cannot be terminated prior to December 31, 2024 without the Board of Trustees’ consent. |
| 5 | Reflects fee waivers and/or expense reimbursements. |
See Notes to Financial Statements.
| 48 | Franklin Multi-Asset Allocation Funds 2023 Annual Report |
Franklin Multi-Asset Moderate Growth Fund
| For a share of each class of beneficial interest outstanding throughout each year ended January 31: | ||||||||||||||||||||
| Class C Shares1 | 2023 | 2022 | 2021 | 2020 | 2019 | |||||||||||||||
| Net asset value, beginning of year | $17.57 | $16.99 | $16.18 | $15.51 | $17.25 | |||||||||||||||
| Income (loss) from operations: | ||||||||||||||||||||
Net investment income | 0.09 | 0.13 | 0.07 | 0.11 | 0.16 | |||||||||||||||
Net realized and unrealized gain (loss) | (1.35) | 1.56 | 1.49 | 1.32 | (1.09) | |||||||||||||||
Total income (loss) from operations | (1.26) | 1.69 | 1.56 | 1.43 | (0.93) | |||||||||||||||
| Less distributions from: | ||||||||||||||||||||
Net investment income | (0.12) | (0.46) | (0.08) | (0.12) | (0.22) | |||||||||||||||
Net realized gains | (0.86) | (0.65) | (0.67) | (0.64) | (0.59) | |||||||||||||||
Total distributions | (0.98) | (1.11) | (0.75) | (0.76) | (0.81) | |||||||||||||||
| Net asset value, end of year | $15.33 | $17.57 | $16.99 | $16.18 | $15.51 | |||||||||||||||
Total return2 | (6.70) | % | 9.80 | % | 10.22 | % | 9.32 | % | (5.29) | % | ||||||||||
| Net assets, end of year (000s) | $1,870 | $2,909 | $4,394 | $6,253 | $15,563 | |||||||||||||||
| Ratios to average net assets: | ||||||||||||||||||||
Gross expenses3 | 1.19 | % | 1.17 | % | 1.18 | % | 1.15 | % | 1.14 | % | ||||||||||
Net expenses3,4 | 1.19 | 1.17 | 5 | 1.18 | 5 | 1.15 | 5 | 1.14 | 5 | |||||||||||
Net investment income | 0.59 | 0.72 | 0.44 | 0.69 | 0.99 | |||||||||||||||
| Portfolio turnover rate | 51 | % | 24 | % | 16 | % | 24 | % | 15 | % | ||||||||||
| 1 | Per share amounts have been calculated using the average shares method. |
| 2 | Performance figures, exclusive of CDSC, may reflect compensating balance arrangements, fee waivers and/or expense reimbursements. In the absence of compensating balance arrangements, fee waivers and/or expense reimbursements, the total return would have been lower. Past performance is no guarantee of future results. |
| 3 | Does not include fees and expenses of the Underlying Funds in which the Fund invests. |
| 4 | As a result of an expense limitation arrangement, the ratio of total annual fund operating expenses, other than interest, brokerage, taxes, extraordinary expenses and acquired fund fees and expenses, to average net assets of Class C shares did not exceed 1.55%. This expense limitation arrangement cannot be terminated prior to December 31, 2024 without the Board of Trustees’ consent. |
| 5 | Reflects fee waivers and/or expense reimbursements. |
See Notes to Financial Statements.
| Franklin Multi-Asset Allocation Funds 2023 Annual Report | 49 |
Financial highlights (cont’d)
Franklin Multi-Asset Moderate Growth Fund
| For a share of each class of beneficial interest outstanding throughout each year ended January 31: | ||||||||||||||||||||
| Class R Shares1 | 2023 | 2022 | 2021 | 2020 | 2019 | |||||||||||||||
| Net asset value, beginning of year | $16.73 | $16.28 | $15.55 | $15.00 | $16.73 | |||||||||||||||
| Income (loss) from operations: | ||||||||||||||||||||
Net investment income | 0.17 | 0.22 | 0.13 | 0.21 | 0.24 | |||||||||||||||
Net realized and unrealized gain (loss) | (1.32) | 1.45 | 1.43 | 1.24 | (1.10) | |||||||||||||||
Total income (loss) from operations | (1.15) | 1.67 | 1.56 | 1.45 | (0.86) | |||||||||||||||
| Less distributions from: | ||||||||||||||||||||
Net investment income | (0.21) | (0.57) | (0.16) | (0.26) | (0.28) | |||||||||||||||
Net realized gains | (0.86) | (0.65) | (0.67) | (0.64) | (0.59) | |||||||||||||||
Total distributions | (1.07) | (1.22) | (0.83) | (0.90) | (0.87) | |||||||||||||||
| Net asset value, end of year | $14.51 | $16.73 | $16.28 | $15.55 | $15.00 | |||||||||||||||
Total return2 | (6.34) | % | 10.14 | % | 10.63 | % | 9.76 | % | (4.97) | % | ||||||||||
| Net assets, end of year (000s) | $130 | $141 | $138 | $132 | $107 | |||||||||||||||
| Ratios to average net assets: | ||||||||||||||||||||
Gross expenses3 | 1.29 | % | 1.15 | % | 1.11 | % | 1.17 | % | 1.13 | % | ||||||||||
Net expenses3,4,5 | 0.80 | 0.80 | 0.80 | 0.80 | 0.80 | |||||||||||||||
Net investment income | 1.17 | 1.28 | 0.89 | 1.37 | 1.53 | |||||||||||||||
| Portfolio turnover rate | 51 | % | 24 | % | 16 | % | 24 | % | 15 | % | ||||||||||
| 1 | Per share amounts have been calculated using the average shares method. |
| 2 | Performance figures may reflect compensating balance arrangements, fee waivers and/or expense reimbursements. In the absence of compensating balance arrangements, fee waivers and/or expense reimbursements, the total return would have been lower. Past performance is no guarantee of future results. |
| 3 | Does not include fees and expenses of the Underlying Funds in which the Fund invests. |
| 4 | As a result of an expense limitation arrangement, the ratio of total annual fund operating expenses, other than interest, brokerage, taxes, extraordinary expenses and acquired fund fees and expenses, to average net assets of Class R shares did not exceed 0.80%. This expense limitation arrangement cannot be terminated prior to December 31, 2024 without the Board of Trustees’ consent. |
| 5 | Reflects fee waivers and/or expense reimbursements. |
See Notes to Financial Statements.
| 50 | Franklin Multi-Asset Allocation Funds 2023 Annual Report |
Franklin Multi-Asset Moderate Growth Fund
| For a share of each class of beneficial interest outstanding throughout each year ended January 31: | ||||||||||||||||||||
| Class I Shares1 | 2023 | 2022 | 2021 | 2020 | 2019 | |||||||||||||||
| Net asset value, beginning of year | $16.82 | $16.35 | $15.60 | $15.03 | $16.78 | |||||||||||||||
| Income (loss) from operations: | ||||||||||||||||||||
Net investment income | 0.30 | 0.36 | 0.23 | 0.31 | 0.34 | |||||||||||||||
Net realized and unrealized gain (loss) | (1.36) | 1.45 | 1.44 | 1.24 | (1.11) | |||||||||||||||
Total income (loss) from operations | (1.06) | 1.81 | 1.67 | 1.55 | (0.77) | |||||||||||||||
| Less distributions from: | ||||||||||||||||||||
Net investment income | (0.30) | (0.69) | (0.25) | (0.34) | (0.39) | |||||||||||||||
Net realized gains | (0.86) | (0.65) | (0.67) | (0.64) | (0.59) | |||||||||||||||
Total distributions | (1.16) | (1.34) | (0.92) | (0.98) | (0.98) | |||||||||||||||
| Net asset value, end of year | $14.60 | $16.82 | $16.35 | $15.60 | $15.03 | |||||||||||||||
Total return2 | (5.68) | % | 10.93 | % | 11.32 | % | 10.45 | % | (4.38) | % | ||||||||||
| Net assets, end of year (000s) | $4,898 | $4,084 | $3,712 | $3,372 | $2,861 | |||||||||||||||
| Ratios to average net assets: | ||||||||||||||||||||
Gross expenses3 | 0.11 | % | 0.13 | % | 0.13 | % | 0.14 | % | 0.18 | % | ||||||||||
Net expenses3,4 | 0.11 | 0.13 | 0.13 | 5 | 0.14 | 0.18 | ||||||||||||||
Net investment income | 2.06 | 2.02 | 1.56 | 2.00 | 2.14 | |||||||||||||||
| Portfolio turnover rate | 51 | % | 24 | % | 16 | % | 24 | % | 15 | % | ||||||||||
| 1 | Per share amounts have been calculated using the average shares method. |
| 2 | Performance figures may reflect compensating balance arrangements, fee waivers and/or expense reimbursements. In the absence of compensating balance arrangements, fee waivers and/or expense reimbursements, the total return would have been lower. Past performance is no guarantee of future results. |
| 3 | Does not include fees and expenses of the Underlying Funds in which the Fund invests. |
| 4 | As a result of an expense limitation arrangement, the ratio of total annual fund operating expenses, other than interest, brokerage, taxes, extraordinary expenses and acquired fund fees and expenses, to average net assets of Class I shares did not exceed 0.25%. This expense limitation arrangement cannot be terminated prior to December 31, 2024 without the Board of Trustees’ consent. |
| 5 | Reflects fee waivers and/or expense reimbursements. |
See Notes to Financial Statements.
| Franklin Multi-Asset Allocation Funds 2023 Annual Report | 51 |
Financial highlights (cont’d)
Franklin Multi-Asset Conservative Growth Fund
| For a share of each class of beneficial interest outstanding throughout each year ended January 31: | ||||||||||||||||||||
| Class A Shares1 | 2023 | 2022 | 2021 | 2020 | 2019 | |||||||||||||||
| Net asset value, beginning of year | $15.12 | $15.03 | $14.33 | $13.74 | $14.94 | |||||||||||||||
| Income (loss) from operations: | ||||||||||||||||||||
Net investment income | 0.26 | 0.29 | 0.22 | 0.26 | 0.30 | |||||||||||||||
Net realized and unrealized gain (loss) | (1.31) | 0.79 | 1.16 | 1.10 | (0.68) | |||||||||||||||
Total income (loss) from operations | (1.05) | 1.08 | 1.38 | 1.36 | (0.38) | |||||||||||||||
| Less distributions from: | ||||||||||||||||||||
Net investment income | (0.27) | (0.52) | (0.26) | (0.30) | (0.35) | |||||||||||||||
Net realized gains | (0.66) | (0.47) | (0.42) | (0.47) | (0.47) | |||||||||||||||
Total distributions | (0.93) | (0.99) | (0.68) | (0.77) | (0.82) | |||||||||||||||
| Net asset value, end of year | $13.14 | $15.12 | $15.03 | $14.33 | $13.74 | |||||||||||||||
Total return2 | (6.63) | % | 7.10 | % | 10.05 | % | 10.11 | % | (2.39) | % | ||||||||||
| Net assets, end of year (millions) | $279 | $319 | $302 | $287 | $271 | |||||||||||||||
| Ratios to average net assets: | ||||||||||||||||||||
Gross expenses3 | 0.46 | % | 0.44 | % | 0.47 | % | 0.46 | % | 0.47 | % | ||||||||||
Net expenses3,4 | 0.46 | 0.44 | 0.47 | 5 | 0.46 | 0.47 | ||||||||||||||
Net investment income | 1.93 | 1.84 | 1.56 | 1.87 | 2.14 | |||||||||||||||
| Portfolio turnover rate | 43 | % | 20 | % | 16 | % | 25 | % | 12 | % | ||||||||||
| 1 | Per share amounts have been calculated using the average shares method. |
| 2 | Performance figures, exclusive of sales charges, may reflect compensating balance arrangements, fee waivers and/or expense reimbursements. In the absence of compensating balance arrangements, fee waivers and/or expense reimbursements, the total return would have been lower. Past performance is no guarantee of future results. |
| 3 | Does not include fees and expenses of the Underlying Funds in which the Fund invests. |
| 4 | As a result of an expense limitation arrangement, the ratio of total annual fund operating expenses, other than interest, brokerage, taxes, extraordinary expenses and acquired fund fees and expenses, to average net assets of Class A shares did not exceed 0.80%. This expense limitation arrangement cannot be terminated prior to December 31, 2024 without the Board of Trustees’ consent. |
| 5 | Reflects fee waivers and/or expense reimbursements. |
See Notes to Financial Statements.
| 52 | Franklin Multi-Asset Allocation Funds 2023 Annual Report |
Franklin Multi-Asset Conservative Growth Fund
| For a share of each class of beneficial interest outstanding throughout each year ended January 31: | ||||||||||||||||||||
| Class C Shares1 | 2023 | 2022 | 2021 | 2020 | 2019 | |||||||||||||||
| Net asset value, beginning of year | $15.97 | $15.79 | $15.02 | $14.35 | $15.55 | |||||||||||||||
| Income (loss) from operations: | ||||||||||||||||||||
Net investment income | 0.14 | 0.13 | 0.09 | 0.18 | 0.19 | |||||||||||||||
Net realized and unrealized gain (loss) | (1.36) | 0.90 | 1.25 | 1.14 | (0.70) | |||||||||||||||
Total income (loss) from operations | (1.22) | 1.03 | 1.34 | 1.32 | (0.51) | |||||||||||||||
| Less distributions from: | ||||||||||||||||||||
Net investment income | (0.14) | (0.38) | (0.15) | (0.18) | (0.22) | |||||||||||||||
Net realized gains | (0.66) | (0.47) | (0.42) | (0.47) | (0.47) | |||||||||||||||
Total distributions | (0.80) | (0.85) | (0.57) | (0.65) | (0.69) | |||||||||||||||
| Net asset value, end of year | $13.95 | $15.97 | $15.79 | $15.02 | $14.35 | |||||||||||||||
Total return2 | (7.39) | % | 6.39 | % | 9.21 | % | 9.37 | % | (3.11) | % | ||||||||||
| Net assets, end of year (000s) | $1,348 | $2,119 | $4,780 | $10,880 | $12,191 | |||||||||||||||
| Ratios to average net assets: | ||||||||||||||||||||
Gross expenses3 | 1.26 | % | 1.20 | % | 1.21 | % | 1.19 | % | 1.20 | % | ||||||||||
Net expenses3,4 | 1.26 | 1.20 | 1.21 | 5 | 1.19 | 1.20 | ||||||||||||||
Net investment income | 0.99 | 0.78 | 0.64 | 1.25 | 1.29 | |||||||||||||||
| Portfolio turnover rate | 43 | % | 20 | % | 16 | % | 25 | % | 12 | % | ||||||||||
| 1 | Per share amounts have been calculated using the average shares method. |
| 2 | Performance figures, exclusive of CDSC, may reflect compensating balance arrangements, fee waivers and/or expense reimbursements. In the absence of compensating balance arrangements, fee waivers and/or expense reimbursements, the total return would have been lower. Past performance is no guarantee of future results. |
| 3 | Does not include fees and expenses of the Underlying Funds in which the Fund invests. |
| 4 | As a result of an expense limitation arrangement, the ratio of total annual fund operating expenses, other than interest, brokerage, taxes, extraordinary expenses and acquired fund fees and expenses, to average net assets of Class C shares did not exceed 1.55%. This expense limitation arrangement cannot be terminated prior to December 31, 2024 without the Board of Trustees’ consent. |
| 5 | Reflects fee waivers and/or expense reimbursements. |
See Notes to Financial Statements.
| Franklin Multi-Asset Allocation Funds 2023 Annual Report | 53 |
Financial highlights (cont’d)
Franklin Multi-Asset Conservative Growth Fund
| For a share of each class of beneficial interest outstanding throughout each year ended January 31: | ||||||||||||||||||||
| Class R Shares1 | 2023 | 2022 | 2021 | 2020 | 2019 | |||||||||||||||
| Net asset value, beginning of year | $15.16 | $15.06 | $14.36 | $13.77 | $14.90 | |||||||||||||||
| Income (loss) from operations: | ||||||||||||||||||||
Net investment income | 0.31 | 0.19 | 0.18 | 0.22 | 0.21 | |||||||||||||||
Net realized and unrealized gain (loss) | (1.41) | 0.83 | 1.15 | 1.09 | (0.63) | |||||||||||||||
Total income (loss) from operations | (1.10) | 1.02 | 1.33 | 1.31 | (0.42) | |||||||||||||||
| Less distributions from: | ||||||||||||||||||||
Net investment income | (0.23) | (0.45) | (0.21) | (0.25) | (0.24) | |||||||||||||||
Net realized gains | (0.66) | (0.47) | (0.42) | (0.47) | (0.47) | |||||||||||||||
Total distributions | (0.89) | (0.92) | (0.63) | (0.72) | (0.71) | |||||||||||||||
| Net asset value, end of year | $13.17 | $15.16 | $15.06 | $14.36 | $13.77 | |||||||||||||||
Total return2 | (6.93) | % | 6.69 | % | 9.66 | % | 9.74 | % | (2.67) | % | ||||||||||
| Net assets, end of year (000s) | $84 | $45 | $70 | $60 | $48 | |||||||||||||||
| Ratios to average net assets: | ||||||||||||||||||||
Gross expenses3 | 0.86 | % | 1.59 | % | 1.25 | % | 1.34 | % | 1.30 | % | ||||||||||
Net expenses3,4,5 | 0.80 | 0.80 | 0.80 | 0.80 | 0.80 | |||||||||||||||
Net investment income | 2.36 | 1.21 | 1.26 | 1.58 | 1.48 | |||||||||||||||
| Portfolio turnover rate | 43 | % | 20 | % | 16 | % | 25 | % | 12 | % | ||||||||||
| 1 | Per share amounts have been calculated using the average shares method. |
| 2 | Performance figures may reflect compensating balance arrangements, fee waivers and/or expense reimbursements. In the absence of compensating balance arrangements, fee waivers and/or expense reimbursements, the total return would have been lower. Past performance is no guarantee of future results. |
| 3 | Does not include fees and expenses of the Underlying Funds in which the Fund invests. |
| 4 | As a result of an expense limitation arrangement, the ratio of total annual fund operating expenses, other than interest, brokerage, taxes, extraordinary expenses and acquired fund fees and expenses, to average net assets of Class R shares did not exceed 0.80%. This expense limitation arrangement cannot be terminated prior to December 31, 2024 without the Board of Trustees’ consent. |
| 5 | Reflects fee waivers and/or expense reimbursements. |
See Notes to Financial Statements.
| 54 | Franklin Multi-Asset Allocation Funds 2023 Annual Report |
Franklin Multi-Asset Conservative Growth Fund
| For a share of each class of beneficial interest outstanding throughout each year ended January 31: | ||||||||||||||||||||
| Class I Shares1 | 2023 | 2022 | 2021 | 2020 | 2019 | |||||||||||||||
| Net asset value, beginning of year | $15.11 | $15.02 | $14.33 | $13.73 | $14.93 | |||||||||||||||
| Income (loss) from operations: | ||||||||||||||||||||
Net investment income | 0.30 | 0.34 | 0.27 | 0.30 | 0.32 | |||||||||||||||
Net realized and unrealized gain (loss) | (1.31) | 0.79 | 1.14 | 1.10 | (0.67) | |||||||||||||||
Total income (loss) from operations | (1.01) | 1.13 | 1.41 | 1.40 | (0.35) | |||||||||||||||
| Less distributions from: | ||||||||||||||||||||
Net investment income | (0.31) | (0.57) | (0.30) | (0.33) | (0.38) | |||||||||||||||
Net realized gains | (0.66) | (0.47) | (0.42) | (0.47) | (0.47) | |||||||||||||||
Total distributions | (0.97) | (1.04) | (0.72) | (0.80) | (0.85) | |||||||||||||||
| Net asset value, end of year | $13.13 | $15.11 | $15.02 | $14.33 | $13.73 | |||||||||||||||
Total return2 | (6.32) | % | 7.42 | % | 10.35 | % | 10.48 | % | (2.15) | % | ||||||||||
| Net assets, end of year (000s) | $2,533 | $2,745 | $2,463 | $1,982 | $1,721 | |||||||||||||||
| Ratios to average net assets: | ||||||||||||||||||||
Gross expenses3 | 0.15 | % | 0.15 | % | 0.15 | % | 0.14 | % | 0.24 | % | ||||||||||
Net expenses3,4 | 0.15 | 0.15 | 0.15 | 5 | 0.14 | 0.24 | ||||||||||||||
Net investment income | 2.28 | 2.16 | 1.92 | 2.16 | 2.24 | |||||||||||||||
| Portfolio turnover rate | 43 | % | 20 | % | 16 | % | 25 | % | 12 | % | ||||||||||
| 1 | Per share amounts have been calculated using the average shares method. |
| 2 | Performance figures may reflect compensating balance arrangements, fee waivers and/or expense reimbursements. In the absence of compensating balance arrangements, fee waivers and/or expense reimbursements, the total return would have been lower. Past performance is no guarantee of future results. |
| 3 | Does not include fees and expenses of the Underlying Funds in which the Fund invests. |
| 4 | As a result of an expense limitation arrangement, the ratio of total annual fund operating expenses, other than interest, brokerage, taxes, extraordinary expenses and acquired fund fees and expenses, to average net assets of Class I shares did not exceed 0.25%. This expense limitation arrangement cannot be terminated prior to December 31, 2024 without the Board of Trustees’ consent. |
| 5 | Reflects fee waivers and/or expense reimbursements. |
See Notes to Financial Statements.
| Franklin Multi-Asset Allocation Funds 2023 Annual Report | 55 |
Financial highlights (cont’d)
Franklin Multi-Asset Defensive Growth Fund
| For a share of each class of beneficial interest outstanding throughout each year ended January 31: | ||||||||||||||||||||
| Class A Shares1 | 2023 | 2022 | 2021 | 2020 | 2019 | |||||||||||||||
| Net asset value, beginning of year | $13.81 | $14.02 | $13.42 | $12.76 | $13.50 | |||||||||||||||
| Income (loss) from operations: | ||||||||||||||||||||
Net investment income | 0.28 | 0.30 | 0.27 | 0.29 | 0.33 | |||||||||||||||
Net realized and unrealized gain (loss) | (1.36) | 0.21 | 0.78 | 0.91 | (0.49) | |||||||||||||||
Total income (loss) from operations | (1.08) | 0.51 | 1.05 | 1.20 | (0.16) | |||||||||||||||
| Less distributions from: | ||||||||||||||||||||
Net investment income | (0.28) | (0.42) | (0.32) | (0.34) | (0.35) | |||||||||||||||
Net realized gains | (0.42) | (0.30) | (0.13) | (0.20) | (0.23) | |||||||||||||||
Total distributions | (0.70) | (0.72) | (0.45) | (0.54) | (0.58) | |||||||||||||||
| Net asset value, end of year | $12.03 | $13.81 | $14.02 | $13.42 | $12.76 | |||||||||||||||
Total return2 | (7.63) | % | 3.63 | % | 8.08 | % | 9.60 | % | (1.11) | % | ||||||||||
| Net assets, end of year (millions) | $109 | $130 | $130 | $124 | $116 | |||||||||||||||
| Ratios to average net assets: | ||||||||||||||||||||
Gross expenses3 | 0.56 | % | 0.52 | % | 0.54 | % | 0.55 | % | 0.56 | % | ||||||||||
Net expenses3,4 | 0.56 | 0.52 | 0.54 | 5 | 0.55 | 0.56 | ||||||||||||||
Net investment income | 2.26 | 2.08 | 2.03 | 2.20 | 2.54 | |||||||||||||||
| Portfolio turnover rate | 36 | % | 8 | % | 10 | % | 19 | % | 9 | % | ||||||||||
| 1 | Per share amounts have been calculated using the average shares method. |
| 2 | Performance figures, exclusive of sales charges, may reflect compensating balance arrangements, fee waivers and/or expense reimbursements. In the absence of compensating balance arrangements, fee waivers and/or expense reimbursements, the total return would have been lower. Past performance is no guarantee of future results. |
| 3 | Does not include fees and expenses of the Underlying Funds in which the Fund invests. |
| 4 | As a result of an expense limitation arrangement, the ratio of total annual fund operating expenses, other than interest, brokerage, taxes, extraordinary expenses and acquired fund fees and expenses, to average net assets of Class A shares did not exceed 0.80%. This expense limitation arrangement cannot be terminated prior to December 31, 2024 without the Board of Trustees’ consent. |
| 5 | Reflects fee waivers and/or expense reimbursements. |
See Notes to Financial Statements.
| 56 | Franklin Multi-Asset Allocation Funds 2023 Annual Report |
Franklin Multi-Asset Defensive Growth Fund
| For a share of each class of beneficial interest outstanding throughout each year ended January 31: | ||||||||||||||||||||
| Class C Shares1 | 2023 | 2022 | 2021 | 2020 | 2019 | |||||||||||||||
| Net asset value, beginning of year | $13.75 | $13.94 | $13.36 | $12.70 | $13.43 | |||||||||||||||
| Income (loss) from operations: | ||||||||||||||||||||
Net investment income | 0.16 | 0.18 | 0.17 | 0.19 | 0.22 | |||||||||||||||
Net realized and unrealized gain (loss) | (1.32) | 0.23 | 0.77 | 0.92 | (0.48) | |||||||||||||||
Total income (loss) from operations | (1.16) | 0.41 | 0.94 | 1.11 | (0.26) | |||||||||||||||
| Less distributions from: | ||||||||||||||||||||
Net investment income | (0.18) | (0.30) | (0.23) | (0.25) | (0.24) | |||||||||||||||
Net realized gains | (0.42) | (0.30) | (0.13) | (0.20) | (0.23) | |||||||||||||||
Total distributions | (0.60) | (0.60) | (0.36) | (0.45) | (0.47) | |||||||||||||||
| Net asset value, end of year | $11.99 | $13.75 | $13.94 | $13.36 | $12.70 | |||||||||||||||
Total return2 | (8.34) | % | 2.98 | % | 7.18 | % | 8.85 | % | (1.85) | % | ||||||||||
| Net assets, end of year (000s) | $545 | $792 | $964 | $1,348 | $1,694 | |||||||||||||||
| Ratios to average net assets: | ||||||||||||||||||||
Gross expenses3 | 1.30 | % | 1.29 | % | 1.27 | % | 1.26 | % | 1.28 | % | ||||||||||
Net expenses3,4 | 1.30 | 1.29 | 1.27 | 5 | 1.26 | 1.28 | ||||||||||||||
Net investment income | 1.30 | 1.28 | 1.32 | 1.47 | 1.67 | |||||||||||||||
| Portfolio turnover rate | 36 | % | 8 | % | 10 | % | 19 | % | 9 | % | ||||||||||
| 1 | Per share amounts have been calculated using the average shares method. |
| 2 | Performance figures, exclusive of CDSC, may reflect compensating balance arrangements, fee waivers and/or expense reimbursements. In the absence of compensating balance arrangements, fee waivers and/or expense reimbursements, the total return would have been lower. Past performance is no guarantee of future results. |
| 3 | Does not include fees and expenses of the Underlying Funds in which the Fund invests. |
| 4 | As a result of an expense limitation arrangement, the ratio of total annual fund operating expenses, other than interest, brokerage, taxes, extraordinary expenses and acquired fund fees and expenses, to average net assets of Class C shares did not exceed 1.55%. This expense limitation arrangement cannot be terminated prior to December 31, 2024 without the Board of Trustees’ consent. |
| 5 | Reflects fee waivers and/or expense reimbursements. |
See Notes to Financial Statements.
| Franklin Multi-Asset Allocation Funds 2023 Annual Report | 57 |
Financial highlights (cont’d)
Franklin Multi-Asset Defensive Growth Fund
| For a share of each class of beneficial interest outstanding throughout each year ended January 31: | ||||||||||||||||||||
| Class C1 Shares1 | 2023 | 2022 | 2021 | 2020 | 2019 | |||||||||||||||
| Net asset value, beginning of year | $14.41 | $14.41 | $13.78 | $13.07 | $13.81 | |||||||||||||||
| Income (loss) from operations: | ||||||||||||||||||||
Net investment income | 0.09 | 0.15 | 0.19 | 0.21 | 0.25 | |||||||||||||||
Net realized and unrealized gain (loss) | (1.43) | 0.44 | 0.81 | 0.95 | (0.48) | |||||||||||||||
Total income (loss) from operations | (1.34) | 0.59 | 1.00 | 1.16 | (0.23) | |||||||||||||||
| Less distributions from: | ||||||||||||||||||||
Net investment income | (0.03) | (0.29) | (0.24) | (0.25) | (0.28) | |||||||||||||||
Net realized gains | (0.42) | (0.30) | (0.13) | (0.20) | (0.23) | |||||||||||||||
Total distributions | (0.45) | (0.59) | (0.37) | (0.45) | (0.51) | |||||||||||||||
| Net asset value, end of year | $12.62 | $14.41 | $14.41 | $13.78 | $13.07 | |||||||||||||||
Total return2 | (9.21) | % | 4.03 | %3 | 7.43 | % | 9.04 | % | (1.53) | % | ||||||||||
| Net assets, end of year (000s) | $2 | $69 | $227 | $596 | $2,005 | |||||||||||||||
| Ratios to average net assets: | ||||||||||||||||||||
Gross expenses4 | 2.05 | % | 1.53 | % | 1.12 | % | 1.05 | % | 1.03 | % | ||||||||||
Net expenses4,5 | 1.25 | 6 | 1.25 | 6 | 1.12 | 6 | 1.05 | 1.03 | ||||||||||||
Net investment income | 0.66 | 1.00 | 1.36 | 1.54 | 1.91 | |||||||||||||||
| Portfolio turnover rate | 36 | % | 8 | % | 10 | % | 19 | % | 9 | % | ||||||||||
| 1 | Per share amounts have been calculated using the average shares method. |
| 2 | Performance figures, exclusive of CDSC, may reflect compensating balance arrangements, fee waivers and/or expense reimbursements. In the absence of compensating balance arrangements, fee waivers and/or expense reimbursements, the total return would have been lower. Past performance is no guarantee of future results. |
| 3 | The total return includes a payment by an affiliate to reimburse for an error. Absent this payment, total return would have been 2.88% for the year ended December 31, 2021. |
| 4 | Does not include fees and expenses of the Underlying Funds in which the Fund invests. |
| 5 | As a result of an expense limitation arrangement, the ratio of total annual fund operating expenses, other than interest, brokerage, taxes, extraordinary expenses and acquired fund fees and expenses, to average net assets of Class C1 shares did not exceed 1.25%. This expense limitation arrangement cannot be terminated prior to December 31, 2024 without the Board of Trustees’ consent. |
| 6 | Reflects fee waivers and/or expense reimbursements. |
See Notes to Financial Statements.
| 58 | Franklin Multi-Asset Allocation Funds 2023 Annual Report |
Franklin Multi-Asset Defensive Growth Fund
| For a share of each class of beneficial interest outstanding throughout each year ended January 31: | ||||||||||||||||||||
| Class R Shares1 | 2023 | 2022 | 2021 | 2020 | 2019 | |||||||||||||||
| Net asset value, beginning of year | $13.79 | $14.00 | $13.41 | $12.75 | $13.47 | |||||||||||||||
| Income (loss) from operations: | ||||||||||||||||||||
Net investment income | 0.22 | 0.29 | 0.24 | 0.26 | 0.30 | |||||||||||||||
Net realized and unrealized gain (loss) | (1.33) | 0.19 | 0.77 | 0.91 | (0.50) | |||||||||||||||
Total income (loss) from operations | (1.11) | 0.48 | 1.01 | 1.17 | (0.20) | |||||||||||||||
| Less distributions from: | ||||||||||||||||||||
Net investment income | (0.25) | (0.39) | (0.29) | (0.31) | (0.29) | |||||||||||||||
Net realized gains | (0.42) | (0.30) | (0.13) | (0.20) | (0.23) | |||||||||||||||
Total distributions | (0.67) | (0.69) | (0.42) | (0.51) | (0.52) | |||||||||||||||
| Net asset value, end of year | $12.01 | $13.79 | $14.00 | $13.41 | $12.75 | |||||||||||||||
Total return2 | (7.77) | % | 3.37 | % | 7.74 | % | 9.36 | % | (1.39) | % | ||||||||||
| Net assets, end of year (000s) | $95 | $141 | $95 | $84 | $60 | |||||||||||||||
| Ratios to average net assets: | ||||||||||||||||||||
Gross expenses3 | 0.87 | % | 1.32 | % | 1.27 | % | 1.34 | % | 1.39 | % | ||||||||||
Net expenses3,4,5 | 0.80 | 0.80 | 0.80 | 0.80 | 0.80 | |||||||||||||||
Net investment income | 1.79 | 2.06 | 1.79 | 2.00 | 2.34 | |||||||||||||||
| Portfolio turnover rate | 36 | % | 8 | % | 10 | % | 19 | % | 9 | % | ||||||||||
| 1 | Per share amounts have been calculated using the average shares method. |
| 2 | Performance figures may reflect compensating balance arrangements, fee waivers and/or expense reimbursements. In the absence of compensating balance arrangements, fee waivers and/or expense reimbursements, the total return would have been lower. Past performance is no guarantee of future results. |
| 3 | Does not include fees and expenses of the Underlying Funds in which the Fund invests. |
| 4 | As a result of an expense limitation arrangement, the ratio of total annual fund operating expenses, other than interest, brokerage, taxes, extraordinary expenses and acquired fund fees and expenses, to average net assets of Class R shares did not exceed 0.80%. This expense limitation arrangement cannot be terminated prior to December 31, 2024 without the Board of Trustees’ consent. |
| 5 | Reflects fee waivers and/or expense reimbursements. |
See Notes to Financial Statements.
| Franklin Multi-Asset Allocation Funds 2023 Annual Report | 59 |
Financial highlights (cont’d)
Franklin Multi-Asset Defensive Growth Fund
| For a share of each class of beneficial interest outstanding throughout each year ended January 31: | ||||||||||||||||||||
| Class I Shares1 | 2023 | 2022 | 2021 | 2020 | 2019 | |||||||||||||||
| Net asset value, beginning of year | $13.78 | $13.98 | $13.39 | $12.74 | $13.47 | |||||||||||||||
| Income (loss) from operations: | ||||||||||||||||||||
Net investment income | 0.31 | 0.33 | 0.31 | 0.33 | 0.36 | |||||||||||||||
Net realized and unrealized gain (loss) | (1.35) | 0.23 | 0.77 | 0.90 | (0.48) | |||||||||||||||
Total income (loss) from operations | (1.04) | 0.56 | 1.08 | 1.23 | (0.12) | |||||||||||||||
| Less distributions from: | ||||||||||||||||||||
Net investment income | (0.32) | (0.46) | (0.36) | (0.38) | (0.38) | |||||||||||||||
Net realized gains | (0.42) | (0.30) | (0.13) | (0.20) | (0.23) | |||||||||||||||
Total distributions | (0.74) | (0.76) | (0.49) | (0.58) | (0.61) | |||||||||||||||
| Net asset value, end of year | $12.00 | $13.78 | $13.98 | $13.39 | $12.74 | |||||||||||||||
Total return2 | (7.35) | % | 3.99 | % | 8.35 | % | 9.86 | % | (0.74) | % | ||||||||||
| Net assets, end of year (000s) | $1,234 | $1,820 | $1,974 | $1,360 | $1,263 | |||||||||||||||
| Ratios to average net assets: | ||||||||||||||||||||
Gross expenses3 | 0.27 | % | 0.26 | % | 0.27 | % | 0.30 | % | 0.32 | % | ||||||||||
Net expenses3,4,5 | 0.25 | 0.25 | 0.25 | 0.25 | 0.25 | |||||||||||||||
Net investment income | 2.48 | 2.30 | 2.34 | 2.50 | 2.80 | |||||||||||||||
| Portfolio turnover rate | 36 | % | 8 | % | 10 | % | 19 | % | 9 | % | ||||||||||
| 1 | Per share amounts have been calculated using the average shares method. |
| 2 | Performance figures may reflect compensating balance arrangements, fee waivers and/or expense reimbursements. In the absence of compensating balance arrangements, fee waivers and/or expense reimbursements, the total return would have been lower. Past performance is no guarantee of future results. |
| 3 | Does not include fees and expenses of the Underlying Funds in which the Fund invests. |
| 4 | As a result of an expense limitation arrangement, the ratio of total annual fund operating expenses, other than interest, brokerage, taxes, extraordinary expenses and acquired fund fees and expenses, to average net assets of Class I shares did not exceed 0.25%. This expense limitation arrangement cannot be terminated prior to December 31, 2024 without the Board of Trustees’ consent. |
| 5 | Reflects fee waivers and/or expense reimbursements. |
See Notes to Financial Statements.
| 60 | Franklin Multi-Asset Allocation Funds 2023 Annual Report |
1. Organization and significant accounting policies
Franklin Multi-Asset Growth Fund (“Growth Fund”), Franklin Multi-Asset Moderate Growth Fund (“Moderate Growth Fund”), Franklin Multi-Asset Conservative Growth Fund (“Conservative Growth Fund”) and Franklin Multi-Asset Defensive Growth Fund (“Defensive Growth Fund”) (the “Funds”) are separate diversified investment series of Legg Mason Partners Investment Trust (the “Trust”). The Trust, a Maryland statutory trust, is registered under the Investment Company Act of 1940, as amended (the “1940 Act”), as an open-end management investment company. The Funds invest in Legg Mason and Franklin Templeton affiliated mutual funds and exchange-traded funds (“ETFs”) and ETFs managed by unaffiliated investment advisers (“Underlying Funds”). The financial statements and financial highlights for the Underlying Funds are presented in a separate shareholder report for each respective Underlying Fund.
The Funds follow the accounting and reporting guidance in Financial Accounting Standards Board (“FASB”) Accounting Standards Codification Topic 946, Financial Services – Investment Companies (“ASC 946”). The following are significant accounting policies consistently followed by the Funds and are in conformity with U.S. generally accepted accounting principles (“GAAP”), including, but not limited to, ASC 946. Estimates and assumptions are required to be made regarding assets, liabilities and changes in net assets resulting from operations when financial statements are prepared. Changes in the economic environment, financial markets and any other parameters used in determining these estimates could cause actual results to differ. Subsequent events have been evaluated through the date the financial statements were issued.
(a) Investment valuation. Investments in the Underlying Funds are valued at the closing net asset value per share of each Underlying Fund on the day of valuation. Equity securities, including ETFs, for which market quotations are available are valued at the last reported sales price or official closing price on the primary market or exchange on which they trade. The valuations for fixed income securities (which may include, but are not limited to, corporate, government, municipal, mortgage-backed, collateralized mortgage obligations and asset-backed securities) and certain derivative instruments are typically the prices supplied by independent third party pricing services, which may use market prices or broker/dealer quotations or a variety of valuation techniques and methodologies. The independent third party pricing services typically use inputs that are observable such as issuer details, interest rates, yield curves, prepayment speeds, credit risks/spreads, default rates and quoted prices for similar securities. Investments in open-end funds are valued at the closing net asset value per share of each fund on the day of valuation. When the Funds hold securities or other assets that are denominated in a foreign currency, the Funds will normally use the currency exchange rates as of 4:00 p.m. (Eastern Time). If independent third party pricing services are unable to supply prices for a portfolio investment, or if the prices supplied are deemed by the manager to be unreliable, the market price may be determined by the manager using quotations from one or more broker/dealers or at the transaction price if the security has recently been purchased and no value has yet been obtained from a pricing service or pricing broker. When reliable prices are not readily available, such as when the value of a security has been significantly affected by events after the close of the exchange or market on which the security is principally traded, but before each Fund calculates its net asset value, the Funds value these securities as determined in accordance with procedures approved by the Funds’ Board of Trustees.
Pursuant to policies adopted by the Board of Trustees, the Funds’ manager has been designated as the valuation designee and is responsible for the oversight of the daily valuation process. The Funds’ manager is assisted by the Global Fund Valuation Committee (the “Valuation Committee”). The Valuation Committee is responsible for making fair value determinations, evaluating the effectiveness of the Funds’ pricing policies, and reporting to the Funds’ manager and the Board of Trustees. When determining the reliability of third party pricing information for investments owned by the Funds, the Valuation Committee, among other things, conducts due diligence reviews of pricing vendors, monitors the daily change in prices and reviews transactions among market participants.
The Valuation Committee will consider pricing methodologies it deems relevant and appropriate when making fair value determinations. Examples of possible methodologies include, but are not limited to, multiple of earnings; discount from market of a similar freely traded security; discounted cash-flow analysis; book value or a multiple thereof; risk premium/yield analysis; yield to maturity; and/or fundamental investment analysis. The Valuation Committee will also consider factors it deems relevant and appropriate in light of the facts and circumstances. Examples of possible factors include, but are not limited to, the type of security; the issuer’s financial statements; the purchase price of the security; the discount from market value of unrestricted securities of the same class at the time of purchase; analysts’ research and observations from financial institutions; information regarding any transactions or offers with respect to the security; the existence of merger proposals or tender offers affecting the security; the price and extent of public trading in similar securities of the issuer or comparable companies; and the existence of a shelf registration for restricted securities. Additionally, if the closing net asset value per share for an Underlying Fund is not available on the day of valuation, the Valuation Committee may adjust the
Franklin Multi-Asset Allocation Funds 2023 Annual Report | 61 |
Notes to financial statements (cont’d)
Underlying Fund’s last available net asset value per share to account for significant events that have occurred subsequent to the Underlying Fund’s last net asset value per share calculation but prior to the day of valuation.
For each portfolio security that has been fair valued pursuant to the policies adopted by the Board of Trustees, the fair value price is compared against the last available and next available market quotations. The Valuation Committee reviews the results of such back testing monthly and fair valuation occurrences are reported to the Board of Trustees quarterly.
The Funds use valuation techniques to measure fair value that are consistent with the market approach and/or income approach, depending on the type of security and the particular circumstance. The market approach uses prices and other relevant information generated by market transactions involving identical or comparable securities. The income approach uses valuation techniques to discount estimated future cash flows to present value.
GAAP establishes a disclosure hierarchy that categorizes the inputs to valuation techniques used to value assets and liabilities at measurement date. These inputs are summarized in the three broad levels listed below:
| • | Level 1 — unadjusted quoted prices in active markets for identical investments |
| • | Level 2 — other significant observable inputs (including quoted prices for similar investments, interest rates, prepayment speeds, credit risk, etc.) |
| • | Level 3 — significant unobservable inputs (including the Funds’ own assumptions in determining the fair value of investments) |
The inputs or methodologies used to value securities are not necessarily an indication of the risk associated with investing in those securities.
The following is a summary of the inputs used in valuing the Funds’ assets carried at fair value:
Growth Fund
| ASSETS | ||||||||||||
| Description | Quoted Prices (Level 1) | Other Significant Observable Inputs (Level 2) | Significant Unobservable Inputs (Level 3) | Total | ||||||||
| Investments in Underlying Funds† | $ | 736,782,386 | — | — | $ | 736,782,386 | ||||||
| Short-Term Investments† | 8,153,079 | — | — | 8,153,079 | ||||||||
| Total Investments | $ | 744,935,465 | — | — | $ | 744,935,465 | ||||||
| † | See Schedule of Investments for additional detailed categorizations. |
Moderate Growth Fund
| ASSETS | ||||||||||||
| Description | Quoted Prices (Level 1) | Other Significant Observable Inputs (Level 2) | Significant Unobservable Inputs (Level 3) | Total | ||||||||
| Investments in Underlying Funds† | $ | 452,698,190 | — | — | $ | 452,698,190 | ||||||
| Short-Term Investments† | 3,617,786 | — | — | 3,617,786 | ||||||||
| Total Investments | $ | 456,315,976 | — | — | $ | 456,315,976 | ||||||
| † | See Schedule of Investments for additional detailed categorizations. |
Conservative Growth Fund
| ASSETS | ||||||||||||
| Description | Quoted Prices (Level 1) | Other Significant Observable Inputs (Level 2) | Significant Unobservable Inputs (Level 3) | Total | ||||||||
| Investments in Underlying Funds† | $ | 279,995,499 | — | — | $ | 279,995,499 | ||||||
| Short-Term Investments† | 2,834,043 | — | — | 2,834,043 | ||||||||
| Total Investments | $ | 282,829,542 | — | — | $ | 282,829,542 | ||||||
| † | See Schedule of Investments for additional detailed categorizations. |
| 62 | Franklin Multi-Asset Allocation Funds 2023 Annual Report |
Defensive Growth Fund
| ASSETS | ||||||||||||
| Description | Quoted Prices (Level 1) | Other Significant Observable Inputs (Level 2) | Significant Unobservable Inputs (Level 3) | Total | ||||||||
| Investments in Underlying Funds† | $ | 109,363,392 | — | — | $ | 109,363,392 | ||||||
| Short-Term Investments† | 1,564,393 | — | — | 1,564,393 | ||||||||
| Total Investments | $ | 110,927,785 | — | — | $ | 110,927,785 | ||||||
| † | See Schedule of Investments for additional detailed categorizations. |
(b) Fund of funds risk. The cost of investing in the Funds, as funds of funds, may be higher than the cost of investing in a mutual fund that only invests directly in individual securities. An Underlying Fund may change its investment objective or policies without the Funds’ approval, which could force the Funds to withdraw their investments from such Underlying Fund at a time that is unfavorable to the Funds. In addition, one Underlying Fund may buy the same securities that another Underlying Fund sells. Therefore, the Funds would indirectly bear the costs of these trades without accomplishing any investment purpose.
(c) Foreign investment risks. The Underlying Funds’ investments in foreign securities may involve risks not present in domestic investments. Since securities may be denominated in foreign currencies, may require settlement in foreign currencies or may pay interest or dividends in foreign currencies, changes in the relationship of these foreign currencies to the U.S. dollar can significantly affect the value of the investments and earnings of the Underlying Funds. Foreign investments may also subject the Underlying Funds to foreign government exchange restrictions, expropriation, taxation or other political, social or economic developments, all of which affect the market and/or credit risk of the investments.
(d) Security transactions and investment income. Security transactions are accounted for on a trade date basis. Net investment income distributions, if any, from the Underlying Funds are recorded on the ex-dividend date as investment income. Interest income is recorded on an accrual basis. Short-term and long-term capital gain distributions, if any, from the Underlying Funds are recorded on the ex-dividend date as realized gains. The character of certain distributions received from the Underlying Funds may represent a return of capital. The Funds determine the components of these distributions subsequent to the ex-dividend date, based on the actual tax character reported by the Underlying Funds. These distributions are recorded by adjusting the cost basis of the related Underlying Fund. The cost of investments sold is determined by use of the specific identification method.
(e) Distributions to shareholders. The Growth and Moderate Growth Funds distribute net investment income and capital gains, if any, at least annually. The Conservative Growth and Defensive Growth Funds distribute net investment income quarterly and capital gains, if any, at least annually. Distributions to shareholders of the Funds are recorded on the ex-dividend date and are determined in accordance with income tax regulations, which may differ from GAAP.
(f) Share class accounting. Investment income, common expenses and realized/unrealized gains (losses) on investments are allocated to the various classes of each Fund on the basis of daily net assets of each class. Fees relating to a specific class are charged directly to that share class.
(g) Compensating balance arrangements. The Funds have an arrangement with their custodian bank whereby a portion of the custodian’s fees is paid indirectly by credits earned on the Funds’ cash on deposit with the bank.
(h) Federal and other taxes. It is the Funds’ policy to comply with the federal income and excise tax requirements of the Internal Revenue Code of 1986 (the “Code”), as amended, applicable to regulated investment companies. Accordingly, the Funds intend to distribute their taxable income and net realized gains, if any, to shareholders in accordance with timing requirements imposed by the Code. Therefore, no federal or state income tax provision is required in the Funds’ financial statements.
Management has analyzed the Funds’ tax positions taken on income tax returns for all open tax years and has concluded that as of January 31, 2023, no provision for income tax is required in the Funds’ financial statements. The Funds’ federal and state income and federal excise tax returns for tax years for which the applicable statutes of limitations have not expired are subject to examination by the Internal Revenue Service and state departments of revenue.
Franklin Multi-Asset Allocation Funds 2023 Annual Report | 63 |
Notes to financial statements (cont’d)
(i) Reclassification. GAAP requires that certain components of net assets be reclassified to reflect permanent differences between financial and tax reporting. These reclassifications have no effect on net assets or net asset value per share. During the current year, the Funds had no reclassifications.
2. Investment management agreement and other transactions with affiliates
Legg Mason Partners Fund Advisor, LLC (“LMPFA”) is each Fund’s investment manager. Franklin Advisers, Inc. (“Franklin Advisers”) is each Fund’s subadviser. Western Asset Management Company, LLC (“Western Asset”) manages the portion of each Fund’s cash and short-term instruments allocated to it. LMPFA, Franklin Advisers and Western Asset are wholly-owned subsidiaries of Franklin Resources, Inc. (“Franklin Resources”). Under the investment management agreements, the Funds do not pay a management fee.
LMPFA provides administrative and certain oversight services to the Funds. LMPFA delegates to the subadviser the day-to-day portfolio management of the Funds, except for the management of the portion of each Fund’s cash and short-term instruments allocated to Western Asset.
The Funds indirectly bear their proportionate share of expenses from the Underlying Funds. Since the Underlying Funds have varied expense levels and the Funds may own different proportions of the Underlying Funds at different times, the amount of expenses incurred indirectly by the Funds will vary.
As a result of expense limitation arrangements between the Funds and LMPFA, the ratio of total annual fund operating expenses, other than interest, brokerage, taxes, extraordinary expenses and acquired fund fees and expenses, to average net assets of Class A, Class C, Class R and Class I shares of Growth Fund, Moderate Growth Fund and Conservative Growth Fund did not exceed 0.80%, 1.55%, 0.80% and 0.25%, respectively. Additionally, the ratio of total annual fund operating expenses, other than interest, brokerage, taxes, extraordinary expenses and acquired fund fees and expenses, to average net assets of Class A, Class C, Class C1, Class R and Class I shares of Defensive Growth Fund did not exceed 0.80%, 1.55%, 1.25%, 0.80% and 0.25%, respectively. These expense limitation arrangements cannot be terminated prior to December 31, 2024 without the Board of Trustees’ consent.
During the year ended January 31, 2023, fees waived and/or expenses reimbursed were as follows:
| Moderate Growth Fund | $ | 638 | ||
| Conservative Growth Fund | 30 | |||
| Defensive Growth Fund | 851 |
LMPFA is permitted to recapture amounts waived and/or reimbursed to a class during the same fiscal year if the class’ total annual fund operating expenses have fallen to a level below the expense limitation (“expense cap”) in effect at the time the fees were earned or the expenses incurred. In no case will LMPFA recapture any amount that would result, on any particular business day of the Funds, in the class’ total annual fund operating expenses exceeding the expense cap or any other lower limit then in effect.
In addition, the Funds indirectly pay management and/or administration fees to LMPFA and certain LMPFA affiliates as shareholders in the Underlying Funds. These management and/or administration fees ranged from 0.45% to 1.15% of the average daily net assets of the Underlying Funds.
Franklin Templeton Investor Services, LLC (“Investor Services”) serves as the Funds’ shareholder servicing agent and acts as the Funds’ transfer agent and dividend-paying agent. Investor Services is an indirect, wholly-owned subsidiary of Franklin Resources. Franklin Distributors, LLC (“Franklin Distributors”) serves as the Funds’ sole and exclusive distributor. Franklin Distributors is an indirect, wholly-owned broker-dealer subsidiary of Franklin Resources.
For Growth Fund, Moderate Growth Fund and Conservative Growth Fund, there is a maximum initial sales charge of 5.50% (5.75% prior to August 15, 2022) for Class A shares. For Defensive Growth Fund, there is a maximum initial sales charge of 3.75% (4.25% prior to August 15, 2022) for Class A shares. Class C and Class C1 shares of the Funds have a 1.00% contingent deferred sales charge (“CDSC”), which applies if redemption occurs within 12 months from purchase payment. In certain cases, Class A shares of the Funds have a 1.00% CDSC, which applies if redemption occurs within 18 months from purchase payment. For Growth Fund, Moderate Growth Fund and Conservative Growth Fund, this CDSC only applies to those purchases of Class A shares, which, when combined with current holdings of other shares of the funds sold by Franklin Distributors, equal or exceed $1,000,000 in the aggregate. For Defensive Growth Fund, this CDSC only applies to those
| 64 | Franklin Multi-Asset Allocation Funds 2023 Annual Report |
purchases of Class A shares, which, when combined with current holdings of other shares of the funds sold by Franklin Distributors, equal or exceed $500,000 ($1,000,000 prior to August 15, 2022) in the aggregate. These purchases do not incur an initial sales charge.
For the year ended January 31, 2023, sales charges retained by and CDSCs paid to Franklin Distributors and its affiliates, if any, were as follows:
| Sales Charges | CDSCs | |||||||||||
| Class A | Class A | Class C | ||||||||||
| Growth Fund | $ | 139,298 | $ | 1,977 | $ | 384 | ||||||
| Moderate Growth Fund | 113,147 | 1,006 | 100 | |||||||||
| Conservative Growth Fund | 72,128 | 69 | 30 | |||||||||
| Defensive Growth Fund | 10,830 | 7 | 4 | |||||||||
All officers and one Trustee of the Trust are employees of Franklin Resources or its affiliates and do not receive compensation from the Trust.
3. Investments
During the year ended January 31, 2023, the aggregate cost of purchases and proceeds from sales of investments (excluding short-term investments) were as follows:
| Purchases | Sales | |||||||
| Growth Fund | $ | 387,723,077 | $ | 384,091,179 | ||||
| Moderate Growth Fund | 230,557,179 | 232,537,459 | ||||||
| Conservative Growth Fund | 123,715,692 | 132,022,369 | ||||||
| Defensive Growth Fund | 42,058,063 | 49,548,538 | ||||||
At January 31, 2023, the aggregate cost of investments and the aggregate gross unrealized appreciation and depreciation of investments for federal income tax purposes were as follows:
| Growth Fund | ||||||||||||||||
| Cost | Gross Unrealized Appreciation | Gross Unrealized Depreciation | Net Unrealized Appreciation | |||||||||||||
| Securities | $ | 676,460,092 | $ | 80,442,477 | $ | (11,967,104) | $ | 68,475,373 | ||||||||
| Moderate Growth Fund | ||||||||||||||||
| Cost | Gross Unrealized Appreciation | Gross Unrealized Depreciation | Net Appreciation | |||||||||||||
| Securities | $ | 425,156,136 | $ | 40,717,645 | $ | (9,557,805) | $ | 31,159,840 | ||||||||
| Conservative Growth Fund | ||||||||||||||||
| Cost | Gross Unrealized Appreciation | Gross Unrealized Depreciation | Net Appreciation | |||||||||||||
| Securities | $ | 270,686,139 | $ | 22,423,888 | $ | (10,280,485) | $ | 12,143,403 | ||||||||
| Defensive Growth Fund | ||||||||||||||||
| Cost | Gross Appreciation | Gross Depreciation | Net Depreciation | |||||||||||||
| Securities | $ | 111,182,663 | $ | 5,171,316 | $ | (5,426,194) | $ | (254,878) | ||||||||
4. Derivative instruments and hedging activities
During the year ended January 31, 2023, the Funds did not invest in derivative instruments.
5. Class specific expenses, waivers and/or expense reimbursements
The Funds have adopted a Rule 12b-1 shareholder services and distribution plan and under that plan Growth Fund, Moderate Growth Fund and Conservative Growth Fund pay service and/or distribution fees with respect to their Class A, Class C and Class R shares calculated at the annual rate of 0.25%, 1.00% and 0.50% of the average daily net assets of each class, respectively. Defensive Growth Fund pays service and/or distribution fees with respect to its Class A, Class C, Class C1 and Class R shares calculated at the annual rate of 0.25%, 1.00%, 0.70% and 0.50% of the average daily net assets of each class, respectively. Service and/or distribution fees are accrued daily and paid monthly.
Franklin Multi-Asset Allocation Funds 2023 Annual Report | 65 |
Notes to financial statements (cont’d)
For the year ended January 31, 2023, class specific expenses were as follows:
Service and/or Distribution Fees | Transfer Agent Fees | |||||||
| Growth Fund | ||||||||
| Class A | $ | 1,829,677 | $ | 1,103,219 | ||||
| Class C | 20,682 | 2,736 | ||||||
| Class R | 430 | 198 | ||||||
| Class I | — | 3,095 | ||||||
| Total | $ | 1,850,789 | $ | 1,109,248 | ||||
Service and/or Distribution Fees | Transfer Agent Fees | |||||||
| Moderate Growth Fund | ||||||||
| Class A | $ | 1,117,829 | $ | 643,239 | ||||
| Class C | 22,458 | 2,931 | ||||||
| Class R | 649 | 955 | ||||||
| Class I | — | 2,205 | ||||||
| Total | $ | 1,140,936 | $ | 649,330 | ||||
Service and/or Distribution Fees | Transfer Agent Fees | |||||||
| Conservative Growth Fund | ||||||||
| Class A | $ | 708,626 | $ | 364,590 | ||||
| Class C | 15,628 | 2,779 | ||||||
| Class R | 263 | 146 | ||||||
| Class I | — | 1,639 | ||||||
| Total | $ | 724,517 | $ | 369,154 | ||||
| Service and/or Distribution Fees | Transfer Agent Fees | |||||||
| Defensive Growth Fund | ||||||||
| Class A | $ | 284,626 | $ | 148,940 | ||||
| Class C | 6,901 | 851 | ||||||
| Class C1 | 387 | 651 | ||||||
| Class R | 600 | 231 | ||||||
| Class I | — | 1,411 | ||||||
| Total | $ | 292,514 | $ | 152,084 | ||||
For the year ended January 31, 2023, waivers and/or expense reimbursements by class were as follows:
Waivers/Expense Reimbursements | ||||
| Moderate Growth Fund | ||||
| Class A | — | |||
| Class C | — | |||
| Class R | $ | 638 | ||
| Class I | — | |||
| Total | $ | 638 | ||
| 66 | Franklin Multi-Asset Allocation Funds 2023 Annual Report |
Waivers/Expense Reimbursements | ||||
| Conservative Growth Fund | ||||
| Class A | — | |||
| Class C | — | |||
| Class R | $ | 30 | ||
| Class I | — | |||
| Total | $ | 30 | ||
Waivers/Expense Reimbursements | ||||
| Defensive Growth Fund | ||||
| Class A | — | |||
| Class C | — | |||
| Class C1 | $ | 442 | ||
| Class R | 81 | |||
| Class I | 328 | |||
| Total | $ | 851 | ||
6. Distributions to shareholders by class
Year Ended January 31, 2023 | Year Ended January 31, 2022 | |||||||
| Growth Fund | ||||||||
| Net Investment Income: | ||||||||
| Class A | $ | 12,340,124 | $ | 29,099,930 | ||||
| Class C | 24,223 | 78,204 | ||||||
| Class R | 1,234 | 3,952 | ||||||
| Class I | 84,468 | 117,962 | ||||||
| Total | $ | 12,450,049 | $ | 29,300,048 | ||||
| Net Realized Gains: | ||||||||
| Class A | $ | 46,031,810 | $ | 30,382,029 | ||||
| Class C | 139,953 | 147,374 | ||||||
| Class R | 5,102 | 4,690 | ||||||
| Class I | 166,277 | 102,592 | ||||||
| Total | $ | 46,343,142 | $ | 30,636,685 | ||||
Year Ended January 31, 2023 | Year Ended January 31, 2022 | |||||||
| Moderate Growth Fund | ||||||||
| Net Investment Income: | ||||||||
| Class A | $ | 7,634,210 | $ | 18,068,579 | ||||
| Class C | 14,876 | 73,018 | ||||||
| Class R | 1,818 | 4,735 | ||||||
| Class I | 99,134 | 158,689 | ||||||
| Total | $ | 7,750,038 | $ | 18,305,021 | ||||
| Franklin Multi-Asset Allocation Funds 2023 Annual Report | 67 |
Notes to financial statements (cont’d)
| Year Ended January 31, 2023 | Year Ended January 31, 2022 | |||||||
| Moderate Growth Fund (cont’d) | ||||||||
| Net Realized Gains: | ||||||||
| Class A | $ | 24,965,156 | $ | 18,360,343 | ||||
| Class C | 129,109 | 125,918 | ||||||
| Class R | 7,497 | 5,551 | ||||||
| Class I | 219,522 | 146,782 | ||||||
| Total | $ | 25,321,284 | $ | 18,638,594 | ||||
| Year Ended January 31, 2023 | Year Ended January 31, 2022 | |||||||
| Conservative Growth Fund | ||||||||
| Net Investment Income: | ||||||||
| Class A | $ | 5,662,459 | $ | 10,685,734 | ||||
| Class C | 13,602 | 53,133 | ||||||
| Class R | 1,316 | 1,670 | ||||||
| Class I | 61,186 | 99,389 | ||||||
| Total | $ | 5,738,563 | $ | 10,839,926 | ||||
| Net Realized Gains: | ||||||||
| Class A | $ | 13,583,650 | $ | 9,577,996 | ||||
| Class C | 70,862 | 87,524 | ||||||
| Class R | 1,933 | 1,929 | ||||||
| Class I | 124,892 | 80,605 | ||||||
| Total | $ | 13,781,337 | $ | 9,748,054 | ||||
| Year Ended January 31, 2023 | Year Ended January 31, 2022 | |||||||
| Defensive Growth Fund | ||||||||
| Net Investment Income: | ||||||||
| Class A | $ | 2,557,771 | $ | 3,885,254 | ||||
| Class C | 8,762 | 17,247 | ||||||
| Class C1 | �� | 166 | 1,564 | |||||
| Class R | 2,222 | 3,418 | ||||||
| Class I | 35,463 | 59,175 | ||||||
| Total | $ | 2,604,384 | $ | 3,966,658 | ||||
| Net Realized Gains: | ||||||||
| Class A | $ | 3,813,103 | $ | 2,765,929 | ||||
| Class C | 24,276 | 16,591 | ||||||
| Class C1 | 2,010 | 2,562 | ||||||
| Class R | 4,431 | 2,454 | ||||||
| Class I | 46,708 | 40,598 | ||||||
| Total | $ | 3,890,528 | $ | 2,828,134 | ||||
7. Shares of beneficial interest
At January 31, 2023, the Trust had an unlimited number of shares of beneficial interest authorized with a par value of $0.00001 per share. The Funds have the ability to issue multiple classes of shares. Each class of shares represents an identical interest and has the same rights, except that each class bears certain direct expenses, including those specifically related to the distribution of its shares.
| 68 | Franklin Multi-Asset Allocation Funds 2023 Annual Report |
Transactions in shares of each class were as follows:
| Year Ended January 31, 2023 | Year Ended January 31, 2022 | |||||||||||||||
| Shares | Amount | Shares | Amount | |||||||||||||
| Growth Fund | ||||||||||||||||
| Class A | ||||||||||||||||
| Shares sold | 1,890,738 | $ | 29,220,947 | 1,792,642 | $ | 33,119,918 | ||||||||||
| Shares issued on reinvestment | 4,124,468 | 58,254,125 | 3,241,933 | 59,323,125 | ||||||||||||
| Shares repurchased | (3,947,482) | (60,824,267) | (4,338,524) | (80,064,235) | ||||||||||||
| Net increase | 2,067,724 | $ | 26,650,805 | 696,051 | $ | 12,378,808 | ||||||||||
| Class C | ||||||||||||||||
| Shares sold | 17,869 | $ | 247,937 | 18,947 | $ | 323,757 | ||||||||||
| Shares issued on reinvestment | 12,726 | 164,176 | 13,323 | 225,469 | ||||||||||||
| Shares repurchased | (41,240) | (609,172) | (209,203) | (3,562,241) | ||||||||||||
| Net decrease | (10,645) | $ | (197,059) | (176,933) | $ | (3,013,015) | ||||||||||
| Class R | ||||||||||||||||
| Shares sold | 605 | $ | 9,146 | 1,169 | $ | 21,343 | ||||||||||
| Shares issued on reinvestment | 454 | 6,336 | 477 | 8,642 | ||||||||||||
| Shares repurchased | (1,832) | (29,794) | (1,680) | (30,630) | ||||||||||||
| Net decrease | (773) | $ | (14,312) | (34) | $ | (645) | ||||||||||
| Class I | ||||||||||||||||
| Shares sold | 170,696 | $ | 2,492,401 | 132,034 | $ | 2,449,056 | ||||||||||
| Shares issued on reinvestment | 17,621 | 248,448 | 12,006 | 218,465 | ||||||||||||
| Shares repurchased | (60,918) | (956,459) | (110,406) | (2,035,031) | ||||||||||||
| Net increase | 127,399 | $ | 1,784,390 | 33,634 | $ | 632,490 | ||||||||||
| Year Ended January 31, 2023 | Year Ended January 31, 2022 | |||||||||||||||
| Shares | Amount | Shares | Amount | |||||||||||||
| Moderate Growth Fund | ||||||||||||||||
| Class A | ||||||||||||||||
| Shares sold | 1,808,256 | $ | 27,194,212 | 1,739,347 | $ | 30,899,614 | ||||||||||
| Shares issued on reinvestment | 2,356,760 | 32,501,590 | 2,066,495 | 36,288,644 | ||||||||||||
| Shares repurchased | (3,324,777) | (50,006,576) | (3,123,579) | (55,540,449) | ||||||||||||
| Net increase | 840,239 | $ | 9,689,226 | 682,263 | $ | 11,647,809 | ||||||||||
| Class C | ||||||||||||||||
| Shares sold | 16,413 | $ | 265,938 | 20,619 | $ | 375,663 | ||||||||||
| Shares issued on reinvestment | 10,124 | 143,985 | 10,961 | 198,887 | ||||||||||||
| Shares repurchased | (70,102) | (1,082,779) | (124,702) | (2,286,850) | ||||||||||||
| Net decrease | (43,565) | $ | (672,856) | (93,122) | $ | (1,712,300) | ||||||||||
| Class R | ||||||||||||||||
| Shares sold | 499 | $ | 7,480 | 778 | $ | 13,647 | ||||||||||
| Shares issued on reinvestment | 688 | 9,315 | 595 | 10,286 | ||||||||||||
| Shares repurchased | (708) | (9,673) | (1,410) | (25,009) | ||||||||||||
| Net increase (decrease) | 479 | $ | 7,122 | (37) | $ | (1,076) | ||||||||||
| Class I | ||||||||||||||||
| Shares sold | 103,856 | $ | 1,483,437 | 46,822 | $ | 822,787 | ||||||||||
| Shares issued on reinvestment | 22,396 | 306,243 | 16,760 | 291,170 | ||||||||||||
| Shares repurchased | (33,517) | (497,545) | (47,770) | (847,793) | ||||||||||||
| Net increase | 92,735 | $ | 1,292,135 | 15,812 | $ | 266,164 | ||||||||||
| Franklin Multi-Asset Allocation Funds 2023 Annual Report | 69 |
Notes to financial statements (cont’d)
| Year Ended January 31, 2023 | Year Ended January 31, 2022 | |||||||||||||||
| Shares | Amount | Shares | Amount | |||||||||||||
| Conservative Growth Fund |
| |||||||||||||||
| Class A | ||||||||||||||||
| Shares sold | 1,307,706 | $ | 17,699,042 | 2,210,256 | $ | 34,698,361 | ||||||||||
| Shares issued on reinvestment | 1,519,281 | 19,151,811 | 1,289,125 | 20,158,136 | ||||||||||||
| Shares repurchased | (2,724,135) | (36,315,411) | (2,520,883) | (39,602,906) | ||||||||||||
| Net increase | 102,852 | $ | 535,442 | 978,498 | $ | 15,253,591 | ||||||||||
| Class C | ||||||||||||||||
| Shares sold | 23,824 | $ | 332,014 | 14,289 | $ | 236,302 | ||||||||||
| Shares issued on reinvestment | 6,345 | 84,464 | 8,509 | 140,657 | ||||||||||||
| Shares repurchased | (66,186) | (948,382) | (192,885) | (3,198,738) | ||||||||||||
| Net decrease | (36,017) | $ | (531,904) | (170,087) | $ | (2,821,779) | ||||||||||
| Class R | ||||||||||||||||
| Shares sold | 3,283 | $ | 41,068 | 345 | $ | 5,453 | ||||||||||
| Shares issued on reinvestment | 258 | 3,249 | 222 | 3,476 | ||||||||||||
| Shares repurchased | (134) | (1,658) | (2,278) | (36,209) | ||||||||||||
| Net increase (decrease) | 3,407 | $ | 42,659 | (1,711) | $ | (27,280) | ||||||||||
| Class I | ||||||||||||||||
| Shares sold | 59,133 | $ | 783,505 | 38,177 | $ | 598,702 | ||||||||||
| Shares issued on reinvestment | 14,772 | 186,016 | 11,523 | 179,930 | ||||||||||||
| Shares repurchased | (62,597) | (805,964) | (32,100) | (502,037) | ||||||||||||
| Net increase | 11,308 | $ | 163,557 | 17,600 | $ | 276,595 | ||||||||||
| Year Ended January 31, 2023 | Year Ended January 31, 2022 | |||||||||||||||
| Shares | Amount | Shares | Amount | |||||||||||||
| Defensive Growth Fund | ||||||||||||||||
| Class A | ||||||||||||||||
| Shares sold | 518,402 | $ | 6,405,208 | 948,700 | $ | 13,564,304 | ||||||||||
| Shares issued on reinvestment | 539,905 | 6,338,199 | 465,626 | 6,619,273 | ||||||||||||
| Shares repurchased | (1,425,675) | (17,352,860) | (1,242,780) | (17,747,858) | ||||||||||||
| Net increase (decrease) | (367,368) | $ | (4,609,453) | 171,546 | $ | 2,435,719 | ||||||||||
| Class C | ||||||||||||||||
| Shares sold | 7,847 | $ | 102,897 | 8,647 | $ | 124,778 | ||||||||||
| Shares issued on reinvestment | 2,825 | 33,038 | 2,388 | 33,838 | ||||||||||||
| Shares repurchased | (22,797) | (272,517) | (22,634) | (323,983) | ||||||||||||
| Net decrease | (12,125) | $ | (136,582) | (11,599) | $ | (165,367) | ||||||||||
| Class C1 | ||||||||||||||||
| Shares sold | 4 | $ | 40 | 23 | $ | 1,130 | ||||||||||
| Shares issued on reinvestment | 177 | 2,176 | 279 | 4,126 | ||||||||||||
| Shares repurchased | (4,854) | (60,951) | (11,237) | (165,941) | ||||||||||||
| Net decrease | (4,673) | $ | (58,735) | (10,935) | $ | (160,685) | ||||||||||
| Class R | ||||||||||||||||
| Shares sold | 580 | $ | 7,352 | 3,440 | $ | 49,547 | ||||||||||
| Shares issued on reinvestment | 568 | 6,653 | 414 | 5,872 | ||||||||||||
| Shares repurchased | (3,473) | (38,575) | (411) | (5,938) | ||||||||||||
| Net increase (decrease) | (2,325) | $ | (24,570) | 3,443 | $ | 49,481 | ||||||||||
| Class I | ||||||||||||||||
| Shares sold | 7,977 | $ | 101,401 | 12,139 | $ | 171,004 | ||||||||||
| Shares issued on reinvestment | 7,007 | 82,171 | 7,038 | 99,773 | ||||||||||||
| Shares repurchased | (44,283) | (537,528) | (28,245) | (405,733) | ||||||||||||
| Net decrease | (29,299) | $ | (353,956) | (9,068) | $ | (134,956) | ||||||||||
| 70 | Franklin Multi-Asset Allocation Funds 2023 Annual Report |
8. Transactions with affiliated companies
As defined by the 1940 Act, an affiliated company is one in which the Funds own 5% or more of the outstanding voting securities, or a company which is under common ownership or control with the Funds. The following Underlying Funds were considered affiliated companies for all or some portion of the year ended January 31, 2023. The following transactions were effected in such Underlying Funds for the year ended January 31, 2023.
Affiliate Value at January 31, 2022 |
Purchased | Sold | Realized Gain (Loss) of Affiliated Underlying Funds | Income Distributions from Affiliated Underlying Funds | Capital Gain Distributions from Affiliated Underlying Funds | Net Increase (Decrease) in Unrealized Appreciation (Depreciation) | Affiliate Value at January 31, 2023 | |||||||||||||||||||||||||||||||||||||||||
| Growth Fund | Cost | Shares | Cost | Shares | ||||||||||||||||||||||||||||||||||||||||||||
| Franklin Growth Fund, Class R6 Shares |
| |||||||||||||||||||||||||||||||||||||||||||||||
| — | $ | 55,240,739 | 495,551 | $ | 3,486,720 | 31,084 | $ | 323,280 $ | 116,804 | $ | 4,503,934 | $ | (894,933) | $ | 50,859,086 | |||||||||||||||||||||||||||||||||
| BrandywineGLOBAL — Dynamic US Large Cap Value ETF(a) |
| |||||||||||||||||||||||||||||||||||||||||||||||
| $ | 33,461,089 | 2,046,423 | 170,994 | 4,936,505 | 374,521 | (90,289) | 414,583 | 3,279,874 | (2,601,612) | 27,969,395 | ||||||||||||||||||||||||||||||||||||||
| BrandywineGLOBAL — Diversified US Large Cap Value Fund, Class IS Shares |
| |||||||||||||||||||||||||||||||||||||||||||||||
| 102,574,326 | 5,904,160 | 323,243 | 45,814,174 | 2,882,561 | 8,690,827 | 827,359 | 4,586,801 | (16,705,283) | 45,959,029 | |||||||||||||||||||||||||||||||||||||||
| ClearBridge Small Cap Fund, Class IS Shares |
| |||||||||||||||||||||||||||||||||||||||||||||||
| 43,128,724 | 1,070,216 | 17,452 | 29,905,421 | 498,191 | (465,421) | 25,216 | — | (4,891,390) | 9,402,129 | |||||||||||||||||||||||||||||||||||||||
| Franklin U.S. Small Cap Equity Fund, Class IS Shares |
| |||||||||||||||||||||||||||||||||||||||||||||||
| 22,867,614 | 2,083,959 | 189,888 | 3,801,287 | 280,952 | (591,287) | 225,720 | 893,238 | (807,041) | 20,343,245 | |||||||||||||||||||||||||||||||||||||||
| ClearBridge Aggressive Growth Fund, Class IS Shares |
| |||||||||||||||||||||||||||||||||||||||||||||||
| 19,670,754 | 1,540,000 | 10,983 | 11,124,525 | 127,289 | 6,366,156 | — | — | (10,086,229) | — | |||||||||||||||||||||||||||||||||||||||
| ClearBridge Appreciation Fund, Class IS Shares |
| |||||||||||||||||||||||||||||||||||||||||||||||
| 44,869,884 | 78,177,047 | 2,790,302 | 9,454,128 | 326,401 | 125,872 | 1,206,160 | 7,650,887 | (6,549,612) | 107,043,191 | |||||||||||||||||||||||||||||||||||||||
| ClearBridge Large Cap Growth Fund, Class IS Shares |
| |||||||||||||||||||||||||||||||||||||||||||||||
| 45,344,823 | 29,309,629 | 565,271 | 5,778,221 | 80,534 | (1,223,221) | — | 4,004,629 | (9,611,011) | 59,265,220 | |||||||||||||||||||||||||||||||||||||||
| ClearBridge Mid Cap Fund, Class IS Shares |
| |||||||||||||||||||||||||||||||||||||||||||||||
| 32,166,971 | 2,412,793 | 60,009 | 16,910,879 | 781,565 | 12,100,040 | — | 12,794 | (17,668,885) | — | |||||||||||||||||||||||||||||||||||||||
| ClearBridge Small Cap Growth Fund, Class IS Shares |
| |||||||||||||||||||||||||||||||||||||||||||||||
| 4,579,560 | 5,600,000 | 156,238 | 1,063,226 | 25,568 | (93,226) | — | — | 540,962 | 9,657,296 | |||||||||||||||||||||||||||||||||||||||
| Franklin U.S. Large Cap Equity Fund, Class IS Shares |
| |||||||||||||||||||||||||||||||||||||||||||||||
| 28,727,155 | 82,517,260 | 4,988,176 | 9,129,579 | 487,552 | (619,578) | 927,260 | — | 3,312,035 | 105,426,871 | |||||||||||||||||||||||||||||||||||||||
| ClearBridge Global Infrastructure Income Fund, Class IS Shares |
| |||||||||||||||||||||||||||||||||||||||||||||||
| 8,543,273 | 49,131 | 3,275 | 7,232,658 | 613,073 | 1,456,914 | 49,130 | — | (1,359,746) | — | |||||||||||||||||||||||||||||||||||||||
| ClearBridge International Growth Fund, Class IS Shares |
| |||||||||||||||||||||||||||||||||||||||||||||||
| — | 29,971,875 | 585,306 | 3,545,207 | 69,283 | 214,792 | 236,875 | — | 3,678,109 | 30,104,777 | |||||||||||||||||||||||||||||||||||||||
| Franklin Global Market Neutral Fund, Class IS Shares |
| |||||||||||||||||||||||||||||||||||||||||||||||
| 30,816,311 | 1,026,844 | 111,415 | 24,894,773 | 2,534,078 | 1,340,228 | 831,844 | — | (1,689,017) | 5,259,365 | |||||||||||||||||||||||||||||||||||||||
| Franklin International Equity Fund, Class IS Shares |
| |||||||||||||||||||||||||||||||||||||||||||||||
| 88,312,494 | 3,350,413 | 210,379 | 36,265,513 | 2,063,354 | (5,920,512) | 1,871,867 | 53,545 | (3,161,376) | 52,236,018 | |||||||||||||||||||||||||||||||||||||||
| Martin Currie Emerging Markets Fund, Class IS Shares |
| |||||||||||||||||||||||||||||||||||||||||||||||
| 64,853,695 | 13,796,384 | 1,149,089 | 23,199,918 | 1,635,895 | (3,239,918) | 291,384 | — | (9,269,082) | 46,181,079 | |||||||||||||||||||||||||||||||||||||||
| ClearBridge International Value Fund, Class IS Shares |
| |||||||||||||||||||||||||||||||||||||||||||||||
| 41,228,165 | — | — | 34,979,704 | 3,671,252 | (1,804,069) | — | — | (6,248,461) | — | |||||||||||||||||||||||||||||||||||||||
| Franklin Global Dividend Fund, Class IS Shares |
| |||||||||||||||||||||||||||||||||||||||||||||||
| 77,770,051 | 5,943,580 | 452,336 | 10,385,101 | 823,602 | 984,899 | 1,898,914 | 1,919,667 | (6,841,602) | 66,486,928 | |||||||||||||||||||||||||||||||||||||||
| BrandywineGLOBAL — Alternative Credit Fund, Class IS Shares |
| |||||||||||||||||||||||||||||||||||||||||||||||
| 20,677,554 | 244,709 | 25,021 | 21,189,939 | 2,050,247 | (1,015,631) | 244,709 | — | 267,676 | — | |||||||||||||||||||||||||||||||||||||||
| Western Asset Core Bond Fund, Class IS Shares |
| |||||||||||||||||||||||||||||||||||||||||||||||
| — | 35,156,051 | 3,144,151 | — | — | — | 521,051 | — | (476,065) | 34,679,986 | |||||||||||||||||||||||||||||||||||||||
| Western Asset Core Plus Bond Fund, Class IS Shares |
| |||||||||||||||||||||||||||||||||||||||||||||||
| 8,670,854 | 17,728,948 | 1,668,784 | 12,975,774 | 1,093,059 | (2,065,774) | 398,949 | — | (457,141) | 12,966,887 | |||||||||||||||||||||||||||||||||||||||
| Western Asset High Yield Fund, Class IS Shares |
| |||||||||||||||||||||||||||||||||||||||||||||||
| 22,631,379 | 8,782,375 | 1,222,020 | 26,889,353 | 3,347,090 | (3,967,106) | 815,052 | — | 297,148 | 4,821,549 | |||||||||||||||||||||||||||||||||||||||
| Western Asset Macro Opportunities Fund, Class IS Shares |
| |||||||||||||||||||||||||||||||||||||||||||||||
| 12,126,434 | 1,400,000 | 155,358 | 13,186,415 | 1,249,802 | (1,987,671) | — | — | (340,019) | — | |||||||||||||||||||||||||||||||||||||||
| Franklin Multi-Asset Allocation Funds 2023 Annual Report | 71 |
Notes to financial statements (cont’d)
Growth Fund (cont’d) | Affiliate Value at January 31, 2022 |
Purchased | Sold | Realized Gain (Loss) from Sale of Affiliated Underlying Funds | Income Distributions from Affiliated Underlying Funds | Capital Gain Distributions from Affiliated Underlying Funds | Net Increase (Decrease) in Unrealized Appreciation (Depreciation) | Affiliate Value at January 31, 2023 | ||||||||||||||||||||||||||||||||||||
| Cost | Shares | Cost | Shares | |||||||||||||||||||||||||||||||||||||||||
| Franklin Strategic Real Return Fund, Class IS Shares |
| |||||||||||||||||||||||||||||||||||||||||||
| $ | 51,525,399 | $ | 4,221,542 | 453,442 | $ | 7,452,874 | 567,190 | $ | (1,117,874) | $ | 1,318,175 | $ | 2,903,367 | $ | (5,705,036) | $ | 42,589,031 | |||||||||||||||||||||||||||
| BrandywineGLOBAL — Global Opportunities Bond Fund (USD Hedged), Class IS Shares |
| |||||||||||||||||||||||||||||||||||||||||||
| 7,520,589 | — | — | 7,986,663 | 771,342 | (1,016,560) | — | — | 466,074 | — | |||||||||||||||||||||||||||||||||||
| BrandywineGLOBAL — Global Unconstrained Bond Fund, Class IS Shares |
| |||||||||||||||||||||||||||||||||||||||||||
| 12,339,484 | 148,999 | 12,927 | 6,929,415 | 548,220 | (794,415) | 78,999 | — | (27,764) | 5,531,304 | |||||||||||||||||||||||||||||||||||
| $ | 824,406,582 | $ | 387,723,077 | $ | 378,517,972 | $ | 5,590,456 | $ | 12,300,051 | $ | 29,808,736 | $ | (96,829,301) | $ | 736,782,386 | |||||||||||||||||||||||||||||
| (a) | On October 28, 2022, BrandywineGLOBAL — Dynamic US Large Cap Value Fund reorganized into Franklin Templeton ETF Trust — BrandywineGLOBAL — Dynamic US Large Cap Value ETF. |
Moderate Growth Fund | Affiliate Value at January 31, 2022 |
Purchased | Sold | Realized Gain (Loss) from Sale of Affiliated Underlying Funds | Income Distributions from Affiliated Underlying Funds | Capital Gain Distributions from Affiliated Underlying Funds | Net Increase (Decrease) in Unrealized Appreciation (Depreciation) | Affiliate Value at January 31, 2023 | ||||||||||||||||||||||||||||||||||||
| Cost | Shares | Cost | Shares | |||||||||||||||||||||||||||||||||||||||||
| Franklin Growth Fund, Class R6 Shares |
| |||||||||||||||||||||||||||||||||||||||||||
| — | $ | 30,189,613 | 270,800 | $ | 2,024,590 | 18,037 | $ | 165,409 $ | 63,565 | $ | 2,451,048 | $ | (487,432) | $ | 27,677,591 | |||||||||||||||||||||||||||||
| BrandywineGLOBAL — Dynamic US Large Cap Value ETF(a) |
| |||||||||||||||||||||||||||||||||||||||||||
| $ | 15,403,628 | 3,999,303 | 333,056 | 2,732,965 | 210,298 | (27,953) | 230,485 | 1,795,719 | (1,120,507) | 15,549,459 | ||||||||||||||||||||||||||||||||||
| BrandywineGLOBAL — Diversified US Large Cap Value Fund, Class IS Shares |
| |||||||||||||||||||||||||||||||||||||||||||
| 58,229,043 | 3,541,723 | 192,896 | 26,673,660 | 1,699,166 | 5,466,340 | 451,828 | 2,504,894 | (9,998,456) | 25,098,650 | |||||||||||||||||||||||||||||||||||
| ClearBridge Small Cap Fund, Class IS Shares |
| |||||||||||||||||||||||||||||||||||||||||||
| 17,365,253 | 554,296 | 9,041 | 10,710,446 | 178,578 | (140,446) | 14,296 | — | (1,878,494) | 5,330,609 | |||||||||||||||||||||||||||||||||||
| Franklin U.S. Small Cap Equity Fund, Class IS Shares |
| |||||||||||||||||||||||||||||||||||||||||||
| 12,069,290 | 1,446,745 | 132,209 | 1,959,800 | 144,848 | (289,800) | 122,203 | 484,542 | (398,093) | 11,158,142 | |||||||||||||||||||||||||||||||||||
| ClearBridge Aggressive Growth Fund, Class IS Shares |
| |||||||||||||||||||||||||||||||||||||||||||
| 10,630,355 | 890,000 | 6,347 | 5,759,371 | 69,200 | 3,749,446 | — | — | (5,760,984) | — | |||||||||||||||||||||||||||||||||||
| ClearBridge Appreciation Fund, Class IS Shares |
| |||||||||||||||||||||||||||||||||||||||||||
| 23,644,256 | 42,782,388 | 1,526,867 | 5,547,412 | 191,290 | 112,588 | 647,184 | 4,105,204 | (3,443,514) | 57,435,718 | |||||||||||||||||||||||||||||||||||
| ClearBridge Large Cap Growth Fund, Class IS Shares |
| |||||||||||||||||||||||||||||||||||||||||||
| 26,533,029 | 14,648,756 | 283,749 | 3,326,821 | 46,045 | (721,821) | — | 2,183,757 | (5,537,156) | 32,317,808 | |||||||||||||||||||||||||||||||||||
| ClearBridge Mid Cap Fund, Class IS Shares |
| |||||||||||||||||||||||||||||||||||||||||||
| 9,334,005 | 578,703 | 15,200 | 4,791,482 | 224,577 | 3,535,696 | — | 3,703 | (5,121,226) | — | |||||||||||||||||||||||||||||||||||
| ClearBridge Small Cap Growth Fund, Class IS Shares |
| |||||||||||||||||||||||||||||||||||||||||||
| 6,258,640 | 1,465,000 | 36,726 | 1,925,870 | 43,962 | (310,869) | — | — | (322,142) | 5,475,628 | |||||||||||||||||||||||||||||||||||
| Franklin U.S. Large Cap Equity Fund, Class IS Shares |
| |||||||||||||||||||||||||||||||||||||||||||
| 15,809,004 | 45,243,798 | 2,734,242 | 5,568,095 | 299,128 | (308,095) | 503,798 | — | 1,795,740 | 57,280,447 | |||||||||||||||||||||||||||||||||||
| ClearBridge Global Infrastructure Income Fund, Class IS Shares |
| |||||||||||||||||||||||||||||||||||||||||||
| 5,271,856 | 30,615 | 2,041 | 4,462,888 | 378,334 | 913,443 | 30,615 | — | (839,583) | — | |||||||||||||||||||||||||||||||||||
| ClearBridge International Growth Fund, Class IS Shares |
| |||||||||||||||||||||||||||||||||||||||||||
| — | 16,750,829 | 324,423 | 2,595,975 | 50,310 | 134,026 | 125,829 | — | 1,836,917 | 15,991,771 | |||||||||||||||||||||||||||||||||||
| Franklin Global Market Neutral Fund, Class IS Shares |
| |||||||||||||||||||||||||||||||||||||||||||
| 19,397,252 | 1,263,482 | 137,090 | 13,071,709 | 1,314,720 | 558,291 | 1,023,482 | — | (1,118,020) | 6,471,005 | |||||||||||||||||||||||||||||||||||
| Franklin International Equity Fund, Class IS Shares |
| |||||||||||||||||||||||||||||||||||||||||||
| 32,922,435 | 7,726,969 | 515,368 | 13,734,076 | 738,890 | (2,704,076) | 969,243 | 27,725 | 132,216 | 27,047,544 | |||||||||||||||||||||||||||||||||||
| Martin Currie Emerging Markets Fund, Class IS Shares |
| |||||||||||||||||||||||||||||||||||||||||||
| 31,169,710 | 7,074,330 | 588,418 | 8,525,728 | 585,984 | (1,370,729) | 159,330 | — | (4,466,289) | 25,252,023 | |||||||||||||||||||||||||||||||||||
| ClearBridge International Value Fund, Class IS Shares |
| |||||||||||||||||||||||||||||||||||||||||||
| 15,871,213 | — | — | 13,437,653 | 1,413,287 | 152,245 | — | — | (2,433,560) | — | |||||||||||||||||||||||||||||||||||
| Franklin Global Dividend Fund, Class IS Shares |
| |||||||||||||||||||||||||||||||||||||||||||
| 48,335,376 | 3,054,365 | 232,563 | 10,138,961 | 840,814 | 1,406,039 | 1,070,026 | 1,049,339 | (4,907,325) | 36,343,455 | |||||||||||||||||||||||||||||||||||
| BrandywineGLOBAL — Alternative Credit Fund, Class IS Shares |
| |||||||||||||||||||||||||||||||||||||||||||
| 12,934,119 | 151,057 | 15,446 | 13,247,899 | 1,282,255 | (625,648) | 151,057 | — | 162,723 | — | |||||||||||||||||||||||||||||||||||
| 72 | Franklin Multi-Asset Allocation Funds 2023 Annual Report |
Moderate Growth Fund (cont’d) | Affiliate Value at January 31, 2022 |
Purchased | Sold | Realized Gain (Loss) from Sale of Affiliated Underlying Funds | Income Distributions from Affiliated Underlying Funds | Capital Gain Distributions from Affiliated Underlying Funds | Net Increase (Decrease) in Unrealized Appreciation (Depreciation) | Affiliate Value at January 31, 2023 | ||||||||||||||||||||||||||||||||||||
| Cost | Shares | Cost | Shares | |||||||||||||||||||||||||||||||||||||||||
| Western Asset Core Bond Fund, Class IS Shares |
| |||||||||||||||||||||||||||||||||||||||||||
| $ | 14,789,523 | $ | 26,117,103 | 2,323,160 | $ | 1,072,531 | 81,718 | $ | (132,531) | $ | 767,103 | — | $ | (2,296,508) | $ | 37,537,587 | ||||||||||||||||||||||||||||
| Western Asset Core Plus Bond Fund, Class IS Shares |
| |||||||||||||||||||||||||||||||||||||||||||
| 42,530,570 | 12,599,538 | 1,208,713 | 31,825,724 | 2,856,761 | (3,680,724) | 889,538 | — | (3,482,441) | 19,821,943 | |||||||||||||||||||||||||||||||||||
| Western Asset High Yield Fund, Class IS Shares |
| |||||||||||||||||||||||||||||||||||||||||||
| 22,140,995 | 5,243,000 | 727,656 | 22,833,195 | 2,910,418 | (2,855,065) | 724,708 | — | (558,862) | 3,991,938 | |||||||||||||||||||||||||||||||||||
| Western Asset Macro Opportunities Fund, Class IS Shares |
| |||||||||||||||||||||||||||||||||||||||||||
| 7,558,622 | 805,000 | 89,230 | 8,091,137 | 771,416 | (1,033,162) | — | — | (272,485) | — | |||||||||||||||||||||||||||||||||||
| Franklin Strategic Real Return Fund, Class IS Shares |
| |||||||||||||||||||||||||||||||||||||||||||
| 31,713,616 | 2,598,381 | 279,096 | 4,530,822 | 349,062 | (620,823) | 811,343 | $ | 1,787,037 | (3,567,411) | 26,213,764 | ||||||||||||||||||||||||||||||||||
| BrandywineGLOBAL — Global Opportunities Bond Fund (USD Hedged), Class IS Shares |
| |||||||||||||||||||||||||||||||||||||||||||
| 21,495,866 | 1,495,000 | 165,725 | 13,363,642 | 1,287,441 | (1,698,642) | — | — | 271,284 | 9,898,508 | |||||||||||||||||||||||||||||||||||
| BrandywineGLOBAL — Global Unconstrained Bond Fund, Class IS Shares |
| |||||||||||||||||||||||||||||||||||||||||||
| 7,746,386 | 307,185 | 26,675 | 1,011,678 | 79,848 | (91,677) | 97,185 | — | (237,293) | 6,804,600 | |||||||||||||||||||||||||||||||||||
| $ | 509,154,042 | $ | 230,557,179 | $ | 232,964,130 | $ | (418,538) | $ | 8,852,818 | $ | 16,392,968 | $ | (54,048,901) | $ | 452,698,190 | |||||||||||||||||||||||||||||
| (a) | On October 28, 2022, BrandywineGLOBAL — Dynamic US Large Cap Value Fund reorganized into Franklin Templeton ETF Trust — BrandywineGLOBAL — Dynamic US Large Cap Value ETF. |
Conservative Growth Fund | Affiliate Value at January 31, 2022 |
Purchased | Sold | Realized Gain (Loss) from Sale of Affiliated Underlying Funds | Income Distributions from Affiliated Underlying Funds | Capital Gain Distributions from Affiliated Underlying Funds | Net Increase (Decrease) in Unrealized Appreciation (Depreciation) | Affiliate Value at January 31, 2023 | ||||||||||||||||||||||||||||||||||||
| Cost | Shares | Cost | Shares | |||||||||||||||||||||||||||||||||||||||||
| Franklin Growth Fund, Class R6 Shares |
| |||||||||||||||||||||||||||||||||||||||||||
| — | $ | 14,830,487 | 132,948 | $ | 1,500,159 | 13,283 | $ | 99,841 $ | 30,093 | $ | 1,160,393 | $ | (226,997) | $ | 13,103,331 | |||||||||||||||||||||||||||||
| BrandywineGLOBAL — Dynamic US Large Cap Value ETF(a) |
| |||||||||||||||||||||||||||||||||||||||||||
| $ | 6,519,196 | 2,666,433 | 221,480 | 1,570,138 | 122,948 | 7,537 | 106,076 | 821,066 | (459,179) | 7,156,312 | ||||||||||||||||||||||||||||||||||
| BrandywineGLOBAL — Diversified US Large Cap Value Fund, Class IS Shares |
| |||||||||||||||||||||||||||||||||||||||||||
| 18,816,799 | 1,864,934 | 100,976 | 6,488,031 | 391,308 | 1,046,969 | 211,637 | 1,173,297 | (2,437,449) | 11,756,253 | |||||||||||||||||||||||||||||||||||
| ClearBridge Small Cap Fund, Class IS Shares |
| |||||||||||||||||||||||||||||||||||||||||||
| 6,375,846 | 266,445 | 4,347 | 3,590,837 | 59,658 | (30,838) | 6,445 | — | (648,258) | 2,403,196 | |||||||||||||||||||||||||||||||||||
| Franklin U.S. Small Cap Equity Fund, Class IS Shares |
| |||||||||||||||||||||||||||||||||||||||||||
| 7,069,496 | 697,482 | 63,392 | 2,454,673 | 182,668 | (404,673) | 62,607 | 244,877 | (106,673) | 5,205,632 | |||||||||||||||||||||||||||||||||||
| ClearBridge Aggressive Growth Fund, Class IS Shares |
| |||||||||||||||||||||||||||||||||||||||||||
| 4,807,429 | 385,000 | 2,746 | 3,936,357 | 31,170 | 351,377 | — | — | (1,256,072) | — | |||||||||||||||||||||||||||||||||||
| ClearBridge Appreciation Fund, Class IS Shares |
| |||||||||||||||||||||||||||||||||||||||||||
| 17,262,257 | 15,892,717 | 566,725 | 4,186,364 | 147,592 | 198,636 | 299,287 | 1,898,431 | (2,407,759) | 26,560,851 | |||||||||||||||||||||||||||||||||||
| ClearBridge Large Cap Growth Fund, Class IS Shares |
| |||||||||||||||||||||||||||||||||||||||||||
| 14,422,820 | 5,567,806 | 108,351 | 1,887,599 | 27,877 | (307,599) | — | 1,017,806 | (3,040,337) | 15,062,690 | |||||||||||||||||||||||||||||||||||
| ClearBridge Mid Cap Fund, Class IS Shares |
| |||||||||||||||||||||||||||||||||||||||||||
| 4,707,755 | 301,854 | 7,928 | 2,005,244 | 113,530 | 2,212,375 | — | 1,854 | (3,004,365) | — | |||||||||||||||||||||||||||||||||||
| ClearBridge Small Cap Growth Fund, Class IS Shares |
| |||||||||||||||||||||||||||||||||||||||||||
| 3,982,023 | 905,000 | 22,990 | 1,592,928 | 52,023 | 302,072 | — | — | (825,551) | 2,468,544 | |||||||||||||||||||||||||||||||||||
| Franklin U.S. Large Cap Equity Fund, Class IS Shares |
| |||||||||||||||||||||||||||||||||||||||||||
| 10,665,715 | 19,042,329 | 1,150,197 | 3,685,350 | 197,872 | (170,350) | 232,329 | — | 392,512 | 26,415,206 | |||||||||||||||||||||||||||||||||||
| BrandywineGLOBAL — Alternative Credit Fund, Class IS Shares |
| |||||||||||||||||||||||||||||||||||||||||||
| 8,290,381 | 96,243 | 9,841 | 8,497,390 | 821,827 | (405,142) | 96,243 | — | 110,766 | — | |||||||||||||||||||||||||||||||||||
| Western Asset Core Bond Fund, Class IS Shares |
| |||||||||||||||||||||||||||||||||||||||||||
| 34,775,531 | 16,159,416 | 1,431,634 | 2,100,644 | 159,375 | (325,644) | 1,109,361 | — | (4,669,772) | 44,164,531 | |||||||||||||||||||||||||||||||||||
| Western Asset Core Plus Bond Fund, Class IS Shares |
| |||||||||||||||||||||||||||||||||||||||||||
| 50,696,904 | 7,204,843 | 699,082 | 29,829,149 | 2,752,708 | (2,779,149) | 1,044,843 | — | (5,317,260) | 22,755,338 | |||||||||||||||||||||||||||||||||||
| Western Asset High Yield Fund, Class IS Shares |
| |||||||||||||||||||||||||||||||||||||||||||
| 18,135,664 | 3,396,753 | 471,609 | 16,565,086 | 2,092,162 | (2,229,291) | 630,886 | — | (527,804) | 4,439,527 | |||||||||||||||||||||||||||||||||||
| Franklin Multi-Asset Allocation Funds 2023 Annual Report | 73 |
Notes to financial statements (cont’d)
Conservative Growth Fund (cont’d) | Affiliate Value at January 31, 2022 |
Purchased | Sold | Realized Gain (Loss) of Affiliated Underlying | Income Distributions from Affiliated Underlying Funds | Capital Gain Distributions from Affiliated Underlying Funds | Net Increase (Decrease) in Unrealized Appreciation (Depreciation) | Affiliate Value at January 31, 2023 | ||||||||||||||||||||||||||||||||||||
| Cost | Shares | Cost | Shares | |||||||||||||||||||||||||||||||||||||||||
| Western Asset Macro Opportunities Fund, Class IS Shares |
| |||||||||||||||||||||||||||||||||||||||||||
| $ | 4,853,492 | $ | 455,000 | 50,538 | $ | 5,090,140 | 488,579 | $ | (619,743) | — | — | $ | (218,352) | — | ||||||||||||||||||||||||||||||
ClearBridge Global Infrastructure Income Fund, Class IS Shares |
| |||||||||||||||||||||||||||||||||||||||||||
| 3,351,758 | 19,090 | 1,273 | 2,831,286 | 240,513 | 592,467 | $ | 19,090 | — | (539,562) | — | ||||||||||||||||||||||||||||||||||
| ClearBridge International Growth Fund, Class IS Shares |
| |||||||||||||||||||||||||||||||||||||||||||
| — | 7,888,586 | 152,792 | 1,860,569 | 36,058 | 84,430 | 53,586 | — | 782,273 | $ | 6,810,290 | ||||||||||||||||||||||||||||||||||
| Franklin Global Market Neutral Fund, Class IS Shares |
| |||||||||||||||||||||||||||||||||||||||||||
| 12,302,337 | 1,532,414 | 166,781 | 4,959,132 | 473,671 | (14,131) | 1,282,414 | — | (767,508) | 8,108,111 | |||||||||||||||||||||||||||||||||||
| Franklin International Equity Fund, Class IS Shares |
| |||||||||||||||||||||||||||||||||||||||||||
| 2,463,433 | 12,621,989 | 856,729 | 5,651,611 | 342,256 | (591,612) | 381,088 | $ | 10,901 | 1,200,756 | 10,634,567 | ||||||||||||||||||||||||||||||||||
| Martin Currie Emerging Markets Fund, Class IS Shares |
| |||||||||||||||||||||||||||||||||||||||||||
| 11,661,143 | 2,673,435 | 229,839 | 1,877,234 | 120,731 | (417,234) | 68,435 | — | (1,611,124) | 10,846,220 | |||||||||||||||||||||||||||||||||||
| ClearBridge International Value Fund, Class IS Shares |
| |||||||||||||||||||||||||||||||||||||||||||
| 2,492,123 | 600,000 | 52,910 | 3,068,275 | 274,826 | (415,331) | — | — | (23,848) | — | |||||||||||||||||||||||||||||||||||
| Franklin Global Dividend Fund, Class IS Shares |
| |||||||||||||||||||||||||||||||||||||||||||
| 30,658,638 | 1,329,474 | 101,075 | 11,728,292 | 1,005,651 | 1,966,709 | 546,453 | 468,021 | (4,050,093) | 16,209,727 | |||||||||||||||||||||||||||||||||||
BrandywineGLOBAL — Global Opportunities Bond Fund (USD Hedged), Class IS Shares |
| |||||||||||||||||||||||||||||||||||||||||||
| 24,503,318 | 1,070,000 | 118,312 | 3,984,490 | 382,390 | (479,490) | — | — | (1,032,213) | 20,556,615 | |||||||||||||||||||||||||||||||||||
BrandywineGLOBAL — Global Unconstrained Bond Fund, Class IS Shares |
| |||||||||||||||||||||||||||||||||||||||||||
| 4,965,551 | 4,411,825 | 394,986 | 953,732 | 75,262 | (88,732) | 121,824 | — | 106,085 | 8,529,729 | |||||||||||||||||||||||||||||||||||
| Franklin Strategic Real Return Fund, Class IS Shares |
| |||||||||||||||||||||||||||||||||||||||||||
| 20,190,095 | 1,836,137 | 194,910 | 2,946,318 | 226,990 | (391,318) | 520,251 | 1,145,886 | (2,271,085) | 16,808,829 | |||||||||||||||||||||||||||||||||||
| $ | 323,969,704 | $ | 123,715,692 | $ | 134,841,028 | $ | (2,807,864) | $ | 6,822,948 | $ | 7,942,532 | $ | (32,848,869) | $ | 279,995,499 | |||||||||||||||||||||||||||||
| (a) | On October 28, 2022, BrandywineGLOBAL — Dynamic US Large Cap Value Fund reorganized into Franklin Templeton ETF Trust — BrandywineGLOBAL — Dynamic US Large Cap Value ETF. |
Defensive Growth Fund | Affiliate Value at January 31, 2022 |
Purchased | Sold | Realized Gain (Loss) from Sale of Affiliated Underlying | Income Distributions from Affiliated Underlying Funds | Capital Gain Distributions from Affiliated Underlying Funds | Net Increase (Decrease) in Unrealized Appreciation (Depreciation) | Affiliate Value at January 31, 2023 | ||||||||||||||||||||||||||||||||||||
| Cost | Shares | Cost | Shares | |||||||||||||||||||||||||||||||||||||||||
| BrandywineGLOBAL — Alternative Credit Fund, Class IS Shares |
| |||||||||||||||||||||||||||||||||||||||||||
| $ | 3,384,818 | $ | 39,658 | 4,055 | $ | 3,468,906 | 335,575 | $ | (165,946) | $ | 39,658 | — | $ | 44,430 | — | |||||||||||||||||||||||||||||
| Western Asset Core Bond Fund, Class IS Shares |
| |||||||||||||||||||||||||||||||||||||||||||
| 27,996,215 | 3,995,219 | 353,630 | 3,611,802 | 270,347 | (616,802) | 730,186 | — | (3,203,505) | $ | 25,176,127 | ||||||||||||||||||||||||||||||||||
| Western Asset Core Plus Bond Fund, Class IS Shares |
| |||||||||||||||||||||||||||||||||||||||||||
| 30,610,558 | 2,458,352 | 242,924 | 16,083,239 | 1,570,450 | (653,239) | 618,328 | — | (4,103,278) | 12,882,393 | |||||||||||||||||||||||||||||||||||
| Western Asset High Yield Fund, Class IS Shares |
| |||||||||||||||||||||||||||||||||||||||||||
| 9,062,114 | 1,302,309 | 180,879 | 7,026,692 | 941,197 | (565,686) | 326,289 | — | (773,721) | 2,564,010 | |||||||||||||||||||||||||||||||||||
| Western Asset Macro Opportunities Fund, Class IS Shares |
| |||||||||||||||||||||||||||||||||||||||||||
| 1,975,720 | 180,000 | 20,000 | 2,077,579 | 198,314 | (262,659) | — | — | (78,141) | — | |||||||||||||||||||||||||||||||||||
| Franklin Growth Fund, Class R6 Shares |
| |||||||||||||||||||||||||||||||||||||||||||
| — | 4,030,981 | 36,113 | 549,262 | 4,854 | 30,738 | 7,861 | $ | 303,120 | (58,844) | 3,422,875 | ||||||||||||||||||||||||||||||||||
| BrandywineGLOBAL — Dynamic US Large Cap Value ETF(a) |
| |||||||||||||||||||||||||||||||||||||||||||
| 1,332,193 | 1,141,452 | 94,982 | 541,397 | 44,282 | 17,215 | 27,273 | 208,047 | (92,283) | 1,839,965 | |||||||||||||||||||||||||||||||||||
| BrandywineGLOBAL — Diversified US Large Cap Value Fund, Class IS Shares |
| |||||||||||||||||||||||||||||||||||||||||||
| 1,362,804 | 2,479,827 | 133,988 | 723,960 | 38,606 | 26,040 | 54,223 | 300,605 | (106,661) | 3,012,010 | |||||||||||||||||||||||||||||||||||
| ClearBridge Small Cap Fund, Class IS Shares |
| |||||||||||||||||||||||||||||||||||||||||||
| — | 666,703 | 10,463 | 37,594 | 589 | (2,594) | 1,703 | — | 5,822 | 634,931 | |||||||||||||||||||||||||||||||||||
| Franklin U.S. Small Cap Equity Fund, Class IS Shares |
| |||||||||||||||||||||||||||||||||||||||||||
| 1,512,543 | 199,379 | 18,422 | 303,651 | 22,451 | (43,651) | 14,978 | 59,400 | (38,983) | 1,369,288 | |||||||||||||||||||||||||||||||||||
| ClearBridge Appreciation Fund, Class IS Shares |
| |||||||||||||||||||||||||||||||||||||||||||
| 6,462,366 | 2,348,892 | 83,779 | 1,413,846 | 48,756 | 16,154 | 74,068 | 469,825 | (824,113) | 6,573,299 | |||||||||||||||||||||||||||||||||||
| 74 | Franklin Multi-Asset Allocation Funds 2023 Annual Report |
Defensive Growth Fund (cont’d) | Affiliate Value at January 31, 2022 |
Purchased | Sold | Realized Gain (Loss) from Sale of Affiliated Underlying | Income Distributions from Affiliated Underlying Funds | Capital Gain Distributions from Affiliated Underlying Funds | Net Increase (Decrease) in Unrealized Appreciation (Depreciation) | Affiliate Value at January 31, 2023 | ||||||||||||||||||||||||||||||||||||
| Cost | Shares | Cost | Shares | |||||||||||||||||||||||||||||||||||||||||
| ClearBridge Large Cap Growth Fund, Class IS Shares |
| |||||||||||||||||||||||||||||||||||||||||||
| $ | 3,605,474 | $ | 1,883,596 | 36,608 | $ | 678,009 | 10,973 | $ | (68,009) | — | $ | 273,596 | $ | (762,063) | $ | 4,048,998 | ||||||||||||||||||||||||||||
| ClearBridge Small Cap Growth Fund, Class IS Shares |
| |||||||||||||||||||||||||||||||||||||||||||
| 1,126,116 | 205,000 | 5,784 | 585,428 | 16,180 | (428) | — | — | (138,410) | 607,278 | |||||||||||||||||||||||||||||||||||
| Franklin U.S. Large Cap Equity Fund, Class IS Shares |
| |||||||||||||||||||||||||||||||||||||||||||
| 4,422,045 | 3,592,809 | 216,829 | 1,309,479 | 69,264 | (94,479) | $ | 57,808 | — | (132,739) | 6,572,636 | ||||||||||||||||||||||||||||||||||
| BrandywineGLOBAL — Global Opportunities Bond Fund (USD Hedged), Class IS Shares |
| |||||||||||||||||||||||||||||||||||||||||||
| 10,632,076 | 4,680,000 | 518,034 | 1,037,528 | 98,711 | (132,528) | — | — | (475,048) | 13,799,500 | |||||||||||||||||||||||||||||||||||
| BrandywineGLOBAL — Global Unconstrained Bond Fund, Class IS Shares |
| |||||||||||||||||||||||||||||||||||||||||||
| 2,026,695 | 3,517,066 | 315,085 | 656,044 | 51,779 | (61,044) | 72,067 | — | 158,202 | 5,045,919 | |||||||||||||||||||||||||||||||||||
| ClearBridge Global Infrastructure Income Fund, Class IS Shares |
| |||||||||||||||||||||||||||||||||||||||||||
| 1,354,995 | 7,929 | 529 | 1,146,056 | 97,245 | 240,082 | 7,929 | — | (216,868) | — | |||||||||||||||||||||||||||||||||||
| ClearBridge International Growth Fund, Class IS Shares |
| |||||||||||||||||||||||||||||||||||||||||||
| — | 2,029,995 | 39,325 | 905,607 | 17,551 | 44,393 | 9,995 | — | 145,915 | 1,270,303 | |||||||||||||||||||||||||||||||||||
| Franklin Global Market Neutral Fund, Class IS Shares |
| |||||||||||||||||||||||||||||||||||||||||||
| 4,975,709 | 1,887,695 | 193,943 | 1,518,674 | 145,050 | 6,326 | 767,695 | — | (490,946) | 4,853,784 | |||||||||||||||||||||||||||||||||||
| Franklin International Equity Fund, Class IS Shares |
| |||||||||||||||||||||||||||||||||||||||||||
| 188,259 | 2,524,872 | 172,851 | 1,244,880 | 83,468 | (4,880) | 58,206 | 1,665 | 156,037 | 1,624,288 | |||||||||||||||||||||||||||||||||||
| Martin Currie Emerging Markets Fund, Class IS Shares |
| |||||||||||||||||||||||||||||||||||||||||||
| 1,538,252 | 1,832,586 | 153,025 | 447,947 | 33,735 | (42,947) | 17,585 | — | (135,815) | 2,787,076 | |||||||||||||||||||||||||||||||||||
| ClearBridge International Value Fund, Class IS Shares |
| |||||||||||||||||||||||||||||||||||||||||||
| 194,147 | — | — | 183,398 | 17,288 | (17,219) | — | — | (10,749) | — | |||||||||||||||||||||||||||||||||||
| Franklin Global Dividend Fund, Class IS Shares |
| |||||||||||||||||||||||||||||||||||||||||||
| 9,915,328 | 377,308 | 28,632 | 4,411,513 | 380,916 | 748,488 | 158,694 | 128,614 | (1,426,626) | 4,454,497 | |||||||||||||||||||||||||||||||||||
| Franklin Strategic Real Return Fund, Class IS Shares |
| |||||||||||||||||||||||||||||||||||||||||||
| 8,416,149 | 676,435 | 72,657 | 1,362,239 | 104,957 | (187,240) | 211,217 | 465,219 | (906,130) | 6,824,215 | |||||||||||||||||||||||||||||||||||
| $ | 132,094,576 | $ | 42,058,063 | $ | 51,324,730 | $ | (1,789,915) | $ | 3,255,763 | $ | 2,210,091 | $ | (13,464,517) | $ | 109,363,392 | |||||||||||||||||||||||||||||
| (a) | On October 28, 2022, BrandywineGLOBAL — Dynamic US Large Cap Value Fund reorganized into Franklin Templeton ETF Trust — BrandywineGLOBAL — Dynamic US Large Cap Value ETF. |
9. Redemption facility
On February 4, 2022, each Fund, together with other U.S. registered and foreign investment funds (collectively, the “Borrowers”) managed by Franklin Resources or its affiliates, became a borrower in a joint syndicated senior unsecured credit facility totaling $2.675 billion (the “Global Credit Facility”). The Global Credit Facility provides a source of funds to the Borrowers for temporary and emergency purposes, including the ability to meet future unanticipated or unusually large redemption requests. Unless renewed, the Global Credit Facility will terminate on February 2, 2024.
Under the terms of the Global Credit Facility, each Fund shall, in addition to interest charged on any borrowings made by the Fund and other costs incurred by the Fund, pay its share of fees and expenses incurred in connection with the implementation and maintenance of the Global Credit Facility, based upon its relative share of the aggregate net assets of all the Borrowers, including an annual commitment fee of 0.15% based upon the unused portion of the Global Credit Facility. These fees are reflected in the Statement of Operations. The Funds did not utilize the Global Credit Facility during the year ended January 31, 2023.
| Franklin Multi-Asset Allocation Funds 2023 Annual Report | 75 |
Notes to financial statements (cont’d)
10. Income tax information and distributions to shareholders
The tax character of distributions paid during the fiscal year ended January 31, 2023 was as follows:
| Growth | Moderate Growth | Conservative Growth | Defensive Growth | |||||||||||||
| Distributions paid from: |
| |||||||||||||||
| Ordinary income | $ | 12,933,484 | $ | 8,103,002 | $ | 5,738,563 | $ | 2,608,023 | ||||||||
| Net long-term capital gains | 45,859,707 | 24,968,320 | 13,781,337 | 3,886,889 | ||||||||||||
| Total distributions paid | $ | 58,793,191 | $ | 33,071,322 | $ | 19,519,900 | $ | 6,494,912 | ||||||||
The tax character of distributions paid during the fiscal year ended January 31, 2022 was as follows:
| Growth | Moderate Growth | Conservative Growth | Defensive Growth | |||||||||||||
| Distributions paid from: | ||||||||||||||||
| Ordinary income | $ | 33,687,829 | $ | 20,806,033 | $ | 12,297,664 | $ | 4,113,048 | ||||||||
| Net long-term capital gains | 26,248,904 | 16,137,582 | 8,290,316 | 2,681,744 | ||||||||||||
| Total distributions paid | $ | 59,936,733 | $ | 36,943,615 | $ | 20,587,980 | $ | 6,794,792 | ||||||||
As of January 31, 2023, the components of distributable earnings (loss) on a tax basis were as follows:
|
| |||||||||||||||
| Growth | Moderate Growth | Conservative Growth | Defensive Growth | |||||||||||||
| Undistributed ordinary income — net | — | — | $ | 114,122 | $ | 306,951 | ||||||||||
| Undistributed long-term capital gains — net | $ | 27,347,356 | $ | 11,987,904 | 4,463,333 | — | ||||||||||
| Total undistributed earnings | $ | 27,347,356 | $ | 11,987,904 | $ | 4,577,455 | $ | 306,951 | ||||||||
| Deferred capital losses* | (203,562) | — | — | (492,462) | ||||||||||||
| Other book/tax temporary differences | (2,043,011 | )(a) | (396,668) | (a) | (31,123) | (b) | (120,525) | (a) | ||||||||
| Unrealized appreciation (depreciation)(c) | 68,475,373 | 31,159,840 | 12,143,403 | (254,878) | ||||||||||||
| Total distributable earnings (loss) — net | $ | 93,576,156 | $ | 42,751,076 | $ | 16,689,735 | $ | (560,914) | ||||||||
| * | These capital losses have been deferred in the current year as either short-term or long-term losses. The losses will be deemed to occur on the first day of the next taxable year in the same character as they were originally deferred and will be available to offset future taxable capital gains. |
| (a) | Other book/tax temporary differences are attributable to the deferral of certain late year losses for tax purposes and book/tax differences in the timing of the deductibility of various expenses. |
| (b) | Other book/tax temporary differences are attributable to book/tax differences in the timing of the deductibility of various expenses. |
| (c) | The difference between book-basis and tax-basis unrealized appreciation (depreciation) is attributable to the tax deferral of losses on wash sales. |
11. Recent accounting pronouncement
In March 2020, the Financial Accounting Standards Board (FASB) issued Accounting Standards Update (ASU) No. 2020-04, Reference Rate Reform (Topic 848) – Facilitation of the Effects of Reference Rate Reform on Financial Reporting. In January 2021, the FASB issued ASU No. 2021-01, with further amendments to Topic 848. The amendments in the ASUs provide optional temporary accounting recognition and financial reporting relief from the effect of certain types of contract modifications due to the planned discontinuation of the LIBOR and other interbank-offered based reference rates as of the end of 2021 and 2023. The ASUs are effective for certain reference rate-related contract modifications that occur during the period March 12, 2020 through December 31, 2022. Management has reviewed the requirements and believes the adoption of these ASUs will not have a material impact on the financial statements.
12. Other matters
The outbreak of the respiratory illness COVID-19 (commonly referred to as “coronavirus”) has continued to rapidly spread around the world, causing considerable uncertainty for the global economy and financial markets. The ultimate economic fallout from the pandemic, and the long-term impact on economies, markets, industries and individual issuers, are not known. The COVID-19 pandemic could adversely affect the value and liquidity of the Funds’ investments, impair the Funds’ ability to satisfy redemption requests, and negatively impact the Funds’ performance. In addition, the outbreak of COVID-19, and measures taken to mitigate its effects, could result in disruptions to the services provided to the Funds by their service providers.
* * *
| 76 | Franklin Multi-Asset Allocation Funds 2023 Annual Report |
On February 24, 2022, Russia engaged in military actions in the sovereign territory of Ukraine. The current political and financial uncertainty surrounding Russia and Ukraine may increase market volatility and the economic risk of investing in securities in these countries and may also cause uncertainty for the global economy and broader financial markets. The ultimate fallout and long-term impact from these events are not known. The Funds will continue to assess the impact on valuations and liquidity and will take any potential actions needed in accordance with procedures approved by the Board of Trustees.
| Franklin Multi-Asset Allocation Funds 2023 Annual Report | 77 |
Report of independent registered public accounting firm
To the Board of Trustees of Legg Mason Partners Investment Trust and Shareholders of Franklin Multi-Asset Growth Fund, Franklin Multi-Asset Moderate Growth Fund, Franklin Multi-Asset Conservative Growth Fund and Franklin Multi-Asset Defensive Growth Fund
Opinion on the Financial Statements
We have audited the accompanying statements of assets and liabilities, including the schedules of investments, of Franklin Multi-Asset Growth Fund, Franklin Multi-Asset Moderate Growth Fund, Franklin Multi-Asset Conservative Growth Fund and Franklin Multi-Asset Defensive Growth Fund (four of the funds constituting Legg Mason Partners Investment Trust, hereafter collectively referred to as the “Funds”) as of January 31, 2023, the related statements of operations for the year ended January 31, 2023, the statements of changes in net assets for each of the two years in the period ended January 31, 2023, including the related notes, and the financial highlights for each of the five years in the period ended January 31, 2023 (collectively referred to as the “financial statements”). In our opinion, the financial statements present fairly, in all material respects, the financial position of each of the funds as of January 31, 2023, the results of each of their operations for the year then ended, the changes in each of their net assets for each of the two years in the period ended January 31, 2023 and each of the financial highlights for each of the five years in the period ended January 31, 2023 in conformity with accounting principles generally accepted in the United States of America.
Basis for Opinions
These financial statements are the responsibility of the Funds’ management. Our responsibility is to express an opinion on the Funds’ financial statements based on our audits. We are a public accounting firm registered with the Public Company Accounting Oversight Board (United States) (“PCAOB”) and are required to be independent with respect to the Funds in accordance with the U.S. federal securities laws and the applicable rules and regulations of the Securities and Exchange Commission and the PCAOB.
We conducted our audits of these financial statements in accordance with the standards of the PCAOB. Those standards require that we plan and perform the audit to obtain reasonable assurance about whether the financial statements are free of material misstatement, whether due to error or fraud.
Our audits included performing procedures to assess the risks of material misstatement of the financial statements, whether due to error or fraud, and performing procedures that respond to those risks. Such procedures included examining, on a test basis, evidence regarding the amounts and disclosures in the financial statements. Our audits also included evaluating the accounting principles used and significant estimates made by management, as well as evaluating the overall presentation of the financial statements. Our procedures included confirmation of securities owned as of January 31, 2023 by correspondence with the custodian and transfer agent of the underlying funds. We believe that our audits provide a reasonable basis for our opinions.
/s/PricewaterhouseCoopers LLP
Baltimore, Maryland
March 21, 2023
We have served as the auditor of one or more investment companies in the Franklin Templeton Group of Funds since 1948.
| 78 | Franklin Multi-Asset Allocation Funds 2023 Annual Report |
Additional information (unaudited)
Information about Trustees and Officers
The business and affairs of Franklin Multi-Asset Allocation Funds (the “Funds”) are conducted by management under the supervision and subject to the direction of its Board of Trustees. The business address of each Trustee is c/o Jane Trust, Franklin Templeton, 100 International Drive, 11th Floor, Baltimore, Maryland 21202.
Information pertaining to the Trustees and officers of the Funds is set forth below. The Statement of Additional Information includes additional information about Trustees and is available, without charge, upon request by calling the Funds at 877-6LM-FUND/656-3863.
| Independent Trustees† | ||
| Paul R. Ades | ||
| Year of birth | 1940 | |
| Position(s) with Trust | Trustee | |
| Term of office1 and length of time served2 | Since 1983 | |
| Principal occupation(s) during the past five years | Paul R. Ades, PLLC (law firm) (since 2000) | |
| Number of funds in fund complex overseen by Trustee | 56 | |
| Other board memberships held by Trustee during the past five years | None | |
| Andrew L. Breech | ||
| Year of birth | 1952 | |
| Position(s) with Trust | Trustee | |
| Term of office1 and length of time served2 | Since 1991 | |
| Principal occupation(s) during the past five years | President, Dealer Operating Control Service, Inc. (automotive retail management) (since 1985) | |
| Number of funds in fund complex overseen by Trustee | 56 | |
| Other board memberships held by Trustee during the past five years | None | |
| Althea L. Duersten | ||
| Year of birth | 1951 | |
| Position(s) with Trust | Trustee and Chair of the Board | |
| Term of office1 and length of time served2 | Since 2014 (Chair of the Board since 2021) | |
| Principal occupation(s) during the past five years | Retired (since 2011); formerly, Chief Investment Officer, North America, JPMorgan Chase (investment bank) and member of JPMorgan Executive Committee (2007 to 2011) | |
| Number of funds in fund complex overseen by Trustee | 56 | |
| Other board memberships held by Trustee during the past five years | Formerly, Non-Executive Director, Rokos Capital Management LLP (2019 to 2020) | |
| Stephen R. Gross | ||
| Year of birth | 1947 | |
| Position(s) with Trust | Trustee | |
| Term of office1 and length of time served2 | Since 1986 | |
| Principal occupation(s) during the past five years | Chairman Emeritus (since 2011) and formerly, Chairman, HLB Gross Collins, P.C. (accounting and consulting firm) (1979 to 2011); Executive Director of Business Builders Team, LLC (since 2005); Principal, Gross Consulting Group, LLC (since 2011); CEO, Gross Capital Partners, LLC (since 2014); CEO, Trusted CFO Solutions, LLC (since 2011) | |
| Number of funds in fund complex overseen by Trustee | 56 | |
| Other board memberships held by Trustee during the past five years | None | |
| Franklin Multi-Asset Allocation Funds | 79 |
Additional information (unaudited) (cont’d)
Information about Trustees and Officers
| Independent Trustees† (cont’d) | ||
| Susan M. Heilbron | ||
| Year of birth | 1945 | |
| Position(s) with Trust | Trustee | |
| Term of office1 and length of time served2 | Since 1991 | |
| Principal occupation(s) during the past five years | Retired; formerly, President, Lacey & Heilbron (communications consulting) (1990 to 2002); General Counsel and Executive Vice President, The Trump Organization (1986 to 1990); Senior Vice President, New York State Urban Development Corporation (1984 to 1986); Associate, Cravath, Swaine & Moore LLP (1980 to 1984 and 1977 to 1979) | |
| Number of funds in fund complex overseen by Trustee | 56 | |
| Other board memberships held by Trustee during the past five years | None | |
| Arnold L. Lehman | ||
| Year of birth | 1944 | |
| Position(s) with Trust | Trustee | |
| Term of office1 and length of time served2 | Since 1982 | |
| Principal occupation(s) during the past five years | Senior Advisor, Phillips (auction house) (since 2015); formerly, Fellow, Ford Foundation (2015 to 2016); Director of the Brooklyn Museum (1997 to 2015) | |
| Number of funds in fund complex overseen by Trustee | 56 | |
| Other board memberships held by Trustee during the past five years | Trustee of American Federation of Arts (since 2002) | |
| Robin J. W. Masters | ||
| Year of birth | 1955 | |
| Position(s) with Trust | Trustee | |
| Term of office1 and length of time served2 | Since 2002 | |
| Principal occupation(s) during the past five years | Retired; formerly, Chief Investment Officer of ACE Limited (insurance) (1986 to 2000) | |
| Number of funds in fund complex overseen by Trustee | 56 | |
| Other board memberships held by Trustee during the past five years | Director of HSBC Managed Portfolios Limited and HSBC Specialist Funds Limited (since 2020); formerly, Director of Cheyne Capital International Limited (investment advisory firm) (2005 to 2020); Director/ Trustee of Legg Mason Institutional Funds plc, Western Asset Fixed Income Funds plc and Western Asset Debt Securities Fund plc. (2007 to 2011) | |
| Ken Miller | ||
| Year of birth | 1942 | |
| Position(s) with Trust | Trustee | |
| Term of office1 and length of time served2 | Since 1983 | |
| Principal occupation(s) during the past five years | Retired; formerly, President, Young Stuff Apparel Group, Inc. (apparel manufacturer), division of Li & Fung (1963 to 2012) | |
| Number of funds in fund complex overseen by Trustee | 56 | |
| Other board memberships held by Trustee during the past five years | None | |
| 80 | Franklin Multi-Asset Allocation Funds |
| Independent Trustees† (cont’d) | ||
| G. Peter O’Brien | ||
| Year of birth | 1945 | |
| Position(s) with Trust | Trustee | |
| Term of office1 and length of time served2 | Since 1999 | |
| Principal occupation(s) during the past five years | Retired, Trustee Emeritus of Colgate University (since 2005); Board Member, Hill House, Inc. (residential home care) (since 1999); formerly, Board Member, Bridges School (pre-school) (2006 to 2017); Managing Director, Equity Capital Markets Group of Merrill Lynch & Co. (1971 to 1999) | |
| Number of funds in fund complex overseen by Trustee | Trustee of Legg Mason funds consisting of 56 portfolios; Director/Trustee of the Royce Family of Funds consisting of 16 portfolios | |
| Other board memberships held by Trustee during the past five years | Formerly, Director of TICC Capital Corp. (2003 to 2017) | |
| Thomas F. Schlafly | ||
| Year of birth | 1948 | |
| Position(s) with Trust | Trustee | |
| Term of office1 and length of time served2 | Since 1983 | |
| Principal occupation(s) during the past five years | Chairman, The Saint Louis Brewery, LLC (brewery) (since 2012); formerly, President, The Saint Louis Brewery, Inc. (1989 to 2012); Senior Counsel (since 2017) and formerly, Partner (2009 to 2016), Thompson Coburn LLP (law firm) | |
| Number of funds in fund complex overseen by Trustee | 56 | |
| Other board memberships held by Trustee during the past five years | Director, CNB St. Louis Bank (since 2020); formerly, Director, Citizens National Bank of Greater St. Louis (2006 to 2020) | |
| Interested Trustee and Officer | ||
| Jane Trust, CFA3 | ||
| Year of birth | 1962 | |
| Position(s) with Trust | Trustee, President and Chief Executive Officer | |
| Term of office1 and length of time served2 | Since 2015 | |
| Principal occupation(s) during the past five years | Senior Vice President, Fund Board Management, Franklin Templeton (since 2020); Officer and/or Trustee/Director of 126 funds associated with LMPFA or its affiliates (since 2015); President and Chief Executive Officer of LMPFA (since 2015); formerly, Senior Managing Director (2018 to 2020) and Managing Director (2016 to 2018) of Legg Mason & Co., LLC (“Legg Mason & Co.”); Senior Vice President of LMPFA (2015) | |
| Number of funds in fund complex overseen by Trustee | 126 | |
| Other board memberships held by Trustee during the past five years | None | |
| Additional Officers | ||
| Ted P. Becker | ||
| Franklin Templeton | ||
| 280 Park Avenue, 8th Floor, New York, NY 10017 | ||
| Year of birth | 1951 | |
| Position(s) with Trust | Chief Compliance Officer | |
| Term of office1 and length of time served2 | Since 2007 | |
| Principal occupation(s) during the past five years | Vice President, Global Compliance of Franklin Templeton (since 2020); Chief Compliance Officer of LMPFA (since 2006); Chief Compliance Officer of certain funds associated with Legg Mason & Co. or its affiliates (since 2006); formerly, Director of Global Compliance at Legg Mason, Inc. (2006 to 2020); Managing Director of Compliance of Legg Mason & Co. (2005 to 2020) | |
| Franklin Multi-Asset Allocation Funds | 81 |
Additional information (unaudited) (cont’d)
Information about Trustees and Officers
| Additional Officers (cont’d) | ||
| Susan Kerr | ||
| Franklin Templeton | ||
| 280 Park Avenue, 8th Floor, New York, NY 10017 | ||
| Year of birth | 1949 | |
| Position(s) with Trust | Chief Anti-Money Laundering Compliance Officer | |
| Term of office1 and length of time served2 | Since 2013 | |
| Principal occupation(s) during the past five years | Senior Compliance Analyst, Franklin Templeton (since 2020); Chief Anti-Money Laundering Compliance Officer of certain funds associated with Legg Mason & Co. or its affiliates (since 2013) and Anti-Money Laundering Compliance Officer (since 2012), Senior Compliance Officer (since 2011) and Assistant Vice President (since 2010) of Franklin Distributors, LLC; formerly, Assistant Vice President of Legg Mason & Co. (2010 to 2020) | |
| Marc A. De Oliveira | ||
| Franklin Templeton | ||
| 100 First Stamford Place, 6th Floor, Stamford, CT 06902 | ||
| Year of birth | 1971 | |
| Position(s) with Trust | Secretary and Chief Legal Officer | |
| Term of office1 and length of time served2 | Since 2020 | |
| Principal occupation(s) during the past five years | Associate General Counsel of Franklin Templeton (since 2020); Assistant Secretary of certain funds associated with Legg Mason & Co. or its affiliates (since 2006); formerly, Managing Director (2016 to 2020) and Associate General Counsel of Legg Mason & Co. (2005 to 2020) | |
| Thomas C. Mandia | ||
| Franklin Templeton | ||
| 100 First Stamford Place, 6th Floor, Stamford, CT 06902 | ||
| Year of birth | 1962 | |
| Position(s) with Trust | Senior Vice President | |
| Term of office1 and length of time served2 | Since 2020 | |
| Principal occupation(s) during the past five years | Senior Associate General Counsel of Franklin Templeton (since 2020); Secretary of LMPFA (since 2006); Assistant Secretary of certain funds associated with Legg Mason & Co. or its affiliates (since 2006); Secretary of LM Asset Services, LLC (“LMAS”) (since 2002) and Legg Mason Fund Asset Management, Inc. (“LMFAM”) (since 2013) (formerly registered investment advisers); formerly, Managing Director and Deputy General Counsel of Legg Mason & Co. (2005 to 2020) | |
| Christopher Berarducci | ||
| Franklin Templeton | ||
| 280 Park Avenue, 8th Floor, New York, NY 10017 | ||
| Year of birth | 1974 | |
| Position(s) with Trust | Treasurer and Principal Financial Officer | |
| Term of office1 and length of time served2 | Since 2014 and 2019 | |
| Principal occupation(s) during the past five years | Vice President, Fund Administration and Reporting, Franklin Templeton (since 2020); Treasurer (since 2010) and Principal Financial Officer (since 2019) of certain funds associated with Legg Mason & Co. or its affiliates; formerly, Managing Director (2020), Director (2015 to 2020), and Vice President (2011 to 2015) of Legg Mason & Co. | |
| Jeanne M. Kelly | ||
| Franklin Templeton | ||
| 280 Park Avenue, 8th Floor, New York, NY 10017 | ||
| Year of birth | 1951 | |
| Position(s) with Trust | Senior Vice President | |
| Term of office1 and length of time served2 | Since 2007 | |
| Principal occupation(s) during the past five years | U.S. Fund Board Team Manager, Franklin Templeton (since 2020); Senior Vice President of certain funds associated with Legg Mason & Co. or its affiliates (since 2007); Senior Vice President of LMPFA (since 2006); President and Chief Executive Officer of LMAS and LMFAM (since 2015); formerly, Managing Director of Legg Mason & Co. (2005 to 2020); Senior Vice President of LMFAM (2013 to 2015) | |
| † | Trustees who are not “interested persons” of the Funds within the meaning of Section 2(a)(19) of the Investment Company Act of 1940, as amended (the “1940 Act”). |
| 82 | Franklin Multi-Asset Allocation Funds |
| 1 | Each Trustee and officer serves until his or her respective successor has been duly elected and qualified or until his or her earlier death, resignation, retirement or removal. |
| 2 | Indicates the earliest year in which the Trustee became a board member for a fund in the Legg Mason fund complex or the officer took such office. |
| 3 | Ms. Trust is an “interested person” of the Funds, as defined in the 1940 Act, because of her position with LMPFA and/or certain of its affiliates. |
| Franklin Multi-Asset Allocation Funds | 83 |
Important tax information (unaudited)
By mid-February, tax information related to a shareholder’s proportionate share of distributions paid during the preceding calendar year will be received, if applicable. Please also refer to www.franklintempleton.com for per share tax information related to any distributions paid during the preceding calendar year. Shareholders are advised to consult with their tax advisors for further information on the treatment of these amounts on their tax returns.
The following tax information for the Funds is required to be furnished to shareholders with respect to income earned and distributions paid during its fiscal year.
The Funds hereby report the following amounts, or if subsequently determined to be different, the maximum allowable amounts, for the fiscal year ended January 31, 2023:
| Pursuant to: | Growth | Moderate Growth | Conservative Growth | Defensive Growth | ||||||||||||||||
| Long-Term Capital Gain Dividends Distributed | § | 852(b)(3)(C) | $45,859,707 | $24,968,320 | $13,781,337 | $3,886,889 | ||||||||||||||
| Income Eligible for Dividends Received Deduction (DRD) | § | 854(b)(1)(A) | $18,701,577 | $10,170,036 | $4,788,855 | $1,236,280 | ||||||||||||||
| Qualified Dividend Income Earned (QDI) | § | 854(b)(1)(B) | $7,456,031 | $4,185,056 | $2,128,602 | $633,770 | ||||||||||||||
| Short-Term Capital Gain Dividends Distributed | § | 871(k)(2)(C) | $489,642 | $355,066 | — | $3,497 | ||||||||||||||
Under Section 853 of the Internal Revenue Code, the Funds intend to elect to pass through to its shareholders the following amounts, or amounts as finally determined, of foreign taxes paid and foreign source income earned by the Funds during the fiscal year ended January 31, 2023:
| Growth | Moderate Growth | Conservative Growth | Defensive Growth | |||||||||||||
| Foreign Taxes Paid | $ | 245,465 | $ | 128,942 | $ | 52,236 | $ | 9,408 | ||||||||
| Foreign Source Income Earned | $ | 2,724,805 | $ | 1,427,612 | $ | 577,181 | $ | 101,679 | ||||||||
| 84 | Franklin Multi-Asset Allocation Funds |
Franklin
Multi-Asset Allocation Funds
Trustees
Paul R. Ades
Andrew L. Breech
Althea L. Duersten
Chair
Stephen R. Gross
Susan M. Heilbron
Arnold L. Lehman
Robin J. W. Masters
Ken Miller
G. Peter O’Brien
Thomas F. Schlafly
Jane Trust
Investment manager
Legg Mason Partners Fund Advisor, LLC
Subadviser
Franklin Advisers, Inc.
Distributor
Franklin Distributors, LLC
Custodian
The Bank of New York Mellon
Transfer agent
Franklin Templeton Investor Services, LLC
3344 Quality Drive
Rancho Cordova, CA 95670-7313
Independent registered public accounting firm
PricewaterhouseCoopers LLP
Baltimore, MD
Franklin Multi-Asset Allocation Funds
Franklin Multi-Asset Growth Fund
Franklin Multi-Asset Moderate Growth Fund
Franklin Multi-Asset Conservative Growth Fund
Franklin Multi-Asset Defensive Growth Fund
The Funds are separate investment series of Legg Mason Partners Investment Trust, a Maryland statutory trust.
Franklin Multi-Asset Allocation Funds
Legg Mason Funds
620 Eighth Avenue, 47th Floor
New York, NY 10018
The Funds file their complete schedule of portfolio holdings with the Securities and Exchange Commission (“SEC”) for the first and third quarters of each fiscal year as an exhibit to their reports on Form N-PORT. The Funds’ Forms N-PORT are available on the SEC’s website at www.sec.gov. To obtain information on Form N-PORT, shareholders can call the Funds at 877-6LM-FUND/656-3863.
Information on how the Funds voted proxies relating to portfolio securities during the prior 12-month period ended June 30th of each year and a description of the policies and procedures that the Funds use to determine how to vote proxies related to portfolio transactions are available (1) without charge, upon request, by calling the Funds at 877-6LM-FUND/656-3863, (2) at www.franklintempleton.com and (3) on the SEC’s website at www.sec.gov.
This report is submitted for the general information of the shareholders of Franklin Multi-Asset Allocation Funds. This report is not authorized for distribution to prospective investors in the Funds unless preceded or accompanied by a current prospectus.
Investors should consider each Fund’s investment objectives, risks, charges and expenses carefully before investing. Each prospectus contains this and other important information about the Funds. Please read the prospectuses carefully before investing.
www.franklintempleton.com
© 2023 Franklin Distributors, LLC, Member FINRA/SIPC. All rights reserved.
Legg Mason Funds Privacy and Security Notice
Your Privacy Is Our Priority
Franklin Templeton* is committed to safeguarding your personal information. This notice is designed to provide you with a summary of the non-public personal information Franklin Templeton may collect and maintain about current or former individual investors; our policy regarding the use of that information; and the measures we take to safeguard the information. We do not sell individual investors’ non-public personal information to anyone and only share it as described in this notice.
Information We Collect
When you invest with us, you provide us with your non-public personal information. We collect and use this information to service your accounts and respond to your requests. The non-public personal information we may collect falls into the following categories:
| • | Information we receive from you or your financial intermediary on applications or other forms, whether we receive the form in writing or electronically. For example, this information may include your name, address, tax identification number, birth date, investment selection, beneficiary information, and your personal bank account information and/or email address if you have provided that information. |
| • | Information about your transactions and account history with us, or with other companies that are part of Franklin Templeton, including transactions you request on our website or in our app. This category also includes your communications to us concerning your investments. |
| • | Information we receive from third parties (for example, to update your address if you move, obtain or verify your email address or obtain additional information to verify your identity). |
| • | Information collected from you online, such as your IP address or device ID and data gathered from your browsing activity and location. (For example, we may use cookies to collect device and browser information so our website recognizes your online preferences and device information.) Our website contains more information about cookies and similar technologies and ways you may limit them. |
| • | Other general information that we may obtain about you such as demographic information. |
Disclosure Policy
To better service your accounts and process transactions or services you requested, we may share non-public personal information with other Franklin Templeton companies. From time to time we may also send you information about products/services offered by other Franklin Templeton companies although we will not share your non-public personal information with these companies without first offering you the opportunity to prevent that sharing.
We will only share non-public personal information with outside parties in the limited circumstances permitted by law. For example, this includes situations where we need to share information with companies who work on our behalf to service or maintain your account or process transactions you requested, when the disclosure is to companies assisting us with our own marketing efforts, when the disclosure is to a party representing you, or when required by law (for example, in response to legal process). Additionally, we will ensure that any outside companies working on our behalf, or with whom we have joint marketing agreements, are under contractual obligations to protect the confidentiality of your information, and to use it only to provide the services we asked them to perform.
Confidentiality and Security
Our employees are required to follow procedures with respect to maintaining the confidentiality of our investors’ non-public personal information. Additionally, we maintain physical, electronic and procedural safeguards to protect the information. This includes performing ongoing evaluations of our systems containing investor information and making changes when appropriate.
At all times, you may view our current privacy notice on our website at franklintempleton.com or contact us for a copy at (800) 632-2301.
| * | For purposes of this privacy notice Franklin Templeton shall refer to the following entities: |
Fiduciary Trust International of the South (FTIOS), as custodian for individual retirement plans
| NOT PART OF THE ANNUAL REPORT |
Legg Mason Funds Privacy and Security Notice (cont’d)
Franklin Advisers, Inc.
Franklin Distributors, LLC, including as program manager of the Franklin Templeton 529 College Savings Plan and the NJBEST 529 College Savings Plan
Franklin Mutual Advisers, LLC
Franklin, Templeton and Mutual Series Funds
Franklin Templeton Institutional, LLC
Franklin Templeton Investments Corp., Canada
Franklin Templeton Investments Management, Limited UK
Franklin Templeton Portfolio Advisors, Inc.
Legg Mason Funds serviced by Franklin Templeton Investor Services, LLC
Templeton Asset Management, Limited
Templeton Global Advisors, Limited
Templeton Investment Counsel, LLC
If you are a customer of other Franklin Templeton affiliates and you receive notices from them, you will need to read those notices separately.
| NOT PART OF THE ANNUAL REPORT |
www.franklintempleton.com
© 2023 Franklin Distributors, LLC, Member FINRA/SIPC. All rights reserved.
FD01278 3/23 SR23-4618
| ITEM 2. | CODE OF ETHICS. |
The registrant has adopted a code of ethics that applies to the registrant’s principal executive officer, principal financial officer, principal accounting officer or controller.
| ITEM 3. | AUDIT COMMITTEE FINANCIAL EXPERT. |
The Board of Trustees of the registrant has determined that Stephen R. Gross possesses the technical attributes identified in Instruction 2(b) of Item 3 to Form N-CSR to qualify as an “audit committee financial expert,” and has designated Stephen R. Gross as the Audit Committee’s financial expert. Stephen R. Gross is an “independent” Trustees pursuant to paragraph (a)(2) of Item 3 to Form N-CSR.
| ITEM 4. | PRINCIPAL ACCOUNTANT FEES AND SERVICES. |
a) Audit Fees. The aggregate fees billed in the last two fiscal years ending January 31, 2022 and January 31, 2023 (the “Reporting Periods”) for professional services rendered by the Registrant’s principal accountant (the “Auditor”) for the audit of the Registrant’s annual financial statements, or services that are normally provided by the Auditor in connection with the statutory and regulatory filings or engagements for the Reporting Periods, were $97,291 in January 31, 2022 and $97,291 in January 31, 2023.
b) Audit-Related Fees. The aggregate fees billed in the Reporting Period for assurance and related services by the Auditor that are reasonably related to the performance of the Registrant’s financial statements were $0 in January 31, 2022 and $0 in January 31, 2023.
(c) Tax Fees. The aggregate fees billed in the Reporting Periods for professional services rendered by the Auditor for tax compliance, tax advice and tax planning (“Tax Services”) were $39,000 in January 31, 2022 and $39,000 in January 31, 2023. These services consisted of (i) review or preparation of U.S. federal, state, local and excise tax returns; (ii) U.S. federal, state and local tax planning, advice and assistance regarding statutory, regulatory or administrative developments, and (iii) tax advice regarding tax qualification matters and/or treatment of various financial instruments held or proposed to be acquired or held.
There were no fees billed for tax services by the Auditors to service affiliates during the Reporting Periods that required pre-approval by the Audit Committee.
d) All Other Fees.
The aggregate fees billed in the Reporting Periods for products and services provided by the Auditor, other than the services reported in paragraphs (a) through (c) for the Item 4 for the Legg Mason Partners Investment Trust., were $0 in January 31, 2022 and $0 in January 31, 2023.
All Other Fees. There were no other non-audit services rendered by the Auditor to Legg Mason Partners Fund Advisors, LLC (“LMPFA”), and any entity controlling, controlled by or under common control with LMPFA that provided ongoing services to Legg Mason Partners Investment Trust requiring pre-approval by the Audit Committee in the Reporting Period.
(e) Audit Committee’s pre–approval policies and procedures described in paragraph (c) (7) of Rule 2-01 of Regulation S-X.
(1) The Charter for the Audit Committee (the “Committee”) of the Board of each registered investment company (the “Fund”) advised by LMPFA or one of their affiliates (each, an “Adviser”) requires that the Committee shall approve (a) all audit and permissible non-audit
services to be provided to the Fund and (b) all permissible non-audit services to be provided by the Fund’s independent auditors to the Adviser and any Covered Service Providers if the engagement relates directly to the operations and financial reporting of the Fund. The Committee may implement policies and procedures by which such services are approved other than by the full Committee.
The Committee shall not approve non-audit services that the Committee believes may impair the independence of the auditors. As of the date of the approval of this Audit Committee Charter, permissible non-audit services include any professional services (including tax services), that are not prohibited services as described below, provided to the Fund by the independent auditors, other than those provided to the Fund in connection with an audit or a review of the financial statements of the Fund. Permissible non-audit services may not include: (i) bookkeeping or other services related to the accounting records or financial statements of the Fund; (ii) financial information systems design and implementation; (iii) appraisal or valuation services, fairness opinions or contribution-in-kind reports; (iv) actuarial services; (v) internal audit outsourcing services; (vi) management functions or human resources; (vii) broker or dealer, investment adviser or investment banking services; (viii) legal services and expert services unrelated to the audit; and (ix) any other service the Public Company Accounting Oversight Board determines, by regulation, is impermissible.
Pre-approval by the Committee of any permissible non-audit services is not required so long as: (i) the aggregate amount of all such permissible non-audit services provided to the Fund, the Adviser and any service providers controlling, controlled by or under common control with the Adviser that provide ongoing services to the Fund (“Covered Service Providers”) constitutes not more than 5% of the total amount of revenues paid to the independent auditors during the fiscal year in which the permissible non-audit services are provided to (a) the Fund, (b) the Adviser and (c) any entity controlling, controlled by or under common control with the Adviser that provides ongoing services to the Fund during the fiscal year in which the services are provided that would have to be approved by the Committee; (ii) the permissible non-audit services were not recognized by the Fund at the time of the engagement to be non-audit services; and (iii) such services are promptly brought to the attention of the Committee and approved by the Committee (or its delegate(s)) prior to the completion of the audit.
(2) None of the services described in paragraphs (b) through (d) of this Item were performed in reliance on paragraph (c)(7)(i)(C) of Rule 2-01 of Regulation S-X.
(f) Not applicable.
(g) Non-audit fees billed by the Auditor for services rendered to Legg Mason Partners Investment Trust, LMPFA and any entity controlling, controlled by, or under common control with LMPFA that provides ongoing services to Legg Mason Partners Investment Trust during the reporting period were $1,258,748 in January 31, 2022 and $527,904 in January 31, 2023.
(h) Yes. Legg Mason Partners Investment Trust’s Audit Committee has considered whether the provision of non-audit services that were rendered to Service Affiliates, which were not pre-approved (not requiring pre-approval), is compatible with maintaining the Accountant’s independence. All services provided by the Auditor to the Legg Mason Partners Investment Trust or to Service Affiliates, which were required to be pre-approved, were pre-approved as required.
(i) Not applicable.
(j) Not applicable.
| ITEM 5. | AUDIT COMMITTEE OF LISTED REGISTRANTS. |
| a) | The independent board members are acting as the registrant’s audit committee as specified in Section 3(a)(58)(B) of the Exchange Act. The Audit Committee consists of the following Board members: |
Paul R. Ades
Andrew L. Breech
Althea L. Duersten
Stephen R. Gross
Susan M. Heilbron
Arnold L. Lehman
Robin J. W. Masters
Ken Miller
G. Peter O’Brien
Thomas F. Schlafly
| b) | Not applicable. |
| ITEM 6. | SCHEDULE OF INVESTMENTS. |
Included herein under Item 1.
| ITEM 7. | DISCLOSURE OF PROXY VOTING POLICIES AND PROCEDURES FOR CLOSED-END MANAGEMENT INVESTMENT COMPANIES. |
Not applicable.
| ITEM 8. | PORTFOLIO MANAGERS OF CLOSED-END MANAGEMENT INVESTMENT COMPANIES. |
Not applicable.
| ITEM 9. | PURCHASES OF EQUITY SECURITIES BY CLOSED-END MANAGEMENT INVESTMENT COMPANY AND AFFILIATED PURCHASERS. |
Not applicable.
| ITEM 10. | SUBMISSION OF MATTERS TO A VOTE OF SECURITY HOLDERS. |
Not applicable.
| ITEM 11. | CONTROLS AND PROCEDURES. |
| (a) | The registrant’s principal executive officer and principal financial officer have concluded that the registrant’s disclosure controls and procedures (as defined in Rule 30a- 3(c) under the Investment Company Act of 1940, as amended (the “1940 Act”)) are effective as of a date within 90 days of the filing date of this report that includes the disclosure required by this paragraph, based on their evaluation of the disclosure controls and procedures required by Rule 30a-3(b) under the 1940 Act and 15d-15(b) under the Securities Exchange Act of 1934. |
| (b) | There were no changes in the registrant’s internal control over financial reporting (as defined in Rule 30a-3(d) under the 1940 Act) that occurred during the period covered by this report that have materially affected, or are likely to materially affect the registrant’s internal control over financial reporting. |
| ITEM 12. | DISCLOSURE OF SECURITIES LENDING ACTIVITIES FOR CLOSED-END MANAGEMENT INVESTMENT COMPANIES. |
Not applicable.
| ITEM 13. | EXHIBITS. |
(a) (1) Code of Ethics attached hereto.
Exhibit 99.CODE ETH
(a) (2) Certifications pursuant to section 302 of the Sarbanes-Oxley Act of 2002 attached hereto.
Exhibit 99.CERT
(b) Certifications pursuant to Section 906 of the Sarbanes-Oxley Act of 2002 attached hereto.
Exhibit 99.906CERT
SIGNATURES
Pursuant to the requirements of the Securities Exchange Act of 1934 and the Investment Company Act of 1940, the registrant has duly caused this Report to be signed on its behalf by the undersigned, there unto duly authorized.
| Legg Mason Partners Investment Trust | ||
| By: | /s/ Jane Trust | |
| Jane Trust | ||
| Chief Executive Officer | ||
| Date: | March 27, 2023 | |
Pursuant to the requirements of the Securities Exchange Act of 1934 and the Investment Company Act of 1940, this report has been signed below by the following persons on behalf of the registrant and in the capacities and on the dates indicated.
| By: | /s/ Jane Trust | |
| Jane Trust | ||
| Chief Executive Officer | ||
| Date: | March 27, 2023 | |
| By: | /s/ Christopher Berarducci | |
| Christopher Berarducci | ||
| Principal Financial Officer | ||
| Date: | March 27, 2023 | |