UNITED STATES
SECURITIES AND EXCHANGE COMMISSION
Washington, D.C. 20549
FORM N-CSR
CERTIFIED SHAREHOLDER REPORT OF REGISTERED
MANAGEMENT INVESTMENT COMPANIES
Investment Company Act file number 811-06444
Legg Mason Partners Investment Trust
(Exact name of registrant as specified in charter)
620 Eighth Avenue,
47th Floor, New York, NY 10018
(Address of principal executive offices) (Zip code)
Marc A. De Oliveira
Franklin Templeton
100 First Stamford Place
Stamford, CT 06902
(Name and address of agent for service)
Registrant’s telephone number, including area code: 877-6LM-FUND/656-3863
Date of fiscal year end: October 31
Date of reporting period: April 30, 2024
| ITEM 1. | REPORT TO STOCKHOLDERS. |
The Semi-Annual Report to Stockholders is filed herewith.

| | |
| Semi-Annual Report | | April 30, 2024 |
CLEARBRIDGE
MID CAP FUND
The Securities and Exchange Commission has adopted new regulations that will result in changes to the design and delivery of annual and semi-annual shareholder reports beginning in July 2024.
If you have previously elected to receive shareholder reports electronically, you will continue to do so and need not take any action.
Otherwise, paper copies of the Fund’s shareholder reports will be mailed to you beginning in July 2024. If you would like to receive shareholder reports and other communications from the Fund electronically instead of by mail, you may make that request at any time by contacting your financial intermediary (such as a broker-dealer or bank) or, if you are a direct investor, enrolling at franklintempleton.com.
You may access franklintempleton.com by scanning the code below.


|
| INVESTMENT PRODUCTS: NOT FDIC INSURED • NO BANK GUARANTEE • MAY LOSE VALUE |
Fund objective
The Fund seeks long-term capital growth.
Letter from the president

Dear Shareholder,
We are pleased to provide the semi-annual report of ClearBridge Mid Cap Fund for the six-month reporting period ended April 30, 2024. Please read on for Fund performance information during the Fund’s reporting period.
As always, we remain committed to providing you with excellent service and a full spectrum of investment choices. We also remain committed to supplementing the support you receive from your financial advisor. One way we accomplish this is through our website, www.franklintempleton.com. Here you can gain immediate access to market and investment information, including:
| • | | Fund prices and performance, |
| • | | Market insights and commentaries from our portfolio managers, and |
| • | | A host of educational resources. |
We look forward to helping you meet your financial goals.
Sincerely,

Jane Trust, CFA
President and Chief Executive Officer
May 31, 2024
| | |
II | | ClearBridge Mid Cap Fund |
Performance review
For the six months ended April 30, 2024, Class A shares of ClearBridge Mid Cap Fund, excluding sales charges, returned 16.67%. The Fund’s unmanaged benchmark, the Russell Midcap Indexi, returned 22.00% for the same period.
| | | | |
Performance Snapshot as of April 30, 2024 (unaudited) | | | |
| (excluding sales charges) | | 6 months | |
| ClearBridge Mid Cap Fund: | | | | |
Class 11 | | | 16.83 | % |
Class A | | | 16.67 | % |
Class C | | | 16.20 | % |
Class R | | | 16.50 | % |
Class I | | | 16.84 | % |
Class IS | | | 16.93 | % |
| Russell Midcap Index | | | 22.00 | % |
The performance shown represents past performance. Past performance is no guarantee of future results and current performance may be higher or lower than the performance shown above. Principal value and investment returns will fluctuate and investors’ shares, when redeemed, may be worth more or less than their original cost. To obtain performance data current to the most recent month-end, please visit our website at www.franklintempleton.com.
All share class returns assume the reinvestment of all distributions, including returns of capital, if any, at net asset value and the deduction of all Fund expenses. Returns have not been adjusted to include sales charges that may apply or the deduction of taxes that a shareholder would pay on Fund distributions. If sales charges were reflected, the performance quoted would be lower. Performance figures for periods shorter than one year represent cumulative figures and are not annualized.
Fund performance figures reflect fee waivers and/or expense reimbursements, without which the performance would have been lower.
| | |
| Total Annual Operating Expenses (unaudited) |
As of the Fund’s current prospectus dated March 1, 2024, the gross total annual fund operating expense ratios for Class 1, Class A, Class C, Class R, Class I and Class IS shares were 0.85%, 1.17%, 1.88%, 1.47%, 0.87% and 0.79%, respectively.
Actual expenses may be higher. For example, expenses may be higher than those shown if average net assets decrease. Net assets are more likely to decrease and Fund expense ratios are more likely to increase when markets are volatile.
As a result of expense limitation arrangements, the ratio of total annual fund operating expenses, other than interest, brokerage commissions, taxes, extraordinary expenses and acquired fund fees and expenses, to average net assets will not exceed 1.20% for Class A shares, 1.95% for Class C shares, 1.45% for Class R shares, 0.85% for Class I shares and 0.75% for Class IS shares. In addition, the ratio of total annual fund operating expenses for Class 1 shares will not exceed the ratio of total
| 1 | Class 1 shares of the Fund are closed to all purchases or incoming exchanges. Investors owning Class 1 shares may continue to maintain their then-current Class 1 shares, but are no longer permitted to add to their Class 1 share positions, except through dividend reinvestment. |
| | |
| ClearBridge Mid Cap Fund | | III |
Performance review (cont’d)
annual fund operating expenses for Class A shares and the ratio of total annual fund operating expenses for Class IS shares will not exceed the ratio of total annual fund operating expense for Class I shares. Total annual fund operating expenses, after waiving fees and/or reimbursing expenses, exceed the expense limitation (“expense cap”) for Class R, Class I and Class IS shares as a result of acquired fund fees and expenses. These expense limitation arrangements cannot be terminated prior to December 31, 2025 without the Board of Trustees’ consent. In addition, the manager has agreed to waive the Fund’s management fee to an extent sufficient to offset the net management fee payable in connection with any investment in an affiliated money market fund. This management fee waiver is not subject to the recapture provision discussed below.
The manager is permitted to recapture amounts waived and/or reimbursed to a class during the same fiscal year if the class’ total annual fund operating expenses have fallen to a level below the expense cap in effect at the time the fees were earned or the expenses incurred. In no case will the manager recapture any amount that would result, on any particular business day of the Fund, in the class’ total annual fund operating expenses exceeding the expense cap or any other lower limit then in effect.
As always, thank you for your confidence in our stewardship of your assets.
Sincerely,
Jane Trust, CFA
President and Chief Executive Officer
May 31, 2024
RISKS: The Fund invests in equity securities, which are subject to market and price fluctuations. Mid-cap stocks may be more volatile than large-cap stocks. International investments are subject to special risks, including currency fluctuations and social, economic and political uncertainties, which could increase volatility. These risks are magnified in emerging markets. Emerging market countries tend to have economic, political and legal systems that are less developed and are less stable than those of more developed countries. The Fund may use derivatives, such as options, which can be illiquid, may disproportionately increase losses, and have a potentially large impact on Fund performance. The market values of securities or other assets will fluctuate, sometimes sharply and unpredictably, due to changes in general market conditions, overall economic trends or events, governmental actions or intervention, actions taken by the U.S. Federal Reserve or foreign central banks, market disruptions caused by trade disputes or other factors, political developments, armed conflicts, economic sanctions and countermeasures in response to sanctions, major cybersecurity events, investor sentiment, the global and domestic effects of a pandemic, and other factors that may or may not be related to the issuer of the security or other asset. Please see the Fund’s prospectus for a more complete discussion of these and other risks and the Fund’s investment strategies.
| | |
IV | | ClearBridge Mid Cap Fund |
All investments are subject to risk including the possible loss of principal. Past performance is no guarantee of future results. All index performance reflects no deduction for fees, expenses or taxes. Please note that an investor cannot invest directly in an index.
| i | The Russell Midcap Index measures the performance of the mid-cap segment of the U.S. equity universe. The Russell Midcap Index is a subset of the Russell 1000 Index. It includes approximately 800 of the smallest securities based on a combination of their market cap and current index membership. The Russell Midcap Index represents approximately 27% of the total market capitalization of the Russell 1000 companies. The Russell 1000 Index represents approximately 93% of the Russell 3000 Index. The Russell 3000 Index measures the performance of the 3,000 largest U.S. companies based on total market capitalization, which represents approximately 98% of the U.S. equity market. |
| | |
| ClearBridge Mid Cap Fund | | V |
Fund at a glance† (unaudited)
Investment breakdown (%) as a percent of total investments
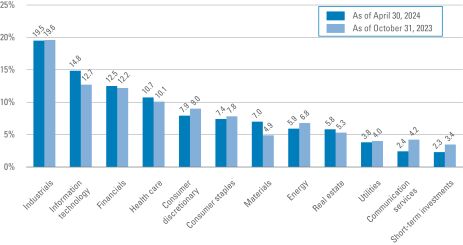
| † | The bar graph above represents the composition of the Fund’s investments as of April 30, 2024 and October 31, 2023. The Fund is actively managed. As a result, the composition of the Fund’s investments is subject to change at any time. |
| | | | |
| ClearBridge Mid Cap Fund 2024 Semi-Annual Report | | | | 1 |
Fund expenses (unaudited)
Example
As a shareholder of the Fund, you may incur two types of costs: (1) transaction costs, including front-end and back-end sales charges (loads) on purchase payments; and (2) ongoing costs, including management fees; service and/or distribution (12b-1) fees; and other Fund expenses. This example is intended to help you understand your ongoing costs (in dollars) of investing in the Fund and to compare these costs with the ongoing costs of investing in other mutual funds.
This example is based on an investment of $1,000 invested on November 1, 2023 and held for the six months ended April 30, 2024.
Actual expenses
The table below titled “Based on actual total return” provides information about actual account values and actual expenses. You may use the information provided in this table, together with the amount you invested, to estimate the expenses that you paid over the period. To estimate the expenses you paid on your account, divide your ending account value by $1,000 (for example, an $8,600 ending account value divided by $1,000 = 8.6), then multiply the result by the number under the heading entitled “Expenses Paid During the Period”.
Hypothetical example for comparison purposes
The table below titled “Based on hypothetical total return” provides information about hypothetical account values and hypothetical expenses based on the actual expense ratio and an assumed rate of return of 5.00% per year before expenses, which is not the Fund’s actual return. The hypothetical account values and expenses may not be used to estimate the actual ending account balance or expenses you paid for the period. You may use the information provided in this table to compare the ongoing costs of investing in the Fund and other funds. To do so, compare the 5.00% hypothetical example relating to the Fund with the 5.00% hypothetical examples that appear in the shareholder reports of the other funds.
Please note that the expenses shown in the table below are meant to highlight your ongoing costs only and do not reflect any transactional costs, such as front-end or back-end sales charges (loads). Therefore, the table is useful in comparing ongoing costs only, and will not help you determine the relative total costs of owning different funds. In addition, if these transaction costs were included, your costs would have been higher.
| | | | | | | | | | | | | | | | | | | | | | | | | | | | | | | | | | | | | | | | | | | | | | |
| | | |
| Based on actual total return1 | | | | | | | | | Based on hypothetical total return1 | |
| | | Actual
Total Return
Without
Sales
Charge2 | | | Beginning
Account
Value | | | Ending
Account
Value | | | Annualized
Expense
Ratio | | | Expenses
Paid
During
the
Period3 | | | | | | | | Hypothetical
Annualized
Total Return | | | Beginning
Account
Value | | | Ending
Account
Value | | | Annualized
Expense
Ratio | | | Expenses
Paid
During
the
Period3 | |
| Class 1 | | | 16.83 | % | | $ | 1,000.00 | | | $ | 1,168.30 | | | | 0.83 | % | | $ | 4.47 | | | | | | | Class 1 | | | 5.00 | % | | $ | 1,000.00 | | | $ | 1,020.74 | | | | 0.83 | % | | $ | 4.17 | |
| Class A | | | 16.67 | | | | 1,000.00 | | | | 1,166.70 | | | | 1.15 | | | | 6.20 | | | | | | | Class A | | | 5.00 | | | | 1,000.00 | | | | 1,019.14 | | | | 1.15 | | | | 5.77 | |
| Class C | | | 16.20 | | | | 1,000.00 | | | | 1,162.00 | | | | 1.89 | | | | 10.16 | | | | | | | Class C | | | 5.00 | | | | 1,000.00 | | | | 1,015.47 | | | | 1.89 | | | | 9.47 | |
| Class R | | | 16.50 | | | | 1,000.00 | | | | 1,165.00 | | | | 1.45 | | | | 7.81 | | | | | | | Class R | | | 5.00 | | | | 1,000.00 | | | | 1,017.65 | | | | 1.45 | | | | 7.27 | |
| Class I | | | 16.84 | | | | 1,000.00 | | | | 1,168.40 | | | | 0.85 | | | | 4.58 | | | | | | | Class I | | | 5.00 | | | | 1,000.00 | | | | 1,020.64 | | | | 0.85 | | | | 4.27 | |
| Class IS | | | 16.93 | | | | 1,000.00 | | | | 1,169.30 | | | | 0.75 | | | | 4.05 | | | | | | | Class IS | | | 5.00 | | | | 1,000.00 | | | | 1,021.13 | | | | 0.75 | | | | 3.77 | |
| | | | |
2 | | | | ClearBridge Mid Cap Fund 2024 Semi-Annual Report |
| 1 | For the six months ended April 30, 2024. |
| 2 | Assumes the reinvestment of all distributions, including returns of capital, if any, at net asset value and does not reflect the deduction of the applicable sales charge with respect to Class A shares or the applicable contingent deferred sales charge (“CDSC”) with respect to Class C shares. Total return is not annualized, as it may not be representative of the total return for the year. Performance figures may reflect compensating balance arrangements, fee waivers and/or expense reimbursements. In the absence of compensating balance arrangements, fee waivers and/or expense reimbursements, the total return would have been lower. Past performance is no guarantee of future results. |
| 3 | Expenses (net of compensating balance arrangements, fee waivers and/or expense reimbursements) are equal to each class’ respective annualized expense ratio multiplied by the average account value over the period, multiplied by the number of days in the most recent fiscal half-year (182), then divided by 366. |
| | | | |
| ClearBridge Mid Cap Fund 2024 Semi-Annual Report | | | | 3 |
Schedule of investments (unaudited)
April 30, 2024
ClearBridge Mid Cap Fund
(Percentages shown based on Fund net assets)
| | | | | | | | | | | | | | | | |
| Security | | | | | | | | Shares | | | Value | |
| Common Stocks — 97.8% | | | | | | | | | | | | | | | | |
| Communication Services — 2.4% | | | | | | | | | | | | | | | | |
Entertainment — 0.9% | | | | | | | | | | | | | | | | |
Live Nation Entertainment Inc. | | | | | | | | | | | 191,000 | | | $ | 16,981,810 | * |
Interactive Media & Services — 1.5% | | | | | | | | | | | | | | | | |
Pinterest Inc., Class A Shares | | | | | | | | | | | 815,000 | | | | 27,261,750 | * |
Total Communication Services | | | | | | | | | | | | | | | 44,243,560 | |
| Consumer Discretionary — 7.9% | | | | | | | | | | | | | | | | |
Automobile Components — 1.5% | | | | | | | | | | | | | | | | |
Aptiv PLC | | | | | | | | | | | 378,000 | | | | 26,838,000 | * |
Broadline Retail — 0.9% | | | | | | | | | | | | | | | | |
Etsy Inc. | | | | | | | | | | | 239,000 | | | | 16,412,130 | * |
Diversified Consumer Services — 1.0% | | | | | | | | | | | | | | | | |
Service Corp. International | | | | | | | | | | | 269,000 | | | | 19,289,990 | |
Hotels, Restaurants & Leisure — 1.7% | | | | | | | | | | | | | | | | |
Expedia Group Inc. | | | | | | | | | | | 237,000 | | | | 31,907,310 | * |
Household Durables — 1.0% | | | | | | | | | | | | | | | | |
Mohawk Industries Inc. | | | | | | | | | | | 153,000 | | | | 17,643,960 | * |
Specialty Retail — 1.8% | | | | | | | | | | | | | | | | |
Five Below Inc. | | | | | | | | | | | 100,000 | | | | 14,634,000 | * |
Ross Stores Inc. | | | | | | | | | | | 135,000 | | | | 17,489,250 | |
Total Specialty Retail | | | | | | | | | | | | | | | 32,123,250 | |
Total Consumer Discretionary | | | | | | | | | | | | | | | 144,214,640 | |
| Consumer Staples — 7.4% | | | | | | | | | | | | | | | | |
Consumer Staples Distribution & Retail — 5.5% | | | | | | | | | | | | | | | | |
Casey’s General Stores Inc. | | | | | | | | | | | 145,000 | | | | 46,339,100 | |
Performance Food Group Co. | | | | | | | | | | | 795,000 | | | | 53,964,600 | * |
Total Consumer Staples Distribution & Retail | | | | | | | | | | | | | | | 100,303,700 | |
Personal Care Products — 1.9% | | | | | | | | | | | | | | | | |
Coty Inc., Class A Shares | | | | | | | | | | | 3,050,000 | | | | 34,892,000 | * |
Total Consumer Staples | | | | | | | | | | | | | | | 135,195,700 | |
| Energy — 5.9% | | | | | | | | | | | | | | | | |
Energy Equipment & Services — 2.5% | | | | | | | | | | | | | | | | |
Baker Hughes Co. | | | | | | | | | | | 865,000 | | | | 28,216,300 | |
Noble Corp. PLC | | | | | | | | | | | 400,000 | | | | 17,752,000 | |
Total Energy Equipment & Services | | | | | | | | | | | | | | | 45,968,300 | |
Oil, Gas & Consumable Fuels — 3.4% | | | | | | | | | | | | | | | | |
Coterra Energy Inc. | | | | | | | | | | | 720,000 | | | | 19,699,200 | |
See Notes to Financial Statements.
| | | | |
4 | | | | ClearBridge Mid Cap Fund 2024 Semi-Annual Report |
ClearBridge Mid Cap Fund
(Percentages shown based on Fund net assets)
| | | | | | | | | | | | | | | | |
| Security | | | | | | | | Shares | | | Value | |
Oil, Gas & Consumable Fuels — continued | | | | | | | | | | | | | | | | |
Diamondback Energy Inc. | | | | | | | | | | | 78,000 | | | $ | 15,688,140 | |
EQT Corp. | | | | | | | | | | | 677,000 | | | | 27,140,930 | |
Total Oil, Gas & Consumable Fuels | | | | | | | | | | | | | | | 62,528,270 | |
Total Energy | | | | | | | | | | | | | | | 108,496,570 | |
| Financials — 12.6% | | | | | | | | | | | | | | | | |
Banks — 2.4% | | | | | | | | | | | | | | | | |
Fifth Third Bancorp | | | | | | | | | | | 415,000 | | | | 15,130,900 | |
PNC Financial Services Group Inc. | | | | | | | | | | | 98,000 | | | | 15,019,480 | |
US Bancorp | | | | | | | | | | | 318,000 | | | | 12,920,340 | |
Total Banks | | | | | | | | | | | | | | | 43,070,720 | |
Capital Markets — 5.1% | | | | | | | | | | | | | | | | |
Blue Owl Capital Inc. | | | | | | | | | | | 1,480,000 | | | | 27,957,200 | |
Houlihan Lokey Inc. | | | | | | | | | | | 225,000 | | | | 28,685,250 | |
KKR & Co. Inc. | | | | | | | | | | | 135,000 | | | | 12,564,450 | |
Raymond James Financial Inc. | | | | | | | | | | | 202,000 | | | | 24,644,000 | |
Total Capital Markets | | | | | | | | | | | | | | | 93,850,900 | |
Insurance — 5.1% | | | | | | | | | | | | | | | | |
Arch Capital Group Ltd. | | | | | | | | | | | 509,000 | | | | 47,611,860 | * |
Everest Group Ltd. | | | | | | | | | | | 25,000 | | | | 9,160,250 | |
Hartford Financial Services Group Inc. | | | | | | | | | | | 365,000 | | | | 35,364,850 | |
Total Insurance | | | | | | | | | | | | | | | 92,136,960 | |
Total Financials | | | | | | | | | | | | | | | 229,058,580 | |
| Health Care — 10.7% | | | | | | | | | | | | | | | | |
Biotechnology — 0.7% | | | | | | | | | | | | | | | | |
Argenx SE, ADR | | | | | | | | | | | 34,462 | | | | 12,940,481 | * |
Health Care Equipment & Supplies — 2.9% | | | | | | | | | | | | | | | | |
IDEXX Laboratories Inc. | | | | | | | | | | | 20,000 | | | | 9,855,200 | * |
STERIS PLC | | | | | | | | | | | 119,000 | | | | 24,342,640 | |
Teleflex Inc. | | | | | | | | | | | 86,000 | | | | 17,952,500 | |
Total Health Care Equipment & Supplies | | | | | | | | | | | | | | | 52,150,340 | |
Life Sciences Tools & Services — 7.1% | | | | | | | | | | | | | | | | |
Avantor Inc. | | | | | | | | | | | 2,000,000 | | | | 48,460,000 | * |
Bio-Techne Corp. | | | | | | | | | | | 287,000 | | | | 18,141,270 | |
ICON PLC | | | | | | | | | | | 212,000 | | | | 63,150,560 | * |
Total Life Sciences Tools & Services | | | | | | | | | | | | | | | 129,751,830 | |
Total Health Care | | | | | | | | | | | | | | | 194,842,651 | |
| Industrials — 19.5% | | | | | | | | | | | | | | | | |
Aerospace & Defense — 1.6% | | | | | | | | | | | | | | | | |
CAE Inc. | | | | | | | | | | | 1,480,000 | | | | 28,549,200 | * |
See Notes to Financial Statements.
| | | | |
| ClearBridge Mid Cap Fund 2024 Semi-Annual Report | | | | 5 |
Schedule of investments (unaudited) (cont’d)
April 30, 2024
ClearBridge Mid Cap Fund
(Percentages shown based on Fund net assets)
| | | | | | | | | | | | | | | | |
| Security | | | | | | | | Shares | | | Value | |
Building Products — 1.5% | | | | | | | | | | | | | | | | |
Resideo Technologies Inc. | | | | | | | | | | | 1,440,000 | | | $ | 28,123,200 | * |
Commercial Services & Supplies — 2.3% | | | | | | | | | | | | | | | | |
Clean Harbors Inc. | | | | | | | | | | | 218,000 | | | | 41,300,100 | * |
Construction & Engineering — 4.5% | | | | | | | | | | | | | | | | |
API Group Corp. | | | | | | | | | | | 850,000 | | | | 32,784,500 | * |
WillScot Mobile Mini Holdings Corp. | | | | | | | | | | | 1,325,000 | | | | 48,972,000 | * |
Total Construction & Engineering | | | | | | | | | | | | | | | 81,756,500 | |
Electrical Equipment — 6.6% | | | | | | | | | | | | | | | | |
Atkore Inc. | | | | | | | | | | | 200,000 | | | | 35,060,000 | |
Regal Rexnord Corp. | | | | | | | | | | | 323,000 | | | | 52,122,510 | |
Vertiv Holdings Co., Class A Shares | | | | | | | | | | | 350,000 | | | | 32,550,000 | |
Total Electrical Equipment | | | | | | | | | | | | | | | 119,732,510 | |
Machinery — 1.5% | | | | | | | | | | | | | | | | |
ATS Corp. | | | | | | | | | | | 85,000 | | | | 2,796,500 | * |
ATS Corp., CN | | | | | | | | | | | 773,000 | | | | 25,430,698 | * |
Total Machinery | | | | | | | | | | | | | | | 28,227,198 | |
Trading Companies & Distributors — 1.5% | | | | | | | | | | | | | | | | |
Ferguson PLC | | | | | | | | | | | 135,000 | | | | 28,336,500 | |
Total Industrials | | | | | | | | | | | | | | | 356,025,208 | |
| Information Technology — 14.8% | | | | | | | | | | | | | | | | |
Electronic Equipment, Instruments & Components — 3.9% | | | | | | | | | | | | | | | | |
Keysight Technologies Inc. | | | | | | | | | | | 218,000 | | | | 32,250,920 | * |
Teledyne Technologies Inc. | | | | | | | | | | | 102,000 | | | | 38,910,960 | * |
Total Electronic Equipment, Instruments & Components | | | | | | | | | | | | | | | 71,161,880 | |
Semiconductors & Semiconductor Equipment — 3.7% | | | | | | | | | | | | | | | | |
Entegris Inc. | | | | | | | | | | | 135,000 | | | | 17,944,200 | |
Marvell Technology Inc. | | | | | | | | | | | 760,000 | | | | 50,091,600 | |
Total Semiconductors & Semiconductor Equipment | | | | | | | | | | | | | | | 68,035,800 | |
Software — 7.2% | | | | | | | | | | | | | | | | |
AppLovin Corp., Class A Shares | | | | | | | | | | | 138,000 | | | | 9,738,660 | * |
Aspen Technology Inc. | | | | | | | | | | | 95,000 | | | | 18,702,650 | * |
Bentley Systems Inc., Class B Shares | | | | | | | | | | | 275,000 | | | | 14,445,750 | |
Freshworks Inc., Class A Shares | | | | | | | | | | | 1,240,000 | | | | 22,134,000 | * |
NCR Voyix Corp. | | | | | | | | | | | 1,300,000 | | | | 15,925,000 | * |
PTC Inc. | | | | | | | | | | | 103,000 | | | | 18,276,320 | * |
Rubrik Inc., Class A Shares | | | | | | | | | | | 342,926 | | | | 10,980,490 | * |
Workiva Inc. | | | | | | | | | | | 258,000 | | | | 20,330,400 | * |
Total Software | | | | | | | | | | | | | | | 130,533,270 | |
Total Information Technology | | | | | | | | | | | | | | | 269,730,950 | |
See Notes to Financial Statements.
| | | | |
6 | | | | ClearBridge Mid Cap Fund 2024 Semi-Annual Report |
ClearBridge Mid Cap Fund
(Percentages shown based on Fund net assets)
| | | | | | | | | | | | | | | | |
| Security | | | | | | | | Shares | | | Value | |
| Materials — 7.0% | | | | | | | | | | | | | | | | |
Chemicals — 4.8% | | | | | | | | | | | | | | | | |
Ashland Inc. | | | | | | | | | | | 543,000 | | | $ | 51,764,190 | |
Eastman Chemical Co. | | | | | | | | | | | 379,000 | | | | 35,792,760 | |
Total Chemicals | | | | | | | | | | | | | | | 87,556,950 | |
Containers & Packaging — 2.2% | | | | | | | | | | | | | | | | |
Crown Holdings Inc. | | | | | | | | | | | 485,000 | | | | 39,803,950 | |
Total Materials | | | | | | | | | | | | | | | 127,360,900 | |
| Real Estate — 5.8% | | | | | | | | | | | | | | | | |
Office REITs — 2.0% | | | | | | | | | | | | | | | | |
Alexandria Real Estate Equities Inc. | | | | | | | | | | | 315,000 | | | | 36,499,050 | |
Real Estate Management & Development — 1.6% | | | | | | | | | | | | | | | | |
CoStar Group Inc. | | | | | | | | | | | 323,000 | | | | 29,564,190 | * |
Residential REITs — 1.2% | | | | | | | | | | | | | | | | |
Sun Communities Inc. | | | | | | | | | | | 205,000 | | | | 22,820,600 | |
Retail REITs — 1.0% | | | | | | | | | | | | | | | | |
NNN REIT Inc. | | | | | | | | | | | 438,000 | | | | 17,752,140 | |
Total Real Estate | | | | | | | | | | | | | | | 106,635,980 | |
| Utilities — 3.8% | | | | | | | | | | | | | | | | |
Electric Utilities — 2.6% | | | | | | | | | | | | | | | | |
Eversource Energy | | | | | | | | | | | 325,000 | | | | 19,701,500 | |
PPL Corp. | | | | | | | | | | | 1,035,000 | | | | 28,421,100 | |
Total Electric Utilities | | | | | | | | | | | | | | | 48,122,600 | |
Multi-Utilities — 1.2% | | | | | | | | | | | | | | | | |
DTE Energy Co. | | | | | | | | | | | 200,000 | | | | 22,064,000 | |
Total Utilities | | | | | | | | | | | | | | | 70,186,600 | |
Total Investments before Short-Term Investments (Cost — $1,325,783,444) | | | | 1,785,991,339 | |
| | | | |
| | | | Rate | | | | | | | | | | | | | |
| Short-Term Investments — 2.3% | | | | | | | | | | | | | | | | |
JPMorgan 100% U.S. Treasury Securities Money Market Fund, Institutional Class | | | 5.156 | % | | | | | | | 20,823,047 | | | | 20,823,047 | (a) |
Western Asset Premier Institutional U.S. Treasury Reserves, Premium Shares | | | 5.252 | % | | | | | | | 20,823,047 | | | | 20,823,047 | (a)(b) |
Total Short-Term Investments (Cost — $41,646,094) | | | | | | | | | | | | 41,646,094 | |
Total Investments — 100.1% (Cost — $1,367,429,538) | | | | | | | | | | | | | | | 1,827,637,433 | |
Liabilities in Excess of Other Assets — (0.1)% | | | | | | | | | | | | | | | (1,896,067 | ) |
Total Net Assets — 100.0% | | | | | | | | | | | | | | $ | 1,825,741,366 | |
See Notes to Financial Statements.
| | | | |
| ClearBridge Mid Cap Fund 2024 Semi-Annual Report | | | | 7 |
Schedule of investments (unaudited) (cont’d)
April 30, 2024
ClearBridge Mid Cap Fund
| * | Non-income producing security. |
| (a) | Rate shown is one-day yield as of the end of the reporting period. |
| (b) | In this instance, as defined in the Investment Company Act of 1940, an “Affiliated Company” represents Fund ownership of at least 5% of the outstanding voting securities of an issuer, or a company which is under common ownership or control with the Fund. At April 30, 2024, the total market value of investments in Affiliated Companies was $20,823,047 and the cost was $20,823,047 (Note 8). |
| | |
Abbreviation(s) used in this schedule: |
| |
| ADR | | — American Depositary Receipts |
| |
| CN | | — Canadian National Stock Exchange |
| |
| REIT | | — Real Estate Investment Trust |
See Notes to Financial Statements.
| | | | |
8 | | | | ClearBridge Mid Cap Fund 2024 Semi-Annual Report |
Statement of assets and liabilities (unaudited)
April 30, 2024
| | | | |
| |
| Assets: | | | | |
Investments in unaffiliated securities, at value (Cost — $1,346,606,491) | | $ | 1,806,814,386 | |
Investments in affiliated securities, at value (Cost — $20,823,047) | | | 20,823,047 | |
Receivable for Fund shares sold | | | 734,904 | |
Dividends receivable from unaffiliated investments | | | 626,506 | |
Dividends receivable from affiliated investments | | | 62,021 | |
Prepaid expenses | | | 12,039 | |
Total Assets | | | 1,829,072,903 | |
| |
| Liabilities: | | | | |
Payable for Fund shares repurchased | | | 1,411,552 | |
Investment management fee payable | | | 1,129,906 | |
Transfer agent fees payable | | | 385,448 | |
Service and/or distribution fees payable | | | 275,514 | |
Trustees’ fees payable | | | 21,217 | |
Foreign currency due to custodian, at value (Cost — $87) | | | 87 | |
Accrued expenses | | | 107,813 | |
Total Liabilities | | | 3,331,537 | |
| Total Net Assets | | $ | 1,825,741,366 | |
| |
| Net Assets: | | | | |
Par value (Note 7) | | $ | 521 | |
Paid-in capital in excess of par value | | | 1,216,818,009 | |
Total distributable earnings (loss) | | | 608,922,836 | |
| Total Net Assets | | $ | 1,825,741,366 | |
See Notes to Financial Statements.
| | | | |
| ClearBridge Mid Cap Fund 2024 Semi-Annual Report | | | | 9 |
Statement of assets and liabilities (unaudited) (cont’d)
April 30, 2024
| | | | |
| |
| Net Assets: | | | | |
Class 1 | | | $3,359,230 | |
Class A | | | $1,150,948,803 | |
Class C | | | $11,859,625 | |
Class R | | | $59,881,671 | |
Class I | | | $364,501,688 | |
Class IS | | | $235,190,349 | |
| |
| Shares Outstanding: | | | | |
Class 1 | | | 93,460 | |
Class A | | | 34,430,404 | |
Class C | | | 525,127 | |
Class R | | | 1,886,140 | |
Class I | | | 9,282,326 | |
Class IS | | | 5,908,383 | |
| |
| Net Asset Value: | | | | |
Class 1 (and redemption price) | | | $35.94 | |
Class A (and redemption price) | | | $33.43 | |
Class C* | | | $22.58 | |
Class R (and redemption price) | | | $31.75 | |
Class I (and redemption price) | | | $39.27 | |
Class IS (and redemption price) | | | $39.81 | |
| Maximum Public Offering Price Per Share: | | | | |
Class A (based on maximum initial sales charge of 5.50%) | | | $35.38 | |
| * | Redemption price per share is NAV of Class C shares reduced by a 1.00% CDSC if shares are redeemed within one year from purchase payment (Note 2). |
See Notes to Financial Statements.
| | | | |
10 | | | | ClearBridge Mid Cap Fund 2024 Semi-Annual Report |
Statement of operations (unaudited)
For the Six Months Ended April 30, 2024
| | | | |
| |
| Investment Income: | | | | |
Dividends from unaffiliated investments | | $ | 10,834,236 | |
Dividends from affiliated investments | | | 375,391 | |
Total Investment Income | | | 11,209,627 | |
| |
| Expenses: | | | | |
Investment management fee (Note 2) | | | 7,009,780 | |
Service and/or distribution fees (Notes 2 and 5) | | | 1,651,062 | |
Transfer agent fees (Notes 2 and 5) | | | 1,142,135 | |
Trustees’ fees | | | 64,945 | |
Registration fees | | | 62,966 | |
Shareholder reports | | | 46,267 | |
Fund accounting fees | | | 42,680 | |
Legal fees | | | 29,102 | |
Audit and tax fees | | | 19,133 | |
Commitment fees (Note 9) | | | 8,613 | |
Insurance | | | 7,189 | |
Custody fees | | | 5,989 | |
Interest expense | | | 87 | |
Miscellaneous expenses | | | 10,920 | |
Total Expenses | | | 10,100,868 | |
Less: Fee waivers and/or expense reimbursements (Notes 2 and 5) | | | (82,859) | |
Net Expenses | | | 10,018,009 | |
| Net Investment Income | | | 1,191,618 | |
| |
| Realized and Unrealized Gain (Loss) on Investments and Foreign Currency Transactions (Notes 1 and 3): | | | | |
Net Realized Gain (Loss) From: | | | | |
Investment transactions in unaffiliated securities | | | 150,095,116 | |
Foreign currency transactions | | | (3,609) | |
Net Realized Gain | | | 150,091,507 | |
Change in Net Unrealized Appreciation (Depreciation) From Unaffiliated Investments | | | 145,218,342 | |
| Net Gain on Investments and Foreign Currency Transactions | | | 295,309,849 | |
| Increase in Net Assets From Operations | | $ | 296,501,467 | |
See Notes to Financial Statements.
| | | | |
| ClearBridge Mid Cap Fund 2024 Semi-Annual Report | | | | 11 |
Statements of changes in net assets
| | | | | | | | |
For the Six Months Ended April 30, 2024 (unaudited) and the Year Ended October 31, 2023 | | 2024 | | | 2023 | |
| | |
| Operations: | | | | | | | | |
Net investment income | | $ | 1,191,618 | | | $ | 1,887,841 | |
Net realized gain | | | 150,091,507 | | | | 39,121,455 | |
Change in net unrealized appreciation (depreciation) | | | 145,218,342 | | | | (77,575,811) | |
Increase (Decrease) in Net Assets From Operations | | | 296,501,467 | | | | (36,566,515) | |
| | |
| Distributions to Shareholders From (Notes 1 and 6): | | | | | | | | |
Total distributable earnings | | | (35,382,190) | | | | (88,592,881) | |
Decrease in Net Assets From Distributions to Shareholders | | | (35,382,190) | | | | (88,592,881) | |
| | |
| Fund Share Transactions (Note 7): | | | | | | | | |
Net proceeds from sale of shares | | | 131,494,230 | | | | 270,104,091 | |
Reinvestment of distributions | | | 34,383,957 | | | | 85,849,735 | |
Cost of shares repurchased | | | (357,929,089) | | | | (436,426,018) | |
Decrease in Net Assets From Fund Share Transactions | | | (192,050,902) | | | | (80,472,192) | |
Increase (Decrease) in Net Assets | | | 69,068,375 | | | | (205,631,588) | |
| | |
| Net Assets: | | | | | | | | |
Beginning of period | | | 1,756,672,991 | | | | 1,962,304,579 | |
End of period | | $ | 1,825,741,366 | | | $ | 1,756,672,991 | |
See Notes to Financial Statements.
| | | | |
12 | | | | ClearBridge Mid Cap Fund 2024 Semi-Annual Report |
Financial highlights
| | | | | | | | | | | | | | | | | | | | | | | | |
For a share of each class of beneficial interest outstanding throughout each year ended October 31,
unless otherwise noted: | |
| Class 1 Shares1 | | 20242 | | | 2023 | | | 2022 | | | 2021 | | | 2020 | | | 2019 | |
| | | | | | |
| Net asset value, beginning of period | | | $31.34 | | | | $33.52 | | | | $49.24 | | | | $35.25 | | | | $36.39 | | | | $33.04 | |
| | | | | | |
| Income (loss) from operations: | | | | | | | | | | | | | | | | | | | | | | | | |
Net investment income | | | 0.06 | | | | 0.10 | | | | 0.06 | | | | 0.04 | | | | 0.10 | | | | 0.16 | |
Net realized and unrealized gain (loss) | | | 5.20 | | | | (0.72) | | | | (10.39) | | | | 16.62 | | | | 1.52 | | | | 4.59 | |
Total income (loss) from operations | | | 5.26 | | | | (0.62) | | | | (10.33) | | | | 16.66 | | | | 1.62 | | | | 4.75 | |
| | | | | | |
| Less distributions from: | | | | | | | | | | | | | | | | | | | | | | | | |
Net investment income | | | (0.05) | | | | (0.09) | | | | — | | | | (0.00) | 3 | | | (0.22) | | | | (0.17) | |
Net realized gains | | | (0.61) | | | | (1.47) | | | | (5.39) | | | | (2.67) | | | | (2.54) | | | | (1.23) | |
Total distributions | | | (0.66) | | | | (1.56) | | | | (5.39) | | | | (2.67) | | | | (2.76) | | | | (1.40) | |
| | | | | | |
| Net asset value, end of period | | | $35.94 | | | | $31.34 | | | | $33.52 | | | | $49.24 | | | | $35.25 | | | | $36.39 | |
Total return4 | | | 16.83 | % | | | (2.12) | % | | | (23.33) | % | | | 49.59 | % | | | 4.57 | % | | | 15.01 | % |
| | | | | | |
| Net assets, end of period (000s) | | | $3,359 | | | | $3,065 | | | | $3,294 | | | | $4,556 | | | | $3,247 | | | | $3,700 | |
| | | | | | |
| Ratios to average net assets: | | | | | | | | | | | | | | | | | | | | | | | | |
Gross expenses | | | 0.84 | %5 | | | 0.84 | % | | | 0.82 | % | | | 0.82 | % | | | 0.86 | % | | | 0.85 | % |
Net expenses6,7 | | | 0.83 | 5 | | | 0.83 | | | | 0.82 | | | | 0.82 | | | | 0.85 | | | | 0.85 | |
Net investment income | | | 0.32 | 5 | | | 0.29 | | | | 0.14 | | | | 0.09 | | | | 0.30 | | | | 0.48 | |
| | | | | | |
| Portfolio turnover rate | | | 21 | % | | | 38 | % | | | 23 | % | | | 30 | % | | | 31 | % | | | 20 | % |
| 1 | Per share amounts have been calculated using the average shares method. |
| 2 | For the six months ended April 30, 2024 (unaudited). |
| 3 | Amount represents less than $0.005 or greater than $(0.005) per share. |
| 4 | Performance figures may reflect compensating balance arrangements, fee waivers and/or expense reimbursements. In the absence of compensating balance arrangements, fee waivers and/or expense reimbursements, the total return would have been lower. Past performance is no guarantee of future results. Total returns for periods of less than one year are not annualized. |
| 6 | As a result of an expense limitation arrangement, the ratio of total annual fund operating expenses for Class 1 shares did not exceed the ratio of total annual fund operating expenses for Class A shares. This expense limitation arrangement cannot be terminated prior to December 31, 2025 without the Board of Trustees’ consent. In addition, the manager has agreed to waive the Fund’s management fee to an extent sufficient to offset the net management fee payable in connection with any investment in an affiliated money market fund. |
| 7 | Reflects fee waivers and/or expense reimbursements. |
See Notes to Financial Statements.
| | | | |
| ClearBridge Mid Cap Fund 2024 Semi-Annual Report | | | | 13 |
Financial highlights (cont’d)
| | | | | | | | | | | | | | | | | | | | | | | | |
For a share of each class of beneficial interest outstanding throughout each year ended October 31,
unless otherwise noted: | |
| Class A Shares1 | | 20242 | | | 2023 | | | 2022 | | | 2021 | | | 2020 | | | 2019 | |
| | | | | | |
| Net asset value, beginning of period | | | $29.19 | | | | $31.33 | | | | $46.52 | | | | $33.53 | | | | $34.76 | | | | $31.60 | |
| | | | | | |
| Income (loss) from operations: | | | | | | | | | | | | | | | | | | | | | | | | |
Net investment income (loss) | | | 0.00 | 3 | | | (0.01) | | | | (0.06) | | | | (0.09) | | | | (0.01) | | | | 0.05 | |
Net realized and unrealized gain (loss) | | | 4.85 | | | | (0.66) | | | | (9.74) | | | | 15.75 | | | | 1.45 | | | | 4.40 | |
Total income (loss) from operations | | | 4.85 | | | | (0.67) | | | | (9.80) | | | | 15.66 | | | | 1.44 | | | | 4.45 | |
| | | | | | |
| Less distributions from: | | | | | | | | | | | | | | | | | | | | | | | | |
Net investment income | | | — | | | | — | | | | — | | | | — | | | | (0.13) | | | | (0.06) | |
Net realized gains | | | (0.61) | | | | (1.47) | | | | (5.39) | | | | (2.67) | | | | (2.54) | | | | (1.23) | |
Total distributions | | | (0.61) | | | | (1.47) | | | | (5.39) | | | | (2.67) | | | | (2.67) | | | | (1.29) | |
| | | | | | |
| Net asset value, end of period | | | $33.43 | | | | $29.19 | | | | $31.33 | | | | $46.52 | | | | $33.53 | | | | $34.76 | |
Total return4 | | | 16.67 | % | | | (2.43) | % | | | (23.58) | % | | | 49.11 | % | | | 4.23 | % | | | 14.66 | % |
| | | | | | |
| Net assets, end of period (millions) | | | $1,151 | | | | $1,023 | | | | $1,087 | | | | $1,411 | | | | $983 | | | | $1,043 | |
| | | | | | |
| Ratios to average net assets: | | | | | | | | | | | | | | | | | | | | | | | | |
Gross expenses | | | 1.15 | %5 | | | 1.16 | % | | | 1.14 | % | | | 1.13 | % | | | 1.18 | % | | | 1.18 | % |
Net expenses6,7 | | | 1.15 | 5 | | | 1.15 | | | | 1.14 | | | | 1.13 | | | | 1.17 | | | | 1.17 | |
Net investment income (loss) | | | 0.00 | 5,8 | | | (0.03) | | | | (0.18) | | | | (0.22) | | | | (0.02) | | | | 0.15 | |
| | | | | | |
| Portfolio turnover rate | | | 21 | % | | | 38 | % | | | 23 | % | | | 30 | % | | | 31 | % | | | 20 | % |
| 1 | Per share amounts have been calculated using the average shares method. |
| 2 | For the six months ended April 30, 2024 (unaudited). |
| 3 | Amount represents less than $0.005 or greater than $(0.005) per share. |
| 4 | Performance figures, exclusive of sales charges, may reflect compensating balance arrangements, fee waivers and/or expense reimbursements. In the absence of compensating balance arrangements, fee waivers and/or expense reimbursements, the total return would have been lower. Past performance is no guarantee of future results. Total returns for periods of less than one year are not annualized. |
| 6 | As a result of an expense limitation arrangement, the ratio of total annual fund operating expenses, other than interest, brokerage commissions, taxes, extraordinary expenses and acquired fund fees and expenses, to average net assets of Class A shares did not exceed 1.20%. This expense limitation arrangement cannot be terminated prior to December 31, 2025 without the Board of Trustees’ consent. In addition, the manager has agreed to waive the Fund’s management fee to an extent sufficient to offset the net management fee payable in connection with any investment in an affiliated money market fund. |
| 7 | Reflects fee waivers and/or expense reimbursements. |
| 8 | Amount represents less than 0.005% or greater than (0.005)%. |
See Notes to Financial Statements.
| | | | |
14 | | | | ClearBridge Mid Cap Fund 2024 Semi-Annual Report |
| | | | | | | | | | | | | | | | | | | | | | | | |
For a share of each class of beneficial interest outstanding throughout each year ended October 31,
unless otherwise noted: | |
| Class C Shares1 | | 20242 | | | 2023 | | | 2022 | | | 2021 | | | 2020 | | | 2019 | |
| | | | | | |
| Net asset value, beginning of period | | | $19.97 | | | | $22.03 | | | | $34.56 | | | | $25.68 | | | | $27.28 | | | | $25.18 | |
| | | | | | |
| Income (loss) from operations: | | | | | | | | | | | | | | | | | | | | | | | | |
Net investment loss | | | (0.08) | | | | (0.16) | | | | (0.24) | | | | (0.29) | | | | (0.18) | | | | (0.12) | |
Net realized and unrealized gain (loss) | | | 3.30 | | | | (0.43) | | | | (6.90) | | | | 11.84 | | | | 1.12 | | | | 3.45 | |
Total income (loss) from operations | | | 3.22 | | | | (0.59) | | | | (7.14) | | | | 11.55 | | | | 0.94 | | | | 3.33 | |
| | | | | | |
| Less distributions from: | | | | | | | | | | | | | | | | | | | | | | | | |
Net realized gains | | | (0.61) | | | | (1.47) | | | | (5.39) | | | | (2.67) | | | | (2.54) | | | | (1.23) | |
Total distributions | | | (0.61) | | | | (1.47) | | | | (5.39) | | | | (2.67) | | | | (2.54) | | | | (1.23) | |
| | | | | | |
| Net asset value, end of period | | | $22.58 | | | | $19.97 | | | | $22.03 | | | | $34.56 | | | | $25.68 | | | | $27.28 | |
Total return3 | | | 16.20 | % | | | (3.12) | % | | | (24.12) | % | | | 48.03 | % | | | 3.51 | % | | | 13.87 | % |
| | | | | | |
| Net assets, end of period (000s) | | | $11,860 | | | | $12,982 | | | | $19,227 | | | | $30,728 | | | | $27,205 | | | | $40,099 | |
| | | | | | |
| Ratios to average net assets: | | | | | | | | | | | | | | | | | | | | | | | | |
Gross expenses | | | 1.89 | %4 | | | 1.87 | % | | | 1.87 | % | | | 1.87 | % | | | 1.90 | % | | | 1.84 | % |
Net expenses5,6 | | | 1.89 | 4 | | | 1.86 | | | | 1.87 | | | | 1.87 | | | | 1.89 | | | | 1.84 | |
Net investment loss | | | (0.72 | )4 | | | (0.73 | ) | | | (0.93 | ) | | | (0.96 | ) | | | (0.72 | ) | | | (0.46 | ) |
| | | | | | |
| Portfolio turnover rate | | | 21 | % | | | 38 | % | | | 23 | % | | | 30 | % | | | 31 | % | | | 20 | % |
| 1 | Per share amounts have been calculated using the average shares method. |
| 2 | For the six months ended April 30, 2024 (unaudited). |
| 3 | Performance figures, exclusive of CDSC, may reflect compensating balance arrangements, fee waivers and/or expense reimbursements. In the absence of compensating balance arrangements, fee waivers and/or expense reimbursements, the total return would have been lower. Past performance is no guarantee of future results. Total returns for periods of less than one year are not annualized. |
| 5 | As a result of an expense limitation arrangement, the ratio of total annual fund operating expenses, other than interest, brokerage commissions, taxes, extraordinary expenses and acquired fund fees and expenses, to average net assets of Class C shares did not exceed 1.95%. This expense limitation arrangement cannot be terminated prior to December 31, 2025 without the Board of Trustees’ consent. In addition, the manager has agreed to waive the Fund’s management fee to an extent sufficient to offset the net management fee payable in connection with any investment in an affiliated money market fund. |
| 6 | Reflects fee waivers and/or expense reimbursements. |
See Notes to Financial Statements.
| | | | |
| ClearBridge Mid Cap Fund 2024 Semi-Annual Report | | | | 15 |
Financial highlights (cont’d)
| | | | | | | | | | | | | | | | | | | | | | | | |
For a share of each class of beneficial interest outstanding throughout each year ended October 31,
unless otherwise noted: | |
| Class R Shares1 | | 20242 | | | 2023 | | | 2022 | | | 2021 | | | 2020 | | | 2019 | |
| | | | | | |
| Net asset value, beginning of period | | | $27.79 | | | | $29.98 | | | | $44.88 | | | | $32.53 | | | | $33.80 | | | | $30.78 | |
| | | | | | |
| Income (loss) from operations: | | | | | | | | | | | | | | | | | | | | | | | | |
Net investment loss | | | (0.05) | | | | (0.10) | | | | (0.17) | | | | (0.21) | | | | (0.10) | | | | (0.04) | |
Net realized and unrealized gain (loss) | | | 4.62 | | | | (0.62) | | | | (9.34) | | | | 15.23 | | | | 1.41 | | | | 4.29 | |
Total income (loss) from operations | | | 4.57 | | | | (0.72) | | | | (9.51) | | | | 15.02 | | | | 1.31 | | | | 4.25 | |
| | | | | | |
| Less distributions from: | | | | | | | | | | | | | | | | | | | | | | | | |
Net investment income | | | — | | | | — | | | | — | | | | — | | | | (0.04) | | | | — | |
Net realized gains | | | (0.61) | | | | (1.47) | | | | (5.39) | | | | (2.67) | | | | (2.54) | | | | (1.23) | |
Total distributions | | | (0.61) | | | | (1.47) | | | | (5.39) | | | | (2.67) | | | | (2.58) | | | | (1.23) | |
| | | | | | |
| Net asset value, end of period | | | $31.75 | | | | $27.79 | | | | $29.98 | | | | $44.88 | | | | $32.53 | | | | $33.80 | |
Total return3 | | | 16.50 | % | | | (2.71) | % | | | (23.82) | % | | | 48.63 | % | | | 3.96 | % | | | 14.35 | % |
| | | | | | |
| Net assets, end of period (000s) | | | $59,882 | | | | $53,438 | | | | $57,554 | | | | $71,031 | | | | $48,683 | | | | $47,229 | |
| | | | | | |
| Ratios to average net assets: | | | | | | | | | | | | | | | | | | | | | | | | |
Gross expenses | | | 1.45 | %4 | | | 1.46 | % | | | 1.45 | % | | | 1.46 | % | | | 1.46 | % | | | 1.46 | % |
Net expenses5,6 | | | 1.45 | 4 | | | 1.45 | | | | 1.45 | | | | 1.45 | | | | 1.45 | | | | 1.45 | |
Net investment loss | | | (0.29) | 4 | | | (0.32) | | | | (0.48) | | | | (0.53) | | | | (0.31) | | | | (0.12) | |
| | | | | | |
| Portfolio turnover rate | | | 21 | % | | | 38 | % | | | 23 | % | | | 30 | % | | | 31 | % | | | 20 | % |
| 1 | Per share amounts have been calculated using the average shares method. |
| 2 | For the six months ended April 30, 2024 (unaudited). |
| 3 | Performance figures may reflect compensating balance arrangements, fee waivers and/or expense reimbursements. In the absence of compensating balance arrangements, fee waivers and/or expense reimbursements, the total return would have been lower. Past performance is no guarantee of future results. Total returns for periods of less than one year are not annualized. |
| 5 | As a result of an expense limitation arrangement, the ratio of total annual fund operating expenses, other than interest, brokerage commissions, taxes, extraordinary expenses and acquired fund fees and expenses, to average net assets of Class R shares did not exceed 1.45%. This expense limitation arrangement cannot be terminated prior to December 31, 2025 without the Board of Trustees’ consent. In addition, the manager has agreed to waive the Fund’s management fee to an extent sufficient to offset the net management fee payable in connection with any investment in an affiliated money market fund. |
| 6 | Reflects fee waivers and/or expense reimbursements. |
See Notes to Financial Statements.
| | | | |
16 | | | | ClearBridge Mid Cap Fund 2024 Semi-Annual Report |
| | | | | | | | | | | | | | | | | | | | | | | | |
For a share of each class of beneficial interest outstanding throughout each year ended October 31,
unless otherwise noted: | |
| Class I Shares1 | | 20242 | | | 2023 | | | 2022 | | | 2021 | | | 2020 | | | 2019 | |
| | | | | | |
| Net asset value, beginning of period | | | $34.18 | | | | $36.40 | | | | $53.02 | | | | $37.79 | | | | $38.80 | | | | $35.12 | |
| | | | | | |
| Income (loss) from operations: | | | | | | | | | | | | | | | | | | | | | | | | |
Net investment income | | | 0.06 | | | | 0.10 | | | | 0.05 | | | | 0.03 | | | | 0.11 | | | | 0.17 | |
Net realized and unrealized gain (loss) | | | 5.67 | | | | (0.78) | | | | (11.28) | | | | 17.87 | | | | 1.63 | | | | 4.90 | |
Total income (loss) from operations | | | 5.73 | | | | (0.68) | | | | (11.23) | | | | 17.90 | | | | 1.74 | | | | 5.07 | |
| | | | | | |
| Less distributions from: | | | | | | | | | | | | | | | | | | | | | | | | |
Net investment income | | | (0.03) | | | | (0.07) | | | | — | | | | (0.00) | 3 | | | (0.21) | | | | (0.16) | |
Net realized gains | | | (0.61) | | | | (1.47) | | | | (5.39) | | | | (2.67) | | | | (2.54) | | | | (1.23) | |
Total distributions | | | (0.64) | | | | (1.54) | | | | (5.39) | | | | (2.67) | | | | (2.75) | | | | (1.39) | |
| | | | | | |
| Net asset value, end of period | | | $39.27 | | | | $34.18 | | | | $36.40 | | | | $53.02 | | | | $37.79 | | | | $38.80 | |
Total return4 | | | 16.84 | % | | | (2.11) | % | | | (23.36) | % | | | 49.53 | % | | | 4.60 | % | | | 15.03 | % |
| | | | | | |
| Net assets, end of period (millions) | | | $365 | | | | $358 | | | | $414 | | | | $545 | | | | $345 | | | | $389 | |
| | | | | | |
| Ratios to average net assets: | | | | | | | | | | | | | | | | | | | | | | | | |
Gross expenses | | | 0.87 | %5 | | | 0.86 | % | | | 0.86 | % | | | 0.84 | % | | | 0.85 | % | | | 0.87 | % |
Net expenses6,7 | | | 0.85 | 5 | | | 0.85 | | | | 0.85 | | | | 0.84 | | | | 0.84 | | | | 0.85 | |
Net investment income | | | 0.31 | 5 | | | 0.28 | | | | 0.11 | | | | 0.07 | | | | 0.31 | | | | 0.48 | |
| | | | | | |
| Portfolio turnover rate | | | 21 | % | | | 38 | % | | | 23 | % | | | 30 | % | | | 31 | % | | | 20 | % |
| 1 | Per share amounts have been calculated using the average shares method. |
| 2 | For the six months ended April 30, 2024 (unaudited). |
| 3 | Amount represents less than $0.005 or greater than $(0.005) per share. |
| 4 | Performance figures may reflect compensating balance arrangements, fee waivers and/or expense reimbursements. In the absence of compensating balance arrangements, fee waivers and/or expense reimbursements, the total return would have been lower. Past performance is no guarantee of future results. Total returns for periods of less than one year are not annualized. |
| 6 | As a result of an expense limitation arrangement, the ratio of total annual fund operating expenses, other than interest, brokerage commissions, taxes, extraordinary expenses and acquired fund fees and expenses, to average net assets of Class I shares did not exceed 0.85%. This expense limitation arrangement cannot be terminated prior to December 31, 2025 without the Board of Trustees’ consent. In addition, the manager has agreed to waive the Fund’s management fee to an extent sufficient to offset the net management fee payable in connection with any investment in an affiliated money market fund. |
| 7 | Reflects fee waivers and/or expense reimbursements. |
See Notes to Financial Statements.
| | | | |
| ClearBridge Mid Cap Fund 2024 Semi-Annual Report | | | | 17 |
Financial highlights (cont’d)
| | | | | | | | | | | | | | | | | | | | | | | | |
For a share of each class of beneficial interest outstanding throughout each year ended October 31,
unless otherwise noted: | |
| Class IS Shares1 | | 20242 | | | 2023 | | | 2022 | | | 2021 | | | 2020 | | | 2019 | |
| | | | | | |
| Net asset value, beginning of period | | | $34.65 | | | | $36.91 | | | | $53.63 | | | | $38.17 | | | | $39.17 | | | | $35.45 | |
| | | | | | |
| Income (loss) from operations: | | | | | | | | | | | | | | | | | | | | | | | | |
Net investment income | | | 0.09 | | | | 0.14 | | | | 0.09 | | | | 0.08 | | | | 0.14 | | | | 0.21 | |
Net realized and unrealized gain (loss) | | | 5.75 | | | | (0.81) | | | | (11.42) | | | | 18.06 | | | | 1.66 | | | | 4.94 | |
Total income (loss) from operations | | | 5.84 | | | | (0.67) | | | | (11.33) | | | | 18.14 | | | | 1.80 | | | | 5.15 | |
| | | | | | |
| Less distributions from: | | | | | | | | | | | | | | | | | | | | | | | | |
Net investment income | | | (0.07) | | | | (0.12) | | | | — | | | | (0.01) | | | | (0.26) | | | | (0.20) | |
Net realized gains | | | (0.61) | | | | (1.47) | | | | (5.39) | | | | (2.67) | | | | (2.54) | | | | (1.23) | |
Total distributions | | | (0.68) | | | | (1.59) | | | | (5.39) | | | | (2.68) | | | | (2.80) | | | | (1.43) | |
| | | | | | |
| Net asset value, end of period | | | $39.81 | | | | $34.65 | | | | $36.91 | | | | $53.63 | | | | $38.17 | | | | $39.17 | |
Total return3 | | | 16.93 | % | | | (2.06) | % | | | (23.28) | % | | | 49.68 | % | | | 4.70 | % | | | 15.16 | % |
| | | | | | |
| Net assets, end of period (millions) | | | $235 | | | | $306 | | | | $381 | | | | $518 | | | | $335 | | | | $350 | |
| | | | | | |
| Ratios to average net assets: | | | | | | | | | | | | | | | | | | | | | | | | |
Gross expenses | | | 0.76 | %4 | | | 0.78 | % | | | 0.76 | % | | | 0.76 | % | | | 0.77 | % | | | 0.77 | % |
Net expenses5,6 | | | 0.75 | 4 | | | 0.75 | | | | 0.75 | | | | 0.75 | | | | 0.75 | | | | 0.75 | |
Net investment income | | | 0.44 | 4 | | | 0.38 | | | | 0.22 | | | | 0.17 | | | | 0.39 | | | | 0.58 | |
| | | | | | |
| Portfolio turnover rate | | | 21 | % | | | 38 | % | | | 23 | % | | | 30 | % | | | 31 | % | | | 20 | % |
| 1 | Per share amounts have been calculated using the average shares method. |
| 2 | For the six months ended April 30, 2024 (unaudited). |
| 3 | Performance figures may reflect compensating balance arrangements, fee waivers and/or expense reimbursements. In the absence of compensating balance arrangements, fee waivers and/or expense reimbursements, the total return would have been lower. Past performance is no guarantee of future results. Total returns for periods of less than one year are not annualized. |
| 5 | As a result of an expense limitation arrangement, the ratio of total annual fund operating expenses, other than interest, brokerage commissions, taxes, extraordinary expenses and acquired fund fees and expenses, to average net assets of Class IS shares did not exceed 0.75%. In addition, the ratio of total annual fund operating expenses for Class IS shares did not exceed the ratio of total annual fund operating expenses for Class I shares. These expense limitation arrangements cannot be terminated prior to December 31, 2025 without the Board of Trustees’ consent. In addition, the manager has agreed to waive the Fund’s management fee to an extent sufficient to offset the net management fee payable in connection with any investment in an affiliated money market fund. |
| 6 | Reflects fee waivers and/or expense reimbursements. |
See Notes to Financial Statements.
| | | | |
18 | | | | ClearBridge Mid Cap Fund 2024 Semi-Annual Report |
Notes to financial statements (unaudited)
1. Organization and significant accounting policies
ClearBridge Mid Cap Fund (the “Fund”) is a separate diversified investment series of Legg Mason Partners Investment Trust (the “Trust”). The Trust, a Maryland statutory trust, is registered under the Investment Company Act of 1940, as amended (the “1940 Act”), as an open-end management investment company.
The Fund follows the accounting and reporting guidance in Financial Accounting Standards Board (“FASB”) Accounting Standards Codification Topic 946, Financial Services – Investment Companies (“ASC 946”). The following are significant accounting policies consistently followed by the Fund and are in conformity with U.S. generally accepted accounting principles (“GAAP”), including, but not limited to, ASC 946. Estimates and assumptions are required to be made regarding assets, liabilities and changes in net assets resulting from operations when financial statements are prepared. Changes in the economic environment, financial markets and any other parameters used in determining these estimates could cause actual results to differ. Subsequent events have been evaluated through the date the financial statements were issued.
(a) Investment valuation. Equity securities for which market quotations are available are valued at the last reported sales price or official closing price on the primary market or exchange on which they trade. The valuations for fixed income securities (which may include, but are not limited to, corporate, government, municipal, mortgage-backed, collateralized mortgage obligations and asset-backed securities) and certain derivative instruments are typically the prices supplied by independent third party pricing services, which may use market prices or broker/dealer quotations or a variety of valuation techniques and methodologies. The independent third party pricing services typically use inputs that are observable such as issuer details, interest rates, yield curves, prepayment speeds, credit risks/spreads, default rates and quoted prices for similar securities. Investments in open-end funds are valued at the closing net asset value per share of each fund on the day of valuation. When the Fund holds securities or other assets that are denominated in a foreign currency, the Fund will normally use the currency exchange rates as of 4:00 p.m. (Eastern Time). If independent third party pricing services are unable to supply prices for a portfolio investment, or if the prices supplied are deemed by the manager to be unreliable, the market price may be determined by the manager using quotations from one or more broker/dealers or at the transaction price if the security has recently been purchased and no value has yet been obtained from a pricing service or pricing broker. When reliable prices are not readily available, such as when the value of a security has been significantly affected by events after the close of the exchange or market on which the security is principally traded, but before the Fund calculates its net asset value, the Fund values these securities as determined in accordance with procedures approved by the Fund’s Board of Trustees.
Pursuant to policies adopted by the Board of Trustees, the Fund’s manager has been designated as the valuation designee and is responsible for the oversight of the daily
| | | | |
| ClearBridge Mid Cap Fund 2024 Semi-Annual Report | | | | 19 |
Notes to financial statements (unaudited) (cont’d)
valuation process. The Fund’s manager is assisted by the Global Fund Valuation Committee (the “Valuation Committee”). The Valuation Committee is responsible for making fair value determinations, evaluating the effectiveness of the Fund’s pricing policies, and reporting to the Fund’s manager and the Board of Trustees. When determining the reliability of third party pricing information for investments owned by the Fund, the Valuation Committee, among other things, conducts due diligence reviews of pricing vendors, monitors the daily change in prices and reviews transactions among market participants.
The Valuation Committee will consider pricing methodologies it deems relevant and appropriate when making fair value determinations. Examples of possible methodologies include, but are not limited to, multiple of earnings; discount from market of a similar freely traded security; discounted cash-flow analysis; book value or a multiple thereof; risk premium/yield analysis; yield to maturity; and/or fundamental investment analysis. The Valuation Committee will also consider factors it deems relevant and appropriate in light of the facts and circumstances. Examples of possible factors include, but are not limited to, the type of security; the issuer’s financial statements; the purchase price of the security; the discount from market value of unrestricted securities of the same class at the time of purchase; analysts’ research and observations from financial institutions; information regarding any transactions or offers with respect to the security; the existence of merger proposals or tender offers affecting the security; the price and extent of public trading in similar securities of the issuer or comparable companies; and the existence of a shelf registration for restricted securities.
For each portfolio security that has been fair valued pursuant to the policies adopted by the Board of Trustees, the fair value price is compared against the last available and next available market quotations. The Valuation Committee reviews the results of such back testing monthly and fair valuation occurrences are reported to the Board of Trustees quarterly.
The Fund uses valuation techniques to measure fair value that are consistent with the market approach and/or income approach, depending on the type of security and the particular circumstance. The market approach uses prices and other relevant information generated by market transactions involving identical or comparable securities. The income approach uses valuation techniques to discount estimated future cash flows to present value.
| | | | |
20 | | | | ClearBridge Mid Cap Fund 2024 Semi-Annual Report |
GAAP establishes a disclosure hierarchy that categorizes the inputs to valuation techniques used to value assets and liabilities at measurement date. These inputs are summarized in the three broad levels listed below:
| • | | Level 1 — unadjusted quoted prices in active markets for identical investments |
| • | | Level 2 — other significant observable inputs (including quoted prices for similar investments, interest rates, prepayment speeds, credit risk, etc.) |
| • | | Level 3 — significant unobservable inputs (including the Fund’s own assumptions in determining the fair value of investments) |
The inputs or methodologies used to value securities are not necessarily an indication of the risk associated with investing in those securities.
The following is a summary of the inputs used in valuing the Fund’s assets carried at fair value:
| | | | | | | | | | | | | | | | |
| ASSETS | |
| Description | | Quoted Prices
(Level 1) | | | Other Significant
Observable Inputs
(Level 2) | | | Significant
Unobservable
Inputs
(Level 3) | | | Total | |
| Common Stocks† | | $ | 1,785,991,339 | | | | — | | | | — | | | $ | 1,785,991,339 | |
| Short-Term Investments† | | | 41,646,094 | | | | — | | | | — | | | | 41,646,094 | |
| Total Investments | | $ | 1,827,637,433 | | | | — | | | | — | | | $ | 1,827,637,433 | |
| † | See Schedule of Investments for additional detailed categorizations. |
(b) Foreign currency translation. Investment securities and other assets and liabilities denominated in foreign currencies are translated into U.S. dollar amounts based upon prevailing exchange rates on the date of valuation. Purchases and sales of investment securities and income and expense items denominated in foreign currencies are translated into U.S. dollar amounts based upon prevailing exchange rates on the respective dates of such transactions.
The Fund does not isolate that portion of the results of operations resulting from fluctuations in foreign exchange rates on investments from the fluctuations arising from changes in market prices of securities held. Such fluctuations are included with the net realized and unrealized gain or loss on investments.
Net realized foreign exchange gains or losses arise from sales of foreign currencies, including gains and losses on forward foreign currency contracts, currency gains or losses realized between the trade and settlement dates on securities transactions, and the difference between the amounts of dividends, interest, and foreign withholding taxes recorded on the Fund’s books and the U.S. dollar equivalent of the amounts actually received or paid. Net unrealized foreign exchange gains and losses arise from changes in
| | | | |
| ClearBridge Mid Cap Fund 2024 Semi-Annual Report | | | | 21 |
Notes to financial statements (unaudited) (cont’d)
the values of assets and liabilities, other than investments in securities, on the date of valuation, resulting from changes in exchange rates.
Foreign security and currency transactions may involve certain considerations and risks not typically associated with those of U.S. dollar denominated transactions as a result of, among other factors, the possibility of lower levels of governmental supervision and regulation of foreign securities markets and the possibility of political or economic instability.
(c) Foreign investment risks. The Fund’s investments in foreign securities may involve risks not present in domestic investments. Since securities may be denominated in foreign currencies, may require settlement in foreign currencies or may pay interest or dividends in foreign currencies, changes in the relationship of these foreign currencies to the U.S. dollar can significantly affect the value of the investments and earnings of the Fund. Foreign investments may also subject the Fund to foreign government exchange restrictions, expropriation, taxation or other political, social or economic developments, all of which affect the market and/or credit risk of the investments.
(d) Security transactions and investment income. Security transactions are accounted for on a trade date basis. Interest income (including interest income from payment-in-kind securities) is recorded on the accrual basis. Amortization of premiums and accretion of discounts on debt securities are recorded to interest income over the lives of the respective securities, except for premiums on certain callable debt securities, which are amortized to the earliest call date. Dividend income is recorded on the ex-dividend date for dividends received in cash and/or securities. Foreign dividend income is recorded on the ex-dividend date or as soon as practicable after the Fund determines the existence of a dividend declaration after exercising reasonable due diligence. The cost of investments sold is determined by use of the specific identification method. To the extent any issuer defaults or a credit event occurs that impacts the issuer, the Fund may halt any additional interest income accruals and consider the realizability of interest accrued up to the date of default or credit event.
(e) REIT distributions. The character of distributions received from Real Estate Investment Trusts (‘‘REITs’’) held by the Fund is generally comprised of net investment income, capital gains, and return of capital. It is the policy of the Fund to estimate the character of distributions received from underlying REITs based on historical data provided by the REITs. After each calendar year end, REITs report the actual tax character of these distributions. Differences between the estimated and actual amounts reported by the REITs are reflected in the Fund’s records in the year in which they are reported by the REITs by adjusting related investment cost basis, capital gains and income, as necessary.
(f) Distributions to shareholders. Distributions from net investment income and distributions of net realized gains, if any, are declared at least annually. Distributions to
| | | | |
22 | | | | ClearBridge Mid Cap Fund 2024 Semi-Annual Report |
shareholders of the Fund are recorded on the ex-dividend date and are determined in accordance with income tax regulations, which may differ from GAAP.
(g) Share class accounting. Investment income, common expenses and realized/ unrealized gains (losses) on investments are allocated to the various classes of the Fund on the basis of daily net assets of each class. Fees relating to a specific class are charged directly to that share class.
(h) Compensating balance arrangements. The Fund has an arrangement with its custodian bank whereby a portion of the custodian’s fees is paid indirectly by credits earned on the Fund’s cash on deposit with the bank.
(i) Federal and other taxes. It is the Fund’s policy to comply with the federal income and excise tax requirements of the Internal Revenue Code of 1986 (the “Code”), as amended, applicable to regulated investment companies. Accordingly, the Fund intends to distribute its taxable income and net realized gains, if any, to shareholders in accordance with timing requirements imposed by the Code. Therefore, no federal or state income tax provision is required in the Fund’s financial statements.
Management has analyzed the Fund’s tax positions taken on income tax returns for all open tax years and has concluded that as of October 31, 2023, no provision for income tax is required in the Fund’s financial statements. The Fund’s federal and state income and federal excise tax returns for tax years for which the applicable statutes of limitations have not expired are subject to examination by the Internal Revenue Service and state departments of revenue.
(j) Reclassification. GAAP requires that certain components of net assets be reclassified to reflect permanent differences between financial and tax reporting. These reclassifications have no effect on net assets or net asset value per share.
2. Investment management agreement and other transactions with affiliates
Franklin Templeton Fund Adviser, LLC (“FTFA”) is the Fund’s investment manager and ClearBridge Investments, LLC (“ClearBridge”) is the Fund’s subadviser. Western Asset Management Company, LLC (“Western Asset”) manages the portion of the Fund’s cash and short-term instruments allocated to it. FTFA, ClearBridge and Western Asset are indirect, wholly-owned subsidiaries of Franklin Resources, Inc. (“Franklin Resources”).
| | | | |
| ClearBridge Mid Cap Fund 2024 Semi-Annual Report | | | | 23 |
Notes to financial statements (unaudited) (cont’d)
Under the investment management agreement, the Fund pays an investment management fee, calculated daily and paid monthly, in accordance with the following breakpoint schedule:
| | | | |
| Average Daily Net Assets | | Annual Rate | |
| First $1 billion | | | 0.750 | % |
| Next $1 billion | | | 0.700 | |
| Next $3 billion | | | 0.650 | |
| Next $5 billion | | | 0.600 | |
| Over $10 billion | | | 0.550 | |
FTFA provides administrative and certain oversight services to the Fund. FTFA delegates to the subadviser the day-to-day portfolio management of the Fund, except for the management of the portion of the Fund’s cash and short-term instruments allocated to Western Asset. For its services, FTFA pays ClearBridge a fee monthly, at an annual rate equal to 70% of the net management fee it receives from the Fund. For Western Asset’s services to the Fund, FTFA pays Western Asset monthly 0.02% of the portion of the Fund’s average daily net assets that are allocated to Western Asset by FTFA.
As a result of expense limitation arrangements between the Fund and FTFA, the ratio of total annual fund operating expenses, other than interest, brokerage commissions, taxes, extraordinary expenses and acquired fund fees and expenses, to average net assets of Class A, Class C, Class R, Class I and Class IS shares did not exceed 1.20%, 1.95%, 1.45%, 0.85% and 0.75%, respectively. In addition, the ratio of total annual fund operating expenses for Class IS shares did not exceed the ratio of total annual fund operating expenses for Class I shares and the ratio of total annual fund operating expenses for Class 1 shares did not exceed the ratio of total annual fund operating expenses for Class A shares. These expense limitation arrangements cannot be terminated prior to December 31, 2025 without the Board of Trustees’ consent. In addition, the manager has agreed to waive the Fund’s management fee to an extent sufficient to offset the net management fee payable in connection with any investment in an affiliated money market fund (the “affiliated money market fund waiver”). The affiliated money market fund waiver is not subject to the recapture provision discussed below.
During the six months ended April 30, 2024, fees waived and/or expenses reimbursed amounted to $82,859, which included an affiliated money market fund waiver of $6,222.
FTFA is permitted to recapture amounts waived and/or reimbursed to a class during the same fiscal year if the class’ total annual fund operating expenses have fallen to a level below the expense limitation (“expense cap”) in effect at the time the fees were earned or the expenses incurred. In no case will FTFA recapture any amount that would result, on any particular business day of the Fund, in the class’ total annual fund operating expenses exceeding the expense cap or any other lower limit then in effect.
| | | | |
24 | | | | ClearBridge Mid Cap Fund 2024 Semi-Annual Report |
Franklin Distributors, LLC (“Franklin Distributors”) serves as the Fund’s sole and exclusive distributor. Franklin Distributors is an indirect, wholly-owned broker-dealer subsidiary of Franklin Resources. Franklin Templeton Investor Services, LLC (“Investor Services”) serves as the Fund’s shareholder servicing agent and acts as the Fund’s transfer agent and dividend-paying agent. Investor Services is an indirect, wholly-owned subsidiary of Franklin Resources. Each class of shares of the Fund pays transfer agent fees to Investor Services for its performance of shareholder servicing obligations. Investor Services charges account-based fees based on the number of individual shareholder accounts, as well as a fixed percentage fee based on the total account-based fees charged. In addition, each class reimburses Investor Services for out of pocket expenses incurred. For the six months ended April 30, 2024, the Fund incurred transfer agent fees as reported on the Statement of Operations, of which $23,964 was earned by Investor Services.
There is a maximum initial sales charge of 5.50% for Class A shares. There is a contingent deferred sales charge (“CDSC”) of 1.00% on Class C shares, which applies if redemption occurs within 12 months from purchase payment. In certain cases, Class A shares have a 1.00% CDSC, which applies if redemption occurs within 18 months from purchase payment. This CDSC only applies to those purchases of Class A shares, which, when combined with current holdings of other shares of funds sold by Franklin Distributors, equal or exceed $1,000,000 in the aggregate. These purchases do not incur an initial sales charge.
For the six months ended April 30, 2024, sales charges retained by and CDSCs paid to Franklin Distributors and its affiliates, if any, were as follows:
| | | | | | | | |
| | | Class A | | | Class C | |
| Sales charges | | $ | 78,413 | | | | — | |
| CDSCs | | | 283 | | | $ | 46 | |
All officers and one Trustee of the Trust are employees of Franklin Resources or its affiliates and do not receive compensation from the Trust.
3. Investments
During the six months ended April 30, 2024, the aggregate cost of purchases and proceeds from sales of investments (excluding short-term investments) were as follows:
| | | | |
| Purchases | | $ | 391,681,402 | |
| Sales | | | 596,581,284 | |
| | | | |
| ClearBridge Mid Cap Fund 2024 Semi-Annual Report | | | | 25 |
Notes to financial statements (unaudited) (cont’d)
At April 30, 2024, the aggregate cost of investments and the aggregate gross unrealized appreciation and depreciation of investments for federal income tax purposes were substantially as follows:
| | | | | | | | | | | | | | | | |
| | | Cost | | | Gross
Unrealized
Appreciation | | | Gross
Unrealized
Depreciation | | | Net
Unrealized
Appreciation | |
| Securities | | $ | 1,367,429,538 | | | $ | 515,379,227 | | | $ | (55,171,332) | | | $ | 460,207,895 | |
4. Derivative instruments and hedging activities
During the six months ended April 30, 2024, the Fund did not invest in derivative instruments.
5. Class specific expenses, waivers and/or expense reimbursements
The Fund has adopted a Rule 12b-1 shareholder services and distribution plan and under that plan the Fund pays service and/or distribution fees with respect to its Class A, Class C and Class R shares calculated at the annual rate of 0.25%, 1.00% and 0.50% of the average daily net assets of each class, respectively. Service and/or distribution fees are accrued daily and paid monthly.
For the six months ended April 30, 2024, class specific expenses were as follows:
| | | | | | | | |
| | | Service and/or
Distribution Fees | | | Transfer Agent
Fees | |
| Class 1 | | | — | | | $ | 1,355 | |
| Class A | | $ | 1,435,472 | | | | 836,808 | |
| Class C | | | 65,441 | | | | 8,689 | |
| Class R | | | 150,149 | | | | 59,243 | |
| Class I | | | — | | | | 218,943 | |
| Class IS | | | — | | | | 17,097 | |
| Total | | $ | 1,651,062 | | | $ | 1,142,135 | |
For the six months ended April 30, 2024, waivers and/or expense reimbursements by class were as follows:
| | | | |
| | | Waivers/Expense
Reimbursements | |
| Class 1 | | $ | 52 | |
| Class A | | | 17,410 | |
| Class C | | | 199 | |
| Class R | | | 1,560 | |
| Class I | | | 41,635 | |
| Class IS | | | 22,003 | |
| Total | | $ | 82,859 | |
| | | | |
26 | | | | ClearBridge Mid Cap Fund 2024 Semi-Annual Report |
6. Distributions to shareholders by class
| | | | | | | | |
| | | Six Months Ended
April 30, 2024 | | | Year Ended
October 31, 2023 | |
| Net Investment Income: | | | | | | | | |
| Class 1 | | $ | 4,484 | | | $ | 8,887 | |
| Class A | | | — | | | | — | |
| Class C | | | — | | | | — | |
| Class R | | | — | | | | — | |
| Class I | | | 356,984 | | | | 788,300 | |
| Class IS | | | 638,558 | | | | 1,245,175 | |
| Total | | $ | 1,000,026 | | | $ | 2,042,362 | |
| | |
| Net Realized Gains: | | | | | | | | |
| Class 1 | | $ | 59,611 | | | $ | 144,204 | |
| Class A | | | 21,259,116 | | | | 50,951,909 | |
| Class C | | | 367,195 | | | | 1,240,823 | |
| Class R | | | 1,171,801 | | | | 2,803,943 | |
| Class I | | | 6,244,599 | | | | 16,373,538 | |
| Class IS | | | 5,279,842 | | | | 15,036,102 | |
| Total | | $ | 34,382,164 | | | $ | 86,550,519 | |
7. Shares of beneficial interest
At April 30, 2024, the Trust had an unlimited number of shares of beneficial interest authorized with a par value of $0.00001 per share. The Fund has the ability to issue multiple classes of shares. Each class of shares represents an identical interest and has the same rights, except that each class bears certain direct expenses, including those specifically related to the distribution of its shares.
Transactions in shares of each class were as follows:
| | | | | | | | | | | | | | | | |
| | | Six Months Ended
April 30, 2024 | | | Year Ended
October 31, 2023 | |
| | | Shares | | | Amount | | | Shares | | | Amount | |
| Class 1 | | | | | | | | | | | | | | | | |
| Shares sold | | | — | | | | — | | | | — | | | | — | |
| Shares issued on reinvestment | | | 1,837 | | | $ | 64,095 | | | | 4,600 | | | $ | 153,091 | |
| Shares repurchased | | | (6,199) | | | | (226,067) | | | | (5,069) | | | | (167,196) | |
| Net decrease | | | (4,362) | | | $ | (161,972) | | | | (469) | | | $ | (14,105) | |
| | | | |
| Class A | | | | | | | | | | | | | | | | |
| Shares sold | | | 1,368,137 | | | $ | 45,068,576 | | | | 3,459,006 | | | $ | 107,615,565 | |
| Shares issued on reinvestment | | | 641,072 | | | | 20,828,430 | | | | 1,601,773 | | | | 49,799,129 | |
| Shares repurchased | | | (2,612,260) | | | | (86,563,365) | | | | (4,724,163) | | | | (147,021,522) | |
| Net increase (decrease) | | | (603,051) | | | $ | (20,666,359) | | | | 336,616 | | | $ | 10,393,172 | |
| | | | |
| ClearBridge Mid Cap Fund 2024 Semi-Annual Report | | | | 27 |
Notes to financial statements (unaudited) (cont’d)
| | | | | | | | | | | | | | | | |
| | | Six Months Ended
April 30, 2024 | | | Year Ended
October 31, 2023 | |
| | | Shares | | | Amount | | | Shares | | | Amount | |
| Class C | | | | | | | | | | | | | | | | |
| Shares sold | | | 25,956 | | | $ | 578,115 | | | | 59,541 | | | $ | 1,286,926 | |
| Shares issued on reinvestment | | | 16,409 | | | | 361,170 | | | | 57,033 | | | | 1,220,498 | |
| Shares repurchased | | | (167,405) | | | | (3,741,981) | | | | (339,336) | | | | (7,264,879) | |
| Net decrease | | | (125,040) | | | $ | (2,802,696) | | | | (222,762) | | | $ | (4,757,455) | |
| | | | |
| Class R | | | | | | | | | | | | | | | | |
| Shares sold | | | 109,560 | | | $ | 3,445,848 | | | | 298,520 | | | $ | 8,841,504 | |
| Shares issued on reinvestment | | | 37,797 | | | | 1,167,560 | | | | 93,917 | | | | 2,787,460 | |
| Shares repurchased | | | (184,151) | | | | (5,853,296) | | | | (389,115) | | | | (11,648,258) | |
| Net increase (decrease) | | | (36,794) | | | $ | (1,239,888) | | | | 3,322 | | | $ | (19,294) | |
| | | | |
| Class I | | | | | | | | | | | | | | | | |
| Shares sold | | | 918,886 | | | $ | 35,517,018 | | | | 2,246,748 | | | $ | 81,525,293 | |
| Shares issued on reinvestment | | | 163,357 | | | | 6,227,188 | | | | 445,574 | | | | 16,174,335 | |
| Shares repurchased | | | (2,286,873) | | | | (88,670,850) | | | | (3,587,489) | | | | (129,750,139) | |
| Net decrease | | | (1,204,630) | | | $ | (46,926,644) | | | | (895,167) | | | $ | (32,050,511) | |
| | | | |
| Class IS | | | | | | | | | | | | | | | | |
| Shares sold | | | 1,195,654 | | | $ | 46,884,673 | | | | 1,917,035 | | | $ | 70,834,803 | |
| Shares issued on reinvestment | | | 148,473 | | | | 5,735,514 | | | | 427,276 | | | | 15,715,222 | |
| Shares repurchased | | | (4,271,473) | | | | (172,873,530) | | | | (3,826,619) | | | | (140,574,024) | |
| Net decrease | | | (2,927,346) | | | $ | (120,253,343) | | | | (1,482,308) | | | $ | (54,023,999) | |
8. Transactions with affiliated company
As defined by the 1940 Act, an affiliated company is one in which the Fund owns 5% or more of the outstanding voting securities, or a company which is under common ownership or control with the Fund. The following company was considered an affiliated company for all or some portion of the six months ended April 30, 2024. The following transactions were effected in such company for the six months ended April 30, 2024.
| | | | | | | | | | |
| | | Affiliate
Value at
October 31,
2023 | | Purchased | | Sold |
| | | Cost | | Shares | | Proceeds | | Shares |
| Western Asset Premier Institutional U.S. Treasury Reserves, Premium Shares | | $30,102,788 | | $108,358,000 | | 108,358,000 | | $117,637,741 | | 117,637,741 |
| | | | |
28 | | | | ClearBridge Mid Cap Fund 2024 Semi-Annual Report |
| | | | | | | | |
| (cont’d) | | Realized
Gain (Loss) | | Dividend
Income | | Net Increase
(Decrease) in
Unrealized
Appreciation
(Depreciation) | | Affiliate
Value at
April 30,
2024 |
Western Asset Premier Institutional U.S.
Treasury Reserves, Premium Shares | | — | | $375,391 | | — | | $20,823,047 |
9. Redemption facility
The Fund, together with other U.S. registered and foreign investment funds (collectively, the “Borrowers”) managed by Franklin Resources or its affiliates, is a borrower in a joint syndicated senior unsecured credit facility totaling $2.675 billion (the “Global Credit Facility”). The Global Credit Facility provides a source of funds to the Borrowers for temporary and emergency purposes, including the ability to meet future unanticipated or unusually large redemption requests. Unless renewed, the Global Credit Facility will terminate on January 31, 2025.
Under the terms of the Global Credit Facility, the Fund shall, in addition to interest charged on any borrowings made by the Fund and other costs incurred by the Fund, pay its share of fees and expenses incurred in connection with the implementation and maintenance of the Global Credit Facility, based upon its relative share of the aggregate net assets of all the Borrowers, including an annual commitment fee of 0.15% based upon the unused portion of the Global Credit Facility. These fees are reflected in the Statement of Operations. The Fund did not utilize the Global Credit Facility during the six months ended April 30, 2024.
10. Recent accounting pronouncement
In June 2022, the Financial Accounting Standards Board (FASB) issued Accounting Standards Update (ASU) No. 2022-03, Fair Value Measurement (Topic 820) – Fair Value Measurement of Equity Securities Subject to Contractual Sale Restrictions. The amendments in the ASU clarify that a contractual restriction on the sale of an equity security is not considered part of the unit of account of the equity security and, therefore, should not be considered in measuring fair value. The ASU is effective for interim and annual reporting periods beginning after December 15, 2023, with the option of early adoption. Management has reviewed the requirements and believes that the adoption of the ASU will not have a material impact on the financial statements.
| | | | |
| ClearBridge Mid Cap Fund 2024 Semi-Annual Report | | | | 29 |
ClearBridge
Mid Cap Fund
Trustees
Andrew L. Breech
Stephen R. Gross
Susan M. Heilbron
Arnold L. Lehman
Robin J. W. Masters
Ken Miller
G. Peter O’Brien*
Chair
Thomas F. Schlafly
Jane Trust
* Effective February 7, 2024, Mr. O’Brien became Chair of the Board.
Investment manager
Franklin Templeton Fund Adviser, LLC
Subadviser
ClearBridge Investments, LLC
Distributor
Franklin Distributors, LLC
Custodian
The Bank of New York Mellon
Transfer agent
Franklin Templeton Investor Services, LLC
3344 Quality Drive
Rancho Cordova, CA 95670-7313
Independent registered public accounting firm
PricewaterhouseCoopers LLP
Baltimore, MD
ClearBridge Mid Cap Fund
The Fund is a separate investment series of Legg Mason Partners Investment Trust, a Maryland statutory trust.
ClearBridge Mid Cap Fund
Legg Mason Funds
620 Eighth Avenue, 47th Floor
New York, NY 10018
The Fund files its complete schedule of portfolio holdings with the Securities and Exchange Commission (“SEC”) for the first and third quarters of each fiscal year as an exhibit to its reports on Form N-PORT. The Fund’s Forms N-PORT are available on the SEC’s website at www.sec.gov. To obtain information on Form N-PORT, shareholders can call the Fund at 877-6LM-FUND/656-3863.
Information on how the Fund voted proxies relating to portfolio securities during the prior 12-month period ended June 30th of each year and a description of the policies and procedures that the Fund uses to determine how to vote proxies related to portfolio transactions are available (1) without charge, upon request, by calling the Fund at 877-6LM-FUND/656-3863, (2) at www.franklintempleton.com and (3) on the SEC’s website at www.sec.gov.
This report is submitted for the general information of the shareholders of ClearBridge Mid Cap Fund. This report is not authorized for distribution to prospective investors in the Fund unless preceded or accompanied by a current prospectus.
Investors should consider the Fund’s investment objectives, risks, charges and expenses carefully before investing. The prospectus contains this and other important information about the Fund. Please read the prospectus carefully before investing.
www.franklintempleton.com
© 2024 Franklin Distributors, LLC, Member FINRA/SIPC. All rights reserved.
Franklin Templeton Funds Privacy and Security Notice
Your Privacy Is Our Priority
Franklin Templeton* is committed to safeguarding your personal information. This notice is designed to provide you with a summary of the non-public personal information Franklin Templeton may collect and maintain about current or former individual investors; our policy regarding the use of that information; and the measures we take to safeguard the information. We do not sell individual investors’ non-public personal information to anyone and only share it as described in this notice.
Information We Collect
When you invest with us, you provide us with your non-public personal information. We collect and use this information to service your accounts and respond to your requests. The non-public personal information we may collect falls into the following categories:
| • | | Information we receive from you or your financial intermediary on applications or other forms, whether we receive the form in writing or electronically. For example, this information may include your name, address, tax identification number, birth date, investment selection, beneficiary information, and your personal bank account information and/or email address if you have provided that information. |
| • | | Information about your transactions and account history with us, or with other companies that are part of Franklin Templeton, including transactions you request on our website or in our app. This category also includes your communications to us concerning your investments. |
| • | | Information we receive from third parties (for example, to update your address if you move, obtain or verify your email address or obtain additional information to verify your identity). |
| • | | Information collected from you online, such as your IP address or device ID and data gathered from your browsing activity and location. (For example, we may use cookies to collect device and browser information so our website recognizes your online preferences and device information.) Our website contains more information about cookies and similar technologies and ways you may limit them. |
| • | | Other general information that we may obtain about you such as demographic information. |
Disclosure Policy
To better service your accounts and process transactions or services you requested, we may share non-public personal information with other Franklin Templeton companies. From time to time we may also send you information about products/services offered by other Franklin Templeton companies although we will not share your non-public personal information with these companies without first offering you the opportunity to prevent that sharing.
We will only share non-public personal information with outside parties in the limited circumstances permitted by law. For example, this includes situations where we need to share information with companies who work on our behalf to service or maintain your account or process transactions you requested, when the disclosure is to companies assisting us with our own marketing efforts, when the disclosure is to a party representing you, or when required by law (for example, in response to legal process). Additionally, we will ensure that any outside
|
| NOT PART OF THE SEMI-ANNUAL REPORT |
Franklin Templeton Funds Privacy and Security Notice (cont’d)
companies working on our behalf, or with whom we have joint marketing agreements, are under contractual obligations to protect the confidentiality of your information, and to use it only to provide the services we asked them to perform.
Confidentiality and Security
Our employees are required to follow procedures with respect to maintaining the confidentiality of our investors’ non-public personal information. Additionally, we maintain physical, electronic and procedural safeguards to protect the information. This includes performing ongoing evaluations of our systems containing investor information and making changes when appropriate.
At all times, you may view our current privacy notice on our website at https://www.franklintempleton.com/help/privacy-policy or contact us for a copy at (800) 632-2301.
*For purposes of this privacy notice Franklin Templeton shall refer to the following entities:
Fiduciary Trust International of the South (FTIOS), as custodian for individual retirement plans
Franklin Advisers, Inc.
Franklin Distributors, LLC, including as program manager of the Franklin Templeton 529 College Savings Plan and the NJBEST 529 College Savings Plan
Franklin Mutual Advisers, LLC
Franklin, Templeton and Mutual Series Funds
Franklin Templeton Institutional, LLC
Franklin Templeton Investments Corp., Canada
Franklin Templeton Investments Management, Limited UK
Legg Mason Funds
Templeton Asset Management, Limited
Templeton Global Advisors, Limited
Templeton Investment Counsel, LLC
If you are a customer of other Franklin Templeton affiliates and you receive notices from them, you will need to read those notices separately.
|
| NOT PART OF THE SEMI-ANNUAL REPORT |
www.franklintempleton.com
© 2024 Franklin Distributors, LLC, Member FINRA/SIPC. All rights reserved.
FD01675 6/24 SR24-4878
Not applicable.
| ITEM 3. | AUDIT COMMITTEE FINANCIAL EXPERT. |
Not applicable.
| ITEM 4. | PRINCIPAL ACCOUNTANT FEES AND SERVICES. |
Not applicable.
| ITEM 5. | AUDIT COMMITTEE OF LISTED REGISTRANTS. |
Not applicable.
| ITEM 6. | SCHEDULE OF INVESTMENTS. |
Included herein under Item 1.
| ITEM 7. | DISCLOSURE OF PROXY VOTING POLICIES AND PROCEDURES FOR CLOSED-END MANAGEMENT INVESTMENT COMPANIES. |
Not applicable.
| ITEM 8. | PORTFOLIO MANAGERS OF CLOSED-END MANAGEMENT INVESTMENT COMPANIES. |
Not applicable.
| ITEM 9. | PURCHASES OF SECURITIES BY CLOSED-END MANAGEMENT INVESTMENT COMPANY AND AFFILIATED PURCHASERS. |
Not applicable.
| ITEM 10. | SUBMISSION OF MATTERS TO A VOTE OF SECURITY HOLDERS. |
Not applicable.
| ITEM 11. | CONTROLS AND PROCEDURES. |
| | (a) | | The registrant’s principal executive officer and principal financial officer have concluded that the registrant’s disclosure controls and procedures (as defined in Rule 30a- 3(c) under the Investment Company Act of 1940, as amended (the “1940 Act”)) are effective as of a date within 90 days of the filing date of this report that includes the disclosure required by this paragraph, based on their evaluation of the disclosure controls and procedures required by Rule 30a-3(b) under the 1940 Act and 15d-15(b) under the Securities Exchange Act of 1934. |
| | (b) | | There were no changes in the registrant’s internal control over financial reporting (as defined in Rule 30a-3(d) under the 1940 Act) that occurred during the period covered by this report that have materially affected, or are likely to materially affect the registrant’s internal control over financial reporting. |
| ITEM 12. | DISCLOSURE OF SECURITIES LENDING ACTIVITIES FOR CLOSED-END MANAGEMENT INVESTMENT COMPANIES. |
Not applicable.
| ITEM 13. | RECOVERY OF ERRONEOUSLY AWARDED COMPENSATION. |
(a) Not applicable.
(b) Not applicable.
(a) (1) Not applicable.
Exhibit 99.CODE ETH
(a) (2) Certifications pursuant to section 302 of the Sarbanes-Oxley Act of 2002 attached hereto.
Exhibit 99.CERT
(b) Certifications pursuant to Section 906 of the Sarbanes-Oxley Act of 2002 attached hereto.
Exhibit 99.906CERT
SIGNATURES
Pursuant to the requirements of the Securities Exchange Act of 1934 and the Investment Company Act of 1940, the registrant has duly caused this Report to be signed on its behalf by the undersigned, there unto duly authorized.
| | |
| Legg Mason Partners Investment Trust |
| |
| By: | | /s/ Jane Trust |
| | Jane Trust |
| | Chief Executive Officer |
| |
| Date: | | June 26, 2024 |
Pursuant to the requirements of the Securities Exchange Act of 1934 and the Investment Company Act of 1940, this report has been signed below by the following persons on behalf of the registrant and in the capacities and on the dates indicated.
| | |
| By: | | /s/ Jane Trust |
| | Jane Trust |
| | Chief Executive Officer |
| |
| Date: | | June 26, 2024 |
| | |
| By: | | /s/ Christopher Berarducci |
| | Christopher Berarducci |
| | Principal Financial Officer |
| |
| Date: | | June 26, 2024 |