Exhibit 99.1
For Immediate Release
CSB Bancorp, Inc. Announces Increased Fourth Quarter and Full Year Earnings
Millersburg, Ohio, January 24, 2005 — CSB Bancorp, Inc., (OTCBB:CSBB) today announced preliminary, unaudited earnings for the three months ended December 31, 2004 of $651,000, or $0.24 per diluted share, compared to $552,000 of earnings, or $0.21 per diluted share in 2003. This represents increases of 17.9% in net income and 14.3% in earnings per share for the comparable quarters.
CSB Bancorp, Inc. also reported 2004 full year preliminary, unaudited earnings of $2,526,000 or $0.95 per diluted share compared to $2,060,000 or $0.78 per share in 2003. These results represent increases of 22.6% in earnings and 21.8% in diluted per share results.
“We are pleased with these results, while acknowledging we need to continue the hard work the staff and officers have begun. While our full year Return on Average Assets increased to .81 percent, versus .68 percent in 2003, there is still potential to improve. Likewise, our Non-Interest Expense to Revenue ratio, the efficiency benchmark, fell to 70.4 percent compared to 77.6 percent at the end of 2003. These ratios are measured on a fully taxable basis and also have potential for improvement,” stated President and C.E.O. John Limbert.
“We ended the year with positive momentum. Our net interest income reflected four consecutive quarters of increases; loan delinquencies are below industry peers; and perhaps most significantly, our non-interest expenses were $521,000 lower than the prior year. These trends, coupled with the strategies we have put into place, give us confidence for the coming year,” added Limbert.
CSB Bancorp, Inc. is headquartered in Millersburg, Ohio and is the parent company of The Commercial & Savings Bank, a $317 million bank serving Holmes, Wayne and Tuscarawas counties with nine banking centers, trust and financial, and brokerage services. CSB is located on the web athttp://www.csb1.com.
Forward-looking Statement. The information in this press release contains forward-looking statements including certain projections, plans and forecasts of expected future performance that are not historical facts and that are subject to a number of risk and uncertainties. Actual results and performance could differ materially from those contemplated or implied by these forward-looking statements.
Contact information:
Paula Meiler, Sr. V.P. and CFO
1-330-763-2873
paula.meiler@csb1.com
TO OUR SHAREHOLDERS
Dear Shareholder:
We are pleased to report to you that, on a preliminary basis, our unaudited fourth quarter net income was $651,000. This is 17.9 percent better than 2003’s fourth quarter results of $552,000. Quarterly basic earnings were $.25 per share versus $.21 per share in 2003, or a 19.0% increase. Diluted quarterly earnings per share were $.24 as compared to $.21 per share for the fourth quarter 2003.
For the full year of 2004, we are equally pleased to report, on a preliminary basis, unaudited net income of $2,526,000 versus $2,060,000 in 2003, an increase of 22.6%. On a per share basis, full year 2004 results of $.96 per share compare favorably to $.78 per share in 2003. These results represent a 23.1% year over year increase! Diluted earnings per share were $.95 for the year ended 2004 as compared to $.78 for the same period in 2003.
While we are pleased with the results, we still have work to do. For instance, while our full year Return on Average Assets rose 19%, to a ratio of .81%, it still has potential to improve. We made very good progress in reducing our Non-Interest Expense to Revenue (efficiency) ratio, on a fully taxable equivalent basis, to 70.4% versus last year’s 77.6%. The ratio, however, is still higher than we would like and likewise has potential to improve.
While we admit to having work left to do, we will take this opportunity to compliment our fellow employees for their accomplishments to date. For instance, while the assets of the Company grew only 3.7% last year, Net Income increased 22.6%, including the impact of adding $423,000 to our allowance for loan losses, thus improving this reserve to total loans to 1.18%. We believe CSB will be one of the few banks that will report a full year improvement on their Net Interest Income. And perhaps most significantly, we were able to achieve these improvements as a result of reducing our Non-Interest expenses $521,000! This is the lowest level of Non-Interest expenses since 2000!
So, what’s next?
A number of things! First, we believe we can continue to show significant improvement in our basic operating ratios, including Return on Assets, NIE/Revenue, and Return on Equity. We are focused on improving these benchmarks and believe that our progress last year evidences our commitment to meeting these goals in 2005. Second, by the time you read this, we will have announced the opening of a combined Trust Office and Loan Production Office in Wooster, Ohio. We expect these expanded operations will increase earnings and shareholder value. Third, it’s been over five years since the bank opened a new banking center, a drought we hope to end in 2005! Next, we will be emphasizing a renewed emphasis on providing outstanding customer service. While we strive to do this today, our goal will be to improve our relationship with every customer. Last, and by no means least, we seek to improve the return on your investment and will be exploring a number of ways to make that happen in 2005.
In summary, we had a good and improving year. Earnings were up 22.6%, your stock increased in value, from $17.00 per share on December 31, 2003 to $20.00 per share on December 31, 2004, or 17.6%. Per share declared dividends increased to $.52, or an 8.3% improvement. We are intent on sustaining these trends while exercising prudent banking principles.
Thank you for your continued support. As always, please feel free to contact us with any questions or concerns you may have. And if we don’t talk to you before, we’ll look forward to seeing you at our annual meeting in the spring.
Sincerely,
| | |
JOHN J. LIMBERT
President and C.E.O. | | ROBERT K. BAKER
Chairman |
CONSOLIDATED STATEMENTS OF CONDITION (UNAUDITED)
| | | | | | | | | | |
| (DOLLARS IN THOUSANDS, EXCEPT PER SHARE DATA) | | DECEMBER 31 | |
| | | 2004 | | | | 2003 | |
ASSETS: | | | | | | | | | |
| Cash and due from banks | | $ | 12,644 | | | | $ | 12,474 | |
| Federal funds sold | | | 3,000 | | | | | 4,727 | |
| Securities | | | 76,228 | | | | | 67,773 | |
| Net loans | | | 215,510 | | | | | 210,796 | |
| Premises and equipment, net | | | 8,244 | | | | | 8,563 | |
| Other assets | | | 1,979 | | | | | 1,847 | |
| | | | | | | | |
TOTAL ASSETS | | $ | 317,605 | | | | $ | 306,180 | |
| | | | | | | | |
LIABILITIES: | | | | | | | | | |
| Deposits | | $ | 247,951 | | | | $ | 248,958 | |
| Securities sold under agreements to repurchase | | | 13,316 | | | | | 11,859 | |
| Other borrowings | | | 18,745 | | | | | 9,512 | |
| Other liabilities | | | 1,385 | | | | | 1,133 | |
| | | | | | | | |
TOTAL LIABILITIES | | | 281,397 | | | | | 271,462 | |
| | | | | | | | |
SHAREHOLDERS’ EQUITY: | | | | | | | | | |
| Common stock | | | 16,674 | | | | | 16,674 | |
| Additional paid-in capital | | | 6,414 | | | | | 6,413 | |
| Retained earnings | | | 13,358 | | | | | 12,215 | |
| Treasury stock | | | (627 | ) | | | | (645 | ) |
| Accumulated other comprehensive income | | | 389 | | | | | 61 | |
| | | | | | | | |
TOTAL SHAREHOLDERS’ EQUITY | | | 36,208 | | | | | 34,718 | |
| | | | | | | | |
TOTAL LIABILITIES AND SHAREHOLDERS’ EQUITY | | $ | 317,605 | | | | $ | 306,180 | |
| | | | | | | | |
CONSOLIDATED STATEMENTS OF EARNINGS (UNAUDITED)
| | | | | | | | | | | | | | | | | | | | |
| (DOLLARS IN THOUSANDS, EXCEPT PER SHARE DATA) | | THREE MONTHS ENDED DECEMBER 31 | | �� | | TWELVE MONTHS ENDED DECEMBER 31 | |
| | | 2004 | | | | 2003 | | | | 2004 | | | | 2003 | |
| INTEREST INCOME: | | | | | | | | | | | | | | | | | | | |
| Interest and fees on loans | | $ | 3,154 | | | | $ | 2,991 | | | | $ | 12,123 | | | | $ | 12,453 | |
| Interest on securities | | | 706 | | | | | 696 | | | | | 2,911 | | | | | 2,925 | |
| Other interest income | | | 30 | | | | | 16 | | | | | 40 | | | | | 36 | |
| | | | | | | | | | | | | | | | |
| TOTAL INTEREST INCOME | | | 3,890 | | | | | 3,703 | | | | | 15,074 | | | | | 15,414 | |
| | | | | | | | | | | | | | | | |
| INTEREST EXPENSE: | | | | | | | | | | | | | | | | | | | |
| Interest on deposits | | | 820 | | | | | 916 | | | | | 3,238 | | | | | 3,849 | |
| Other interest expense | | | 154 | | | | | 159 | | | | | 636 | | | | | 782 | |
| | | | | | | | | | | | | | | | |
| TOTAL INTEREST EXPENSE | | | 974 | | | | | 1,075 | | | | | 3,874 | | | | | 4,631 | |
| | | | | | | | | | | | | | | | |
| Net interest income | | | 2,916 | | | | | 2,628 | | | | | 11,200 | | | | | 10,783 | |
| Provision (credit) for loan losses | | | — | | | | | — | | | | | 423 | | | | | (51 | ) |
| | | | | | | | | | | | | | | | |
| Net interest income after provision (credit) for loan losses | | | 2,916 | | | | | 2,628 | | | | | 10,777 | | | | | 10,834 | |
| Noninterest income | | | 524 | | | | | 521 | | | | | 2,092 | | | | | 2,155 | |
| Gain on sale of securities | | | 3 | | | | | — | | | | | 588 | | | | | — | |
| Noninterest expense | | | 2,555 | | | | | 2,545 | | | | | 10,278 | | | | | 10,799 | |
| | | | | | | | | | | | | | | | |
| Net income before federal income taxes | | | 888 | | | | | 604 | | | | | 3,179 | | | | | 2,190 | |
| Federal income tax provision (credit) | | | 237 | | | | | 52 | | | | | 653 | | | | | 130 | |
| | | | | | | | | | | | | | | | |
NET INCOME | | $ | 651 | | | | $ | 552 | | | | $ | 2,526 | | | | $ | 2,060 | |
| | | | | | | | | | | | | | | | |
BASIC EARNINGS PER SHARE | | $ | 0.25 | | | | $ | 0.21 | | | | $ | 0.96 | | | | $ | 0.78 | |
DILUTED EARNINGS PER SHARE | | $ | 0.24 | | | | $ | 0.21 | | | | $ | 0.95 | | | | $ | 0.78 | |
| | | | | | | | | | | | | | | | |
FINANCIAL HIGHLIGHTS
(DOLLARS IN THOUSANDS, EXCEPT PER SHARE DATA)
| | | | | | | | | | |
| | | AT OR FOR THE TWELVE MONTHS | |
| | | ENDED DECEMBER 31 | |
| | | 2004 | | | | 2003 | |
| Assets | | $ | 317,605 | | | | $ | 306,180 | |
| Net loans | | $ | 215,510 | | | | $ | 210,796 | |
| Securities | | $ | 76,228 | | | | $ | 67,773 | |
| Deposits | | $ | 247,951 | | | | $ | 248,958 | |
| Shareholders’ equity | | $ | 36,208 | | | | $ | 34,718 | |
| Net income | | $ | 2,526 | | | | $ | 2,060 | |
| Earnings per share | | $ | 0.96 | | | | $ | 0.78 | |
| Book value per outstanding share | | $ | 13.69 | | | | $ | 13.13 | |
KEY RATIOS
| | | | | | | | | | |
| | | AT OR FOR THE TWELVE MONTHS | |
| | | ENDED DECEMBER 31 | |
| | | 2004 | | | | 2003 | |
| Return on average assets | | | 0.81 | % | | | | 0.68 | % |
| Return on average equity | | | 7.15 | % | | | | 6.00 | % |
| Net interest margin | | | 3.83 | % | | | | 3.81 | % |
| Loans to deposit | | | 87.95 | % | | | | 85.66 | % |
| Allowance for loan loss to total loans | | | 1.18 | % | | | | 1.15 | % |
| Shareholders’ equity to total assets | | | 11.40 | % | | | | 11.34 | % |
| Efficiency ratio | | | 70.36 | % | | | | 77.58 | % |
DIRECTORS
| | | |
Robert K. Baker
Chairman | | Daniel J. Miller |
| | Jeffrey A. Robb, Sr. |
John J. Limbert
President and CEO | |
Samuel M. Steimel |
| |
Eddie L. Steiner |
| Ronald E. Holtman | | |
| | John R. Waltman |
| J. Thomas Lang | | |
EXECUTIVE OFFICERS
John J. Limbert
President and CEO
Rick L. Ginther
Senior Vice President
Chief Lending Officer
Paul D. Greig
Senior Vice President
Chief Operation/Information Officer
Paula J. Meiler
Senior Vice President
Chief Financial Officer
STOCK PERFORMANCE & DIVIDENDS
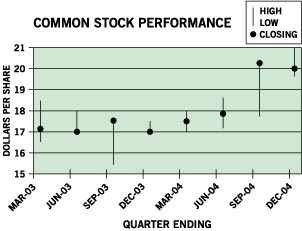
QUARTER ENDING
ADDITIONAL STOCK INFORMATION
STOCK LISTING
Common:
Symbol – CSBB.OB
STOCK TRANSFER
Registrar & Transfer Company
Attn: Investor Relations
10 Commerce Drive
Cranford, NJ 07016
(800) 368-5948
Copies of
CSB Bancorp, Inc.
S.E.C. Filings may be obtained by writing:
Paula J. Meiler, CFO
CSB Bancorp, Inc.
6 West Jackson Street
Millersburg, OH 44654
(330) 674-9015 or
(800) 654-9015