2011 Annual Report
A Relationship
You Can “Bank On”
CSB Bancorp, Inc.
“Bank On”
This original 1930’s-era brass piggy bank motivated many CSB customers to start saving.
2011 Financial Highlights 3
2011 Letter to Shareholders 4
Board of Directors 7
2011 Financial Review. 8
Report on Management’s Assessment
of Internal Control over Financial Reporting 22
Report of Independent Registered
Public Accounting Firm 23
Consolidated Balance Sheets 24
Consolidated Statements of Income 25
Consolidated Statements of Shareholders’ Equity 26
Consolidated Statements of Cash Flows 27
Summary of Significant Accounting Policies 29
Notes to Consolidated Financial Statements 34
Officers of The Commercial & Savings Bank 56
Shareholder & General Inquiries 57
Banking Center Information 60
2 | 2011 Annual Report to Shareholders | CSB Bancorp, Inc. |
2011 Financial Highlights
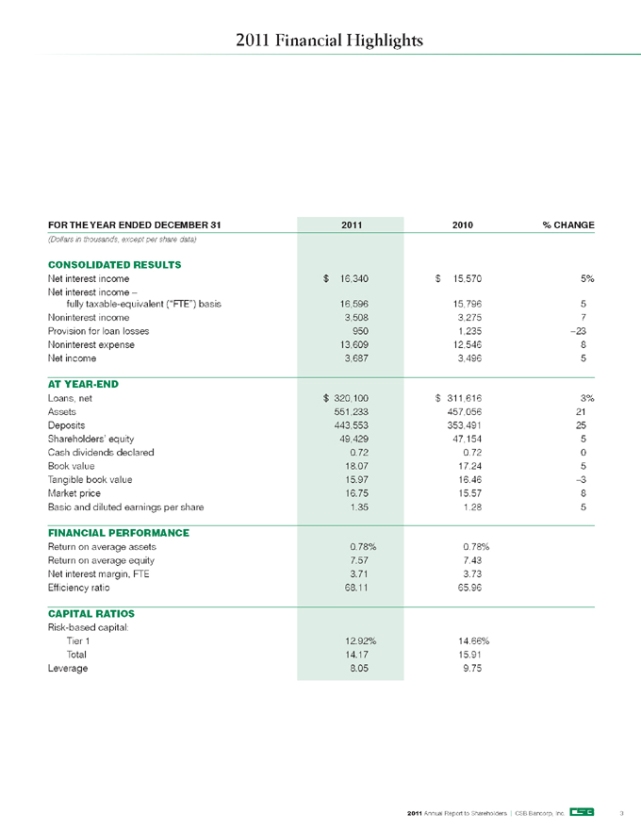
FOR THE YEAR ENDED DECEMBER 31 2011 2010 % CHANGE
(Dollars in thousands, except per share data)
CONSOLIDATED RESULTS
Net interest income $ 16,340 $ 15,570 5%
Net interest income –
fully taxable-equivalent (“FTE”) basis 16,596 15,796 5
Noninterest income 3,508 3,275 7
Provision for loan losses 950 1,235 –23
Noninterest expense 13,609 12,546 8
Net income 3,687 3,496 5
AT YEAR-END
Loans, net $ 320,100 $ 311,616 3%
Assets 551,233 457,056 21
Deposits 443,553 353,491 25
Shareholders’ equity 49,429 47,154 5
Cash dividends declared 0.72 0.72 0
Book value 18.07 17.24 5
Tangible book value 15.97 16.46 –3
Market price 16.75 15.57 8
Basic and diluted earnings per share 1.35 1.28 5
FINANCIAL PERFORMANCE
Return on average assets 0.78% 0.78%
Return on average equity 7.57 7.43
Net interest margin, FTE 3.71 3.73
Efficiency ratio 68.11 65.96
CAPITAL RATIOS
Risk-based capital:
Tier 1 12.92% 14.66%
Total 14.17 15.91
Leverage 8.05 9.75
2011 Annual Report to Shareholders | CSB Bancorp, Inc. 3

Letter to Shareholders
Eddie L. Steiner John R. Waltman
President & CEO, CSB Bancorp, Inc. Chairman, Board of Directors,
CSB Bancorp, Inc.
Dear Fellow Shareholder:
CSB’s strategy is to provide high quality financial services through each channel and in each market we serve. As an independent community bank, we know that banking, trust and brokerage services provide vital access to funds and economic stability for businesses, consumers and organizations throughout our market area. Community banking is a people business. It is built on relationships. The Bank honors its end of the bargain by:
• Maintaining a strong balance sheet through effective risk management
• Investing continuously in its people, processes, and systems
• Staying in tune with the financial needs and wants of constituents in the communities it serves
We are committed to being a company that is actively engaged in fostering growth, progress and economic stability.
Share Performance
CSB’s stock (symbol CSBB.OB) delivered a total return of 12.6% in 2011, with quarterly dividends representing approximately one-third of that return. Our dividend yield has averaged 4.3% over the past five-year period. We continue to recognize the importance of our dividend to many shareholders in this environment of very low interest rates on savings deposits. While approximately one-half of publicly traded banks in the U.S. are not paying a dividend, CSB has either increased or held its dividend steady in each of the past 39 quarters. The Company’s stock finished the year priced at 97% of tangible book value and a multiple of twelve times the last twelve months’ reported earnings. We believe the outlook for our stock is encouraging, given our consistent earnings performance and attractive dividend yield, and we thank each shareholder for their continued support.
Company Performance Against 2011 Objectives
At the beginning of 2011, we established four broad performance goals that encapsulated our tactical plans for the year. These goals were to:
• Maintain a primary focus on credit quality issues
• Monitor all risks to earnings, with special focus on the interest rate and regulatory environments
• Continue to work on determining how to most efficiently deliver excellence in banking products and services both in the current and coming years
• Seek and capitalize on prudent growth opportunities
EARNINGS DIVIDENDS BOOK VALUE TANGIBLE BOOK VALUE
PER SHARE, DILUTED PER SHARE (ANNUAL) PER SHARE PER SHARE
4 | 2011 Annual Report to Shareholders | CSB Bancorp, Inc. |
Letter to Shareholders
We made forward strides in each of the four areas, but our work is far from finished. However, enough progress was made to deliver
$1.35 per share in net income, thus meeting our earnings plan and exceeding the prior year’s performance. We want to do even better.
Nevertheless, this year’s achievements were solid, and they warrant some further explanation.
Credit Quality
Credit quality considerations have required very careful and constant attention for several years as consumers and businesses grapple with pressures created by the prolonged aftermath of deep recessionary conditions. While we have experienced elevated levels of delinquency and loan charge-offs as compared to our historical norm, the impact to earnings has been moderate. This we attribute to our emphasis on maintaining a strong credit culture. At the end of 2011, 0.64% of the Bank’s assets met FDIC’s classification of noncurrent or other property owned. The average of all Ohio banks at the end of the year was more than three times that rate, and the average for Ohio’s ninety commercial banks ranging from $100 million to $1 billion in assets was more than double our rate.
Interest Rate and Regulatory Environments
The very low interest rate environment has resulted in margin compression throughout the industry. Our tax-adjusted net interest margin declined only slightly to 3.71% for the year. However, during the fourth quarter we acquired two branches in Wooster, Ohio with a deposit base far exceeding the acquired loan balances. While we anticipate loan growth in this new retail market, our net interest margin, stated as a percentage, will be lower during 2012 as we work to increase the ratio of loan to deposit balances.
Another risk to bank earnings that received a lot of attention this past year involved regulatory developments. As a result of the Dodd-Frank Wall Street Reform and Consumer Protection Act (Dodd-Frank, 2010), the regulatory landscape governing banking and financial services is being significantly reshaped by new sets of authorities for various governing bodies and many new rules. These changes will be developed and implemented over a period of years. While a number of new regulations have already affected our activities and increased operating costs, thus far the total impact on our financial results has not been materially adverse. We are committed to functioning in accordance with guidelines established by the vested authorities and will continue to monitor and adapt our business model as necessary in response to changing regulatory conditions.
Efficient and Effective Delivery of Products and Services
During 2011, we began a multi-year initiative focused on the delivery of convenient and high-quality banking services. Electronic banking channels, such as the internet and mobile phone, provide new levels of convenience for some bank transactions. These channels have been experiencing rapid industry growth, while traditional branch activity has been declining. Early in 2011, we introduced optional “e-statements” which were quickly adopted by many customers.
We are evaluating these trends, and developing and implementing plans to ensure that we invest properly in related capability needs. Technology upgrades will be a part of the investments required to meet emerging channel demands. Training and talent development will also play a key role in ensuring the Company’s proper positioning to meet customer preferences. Within the past year, we have assessed and modified significant portions of our training and career development programs. Our corporate training group is charged with ensuring that we provide the knowledge tools required to keep pace with changes in the industry, and to foster leadership development from within the Company. This period of heightened investment in technology and training protocols will take several years, and the related investment costs will have some impact on near-term earnings as we build new capabilities to meet changing consumption patterns.
We also continued to invest in our existing infrastructure during 2011. Key accomplishments in this area included:
• Upgrading all of our ATM machines
• Remodeling the Walnut Creek Banking Center
• Enhancing security features for our web-based delivery channels
• Rolling out a company communications platform on our corporate intranet -wide
These upgrades position us well to meet our plans and objectives for 2012.
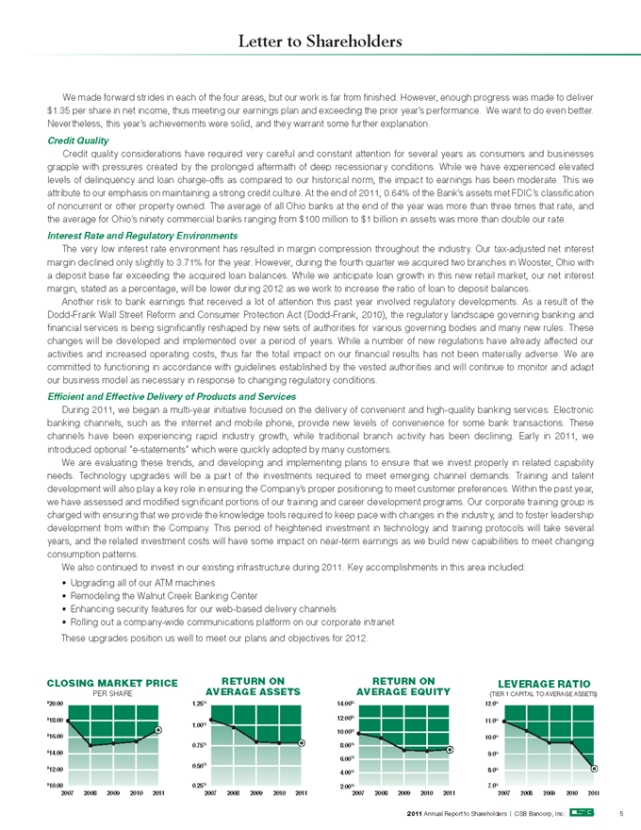
CLOSING MARKET PRICE RETURN ON RETURN ON LEVERAGE RATIO
PER SHARE AVERAGE ASSETS AVERAGE EQUITY (TIER 1 CAPITAL TO AVERAGE ASSETS)
2011 Annual Report to Shareholders | CSB Bancorp, Inc. 5
Letter to Shareholders
Growth
Our commitment to seeking growth provided the opportunity to acquire two branches in Wooster, Ohio, on October 15, 2011. CSB now has five branches in Wayne County, and we now have branch locations in the county seat of three of the four counties in our primary market area. The two additional branches increased CSB’s asset size by 16% and bring the total number of CSB’s branches to fifteen. The Company has completed one bank acquisition, opened two new banking centers and purchased two banking centers in the past five years, growing from $350 million in total assets to $551 million. We remain firmly committed to prudent growth. Our commitment is grounded in the belief that appropriate growth provides scale from which we can derive:
• Economies of effort
• Absorption of externally mandated costs
• Opportunities for employee development and advancement
• Diversification of exposure to risks
• Potential for greater long- return on investment term
Key Drivers of Continued Success
CSB’s success going forward will be driven by our commitment to continuous improvement in all aspects of our operations, and relentless focus on providing products and services that conveniently meet customers’ banking needs. We will monitor and adapt innovative uses of technology that enhance our delivery of banking products and services. We will capitalize on our ability to deliver a diverse set of banking services to consumers and commercial customers, and we will continue to prudently manage risks across our enterprise and our range of activities. All of these efforts will be conducted within the framework of our long-standing core values:
• Profit responsibility
• Customer service
• Fair and empowering interactions with all employees
• Honesty and integrity in all of our dealings
• Enjoyment of life and the privilege to work and serve in the communities in which we live
• Growth, as part of the life- of our future blood
Closing
CSB is in an excellent position to continue growing and providing rewarding returns to our shareholders. The Company’s balance sheet is strong, able to support needed investments and positioned to benefit from a recovering economy. While many of the fundamentals of good banking remain based upon tried and true principles, the industry itself is changing. We are actively investing in our people, technology and other infrastructure required to support the future. Our team is fully committed to delivering financial products and services that meet the wants and needs of customers both today and in the future. For customers and shareholders alike, we remain dedicated to the proposition of being a relationship you can bank on.
Eddie L. Steiner John R. Waltman
President and Chairman,
Chief Executive Officer Board of Directors
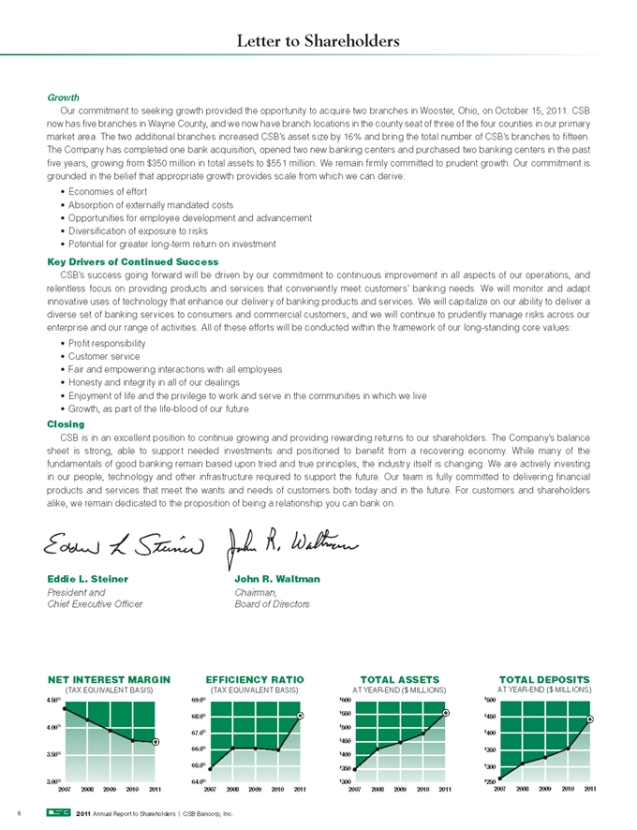
NET INTEREST MARGIN EFFICIENCY RATIO TOTAL ASSETS TOTAL DEPOSITS
(TAX EQUIVALENT BASIS) (TAX EQUIVALENT BASIS) AT YEAR-END ($ MILLIONS) AT YEAR-END ($ MILLIONS)
6 | 2011 Annual Report to Shareholders | CSB Bancorp, Inc. |

Board of Directors
Standing, Left to Right
J. Thomas Lang Eddie L. Steiner Ronald E. Holtman Robert K. Baker John R. Waltman
Veterinarian, President, Attorney, Co-owner and Controller, Attorney, Of Counsel
Dairy Farmer, Chief Executive Officer, Logee, Hostetler, Bakerwell, Inc. Critchfield, Critchfield
Spring Hill Farms, Inc. CSB Bancorp, Inc. Stutzman & Lehman & Johnston
Chairman, President, Chairman,
Chief Executive Officer, CSB Bancorp, Inc.
The Commercial and
Savings Bank
Seated, Left to Right
Jeffery A. Robb, Sr. Daniel J. Miller
President, Retired Physician,
Robb Companies, Inc. East Holmes Family Care, Inc.
ALLOWANCE FOR NET LOAN CHARGE-OFFS
NET LOANS LOAN & LEASE LOSSES (RECOVERIES) ALLL COVERAGE
AT YEAR-END ($ MILLIONS) AS A PERCENTAGE OF LOANS AS A PERCENTAGE OF AVERAGE LOANS OF NONPERFORMING LOANS
2011 Annual Report to Shareholders | CSB Bancorp, Inc. 7
2011 Financial Review
INTRODUCTION
CSB Bancorp, Inc. (the “Company” or “CSB”) was incorporated under the laws of the State of Ohio in 1991 and is a registered bank holding company. The Company’s wholly-owned subsidiaries are The Commercial and Savings Bank (the “Bank”) and CSB Investment Services, LLC. The Bank is chartered under the laws of the State of Ohio and was organized in 1879. The Bank is a member of the Federal Reserve System, with deposits insured by the Federal Deposit Insurance Corporation, and its primary regulators are the Ohio Division of Financial Institutions and the Federal Reserve Board.
The Company, through the Bank, provides retail and commercial banking services to its customers including checking and savings accounts, time deposits, cash management, safe deposit facilities, personal loans, commercial loans, real estate mortgage loans, installment loans, IRAs, night depository facilities and trust and brokerage services. Its customers are located primarily in Holmes, Tuscarawas, Wayne, Stark and portions of surrounding counties in Ohio.
The Company’s market area has historically exhibited relatively stable economic conditions; however, a pronounced slowdown in economic activity has been evident since the latter half of 2008. Unemployment levels in Holmes County have generally been among the lowest in the State of Ohio, while the balance of the Company’s market area typically experiences unemployment levels similar to the state average. Unemployment in the Company’s market area peaked during 2010 and improved steadily thereafter, with average unemployment at December 2011 approximately 20–25% lower than December 2010. Moderate reductions in residential real estate values have also continued as a result of the slow recessionary conditions.
Effective as of the close of business on October 14, 2011, the Bank acquired two branches from Premier Bank & Trust (“Premier”). The acquired banking centers are located in Wooster, Ohio. The Bank paid a 5% premium on the deposits. The transaction was accounted for using the purchase method of accounting (see Note 3 – Branch Acquisition).
FORWARD-LOOKING STATEMENTS
Certain statements contained in Management’s Discussion and Analysis of Financial Condition and Results of Operations are not related to historical results, but are forward-looking statements within the meaning of the Private Securities Litigation Reform Act of 1995. These statements involve a number of risks and uncertainties. Any forward-looking statements made by the Company herein and in future reports and statements are not guarantees of future performance, and actual results may differ materially from those in forward-looking statements because of various risk factors as discussed in this annual report and the Company’s annual report on Form 10-K. The Company does not undertake, and specifically disclaims, any obligation to publicly release the result of any revisions to any forward-looking statements to reflect the occurrence of unanticipated events or circumstances after the date of such statements.
8 | 2011 Annual Report to Shareholders | CSB Bancorp, Inc. |
2011 Financial Review
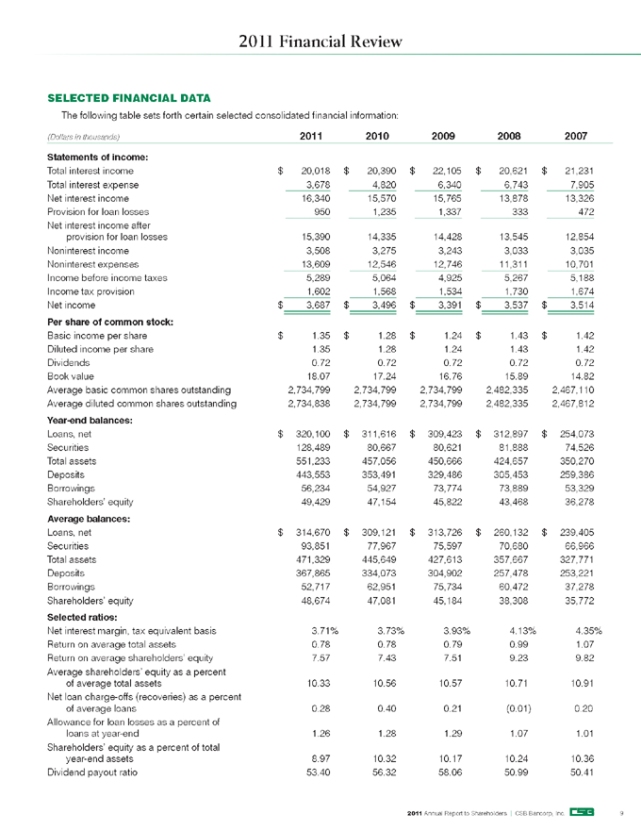
SELECTED FINANCIAL DATA
The following table sets forth certain selected consolidated financial information:
(Dollars in thousands) 2011 2010 2009 2008 2007
Statements of income:
Total interest income $ 20,018 $ 20,390 $ 22,105 $ 20,621 $ 21,231
Total interest expense 3,678 4,820 6,340 6,743 7,905
Net interest income 16,340 15,570 15,765 13,878 13,326
Provision for loan losses 950 1,235 1,337 333 472
Net interest income after
provision for loan losses 15,390 14,335 14,428 13,545 12,854
Noninterest income 3,508 3,275 3,243 3,033 3,035
Noninterest expenses 13,609 12,546 12,746 11,311 10,701
Income before income taxes 5,289 5,064 4,925 5,267 5,188
Income tax provision 1,602 1,568 1,534 1,730 1,674
Net income $ 3,687 $ 3,496 $ 3,391 $ 3,537 $ 3,514
Per share of common stock:
Basic income per share $ 1.35 $ 1.28 $ 1.24 $ 1.43 $ 1.42
Diluted income per share 1.35 1.28 1.24 1.43 1.42
Dividends 0.72 0.72 0.72 0.72 0.72
Book value 18.07 17.24 16.76 15.89 14.82
Average basic common shares outstanding 2,734,799 2,734,799 2,734,799 2,482,335 2,467,110
Average diluted common shares outstanding 2,734,838 2,734,799 2,734,799 2,482,335 2,467,812
Year-end balances:
Loans, net $ 320,100 $ 311,616 $ 309,423 $ 312,897 $ 254,073
Securities 128,489 80,667 80,621 81,888 74,526
Total assets 551,233 457,056 450,666 424,657 350,270
Deposits 443,553 353,491 329,486 305,453 259,386
Borrowings 56,234 54,927 73,774 73,889 53,329
Shareholders’ equity 49,429 47,154 45,822 43,468 36,278
Average balances:
Loans, net $ 314,670 $ 309,121 $ 313,726 $ 260,132 $ 239,405
Securities 93,851 77,967 75,597 70,680 66,966
Total assets 471,329 445,649 427,613 357,667 327,771
Deposits 367,865 334,073 304,902 257,478 253,221
Borrowings 52,717 62,951 75,734 60,472 37,278
Shareholders’ equity 48,674 47,081 45,184 38,308 35,772
Selected ratios:
Net interest margin, tax equivalent basis 3.71% 3.73% 3.93% 4.13% 4.35%
Return on average total assets 0.78 0.78 0.79 0.99 1.07
Return on average shareholders’ equity 7.57 7.43 7.51 9.23 9.82
Average shareholders’ equity as a percent
of average total assets 10.33 10.56 10.57 10.71 10.91
Net loan charge-offs (recoveries) as a percent
of average loans 0.28 0.40 0.21 (0.01) 0.20
Allowance for loan losses as a percent of
loans at year-end 1.26 1.28 1.29 1.07 1.01
Shareholders’ equity as a percent of total
year-end assets 8.97 10.32 10.17 10.24 10.36
Dividend payout ratio 53.40 56.32 58.06 50.99 50.41
2011 Annual Report to Shareholders | CSB Bancorp, Inc. 9
2011 Financial Review
RESULTS OF OPERATIONS
Net Income
Net income for 2011 was $3.7 million, an increase of $191 thousand or 5.5% from 2010. Basic and diluted net income per share was $1.35. Net income increased in 2011 primarily due to a $770 thousand increase in net interest income, a $233 thousand increase in other noninterest income and a decrease in provision for loan losses of $285 thousand. Partially offsetting the increase to net income was a $1.1 million increase in noninterest expenses. Return on average assets was 0.78% in 2011 and 2010, and return on average shareholders’ equity was 7.57% in 2011 as compared to 7.43% in 2010.
CSB’s 2010 net income was $3.5 million while basic and diluted earnings per share were $1.28, as compared to $3.4 million or $1.24 per share for the year ended 2009. Net income increased 3.1% during 2010 as compared to 2009, due primarily to a $200 thousand decrease in total noninterest expenses and a $32 thousand increase in total noninterest income. Partially offsetting the income increases were a reduction in net interest income and increases in the provision for loan losses and federal income taxes. Return on average assets was 0.78% in 2010 compared to 0.79% in 2009, and return on average shareholders’ equity was 7.43% in 2010 as compared to 7.51% in 2009.
Net Interest Income
(Dollars in thousands) 2011 2010 2009
Net interest income $ 16,340 $ 15,570 $ 15,765
Taxable equivalent adjustment1 256 226 209
Net interest income, fully taxable equivalent $ 16,596 $ 15,796 $ 15,974
Net interest yield 3.65% 3.68% 3.88%
Taxable equivalent adjustment1 .06% .05% .05%
Net interest yield – taxable equivalent 3.71% 3.73% 3.93%
1Taxable equivalent adjustments have been computed assuming a 34% tax rate.
Net interest income is the largest source of the Company’s revenue and consists of the difference between interest income generated on earning assets and interest expense incurred on liabilities (deposits and short-term and long-term borrowings). Volumes, interest rates and composition of interest-earning assets and interest-bearing liabilities affect net interest income.
Interest income decreased $372 thousand, or 1.8% in 2011 as compared to 2010. This decrease was primarily due to the 34 basis point decrease on earning assets as historical interest rates hit new lows in 2011.
Interest income decreased $1.7 million in 2010 as compared to 2009. The decrease was primarily due to a decrease of 62 basis points on earning assets as historically low interest rates continued in 2010 from 2009. Additionally, the daily average balance of loans decreased $3.7 million or 1.2% during 2010.
Interest expense decreased $1.1 million, or 23.7% for 2011 as compared to 2010, due to a decline in the average rate paid for interest bearing liabilities from 1.42% in 2010 to 1.05% in 2011. Interest expense on deposits decreased $645 thousand, or 18.4% in 2011. The decrease in interest expense occurred even though the average balance of interest-bearing deposits and borrowed funds increased by $11.6 million or 3.4% in 2011 as compared to 2010. The increase in the average balances of interest-bearing deposits was partially from the Branch Acquisition.
Interest expense decreased $1.5 million, or 24.0%, for 2010 as compared to 2009, due to continued declines in average rates paid for interest bearing liabilities, from 1.90% in 2009 to 1.42% in 2010. Interest expense on deposits declined $797 thousand, even though average deposit balances increased by $17.0 million, or 6.6% in 2010 as compared to 2009. Interest expense on borrowed funds decreased by $723 thousand due to principal reductions and maturities of FHLB advances, and lower interest rates remaining on outstanding borrowings.
10 2011 Annual Report to Shareholders | CSB Bancorp, Inc.
2011 Financial Review
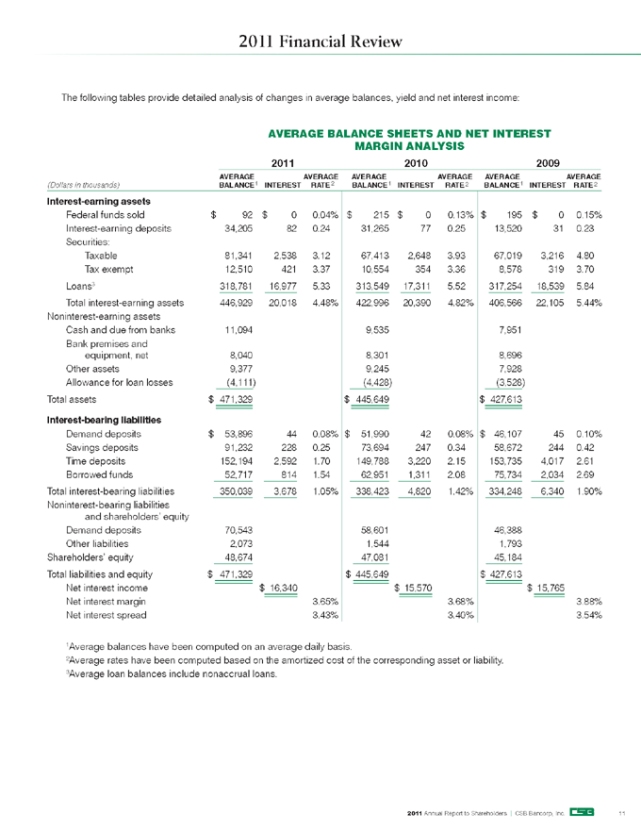
The following tables provide detailed analysis of changes in average balances, yield and net interest income:
AVERAGE BALANCE SHEETS AND NET INTEREST MARGIN ANALYSIS
2011 2010 2009
AVERAGE AVERAGE AVERAGE AVERAGE AVERAGE AVERAGE
(Dollars in thousands) BALANCE1 INTEREST RATE2 BALANCE1 INTEREST RATE 2 BALANCE1 INTEREST RATE 2
Interest-earning assets
Federal funds sold $ 92 $ 0 0.04% $ 215 $ 0 0.13% $ 195 $ 0 0.15%
Interest-earning deposits 34,205 82 0.24 31,265 77 0.25 13,520 31 0.23
Securities:
Taxable 81,341 2,538 3.12 67,413 2,648 3.93 67,019 3,216 4.80
Tax exempt 12,510 421 3.37 10,554 354 3.36 8,578 319 3.70
Loans3 318,781 16,977 5.33 313,549 17,311 5.52 317,254 18,539 5.84
Total interest-earning assets 446,929 20,018 4.48% 422,996 20,390 4.82% 406,566 22,105 5.44%
Noninterest-earning assets
Cash and due from banks 11,094 9,535 7,951
Bank premises and
equipment, net 8,040 8,301 8,696
Other assets 9,377 9,245 7,928
Allowance for loan losses (4,111) (4,428) (3,528)
Total assets $ 471,329 $ 445,649 $ 427,613
Interest-bearing liabilities
Demand deposits $ 53,896 44 0.08% $ 51,990 42 0.08% $ 46,107 45 0.10%
Savings deposits 91,232 228 0.25 73,694 247 0.34 58,672 244 0.42
Time deposits 152,194 2,592 1.70 149,788 3,220 2.15 153,735 4,017 2.61
Borrowed funds 52,717 814 1.54 62,951 1,311 2.08 75,734 2,034 2.69
Total interest-bearing liabilities 350,039 3,678 1.05% 338,423 4,820 1.42% 334,248 6,340 1.90%
Noninterest-bearing liabilities
and shareholders’ equity
Demand deposits 70,543 58,601 46,388
Other liabilities 2,073 1,544 1,793
Shareholders’ equity 48,674 47,081 45,184
Total liabilities and equity $ 471,329 $ 445,649 $ 427,613
Net interest income $ 16,340 $ 15,570 $ 15,765
Net interest margin 3.65% 3.68% 3.88%
Net interest spread 3.43% 3.40% 3.54%
1Average balances have been computed on an average daily basis.
2Average rates have been computed based on the amortized cost of the corresponding asset or liability. 3Average loan balances include nonaccrual loans.
2011 Annual Report to Shareholders | CSB Bancorp, Inc. 11
2011 Financial Review
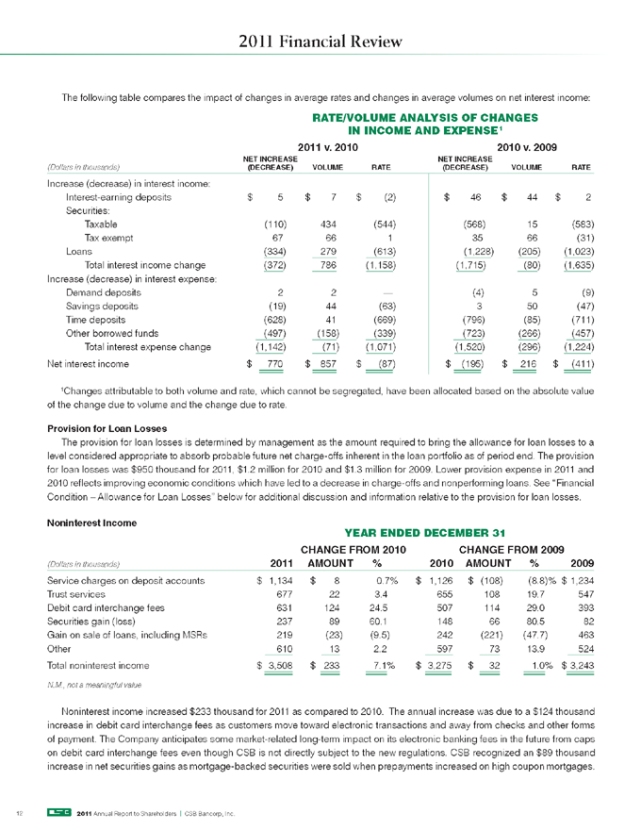
The following table compares the impact of changes in average rates and changes in average volumes on net interest income: RATE/VOLUME ANALYSIS OF CHANGES
IN INCOME AND EXPENSE1
2011 v. 2010 2010 v. 2009
NET INCREASE NET INCREASE
(Dollars in thousands) (DECREASE) VOLUME RATE (DECREASE) VOLUME RATE
Increase (decrease) in interest income:
Interest-earning deposits $ 5 $ 7 $ (2) $ 46 $ 44 $ 2
Securities:
Taxable (110) 434 (544) (568) 15 (583)
Tax exempt 67 66 1 35 66 (31)
Loans (334) 279 (613) (1,228) (205) (1,023)
Total interest income change (372 ) 786 (1,158) (1,715) (80) (1,635)
Increase (decrease) in interest expense:
Demand deposits 2 2 — (4) 5 (9)
Savings deposits (19) 44 (63) 3 50 (47)
Time deposits (628) 41 (669) (796) (85) (711)
Other borrowed funds (497) (158) (339) (723) (266) (457)
Total interest expense change (1,142) (71) (1,071) (1,520) (296) (1,224)
Net interest income $ 770 $ 857 $ (87) $ (195) $ 216 $ (411 )
1Changes attributable to both volume and rate, which cannot be segregated, have been allocated based on the absolute value of the change due to volume and the change due to rate.
Provision for Loan Losses
The provision for loan losses is determined by management as the amount required to bring the allowance for loan losses to a level considered appropriate to absorb probable future net charge-offs inherent in the loan portfolio as of period end. The provision for loan losses was $950 thousand for 2011, $1.2 million for 2010 and $1.3 million for 2009. Lower provision expense in 2011 and 2010 reflects improving economic conditions which have led to a decrease in charge-offs and nonperforming loans. See “Financial Condition – Allowance for Loan Losses” below for additional discussion and information relative to the provision for loan losses.
Noninterest Income
YEAR ENDED DECEMBER 31
CHANGE FROM 2010 CHANGE FROM 2009
(Dollars in thousands) 2011 AMOUNT % 2010 AMOUNT % 2009
Service charges on deposit accounts $ 1,134 $ 8 0.7% $ 1,126 $ (108) (8.8)% $ 1,234
Trust services 677 22 3.4 655 108 19.7 547
Debit card interchange fees 631 124 24.5 507 114 29.0 393
Securities gain (loss) 237 89 60.1 148 66 80.5 82
Gain on sale of loans, includingMSRs 219 (23) (9.5) 242 (221)
Other 610 13 2.2 597 73 13.9 524
Total noninterest income $ 3,508 $ 233 7.1% $ 3,275 $ 32 1.0% $ 3,243
N.M., not a meaningful value
Noninterest income increased $233 thousand for 2011 as compared to 2010. The annual increase was due to a $124 thousand increase in debit card interchange fees as customers move toward electronic transactions and away from checks and other forms of payment. The Company anticipates some market-related long-term impact on its electronic banking fees in the future from caps on debit card interchange fees even though CSB is not directly subject to the new regulations. CSB recognized an $89 thousand increase in net securities gains as mortgage-backed securities were sold when prepayments increased on high coupon mortgages.
12 2011 Annual Report to Shareholders | CSB Bancorp, Inc.
2011 Financial Review
Gains on sale of mortgage loans decreased as the volume of loans refinancing in 2011 was lower than 2010 Trust fees improved .
3.4% for the year due to higher average trust assets.
Noninterest income increased $32 thousand, or 1.0% for 2010 as compared to 2009. Service charges on deposits declined $108 thousand, or 8.8% for 2010 as compared to 2009, continuing a two-year trend of consumers overdrawing their accounts less frequently. Trust services income increased in 2010 from 2009 as fair market valuations and assets under management both increased. The average market value of trust assets under management during 2010 and 2009 was $61.2 million and $53.2 million, respectively. Debit card interchange fees increased $114 thousand, or 29.0% due primarily to increased consumer usage as monthly fees are waived on certain consumer checking accounts when the consumer reaches a specified minimum number of monthly debit card transactions Gain on sale of loans declined in 2010 from 2009 due to volume decreases in 1 .— family residential 4 mortgages sold into the secondary market, reflecting a softening of the consumer refinancing wave. Securities gains increased from 2009 primarily from the sale of certain mortgage-backed securities whose values rose in the low interest rate environment in 2010. Other income increased $73 thousand in 2010 over 2009, or 13.9% primarily from increases in loan servicing income of $35 thousand and check printing income of $28 thousand.
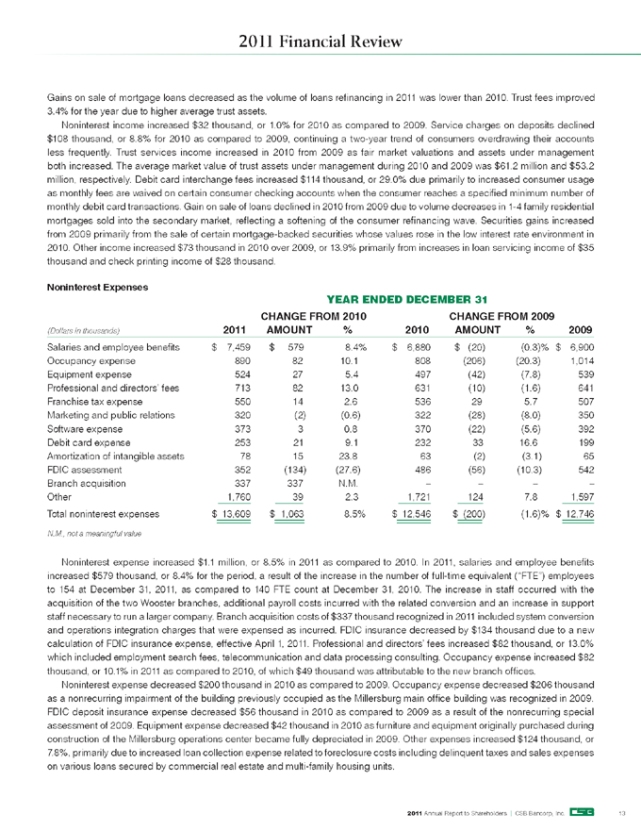
Noninterest Expenses
YEAR ENDED DECEMBER 31
CHANGE FROM 2010 CHANGE FROM 2009
(Dollars in thousands) 2011 AMOUNT % 2010 AMOUNT % 2009
Salaries and employee benefits $ 7,459 $ 579 8.4% $ 6,880 $ (20) (0.3)% $ 6,900
Occupancy expense 890 82 10.1 808 (206) (20.3) 1,014
Equipment expense 524 27 5.4 497 (42) (7.8) 539
Professional and directors’ fees 713 82 13.0 631 (10) (1.6) 641
Franchise tax expense 550 14 2.6 536 29 5.7 507
Marketing and public relations 320 (2) (0.6) 322 (28) (8.0) 350
Software expense 373 3 0.8 370 (22) (5.6) 392
Debit card expense 253 21 9.1 232 33 16.6 199
Amortization of intangible assets 78 15 23.8 63 (2) (3.1) 65
FDIC assessment 352 (134) (27.6) 486 (56) (10.3) 542
Branch acquisition 337 337 N.M. – – – –
Other 1,760 39 2.3 1,721 124 7.8 1,597
Total noninterest expenses $ 13,609 $ 1,063 8.5% $ 12,546 $ (200) (1.6)% $ 12,746
N.M., not a meaningful value
Noninterest expense increased $1.1 million, or 8.5% in 2011 as compared to 2010. In 2011, salaries and employee benefits increased $579 thousand, or 8.4% for the period, a result of the increase in the number of full-time equivalent (“FTE”) employees to 154 at December 31, 2011, as compared to 140 FTE count at December 31, 2010. The increase in staff occurred with the acquisition of the two Wooster branches, additional payroll costs incurred with the related conversion and an increase in support staff necessary to run a larger company. Branch acquisition costs of $337 thousand recognized in 2011 included system conversion and operations integration charges that were expensed as incurred. FDIC insurance decreased by $134 thousand due to a new calculation of FDIC insurance expense, effective April 1, 2011. Professional and directors’ fees increased $82 thousand, or 13.0% which included employment search fees, telecommunication and data processing consulting. Occupancy expense increased $82 thousand, or 10.1% in 2011 as compared to 2010, of which $49 thousand was attributable to the new branch offices.
Noninterest expense decreased $200 thousand in 2010 as compared to 2009. Occupancy expense decreased $206 thousand as a nonrecurring impairment of the building previously occupied as the Millersburg main office building was recognized in 2009. FDIC deposit insurance expense decreased $56 thousand in 2010 as compared to 2009 as a result of the nonrecurring special assessment of 2009. Equipment expense decreased $42 thousand in 2010 as furniture and equipment originally purchased during construction of the Millersburg operations center became fully depreciated in 2009. Other expenses increased $124 thousand, or 7.8%, primarily due to increased loan collection expense related to foreclosure costs including delinquent taxes and sales expenses on various loans secured by commercial real estate and multi-family housing units.
2011 Annual Report to Shareholders | CSB Bancorp, Inc. 13
2011 Financial Review
Income Taxes
The provision for income taxes amounted to $1.6 million in 2011 and 2010, an effective rate of 30.3% in 2011 compared to 31.0% in 2010, and $1.5 million in 2009, an effective rate of 31.1%. The decrease in the effective tax rate during 2011 as compared to 2010 is due primarily to a higher percentage of tax-exempt income to total income.
FINANCIAL CONDITION
Total assets of the Company were $551.2 million at December 31, 2011, compared to $457.1 million at December 31, 2010, representing an increase of $94.2 million, or 20.6%. Net loans increased $8.5 million, or 2.7%, while investment securities increased
$47.8 million, or 59.3% and interest-earning deposits with other banks increased $31.2 million. Deposits increased $90.1 million, or
25.5%, while other borrowings from the Federal Home Loan Bank (FHLB) decreased by $3.7 million, or 16.4%.
Securities
Total investment securities increased $48 million, or 59% to $128.5 million at year-end 2011. CSB’s portfolio primarily comprises agency mortgage-backed securities, other government agencies and corporations debt, and obligations of state and political subdivisions. Restricted securities consist primarily of FHLB stock. During 2011, increases occurred in government agency and corporation debt, mortgage-backed securities and state and political subdivision securities.
The Company has no exposure to government-sponsored enterprise preferred stocks, collateralized debt obligations or trust preferred securities. The Company’s municipal bond portfolio consists of both taxable and tax-exempt general obligation and revenue bonds. As of December 31, 2011, $12.8 million, or 86%, held an S&P or Moody’s investment grade rating and $2.1 million or 14% were nonrated. The portfolio includes a broad spectrum of counties, towns, universities and school districts in Ohio. The Company holds two nonagency collateralized mortgage securities whose national credit ratings have declined below investment grade since their purchase. The bonds current factors are below .20 on original faces of $4.5 million and there has been no significant evidence to support any adverse changes in the expected cash flows. The Company has the ability and intent to hold the bonds until the recovery of its cost. Total gross unrealized security losses within the portfolio were 0.2% of total available-for-sale securities at December 31, 2011, reflecting interest rate fluctuations, not credit downgrades.
Since one of the primary functions of the securities portfolio is to provide a source of liquidity, it is structured such that maturities and cash flows satisfy the Company’s liquidity needs and asset/liability management requirements.
Loans
Total loans increased $8.5 million, or 2.7% during 2011. Volume increases were recognized in commercial loans of $11.3 million, or 14.4%, and construction loans of $1.5 million, or 9.4%. These increases were offset by a decline in residential real estate loan balances of $5.3 million, or 4.9%, caused partially by the sale of most newly originated residential mortgages to the secondary market, and to a lesser extent a continued soft housing market suppressing overall mortgage lending activity. Attractive interest rates in the secondary market drove consumer demand for 1-4 family fixed rate residential mortgages during 2011 and the Company sold $7.0 million of originated mortgages into the secondary market. This demand for low fixed-rate mortgages included refinancing of the Company’s in-house mortgage portfolio, leading to a decline in residential mortgage balances.
Demand for home equity loans continued in 2011, with balances increasing $4.2 million. However, demand for installment lending declined as consumers continued to deleverage by paying down debt and increasing savings during 2011.
Commercial loans and commercial real estate loans increased with specific loan purchases being made in the Company’s new market areas acquired during the Wooster branch acquisition. Management anticipates the Company’s local service areas will exhibit slow economic growth with modest commercial real estate loan demand in 2012.
Commercial and commercial real estate loans comprise approximately 61% of the total loan portfolio, increasing from 58% at year-end 2010. Residential real estate decreased from 34% to approximately 32% between December 31, 2010 and December 31, 2011. Construction loans increased from 5.2% to 5.6% of the total portfolio between 2010 and 2011. The Company is well within the respective regulatory guidelines for investment in construction development and investment property loans that are not owner occupied.
14 2011 Annual Report to Shareholders | CSB Bancorp, Inc.
2011 Financial Review
Most of the Company’s lending activity is with customers primarily located within Holmes, Tuscarawas, Wayne and Stark Counties in Ohio. Credit concentrations, including commitments, as determined using North American Industry Classification Codes (NAICS), to the four largest industries compared to total loans at December 31, 2011 included $21.6 million, or 6.7% of total loans to lessors of nonresidential buildings or dwellings; $16.7 million, or 5.2% of total loans to lessors of residential real estate;
$16.3 million, or 5.0% of total loans to borrowers in the hotel, motel and lodging business and $14.1 million, or 4.3% of total loans to logging, sawmills and timber tract operations. These loans are generally secured by real property and equipment, and repayment is expected from operational cash flow. Credit losses arising from the Company’s lending experience in all four industries compare favorably with the Company’s loss experience on its loan portfolio as a whole. Credit evaluation is based on an evaluation of cash flow coverage of principal and interest payments and the adequacy of the collateral received.
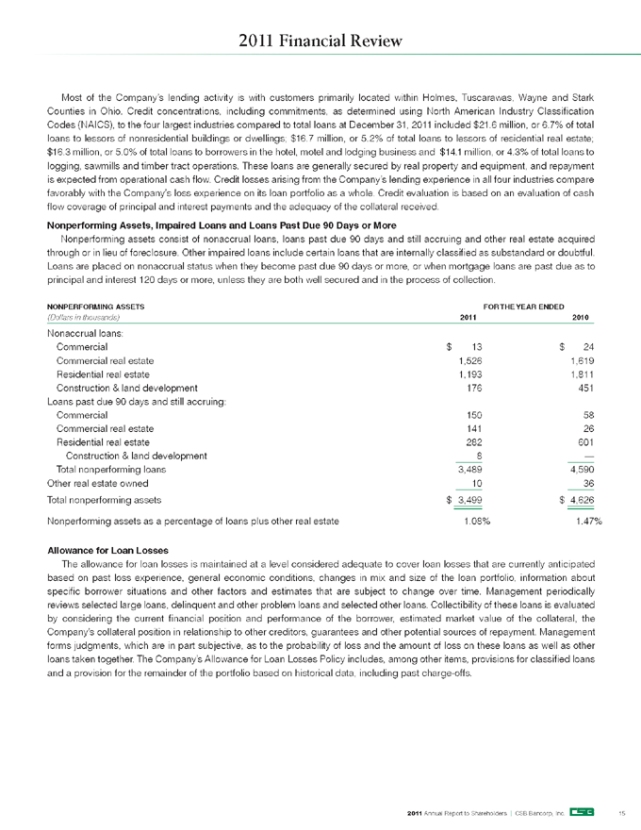
Nonperforming Assets, Impaired Loans and Loans Past Due 90 Days or More
Nonperforming assets consist of nonaccrual loans, loans past due 90 days and still accruing and other real estate acquired through or in lieu of foreclosure. Other impaired loans include certain loans that are internally classified as substandard or doubtful. Loans are placed on nonaccrual status when they become past due 90 days or more, or when mortgage loans are past due as to principal and interest 120 days or more, unless they are both well secured and in the process of collection.
NONPERFORMING ASSETS FOR THE YEAR ENDED
(Dollars in thousands) 2011 2010
Nonaccrual loans:
Commercial $ 13 $ 24
Commercial real estate 1,526 1,619
Residential real estate 1,193 1,811
Construction & land development 176 451
Loans past due 90 days and still accruing:
Commercial 150 58
Commercial real estate 141 26
Residential real estate 282 601
Construction & land development 8 —
Total nonperforming loans 3,489 4,590
Other real estate owned 10 36
Total nonperforming assets $ 3,499 $ 4,626
Nonperforming assets as a percentage of loans plus other real estate 1.08% 1.47%
Allowance for Loan Losses
The allowance for loan losses is maintained at a level considered adequate to cover loan losses that are currently anticipated based on past loss experience, general economic conditions, changes in mix and size of the loan portfolio, information about specific borrower situations and other factors and estimates that are subject to change over time. Management periodically reviews selected large loans, delinquent and other problem loans and selected other loans. Collectibility of these loans is evaluated by considering the current financial position and performance of the borrower, estimated market value of the collateral, the Company’s collateral position in relationship to other creditors, guarantees and other potential sources of repayment. Management forms judgments, which are in part subjective, as to the probability of loss and the amount of loss on these loans as well as other loans taken together. The Company’s Allowance for Loan Losses Policy includes, among other items, provisions for classified loans and a provision for the remainder of the portfolio based on historical data, including past charge-offs.
2011 Annual Report to Shareholders | CSB Bancorp, Inc. 15
2011 Financial Review
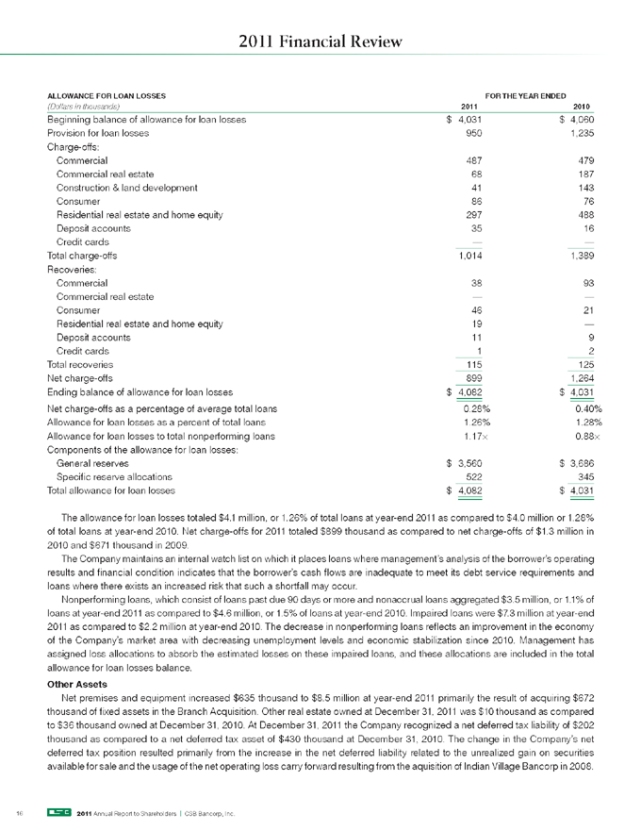
ALLOWANCE FOR LOAN LOSSES FOR THE YEAR ENDED
(Dollars in thousands) 2011 2010
Beginning balance of allowance for loan losses $ 4,031 $ 4,060
Provision for loan losses 950 1,235
Charge-offs:
Commercial 487 479
Commercial real estate 68 187
Construction & land development 41 143
Consumer 86 76
Residential real estate and home equity 297 488
Deposit accounts 35 16
Credit cards — —
Total charge-offs 1,014 1,389
Recoveries:
Commercial 38 93
Commercial real estate — —
Consumer 46 21
Residential real estate and home equity 19 —
Deposit accounts 11 9
Credit cards 1 2
Total recoveries 115 125
Net charge-offs 899 1,264
Ending balance of allowance for loan losses $ 4,082 $ 4,031
Net charge-offs as a percentage of average total loans 0.28% 0.40%
Allowance for loan losses as a percent of total loans 1.26% 1.28%
Allowance for loan losses to total nonperforming loans 1.17× 0.88×
Components of the allowance for loan losses:
General reserves $ 3,560 $ 3,686
Specific reserve allocations 522 345
Total allowance for loan losses $ 4,082 $ 4,031
The allowance for loan losses totaled $4.1 million, or 1.26% of total loans at year-end 2011 as compared to $4.0 million or 1.28% of total loans at year-end 2010. Net charge-offs for 2011 totaled $899 thousand as compared to net charge-offs of $1.3 million in 2010 and $671 thousand in 2009.
The Company maintains an internal watch list on which it places loans where management’s analysis of the borrower’s operating results and financial condition indicates that the borrower’s cash flows are inadequate to meet its debt service requirements and loans where there exists an increased risk that such a shortfall may occur.
Nonperforming loans, which consist of loans past due 90 days or more and nonaccrual loans aggregated $3.5 million, or 1.1% of loans at year-end 2011 as compared to $4.6 million, or 1.5% of loans at year-end 2010. Impaired loans were $7.3 million at year-end 2011 as compared to $2.2 million at year-end 2010. The decrease in nonperforming loans reflects an improvement in the economy of the Company’s market area with decreasing unemployment levels and economic stabilization since 2010. Management has assigned loss allocations to absorb the estimated losses on these impaired loans, and these allocations are included in the total allowance for loan losses balance.
Other Assets
Net premises and equipment increased $635 thousand to $8.5 million at year-end 2011 primarily the result of acquiring $672 thousand of fixed assets in the Branch Acquisition. Other real estate owned at December 31, 2011 was $10 thousand as compared to $36 thousand owned at December 31, 2010. At December 31, 2011 the Company recognized a net deferred tax liability of $202 thousand as compared to a net deferred tax asset of $430 thousand at December 31, 2010. The change in the Company’s net deferred tax position resulted primarily from the increase in the net deferred liability related to the unrealized gain on securities available for sale and the usage of the net operating loss carry forward resulting from the aquisition of Indian Village Bancorp in 2008.
16 2011 Annual Report to Shareholders | CSB Bancorp, Inc.
2011 Financial Review
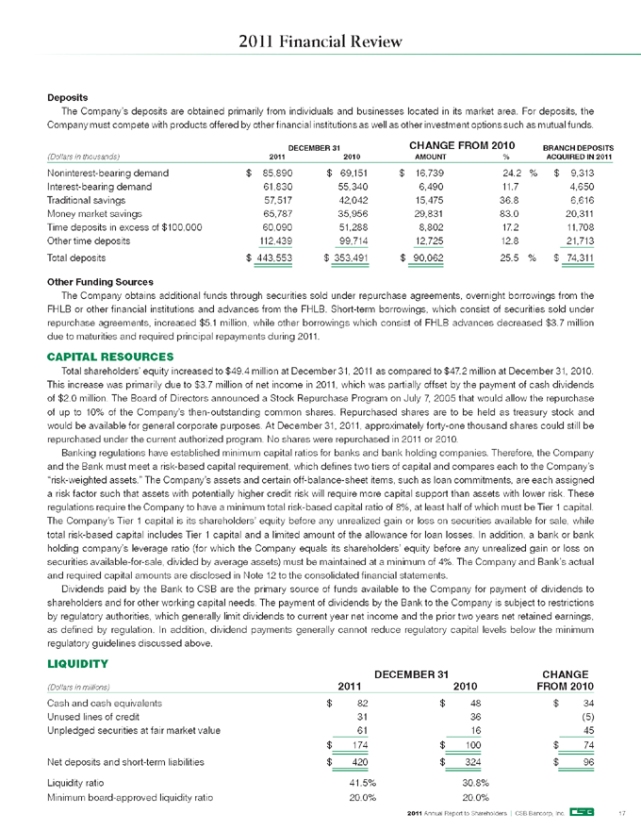
Deposits
The Company’s deposits are obtained primarily from individuals and businesses located in its market area. For deposits, the Company must compete with products offered by other financial institutions as well as other investment options such as mutual funds.
DECEMBER 31 CHANGE FROM 2010 BRANCH DEPOSITS
(Dollars in thousands) 2011 2010 AMOUNT % ACQUIRED IN 2011
Noninterest-bearing demand $ 85,890 $ 69,151 $ 16,739 24.2 % $ 9,313
Interest-bearing demand 61,830 55,340 6,490 11.7 4,650
Traditional savings 57,517 42,042 15,475 36.8 6,616
Money market savings 65,787 35,956 29,831 83.0 20,311
Time deposits in excess of $100,000 60,090 51,288 8,802 17.2 11,708
Other time deposits 112,439 99,714 12,725 12.8 21,713
Total deposits $ 443,553 $ 353,491 $ 90,062 25.5 % $ 74,311
Other Funding Sources
The Company obtains additional funds through securities sold under repurchase agreements, overnight borrowings from the FHLB or other financial institutions and advances from the FHLB. Short-term borrowings, which consist of securities sold under repurchase agreements, increased $5.1 million, while other borrowings which consist of FHLB advances decreased $3.7 million due to maturities and required principal repayments during 2011.
CAPITAL RESOURCES
Total shareholders’ equity increased to $49.4 million at December 31, 2011 as compared to $47.2 million at December 31, 2010. This increase was primarily due to $3.7 million of net income in 2011, which was partially offset by the payment of cash dividends of $2.0 million. The Board of Directors announced a Stock Repurchase Program on July 7, 2005 that would allow the repurchase of up to 10% of the Company’s then-outstanding common shares. Repurchased shares are to be held as treasury stock and would be available for general corporate purposes. At December 31, 2011, approximately forty-one thousand shares could still be repurchased under the current authorized program. No shares were repurchased in 2011 or 2010.
Banking regulations have established minimum capital ratios for banks and bank holding companies. Therefore, the Company and the Bank must meet a risk-based capital requirement, which defines two tiers of capital and compares each to the Company’s “risk-weighted assets.” The Company’s assets and certain off-balance-sheet items, such as loan commitments, are each assigned a risk factor such that assets with potentially higher credit risk will require more capital support than assets with lower risk. These regulations require the Company to have a minimum total risk-based capital ratio of 8%, at least half of which must be Tier 1 capital. The Company’s Tier 1 capital is its shareholders’ equity before any unrealized gain or loss on securities available for sale, while total risk-based capital includes Tier 1 capital and a limited amount of the allowance for loan losses. In addition, a bank or bank holding company’s leverage ratio (for which the Company equals its shareholders’ equity before any unrealized gain or loss on securities available-for-sale, divided by average assets) must be maintained at a minimum of 4%. The Company and Bank’s actual and required capital amounts are disclosed in Note 12 to the consolidated financial statements.
Dividends paid by the Bank to CSB are the primary source of funds available to the Company for payment of dividends to shareholders and for other working capital needs. The payment of dividends by the Bank to the Company is subject to restrictions by regulatory authorities, which generally limit dividends to current year net income and the prior two years net retained earnings, as defined by regulation. In addition, dividend payments generally cannot reduce regulatory capital levels below the minimum regulatory guidelines discussed above.
LIQUIDITY
DECEMBER 31 CHANGE
(Dollars in millions) 2011 2010 FROM 2010
Cash and cash equivalents $ 82 $ 48 $ 34
Unused lines of credit 31 36 (5)
Unpledged securities at fair market value 61 16 45
$ 174 $ 100 $ 74
Net deposits and short-term liabilities $ 420 $ 324 $ 96
Liquidity ratio 41.5% 30.8%
Minimum board-approved liquidity ratio 20.0% 20.0%
2011 Annual Report to Shareholders | CSB Bancorp, Inc. 17

2011 Financial Review
Liquidity refers to the Company’s ability to generate sufficient cash to fund current loan demand, meet deposit withdrawals, pay operating expenses and meet other obligations. The Company’s liquidity ratio rose in 2011 after receiving $61 million in cash through the branch acquisition. Liquidity is centrally monitored by CSB’s Asset Liability Committee. The Company was within all Board-approved limits at December 31, 2011 and 2010. Additional sources of liquidity include net income, loan repayments, and adjustments of interest rates to attract deposit accounts.
As summarized in the consolidated statements of cash flows, the most significant investing activities for the Company in 2011 included net cash from the branch acquisition of $61 million, net loan originations of $1 million and the maturities and calls of securities totaling $45 million, offset by $96 million in securities purchases. The Company’s financing activities included a $16 million increase in deposits, a $5 million increase in securities sold under agreements to repurchase and a $4 million net repayment of FHLB advances.
QUANTITATIVE AND QUALITATIVE DISCLOSURES ABOUT MARKET RISK
The most significant market risk to which the Company is exposed is interest rate risk. The business of the Company and the composition of its balance sheet consist of investments in interest-earning assets (primarily loans and securities), which are funded by interest-bearing liabilities (deposits and borrowings). These financial instruments have varying levels of sensitivity to changes in the market rates of interest, resulting in market risk. None of the Company’s financial instruments are held for trading purposes.
The Board of Directors establishes policies and operating limits with respect to interest rate risk. The Company manages interest rate risk regularly through its Asset Liability Committee. The Committee meets on a monthly basis and reviews various asset and liability management information including, but not limited to, the Company’s liquidity position, projected sources and uses of funds, interest rate risk position and economic conditions.
The Company monitors its interest rate risk through modeling, whereby it measures potential changes in its future earnings and the fair values of its financial instruments that may result from one or more hypothetical changes in interest rates. This analysis is performed by estimating the expected cash flows of the Company’s financial instruments using interest rates in effect at year-end 2011 and 2010. Income simulation analysis is used to measure the sensitivity of forecasted net interest income to changes in market rates over a two-year time horizon. The economic value of equity (EVE) is calculated by subjecting the period-end balance sheet on a quarterly basis to changes in interest rates and measuring the impact of the changes on the values of the assets and liabilities. Hypothetical changes in interest rates are then applied to the financial instruments, and the cash flows and fair values are again estimated using these hypothetical rates. For the net interest income estimates, the hypothetical rates are applied to the financial instruments based on the assumed cash flows. Interest rate risk policy limits are determined by measuring the anticipated change in net interest income over a two year period assuming a quarterly ramped 100, 200, 300 and 400 basis point increase in market interest rates as compared to a stable rate environment or base model.
Net Interest Income at Risk
DECEMBER 31, 2011
CHANGE IN NET INTEREST DOLLAR
INTEREST RATES INCOME CHANGE PERCENTAGE BOARD
(BASIS POINTS) (Dollars in thousands) CHANGE POLICY LIMITS
+400 $ 17,500 $ 818 4.9% ± 25%
+300 17,241 559 3.4 ± 15
+200 17,028 346 2.1 ± 10
+100 16,857 175 1.0 ± 5
0 16,682 — — —
DECEMBER 31, 2010
CHANGE IN NET INTEREST DOLLAR
INTEREST RATES INCOME CHANGE PERCENTAGE BOARD
(BASIS POINTS) (Dollars in thousands) CHANGE POLICY LIMITS
+300 $ 16,275 $ 443 2.8% ± 15%
+200 16,073 241 1.5 ± 10
+100 15,906 74 0.5 ± 5
0 15,832 — — —
Management reviews Net Interest Income at Risk with the Board on a periodic basis. The Company was within all Board-approved limits at December 31, 2011 and 2010.
18 2011 Annual Report to Shareholders | CSB Bancorp, Inc.
2011 Financial Review
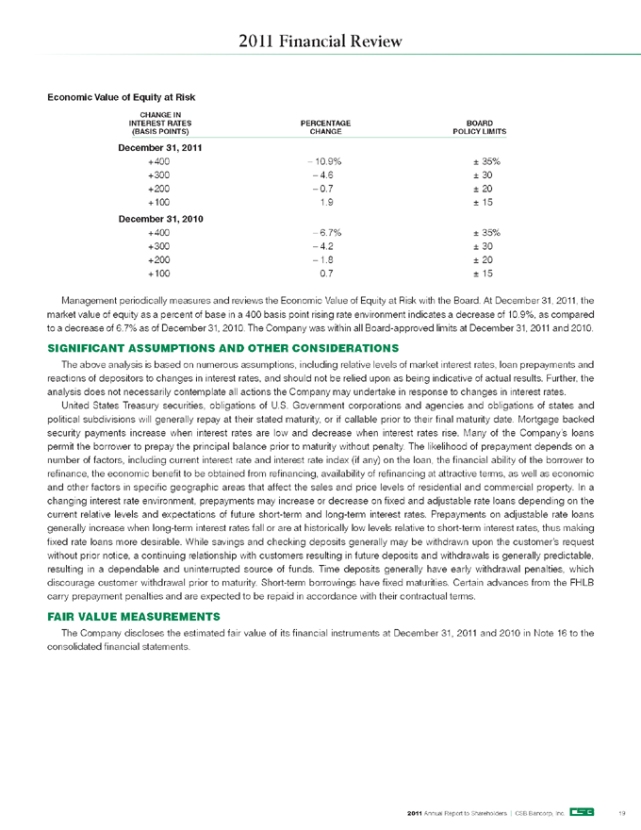
Economic Value of Equity at Risk
CHANGE IN
INTEREST RATES PERCENTAGE BOARD
(BASIS POINTS) CHANGE POLICY LIMITS
December 31, 2011
+400 – 10.9% ± 35%
+300 – 4.6 ± 30
+200 – 0.7 ± 20
+100 1.9 ± 15
December 31, 2010
+400 – 6.7% ± 35%
+300 – 4.2 ± 30
+200 – 1.8 ± 20
+100 0.7 ± 15
Management periodically measures and reviews the Economic Value of Equity at Risk with the Board. At December 31, 2011, the market value of equity as a percent of base in a 400 basis point rising rate environment indicates a decrease of 10.9%, as compared to a decrease of 6.7% as of December 31, 2010. The Company was within all Board-approved limits at December 31, 2011 and 2010.
SIGNIFICANT ASSUMPTIONS AND OTHER CONSIDERATIONS
The above analysis is based on numerous assumptions, including relative levels of market interest rates, loan prepayments and reactions of depositors to changes in interest rates, and should not be relied upon as being indicative of actual results. Further, the analysis does not necessarily contemplate all actions the Company may undertake in response to changes in interest rates.
United States Treasury securities, obligations of U. Government corporations and agencies and obligations of states and S. political subdivisions will generally repay at their stated maturity, or if callable prior to their final maturity date. Mortgage backed security payments increase when interest rates are low and decrease when interest rates rise. Many of the Company’s loans permit the borrower to prepay the principal balance prior to maturity without penalty. The likelihood of prepayment depends on a number of factors, including current interest rate and interest rate index (if any) on the loan, the financial ability of the borrower to refinance, the economic benefit to be obtained from refinancing, availability of refinancing at attractive terms, as well as economic and other factors in specific geographic areas that affect the sales and price levels of residential and commercial property. In a changing interest rate environment, prepayments may increase or decrease on fixed and adjustable rate loans depending on the current relative levels and expectations of future short-term and long-term interest rates. Prepayments on adjustable rate loans generally increase when long-term interest rates fall or are at historically low levels relative to short-term interest rates, thus making fixed rate loans more desirable. While savings and checking deposits generally may be withdrawn upon the customer’s request without prior notice, a continuing relationship with customers resulting in future deposits and withdrawals is generally predictable, resulting in a dependable and uninterrupted source of funds. Time deposits generally have early withdrawal penalties, which discourage customer withdrawal prior to maturity. Short-term borrowings have fixed maturities. Certain advances from the FHLB carry prepayment penalties and are expected to be repaid in accordance with their contractual terms.
FAIR VALUE MEASUREMENTS
The Company discloses the estimated fair value of its financial instruments at December 31, 2011 and 2010 in Note 16 to the consolidated financial statements.
2011 Annual Report to Shareholders | CSB Bancorp, Inc. 19
2011 Financial Review
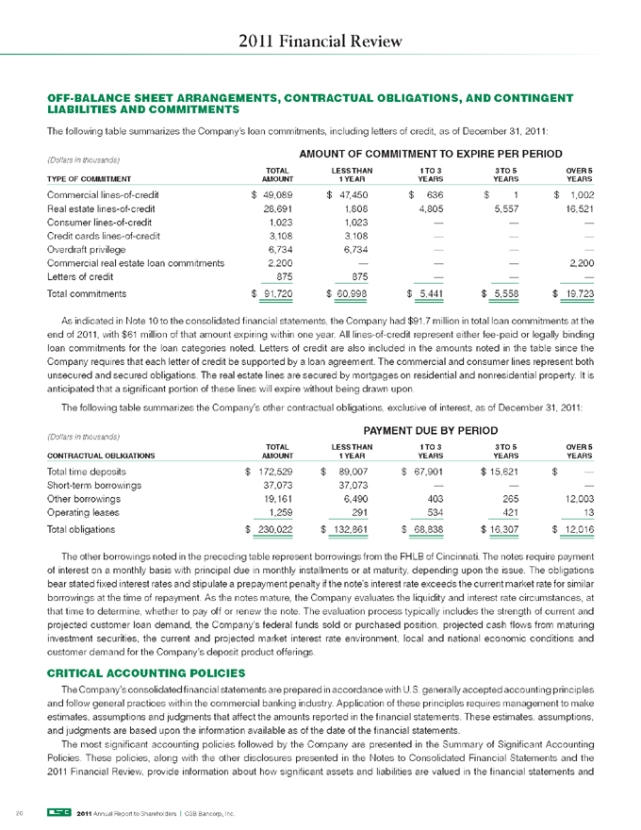
OFF-BALANCE SHEET ARRANGEMENTS, CONTRACTUAL OBLIGATIONS, AND CONTINGENT LIABILITIES AND COMMITMENTS
The following table summarizes the Company’s loan commitments, including letters of credit, as of December 31, 2011:
(Dollars in thousands) AMOUNT OF COMMITMENT TO EXPIRE PER PERIOD
TOTAL LESS THAN 1 TO 3 3 TO 5 OVER 5
TYPE OF COMMITMENT AMOUNT 1 YEAR YEARS YEARS YEARS
Commercial lines-of-credit $ 49,089 $ 47,450 $ 636 $ 1 $ 1,002
Real estate lines-of-credit 28,691 1,808 4,805 5,557 16,521
Consumer lines-of-credit 1,023 1,023 — — —
Credit cards lines-of-credit 3,108 3,108 — — —
Overdraft privilege 6,734 6,734 — — —
Commercial real estate loan commitments 2,200 — — — 2,200
Letters of credit 875 875 — — —
Total commitments $ 91,720 $ 60,998 $ 5,441 $ 5,558 $ 19,723
As indicated in Note 10 to the consolidated financial statements, the Company had $91.7 million in total loan commitments at the end of 2011, with $61 million of that amount expiring within one year. All lines-of-credit represent either fee-paid or legally binding loan commitments for the loan categories noted. Letters of credit are also included in the amounts noted in the table since the Company requires that each letter of credit be supported by a loan agreement. The commercial and consumer lines represent both unsecured and secured obligations. The real estate lines are secured by mortgages on residential and nonresidential property. It is anticipated that a significant portion of these lines will expire without being drawn upon.
The following table summarizes the Company’s other contractual obligations, exclusive of interest, as of December 31, 2011:
(Dollars in thousands) PAYMENT DUE BY PERIOD
TOTAL LESS THAN 1 TO 3 3 TO 5 OVER 5
CONTRACTUAL OBLIGATIONS AMOUNT 1 YEAR YEARS YEARS YEARS
Total time deposits $ 172,529 $ 89,007 $ 67,901 $ 15,621 $ —
Short-term borrowings 37,073 37,073 — — —
Other borrowings 19,161 6,490 403 265 12,003
Operating leases 1,259 291 534 421 13
Total obligations $ 230,022 $ 132,861 $ 68,838 $ 16,307 $ 12,016
The other borrowings noted in the preceding table represent borrowings from the FHLB of Cincinnati. The notes require payment of interest on a monthly basis with principal due in monthly installments or at maturity, depending upon the issue. The obligations bear stated fixed interest rates and stipulate a prepayment penalty if the note’s interest rate exceeds the current market rate for similar borrowings at the time of repayment. As the notes mature, the Company evaluates the liquidity and interest rate circumstances, at that time to determine, whether to pay off or renew the note. The evaluation process typically includes the strength of current and projected customer loan demand, the Company’s federal funds sold or purchased position, projected cash flows from maturing investment securities, the current and projected market interest rate environment, local and national economic conditions and customer demand for the Company’s deposit product offerings.
CRITICAL ACCOUNTING POLICIES
The Company’s consolidated financial statements are prepared in accordance with U.S. generally accepted accounting principles and follow general practices within the commercial banking industry. Application of these principles requires management to make estimates, assumptions and judgments that affect the amounts reported in the financial statements. These estimates, assumptions, and judgments are based upon the information available as of the date of the financial statements.
The most significant accounting policies followed by the Company are presented in the Summary of Significant Accounting Policies. These policies, along with the other disclosures presented in the Notes to Consolidated Financial Statements and the 2011 Financial Review, provide information about how significant assets and liabilities are valued in the financial statements and
20 2011 Annual Report to Shareholders | CSB Bancorp, Inc.
2011 Financial Review
how those values are determined. Management has identified the determination of other-than-temporary impairment on investment securities and the allowance for loan losses as the accounting areas that require the most subjective and complex estimates, assumptions and judgments and, as such, could be the most subject to revision as new information becomes available.
Securities are evaluated periodically to determine whether a decline in their value is other-than-temporary. Management uses criteria such as the magnitude and duration of the decline, in addition to the reasons underlying the decline, to determine whether the loss in value is other-than-temporary. The term “other-than-temporary” is not intended to indicate that the decline is permanent, but indicates that the prospect for a near-term recovery of value is not necessarily favorable, or that there is a lack of evidence to support a realizable value equal to or greater than the carrying value of the investment. Once a decline in value is determined to be other-than-temporary, the value of the security is reduced and a corresponding charge to earnings is recognized.
As previously noted in the section entitled Allowance for Loan Losses, management performs analysis to assess the adequacy of its allowance for loan losses. This analysis encompasses a variety of factors including the potential loss exposure for individually reviewed loans, the historical loss experience, the volume of nonperforming loans (i.e., loans in nonaccrual status or past due 90 days or more), the volume of loans past due, any significant changes in lending or loan review staff, an evaluation of current and future local and national economic conditions, any significant changes in the volume or mix of loans within each category, a review of the significant concentrations of credit and any legal, competitive or regulatory concerns.
CSB accounts for business combinations using the acquisition method of accounting Goodwill and intangible assets with . indefinite useful lives are not amortized. Intangible assets with finite useful lives, consisting of core deposit intangibles, are amortized using accelerated methods over their estimated weighted-average useful lives, approximating ten years. Additional information is presented in Note 5, Goodwill and Other Intangible Assets.
IMPACT OF INFLATION AND CHANGING PRICES
The consolidated financial statements and related data presented herein have been prepared in accordance with U.S. generally accepted accounting principles, requiring measurement of financial position and results of operations primarily in terms of historical dollars without considering changes in the relative purchasing power of money over time due to inflation. Unlike most industrial companies, most assets and liabilities of the Company are monetary in nature. Therefore, interest rates have a more significant impact on the Company’s performance than the effects of general levels of inflation. Interest rates do not necessarily move in the same direction or in the same magnitude as prices of goods and services. The liquidity, maturity structure and quality of the Company’s assets and liabilities are critical to maintenance of acceptable performance levels.
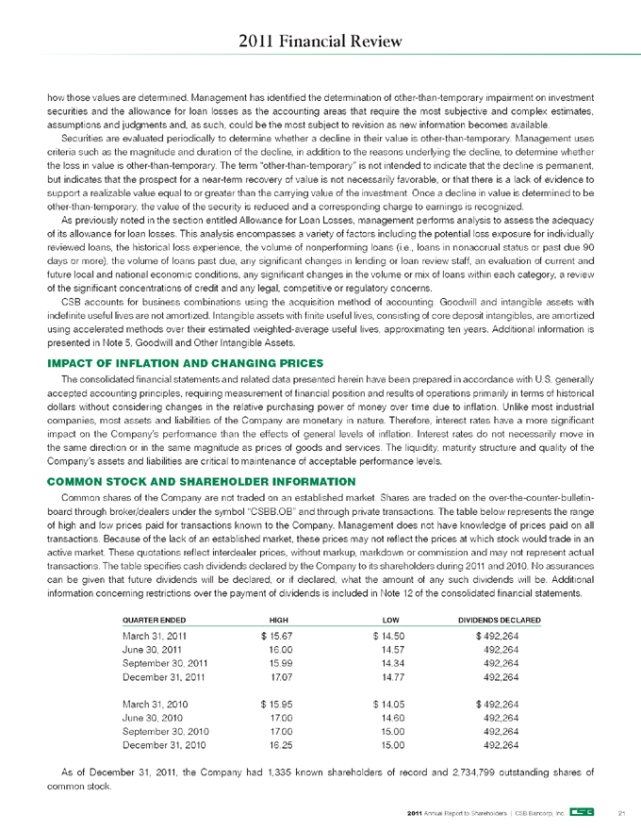
COMMON STOCK AND SHAREHOLDER INFORMATION
Common shares of the Company are not traded on an established market. Shares are traded on the over-the-counter-bulletin-board through broker/dealers under the symbol “CSBB.OB” and through private transactions. The table below represents the range of high and low prices paid for transactions known to the Company. Management does not have knowledge of prices paid on all transactions. Because of the lack of an established market, these prices may not reflect the prices at which stock would trade in an active market. These quotations reflect interdealer prices, without markup, markdown or commission and may not represent actual transactions. The table specifies cash dividends declared by the Company to its shareholders during 2011 and 2010. No assurances can be given that future dividends will be declared, or if declared, what the amount of any such dividends will be. Additional information concerning restrictions over the payment of dividends is included in Note 12 of the consolidated financial statements.
QUARTER ENDED HIGH LOW DIVIDENDS DECLARED
March 31, 2011 $ 15.67 $ 14.50 $ 492,264
June 30, 2011 16.00 14.57 492,264
September 30, 2011 15.99 14.34 492,264
December 31, 2011 17.07 14.77 492,264
March 31, 2010 $ 15.95 $ 14.05 $ 492,264
June 30, 2010 17.00 14.60 492,264
September 30, 2010 17.00 15.00 492,264
December 31, 2010 16.25 15.00 492,264
As of December 31, 2011, the Company had 1,335 known shareholders of record and 2,734,799 outstanding shares of common stock.
2011 Annual Report to Shareholders | CSB Bancorp, Inc. 21
Report on Management’s Assessment of Internal Control over Financial Reporting
The management of CSB Bancorp, Inc. is responsible for establishing and maintaining adequate internal control over financial reporting. Management has designed our internal control over financial reporting to provide reasonable assurance that our published financial statements are fairly presented, in all material respects, in conformity with U.S. generally accepted accounting principles.
Management is required by paragraph (c) of Rule 13a-15 of the Securities Exchange Act of 1934, as amended, to assess the effectiveness of our internal control over financial reporting as of each year-end. In making this assessment, management used the Internal Control-Integrated Framework issued in July 1994 by the Committee of Sponsoring Organizations of the Treadway Commission (COSO).
Management conducted the required assessment of the effectiveness of our internal control over financial reporting as of December 31, 2011. Based upon this assessment, management believes that our internal control over financial reporting is effective as of December 31, 2011.
This annual report does not include an attestation report of the Company’s registered public accounting firm regarding internal control over financial reporting. Management’s report was not subject to attestation by the Company’s registered public accounting firm pursuant to the rules of the Securities and Exchange Commission that permit the Company to provide only management’s report in this annual report.
Eddie L. Steiner Paula J. Meiler
President and Senior Vice President,
Chief Executive Officer Chief Financial Officer
22 2011 Annual Report to Shareholders | CSB Bancorp, Inc.
Report of Independent Registered Public Accounting Firm
Board of Directors and Shareholders CSB Bancorp, Inc.
We have audited the accompanying consolidated balance sheets of CSB Bancorp, Inc. and subsidiaries as of December 31, 2011 and 2010, and the related consolidated statements of income, shareholders’ equity, and cash flows for each of the years in the three-year period ended December 31, 2011. These consolidated financial statements are the responsibility of the Company’s management. Our responsibility is to express an opinion on these financial statements based on our audits.
We conducted our audits in accordance with the standards of the Public Company Accounting Oversight Board (United States). Those standards require that we plan and perform the audit to obtain reasonable assurance about whether the financial statements are free of material misstatement. The Company is not required to have, nor were we engaged to perform an audit of its internal control over financial reporting. Our audits included consideration of internal control over financial reporting as a basis for designing audit procedures that are appropriate in the circumstances, but not for the purpose of expressing an opinion on the effectiveness of the Company’s internal control over financial reporting. Accordingly, we express no such opinion. An audit also includes examining, on a test basis, evidence supporting the amounts and disclosures in the financial statements, assessing the accounting principles used and significant estimates made by management, as well as evaluating the overall financial statement presentation. We believe that our audits provide a reasonable basis for our opinion.
In our opinion, the consolidated financial statements referred to above present fairly, in all material respects, the financial position of CSB Bancorp, Inc. and subsidiaries as of December 31, 2011 and 2010, and the consolidated results of their operations and their cash flows for each of the years in the three-year period ended December 31, 2011, in conformity with U.S. generally accepted accounting principles.
Wexford, Pennsylvania March 8, 2012
2011 Annual Report to Shareholders | CSB Bancorp, Inc. 23
For the fiscal year ended December 31, 2011Consolidated Balance Sheets
December 31, 2011 and 2010
| | | | | | | | |
(Dollars in thousands) | | 2011 | | | 2010 | |
ASSETS | | | | | | | | |
Cash and cash equivalents | | | | | | | | |
Cash and due from banks | | $ | 12,519 | | | $ | 9,798 | |
Interest-earning deposits in other banks | | | 69,739 | | | | 38,497 | |
Federal funds sold | | | — | | | | 65 | |
| | | | | | | | |
Total cash and cash equivalents | | | 82,258 | | | | 48,360 | |
| | | | | | | | |
Securities | | | | | | | | |
Available-for-sale, at fair value | | | 123,026 | | | | 75,204 | |
Restricted stock, at cost | | | 5,463 | | | | 5,463 | |
| | | | | | | | |
Total securities | | | 128,489 | | | | 80,667 | |
| | | | | | | | |
Loans | | | 324,182 | | | | 315,647 | |
Less allowance for loan losses | | | 4,082 | | | | 4,031 | |
| | | | | | | | |
Net loans | | | 320,100 | | | | 311,616 | |
| | | | | | | | |
Premises and equipment, net | | | 8,513 | | | | 7,878 | |
Core deposit intangible | | | 1,034 | | | | 406 | |
Goodwill | | | 4,728 | | | | 1,725 | |
Bank-owned life insurance | | | 3,068 | | | | 2,961 | |
Accrued interest receivable and other assets | | | 3,043 | | | | 3,443 | |
| | | | | | | | |
TOTAL ASSETS | | $ | 551,233 | | | $ | 457,056 | |
| | | | | | | | |
LIABILITIES AND SHAREHOLDERS’ EQUITY | | | | | | | | |
LIABILITIES | | | | | | | | |
Deposits | | | | | | | | |
Noninterest-bearing | | $ | 85,890 | | | $ | 69,151 | |
Interest-bearing | | | 357,663 | | | | 284,340 | |
| | | | | | | | |
Total deposits | | | 443,553 | | | | 353,491 | |
| | | | | | | | |
Short-term borrowings | | | 37,073 | | | | 32,018 | |
Other borrowings | | | 19,161 | | | | 22,909 | |
Accrued interest payable and other liabilities | | | 2,017 | | | | 1,484 | |
| | | | | | | | |
Total liabilities | | | 501,804 | | | | 409,902 | |
| | | | | | | | |
SHAREHOLDERS’ EQUITY | | | | | | | | |
Common stock, $6.25 par value. Authorized 9,000,000 shares; issued 2,980,602 shares; outstanding 2,734,799 shares in 2011 and 2010 | | | 18,629 | | | | 18,629 | |
Additional paid-in capital | | | 9,994 | | | | 9,994 | |
Retained earnings | | | 24,391 | | | | 22,673 | |
Treasury stock at cost – 245,803 shares in 2011 and 2010 | | | (5,015 | ) | | | (5,015 | ) |
Accumulated other comprehensive income | | | 1,430 | | | | 873 | |
| | | | | | | | |
Total shareholders’ equity | | | 49,429 | | | | 47,154 | |
| | | | | | | | |
TOTAL LIABILITIES AND SHAREHOLDERS’ EQUITY | | $ | 551,233 | | | $ | 457,056 | |
| | | | | | | | |
These consolidated financial statements should be read in connection with the accompanying summary of significant accounting policies and notes to consolidated financial statements.
24  2011Annual Report to Shareholders | CSB Bancorp, Inc.
Consolidated Statements of Income
Years Ended December 31, 2011, 2010 and 2009
| | | | | | | | | | | | |
(Dollars in thousands, except per share data) | | 2011 | | | 2010 | | | 2009 | |
INTEREST AND DIVIDEND INCOME | | | | | | | | | | | | |
Loans, including fees | | $ | 16,977 | | | $ | 17,311 | | | $ | 18,539 | |
Taxable securities | | | 2,538 | | | | 2,648 | | | | 3,216 | |
Nontaxable securities | | | 421 | | | | 354 | | | | 319 | |
Other | | | 82 | | | | 77 | | | | 31 | |
| | | | | | | | | | | | |
Total interest and dividend income | | | 20,018 | | | | 20,390 | | | | 22,105 | |
| | | | | | | | | | | | |
INTEREST EXPENSE | | | | | | | | | | | | |
Deposits | | | 2,864 | | | | 3,509 | | | | 4,306 | |
Short-term borrowings | | | 139 | | | | 201 | | | | 271 | |
Other borrowings | | | 675 | | | | 1,110 | | | | 1,763 | |
| | | | | | | | | | | | |
Total interest expense | | | 3,678 | | | | 4,820 | | | | 6,340 | |
| | | | | | | | | | | | |
NET INTEREST INCOME | | | 16,340 | | | | 15,570 | | | | 15,765 | |
PROVISION FOR LOAN LOSSES | | | 950 | | | | 1,235 | | | | 1,337 | |
| | | | | | | | | | | | |
Net interest income, after provision for loan losses | | | 15,390 | | | | 14,335 | | | | 14,428 | |
| | | | | | | | | | | | |
NONINTEREST INCOME | | | | | | | | | | | | |
Service charges on deposit accounts | | | 1,134 | | | | 1,126 | | | | 1,234 | |
Trust services | | | 677 | | | | 655 | | | | 547 | |
Debit card interchange fees | | | 631 | | | | 507 | | | | 393 | |
Securities gain, net | | | 237 | | | | 148 | | | | 152 | |
Other-than-temporary impairment losses | | | — | | | | — | | | | (70 | ) |
Gain on sale of loans, net | | | 219 | | | | 242 | | | | 463 | |
Other income | | | 610 | | | | 597 | | | | 524 | |
| | | | | | | | | | | | |
Total noninterest income | | | 3,508 | | | | 3,275 | | | | 3,243 | |
| | | | | | | | | | | | |
NONINTEREST EXPENSES | | | | | | | | | | | | |
Salaries and employee benefits | | | 7,459 | | | | 6,880 | | | | 6,900 | |
Occupancy expense | | | 890 | | | | 808 | | | | 1,014 | |
Equipment expense | | | 524 | | | | 497 | | | | 539 | |
Professional and director fees | | | 713 | | | | 631 | | | | 641 | |
Franchise tax expense | | | 550 | | | | 536 | | | | 507 | |
Marketing and public relations | | | 320 | | | | 322 | | | | 350 | |
Software expense | | | 373 | | | | 370 | | | | 392 | |
Debit card expense | | | 253 | | | | 232 | | | | 199 | |
Amortization of intangible assets | | | 78 | | | | 63 | | | | 65 | |
FDIC assessment expense | | | 352 | | | | 486 | | | | 542 | |
Branch acquisition expense | | | 337 | | | | — | | | | — | |
Other expenses | | | 1,760 | | | | 1,721 | | | | 1,597 | |
| | | | | | | | | | | | |
Total noninterest expenses | | | 13,609 | | | | 12,546 | | | | 12,746 | |
| | | | | | | | | | | | |
Income before income taxes | | | 5,289 | | | | 5,064 | | | | 4,925 | |
FEDERAL INCOME TAX PROVISION | | | 1,602 | | | | 1,568 | | | | 1,534 | |
| | | | | | | | | | | | |
NET INCOME | | $ | 3,687 | | | $ | 3,496 | | | $ | 3,391 | |
| | | | | | | | | | | | |
NET INCOME PER SHARE | | | | | | | | | | | | |
Basic | | $ | 1.35 | | | $ | 1.28 | | | $ | 1.24 | |
| | | | | | | | | | | | |
Diluted | | $ | 1.35 | | | $ | 1.28 | | | $ | 1.24 | |
| | | | | | | | | | | | |
These consolidated financial statements should be read in connection with the accompanying summary of significant accounting policies and notes to consolidated financial statements.
2011Annual Report to Shareholders | CSB Bancorp, Inc. 25
Consolidated Statements of Shareholders’ Equity
Years Ended December 31, 2011, 2010 and 2009
| | | | | | | | | | | | | | | | | | | | | | | | |
(Dollars in thousands) | | COMMON STOCK | | | ADDITIONAL
PAID-IN CAPITAL | | | RETAINED
EARNINGS | | | TREASURY
STOCK | | | ACCUMULATED OTHER
COMPREHENSIVE
INCOME | | | TOTAL | |
BALANCE AT DECEMBER 31, 2008 | | $ | 18,629 | | | $ | 9,986 | | | $ | 19,724 | | | $ | (5,015 | ) | | $ | 144 | | | $ | 43,468 | |
Comprehensive income: | | | | | | | | | | | | | | | | | | | | | | | | |
Net income | | | — | | | | — | | | | 3,391 | | | | — | | | | — | | | | 3,391 | |
Change in net unrealized gain, net of reclassification adjustments and related income tax provision of $476 | | | — | | | | — | | | | — | | | | — | | | | 924 | | | | 924 | |
| | | | | | | | | | | | | | | | | | | | | | | | |
Total comprehensive income | | | | | | | | | | | | | | | | | | | | | | | 4,315 | |
| | | | | | | | | | | | | | | | | | | | | | | | |
Stock-based compensation expense | | | — | | | | 8 | | | | — | | | | — | | | | — | | | | 8 | |
Cash dividends declared, $0.72 per share | | | — | | | | — | | | | (1,969 | ) | | | — | | | | — | | | | (1,969 | ) |
| | | | | | | | | | | | | | | | | | | | | | | | |
BALANCE AT DECEMBER 31, 2009 | | $ | 18,629 | | | $ | 9,994 | | | $ | 21,146 | | | $ | (5,015 | ) | | $ | 1,068 | | | $ | 45,822 | |
Comprehensive income: | | | | | | | | | | | | | | | | | | | | | | | | |
Net income | | | — | | | | — | | | | 3,496 | | | | — | | | | — | | | | 3,496 | |
Change in net unrealized loss, net of reclassification adjustments and related income tax benefit of $100 | | | — | | | | — | | | | — | | | | — | | | | (195 | ) | | | (195 | ) |
| | | | | | | | | | | | | | | | | | | | | | | | |
Total comprehensive income | | | | | | | | | | | | | | | | | | | | | | | 3,301 | |
| | | | | | | | | | | | | | | | | | | | | | | | |
Cash dividends declared, $0.72 per share | | | — | | | | — | | | | (1,969 | ) | | | — | | | | — | | | | (1,969 | ) |
| | | | | | | | | | | | | | | | | | | | | | | | |
BALANCE AT DECEMBER 31, 2010 | | $ | 18,629 | | | $ | 9,994 | | | $ | 22,673 | | | $ | (5,015 | ) | | $ | 873 | | | $ | 47,154 | |
Comprehensive income: | | | | | | | | | | | | | | | | | | | | | | | | |
Net income | | | — | | | | — | | | | 3,687 | | | | — | | | | — | | | | 3,687 | |
Change in net unrealized gain, net of reclassification adjustments and related income tax provision of $287 | | | — | | | | — | | | | — | | | | — | | | | 557 | | | | 557 | |
| | | | | | | | | | | | | | | | | | | | | | | | |
Total comprehensive income | | | | | | | | | | | | | | | | | | | | | | | 4,244 | |
| | | | | | | | | | | | | | | | | | | | | | | | |
Cash dividends declared, $0.72 per share | | | — | | | | — | | | | (1,969 | ) | | | — | | | | — | | | | (1,969 | ) |
| | | | | | | | | | | | | | | | | | | | | | | | |
BALANCE AT DECEMBER 31, 2011 | | $ | 18,629 | | | $ | 9,994 | | | $ | 24,391 | | | $ | (5,015 | ) | | $ | 1,430 | | | $ | 49,429 | |
| | | | | | | | | | | | | | | | | | | | | | | | |
These consolidated financial statements should be read in connection with the accompanying summary of significant accounting policies and notes to consolidated financial statements.
26 2011Annual Report to Shareholders | CSB Bancorp, Inc.
Consolidated Statements of Cash Flows
Years Ended December 31, 2011, 2010 and 2009
| | | | | | | | | | | | |
(Dollars in thousands) | | 2011 | | | 2010 | | | 2009 | |
CASH FLOWS FROM OPERATING ACTIVITIES | | | | | | | | | | | | |
Net income | | $ | 3,687 | | | $ | 3,496 | | | $ | 3,391 | |
Adjustments to reconcile net income to net cash provided by operating activities: | | | | | | | | | | | | |
Depreciation and amortization of premises, equipment and software | | | 662 | | | | 645 | | | | 758 | |
Deferred income taxes | | | 345 | | | | 293 | | | | 403 | |
Provision for loan losses | | | 950 | | | | 1,235 | | | | 1,337 | |
Gain on sale of loans, net | | | (219 | ) | | | (242 | ) | | | (463 | ) |
Securities (gain) loss, net | | | (237 | ) | | | (148 | ) | | | (152 | ) |
Security amortization, net of accretion | | | 226 | | | | 121 | | | | 105 | |
Other-than-temporary impairment of investments | | | — | | | | — | | | | 70 | |
Secondary market loan sale proceeds | | | 7,201 | | | | 11,362 | | | | 21,005 | |
Originations of secondary market loans held-for-sale | | | (7,019 | ) | | | (10,831 | ) | | | (20,986 | ) |
Effects of changes in operating assets and liabilities: | | | | | | | | | | | | |
Net deferred loan costs | | | 35 | | | | 62 | | | | 78 | |
Accrued interest receivable | | | (134 | ) | | | 100 | | | | 70 | |
Accrued interest payable | | | (31 | ) | | | (109 | ) | | | (96 | ) |
Prepaid FDIC assessment | | | 345 | | | | 437 | | | | (1,483 | ) |
Other assets and liabilities | | | (37 | ) | | | (419 | ) | | | (611 | ) |
| | | | | | | | | | | | |
Net cash provided by operating activities | | $ | 5,774 | | | $ | 6,002 | | | $ | 3,426 | |
| | | | | | | | | | | | |
CASH FLOWS FROM INVESTING ACTIVITIES | | | | | | | | | | | | |
Securities available-for-sale: | | | | | | | | | | | | |
Proceeds from maturities and repayments | | $ | 45,332 | | | $ | 51,234 | | | $ | 33,769 | |
Proceeds from sale | | | 3,244 | | | | 3,359 | | | | 1,305 | |
Purchases | | | (95,542 | ) | | | (54,909 | ) | | | (32,197 | ) |
Purchase of restricted stock | | | — | | | | — | | | | (231 | ) |
Loan originations, net of repayments | | | (1,065 | ) | | | (3,827 | ) | | | 1,864 | |
Net cash from acquisition | | | 60,872 | | | | — | | | | — | |
Proceeds from sale of other real estate | | | 883 | | | | 476 | | | | 83 | |
Property, equipment and software acquisitions | | | (586 | ) | | | (103 | ) | | | (671 | ) |
| | | | | | | | | | | | |
Net cash provided by (used in) investing activities | | $ | 13,138 | | | $ | (3,770 | ) | | $ | 3,922 | |
| | | | | | | | | | | | |
These consolidated financial statements should be read in connection with the accompanying summary of significant accounting policies and notes to consolidated financial statements.
2011Annual Report to Shareholders | CSB Bancorp, Inc. 27
Consolidated Statements of Cash Flows
Years Ended December 31, 2011, 2010 and 2009
Consolidated Statements of Cash Flows | | | | | | | | | | | | |
(Dollars in thousands) | | 2011 | | | 2010 | | | 2009 | |
CASH FLOWS FROM FINANCING ACTIVITIES | | | | | | | | | | | | |
Net change in deposits | | $ | 15,648 | | | $ | 24,084 | | | $ | 24,246 | |
Net change in short-term borrowings | | | 5,055 | | | | 3,254 | | | | 5,872 | |
Federal Home Loan Bank borrowings: | | | | | | | | | | | | |
Proceeds | | | — | | | | — | | | | 4,000 | |
Repayments | | | (3,748 | ) | | | (21,902 | ) | | | (9,582 | ) |
Cash dividends paid | | | (1,969 | ) | | | (1,969 | ) | | | (1,969 | ) |
| | | | | | | | | | | | |
Net cash provided by financing activities | | $ | 14,986 | | | $ | 3,467 | | | $ | 22,567 | |
| | | | | | | | | | | | |
NET INCREASE IN CASH AND CASH EQUIVALENTS | | | 33,898 | | | | 5,699 | | | | 29,915 | |
CASH AND CASH EQUIVALENTS AT BEGINNING OF YEAR | | | 48,360 | | | | 42,661 | | | | 12,746 | |
| | | | | | | | | | | | |
CASH AND CASH EQUIVALENTS AT END OF YEAR | | $ | 82,258 | | | $ | 48,360 | | | $ | 42,661 | |
| | | | | | | | | | | | |
SUPPLEMENTAL DISCLOSURES | | | | | | | | | | | | |
Cash paid during the year for: | | | | | | | | | | | | |
Interest expense | | $ | 3,769 | | | $ | 5,206 | | | $ | 7,055 | |
Income taxes | | | 1,525 | | | | 1,310 | | | | 920 | |
Acquisition of noncash assets and liabilities: | | | | | | | | | | | | |
Assets acquired | | | 13,631 | | | | — | | | | — | |
Liabilities assumed | | | 74,503 | | | | — | | | | — | |
Noncash investing activities: | | | | | | | | | | | | |
Transfer of loans to other real estate owned | | | 814 | | | | 337 | | | | 195 | |
These consolidated financial statements should be read in connection with the accompanying summary of significant accounting policies and notes to consolidated financial statements.
28 2011Annual Report to Shareholders | CSB Bancorp, Inc.
Notes to Consolidated Financial StatementsSummary of Significant Accounting Policies
CSB Bancorp, Inc. (the “Company” or “CSB”) was incorporated in 1991 in the State of Ohio, and is a registered bank holding company. The Company’s wholly-owned subsidiaries are The Commercial and Savings Bank of Millersburg, Ohio (the “Bank”) and CSB Investment Services, LLC. The Company, through its subsidiaries, operates in one industry segment: the commercial banking industry.
The Bank, an Ohio-chartered bank organized in 1879, provides financial services through its sixteen Banking Centers located in Holmes, Tuscarawas, Wayne and Stark Counties in Ohio and nearby communities. These communities are the source of substantially all deposit, loan and trust activities. The majority of the Bank’s income is derived from commercial and retail lending activities and investments in securities. Its primary deposit products are checking, savings, and term certificate accounts, and its primary lending products are residential mortgage, commercial mortgage, commercial and installment loans. Substantially, all loans are secured by specific items of collateral including business assets, consumer assets and real estate. Commercial loans are expected to be repaid from cash flow from business operations. Real estate loans are secured by both residential and commercial real estate.
Significant accounting policies followed by the Company are presented below:
USE OF ESTIMATES IN PREPARING FINANCIAL STATEMENTS
In preparing consolidated financial statements in conformity with U.S. generally accepted accounting principles, management is required to make estimates and assumptions that affect the reported amounts of assets and liabilities as of the date of the Consolidated Balance Sheets and reported amounts of revenues and expenses during each reporting period. Actual results could differ from those estimates. The most significant estimates susceptible to change in the near term relate to management’s determination of the allowance for loan losses and the fair value of financial instruments.
PRINCIPLES OF CONSOLIDATION
The consolidated financial statements include the accounts of the Company and its wholly-owned subsidiaries. All significant intercompany balances and transactions have been eliminated in consolidation.
The Bank has established a trust department and the assets held by the Bank in fiduciary or agency capacities for its customers are not included in the Consolidated Balance Sheets as such items are not assets of the Bank.
CASH AND CASH EQUIVALENTS
For purposes of the Consolidated Statements of Cash Flows, cash and cash equivalents include cash on hand, amounts due from banks and federal funds sold that mature overnight or within three days.
CASH RESERVE REQUIREMENTS
The Bank is required by the Federal Reserve to maintain reserves consisting of cash on hand and noninterest-earning balances on deposit with the Federal Reserve Bank. The required reserve balance at December 31, 2011 and 2010 was $400,000.
SECURITIES
Securities designated as available-for-sale are carried at fair value with unrealized gains and losses on such securities, net of applicable income taxes, recognized as other comprehensive income (loss).
The amortized cost of debt securities is adjusted for amortization of premiums and accretion of discounts to maturity based on the interest method. Such amortization and accretion is included in interest and dividends on securities.
Gains and losses on sales of securities are accounted for on a trade date basis, using the specific identification method, and are included in noninterest income. Securities are periodically reviewed for other-than-temporary impairment based upon a number of factors, including, but not limited to, the length of time and extent to which the market value has been less than cost, the financial condition of the underlying issuer, the receipt of principal and interest according to the contractual terms, the ability of the issuer to meet contractual obligations, the likelihood of the security’s ability to recover any decline in its market value and management’s intent and ability to hold the security for a period of time sufficient to allow for a recovery in market value. Among the factors that are considered in determining management’s intent and ability to hold the security is a review of the Company’s capital adequacy, interest rate risk position and liquidity. The assessment of a security’s ability to recover any decline in market value, the ability of the issuer to meet contractual obligations and management’s intent and ability to hold the security requires considerable judgment. A decline in value that is considered to be other-than-temporary is recorded as a loss within noninterest income in the Consolidated Statements of Income.
Investments in Federal Home Loan Bank of Cincinnati (“FHLB”) and Federal Reserve Bank stock are classified as restricted stock, carried at cost, and evaluated for impairment.
The Bank is required to maintain an investment in common stock of the FHLB and Federal Reserve Bank because the Bank is a member of the FHLB and the Federal Reserve System. We consider these stocks to be nonmarketable equity securities and carry them at cost.
2011Annual Report to Shareholders | CSB Bancorp, Inc. 29
Summary of Significant Accounting Policies
While the Federal Home Loan Banks have been negatively impacted by the current economic conditions, the Federal Home Loan Bank of Cincinnati has reported profits for 2011 and 2010, remains in compliance with regulatory capital and liquidity requirements and continues to pay dividends on the stock and make redemptions at the par value. With consideration given to these factors, management concluded that the stock was not impaired at December 31, 2011 or 2010.
LOANS
Loans that management has the intent and ability to hold for the foreseeable future, or until maturity or payoff, generally are stated at their outstanding principal amount, adjusted for charge-offs, the allowance for loan losses and any deferred loan fees or costs on originated loans. Interest is accrued based upon the daily outstanding principal balance. Loan origination fees and certain direct origination costs are capitalized and recognized as an adjustment of the yield over the life of the related loan.
Interest income is not reported when full repayment is in doubt, typically when the loan is impaired or payments are past due over 90 days. All interest accrued but not collected for loans that are placed on nonaccrual or charged-off is reversed against interest income. The interest on these loans is accounted for on the cash-basis or cost-recovery method, until qualifying for return to accrual. Loans are returned to accrual status when all the principal and interest amounts contractually due are brought current and future payments are reasonably assured.
At origination, a determination is made whether a loan will be held in the Bank’s portfolio or is intended for sale in the secondary market. Mortgage loans held for sale are recorded at the lower of the aggregate cost or fair value. Generally these loans are held for sale for less than three days. The Bank includes gains and losses on sales of the loans held for sale when the sale is completed.
ALLOWANCE FOR LOAN LOSSES
The allowance for loan losses is established as losses are estimated to have occurred through a provision for loan losses charged to income. Loan losses are charged against the allowance when management believes the uncollectibility of a loan balance is confirmed. Subsequent recoveries, if any, are credited to the allowance.
The allowance for loan losses is evaluated on a regular basis by management and is based upon management’s periodic review of the collectibility of the loans in light of historical experience, the nature and volume of the loan portfolio, adverse situations that may affect the borrower’s ability to repay, estimated value of any underlying collateral and prevailing economic conditions. This evaluation is inherently subjective as it requires estimates that are susceptible to significant revision as more information becomes available.
A loan is considered impaired when, based on current information and events, it is probable that the Company will be unable to collect the scheduled payments of principal or interest when due according to the contractual terms of the loan agreement. Factors considered by management in determining impairment include payment status, collateral value and the probability of collecting scheduled principal and interest payments when due. Loans that experience insignificant payment delays and payment shortfalls generally are not classified as impaired. Management determines the significance of payment delays and payment shortfalls on a case-by-case basis, taking into consideration all of the circumstances surrounding the loan and the borrower, including the length of the delay, the reasons for the delay, the borrower’s prior payment record and the amount of the shortfall in relation to the principal and interest owed. Impairment is measured on a loan-by-loan basis for commercial, commercial real estate, and construction loans by either the present value of expected future cash flows discounted at the loan’s effective interest rate, the loan’s obtainable market price, or the fair value of the collateral if the loan is collateral dependent.
Large groups of smaller balance homogeneous loans are collectively evaluated for impairment. Accordingly, the Company does not separately identify individual consumer and residential loans for impairment disclosures.
OTHER REAL ESTATE OWNED
Other real estate acquired through or in lieu of foreclosure is initially recorded at fair value, less estimated costs to sell, and any loan balance in excess of fair value is charged to the allowance for loan losses. Subsequent valuations are periodically performed and write-downs are included in other operating expense, as are gains or losses upon sale and expenses related to maintenance of the properties. Other real estate owned amounted to $10,000 and $36,300 at December 31, 2011 and 2010, respectively.
PREMISES AND EQUIPMENT
Premises and equipment is stated at cost less accumulated depreciation and amortization. Upon the sale or disposition of the assets, the difference between the depreciated cost and proceeds is charged or credited to income. Depreciation and amortization is determined based on the estimated useful lives of the individual assets (typically 20 to 40 years for buildings and 3 to 10 years for equipment) and is computed using both accelerated and straight-line methods.
30 2011Annual Report to Shareholders | CSB Bancorp, Inc.
Summary of Significant Accounting Policies
GOODWILL AND CORE DEPOSIT INTANGIBLE ASSETS
Goodwill is not amortized, but is tested at least annually for impairment, in the fourth quarter or more frequently if indicators of impairment are present. The evaluation for impairment involves comparing the estimated current fair value of the reporting unit to its carrying value, including goodwill. If the estimated current fair value of a reporting unit exceeds its carrying value, no additional testing is required and an impairment loss is not recorded. CSB uses market capitalization and multiples of tangible book value methods to determine the estimated current fair value of its reporting unit. Based on this analysis no impairment was recorded in 2011 or 2010.
The core deposit intangible assets are assigned useful lives, which are amortized on an accelerated basis over their weighted average lives. The Company periodically reviews the intangible asset for impairment as events or changes in circumstances indicate that the carrying amount of such assets may not be recoverable.
MORTGAGE SERVICING RIGHTS
Mortgage servicing rights (“MSRs”) represent the right to service loans for third party investors. MSRs are recognized as a separate asset upon the sale of mortgage loans to a third party investor with the servicing rights retained by CSB. Originated MSRs are recorded at allocated fair value at the time of the sale of the loans to the third party investor. MSRs are amortized in proportion to and over the estimated period of net servicing income. MSRs are carried at amortized cost, less a valuation allowance for impairment, if any. MSRs are evaluated on a discounted earnings basis to determine the present value of future earnings of the underlying serviced mortgages. All assumptions are reviewed annually or more frequently, if necessary, and adjusted to reflect current and anticipated market conditions.
BANK-OWNED LIFE INSURANCE
The cash surrender value of these policies is included as an asset on the Consolidated Balance Sheets and any increases in the cash surrender value are recorded as noninterest income on the Consolidated Statements of Income. In the event of the death of an insured individual under these policies, the Company would receive a death benefit, which would be recorded as noninterest income.
REPURCHASE AGREEMENTS
Substantially all securities sold under repurchase agreements represent amounts advanced by various customers. Securities owned by the Bank are pledged to cover those obligations, which are not deposits and are not covered by federal deposit insurance.
ADVERTISING COSTS
All advertising costs are expensed as incurred. Advertising expenses amounted to $175 thousand, $169 thousand, and $180 thousand for the years ended 2011, 2010 and 2009, respectively.
FEDERAL INCOME TAXES
The Company and its subsidiaries file a consolidated tax return. Deferred income taxes are provided on temporary differences between financial statement and income tax reporting. Temporary differences are differences between the amounts of assets and liabilities reported for financial statement purposes and their tax bases. Deferred tax assets are recognized for temporary differences that will be deductible in future years’ tax returns and for operating loss and tax credit carryforwards. Deferred tax assets are reduced by a valuation allowance if it is deemed more likely than not that some or all of the deferred tax assets will not be realized. Deferred tax liabilities are recognized for temporary differences that will be taxable in future years’ tax returns.
The Bank, domiciled in Ohio, is not currently subject to state and local income taxes.
STOCK-BASED COMPENSATION
The Company sponsors a stock-based compensation plan, administered by a committee, under which incentive stock options may be granted periodically to certain employees. The Company recorded no stock-based compensation expense for 2011 and 2010, and $8 thousand for the year ended December 31, 2009. The total income tax benefit recognized in the accompanying Consolidated Statements of Income related to stock-based compensation was $2 thousand in 2009, with no tax benefit recognized in 2011 or 2010. Shares issued in connection with stock option exercises may be issued from available treasury shares or from market purchases.
The expense is computed using option pricing models, using the following weighted-average assumptions as of grant date.
| | | | | | | | | | | | |
| | | 2011 | | | 2010 | | | 2009 | |
Risk-free interest rate | | | N/A | | | | N/A | | | | 2.5 | % |
Dividend yield | | | | | | | | | | | 4.8 | % |
Volatility | | | | | | | | | | | 18.4 | % |
Expected option life | | | | | | | | | | | 5.0 yrs. | |
2011Annual Report to Shareholders | CSB Bancorp, Inc. 31
Summary of Significant Accounting Policies
As of December 31, 2011, there was no unrecognized compensation cost related to unvested share-based compensation awards granted. All shares are vested.
Options are granted to certain employees at prices equal to the market value of the stock on the grant date. The CSB Share Incentive Plan was adopted at the 2002 annual meeting of shareholders and authorized the issuance of 75,000 shares. The Plan was amended April 27, 2005 to authorize the issuance of 200,000 shares. The time period during which any option is exercisable under the Plan is determined by the committee but shall not continue beyond the expiration of ten years after the date the option is awarded.
The fair value of each option is amortized into compensation expense on a straight-line basis between the grant date for the option and each vesting date. CSB estimates the fair value of stock options on the date of the grant using the Black-Scholes option pricing model. The model requires the use of numerous assumptions, many of which are highly subjective in nature. There were no option grants for the years ended December 31, 2011 and 2010, and options to acquire 1,000 shares of CSB common stock were granted for the year ended December 31, 2009.
COMPREHENSIVE INCOME
The Company includes recognized revenue, expenses, gains and losses in net income. Although certain changes in assets and liabilities, such as unrealized gains and losses on available-for-sale securities, are reported as a separate component of the equity section of the Consolidated Balance Sheets. These items, along with net income, are components of comprehensive income.
TRANSFERS OF FINANCIAL ASSETS
Transfers of financial assets are accounted for as sales when control over the assets has been surrendered. Control over transferred assets is deemed to be surrendered when (1) the assets have been isolated from the Company, (2) the transferee obtains the right (free of conditions that constrain it from taking advantage of that right) to pledge or exchange the transferred assets, and (3) the Company does not maintain effective control over the transferred assets through an agreement to repurchase them before their maturity.
PER SHARE DATA
Basic net income per share is computed based on the weighted average number of shares of common stock outstanding during each year. Diluted income per common share includes the dilutive effect of additional potential common shares issuable under stock options.
The weighted average number of common shares outstanding for basic and diluted earnings per share computations was as follows:
| | | | | | | | | | | | |
| | | 2011 | | | 2010 | | | 2009 | |
Weighted average common shares | | | 2,980,602 | | | | 2,980,602 | | | | 2,980,602 | |
Average treasury shares | | | (245,803 | ) | | | (245,803 | ) | | | (245,803 | ) |
| | | | | | | | | | | | |
Total weighted average common shares outstanding (basic) | | | 2,734,799 | | | | 2,734,799 | | | | 2,734,799 | |
Dilutive effect of assumed exercise of stock options | | | 39 | | | | — | | | | — | |
| | | | | | | | | | | | |
Weighted average common shares outstanding (diluted) | | | 2,734,838 | | | | 2,734,799 | | | | 2,734,799 | |
| | | | | | | | | | | | |
Dividends per share are based on the number of shares outstanding at the declaration date.
There were 17,856 stock options to purchase common stock for $18.00 per share that were antidilutive at December 31, 2011. There were 39,945 stock options to purchase common stock for $15.00 to $18.00 per share that were antidilutive at December 31, 2010 and there were 40,195 stock options to purchase common stock for $15.00 to $18.00 per share that were antidilutive at December 31, 2009.
ACCOUNTING DEVELOPMENTS
In April 2011, the FASB issued ASU 2011-02,Receivables (Topic 310): A Creditor’s Determination of Whether a Restructuring Is a Troubled Debt Restructuring. The amendments in this Update provide additional guidance or clarification to help creditors in determining whether a creditor has granted a concession and whether a debtor is experiencing financial difficulties for purposes of determining whether a restructuring constitutes a troubled debt restructuring. The amendments in this Update are effective for the first interim or annual reporting period beginning on or after June 15, 2011, and should be applied retrospectively to the beginning annual period of adoption. As a result of applying these amendments, an entity may identify receivables that are newly considered impaired. For purposes of measuring impairment of those receivables, an entity should apply the amendments prospectively for the first interim or annual period beginning on or after June 15, 2011. The Company has provided the necessary disclosures in Note 2.
In April 2011, the FASB issued ASU 2011-03,Transfers and Services (Topic 860): Reconsideration of Effective Control for Repurchase Agreements. The main objective in developing this Update is to improve the accounting for repurchase agreements (repos) and other agreements that both entitle and obligate a transferor to repurchase or redeem financial assets before their maturity. The amendments
32 2011Annual Report to Shareholders | CSB Bancorp, Inc.
Summary of Significant Accounting Policies
in this Update remove from the assessment of effective control (1) the criterion requiring the transferor to have the ability to repurchase or redeem the financial assets on substantially the agreed terms, even in the event of default by the transferee, and (2) the collateral maintenance implementation guidance related to that criterion. The amendments in this Update apply to all entities, both public and nonpublic. The amendments affect all entities that enter into agreements to transfer financial assets that both entitle and obligate the transferor to repurchase or redeem the financial assets before their maturity. The guidance in this Update is effective for the first interim or annual period beginning on or after December 15, 2011 and should be applied prospectively to transactions or modifications of existing transactions that occur on or after the effective date. Early adoption is not permitted. This ASU is not expected to have a significant impact on the Company’s financial statements.
In May 2011, the FASB issued ASU 2011-04,Fair Value Measurement (Topic 820): Amendments to Achieve Common Fair Value Measurement and Disclosure Requirements in U.S. GAAP and IFRSs. The amendments in this Update result in common fair value measurement and disclosure requirements in U.S. GAAP and IFRSs. Consequently, the amendments change the wording used to describe many of the requirements in U.S. GAAP for measuring fair value and for disclosing information about fair value measurements. The amendments in this Update are to be applied prospectively. For public entities, the amendments are effective during interim and annual periods beginning after December 15, 2011. For nonpublic entities, the amendments are effective for annual periods beginning after December 15, 2011. Early application by public entities is not permitted. This ASU is not expected to have a significant impact on the Company’s financial statements.
In June 2011, the FASB issued ASU 2011-05,Comprehensive Income (Topic 220): Presentation of Comprehensive Income. The amendments in this Update improve the comparability, clarity, consistency, and transparency of financial reporting and increase the prominence of items reported in other comprehensive income. To increase the prominence of items reported in other comprehensive income and to facilitate convergence of U.S. GAAP and IFRS, the option to present components of other comprehensive income as part of the statement of changes in stockholders’ equity was eliminated. The amendments require that all nonowner changes in stockholders’ equity be presented either in a single continuous statement of comprehensive income or in two separate but consecutive statements. In the two-statement approach, the first statement should present total net income and its components followed consecutively by a second statement that should present total other comprehensive income, the components of other comprehensive income, and the total of comprehensive income. All entities that report items of comprehensive income, in any period presented, will be affected by the changes in this Update. For public entities, the amendments are effective for fiscal years, and interim periods within those years, beginning after December 15, 2011. For nonpublic entities, the amendments are effective for fiscal years ending after December 15, 2012, and interim and annual periods thereafter. The amendments in this Update should be applied retrospectively, and early adoption is permitted. This ASU is not expected to have a significant impact on the Company’s financial statements.
In September 2011, the FASB issued ASU 2011-08, Intangibles – Goodwill and Other Topics (Topic 350), Testing Goodwill for Impairment. The objective of this update is to simplify how entities, both public and nonpublic, test goodwill for impairment. The amendments in the Update permit an entity to first assess qualitative factors to determine whether it is more likely than not that the fair value of a reporting unit is less than its carrying amount as a basis for determining whether it is necessary to perform the two-step goodwill impairment test described in Topic 350. The more-likely-than-not threshold is defined as having a likelihood of more than 50 percent. Under the amendments in this Update, an entity is not required to calculate the fair value of a reporting unit unless the entity determines that it is more likely than not that its fair value is less than its carrying amount. The amendments in this Update apply to all entities, both public and nonpublic, that have goodwill reported in their financial statements and are effective for interim and annual goodwill impairment tests performed for fiscal years beginning after December 15, 2011. Early adoption is permitted, including for annual and interim goodwill impairment tests performed as of a date before September 15, 2011, if an entity’s financial statements for the most recent annual or interim period have not yet been issued or, for nonpublic entities, have not yet been made available for issuance. This ASU is not expected to have a significant impact on the Company’s financial statements.
In December 2011, the FASB issued ASU 2011-12,Comprehensive Income (Topic 220): Deferral of the Effective Date for Amendments to the Presentation of Reclassifications of Items Out of Accumulated Other Comprehensive Income in Accounting Standards Update No. 2011-05. In order to defer only those changes in Update 2011-05 that relate to the presentation of reclassification adjustments, the paragraphs in this Update supersede certain pending paragraphs in Update 2011-05. Entities should continue to report reclassifications out of accumulated other comprehensive income consistent with the presentation requirements in effect before Update 2011-05. All other requirements in Update 2011-05 are not affected by this Update, including the requirement to report comprehensive income either in a single continuous financial statement or in two separate but consecutive financial statements. Public entities should apply these requirements for fiscal years, and interim periods within those years, beginning after December 15, 2011. Nonpublic entities should begin applying these requirements for fiscal years ending after December 15, 2012, and interim and annual periods thereafter. This ASU is not expected to have a significant impact on the Company’s financial statements.
RECLASSIFICATION OF COMPARATIVE AMOUNTS
Certain comparative amounts from the prior years have been reclassified to conform to current year classifications. Such classifications had no effect on net income or shareholders’ equity.
2011Annual Report to Shareholders | CSB Bancorp, Inc. 33
Notes to Consolidated Financial Statements
NOTE 1 – SECURITIES
Securities consist of the following at December 31, 2011 and 2010:
| | | | | | | | | | | | | | | | |
(Dollars in thousands) | | AMORTIZED
COST | | | GROSS
UNREALIZED
GAINS | | | GROSS
UNREALIZED
LOSSES | | | FAIR
VALUE | |
December 31, 2011 | | | | | | | | | | | | | | | | |
Available-for-sale: | | | | | | | | | | | | | | | | |
U.S. Treasury security | | $ | 100 | | | $ | — | | | $ | — | | | $ | 100 | |
Obligations of U.S. government corporations and agencies | | | 28,263 | | | | 83 | | | | 23 | | | | 28,323 | |
Mortgage-backed securities in government sponsored entities | | | 74,834 | | | | 1,562 | | | | 64 | | | | 76,332 | |
Obligations of states and political subdivisions | | | 14,148 | | | | 732 | | | | — | | | | 14,880 | |
Corporate bonds | | | 3,445 | | | | 6 | | | | 121 | | | | 3,330 | |
| | | | | | | | | | | | | | | | |
Total debt securities | | | 120,790 | | | | 2,383 | | | | 208 | | | | 122,965 | |
Equity securities in financial institutions | | | 69 | | | | 3 | | | | 11 | | | | 61 | |
| | | | | | | | | | | | | | | | |
Total available-for-sale | | | 120,859 | | | | 2,386 | | | | 219 | | | | 123,026 | |
Restricted stock | | | 5,463 | | | | — | | | | — | | | | 5,463 | |
| | | | | | | | | | | | | | | | |
Total securities | | $ | 126,322 | | | $ | 2,386 | | | $ | 219 | | | $ | 128,489 | |
| | | | | | | | | | | | | | | | |
December 31, 2010 | | | | | | | | | | | | | | | | |
Available-for-sale: | | | | | | | | | | | | | | | | |
U.S. Treasury security | | $ | 100 | | | $ | — | | | $ | — | | | $ | 100 | |
Obligations of U.S. government corporations and agencies | | | 20,009 | | | | 8 | | | | 306 | | | | 19,711 | |
Mortgage-backed securities in government sponsored entities | | | 41,005 | | | | 1,374 | | | | 28 | | | | 42,351 | |
Obligations of states and political subdivisions | | | 11,699 | | | | 341 | | | | 46 | | | | 11,994 | |
Corporate bonds | | | 1,000 | | | | — | | | | 8 | | | | 992 | |
| | | | | | | | | | | | | | | | |
Total debt securities | | | 73,813 | | | | 1,723 | | | | 388 | | | | 75,148 | |
Equity securities in financial institutions | | | 69 | | | | 3 | | | | 16 | | | | 56 | |
| | | | | | | | | | | | | | | | |
Total available-for-sale | | | 73,882 | | | | 1,726 | | | | 404 | | | | 75,204 | |
Restricted stock | | | 5,463 | | | | — | | | | — | | | | 5,463 | |
| | | | | | | | | | | | | | | | |
Total securities | | $ | 79,345 | | | $ | 1,726 | | | $ | 404 | | | $ | 80,667 | |
| | | | | | | | | | | | | | | | |
34 2011Annual Report to Shareholders | CSB Bancorp, Inc.
Notes to Consolidated Financial Statements
NOTE 1 – SECURITIES (CONTINUED)
The amortized cost and fair value of securities at December 31, 2011, by contractual maturity, are shown below. Actual maturities may differ from contractual maturities because borrowers may have the right to call or prepay obligations with or without call or prepayment penalties.
| | | | | | | | |
(Dollars in thousands) | | AMORTIZED
COST | | | FAIR
VALUE | |
Available-for-sale: | | | | | | | | |
Due in one year or less | | $ | 657 | | | $ | 657 | |
Due after one through five years | | | 10,977 | | | | 11,257 | |
Due after five through ten years | | | 20,493 | | | | 21,005 | |
Due after ten years | | | 88,663 | | | | 90,046 | |
| | | | | | | | |
Total debt securities available-for-sale | | $ | 120,790 | | | $ | 122,965 | |
| | | | | | | | |
Securities with a carrying value of approximately $70.4 million and $63.3 million were pledged at December 31, 2011 and 2010, respectively, to secure public deposits, as well as other deposits and borrowings as required or permitted by law.
Restricted stock primarily consists of investments in FHLB and Federal Reserve Bank stock. The Bank’s investment in FHLB stock amounted to $5.0 million at December 31, 2011 and 2010. Federal Reserve Bank stock was $471 thousand at December 31, 2011 and 2010.
The following table shows the proceeds from sales of available-for-sale securities and the gross realized gains and losses on the sales of those securities that have been included in earnings as a result of the sales. Gains or losses on the sales of available-for-sale securities are recognized upon sale and are determined by the specific identification method.
| | | | | | | | | | | | |
| | | FOR THE YEARS ENDED DECEMBER 31 | |
(Dollars in thousands) | | 2011 | | | 2010 | | | 2009 | |
Proceeds | | $ | 3,244 | | | $ | 3,359 | | | $ | 1,305 | |
Realized gains | | $ | 237 | | | $ | 148 | | | $ | 153 | |
Realized losses | | | — | | | | — | | | | 1 | |
Impairment losses | | | — | | | | — | | | | 70 | |
| | | | | | | | | | | | |
Net securities gains | | $ | 237 | | | $ | 148 | | | $ | 82 | |
| | | | | | | | | | | | |
The income tax provision applicable to realized gains amounted to $81 thousand in 2011, $50 thousand in 2010 and $52 thousand in 2009. The income tax benefit applicable to realized losses and impairment losses amounted to $24 thousand in 2009. There were no tax benefits recognized from gross realized losses in 2011 and 2010.
2011Annual Report to Shareholders | CSB Bancorp, Inc. 35
Notes to Consolidated Financial Statements
NOTE 1 – SECURITIES (CONTINUED)
The following table presents gross unrealized losses and fair value of securities, aggregated by investment category and length of time that individual securities have been in a continuous unrealized loss position, at December 31, 2011 and 2010:
| | | | | | | | | | | | | | | | | | | | | | | | |
| | | SECURITIES IN A CONTINUOUS UNREALIZED LOSS POSITION | |
| | | LESS THAN
12 MONTHS | | | 12 MONTHS
OR MORE | | | TOTAL | |
(Dollars in thousands) | | GROSS
UNREALIZED
LOSSES | | | FAIR
VALUE | | | GROSS
UNREALIZED
LOSSES | | | FAIR
VALUE | | | GROSS
UNREALIZED
LOSSES | | | FAIR
VALUE | |
2011 | | | | | | | | | | | | | | | | | | | | | | | | |
Obligations of U.S. corporations and agencies | | $ | 23 | | | $ | 6,974 | | | $ | — | | | $ | — | | | $ | 23 | | | $ | 6,974 | |
Mortgage-backed securities in government sponsored entities | | | 63 | | | | 16,794 | | | | 1 | | | | 192 | | | | 64 | | | | 16,986 | |
Corporate bonds | | | 49 | | | | 2,397 | | | | 72 | | | | 428 | | | | 121 | | | | 2,825 | |
| | | | | | | | | | | | | | | | | | | | | | | | |
Total debt securities | | | 135 | | | | 26,165 | | | | 73 | | | | 620 | | | | 208 | | | | 26,785 | |
Equity securities in financial institutions | | | — | | | | — | | | | 11 | | | | 43 | | | | 11 | | | | 43 | |
| | | | | | | | | | | | | | | | | | | | | | | | |
Total temporarily impaired securities | | $ | 135 | | | $ | 26,165 | | | $ | 84 | | | $ | 663 | | | $ | 219 | | | $ | 26,828 | |
| | | | | | | | | | | | | | | | | | | | | | | | |
2010 | | | | | | | | | | | | | | | | | | | | | | | | |
Obligations of U.S. corporations and agencies | | $ | 306 | | | $ | 12,686 | | | $ | — | | | $ | — | | | $ | 306 | | | $ | 12,686 | |
Mortgage-backed securities in government sponsored entities | | | 14 | | | | 4,032 | | | | 14 | | | | 493 | | | | 28 | | | | 4,525 | |
Obligations of state and political subdivisions | | | 46 | | | | 2,561 | | | | — | | | | — | | | | 46 | | | | 2,561 | |
Corporate bonds | | | 8 | | | | 492 | | | | — | | | | — | | | | 8 | | | | 492 | |
| | | | | | | | | | | | | | | | | | | | | | | | |
Total debt securities | | | 374 | | | | 19,771 | | | | 14 | | | | 493 | | | | 388 | | | | 20,264 | |
Equity securities in financial institutions | | | — | | | | — | | | | 16 | | | | 38 | | | | 16 | | | | 38 | |
| | | | | | | | | | | | | | | | | | | | | | | | |
Total temporarily impaired securities | | $ | 374 | | | $ | 19,771 | | | $ | 30 | | | $ | 531 | | | $ | 404 | | | $ | 20,302 | |
| | | | | | | | | | | | | | | | | | | | | | | | |
There were seventeen (17) securities in an unrealized loss position at December 31, 2011, two (2) of which were in a continuous loss position for twelve months or more. At least quarterly, the Company conducts a comprehensive security-level impairment assessment. The assessments are based on the nature of the securities, the extent and duration of the securities, the extent and duration of the loss, management’s intent to sell or if it is more likely than not that management will be required to sell a security before recovery of its amortized cost basis, which may be maturity. Management believes the Company will fully recover the cost of these securities and it does not intend to sell these securities and likely will not be required to sell them before the anticipated recovery of the remaining amortized cost basis, which may be maturity. As a result, management concluded that these securities were not other-than-temporarily impaired at December 31, 2011 and has recognized the total amount of the impairment in accumulated other comprehensive income, net of tax.
36 2011Annual Report to Shareholders | CSB Bancorp, Inc.
Notes to Consolidated Financial Statements
NOTE 2 – LOANS
Loans consist of the following at December 31:
| | | | | | | | |
(Dollars in thousands) | | 2011 | | | 2010 | |
Commercial | | $ | 89,828 | | | $ | 78,540 | |
Commercial real estate | | | 106,332 | | | | 104,829 | |
Residential real estate | | | 103,518 | | | | 108,832 | |
Construction and land development | | | 18,061 | | | | 16,515 | |
Consumer | | | 6,216 | | | | 6,715 | |
| | | | | | | | |
Total loans before deferred costs | | | 323,955 | | | | 315,431 | |
Deferred loan costs | | | 227 | | | | 216 | |
| | | | | | | | |
Total Loans | | $ | 324,182 | | | $ | 315,647 | |
| | | | | | | | |
Loan Origination/Risk Management
The Company has certain lending policies and procedures in place that are designed to maximize loan income within an acceptable level of risk. Management reviews and approves these policies and procedures on a regular basis. A reporting system supplements the review process by providing management with frequent reports related to loan production, loan quality, concentrations of credit, loan delinquencies and nonperforming and potential problem loans. Diversification in the loan portfolio is a means of managing risk associated with fluctuations in economic conditions.
Commercial loans are underwritten after evaluating and understanding the borrower’s ability to operate profitably and prudently expand its business. Underwriting standards are designed to promote relationship banking rather than transactional banking. The Company’s management examines current and occasionally projected cash flows to determine the ability of the borrower to repay their obligations as agreed. Commercial loans are primarily made based on the identified cash flows of the borrower and secondarily on the underlying collateral provided by the borrower. The cash flows of borrowers, however, may not be as expected and the collateral securing these loans may fluctuate in value. Most commercial loans are secured by the assets being financed or other business assets such as accounts receivable or inventory and may incorporate a personal guarantee; however, some short-term loans may be made on an unsecured basis. In the case of loans secured by accounts receivable, the availability of funds for the repayment of these loans may be substantially dependent on the ability of the borrower to collect amounts due from its customers.
Commercial real estate loans are subject to underwriting standards and processes similar to commercial loans, in addition to those of real estate loans. These loans are viewed primarily as cash flow loans and secondarily as loans secured by real estate. Commercial real estate lending typically involves higher loan principal amounts and the repayment of these loans is generally largely dependent on the successful operation of the property securing the loan or the business conducted on the property securing the loan. Commercial real estate loans may be more adversely affected by conditions in the real estate markets or in the general economy. The properties securing the Company’s commercial real estate portfolio are diverse in terms of type. This diversity helps reduce the Company’s exposure to adverse economic events that affect any single industry. Management monitors and evaluates commercial real estate loans based on collateral, geography and risk grade criteria. In addition, management tracks the level of owner-occupied commercial real estate loans versus nonowner occupied loans. At December 31, 2011 and 2010, approximately 89% and 87%, respectively, of the outstanding principal balance of the Company’s commercial real estate loans were secured by owner-occupied properties.
With respect to loans to developers and builders that are secured by nonowner occupied properties, the Company generally requires the borrower to have had an existing relationship with the Company and have a proven record of success. Construction and land development loans are underwritten using independent appraisal reviews, sensitivity analysis of absorption and lease rates and financial analysis of the developers and property owners. Construction and land development loans are generally based upon estimates of costs and value associated with the completed project. These estimates may be inaccurate. Construction and land development loans often involve the disbursement of substantial funds with repayment substantially dependent on the success of the ultimate project. Sources or repayment for these types of loans may be precommitted permanent loans from approved long-term lenders, sales of developed property or an interim loan commitment from the Company until permanent financing is obtained. These loans are closely monitored by on-site inspections and are considered to have higher risks than other real estate loans due to their ultimate repayment being sensitive to interest rate changes, governmental regulation of real property, general economic conditions and the availability of long-term financing.
2011Annual Report to Shareholders | CSB Bancorp, Inc. 37
Notes to Consolidated Financial Statements
NOTE 2 – LOANS (CONTINUED)
The Company originates consumer loans using a judgmental underwriting process. To monitor and manage consumer loan risk, policies and procedures are developed and modified, as needed, jointly by line and staff personnel. This activity, coupled with relatively small loan amounts that are spread across many individual borrowers, minimizes risk.
The Company maintains an independent loan review department that reviews and validates the credit risk program on a periodic basis. Results of these reviews are presented to management. The loan review process complements and reinforces the risk identification and assessment decisions made by lenders and credit personnel, as well as the Company’s policies and procedures.
Concentrations of Credit
Nearly all of the Company’s lending activity occurs within the State of Ohio, including the four counties of Holmes, Stark, Tuscarawas and Wayne, as well as other markets. The majority of the Company’s loan portfolio consists of commercial and industrial and commercial real estate loans. As of December 31, 2011 and 2010, there were no concentrations of loans related to any single industry.
Allowance for Loan Loss
The following table represents a summary of the activity in the allowance for loan losses for the years ended December 31:
| | | | | | | | | | | | |
(Dollars in thousands) | | 2011 | | | 2010 | | | 2009 | |
Beginning balance | | $ | 4,031 | | | $ | 4,060 | | | $ | 3,394 | |
Provision for loan losses | | | 950 | | | | 1,235 | | | | 1,337 | |
Loans charged-off | | | (1,014 | ) | | | (1,389 | ) | | | (885 | ) |
Recoveries | | | 115 | | | | 125 | | | | 214 | |
| | | | | | | | | | | | |
Ending balance | | $ | 4,082 | | | $ | 4,031 | | | $ | 4,060 | |
| | | | | | | | | | | | |
The following table details activity in the allowance for loan losses by portfolio segment for the years ended December 31, 2011 and 2010. Allocation of a portion of the allowance to one category of loans does not preclude its availability to absorb losses in other categories.
| | | | | | | | | | | | | | | | | | | | | | | | | | | | |
(Dollars in thousands) | | COMMERCIAL | | | COMMERCIAL
REAL ESTATE | | | RESIDENTIAL
REAL ESTATE | | | CONSUMER | | | CONSTRUCTION
AND LAND
DEVELOPMENT | | | UNALLOCATED | | | TOTAL | |
December 31, 2011: | | | | | | | | | | | | | | | | | | | | | | | | | | | | |
Beginning balance, January 1 | | $ | 1,179 | | | $ | 1,183 | | | $ | 1,057 | | | $ | 80 | | | $ | 213 | | | $ | 319 | | | $ | 4,031 | |
Provision for loan losses | | | 294 | | | | 558 | | | | 115 | | | | 61 | | | | 8 | | | | (86 | ) | | | 950 | |
Charge-offs | | | (487 | ) | | | (68 | ) | | | (297 | ) | | | (121 | ) | | | (41 | ) | | | — | | | | (1,014 | ) |
Recoveries | | | 38 | | | | — | | | | 19 | | | | 58 | | | | — | | | | — | | | | 115 | |
| | | | | | | | | | | | | | | | | | | | | | | | | | | | |
Net charge-offs | | | (449 | ) | | | (68 | ) | | | (278 | ) | | | (63 | ) | | | (41 | ) | | | — | | | | (899 | ) |
| | | | | | | | | | | | | | | | | | | | | | | | | | | | |
Ending balance | | $ | 1,024 | | | $ | 1,673 | | | $ | 894 | | | $ | 78 | | | $ | 180 | | | $ | 233 | | | $ | 4,082 | |
| | | | | | | | | | | | | | | | | | | | | | | | | | | | |
December 31, 2010: | | | | | | | | | | | | | | | | | | | | | | | | | | | | |
Beginning balance, January 1 | | $ | 1,031 | | | $ | 1,338 | | | $ | 1,140 | | | $ | 77 | | | $ | 246 | | | $ | 228 | | | $ | 4,060 | |
Provision for loan losses | | | 534 | | | | 32 | | | | 405 | | | | 63 | | | | 110 | | | | 91 | | | | 1,235 | |
Charge-offs | | | (479 | ) | | | (187 | ) | | | (488 | ) | | | (92 | ) | | | (143 | ) | | | — | | | | (1,389 | ) |
Recoveries | | | 93 | | | | — | | | | — | | | | 32 | | | | — | | | | — | | | | 125 | |
| | | | | | | | | | | | | | | | | | | | | | | | | | | | |
Net charge-offs | | | (386 | ) | | | (187 | ) | | | (488 | ) | | | (60 | ) | | | (143 | ) | | | — | | | | (1,264 | ) |
| | | | | | | | | | | | | | | | | | | | | | | | | | | | |
Ending balance | | $ | 1,179 | | | $ | 1,183 | | | $ | 1,057 | | | $ | 80 | | | $ | 213 | | | $ | 319 | | | $ | 4,031 | |
| | | | | | | | | | | | | | | | | | | | | | | | | | | | |
38 2011Annual Report to Shareholders | CSB Bancorp, Inc.
Notes to Consolidated Financial Statements
NOTE 2 – LOANS (CONTINUED)
The following table presents the balance in the allowance for loan losses and the ending loan balances by portfolio segment and based on impairment method as of December 31:
| | | | | | | | | | | | | | | | | | | | | | | | | | | | |
(Dollars in thousands) | | COMMERCIAL | | | COMMERCIAL
REAL ESTATE | | | RESIDENTIAL
REAL ESTATE | | | CONSTRUCTION
AND LAND
DEVELOPMENT | | | CONSUMER | | | UNALLOCATED | | | TOTAL | |
2011 | | | | | | | | | | | | | | | | | | | | | | | | | | | | |
Allowance for loan losses: | | | | | | | | | | | | | | | | | | | | | | | | | | | | |
Ending allowance balances attributable to loans: | | | | | | | | | | | | | | | | | | | | | | | | | | | | |
Individually evaluated for impairment | | $ | 165 | | | $ | 304 | | | $ | 53 | | | $ | — | | | $ | — | | | $ | — | | | $ | 522 | |
Collectively evaluated for impairment | | | 859 | | | | 1,369 | | | | 841 | | | | 180 | | | | 78 | | | | 233 | | | | 3,560 | |
| | | | | | | | | | | | | | | | | | | | | | | | | | | | |
Total ending allowance balance | | $ | 1,024 | | | $ | 1,673 | | | $ | 894 | | | $ | 180 | | | $ | 78 | | | $ | 233 | | | $ | 4,082 | |
| | | | | | | | | | | | | | | | | | | | | | | | | | | | |
Loans: | | | | | | | | | | | | | | | | | | | | | | | | | | | | |
Loans individually evaluated for impairment | | $ | 4,605 | | | $ | 2,476 | | | $ | 182 | | | $ | — | | | $ | — | | | | | | | $ | 7,263 | |
Loans collectively evaluated for impairment | | | 85,223 | | | | 103,856 | | | | 103,336 | | | | 18,061 | | | | 6,261 | | | | | | | | 316,692 | |
| | | | | | | | | | | | | | | | | | | | | | | | | | | | |
Total ending loans balance | | $ | 89,828 | | | $ | 106,332 | | | $ | 103,518 | | | $ | 18,061 | | | $ | 6,261 | | | | | | | $ | 323,955 | |
| | | | | | | | | | | | | | | | | | | | | | | | | | | | |
2010 | | | | | | | | | | | | | | | | | | | | | | | | | | | | |
Allowance for loan losses: | | | | | | | | | | | | | | | | | | | | | | | | | | | | |
Ending allowance balances attributable to loans: | | | | | | | | | | | | | | | | | | | | | | | | | | | | |
Individually evaluated for impairment | | $ | 106 | | | $ | 132 | | | $ | — | | | $ | — | | | $ | — | | | $ | — | | | $ | 238 | |
Collectively evaluated for impairment | | | 1,073 | | | | 1,051 | | | | 1,057 | | | | 121 | | | | 80 | | | | 319 | | | | 3,701 | |
Acquired with deteriorated credit quality | | | — | | | | — | | | | — | | | | 92 | | | | — | | | | — | | | | 92 | |
| | | | | | | | | | | | | | | | | | | | | | | | | | | | |
Total ending allowance balance | | $ | 1,179 | | | $ | 1,183 | | | $ | 1,057 | | | $ | 213 | | | $ | 80 | | | $ | 319 | | | $ | 4,031 | |
| | | | | | | | | | | | | | | | | | | | | | | | | | | | |
Loans: | | | | | | | | | | | | | | | | | | | | | | | | | | | | |
Loans individually evaluated for impairment | | $ | 622 | | | $ | 886 | | | $ | 298 | | | $ | — | | | $ | — | | | | | | | $ | 1,806 | |
Loans collectively evaluated for impairment | | | 77,919 | | | | 103,943 | | | | 108,533 | | | | 16,075 | | | | 6,715 | | | | | | | | 313,185 | |
Loans acquired with deteriorated credit quality | | | — | | | | — | | | | — | | | | 440 | | | | — | | | | | | | | 440 | |
| | | | | | | | | | | | | | | | | | | | | | | | | | | | |
Total ending loans balance | | $ | 78,541 | | | $ | 104,829 | | | $ | 108,831 | | | $ | 16,515 | | | $ | 6,715 | | | | | | | $ | 315,431 | |
| | | | | | | | | | | | | | | | | | | | | | | | | | | | |
2011Annual Report to Shareholders | CSB Bancorp, Inc. 39
Notes to Consolidated Financial Statements
NOTE 2 – LOANS (CONTINUED)
The following table presents loans individually evaluated for impairment by class of loans as of December 31:
| | | | | | | | | | | | | | | | | | | | | | | | |
(Dollars in thousands) | | UNPAID
PRINCIPAL
BALANCE | | | RECORDED
INVESTMENT WITH
NO ALLOWANCE | | | RECORDED
INVESTMENT
WITH ALLOWANCE | | | TOTAL
RECORDED
INVESTMENT | | | RELATED
ALLOWANCE | | | AVERAGE
RECORDED
INVESTMENT | |
2011 | | | | | | | | | | | | | | | | | | | | | | | | |
Commercial | | $ | 4,605 | | | $ | — | | | $ | 4,605 | | | $ | 4,605 | | | $ | 165 | | | $ | 2,890 | |
Commercial real estate | | | 2,621 | | | | — | | | | 2,476 | | | | 2,476 | | | | 304 | | | | 2,924 | |
Residential real estate | | | 182 | | | | — | | | | 182 | | | | 182 | | | | 53 | | | | 103 | |
| | | | | | | | | | | | | | | | | | | | | | | | |
Total impaired loans | | $ | 7,408 | | | $ | — | | | $ | 7,263 | | | $ | 7,263 | | | $ | 522 | | | $ | 5,917 | |
| | | | | | | | | | | | | | | | | | | | | | | | |
2010 | | | | | | | | | | | | | | | | | | | | | | | | |
Commercial | | $ | 644 | | | $ | 51 | | | $ | 571 | | | $ | 622 | | | $ | 106 | | | $ | 571 | |
Commercial real estate | | | 1,047 | | | | 109 | | | | 777 | | | | 886 | | | | 132 | | | | 1,631 | |
Residential real estate | | | 590 | | | | 298 | | | | — | | | | 298 | | | | — | | | | 97 | |
Construction & land development | | | 683 | | | | — | | | | 440 | | | | 440 | | | | 92 | | | | 483 | |
| | | | | | | | | | | | | | | | | | | | | | | | |
Total impaired loans | | $ | 2,964 | | | $ | 458 | | | $ | 1,788 | | | $ | 2,246 | | | $ | 330 | | | $ | 2,782 | |
| | | | | | | | | | | | | | | | | | | | | | | | |
The following table presents the aging of past due and nonaccrual loans by class of loans as of December 31:
| | | | | | | | | | | | | | | | | | | | | | | | | | | | |
(Dollars in thousands) | | CURRENT | | | 30-59 DAYS
PAST DUE | | | 60-89 DAYS
PAST DUE | | | 90 DAYS +
PAST DUE | | | NONACCRUAL | | | TOTAL PAST
DUE AND
NONACCRUAL | | | TOTAL
LOANS | |
2011 | | | | | | | | | | | | | | | | | | | | | | | | | | | | |
Commercial | | $ | 89,365 | | | $ | 272 | | | $ | 28 | | | $ | 150 | | | $ | 13 | | | $ | 463 | | | $ | 89,828 | |
Commercial real estate | | | 103,828 | | | | 587 | | | | 250 | | | | 141 | | | | 1,526 | | | | 2,504 | | | | 106,332 | |
Residential real estate | | | 100,297 | | | | 1,443 | | | | 303 | | | | 282 | | | | 1,193 | | | | 3,221 | | | | 103,518 | |
Consumer | | | 5,985 | | | | 194 | | | | 29 | | | | 8 | | | | — | | | | 231 | | | | 6,216 | |
Construction & land development | | | 17,885 | | | | — | | | | — | | | | — | | | | 176 | | | | 176 | | | | 18,061 | |
| | | | | | | | | | | | | | | | | | | | | | | | | | | | |
Total loans | | $ | 317,360 | | | $ | 2,496 | | | $ | 610 | | | $ | 581 | | | $ | 2,908 | | | $ | 6,595 | | | $ | 323,955 | |
| | | | | | | | | | | | | | | | | | | | | | | | | | | | |
2010 | | | | | | | | | | | | | | | | | | | | | | | | | | | | |
Commercial | | $ | 78,235 | | | $ | 63 | | | $ | 160 | | | $ | 58 | | | $ | 24 | | | $ | 305 | | | $ | 78,540 | |
Commercial real estate | | | 100,914 | | | | 2,156 | | | | 114 | | | | 26 | | | | 1,619 | | | | 3,915 | | | | 104,829 | |
Residential real estate | | | 105,593 | | | | 574 | | | | 253 | | | | 601 | | | | 1,811 | | | | 3,239 | | | | 108,832 | |
Consumer | | | 6,580 | | | | 69 | | | | 66 | | | | — | | | | — | | | | 135 | | | | 6,715 | |
Construction & land development | | | 16,061 | | | | 3 | | | | — | | | | — | | | | 451 | | | | 454 | | | | 16,515 | |
| | | | | | | | | | | | | | | | | | | | | | | | | | | | |
Total loans | | $ | 307,383 | | | $ | 2,865 | | | $ | 593 | | | $ | 685 | | | $ | 3,905 | | | $ | 8,048 | | | $ | 315,431 | |
| | | | | | | | | | | | | | | | | | | | | | | | | | | | |
Troubled Debt Restructurings
The Company had troubled debt restructurings of $8.5 million as of December 31, 2011, with $516 thousand of specific reserves allocated to customers whose loan terms have been modified in troubled debt restructurings. As of December 31, 2010, the Company had troubled debt restructurings of $4.1 million, with $22 thousand of specific reserves allocated.
Loan modifications that are considered troubled debt restructurings completed during the year ended December 31, 2011 were as follows:
| | | | | | | | | | | | |
(Dollars in thousands) | | NUMBER OF LOANS
RESTRUCTURED | | | PREMODIFICATION
RECORDED INVESTMENT | | | POSTMODIFICATION
RECORDED INVESTMENT | |
Commercial | | | 2 | | | $ | 4,440 | | | $ | 4,440 | |
Commercial real estate | | | 2 | | | | 372 | | | | 372 | |
Residential real estate | | | 5 | | | | 286 | | | | 286 | |
| | | | | | | | | | | | |
Total restructured loans | | | 9 | | | $ | 5,098 | | | $ | 5,098 | |
| | | | | | | | | | | | |
40 2011Annual Report to Shareholders | CSB Bancorp, Inc.
Notes to Consolidated Financial Statements
Credit Quality Indicators
The Company categorizes loans into risk categories based on relevant information about the ability of borrowers to service their debt, such as current financial information, historical payment experience, credit documentation, public information and current economic trends, among other factors. The Company analyzes commercial loans individually by classifying the loans as to credit risk. This analysis includes commercial loans with an outstanding balance greater than $275 thousand. This analysis is performed on an annual basis. The Company uses the following definitions for risk ratings:
Pass. Loans classified as pass (Acceptable, Low Acceptable or Pass Watch) may exhibit a wide array of characteristics but at a minimum represent an acceptable risk to the Bank. Borrowers in this rating may have leveraged but acceptable balance sheet positions, satisfactory asset quality, stable to favorable sales and earnings trends, acceptable liquidity and adequate cash flow. Loans are considered fully collectible and require an average amount of administration. While generally adhering to credit policy, these loans may exhibit occasional exceptions that do not result in undue risk to the Bank. Borrowers are generally capable of absorbing setbacks, financial and otherwise, without the threat of failure.
Special Mention. Loans classified as special mention have a material weakness that deserves management’s close attention. If left uncorrected, these weaknesses may result in deterioration of the repayment prospects for the loan or of the Bank’s credit position at some future date.
Substandard. Loans classified as substandard are inadequately protected by the current net worth and paying capacity of the obligor or of the collateral pledged, if any. Loans so classified have a well-defined weakness or weaknesses that jeopardize the liquidation of the debt. They are characterized by the distinct possibility that the Bank will sustain some loss if the deficiencies are not corrected.
Doubtful. Loans classified as doubtful have all the weaknesses inherent in those classified as substandard, with the added characteristic that the weaknesses make collection or liquidation in full, on the basis of currently existing facts, conditions and values, highly questionable and improbable.
Loans not meeting the criteria above that are analyzed individually as part of the above described process are considered to be pass rated loans. Loans listed as not rated are either less than $275 thousand or are included in groups of homogeneous loans. Based on the most recent analysis performed, the risk category of loans by class is as follows at December 31:
| | | | | | | | | | | | | | | | | | | | | | | | |
(Dollars in thousands) | | PASS | | | SPECIAL
MENTION | | | SUBSTANDARD | | | DOUBTFUL | | | NOT RATED | | | TOTAL | |
2011 | | | | | | | | | | | | | | | | | | | | | | | | |
Commercial | | $ | 76,216 | | | $ | 5,147 | | | $ | 7,710 | | | $ | — | | | $ | 755 | | | $ | 89,828 | |
Commercial real estate | | | 84,846 | | | | 10,385 | | | | 8,686 | | | | — | | | | 2,415 | | | | 106,332 | |
Residential real estate | | | 1,151 | | | | — | | | | 61 | | | | — | | | | 102,306 | | | | 103,518 | |
Consumer | | | — | | | | — | | | | — | | | | — | | | | 6,216 | | | | 6,216 | |
Construction & land development | | | 12,695 | | | | 4,340 | | | | 168 | | | | — | | | | 858 | | | | 18,061 | |
| | | | | | | | | | | | | | | | | | | | | | | | |
Total | | $ | 174,908 | | | $ | 19,872 | | | $ | 16,625 | | | $ | — | | | $ | 112,550 | | | $ | 323,955 | |
| | | | | | | | | | | | | | | | | | | | | | | | |
2010 | | | | | | | | | | | | | | | | | | | | | | | | |
Commercial | | $ | 65,371 | | | $ | 3,843 | | | $ | 9,252 | | | $ | — | | | $ | 74 | | | $ | 78,540 | |
Commercial real estate | | | 78,191 | | | | 9,982 | | | | 8,188 | | | | — | | | | 8,468 | | | | 104,829 | |
Residential real estate | | | 1,153 | | | | — | | | | 365 | | | | — | | | | 107,314 | | | | 108,832 | |
Consumer | | | — | | | | — | | | | 2 | | | | — | | | | 6,713 | | | | 6,715 | |
Construction & land development | | | 11,626 | | | | 2,905 | | | | 591 | | | | — | | | | 1,393 | | | | 16,515 | |
| | | | | | | | | | | | | | | | | | | | | | | | |
Total | | $ | 156,341 | | | $ | 16,730 | | | $ | 18,398 | | | $ | — | | | $ | 123,962 | | | $ | 315,431 | |
| | | | | | | | | | | | | | | | | | | | | | | | |
2011Annual Report to Shareholders | CSB Bancorp, Inc. 41
Notes to Consolidated Financial Statements
NOTE 2 – LOANS (CONTINUED)
Nonperforming loans include loans past due 90 days and greater and loans on nonaccrual of interest status. The following table presents loans that are not rated, by class of loans as of December 31:
| | | | | | | | | | | | |
(Dollars in thousands) | | PERFORMING | | | NONPERFORMING | | | TOTAL | |
December 31, 2011 | | | | | | | | | | | | |
Commercial | | $ | 755 | | | $ | — | | | $ | 755 | |
Commercial real estate | | | 2,415 | | | | — | | | | 2,415 | |
Residential real estate | | | 100,892 | | | | 1,414 | | | | 102,306 | |
Consumer | | | 6,208 | | | | 8 | | | | 6,216 | |
Construction & land development | | | 850 | | | | 8 | | | | 858 | |
| | | | | | | | | | | | |
Total | | $ | 111,120 | | | $ | 1,430 | | | $ | 112,550 | |
| | | | | | | | | | | | |
December 31, 2010 | | | | | | | | | | | | |
Commercial | | $ | 74 | | | $ | — | | | $ | 74 | |
Commercial real estate | | | 8,468 | | | | — | | | | 8,468 | |
Residential real estate | | | 105,201 | | | | 2,113 | | | | 107,314 | |
Consumer | | | 6,713 | | | | — | | | | 6,713 | |
Construction & land development | | | 1,383 | | | | 10 | | | | 1,393 | |
| | | | | | | | | | | | |
Total | | $ | 121,839 | | | $ | 2,123 | | | $ | 123,962 | |
| | | | | | | | | | | | |
Loans serviced for others approximated $49.9 million and $45.1 million at December 31, 2011 and 2010, respectively.
Mortgage Servicing Rights
For the years ended December 31, 2011 and 2010, the Company had outstanding mortgage servicing rights (“MSRs”) of $167 thousand and $155 thousand, respectively. No valuation allowance was recorded at December 31, 2011 or 2010 as the fair value of the MSRs exceeded their carrying value. On December 31, 2011, the Company had $44.3 million residential mortgage loans with servicing retained as compared to $43.2 million with servicing retained at December 31, 2010.
42 2011Annual Report to Shareholders | CSB Bancorp, Inc.
Notes to Consolidated Financial Statements
NOTE 3 – ACQUISITION
Premier Bank & Trust Branches
Effective as of the close of business on October 14, 2011, the Bank completed the branch purchase and assumption of liabilities of two branches of Premier Bank & Trust, National Association (“Premier”) located in Wooster, Ohio. The Bank paid a 5% premium on all deposit accounts. As a result of this purchase, the two full-service banking offices of Premier, located at 305 West Liberty Street and 3562 Commerce Parkway in Wooster, Ohio, became full-service banking offices of the Bank.
The following table summarizes the estimated fair values of the assets acquired and liabilities assumed at the date of the acquisition:
| | | | |
(Dollars in thousands) | | | |
Cash | | $ | 60,872 | |
Loans, net | | | 9,219 | |
Premises, leasehold and equipment | | | 672 | |
Goodwill | | | 3,003 | |
Core deposit intangible | | | 706 | |
Other assets | | | 31 | |
| | | | |
Total assets acquired | | $ | 74,503 | |
| | | | |
Deposits | | | 74,475 | |
Other liabilities | | | 28 | |
| | | | |
Total liabilities assumed | | $ | 74,503 | |
| | | | |
The assets acquired and liabilities assumed from Premier were recorded at fair value on the date of acquisition, and costs related to the acquisition, primarily professional fees, were expensed as incurred. All loans acquired from Premier were performing as of the acquisition date. During the year ended December 31, 2011, $337 thousand in merger and acquisition integration expenses was incurred related to the Branch Acquisition.
The core deposit intangible asset is being amortized over its estimated useful life of approximately ten years, using an accelerated method. The goodwill, which is not amortized for book purposes, will be amortized over 15 years for tax purposes, using the straight line method.
The fair value for loans acquired from Premier was estimated using projected monthly cash flows discounted to present value using a market rate for similar loans. There was no carry-over of Premier’s allowance for credit losses associated with the loans we acquired as the loans were initially recorded at fair value.
The fair value for savings and transaction deposit accounts acquired from Premier was assumed to approximate the carrying value as these accounts have no stated maturity and are payable on demand. Certificates of deposit were valued by comparing the contractual cost of the portfolio to an identical portfolio bearing current market rates. The projected cash flows from maturing certificates were calculated based on contractual rates. The fair value of the certificates of deposit was calculated by discounting their contractual cash flows at a market rate for a certificate of deposit with a corresponding maturity.
2011Annual Report to Shareholders | CSB Bancorp, Inc. 43
Notes to Consolidated Financial Statements
NOTE 4 – PREMISES AND EQUIPMENT
Premises and equipment consist of the following at December 31:
| | | | | | | | |
| (Dollars in thousands) | | 2011 | | | 2010 | |
Land and improvements | | $ | 1,489 | | | $ | 1,418 | |
Buildings and improvements | | | 9,422 | | | | 9,606 | |
Furniture and equipment | | | 6,272 | | | | 6,255 | |
Leasehold improvements | | | 260 | | | | 172 | |
| | | | | | | | |
| | | 17,443 | | | | 17,451 | |
Accumulated depreciation | | | 8,930 | | | | 9,573 | |
| | | | | | | | |
Premises and equipment, net | | $ | 8,513 | | | $ | 7,878 | |
| | | | | | | | |
The Bank leases certain office locations. Total rental expense under these leases approximated $187 thousand, $142 thousand, and $160 thousand in 2011, 2010 and 2009, respectively. Depreciation expense amounted to $530 thousand, $527 thousand and $630 thousand for the years ended December 31, 2011, 2010, and 2009, respectively.
Future minimum lease payments at December 31, 2011 were as follows:
| | | | |
| (Dollars in thousands) | | | |
2012 | | $ | 291 | |
2013 | | | 267 | |
2014 | | | 267 | |
2015 | | | 268 | |
2016 | | | 153 | |
2017 | | | 13 | |
| | | | |
Total | | $ | 1,259 | |
| | | | |
NOTE 5 – GOODWILL AND OTHER INTANGIBLE ASSETS
Goodwill
Goodwill totaled $4.7 and $1.7 million at December 31, 2011 and 2010. In 2011, the increase in goodwill relates to the Branch Acquisition (see Note 3 above) resulting from the premium paid and purchase accounting adjustments. The following table shows a rollforward of goodwill:
| | | | |
| (Dollars in thousands) | | | |
Balance at January 1, 2010 | | $ | 1,725 | |
| | | | |
Balance at December 31, 2010 | | $ | 1,725 | |
Acquisition | | | 3,003 | |
| | | | |
Balance at December 31, 2011 | | $ | 4,728 | |
| | | | |
Core Deposit Intangible
During 2011, the Bank recorded a core deposit intangible totaling $706 thousand with the Branch Acquisition. The core deposit intangible asset will be amortized over an estimated life of ten years. Amortization expense related to the core deposit intangible asset totaled $78 thousand, $63 thousand and $65 thousand in 2011, 2010 and 2009, respectively. The following table shows the core deposit intangible and the related accumulated amortization:
| | | | | | | | |
| | | December 31, | |
| (Dollars in thousands) | | 2011 | | | 2010 | |
Gross carrying amount | | $ | 1,251 | | | $ | 545 | |
Accumulated amortization | | | (217 | ) | | | (139 | ) |
| | | | | | | | |
Net carrying amount | | $ | 1,034 | | | $ | 406 | |
| | | | | | | | |
44 2011Annual Report to Shareholders | CSB Bancorp, Inc.
Notes to Consolidated Financial Statements
NOTE 5 – GOODWILL AND OTHER INTANGIBLE ASSETS (CONTINUED)
The estimated aggregate future amortization expense for the core deposit asset remaining as of December 31, 2011 is as follows:
| | | | |
(Dollars in thousands) | | CORE DEPOSIT
AMORTIZATION | |
2012 | | $ | 140 | |
2013 | | | 135 | |
2014 | | | 130 | |
2015 | | | 125 | |
2016 | | | 121 | |
Thereafter | | | 383 | |
| | | | |
| | $ | 1,034 | |
| | | | |
NOTE 6 – INTEREST-BEARING DEPOSITS
Interest-bearing deposits at December 31 are as follows:
| | | | | | | | |
(Dollars in thousands) | | 2011 | | | 2010 | |
Demand | | $ | 61,830 | | | $ | 55,340 | |
Savings | | | 123,304 | | | | 77,998 | |
Time deposits: | | | | | | | | |
In excess of $100,000 | | | 60,090 | | | | 51,288 | |
Other | | | 112,439 | | | | 99,714 | |
| | | | | | | | |
Total interest-bearing deposits | | $ | 357,663 | | | $ | 284,340 | |
| | | | | | | | |
At December 31, 2011, stated maturities of time deposits were as follows:
| | | | |
(Dollars in thousands) | | | |
2012 | | $ | 89,007 | |
2013 | | | 50,395 | |
2014 | | | 17,506 | |
2015 | | | 6,964 | |
2016 | | | 8,657 | |
| | | | |
Total | | $ | 172,529 | |
| | | | |
NOTE 7 – BORROWINGS
Short-term Borrowings
Short-term borrowings include overnight repurchase agreements, federal funds purchased and short-term advances through the FHLB. The outstanding balances and related information for short-term borrowings are summarized as follows:
| | | | | | | | |
(Dollars in thousands) | | 2011 | | | 2010 | |
Balance at year-end | | $ | 37,073 | | | $ | 32,018 | |
Average balance outstanding | | | 32,577 | | | | 29,700 | |
Maximum month-end balance | | | 37,073 | | | | 33,629 | |
Weighted-average rate at year-end | | | 0.25 | % | | | 0.55 | % |
Weighted-average rate during the year | | | 0.43 | | | | 0.68 | |
Average balances outstanding during the year represent daily average balances, and average interest rates represent interest expenses divided by the related average balances.
2011Annual Report to Shareholders | CSB Bancorp, Inc. 45
Notes to Consolidated Financial Statements
NOTE 7 – BORROWINGS (CONTINUED)
Other Borrowings
The following table sets forth information concerning other borrowings:
| | | | | | | | | | | | | | | | | | | | | | | | |
| (Dollars in thousands) | | MATURITY RANGE | | WEIGHTED AVERAGE
INTEREST RATE | | | STATED INTEREST
RATE RANGE | | | AT DECEMBER 31, | |
DESCRIPTION | | FROM | | TO | | | FROM | | | TO | | | 2011 | | | 2010 | |
Fixed rate | | 3/14/2012 | | 12/21/2017 | | | 3.21 | % | | | 1.82 | % | | | 3.73 | % | | $ | 18,000 | | | $ | 21,000 | |
Fixed rate amortizing | | 1/1/2012 | | 3/1/2017 | | | 5.50 | | | | 3.40 | | | | 7.15 | | | | 1,161 | | | | 1,909 | |
| | | | | | | | | | | | | | | | | | | | | | | | |
| | | | | | | | | | | | | | | | | | $ | 19,161 | | | $ | 22,909 | |
| | | | | | | | | | | | | | | | | | | | | | | | |
Maturities of other borrowings at December 31, 2011, are summarized as follows:
| | | | | | | | |
YEAR ENDING DECEMBER 31, | | AMOUNT | | | WEIGHTED-
AVERAGE RATE | |
2012 | | $ | 6,490 | | | | 2.55 | % |
2013 | | | 213 | | | | 6.06 | |
2014 | | | 190 | | | | 6.03 | |
2015 | | | 169 | | | | 6.01 | |
2016 | | | 96 | | | | 5.84 | |
2017 and beyond | | | 12,003 | | | | 3.62 | |
| | | | | | | | |
| | $ | 19,161 | | | | 3.34 | % |
| | | | | | | | |
Monthly principal and interest payments are due on the fixed rate amortizing borrowings; additionally a 10% principal curtailment is due on the borrowing’s anniversary date. FHLB borrowings are secured by a blanket collateral agreement. At December 31, 2011 the Company has the capacity to borrow an additional $30.8 million from the FHLB.
NOTE 8 – INCOME TAXES
The provision for income taxes consists of the following for the years ended December 31:
| | | | | | | | | | | | |
(Dollars in thousands) | | 2011 | | | 2010 | | | 2009 | |
Current | | $ | 1,257 | | | $ | 1,275 | | | $ | 1,131 | |
Deferred | | | 345 | | | | 293 | | | | 403 | |
| | | | | | | | | | | | |
Total income tax provision | | $ | 1,602 | | | $ | 1,568 | | | $ | 1,534 | |
| | | | | | | | | | | | |
The income tax provision attributable to income from operations differs from the amounts computed by applying the statutory federal income tax rate of 34% to income before income taxes as follows:
| | | | | | | | | | | | |
(Dollars in thousands) | | 2011 | | | 2010 | | | 2009 | |
Expected provision using statutory federal income tax rate | | $ | 1,798 | | | $ | 1,722 | | | $ | 1,674 | |
Tax-exempt income on state and municipal securities and political subdivision loans | | | (169 | ) | | | (149 | ) | | | (138 | ) |
Interest expense associated with carrying certain state and municipal securities and political subdivision loans | | | 8 | | | | 9 | | | | 8 | |
Other | | | (35 | ) | | | (14 | ) | | | (10 | ) |
| | | | | | | | | | | | |
Total income tax provision | | $ | 1,602 | | | $ | 1,568 | | | $ | 1,534 | |
| | | | | | | | | | | | |
46 2011Annual Report to Shareholders | CSB Bancorp, Inc.
Notes to Consolidated Financial Statements
NOTE 8 – INCOME TAXES (CONTINUED)
The tax effects of temporary differences that give rise to deferred tax assets and deferred tax liabilities at December 31 are as follows:
| | | | | | | | |
(Dollars in thousands) | | 2011 | | | 2010 | |
Allowance for loan losses | | $ | 1,195 | | | $ | 1,244 | |
Net operating loss carryforward | | | 727 | | | | 855 | |
Capital loss carryforward | | | 35 | | | | 35 | |
Other | | | 147 | | | | 81 | |
| | | | | | | | |
| | | 2,104 | | | | 2,215 | |
| | | | | | | | |
Valuation allowance on deferred tax assets | | | (35 | ) | | | (35 | ) |
| | | | | | | | |
Deferred tax assets | | | 2,069 | | | | 2,180 | |
| | | | | | | | |
Premises and equipment | | | (389 | ) | | | (144 | ) |
Federal Home Loan Bank stock dividends | | | (736 | ) | | | (736 | ) |
Deferred loan fees | | | (121 | ) | | | (90 | ) |
Unrealized gain on securities available for sale | | | (736 | ) | | | (449 | ) |
Prepaid expenses | | | (83 | ) | | | (110 | ) |
Other | | | (206 | ) | | | (221 | ) |
| | | | | | | | |
Deferred tax liabilities | | | (2,271 | ) | | | (1,750 | ) |
| | | | | | | | |
Net deferred tax (liability) asset | | $ | (202 | ) | | $ | 430 | |
| | | | | | | | |
The Company has a net operating loss tax carryforward of approximately $2.1 million, as of December 31, 2011. The net operating loss carryforward can be used to offset future taxable income and will begin to expire in tax year 2026.
The Company believes it is more likely than not that the benefit of deferred tax assets will be realized with the possible exception of the capital loss carryforward due to expire in 2014. A valuation allowance for the capital loss carryforward is reflected at December 31, 2011 and 2010. No additional valuation allowance is deemed necessary in view of certain tax strategies, coupled with the anticipated future taxable income as evidenced by the Company’s earnings potential.
There is currently no liability for uncertain tax positions and no known unrecognized tax benefits. CSB recognizes, when applicable, interest and penalties related to unrecognized tax benefits in the provision for income taxes in the Consolidated Statement of Income. With few exceptions, CSB is no longer subject to U.S. federal, state, or local income tax examinations by tax authorities for years before 2008.
NOTE 9 – EMPLOYEE BENEFITS
The Company sponsors a contributory 401(k) profit-sharing plan covering substantially all employees who meet certain age and service requirements. The Plan permits investment in the Company’s common stock subject to various limitations and provides for discretionary profit sharing and matching contributions. The discretionary profit sharing contribution is determined annually by the Board of Directors and amounted to 2.5% of each eligible participant’s compensation for 2011, 2010 and 2009, respectively. The Plan also provides for a 50% Company match of participant contributions up to a maximum of 2% of each participant’s annual compensation. Expense under the Plan amounted to approximately $242 thousand, $199 thousand and $230 thousand for 2011, 2010 and 2009, respectively.
The Company maintains a stock option plan. No stock options were granted in 2011 or 2010. During 2009, the Board of Directors extended options to purchase 1,000 shares originally expiring in 2009 through August 2014 at an exercise price of $15.00.
2011Annual Report to Shareholders | CSB Bancorp, Inc. 47
Notes to Consolidated Financial Statements
NOTE 9 – EMPLOYEE BENEFITS (CONTINUED)
The following summarizes stock options activity for the years ended December 31:
| | | | | | | | | | | | | | | | | | | | | | | | |
| | | 2011 | | | 2010 | | | 2009 | |
| | | SHARES | | | WEIGHTED
AVERAGE
EXERCISE
PRICE | | | SHARES | | | WEIGHTED
AVERAGE
EXERCISE
PRICE | | | SHARES | | | WEIGHTED
AVERAGE
EXERCISE
PRICE | |
Outstanding at beginning of year | | | 39,945 | | | $ | 17.48 | | | | 40,195 | | | $ | 17.47 | | | | 40,720 | | | $ | 17.55 | |
Granted | | | — | | | | — | | | | — | | | | — | | | | 1,000 | | | | 15.00 | |
Exercised | | | — | | | | — | | | | — | | | | — | | | | — | | | | — | |
Forfeited | | | (13,229 | ) | | | (17.81 | ) | | | (250 | ) | | | (16.05 | ) | | | (1,525 | ) | | | (17.98 | ) |
| | | | | | | | | | | | | | | | | | | | | | | | |
Outstanding at end of year | | | 26,716 | | | $ | 17.32 | | | | 39,945 | | | $ | 17.48 | | | | 40,195 | | | $ | 17.47 | |
| | | | | | | | | | | | | | | | | | | | | | | | |
Options exercisable at year-end | | | 26,716 | | | $ | 17.32 | | | | 39,945 | | | $ | 17.48 | | | | 40,195 | | | $ | 17.47 | |
| | | | | | | | | | | | | | | | | | | | | | | | |
Weighted-average fair value of options granted during year | | | | | | | N/A | | | | | | | | N/A | | | | | | | $ | 1.40 | |
Options outstanding at December 31, 2011 were as follows:
| | | | | | | | | | | | | | | | |
| | | OUTSTANDING | | | EXERCISABLE | |
RANGE OF EXERCISABLE PRICES | | NUMBER | | | WEIGHTED
AVERAGE
REMAINING
CONTRACTUAL LIFE
(YEARS) | | | NUMBER | | | WEIGHTED
AVERAGE
EXERCISE
PRICE | |
$15.00 | | | 1,000 | | | | 2.57 | | | | 1,000 | | | $ | 15.00 | |
16.05 | | | 6,860 | | | | 0.99 | | | | 6,860 | | | | 16.05 | |
16.10 | | | 1,000 | | | | 0.17 | | | | 1,000 | | | | 16.10 | |
18.00 | | | 17,856 | | | | 4.19 | | | | 17,856 | | | | 18.00 | |
| | | | | | | | | | | | | | | | |
Outstanding at year-end | | | 26,716 | | | | 3.16 | | | | 26,716 | | | $ | 17.32 | |
| | | | | | | | | | | | | | | | |
The total intrinsic value of outstanding in-the-money stock options and outstanding in-the-money exercisable stock options was $7,200 and $570 at December 31, 2011 and 2010, respectively. There were no stock options exercised in 2011, 2010, or 2009. There were no options vested in 2011 or 2010. The total fair value of stock options vested was $8,900 in 2009.
NOTE 10 – FINANCIAL INSTRUMENTS WITH OFF-BALANCE SHEET RISK
The Bank is party to financial instruments with off-balance sheet risk in the normal course of business to meet the financing needs of its customers. These financial instruments are primarily loan commitments to extend credit and letters of credit. These instruments involve, to varying degrees, elements of credit risk in excess of the amounts recognized in the consolidated balance sheets. The contract amount of these instruments reflects the extent of involvement the Bank has in these financial instruments. The Bank’s exposure to credit loss in the event of the nonperformance by the other party to the financial instruments for loan commitments to extend credit and letters of credit is represented by the contractual amounts of these instruments. The Bank uses the same credit policies in making loan commitments as it does for on-balance sheet loans.
The following financial instruments whose contract amount represents credit risk were outstanding at December 31:
| | | | | | | | |
(Dollars in thousands) | | 2011 | | | 2010 | |
Commitments to extend credit | | $ | 90,845 | | | $ | 74,715 | |
| | | | | | | | |
Letters of credit | | $ | 875 | | | $ | 1,302 | |
| | | | | | | | |
48 2011Annual Report to Shareholders | CSB Bancorp, Inc.
Notes to Consolidated Financial Statements
NOTE 10 – FINANCIAL INSTRUMENTS WITH OFF-BALANCE SHEET RISK (CONTINUED)
Commitments to extend credit are agreements to lend to a customer as long as there is no violation of any condition established in the contract. Commitments generally have fixed expiration dates or other termination clauses and may require payment of a fee. Since many of the commitments are expected to expire without being drawn upon, the total commitment amount does not necessarily represent future cash requirements. The Company evaluates each customer’s credit worthiness on a case-by-case basis. The amount of collateral, obtained if deemed necessary by the Company upon extension of credit, is based on management’s credit evaluation of the customer. Collateral held varies but may include accounts receivable; recognized inventory; property, plant and equipment; and income-producing commercial properties.
Letters of credit are written conditional commitments issued by the Company to guarantee the performance of a customer to a third party and are reviewed for renewal at expiration. All letters of credit outstanding at December 31, 2011 are due on demand or expire in 2012. The credit risk involved in issuing letters of credit is essentially the same as that involved in extending loans to customers. The Company requires collateral supporting these commitments when deemed appropriate.
NOTE 11 – RELATED-PARTY TRANSACTIONS
In the ordinary course of business, loans are granted by the Company to executive officers, directors and their related business interests consistent with Federal Reserve Regulation O. The following is an analysis of activity of related-party loans for the year ended December 31, 2011:
| | | | |
(Dollars in thousands) | | | |
Balance at beginning of year | | $ | 4,316 | |
New loans and advances | | | 393 | |
Repayments, including loans sold | | | (1,058 | ) |
| | | | |
Balance at end of year | | $ | 3,651 | |
| | | | |
Deposits from executive officers, directors and their related business interests at both December 31, 2011 and 2010 were approximately $10.2 million and $10.2 million.
NOTE 12 – REGULATORY MATTERS
The Company (on a consolidated basis) and Bank are subject to various regulatory capital requirements administered by the federal and state banking agencies. Failure to meet minimum capital requirements can initiate certain mandatory and possibly additional discretionary, actions by regulators that, if undertaken, could have a direct material effect on the Company’s and Bank’s financial statements. Under capital adequacy guidelines and the regulatory framework for prompt corrective action, the Company and Bank must meet specific capital guidelines that involve quantitative measures of the assets, liabilities and certain off-balance-sheet items as calculated under regulatory accounting practices. The capital amounts and classification are also subject to qualitative judgments by the regulators about components, risk weightings and other factors.
Quantitative measures established by regulation to ensure capital adequacy require the Company and Bank to maintain minimum amounts and ratios (set forth in the following table) of Total and Tier 1 capital (as defined in the regulations) to risk-weighted assets (as defined), and of Tier 1 capital to average assets (as defined). Management believes, as of December 31, 2011 and 2010, that the Company and Bank met or exceeded all capital adequacy requirements to which they are subject.
As of December 31, 2011, the most recent notification from federal and state banking agencies categorized the Bank as “well capitalized” under the regulatory framework for prompt corrective action. To be categorized as “well capitalized” an institution must maintain minimum total risk-based Tier 1 risk-based and Tier 1 leverage ratios as set forth in the following tables. There are no known conditions or events since that notification that Management believes have changed the Bank’s category.
2011Annual Report to Shareholders | CSB Bancorp, Inc. 49
Notes to Consolidated Financial Statements
NOTE 12 – REGULATORY MATTERS (CONTINUED)
The actual capital amounts and ratios of the Company and Bank as of December 31 are presented in the following tables:
| | | | | | | | | | | | | | | | | | | | | | | | |
| | | ACTUAL | | | MINIMUM REQUIRED
FOR CAPITAL
ADEQUACY PURPOSES | | | MINIMUM REQUIRED
TO BE WELL CAPITALIZED
UNDER PROMPT CORRECTIVE
ACTION | |
(Dollars in thousands) | | AMOUNT | | | RATIO | | | AMOUNT | | | RATIO | | | AMOUNT | | | RATIO | |
As of December 31, 2011 | | | | | | | | | | | | | | | | | | | | | | | | |
Total capital (to risk-weighted assets) | | | | | | | | | | | | | | | | | | | | | | | | |
Consolidated | | $ | 46,300 | | | | 14.2 | % | | $ | 26,133 | | | | 8.0 | % | | $ | 32,667 | | | | 10.0 | % |
Bank | | | 45,517 | | | | 13.9 | | | | 26,114 | | | | 8.0 | | | | 32,643 | | | | 10.0 | |
Tier I capital (to risk-weighted assets) | | | | | | | | | | | | | | | | | | | | | | | | |
Consolidated | | | 42,220 | | | | 12.9 | | | | 13,067 | | | | 4.0 | | | | 19,600 | | | | 6.0 | |
Bank | | | 41,437 | | | | 12.7 | | | | 13,057 | | | | 4.0 | | | | 19,586 | | | | 6.0 | |
Tier I capital (to average assets) | | | | | | | | | | | | | | | | | | | | | | | | |
Consolidated | | | 42,220 | | | | 8.1 | | | | 20,971 | | | | 4.0 | | | | 26,214 | | | | 5.0 | |
Bank | | | 41,437 | | | | 7.9 | | | | 20,965 | | | | 4.0 | | | | 26,207 | | | | 5.0 | |
As of December 31, 2010 | | | | | | | | | | | | | | | | | | | | | | | | |
Total capital (to risk-weighted assets) | | | | | | | | | | | | | | | | | | | | | | | | |
Consolidated | | $ | 47,899 | | | | 15.9 | % | | $ | 24,085 | | | | 8.0 | % | | $ | 30,107 | | | | 10.0 | % |
Bank | | | 47,227 | | | | 15.7 | | | | 24,074 | | | | 8.0 | | | | 30,093 | | | | 10.0 | |
Tier I capital (to risk-weighted assets) | | | | | | | | | | | | | | | | | | | | | | | | |
Consolidated | | | 44,134 | | | | 14.7 | | | | 12,043 | | | | 4.0 | | | | 18,064 | | | | 6.0 | |
Bank | | | 43,462 | | | | 14.4 | | | | 12,037 | | | | 4.0 | | | | 18,056 | | | | 6.0 | |
Tier I capital (to average assets) | | | | | | | | | | | | | | | | | | | | | | | | |
Consolidated | | | 44,134 | | | | 9.8 | | | | 18,100 | | | | 4.0 | | | | 22,626 | | | | 5.0 | |
Bank | | | 43,462 | | | | 9.6 | | | | 18,097 | | | | 4.0 | | | | 22,622 | | | | 5.0 | |
The Company’s primary source of funds with which to pay dividends, are dividends received from the Bank. The payment of dividends by the Bank to the Company is subject to restrictions by its regulatory agencies. These restrictions generally limit dividends to current year net income and prior two-years net retained earnings. Also, dividends may not reduce capital levels below the minimum regulatory requirements disclosed in the prior table. Under these provisions, at January 1, 2012, the Bank could dividend $5,021,900 to the Company. The Company does not anticipate the financial need to obtain regulatory approval due to its current cash balances and ability to access the credit markets. Federal law prevents the Company from borrowing from the Bank unless loans are secured by specific obligations. Further, such secured loans are limited to an amount not exceeding ten percent of the Bank’s common stock and capital surplus.
NOTE 13 – CONDENSED PARENT COMPANY FINANCIAL INFORMATION
A summary of condensed financial information of the parent company as of December 31, 2011 and 2010 and for each of the three years in the period ended December 31, 2011 follows:
| | | | | | | | |
(Dollars in thousands) | | 2011 | | | 2010 | |
CONDENSED BALANCE SHEETS | | | | | | | | |
ASSETS | | | | | | | | |
Cash deposited with subsidiary bank | | $ | 535 | | | $ | 376 | |
Investment in subsidiary bank | | | 48,652 | | | | 46,489 | |
Securities available-for-sale | | | 60 | | | | 56 | |
Other assets | | | 196 | | | | 247 | |
| | | | | | | | |
Total assets | | $ | 49,443 | | | $ | 47,168 | |
| | | | | | | | |
LIABILITIES AND SHAREHOLDERS’ EQUITY | | | | | | | | |
Total liabilities | | $ | 14 | | | $ | 14 | |
Total shareholders’ equity | | | 49,429 | | | | 47,154 | |
| | | | | | | | |
Total liabilities and shareholders’ equity | | $ | 49,443 | | | $ | 47,168 | |
| | | | | | | | |
50 2011Annual Report to Shareholders | CSB Bancorp, Inc.
Notes to Consolidated Financial Statements
NOTE 13 – CONDENSED PARENT COMPANY FINANCIAL INFORMATION(CONTINUED)
| | | | | | | | | | | | |
(Dollars in thousands) | | 2011 | | | 2010 | | | 2009 | |
CONDENSED STATEMENTS OF INCOME | | | | | | | | | | | | |
Interest on securities | | $ | 1 | | | $ | 1 | | | $ | 1 | |
Dividends from subsidiary | | | 2,300 | | | | 2,000 | | | | 2,200 | |
Securities gain | | | — | | | | — | | | | 1 | |
Other-than-temporary impairment losses | | | — | | | | — | | | | (70 | ) |
| | | | | | | | | | | | |
Total income | | | 2,301 | | | | 2,001 | | | | 2,132 | |
Operating expenses | | | 336 | | | | 483 | | | | 518 | |
| | | | | | | | | | | | |
Income before taxes and undistributed equity income of subsidiary | | | 1,965 | | | | 1,518 | | | | 1,614 | |
Income tax benefit | | | (115 | ) | | | (164 | ) | | | (176 | ) |
Equity earnings in subsidiary, net of dividends | | | 1,607 | | | | 1,814 | | | | 1,601 | |
| | | | | | | | | | | | |
Net income | | $ | 3,687 | | | $ | 3,496 | | | $ | 3,391 | |
| | | | | | | | | | | | |
| | | |
(Dollars in thousands) | | 2011 | | | 2010 | | | 2009 | |
CONDENSED STATEMENTS OF CASH FLOWS | | | | | | | | | | | | |
Cash flows from operating activities: | | | | | | | | | | | | |
Net income | | $ | 3,687 | | | $ | 3,496 | | | $ | 3,391 | |
Adjustments to reconcile net income to cash provided by operations: | | | | | | | | | | | | |
Securities gain | | | — | | | | — | | | | (1 | ) |
Other-than-temporary impairment of investments | | | — | | | | — | | | | 70 | |
Equity earnings in subsidiary, net of dividends | | | (1,607 | ) | | | (1,814 | ) | | | (1,601 | ) |
Stock compensation expense | | | — | | | | — | | | | 8 | |
Change in other assets, liabilities | | | 48 | | | | 21 | | | | 134 | |
| | | | | | | | | | | | |
Net cash provided by operating activities | | | 2,128 | | | | 1,703 | | | | 2,001 | |
| | | | | | | | | | | | |
Cash flows from investing activities: | | | | | | | | | | | | |
Purchase of investment securities | | | — | | | | (4 | ) | | | — | |
Proceeds from sale of investment securities | | | — | | | | — | | | | 13 | |
| | | | | | | | | | | | |
Net cash provided by (used in) investing activities | | | — | | | | (4 | ) | | | 13 | |
| | | | | | | | | | | | |
Cash flows from financing activities: | | | | | | | | | | | | |
Cash dividends paid | | | (1,969 | ) | | | (1,969 | ) | | | (1,969 | ) |
| | | | | | | | | | | | |
Net cash used in financing activities | | | (1,969 | ) | | | (1,969 | ) | | | (1,969 | ) |
| | | | | | | | | | | | |
Increase (decrease) in cash | | | 159 | | | | (270 | ) | | | 45 | |
Cash at beginning of year | | | 376 | | | | 646 | | | | 601 | |
| | | | | | | | | | | | |
Cash at end of year | | $ | 535 | | | $ | 376 | | | $ | 646 | |
| | | | | | | | | | | | |
2011Annual Report to Shareholders | CSB Bancorp, Inc. 51
Notes to Consolidated Financial Statements
NOTE 14 – OTHER COMPREHENSIVE INCOME
The components of other comprehensive income and related tax effects are as follows for the years ended December 31:
| | | | | | | | | | | | |
(Dollars in thousands) | | 2011 | | | 2010 | | | 2009 | |
Unrealized holding gains (losses) on available-for-sale securities | | $ | 1,081 | | | $ | (148 | ) | | $ | 1,482 | |
Less reclassification adjustment for securities gains recognized in income | | | (237 | ) | | | (148 | ) | | | (82 | ) |
| | | | | | | | | | | | |
Net unrealized holding gains (losses) | | | 844 | | | | (296 | ) | | | 1,400 | |
Federal income tax provision (benefit) | | | 287 | | | | (101 | ) | | | 476 | |
| | | | | | | | | | | | |
Other comprehensive income (loss) | | $ | 557 | | | $ | (195 | ) | | $ | 924 | |
| | | | | | | | | | | | |
NOTE 15 – FAIR VALUE MEASUREMENTS
The Company provides disclosures about assets and liabilities carried at fair value. The framework provides a fair value hierarchy that prioritizes the inputs to valuation techniques used to measure fair value. The hierarchy gives the highest priority to unadjusted quoted prices in active markets for identical assets or liabilities and lowest priority to unobservable inputs. The three broad levels of the fair value hierarchy are described below:
| | |
| Level I: | | Inputs to the valuation methodology are unadjusted quoted prices for identical assets or liabilities in active markets that the Company has the ability to access. |
| |
| Level II: | | Inputs to the valuation methodology include quoted prices for similar assets or liabilities in active markets; quoted prices for identical or similar assets or liabilities in inactive markets; inputs other than quoted prices that are observable for the asset or liability; inputs that are derived principally from or corroborated by observable market data or other means including certified appraisals. If the asset or liability has a specified (contractual) term, the Level II input must be observable for substantially the full term of the asset or liability. |
| |
| Level III: | | Inputs to the valuation methodology are unobservable and significant to the fair value measurement. |
The following table presents the assets reported on the consolidated statements of financial condition at their fair value as of December 31, 2011 and December 31, 2010, by level within the fair value hierarchy. No liabilities are carried at fair value. As required by the accounting standards, financial assets and liabilities are classified in their entirety based on the lowest level of input that is significant to the fair value measurement. Equity securities and U.S. Treasury Notes are valued at the closing price reported on the active market on which the individual securities are traded. Obligations of U.S. government corporations and agencies, mortgage-backed securities and obligations of states and political subdivisions are valued at observable market data for similar assets.
52 2011Annual Report to Shareholders | CSB Bancorp, Inc.
Notes to Consolidated Financial Statements
NOTE 15 – FAIR VALUE MEASUREMENTS (CONTINUED)
| | | | | | | | | | | | | | | | |
(Dollars in thousands) | | Level I | | | Level II | | | Level III | | | Total | |
| | | December 31, 2011 | |
Assets: | | | | |
Securities available-for-sale | | | | | | | | | | | | | | | | |
U.S. Treasury security | | $ | 100 | | | $ | — | | | $ | — | | | $ | 100 | |
Obligations of U.S. government corporations and agencies | | | — | | | | 28,323 | | | | — | | | | 28,323 | |
Mortgage-backed securities in government sponsored entities | | | — | | | | 76,332 | | | | — | | | | 76,332 | |
Obligations of states and political subdivisions | | | — | | | | 14,880 | | | | — | | | | 14,880 | |
Corporate bonds | | | — | | | | 3,330 | | | | — | | | | 3,330 | |
| | | | | | | | | | | | | | | | |
Total debt securities | | | 100 | | | | 122,865 | | | | — | | | | 122,965 | |
Equity securities in financial institutions | | | 61 | | | | — | | | | — | | | | 61 | |
| | | | | | | | | | | | | | | | |
Total available-for-sale securities | | $ | 161 | | | $ | 122,865 | | | $ | — | | | $ | 123,026 | |
| | | | | | | | | | | | | | | | |
| |
| | | December 31, 2010 | |
Assets: | | | | | | | | | | | | | | | | |
Securities available-for-sale | | | | | | | | | | | | | | | | |
U.S. Treasury security | | $ | 100 | | | $ | — | | | $ | — | | | $ | 100 | |
Obligations of U.S. government corporations and agencies | | | — | | | | 19,711 | | | | — | | | | 19,711 | |
Mortgage-backed securities in government sponsored entities | | | — | | | | 42,351 | | | | — | | | | 42,351 | |
Obligations of states and political subdivisions | | | — | | | | 11,994 | | | | — | | | | 11,994 | |
Corporate bonds | | | — | | | | 992 | | | | — | | | | 992 | |
| | | | | | | | | | | | | | | | |
Total debt securities | | | 100 | | | | 75,048 | | | | — | | | | 75,148 | |
Equity securities in financial institutions | | | 56 | | | | — | | | | — | | | | 56 | |
| | | | | | | | | | | | | | | | |
Total available-for-sale securities | | $ | 156 | | | $ | 75,048 | | | $ | — | | | $ | 75,204 | |
| | | | | | | | | | | | | | | | |
The following table presents the assets measured on a nonrecurring basis on the consolidated balance sheets at their fair value as of December 31, 2011, and December 31, 2010, by level within the fair value hierarchy. Impaired loans and other real estate that are collateral dependent are written down to fair value through the establishment of specific reserves. The building held at December 31, 2010, was transferred to a new owner during 2011. Techniques used to value the collateral that secure the impaired loans include quoted market prices for identical assets classified as Level I inputs; observable inputs, employed by certified appraisers, for similar assets classified as Level II inputs. In cases where valuation techniques included inputs that are unobservable and are based on estimates and assumptions developed by management based on the best information available under each circumstance, the asset valuation is classified as Level III inputs.
The fair value of MSRs is based on a valuation model that calculates the present value of estimated net servicing income. The valuation model incorporates discounted cash flow and repayment assumptions based on management’s best judgment. As a result, these rights are measured at fair value on a nonrecurring basis and are classified within Level III of the fair value hierarchy.
| | | | | | | | | | | | | | | | |
(Dollars in thousands) | | Level I | | | Level II | | | Level III | | | Total | |
| | | December 31, 2011 | |
Assets Measured on a Nonrecurring Basis: | | | | |
Impaired loans | | $ | — | | | $ | — | | | $ | 6,741 | | | $ | 6,741 | |
Other real estate owned | | | — | | | | — | | | | 10 | | | | 10 | |
Mortgage servicing rights | | | — | | | | — | | | | 167 | | | | 167 | |
| |
| | | December 31, 2010 | |
Impaired loans | | $ | — | | | $ | — | | | $ | 1,916 | | | $ | 1,916 | |
Other real estate owned | | | — | | | | — | | | | 36 | | | | 36 | |
Premises | | | — | | | | 200 | | | | — | | | | 200 | |
Mortgage servicing rights | | | — | | | | — | | | | 155 | | | | 155 | |
2011Annual Report to Shareholders | CSB Bancorp, Inc. 53
Notes to Consolidated Financial Statements
NOTE 16 – FAIR VALUES OF FINANCIAL INSTRUMENTS
The estimated fair values of recognized financial instruments as of December 31, 2011 and 2010 are as follows:
| | | | | | | | | | | | | | | | |
(Dollars in thousands) | | 2011 | | | 2010 | |
| | | CARRYING
VALUE | | | FAIR
VALUE | | | CARRYING
VALUE | | | FAIR
VALUE | |
Financial assets: | | | | | | | | | | | | | | | | |
Cash and cash equivalents | | $ | 82,258 | | | $ | 82,258 | | | $ | 48,360 | | | $ | 48,360 | |
Securities | | | 128,489 | | | | 128,489 | | | | 80,667 | | | | 80,667 | |
Loans, net | | | 320,100 | | | | 327,138 | | | | 311,616 | | | | 316,474 | |
Accrued interest receivable | | | 1,349 | | | | 1,349 | | | | 1,215 | | | | 1,215 | |
Financial liabilities: | | | | | | | | | | | | | | | | |
Deposits | | $ | 443,553 | | | $ | 445,587 | | | $ | 353,491 | | | $ | 355,589 | |
Short-term borrowings | | | 37,073 | | | | 37,073 | | | | 32,018 | | | | 32,018 | |
Other borrowings | | | 19,161 | | | | 20,087 | | | | 22,909 | | | | 23,042 | |
Accrued interest payable | | | 182 | | | | 182 | | | | 213 | | | | 213 | |
For purposes of the above disclosures of estimated fair value, the following assumptions are used:
Cash and cash equivalents; Accrued interest receivable; Short-term borrowings, Accrued interest payable
The fair value of the above instruments is considered to be carrying value.
Securities
The fair value of securities available-for-sale which are measured on a recurring basis are determined primarily by obtaining quoted prices on nationally recognized securities exchanges or matrix pricing, which is a mathematical technique used widely in the industry to value debt securities without relying exclusively on quoted prices for the specific securities but rather by relying on securities’ relationship to other similar securities.
Loans
The fair value for loans is estimated by discounting future cash flows using current market inputs at which loans with similar terms and qualities would be made to borrowers of similar credit quality. Where quoted market prices were available, primarily for certain residential mortgage loans, such market rates were utilized as estimates for fair value. Fair value of non-accrual loans is based on carrying value.
Deposits and other borrowings funds
The fair values of certificates of deposit and other borrowed funds are based on the discounted value of contractual cash flows. The discount rates are estimated using rates currently offered for similar instruments with similar remaining maturities. Demand, savings, and money market deposit accounts are valued at the amount payable on demand as of year-end.
The Company also has unrecognized financial instruments at December 31, 2011 and 2010. These financial instruments relate to commitments to extend credit and letters of credit. The aggregated contract amount of such financial instruments was approximately $91.7 million at December 31, 2011 and $76 million at December 31, 2010. Such amounts are also considered to be the estimated fair values.
The fair value estimates of financial instruments are made at a specific point in time based on relevant market information. These estimates do not reflect any premium or discount that could result from offering for sale at one time the entire holdings of a particular financial instrument over the value of anticipated future business and the value of assets and liabilities that are not considered financial instruments. Since no ready market exists for a significant portion of the financial instruments, fair value estimates are largely based on judgments after considering such factors as future expected credit losses, current economic conditions, risk characteristics of various financial instruments, and other factors. These estimates are subjective in nature and involve uncertainties and matters of significant judgment and therefore, cannot be determined with precision. Changes in assumptions could significantly affect these estimates.
54 2011Annual Report to Shareholders | CSB Bancorp, Inc.
Notes to Consolidated Financial Statements
NOTE 17 – CONTINGENT LIABILITIES
In the normal course of business, the Company is subject to pending and threatened legal actions. Although, the Company is not able to predict the outcome of such actions, after reviewing pending and threatened actions, management believes that the outcome of any or all such actions will not have a material adverse effect on the results of operations or shareholders’ equity of the Company.
The Company has entered into employment agreements with various officers. Upon the occurrence of certain types of termination of employment, the Company may be required to make specified severance payments if termination occurs within a specified period of time, generally two years from the date of the agreement, or pursuant to certain change in control transactions.
NOTE 18 – QUARTERLY FINANCIAL DATA(UNAUDITED)
The following is a summary of selected quarterly financial data (unaudited) for the years ended December 31, 2011 and 2010:
| | | | | | | | | | | | | | | | | | | | |
(Dollars in thousands) | | INTEREST
INCOME | | | NET
INTEREST
INCOME | | | NET
INCOME | | | BASIC
EARNINGS
PER
SHARE | | | DILUTED
EARNINGS
PER
SHARE | |
2011 | | | | | | | | | | | | | | | | | | | | |
First quarter | | $ | 4,946 | | | $ | 3,934 | | | $ | 896 | | | $ | 0.33 | | | $ | 0.33 | |
Second quarter | | | 5,003 | | | | 4,096 | | | | 973 | | | | 0.35 | | | | 0.35 | |
Third quarter | | | 4,958 | | | | 4,098 | | | | 998 | | | | 0.37 | | | | 0.37 | |
Fourth quarter | | | 5,111 | | | | 4,212 | | | | 820 | | | | 0.30 | | | | 0.30 | |
2010 | | | | | | | | | | | | | | | | | | | | |
First quarter | | $ | 5,155 | | | $ | 3,880 | | | $ | 737 | | | $ | 0.27 | | | $ | 0.27 | |
Second quarter | | | 5,029 | | | | 3,833 | | | | 921 | | | | 0.34 | | | | 0.34 | |
Third quarter | | | 5,159 | | | | 3,957 | | | | 882 | | | | 0.32 | | | | 0.32 | |
Fourth quarter | | | 5,047 | | | | 3,900 | | | | 956 | | | | 0.35 | | | | 0.35 | |
2011Annual Report to Shareholders | CSB Bancorp, Inc. 55
Officers of The Commercial & Savings Bank
Rebecca A. Baker
Assistant Vice President, Banking Center Manager
Pamela S. Basinger
Vice President, Financial Officer
Deborah S. Berner
Vice President,
Retail Services Manager
Pamela L. Bromund
Assistant Vice President, Loan Operations Supervisor
Wendy D. Brown
Assistant Vice President, Bank Operations Manager
C. Dawn Butler
Vice President,
Regional Bank Manager
Beverly A. Carr
Operations Officer, Bank Operations
Colby M. Chamberlin
Vice President, Commercial Lender
Dale J. Clinton
Vice President, Internal Auditor
G. Gail Cochran
Assistant Vice President, Executive Loan Secretary
Peggy L. Conn
Corporate Secretary
Marianne Davis
Officer,
Banking Center Manager
Christopher J. Delatore
Vice President, Commercial Lender
David J. Dolan
Assistant Vice President, Mortgage Services Manager
Paula S. Foy
Vice President,
Compliance Officer/BSA Officer
Lori S. Frantz
Assistant Vice President, Banking Center Manager
Brett A. Gallion
Assistant Vice President, Project Manager
Carrie A. Gerber
Credit Officer
Eric R. Giauque
Assistant Vice President, Banking Center Manager
Benjamin J. Hershberger
Officer,
Banking Center Manager
Deissy L. Houmard
Officer,
Assistant Banking Center Manager
Brandi L. Hudnall
Officer,
Banking Center Manager
Jason B. Hummel
Vice President, Commercial Lender
Julie A. Jones
Vice President,
Director of Human Resources
Stephen K. Kilpatrick
First Vice President, Senior Credit Officer
Betty C. Lyon
Assistant Vice President, Banking Center Manager
W. Robert Manning, Jr. Executive Vice President, Chief Operations Officer, Chief Information Officer
Kevin J. McAllister
Vice President, Trust Officer
Robyn E. McClintock
Vice President,
Regional Bank Manager
Jay R. McCulloch
Vice President, Brokerage Manager
Sherry A. McRobie
Assistant Vice President, Banking Center Manager
Paula J. Meiler
Senior Vice President, Chief Financial Officer
A. Lee Miller
Vice President,
Cash Management & Special Projects, CRA Officer
Edward J. Miller
Vice President,
Operations Services Manager, Security
Daniel L. Muse
Operations Officer
Shawn E. Oswald
Vice President,
Information System Director, OFAC Officer
Amy R. Patterson
Assistant Vice President, Loan Officer
Thomas S. Rumbaugh
Vice President, Trust Officer
Lisa M. Schonauer
Assistant Vice President, Banking Center Manager
Rebecca J. Shultz
Assistant Vice President, Loan Officer
Melissa F. Sprang
Assistant Vice President, Regional Bank Manager
Bud Stebbins
First Vice President, Senior Loan Officer
Eddie L. Steiner
Chairman, President,
Chief Executive Officer
Steven J. Stiffler
Vice President, Commercial Lender
Eric D. Strouse
Vice President, Commercial Lender
Elaine A. Tedrow
Assistant Vice President, Banking Center Manager
Jennifer M. Thorpe
Assistant Vice President, Senior Credit Analyst
William R. Tinlin
Vice President, Recovery
Brian D. Troyer
Assistant Vice President, Trust Operations
Jane C. Whitmer
Officer,
Assistant Banking Center Manager
Michael D. Workman
Vice President, Mortgage Loan Officer, Small Business Lender
Crystal R. Yoder
Operations Officer
56 2011 Annual Report to Shareholders | CSB Bancorp, Inc.
Shareholder & General Inquiries
Stock Listing Common Symbol: CSBB.OB
CORPORATE OFFICE 91 North Clay Street, Millersburg, Ohio. . . . . . . . . . . . . . . . . . . . . . . . . . . . 330-674-9015 or 800-654-9015
If you have questions regarding your CSB Bancorp, Inc. stock, please contact:
Registrar and Transfer Company
Attn: Investor Relations
10 Commerce Drive
Cranford, New Jersey 07016 800-368-5948 www.rtco.com
Peggy L. Conn
Corporate Secretary CSB Bancorp, Inc.
91 North Clay Street Millersburg, Ohio 44654
330-674 • 800 -9015 -654-9015
Legal Counsel
Vorys, Sater, Seymour and Pease LLP
52 East Gay Street
P.O. Box 1008
Columbus, Ohio 43216
If you are interested in purchasing shares of CSB Bancorp, Inc., you may contact your local broker or one of the following:
Jay McCulloch
Investment Executive CSB Investment Services
Located at:
The Commercial & Savings Bank
91 North Clay Street P.O. Box 50 Millersburg, Ohio 44654
330-674 • 800 -2397 -654-9015
George Geissbuhler
Sweney Cartwright & Co.
17 South High Street, Suite 300 Columbus, Ohio 43215 800-334-7481
Nicolas “Nick” P. Bicking
Boenning & Scattergood 9916 Brewster Lane Powell, Ohio 43065 866-326-8113
The annual meeting of shareholders is currently scheduled to be held on Wednesday, April 25, 2012 at 7:00 p.m. at the Carlisle Inn in Walnut Creek, Ohio.
CSB Bancorp, Inc. is required to file an annual report on Form 10-K annually with the Securities and Exchange Commission. Copies of the Form 10-K annual report and the Company’s quarterly reports may be obtained without charge by contacting:
Paula J. Meiler
Chief Financial Officer CSB Bancorp, Inc.
91 North Clay Street Millersburg, Ohio 44654
330-674 • 800 -9015 -654-9015
2011 Annual Report to Shareholders | CSB Bancorp, Inc. 57

58 2011 Annual Report to Shareholders | CSB Bancorp, Inc.

2011 Annual Report to Shareholders | CSB Bancorp, Inc. 59
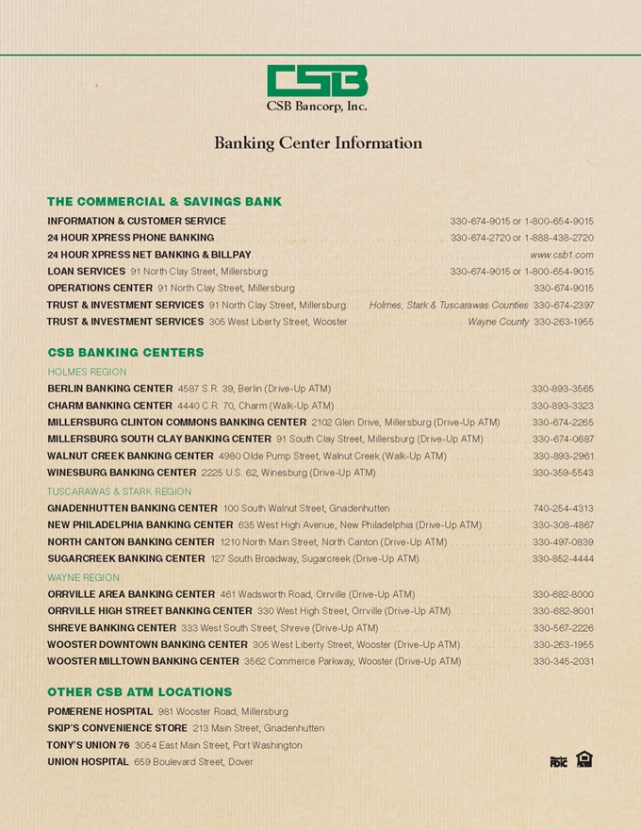
CSB Bancorp, Inc.
Banking Center Information
THE COMMERCIAL & SAVINGS BANK
INFORMATION & CUSTOMER SERVICE 330-674-9015 or 1-800-654-9015
24 HOUR XPRESS PHONE BANKING 330-674-2720 or 1-888-438-2720
24 HOUR XPRESS NET BANKING & BILLPAY www.csb1.com
LOAN SERVICES 91 North Clay Street, Millersburg 330-674-9015 or 1-800-654-9015
OPERATIONS CENTER 91 North Clay Street, Millersburg 330-674-9015
TRUST & INVESTMENT SERVICES 91 North Clay Street, Millersburg. Holmes, Stark & Tuscarawas Counties 330-674-2397
TRUST & INVESTMENT SERVICES 305 West Liberty Street, Wooster Wayne County 330-263-1955
CSB BANKING CENTERS
HOLMES REGION
BERLIN BANKING CENTER 4587 S.R. 39, Berlin (Drive-Up ATM) 330-893-3565
CHARM BANKING CENTER 4440 C.R. 70, Charm (Walk-Up ATM) 330-893-3323
MILLERSBURGCLINTON COMMONS BANKING CENTER 2102 Glen Drive, Millersburg (Drive-Up ATM) 330-674-2265
MILLERSBURG SOUTH CLAY BANKING CENTER 91 South Clay Street, Millersburg (Drive-Up ATM) 330-674-0687
WALNUT CREEK BANKING CENTER 4980 Olde Pump Street, Walnut Creek (Walk-Up ATM) 330-893-2961
WINESBURG BANKING CENTER 2225 U.S. 62, Winesburg (Drive-Up ATM) 330-359-5543
TUSCARAWAS & STARK REGION
GNADENHUTTEN BANKING CENTER 100 South Walnut Street, Gnadenhutten 740-254-4313
NEW PHILADELPHIA BANKING CENTER 635 West High Avenue, New Philadelphia (Drive-Up ATM) 330-308-4867
NORTH CANTON BANKING CENTER 1210 North Main Street, North Canton (Drive-Up ATM) 330-497-0839
SUGARCREEK BANKING CENTER 127 South Broadway, Sugarcreek (Drive-Up ATM) 330-852-4444
WAYNE REGION
ORRVILLE AREA BANKING CENTER 461 Wadsworth Road, Orrville (Drive-Up ATM) 330-682-8000
ORRVILLE HIGH STREET BANKING CENTER 330 West High Street, Orrville (Drive-Up ATM) 330-682-8001
SHREVE BANKING CENTER 333 West South Street, Shreve (Drive-Up ATM) 330-567-2226
WOOSTER DOWNTOWN BANKING CENTER 305 West Liberty Street, Wooster (Drive-Up ATM) 330-263-1955
WOOSTER MILLTOWN BANKING CENTER 3562 Commerce Parkway, Wooster (Drive-Up ATM) 330-345-2031
OTHER CSB ATM LOCATIONS
POMERENE HOSPITAL 981 Wooster Road, Millersburg
SKIP’S CONVENIENCE STORE 213 Main Street, Gnadenhutten
TONY’S UNION 76 3054 East Main Street, Port Washington UNION HOSPITAL 659 Boulevard Street, Dover