Orbital Corporation Limited (OBTEF) Inactive
Filed: 25 Aug 11, 12:00am
UNITED STATES
SECURITIES AND EXCHANGE COMMISSION
Washington, D.C. 20549
FORM 6-K
REPORT OF FOREIGN PRIVATE ISSUER
PURSUANT TO RULE 13a-16 OR 15d-16
UNDER THE SECURITIES EXCHANGE ACT OF 1934
For the month of August, 2011
Commission File Number 1-10936
Orbital Corporation Limited
(Translation of registrant’s name into English)
4 Whipple Street Balcatta WA 6021
(Address of principal executive office)
Indicate by check mark whether the registrant files or will file annual reports under cover of Form 20-F or Form 40-F.
Form 20-F x. Form 40-F ¨
Indicate by check mark if the registrant is submitting the Form 6-K in paper as permitted by Regulation S-T Rule 101(b)(l): ¨
Note: Regulation S-T Rule 10l(b)(1) only permits the submission in paper of a Form 6-K if submitted solely to provide an attached annual report to security holders.
Indicate by check mark if the registrant is submitting the Form 6-K in paper as permitted by Regulation S-T Rule 101(b)(7): ¨
Note: Regulation S-T Rule 101(b)(7) only permits the submission in paper of a Form 6-K if submitted to furnish a report or other document that the registrant foreign private issuer must furnish and make public under the laws of the jurisdiction in which the registrant is incorporated, domiciled or legally organized (the registrant’s “home country”), or under the rules of the home country exchange on which the registrant’s securities are traded, as long as the report or other document is not a press release, is not required to be and has not been distributed to the registrant’s security holders, and, if discussing a material event, has already been the subject of a Form 6-K submission or other Commission filing on EDGAR.
Indicate by check mark whether the registrant by furnishing the information contained in this Form is also thereby furnishing the information to the Commission pursuant to Rule 12g3-2(b) under the Securities Exchange Act of 1934. Yes ¨ No ¨
If “Yes” is marked, indicate below the file number assigned to the registrant in connection with Rule 12g3-2(b): 82- .
APPENDIX 4E
Preliminary Final Report
Orbital Corporation Limited
ABN 32 009 344 058
Financial year ended 30 June 2011
Results for announcement to the market
| A$’000 | A$’000 | |||||||||||||||
Total revenue | DOWN | (627 | ) | -4 | % | to | 16,638 | |||||||||
Net profit from ordinary activities after tax attributable to members | DOWN | (2,753 | ) | -61 | % | to | 1,763 | |||||||||
Net profit attributable to members | DOWN | (2,753 | ) | -61 | % | to | 1,763 | |||||||||
| 2011 | 2010 | |||||||||||||||
Net tangible assets per share (cents) | 35.70 | 39.99 | ||||||||||||||
There is no proposal to pay dividends for the year ended 30 june 2011
Commentary on results for the period
The Commentary on the results for the period is contained in the press release dated 24 August 2011 accompanying this statement.
Annual Meeting
The annual meeting will be held as follows:
Place: | Rydges Hotel Corner Hay and King Streets Perth Western Australia | |
Date: | Wednesday 26 October 2011 | |
Time: | 10.00 am | |
Approximate date the annual report will be available: 23 September 2011
Audit
This report is based on accounts which have been audited. (see attached Annual Report)

ABN 32 009 344 058
ANNUAL REPORT
30 JUNE 2011
DIRECTORS’ REPORT FOR THE YEAR ENDED 30 JUNE 2011
The Directors present their report together with the financial report of Orbital Corporation Limited (the Company or Orbital) and of the Group, being the Company, its subsidiaries and the Group’s interest in its associates for the year ended 30 June 2011 and the auditors’ report thereon.
Reference | Contents of Directors’ Report | Page | ||||||||
| 1. | Directors | 2 | ||||||||
| 2. | Company Secretary | 3 | ||||||||
| 3. | Principal Activities | 3 | ||||||||
| 4. | Consolidated Result | 3 | ||||||||
| 5. | Directors’ Meetings | 3 | ||||||||
| 6. | Directors’ Interests | 3 | ||||||||
| 7. | Operating and Financial Review | 4 | ||||||||
| 8. | Dividends | 9 | ||||||||
| 9. | State of Affairs | 9 | ||||||||
| 10. | Events Subsequent to Balance Date | 9 | ||||||||
| 11. | Likely Developments and Expected Results | 9 | ||||||||
| 12. | Share Options | 9 | ||||||||
| 13. | Indemnification and Insurance of Officers | 10 | ||||||||
| 14. | Non-Audit Services | 10 | ||||||||
| 15. | Lead Auditor’s Independence Declaration | 10 | ||||||||
| 16. | Rounding Off | 10 | ||||||||
| 17. | Remuneration Report | 11 | ||||||||
1
DIRECTORS’ REPORT FOR THE YEAR ENDED 30 JUNE 2011
| 1. | DIRECTORS |
The Directors of the Company at any time during or since the end of the financial year are:
Mr William Peter Day,LLB (Hons), MBA, FCPA, FCA, GAICD
Chairman, Independent Non-Executive Director
Joined the Board and appointed Chairman in August 2007. Mr Day retired as Chief Financial Officer of the global packaging group Amcor in 2007. He has a diversified background in finance and general management in mining, manufacturing, food and financial services industries.
He has held senior executive and director positions with Bonlac Foods, Rio Tinto, CRA and Comalco including Chief Financial Officer at Commonwealth Aluminum Corporation (USA) and Managing Director, CRA Business Services in Australia. He is a former Chairman of the Australian Accounting Standards Board, and was Deputy Chairman of the Australian Securities & Investments Commission.
Mr Day is a member of the Company’s Audit Committee and the Company’s Human Resources, Remuneration and Nomination Committee.
Mr Day is a non-executive director of Ansell Limited (appointed 20 August 2007), SAI Global Limited (appointed 15 August 2008) and Centro Retail Trust Limited (also Chairman appointed 01 October 2009). He is also involved in a number of public interest activities.
Mr Terry Dewayne Stinson, BBA (magna cum laude)
Managing Director and Chief Executive Officer
Joined the Board in June 2008. Mr Stinson has been a senior executive with Siemens VDO, Europe’s largest engineering conglomerate (recently purchased by Continental Corporation), with direct responsibility for sales in excess of US$300 million per annum in their Gasoline Systems, Fuel Systems and Fuel Components operations in the United States, Germany, Italy, China and support in many others. Mr Stinson has also served as a representative Director for Siemens VDO on the Synerject Board.
Prior to that, he held the position of VP Manufacturing for Outboard Marine Corporation, a privately held US$1 billion multinational outboard marine propulsion and boat company and executive positions with Synerject and Mercury Marine.
Mr Stinson was appointed a Member of the Australian Industry Innovation Council (AIIC) in 2009 and is Chairman of Sprint Gas (Aust) Pty Ltd.
Dr Mervyn Thomas Jones,B.E(Hons), Ph.D, DipBusStuds, CEng (UK), FIChemE (UK), FAICD, MIoD (NZ)
Independent Non-Executive Director
Joined the Board in March 2008. Dr Jones has more than 40 years experience as a consulting engineer and as a senior executive. He has specific expertise in the development and management of organic business growth in the Asia Pacific region, as well as acquisition experience in both Australia and China.
Dr Jones chairs the Company’s Audit Committee (since 28 February 2011) and is also a member of the Company’s Human Resources, Remuneration and Nomination Committee (Chairman until 28 February 2011).
Dr Jones is also a non-executive director of Pacific Environment Limited (appointed 3 July 2009, appointed Chairman 16 February 2010).
Dr Vijoleta Braach-Maksvytis,BSc (Hons), Ph.D, MAICD
Independent Non-Executive Director
Joined the Board in March 2008. Dr Braach-Maksvytis is an innovation strategist with more than 20 years experience in organisational change, formation of cross-sectoral and global partnerships, the commercialisation of technology, and intellectual property strategy. Previous roles include Head of the Office of the Chief Scientist of Australia, Science Executive and Director Global Development for CSIRO, and most recently, Deputy Vice Chancellor Innovation and Development at the University of Melbourne, and is currently an advisor in the area of social innovation.
Dr Braach-Maksvytis pioneered nanotechnology in Australia and holds over 20 patents in the field. Dr Braach-Maksvytis was a Member of the Australian Federal Government’s Green Car Innovation Fund Committee and on the advisory board of the Intellectual Property Research Institute of Australia, and is a member of a number of other public interest boards.
Dr Braach-Maksvytis chairs the Company’s Human Resources, Remuneration and Nomination Committee (since 28 February 2011) and is also a member of the Company’s Audit Committee.
Dr Braach-Maksvytis is also a non-executive director of AWE Limited (appointed 7 October 2010).
Mr John Grahame Young,LLB, FTIA, TEP
Independent Non-Executive Director
Mr Young retired from the Board on 28 February 2011. Joined the Board in November 1985. Mr Young is a lawyer with more than 30 years experience in corporate, revenue and intellectual property law. He has been a director of Cape Bouvard Investments Pty Ltd since 1998.
Mr Young chaired the Company’s Audit Committee and was also a member of the Company’s Human Resources, Remuneration and Nomination Committee.
2
DIRECTORS’ REPORT FOR THE YEAR ENDED 30 JUNE 2011
| 2. | COMPANY SECRETARY |
Mr Ian G Veitch, B.Bus, GradDipACG, CA was appointed to the position of Company Secretary on 1 July 2009. He is a Chartered Accountant with over 17 years experience in corporate accounting and an Affiliate of Chartered Secretaries Australia.
| 3. | PRINCIPAL ACTIVITIES |
Orbital is an international developer of innovative technical solutions for a cleaner world. Orbital provides innovation, design, product development and operational improvement services to the world’s producers, suppliers, regulators and end users of engines and engine management systems for applications in motorcycles, marine and recreational vehicles, automobiles and trucks.
There were no significant changes in the nature of the activities of the Group during the year.
| 4. | CONSOLIDATED RESULT |
The consolidated profit after income tax for the year attributable to the members of Orbital was $1,763,084 (2010:$4,515,451 profit)
| 5. | DIRECTORS’ MEETINGS |
The number of Directors’ meetings (including meetings of the committees of Directors) and the number of meetings attended by each of the Directors of the Company during the financial year are shown below.
Director | Directors’ Meetings | Audit Committee Meetings | Human Resources, Remuneration & Nomination Committee Meetings | |||||||||||||||||||||
| No. of meetings attended | No. of meetings held* | No. of meetings attended | No. of meetings held* | No. of meetings attended | No. of meetings held* | |||||||||||||||||||
W P Day | 11 | 11 | 4 | 4 | 3 | 3 | ||||||||||||||||||
T D Stinson | 11 | 11 | — | — | — | — | ||||||||||||||||||
M T Jones | 11 | 11 | 4 | 4 | 3 | 3 | ||||||||||||||||||
V Braach-Maksvytis | 10 | 11 | 4 | 4 | 3 | 3 | ||||||||||||||||||
J G Young | 8 | 8 | 3 | 3 | 2 | 2 | ||||||||||||||||||
| * | number of meetings held during the time the director held office during the year. |
| 6. | DIRECTORS’ INTERESTS |
The relevant interest of each Director in the share capital of the Company shown in the Register of Directors’ Shareholdings as at the date of this report is as follows: -
Director | Ordinary Shares | ELTSP Rights | Performance Rights | |||||||||
W P Day | 10,000 | — | — | |||||||||
T D Stinson | 375,690 | 1,320,000 | 1,150,000 | |||||||||
M T Jones | 18,000 | — | — | |||||||||
V Braach-Maksvytis | — | — | — | |||||||||
|
|
|
|
|
| |||||||
| 403,690 | 1,320,000 | 1,150,000 | ||||||||||
3
DIRECTORS’ REPORT FOR THE YEAR ENDED 30 JUNE 2011
| 7. | OPERATING AND FINANCIAL REVIEW |
The headline financial results for Orbital for the year ended 30 June 2011 are shown below.
June 2011 $’000 | June 2010 $’000 | |||||||
Alternative Fuels | ||||||||
- Revenue | 5,847 | 6,203 | ||||||
- Contribution | (757 | ) | (1,727 | ) | ||||
|
|
|
| |||||
Consulting Services | ||||||||
- Revenue | 9,492 | 9,621 | ||||||
- Contribution | 161 | 1,031 | ||||||
|
|
|
| |||||
Licences & royalties | ||||||||
- Revenue | 1,081 | 1,199 | ||||||
- Contribution | 610 | 732 | ||||||
|
|
|
| |||||
Total Revenue | 16,420 | 17,023 | ||||||
Total Contribution | 14 | 36 | ||||||
|
|
|
| |||||
Synerject | ||||||||
| June 2011 | June 2010 | |||||||
| US$m | US$m | |||||||
- Revenue (100%)(1) | 120.8 | 90.4 | ||||||
|
|
|
| |||||
- Equity accounted profit | 3,233 | 1,874 | ||||||
Unallocated other income | 959 | 644 | ||||||
Unallocated other expenses | (2,809 | ) | (3,488 | ) | ||||
Foreign exchange gain/(loss) | 79 | (97 | ) | |||||
Finance costs (net) | (353 | ) | (513 | ) | ||||
Research and development | (1,158 | ) | (1,152 | ) | ||||
Business development costs* | (205 | ) | (595 | ) | ||||
Government grant on restructure of loan* | — | 7,695 | ||||||
Gain on sale of property* | 4,237 | — | ||||||
Write-off capitalised development costs* | (1,065 | ) | — | |||||
Provision for slow moving inventory* | (942 | ) | — | |||||
Terminations costs* | (417 | ) | (276 | ) | ||||
|
|
|
| |||||
Profit before tax | 1,573 | 4,128 | ||||||
Taxation | 190 | 388 | ||||||
|
|
|
| |||||
Profit after tax | 1,763 | 4,516 | ||||||
|
|
|
| |||||
Underlying profit/(loss) (excluding one off items*) | 155 | (2,308 | ) | |||||
|
|
|
| |||||
| (1) | As reported by Synerject LLC. |
Detailed comments on Orbital’s four business streams are as follows:
4
DIRECTORS’ REPORT FOR THE YEAR ENDED 30 JUNE 2011
| 7. | OPERATING AND FINANCIAL REVIEW (continued) |
Alternative Fuels
| June 2011 | June 2010 | |||||||
| $’000 | $’000 | |||||||
Revenue | 5,847 | 6,203 | ||||||
Contribution | (757 | ) | (1,727 | ) | ||||
|
|
|
| |||||
Write-off of capitalised development costs | (1,065 | ) | — | |||||
Provision for slow moving inventory | (942 | ) | — | |||||
|
|
|
| |||||
Segment result | (2,764 | ) | (1,727 | ) | ||||
|
|
|
| |||||
Alternative fuel system development is core to Orbital’s growth strategy. Long term projections for increased crude oil prices, together with sovereign fuel security and requirements to reduce vehicle emissions, drive this strategy. The USA has announced major developments and sponsorship for use of CNG (Compressed Natural Gas). In the Asia Pacific region, the size of the CNG vehicle fleet increased by almost 16% to 6.7 million vehicle, with a global increase of 11%. In Europe there is a push for increasing use of CNG and LPG (Liquid Petroleum Gas) with European Automotive manufacturer’s now offering product using both of these fuels. In the LNG (Liquid Natural Gas) application the “Blue Corridor” (key road transport routes with LNG readily available) is being developed in Continental Europe. Orbital is already active in this space and plans to grow in each of these markets.
Revenue decreased by approximately 6% compared to last year due to Ford ceasing production of the previous generation LPG Falcon at the end of September 2010. Revenue was partly compensated by increased aftermarket sales including contribution from Sprint Gas Australia (SGA) which was acquired at the end of May 2011. Gross margins improved due to the stronger Australian dollar compared to the Euro. Operational efficiencies have also been introduced reducing overheads resulting in an overall year on year improvement in contribution of $970,000.
In conjunction with the acquisition of SGA, the Orbital Autogas Systems operation was also reviewed. The contraction in the LPG aftermarket prompted a write-down of previously capitalised development costs for Liquid LPi aftermarket kits ($1,065,000). In addition it was decided to provide for slow moving Liquid LPi aftermarket inventory ($942,000). In total these non-cash adjustments amounted to $2,007,000.
Ford Australia has recently released their “EcoLPi” Ford Falcon vehicle range equipped with Orbital’s Liquid LPG systems (Liquid LPi). The response from the motoring press has been very positive. Liquid LPi technology solves issues of emissions compliance, cold start and reduced power compared with previous LPG systems. Most importantly, fuel cost savings are approximately $1,000 year based on current fuel costs for a typical Australian family vehicle.
Orbital’s Liquid LPi systems were also introduced on Holden Special Vehicles in late 2010, confirming that the systems can meet the needs of Australia’s most prestigious and highest performance cars.
In May 2011, Orbital acquired the business of SGA for an initial investment of $2,000,000. SGA is a major LPG distributor in Victoria, with a presence in most capital cities in Australia. SGA offers a full range of LPG systems for the aftermarket, and will be an outlet for Orbital’s Liquid LPi systems. SGA also enables an Orbital presence in Victoria which is the centre of Australia’s auto LPG markets and the home of Australia’s automotive manufacturing businesses.
Orbital strategically invested in the LPG aftermarket at a time when the Australian market was under pressure. The Australian LPG aftermarket contracted throughout the year (approximately 50%), driven initially by the relatively lower differential between the cost of petrol and LPG, and reduction in the Government installation subsidy. However, LPG continues to offer a lower cost, cleaner alternative to petrol. We acquired a company that has a lead market share position in Australia. Orbital’s initial investment is effectively net asset value and we retain the support of the long standing owners. This positions Orbital for future recovery in LPG markets.
Looking forward, Orbital is undertaking research and development in the next generation of alternative fuels systems; for example direct injection of alternative fuels. In the case of CNG, direct injection can reclaim some of the performance typically lost with manifold injection applications of CNG. Orbital continues to support direct injection CNG projects for international customers.
5
DIRECTORS’ REPORT FOR THE YEAR ENDED 30 JUNE 2011
| 7. | OPERATING AND FINANCIAL REVIEW (continued) |
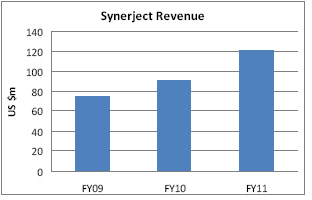
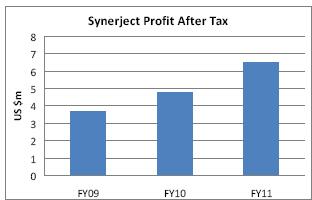
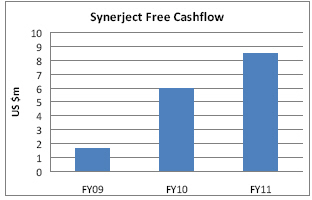
Synerject
| June 2011 | June 2010 | |||||||
| US$’000 | US$’000 | |||||||
Revenue (100%) | 120,834 | 90,375 | ||||||
Profit after tax (100%) | 6,500 | 4,744 | ||||||
Operating cash flow, after capex (100%) | 8,517 | 5,957 | ||||||
|
|
|
| |||||
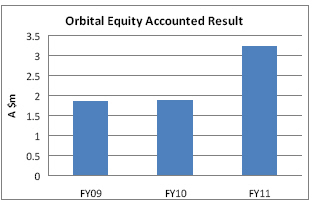
| A$’000 | A$’000 | |||||||
Orbital equity accounted contribution | 3,233 | 1,874 | ||||||
|
|
|
| |||||
Synerject, Orbital’s 42:58% Joint Venture Partnership with Continental AG, is a key supplier of engine management systems to the non-automotive market, with small engine applications for scooters through to high performance motorcycles, outboards and snowmobiles.
Synerject revenue increased by 34% to US$120,834,000 with a corresponding increase in profit after tax.
The marine and recreational markets are still impacted by the ongoing effect of the global financial crisis however Synerject achieved growth with investment in new products which have been launched throughout the year. In particular, Synerject has expanded in the supply of systems to the high end market including snowmobiles and high performance motorcycles.
Taiwan, with its stringent in-field emission requirements remains a major market for Synerject, with 2 out of the 3 major Taiwanese motorcycle/scooter manufactures utilizing Synerject product. China is the largest motorcycle market in the world and has recently introduced motorcycle Euro III emissions standards. This remains Synerject’s primary growth target.
Synerject has also recently introduced new product into the high volume utility and small engine markets.
Notwithstanding the revenue growth Synerject kept tight control of working capital, generating increased cash flow year on year. Synerject had net cash on hand at 30 June 2011 of US$2,291,000 (2010: US$3,316,000 net debt). Orbital received dividends of A$1,208,000 from Synerject during the year (2010: A$677,000).
The Australian dollar has strengthened against the US dollar over recent years adversely impacting the translated equity accounted share of Synerject’s profit (FY2011: A$416,000 impact).
Synerject is well positioned in all of its markets and has a number of new product launches planned in the next 12 months. Synerject has a strong balance sheet and the active support of both parents.
6
DIRECTORS’ REPORT FOR THE YEAR ENDED 30 JUNE 2011
| 7. | OPERATING AND FINANCIAL REVIEW (continued) |
Consulting Services
| June 2011 | June 2010 | |||||||
| $’000 | $’000 | |||||||
Revenue | 9,492 | 9,621 | ||||||
Contribution | 161 | 1,031 | ||||||
|
|
|
| |||||
Orbital Consulting Services (OCS) provides engineering consulting services, design, development and testing in the areas of engine design, engine combustion, fuel systems, engine management systems, alternative fuels, engine and vehicle testing and certification. Orbital provides fuel economy and emissions solutions to a wide variety of vehicle applications, from small displacement utility engines to large transportation and power generation applications.
OCS revenue of $9,492,000 was marginally lower than FY2010. A significant portion of OCS customers are overseas and the strong Australian dollar has meant that OCS services are less competitive globally and margins are under pressure. Orbital continues to win new programs on a consistent basis due to the unique technology and services offered by Orbital, and the order book is higher now than this time last year.
Orbital’s new dual fuel LNG system development continues working with Western Australia’s Mitchell Corporation (recently acquired by Toll Transport). The initial pilot level fleet of three LNG system fitted prime movers has expanded to nine. Mitchell has achieved significant fuel cost savings compared to diesel fuel only operation and improved reliability. Orbital’s success with the Mitchell LNG program has generated interest from the broader transport industry. To expand significantly in this segment will require industry buy-in, expanded fuelling infrastructure and additional investment. We see this as a growth area; however we will continue to have a measured approach to limit Orbital’s future financial exposure without limiting the upside in LNG for transport.
Major work for OCS is the development of spark ignition heavy fuel engines for UAS (unmanned aerial systems) applications. Orbital’s proprietary FlexDITM systems enable a petrol type engine to run on heavy fuels and continue to deliver high performance. Orbital goes beyond FlexDITM offering engine design, development and prototype engine systems for various customer applications. We anticipate that this segment of our business will grow and strategically it is complementary to Orbital’s alternative fuels initiative.
The Changan program has been successfully completed, confirming the capability of the Orbital FlexDITM fuel system, which was integrated into Changan’s new Intelligent Compound Combustion system (ICCS). Orbital and Changan hit the target of 20% reduction for vehicle fuel consumption as measured on the European Drive Cycle. The improved performance of the engine was also demonstrated in the vehicle assessment. Changan are satisfied with the results and displayed the engine concept at the Shanghai Auto show in April 2011.
Orbital’s heavy duty engine test cell continues to be in high demand, with the test facility working extended hours during the year to match customer demand plus supporting Orbital’s large engine R&D. The heavy duty test facility has proven to be a worthwhile investment.
Orbital’s core engineering group provides engineering fee for service to external customers and creates new products for the Orbital group. The support ranges from advanced engine R&D through to development of LPG aftermarket kits and support for customer application programs.
At 31 July, 2011 Orbital had an order book of $4,630,000 (30 June 2010: $3,400,000)
7
DIRECTORS’ REPORT FOR THE YEAR ENDED 30 JUNE 2011
| 7. | OPERATING AND FINANCIAL REVIEW (continued) |
Royalties and Licences
| June 2011 | June 2010 | |||||||
| $’000 | $’000 | |||||||
Revenue | 1,081 | 1,199 | ||||||
Contribution | 610 | 732 | ||||||
|
|
|
| |||||
Orbital earns royalties and licenses from production using its FlexDITM systems and technology. The royalty bearing products today are in the recreational and scooter/motorcycle markets.
Orbital’s key royalty earning products, the Mercury Marine Optimax and the Tohatsu TLDI, achieved a slight increase in volume in a relatively flat global outboard engine market. As Orbital’s royalties are predominantly earned in US Dollars the volume increase was however offset by the strength of the Australian Dollar.
The recreational market growth is expected to remain flat, especially in the key North American market, due to financial insecurity and the general careful use of discretionary income.
Other
In February 2011 Orbital completed the sale and leaseback of its land and buildings in Balcatta for $8,650,000. The sale generated a net profit of approximately $4,237,000 and provides cash reserves for strategic acquisitions such as Sprint Gas and organic growth opportunities such as the launch of the new Ford EcoLPi Falcon range of vehicles. Orbital has entered into a lease agreement to rent the facilities for 10 years (plus two 5 year options) for an initial rent of $745,000 per annum.
In May 2011 Orbital acquired 55% of the business of Sprint Gas Australia for $2,000,000. Sprint Gas, founded in 1978, imports, assembles and distributes automotive LPG conversion kits in the Australian LPG aftermarket. Sprint Gas generated sales of approximately $7,300,000 in FY11 through distribution centres in Victoria, Queensland and Western Australia. The Sprint Gas business will compliment the recently developed range of Liquid LPi kits distributed by Orbital Autogas Systems. Put and call options are in place for the vendors remaining 45% holding of Sprint Gas which Orbital records as contingent (future) consideration. Orbital consolidates 100% of Sprint Gas. This business will be reported in the Alternative Fuels segment going forward.
Research and development investment of $1,158,000 (2010: $1,152,000) related primarily to applications of Orbital’s FlexDITM system in conjunction with the Changan project in China.
During the year management irrevocably waived their right to cash bonuses which were awarded and accrued in FY2010, resulting in a credit to the Income Statement of $407,000 in this year.
Other overhead expenses were managed closely and a range of savings were achieved including corporate costs, travel and accommodation, communication, insurance and patent costs.
| June 2011 | June 2010 | |||||||
| $’000 | $’000 | |||||||
Operating cash flows | (1,792 | ) | (5,049 | ) | ||||
Synerject dividend | 1,208 | 677 | ||||||
|
|
|
| |||||
| (584 | ) | (4,372 | ) | |||||
Sale of Balcatta property | 8,557 | — | ||||||
Acquisition of Sprint Gas | (1,780 | ) | — | |||||
Other capital expenditures and development costs | (1,074 | ) | (2,478 | ) | ||||
Financing cash flow | (1,848 | ) | 336 | |||||
|
|
|
| |||||
Movement in cash/short term deposits | 3,271 | (6,514 | ) | |||||
|
|
|
| |||||
Net cash used in operating activities (including the receipt of dividends from Synerject) was $584,000; an improvement of $3,788,000 compared to FY2010. Cash utilised for acquisition of plant and equipment and development costs decreased to $1,074,000 (FY2010: $2,478,000) as Orbital completed the investment in Liquid LPi retrofit fits and the heavy duty engine test facility. Orbital repaid $1,848,000 loans (2010: $336,000 net drawdown). At 30 June 2011 Orbital had cash and short term deposits of $6,874,000 (June 2010: $3,608,000).
8
DIRECTORS’ REPORT FOR THE YEAR ENDED 30 JUNE 2011
| 7. | OPERATING AND FINANCIAL REVIEW (continued) |
Outlook
The Orbital Board targeted a return to underlying operating profits in FY2011. That has been achieved.
Year over year, changes in the exchange rate and markets impacted profitability. The strong Australian dollar has made our engineering services less competitive for overseas customers and the translation of royalty revenue and Orbital’s share of Synerject’s results were both negatively impacted. The launch of the Ford EcoLPi Falcon range was delayed which meant that OAGS sales of the newly developed Liquid LPi system to Ford were negligible in FY2011. The Australian LPG retrofit market is at record lows impacting the launch of the recently developed LLi retrofit kits.
Notwithstanding the impacts to the operating environment a $2,463,000 improvement in underlying operating result was achieved through cost reduction and efficiencies and the continuing growth of revenue and profits of Synerject.
Continued delivery on our strategy and the investments to date provides a solid foundation for targeted growth in the coming year:
| • | Ford has now launched the EcoLPi Falcon which is receiving excellent media coverage and positive feedback from the market. |
| • | Synerject has launched a number of new products in FY2011 and plans further product launches in FY2012. |
| • | Sprint Gas was acquired on 27th May 2011 and will contribute full year earnings in FY2012. Sprint Gas revenue was approximately $7,000,000 in FY2011. |
| • | OAGS has now developed approximately 50 Liquid LPi aftermarket kits and trained a national network of installers. OAGS will also distribute through Sprint Gas’s long established distribution channels. |
| • | Orbital’s UAS engine systems initiative is gaining momentum and FlexDITM provides Orbital with a unique position in this market. |
Orbital expects Royalties to be flat year on year and the Consulting Services business to provide some growth and a marginally improved contribution. As noted above the OCS order book at 31 July 2011 is $4,630,000.
The business efficiencies achieved in FY2011 will provide benefits in FY2012 with reduction in overheads (on a like for like basis). The integration of Sprint Gas will provide synergistic benefits for both Sprint Gas and OAGS.
As noted above the sale of property has provided a cash reserve for strategic growth. The Board will assess acquisitions opportunities as they arise and direct R&D investment in a number of alternative fuel application opportunities.
The Orbital Board looks forward to growth, improving our profitability and delivering sustainable operating cashflows.
| 8. | DIVIDENDS |
No dividend has been paid or proposed in respect of the current financial year.
| 9. | STATE OF AFFAIRS |
In May 2011, the Group acquired 55% of the voting shares of Sprint Gas (Aust) Pty Ltd, a new company incorporated to acquire the operating business of Sprint Gas, an Australian business specialising in the importation and wholesaling of LPG Fuel systems (refer note 38). There were no other significant changes in the state of affairs of the Group during the financial year, other than as reported elsewhere in the financial statements.
| 10. | EVENTS SUBSEQUENT TO BALANCE DATE |
On 11 August 2011 the Company announced that its American Depositary Shares will begin trading on the NYSE Amex on 25 August 2011.
There has not arisen in the interval between the end of the financial year and the date of this report any other item, transaction or event of a material and unusual nature likely, in the opinion of the directors of the Company, to affect significantly the operations of the Group, the results of those operations, or the state of affairs of the Group, in future years.
| 11. | LIKELY DEVELOPMENTS AND EXPECTED RESULTS |
Information as to the likely developments in the operations of the Group is set out in the review of operations above. Further information as to the likely developments in the operations of the Group and the expected results of those operations in subsequent financial years has not been included in this report because to include such information would be likely to result in unreasonable prejudice to the Group.
| 12. | SHARE OPTIONS |
The Company has no unissued shares under option at the date of this report.
9
DIRECTORS’ REPORT FOR THE YEAR ENDED 30 JUNE 2011
| 13. | INDEMNIFICATION AND INSURANCE OF OFFICERS |
To the extent permitted by law, the Company indemnifies every officer of the Company against any liability incurred by that person:
| (a) | in his or her capacity as an officer of the Company; and |
| (b) | to a person other than the Company or a related body corporate of the Company |
unless the liability arises out of conduct on the part of the officer which involves a lack of good faith.
During the year the Company paid a premium in respect of a contract insuring all Directors, Officers and employees of the Company (and/or any subsidiary companies of which it holds greater than 50% of the voting shares) against liabilities that may arise from their positions within the Company and its controlled entities, except where the liabilities arise out of conduct involving a lack of good faith. The Directors have not included details of the nature of the liabilities covered or the amount of the premium paid in respect of the insurance contract as disclosure is prohibited under the terms of the contract.
| 14. | NON-AUDIT SERVICES |
During the year Ernst & Young, the Company’s auditor, has performed certain other services in addition to their statutory duties.
The Board has considered the non-audit services provided during the year by the auditor and in accordance with advice provided by resolution of the Audit Committee is satisfied that the provision of those non-audit services by the auditor during the year is compatible with, and did not compromise, the auditor independence requirements of the Corporations Act 2001 for the following reasons:
| • | all non-audit services were subject to the corporate governance procedures adopted by the Company and have been reviewed by the Audit Committee to ensure that they do not impact the integrity and objectivity of the auditor; |
| • | the non-audit services do not undermine the general principles relating to auditor independence as set out in Professional Statement F1Professional Independence, as they did not involve reviewing or auditing the auditor’s own work, acting in a management or decision making capacity for the Company, acting as an advocate for the Company or jointly sharing risks and rewards. |
Details of the amounts paid to the auditor of the Company, Ernst & Young, and its related practices for audit and non-audit services provided during the year are shown in note 42 to the financial statements.
| 15. | LEAD AUDITOR’S INDEPENDENCE DECLARATION UNDER SECTION 307C OF THE CORPORATIONS ACT 2001 |
The directors received the following declaration from the auditor of Orbital Corporation Limited.
Auditor’s independence declaration to the Directors of Orbital Corporation Limited
In relation to our audit of the consolidated financial report of Orbital Corporation Limited and its controlled entities for the year ended 30 June 2011, to the best of my knowledge and belief, there have been no contraventions of the auditor independence requirements of theCorporations Act 2001or any applicable code of professional conduct.

Ernst & Young

G Lotter
Partner
Perth
23 August 2011
| 16. | ROUNDING OFF |
The Company is of a kind referred to in ASIC Class Order 98/100 dated 10 July 1998 and in accordance with that Class Order, amounts in the financial report and Directors’ Report have been rounded off to the nearest thousand dollars unless otherwise indicated.
10
DIRECTORS’ REPORT
REMUNERATION REPORT FOR THE YEAR ENDED 30 JUNE 2011
| 17. | REMUNERATION REPORT—AUDITED |
Principles of compensation
This Remuneration Report for the year ended 30 June 2011 outlines the director and executive remuneration arrangements of the Company and the Group in accordance with the requirements of theCorporations Act 2001and its Regulations. For the purposes of this report Key Management Personnel (KMP) are defined as those persons having authority and responsibility for planning, directing and controlling the major activities of the Company and the Group, directly or indirectly, including any director (whether executive or otherwise) of the parent company, and the senior executives of the Group and Company. Remuneration disclosures for two senior managers of the Group who are not KMP but are within the 5 highest paid executives of the Company and the Group is also presented.
The remuneration report is presented under the following sections:
| 1. | Individual key management personnel and other executives’ disclosures |
| 2. | Remuneration at a glance |
| 3. | Board oversight of remuneration |
| 4. | Non-executive director remuneration arrangements |
| 5. | Executive remuneration arrangements |
| 6. | Company performance and the link to remuneration |
| 7. | Executive contractual arrangements |
| 8. | Remuneration tables |
| 9. | Equity instruments disclosures |
1. INDIVIDUAL KEY MANAGEMENT PERSONNEL AND OTHER EXECUTIVES DISCLOSURES
Details of KMP and the highest paid executives of the Company and the Group are set out below.
Key management personnel
(i) Directors
W Peter Day Chairman (Non-executive)
Mervyn T Jones (Non-executive)
Vijoleta Braach-Maksvytis (Non-executive)
J Grahame Young (Non-executive) – retired 28 February 2011
Terry D Stinson (Executive)
(ii) Executives
Keith A Halliwell – Chief Financial Officer
B Anthony Fitzgerald – Director, Orbital Autogas Systems – resigned 1 July 2011
Geoff P Cathcart – Director, Consulting Services & Engineering
Other than the resignation of B Anthony Fitzgerald, there were no other changes to KMP after reporting date and before the date the financial report was authorised for issue.
Other executives
David R Worth – Director, Business Development, Orbital Consulting Services (OCS)
Ian G Veitch – Company Secretary
2. REMUNERATION AT A GLANCE
Orbital’s remuneration strategy is designed to attract, motivate and retain employees and non-executive directors by identifying and rewarding high performers and recognising the contribution of each employee to the continued growth and success of the Group.
There have been no material changes to the medium-term incentive (MTI) bonus plan for the 2011 financial year. As in previous years, incentive payments are based on 1) Profit after tax, 2) Operating Cash Flow, and 3) Pro-rata Consolidated Sales.
Long-term incentive (LTI) awards consisting of shares that vest based on attainment of pre-determined performance goals are awarded to select executives. For the 2011 financial year, the Company used relative total shareholder return and earnings per share as the performance measures for the share awards. During the 2011 financial year, the performance hurdles for the 2008 grant of shares were not met and no shares were vested.
As a result of the one for ten share consolidation conducted by the Company during the financial year, all of the LTI targets impacted by the number of shares outstanding have been reset to maintain their relativity.
The remuneration of non-executive directors of the Company consists only of directors’ fees and committee fees. Director fees and committee fees were reviewed and adjusted during the year. The Chairman, Mr Peter Day, sacrificed a portion of his directors fee in the 2011 financial year.
Remuneration strategy
Orbital’s remuneration strategy is designed to attract, motivate and retain employees and non-executive directors by identifying and rewarding high performers and recognising the contribution of each employee to the continued growth and success of the Group.
To this end, key objectives of the Company’s reward framework are to ensure that remuneration practices:
| • | Are aligned to the Group’s business strategy |
| • | Offer competitive remuneration benchmarked against the external market |
| • | Provide strong linkage between individual and Group performance and rewards |
| • | Align the interests of executives with shareholders through measuring total shareholder return (TSR) |
11
DIRECTORS’ REPORT
REMUNERATION REPORT FOR THE YEAR ENDED 30 JUNE 2011
3. BOARD OVERSIGHT OF REMUNERATION
Human Resources, Remuneration and Nomination Committee
The Human Resources, Remuneration and Nomination Committee reviews and makes recommendations to the Board on remuneration packages and policies applicable to directors, secretary and senior executives of the Company.
Data is obtained from independent surveys to ensure that compensation throughout the Group is set at market rates having regard to experience and performance. In this regard, formal performance appraisals are conducted at least annually for all employees. Compensation packages may include a mix of fixed compensation, performance-based compensation and equity-based compensation.
The Human Resources, Remuneration and Nomination Committee comprises three independent non-executive directors. Further information on the committee’s role, responsibilities and membership can be seen atwww.orbitalcorp.com.au.
Remuneration approval process
The Board approves the remuneration arrangements of the CEO and executives and all awards made under the long-term incentive (LTI) plan, following recommendations from the Human Resources, Remuneration and Nomination Committee. The Board also sets the aggregate remuneration of non-executive directors which is then subject to shareholder approval.
The Human Resources, Remuneration and Nomination Committee approves, having regard to the recommendations made by the CEO, the medium-term incentive (MTI) bonus plan.
Remuneration structure
In accordance with best practice corporate governance, the structure of non-executive directors and executive remuneration is separate and distinct.
4. NON-EXECUTIVE DIRECTOR REMUNERATION ARRANGEMENTS
Remuneration policy
The Board seeks to set aggregate remuneration at a level that provides the Company with the ability to attract and retain directors of the highest calibre, whilst incurring a cost that is acceptable to shareholders.
The amount of aggregate remuneration sought to be approved by shareholders and the fee structure is reviewed against fees paid to non-executive directors of comparable companies. The Board considers advice from external consultants when undertaking the review process.
The Company’s constitution and the ASX listing rules specify that the non-executive directors’ fee pool shall be determined from time to time by a general meeting. The latest determination was at the 2001 annual general meeting (AGM) held on 25 October 2001 when shareholders approved an aggregate fee pool of $400,000 per year.
The Board will not seek any increase for the non-executive director pool at the 2011 AGM.
Structure
The remuneration of non-executive directors consists of directors’ fees and committee fees. non-executive directors do not receive retirement benefits, nor do they participate in any incentive programs.
The Chairman of the Board receives a fee of $105,000 which also covers membership of Committees of the Board. The Chairman sacrificed a portion of his fee in the 2011 financial year. Each non-executive director receives a base fee of $55,000 for being a director of the Group. An additional fee of $3,500 is also paid for each Board committee on which a non-executive director sits or $8,000 if the director is the Chairman of a Board committee. The payment of additional fees for serving on a committee recognises the additional time commitment required by non-executive directors who serve on committees.
The remuneration of non-executive directors for the year ended 30 June 2011 and 30 June 2010 is detailed in Section 8 of this report.
5. EXECUTIVE REMUNERATION ARRANGEMENTS
Remuneration levels and mix
The Group aims to reward executives with a level and mix of remuneration commensurate with their position and responsibilities within the Group and aligned with market practice. The Group undertakes an annual remuneration review to determine the total remuneration positioning against the market.
The CEO’s target remuneration mix comprises 60% fixed remuneration, 20% target MTI opportunity and 20% LTI. The LTI value is the total accounting expense associated with the grant made during the financial year. Executives’ target remuneration mix ranges from 65-85% fixed remuneration, 8-20% target MTI opportunity and 7-15% LTI.
12
DIRECTORS’ REPORT
REMUNERATION REPORT FOR THE YEAR ENDED 30 JUNE 2011
| 5. | EXECUTIVE REMUNERATION ARRANGEMENTS (continued) |
Structure
In the 2011 financial year, the executive remuneration framework consisted of the following components:
| • | Fixed remuneration |
| • | Variable remuneration (MTI and LTI) |
The table below illustrates the structure of Orbital Corporation Limited’s executive remuneration arrangements:
Remuneration | Vehicle | Purpose | Link to performance | |||
| Fixed compensation | • Represented by total fixed remuneration (TFR). • Comprises base salary, Superannuation contributions and other benefits. | • Set with reference to role, market and experience. • Executives are given the opportunity to receive their fixed remuneration in a variety of forms including cash and fringe benefits such as motor vehicles. It is intended that the manner of payment chosen will be optimal for the recipient without creating undue cost for the Group. | • No link to company performance. | |||
| MTI component | • Paid in cash. | • Rewards executives for their contribution to achievement of Group outcomes. | • Profit after tax. • Pro-rata Consolidated Sales. • Operating Cash Flows. | |||
| LTI component | • Awards are made in the form of shares or performance rights. | • Rewards executives for their contribution to the creation of shareholder value over the longer term. | • Vesting of awards is dependent on Orbital Corporation Limited’s TSR performance relative to a peer group and its Earnings Per Share. |
Fixed compensation
Fixed compensation consists of base compensation (which is calculated on a total cost basis and includes any FBT charges related to employee benefits including motor vehicles), as well as employer contributions to superannuation funds.
Executive contracts of employment do not include any guaranteed base pay increases. TFR is reviewed annually by the remuneration committee. The process consists of a review of company, business unit and individual performance, relevant comparative remuneration internally and externally and, where appropriate, external advice independent of management.
The fixed component of executives’ remuneration is detailed in Section 8.
Variable remuneration — short-term incentive (STI)
Orbital does not provide a STI for KMP.
Variable remuneration — medium-term incentive (MTI)
The medium term incentive, replacing the short term incentive, was established in 2009 to incentivise executives to achieve stretch key performance indicators (KPI’s). The MTI plan is a target based plan rather than a time based plan.
Executive directors and senior executives may receive MTI bonuses based on the achievement of key performance indicators (“KPI’s”) related to the performance of the Group over the medium term. The three KPI’s chosen by the Human Resource, Remuneration and Nomination Committee in August 2009 relate to 1) Profit after tax, 2) Operating Cash Flow, and 3) Pro-rata Consolidated Sales. These three measures are chosen as they directly align the individual’s reward to the Group’s strategy and performance.
The KPI’s are summarised as follows:
Key Performance Indicator | Proportion of MTI award KPI applies to | Minimum KPI $’000 | Stretch KPI $’000 | |||||||||
Financial measure: | ||||||||||||
• Profit after tax | 33 | % | 100 | 9,000 | ||||||||
• Operating Cash Flow | 33 | % | 100 | 2,700 | ||||||||
• Pro-rata Consolidated Sales | 33 | % | 100,000 | 150,000 | ||||||||
Bonuses can only be paid if Orbital generates a profit after tax and also generates positive operating cash flow (before working capital movements). Abnormal one-off items influencing the KPIs may be excluded at the discretion of the Human Resources, Remuneration and Nomination Committee. No bonus will be paid unless the Board is satisfied that Orbital has sufficient cash reserves.
Bonuses are awarded when a target is achieved which is higher than that which has already been achieved and rewarded. The MTI earned accumulates over time as targets are achieved with any incremental MTI earned paid annually.
The total potential MTI available is set at a level so as to provide sufficient incentive to executives to achieve the operational targets and such that the cost to the Group is reasonable in the circumstances.
13
DIRECTORS’ REPORT
REMUNERATION REPORT FOR THE YEAR ENDED 30 JUNE 2011
| 5. | EXECUTIVE REMUNERATION ARRANGEMENTS (continued) |
Variable remuneration — medium-term incentive (MTI)(continued)
The annual MTI payments for executives are subject to the approval of the Human Resources, Remuneration and Nomination Committee on an annual basis, after consideration of performance against KPIs. This process usually occurs within three months after the reporting date. Payments made are delivered as a cash bonus in the following reporting period.
MTI awards for 2010 and 2011 financial years
For the 2010 financial year, 100% of the MTI cash bonus of $406,645 as previously accrued in that period vested to executives, however all participants in the MTI scheme voluntarily and irrevocably waived their right to their MTI cash bonuses. The Group recorded a reversal of the MTI cash bonus of $406,645 during the current financial year.
The Human Resources, Remuneration and Nomination Committee has considered the MTI bonus for the 2011 financial year. The MTI cash bonus available for the 2011 financial year is nil. This amount has been determined on the basis that 1) the Group’s Profit after tax (after removing abnormal items) target for the year ended 30 June 2011 has been met, however 2) Positive Operating Cash Flows for the year ended 30 June 2011 were not achieved, and 3) the Consolidated Pro-rata Sales of the Group have not reached the minimum threshold of $100,000,000.
During the year the MTI bonus plan was altered so that Positive Operating Cash Flow (excluding working capital movements) is now a pre-requisite for the payment of any MTIs.
Estimates of the minimum and maximum possible total value of the award over time is as follows:
Name | Position | Amount (Min - Max) | ||
Terry Stinson | Chief Executive Officer | 0 - $630,000 | ||
Keith Halliwell | Chief Financial Officer | 0 - $359,478 | ||
Tony Fitzgerald | Director, Orbital Autogas Systems | 0 - $332,013 | ||
Geoff Cathcart | Director, Consulting Services and Engineering | 0 - $269,325 | ||
David Worth | Director, Business Development, OCS | 0 - $166,971 | ||
Ian Veitch | Company Secretary | 0 - $72,114 |
The maximum bonus is only payable if the stretch targets on all three of the KPI’s are achieved. No bonus is awarded where performance falls below minimum thresholds.
Variable remuneration — long-term incentives (LTI)
LTI awards are made annually to executives in order to align remuneration with the creation of shareholder value over the long-term. As such, LTI awards are only made to executives and other key talent who have an impact on the Group’s performance against the relevant long-term performance measure.
Employee Share Plan No.1
Senior executives (together with all other eligible employees) are each offered shares in the Company, at no cost to the employees, to the value of $1,000 per annum under the terms of the Company’s Employee Share Plan. There are no performance conditions, because the plan is designed to align the interests of participating employees with those of shareholders. Directors do not participate in Share Plan No.1.
Executive Long Term Share Plan
Executives may also be offered rights in the Company’s Executive Long Term Share Plan under which offered shares will vest for no consideration subject to the satisfaction of performance conditions over a 3 year period or subject to Board discretion for other qualifying reasons. The performance conditions, which are based 50% on the relative ranking of the Total Shareholder Return (“TSR”) of the Company to a group of selected peers, and 50% on Earnings Per Share (EPS) (FY2009: based 100% on TSR), apply to determine the number of shares (if any) that vest to the Executives.
TSR is the percentage increase in a company’s share price plus reinvested dividends over a given period and reflects the increase in value delivered to shareholders over that period. The peer group to which the Company’s TSR will be compared will comprise the 50 smallest companies, other than resource companies and property and investment trust companies, within the S&P / ASX 300 Index. These companies have a similar market capitalisation to the Company. The TSR performance criterion was chosen as it is widely accepted as one of the best indicators of shareholder wealth creation as it includes share price growth, dividends and other capital adjustments. In addition, this criterion provides a readily obtained objective means of measuring the Group’s performance against its peer group.
The Company’s TSR ranking at the end of the Performance Period, when compared to the TSR of the peer group will determine the percentage of shares originally offered which will vest to the Executive.
The following table sets out the relevant percentages of shares offered which will vest based on various percentile rankings of the Company:
Company Performance (TSR Ranking) | % of offered shares issued to each executive | |
Up to the 50th percentile | 0% | |
At or above the 50th percentile but below the 75th percentile | 50% to 99% (on a straight line basis) | |
At or above the 75th percentile but below the 90th percentile | 100% | |
At or above the 90th percentile | 125% |
No shares will be granted under the FY2009 offer unless the Company’s TSR is at or above the 50th percentile.
14
DIRECTORS’ REPORT
REMUNERATION REPORT FOR THE YEAR ENDED 30 JUNE 2011
| 5. | EXECUTIVE REMUNERATION ARRANGEMENTS (continued) |
Variable remuneration — long-term incentives (LTI) (continued)
No shares will be granted under the FY2011 and FY2010 offers unless the Company’s TSR is at or above the 50th percentile or the EPS for the years ended 30 June 2012 and 30 June 2013 is at or above 15 and 11 cents per share, respectively.
TSR Performance targets under the LTI offered in FY2008 were not met in FY2011 and as a result nil (2010: 911,400) shares were issued to KMPs.
Executive Long Term Share Plan (continued)
At the Company’s Annual General Meeting in October 2010, shareholders approved the above plan in relation to the ongoing remuneration of the Executive Director.
Performance Rights Plan
The Company also introduced a Performance Rights Plan in 2009 as part of the employment contact of Mr T D Stinson. The Performance Rights Plan was approved by shareholders in October 2008. The Board has no present intention to utilise the Performance Rights Plan for any other senior executives.
Under the Performance Rights Plan, performance rights will only be issued if the terms and conditions detailed below are satisfied.
A performance right is a right to acquire one fully paid ordinary share in the Company. Until they are exercised, performance rights:
| (a) | do not give the holder a legal or beneficial interest in shares of the Company; and |
| (b) | do not enable participating executives to receive dividends, rights on winding up, voting rights or other shareholder benefits. |
Performance rights issued under the Performance Rights Plan will be exercisable if:
| (a) | a performance hurdle is met over the periods specified by the Board; or |
| (b) | the Board allows early exercise on cessation of employment; or |
| (c) | it is determined by the Board in light of specific circumstances. |
The terms and conditions of the offer of Performance Rights made during the year ended 30 June 2009 are as follows:
| (a) | Mr T D Stinson will be awarded 1,150,000 performance rights; |
| (b) | the grant of performance rights will be in seven tranches, each tranche with a different specified share price target as set out below: |
Tranche | Number of performance rights | Share price target | ||||||
1 | 200,000 | $ | 2.50 | |||||
2 | 200,000 | $ | 5.00 | |||||
3 | 200,000 | $ | 7.50 | |||||
4 | 200,000 | $ | 10.00 | |||||
5 | 125,000 | $ | 20.00 | |||||
6 | 125,000 | $ | 30.00 | |||||
7 | 100,000 | $ | 50.00 | |||||
The target share prices were chosen as they directly align the director’s reward with group strategy.
| (c) | the acquisition price and exercise price of the performance rights will be nil. |
| (d) | Mr T D Stinson will only be permitted to exercise a performance right if: |
| • | the Company attains the specified share price target (see table above) within eight years from the date of grant of the performance right; and |
| • | the specified share price target is also achieved at the end of two years from the date the target is first achieved (“Vesting Date”) based on the Company’s average closing share price over a 90 day period up to and including the Vesting Date; |
| (e) | If the specified share price target is either not achieved within eight years from the date of grant, or if so achieved, not also achieved at the end of the Vesting Date, the performance right will lapse. |
No performance rights were granted during the year ended 30 June 2011.
Termination and change of control provisions
Where a participant ceases employment prior to the vesting of their award, the unvested shares are forfeited unless the Board applies its discretion to allow vesting at or post cessation of employment in appropriate circumstances.
In the event of a change of control of the Group, the performance period end date will generally be brought forward to the date of the change of control and awards will vest subject to performance over this shortened period, subject to ultimate Board discretion.
LTI awards for 2011 financial year
Shares were granted under the Employee Share Plan No.1 to a number of executives on 17 January 2011. No Shares were granted under the Executive Long Term Share Plan or the Performance Rights Plan during the 2011 financial year.
Details in respect of the award are provided in Section 9.
15
DIRECTORS’ REPORT
REMUNERATION REPORT FOR THE YEAR ENDED 30 JUNE 2011
| 6. | COMPANY PERFORMANCE AND THE LINK TO REMUNERATION |
Company performance and its link to medium-term incentives
Performance linked compensation includes both medium-term and long-term incentives and is designed to reward key management personnel for meeting or exceeding their financial and personal objectives. The medium-term incentive (MTI), which has replaced the short term incentive, is an “at risk” bonus provided in the form of cash, while the long-term incentive (LTI) is provided as ordinary shares of Orbital Corporation Limited under the rules of the various Share Plans.
In considering the Group’s performance and benefits for shareholders wealth the Human Resources, Remuneration and Nomination Committee has regard to the following indices in respect of the current financial year and the previous four financial years.
Profit after tax, Pro-rata Consolidated Sales and Operating Cash Flows are considered in setting the MTI as they are considered important medium term performance targets.
Company performance for the current year, the last 4 years and KPI targets are as follows:
| 2007 $’000 | 2008 $’000 | 2009 $’000 | 2010 $’000 | 2011 $’000 | Minimum KPI $’000 | Stretch KPI $’000 | ||||||||||||||||||||||
Profit after tax | 1,333 | 469 | (2,451 | ) | 4,516 | 1,763 | positive | 9,000 | ||||||||||||||||||||
Operating Cash Flow | (182 | ) | 73 | (856 | ) | (4,372 | ) | (584 | ) | positive | 2,700 | |||||||||||||||||
Pro-rata Consolidated Sales | 65,004 | 59,875 | 63,867 | 61,081 | 65,889 | 100,000 | 150,000 | |||||||||||||||||||||
Operating Cash Flow (before working capital movements)* | (250 | ) | 901 | (2,372 | ) | (2,934 | ) | (833 | ) | positive | Not applicable | |||||||||||||||||
| * | A positive operating cash flow (before working capital movements) must be achieved as a pre-condition for the payment of any MTI. |
Company performance and its link to long-term incentives
The performance measure which drives LTI vesting is the Company’s TSR performance relative to the companies within its peer group and earnings per share (EPS). The table below show the performance of the Group as measured by the Group’s total shareholder return (TSR) to the median of the TSR for peer group and also the Group’s earnings per share for the past five years (including the current period) to 30 June 2011. The earnings per share values in the table below have been adjusted to reflect the share consolidation undertaken during the reporting period.
Company performance for the current year and last 4 years is as follows:
| 2007 | 2008 | 2009 | 2010 | 2011 | 2012 Minimum | 2013 Minimum | ||||||||||||||||||||||
TSR ranking (percentile) | * | 76th | 70th | 56th | * | 50th | 50th | |||||||||||||||||||||
Earnings per share (cents) | 3.00 | 1.00 | (5.10 | ) | 9.39 | 3.65 | 15.00 | 11.00 | ||||||||||||||||||||
| * | The Company did not measure its TSR ranking in 2007 or 2011 as the Board determined that Orbital’s TSR would be below the median TSR of the peer group. |
As a result of the Company’s performance over the last five years, LTIs offered during 2005, 2006 and 2007 were fully vested in financial year 2008 and partially vested in financial years 2009 and 2010 respectively. The performance target for the LTIs offered in 2008 were not met during the financial year 2011 and as such no shares were vested.
16
DIRECTORS’ REPORT
REMUNERATION REPORT FOR THE YEAR ENDED 30 JUNE 2011
| 7. | EXECUTIVE CONTRACTUAL ARRANGEMENTS |
Remuneration arrangements for KMP are formalised in employment agreements. Details of these contracts are provided below.
The CEO, Mr. Stinson, is employed under a rolling contract.
Under the terms of the present contract as disclosed to the ASX on 14 September 2007:
| • | The CEO receives fixed remuneration of $350,000 per annum |
| • | The CEO’s target MTI opportunity per annum is 20% of annual TEC and his maximum MTI opportunity per annum is 60% of TEC |
| • | The CEO is eligible to participate in Orbital Corporation Limited’s LTI plan on terms determined by the Board, subject to receiving any required or appropriate shareholder approval |
The CEO’s termination provisions are as follows:
Notice Period | Payment in lieu of notice | Treatment of MTI on termination | Treatment of LTI on termination | Termination payments | ||||||
Employer initiated | 12 months | 12 months | Pro-rated for time and performance | Board discretion | None | |||||
| Termination for serious misconduct | None | None | Unvested awards forfeited | Unvested awards forfeited | None | |||||
| Employee- initiated termination | 3 months | 3 months | Unvested awards forfeited | Unvested awards forfeited subject to Board discretion | None | |||||
Other KMP
All other KMP have rolling contracts.
Standard KMP termination provisions are as follows:
Notice | Payment in lieu | Treatment of MTI | Treatment of LTI | Termination payments | ||||||
| Employer initiated termination | 1 months | 1 months | Pro-rated for time and performance | Board discretion | 4 weeks pay, plus 2 weeks pay for each completed year of service, plus for each completed year of service beyond 10, an additional 1/2 weeks pay, plus a pro-rata payment for each completed month of service in the final year. The maximum entitlement to termination pay is limited to 65 weeks pay. | |||||
| Termination for serious misconduct | None | None | Unvested awards forfeited | Unvested awards forfeited | None | |||||
| Employee - initiated termination | 1 months | 1 months | Unvested awards forfeited | Unvested awards forfeited subject to Board discretion | None | |||||
Payments applicable to outgoing executives
The following arrangements applied to outgoing executives in office during the 2011 financial year:
| • | Mr Fitzgerald received a termination payment of $288,241, in accordance with the Company’s policy on termination payments, after over 29 years of service to the Group; |
| • | In accordance with the terms of the Company’s Executive Long Term Share Plan, Mr Fitzgerald’s Executive Long Term Share Plan rights that had not reached their vesting date were forfeited. |
Other than the termination of Mr Fitzgerald, there were no changes to the KMP of the Group for the year ended 30 June 2011 or subsequent to 30 June 2011.
17
DIRECTORS’ REPORT
REMUNERATION REPORT FOR THE YEAR ENDED 30 JUNE 2011
| 8 | DIRECTORS’ AND EXECUTIVE OFFICERS’ REMUNERATION COMPANY AND GROUP |
Details of the nature and amount of each major element of remuneration of each director of the Company and each of the five named Company executives, and relevant group executives who receive the highest remuneration are:
| Short Term | Post Employment | Share Based Payments | Termination Payments $ | Total $ | Proportion of remuneration performance related % (g) | |||||||||||||||||||||||||||||||||||
| Year | Salary and Director’s Fees $ | Cash Bonuses $ (a) | Total $ | Employer Superannuation Contributions $ | Employee Share Plans $ (b)(c) | Performance Rights Plan $ (d) | ||||||||||||||||||||||||||||||||||
Non-executive Directors | ||||||||||||||||||||||||||||||||||||||||
W Peter Day | 2011 | 63,075 | — | 63,075 | 5,676 | — | — | — | 68,751 | — | ||||||||||||||||||||||||||||||
Chairman (Non-executive) | 2010 | 96,376 | — | 96,376 | 8,674 | — | — | — | 105,050 | — | ||||||||||||||||||||||||||||||
Mervyn T Jones | 2011 | 60,827 | — | 60,827 | 5,475 | — | — | — | 66,302 | — | ||||||||||||||||||||||||||||||
Director (Non-executive) | 2010 | 55,092 | — | 55,092 | 4,958 | — | — | — | 60,050 | — | ||||||||||||||||||||||||||||||
Vijoleta Braach-Maksvytis | 2011 | 57,955 | — | 57,955 | 5,216 | — | — | — | 63,171 | — | ||||||||||||||||||||||||||||||
Director (Non-executive) | 2010 | 50,505 | — | 50,505 | 4,545 | — | — | — | 55,050 | — | ||||||||||||||||||||||||||||||
J Grahame Young | 2011 | 41,949 | — | 41,949 | 3,775 | — | — | — | 45,724 | — | ||||||||||||||||||||||||||||||
Director (Non-executive) | 2010 | 52,358 | — | 52,358 | 4,712 | — | — | — | 57,070 | — | ||||||||||||||||||||||||||||||
| 2011 | 223,806 | — | 223,806 | 20,142 | — | — | — | 243,948 | — | |||||||||||||||||||||||||||||||
Total Consolidated, all non-executive directors | 2010 | 254,331 | — | 254,331 | 22,889 | — | — | — | 277,220 | — | ||||||||||||||||||||||||||||||
Executive Director | ||||||||||||||||||||||||||||||||||||||||
Terry D Stinson | 2011 | 322,892 | (140,000 | ) | 182,892 | 36,144 | 113,800 | 49,283 | — | 382,119 | 31.2 | % | ||||||||||||||||||||||||||||
Director and Chief Executive Officer | 2010 | 321,101 | 140,000 | 461,101 | 38,532 | 58,383 | 49,283 | — | 607,299 | 40.8 | % | |||||||||||||||||||||||||||||
Total Consolidated, all specified directors |
| 2011 2010 |
|
| 546,698 575,432 |
|
| (140,000 140,000 | )
|
| 406,698 715,432 |
|
| 56,286 61,421 |
|
| 113,800 58,383 |
|
| 49,283 49,283 |
|
| — — |
|
| 626,067 884,519 |
|
| 21.3 28.0 | % % | ||||||||||
| Short Term | Post Employment | Share Based Payments | Termination Payments $ | Total $ | Proportion of remuneration performance related % (g) | |||||||||||||||||||||||||||||||||||
| Year | Salary and Director’s Fees $ | Cash Bonuses $ (a) | Total $ | Employer Superannuation Contributions $ | Employee Share Plans $ (b)(c) | Performance Rights Plan $ (d) | ||||||||||||||||||||||||||||||||||
Executives | ||||||||||||||||||||||||||||||||||||||||
Keith A Halliwell | 2011 | 256,694 | (79,884 | ) | 176,810 | 28,757 | 59,542 | — | — | 265,109 | 17.3 | % | ||||||||||||||||||||||||||||
Chief Financial Officer | 2010 | 245,701 | 79,884 | 325,585 | 27,439 | 46,982 | — | — | 400,006 | 31.7 | % | |||||||||||||||||||||||||||||
B Anthony Fitzgerald (e) | 2011 | 230,593 | (73,781 | ) | 156,812 | 27,671 | (41,647 | ) | — | 288,241 | 431,077 | -8.2 | % | |||||||||||||||||||||||||||
Director, Orbital Autogas Systems | 2010 | 225,629 | 73,781 | 299,410 | 27,076 | 39,917 | — | — | 366,403 | 31.0 | % | |||||||||||||||||||||||||||||
Geoff P Cathcart | 2011 | 196,340 | (59,850 | ) | 136,490 | 18,841 | 42,427 | — | — | 197,758 | 16.5 | % | ||||||||||||||||||||||||||||
Director, Consulting Services & Engineering | 2010 | 186,998 | 59,850 | 246,848 | 16,669 | 31,172 | — | — | 294,689 | 30.9 | % | |||||||||||||||||||||||||||||
Other executives | ||||||||||||||||||||||||||||||||||||||||
David R Worth (f) | 2011 | 174,288 | (37,105 | ) | 137,183 | 20,915 | 17,571 | — | — | 175,669 | 8.3 | % | ||||||||||||||||||||||||||||
Director, Business Development OCS | 2010 | 170,203 | 37,105 | 207,308 | 20,424 | 16,002 | — | — | 243,734 | 21.8 | % | |||||||||||||||||||||||||||||
Ian G Veitch (f) | 2011 | 155,268 | (16,025 | ) | 139,243 | 12,985 | 14,033 | — | — | 166,261 | 7.7 | % | ||||||||||||||||||||||||||||
Company Secretary | 2010 | 147,926 | 16,025 | 163,951 | 12,325 | 11,448 | — | — | 187,724 | 14.6 | % | |||||||||||||||||||||||||||||
Total Consolidated, all specified executives |
| 2011 2010 |
|
| 1,013,183 976,457 |
|
| (266,645 266,645 | )
|
| 746,538 1,243,102 |
|
| 109,169 103,933 |
|
| 91,926 145,521 |
|
| — — |
|
| 288,241 — |
|
| 1,235,874 1,492,556 |
|
| 6.1 27.6 | % % | ||||||||||
Notes in relation to the table of directors’ and executive officers remuneration
| (a) | Bonuses are those paid or accrued as payable in relation to the year reported. For the 2010 financial year, 100% of the MTI cash bonus of $406,645 as previously accrued in that period vested to executives, however all participants in the MTI scheme voluntarily and irrevocably waived their right to their MTI cash bonuses. The Group recorded a reversal of the MTI cash bonus of $406,645 during the current financial year. |
| (b) | The fair value of the Employee Share Plan #1 is based upon the market value (at offer date) of shares offered. |
| (c) | The fair value of the Executive Long Term Share plan (“ELTSP”) is calculated at the date of grant through utilisation of the assumptions underlying the Black-Scholes methodology to produce a Monte-Carlo simulation model and is allocated to each reporting period evenly over the period from grant date to vesting date. The value disclosed is the portion of the fair value of the rights recognised in this reporting period. In valuing the rights the market based hurdles that must be met before the executive long term share plan rights vest in the holder have been taken into account. |
18
DIRECTORS’ REPORT
REMUNERATION REPORT FOR THE YEAR ENDED 30 JUNE 2011
| 8. | DIRECTORS’ AND EXECUTIVE OFFICERS’ REMUNERATION COMPANY AND GROUP (continued) |
The following factors and assumptions were used in determining the fair value of TSR related rights issued under the ELTSP on grant date:
TSR related rights
Grant Date | Life | Fair Value per right | Exercise Price | Market Price of shares on grant date | Expected volatility | Risk free interest rate | ||||||||||||||||||
31-Aug-08 | 3 years | 58 cents | nil | 79 cents | 62.70 | % | 5.68 | % | ||||||||||||||||
31-Aug-09 | 3 years | 38 cents | nil | 55 cents | 65.00 | % | 5.03 | % | ||||||||||||||||
31-Aug-10 | 3 years | 33 cents | nil | 34 cents | 60.00 | % | 4.27 | % | ||||||||||||||||
The following factors and assumptions were used in determining the fair value of EPS related rights issued under the ELTSP on grant date:
EPS related rights
Grant Date | Life | Fair Value per right | Exercise Price | Market price of shares on grant date | ||||||||||||
31-Aug-09 | 3 years | 55 cents | nil | 55 cents | ||||||||||||
31-Aug-10 | 3 years | 34 cents | nil | 34 cents | ||||||||||||
The fair value of the EPS related rights is equal to the market price of shares on the grant date.
| (d) | The fair value of the Performance Rights is calculated at the date of grant through utilisation of the assumptions underlying the Black-Scholes methodology to produce a Monte-Carlo simulation model and allocated to each reporting period evenly over the period from grant date to vesting date. The value disclosed is the portion of the fair value of the performance rights recognised in this reporting period. In valuing the performance rights the hurdles that must be met before the executive long term share plan shares vest in the holder have been taken into account. |
Grant Date | Life | Fair Value per right | Target price | Market price of shares on grant date | Expected volatility | Risk free interest rate | ||||||||||||||||||
31-Aug-08 | 10 years | 47 cents | $ | 2.50 | 79 cents | 55.00 | % | 5.75 | % | |||||||||||||||
31-Aug-08 | 10 years | 35 cents | $ | 5.00 | 79 cents | 55.00 | % | 5.75 | % | |||||||||||||||
31-Aug-08 | 10 years | 28 cents | $ | 7.50 | 79 cents | 55.00 | % | 5.75 | % | |||||||||||||||
31-Aug-08 | 10 years | 23 cents | $ | 10.00 | 79 cents | 55.00 | % | 5.75 | % | |||||||||||||||
31-Aug-08 | 10 years | 13 cents | $ | 20.00 | 79 cents | 55.00 | % | 5.75 | % | |||||||||||||||
31-Aug-08 | 10 years | 9 cents | $ | 30.00 | 79 cents | 55.00 | % | 5.75 | % | |||||||||||||||
31-Aug-08 | 10 years | 5 cents | $ | 50.00 | 79 cents | 55.00 | % | 5.75 | % | |||||||||||||||
| (e) | Mr Fitzgerald ceased to be a KMP on 1 July 2011. |
| (f) | Mr Worth and Mr Veitch are included above as their remuneration is within the 5 highest paid executives not being directors or KMP. |
| (g) | The reversal of the cash bonus has been excluded from the calculation of proportion of remuneration performance related. |
| 9. | EQUITY INSTRUMENTS |
All shares refer to ordinary shares of Orbital Corporation Limited.
Analysis of Shares Offered as Compensation
Details of the shares offered under the LTI to each key management person and specified senior managers during the reporting period are as shown below. Please refer to footnote (b) below for the terms and conditions relating to the granting of the rights offered under the Executive Long Term Share Plan.
19
DIRECTORS’ REPORT
REMUNERATION REPORT FOR THE YEAR ENDED 30 JUNE 2011
| 9. | EQUITY INSTRUMENTS (continued) |
Analysis of Shares Offered as Compensation (continued)
| Employee Share Plan No. 1 | Executive Long Term Share Plan | Performance Rights Plan |
| |||||||||||||||||||||||||||||||||||||||||
| Number of shares issued | Share Price | Value (a) $ | Number of Rights Granted/ (Forfeited) | Value (b) $ | Number of Rights Vested | Number of Rights Granted | Value (c) $ | Number of Rights Vested | Number of Shares Vested | |||||||||||||||||||||||||||||||||||
Executive Director | ||||||||||||||||||||||||||||||||||||||||||||
T D Stinson | 2011 | — | — | — | 665,000 | 222,775 | — | — | — | — | 300,000 | |||||||||||||||||||||||||||||||||
| 2010 | — | — | — | 525,000 | 244,125 | — | — | — | — | — | ||||||||||||||||||||||||||||||||||
Executives | ||||||||||||||||||||||||||||||||||||||||||||
K A Halliwell | 2011 | 3,369 | $ | 0.2968 | 1,000 | 337,567 | 113,085 | — | — | — | — | 300,000 | ||||||||||||||||||||||||||||||||
| 2010 | 1,625 | $ | 0.6160 | 1,000 | 266,500 | 123,923 | 40,920 | — | — | — | ||||||||||||||||||||||||||||||||||
B A Fitzgerald | 2011 | 3,369 | $ | 0.2968 | 1,000 | (316,000 | ) | — | — | — | — | — | 200,000 | |||||||||||||||||||||||||||||||
| 2010 | 1,625 | $ | 0.6160 | 1,000 | 246,000 | 114,390 | 34,100 | — | — | — | ||||||||||||||||||||||||||||||||||
G P Cathcart | 2011 | 3,369 | $ | 0.2968 | 1,000 | 252,700 | 84,655 | — | — | — | — | 85,000 | ||||||||||||||||||||||||||||||||
| 2010 | 1,625 | $ | 0.6160 | 1,000 | 199,500 | 92,768 | 16,120 | — | — | — | ||||||||||||||||||||||||||||||||||
Other executives | ||||||||||||||||||||||||||||||||||||||||||||
DW Worth | 2011 | 3,369 | $ | 0.2968 | 1,000 | 88,033 | 29,492 | — | — | — | — | |||||||||||||||||||||||||||||||||
| 2010 | 1,625 | $ | 0.6160 | 1,000 | 69,500 | 32,318 | 14,880 | — | — | — | ||||||||||||||||||||||||||||||||||
IG Veitch | 2011 | 3,369 | $ | 0.2968 | 1,000 | 76,000 | 25,460 | — | — | — | — | |||||||||||||||||||||||||||||||||
| 2010 | 1,625 | $ | 0.6160 | 1,000 | 60,000 | 27,900 | 3,100 | — | — | — | ||||||||||||||||||||||||||||||||||
| (a) | The fair value of the employee share plan No. 1 based upon the market value (at offer date of 31 October 2010 and 31 October 2009 respectively) of shares offered. These awards are fully vested. |
| (b) | Represents the fair value of rights offered on 31 August 2010 and 31 August 2009 respectively using a Monte-Carlo simulation model. The vesting of the shares offered on 31 August 2010 is subject to the achievement of two performance conditions; a) 50% related to the Total Shareholder Return (“TSR”) of the Company compared to a peer group of selected companies over a three year period, and b) 50% related to the Group achieving earnings in excess of 11 cents per share for the year ending 30 June 2013. The vesting of the shares offered on 31 August 2009 is subject to the achievement of two performance conditions; a) 50% related to the Total Shareholder Return (“TSR”) of the Company compared to a peer group of selected companies over a three year period, and b) 50% related to the Group achieving earnings in excess of 15 cents per share for the year ending 30 June 2012. Performance conditions were met in respect of shares offered in August 2006 and shares in relation to that offer were vested at the expiration of the performance period during the 2010 financial year. |
| (c) | No performance rights vested during the years ended 30 June 2011 or 30 June 2010. |
| (d) | As a result of the one for ten share consolidation conducted on 20 October 2010 by the Company, all of the KPIs impacted by the number of shares outstanding have been reset by a multiple of 10 to maintain their relativity, whilst the number of rights outstanding for each offer has been divided by 10. The share consolidation did not change the time remaining to expiry of the rights outstanding or change the total fair value of the rights outstanding at the time of the Company undertaking the share consolidation. Refer to note 36 for details of number of awards outstanding and their new terms and conditions. The share price on the consolidation date was $0.27. |
End of Remuneration Report
Signed in accordance with a resolution of the Directors:
 |  | |
| W P DAY | T D STINSON | |
Director | Managing Director | |
Dated at Perth, Western Australia this 23rd day of August 2011.
20
CORPORATE GOVERNANCE STATEMENT
1. CORPORATE GOVERNANCE AT ORBITAL
The Board of Directors of Orbital Corporation Limited is responsible for the corporate governance of the Group. The Board guides and monitors the business and affairs of the Group on behalf of the shareholders by whom they are elected and to whom they are accountable. This statement reports on Orbital’s key governance principles and practices. These principles and practices are reviewed regularly and revised as appropriate to reflect changes in law and developments in corporate governance.
The Company, as a listed entity, must comply with theCorporations Act 2001 (Cwth) (Corporations Act), the Australian Securities Exchange (ASX) Listing Rules (ASX Listing Rules) and other Australian and international laws. The ASX Listing Rules requires the Company to report on the extent to which it has followed the Corporate Governance Recommendations contained in the ASX Corporate Governance Council’s (ASXCGC) second edition of its Corporate Governance Principles and Recommendations (August 2007). Orbital believes that, throughout the 2011 financial year and to the date of this report, it has complied with all the ASXCGC Recommendations.
Information on Orbital’s corporate governance framework is also provided in the Corporate Governance section of Orbital’s website (www.orbitalcorp.com.au)
2. BOARD OF DIRECTORS
2.1 Role of the Board
ASXCGC Recommendations 1.1, 1.3
The Board’s primary role is to protect and enhance long-term shareholder value by providing strategic guidance to the Group and effective oversight of management.
To fulfil this role, the Board is responsible for the overall corporate governance of the Group including formulating its strategic direction, approving and monitoring capital expenditure, setting remuneration, appointing, removing and creating succession policies for directors and senior executives, establishing and monitoring the achievement of management’s goals and ensuring the integrity of internal control and management information systems.
It is also responsible for approving and monitoring financial and other reporting. A copy of the Board’s Charter is available in the Corporate Governance section of Orbital’s website.
The Board has delegated responsibility for operation and administration of the Group to the Chief Executive Officer and executive management. Responsibilities are delineated by formal authority delegations.
The Board conducts an annual review of its processes to ensure that it is able to carry out its functions in the most effective manner.
2.2 Composition of the Board
ASXCGC Recommendations 2.1, 2.2, 2.3, 2.6
The names and qualifications of the directors of the Company in office at the date of this Report are detailed in the Directors’ Report on page 2.
The composition of the Board is determined using the following principles:
| • | A minimum of three directors, with a broad range of expertise; |
| • | An independent non-executive director as Chairman; |
| • | A majority of independent non-executive directors; and |
| • | The role of Chief Executive Officer (CEO) and Chairman should not be exercised by the same individual. |
An independent director is a non-executive director who:
| • | is not a substantial shareholder of the company or an officer of, or otherwise associated directly with, a substantial shareholder of the company; |
| • | within the last three years has not been employed in an executive capacity by the company or another group member, or been a director after ceasing to hold any such employment; |
| • | within the last three years has not been a principal of a professional adviser or a consultant to the company or another group member, or an employee materially associated with the service provided; |
| • | is not a material* supplier or customer of the company or other group member, or an officer of or otherwise associated directly or indirectly with a material supplier or customer; |
| • | has no material* contractual relationship with the company or another group member other than as a director of the company; |
| • | has not served on the board for a period which could, or could reasonably be perceived to, materially interfere with the director’s ability to act in the best interests of the company; and |
| • | is free from any interest and any business or other relationship which could, or could reasonably be perceived to, materially interfere with the director’s ability to act in the best interests of the company. |
| * | No non-executive director is a supplier to or customer of the Group, nor does any non-executive Director have a contractual relationship with the Group (other than as a director of the Company) and therefore the Board has not had to consider any materiality threshold. |
2.3 Conflicts of Interest
In accordance with the Corporations Act 2001 and the Company's constitution, directors must keep the Board advised, on an ongoing basis, of any interest that could potentially conflict with those of the Company. Where the Board believes that a significant conflict exists the director concerned must not be present at the meeting whilst the item is considered or vote on the matter. The Board has procedures in place to assist directors to disclose potential conflicts of interest.
21
CORPORATE GOVERNANCE STATEMENT
2.4 Board Succession Planning
ASXCGC Recommendation 2.6
The Board manages its succession planning with the assistance of the Human Resources, Remunerations and Nominations Committee. The Committee annually reviews the size, composition and diversity of the Board and the mix of existing and desired competencies across members and reports its conclusions to the Board. In conducting the review a skills matrix is used to enable the Committee to assess the skills and experience of each director and the combined capabilities of the Board.
Recognising the importance of Board renewal, the Committee takes each director’s tenure into consideration in its succession planning.
2.5 Directors’ Retirement and Re-election
ASXCGC Recommendation 2.6
Non-executive directors must retire at the third AGM following their election or most recent re-election. At least one non-executive director must stand for election at each AGM. Any director appointed to fill a vacancy since the date of the previous AGM must submit themselves to shareholders for election at the next AGM.
Board support for a director’s re-election is not automatic and is subject to satisfactory director performance.
2.6 Directors’ Appointment, Induction Training and Continuing Education
All new directors are required to sign and return a letter of appointment which sets out the key terms and conditions of their appointment, including duties, rights and responsibilities, the time commitment envisaged and the Board’s expectations regarding their involvement with committee work.
As part of the induction process, new directors are provided with detailed information about the nature of the Group’s business, current issues, group strategy, financial matters, policies and procedures and are given the opportunity to meet with management to obtain an insight into the Group’s business operations.
All directors are expected to maintain the skills required to discharge their obligations to the company. Directors are encouraged to undertake continuing professional education including industry seminars and approved education courses.
2.7 Board Access to Independent Professional Advice and Company Information
ASXCGC Recommendation 2.6
Each director has the right of access to all relevant Company information and to the Group’s executives and, subject to prior consultation with the Chairman, may seek independent professional advice from a suitably qualified adviser at the Group’s expense. The director must consult with an advisor suitably qualified in the relevant field, and obtain the Chairman’s approval of the fee payable for the advice before proceeding with the consultation. A copy of the advice received by the director is made available to all other members of the board.
2.8 Review of Board Performance
ASXCGC Recommendations 2.5, 2.6
The Human Resources, Remuneration and Nomination Committee is responsible for determining the process for evaluating Board performance. Evaluations are conducted by way of questionnaires appropriate in scope and content to effectively review:
| • | the performance of the Board and each of its committees against the requirements of their respective charters; and |
| • | the individual performance of the Chairman and each director. |
The performance of each director retiring at the next AGM is taken into account by the Board in determining whether or not the Board should support the re-election of the director.
2.9 Directors’ Remuneration
Details of remuneration paid to directors (executive and non-executive) are set out in the Remuneration Report on pages 18 to 19. The Remuneration Report also contains information on the Company’s policy for determining the nature and amount of remuneration for directors and senior executives and the relationship between the policy and company performance.
Shareholders will be invited to consider and approve the Remuneration Report at the 2011 AGM.
2.10 Board Meetings
The full Board currently holds six scheduled meetings each year, plus strategy meetings and any extraordinary meetings at such other times as may be necessary to address any specific significant matters that may arise.
The agenda for meetings is prepared in conjunction with the Chairman, Managing Director and Company Secretary. Standing items include the managing director’s report, financial reports, strategic matters, governance and compliance. Submissions are circulated in advance. Executives are regularly involved in board discussions and directors have other opportunities, including visits to operations, for contact with a wider group of employees.
22
CORPORATE GOVERNANCE STATEMENT
2.11 Company Secretary
Details of the Company Secretary are set out on page XX of the Directors’ Report. The appointment and removal of a Company Secretary is a matter for decision by the Board. The Company Secretary is responsible for ensuring that Board procedures are complied with and that governance matters are addressed.
3. COMMITTEES OF THE BOARD
3.1 Board Committees, Membership and Charters
ASXCGC Recommendations 2.4, 2.6, 4.1, 4.2, 4.3, 4.4, 8.1, 8.3,
To assist in the execution of its responsibilities, the Board has established a number of Board Committees including an Audit Committee and a Human Resources, Remuneration and Nomination Committee. These committees have written mandates and operating procedures, which are reviewed on a regular basis. The effectiveness of each committee is also constantly monitored. The Board has also established a framework for the management of the Group including a system of internal control and the establishment of appropriate ethical standards.
3.2 Audit Committee
ASXCGC Recommendations 4.1, 4.2, 4.3, 4.4
The role of the Audit Committee is to give the Board of Directors additional assurance regarding the quality and reliability of financial information prepared for use by the Board in determining accounting policies for inclusion in the financial report. The Committee has a documented charter, approved by the Board. A copy of the Audit Committee’s Charter is available in the Corporate Governance section of Orbital’s website. All members of the Committee must be independent, non-executive directors.
Members of the Audit Committee during the year were Mr J G Young (Chairman – 1 July 2010 to 28 February 2011), Dr M T Jones (Chairman – from 28 February 2011), Mr W P Day and Dr V Braach-Maksvytis. The external auditors, Chief Executive Officer, Chief Financial Officer, Company Secretary and other financial and accounting staff are invited to Audit Committee meetings at the discretion of the Committee. The Chief Executive Officer and Chief Financial Officer declared in writing to the Board that the Company’s financial reports for the year ended 30 June 2011 present a true and fair view, in all material respects, of the Company’s financial condition and operational results and are in accordance with relevant accounting standards. This statement is required annually.
The responsibilities of the Audit Committee include, liaising with the external auditors and ensuring that the annual and half-year statutory audits/reviews are conducted in an effective manner; reviewing and ensuring management implement appropriate and prompt remedial action for any deficiencies identified; monitoring compliance with Australian and international taxation requirements; the Australian and United States corporations laws and ASX Listing Rules; and improving quality of the accounting function.
The Audit Committee reviews the performance of the external auditors on an annual basis and meets with them to discuss audit planning matters, statutory reporting and as required for any special reviews or investigations deemed necessary by the Board. The Audit Committee also assesses whether non-audit services provided by the external auditor are consistent with maintaining the external auditor’s independence and provides advice to the Board whether the provision of such services by the external auditor is compatible with the general standard of independence of auditors imposed by the Corporations Act. The Audit Committee charter provides for rotation of the external audit partner every five years.
3.3 Human Resources, Remuneration and Nomination Committee
ASXCGC Recommendations 2.4, 2.6
The role of the Human Resources, Remuneration and Nomination Committee is to review and make recommendations to the Board on the remuneration packages and policies applicable to the Chief Executive Officer, senior executives and directors. It also plays a role in evaluation of the performance of the Chief Executive Officer and management succession planning. This role also includes responsibility for employee share schemes, incentive performance packages, superannuation entitlements, fringe benefits policies and professional indemnity and liability insurance policies. From time-to-time, the Remuneration Committee obtains independent advice on the appropriateness of remuneration packages, given trends in comparative companies both locally and internationally.
The Committee also oversees the appointment and induction process for directors. It reviews the composition of the Board and makes recommendations on the appropriate skill mix, personal qualities, expertise and diversity. When a vacancy exists or there is a need for particular skills, the Committee, in consultation with the Board, determines the selection criteria based on the skills deemed necessary. Potential candidates are identified by the Committee with advice from an external consultant, where appropriate. The Board then appoints the most suitable candidate who must stand for election at the next general meeting of shareholders. The Nomination Committee is also responsible for the selection, appointment and succession planning process of the Company’s Chief Executive Officer.
Members of the Human Resources, Remuneration and Nomination Committee during the year were Dr M T Jones (Chairman – 1 July 2010 to 28 February 2011), Dr V Braach-Maksvytis (Chairman – from 28 February 2011), Mr W P Day and Mr J G Young (retired 28 February 2011).
The Human Resources, Remuneration and Nomination Committee meet as and when required. The Committee has a documented charter, approved by the Board. A copy of the Human Resources, Remuneration and Nomination Committee’s Charter is available in the Corporate Governance section of Orbital’s website.
The performance of all Directors is reviewed by the Chairman each year. Directors whose performance is unsatisfactory are asked to retire.
23
CORPORATE GOVERNANCE STATEMENT
4 SHAREHOLDERS
4.1 Shareholder Communication
ASXCGC Recommendations 6.1, 6.2
Directors recognise that shareholders, as the ultimate owners of the Company, are entitled to receive timely and relevant high quality information about their investment. Similarly, prospective new investors are entitled to be able to make informed investment decisions when considering the purchase of shares.
Information is communicated to shareholders as follows:
| • | The disclosure of full and timely information about Orbital’s activities in accordance with the disclosure requirements contained in the ASX Listing Rules and the Corporations Act; |
| • | All information released to the market to be placed on the Company’s website promptly following release; |
| • | The annual financial report is distributed to all shareholders (and to American Depositary Receipt (ADR) holders) on request in accordance with Corporation Act requirements and includes relevant information about the operations of the Group during the year, changes in the state of affairs of the Group and details of future developments, in addition to other disclosures required by the Corporations Act and US Securities Law; |
| • | The half-yearly report contains summarised financial information and a review of the operations of the Group during the period. The half-year financial report is prepared in accordance with the requirements of Accounting Standards and the Corporations Act and is lodged with Australian and United States regulatory bodies and stock exchanges. Financial reports are sent to any shareholder or ADR holder who requests them; and |
The Board encourages participation of shareholders at the Annual General Meeting to ensure a high level of accountability and identification with the Group's strategy and goals. Important issues are presented to the shareholders as single resolutions. The Company’s external auditor is requested to attend annual general meetings to answer any questions concerning the audit and the content of the auditor’s report.
Shareholders are requested to vote on the appointment of Directors, aggregate remuneration of non-executive directors, the granting of shares to Directors and changes to the Constitution. A copy of the Constitution is available to any shareholder who requests it.
4.2 Continuous Disclosure and Market Communications
ASXCGC Recommendations 5.1, 5.2
The Board of Directors aims to ensure that shareholders are informed of all major developments affecting the Group's state of affairs. The Board has adopted a policy to identify matters that may have a material effect on the price of the Company’s securities and to notify the ASX as required.
This policy on Release of Price Sensitive Information is overseen and coordinated by the Company Secretary. All directors, officers and members of the Company’s management committee are required to forward details of any potentially price sensitive information to the Company Secretary, who is also to be made aware, in advance, of proposed information disclosures (including information to be presented at private briefings) to enable consideration of the continuous disclosure requirements. Proposed announcements are to be approved by the Managing Director and either the Chairman or Company Secretary prior to release to the ASX. The Company Secretary is responsible for all communications with the ASX.
The Company’s policy on Release of Price Sensitive Information and its policy on communication with shareholders are available in the Corporate Governance Section of Orbital’s website.
5. PROMOTING RESPONSIBLE AND ETHICAL BEHAVIOUR
5.1 Code of Conduct and Whistleblower Policy
ASXCGC Recommendations 3.1, 3.3
All Directors, managers and employees are expected to act with the utmost integrity and objectivity, striving at all times to enhance the reputation and performance of the Group. Every employee has a nominated supervisor to whom they may refer any issues arising from their employment. The Board has approved a Code of Conduct, applicable to all Directors and employees of the Group, providing for the conduct of business in accordance with the highest ethical standards and sound corporate governance. The Code also incorporates the Company’s policy on trading in the Company’s securities. A Code of Ethics, relating to Accounting Practice and Financial Reporting, has also been adopted by the Board and applies specifically to the Chief Executive Officer, Chief Financial Officer and senior finance officers of the Company who influence financial performance. The Code of Ethics is complementary to the Code of Conduct, copies of both of which are available in the Corporate Governance section of Orbital’s website.
5.2 Securities Ownership and Dealing
ASXCGC Recommendation 3.2, 3.3
The Company's policy with respect to Directors and Officers dealing in the Company's shares or options states that:
| • | Directors and Officers are prohibited from dealing in the Company's securities at any time when they possess information which, if publicly disclosed, would be likely to affect the market price of the Company's securities; |
| • | Directors and Officers are prohibited from short term trading in the Company's securities; |
| • | Directors must obtain the written approval of the Chairman before undertaking any transactions involving the Company's securities; and |
| • | Directors and Officers are prohibited from undertaking transactions in the Company's securities during the period from one month prior to the proposed release of the Company's annual or half-year result until two days after that release. |
A copy of the Securities Trading Policy is available in the Corporate Governance section of Orbital’s website.
24
CORPORATE GOVERNANCE STATEMENT
6. RISK MANAGEMENT
6.1 Approach to Risk Management and Internal Control
ASXCGC Recommendations 7.1, 7.4
The Board oversees the establishment, implementation and review of the Company’s risk management systems, which have been established by management for assessing, monitoring and managing operational, financial reporting and compliance risks for the Group. Responsibility for establishing and maintaining effective risk management strategies rests with senior management, accountable to the Chief Executive Officer and the Audit Committee of the Board. The Audit Committee reviews the risk management and internal control structure implemented by management so as to obtain reasonable assurance that the Group’s assets are safeguarded and that reliable financial records are maintained. Operational and other compliance risk management has also been reviewed and found to be operating efficiently and effectively. A copy of the Company’s risk management policy is available in the Corporate Governance section of Orbital’s website.
Risks to the Group arise from matters such as competitive technologies that may be developed, delays in government regulation, reduction in development and testing expenditure by the Company’s customers, the impact of exchange rate movements, environmental issues, occupational safety and health and financial reporting.
6.2 Internal Control Framework
ASXCGC Recommendations 7.2, 7.4
The Board recognises that no cost effective internal control system will preclude all errors and irregularities. The system is based upon written procedures, policies and guidelines, an organisational structure that provides an appropriate division of responsibility, and the careful selection and training of qualified personnel.
Established practices ensure:
| • | Capital expenditure commitments are subject to authority level approval procedures; |
| • | Financial exposures are controlled by the use of forward exchange contracts, where appropriate; |
| • | Occupational safety and health issues are monitored by a management committee; |
| • | Financial reporting accuracy and compliance with regulatory requirements; and |
| • | Compliance with environmental regulation. |
Where risks, such as natural disasters, cannot be adequately mitigated using internal controls, those risks are transferred to third parties through insurance coverage to the extent considered appropriate.
6.3 Chief Executive Officer and Chief Financial Officer Assurance
ASXCGC Recommendations 7.3, 7.4
The Chief Executive Officer and Chief Financial Officer have declared, in writing to the Board, that the Company’s financial reports are founded on a sound system of risk management and internal compliance and control which implements the policies adopted by the Board, and that they have evaluated the effectiveness of the company’s financial disclosure controls and procedures and have concluded that they are operating efficiently and effectively.
Monthly financial results are reported against budgets approved by the directors and revised forecasts for the year are prepared regularly.
6.4 Environmental Regulation
The Group holds a number of permits, licences and registrations for environmental regulation under both Australian Commonwealth and State legislation. These permits, licences and registrations are primarily for the storage of fuels and chemicals and the disposal of waste and are reviewed by the Group on an on-going basis. The directors are not aware of any serious breaches during the period covered by this report.
7. EXTERNAL AUDITOR RELATIONSHIP
ASXCGC Recommendation 4.4
The Audit Committee oversees the terms of engagement of Orbital’s external auditor. The Audit Committee ensures that the audit approach covers all financial statement areas where there is a risk of material misstatement and that audit activities are carried out throughout the Orbital Group in the most effective, efficient and comprehensive manner.
The Committee has the responsibility for the appointment, compensation and oversight of the external Auditor and to ensure that the external Auditor meets the required standards for Auditor Independence. In monitoring Auditor Independence the Committee will have regard to any legislative or regulatory requirements, and the following principles:
| • | It is mandatory that the Audit Partner responsible for the Audit be rotated at least every five years. At least two years must expire before the Audit Partner can again be involved in the Audit of the Group. |
| • | The Committee monitors the number of former employees of the external Auditor who were involved in auditing the company, currently employed in senior financial positions in the company, and assesses whether this impairs or appears to impair the Auditor’s judgment or independence in respect of the company. An individual auditor who was engaged by the external Auditor and participated in the company’s audit shall be precluded from employment as Chief Executive Officer or Chief Financial Officer of the company for a period of twelve months from the time of the audit. |
25
CORPORATE GOVERNANCE STATEMENT
| 7. | EXTERNAL AUDITOR RELATIONSHIP (continued) |
| • | Consider whether taken as a whole, the various relationships between the company and the external Auditor and the economic importance of the company (in terms of fees paid to the external Auditor for the Audit as well as fees paid to the external Auditor for the provision of non-audit services) to the external Auditor impair or appear to impair the Auditor’s judgment or independence in respect of the company. |
| • | The company shall not engage its external Auditor for certain non-audit services (including book-keeping, financial information systems design, valuations, actuarial services, internal audit outsourcing, human resources and unrelated legal/expert services). Any proposal to grant the external Auditor non-prohibited non-audit services will be referred to the Chairman of the Audit Committee by management prior to granting the work. |
| • | The Chairman of the Committee will meet (at least annually) with the external Auditors without the presence of management |
8. ASX Corporate Governance Council Recommendations Checklist
The table below summarises the Group’s compliance with the ASX Corporate Governance Council’s Recommendations.
| Recommendation | Comply Yes / No | Reference | ||||
Principle 1 - Lay solid foundations for management and oversight | ||||||
| 1.1 | Companies should establish the functions reserved to the board and those delegated to senior executives and disclose those functions. | Yes | 2.1 | |||
| 1.2 | Companies should disclose the process for evaluating the performance of senior executives. | Yes | Remuneration Report | |||
| 1.3 | Companies should provide the information indicated in the guide to reporting on Principle 1 | Yes | 2.1, 2.8, Remuneration Report | |||
Principle 2 - Structure the board to add value | ||||||
| 2.1 | A majority of the board should be independent directors. | Yes | 2.2 | |||
| 2.2 | The chair should be an independent director. | Yes | 2.2 | |||
| 2.3 | The roles of chair and chief executive officer should not be exercised by the same individual. | Yes | 2.2 | |||
| 2.4 | The board should establish a nomination committee. | Yes | 3.1, 3.3 | |||
| 2.5 | Companies should disclose the process for evaluating the performance of the board, its committees and individual directors. | Yes | 2.8 | |||
| 2.6 | Companies should provide the information indicated in the guide to reporting on Principle 2. | Yes | 2.2, 2.4, 2.5, 2.7, 2.8, 3.1, 3.3 | |||
Principle 3 - Promote ethical and responsible decision-making | ||||||
| 3.1 | Companies should establish a code of conduct and disclose the code or a summary of the code as to:
• The practices necessary to maintain confidence in the company’s integrity.
• The practices necessary to take into account their legal obligations and the reasonable expectations of their stakeholders.
• The responsibility and accountability of individuals for reporting and investigating reports of unethical practices. | Yes | 5.1 | |||
| 3.2 | Companies should establish a policy concerning trading in company securities by directors, senior executives and employees, and disclose the policy or a summary of that policy. | Yes | 5.2 | |||
| 3.3 | Companies should provide the information indicated in the guide to reporting on Principle 3 | Yes | 5.1, 5.2 | |||
Principle 4 - Safeguard integrity in financial reporting | ||||||
| 4.1 | The board should establish an audit committee | Yes | 3.1, 3.2 | |||
| 4.2 | The audit committee should be structured so that it:
• Consists only of non-executive directors
• Consists of a majority of independent directors
• Is chaired by an independent chair, who is not chair of the board
• Has at least three members | Yes | 3.1, 3.2 | |||
| 4.3 | The audit committee should have a formal charter. | Yes | 3.1, 3.2 | |||
26
CORPORATE GOVERNANCE STATEMENT
| 4.4 | Companies should provide the information indicated in the Guide to reporting on Principle 4 | Yes | 3.1, 3.2, 7 | |||
Principle 5 - Make timely and balanced disclosure | ||||||
| 5.1 | Companies should establish written policies designed to ensure compliance with ASX listing rule disclosure requirements and to ensure accountability at a senior executive level for that compliance and disclose those policies or a summary of those policies. | Yes | 4.2 | |||
| 5.2 | Companies should provide the information indicated in the guide to reporting on Principle 5. | Yes | 4.2 | |||
Principle 6 - Respect the rights of shareholders | ||||||
| 6.1 | Companies should design a communications policy for promoting effective communication with shareholders and encouraging their participation at general meetings and disclose their policy or a summary of that policy. | Yes | 4.1 | |||
| 6.2 | Companies should provide the information indicated in the guide to reporting on Principle 6. | Yes | 4.1 | |||
Principle 7 - Recognise and manage risk | ||||||
| 7.1 | Companies should establish policies for the oversight and management of material business risks and disclose a summary of those policies. | Yes | 6.1 | |||
| 7.2 | The board should require management to design and implement the risk management and internal control system to manage the company’s material business risks and report to it on whether those risks are being managed effectively. The board should disclose that management has reported to it as to the effectiveness of the company’s management of its material business risks | Yes | 6.2 | |||
| 7.3 | The board should disclose whether it has received assurance from the chief executive officer [or equivalent] and the chief financial officer [or equivalent] that the declaration provided in accordance with section 295A of the Corporations Act is founded on a sound system of risk management and internal control and that the system is operating effectively in all material respects in relation to financial reporting risks. | Yes | 6.3 | |||
| 7.4 | Companies should provide the information indicated in the guide to reporting on Principle 7. | Yes | 6.1, 6.2, 6.3 | |||
Principle 8 – Remunerate fairly and responsibly | ||||||
| 8.1 | The board should establish a remuneration committee. | Yes | 3.1 | |||
| 8.2 | Companies should clearly distinguish the structure of nonexecutive directors’ remuneration from that of executive directors and senior executives. | Yes | 2.9, Remuneration Report | |||
| 8.3 | Companies should provide the information indicated in the Guide to reporting on Principle 8. | Yes | 3.1 | |||
27
INCOME STATEMENT FOR THE YEAR ENDED 30 JUNE 2011
| NOTE | CONSOLIDATED | |||||||||
| 2011 | 2010 | |||||||||
| $’000 | $’000 | |||||||||
Engineering services income | 9,492 | 9,621 | ||||||||
Sale of goods | 5,847 | 6,203 | ||||||||
Licence and royalty income | 1,081 | 1,199 | ||||||||
Other revenue | 7 | 218 | 242 | |||||||
|
|
|
| |||||||
Total Revenue | 16,638 | 17,265 | ||||||||
|
|
|
| |||||||
Other income | 8 | 6,110 | 8,759 | |||||||
Inventory expenses | 9(d) | (4,484 | ) | (4,607 | ) | |||||
Employee benefits expenses | 9(a) | (10,494 | ) | (10,792 | ) | |||||
Depreciation and amortisation | (1,174 | ) | (1,004 | ) | ||||||
Engineering consumables and contractors | (1,954 | ) | (2,085 | ) | ||||||
Occupancy expenses | (1,165 | ) | (786 | ) | ||||||
Travel and accommodation | (634 | ) | (866 | ) | ||||||
Communications and computing | (593 | ) | (791 | ) | ||||||
Patent costs | (300 | ) | (338 | ) | ||||||
Insurance costs | (441 | ) | (441 | ) | ||||||
Audit, compliance and listing costs | (704 | ) | (560 | ) | ||||||
Finance costs | 9(b) | (688 | ) | (755 | ) | |||||
Other expenses | 9(c) | (1,777 | ) | (745 | ) | |||||
Share of profit from equity accounted investment | 16 | 3,233 | 1,874 | |||||||
|
|
|
| |||||||
Profit before income tax | 1,573 | 4,128 | ||||||||
Income tax benefit | 10(a) | 190 | 388 | |||||||
|
|
|
| |||||||
Profit for the year attributable to the members of the parent entity | 1,763 | 4,516 | ||||||||
|
|
|
| |||||||
Earnings per share: | ||||||||||
Basic earnings per share (in cents) | 11 | 3.65 | 9.39 | |||||||
Diluted earnings per share (in cents) | 11 | 3.65 | 9.29 | |||||||
|
|
|
| |||||||
The income statements are to be read in conjunction with the notes to the financial statements set out on pages 33 to 81.
28
STATEMENT OF COMPREHENSIVE INCOME FOR THE YEAR ENDED 30 JUNE 2011
| CONSOLIDATED | ||||||||
| 2011 | 2010 | |||||||
| $’000 | $’000 | |||||||
Net profit for the year | 1,763 | 4,516 | ||||||
Other comprehensive income | ||||||||
Share of foreign currency reserve of equity accounted investment | 343 | (356 | ) | |||||
Foreign currency translation | (3,758 | ) | (813 | ) | ||||
|
|
|
| |||||
Other comprehensive income for the year, net of tax | (3,415 | ) | (1,169 | ) | ||||
|
|
|
| |||||
TOTAL COMPREHENSIVE INCOME FOR THE YEAR | (1,652 | ) | 3,347 | |||||
|
|
|
| |||||
Total comprehensive (loss)/income for the year attributable to owners of the parent | (1,652 | ) | 3,347 | |||||
|
|
|
| |||||
The statements of comprehensive income are to be read in conjunction with the notes to the financial statements set out on pages 33 to 81.
STATEMENT OF CHANGES IN EQUITY FOR THE YEAR ENDED 30 JUNE 2011
| Share Capital | Retained Profits | Employee Equity Benefits Reserve | Foreign Currency Transalation Reserve | Total | ||||||||||||||||
| $’000 | $’000 | $’000 | $’000 | $’000 | ||||||||||||||||
At 1 July 2009 | 19,055 | (3,224 | ) | 884 | 399 | 17,114 | ||||||||||||||
Profit for period | — | 4,516 | — | — | 4,516 | |||||||||||||||
Other comprehensive income | — | — | — | (1,169 | ) | (1,169 | ) | |||||||||||||
|
|
|
|
|
|
|
|
|
| |||||||||||
Total comprehensive income for the period | — | 4,516 | — | (1,169 | ) | 3,347 | ||||||||||||||
Transactions with owners in their capacity as owners | ||||||||||||||||||||
Shares issued in accordance with share plan | 117 | — | (117 | ) | — | — | ||||||||||||||
Share based payments | 89 | — | 250 | — | 339 | |||||||||||||||
|
|
|
|
|
|
|
|
|
| |||||||||||
Balance at 30 June 2010 | 19,261 | 1,292 | 1,017 | (770 | ) | 20,800 | ||||||||||||||
|
|
|
|
|
|
|
|
|
| |||||||||||
At 1 July 2010 | 19,261 | 1,292 | 1,017 | (770 | ) | 20,800 | ||||||||||||||
Profit for period | — | 1,763 | — | — | 1,763 | |||||||||||||||
Other comprehensive income | — | — | — | (3,415 | ) | (3,415 | ) | |||||||||||||
|
|
|
|
|
|
|
|
|
| |||||||||||
Total comprehensive income for the period | — | 1,763 | — | (3,415 | ) | (1,652 | ) | |||||||||||||
Transactions with owners in their capacity as owners | ||||||||||||||||||||
Share based payments | 84 | — | 250 | — | 334 | |||||||||||||||
|
|
|
|
|
|
|
|
|
| |||||||||||
Balance at 30 June 2011 | 19,345 | 3,055 | 1,267 | (4,185 | ) | 19,482 | ||||||||||||||
|
|
|
|
|
|
|
|
|
| |||||||||||
The statements of changes in equity are to be read in conjunction with the notes to the financial statements set out on pages 33 to 81.
29
STATEMENT OF FINANCIAL POSITION AS AT 30 JUNE 2011
| NOTE | CONSOLIDATED | |||||||||||
| 2011 | 2010 | |||||||||||
| $’000 | $’000 | |||||||||||
Assets | ||||||||||||
Current assets | ||||||||||||
Cash and cash equivalents | 12 | 3,440 | 3,608 | |||||||||
Other financial assets | 13 | 3,434 | — | |||||||||
Trade and other receivables | 14 | 6,841 | 5,084 | |||||||||
Inventories | 15 | 4,388 | 3,722 | |||||||||
|
|
|
| |||||||||
Total Current Assets | 18,103 | 12,414 | ||||||||||
|
|
|
| |||||||||
Non-Current Assets | ||||||||||||
Investment in associate | 16 | 11,406 | 11,534 | |||||||||
Deferred tax assets | 17 | 4,958 | 5,215 | |||||||||
Property, plant & equipment | 18 | 4,134 | 7,911 | |||||||||
Intangibles and goodwill | 19 | 2,173 | 1,525 | |||||||||
|
|
|
| |||||||||
Total Non-Current Assets | 22,671 | 26,185 | ||||||||||
|
|
|
| |||||||||
Total Assets | 40,774 | 38,599 | ||||||||||
|
|
|
| |||||||||
Liabilities | ||||||||||||
Current liabilities | ||||||||||||
Trade payables and other liabilities | 20 | 5,004 | 2,676 | |||||||||
Interest bearing borrowings | 21 | 648 | 2,056 | |||||||||
Employee benefits | 23 | 2,354 | 2,420 | |||||||||
Deferred revenue | 24 | 316 | 316 | |||||||||
Government grants | 27 | 225 | 225 | |||||||||
Other provisions | 25 | �� | 195 | 173 | ||||||||
|
|
|
| |||||||||
Total Current Liabilities | 8,742 | 7,866 | ||||||||||
|
|
|
| |||||||||
Non-current liabilities | ||||||||||||
Long term borrowings | 26 | 7,777 | 7,604 | |||||||||
Employee benefits | 23 | 132 | 455 | |||||||||
Government grants | 27 | 1,649 | 1,874 | |||||||||
Contingent consideration | 28 | 2,688 | — | |||||||||
Other provisions | 25 | 304 | — | |||||||||
|
|
|
| |||||||||
Total Non-Current Liabilities | 12,550 | 9,933 | ||||||||||
|
|
|
| |||||||||
Total Liabilities | 21,292 | 17,799 | ||||||||||
|
|
|
| |||||||||
Net Assets | 19,482 | 20,800 | ||||||||||
|
|
|
| |||||||||
Equity | ||||||||||||
Share capital | 29 | 19,345 | 19,261 | |||||||||
Reserves | 30 | (2,918 | ) | 247 | ||||||||
Retained profits | 30 | 3,055 | 1,292 | |||||||||
|
|
|
| |||||||||
Total Equity | 19,482 | 20,800 | ||||||||||
|
|
|
| |||||||||
The statements of financial position are to be read in conjunction with the notes to the financial statements set out on pages 33 to 81.
30
STATEMENT OF CASH FLOWS FOR THE YEAR ENDED 30 JUNE 2011
| NOTE | CONSOLIDATED | |||||||||||
| 2011 | 2010 | |||||||||||
| $’000 | $’000 | |||||||||||
Cash Flows from Operating Activities | ||||||||||||
Cash receipts from customers | 17,070 | 17,947 | ||||||||||
Cash paid to suppliers and employees | (18,742 | ) | (22,925 | ) | ||||||||
|
|
|
| |||||||||
Cash used in operations | (1,672 | ) | (4,978 | ) | ||||||||
Interest received | 218 | 242 | ||||||||||
Interest paid | (104 | ) | (107 | ) | ||||||||
Income taxes paid | (234 | ) | (206 | ) | ||||||||
|
|
|
| |||||||||
Net cash used in operating activities | 35 | (1,792 | ) | (5,049 | ) | |||||||
|
|
|
| |||||||||
Cash Flows from Investing Activities | ||||||||||||
Dividends received from associate | 1,208 | 677 | ||||||||||
Net proceeds from sale of property, plant & equipment | 8,557 | 44 | ||||||||||
Acquisition of property, plant & equipment | (481 | ) | (1,394 | ) | ||||||||
Costs incurred on development of intangibles | (593 | ) | (1,128 | ) | ||||||||
Acquisition of subsidiary | 38 | (1,780 | ) | — | ||||||||
Redemption/(acquisition) of short term deposits | (3,434 | ) | 3,500 | |||||||||
|
|
|
| |||||||||
Net cash provided by investing activities | 3,477 | 1,699 | ||||||||||
|
|
|
| |||||||||
Cash Flows from Financing Activities | ||||||||||||
Proceeds from borrowings | — | 536 | ||||||||||
Repayment of borrowings | (1,848 | ) | (200 | ) | ||||||||
|
|
|
| |||||||||
Net cash (used in)/provided by financing activities | (1,848 | ) | 336 | |||||||||
|
|
|
| |||||||||
Net decrease in cash and cash equivalents | (163 | ) | (3,014 | ) | ||||||||
Cash and cash equivalents at 1 July | 3,608 | 6,623 | ||||||||||
Effects of exchange rate fluctuations on the balances of cash held in foreign currencies |
| (5 | ) | (1 | ) | |||||||
|
|
|
| |||||||||
Cash and cash equivalents at 30 June | 12 | 3,440 | 3,608 | |||||||||
|
|
|
| |||||||||
Non-Cash Investing Activities | ||||||||||||
There were no non-cash investing or financing activities for the years ended 30 June 2010 and 2011. | ||||||||||||
Refer to note 6 for details of non-cash operating items. | ||||||||||||
The statements of cash flows are to be read in conjunction with the notes to the financial statements set out in pages 33 to 81.
31
NOTES TO THE FINANCIAL STATEMENTS FOR THE YEAR ENDED 30 JUNE 2010
| Page | ||||||||
| 1. | Reporting Entity | 33 | ||||||
| 2. | Basis of Preparation | 33 | ||||||
| (a) | Statement of Compliance with IFRS | 33 | ||||||
| (b) | Basis of Measurement | 33 | ||||||
| (c) | Functional and Presentation Currency | 33 | ||||||
| (d) | Use of Estimates and Judgements | 33 | ||||||
| 3. | Significant accounting policies | 33 | ||||||
| (a) | New accounting standards and interpretations | 33 | ||||||
| (b) | Basis of consolidation | 33 | ||||||
| (c) | Foreign currency | 34 | ||||||
| (d) | Financial instruments | 34 | ||||||
| (e) | Inventories | 35 | ||||||
| (f) | Property, plant and equipment | 36 | ||||||
| (g) | Intangibles and goodwill | 36 | ||||||
| (h) | Impairment | 36 | ||||||
| (i) | Share capital | 37 | ||||||
| (j) | Employee benefits | 37 | ||||||
| (k) | Provisions – Warranties | 38 | ||||||
| (l) | Revenue recognition | 38 | ||||||
| (m) | Operating leases | 38 | ||||||
| (n) | Finance expense | 39 | ||||||
| (o) | Income tax | 39 | ||||||
| (p) | Operating segment | 39 | ||||||
| (q) | Goods and services tax | 39 | ||||||
| (r) | Earnings per share | 40 | ||||||
| (s) | Government grants | 40 | ||||||
| (t) | Business combinations | 40 | ||||||
| (u) | New standards and interpretations not yet adopted | 40 | ||||||
| 4. | Financial risk management objectives and policies | 44 | ||||||
| 5. | Significant accounting judgements, estimates and assumptions | 47 | ||||||
| 6. | Operating segments | 49 | ||||||
| 7. | Other revenue | 51 | ||||||
| 8. | Other income | 52 | ||||||
| 9. | Expenses | 52 | ||||||
| 10. | Income Tax | 53 | ||||||
| 11. | Earnings per share | 54 | ||||||
| Page | ||||||||
| 12. | Cash and cash equivalents | 55 | ||||||
| 13. | Other financial assets | 55 | ||||||
| 14. | Trade and other receivables | 55 | ||||||
| 15. | Inventories | 56 | ||||||
| 16. | Investment in associate | 57 | ||||||
| 17. | Deferred tax assets and liabilities | 59 | ||||||
| 18. | Property, plant and equipment | 60 | ||||||
| 19. | Intangibles and goodwill | 61 | ||||||
| 20. | Trade and other payables | 63 | ||||||
| 21. | Interest bearing loans and borrowings | 64 | ||||||
| 22. | Financing arrangements | 64 | ||||||
| 23. | Employee benefits | 65 | ||||||
| 24. | Deferred revenue | 65 | ||||||
| 25. | Other provisions | 66 | ||||||
| 26. | Long term borrowings | 67 | ||||||
| 27. | Government grants | 67 | ||||||
| 28. | Contingent consideration | 68 | ||||||
| 29. | Share capital | 68 | ||||||
| 30. | Retained profits and reserves | 69 | ||||||
| 31. | Consolidated entity | 70 | ||||||
| 32 | Information relating to Orbital Corporation Limited | 71 | ||||||
| 33. | Related party disclosures | 71 | ||||||
| 34. | Key management personnel | 72 | ||||||
| 35. | Notes to the statement of cash flows | 75 | ||||||
| 36. | Share based payment plans | 75 | ||||||
| 37. | Defined contribution superannuation fund | 78 | ||||||
| 38. | Business combination | 78 | ||||||
| 39. | Commitments | 80 | ||||||
| 40. | Contingencies | 80 | ||||||
| 41. | Events after the balance sheet date | 80 | ||||||
| 42. | Remuneration of auditors | 81 | ||||||
32
NOTES TO THE FINANCIAL STATEMENTS FOR THE YEAR ENDED 30 JUNE 2011
| 1. | REPORTING ENTITY |
Orbital Corporation Limited (the “Company”) is a company domiciled in Australia. The address of the Company’s registered office is 4 Whipple Street, Balcatta, Western Australia. The consolidated financial report of the Company for the year ended 30 June 2011 comprises the Company and its subsidiaries (together referred to as the “Group”).
The consolidated financial report was authorised for issue by the directors on 23 August 2011.
| 2. | BASIS OF PREPARATION |
| (a) | Statement of Compliance |
The financial report complies with Australian Accounting Standards as issued by the Australian Accounting Standards Board and International Financial Reporting Standards (IFRS) as issued by the International Accounting Standards Board.
| (b) | Basis of Measurement |
The consolidated financial statements have been prepared on the historical cost basis, except for contingent consideration which is measured at fair value.
| (c) | Functional and Presentation Currency |
These consolidated financial statements are presented in Australian dollars, which is the Company’s functional currency and the functional currency of the majority of the Group.
The Company is of a kind referred to in ASIC Class Order 98/100 dated 10 July 1998 and in accordance with that Class Order, all financial information presented in Australian dollars has been rounded to the nearest thousand unless otherwise stated.
| (d) | Use of Estimates and Judgements |
The preparation of financial statements requires management to make judgements, estimates and assumptions that affect the application of accounting policies and reported amounts of assets, liabilities, income and expenses. Actual results may differ from these estimates.
Estimates and underlying assumptions are reviewed on an ongoing basis. Revisions to accounting estimates are recognised in the period in which the estimate is revised if the revision affects only that period, or in the period of the revision and future periods if the revision affects both current and future periods.
Judgements made by management in the application of Australian Accounting Standards that have a significant effect on the financial report and estimates with a significant risk of material adjustment in the next year are discussed in note 5.
| 3. | SIGNIFICANT ACCOUNTING POLICIES |
| (a) | New Accounting Standards and Interpretations |
The accounting policies adopted are consistent with those of the previous financial year. From 1 July 2010, the Group has adopted all the standards and interpretations mandatory for annual periods beginning on or after 1 July 2010. Adoption of these standards and interpretations did not have any effect on the financial position or performance of the Group. The Group has not elected to early adopt any new standards or amendments.
| (b) | Basis of Consolidation |
| (i) | Subsidiaries |
Subsidiaries are all those entities over which the Group has the power to govern the financial and operating policies so as to obtain benefits from their activities. The existence and effect of potential voting rights that are currently exercisable or convertible are considered when assessing whether a group controls another entity.
The financial statements of the subsidiaries are prepared for the same reporting period as the parent company, using consistent accounting policies. In preparing the consolidated financial statements, all intercompany balances and transactions, income and expenses and profit and losses resulting from intragroup transactions have been eliminated in full.
Subsidiaries are fully consolidated from the date on which control is obtained by the Group and cease to be consolidated from the date on which control is transferred out of the Group.
The acquisition of subsidiaries is accounted for using the acquisition method of accounting. The acquisition method of accounting involves recognising at acquisition date, separately from goodwill, the identifiable assets acquired, the liabilities assumed and any non-controlling interest in the acquiree. The identifiable assets acquired and the liabilities assumed are measured at their acquisition date fair values.
The difference between the above items and the fair value of the consideration (including the fair value of any pre-existing investment in the acquiree) is goodwill or a discount on acquisition.
A change in the ownership interest of a subsidiary that does not result in a loss of control, is accounted for as an equity transaction.
33
NOTES TO THE FINANCIAL STATEMENTS FOR THE YEAR ENDED 30 JUNE 2011
| 3. | SIGNIFICANT ACCOUNTING POLICIES (continued) |
| (b) | Basis of Consolidation (continued) |
If the Group loses control over a subsidiary, it
| • | Derecognises the assets (including goodwill) and liabilities of the subsidiary. |
| • | Derecognises the carrying amount of any non-controlling interest. |
| • | Derecognises the cumulative translation differences, recorded in equity. |
| • | Recognises the fair value of the consideration received. |
| • | Recognises the fair value of any investment retained. |
| • | Recognises any surplus or deficit in profit or loss. |
| • | Reclassifies the parent's share of components previously recognised in other comprehensive income to profit or loss. |
| (ii) | Associate |
The Group’s investment in its associate is accounted for using the equity method of accounting in the consolidated financial statements. The associate is an entity over which the Group has significant influence and that is neither a subsidiary nor a joint venture.
The Group generally deems they have significant influence if they have over 20% of the voting rights.
Under the equity method, investments in associates are carried in the consolidated statement of financial position at cost plus post-acquisition changes in the Group’s share of net assets of the associate. Goodwill relating to an associate is included in the carrying amount of the investment and is not amortised. After application of the equity method, the Group determines whether it is necessary to recognise any impairment loss with respect to the Group’s net investment in associates.
The Group’s share of its associates’ post-acquisition profit or losses is recognised in the income statement, and its share of post-acquisition movements in reserves is recognised in reserves. The cumulative post-acquisition movements are adjusted against the carrying amount of the investment. Dividends received from the associate reduce the carrying amount of the investment.
When the Group’s share of losses in the associate equals or exceeds its interest in the associate, including any unsecured long-term receivables or loans, the Group does not recognise further losses, unless it has incurred obligations or made payments on behalf of the associate.
The associate’s accounting policies conform to those used by the Group for like transactions and events in similar circumstances.
| (iii) | Transactions Eliminated on Consolidation |
Intra-group balances, and any unrealised gains and losses or income and expenses arising from intra-group transactions, are eliminated in preparing the consolidated financial statements. Unrealised gains arising from transactions with associates are eliminated to the extent of the Group’s interest in the entity with adjustments made to the investment in the associate. Unrealised losses are eliminated in the same way as unrealised gains, but only to the extent that there is no evidence of impairment. Gains and losses are recognised as the contributed assets are consumed or sold or, if not consumed or sold, when the Group’s interest in such entities is disposed of.
| (c) | Foreign Currency |
| (i) | Foreign currency transactions |
Transactions in foreign currencies are converted to the respective functional currencies of Group entities at exchange rates at the dates of the transactions. Monetary assets and liabilities denominated in foreign currencies at the reporting date (except those representing the Group’s net investment in subsidiaries and its associate – see below) are retranslated to the functional currency at the exchange rate at that date. Foreign exchange differences arising on translation are recognised in the income statement. Non-monetary assets and liabilities that are measured in terms of historical cost in a foreign currency are translated using the exchange rate at the date of the transaction.
| (ii) | Financial statements of foreign operations |
The assets and liabilities of foreign operations are translated to Australian dollars at exchange rates ruling at the reporting date. The revenues and expenses of foreign operations are translated to Australian dollars at rates approximating the exchange rates ruling at the dates of the transactions. Foreign exchange differences arising on retranslation are recognised directly in a separate component of equity described as ‘foreign currency translation reserve’.
| (iii) | Net investment in foreign operations |
Exchange differences arising from the translation of balances representing the net investment in foreign operations are taken to the foreign currency translation reserve. They are released into the income statement upon disposal.
| (d) | Financial Instruments |
| (i) | Non-derivative financial instruments |
Non-derivative financial instruments comprise trade and other receivables, cash and cash equivalents, loans and borrowings, and trade and other payables.
Non-derivative financial instruments are recognised initially at fair value plus, for instruments not at fair value through profit or loss, any directly attributable transaction costs. Subsequent to initial recognition non-derivative financial instruments are measured as described below.
34
NOTES TO THE FINANCIAL STATEMENTS FOR THE YEAR ENDED 30 JUNE 2011
| 3. | SIGNIFICANT ACCOUNTING POLICIES (continued) |
| (d) | Financial Instruments (continued) |
A financial instrument is recognised if the Group becomes party to the contractual provisions of the instrument. Financial assets are derecognised if the Group’s contractual rights to the cash flows from the financial asset expire or if the Group transfers the financial asset to another party without retaining control or substantially all risks and rewards of the asset. Regular way purchases and sales of financial assets are accounted for at trade date, i.e., the date that the Group commits itself to purchase or sell the asset. Financial liabilities are derecognised if the Group’s obligations specified in the contract expire or are discharged or cancelled.
Cash and cash equivalents—refer note 12
Cash and cash equivalents comprise cash balances, at call deposits and bank-endorsed bills of exchange at discounted value.
Other financial assets—refer note 13
Other financial assets comprise term deposits with financial institutions with maturities between 90 days and 365 days. Subsequent to initial recognition other financial assets are stated at amortised cost.
Trade and other receivables—refer note 14
Subsequent to initial recognition, trade receivables are stated at their amortised cost, less impairment losses. Normal settlement terms are 30 to 60 days. The collectability of debts is assessed at balance date and specific allowance is made for any doubtful accounts. Individual debts that are known to be uncollectible are written off when identified. An impairment allowance is recognised when there is objective evidence that the Group will not be able to collect the receivable. Financial difficulties of the debtor, default payments or debts more than 60 days overdue are considered objective evidence of impairment. The amount of the impairment loss is the receivable carrying amount compared to the present value of estimated future cash flows, discounted at the original effective interest rate.
Trade and other payables—refer note 20
Liabilities are recognised for amounts due to be paid in the future for goods or services received. Subsequent to initial recognition, trade and other payables are stated at their amortised cost.
Trade payables are non-interest bearing and are normally settled on 30-day terms.
Interest bearing borrowings—refer note 21
Included in current liabilities is an amount owing under a trade finance facility utilised for the import of inventory. The trade finance facility provides loans of up to 180 days with interest payable at maturity. The loans are initially recognised at the fair value of consideration received plus transaction costs and subsequently stated at amortised cost with any difference between cost and repayment value being recognised in the income statement over the period of the borrowings on an effective interest basis.
Long term borrowings—refer note 26
Included in non-current liabilities is an amount owing to the Government of Western Australia resulting from a loan of $14,346,164 restructured in January 2010. The loan is interest-free with annual repayments commencing in May 2010 and concluding in May 2025.
The non-interest bearing loan from the Government of Western Australia was recognised initially at fair value and subsequently stated at amortised cost using the effective interest method. The difference between the fair value and face value of the loan is accounted for as a government grant as disclosed in note 26.
Contingent consideration—refer note 28
Included in non-current liabilities is an amount owing to the owners of the non-controlling interest in Sprint Gas (Aust) Pty Ltd. The contingent consideration was recognised initially at fair value and subsequently at fair value through profit and loss.
| (ii) | Derivative financial instruments |
The Group may use derivative financial instruments to hedge its exposure to foreign exchange fluctuations and interest rate movements. In accordance with its treasury policy, the Group entity does not hold the derivative financial instruments for trading purposes. However, derivatives that do not qualify for hedge accounting are accounted for as trading instruments.
Derivative financial instruments are recognised initially at fair value. Subsequent to initial recognition, derivative financial instruments are stated at fair value. Changes in the fair value of the derivative financial instrument that are not designated as cash flow hedging instruments are recognised in profit or loss.
Cash flow hedges
Changes in the fair value of the derivative hedging instrument designated as a cash flow hedge are recognised directly in equity to the extent that the hedge is effective. To the extent that the hedge is ineffective, changes in fair value are recognised in profit or loss.
If the hedging instrument no longer meets the criteria for hedge accounting, expires or is sold, terminated or exercised, then hedge accounting is discontinued prospectively. The cumulative gain or loss previously recognised in equity remains there until the forecast transaction occurs. When the hedged item is a non-financial asset, the amount recognised in equity is transferred to the carrying amount of the asset when it is recognised. In other cases the amount recognised in equity is transferred to profit or loss in the same period that the hedged item affects profit or loss.
| (e) | Inventories—refer note 15 |
Inventories are carried at the lower of cost and net realisable value. Cost is based on the first-in first-out principle and includes expenditure incurred in acquiring the inventories and bringing them to their present location and condition. Net realisable value is the estimated selling price in the ordinary course of business, less the estimated costs of completion and selling expenses.
35
NOTES TO THE FINANCIAL STATEMENTS FOR THE YEAR ENDED 30 JUNE 2011
| 3. | SIGNIFICANT ACCOUNTING POLICIES (continued) |
| (f) | Property, Plant and Equipment—refer note 18 |
| (i) | Recognition and measurement |
Items of property, plant and equipment are stated at cost less accumulated depreciation and impairment losses.
Cost includes expenditures that are directly attributable to the acquisition of the asset.
| (ii) | Subsequent costs |
The cost of replacing part of an item of property, plant and equipment is recognised in the carrying amount of the item if it is probable that the future economic benefits embodied within the part will flow to the Group and its cost can be measured reliably. The costs of day-to-day servicing of property, plant and equipment are recognised in profit or loss as incurred.
| (iii) | Depreciation and Amortisation |
Items of property, plant and equipment, including buildings but excluding freehold land, are depreciated/amortised on a straight line basis over their estimated useful lives. The depreciation rates used in the current and comparative period for each class of asset are as follows: Buildings 2.5%; Plant and Equipment 6.67% to 33.3%. Assets are depreciated or amortised from the date of acquisition.
The residual value, the useful life and the depreciation method applied to an asset are reassessed at least annually.
| (iv) | Asset Sales |
The net profit or loss from asset sales are included as other income or expenses of the Group. The profit or loss on disposal of assets is brought to account at the date that an unconditional contract of sale is signed. The profit or loss on disposal is calculated as the difference between the carrying amount of the asset at the time of disposal and the net proceeds on disposal.
| (g) | Intangibles and goodwill—refer note 19 |
| (i) | Research and Development |
Expenditure on research activities, undertaken with the prospect of gaining new scientific or technical knowledge and understanding, is recognised in the income statement as an expense as incurred.
Expenditure on development activities, whereby research findings are applied to a plan or design for the production of new or substantially improved products and processes, is capitalised if the product or process is technically and commercially feasible and the Group has sufficient resources to complete development.
Expenditure on intangibles which may be capitalised includes the cost of materials and direct labour. Other development expenditure is recognised in the income statement as an expense as incurred. Capitalised expenditure is stated at cost less accumulated amortisation and impairment losses. Amortisation is charged to the income statement on a straight-line basis over the estimated useful lives of intangible assets unless such lives are indefinite.
| (ii) | Patents, Licences and Technologies |
Patents, licences and technology development and maintenance costs, not qualifying for capitalisation, are expensed as incurred.
| (iii) | Goodwill |
Goodwill acquired in a business combination is initially measured at cost being the excess of the cost of the business combination over the Group's interest in the net fair value of the acquiree's identifiable assets, liabilities and contingent liabilities.
Following initial recognition, goodwill is measured at cost less any accumulated impairment losses.
For the purpose of impairment testing, goodwill acquired in a business combination is, from the acquisition date, allocated to each of the Group's cash-generating units, or groups of cash-generating units, that are expected to benefit from the synergies of the combination, irrespective of whether other assets or liabilities of the Group are assigned to those units or groups of units.
Impairment is determined by assessing the recoverable amount of the cash-generating unit (group of cash-generating units), to which the goodwill relates.
When the recoverable amount of the cash-generating unit (group of cash-generating units) is less than the carrying amount, an impairment loss is recognised. When goodwill forms part of a cash-generating unit (group of cash-generating units) and an operation within that unit is disposed of, the goodwill associated with the operation disposed of is included in the carrying amount of the operation when determining the gain or loss on disposal of the operation. Goodwill disposed of in this manner is measured based on the relative values of the operation disposed of and the portion of the cash-generating unit retained. Impairment losses recognised for goodwill are not subsequently reversed.
| (h) | Impairment |
| (i) | Financial assets |
A financial asset is considered to be impaired if objective evidence indicates that one or more events have had a negative effect on the estimated future cash flows of that asset.
An impairment loss in respect of a financial asset measured at amortised cost is calculated as the difference between its carrying amount, and the present value of the estimated future cash flows discounted at the original effective interest rate. An impairment loss in respect of an available-for-sale financial asset is calculated by reference to its current fair value.
36
NOTES TO THE FINANCIAL STATEMENTS FOR THE YEAR ENDED 30 JUNE 2011
| 3. | SIGNIFICANT ACCOUNTING POLICIES (continued) |
| (h) | Impairment (continued) |
Individually significant financial assets are tested for impairment on an individual basis. The remaining financial assets are assessed collectively in groups that share similar credit risk characteristics.
All impairment losses are recognised in profit or loss. Any cumulative loss in respect of an available-for-sale financial asset recognised previously in equity is transferred to profit or loss.
An impairment loss is reversed if the reversal can be related objectively to an event occurring after the impairment loss was recognised. For financial assets measured at amortised cost and available-for-sale financial assets that are debt securities, the reversal is recognised in profit or loss. For available-for-sale financial assets that are equity securities, the reversal is recognised directly in equity.
| (ii) | Non-financial assets |
The carrying amounts of the Group’s non-financial assets, other than inventories and deferred tax assets, are reviewed at each reporting date to determine whether there is any indication of impairment. If any such indication exists then the asset’s recoverable amount is estimated.
An impairment loss is recognised if the carrying amount of an asset or its cash-generating unit exceeds its recoverable amount. A cash-generating unit is the smallest identifiable asset group that generates cash flows that largely are independent from other assets and groups. Impairment losses are recognised in profit or loss. Impairment losses recognised in respect of cash-generating units are allocated first to reduce the carrying amount of any goodwill allocated to the units and then to reduce the carrying amount of the other assets in the unit (group of units) on a pro rata basis.
The recoverable amount of an asset or cash-generating unit is the greater of its value in use and its fair value less costs to sell. In assessing value in use, the estimated future cash flows are discounted to their present value using a pre-tax discount rate that reflects current market assessments of the time value of money and the risks specific to the asset.
An impairment loss in respect of goodwill is not reversed. In respect of other assets, impairment losses recognised in prior periods are assessed at each reporting date for any indications that the loss has decreased or no longer exists. An impairment loss is reversed if there has been a change in estimates used to determine the recoverable amount. An impairment loss is reversed only to the extent that the asset’s carrying amount does not exceed the carrying amount that would have been determined, net of depreciation or amortisation, if no impairment loss had been recognised.
| (ii) | Goodwill |
Impairment is determined by assessing the recoverable amount of the cash-generating unit (group of cash-generating units), to which the goodwill relates.
| (i) | Share capital—refer note 29 |
| (i) | Issued Capital |
Share capital is recognised at the fair value of the consideration received.
| (ii) | Dividends |
Dividends are recognised as a liability in the period in which they are declared.
| (iii) | Transaction Costs |
Transaction costs of an equity transaction are accounted for as a deduction from equity, net of any related income tax benefit.
| (j) | Employee Benefits |
| (i) | Short-term benefits—refer note 23 |
The provisions for employee entitlements to wages, salaries and annual leave due to be settled within 12 months of year end represent present obligations resulting from employees’ services provided up to the balance date, calculated at undiscounted amounts based on wage and salary rates that the Group expects to pay as at the reporting date including related on-costs, such as workers’ compensation and payroll tax. Expenses for non-accumulating sick leave are recognised when the leave is taken and are measured at the rates paid or payable.
| (ii) | Long Service Leave—refer note 23 |
The provision for employee entitlements to long service leave represents the present value of the estimated future cash outflows to be made resulting from employees’ services provided up to balance sheet date.
The provision is calculated using estimated future increases in wage and salary rates including related on-costs and expected settlement dates based on the Group’s experience with staff departures and is discounted using the rates attached to national government securities at balance sheet date, which most closely match the terms of maturity of the related liabilities.
| (iii) | Defined Contribution Superannuation Fund—refer note 37 |
Obligations for contributions to the defined contribution superannuation fund are recognised as an expense in the income statement as incurred.
37
NOTES TO THE FINANCIAL STATEMENTS FOR THE YEAR ENDED 30 JUNE 2011
| 3. | SIGNIFICANT ACCOUNTING POLICIES (continued) |
| (j) | Employee Benefits (continued) |
| (iv) | Share-based payment transactions—refer note 36 |
Employees have been offered the right to take up shares in the Company under three plans (i) the Employee Share Plan No.1 provides $1,000 of shares per annum and is subject to qualification by length of service, (ii) the Executive Long Term Share Plan (“ELTSP”) is subject to qualification by length of service and achievement of corporate performance targets related to returns to shareholders, and (iii) the Performance Rights Plan is subject to qualification by length of service and achievement of share price targets.
The fair value of rights granted to employees is recognised as an employee benefit expense with a corresponding increase in equity. The fair value of the shares granted under the Employee Share Plan No.1 is based on the market price of the shares on the date of issue. The fair value of the ELTSP is measured at grant date taking into account market performance conditions only, and spread over the vesting period during which the employees become unconditionally entitled to the performance–based shares. The fair value of the shares granted is measured using a Monte-Carlo simulation model. The amount recognised as an expense is adjusted to reflect the actual number of shares that vest except where forfeiture is only due to market conditions that are not met. The fair value of the Performance Rights is measured at grant date taking into account the share price targets and spread over the expected life of the rights.
| (k) | Provisions – Warranties—refer note 25 |
A provision is recognised if, as a result of a past event, the Group has a present legal or constructive obligation that can be estimated reliably, and it is probable that an outflow of economic benefits will be required to settle the obligation. Provisions are determined by discounting the expected future cash flows at a pre-tax rate that reflects current market assessments of the time value of money and the risks specific to the liability.
Provision for warranty is recognised when the underlying products are sold. The provision is based on historical claim data.
| (l) | Revenue Recognition |
Revenues are recognised and measured at the fair value of the consideration received net of the amount of goods and services tax (GST). Exchanges of goods or services of the same nature and value without any cash consideration are not recognised as revenues.
| (i) | Revenue from Rendering of Services |
Revenue from services rendered is recognised in the income statement in proportion to the stage of completion of the transaction at the reporting date. The stage of completion is assessed by reference to the extent of work performed. No revenue is recognised if there are significant uncertainties regarding recovery of the consideration due.
Revenue received in advance represents cash payments received from customers in accordance with contractual commitments prior to the performance of the service.
| (ii) | Sale of goods |
Revenue from the sale of goods is recognised when there is persuasive evidence, usually in the form of an executed sales agreement at the time of delivery of the goods to customer, indicating that there has been a transfer of risks and rewards to the customer, no further work or processing is required, the quantity and quality of the goods has been determined, the price is fixed and generally title has passed.
| (iii) | Licence and royalties |
Revenue earned under various licence, royalty and other agreements is recognised on an accrual basis upon the satisfactory completion of contracted technical specifications. Additional revenue may be earned after a fixed time interval or after delivery of a prototype engine and/or hardware meeting specified performance targets, provided the licence agreements are not terminated. Under the terms of the licence agreements, licensees are not specifically obliged to commence production and sale of engines using OCP Technology and may terminate the agreements upon notice to Orbital. If a licensee were to terminate its licence agreement with Orbital, the licensee would forfeit the licence and any technical disclosure fees paid through to the date of termination. Revenue under royalty agreements is recognised when such amounts become due and payable.
| (iv) | Interest Revenue |
Revenue is recognised as interest accrues using the effective interest method.
| (v) | Dividends |
Revenue is recognised when the Group’s right to receive the payment is established.
| (m) | Operating leases |
| (i) | Operating lease payments |
Payments made under operating leases are recognised in the income statement on a straight-line basis over the term of the lease.
38
NOTES TO THE FINANCIAL STATEMENTS FOR THE YEAR ENDED 30 JUNE 2011
| 3. | SIGNIFICANT ACCOUNTING POLICIES (continued) |
| (n) | Finance expense |
Borrowing costs directly attributable to the acquisition, construction or production of a qualifying asset (i.e. an asset that necessarily takes a substantial period of time to get ready for its intended use or sale) are capitalised as part of the cost of that asset. All other borrowing costs are expensed in the period they occur.
Borrowing costs consist of interest and other costs that an entity incurs in connection with the borrowing of funds
| (o) | Income Tax—refer note 10 |
| (i) | Current income tax expense and liability |
Income tax on the profit or loss for the year presented comprises current and deferred tax. Income tax is recognised in the income statement except to the extent that it relates to items recognised directly in equity, in which case it is recognised in equity.
Current tax is the expected tax payable on the taxable income for the year, using tax rates enacted or substantially enacted at the balance sheet date, and any adjustment to tax payable in respect of previous years.
| (ii) | Deferred income tax expense and liability |
Deferred tax is provided using the balance sheet liability method, providing for temporary differences between the carrying amounts of assets and liabilities for financial reporting purposes and the amounts used for taxation purposes. The amount of deferred tax provided is based on the expected manner of realisation or settlement of the carrying amount of assets and liabilities, using tax rates enacted or substantively enacted at the balance sheet date.
A deferred tax asset is recognised only to the extent that it is probable that future taxable profits will be available against which the asset can be utilised. Deferred tax assets are reduced to the extent that it is no longer probable that the related tax benefit will be realised.
| (iii) | Tax Consolidation |
The Company and its wholly-owned Australian resident entities have formed a tax-consolidated group with effect from 1 July 2002 and are therefore taxed as a single entity from that date. The head entity within the tax-consolidated group is Orbital Corporation Limited.
| (p) | Operating segments—refer note 6 |
An operating segment is a component of an entity that engages in business activities from which it may earn revenues and incur expenses (including revenues and expenses relating to transactions with other components of the same entity), whose operating results are regularly reviewed by the entity’s executive management team (the chief operating decision maker) to make decisions about resources to be allocated to the segment and assess its performance and for which discrete financial information is available. Management will also consider other factors in determining operating segments such as the existence of a line manager and the level of segment information presented to the executive management team.
The group aggregates two or more operating segments when they have similar economic characteristics, and the segments are similar in each of the following respects:
| • | Nature of the products and services, |
| • | Nature of the production processes, |
| • | Type or class of customer for the products and services, |
| • | Methods used to distribute the products or provide the services, and if applicable |
| • | Nature of the regulatory environment. |
Operating segments that meet the quantitative criteria as prescribed by AASB 8 are reported separately. However, an operating segment that does not meet the quantitative criteria is still reported separately where information about the segment would be useful to users of the financial statements.
Information about other business activities and operating segments that are below the quantitative criteria are combined and disclosed in a separate category for “all other segments”.
| (q) | Goods and services tax |
Revenue, expenses and assets are recognised net of the amount of goods and services tax (GST), except where the amount of GST incurred is not recoverable from the taxation authority. In these circumstances, the GST is recognised as part of the cost of acquisition of the asset or as part of the expense.
Receivables and payables are stated with the amounts of GST included. The net amount of GST recoverable from, or payable to, the Australian Taxation Office is included as a current asset or liability in the statement of financial position.
Cash flows are included in the statement of cash flows on a gross basis. The GST components of cash flows arising from investing and financing activities which are recoverable from, or payable to, the ATO are classified as operating cash flows.
39
NOTES TO THE FINANCIAL STATEMENTS FOR THE YEAR ENDED 30 JUNE 2011
| 3. | STATEMENT OF SIGNIFICANT ACCOUNTING POLICIES (continued) |
| (r) | Earnings per share – refer note 11 |
The Group presents basic and diluted earnings per share (EPS) data for its ordinary shares. Basic EPS is calculated by dividing the profit or loss attributable to ordinary shareholders of the Company by the weighted average number of ordinary shares outstanding during the period.
Diluted EPS is determined by adjusting the profit or loss attributable to ordinary shareholders and the weighted average number of ordinary shares outstanding for the effects of all dilutive potential ordinary shares.
| (s) | Government grants – refer note 27 |
Government grants are recognised in the Statement of Financial Position as a liability when the grant is received. Government grants are recognised as income over the periods necessary to match them with the related costs which they are intended to compensate, on a systematic basis. Government grants received on compensation for expenses and losses already incurred or for the purpose of giving immediate financial support are recognised immediately in profit and loss for the period.
When the grant relates to a discount on services to be rendered in the future, the fair value is credited to deferred revenue and is released to the income statement over the periods that the discounted services are rendered.
When the grant relates to an asset (investment grants relating to the construction of a heavy duty engine test facility), the fair value is credited to deferred income and is released to the income statement over the expected useful life of the relevant asset by equal annual instalments.
| (t) | Business combinations – refer note 38 |
Business combinations are accounted for using the acquisition method. The consideration transferred in a business combination shall be measured at fair value, which shall be calculated as the sum of the acquisition date fair values of the assets transferred by the acquirer, the liabilities incurred by the acquirer to former owners of the acquiree and the equity issued by the acquirer, and the amount of any non-controlling interest in the acquiree. For each business combination, the acquirer measures the non-controlling interest in the acquiree either at fair value or at the proportionate share of the acquiree’s identifiable net assets. Acquisition-related costs are expensed as incurred, and included in administrative expenses.
When the Group acquires a business, it assesses the financial assets and liabilities assumed for appropriate classification and designation in accordance with the contractual terms, economic conditions, the Group’s operating or accounting policies and other pertinent conditions as at the acquisition date. This includes the separation of embedded derivatives in host contracts by the acquiree.
If the business combination is achieved in stages, the acquisition date fair value of the acquirer’s previously held equity interest in the acquiree is remeasured to fair value at the acquisition date through profit or loss.
Any contingent consideration to be transferred by the acquirer will be recognised at fair value at the acquisition date. Subsequent changes to the fair value of the contingent consideration which is deemed to be an asset or liability will be recognised in accordance with AASB 139 either in profit or loss or as a change to other comprehensive income. If the contingent consideration is classified as equity, it should not be remeasured until it is finally settled within equity
| (u) | New standards and interpretations not yet effective |
The following standards, amendments to standards and interpretations have been identified as those which may impact the entity in the period of initial application. They are available for early adoption at 30 June 2011, but have not been applied in preparing this financial report:
40
NOTES TO THE FINANCIAL STATEMENTS FOR THE YEAR ENDED 30 JUNE 2011
| 3. | STATEMENT OF SIGNIFICANT ACCOUNTING POLICIES (continued) |
| (u) | New standards and interpretations not yet effective (continued) |
Reference | Title | Summary | Application | Application | ||||
AASB 9 (IFRS 9) | Financial Instruments | AASB 9 (IFRS 9) includes requirements for the classification and measurement of financial assets resulting from the first part of Phase 1 of the IASB’s project to replace IAS 39 Financial Instruments: Recognition and Measurement (AASB 139 Financial Instruments: Recognition and Measurement) (IAS 39).
These requirements improve and simplify the approach for classification and measurement of financial assets compared with the requirements of AASB 139(IAS 39). The main changes from AASB 139 (IAS 39) are described below.
(a) Financial assets are classified based on (1) the objective of the entity’s business model for managing the financial assets; (2) the characteristics of the contractual cash flows. This replaces the numerous categories of financial assets in AASB 139 (IAS 39), each of which had its own classification criteria.
(b) AASB 9 allows an irrevocable election on initial recognition to present gains and losses on investments in equity instruments that are not held for trading in other comprehensive income. Dividends in respect of these investments that are a return on investment can be recognised in profit or loss and there is no impairment or recycling on disposal of the instrument.
(c) Financial assets can be designated and measured at fair value through profit or loss at initial recognition if doing so eliminates or significantly reduces a measurement or recognition inconsistency that would arise from measuring assets or liabilities, or recognising the gains and losses on them, on different bases. | 1 January 2013 | 1 July 2013 | ||||
AASB 2009-11 (IFRS 9 and consequential amendments to IFRS 1, 3, 4, 5, 7, IAS 1, 2, 8, 12, 18, 21, 27, 28, 31, 32, 36, 39 and IFRIC 10, 12) | Amendments to Australian Accounting Standards arising from AASB 9 (IFRS 9) [AASB 1, 3, 4, 5, 7, 101, 102, 108, 112, 118, 121, 127, 128, 131, 132, 136, 139, 1023 & 1038 and Interpretations 10 & 12] | • These amendments arise from the issuance of AASB 9Financial Instruments (IFRS 9)that sets out requirements for the classification and measurement of financial assets. The requirements in AASB 9 (IFRS 9) form part of the first phase of the International Accounting Standards Board’s project to replace IAS 39Financial Instruments: Recognition and Measurement.
• This Standard shall be applied when AASB 9 (IFRS 9) is applied. | 1 January 2013 | 1 July 2013 | ||||
41
NOTES TO THE FINANCIAL STATEMENTS FOR THE YEAR ENDED 30 JUNE 2011
| 3. | STATEMENT OF SIGNIFICANT ACCOUNTING POLICIES (continued) |
| (u) | New standards and interpretations not yet effective (continued) |
Reference | Title | Summary | Application | Application | ||||
AASB 124 (Revised) (IAS 24) | Related Party Disclosures (December 2009) | The revised AASB 124 (IAS 24) simplifies the definition of a related party, clarifying its intended meaning and eliminating inconsistencies from the definition, including:
(a) The definition now identifies a subsidiary and an associate with the same investor as related parties of each other
(b) Entities significantly influenced by one person and entities significantly influenced by a close member of the family of that person are no longer related parties of each other
(c) The definition now identifies that, whenever a person or entity has both joint control over a second entity and joint control or significant influence over a third party, the second and third entities are related to each other
A partial exemption is also provided from the disclosure requirements for government-related entities. Entities that are related by virtue of being controlled by the same government can provide reduced related party disclosures. | 1 January 2011 | 1 July 2011 | ||||
AASB 2009-12 (IFRS 5, 8, IAS 8, 10, 12, 19, 33, 37, 39 and IFRIC 2, 4, 16) | Amendments to Australian Accounting Standards [AASBs 5, 8, 108, 110, 112, 119, 133, 137, 139, 1023 & 1031 and Interpretations 2, 4, 16, 1039 & 1052] | This amendment makes numerous editorial changes to a range of Australian Accounting Standards and Interpretations.
In particular, it amends AASB 8Operating Segments(IFRS 8) to require an entity to exercise judgement in assessing whether a government and entities known to be under the control of that government are considered a single customer for the purposes of certain operating segment disclosures. It also makes numerous editorial amendments to a range of Australian Accounting Standards and Interpretations, including amendments to reflect changes made to the text of IFRS by the IASB. | 1 January 2011 | 1 July 2011 | ||||
| AASB 1054 | Australian Additional Disclosures | This standard is as a consequence of phase 1 of the joint Trans-Tasman Convergence project of the AASB and FRSB.
This standard relocates all Australian specific disclosures from other standards to one place and revises disclosures in the following areas:
(a) Compliance with Australian Accounting Standards
(b) The statutory basis or reporting framework for financial statements
(c) Whether the financial statements are general purpose or special purpose
(d) Audit fees
(e) Imputation credits | 1 July 2011 | 1 July 2011 | ||||
AASB 2010-4 (IFRS 1, 7, IAS 1, 34 and IFRIC 13) | Further Amendments to Australian Accounting Standards arising from the Annual Improvements Project [AASB 1, AASB 7, AASB 101, AASB 134 and Interpretation 13] | Emphasises the interaction between quantitative and qualitative AASB 7 (IFRS 7) disclosures and the nature and extent of risks associated with financial instruments.
Clarifies that an entity will present an analysis of other comprehensive income for each component of equity, either in the statement of changes in equity or in the notes to the financial statements.
Provides guidance to illustrate how to apply disclosure principles in AASB 134 (IAS 34) for significant events and transactions.
Clarifies that when the fair value of award credits is measured based on the value of the awards for which they could be redeemed, the amount of discounts or incentives otherwise granted to customers not participating in the award credit scheme, is to be taken into account. | 1 January 2011 | 1 July 2011 | ||||
42
NOTES TO THE FINANCIAL STATEMENTS FOR THE YEAR ENDED 30 JUNE 2011
| 3. | STATEMENT OF SIGNIFICANT ACCOUNTING POLICIES (continued) |
| (u) | New standards and interpretations not yet effective (continued) |
Reference | Title | Summary | Application | Application | ||||
AASB 2010-5 (IFRS 1, 3, 4, 5, IAS 1, 7, 12, 18, 19, 21, 32, 33, 34, 37, 39, 40 and SIC 12, 15, 27, 32) | Amendments to Australian Accounting Standards [AASB 1, 3, 4, 5, 101, 107, 112, 118, 119, 121, 132, 133, 134, 137, 139, 140, 1023 & 1038 and Interpretations 112, 115, 127, 132 & 1042] | This Standard makes numerous editorial amendments to a range of Australian Accounting Standards and Interpretations, including amendments to reflect changes made to the text of IFRS by the IASB.
These amendments have no major impact on the requirements of the amended pronouncements. | 1 January 2011 | 1 July 2011 | ||||
AASB 2010-6 (IFRS 1 & 7) | Amendments to Australian Accounting Standards – Disclosures on Transfers of Financial Assets [AASB 1 & AASB 7] | The amendments increase the disclosure requirements for transactions involving transfers of financial assets. Disclosuresrequire enhancements to the existing disclosures in AASB 7 (IFRS 7) where an asset is transferred but is not derecognised and introduce new disclosures for assets that are derecognised but the entity continues to have a continuing exposure to the asset after the sale. | 1 July 2011 | 1 July 2011 | ||||
AASB 2010-7 (IFRS 9 and consequential amendments to IFRS 1, 3, 4, 5, 7, IAS 1, 2, 8, 12, 18, 20, 21, 27, 28, 31, 32, 36, 37, 39 and IFRIC 2, 5, 10, 12, 19 and SIC 27) | Amendments to Australian Accounting Standards arising from AASB 9 (December 2010) [AASB 1, 3, 4, 5, 7, 101, 102, 108, 112, 118, 120, 121, 127, 128, 131, 132, 136, 137, 139, 1023, & 1038 and interpretations 2, 5, 10, 12, 19 & 127] | The requirements for classifying and measuring financial liabilities were added to AASB 9 (IFRS 9). The existing requirements for the classification of financial liabilities and the ability to use the fair value option have been retained. However, where the fair value option is used for financial liabilities the change in fair value is accounted for as follows:
• The change attributable to changes in credit risk are presented in other comprehensive income (OCI)
• The remaining change is presented in profit or loss
If this approach creates or enlarges an accounting mismatch in the profit or loss, the effect of the changes in credit risk are also presented in profit or loss. | 1 January 2013 | 1 July 2013 | ||||
AASB 2011-1 (IFRS 1, 5, IAS 1, 7, 8, 21, 28, 32, 34 and IFRIC 2 and SIC 12, 13) | Amendments to Australian Accounting Standards arising from the Trans-Tasman Convergence project [AASB 1, AASB 5, AASB 101, AASB 107, AASB 108, AASB 121, AASB 128, AASB 132, AASB 134, Interpretation 2, Interpretation 112, Interpretation 113] | This Standard amendments many Australian Accounting Standards, removing the disclosures which have been relocated to AASB 1054. | 1 July 2011 | 1 July 2011 | ||||
| AASB 2011-2 | Amendments to Australian Accounting Standards arising from the Trans-Tasman Convergence project – Reduced disclosure regime [AASB 101, AASB 1054] | This Standard makes amendments to the application of the revised disclosures to Tier 2 entities, that are applying AASB 1053. | 1 July 2013 | 1 July 2013 | ||||
** (IFRS 10) | Consolidated Financial Statements | IFRS 10 establishes a new control model that applies to all entities. It replaces parts of IAS 27Consolidated and Separate Financial Statements dealing with the accounting for consolidated financial statements and SIC-12Consolidation – Special Purpose Entities.
The new control model broadens the situations when an entity is considered to be controlled by another entity and includes new guidance for applying the model to specific situations, including when acting as a manager may give control, the impact of potential voting rights and when holding less than a majority voting rights may give control. | 1 January 2013 | 1 July 2013 | ||||
43
NOTES TO THE FINANCIAL STATEMENTS FOR THE YEAR ENDED 30 JUNE 2011
| 3. | STATEMENT OF SIGNIFICANT ACCOUNTING POLICIES (continued) |
| (u) | New standards and interpretations not yet effective (continued) |
Reference | Title | Summary | Application | Application | ||||
** (IFRS 11) | Joint Arrangements | IFRS 11 replaces IAS 31Interests in Joint Venturesand SIC-13Jointly- controlled Entities – Non-monetary Contributions by Ventures.IFRS 11 uses the principle of control in IFRS 10 to define joint control, and therefore the determination of whether joint control exists may change. In addition IFRS 11 removes the option to account for jointly controlled entities (JCEs) using proportionate consolidation. Instead, accounting for a joint arrangement is dependent on the nature of the rights and obligations arising from the arrangement. Joint operations that give the venturers a right to the underlying assets and obligations themselves is accounted for by recognising the share of those assets and obligations. Joint ventures that give the venturers a right to the net assets is accounted for using the equity method. | 1 January 2013 | 1 July 2013 | ||||
** (IFRS 12) | Disclosure of Interests in Other Entities | IFRS 12 includes all disclosures relating to an entity’s interests in subsidiaries, joint arrangements, associates and structures entities. New disclosures have been introduced about the judgements made by management to determine whether control exists, and to require summarised information about associates and subsidiaries with non-controlling interests. | 1 January 2013 | 1 July 2013 | ||||
** (IFRS 13) | Fair Value Measurement | IFRS 13 establishes a single source of guidance under IFRS for determining the fair value of assets and liabilities. IFRS 13 does not change when an entity is required to use fair value, but rather, provides guidance on how to determine fair value under IFRS when fair value is required or permitted by IFRS. Application of this definition may result in different fair values being determined for the relevant assets.
IFRS 13 also expands the disclosure requirements for all assets or liabilities carried at fair value. This includes information about the assumptions made and the qualitative impact of those assumptions on the fair value determined. | 1 January 2013 | 1 July 2013 | ||||
| * | Designates the beginning of the applicable annual reporting period unless otherwise stated |
| ** | The AASB has not issued this standard, which was finalised by the IASB in May 2011 |
The directors have not determined the impact of the above new and amended accounting standards.
| 4. | FINANCIAL RISK MANAGEMENTS OBJECTIVES AND POLICIES |
The Group’s principal financial instruments comprise cash and short-term deposits, receivables, payables, and financial liabilities.
The Group manages its exposure to key financial risks, including interest rate and currency risk in accordance with the Group’s financial risk management policy. The objective of the policy is to support the delivery of the Group’s financial targets whilst protecting future financial security.
The Group from time-to-time enters into derivative transactions, principally forward currency contracts. The purpose is to manage the currency risks arising from the Group’s operations and its sources of revenue. The main risks arising from the Group’s financial instruments are interest rate risk, foreign currency risk, credit risk and liquidity risk. The Group uses different methods to measure and manage different types of risks to which it is exposed. These include monitoring levels of exposure to interest rate and foreign exchange risk and assessments of market forecasts for interest and foreign exchange rates. Ageing analyses and monitoring of specific credit allowances are undertaken to manage credit risk, liquidity risk is monitored through the development of future rolling cash flow forecasts.
The Board reviews and agrees policies for managing each of these risks as summarised below.
Primary responsibility for identification and control of financial risks rests with the Audit Committee under the authority of the Board. The Board reviews and agrees policies for managing each of the risks identified below, including the setting of limits for hedging cover of foreign currency and interest rate risk, credit allowances, and future cash flow forecast projections.
44
NOTES TO THE FINANCIAL STATEMENTS FOR THE YEAR ENDED 30 JUNE 2011
| 4. | FINANCIAL RISK MANAGEMENTS OBJECTIVES AND POLICIES (continued) |
Risk Exposures and Responses
Interest rate risk
The Group's exposure to market interest rates relates primarily to the Group's cash, cash equivalents on deposit and term deposits with Australian banks.
The primary goal of the Group is to maximize returns on surplus cash, using deposits with maturities of less than 90 days. Management continually monitors the returns on funds invested. The Group also has a term deposit of greater than 90 days and less than 365 days that has been pledged as security to the Group’s bankers for a trade finance facility.
At balance date, the Group had the following mix of financial assets and financial liabilities exposed to Australian variable interest rate risk that are not designated in cash flow hedges:
| CONSOLIDATED | ||||||||
| 2011 | 2010 | |||||||
| $’000 | $’000 | |||||||
Financial assets | ||||||||
Cash and cash equivalents | 3,440 | 3,608 | ||||||
|
|
|
| |||||
Financial liabilities | ||||||||
Interest bearing liabilities | 648 | |||||||
Contingent consideration | 2,688 | — | ||||||
|
|
|
| |||||
| 3,336 | ||||||||
|
|
|
| |||||
The following sensitivity analysis is based on the interest rate risk exposures in existence at the balance sheet date:
At 30 June 2011, if interest rates had moved, as illustrated in the table below, with all other variables held constant, post tax profit and other comprehensive income would have been affected as follows:
| Post tax profit | Other comprehensive income | |||||||||||||||
| Higher/(Lower) | Higher/(Lower) | |||||||||||||||
| 2011 | 2010 | 2011 | 2010 | |||||||||||||
| $’000 | $’000 | $’000 | $’000 | |||||||||||||
Consolidated | ||||||||||||||||
+1% (100 basis points) | 8 | 36 | — | — | ||||||||||||
-.5% (50 basis points) | (4 | ) | (18 | ) | — | — | ||||||||||
The movements in profit are due to higher/lower interest revenue from variable rate cash balances. The sensitivity is the same in 2011 as in 2010 because the only balances affected by interest rates are cash and interest-bearing loan balances.
Foreign currency risk
As a result of the investment in Synerject LLC, an associate, the Group's income statement and statement of financial position can be affected significantly by movements in the US$/A$ exchange rates.
The Group also has transactional currency exposures. Such exposure arises from sales or purchases by an operating entity in currencies other than the functional currency.
Approximately 20% (FY2010: 17%) of the Group's sales are denominated in currencies other than the functional currency of the operating entity making the sale, whilst approximately 14% (FY2010: 26%) of costs are denominated in currencies other than the functional currency of the operating entity making the expenditure.
With respect to assets and liabilities denominated in foreign currencies, the Group ensures that its net exposure is kept to an acceptable level by buying or selling forward foreign currency contracts at spot rates when incurred. The Group does not hold foreign currency positions for trading purposes.
45
NOTES TO THE FINANCIAL STATEMENTS FOR THE YEAR ENDED 30 JUNE 2011
| 4. | FINANCIAL RISK MANAGEMENTS OBJECTIVES AND POLICIES (continued) |
Foreign currency risk (continued)
At 30 June 2011, the Group had the following exposure to US$ foreign currency that is not designated in cash flow hedges:
| CONSOLIDATED | ||||||||
| 2011 | 2010 | |||||||
| $’000 | $’000 | |||||||
Financial assets | ||||||||
Cash and cash equivalents | 68 | 195 | ||||||
Trade and other receivables | 120 | 308 | ||||||
|
|
|
| |||||
| 188 | 503 | |||||||
|
|
|
| |||||
Financial liabilities | ||||||||
Trade and other payables | 139 | — | ||||||
|
|
|
| |||||
At 30 June 2011, the Group had the following exposure to European Currency Units that is not designated in cash flow hedges:
Financial assets | ||||||||
Cash and cash equivalents | 13 | 23 | ||||||
Trade and other receivables | 23 | 48 | ||||||
|
|
|
| |||||
| 36 | 71 | |||||||
|
|
|
| |||||
Financial liabilities | ||||||||
Trade and other payables | 130 | — | ||||||
|
|
|
| |||||
The following sensitivity is based on the foreign currency risk exposures in existence at the balance sheet date:
At 30 June 2011, had the Australian Dollar moved, as illustrated in the table below, with all other variables held constant, post tax profit and other comprehensive income would have been affected as follows:
| Post Tax Profit | Other comprehensive income | |||||||||||||||
| Higher/(Lower) | Higher/(Lower) | |||||||||||||||
| 2011 | 2010 | 2011 | 2010 | |||||||||||||
| $'000 | $'000 | $'000 | $'000 | |||||||||||||
Consolidated | ||||||||||||||||
AUD/USD/EURO +10% | 4 | (46 | ) | — | — | |||||||||||
AUD/USD/EURO -5% | (2 | ) | 26 | — | — | |||||||||||
The movements in profit in 2011 are less sensitive than in 2010 due to the lower level of net US Dollar assets and the net Euro financial liabilities position at balance date.
Credit risk
Credit risk arises from the financial assets of the Group, which comprise cash and cash equivalents and trade and other receivables. The Group's exposure to credit risk arises from potential default of the counter party, with a maximum exposure equal to the carrying amount of these financial assets (as outlined in each applicable note).
The Group does not hold any credit derivatives to offset its credit exposure, however the Group does hold receivable insurance where appropriate.
It is the Group's policy that all customers who wish to trade on credit terms are subject to credit verification procedures including an assessment of their independent credit rating, financial position, past experience and industry reputation. Risk limits are set for each individual customer in accordance with parameters set by management. These risk limits are regularly monitored.
In addition, receivable balances are monitored on an ongoing basis.
There are no significant concentrations of credit risk within the Group and financial instruments are only invested with a major financial institution to minimise the risk of default of counterparties. An ageing of receivables is included in note 14.
46
NOTES TO THE FINANCIAL STATEMENTS FOR THE YEAR ENDED 30 JUNE 2011
| 4. | FINANCIAL RISK MANAGEMENTS OBJECTIVES AND POLICIES (continued) |
Liquidity risk
The Group has established a trade finance facility with its bankers. The Group does not have any other bank overdrafts, bank loans, preference shares, finance leases or committed available credit lines at 30 June 2011.
The only external borrowings of the Group are the trade finance facility repayable on terms not exceeding 180 days and the interest free Western Australian Government loan of $14,346,164 repayable in yearly instalments from May 2010 to May 2025.
The Group has recognised a contingent consideration liability of $3,474,000 payable in November 2013 to the owners of the non-controlling interest in Sprint Gas (Aust) Pty Ltd.
The table below reflects all contractually fixed pay-offs, repayments and interest resulting from recognised financial liabilities as of 30 June 2011. For all obligations the respective undiscounted cash flows for the respective upcoming fiscal years are presented. Cash flows for financial liabilities without fixed amount or timing are based on the conditions existing at 30 June 2011. The Group’s approach to managing liquidity is to ensure, as far as is possible, that it will always have sufficient liquidity to meet its liabilities when due and payable without incurring unacceptable losses or risks.
The remaining contractual maturities of the Group's financial liabilities are:
| 2011 | 2010 | |||||||
| $’000 | $’000 | |||||||
6 months or less | 5,652 | 4,732 | ||||||
6-12 months | 288 | 240 | ||||||
1-5 years | 5,329 | 1,546 | ||||||
Over 5 years | 11,763 | 12,360 | ||||||
|
|
|
| |||||
| 23,032 | 18,878 | |||||||
|
|
|
| |||||
Fair value
The methods for estimating fair value are outlined in the relevant notes to the financial statements.
The Group’s contingent consideration liability belongs to level 3 fair value hierarchy, where the inputs for the valuation of the liability are not based on observable market data (unobservable inputs)(Level 3).
The following table shows a reconciliation of the movement in the fair value of the financial instruments categorised within Level 3 between the beginning and the end of the reporting period.
At 1 July | — | — | ||||||
Recognised during the year | 2,688 | — | ||||||
Released to the income statement | — | — | ||||||
|
|
|
| |||||
At 30 June | 2,688 | — | ||||||
|
|
|
|
No gains or losses were recognised in the income statement during the current year due to a change in the fair value of the contingent consideration.
The fair value of the contingent consideration payable was calculated with reference to the estimated future value of the Sprint Gas business, which is based on an estimated average EBITDA multiple. The undiscounted value was discounted at the present value using a market discount rate of 9.8%. If the business was to perform 20% better or 20% worse than forecast the estimated fair value of the contingent consideration would increase by $531,000/decrease by $531,000 respectively
| 5. | SIGNIFICANT ACCOUNTING JUDGEMENTS, ESTIMATES AND ASSUMPTIONS |
The preparation of the financial statements requires management to make judgements, estimates and assumptions that affect the reported amounts in the financial statements. Management continually evaluates its judgements and estimates in relation to assets, liabilities, contingent liabilities, revenue and expenses. Management bases its judgements and estimates on historical experience and on other various factors it believes to be reasonable under the circumstances, the result of which form the basis of the carrying values of the assets and liabilities that are not readily apparent from other sources. Actual results may differ from these estimates under different assumptions and conditions.
Management has identified the following critical accounting policies for which significant judgements, estimates and assumptions are made. Actual results may differ from these estimates under different assumptions and conditions and may materially affect financial results or the financial position reported in future periods.
Further details of the nature of these assumptions and conditions may be found in the relevant notes to the financial statements.
47
NOTES TO THE FINANCIAL STATEMENTS FOR THE YEAR ENDED 30 JUNE 2011
| 5. | SIGNIFICANT ACCOUNTING JUDGEMENTS, ESTIMATES AND ASSUMPTIONS (continued) |
| (a) | Significant accounting judgements |
Impairment of non-financial assets other than goodwill
The Group assesses impairment of all assets at each reporting date by evaluating conditions specific to the Group and to the particular asset that may lead to impairment. These include product and manufacturing performance, technology, economic and political environments and future product expectations. If an impairment trigger exists the recoverable amount of the asset is determined. Given the current uncertain economic environment management considered that the indicators of impairment were significant enough and as such these assets have been tested for impairment in this financial period. Value in use models, based on approved budgets and forecasts, have been used to assess impairments of each cash generating unit.
Capitalised development costs
Development costs are only capitalised when it can be demonstrated that the technical feasibility of completing the intangible asset is valid so that the asset will be available for use or sale. During the reporting period the Group identified an impairment trigger in relation to the capitalised development costs for the aftermarket LPI kits and recognised an allowance for impairment of $1,065,000.
Consolidation of Sprint Gas (Aust) Pty Ltd
On 27 May 2011, Orbital Autogas Systems Pty Ltd acquired 55% of the voting shares of Sprint Gas (Aust) Pty Ltd, a new company incorporated to acquire the operating business of Sprint Gas, an Australian business specializing in the importation and wholesaling of LPG Fuel systems. Concurrently with the entering into of the Business Acquisition Agreement, the Group entered into a Subscription and Shareholders Agreement with the owners of the 45% non-controlling interest in Sprint Gas (Aust) Pty Ltd. As part of the Subscription and Shareholders Agreement Call and Put options were issued over the remaining 45% non-controlling interest. Management has determined that the Call and Put options, exercisable after 30 months, are in nature a forward contract and in substance represent contingent consideration. The Group has accounted for the business combination as though it acquired a 100% interest and has recognised a financial liability to the non-controlling shareholders equal to the fair value of the underlying obligations under the Put and Call option (Contingent consideration liability).
| (b) | Significant accounting estimates and assumptions |
Taxation
The Group's accounting policy for taxation requires management's judgement as to the types of arrangements considered to be a tax on income in contrast to an operating cost. Judgement is also required in assessing whether deferred tax assets and certain deferred tax liabilities are recognised on the balance sheet. Deferred tax assets, including those arising from unrecouped tax losses, capital losses and temporary differences, are recognised only where it is considered more likely than not that they will be recovered, which is dependent on the generation of sufficient future taxable profits. Assumptions about the generation of future taxable profits and repatriation of retained earnings depend on management's estimates of future cash flows. These depend on estimates of future production and sales volumes, operating costs, capital expenditure, dividends and other capital management transactions. Judgements are also required about the application of income tax legislation. These judgements and assumptions are subject to risk and uncertainty, hence there is a possibility that changes in circumstances will alter expectations, which may impact the amount of deferred tax assets and deferred tax liabilities recognised on the balance sheet and the amount of other tax losses and temporary differences not yet recognised. In such circumstances, some or all of the carrying amounts of recognised deferred tax assets and liabilities may require adjustment, resulting in a corresponding credit or charge to the income statement.
Share-based payment transactions
The Group measures the cost of equity-settled transactions with employees by reference to the fair value of the equity instruments at the date at which they are granted. The fair value of shares granted under the Employee Share Plan No.1 is the market value on the date of issue. The fair value of the Executive Long Term Share Plan rights is determined by an external valuer using a monte-carlo simulation model, with the assumptions detailed in note 36. The fair value of the performance rights is determined by an external valuer using a monte-carlo simulation model, with assumptions detailed in note 36. The accounting estimates and assumptions relating to equity-settled share-based payments would have no impact on the carrying amounts of assets and liabilities within the next annual reporting period but may impact expenses and equity.
Impairment of goodwill and intangibles with indefinite useful lives
The Group determines whether goodwill and intangibles with indefinite useful lives are impaired at least on an annual basis. This requires an estimation of the recoverable amount of the cash-generating units, using a value in use discounted cash flow methodology, to which the goodwill and intangibles with indefinite useful lives are allocated. No impairment loss has been recognised in the current year in respect of goodwill.
Product warranty
In determining the level of provision required for product warranties the Group has made judgements in respect of the expected performance of the product, number of customers who will actually use the product warranty and how often, and the costs of fulfilling the performance of the product warranty. Historical experience and current knowledge of the performance of products has been used in determining this provision. The related carrying amounts are disclosed in note 25.
Estimation of useful lives of assets
The estimation of the useful lives of assets has been based on historical experience as well as manufacturers' warranties (for plant and equipment). In addition, the condition of the assets is assessed at least once per year and considered against the remaining useful life. Adjustments to useful lives are made when considered necessary.
Revenue from Rendering of Services
Revenue from services rendered is recognised in the income statement in proportion to the stage of completion of the transaction at the reporting date. The stage of completion is assessed by reference to the extent of work performed. No revenue is recognised if there are significant uncertainties regarding recovery of the consideration due.
48
NOTES TO THE FINANCIAL STATEMENTS FOR THE YEAR ENDED 30 JUNE 2011
| 5. | SIGNIFICANT ACCOUNTING JUDGEMENTS, ESTIMATES AND ASSUMPTIONS (continued) |
| (b) | Significant accounting estimates and assumptions (continued) |
Recognition of contingent consideration
The Group has measured the value of the contingent consideration liability by reference to the fair values of the underlying obligations under the Put and Call options that give rise to the liability. In determining the fair values of underlying obligations under the Put and Call options the Group has made judgements in respect of the expected earnings before interest, depreciation and amortisation expected to be generated by the business during the calculation period.
| 6. | OPERATING SEGMENTS |
Identification of reportable segments
The group has identified its operating segments based on the internal reports that are reviewed and used by the executive management team (the chief operating decision makers) in assessing performance and in determining the allocation of resources.
The operating segments are identified by management based on the manner in which the product is sold, whether retail or wholesale, and the nature of the services provided, the identity of service line manager and country of origin. Discrete financial information about each of these operating businesses is reported to the executive management team on at least a monthly basis.
The reportable segments are based on the similarity of the products produced and sold and/or the services provided, as these are the sources of the Group’s major risks and have the most effect on the rates of return.
Types of products and services
Engineering services (consultancy)
The engineering services business provides consultancy services to original equipment manufacturers, engine manufacturers and government departments. The engineering services provided include research, design, development, calibration, improvement, production support, performance testing, emissions testing and certification.
Alternative fuels (sale of goods)
The alternative fuels businesses provide LPG fuel systems to an Australian automobile manufacturer, LPG retrofit installers and also operate spare parts businesses for LPG fuel systems.
Royalties and licences (intellectual property rights)
The royalties and licences business receives revenue from licensees of Orbital technologies. Applications utilising Orbital technologies include outboard engines, autorickshaws and scooters.
Accounting policies
The following items and associated assets and liabilities are not allocated to operating segments as they are not considered part of the core operations of any segment:
| • | Corporate management and finance and administration overhead expenses. |
| • | Share of profit from equity accounted investment. |
| • | Finance costs—including adjustments on provisions due to discounting. |
| • | Cash and cash equivalents. |
| • | Borrowings. |
Segment capital expenditure is the total cost incurred during the period to acquire segment assets that are expected to be used for more than one period.
Inter-segment pricing is determined on an arm’s length basis.
Geographical information
The engineering services and royalties and licences segments are managed on a worldwide basis. The alternative fuels segment is managed on an Australian basis.
In presenting geographical information revenue is based on the geographical location of customers and non-current assets are based on the geographical location of the assets.
Revenue is derived predominantly from the provision of engineering services, the sale of LPG fuel systems and the sale of intellectual property rights to Orbital’s OCP technology. The consolidated entity operates predominantly in the automotive, marine and motorcycle engine markets.
Major customers
The Group has a number of customers to which it provides both products and services. The alternative fuels segment supplies an Australian automobile manufacturer with LPG fuel systems that accounted for 12.7% of external revenue (2010: 22.9%). The next most significant customer which accounted for 12.2% (2010: 12.1%) of external revenue was in the engineering services segment. No other customer accounts for more than 10% of revenue.
49
NOTES TO THE FINANCIAL STATEMENTS FOR THE YEAR ENDED 30 JUNE 2011
| 6. | OPERATING SEGMENTS (continued) |
| (a) | Operating segments |
| Consulting Services | Alternative Fuels | Royalties and licences (i) | Consolidated | |||||||||||||||||||||||||||||
| 2011 | 2010 | 2011 | 2010 | 2011 | 2010 | 2011 | 2009 | |||||||||||||||||||||||||
| $’000 | $’000 | $’000 | $’000 | $’000 | $’000 | $’000 | $’000 | |||||||||||||||||||||||||
Segment Revenue—external customers | 9,492 | 9,621 | 5,847 | 6,203 | 1,081 | 1,199 | 16,420 | 17,023 | ||||||||||||||||||||||||
|
|
|
|
|
|
|
|
|
|
|
|
|
|
|
| |||||||||||||||||
Unallocated other revenue | 218 | 242 | ||||||||||||||||||||||||||||||
|
|
|
| |||||||||||||||||||||||||||||
Total Revenue | 16,638 | 17,265 | ||||||||||||||||||||||||||||||
|
|
|
| |||||||||||||||||||||||||||||
Segment profit/(loss) | 161 | 1,031 | (2,764 | ) | (1,727 | ) | 610 | 732 | (1,993 | ) | 36 | |||||||||||||||||||||
|
|
|
|
|
|
|
|
|
|
|
|
|
|
|
| |||||||||||||||||
Research & development | (1,158 | ) | (1,152 | ) | ||||||||||||||||||||||||||||
Unallocated expenses—net (ii) | (2,581 | ) | (3,570 | ) | ||||||||||||||||||||||||||||
Gain on restructure of WA Government Loan | — | 7,695 | ||||||||||||||||||||||||||||||
Gain on sale of property, plant and equipment | 4,760 | — | ||||||||||||||||||||||||||||||
Finance costs | (688 | ) | (755 | ) | ||||||||||||||||||||||||||||
Share of profit from equity accounted investment | 3,233 | 1,874 | ||||||||||||||||||||||||||||||
|
|
|
| |||||||||||||||||||||||||||||
Net profit/(loss) before related income tax | 1,573 | 4,128 | ||||||||||||||||||||||||||||||
|
|
|
| |||||||||||||||||||||||||||||
Income tax benefit/(expense) | 190 | 388 | ||||||||||||||||||||||||||||||
|
|
|
| |||||||||||||||||||||||||||||
Profit after tax attributable to members | 1,763 | 4,516 | ||||||||||||||||||||||||||||||
|
|
|
| |||||||||||||||||||||||||||||
| Consulting Services | Alternative Fuels | Royalties and licences | Consolidated | |||||||||||||||||||||||||||||
| 2011 | 2010 | 2011 | 2010 | 2011 | 2010 | 2011 | 2010 | |||||||||||||||||||||||||
| $’000 | $’000 | $’000 | $’000 | $’000 | $’000 | $’000 | $’000 | |||||||||||||||||||||||||
Non-cash (revenue) and expenses | ||||||||||||||||||||||||||||||||
Depreciation and amortisation | 695 | 737 | 479 | 267 | — | — | 1,174 | 1,004 | ||||||||||||||||||||||||
Equity settled employee compensation | 122 | 127 | 9 | 49 | 1 | 1 | 132 | 177 | ||||||||||||||||||||||||
Other non-cash (income)/expenses | (225 | ) | (345 | ) | 2,007 | — | — | — | 1,782 | (345 | ) | |||||||||||||||||||||
|
|
|
|
|
|
|
|
|
|
|
|
|
|
|
| |||||||||||||||||
Segment non-cash expenses | 592 | 519 | 2,495 | 316 | 1 | 1 | 3,088 | 836 | ||||||||||||||||||||||||
|
|
|
|
|
|
|
|
|
|
|
|
|
|
|
| |||||||||||||||||
Equity settled employee compensation | 202 | 163 | ||||||||||||||||||||||||||||||
Amortisation of non-interest bearing loans | 614 | 626 | ||||||||||||||||||||||||||||||
Gain on restructure of WA Government Loan | — | (7,695 | ) | |||||||||||||||||||||||||||||
Share of profit from equity accounted investment | (3,233 | ) | (1,874 | ) | ||||||||||||||||||||||||||||
Foreign exchange translation (gain)/loss | (79 | ) | 97 | |||||||||||||||||||||||||||||
|
|
|
| |||||||||||||||||||||||||||||
Total non-cash (revenue) and expenses | 592 | (7,847 | ) | |||||||||||||||||||||||||||||
|
|
|
| |||||||||||||||||||||||||||||
| (i) | Licence and royalty costs include direct patent costs and research and development. |
| (ii) | Unallocated expenses (net) include corporate management and finance and administration overhead expenses net of unallocated other income. In FY10, unallocated expenses include $595,000 of due diligence and capital raising expenses for a proposed acquisition which did not proceed. |
50
NOTES TO THE FINANCIAL STATEMENTS FOR THE YEAR ENDED 30 JUNE 2011
| 6. | OPERATING SEGMENTS (CONTINUED) |
| (a) | Operating segments |
| Consulting Services | Alternative Fuels | Royalties and licences | Consolidated | |||||||||||||||||||||||||||||
| 2011 | 2010 | 2011 | 2010 | 2011 | 2010 | 2011 | 2010 | |||||||||||||||||||||||||
| $’000 | $’000 | $’000 | $’000 | $’000 | $’000 | $’000 | $’000 | |||||||||||||||||||||||||
Segment Assets | 7,619 | 10,695 | 9,581 | 6,784 | 336 | 763 | 17,536 | 18,242 | ||||||||||||||||||||||||
|
|
|
|
|
|
|
|
|
|
|
|
|
|
|
| |||||||||||||||||
Unallocated assets | ||||||||||||||||||||||||||||||||
Cash | 3,440 | 3,608 | ||||||||||||||||||||||||||||||
Other financial assets | 3,434 | — | ||||||||||||||||||||||||||||||
Equity accounted investment in associate | 11,406 | 11,534 | ||||||||||||||||||||||||||||||
Deferred tax asset | 4,958 | 5,215 | ||||||||||||||||||||||||||||||
|
|
|
| |||||||||||||||||||||||||||||
Consolidated Total Assets | 40,774 | 38,599 | ||||||||||||||||||||||||||||||
|
|
|
| |||||||||||||||||||||||||||||
Segment Liabilities | 7,766 | 7,348 | 5,672 | 2,847 | 77 | — | 13,515 | 10,195 | ||||||||||||||||||||||||
|
|
|
|
|
|
|
|
|
|
|
|
|
|
|
| |||||||||||||||||
Unallocated liabilities | ||||||||||||||||||||||||||||||||
Borrowings | 7,777 | 7,604 | ||||||||||||||||||||||||||||||
|
|
|
| |||||||||||||||||||||||||||||
Consolidated Total Liabilities | 21,292 | 17,799 | ||||||||||||||||||||||||||||||
|
|
|
| |||||||||||||||||||||||||||||
Consolidated Net Assets | 19,482 | 20,800 | ||||||||||||||||||||||||||||||
|
|
|
| |||||||||||||||||||||||||||||
Segment acquisitions of non current assets | 217 | 827 | 857 | 1,695 | — | — | 1,074 | 2,522 | ||||||||||||||||||||||||
|
|
|
|
|
|
|
|
|
|
|
|
|
|
|
| |||||||||||||||||
Acquisitions of non-current assets represent acquisitions of property, plant and equipment of $481,000 and development of intangibles of $593,000
| (b) | Geographic information |
| Americas | Europe | Asia | Australia | Consolidated | ||||||||||||||||||||||||||||||||||||
| 2011 $’000 | 2010 $’000 | 2011 $’000 | 2010 $’000 | 2011 $’000 | 2010 $’000 | 2011 $’000 | 2010 $’000 | 2011 $’000 | 2010 $’000 | |||||||||||||||||||||||||||||||
Revenue - external customers | 3,473 | 4,032 | 889 | 282 | 1,917 | 3,665 | 10,141 | 9,044 | 16,420 | 17,023 | ||||||||||||||||||||||||||||||
Non-current assets | 16,122 | 16,749 | — | — | — | — | 6,549 | 9,436 | 22,671 | 26,185 | ||||||||||||||||||||||||||||||
| 7. | OTHER REVENUE |
| CONSOLIDATED | ||||||||
| 2011 $’000 | 2010 $’000 | |||||||
Interest revenue | 218 | 242 | ||||||
|
|
|
| |||||
51
NOTES TO THE FINANCIAL STATEMENTS FOR THE YEAR ENDED 30 JUNE 2011
| 8. | OTHER INCOME |
| CONSOLIDATED | ||||||||
| 2011 $’000 | 2010 $’000 | |||||||
Gain on sale of property, plant and equipment | 4,760 | 41 | ||||||
Automotive grant income (a) | 680 | 538 | ||||||
Net foreign exchange gains | 79 | — | ||||||
Government grant arising on restructure of non interest bearing loan (refer note 26) | — | 7,695 | ||||||
Grant income | 587 | 330 | ||||||
Other | 4 | 155 | ||||||
|
|
|
| |||||
| 6,110 | 8,759 | |||||||
|
|
|
| |||||
| (a) | The Group received Automotive Competitiveness and Investment Scheme (ACIS) credits from the Federal Government for qualifying research and development activities and accounts for these as government grants. During the year ACIS was replaced by the Automotive Transformation Scheme |
| 9. | EXPENSES |
| CONSOLIDATED | ||||||||
| 2011 $’000 | 2010 $’000 | |||||||
(a) Employee benefits expense | ||||||||
Salaries and wages | 8,249 | 8,485 | ||||||
Contributions to defined contributions superannuation funds | 892 | 914 | ||||||
Share based payments | 334 | 339 | ||||||
(Decrease)/Increase in liability for annual leave | 18 | (110 | ) | |||||
Increase in liability for long service leave | 19 | 98 | ||||||
Termination costs | 418 | 276 | ||||||
Other associated personnel expenses | 564 | 790 | ||||||
|
|
|
| |||||
| 10,494 | 10,792 | |||||||
|
|
|
| |||||
(b) Finance costs | ||||||||
Interest on borrowings | 74 | 129 | ||||||
Non-cash interest expense WA Government Loan | 614 | 626 | ||||||
|
|
|
| |||||
| 688 | 755 | |||||||
|
|
|
| |||||
(c) Other expenses | ||||||||
Administration | 234 | 284 | ||||||
Marketing | 73 | 97 | ||||||
Investor relations | 28 | 88 | ||||||
(Write-back)/allowance for impairment of receivables | 43 | (114 | ) | |||||
Write-off previously capitalised development expenditure | 1,065 | — | ||||||
Net foreign exchange losses | — | 97 | ||||||
Other | 334 | 293 | ||||||
|
|
|
| |||||
| 1,777 | 745 | |||||||
|
|
|
| |||||
52
NOTES TO THE FINANCIAL STATEMENTS FOR THE YEAR ENDED 30 JUNE 2011
| 9. | EXPENSES (continued) |
| CONSOLIDATED | ||||||||||
| 2011 | 2010 | |||||||||
| $’000 | $’000 | |||||||||
(d) | Inventory expenses | |||||||||
Raw materials and consumables purchased | 4,208 | 5,245 | ||||||||
Inventory write-downs (Note 15) | 942 | — | ||||||||
Change in inventories | (666 | ) | (638 | ) | ||||||
|
|
|
| |||||||
| 4,484 | 4,607 | |||||||||
|
|
|
| |||||||
(e) | Lease payments included in income statement | |||||||||
Minimum lease payments - operating lease | 490 | 171 | ||||||||
|
|
|
| |||||||
(f) | Research and development costs | |||||||||
Research and development costs charged directly to the income statement: | ||||||||||
- LPI development | — | 275 | ||||||||
- Green Car Innovation Fund project | 963 | — | ||||||||
- Other research & development | 195 | 877 | ||||||||
|
|
|
| |||||||
| 1,158 | 1,152 | |||||||||
|
|
|
| |||||||
| 10. | INCOME TAX |
| (a) | Recognised in the income statement |
| CONSOLIDATED | ||||||||
| 2011 | 2010 | |||||||
| $’000 | $’000 | |||||||
Current income tax | ||||||||
Current year (expense)/benefit | (342 | ) | 79 | |||||
Prior year under provided | — | (108 | ) | |||||
|
|
|
| |||||
| (342 | ) | (29 | ) | |||||
|
|
|
| |||||
Deferred tax | ||||||||
Relating to originating and reversing temporary differences | — | (2,826 | ) | |||||
Benefit on recognition of tax losses | 532 | 3,243 | ||||||
|
|
|
| |||||
| 532 | 417 | |||||||
|
|
|
| |||||
Total income tax benefit in income statement | 190 | 388 | ||||||
|
|
|
| |||||
53
NOTES TO THE FINANCIAL STATEMENTS FOR THE YEAR ENDED 30 JUNE 2011
| 10. | INCOME TAX (continued) |
| (b) | Numerical reconciliation between tax benefit and pre-tax net profit |
| CONSOLIDATED | ||||||||
| 2011 | 2010 | |||||||
| $’000 | $’000 | |||||||
Profit before tax | 1,573 | 4,128 | ||||||
|
|
|
| |||||
Income tax using the statutory tax rates | (472 | ) | (1,238 | ) | ||||
- Non deductible expenditure | (711 | ) | (1,193 | ) | ||||
- Non assessable items | 706 | 444 | ||||||
- Deferred tax assets not brought to account in prior years now recognised | 922 | 2,404 | ||||||
- Net withholding tax recouped/(paid) | (70 | ) | 202 | |||||
- United States of America Federal and State taxes | (185 | ) | (123 | ) | ||||
- Under provided for in prior periods | — | (108 | ) | |||||
|
|
|
| |||||
Income tax benefit on pre-tax net profit | 190 | 388 | ||||||
|
|
|
| |||||
| c) | Tax consolidation |
(i) Members of the tax consolidated group and the tax sharing arrangement
Orbital Corporation Limited and its 100% owned Australian resident subsidiaries formed a tax consolidated group with effect from 1 July 2002. Orbital Corporation Limited is the head entity of the tax consolidated group. Members of the group have entered into a tax sharing agreement that provides for the allocation of income tax liabilities between the entities should the head entity default on its tax payment obligations. No amounts have been recognised in the financial statements in respect of this agreement on the basis that the possibility of default is remote.
| 11. | EARNINGS PER SHARE |
Basic earnings per share
The calculation of basic earnings per share at 30 June 2011 was based on the profit attributable to ordinary shareholders of $1,763,084 (2010: profit $4,515,451) and a weighted average number of ordinary shares outstanding during the financial year ended 30 June 2011 of 48,325,837 shares (2010: 48,086,676 shares), calculated as follows:
| $ | $ | |||||||
Profit attributable to ordinary shareholders | 1,763,084 | 4,515,451 | ||||||
|
|
|
| |||||
Weighted average number of ordinary shares (1) | Number | Number | ||||||
Weighted average number of ordinary shares at 30 June | 48,325,837 | 48,086,676 | ||||||
Effect of potential dilutive ordinary shares | — | 539,125 | ||||||
|
|
|
| |||||
Weighted average number of potential dilutive ordinary shares at 30 June | 48,325,837 | 48,625,801 | ||||||
|
|
|
| |||||
| Earnings per share | cents | cents | ||||||
Basic earnings per share | 3.65 | 9.39 | ||||||
|
|
|
| |||||
Diluted earnings per share | 3.65 | 9.29 | ||||||
|
|
|
| |||||
Shares granted to employees (including Key Management Personnel) as described in note 36 are considered to be potential ordinary shares and have been included in the determination of the diluted earnings per share to the extent they are dilutive. These potential ordinary shares have not been included in the determination of basic earnings per share. In the current year, no potential shares which are issuable under the ELTSP have been included in the diluted earnings per share calculation. The 2,849,800 rights granted under the ELTSP and the 1,150,000 performance rights have not been included in the diluted earnings per share calculation as they are contingent on future performance.
(1) Share Consolidation
On 28 October, 2010 the shareholders in Annual General Meeting approved the consolidation of ordinary shares on the basis that every ten ordinary shares be consolidated into one ordinary share, and where this consolidation results in a fraction of a share being held by a shareholder, the directors of the Company be authorised to round that fraction up to the nearest whole share. The share consolidation became effective on 28 October, 2010. The effect of the share consolidation has been retroactively applied to the number of shares outstanding and earnings per share calculations above.
54
NOTES TO THE FINANCIAL STATEMENTS FOR THE YEAR ENDED 30 JUNE 2011
| 12. | CASH AND CASH EQUIVALENTS |
| CONSOLIDATED | ||||||||
| 2011 | 2010 | |||||||
| $’000 | $’000 | |||||||
Cash at bank | 1,181 | 148 | ||||||
Cash at bank - US dollars | 68 | 195 | ||||||
Cash at bank - European currency units | 13 | 23 | ||||||
At call deposits - financial institutions | 2,178 | 3,242 | ||||||
|
|
|
| |||||
| 3,440 | 3,608 | |||||||
|
|
|
| |||||
| 13. | OTHER FINANCIAL ASSETS |
Short term deposits - financial institutions | 3,434 | — | ||||||
|
|
|
| |||||
| 3,434 | — | |||||||
|
|
|
|
Short term deposits represents term deposits with financial institutions for periods greater than 90 days and less than 365 days earning interest at the respective term deposit rates at time of lodgement.
Due to the short term nature of the deposits carrying value approximates fair value. Short term deposits are only invested with a major financial institution to minimise the risk of default of counterparties.
| 14. | TRADE AND OTHER RECEIVABLES |
Current | ||||||||
Trade receivables | 6,284 | 4,138 | ||||||
Allowance for impairment loss (a) | (154 | ) | (116 | ) | ||||
|
|
|
| |||||
| 6,130 | 4,022 | |||||||
Accrued royalties | 288 | 734 | ||||||
Taxation instalments | 48 | 141 | ||||||
Other receivables | 117 | 71 | ||||||
Prepayments | 258 | 116 | ||||||
|
|
|
| |||||
| 6,841 | 5,084 | |||||||
|
|
|
|
| (a) | Allowance for impairment loss |
Trade receivables are non-interest bearing and are generally on 30-60 day terms. An allowance for impairment loss is recognised when there is objective evidence that an individual trade receivable is impaired. An impairment allowance account of $154,000 (2010: $116,000) has been recognised by the Group at balance date. Movement in this allowance account has been included in the other expenses item.
Movements in the allowance for impairment loss were as follows:
At 1 July | (116 | ) | (230 | ) | ||||
Write-back/(charge) for the year | (43 | ) | 114 | |||||
Amounts written off | 5 | — | ||||||
|
|
|
| |||||
At 30 June | (154 | ) | (116 | ) | ||||
|
|
|
|
55
NOTES TO THE FINANCIAL STATEMENTS FOR THE YEAR ENDED 30 JUNE 2011
| 14. | TRADE AND OTHER RECEIVABLES (continued) |
| (a) | Allowance for impairment loss |
At 30 June, the ageing analysis of trade receivables is as follows:
| Total | 0-30 days | 31-60 days | 61-90 days PDNI* | +91 days PDNI* | +91 days CI* | |||||||||||||||||||
2011 Consolidated | 6,284 | 4,484 | 1,097 | 267 | 282 | 154 | ||||||||||||||||||
2010 Consolidated | 4,138 | 2,494 | 1,009 | 419 | 100 | 116 | ||||||||||||||||||
| * | Past due not impaired (‘PDNI’) |
| Considered | impaired (‘CI’) |
Receivables past due but not considered impaired are $549,000 (2010:$519,000). Payment terms on these amounts have not been re-negotiated. Management has been in contact with each relevant debtor and is satisfied that payment will be received in full.
Other balances within trade and other receivables do not contain impaired assets and are not past due. It is expected that these other balances will be received when due.
| (b) | Fair value and credit risk |
Due to the short term nature of these receivables, their carrying value is assumed to approximate fair value.
The maximum exposure to credit risk is the fair value of receivables. Collateral is not held as security.
| (c) | Foreign exchange and interest rate risk |
Detail regarding foreign exchange and interest rate risk exposure is disclosed in note 4.
| 15. | INVENTORIES |
| CONSOLIDATED | ||||||||
| 2011 | 2010 | |||||||
| $’000 | $’000 | |||||||
Materials and production supplies - at lower of cost and net realisable value | 4,388 | 3,722 | ||||||
|
|
|
| |||||
| (a) | Inventory expense |
Inventories recognised as an expense for the year ended 30 June 2011 totalled $4,484,000 (2010: $4,607,000) for the Group (Refer to Note 9(d)).
Inventory write-downs recognised as an expense totalled $942,000 (2010: $nil) for the Group as a result of the contraction of the Australian LPG retrofit market (Refer to Note 19(c)).
56
NOTES TO THE FINANCIAL STATEMENTS FOR THE YEAR ENDED 30 JUNE 2011
| 16. | INVESTMENT IN ASSOCIATE |
| (a) | Interest in Synerject LLC |
On 31 March 2009 the Group sold an 8% share of Synerject LLC to Continental Corporation. The sale of the interest to Continental Corporation resulted in a loss of joint control of Synerject, as such the investment is now recognised and disclosed as an investment in an associate.
The principal activities of Synerject LLC are the marketing, sale and manufacture, including research and development in the area of engine management systems and components in the marine, recreational, motorcycle and utility markets.
The Group accounts for the investment in Synerject using the equity method.
The Group has the following interests in Synerject:
| Name | Principal activities | Country of incorporation | Financial Year end | 30 June Ownership | ||||||||||||||
| 2011 | 2010 | |||||||||||||||||
Synerject LLC | Manufacture of engine management systems | USA | 31 December | 42 | % | 42 | % | |||||||||||
Summarised financial information relating to Synerject at 30 June 2011 is as follows:
Revenues (100%) | Profit (100%) | Total Assets (100%) | Total Liabilities (100%) | Net assets (100%) | ||||||||||||||||
| US$’000 | US$’000 | US$’000 | US$’000 | US$’000 | ||||||||||||||||
30 June 2011 | 120,834 | 6,500 | 53,810 | 33,025 | 20,785 | |||||||||||||||
30 June 2010 | 90,375 | 4,744 | 46,071 | 29,688 | 16,383 | |||||||||||||||
Revenues (100%) | Profit (100%) | Share of Synerject’s net profit recognised | Total Assets (100%) | Total Liabilities | Net assets as reported by Synerject (100%) | Share of Synerject’s net assets equity accounted | ||||||||||||||||||||||
| A$’000 | A$’000 | A$’000 | A$’000 | A$’000 | A$’000 | A$’000 | ||||||||||||||||||||||
30 June 2011 | 122,314 | 6,580 | 3,233 | 50,107 | 30,752 | 19,355 | 11,406 | |||||||||||||||||||||
30 June 2010 | 104,323 | 5,476 | 1,874 | 53,478 | 34,461 | 19,017 | 11,534 | |||||||||||||||||||||
| (b) | Movements in the carrying amount of the Group”s interest in Synerject |
| CONSOLIDATED | ||||||||
| 2011 | 2010 | |||||||
| $’000 | $’000 | |||||||
Beginning of year | 11,534 | 11,264 | ||||||
Share of profits after tax | 3,233 | 1,874 | ||||||
Share of reserves | 343 | (357 | ) | |||||
Dividends received | (1,208 | ) | (677 | ) | ||||
Unrealised foreign exchange movements | (2,496 | ) | (570 | ) | ||||
|
|
|
| |||||
End of year | 11,406 | 11,534 | ||||||
|
|
|
| |||||
57
NOTES TO THE FINANCIAL STATEMENTS FOR THE YEAR ENDED 30 JUNE 2011
| 16. | INVESTMENT IN ASSOCIATE (continued) |
| (c) | Results of Synerject |
| CONSOLIDATED | ||||||||
| 2011 | 2010 | |||||||
| $’000 | $’000 | |||||||
Share of Synerject’s profit before income tax | 2,835 | 2,363 | ||||||
Share of income tax expense | (71 | ) | (87 | ) | ||||
|
|
|
| |||||
Share of Synerject’s net profit—as disclosed by Synerject | 2,764 | 2,276 | ||||||
Adjustments: | ||||||||
- dissimilar accounting treatment with respect to revenue recognition | 357 | (402 | ) | |||||
- dissimilar accounting treatment with respect to development expenditure | 98 | (354 | ) | |||||
- dissimilar accounting treatment with respect to intangibles | 14 | 354 | ||||||
|
|
|
| |||||
Share of jointly controlled entity’s net profit accounted for using the equity method | 3,233 | 1,874 | ||||||
|
|
|
| |||||
| (d) | Commitments |
Share of Synerject’s capital commitments contracted but not provided for or payable: | ||||||||
Within one year | 292 | 649 | ||||||
One year or later and no later than five years | 1,014 | 1,349 | ||||||
Later than 5 years | 467 | 741 | ||||||
|
|
|
| |||||
| 1,773 | 2,739 | |||||||
|
|
|
|
58
NOTES TO THE FINANCIAL STATEMENTS FOR THE YEAR ENDED 30 JUNE 2011
| 17. | DEFERRED TAX ASSETS AND LIABILITIES |
Recognised deferred tax assets and liabilities
Deferred tax assets and liabilities are attributable to the following:
| Consolidated | Deferred Tax Assets | Deferred Tax Liabilities | Net | |||||||||||||||||||||
| 2011 | 2010 | 2011 | 2010 | 2011 | 2010 | |||||||||||||||||||
| $’000 | $’000 | $’000 | $’000 | $’000 | $’000 | |||||||||||||||||||
Tax value of loss carry-forwards recognised | 4,716 | 5,215 | — | — | 4,716 | 5,215 | ||||||||||||||||||
Other net temporary differences (a) | 2,301 | 2,197 | (2,059 | ) | (2,197 | ) | 242 | — | ||||||||||||||||
|
|
|
|
|
|
|
|
|
|
|
| |||||||||||||
Net tax assets | 7,017 | 7,412 | (2,059 | ) | (2,197 | ) | 4,958 | 5,215 | ||||||||||||||||
|
|
|
|
|
|
|
|
|
|
|
| |||||||||||||
| Unrecognised | deferred tax assets |
Deferred tax assets have not been recognised in respect of the following items:
| Consolidated | ||||||||
| 2011 | 2010 | |||||||
| $’000 | $’000 | |||||||
| Australia (net at 30%) | ||||||||
Tax losses | 17,907 | 17,654 | ||||||
Timing difference from provision for capital loss on investment | 1,934 | 1,934 | ||||||
Other net temporary differences | 233 | (207 | ) | |||||
|
|
|
| |||||
| 20,074 | 19,381 | |||||||
|
|
|
| |||||
United States of America (net at 34%) | ||||||||
Tax losses | 8,588 | 10,632 | ||||||
Other net temporary differences | 3,339 | 5,075 | ||||||
|
|
|
| |||||
| 11,927 | 15,707 | |||||||
|
|
|
| |||||
| (a) | Other net temporary differences |
Annual leave | 339 | 259 | ||||||
Long service leave | 407 | 401 | ||||||
Staff bonus | 15 | 173 | ||||||
Revenue in advance | 1,122 | 964 | ||||||
Impairment allowance | 320 | — | ||||||
Other | (208 | ) | 193 | |||||
Government loan | (1,851 | ) | (2,023 | ) | ||||
Accelerated depreciation: plant & equipment | 89 | (174 | ) | |||||
|
|
|
| |||||
Net temporary differences | 233 | (207 | ) | |||||
|
|
|
|
Under the tax laws of the United States, tax losses that cannot be fully utilised for tax purposes during the current year may be carried forward, subject to some statutory limitations, to reduce taxable income in future years. At 30 June 2011, the available tax carry forward losses of US$40,154,383 (2010: US$45,034,834) expire between the years 2012 and 2024.
59
NOTES TO THE FINANCIAL STATEMENTS FOR THE YEAR ENDED 30 JUNE 2011
| 17. | DEFERRED TAX ASSETS AND LIABILITIES (continued) |
Movement in temporary differences during the year
| Consolidated | ||||||||||||||||||||
Balance 1-Jul-09 | Acquired during the year | Recognised in income | Recognised in equity (b) | Balance 30-Jun-10 | ||||||||||||||||
| $’000 | $’000 | $’000 | $’000 | $’000 | ||||||||||||||||
Tax value of loss carry-forwards recognised | 5,054 | — | 417 | (256 | ) | 5,215 | ||||||||||||||
|
|
|
|
|
|
|
|
|
| |||||||||||
Net tax assets | 5,054 | — | 417 | (256 | ) | 5,215 | ||||||||||||||
|
|
|
|
|
|
|
|
|
| |||||||||||
| Consolidated | ||||||||||||||||||||
Balance 1-Jul-10 | Acquired during the year | Recognised in income | Recognised in equity (b) | Balance 30-Jun-11 | ||||||||||||||||
| $’000 | $’000 | $’000 | $’000 | $’000 | ||||||||||||||||
Tax value of loss carry-forwards recognised | 5,215 | — | 532 | (1,031 | ) | 4,716 | ||||||||||||||
Other temporary differences | — | 242 | — | — | 242 | |||||||||||||||
|
|
|
|
|
|
|
|
|
| |||||||||||
Net tax assets | 5,215 | 242 | 532 | (1,031 | ) | 4,958 | ||||||||||||||
|
|
|
|
|
|
|
|
|
| |||||||||||
| (b) | The amounts recognised through equity represent the foreign exchange differences arising on the translation of the foreign subsidiary. |
| 18. | PROPERTY, PLANT AND EQUIPMENT |
| CONSOLIDATED | ||||||||
| 2011 | 2010 | |||||||
| $’000 | $’000 | |||||||
Freehold land | ||||||||
At cost | — | 1,091 | ||||||
|
|
|
| |||||
Buildings | ||||||||
At cost | — | 3,057 | ||||||
Less: accumulated depreciation | — | (1,137 | ) | |||||
|
|
|
| |||||
| — | 1,920 | |||||||
|
|
|
| |||||
Plant and equipment | ||||||||
At cost | 21,693 | 22,336 | ||||||
Less: accumulated depreciation | (17,559 | ) | (17,436 | ) | ||||
|
|
|
| |||||
| 4,134 | 4,900 | |||||||
|
|
|
| |||||
Total property, plant and equipment—net book value | 4,134 | 7,911 | ||||||
|
|
|
| |||||
60
NOTES TO THE FINANCIAL STATEMENTS FOR THE YEAR ENDED 30 JUNE 2011
| 18. | PROPERTY, PLANT AND EQUIPMENT (continued) |
Reconciliations
Reconciliations of the carrying amounts for each class of property, plant and equipment are set out below:
| CONSOLIDATED | ||||||||
| 2011 | 2010 | |||||||
| $’000 | $’000 | |||||||
Freehold land | ||||||||
Carrying amount at beginning of year | 1,091 | 1,091 | ||||||
Disposals | (1,091 | ) | — | |||||
|
|
|
| |||||
Carrying amount at end of year | — | 1,091 | ||||||
|
|
|
| |||||
Buildings | ||||||||
Carrying amount at beginning of year | 1,920 | 2,002 | ||||||
Disposals | (1,866 | ) | — | |||||
Depreciation | (54 | ) | (82 | ) | ||||
|
|
|
| |||||
Carrying amount at end of year | — | 1,920 | ||||||
|
|
|
| |||||
Plant and equipment | ||||||||
Carrying amount at beginning of year | 4,900 | 4,304 | ||||||
Additions | 481 | 1,394 | ||||||
Acquired in business combination | 468 | — | ||||||
Disposals | (839 | ) | (3 | ) | ||||
Depreciation | (876 | ) | (795 | ) | ||||
|
|
|
| |||||
Carrying amount at end of year | 4,134 | 4,900 | ||||||
|
|
|
| |||||
Total | ||||||||
Carrying amount at beginning of year | 7,911 | 7,397 | ||||||
|
|
|
| |||||
Carrying amount at end of year | 4,134 | 7,911 | ||||||
|
|
|
| |||||
All property, plant and equipment of the Group are subject to floating charges from the Group’s banker (see note 22) and from the Government of Western Australia (see note 26).
| 19. | INTANGIBLES AND GOODWILL |
| Net carrying value | ||||||||
Goodwill acquired in business combinations | ||||||||
At cost | 1,736 | 363 | ||||||
|
|
|
| |||||
Capitalised development expenditure | ||||||||
At cost | 1,891 | 1,298 | ||||||
Less: accumulated amortisation | (389 | ) | (136 | ) | ||||
Less: allowance for impairment | (1,065 | ) | — | |||||
|
|
|
| |||||
| 437 | 1,162 | |||||||
|
|
|
| |||||
Total intangibles and goodwill—net book value | 2,173 | 1,525 | ||||||
|
|
|
| |||||
61
NOTES TO THE FINANCIAL STATEMENTS FOR THE YEAR ENDED 30 JUNE 2011
| 19. | INTANGIBLES AND GOODWILL (continued) |
| CONSOLIDATED | ||||||||
| 2011 | 2010 | |||||||
| $’000 | $’000 | |||||||
(a) Reconciliation of carrying amounts at the beginning and end of the period | ||||||||
Reconciliations of the carrying amounts for goodwill | ||||||||
Carrying amount at beginning of year | 363 | 363 | ||||||
Goodwill arising from acquisition of Sprint Gas business (note 38) | 1,373 | — | ||||||
|
|
|
| |||||
Carrying amount at end of year | 1,736 | 363 | ||||||
|
|
|
| |||||
Reconciliations of the carrying amounts for capitalised development expenditure | ||||||||
Carrying amount at beginning of year | 1,162 | 170 | ||||||
Additions | 593 | 1,128 | ||||||
Write-off of previously capitalised development expenditure | (1,065 | ) | — | |||||
Amortisation | (253 | ) | (136 | ) | ||||
|
|
|
| |||||
Carrying amount at end of year | 437 | 1,162 | ||||||
|
|
|
| |||||
(b) Description of the Group’s intangible assets and goodwill
Goodwill
The goodwill arose on the acquisitions of Boral Alternative Fuel Systems on 26 June 2008 ($363,000) and Sprint Gas (Aust) Pty Ltd on 27 May 2011 ($1,373,000).
After initial recognition, goodwill acquired in a business combination is measured at cost less any accumulated impairment losses. Goodwill is not amortised but is subject to impairment testing on an annual basis or whenever there is an indication of impairment.
Capitalised development expenditure
Expenditure on development activities relating to next generation LPG fuel systems for the Ford EcoLPI Falcon have been capitalised. The EcoLPI range of Falcon vehicles were launched by Ford Australia in July 2011.
(c) Impairment losses recognised
(i) Continuing operations
An impairment loss of $1,065,000 on previously capitalised development expenditure was recognised for continuing operations in the 2011 financial year (2010: $nil). The impaired development expenditure related to the development of LPG fuel systems for aftermarket conversions. The impairment loss was recognised as a result of the contraction of the Australian LPG retrofit market, which led to a significant decrease in the number of vehicles being converted to LPG during the reporting period and to lower than expected penetration of our Liquid LPG product into this contracting market. The assessment of recoverable amount was based on a value in use model using a discount arte of 18.4% and was determined at the cash-generating unit level. The cash-generating unit consists of the capitalised development costs relating to the reportable Alternative Fuels Segment. The impairment loss has been recognised in the income statement in the line item “other expenses”.
(d) Impairment tests for goodwill and intangibles with indefinite useful lives
(i) Description of the cash generating units and other relevant information
Goodwill acquired through business combinations have been allocated to and are tested at the level of their respective cash generating units, each of which is an operating segment within the same reportable segment (refer to note 6), for impairment testing as follows:
| • | Orbital Autogas Systems cash generating unit |
| • | Sprint Gas cash generating unit |
Orbital Autogas Systems cash generating unit
The recoverable amount of the Orbital Autogas Systems cash generating unit has been determined based on a value in use calculation using cash flow projections as at 30 June 2011 based on financial budgets approved by management covering a five-year period.
The pre-tax, risk-adjusted discount rate applied to these cash flow projections is 18.4%.
Sprint Gas cash generating unit
The recoverable amount of the Sprint Gas cash generating unit has been determined based on a value in use calculation using cash flow projections as at 30 June 2011 based on financial budgets approved by management covering a five-year period.
The pre-tax, risk-adjusted discount rate applied to these cash flow projections is 18.4%.
62
NOTES TO THE FINANCIAL STATEMENTS FOR THE YEAR ENDED 30 JUNE 2011
| 19. | INTANGIBLES AND GOODWILL (continued) |
(ii) Carrying amount of goodwill and intangible assets allocated to each of the cash generating units
The carrying amounts of goodwill and intangible assets allocated to the Orbital Autogas Systems segment and to the Sprint Gas segment are shown below:
| Orbital Autogas Systems | Sprint Gas | Total | ||||||||||||||||||||||
| 2011 | 2010 | 2011 | 2010 | 2011 | 2010 | |||||||||||||||||||
| $’000 | $’000 | $’000 | $’000 | $’000 | $’000 | |||||||||||||||||||
Carrying amount of goodwill | 363 | 363 | 1,373 | — | 1,736 | 363 | ||||||||||||||||||
Carrying amount of capitaliseddevelopment expenditure | 437 | 1,162 | — | — | 437 | 1,162 | ||||||||||||||||||
|
|
|
|
|
|
|
|
|
|
|
| |||||||||||||
(iii) Key assumptions used in value in use calculations for the Orbital Autogas Systems and Sprint Gas units, respectively, for 30 June 2011 and 30 June 2010
The calculations of value in use for the Orbital Autogas Systems and Sprint Gas cash generating units are most sensitive to the following assumptions:
| • | Revenue |
| • | Gross margins |
| • | Discount rates |
Revenues —revenues for the Orbital Autogas Systems unit are based on expected volumes of production of the Ford EcoLPI Falcon by its largest customer, Ford Australia, over the budget period and for the Sprint Gas unit are based on values achieved in the years preceding the start of the budget period.
Gross margins —gross margins are based on the average values achieved in the years preceding the start of the budget period.
Discount rates— discount rates reflect management’s estimate of the time value of money and the risks specific to each unit that are not already reflected in the cash flows. In determining appropriate discount rates for each unit, regard has been given to the external borrowing rate of the entity as a whole.
(iv) Sensitivity to changes in assumptions
Orbital Autogas Systems sales unit
With regard to the assessment of the value in use of the Orbital Autogas Systems sales unit, management believe that no reasonably possible change in any of the above key assumptions would cause the carrying value of the unit to materially exceed its recoverable amount.
Sprint Gas sales unit
With regard to the assessment of the value in use of the Sprint Gas sales unit, management believe that no reasonably possible change in any of the above key assumptions would cause the carrying value of the unit to materially exceed its recoverable amount.
| 20. | TRADE PAYABLES AND OTHER LIABILITIES |
| CONSOLIDATED | ||||||||
| 2011 | 2010 | |||||||
| $’000 | $’000 | |||||||
Current | ||||||||
Trade creditors and accruals | 3,453 | 2,047 | ||||||
Revenues received in advance | 1,551 | 629 | ||||||
|
|
|
| |||||
| 5,004 | 2,676 | |||||||
|
|
|
| |||||
| (a) | Fair value |
Due to the short term nature of trade payables and other liabilities, their carrying value is assumed to approximate their fair value.
| (b) | Interest rate, foreign exchange and liquidity risk |
Information regarding interest rate, foreign exchange and liquidity risk exposure is set out in note 4.
63
NOTES TO THE FINANCIAL STATEMENTS FOR THE YEAR ENDED 30 JUNE 2011
| 21. | INTEREST BEARING LOANS AND BORROWINGS |
| CONSOLIDATED | ||||||||||
| 2011 | 2010 | |||||||||
| Note | $’000 | $’000 | ||||||||
Current | ||||||||||
Loans and advances - secured (a) | 648 | 2,056 | ||||||||
|
|
|
| |||||||
| (a) | Security |
A first ranking mortgage debenture with fixed and floating charges over the whole of the assets has been granted to the Company’s banker for the establishment of the credit facilities and forward exchange contracts totalling $3,365,000 (2010: $3,800,000).
| (b) | Maturity |
All loans and advances have a maturity of no greater than 180 days.
| (c) | Interest |
Interest calculations are based on fixed interest rates applicable at the date of drawdown and payable on maturity. The average interest rate on borrowings outstanding at reporting date is 8.49% (2010: 8.00%).
| (d) | Fair value |
Due to the short term nature of these loans, their carrying value is assumed to approximate their fair value.
| (e) | Interest rate, foreign exchange and liquidity risk |
Information regarding interest rate, foreign exchange and liquidity risk exposure is set out in note 4.
| 22. | FINANCING ARRANGEMENTS |
The consolidated entity has standby arrangements with Westpac Banking Corporation to provide support facilities:
Total facilities available | ||||||||||||
Forward exchange contracts facility | 200 | 350 | ||||||||||
Trade finance facility | 2,500 | 2,500 | ||||||||||
Corporate credit card facility | 200 | 200 | ||||||||||
Bank guarantee | 465 | — | ||||||||||
Multi-option credit facility | — | 750 | ||||||||||
|
|
|
| |||||||||
| 3,365 | 3,800 | |||||||||||
|
|
|
| |||||||||
Facilities utilised at balance date | ||||||||||||
Forward exchange contracts facility | — | — | ||||||||||
Trade finance facility | 21 | 648 | 2,056 | |||||||||
Corporate credit card facility | 34 | 29 | ||||||||||
Bank guarantee | 465 | — | ||||||||||
Multi-option credit facility | — | — | ||||||||||
|
|
|
| |||||||||
| 1,147 | 2,085 | |||||||||||
|
|
|
| |||||||||
Facilities not utilised at balance date | ||||||||||||
Forward exchange contracts facility | 200 | 350 | ||||||||||
Trade finance facility | 1,852 | 444 | ||||||||||
Corporate credit card facility | 166 | 171 | ||||||||||
Bank guarantee | — | — | ||||||||||
Multi-option credit facility | — | 750 | ||||||||||
|
|
|
| |||||||||
| 2,218 | 1,715 | |||||||||||
|
|
|
| |||||||||
A first ranking mortgage debenture with fixed and floating charges over the whole of the assets has been granted to the Company’s banker for the establishment of the credit facilities and forward exchange contracts totalling $3,365,000 (2010: $3,800,000).
The Company has also provided the Company’s banker with security over a short term deposit of $3,365,000 (2010: $nil) held by the Company’s banker as cash collateral for the financing facilities.
The bank guarantee has been provided for the benefit of the landlord of the Balcatta premises.
64
NOTES TO THE FINANCIAL STATEMENTS FOR THE YEAR ENDED 30 JUNE 2011
| 23. | EMPLOYEE BENEFITS |
| CONSOLIDATED | ||||||||
| 2011 | 2010 | |||||||
| $’000 | $’000 | |||||||
(a) Current | 2,354 | 2,420 | ||||||
|
|
|
| |||||
(b) Non-Current | 132 | 455 | ||||||
|
|
|
| |||||
(c) Aggregate Liability for employee entitlements | 2,486 | 2,875 | ||||||
|
|
|
| |||||
The present value of employee entitlements not expected to be settled within twelve months of balance date have been calculated using the following weighted averages:
Assumed rate of increase in wage and salary rates | 4.0 | % | 3.5 | % | ||||
Discount rate at 30 June | 5.1 | % | 5.2 | % | ||||
Settlement term (years) | 10 | 10 | ||||||
Number of employees | ||||||||
Number of employees at year end | 118 | 102 | ||||||
|
|
|
| |||||
| 24. | DEFERRED REVENUE |
| (a) | Current |
| CONSOLIDATED | ||||||||
| 2011 | 2010 | |||||||
| $’000 | $’000 | |||||||
Deferred revenue for operation of heavy duty engine testing facility | 316 | 316 | ||||||
|
|
|
| |||||
| (b) | Movement in deferred revenue |
At 1 July | 316 | — | ||||||
Transferred from government grants (see note 27) | — | 512 | ||||||
Released to the income statement | — | (196 | ) | |||||
|
|
|
| |||||
At 30 June | 316 | 316 | ||||||
|
|
|
|
In June 2008 the Group received funding of $2,760,000 from the Commonwealth of Australia through the Alternative Fuels Conversion Program administered by the Department of the Environment, Water, Heritage and the Arts towards the construction of a heavy duty engine test facility. The terms of the Grant included providing the Commonwealth with preferential access to the facility at a discount to the commercial rate. This discount to commercial rates of $512,000 has been transferred from government grants (see note 27) and recorded as deferred revenue.
The deferred revenue will be recognised as income over the periods in which the Commonwealth utilises the Heavy Duty Engine Testing Facility at discounted rates.
65
NOTES TO THE FINANCIAL STATEMENTS FOR THE YEAR ENDED 30 JUNE 2011
| 25. | OTHER PROVISIONS |
| CONSOLIDATED | ||||||||||
| 2011 | 2010 | |||||||||
| $’000 | $’000 | |||||||||
(a) | Current | |||||||||
| Warranties | 88 | 119 | ||||||||
| Surplus lease space | 37 | — | ||||||||
| Other | 70 | 54 | ||||||||
|
|
|
| |||||||
| 195 | 173 | |||||||||
|
|
|
| |||||||
(b) | Non-Current | |||||||||
| Surplus lease space | 304 | — | ||||||||
|
|
|
| |||||||
| 304 | — | |||||||||
|
|
|
| |||||||
(c) | Reconciliations | |||||||||
| Reconciliations of the carrying amounts for each class of provisions are set out below: | ||||||||||
| Warranties - current | ||||||||||
| Carrying amount at beginning of year | 119 | 92 | ||||||||
| Arising during the year | 91 | 67 | ||||||||
| Utilised | (122 | ) | (40 | ) | ||||||
|
|
|
| |||||||
| Carrying amount at end of year | 88 | 119 | ||||||||
|
|
|
| |||||||
| Surplus lease space - current | ||||||||||
| Carrying amount at beginning of year | — | — | ||||||||
| Utilised | (13 | ) | — | |||||||
| Reclassified (to) from non current | 50 | — | ||||||||
|
|
|
| |||||||
| Carrying amount at end of year | 37 | — | ||||||||
|
|
|
| |||||||
| Other provisions - current | ||||||||||
| Carrying amount at beginning of year | 54 | — | ||||||||
| Arising during the year | 70 | 54 | ||||||||
| Utilised | (54 | ) | — | |||||||
|
|
|
| |||||||
| Carrying amount at end of year | 70 | 54 | ||||||||
|
|
|
| |||||||
| Surplus lease space - non-current | ||||||||||
| Carrying amount at beginning of year | — | — | ||||||||
| Arising during the year | 354 | — | ||||||||
| Reclassified (to) from non current | (50 | ) | — | |||||||
|
|
|
| |||||||
| Carrying amount at end of year | 304 | — | ||||||||
|
|
|
| |||||||
Surplus lease space provision relates to certain unutilised office space. The provision takes account of estimated rental income Orbital is able to recover by sub-letting the space.
66
NOTES TO THE FINANCIAL STATEMENTS FOR THE YEAR ENDED 30 JUNE 2011
| 26. | LONG TERM BORROWINGS |
| CONSOLIDATED | ||||||||
| 2011 $’000 | 2010 $’000 | |||||||
| Non-Current | ||||||||
| Loans and advances - secured (a) | 7,777 | 7,604 | ||||||
|
|
|
| |||||
| 7,777 | 7,604 | |||||||
|
|
|
| |||||
| (a) | The Government of Western Australia had previously provided the company with a fully utilised loan facility of $19,000,000 under the terms of a “Development Agreement”. During the 2010 year Orbital reached agreement with the WA Government through the Department of Commerce for the Restructure of the Non-Interest Bearing Loan. |
Under the agreed restructure the original loan has been terminated and replaced by a new loan of $14,346,000 with the following terms and conditions.
| • | Term – 2010 to 2025. |
| • | Repayments—Commencing May 2010 at $200,000 per annum. |
| • | Repayments—Increasing annually to a maximum of $2,100,000 per annum in 2023. |
| • | Interest free. |
The restructured loan’s net fair value at 27 January 2010 utilising a market interest rate of 6.52% was $7,558,000 which compares to the carrying value of the old loan of $15,253,000 at that date. In accordance with the Accounting Standards, the benefit of the interest free government loan amounting to $7,695,000 was accounted for as a government grant.
This loan facility is secured by way of a second ranking floating debenture over the whole of the assets and undertakings of the Company.
The non-interest bearing loan from the Government of Western Australia was initially recognised at fair value and subsequently stated at amortised cost with any difference between cost and repayment value being recognised in the income statement over the period of the borrowings on an effective interest basis. During the 2011 year Orbital made an additional loan repayment to the Government of Western Australia of $200,000 which resulted in the recognition of an interest expense of $117,000 in the reporting period.
The fair value of the loan 2011: $7,423,513 (2010:$7,184,041) is calculated by discounting the expected future cash flows at the prevailing market interest rate at reporting date 2011: 7.23% (2010: 7.17%)
| 27. | GOVERNMENT GRANTS |
| Current liabilities | ||||||||||
| Investment grant for construction of heavy duty engine testing facility | 225 | 225 | ||||||||
| Non-current liabilities | ||||||||||
| Investment grant for construction of heavy duty engine testing facility | 1,649 | 1,874 | ||||||||
|
|
|
| |||||||
| Total government grants deferred | 1,874 | 2,099 | ||||||||
|
|
|
| |||||||
(a) | Movement in government grants | |||||||||
| At 1 July | 2,099 | 2,760 | ||||||||
| Transferred to deferred revenue | — | (512 | ) | |||||||
| Released to the income statement | (225 | ) | (149 | ) | ||||||
|
|
|
| |||||||
| At 30 June | 1,874 | 2,099 | ||||||||
|
|
|
| |||||||
In June 2008 the Group received funding of $2,760,000 from the Commonwealth of Australia through the Alternative Fuels Conversion Program administered by the Department of the Environment, Water, Heritage and the Arts towards the construction of a heavy duty engine test facility. The Group will fund the maintenance and operation of the facility until at least financial year 2014/2015 and provide the Commonwealth with preferential access to the facility.
The terms of the Grant included providing the Commonwealth with preferential access to the facility at a discount to the commercial rate. This discount to commercial rates of $512,000 has been transferred to deferred revenue (see note 24) and recorded as deferred revenue.
The government grant will be recognised as income over the periods and in the proportions in which depreciation on the heavy duty engine test facility is charged.
67
NOTES TO THE FINANCIAL STATEMENTS FOR THE YEAR ENDED 30 JUNE 2011
| 28. | CONTINGENT CONSIDERATION |
| CONSOLIDATED | ||||||||
| 2011 $’000 | 2010 $’000 | |||||||
| Non-current liabilities | ||||||||
| Contingent consideration for business acquisition | 2,688 | — | ||||||
|
|
|
| |||||
| Total contingent commitments | 2,688 | — | ||||||
|
|
|
| |||||
On 27 May 2011, Orbital Autogas Systems Pty Ltd acquired 55% of the voting shares of Sprint Gas (Aust) Pty Ltd, a new company incorporated to acquire the operating business of Sprint Gas, an Australian business specialising in the importation and wholesaling of LPG Fuel systems.
Concurrently with the entering into of the Business Acquisition Agreement, the Group entered into a Subscription and Shareholders Agreement with the owners of the 45% non-controlling interest in Sprint Gas (Aust) Pty Ltd. As part of the Subscription and Shareholders Agreement Call and Put options were issued over the remaining 45% non-controlling interest. The Put and Call options, exercisable after 30 months, are in nature a forward contract and therefore a present ownership interest is granted. The Group has accounted for the business combination as though it acquired a 100% interest and has recognised a financial liability to the non-controlling shareholders equal to the fair value of the underlying obligations under the Put and Call options (contingent consideration liability).
The underlying obligations under the Put and Call options that gives rise to the contingent consideration liability were initially recognised at fair value and subsequently at fair value through the profit and loss
The contingent consideration payable will be calculated with reference to the estimated value of the Sprint Gas business, based on an estimated average EBITDA multiple. The undiscounted estimated contingent consideration payable is $3,474,000. If the business was to perform 20% better or 20% worse than the current four year forecast the estimated fair value of the contingent consideration would increase by $531,000/decrease by $531,000 respectively.
| (a) | Movement in contingent consideration |
At 1 July | — | — | ||||||
Recognised during the year | 2,688 | — | ||||||
Released to the income statement | — | — | ||||||
|
|
|
| |||||
At 30 June | 2,688 | — | ||||||
|
|
|
|
No gains or losses were recognised in the income statement during the current year due to a change in the fair value of the contingent consideration
| 29. | SHARE CAPITAL |
| Ordinary shares | 19,345 | 19,261 | ||||||
|
|
|
|
| Number | $’000 | |||||||
| Movement in ordinary shares on issue | ||||||||
| At 1 July 2009 | 47,888,505 | 19,055 | ||||||
| Shares issued pursuant to employee share plans | 308,889 | 206 | ||||||
|
|
|
| |||||
| At 30 June 2010 | 48,197,394 | 19,261 | ||||||
| Shares issued pursuant to Share Consolidation | 1,494 | — | ||||||
| Shares issued pursuant to employee share plans | 283,670 | 84 | ||||||
|
|
|
| |||||
| At 30 June 2011 | 48,482,558 | 19,345 | ||||||
|
|
|
| |||||
Holders of ordinary shares are entitled to receive dividends as declared from time to time and are entitled to one vote per share at shareholders’ meetings.
In the event of winding up of the Company, ordinary shareholders rank after creditors and are fully entitled to any proceeds of liquidation.
68
NOTES TO THE FINANCIAL STATEMENTS FOR THE YEAR ENDED 30 JUNE 2011
| 29 | SHARE CAPITAL (continued) |
| (a) | Capital management |
When managing capital, management’s objective is to ensure the entity continues as a going concern as well as to maintain optimal returns to shareholders and benefits for other stakeholders. Management also aims to maintain a capital structure that ensures the lowest cost of capital, provides a strong capital base so as to maintain investor, creditor and market confidence and to sustain future development of the business.
Management defines capital as contributed shareholder equity and has no current plans to change the share capital.
| (b) | Share Consolidation |
On 28 October, 2010 the shareholders in Annual General Meeting approved the consolidation of ordinary shares on the basis that every ten ordinary shares be consolidated into one ordinary share, and where this consolidation results in a fraction of a share being held by a shareholder, the directors of the Company be authorised to round that fraction up to the nearest whole share. The share consolidation became effective on 28 October, 2010.
The effect of the share consolidation has been retroactively applied to the number of shares outstanding and Earnings per share calculations above.
| 30. | RETAINED PROFITS AND RESERVES |
| (a) | Movements in retained earnings were as follows: |
| CONSOLIDATED | ||||||||
| 2011 | 2010 | |||||||
| $’000 | $’000 | |||||||
| Balance 1 July | 1,292 | (3,224 | ) | |||||
| Net profit | 1,763 | 4,516 | ||||||
|
|
|
| |||||
| Balance 30 June | 3,055 | 1,292 | ||||||
|
|
|
| |||||
| (b) | Other reserves |
| Employee Equity Benefits Reserve | Foreign Currency Translation Reserve | Total | ||||||||||
| Consolidated | $’000 | $’000 | $’000 | |||||||||
Balance 1 July 2009 | 884 | 399 | 1,283 | |||||||||
Equity-settled transaction-employee shares | 250 | — | 250 | |||||||||
Transfer to share capital | (117 | ) | — | (117 | ) | |||||||
Other comprehensive income | — | (1,169 | ) | (1,169 | ) | |||||||
|
|
|
|
|
| |||||||
Balance at 30 June 2010 | 1,017 | (770 | ) | 247 | ||||||||
|
|
|
|
|
| |||||||
Balance 1 July 2010 | 1,017 | (770 | ) | 247 | ||||||||
Equity-settled transaction-employee shares | 250 | — | 250 | |||||||||
Other comprehensive income | — | (3,415 | ) | (3,415 | ) | |||||||
|
|
|
|
|
| |||||||
Balance at 30 June 2011 | 1,267 | (4,185 | ) | (2,918 | ) | |||||||
|
|
|
|
|
| |||||||
| (c) | Nature and purpose of reserves |
Employee equity benefits reserve
The employee equity benefits reserve is used to record the value of share based payments provided to employees, including KMP’s, as part of their remuneration. Refer to note 36 for further details of these plans.
Foreign currency translation reserve
The foreign currency translation reserve is used to record exchange differences arising from the translation of the financial statements of foreign subsidiaries.
69
NOTES TO THE FINANCIAL STATEMENTS FOR THE YEAR ENDED 30 JUNE 2011
| 31. | CONSOLIDATED ENTITY |
| Note | Class of Shares | Consolidated Entity Interest | ||||||||||||||
| 2011 | 2010 | |||||||||||||||
| % | % | |||||||||||||||
Ultimate Parent Entity | ||||||||||||||||
- Orbital Corporation Limited | ||||||||||||||||
Controlled Entities, incorporated and carrying on business in: | ||||||||||||||||
Australia | ||||||||||||||||
- Orbital Australia Pty Ltd | Ord | 100 | 100 | |||||||||||||
- Orbital Australia Manufacturing Pty Ltd | Ord | 100 | 100 | |||||||||||||
- OEC Pty Ltd | (a | ) | Ord | 100 | 100 | |||||||||||
- S T Management Pty Ltd | (a | ) | Ord | 100 | 100 | |||||||||||
- OFT Australia Pty Ltd | (a | ) | Ord | 100 | 100 | |||||||||||
- Investment Development Funding Pty Ltd | (a | ) | Ord | 100 | 100 | |||||||||||
- Power Investment Funding Pty Ltd | (a | ) | Ord | 100 | 100 | |||||||||||
- Orbital Environmental Pty Ltd | (a | ) | Ord | 100 | 100 | |||||||||||
- Orbital Share Plan Pty Ltd | (b | ) | Ord | 100 | 100 | |||||||||||
- Orbital Autogas Systems Pty Ltd | Ord | 100 | 100 | |||||||||||||
- Sprint Gas (Aust) Pty Ltd | (c | ) | Ord | 100 | — | |||||||||||
United States of America | ||||||||||||||||
- Orbital Holdings (USA) Inc. | (a | ) | Ord | 100 | 100 | |||||||||||
- Orbital Fluid Technologies Inc. | Ord | 100 | 100 | |||||||||||||
- Orbital Engine Company (USA) Inc. | (a | ) | Ord | 100 | 100 | |||||||||||
United Kingdom | ||||||||||||||||
- Orbital Engine Company (UK) Ltd | (a | ) | Ord | 100 | 100 | |||||||||||
| (a) | Dormant for the years ended 30 June 2011 and 30 June 2010. |
| (b) | Orbital Share Plan Pty Ltd was established on 22 September 2008 and acts as the trustee of the Orbital Executive Long Term Share Plans. |
| (c) | Refer to note 38 for further discussion. |
70
NOTES TO THE FINANCIAL STATEMENTS FOR THE YEAR ENDED 30 JUNE 2011
| 32. | INFORMATION RELATING TO ORBITAL CORPORATION LIMITED |
| 2011 $’000 | 2010 $’000 | |||||||
Current assets | 4 | 22 | ||||||
Total assets | 38,645 | 41,494 | ||||||
|
|
|
| |||||
Current liabilities | — | — | ||||||
Total liabilities | 19,163 | 20,694 | ||||||
|
|
|
| |||||
Issued capital | 19,345 | 19,261 | ||||||
Retained profits/(accumulated losses) | (1,130 | ) | 522 | |||||
Employee equity benefits reserve | 1,267 | 1,017 | ||||||
|
|
|
| |||||
Total shareholders’ equity | 19,482 | 20,800 | ||||||
|
|
|
| |||||
Profit/(loss) of the parent entity | (1,652 | ) | 4,270 | |||||
Total comprehensive income of the parent entity | (1,652 | ) | 4,270 | |||||
|
|
|
| |||||
Guarantee
Orbital Corporation Limited has provided a guarantee to Westpac Banking Corporation for all liabilities and obligations of Orbital Australia Pty Ltd. See note 22 for details of Orbital Australia Pty Ltd's outstanding liabilities to Westpac Banking Corporation.
| 33. | RELATED PARTY DISCLOSURES |
| (a) | Identity of related parties |
The Group has a relationship with its subsidiaries (see note 31), with its investment accounted for using the equity method (see note 16), and with its key management personnel (refer to disclosures for key management personnel, see note 34).
| (b) | Controlled Entities |
Details of interest in controlled entities are set out in Note 31.
| (c) | Other Related Parties |
Details of dealings with other related parties, being joint venture entity Synerject LLC, are set out below:
| (i) | Receivables and Payables |
The aggregate amounts receivable from/payable to Synerject LLC by the Group at balance date are:
| CONSOLIDATED | ||||||||
| 2011 $’000 | 2010 $’000 | |||||||
Receivables | ||||||||
Current | — | 3 | ||||||
|
|
|
| |||||
Payables | ||||||||
Current | 7 | 110 | ||||||
|
|
|
| |||||
| (ii) | Transactions |
During the year the Group provided engineering services to Synerject LLC of $nil (2010: $nil) and purchased goods and services to the value of $140,000 (2010: $190,000) from Synerject LLC. All transactions are in the ordinary course of business and on normal commercial terms and conditions.
71
NOTES TO THE FINANCIAL STATEMENTS FOR THE YEAR ENDED 30 JUNE 2011
| 34 | KEY MANAGEMENT PERSONNEL |
The following were key management personnel of the Group at any time during the reporting period and unless otherwise indicated were key management personnel for the entire period:
Non-executive directors
Mr WP Day (Chairman)
Mr JG Young – retired 28 February 2011
Dr MT Jones
Dr V Braach-Maksvytis
Executive directors
Mr TD Stinson (Managing Director & Chief Executive Officer)
Executives
Mr KA Halliwell (Chief Financial Officer)
Mr BA Fitzgerald (Director of Sales & Marketing) (ceased to be KMP on 1 July 2011)
Dr GP Cathcart (Director of Engineering & Operations)
Key management personnel compensation
The key management personnel compensation included in ‘employee benefits expense’ (see note 9) are as follows:
| CONSOLIDATED | ||||||||
| 2011 $ | 2010 $ | |||||||
Short-term employee benefits | 876,810 | 1,587,275 | ||||||
Post-employment benefits | 131,555 | 132,605 | ||||||
Equity compensation benefits | 223,405 | 225,737 | ||||||
Termination benefits | 288,241 | — | ||||||
|
|
|
| |||||
| 1,520,011 | 1,945,617 | |||||||
|
|
|
| |||||
Individual directors and executives compensation disclosures
No director has entered into a material contract with the Group since the end of the previous financial year and there were no material contracts involving directors’ interests at year-end.
Loans to key management personnel and their related parties.
The Group has not made any loans to key management personnel or their related parties since the end of the previous financial year and there were no loans to any key management person or their related parties at year-end.
72
NOTES TO THE FINANCIAL STATEMENTS FOR THE YEAR ENDED 30 JUNE 2011
| 34 | KEY MANAGEMENT PERSONNEL (continued) |
Movements in shares
The movement during the reporting period in the number of ordinary shares in Orbital Corporation Limited held, directly, indirectly or beneficially, by each key management person, including their related parties, is as follows:
| Held at 1-Jul-10 | Granted as compensation | Held at 30-Jun-11 | ||||||||||||||||||||||||||
| Purchases | ESP #1 | ELTSP | Sales | Other(a)(b) | ||||||||||||||||||||||||
Non-executive directors | ||||||||||||||||||||||||||||
Mr WP Day | 10,000 | — | — | — | — | — | 10,000 | |||||||||||||||||||||
Mr JG Young | 74,854 | — | — | — | — | (74,854 | ) | — | ||||||||||||||||||||
Dr V Braach-Maksvytis | — | — | — | — | — | — | — | |||||||||||||||||||||
Dr MT Jones | 18,000 | — | — | — | — | — | 18,000 | |||||||||||||||||||||
Executive directors | ||||||||||||||||||||||||||||
Mr TD Stinson (d) | 230,088 | 145,602 | — | — | — | — | 375,690 | |||||||||||||||||||||
Executives | ||||||||||||||||||||||||||||
Mr KA Halliwell | 136,734 | 37,500 | 3,369 | — | — | 2 | 177,605 | |||||||||||||||||||||
Mr BA Fitzgerald | 103,242 | — | 3,369 | — | — | 2 | 106,613 | |||||||||||||||||||||
Dr GP Cathcart | 48,091 | — | 3,369 | — | — | 2 | 51,462 | |||||||||||||||||||||
| Held at 1-Jul-09 | Granted as compensation | Held at 30-Jun-10 | ||||||||||||||||||||||||||
| Purchases | ESP #1 | ELTSP | Sales | Other(c) | ||||||||||||||||||||||||
Non-executive directors | ||||||||||||||||||||||||||||
Mr WP Day | 10,000 | — | — | — | — | — | 10,000 | |||||||||||||||||||||
Mr JG Young | 74,854 | — | — | — | — | — | 74,854 | |||||||||||||||||||||
Dr V Braach-Maksvytis | — | — | — | — | — | — | — | |||||||||||||||||||||
Dr MT Jones | 18,000 | — | — | — | — | — | 18,000 | |||||||||||||||||||||
Executive directors | ||||||||||||||||||||||||||||
Mr TD Stinson | 120,100 | 110,000 | — | — | — | (12 | ) | 230,088 | ||||||||||||||||||||
Executives | ||||||||||||||||||||||||||||
Mr KA Halliwell | 94,189 | — | 1,625 | 40,920 | — | — | 136,734 | |||||||||||||||||||||
Mr BA Fitzgerald | 67,517 | — | 1,625 | 34,100 | — | — | 103,242 | |||||||||||||||||||||
Dr GP Cathcart | 30,346 | — | 1,625 | 16,120 | — | — | 48,091 | |||||||||||||||||||||
| (a) | Represents shareholdings at time that Mr J G Young ceased to be a Director. |
| (b) | Represents the rounding of shareholdings as a result of the share consolidation. |
| (c) | As a result of a change to the ratio of ADRs to ordinary shares the equivalent ordinary shares of Mr Stinson were rounded down to the nearest multiple of 160. |
| (d) | Mr Stinson’s shareholding of 375,690 is represented by 6,618 ADRs and 269,802 ordinary shares. |
73
NOTES TO THE FINANCIAL STATEMENTS FOR THE YEAR ENDED 30 JUNE 2011
| 34 | KEY MANAGEMENT PERSONNEL (continued) |
Movements in ELTSP rights
The movement during the reporting period in the number of ELTSP rights to ordinary shares in Orbital Corporation Limited held, directly, indirectly or beneficially, by each key management person, including their related parties, is as follows:
| Held at 1-Jul-10 | Offered | Forfeited | Vested | Expired | Held at 30-Jun-11 | |||||||||||||||||||
Executive directors | ||||||||||||||||||||||||
Mr TD Stinson | 655,000 | 665,000 | — | — | — | 1,320,000 | ||||||||||||||||||
Executives | ||||||||||||||||||||||||
Mr KA Halliwell | 363,500 | 337,567 | — | — | (27,000 | ) | 674,067 | |||||||||||||||||
Mr BA Fitzgerald | 333,000 | 311,600 | (627,600 | ) | — | (17,000 | ) | — | ||||||||||||||||
Dr GP Cathcart | 256,500 | 252,700 | — | — | (17,000 | ) | 492,200 | |||||||||||||||||
| Held at 1-Jul-09 | Offered | Forfeited | Vested | Expired | Held at 30-Jun-10 | |||||||||||||||||||
Executive directors | ||||||||||||||||||||||||
Mr TD Stinson | 130,000 | 525,000 | — | — | — | 655,000 | ||||||||||||||||||
Executives | ||||||||||||||||||||||||
Mr KA Halliwell | 163,000 | 266,500 | — | (40,920 | ) | (25,080 | ) | 363,500 | ||||||||||||||||
Mr BA Fitzgerald | 142,000 | 246,000 | — | (34,100 | ) | (20,900 | ) | 333,000 | ||||||||||||||||
Dr GP Cathcart | 83,000 | 199,500 | — | (16,120 | ) | (9,880 | ) | 256,500 | ||||||||||||||||
Movements in performance rights
The movement during the reporting period in the number of performance rights to ordinary shares in Orbital Corporation Limited held, directly, indirectly or beneficially, by each key management person, including their related parties, is as follows:
| Held at 1-Jul-10 | Offered | Forfeited | Vested | Expired | Held at 30-Jun-11 | |||||||||||||||||||
Executive directors | ||||||||||||||||||||||||
Mr TD Stinson | 1,150,000 | — | — | — | — | 1,150,000 | ||||||||||||||||||
| Held at 1-Jul-09 | Offered | Forfeited | Vested | Expired | Held at 30-Jun-10 | |||||||||||||||||||
Executive directors | ||||||||||||||||||||||||
Mr TD Stinson | 1,150,000 | — | — | — | — | 1,150,000 | ||||||||||||||||||
74
NOTES TO THE FINANCIAL STATEMENTS FOR THE YEAR ENDED 30 JUNE 2011
| 35. | NOTES TO THE STATEMENTS OF CASH FLOWS |
Reconciliation of cash flows from operating activities
| NOTE | CONSOLIDATED | THE COMPANY | ||||||||||||||||||
| 2011 $’000 | 2010 $’000 | 2010 $’000 | 2009 $’000 | |||||||||||||||||
Profit after income tax | 1,763 | 4,516 | 315 | 315 | ||||||||||||||||
Adjustments for: | ||||||||||||||||||||
(Profit)/Loss on sale of property, plant and equipment | 8 | (4,760 | ) | (41 | ) | — | — | |||||||||||||
Depreciation | 18 | 930 | 877 | — | — | |||||||||||||||
Amortisation | 19 | 253 | 136 | |||||||||||||||||
Amortisation of deferred revenue and government grants | (225 | ) | (345 | ) | ||||||||||||||||
Impairment, write-off/(write-back) of trade receivables | 38 | (114 | ) | — | — | |||||||||||||||
Impairment of capitalised development costs | 19 | 1,065 | — | — | — | |||||||||||||||
Inventory write-down | 942 | — | ||||||||||||||||||
Amortisation of non-interest bearing loans | 613 | 626 | 722 | 722 | ||||||||||||||||
Gain on restructure of non-interest bearing loans | — | (7,695 | ) | |||||||||||||||||
Amounts set aside to warranty and other provisions | 318 | (133 | ) | — | — | |||||||||||||||
Share of net profit of equity accounted investment | 16 | (3,233 | ) | (1,874 | ) | — | — | |||||||||||||
Employee compensation expense | 36 | (a) | 334 | 339 | — | — | ||||||||||||||
Net foreign exchange (gains)/losses | (79 | ) | 97 | (965 | ) | (965 | ) | |||||||||||||
|
|
|
|
|
|
|
| |||||||||||||
Net cash provided by/(used in) operating activities before changes in assets and liabilities | (2,983 | ) | (3,611 | ) | 72 | 72 | ||||||||||||||
|
|
|
|
|
|
|
| |||||||||||||
Changes in assets and liabilities during the year: | ||||||||||||||||||||
(Increase)/decrease in receivables | (621 | ) | 28 | 30 | 30 | |||||||||||||||
(Increase)/decrease in inventories | 1,302 | (638 | ) | — | — | |||||||||||||||
(Increase)/decrease in deferred tax assets | (532 | ) | (417 | ) | — | — | ||||||||||||||
(Decrease)/increase in payables | 1,629 | (951 | ) | — | — | |||||||||||||||
(Decrease)/increase in employee provisions | (587 | ) | 540 | — | — | |||||||||||||||
|
|
|
|
|
|
|
| |||||||||||||
| 1,191 | (1,438 | ) | 30 | 30 | ||||||||||||||||
|
|
|
|
|
|
|
| |||||||||||||
Net cash used in operating activities | (1,792 | ) | (5,049 | ) | 102 | 102 | ||||||||||||||
|
|
|
|
|
|
|
| |||||||||||||
| 36. | SHARE-BASED PAYMENT PLANS |
| (a) | Recognised share-based payment expenses |
The expense recognised for employee services received during the year is shown in the table below:
Expense arising from equity-settled share-based payment transactions | 334 | 339 | ||||||
|
|
|
|
The share-based payment plans are described below. Entitlements to shares are based 50% of Total Shareholder Return and 50% on Earnings Per Share.
75
NOTES TO THE FINANCIAL STATEMENTS FOR THE YEAR ENDED 30 JUNE 2011
| 36. | SHARE BASED PAYMENT PLANS (continued) |
| (b) | Employee share Plan No. 1 |
Under Employee Share Plan No. 1 each eligible employee is offered fully paid ordinary shares to the value of $1,000 per annum.
During the year there were 283,670 (2010: 144,589) shares issued under Plan 1 to eligible employees at a market value on the day of issue of $84,193 (2010: $89,000).
| (c) | Executive Long Term Share Plan (“ELTSP”) |
Executives may also be offered shares in the Company’s Executive Long Term Share Plan under which offered shares will be granted subject to the satisfaction of performance conditions over a 3 year period or subject to Board discretion for other qualifying reasons.
The number of shares that the executive actually receives depends on two performance hurdles, as set out below:
| (a) | 50% of the shares offered will be issued depending on the performance of the Company relative to a group of selected peers (being the 50 smallest companies by market capitalisation (other than resource companies and property and investment trust companies) within the S&P / ASX 300 Index). The peer group is ranked in terms of Total Shareholder Return (“TSR”). TSR is the percentage increase in a company’s share price plus reinvested dividends over a three year period commencing on 1 September 2010 and ending on 31 August 2013 (“Performance Period”). |
The following table sets out the relevant percentages of an executive’s Personal Allotment which will be issued at the conclusion of the Performance Period based on the TSR ranking of the Company relative to the peer group:
Company Performance (TSR Ranking) | % of Personal | |
Up to the 50th percentile | 0% | |
At or above the 50th percentile but below the 75th percentile | 50% to 99% (on a straight-line basis). | |
At or above the 75th percentile but below the 90th percentile | 100% | |
At or above the 90th percentile | 125% |
No shares will be granted unless the Company’s TSR is at or above the 50th percentile. In 2011 nil (2010: 164,300) rights were issued in accordance with the terms of the plan.
| (b) | 50% of the shares offered will be issued if the Company achieves earnings in excess of 11 cents per share for the year ending 30 June 2013. |
At the Company’s Annual General Meeting in October 2010, shareholders approved the above plan in relation to the ongoing remuneration of Executive Directors and senior executives.
During the year, a total of 1,730,900 rights under the plan were offered to 6 executives (2010: 1,436,000 rights offered to 7 executives).
Summary of rights granted under the ELTSP
2011 No. | 2010 No. | |||||||
Outstanding at the beginning of the year | 1,855,000 | 780,000 | ||||||
Granted during the year | 1,730,900 | 1,436,000 | ||||||
Forfeited during the year | (642,600 | ) | (96,000 | ) | ||||
Vested during the year and shares issued | — | (164,300 | ) | |||||
Expired during the year | (93,500 | ) | (100,700 | ) | ||||
|
|
|
| |||||
Outstanding at the end of the year | 2,849,800 | 1,855,000 | ||||||
|
|
|
| |||||
| . | ||||||||
The outstanding balance as at 30 June 2011 is represented by:
| • | 310,000 rights with a fair value at grant date of $0.580 that will potentially vest in August 2011; |
| • | 1,120,500 rights with a fair value at grant date of $0.465 that will potentially vest in August 2012; |
| • | 1,419,300 rights with a fair value at grant date of $0.335 that will potentially vest in August 2013. |
76
NOTES TO THE FINANCIAL STATEMENTS FOR THE YEAR ENDED 30 JUNE 2011
| 36. | SHARE BASED PAYMENT PLANS (continued) |
Fair value of rights on grant date
The following factors and assumptions were used in determining the fair value of TSR related rights issued under the ELTSP on grant date:
TSR related rights
| Grant Date | Life | Fair Value per right | Exercise Price | Market price of shares on grant date | Expected volatility | Risk free interest rate | ||||||||||||||||||
31-Aug-08 | 3 years | 58 cents | nil | 79 cents | 62.70 | % | 5.68 | % | ||||||||||||||||
31-Aug-09 | 3 years | 38 cents | nil | 55 cents | 65.00 | % | 5.03 | % | ||||||||||||||||
31-Aug-10 | 3 years | 33 cents | nil | 34 cents | 60.00 | % | 4.27 | % | ||||||||||||||||
The following factors and assumptions were used in determining the fair value of EPS related rights issued under the ELTSP on grant date:
EPS related rights
Grant Date | Life | Fair Value per right | Exercise Price | Market price of shares on grant date | ||||||||||||
31-Aug-09 | 3 years | 55 cents | nil | 55 cents | ||||||||||||
31-Aug-10 | 3 years | 34 cents | nil | 34 cents | ||||||||||||
The fair value of the EPS related rights is equal to the market price of shares on the grant date.
| (d) | Performance Rights Plan |
The Company also introduced a Performance Rights Plan as part of its long-term incentive arrangements for senior executives, which was approved by shareholders in October 2009.
Under the Performance Rights Plan, performance rights will only be issued if the terms and conditions detailed below are satisfied.
A performance right is a right to acquire one fully paid ordinary share in the Company. Until they are exercised, performance rights:
| (a) | do not give the holder a legal or beneficial interest in shares of the Company; and |
| (b) | do not enable participating executives to receive dividends, rights on winding up, voting rights or other shareholder benefits. |
Performance rights issued under the Performance Rights Plan will be exercisable if:
| (a) | a performance hurdle is met over the periods specified by the Board; or |
| (b) | the Board allows early exercise on cessation of employment (see “Cessation of employment” below); or |
| (c) | it is determined by the Board in light of specific circumstances. |
The Terms and conditions of the offer of Performance Rights made during the year ended 30 June 2009 are as follows:
| (a) | Mr T D Stinson will be awarded 1,150,000 performance rights; |
| (b) | the grant of performance rights will be in seven tranches, each tranche with a different specified share price target as set out below: |
Tranche | Number of performance rights | Share price target $ | Fair Value at grant date $ | |||||||||
1 | 200,000 | $ | 2.50 | 94,000 | ||||||||
2 | 200,000 | $ | 5.00 | 70,000 | ||||||||
3 | 200,000 | $ | 7.50 | 56,000 | ||||||||
4 | 200,000 | $ | 10.00 | 46,000 | ||||||||
5 | 125,000 | $ | 20.00 | 16,250 | ||||||||
6 | 125,000 | $ | 30.00 | 11,250 | ||||||||
7 | 100,000 | $ | 50.00 | 5,000 | ||||||||
| (c) | the acquisition price and exercise price of the performance rights will be nil. |
77
NOTES TO THE FINANCIAL STATEMENTS FOR THE YEAR ENDED 30 JUNE 2011
| 36. | SHARE BASED PAYMENT PLANS (continued) |
| (d) | Performance Rights Plan (continued) |
| (d) | Mr T D Stinson will only be permitted to exercise a performance right if: |
| • | the Company attains the specified share price target (see table above) within eight years from the date of grant of the performance right; and |
| • | the specified share price target is also achieved at the end of two years from the date the target is first achieved (“Vesting Date”) based on the Company’s average closing share price over a 90 day period up to and including the Vesting Date; |
| (e) | If the specified share price target is either not achieved within eight years from the date of grant, or if so achieved, not also achieved at the end of the Vesting Date, the performance right will lapse. |
No performance rights were granted during the years ended 30 June 2011 or 30 June 2010.
| 37. | DEFINED CONTRIBUTION SUPERANNUATION FUND |
The Group contributes to a defined contribution plan for the provision of benefits to Australian employees on retirement, death or disability. Employee and employer contributions are based on various percentages of gross salaries and wages. Apart from the contributions required under superannuation legislation, there is no legally enforceable obligation on the Company or its controlled entities to contribute to the superannuation plan.
| 38. | BUSINESS COMBINATION |
Initial acquisition of Sprint Gas Business
On 27 May 2011, Orbital Autogas Systems Pty Ltd acquired 55% of the voting shares of Sprint Gas (Aust) Pty Ltd, a new company incorporated to acquire the operating business of Sprint Gas, an Australian business specialising in the importation and wholesaling of LPG Fuel systems. The consideration transferred was $2,000,000 cash as payment in full for 2,200,000 ordinary shares in the new company, Sprint Gas (Aust) Pty Ltd.
Concurrently with the entering into of the Business Acquisition Agreement, the Group entered into a Subscription and Shareholders Agreement with the owners of the 45% non-controlling interest in Sprint Gas (Aust) Pty Ltd. As part of the Subscription and Shareholders Agreement Put and Call options were issued over the remaining 45% non-controlling interest. The Put and Call options, exercisable after 30 months, are in nature a forward contract and in substance represent contingent consideration. The Group has accounted for the business combination as though it acquired a 100% interest and has recognised a financial liability to the non-controlling shareholders equal to the fair value of the underlying obligations under the Put and Call options (Contingent consideration liability).
The option that gives rise to the contingent consideration liability is classified as a financial liability at fair value through profit and loss.
The acquisition of Sprint Gas significantly broadens the Group’s wholesaling and distribution activities in the area of alternative fuels and positions the Group as a leader in the Australian LPG market.
The relocation provision recognised on acquisition was a present obligation of Sprint Gas (Aust) Pty Ltd prior to the business combination and its execution was not conditional upon it being acquired by Orbital Corporation Limited. The key factor contributing to the $1,373,000 of goodwill is the profits expected to be generated by the business during the contingent consideration calculation period. None of the goodwill recognised is expected to be deductable for income tax purposes.
Included in the business acquired were receivables with a gross contractual and fair value of $1,208,000 resulting from trade sales with customers. Management expects these amounts to be collected in full and converted to cash consistent with customer terms, which call for payment within 30-45 days of the initial sale.
78
NOTES TO THE FINANCIAL STATEMENTS FOR THE YEAR ENDED 30 JUNE 2011
| 38. | BUSINESS COMBINATION (continued) |
Initial acquisition of Sprint Gas Business (continued)
The total provisional cost of the combination was $4,688,000 and comprised the payment of cash and the recognition of a contingent consideration liability. As the acquisition was made close to year end, the Company has left the acquisition accounting open pending further adjustment to the fair values of net assets acquired. The initial accounting for the combination will be finalised within the next financial year.
The provisional fair values of the identifiable assets and liabilities of Sprint Gas (Aust) Pty Ltd as of the date of acquisition were as follows:
Consolidated | ||||
Cash and cash equivalents | 420 | |||
Trade and other receivables | 1,319 | |||
Inventories | 1,968 | |||
Plant and equipment | 468 | |||
Deferred tax asset | 242 | |||
|
| |||
| 4,417 | ||||
|
| |||
Trade and other payables | (835 | ) | ||
Employee benefits | (197 | ) | ||
Relocation provision | (70 | ) | ||
|
| |||
| (1,102 | ) | |||
|
| |||
Provisional fair value of identifiable net assets | 3,315 | |||
Goodwill arising on acquisition | 1,373 | |||
|
| |||
| 4,688 | ||||
|
| |||
The fair values have been determined provisionally and based upon the best information available as initial accounting was not complete at the reporting date.
| Consolidated Fair value at acquisition date $’000 | ||||
Acquisition-date fair-value consideration transferred: | ||||
Cash paid | 2,000 | |||
Contingent consideration liability | 2,688 | |||
|
| |||
Consideration transferred | 4,688 | |||
|
| |||
Direct costs relating to the acquisition (included in administration expenses) | 206 | |||
The cash outflow on acquisition is as follows: | ||||
Net cash acquired with the subsidiary | 420 | |||
Cash paid (including $200,000 loan to Sprint Gas (Aust) Pty Ltd) | (2,200 | ) | ||
|
| |||
Net consolidated cash outflow | (1,780 | ) | ||
|
| |||
The consolidated statement of comprehensive income includes sales revenue and net profit for the year ended 30 June 2011 of $1,112,153 and $204,049 respectively, as a result of the acquisition of Sprint Gas (Aust) Pty Ltd.
It is not possible to quantify the impact that the acquisition of Sprint Gas (Aust) Pty Ltd would have had on the consolidated statement of comprehensive income had it occurred at the beginning of the reporting period as separate books and records were not maintained for this business unit.
79
NOTES TO THE FINANCIAL STATEMENTS FOR THE YEAR ENDED 30 JUNE 2011
| 39. | COMMITMENTS |
| (a) | Operating leases |
The Group leases premises and plant & equipment under operating leases. The lease for the engineering premises is for a period of 10 years with options to extend for two further periods of five years each. Leases for warehousing premises typically run for a period of 5 years. The plant & equipment leases typically run for a period of 5 years and the lease payments are fixed. None of the leases include contingent rentals.
| CONSOLIDATED | THE COMPANY | |||||||||||||||
| 2011 | 2010 | 2010 | 2009 | |||||||||||||
| $’000 | $’000 | $ | $ | |||||||||||||
Non-cancellable future operating lease rentals not provided for in the financial statements and payable: | ||||||||||||||||
- Not later than one year | 1,022 | 184 | — | — | ||||||||||||
- Later than one year but not later than five years | 3,536 | 3 | — | — | ||||||||||||
- later than five years | 4,273 | — | — | — | ||||||||||||
|
|
|
|
|
|
|
| |||||||||
| 8,831 | 187 | — | — | |||||||||||||
|
|
|
|
|
|
|
| |||||||||
During the financial year ended 30 June 2010, $489,612 was recognised as an expense in the income statement in respect of operating leases (2010:$171,081).
| (b) | Other |
In June 2008 the Group received funding of $2,760,000 from the Commonwealth of Australia through the Alternative Fuels Conversion Program administered by the Department of the Environment, Water, Heritage and the Arts towards the construction of a heavy duty engine test facility.
The Group will fund the maintenance and operation of the facility until at least financial year 2014/2015 and provide the Commonwealth with preferential access to the facility, as follows:
| CONSOLIDATED | THE COMPANY | |||||||||||||||
| 2011 | 2010 | 2010 | 2009 | |||||||||||||
| $’000 | $’000 | $ | $ | |||||||||||||
Operational commitment to the running of the heavy duty engine testing facility not provided for in the financial statements and payable: | ||||||||||||||||
- Not later than one year | 391 | 391 | — | — | ||||||||||||
- Later than one year but not later than five years | 682 | 1,073 | — | — | ||||||||||||
|
|
|
|
|
|
|
| |||||||||
| 1,073 | 1,464 | — | — | |||||||||||||
|
|
|
|
|
|
|
| |||||||||
| 40. | CONTINGENCIES |
The details and estimated maximum amounts of contingent liabilities that may become payable are set out below. The directors are not aware of any circumstance or information that would lead them to believe that these liabilities will crystallise.
In the event of the Company terminating the employment of the Chief Executive Officer (other than by reason of serious misconduct or material breach of his service agreement), an equivalent of 12 months remuneration is payable to the CEO. In the event of the Company terminating the employment of a KMP (other than by reason of serious misconduct or material breach of their service agreement), an equivalent of 4 weeks pay, plus 2 weeks pay for each completed year of service, plus for each completed year of service beyond 10, an additional 1/2 weeks pay, plus a pro-rata payment for each completed month of service in the final year is payable to the KMP. The maximum entitlement to termination pay is limited to 65 weeks pay. There are no other contingent liabilities for termination benefits under the service agreements with Directors or other persons who take part in the management of any entity within the Group.
| 41. | EVENTS AFTER THE BALANCE SHEET DATE |
On 11 August 2011 the Company announced that its American Depositary Shares will begin trading on the NYSE Amex on 25 August 2011.
There has not arisen in the interval between the end of the financial year and the date of this report any item, transaction or event of a material and unusual nature that is likely, in the opinion of the Directors of the Company, to significantly affect the operations of the Group, the results of those operations, or the state of affairs of the Group in subsequent financial years.
80
NOTES TO THE FINANCIAL STATEMENTS FOR THE YEAR ENDED 30 JUNE 2011
| 42. | REMUNERATION OF AUDITORS |
| CONSOLIDATED | THE COMPANY | |||||||||||||||
| 2011 | 2010 | 2010 | 2009 | |||||||||||||
| $ | $ | $ | $ | |||||||||||||
Amounts received or due and receivable for audit services by: | ||||||||||||||||
Auditors of the Company | ||||||||||||||||
- Audit and review of financial reports | 347,900 | 374,420 | — | — | ||||||||||||
Amounts received or due and receivable for taxation services by: | ||||||||||||||||
Auditors of the Company | 10,000 | 10,055 | — | — | ||||||||||||
Amounts received or due and receivable for other services by: | ||||||||||||||||
Auditors of the Company | 5,150 | 5,627 | — | — | ||||||||||||
|
|
|
|
|
|
|
| |||||||||
Total auditors’ remuneration | 363,050 | 390,102 | — | — | ||||||||||||
|
|
|
|
|
|
|
| |||||||||
The Auditors of the Group in 2011 and 2010 were Ernst & Young.
81
DIRECTORS’ DECLARATION FOR THE YEAR ENDED 30 JUNE 2011
In accordance with a resolution of the directors of Orbital Corporation Limited, we state that:
| 1. | In the opinion of the Directors: |
| (a) | the financial statements and notes and the additional disclosures included in the Directors’ Report designated as audited, of the Group are in accordance with the Corporations Act 2001, including: |
| (i) | giving a true and fair view of the financial position of the Group as at 30 June 2011 and of their performance, as represented by the results of their operations and their cash flows, for the year ended on that date; and |
| (ii) | complying with Accounting Standards in Australia and the Corporations Regulations 2001. |
| (b) | the financial statements and notes also comply with International Financial Reporting Standards as disclosed in note 2(a). |
| (c) | there are reasonable grounds to believe that the Company will be able to pay its debts as and when they become due and payable. |
| 2. | This declaration has been made after receiving the declarations required to be made to the Directors in accordance with Section 295A of the Corporations Act 2001, from the chief executive officer and chief financial officer for the financial year 30 June 2011. |
On behalf of the Board:
W P DAY T D STINSON
Chairman Managing Director
Dated at Perth, Western Australia this 23rd day of August 2011
82

Independent auditor’s report to the members of Orbital Corporation Limited
Report on the financial report
We have audited the accompanying financial report of Orbital Corporation Limited, which comprises the consolidated statement of financial position as at 30 June 2011, the consolidated income statement, the consolidated statement of comprehensive income, the consolidated statement of changes in equity and the consolidated statement of cash flows for the year then ended, notes comprising a summary of significant accounting policies and other explanatory information, and the directors’ declaration of the consolidated entity comprising the company and the entities it controlled at the year’s end or from time to time during the financial year.
Directors’ responsibility for the financial report
The directors of the company are responsible for the preparation of the financial report that gives a true and fair view in accordance with Australian Accounting Standards and theCorporations Act 2001 and for such internal controls as the directors determine are necessary to enable the preparation of the financial report that is free from material misstatement, whether due to fraud or error. In Note 2(a), the directors also state, in accordance with Accounting Standard AASB 101Presentation of Financial Statements, that the financial statements comply withInternational Financial Reporting Standards.
Auditor’s responsibility
Our responsibility is to express an opinion on the financial report based on our audit. We conducted our audit in accordance with Australian Auditing Standards. Those standards require that we comply with relevant ethical requirements relating to audit engagements and plan and perform the audit to obtain reasonable assurance about whether the financial report is free from material misstatement.
An audit involves performing procedures to obtain audit evidence about the amounts and disclosures in the financial report. The procedures selected depend on the auditor’s judgment, including the assessment of the risks of material misstatement of the financial report, whether due to fraud or error. In making those risk assessments, the auditor considers internal controls relevant to the entity’s preparation and fair presentation of the financial report in order to design audit procedures that are appropriate in the circumstances, but not for the purpose of expressing an opinion on the effectiveness of the entity’s internal controls. An audit also includes evaluating the appropriateness of accounting policies used and the reasonableness of accounting estimates made by the directors, as well as evaluating the overall presentation of the financial report.
We believe that the audit evidence we have obtained is sufficient and appropriate to provide a basis for our audit opinion.
Independence
In conducting our audit we have complied with the independence requirements of theCorporations Act 2001. We have given to the directors of the company a written Auditor’s Independence Declaration, a copy of which is included in the directors’ report.
Liability limited by a scheme approved
under Professional Standards Legislation
83
Opinion
In our opinion:
| a. | the financial report of Orbital Corporation Limited is in accordance with the Corporations Act2001, including: |
| i | giving a true and fair view of the consolidated entity’s financial position as at 30 June 2010 and of its performance for the year ended on that date; and |
| ii | complying with Australian Accounting Standards and theCorporations Regulations 2001; and |
| b. | the financial report also complies withInternational Financial Reporting Standards as disclosed in Note 2(a). |
Report on the remuneration report
We have audited the Remuneration Report included in pages x to y of the directors’ report for the year ended 30 June 2011. The directors of the company are responsible for the preparation and presentation of the Remuneration Report in accordance with section 300A of theCorporations Act 2001. Our responsibility is to express an opinion on the Remuneration Report, based on our audit conducted in accordance with Australian Auditing Standards.
Opinion
In our opinion, the Remuneration Report of Orbital Corporation Limited for the year ended 30 June 2011, complies with section 300A of theCorporations Act 2001.
Ernst & Young
G Lotter
Partner
Perth
23 August 2011
84
SHAREHOLDING DETAILS
Shareholding Details
Class of Shares and Voting Rights
As at 31 July 2011 there were 5,157 shareholders of the ordinary shares of the Company. The voting rights attaching to the ordinary shares, set out in Article 8 of the Company’s Constitution, subject to any rights or restrictions for the time being attached to any class or classes of shares, are:-
| a) | at meetings of members or class of members, each member entitled to vote may vote in person or by proxy or representative; and |
| b) | on a show of hands every person present who is a member has one vote, and on a poll every person present in person or by proxy or representative has one vote for each ordinary share held. |
Substantial Shareholders and Holdings as at 31 July 2011
SG Hiscock & Company Ltd (as notified on 13 July 2011) | 4,755,400 | 9.80 | % |
Distribution of Shareholdings as at 31 July 2011
1-1,000 | 3,078 | |||
1,001-5,000 | 1,240 | |||
5,001-10,000 | 411 | |||
10,001-100,000 | 376 | |||
100,001 and over | 52 | |||
|
| |||
| 5,157 | ||||
|
| |||
Total Shares on Issue | 48,482,558 | |||
|
| |||
Number of shareholders holding less than a marketable parcel | 3,313 | |||
|
|
Top 20 Shareholders as at 31 July 2011
| NAME | NUMBER OF SHARES HELD | % OF SHARES | ||||||
National Nominees Limited* | 11,710,775 | 24.15 | % | |||||
Equity Trustees Limited SGH PI Smaller Co’s | 3,196,510 | 6.59 | % | |||||
Verido Holdings Pty Ltd | 1,510,000 | 3.11 | % | |||||
Colbern Fiduciary Nominees Pty Limited | 1,165,497 | 2.40 | % | |||||
Bond Street Custodians Limited | 907,850 | 1.87 | % | |||||
Annapurna Pty Limited | 900,000 | 1.86 | % | |||||
Morgan Stanley Australia Securities (Nominee) Pty Limited | 796,770 | 1.64 | % | |||||
Equity Trustees Limited SGH Tiger A/C | 792,901 | 1.64 | % | |||||
Mr Christopher Ian Wallin & Ms Fiona Kay Wallin | 689,200 | 1.42 | % | |||||
Nefco Nominees Pty Limited | 597,500 | 1.23 | % | |||||
Twokind Pty Ltd | 575,000 | 1.19 | % | |||||
Ms Barbara Lynn Gallisath | 441,930 | 0.91 | % | |||||
Mr Michael William Ford & Mrs Nina Bette Ford | 365,122 | 0.75 | % | |||||
Interstate Investments Pty Ltd | 331,515 | 0.68 | % | |||||
Dr Colin Rose | 313,407 | 0.65 | % | |||||
Texas Holdings Pty Ltd | 312,728 | 0.65 | % | |||||
Mr Terry Dewayne Stinson | 269,802 | 0.56 | % | |||||
Mr Murray Gordon Scott | 257,673 | 0.53 | % | |||||
Ms Kerry Moran | 240,000 | 0.50 | % | |||||
Mr William Ewart Granter | 230,067 | 0.47 | % | |||||
| 25,604,247 | 52.81 | % | ||||||
The twenty largest shareholders hold 52.81% of the ordinary shares of the Company.
* Denotes The Bank of New York Mellon nominee company for United States American Depository Receipts. This nominee company is the main representative body for Orbital’s 9,000 (approx) US shareholders.
On-market buy-back
There is no current on-market buy-back.
85
OFFICES AND OFFICERS
REGISTERED AND PRINCIPAL OFFICE
4 Whipple Street
Balcatta, Western Australia 6021
CONTACT DETAILS
Australia: -
Telephone: 61 (08) 9441 2311
Facsimile: 61 (08) 9441 2111
INTERNET ADDRESS
http://www.orbitalcorp.com.au
Email: info@orbitalcorp.com.au
DIRECTORS
Peter Day – Chairman
Terry Stinson – Chief Executive Officer
Mervyn Jones
Vijoleta Braach-Maksvytis
COMPANY SECRETARY
Ian Veitch
SHARE REGISTRY
Computershare Investor Services Pty Ltd
Level 2, Reserve Bank Building
45 St Georges Terrace
Perth, Western Australia, 6000
Telephone: 61 (08) 9323 2000
Facsimile: 61 (08) 9323 2033
ADR FACILITY
The Bank of New York Mellon
101 Barclay Street
New York, NY, 10286
United States of America
Telephone: 1 (212) 815 2218
Facsimile: 1 (212) 571 3050
SHARE TRADING FACILITIES
Australian Stock Exchange Limited (Code “OEC”)
NYSE Amex (Code: “OBT”) from 25 August 2011
OTC Bulletin Board (Code “OBTMY”) until 25 August 2011
AUDITORS
Ernst & Young
The Ernst & Young Building
11 Mounts Bay Road
Perth, Western Australia, 6000
86
SIGNATURES
Pursuant to the requirements of the Securities Exchange Act of 1934, the registrant has duly caused this report to be signed on its behalf by the undersigned, thereunto duly authorized.
| ORBITAL CORPORATION LIMITED | ||||
| (Registrant) | ||||
| Date: 25 August 2011 | By | /S/ IAN VEITCH | ||
| (Signature)* | ||||
Ian Veitch Company Secretary | ||||