UNITED STATES
SECURITIES AND EXCHANGE COMMISSION
WASHINGTON, D. C. 20549
FORM N-CSRS
Investment Company Act file number: 811-02021
Deutsche DWS Securities Trust
(Exact Name of Registrant as Specified in Charter)
875 Third Avenue
New York, NY 10022-6225
(Address of Principal Executive Offices) (Zip Code)
Registrant’s Telephone Number, including Area Code: (212) 454-4500
Diane Kenneally
100 Summer Street
Boston, MA 02110
(Name and Address of Agent for Service)
| Date of fiscal year end: | 6/30 |
| Date of reporting period: | 12/31/2020 |
| ITEM 1. | REPORT TO STOCKHOLDERS |
| (a) | |

December 31, 2020
Semiannual Report
to Shareholders
DWS Enhanced Commodity Strategy Fund

This report must be preceded or accompanied by a prospectus. To obtain a summary prospectus, if available, or prospectus for any of our funds, refer to the Account Management Resources information provided in the back of this booklet. We advise you to consider the Fund’s objectives, risks, charges and expenses carefully before investing. The summary prospectus and prospectus contain this and other important information about the Fund. Please read the prospectus carefully before you invest.
The Fund invests in commodity-linked derivatives which may subject the Fund to special risks. Market price movements or regulatory and economic changes will have a significant impact on the Fund’s performance. Investing in derivatives entails special risks relating to liquidity, leverage and credit that may reduce returns and/or increase volatility. Any fund that concentrates in a particular segment of the market will generally be more volatile than a fund that invests more broadly. Bond investments are subject to interest-rate, credit, liquidity and market risks to varying degrees. When interest rates rise, bond prices generally fall. Credit risk refers to the ability of an issuer to make timely payments of principal and interest. Investing in foreign securities presents certain risks, such as currency fluctuations, political and economic changes, and market risks. Emerging markets tend to be more volatile and less liquid than the markets of more mature economies, and generally have less diverse and less mature economic structures and less stable political systems than those of developed countries. A counterparty with whom the Fund does business may decline in financial health and become unable to honor its commitments, which could cause losses for the Fund. The Fund may lend securities to approved institutions. Please read the prospectus for details.
War, terrorism, economic uncertainty, trade disputes, public health crises (including the recent pandemic spread of the novel coronavirus) and related geopolitical events could lead to increased market volatility, disruption to U.S. and world economies and markets and may have significant adverse effects on the Fund and its investments.
The brand DWS represents DWS Group GmbH & Co. KGaA and any of its subsidiaries such as DWS Distributors, Inc. which offers investment products or DWS Investment Management Americas, Inc. and RREEF America L.L.C. which offer advisory services.
NOT FDIC/NCUA INSURED NO BANK GUARANTEE MAY LOSE VALUE NOT A DEPOSIT NOT INSURED BY ANY FEDERAL GOVERNMENT AGENCY
| 2 | | | DWS Enhanced Commodity Strategy Fund |
Dear Shareholder:
The outlook for economic recovery remains positive overall, buoyed by progress in the approval and distribution of coronavirus vaccines and a resolution of the 2020 elections. We still, however, have a long road ahead.
Restrictive measures are likely to remain in place, at least to some degree, until broad vaccine distribution is achieved. This suggests that full recovery might take some time. This view appears to be shared by the U.S. Federal Reserve (Fed). Despite more optimism on growth and employment, inflation is expected to remain below the 2% target. Only by 2023 are inflation and unemployment forecasts at levels that would reflect what the Fed would currently see as a full recovery.
The coming months should bring clarity regarding the Biden administration’s domestic and foreign policies. The first priority is likely to be another tranche of COVID-related fiscal support. In the first quarter, we anticipate passage of a bill built around further stimulus checks, funds for state and local governments, and enhancements to unemployment benefits, among other provisions.
Recovery suggests that long-term interest rates climb, at least modestly, and S&P earnings per share (EPS) could return to its prior peak in the second quarter of this year. That is a reasonable and constructive outlook, but it provides little help in forecasting equity returns for 2021. Fair or sustainable price-to-earnings ratios (PEs) on mid-cycle earnings remains uncertain.
As we move forward, not all sectors will benefit equally. For this reason, we believe that active management, with its close monitoring of developments, is critical. We believe that the close interaction between our portfolio managers and our CIO Office — which synthesizes the views of more than 900 DWS economists, analysts and investment professionals around the world — positions us to make strategic and tactical decisions.
We appreciate your trust and welcome the opportunity to help you navigate these unusual times. For ongoing updates to our market and economic outlook, please visit the ‘Insights’ section of dws.com.
Best regards,
 |
Hepsen Uzcan
President, DWS Funds |

Assumptions, estimates and opinions contained in this document constitute our judgment as of the date of the document and are subject to change without notice. Any projections are based on a number of assumptions as to market conditions and there can be no guarantee that any projected results will be achieved. Past performance is not a guarantee of future results.
| DWS Enhanced Commodity Strategy Fund | | | 3 |
| Performance Summary | December 31, 2020 (Unaudited) |
| Class A | 6-Month‡ | 1-Year | 5-Year | 10-Year | ||||||||||||
| Average Annual Total Returns as of 12/31/20 | ||||||||||||||||
| Unadjusted for Sales Charge | 15.47% | –2.01% | –0.24% | –4.44% | ||||||||||||
| Adjusted for the Maximum Sales Charge (max 5.75% load) | 8.83% | –7.64% | | –1.41% | | | –5.00% | | ||||||||
| Bloomberg Commodity Index† | 20.19% | –3.12% | 1.03% | –6.50% | ||||||||||||
| Class T | 6-Month‡ | 1-Year | 5-Year | 10-Year | ||||||||||||
| Average Annual Total Returns as of 12/31/20 | ||||||||||||||||
| Unadjusted for Sales Charge | 15.45% | –1.99% | –0.21% | –4.45% | ||||||||||||
| Adjusted for the Maximum Sales Charge (max 2.50% load) | 12.57% | –4.44% | –0.71% | –4.69% | ||||||||||||
| Bloomberg Commodity Index† | 20.19% | –3.12% | 1.03% | –6.50% | ||||||||||||
| Class C | 6-Month‡ | 1-Year | 5-Year | 10-Year | ||||||||||||
| Average Annual Total Returns as of 12/31/20 | ||||||||||||||||
| Unadjusted for Sales Charge | 15.04% | –2.77% | –0.97% | –5.15% | ||||||||||||
| Adjusted for the Maximum Sales Charge (max 1.00% CDSC) | 14.04% | –2.77% | –0.97% | –5.15% | ||||||||||||
| Bloomberg Commodity Index† | 20.19% | –3.12% | 1.03% | | –6.50% | | ||||||||||
| Class R6 | 6-Month‡ | 1-Year | Life of Class* | |||||||||||||
| Average Annual Total Returns as of 12/31/20 | ||||||||||||||||
| No Sales Charges | 15.60% | –1.67% | –1.81% | |||||||||||||
| Bloomberg Commodity Index† | 20.19% | –3.12% | –0.71% | |||||||||||||
| Class S | 6-Month‡ | 1-Year | 5-Year | 10-Year | ||||||||||||
| Average Annual Total Returns as of 12/31/20 | ||||||||||||||||
| No Sales Charges | 15.52% | –1.88% | –0.03% | –4.25% | ||||||||||||
| Bloomberg Commodity Index† | 20.19% | –3.12% | 1.03% | –6.50% | ||||||||||||
| Institutional Class | 6-Month‡ | 1-Year | 5-Year | 10-Year | ||||||||||||
| Average Annual Total Returns as of 12/31/20 | ||||||||||||||||
| No Sales Charges | 15.58% | –1.68% | 0.13% | –4.12% | ||||||||||||
| Bloomberg Commodity Index† | 20.19% | –3.12% | 1.03% | –6.50% | ||||||||||||
| 4 | | | DWS Enhanced Commodity Strategy Fund |
Performance in the Average Annual Total Returns table above and the Growth of an Assumed $10,000 Investment line graph that follows is historical and does not guarantee future results. Investment return and principal fluctuate, so your shares may be worth more or less when redeemed. Current performance may differ from performance data shown. Please visit dws.com for the Fund’s most recent month-end performance. Fund performance includes reinvestment of all distributions. Unadjusted returns do not reflect sales charges and would have been lower if they had.
The gross expense ratios of the Fund, as stated in the fee table of the prospectus dated October 1, 2020 are 1.41%, 1.33%, 2.10%, 0.98%, 1.15% and 1.09% for Class A, Class T, Class C, Class R6, Class S and Institutional Class shares, respectively, and may differ from the expense ratios disclosed in the Financial Highlights tables in this report.
Index returns do not reflect any fees or expenses and it is not possible to invest directly into an index.
Performance figures do not reflect the deduction of taxes that a shareholder would pay on fund distributions or the redemption of fund shares.
Returns shown for Class T shares for the period prior to its inception on June 5, 2017 are derived from the historical performance of Institutional Class shares of DWS Enhanced Commodity Strategy Fund during such periods and have been adjusted to reflect the higher total annual operating expenses. Any difference in expenses will affect performance.
Generally accepted accounting principles require adjustments to be made to the net assets of the Fund at period end for financial reporting purposes only, and as such, the total return based on the unadjusted net asset value per share may differ from the total return reported in the financial highlights.
| Growth of an Assumed $10,000 Investment (Adjusted for Maximum Sales Charge) |
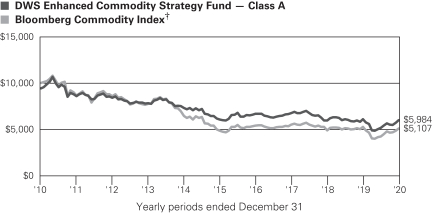
The Fund’s growth of an assumed $10,000 investment is adjusted for the maximum sales charge of 5.75%. This results in a net initial investment of $9,425.
The growth of $10,000 is cumulative.
| DWS Enhanced Commodity Strategy Fund | | | 5 |
Performance of other share classes will vary based on the sales charges and the fee structure of those classes.
| * | Class R6 shares commenced operations on June 1, 2016. |
| † | The Bloomberg Commodity Index is an unmanaged index that tracks a diversified group of commodities and commodities futures contracts traded on both U.S. and London exchanges. |
| ‡ | Total returns shown for periods less than one year are not annualized. |
| Class A | Class T | Class C | Class R6 | Class S | Institutional Class | |||||||||||||||||||
| Net Asset Value | ||||||||||||||||||||||||
| 12/31/20 | $ | 9.10 | $ | 9.11 | $ | 8.16 | $ | 9.23 | $ | 9.21 | $ | 9.24 | ||||||||||||
| 6/30/20 | $ | 7.93 | $ | 7.94 | $ | 7.11 | $ | 8.05 | $ | 8.03 | $ | 8.06 | ||||||||||||
| Distribution Information as of 12/31/20 |
| |||||||||||||||||||||||
| Income Dividends, Six Months | $ | .05 | $ | .05 | $ | .02 | $ | .07 | $ | .06 | $ | .07 | ||||||||||||
| 6 | | | DWS Enhanced Commodity Strategy Fund |
| Portfolio Management Team |
Darwei Kung, Managing Director
Portfolio Manager of the Fund. Began managing the Fund in 2010.
| – | Joined DWS in 2006; previously has worked as a Director, Engineering and Business Development at Calpoint LLC from 2001–2004. |
| – | Portfolio Manager: New York. |
| – | BS and MS, University of Washington, Seattle; MS and MBA, Carnegie Mellon University. |
Sonali Kapoor, Director
Portfolio Manager of the Fund. Began managing the Fund in 2015.
| – | Joined DWS in 2013 with three years of industry experience. Prior to joining, served in Foreign Exchange Sales covering Institutional Clients at BNP Paribas. Prior to that, provided Fixed Income Coverage and Execution to Energy, Utility and Real Estate Companies in the Debt Capital Markets Group at UBS Securities. Started her career in Mathematical Modeling and Quantitative Analysis of Cash CLOs in the Credit Structuring Group at UBS Securities. |
| – | Portfolio Analyst for Fixed Income, Multi-Asset and Commodities: New York. |
| – | BS in Electrical and Computer Engineering, Carnegie Mellon University; MS in Computational Finance, Carnegie Mellon University. |
Rick Smith, CFA, Managing Director
Portfolio Manager of the Fund. Began managing the Fund in 2016.
| – | Joined DWS in 2004 with 21 years of industry experience. Prior to joining, he served 11 years as a Fixed Income Investment Grade Portfolio Manager at MFS Investments. Previously, he worked as a Research Analyst at Salomon Brothers. |
| – | Senior Portfolio Manager: New York. |
| – | BA in Economics, Vassar College; MBA in Finance, Vanderbilt University. |
| DWS Enhanced Commodity Strategy Fund | | | 7 |
| Consolidated Portfolio Summary | (Unaudited) |
The Fund invests in commodity-linked derivative instruments backed by a portfolio of fixed-income instruments.
Commodity-Linked Investments
| Commodity Sector Allocation (Commodity Exposure from Commodity-Linked Derivative Instruments as a % of Net Assets) | 12/31/20 | 6/30/20 | ||||||
| Energy | 28% | 24% | ||||||
| Agriculture | 28% | 21% | ||||||
| Industrial | 19% | 16% | ||||||
| Precious Metals | 17% | 16% | ||||||
| Livestock | 5% | 4% | ||||||
| 97% | 81% | |||||||
Fixed-Income Investments
| Asset Allocation (As a % of Investment Portfolio excluding Securities Lending Collateral) | 12/31/20 | 6/30/20 | ||||||
| Government & Agency Obligations | 46% | 44% | ||||||
| Corporate Bonds | 24% | 26% | ||||||
| Cash Equivalents | 8% | 9% | ||||||
Asset-Backed | 8% | 11% | ||||||
| Commercial Mortgage-Backed Securities | 5% | 5% | ||||||
| Short-Term U.S. Treasury Obligations | 4% | 3% | ||||||
| Mortgage-Backed Securities Pass-Throughs | 2% | — | ||||||
Collateralized Mortgage Obligations | 2% | 2% | ||||||
| Exchange-Traded Funds | 1% | 0% | ||||||
Municipal Bonds and Notes | 0% | 0% | ||||||
| 100% | 100% | |||||||
| Quality (Excludes Cash Equivalents and securities lending collateral) | 12/31/20 | 6/30/20 | ||||||
| AAA | 64% | 60% | ||||||
| AA | 8% | 11% | ||||||
| A | 8% | 10% | ||||||
| BBB | 15% | 16% | ||||||
| Below BBB | 4% | 3% | ||||||
| Not Rated | 1% | 0% | ||||||
| 100% | 100% | |||||||
The quality ratings represent the higher of Moody’s Investors Service, Inc. (“Moody’s”), Fitch Ratings, Inc. (“Fitch”) or S&P Global Ratings (“S&P”) credit ratings. The ratings of Moody’s, Fitch and S&P represent their opinions as to the quality of the securities they rate. Credit quality measures a bond issuer’s ability to repay interest and principal in a timely manner. Ratings are relative and subjective and are not absolute standards of quality. Credit quality does not remove market risk and is subject to change.
| 8 | | | DWS Enhanced Commodity Strategy Fund |
| Interest Rate Sensitivity | 12/31/20 | 6/30/20 | ||||||
| Effective Maturity | 1.7 years | 1.9 years | ||||||
| Effective Duration | 0.8 years | 1.2 years | ||||||
Effective maturity is the weighted average of the maturity date of bonds held by the Fund taking into consideration any maturity shortening features.
Effective duration is an approximate measure of the Fund’s sensitivity to interest rate changes taking into consideration any maturity shortening features.
Portfolio holdings and characteristics are subject to change.
For more complete details about the Fund’s consolidated investment portfolio, see page 10. A quarterly Fact Sheet is available on dws.com or upon request. Please see the Account Management Resources section on page 67 for contact information.
| DWS Enhanced Commodity Strategy Fund | | | 9 |
| Consolidated Investment Portfolio | as of December 31, 2020 (Unaudited) |
| Principal Amount ($) | Value ($) | |||||||
| Corporate Bonds 23.6% |
| |||||||
| Communication Services 1.1% |
| |||||||
Charter Communications Operating LLC, 4.908%, 7/23/2025 | 3,000,000 | 3,484,343 | ||||||
Clear Channel Worldwide Holdings, Inc., 9.25%, 2/15/2024 | 298,000 | 301,725 | ||||||
CommScope, Inc., 144A, 5.5%, 3/1/2024 | 1,500,000 | 1,546,500 | ||||||
Kenbourne Invest SA, 144A, 6.875%, 11/26/2024 | 425,000 | 461,337 | ||||||
Meituan, 144A, 2.125%, 10/28/2025 | 720,000 | 731,405 | ||||||
Oztel Holdings SPC Ltd., 144A, 5.625%, 10/24/2023 | 3,161,000 | 3,343,200 | ||||||
Sprint Spectrum Co., LLC, 144A, 3.36%, 3/20/2023 | 116,250 | 117,343 | ||||||
Tencent Holdings Ltd., 144A, 3.28%, 4/11/2024 | 6,000,000 | 6,389,700 | ||||||
Tencent Music Entertainment Group, 1.375%, 9/3/2025 | 1,000,000 | 1,001,360 | ||||||
TripAdvisor, Inc., 144A, 7.0%, 7/15/2025 | 205,000 | 221,400 | ||||||
|
| |||||||
| 17,598,313 | ||||||||
| Consumer Discretionary 2.3% |
| |||||||
Ford Motor Credit Co., LLC, 3.375%, 11/13/2025 | 1,360,000 | 1,397,210 | ||||||
General Motors Financial Co., Inc., 3-month USD-LIBOR + 0.990%, 1.228%*, 1/5/2023 | 7,000,000 | 6,993,352 | ||||||
Harley-Davidson Financial Services, Inc., 144A, 4.05%, 2/4/2022 | 6,500,000 | 6,727,047 | ||||||
Hyundai Capital America: | ||||||||
144A, 3-month USD-LIBOR + 0.940%, 1.17%*, 7/8/2021 | 5,000,000 | 5,006,634 | ||||||
144A, 1.25%, 9/18/2023 | 4,685,000 | 4,740,528 | ||||||
144A, 2.375%, 2/10/2023 | 2,090,000 | 2,154,001 | ||||||
Meritor, Inc., 144A, 6.25%, 6/1/2025 | 310,000 | 334,800 | ||||||
Nissan Motor Acceptance Corp.: | ||||||||
144A, 2.6%, 9/28/2022 | 4,000,000 | 4,104,278 | ||||||
144A, 3.65%, 9/21/2021 | 2,612,000 | 2,657,519 | ||||||
Picasso Finance Sub, Inc., 144A, 6.125%, 6/15/2025 | 575,000 | 615,250 | ||||||
Volkswagen Group of America Finance LLC, 144A, 2.7%, 9/26/2022 | 4,160,000 | 4,312,857 | ||||||
|
| |||||||
| 39,043,476 | ||||||||
| Consumer Staples 0.1% |
| |||||||
General Mills, Inc., 3-month USD-LIBOR + 0.540%, 0.77%*, 4/16/2021 | 1,418,000 | 1,420,029 | ||||||
| Energy 2.2% |
| |||||||
Antero Midstream Partners LP, 144A, 7.875%, 5/15/2026 | 2,000,000 | 2,065,160 | ||||||
Bharat Petroleum Corp. Ltd., REG S, 4.625%, 10/25/2022 | 1,830,000 | 1,914,034 | ||||||
CNOOC Curtis Funding No. 1 Pty Ltd., 144A, 4.5%, 10/3/2023 | 1,000,000 | 1,084,784 | ||||||
The accompanying notes are an integral part of the consolidated financial statements.
| 10 | | | DWS Enhanced Commodity Strategy Fund |
| Principal Amount ($) | Value ($) | |||||||
Ecopetrol SA, 5.875%, 9/18/2023 | 1,500,000 | 1,674,765 | ||||||
Energy Transfer Operating LP: | ||||||||
3.6%, 2/1/2023 | 5,920,000 | 6,201,976 | ||||||
4.25%, 3/15/2023 | 1,170,000 | 1,243,308 | ||||||
MarkWest Energy Partners LP, 4.875%, 6/1/2025 | 3,500,000 | 4,042,743 | ||||||
MPLX LP, 3.5%, 12/1/2022 | 605,000 | 635,406 | ||||||
ONGC Videsh Ltd., REG S, 3.75%, 5/7/2023 | 2,000,000 | 2,092,780 | ||||||
Pertamina Persero PT: | ||||||||
144A, 4.3%, 5/20/2023 | 1,500,000 | 1,608,750 | ||||||
144A, 4.875%, 5/3/2022 | 1,000,000 | 1,051,009 | ||||||
Petroleos Mexicanos, 3.5%, 1/30/2023 | 1,000,000 | 1,019,800 | ||||||
Petronas Capital Ltd., 144A, 7.875%, 5/22/2022 | 1,000,000 | 1,100,620 | ||||||
Phillips 66, 0.9%, 2/15/2024 | 2,020,000 | 2,024,892 | ||||||
Saudi Arabian Oil Co., 144A, 1.25%, 11/24/2023 | 887,000 | 898,414 | ||||||
Sinopec Group Overseas Development, Ltd., 144A, 2.15%, 5/13/2025 | 2,500,000 | 2,574,548 | ||||||
Tengizchevroil Finance Co. International Ltd., 144A, 2.625%, 8/15/2025 | 1,500,000 | 1,560,138 | ||||||
Western Midstream Operating LP, 3-month USD-LIBOR + 1.850%, 2.074%*, 1/13/2023 | 2,000,000 | 1,960,526 | ||||||
Williams Companies, Inc., 4.55%, 6/24/2024 | 2,200,000 | 2,462,582 | ||||||
|
| |||||||
| 37,216,235 | ||||||||
| Financials 9.6% |
| |||||||
AerCap Ireland Capital DAC, 4.875%, 1/16/2024 | 2,350,000 | 2,565,510 | ||||||
Aircastle Ltd.: |
| |||||||
4.4%, 9/25/2023 | 4,345,000 | 4,604,221 | ||||||
5.5%, 2/15/2022 | 4,000,000 | 4,165,985 | ||||||
Ares Capital Corp., 3.5%, 2/10/2023 | 8,000,000 | 8,427,409 | ||||||
ASB Bank Ltd., 144A, 3.125%, 5/23/2024 | 5,290,000 | 5,704,194 | ||||||
Avolon Holdings Funding Ltd., 144A, 5.125%, 10/1/2023 | 1,675,000 | 1,791,885 | ||||||
Banco de Credito del Peru, 144A, 4.25%, 4/1/2023 | 1,000,000 | 1,067,500 | ||||||
Banco Santander SA, 3.125%, 2/23/2023 | 4,600,000 | 4,843,315 | ||||||
Banco Votorantim SA, 144A, 4.375%, 7/29/2025 | 1,000,000 | 1,065,510 | ||||||
Bancolombia SA, 3.0%, 1/29/2025 | 3,104,000 | 3,228,191 | ||||||
Barclays PLC, 4.61%, 2/15/2023 | 8,000,000 | 8,351,474 | ||||||
BBVA Bancomer SA, 144A, 1.875%, 9/18/2025 | 2,139,000 | 2,160,390 | ||||||
BBVA USA: | ||||||||
3-month USD-LIBOR + 0.730%, 0.951%*, 6/11/2021 | 5,000,000 | 5,011,388 | ||||||
3.5%, 6/11/2021 | 2,000,000 | 2,022,596 | ||||||
BOC Aviation Ltd., 144A, 3.25%, 4/29/2025 | 1,500,000 | 1,588,516 | ||||||
BPCE SA: | ||||||||
144A, 2.375%, 1/14/2025 | 300,000 | 317,056 | ||||||
144A, 3.0%, 5/22/2022 | 1,500,000 | 1,552,287 | ||||||
Canadian Imperial Bank of Commerce, 0.95%, 6/23/2023 | 4,800,000 | 4,863,468 | ||||||
The accompanying notes are an integral part of the consolidated financial statements.
| DWS Enhanced Commodity Strategy Fund | | | 11 |
| Principal Amount ($) | Value ($) | |||||||
CBQ Finance Ltd., REG S, 5.0%, 5/24/2023 | 3,000,000 | 3,249,000 | ||||||
Citizens Financial Group, Inc., 144A, 4.15%, 9/28/2022 | 2,000,000 | 2,111,271 | ||||||
Credicorp Ltd., 144A, 2.75%, 6/17/2025 | 1,000,000 | 1,040,000 | ||||||
Danske Bank AS, 144A, 3.001%, 9/20/2022 | 4,308,000 | 4,376,138 | ||||||
Discover Bank, 3.35%, 2/6/2023 | 3,085,000 | 3,255,254 | ||||||
Equitable Holdings, Inc., 3.9%, 4/20/2023 | 4,680,000 | 5,035,138 | ||||||
Genworth Mortgage Holdings, Inc., 144A, 6.5%, 8/15/2025 | 250,000 | 270,625 | ||||||
Global Bank Corp., 144A, 4.5%, 10/20/2021 | 4,125,000 | 4,212,656 | ||||||
ING Groep NV: | ||||||||
3.15%, 3/29/2022 | 1,580,000 | 1,634,017 | ||||||
3.55%, 4/9/2024 | 3,950,000 | 4,315,649 | ||||||
Intercontinental Exchange, Inc., 3.45%, 9/21/2023 | 2,825,000 | 3,043,149 | ||||||
Intesa Sanpaolo SpA, 144A, 3.125%, 7/14/2022 | 4,455,000 | 4,613,374 | ||||||
Kookmin Bank, 144A, 1.75%, 5/4/2025 | 805,000 | 835,708 | ||||||
LD Holdings Group LLC, 144A, 6.5%, 11/1/2025 | 766,000 | 806,215 | ||||||
Lloyds Banking Group PLC, 1.326%, 6/15/2023 | 3,500,000 | 3,538,572 | ||||||
Mizuho Financial Group, Inc., 1.241%, 7/10/2024 | 4,351,000 | 4,423,196 | ||||||
Morgan Stanley, SOFR + 0.700%, 0.785%*, 1/20/2023 | 2,000,000 | 2,006,420 | ||||||
National Australia Bank Ltd., 2.5%, 1/12/2021 | 2,000,000 | 2,000,820 | ||||||
Nationwide Building Society, 144A, 3.622%, 4/26/2023 | 2,460,000 | 2,555,245 | ||||||
NatWest Markets PLC, 144A, 3-month USD-LIBOR + 1.400%, 1.651%*, 9/29/2022 | 3,000,000 | 3,036,644 | ||||||
Nomura Holdings, Inc., 2.648%, 1/16/2025 | 2,495,000 | 2,664,582 | ||||||
Park Aerospace Holdings Ltd., 144A, 4.5%, 3/15/2023 | 2,450,000 | 2,567,416 | ||||||
REC Ltd., 144A, 4.75%, 5/19/2023 | 1,423,000 | 1,517,714 | ||||||
Santander Holdings U.S.A., Inc., 3.4%, 1/18/2023 | 6,150,000 | 6,459,849 | ||||||
Skandinaviska Enskilda Banken AB: | ||||||||
144A, 3-month USD-LIBOR + 0.430%, 0.652%*, 5/17/2021 | 5,000,000 | 5,007,432 | ||||||
144A, 3.05%, 3/25/2022 | 2,750,000 | 2,842,222 | ||||||
Societe Generale SA, 144A, 2.625%, 1/22/2025 | 3,705,000 | 3,923,927 | ||||||
Standard Chartered PLC: | ||||||||
144A, 1.319%, 10/14/2023 | 2,500,000 | 2,525,000 | ||||||
144A, 4.247%, 1/20/2023 | 2,080,000 | 2,156,955 | ||||||
Synchrony Bank: | ||||||||
3.0%, 6/15/2022 | 4,310,000 | 4,450,637 | ||||||
3.65%, 5/24/2021 | 4,234,000 | 4,275,982 | ||||||
Turkiye Sinai Kalkinma Bankasi AS, 144A, 6.0%, 1/23/2025 | 500,000 | 503,952 | ||||||
Turkiye Vakiflar Bankasi TAO, REG S, 5.625%, 5/30/2022 | 1,000,000 | 1,008,028 | ||||||
|
| |||||||
| 159,593,682 | ||||||||
| Health Care 0.2% |
| |||||||
Bausch Health Companies, Inc., 144A, 7.0%, 3/15/2024 | 3,200,000 | 3,292,000 | ||||||
The accompanying notes are an integral part of the consolidated financial statements.
| 12 | | | DWS Enhanced Commodity Strategy Fund |
| Principal Amount ($) | Value ($) | |||||||
| Industrials 2.0% |
| |||||||
Adani Ports & Special Economic Zone Ltd., 144A, 3.95%, 1/19/2022 | 2,267,000 | 2,317,622 | ||||||
Bombardier, Inc., 144A, 6.0%, 10/15/2022 | 3,000,000 | 2,944,950 | ||||||
CNH Industrial Capital LLC, 3.875%, 10/15/2021 | 2,510,000 | 2,568,936 | ||||||
Colfax Corp., 144A, 6.0%, 2/15/2024 | 775,000 | 803,109 | ||||||
DAE Funding LLC, 144A, 5.25%, 11/15/2021 | 3,000,000 | 3,052,500 | ||||||
Delta Air Lines, Inc.: | ||||||||
3.4%, 4/19/2021 | 3,636,000 | 3,659,771 | ||||||
144A, 4.5%, 10/20/2025 | 520,000 | 555,807 | ||||||
Hillenbrand, Inc., 5.75%, 6/15/2025 | 1,120,000 | 1,209,600 | ||||||
Nielsen Finance LLC, 144A, 5.625%, 10/1/2028 | 1,235,000 | 1,341,889 | ||||||
Penske Truck Leasing Co. LP, 144A, 1.2%, 11/15/2025 | 3,155,000 | 3,181,989 | ||||||
Prime Security Services Borrower LLC, 144A, 5.25%, 4/15/2024 | 2,065,000 | 2,204,387 | ||||||
Southwest Airlines Co., 4.75%, 5/4/2023 (a) | 2,305,000 | 2,505,268 | ||||||
Spirit AeroSystems, Inc., 3-month USD-LIBOR + 0.800%, 1.017%*, 6/15/2021 | 4,390,000 | 4,334,518 | ||||||
Spirit Loyalty Cayman Ltd., 144A, 8.0%, 9/20/2025 | 225,000 | 252,000 | ||||||
Transnet SOC Ltd., 144A, 4.0%, 7/26/2022 | 2,000,000 | 2,022,080 | ||||||
WESCO Distribution, Inc., 144A, 7.125%, 6/15/2025 | 375,000 | 412,436 | ||||||
|
| |||||||
| 33,366,862 | ||||||||
| Information Technology 2.0% |
| |||||||
DXC Technology Co., 4.0%, 4/15/2023 | 4,000,000 | 4,255,308 | ||||||
Hewlett Packard Enterprise Co., 3-month USD-LIBOR + 0.720%, 0.958%*, 10/5/2021 | 2,090,000 | 2,090,301 | ||||||
HP, Inc., 2.2%, 6/17/2025 | 4,190,000 | 4,436,116 | ||||||
Microchip Technology, Inc.: | ||||||||
144A, 0.972%, 2/15/2024 | 4,000,000 | 4,009,791 | ||||||
144A, 2.67%, 9/1/2023 | 1,250,000 | 1,307,330 | ||||||
144A, 4.25%, 9/1/2025 | 170,000 | 179,850 | ||||||
NXP BV, 144A, 4.625%, 6/1/2023 | 5,961,000 | 6,515,538 | ||||||
Seagate HDD Cayman, 4.875%, 3/1/2024 | 1,940,000 | 2,107,228 | ||||||
VMware, Inc., 2.95%, 8/21/2022 | 4,800,000 | 4,979,295 | ||||||
Xerox Holdings Corp., 144A, 5.0%, 8/15/2025 | 3,490,000 | 3,714,302 | ||||||
|
| |||||||
| 33,595,059 | ||||||||
| Materials 1.8% |
| |||||||
Bluestar Finance Holdings Ltd., REG S, 3.375%, 7/16/2024 | 1,000,000 | 1,010,390 | ||||||
Celanese U.S. Holdings LLC, 3.5%, 5/8/2024 | 1,010,000 | 1,093,747 | ||||||
CF Industries, Inc., 144A, 3.4%, 12/1/2021 | 340,000 | 347,974 | ||||||
CNAC HK Finbridge Co., Ltd., REG S, 4.125%, 3/14/2021 | 3,000,000 | 3,010,200 | ||||||
DuPont de Nemours, Inc., 2.169%, 5/1/2023 | 2,500,000 | 2,533,125 | ||||||
First Quantum Minerals Ltd., 144A, 7.25%, 4/1/2023 | 486,000 | 500,908 | ||||||
The accompanying notes are an integral part of the consolidated financial statements.
| DWS Enhanced Commodity Strategy Fund | | | 13 |
| Principal Amount ($) | Value ($) | |||||||
Glencore Funding LLC: | ||||||||
144A, 1.625%, 9/1/2025 | 1,385,000 | 1,424,866 | ||||||
144A, 4.125%, 3/12/2024 | 4,640,000 | 5,105,824 | ||||||
Indonesia Asahan Aluminium Persero PT, 144A, 4.75%, 5/15/2025 | 1,500,000 | 1,655,250 | ||||||
LYB International Finance III LLC, 1.25%, 10/1/2025 | 2,000,000 | 2,035,031 | ||||||
MEGlobal Canada ULC, 144A, 5.0%, 5/18/2025 | 2,419,000 | 2,721,375 | ||||||
NOVA Chemicals Corp., 144A, 4.875%, 6/1/2024 | 1,510,000 | 1,572,288 | ||||||
Nucor Corp., 2.0%, 6/1/2025 | 635,000 | 672,478 | ||||||
OCI NV, 144A, 4.625%, 10/15/2025 | 2,500,000 | 2,593,750 | ||||||
The Mosaic Co., 3.25%, 11/15/2022 | 4,190,000 | 4,378,523 | ||||||
|
| |||||||
| 30,655,729 | ||||||||
| Real Estate 0.3% |
| |||||||
Equinix, Inc., (REIT), 1.25%, 7/15/2025 | 690,000 | 703,892 | ||||||
iStar, Inc., (REIT), 4.25%, 8/1/2025 | 450,000 | 444,375 | ||||||
MGM Growth Properties Operating Partnership LP, 144A, (REIT), 4.625%, 6/15/2025 | 330,000 | 353,430 | ||||||
Realogy Group LLC, 144A, (REIT), 7.625%, 6/15/2025 | 800,000 | 868,576 | ||||||
Ventas Realty LP, (REIT), 3.5%, 4/15/2024 | 2,800,000 | 3,045,675 | ||||||
VICI Properties LP, 144A, (REIT), 3.5%, 2/15/2025 | 140,000 | 143,189 | ||||||
|
| |||||||
| 5,559,137 | ||||||||
| Utilities 2.0% |
| |||||||
American Electric Power Co., Inc., 0.75%, 11/1/2023 | 2,255,000 | 2,260,059 | ||||||
CenterPoint Energy, Inc., 3.6%, 11/1/2021 | 2,030,000 | 2,084,121 | ||||||
Comision Federal de Electricidad, 144A, 4.875%, 5/26/2021 | 2,500,000 | 2,537,525 | ||||||
Dominion Energy, Inc., 3.071%, 8/15/2024 | 3,159,000 | 3,410,233 | ||||||
DTE Energy Co., Series B, 2.6%, 6/15/2022 | 4,100,000 | 4,228,348 | ||||||
Korea East-West Power Co., Ltd.: | ||||||||
144A, 1.75%, 5/6/2025 | 940,000 | 981,614 | ||||||
144A, 2.625%, 6/19/2022 | 4,740,000 | 4,885,802 | ||||||
NextEra Energy Operating Partners LP, 144A, 4.25%, 7/15/2024 | 1,330,000 | 1,423,100 | ||||||
Pacific Gas and Electric Co., 1.75%, 6/16/2022 | 9,000,000 | 9,025,399 | ||||||
Perusahaan Perseroan Persero PT Perusahaan Listrik Negara, 144A, 5.5%, 11/22/2021 | 1,025,000 | 1,068,050 | ||||||
State Grid Overseas Investment, Ltd., 144A, 2.75%, 5/4/2022 | 1,500,000 | 1,536,751 | ||||||
|
| |||||||
| 33,441,002 | ||||||||
Total Corporate Bonds (Cost $380,874,736) |
| 394,781,524 | ||||||
| Mortgage-Backed Securities Pass-Throughs 1.9% |
| |||||||
Federal National Mortgage Association, 2.0%, with various maturities from 1/1/2036 until 2/1/2036 (b) (Cost $31,171,875) | 30,000,000 | 31,363,500 | ||||||
The accompanying notes are an integral part of the consolidated financial statements.
| 14 | | | DWS Enhanced Commodity Strategy Fund |
| Principal Amount ($) | Value ($) | |||||||
| Asset-Backed 8.0% |
| |||||||
| Automobile Receivables 3.8% |
| |||||||
AmeriCredit Automobile Receivables Trust: |
| |||||||
“C”, Series 2020-2, 1.48%, 2/18/2026 | 1,100,000 | 1,114,887 | ||||||
“C”, Series 2019-2, 2.74%, 4/18/2025 | 2,760,000 | 2,874,683 | ||||||
Avis Budget Rental Car Funding LLC, “B”, Series 2017-2A, 144A, 3.33%, 3/20/2024 | 720,000 | 744,022 | ||||||
Canadian Pacer Auto Receivables Trust, “B”, Series 2018-2A, 144A, 3.63%, 1/19/2024 | 1,500,000 | 1,555,428 | ||||||
CarMax Auto Owner Trust, “C”, Series 2020-3, 1.69%, 4/15/2026 | 750,000 | 767,796 | ||||||
Chase Auto Credit Linked Notes: |
| |||||||
“D”, Series 2020-2, 144A, 1.487%, 2/25/2028 | 1,175,000 | 1,176,637 | ||||||
“E”, Series 2020-2, 144A, 3.072%, 2/25/2028 | 1,959,000 | 1,962,945 | ||||||
CPS Auto Receivables Trust: |
| |||||||
“B”, Series 2020-B, 144A, 2.11%, 4/15/2026 | 2,000,000 | 2,036,626 | ||||||
“B”, Series 2019-C, 144A, 2.63%, 8/15/2023 | 2,000,000 | 2,014,140 | ||||||
“B”, Series 2019-B, 144A, 3.09%, 4/17/2023 | 2,762,932 | 2,779,784 | ||||||
“D”, Series 2017-D, 144A, 3.73%, 9/15/2023 | 2,300,000 | 2,342,790 | ||||||
“C”, Series 2018-D, 144A, 3.83%, 9/15/2023 | 3,160,000 | 3,209,675 | ||||||
“D”, Series 2016-A, 144A, 5.0%, 12/15/2021 | 936,952 | 939,836 | ||||||
CPS Auto Trust, “D”, Series 2016-D, 144A, 4.53%, 1/17/2023 | 250,312 | 252,708 | ||||||
Flagship Credit Auto Trust: |
| |||||||
“C”, Series 2020-4, 144A, 1.28%, 2/16/2027 | 763,000 | 769,624 | ||||||
“C”, Series 2020-3, 144A, 1.73%, 9/15/2026 | 2,150,000 | 2,201,758 | ||||||
“C”, Series 2020-1, 144A, 2.24%, 1/15/2026 | 2,240,000 | 2,303,180 | ||||||
“B”, Series 2020-2, 144A, 2.61%, 4/15/2026 | 3,348,000 | 3,459,533 | ||||||
“C”, Series 2019-3, 144A, 2.74%, 10/15/2025 | 3,000,000 | 3,105,866 | ||||||
“C”, Series 2019-4, 144A, 2.77%, 12/15/2025 | 165,000 | 171,713 | ||||||
“C”, Series 2017-1, 144A, 3.22%, 5/15/2023 | 102,536 | 102,758 | ||||||
“C”, Series 2020-2, 144A, 3.8%, 4/15/2026 | 500,000 | 533,343 | ||||||
Ford Credit Floorplan Master Owner Trust, “A1”, Series 2018-3, 3.52%, 10/15/2023 | 530,000 | 543,483 | ||||||
Foursight Capital Automobile Receivables Trust: |
| |||||||
“B”, Series 2020-1, 144A, 2.27%, 2/18/2025 | 1,250,000 | 1,281,032 | ||||||
“A3”, Series 2019-1, 144A, 2.67%, 3/15/2024 | 2,500,000 | 2,539,137 | ||||||
“B”, Series 2018-2, 144A, 3.8%, 11/15/2023 | 2,110,000 | 2,159,154 | ||||||
GMF Floorplan Owner Revolving Trust: |
| |||||||
“C”, Series 2020-2, 144A, 1.31%, 10/15/2025 | 700,000 | 705,461 | ||||||
“A”, Series 2019-1, 144A, 2.7%, 4/15/2024 | 510,000 | 525,162 | ||||||
Hertz Vehicle Financing II LP: |
| |||||||
“A”, Series 2016-2A, 144A, 2.95%, 3/25/2022 | 1,312,215 | 1,313,346 | ||||||
“B”, Series 2019-3A, 144A, 3.03%, 12/26/2025 | 2,500,000 | 2,495,894 | ||||||
“A”, Series 2017-2A, 144A, 3.29%, 10/25/2023 | 1,140,295 | 1,141,612 | ||||||
The accompanying notes are an integral part of the consolidated financial statements.
| DWS Enhanced Commodity Strategy Fund | | | 15 |
| Principal Amount ($) | Value ($) | |||||||
Santander Consumer Auto Receivables Trust, “B”, Series 2020-AA, 144A, 2.26%, 12/15/2025 | 1,000,000 | 1,034,946 | ||||||
Santander Drive Auto Receivables Trust: |
| |||||||
“C”, Series 2020-4, 1.01%, 1/15/2026 | 1,195,000 | 1,200,207 | ||||||
“C”, Series 2020-2, 1.46%, 9/15/2025 | 1,750,000 | 1,773,190 | ||||||
“C”, Series 2018-5, 3.81%, 12/16/2024 | 3,028,882 | 3,062,313 | ||||||
Tesla Auto Lease Trust, “C”, Series 2020-A, 144A, 1.68%, 2/20/2024 | 1,000,000 | 1,014,161 | ||||||
United Auto Credit Securitization Trust, “B”, Series 2020-1, 144A, 1.47%, 11/10/2022 | 3,000,000 | 3,016,080 | ||||||
World Omni Select Auto Trust: |
| |||||||
“C”, Series 2019-A, 2.38%, 12/15/2025 | 1,500,000 | 1,550,932 | ||||||
“B”, Series 2018-1A, 144A, 3.68%, 7/15/2023 | 1,630,000 | 1,646,654 | ||||||
|
| |||||||
| 63,422,496 | ||||||||
| Credit Card Receivables 0.7% |
| |||||||
Evergreen Credit Card Trust, “C”, Series 2019-2, 144A, 2.62%, 9/15/2024 | 1,000,000 | 1,026,312 | ||||||
First National Master Note Trust, “A”, Series 2018-1, 1-month USD-LIBOR + 0.460%, 0.619% *, 10/15/2024 | 785,000 | 786,115 | ||||||
Genesis Sales Finance Master Trust, “A”, Series 2020-AA, 144A, 1.65%, 9/22/2025 | 500,000 | 499,808 | ||||||
Synchrony Credit Card Master Note Trust: |
| |||||||
“C”, Series 2016-2, 2.95%, 5/15/2024 | 415,017 | 418,149 | ||||||
“C”, Series 2017-2, 3.01%, 10/15/2025 | 3,291,836 | 3,403,679 | ||||||
World Financial Network Credit Card Master Trust, “M”, Series 2016-A, 2.33%, 4/15/2025 | 6,000,000 | 6,043,646 | ||||||
|
| |||||||
| 12,177,709 | ||||||||
| Miscellaneous 3.5% |
| |||||||
Babson CLO Ltd.: |
| |||||||
“BR”, Series 2015-IA, 144A, 3-month USD-LIBOR + 1.400%, 1.618%*, 1/20/2031 | 2,000,000 | 1,960,346 | ||||||
“BR”, Series 2014-IA, 144A, 3-month USD-LIBOR + 2.200%, 2.418%*, 7/20/2025 | 500,000 | 500,072 | ||||||
BlueMountain Fuji U.S. CLO II Ltd., “A1B”, Series 2017-2A, 144A, 3-month USD-LIBOR + 1.350%, 1.568%*, 10/20/2030 | 4,000,000 | 3,977,388 | ||||||
CF Hippolyta LLC, “B1”, Series 2020-1, 144A, 2.28%, 7/15/2060 | 2,545,010 | 2,584,380 | ||||||
Dell Equipment Finance Trust: |
| |||||||
“C”, Series 2019-2, 144A, 2.18%, 10/22/2024 | 1,750,000 | 1,777,887 | ||||||
“D”, Series 2019-1, 144A, 3.45%, 3/24/2025 | 2,400,000 | 2,457,344 | ||||||
“C”, Series 2018-1,144A, 3.53%, 6/22/2023 | 2,656,000 | 2,683,875 | ||||||
“C”, Series 2018-2, 144A, 3.72%, 10/22/2023 | 3,000,000 | 3,062,362 | ||||||
The accompanying notes are an integral part of the consolidated financial statements.
| 16 | | | DWS Enhanced Commodity Strategy Fund |
| Principal Amount ($) | Value ($) | |||||||
Hilton Grand Vacations Trust, “A”, Series 2019-AA, 144A, 2.34%, 7/25/2033 | 682,609 | 706,699 | ||||||
HPEFS Equipment Trust: |
| |||||||
“C”, Series 2020-2A, 144A, 2.0%, 7/22/2030 | 1,890,000 | 1,920,451 | ||||||
“C”, Series 2019-1A, 144A, 2.49%, 9/20/2029 | 1,140,000 | 1,162,396 | ||||||
Madison Park Funding XII Ltd., “AR”, Series 2014-12A, 144A, 3-month USD-LIBOR + 1.260%, 1.478%*, 7/20/2026 | 380,843 | 380,899 | ||||||
Madison Park Funding XXVI Ltd., “AR”, Series 2007-4A, 144A, 3-month USD-LIBOR + 1.200%, 1.413%*, 7/29/2030 | 3,646,000 | 3,646,193 | ||||||
MVW LLC: |
| |||||||
“A”, Series 2020-1A, 144A, 1.74%, 10/20/2037 | 454,005 | 464,294 | ||||||
“B”, Series 2019-2A, 144A, 2.44%, 10/20/2038 | 1,267,519 | 1,289,769 | ||||||
“B”, Series 2020-1A, 144A, 2.73%, 10/20/2037 | 454,005 | 465,456 | ||||||
MVW Owner Trust, “A”, Series 2019-1A, 144A, 2.89%, 11/20/2036 | 1,613,755 | 1,674,560 | ||||||
Neuberger Berman Loan Advisers CLO Ltd.: |
| |||||||
“A2”, Series 2018-29A, 144A, 3-month USD-LIBOR + 1.400%, 1.618%*, 10/19/2031 | 3,000,000 | 2,999,991 | ||||||
“B”, Series 2018-27A, 144A, 3-month USD-LIBOR + 1.400%, 1.637%*, 1/15/2030 | 5,250,000 | 5,212,000 | ||||||
NRZ Excess Spread-Collateralized Notes, “A”, Series 2020-PLS1, 144A, 3.844%, 12/25/2025 (c) | 1,000,000 | 999,997 | ||||||
Sierra Timeshare Receivables Funding LLC, “B”, Series 2020-2A, 144A, 2.32%, 7/20/2037 | 1,055,065 | 1,067,261 | ||||||
Transportation Finance Equipment Trust, “C”, Series 2019-1, 144A, 2.19%, 8/23/2024 | 1,250,000 | 1,281,251 | ||||||
Venture XXX CLO Ltd., “A2”, Series 2017-30A, 144A, 3-month USD-LIBOR + 1.350%, 1.587%*, 1/15/2031 | 10,000,000 | 9,940,150 | ||||||
Verizon Owner Trust, “C”, Series 2018-A, 3.55%, 4/20/2023 | 720,000 | 741,213 | ||||||
Voya CLO Ltd.: |
| |||||||
“A1RR”, Series 2014-2A, 144A, 3-month USD-LIBOR + 1.020%, 1.238%*, 4/17/2030 | 2,981,211 | 2,962,114 | ||||||
“A2AR”, Series 2012-4A, 144A, 3-month USD-LIBOR + 1.900%, 2.137%*, 10/15/2030 | 3,000,000 | 2,998,464 | ||||||
|
| |||||||
| 58,916,812 | ||||||||
Total Asset-Backed (Cost $133,018,600) |
| 134,517,017 | ||||||
| Commercial Mortgage-Backed Securities 5.0% |
| |||||||
Atrium Hotel Portfolio Trust, “B”, Series 2018-ATRM,144A, 1-month USD-LIBOR + 1.430%, 1.589%*, 6/15/2035 | 6,000,000 | 5,714,249 | ||||||
BAMLL Commercial Mortgage Securities Trust: |
| |||||||
“A”, Series 2018-DSNY, 144A, 1-month USD-LIBOR + 0.850%, 1.009%*, 9/15/2034 | 950,000 | 938,084 | ||||||
The accompanying notes are an integral part of the consolidated financial statements.
| DWS Enhanced Commodity Strategy Fund | | | 17 |
| Principal Amount ($) | Value ($) | |||||||
“B”, Series 2018-DSNY, 144A, 1-month USD-LIBOR + 1.150%, 1.309%*, 9/15/2034 | 9,200,000 | 8,992,326 | ||||||
“C”, Series 2018-DSNY, 144A, 1-month USD-LIBOR + 1.350%, 1.509%*, 9/15/2034 | 130,000 | 125,762 | ||||||
BFLD TRUST, “B”, Series 2019-DPLO, 144A, 1-month USD-LIBOR + 1.340%, 1.499%*, 10/15/2034 | 1,500,000 | 1,471,797 | ||||||
BX Commercial Mortgage Trust: |
| |||||||
“B”, Series 2019-IMC, 144A, 1-month USD-LIBOR + 1.300%, 1.459%*, 4/15/2034 | 6,500,000 | 6,239,151 | ||||||
“D”, Series 2020-VKNG, 144A, 1-month USD-LIBOR + 1.700%, 1.859%*, 10/15/2037 | 1,920,000 | 1,917,710 | ||||||
BXP Trust: |
| |||||||
“A”, Series 2017-CQHP, 144A, 1-month USD-LIBOR + 0.850%, 1.009%*, 11/15/2034 | 730,000 | 717,967 | ||||||
“B”, Series 2017-CQHP, 144A, 1-month USD-LIBOR + 1.100%, 1.259%*, 11/15/2034 | 6,210,000 | 5,897,972 | ||||||
CHT Mortgage Trust, “A”, Series 2017-CSMO,144A, 1-month USD-LIBOR + 0.930%, 1.089%*, 11/15/2036 | 1,800,000 | 1,779,766 | ||||||
Citigroup Commercial Mortgage Trust: |
| |||||||
“AS”, Series 2013-GC11, 3.422%, 4/10/2046 | 1,500,000 | 1,575,320 | ||||||
“B”, Series 2013-GC11, 3.732%, 4/10/2046 | 500,000 | 525,302 | ||||||
“C”, Series 2019-PRM, 144A, 3.896%, 5/10/2036 | 1,614,506 | 1,692,876 | ||||||
COMM Mortgage Trust: |
| |||||||
“AM”, Series 2013-CR6, 144A, 3.147%, 3/10/2046 | 2,200,000 | 2,286,496 | ||||||
“AM”, Series 2013-LC6, 3.282%, 1/10/2046 | 2,500,000 | 2,600,460 | ||||||
“B”, Series 2013-CR6, 144A, 3.397%, 3/10/2046 | 4,238,720 | 4,333,096 | ||||||
Credit Suisse Mortgage Trust: |
| |||||||
“B”, Series 2020-FACT, 144A, 1-month USD-LIBOR + 2.000%, 2.159%*, 10/15/2037 | 2,756,000 | 2,761,355 | ||||||
“A”, Series 2020-TMIC, 144A, 1-month USD-LIBOR + 3.000%, 3.25%*, 12/15/2035 | 1,500,000 | 1,505,696 | ||||||
“C”, Series 2020-NET, 144A, 3.526%, 8/15/2037 | 1,000,000 | 1,044,360 | ||||||
FHLMC Multifamily Structured Pass-Through Certificates: |
| |||||||
“X1”, Series K058, Interest Only, 0.925%*, 8/25/2026 | 23,342,060 | 1,076,872 | ||||||
“X1”, Series K722, Interest Only, 1.307%*, 3/25/2023 | 14,724,906 | 314,478 | ||||||
FREMF Mortgage Trust, “B”, Series 2012-K23, 144A, 3.656%*, 10/25/2045 | 1,750,000 | 1,821,849 | ||||||
Hospitality Mortgage Trust, “B”, Series 2019-HIT, 144A, 1-month USD-LIBOR + 1.350%, 1.509%*, 11/15/2036 | 4,693,470 | 4,605,225 | ||||||
IMT Trust, “BFL”, Series 2017-APTS, 144A, 1-month USD-LIBOR + 0.950%, 1.109%*, 6/15/2034 | 7,229,985 | 7,206,767 | ||||||
InTown Hotel Portfolio Trust, “C”, Series 2018-STAY, 144A, 1-month USD-LIBOR + 1.250%, 1.409%*, 1/15/2033 | 2,200,000 | 2,146,100 | ||||||
Morgan Stanley Capital I Trust, “B”, Series 2018-SUN, 144A, 1-month USD-LIBOR + 1.200%, 1.359%*, 7/15/2035 | 2,353,200 | 2,303,177 | ||||||
The accompanying notes are an integral part of the consolidated financial statements.
| 18 | | | DWS Enhanced Commodity Strategy Fund |
| Principal Amount ($) | Value ($) | |||||||
Natixis Commercial Mortgage Securities Trust, “B”, Series 2018-850T, 144A, 1-month USD-LIBOR + 0.954%, 1.112%*, 7/15/2033 | 6,500,000 | 6,332,435 | ||||||
One New York Plaza Trust, “AJ”, Series 2020-1NYP, 144A, 1-month USD-LIBOR + 1.250%, 1.409%*, 1/15/2026 | 2,378,000 | 2,379,425 | ||||||
UBS Commercial Mortgage Trust, “XA”, Series 2017-C1, Interest Only, 1.544%*, 6/15/2050 | 33,785,299 | 2,516,032 | ||||||
Wells Fargo Commercial Mortgage Trust: |
| |||||||
“A2”, Series 2016-C34, 2.603%, 6/15/2049 | 485,367 | 488,002 | ||||||
“ASB”, Series 2015-C31, 3.487%, 11/15/2048 | 203,753 | 217,120 | ||||||
| ||||||||
Total Commercial Mortgage-Backed Securities (Cost $84,006,140) |
| 83,527,227 | ||||||
| Collateralized Mortgage Obligations 1.6% |
| |||||||
Angel Oak Mortgage Trust, “A1”, Series 2019-3, 144A, 2.93%, 5/25/2059 | 1,924,977 | 1,952,536 | ||||||
COLT Mortgage Loan Trust, A2, Series 2019-2, 144A, 3.439%, 5/25/2049 | 1,060,800 | 1,067,000 | ||||||
Deephave Residential Mortgage Trust, A3, Series 2019-2A, 144A, 3.763%, 4/25/2059 | 1,916,764 | 1,939,890 | ||||||
Deephaven Residential Mortgage Trust, A3, Series 2018-1A, 144A, 3.202%, 12/25/2057 | 1,522,227 | 1,524,822 | ||||||
Federal National Mortgage Association, “FB”, Series 1996-44, 1-month USD-LIBOR + 0.800%, 0.95%*, 9/25/2023 | 11,973 | 12,048 | ||||||
Freddie Mac Structured Agency Credit Risk Debt Notes, “M1”, Series 2020-DNA3, 144A, 1-month USD-LIBOR + 1.500%, 1.648%*, 6/25/2050 | 694,212 | 694,762 | ||||||
FWD Securitization Trust: |
| |||||||
“A1”, Series 2020-INV1, 144A, 2.24%, 1/25/2050 | 1,988,664 | 2,036,280 | ||||||
“A1”, Series 2019-INV1, 144A, 2.81%, 6/25/2049 | 1,420,348 | 1,455,048 | ||||||
GS Mortgage-Backed Securities Trust, “A2”, Series 2020-NQM1, 144A, 1.791%, 9/27/2060 | 476,791 | 479,303 | ||||||
PSMC Trust, “A3”, Series 2018-1, 144A, 3.5%, 2/25/2048 | 242,090 | 243,121 | ||||||
Residential Mortgage Loan Trust, A3, Series 2019-1, 144A, 4.242%, 10/25/2058 | 3,130,017 | 1,541,279 | ||||||
Sequoia Mortgage Trust: |
| |||||||
“A10”, Series 2017-CH2, 144A, 4.0%, 12/25/2047 | 1,401,233 | 1,408,523 | ||||||
“A10”, Series 2018-CH1, 144A, 4.0%, 2/25/2048 | 838,089 | 842,880 | ||||||
“A10”, Series 2019-CH3, 144A, 4.0%, 9/25/2049 | 1,277,173 | 1,300,791 | ||||||
Starwood Mortgage Residential Trust, A3, Series 2020-INV1, 144A, 1.593%, 11/25/2055 | 1,625,000 | 1,616,769 | ||||||
Verus Securitization Trust: |
| |||||||
“A2”, Series 2020-4, 144A, 1.912%, 5/25/2065 | 2,933,764 | 2,954,944 | ||||||
“A1”, Series 2020-INV1, 144A, 1.977%, 3/25/2060 | 542,966 | 550,527 | ||||||
The accompanying notes are an integral part of the consolidated financial statements.
| DWS Enhanced Commodity Strategy Fund | | | 19 |
| Principal Amount ($) | Value ($) | |||||||
“A1”, Series 2020-2, 144A, 2.226%, 5/25/2060 | 406,059 | 414,026 | ||||||
“A1”, Series 2019-INV1, 144A, 3.402%, 12/25/2059 | 2,187,714 | 2,209,877 | ||||||
“A1”, Series 2018-INV1, 144A, 3.626%, 3/25/2058 | 1,745,162 | 1,760,341 | ||||||
| ||||||||
Total Collateralized Mortgage Obligations (Cost $25,847,832) |
| 26,004,767 | ||||||
| Government & Agency Obligations 44.1% |
| |||||||
| Other Government Related (d) 1.2% |
| |||||||
Banque Ouest Africaine de Developpement, 144A, 5.5%, 5/6/2021 | 3,200,000 | 3,247,283 | ||||||
Corp. Andina de Fomento: |
| |||||||
2.375%, 5/12/2023 | 4,000,000 | 4,144,160 | ||||||
4.375%, 6/15/2022 | 2,000,000 | 2,104,020 | ||||||
Eastern & Southern African Trade & Development Bank, REG S, 5.375%, 3/14/2022 | 2,779,000 | 2,863,482 | ||||||
Eurasian Development Bank, 144A, 4.767%, 9/20/2022 | 3,000,000 | 3,153,900 | ||||||
Severstal OAO: |
| |||||||
144A, 3.15%, 9/16/2024 | 1,000,000 | 1,044,876 | ||||||
144A, 5.9%, 10/17/2022 | 2,000,000 | 2,152,200 | ||||||
Vnesheconombank, 144A, 6.025%, 7/5/2022 | 1,500,000 | 1,602,630 | ||||||
|
| |||||||
| 20,312,551 | ||||||||
| Sovereign Bonds 0.6% |
| |||||||
Abu Dhabi Government International Bond, 144A, 2.5%, 4/16/2025 | 1,895,000 | 2,024,428 | ||||||
Government of Malaysia, 144A, 3.043%, 4/22/2025 | 1,000,000 | 1,098,497 | ||||||
Republic of Namibia, 144A, 5.5%, 11/3/2021 | 1,500,000 | 1,534,761 | ||||||
Republic of Paraguay, 144A, 4.625%, 1/25/2023 | 1,000,000 | 1,075,000 | ||||||
Republic of Turkey, 5.6%, 11/14/2024 | 2,000,000 | 2,093,000 | ||||||
Saudi Government International Bond, 144A, 4.0%, 4/17/2025 | 2,000,000 | 2,233,740 | ||||||
|
| |||||||
| 10,059,426 | ||||||||
| U.S. Treasury Obligations 42.3% |
| |||||||
U.S. Treasury Floating Rate Notes: |
| |||||||
3-month U.S. Treasury Bill Money Market Yield + 0.055%, 0.15%*, 7/31/2022 (e) | 65,000,000 | 64,997,427 | ||||||
3-month U.S. Treasury Bill Money Market Yield + 0.055%, 0.15%*, 10/31/2022 (e) | 20,000,000 | 19,996,265 | ||||||
3-month U.S. Treasury Bill Money Market Yield + 0.114%, 0.209%*, 4/30/2022 (e) | 65,000,000 | 65,051,386 | ||||||
3-month U.S. Treasury Bill Money Market Yield + 0.139%, 0.234%*, 4/30/2021 | 10,000,000 | 10,004,119 | ||||||
3-month U.S. Treasury Bill Money Market Yield + 0.154%, 0.249%*, 1/31/2022 (e) | 30,000,000 | 30,029,573 | ||||||
The accompanying notes are an integral part of the consolidated financial statements.
| 20 | | | DWS Enhanced Commodity Strategy Fund |
| Principal Amount ($) | Value ($) | |||||||
3-month U.S. Treasury Bill Money Market Yield + 0.220%, 0.315%*, 7/31/2021 (e) | 20,000,000 | 20,023,136 | ||||||
3-month U.S. Treasury Bill Money Market Yield + 0.300%, 0.395%*, 10/31/2021 (e) | 35,000,000 | 35,071,580 | ||||||
U.S. Treasury Inflation-Indexed Notes: |
| |||||||
0.125%, 1/15/2022 | 34,513,200 | 35,130,663 | ||||||
0.125%, 4/15/2022 | 32,120,400 | 32,794,175 | ||||||
0.125%, 1/15/2023 | 45,122,800 | 46,872,483 | ||||||
0.375%, 7/15/2023 | 44,755,200 | 47,409,044 | ||||||
U.S. Treasury Notes: |
| |||||||
0.5%, 3/15/2023 | 40,000,000 | 40,325,000 | ||||||
1.25%, 3/31/2021 | 20,000,000 | 20,052,887 | ||||||
1.375%, 4/30/2021 | 25,000,000 | 25,101,563 | ||||||
1.625%, 4/30/2023 | 30,000,000 | 31,034,766 | ||||||
1.75%, 11/30/2021 | 35,000,000 | 35,516,797 | ||||||
2.0%, 2/28/2021 | 20,000,000 | 20,056,171 | ||||||
2.125%, 9/30/2021 | 30,000,000 | 30,447,656 | ||||||
2.25%, 2/15/2021 | 20,000,000 | 20,047,897 | ||||||
2.25%, 3/31/2021 | 20,000,000 | 20,100,109 | ||||||
2.5%, 1/31/2021 | 25,000,000 | 25,043,256 | ||||||
2.75%, 5/31/2023 | 30,000,000 | 31,879,688 | ||||||
|
| |||||||
| 706,985,641 | ||||||||
Total Government & Agency Obligations (Cost $727,394,581) |
| 737,357,618 | ||||||
| Municipal Bonds and Notes 0.4% |
| |||||||
New Jersey, Turnpike Authority Revenue, Series F, 2.536%, 1/1/2021 (Cost $6,000,000) | 6,000,000 | 6,000,000 | ||||||
| Short-Term U.S. Treasury Obligations 5.4% |
| |||||||
U.S. Treasury Bills: |
| |||||||
0.078%**, 6/17/2021 (f) | 39,000,000 | 38,985,342 | ||||||
0.085%**, 2/4/2021 | 20,000,000 | 19,999,053 | ||||||
0.092%**, 6/17/2021 (f) | 10,000,000 | 9,996,242 | ||||||
0.097%**, 6/17/2021 (f) | 100,000 | 99,962 | ||||||
0.097%**, 6/17/2021 (f) | 1,000,000 | 999,624 | ||||||
0.126%**, 6/17/2021 (f) | 400,000 | 399,850 | ||||||
0.15%**, 6/17/2021 (f) | 20,000,000 | 19,992,483 | ||||||
| ||||||||
Total Short-Term U.S. Treasury Obligations (Cost $90,465,508) |
| 90,472,556 | ||||||
| Exchange-Traded Funds 0.6% |
| |||||||
iShares 0-5 Year High Yield Corporate Bond ETF | 125,000 | 5,680,000 | ||||||
SPDR Bloomberg Barclays Short Term High Yield Bond ETF | 150,000 | 4,042,500 | ||||||
The accompanying notes are an integral part of the consolidated financial statements.
| DWS Enhanced Commodity Strategy Fund | | | 21 |
| Principal Amount ($) | Value ($) | |||||||
Xtrackers Short Duration High Yield Bond ETF (a) (g) | 5,250 | 249,401 | ||||||
| ||||||||
Total Exchange-Traded Funds (Cost $9,761,670) |
| 9,971,901 | ||||||
| Shares | Value ($) | |||||||
| Securities Lending Collateral 0.2% |
| |||||||
DWS Government & Agency Securities Portfolio “DWS Government Cash Institutional Shares”, | 2,707,148 | 2,707,148 | ||||||
| Cash Equivalents 8.4% |
| |||||||
DWS Central Cash Management Government Fund, 0.08% (h) | 133,651,174 | 133,651,174 | ||||||
DWS ESG Liquidity Fund “Capital Shares”, 0.18% (h) | 6,931,767 | 6,931,767 | ||||||
| ||||||||
Total Cash Equivalents (Cost $140,582,895) |
| 140,582,941 | ||||||
| % of Net Assets | Value ($) | |||||||
| Total Consolidated Investment Portfolio (Cost $1,631,830,985) | 99.2 | 1,657,286,199 | ||||||
| Other Assets and Liabilities, Net | 0.8 | 14,033,325 | ||||||
| ||||||||
| Net Assets | 100.0 | 1,671,319,524 | ||||||
A summary of the Fund’s transactions with affiliated investments during the period ended December 31, 2020 are as follows:
| Value ($) at 6/30/2020 | Pur- chases Cost ($) | Sales Proceeds ($) | Net Real- ized Gain/ (Loss) ($) | Net Change in Unrea- lized Appreci- ation (Depreci- ation) ($) | Income ($) | Capital Gain Distribu- tions ($) | Number of Shares at 12/31/2020 | Value ($) at 12/31/2020 | ||||||||||||||||||||||||||
| Exchange-Traded Funds 0.0% | ||||||||||||||||||||||||||||||||||
| Xtrackers Short Duration High Yield Bond ETF, (a) (g) | ||||||||||||||||||||||||||||||||||
| — | 243,547 | — | — | 5,854 | 6,915 | — | 5,250 | 249,401 | ||||||||||||||||||||||||||
| Securities Lending Collateral 0.2% | ||||||||||||||||||||||||||||||||||
| | DWS Government & Agency Securities Portfolio “DWS Government Cash Institutional Shares”, 0.03% (h) (i) | | ||||||||||||||||||||||||||||||||
| — | 2,707,148 | (j) | — | — | — | 608 | — | 2,707,148 | 2,707,148 | |||||||||||||||||||||||||
| Cash Equivalents 8.4% | ||||||||||||||||||||||||||||||||||
| DWS Central Cash Management Government Fund, 0.08% (h) | ||||||||||||||||||||||||||||||||||
| 128,467,296 | 996,127,744 | 990,943,866 | — | — | 77,657 | — | 133,651,174 | 133,651,174 | ||||||||||||||||||||||||||
| DWS ESG Liquidity Fund “Capital Shares”, 0.18% (h) | ||||||||||||||||||||||||||||||||||
| 6,918,373 | 20,021,472 | 20,004,000 | (2,000) | (2,078) | 14,373 | — | 6,931,767 | 6,931,767 | ||||||||||||||||||||||||||
| 135,385,669 | 1,019,099,911 | 1,010,947,866 | (2,000) | 3,776 | 99,553 | — | 143,295,339 | 143,539,490 | ||||||||||||||||||||||||||
The accompanying notes are an integral part of the consolidated financial statements.
| 22 | | | DWS Enhanced Commodity Strategy Fund |
| * | Variable or floating rate security. These securities are shown at their current rate as of December 31, 2020. For securities based on a published reference rate and spread, the reference rate and spread are indicated within the description above. Certain variable rate securities are not based on a published reference rate and spread but adjust periodically based on current market conditions, prepayment of underlying positions and/or other variables. Securities with a floor or ceiling feature are disclosed at the inherent rate, where applicable. |
| ** | Annualized yield at time of purchase; not a coupon rate. |
| (a) | All or a portion of these securities were on loan. In addition, “Other Assets and Liabilities, Net” may include pending sales that are also on loan. The value of securities loaned at December 31, 2020 amounted to $2,637,439, which is 0.2% of net assets. |
| (b) | When-issued, delayed delivery or forward commitment securities included. |
| (c) | Investment was valued using significant unobservable inputs. |
| (d) | Government-backed debt issued by financial companies or government sponsored enterprises. |
| (e) | At December 31, 2020, this security has been pledged, in whole or in part, as collateral for open commodity-linked rate swap contracts. |
| (f) | At December 31, 2020, this security has been pledged, in whole or in part, to cover initial margin requirements for open futures and options contracts. |
| (g) | Affiliated fund managed by DBX Advisors LLC, a subsidiary of Deutsche Bank AG. |
| (h) | Affiliated fund managed by DWS Investment Management Americas, Inc. The rate shown is the annualized seven-day yield at period end. |
| (i) | Represents cash collateral held in connection with securities lending. Income earned by the Fund is net of borrower rebates. |
| (j) | Represents the net increase (purchase cost) or decrease (sales proceeds) in the amount invested in cash collateral for the period ended December 31, 2020. |
144A: Security exempt from registration under Rule 144A of the Securities Act of 1933. These securities may be resold in transactions exempt from registration, normally to qualified institutional buyers.
CLO: Collateralized Loan Obligation
COT: Commitment of Traders
Interest Only: Interest Only (IO) bonds represent the “interest only” portion of payments on a pool of underlying mortgages or mortgage-backed securities. IO securities are subject to prepayment risk of the pool of underlying mortgages.
LIBOR: London Interbank Offered Rate
LME: London Metal Exchange
OAO: Otkrytoe Aktsionernoe Obschestvo (Russian: Open Joint Stock Corporation)
REG S: Securities sold under Regulation S may not be offered, sold or delivered within the United States or to, or for the account or benefit of, U.S. persons, except pursuant to an exemption from, or in a transaction not subject to, the registration requirements of the Securities Act of 1933.
REIT: Real Estate Investment Trust
SOC: State Owned Company
SOFR: Secured Overnight Financing Rate
SPDR: Standard & Poor’s Depositary Receipt
ULS: Ultra-Low Sulfur
Included in the portfolio are investments in mortgage or asset-backed securities which are interests in separate pools of mortgages or assets. Effective maturities of these investments may be shorter than stated maturities due to prepayments. Some separate investments in the Federal National Mortgage Association issues which have similar coupon rates have been aggregated for presentation purposes in this investment portfolio.
The accompanying notes are an integral part of the consolidated financial statements.
| DWS Enhanced Commodity Strategy Fund | | | 23 |
At December 31, 2020, open futures contracts purchased were as follows:
| Futures | Currency | Expiration Date | Contracts | Notional Amount ($) | Notional Value ($) | Unrealized Appreciation (Depreciation) ($) | ||||||||||||||||||
| Aluminum Futures | USD | 3/17/2021 | 845 | 42,738,452 | 41,774,687 | (963,765 | ) | |||||||||||||||||
| Brent Crude Oil Futures | USD | 4/30/2021 | 132 | 5,951,760 | 6,819,120 | 867,360 | ||||||||||||||||||
| Brent Crude Oil Futures | USD | 5/28/2021 | 131 | 5,942,674 | 6,745,190 | 802,516 | ||||||||||||||||||
| Copper Futures | USD | 1/26/2021 | 75 | 12,739,099 | 14,535,282 | 1,796,183 | ||||||||||||||||||
| Copper Futures | USD | 12/15/2021 | 200 | 38,432,800 | 38,736,250 | 303,450 | ||||||||||||||||||
| LME Nickel Futures | USD | 12/13/2021 | 255 | 23,105,843 | 25,645,860 | 2,540,017 | ||||||||||||||||||
| Natural Gas Futures | USD | 2/23/2021 | 160 | 15,475,680 | 15,926,746 | 451,066 | ||||||||||||||||||
| Natural Gas Futures | USD | 2/24/2021 | 2,000 | 54,366,460 | 50,520,000 | (3,846,460 | ) | |||||||||||||||||
| Soybean Futures | USD | 5/14/2021 | 150 | 8,757,888 | 9,800,625 | 1,042,737 | ||||||||||||||||||
| Zinc Futures | USD | 2/23/2021 | 230 | 15,991,441 | 15,770,583 | (220,858 | ) | |||||||||||||||||
| Total net unrealized appreciation |
| 2,772,246 | ||||||||||||||||||||||
At December 31, 2020, open futures contracts sold were as follows:
| Futures | Currency | Expiration Date | Contracts | Notional Amount ($) | Notional Value ($) | Unrealized Appreciation (Depreciation) ($) | ||||||||||||||||||
| 5 Year U.S. Treasury Note | USD | 3/31/2021 | 883 | 111,179,936 | 111,402,868 | (222,932 | ) | |||||||||||||||||
| Brent Crude Oil Futures | USD | 6/30/2021 | 263 | 11,875,498 | 13,505,050 | (1,629,552 | ) | |||||||||||||||||
| Copper Futures | USD | 12/15/2021 | 200 | 34,130,871 | 38,736,250 | (4,605,379 | ) | |||||||||||||||||
| Copper Futures | USD | 1/26/2021 | 75 | 14,958,401 | 14,535,281 | 423,120 | ||||||||||||||||||
| LME Copper Futures | USD | �� | 3/15/2021 | 150 | 29,276,025 | 29,125,312 | 150,713 | |||||||||||||||||
| LME Nickel Futures | USD | 12/13/2021 | 255 | 22,391,062 | 25,645,860 | (3,254,798 | ) | |||||||||||||||||
| Natural Gas Futures | USD | 3/29/2021 | 2,000 | 52,825,380 | 50,760,000 | 2,065,380 | ||||||||||||||||||
| Nickel Futures | USD | 2/23/2021 | 160 | 15,681,120 | 15,926,746 | (245,626 | ) | |||||||||||||||||
The accompanying notes are an integral part of the consolidated financial statements.
| 24 | | | DWS Enhanced Commodity Strategy Fund |
| Futures | Currency | Expiration Date | Contracts | Notional Amount ($) | Notional Value ($) | Unrealized Appreciation (Depreciation) ($) | ||||||||||||||||||
| Soybean Futures | USD | 11/12/2021 | 150 | 7,823,111 | 8,338,124 | (515,013 | ) | |||||||||||||||||
| Zinc Futures | USD | 2/23/2021 | 230 | 15,729,125 | 15,770,583 | (41,458 | ) | |||||||||||||||||
| Total net unrealized depreciation |
| (7,875,545 | ) | |||||||||||||||||||||
At December 31, 2020, open futures options contracts purchased were as follows:
| Call Options | Contracts | Expiration Date | Strike Price ($) | Notional Amount ($) | Notional Value ($) | Unrealized Depreciation ($) | ||||||||||||||||||
| Brent Crude Oil Futures, Expiration Date 8/31/2021 | 2,400 | 6/25/2021 | 66.0 | 2,211,798 | 1,968,000 | (243,798 | ) | |||||||||||||||||
At December 30, 2020, open futures options contracts sold were as follows:
| Put Options | Contracts | Expiration Date | Strike Price ($) | Notional Amount ($) | Notional Value ($) | Unrealized Appreciation ($) | ||||||||||||||||||
| Brent Crude Oil Futures, Expiration Date 8/31/2021 | 2,400 | 6/25/2021 | 34.0 | 4,634,202 | 1,968,000 | 2,666,202 | ||||||||||||||||||
Each commodity linked swap is a commitment to receive the total return of the specified commodity linked index in exchange for a fixed financing rate. At December 31, 2020, open commodity-linked swap contracts were as follows:
Pay/Receive Return of the | Expiration Date | Counterparty | Notional Amount | Fixed Fee Received/ (Paid) by the Fund | Frequency | Value ($) (k) | ||||||||||||
| Long Positions |
| |||||||||||||||||
| Barclays EFS Custom Commodity Basket 08 Index/BEFSCB08 | 1/15/2021 | Barclays Bank PLC | 38,407,500 | — | At Expiration | 701,332 | ||||||||||||
| RBC Enhanced Commodity D03 Excess Return Index/RBCADC03 | 1/15/2021 | Royal Bank of Canada | 60,242,000 | (0.15 | %) | At Expiration | 2,213,606 | |||||||||||
| Bloomberg Commodity Index 3 Month Forward/BCOMF3 | 1/15/2021 | Goldman Sachs & Co. | 33,133,000 | (0.12 | %) | At Expiration | 1,166,516 | |||||||||||
| Bloomberg Commodity Index 6 Month Forward/BCOMF6 | 1/15/2021 | JPMorgan Chase Securities, Inc. | 76,808,000 | (0.16 | %) | At Expiration | 1,881,294 | |||||||||||
The accompanying notes are an integral part of the consolidated financial statements.
| DWS Enhanced Commodity Strategy Fund | | | 25 |
Pay/Receive Return of the | Expiration Date | Counterparty | Notional Amount | Fixed Fee Received/ (Paid) by the Fund | Frequency | Value ($) (k) | ||||||||||||
| Bloomberg Commodity Index 6 Month Forward/BCOMF6 | 1/15/2021 | Macquarie Bank Ltd. | 90,363,000 | (0.17 | %) | At Expiration | 2,212,856 | |||||||||||
| Bloomberg Commodity Index/BCOM | 1/15/2021 | JPMorgan Chase Securities, Inc. | 179,220,000 | (0.09 | %) | At Expiration | 6,830,416 | |||||||||||
| Bloomberg Commodity Index/BCOM | 1/15/2021 | Canadian Imperial Bank of Commerce | 45,181,000 | (0.13 | %) | At Expiration | 1,721,042 | |||||||||||
| Bloomberg Commodity Index/BCOM | 1/15/2021 | BNP Paribas | 105,423,000 | (0.12 | %) | At Expiration | 4,016,312 | |||||||||||
| Bloomberg Commodity Index/BCOM | 1/15/2021 | Barclays Bank PLC | 90,363,000 | (0.11 | %) | At Expiration | 3,443,015 | |||||||||||
| Bloomberg Commodity Index/BCOM | 1/15/2021 | Credit Suisse | 96,387,000 | (0.11 | %) | At Expiration | 3,672,542 | |||||||||||
| Bloomberg Commodity Index/BCOM | 1/15/2021 | Morgan Stanley | 45,181,000 | (0.12 | %) | At Expiration | 1,721,265 | |||||||||||
| Bloomberg Copper Subindex/BCOMHG | 1/15/2021 | Goldman Sachs & Co. | 31,000,000 | (0.11 | %) | At Expiration | (67,614 | ) | ||||||||||
| BNP Paribas 03 Alpha Index/BNPIFMN3 | 1/15/2021 | BNP Paribas | 107,475,000 | (0.12 | %) | At Expiration | (413,434 | ) | ||||||||||
| BofA Merrill Lynch Commodity Excess Return Strategy/MLCIHR6S | 1/15/2021 | Merrill Lynch International Ltd. | 25,300,000 | — | At Expiration | (13,192 | ) | |||||||||||
| BofA Merrill Lynch Commodity Excess Return Strategy/MLCIMRL2 | 1/15/2021 | Merrill Lynch International Ltd. | 36,400,000 | (0.35 | %) | At Expiration | (318,115 | ) | ||||||||||
| Citi Custom CiVICS 7 Excess Return/CVICSER7 | 1/15/2021 | Citigroup, Inc. | 397,421,750 | (0.21 | %) | At Expiration | 5,229,789 | |||||||||||
| Credit Suisse Custom 10 Excess Return Index/CSCUS10E | 1/15/2021 | Credit Suisse | 24,097,000 | (0.18 | %) | At Expiration | 917,341 | |||||||||||
The accompanying notes are an integral part of the consolidated financial statements.
| 26 | | | DWS Enhanced Commodity Strategy Fund |
Pay/Receive Return of the | Expiration Date | Counterparty | Notional Amount | Fixed Fee Received/ (Paid) by the Fund | Frequency | Value ($) (k) | ||||||||||||
| Goldman Sachs Brent Vol Carry 05/GSVLBR05 | 2/12/2021 | Goldman Sachs & Co. | 15,000,000 | (0.35 | %) | At Expiration | 496,847 | |||||||||||
| Goldman Sachs Commodity COT Strategy COT3/ABGSCOT3 | 1/15/2021 | Goldman Sachs & Co. | 37,900,000 | (0.35 | %) | At Expiration | 133,539 | |||||||||||
| Macquarie Commodity Product 708E/MQCP708E | 1/15/2021 | Macquarie Bank Ltd. | 29,570,000 | — | At Expiration | (276,249 | ) | |||||||||||
| Macquarie Vol Product 2CL2/VMAC2CL2 | 2/12/2021 | Macquarie Bank Ltd. | 10,000,000 | (0.10 | %) | At Expiration | 841,209 | |||||||||||
| Macquarie Vol Product 3GC1/VMAC3GC1 | 2/12/2021 | Macquarie Bank Ltd. | 15,000,000 | (0.10 | %) | At Expiration | (161,963 | ) | ||||||||||
| Merrill Lynch Enhanced Benchmark—A Pre Roll Excess Return Index/MLCXAPRE | 1/15/2021 | Merrill Lynch International Ltd. | 105,423,000 | (0.14 | %) | At Expiration | 4,015,355 | |||||||||||
| Modified Strategy D177 on the Bloomberg Commodity Index/ENHG177P | 1/15/2021 | Goldman Sachs & Co. | 132,532,000 | (0.43 | %) | At Expiration | 4,358,881 | |||||||||||
| Morgan Stanley Index/MSCBVB20 | 1/15/2021 | Morgan Stanley | 68,287,500 | (0.45 | %) | At Expiration | (817,271 | ) | ||||||||||
| RBC Enhanced Commodity Basket 01 Excess Return Index/RBCAEC01 | 1/15/2021 | Royal Bank of Canada | 30,121,000 | (0.11 | %) | At Expiration | 1,032,353 | |||||||||||
| RBC Enhanced Commodity D01 Excess Return Index/RBCADC01 | 1/15/2021 | Royal Bank of Canada | 30,121,000 | (0.20 | %) | At Expiration | 858,704 | |||||||||||
| RBC Enhanced Commodity MSC4 Index/RBCAMSC4 | 1/15/2021 | Royal Bank of Canada | 57,554,000 | (0.35 | %) | At Expiration | (667,053 | ) | ||||||||||
| SGI Commodity Dynamic Alpha Index/SGICCODA | 1/15/2021 | Societe Generale | 68,542,500 | (0.25 | %) | At Expiration | (615,022 | ) | ||||||||||
The accompanying notes are an integral part of the consolidated financial statements.
| DWS Enhanced Commodity Strategy Fund | | | 27 |
Pay/Receive Return of the | Expiration Date | Counterparty | Notional Amount | Fixed Fee Received/ (Paid) by the Fund | Frequency | Value ($) (k) | ||||||||||||
| Societe Generale Alpha 1 Custom Excess Return/SGCOA1CE | 1/15/2021 | Societe Generale | 104,872,500 | (0.17 | %) | At Expiration | (776,483 | ) | ||||||||||
| Societe Generale M Po 3 U Index/SGCOL45E | 1/15/2021 | Societe Generale | 54,218,000 | (0.16 | %) | At Expiration | 1,901,589 | |||||||||||
| Societe Generale M Po 4 U Index/SGCOM15E | 1/15/2021 | Societe Generale | 36,145,000 | (0.18 | %) | At Expiration | 1,226,729 | |||||||||||
| UBS Custom Commodity Index/UBSIB163 | 1/15/2021 | UBS AG | 118,467,000 | (0.17 | %) | At Expiration | 960,969 | |||||||||||
| Index Description | Ticker | Notional Amount ($) | Index Weight (%) | Value ($) | ||||||||||
| Bloomberg Commodity Index | BCOM | 52,712,000 | 22.3 | 2,008,859 | ||||||||||
| Bloomberg Commodity Index 3 Month Forward | BCOMF3 | 52,712,000 | 22.3 | 1,855,760 | ||||||||||
| Bloomberg Corn Subindex | BCOMCN | (14,979,000) | 6.3 | (2,120,292 | ) | |||||||||
| Bloomberg Gold Subindex | BCOMGC | (23,967,000) | 10.1 | (824,370 | ) | |||||||||
| Bloomberg Wheat Subindex | BCOMWH | (21,622,000) | 9.1 | (1,595,118 | ) | |||||||||
| Bloomberg Aluminum Subindex | BCOMAL | (10,257,000) | 4.3 | 348,635 | ||||||||||
| Bloomberg ULS Diesel Subindex | BCOMHO | 43,895,000 | 18.5 | 770,377 | ||||||||||
| Bloomberg Brent Crude Subindex | BCOMCO | 16,790,000 | 7.1 | 517,118 | ||||||||||
Total UBS Custom Commodity Index | 960,969 | |||||||||||||
| UBS Targeted Commodity Curve Carry Strategy Index/UBSTCCIS | 1/15/2021 | UBS AG | 62,500,000 | (0.10 | %) | At Expiration | (264,936 | ) | ||||||||||
Total net unrealized appreciation | 47,162,169 | |||||||||||||||||
| (k) | There are no upfront payments on the commodity-linked swaps listed above, therefore unrealized appreciation (depreciation) is equal to their value. |
| Currency Abbreviation |
| USD United States Dollar |
For information on the Fund’s policy and additional disclosures regarding futures contracts and commodity-linked swap contracts, please refer to the Derivatives section of Note B in the accompanying Notes to Financial Statements.
The accompanying notes are an integral part of the consolidated financial statements.
| 28 | | | DWS Enhanced Commodity Strategy Fund |
Fair Value Measurements
Various inputs are used in determining the value of the Fund’s investments. These inputs are summarized in three broad levels. Level 1 includes quoted prices in active markets for identical securities. Level 2 includes other significant observable inputs (including quoted prices for similar securities, interest rates, prepayment speeds and credit risk). Level 3 includes significant unobservable inputs (including the Fund’s own assumptions in determining the fair value of investments). The level assigned to the securities valuations may not be an indication of the risk or liquidity associated with investing in those securities.
The following is a summary of the inputs used as of December 31, 2020 in valuing the Fund’s investments. For information on the Fund’s policy regarding the valuation of investments, please refer to the Security Valuation section of Note A in the accompanying Notes to Consolidated Financial Statements.
| Assets | Level 1 | Level 2 | Level 3 | Total | ||||||||||||
| Fixed Income Investments (l) | ||||||||||||||||
Corporate Bonds | $ | — | $ | 394,781,524 | $ | — | $ | 394,781,524 | ||||||||
Mortgage-Backed Securities Pass-Throughs | — | 31,363,500 | — | 31,363,500 | ||||||||||||
Asset-Backed | — | 133,517,020 | 999,997 | 134,517,017 | ||||||||||||
Commercial Mortgage-Backed Securities | — | 83,527,227 | — | 83,527,227 | ||||||||||||
Collateralized Mortgage Obligations | — | 26,004,767 | — | 26,004,767 | ||||||||||||
Government & Agency Obligations | — | 737,357,618 | — | 737,357,618 | ||||||||||||
Municipal Bonds and Notes | — | 6,000,000 | — | 6,000,000 | ||||||||||||
Short-Term U.S. Treasury Obligations | — | 90,472,556 | — | 90,472,556 | ||||||||||||
| Exchange-Traded Funds | 9,971,901 | — | — | 9,971,901 | ||||||||||||
| Short-Term Investments (l) | 143,290,089 | — | — | 143,290,089 | ||||||||||||
| Derivatives (m) | ||||||||||||||||
Futures and Futures Options Contracts | 13,108,744 | — | — | 13,108,744 | ||||||||||||
Commodity-Linked Swap Contracts | — | 51,553,501 | — | 51,553,501 | ||||||||||||
| Total | $ | 166,370,734 | $ | 1,554,577,713 | $ | 999,997 | $ | 1,721,948,444 | ||||||||
| Liabilities | Level 1 | Level 2 | Level 3 | Total | ||||||||||||
| Derivatives (m) | ||||||||||||||||
Futures and Futures Options Contracts | $ | (15,789,639 | ) | $ | — | $ | — | $ | (15,789,639 | ) | ||||||
Commodity-Linked Swap Contracts | — | (4,391,332 | ) | — | (4,391,332 | ) | ||||||||||
| Total | $ | (15,789,639 | ) | $ | (4,391,332 | ) | $ | — | $ | (20,180,971 | ) | |||||
| (l) | See Consolidated Investment Portfolio for additional detailed categorizations. |
| (m) | Derivatives include unrealized appreciation (depreciation) on open futures contracts and commodity-linked swap contracts. |
The accompanying notes are an integral part of the consolidated financial statements.
| DWS Enhanced Commodity Strategy Fund | | | 29 |
Consolidated Statement of Assets and Liabilities
| as of December 31, 2020 (Unaudited) | ||||
| Assets |
| |||
| Investments in non-affiliated securities, at value (cost $1,488,297,395) — including $2,637,439 of securities loaned | $ | 1,513,746,709 | ||
| Investment in DWS Government & Agency Securities Portfolio (cost $2,707,148)* | 2,707,148 | |||
| Investment in affiliated securities, at value (cost $140,826,442) | 140,832,342 | |||
| Cash | 579,508 | |||
| Cash held as collateral for over-the-counter derivatives | 9,450,000 | |||
| Receivable for Fund shares sold | 2,797,600 | |||
| Interest receivable | 5,400,827 | |||
| Unrealized appreciation on bilateral swap contracts | 51,553,501 | |||
| Other assets | 153,558 | |||
| Total assets | 1,727,221,193 | |||
| Liabilities | ||||
| Payable upon return of securities loaned | 2,707,148 | |||
| Payable for investments purchased — when-issued/delayed delivery securities | 31,201,875 | |||
| Payable for Fund shares redeemed | 2,803,681 | |||
| Payable for variation margin on futures and options contracts | 3,406,356 | |||
| Payable upon return of collateral for over-the-counter derivatives | 9,450,000 | |||
| Unrealized depreciation on bilateral swap contracts | 4,391,332 | |||
| Accrued management fee | 871,647 | |||
| Accrued Trustees’ fees | 37,944 | |||
| Other accrued expenses and payables | 1,031,686 | |||
| Total liabilities | 55,901,669 | |||
| Net assets, at value | $ | 1,671,319,524 | ||
| * | Represents collateral on securities loaned. |
The accompanying notes are an integral part of the consolidated financial statements.
| 30 | | | DWS Enhanced Commodity Strategy Fund |
| Consolidated Statement of Assets and Liabilities as of December 31, 2020 (Unaudited) (continued) |
| Net Assets Consist of |
| |||
| Distributable earnings (loss) | $ | 234,944,384 | ||
| Paid-in capital | 1,436,375,140 | |||
| Net assets, at value | $ | 1,671,319,524 | ||
| Net Asset Value |
| |||
Class A |
| |||
| Net Asset Value and redemption price per share ($68,949,815 ÷ 7,578,448 outstanding shares of beneficial interest, $.01 par value, unlimited number of shares authorized) | $ | 9.10 | ||
| Maximum offering price per share (100 ÷ 94.25 of $9.10) | $ | 9.66 | ||
Class T |
| |||
| Net Asset Value and redemption price per share ($9,570 ÷ 1,051 outstanding shares of beneficial interest, $.01 par value, unlimited number of shares authorized) | $ | 9.11 | ||
| Maximum offering price per share (100 ÷ 97.50 of $9.11) | $ | 9.34 | ||
Class C |
| |||
| Net Asset Value, offering and redemption price (subject to contingent deferred sales charge) per share ($8,160,339 ÷ 1,000,262 outstanding shares of beneficial interest, $.01 par value, unlimited number of shares authorized) | $ | 8.16 | ||
Class R6 |
| |||
| Net Asset Value, offering and redemption price per share ($37,805,836 ÷ 4,094,855 outstanding shares of beneficial interest, $.01 par value, unlimited number of shares authorized) | $ | 9.23 | ||
Class S |
| |||
| Net Asset Value, offering and redemption price per share ($68,144,421 ÷ 7,396,505 outstanding shares of beneficial interest, $.01 par value, unlimited number of shares authorized) | $ | 9.21 | ||
Institutional Class |
| |||
| Net Asset Value, offering and redemption price per share ($1,488,249,543 ÷ 161,054,869 outstanding shares of beneficial interest, $.01 par value, unlimited number of shares authorized) | $ | 9.24 | ||
The accompanying notes are an integral part of the consolidated financial statements.
| DWS Enhanced Commodity Strategy Fund | | | 31 |
Consolidated Statement of Operations
| for the six months ended December 31, 2020 (Unaudited) | ||||
| Investment Income |
| |||
| Income: |
| |||
| Interest (net of foreign taxes withheld of $3,333) | $ | 13,931,191 | ||
| Dividends | 126,792 | |||
| Income distributions from affiliated securities | 98,945 | |||
| Securities lending income, net of borrower rebates | 608 | |||
| Total income | 14,157,536 | |||
| Expenses: | ||||
| Management fee | 6,825,038 | |||
| Administration fee | 782,860 | |||
| Services to shareholders | 1,222,400 | |||
| Distribution and service fees | 119,175 | |||
| Custodian fee | 79,187 | |||
| Professional fees | 66,812 | |||
| Reports to shareholders | 199,478 | |||
| Registration fees | 57,368 | |||
| Trustees’ fees and expenses | 33,219 | |||
| Other | 53,159 | |||
| Total expenses before expense reductions | 9,438,696 | |||
| Expense reductions | (2,035,553 | ) | ||
| Total expenses after expense reductions | 7,403,143 | |||
| Net investment income | 6,754,393 | |||
| Realized and Unrealized Gain (Loss) | ||||
| Net realized gain (loss) from: | ||||
| Affiliated investments | (2,000 | ) | ||
| Non-affiliated Investments | 128,209 | |||
| Swap contracts | 191,236,369 | |||
| Futures | (1,631,550 | ) | ||
| Written options | 1,268,200 | |||
| Foreign currency | (16 | ) | ||
| 190,999,212 | ||||
| Change in net unrealized appreciation (depreciation) on: | ||||
| Affiliated investments | 3,776 | |||
| Non-affiliated investments | 15,062,027 | |||
| Swap contracts | 25,259,159 | |||
| Futures | (556,374 | ) | ||
| Written options | (214,800 | ) | ||
| 39,553,788 | ||||
| Net gain (loss) | 230,553,000 | |||
| Net increase (decrease) in net assets resulting from operations | $ | 237,307,393 | ||
The accompanying notes are an integral part of the consolidated financial statements.
| 32 | | | DWS Enhanced Commodity Strategy Fund |
Consolidated Statements of Changes in Net Assets
| Increase (Decrease) in Net Assets | Six Months Ended December 31, 2020 (Unaudited) | Year Ended 2020 | ||||||
| Operations: | ||||||||
| Net investment income (loss) | $ | 6,754,393 | $ | 27,307,546 | ||||
| Net realized gain (loss) | 190,999,212 | (330,276,058 | ) | |||||
| Change in net unrealized appreciation (depreciation) | 39,553,788 | (15,747,848 | ) | |||||
| Net increase (decrease) in net assets resulting from operations | 237,307,393 | (318,716,360 | ) | |||||
| Distributions to shareholders: | ||||||||
Class A | (398,935 | ) | (985,068 | ) | ||||
Class T | (56 | ) | (140 | ) | ||||
Class C | (19,511 | ) | (87,971 | ) | ||||
Class R6 | (288,226 | ) | (603,995 | ) | ||||
Class S | (576,919 | ) | (1,999,904 | ) | ||||
Institutional Class | (11,194,051 | ) | (30,899,176 | ) | ||||
| Total distributions | (12,477,698 | ) | (34,576,254 | ) | ||||
| Fund share transactions: | ||||||||
| Proceeds from shares sold | 455,143,505 | 971,270,795 | ||||||
| Reinvestment of distributions | 11,729,842 | 32,006,950 | ||||||
| Payments for shares redeemed | (572,152,686 | ) | (1,863,611,943 | ) | ||||
| Net increase (decrease) in net assets from Fund share transactions | (105,279,339 | ) | (860,334,198 | ) | ||||
| Increase (decrease) in net assets | 119,550,356 | (1,213,626,812 | ) | |||||
| Net assets at beginning of period | 1,551,769,168 | 2,765,395,980 | ||||||
| Net assets at end of period | $ | 1,671,319,524 | $ | 1,551,769,168 | ||||
The accompanying notes are an integral part of the consolidated financial statements.
| DWS Enhanced Commodity Strategy Fund | | | 33 |
Consolidated Financial Highlights
| DWS Enhanced Commodity Strategy Fund — Class A | ||||||||||||||
Six Months | Years Ended June 30, | |||||||||||||||||||||||
| 2020 | 2019 | 2018 | 2017 | 2016 | ||||||||||||||||||||
| Selected Per Share Data | ||||||||||||||||||||||||
| Net asset value, beginning of period | $7.93 | $9.47 | $11.71 | $10.88 | $12.60 | $13.42 | ||||||||||||||||||
| Income (loss) from investment operations: | ||||||||||||||||||||||||
Net investment income (loss)a | .02 | .09 | .15 | .08 | .03 | .02 | ||||||||||||||||||
Net realized and unrealized gain (loss) | 1.20 | (1.50 | ) | (1.27 | ) | .78 | (.97 | ) | (.83 | ) | ||||||||||||||
Total from investment operations | 1.22 | (1.41 | ) | (1.12 | ) | .86 | (.94 | ) | (.81 | ) | ||||||||||||||
| Less distributions from: | ||||||||||||||||||||||||
Net investment income | (.05 | ) | (.13 | ) | (1.12 | ) | (.03 | ) | (.78 | ) | (.01 | ) | ||||||||||||
| Redemption fees | — | — | — | — | .00 | *** | .00 | *** | ||||||||||||||||
| Net asset value, end of period | $9.10 | $7.93 | $9.47 | $11.71 | $10.88 | $12.60 | ||||||||||||||||||
| Total Return (%)b,c | 15.47 | ** | (14.96 | ) | (9.77 | ) | 7.87 | (7.70 | ) | (6.00 | ) | |||||||||||||
| Ratios to Average Net Assets and Supplemental Data |
| |||||||||||||||||||||||
| Net assets, end of period ($ millions) | 69 | 58 | 75 | 121 | 110 | 129 | ||||||||||||||||||
| Ratio of expenses before expense reductions (%) | 1.46 | * | 1.51 | 1.48 | 1.43 | 1.47 | 1.44 | |||||||||||||||||
| Ratio of expenses after expense reductions (%) | 1.24 | * | 1.29 | 1.34 | 1.35 | 1.33 | 1.36 | |||||||||||||||||
| Ratio of net investment income (loss) (%) | .51 | * | 1.05 | 1.43 | .73 | .28 | .19 | |||||||||||||||||
| Portfolio turnover rate (%) | 34 | ** | 68 | 65 | 79 | 52 | 92 | |||||||||||||||||
| a | Based on average shares outstanding during the period. |
| b | Total return does not reflect the effect of any sales charges. |
| c | Total return would have been lower had certain expenses not been reduced. |
| * | Annualized |
| ** | Not annualized |
| *** | Amount is less than $.005. |
The accompanying notes are an integral part of the consolidated financial statements.
| 34 | | | DWS Enhanced Commodity Strategy Fund |
| DWS Enhanced Commodity Strategy Fund — Class T | ||||||||||||||
| Six Months Ended 12/31/20 (Unaudited) | Years Ended June 30, | Period Ended | ||||||||||||||||||
| 2020 | 2019 | 2018 | 6/30/17a | |||||||||||||||||
| Selected Per Share Data | ||||||||||||||||||||
| Net asset value, beginning of period | $7.94 | $9.48 | $11.72 | $10.88 | $10.88 | |||||||||||||||
| Income (loss) from investment operations: | ||||||||||||||||||||
Net investment income (loss)b | .02 | .09 | .14 | .09 | .00 | *** | ||||||||||||||
Net realized and unrealized gain (loss) | 1.20 | (1.49 | ) | (1.25 | ) | .77 | (.00 | )*** | ||||||||||||
Total from investment operations | 1.22 | (1.40 | ) | (1.11 | ) | .86 | .00 | *** | ||||||||||||
| Less distributions from: | ||||||||||||||||||||
Net investment income | (.05 | ) | (.14 | ) | (1.13 | ) | (.02 | ) | (.00 | )*** | ||||||||||
| Net asset value, end of period | $9.11 | $7.94 | $9.48 | $11.72 | $10.88 | |||||||||||||||
| Total Return (%)c,d | 15.45 | ** | (14.92 | ) | (9.72 | ) | 7.95 | .01 | ** | |||||||||||
| Ratios to Average Net Assets and Supplemental Data |
| |||||||||||||||||||
| Net assets, end of period ($ thousands) | 10 | 8 | 10 | 11 | 10 | |||||||||||||||
| Ratio of expenses before expense reductions (%) | 1.42 | * | 1.43 | 1.40 | 1.36 | 1.57 | * | |||||||||||||
| Ratio of expenses after expense reductions (%) | 1.24 | * | 1.28 | 1.32 | 1.29 | 1.35 | * | |||||||||||||
| Ratio of net investment income (loss) (%) | .47 | * | 1.07 | 1.42 | .80 | .47 | * | |||||||||||||
| Portfolio turnover rate (%) | 34 | ** | 68 | 65 | 79 | 52 | e | |||||||||||||
| a | For the period from June 5, 2017 (commencement of operations) to June 30, 2017. |
| b | Based on average shares outstanding during the period. |
| c | Total return does not reflect the effect of any sales charges. |
| d | Total return would have been lower had certain expenses not been reduced. |
| e | Represents the Fund’s portfolio turnover rate for the year ended June 30, 2017. |
| * | Annualized |
| ** | Not annualized |
| *** | Amount is less than $.005. |
The accompanying notes are an integral part of the consolidated financial statements.
| DWS Enhanced Commodity Strategy Fund | | | 35 |
| DWS Enhanced Commodity Strategy Fund — Class C | ||||||||||||||
| Six Months Ended 12/31/20 (Unaudited) | Years Ended June 30, | |||||||||||||||||||||||
| 2020 | 2019 | 2018 | 2017 | 2016 | ||||||||||||||||||||
| Selected Per Share Data | ||||||||||||||||||||||||
| Net asset value, beginning of period | $7.11 | $8.49 | $10.50 | $9.80 | $11.39 | $12.21 | ||||||||||||||||||
| Income (loss) from investment operations: | ||||||||||||||||||||||||
Net investment income (loss)a | (.01 | ) | .03 | .06 | (.00 | )*** | (.05 | ) | (.06 | ) | ||||||||||||||
Net realized and unrealized gain (loss) | 1.08 | (1.35 | ) | (1.13 | ) | .70 | (.88 | ) | (.76 | ) | ||||||||||||||
Total from investment operations | 1.07 | (1.32 | ) | (1.07 | ) | .70 | (.93 | ) | (.82 | ) | ||||||||||||||
| Less distributions from: | ||||||||||||||||||||||||
Net investment income | (.02 | ) | (.06 | ) | (.94 | ) | — | (.66 | ) | — | ||||||||||||||
| Redemption fees | — | — | — | — | .00 | *** | .00 | *** | ||||||||||||||||
| Net asset value, end of period | $8.16 | $7.11 | $8.49 | $10.50 | $9.80 | $11.39 | ||||||||||||||||||
| Total Return (%)b,c | 15.04 | ** | (15.59 | ) | (10.48 | ) | 7.14 | (8.42 | ) | (6.72 | ) | |||||||||||||
| Ratios to Average Net Assets and Supplemental Data |
| |||||||||||||||||||||||
| Net assets, end of period ($ millions) | 8 | 9 | 15 | 27 | 27 | 29 | ||||||||||||||||||
| Ratio of expenses before expense reductions (%) | 2.14 | * | 2.20 | 2.18 | 2.17 | 2.21 | 2.22 | |||||||||||||||||
| Ratio of expenses after expense reductions (%) | 1.99 | * | 2.04 | 2.09 | 2.09 | 2.08 | 2.11 | |||||||||||||||||
| Ratio of net investment income (loss) (%) | (.23 | )* | .32 | .68 | (.02 | ) | (.47 | ) | (.56 | ) | ||||||||||||||
| Portfolio turnover rate (%) | 34 | ** | 68 | 65 | 79 | 52 | 92 | |||||||||||||||||
| a | Based on average shares outstanding during the period. |
| b | Total return does not reflect the effect of any sales charges. |
| c | Total return would have been lower had certain expenses not been reduced. |
| * | Annualized |
| ** | Not annualized |
| *** | Amount is less than $.005. |
The accompanying notes are an integral part of the consolidated financial statements.
| 36 | | | DWS Enhanced Commodity Strategy Fund |
| DWS Enhanced Commodity Strategy Fund — Class R6 | ||||||||||||||
| Six Months Ended 12/31/20 (Unaudited) | Years Ended June 30, | Period Ended | ||||||||||||||||||||||
| 2020 | 2019 | 2018 | 2017 | 6/30/16a | ||||||||||||||||||||
| Selected Per Share Data | ||||||||||||||||||||||||
| Net asset value, beginning of period | $8.05 | $9.62 | $11.89 | $11.04 | $12.79 | $12.50 | ||||||||||||||||||
| Income (loss) from investment operations: | ||||||||||||||||||||||||
Net investment incomeb | .04 | .12 | .19 | .13 | .08 | .01 | ||||||||||||||||||
Net realized and unrealized gain (loss) | 1.21 | (1.52 | ) | (1.28 | ) | .79 | (.99 | ) | .30 | |||||||||||||||
Total from investment operations | 1.25 | (1.40 | ) | (1.09 | ) | .92 | (.91 | ) | .31 | |||||||||||||||
| Less distributions from: | ||||||||||||||||||||||||
Net investment income | (.07 | ) | (.17 | ) | (1.18 | ) | (.07 | ) | (.84 | ) | (.02 | ) | ||||||||||||
| Redemption fees | — | — | — | — | .00 | *** | .00 | *** | ||||||||||||||||
| Net asset value, end of period | $9.23 | $8.05 | $9.62 | $11.89 | $11.04 | $12.79 | ||||||||||||||||||
| Total Return (%)c | 15.60 | ** | (14.58 | ) | (9.46 | ) | 8.36 | (7.37 | ) | 2.46 | ** | |||||||||||||
| Ratios to Average Net Assets and Supplemental Data |
| |||||||||||||||||||||||
| Net assets, end of period ($ millions) | 38 | 31 | 30 | 22 | 13 | 5 | ||||||||||||||||||
| Ratio of expenses before expense reductions (%) | 1.05 | * | 1.08 | 1.06 | 1.07 | 1.09 | 1.27 | * | ||||||||||||||||
| Ratio of expenses after expense reductions (%) | .89 | * | .89 | .95 | .95 | .96 | .95 | * | ||||||||||||||||
| Ratio of net investment income (%) | .86 | * | 1.42 | 1.86 | 1.14 | .67 | .68 | * | ||||||||||||||||
| Portfolio turnover rate (%) | 34 | ** | 68 | 65 | 79 | 52 | 92 | d | ||||||||||||||||
| a | For the period from June 1, 2016 (commencement of operations) to June 30, 2016. |
| b | Based on average shares outstanding during the period. |
| c | Total return would have been lower had certain expenses not been reduced. |
| d | Represents the Fund’s portfolio turnover rate for the year ended June 30, 2016. |
| * | Annualized |
| ** | Not annualized |
| *** | Amount is less than $.005. |
The accompanying notes are an integral part of the consolidated financial statements.
| DWS Enhanced Commodity Strategy Fund | | | 37 |
| DWS Enhanced Commodity Strategy Fund — Class S | ||||||||||||||
| Six Months Ended 12/31/20 (Unaudited) | Years Ended June 30, | |||||||||||||||||||||||
| 2020 | 2019 | 2018 | 2017 | 2016 | ||||||||||||||||||||
| Selected Per Share Data | ||||||||||||||||||||||||
| Net asset value, beginning of period | $8.03 | $9.59 | $11.86 | $11.02 | $12.76 | $13.58 | ||||||||||||||||||
| Income (loss) from investment operations: | ||||||||||||||||||||||||
Net investment income (loss)a | .03 | .12 | .17 | .11 | .06 | .05 | ||||||||||||||||||
Net realized and unrealized gain (loss) | 1.21 | (1.53 | ) | (1.28 | ) | .78 | (.99 | ) | (.84 | ) | ||||||||||||||
Total from investment operations | 1.24 | (1.41 | ) | (1.11 | ) | .89 | (.93 | ) | (.79 | ) | ||||||||||||||
| Less distributions from: | ||||||||||||||||||||||||
Net investment income | (.06 | ) | (.15 | ) | (1.16 | ) | (.05 | ) | (.81 | ) | (.03 | ) | ||||||||||||
| Redemption fees | — | — | — | — | .00 | *** | .00 | *** | ||||||||||||||||
| Net asset value, end of period | $9.21 | $8.03 | $9.59 | $11.86 | $11.02 | $12.76 | ||||||||||||||||||
| Total Return (%)b | 15.52 | ** | (14.79 | ) | (9.58 | ) | 8.08 | (7.50 | ) | (5.77 | ) | |||||||||||||
| Ratios to Average Net Assets and Supplemental Data |
| |||||||||||||||||||||||
| Net assets, end of period ($ millions) | 68 | 83 | 195 | 520 | 349 | 298 | ||||||||||||||||||
| Ratio of expenses before expense reductions (%) | 1.23 | * | 1.25 | 1.21 | 1.19 | 1.24 | 1.25 | |||||||||||||||||
| Ratio of expenses after expense reductions (%) | 1.04 | * | 1.09 | 1.14 | 1.12 | 1.13 | 1.17 | |||||||||||||||||
| Ratio of net investment income (loss) (%) | .73 | * | 1.30 | 1.60 | .97 | .48 | .39 | |||||||||||||||||
| Portfolio turnover rate (%) | 34 | ** | 68 | 65 | 79 | 52 | 92 | |||||||||||||||||
| a | Based on average shares outstanding during the period. |
| b | Total return would have been lower had certain expenses not been reduced. |
| * | Annualized |
| ** | Not annualized |
| *** | Amount is less than $.005. |
The accompanying notes are an integral part of the consolidated financial statements.
| 38 | | | DWS Enhanced Commodity Strategy Fund |
| DWS Enhanced Commodity Strategy Fund — Institutional Class | ||||||||||||||
| Six Months Ended 12/31/20 (Unaudited) | Years Ended June 30, | |||||||||||||||||||||||
| 2020 | 2019 | 2018 | 2017 | 2016 | ||||||||||||||||||||
| Selected Per Share Data | ||||||||||||||||||||||||
| Net asset value, beginning of period | $8.06 | $9.62 | $11.90 | $11.05 | $12.80 | $13.63 | ||||||||||||||||||
| Income (loss) from investment operations: | ||||||||||||||||||||||||
Net investment income (loss)a | .04 | .13 | .19 | .13 | .07 | .06 | ||||||||||||||||||
Net realized and unrealized gain (loss) | 1.21 | (1.52 | ) | (1.29 | ) | .79 | (.99 | ) | (.84 | ) | ||||||||||||||
Total from investment operations | 1.25 | (1.39 | ) | (1.10 | ) | .92 | (.92 | ) | (.78 | ) | ||||||||||||||
| Less distributions from: | ||||||||||||||||||||||||
Net investment income | (.07 | ) | (.17 | ) | (1.18 | ) | (.07 | ) | (.83 | ) | (.05 | ) | ||||||||||||
| Redemption fees | — | — | — | — | .00 | *** | .00 | *** | ||||||||||||||||
| Net asset value, end of period | $9.24 | $8.06 | $9.62 | $11.90 | $11.05 | $12.80 | ||||||||||||||||||
| Total Return (%)b | 15.58 | ** | (14.58 | ) | (9.47 | ) | 8.31 | (7.40 | ) | (5.70 | ) | |||||||||||||
| Ratios to Average Net Assets and Supplemental Data |
| |||||||||||||||||||||||
| Net assets, end of period ($ millions) | 1,488 | 1,371 | 2,450 | 2,769 | 2,246 | 2,127 | ||||||||||||||||||
| Ratio of expenses before expense reductions (%) | 1.15 | * | 1.19 | 1.16 | 1.13 | 1.18 | 1.16 | |||||||||||||||||
| Ratio of expenses after expense reductions (%) | .89 | * | .90 | .99 | .99 | .99 | 1.01 | |||||||||||||||||
| Ratio of net investment income (loss) (%) | .86 | * | 1.46 | �� | 1.79 | 1.09 | .62 | .53 | ||||||||||||||||
| Portfolio turnover rate (%) | 34 | ** | 68 | 65 | 79 | 52 | 92 | |||||||||||||||||
| a | Based on average shares outstanding during the period. |
| b | Total return would have been lower had certain expenses not been reduced. |
| * | Annualized |
| ** | Not annualized |
| *** | Amount is less than $.005. |
The accompanying notes are an integral part of the consolidated financial statements.
| DWS Enhanced Commodity Strategy Fund | | | 39 |
| Notes to Consolidated Financial Statements | (Unaudited) |
A. Organization and Significant Accounting Policies
DWS Enhanced Commodity Strategy Fund (the “Fund”) is a diversified series of Deutsche DWS Securities Trust (the “Trust”), which is registered under the Investment Company Act of 1940, as amended (the “1940 Act”), as an open-end management investment company organized as a Massachusetts business trust.
The Fund offers multiple classes of shares which provide investors with different purchase options. Class A shares are subject to an initial sales charge. Class T shares are subject to an initial sales charge and are only available through certain financial intermediaries. Class T shares are closed to new purchases, except in connection with the reinvestment of dividends or other distributions. Class C shares are not subject to an initial sales charge but are subject to higher ongoing expenses than Class A shares and a contingent deferred sales charge payable upon certain redemptions within one year of purchase. Class C shares automatically convert to Class A shares in the same fund after 10 years, provided that the fund or the financial intermediary through which the shareholder purchased the Class C shares has records verifying that the Class C shares have been held for at least 10 years. Class R6 shares are not subject to initial or contingent deferred sales charges and are generally available only to certain retirement plans. Class S shares are not subject to initial or contingent deferred sales charges and are available through certain intermediary relationships with financial services firms, or can be purchased by establishing an account directly with the Fund’s transfer agent. Institutional Class shares are not subject to initial or contingent deferred sales charges and are generally available only to qualified institutions.
Investment income, realized and unrealized gains and losses, and certain fund-level expenses and expense reductions, if any, are borne pro rata on the basis of relative net assets by the holders of all classes of shares, except that each class bears certain expenses unique to that class such as distribution and service fees, services to shareholders and certain other class-specific expenses. Differences in class-level expenses may result in payment of different per share dividends by class. All shares of the Fund have equal rights with respect to voting subject to class-specific arrangements.
The Fund’s consolidated financial statements are prepared in accordance with accounting principles generally accepted in the United States of America (“U.S. GAAP”) which require the use of management estimates. Actual results could differ from those estimates. The Fund qualifies as an investment company under Topic 946 of Accounting Standards Codification
| 40 | | | DWS Enhanced Commodity Strategy Fund |
of U.S. GAAP. The policies described below are followed consistently by the Fund in the preparation of its consolidated financial statements.
Principles of Consolidation. The Fund invests indirectly in commodities markets through a wholly owned subsidiary, Cayman Commodity Fund II, Ltd., organized under the laws of the Cayman Islands (the “Subsidiary”). The Fund and the Subsidiary are each a commodity pool and are subject to the requirements of the Commodity Exchange Act (“CEA”), as amended, and the rules of the Commodity Futures Trading Commission (“CFTC”) promulgated thereunder. DWS Investment Management Americas, Inc. (the “Advisor”) acts as a commodity pool operator with respect to the operation of the Fund and the Subsidiary as commodity pools under and pursuant to the CEA. The Advisor, the Fund and the Subsidiary are subject to dual regulation by the CFTC and the Securities and Exchange Commission. Among other investments, the Subsidiary may invest in commodity-linked derivative instruments, such as futures and options contracts and commodity-linked swaps. The Subsidiary may also invest in debt securities, some of which are intended to serve as margin or collateral for the Subsidiary’s derivatives positions. The Subsidiary may also invest available cash in affiliated money market funds. The Subsidiary is managed by the same portfolio managers that manage the Fund. As of December 31, 2020, the Fund’s investment in the Subsidiary was $335,455,763, representing 19% of the Fund’s total assets.
The Fund’s Investment Portfolio has been consolidated and includes the portfolio holdings of the Fund and the Subsidiary. The consolidated financial statements include the accounts of the Fund and the Subsidiary. All inter-company transactions and balances have been eliminated.
Security Valuation. Investments are stated at value determined as of the close of regular trading on the New York Stock Exchange on each day the exchange is open for trading.
Various inputs are used in determining the value of the Fund’s investments. These inputs are summarized in three broad levels. Level 1 includes quoted prices in active markets for identical securities. Level 2 includes other significant observable inputs (including quoted prices for similar securities, interest rates, prepayment speeds and credit risk). Level 3 includes significant unobservable inputs (including the Fund’s own assumptions in determining the fair value of investments). The level assigned to the securities valuations may not be an indication of the risk or liquidity associated with investing in those securities.
Exchange-traded funds (“ETFs”) are valued at the most recent sale price or official closing price reported on the exchange (U.S. or foreign) or over-the-counter market on which they trade. ETFs for which no sales are reported are valued at the calculated mean between the most recent bid
| DWS Enhanced Commodity Strategy Fund | | | 41 |
and asked quotations on the relevant market or, if a mean cannot be determined, at the most recent bid quotation. ETFs are generally categorized as Level 1.
Debt securities are valued at prices supplied by independent pricing services approved by the Fund’s Board. Such services may use various pricing techniques which take into account appropriate factors such as yield, quality, coupon rate, maturity, type of issue, trading characteristics, prepayment speeds and other data, as well as broker quotes. If the pricing services are unable to provide valuations, debt securities are valued at the average of the most recent reliable bid quotations or evaluated prices, as applicable, obtained from broker-dealers. These securities are generally categorized as Level 2.
Investments in open-end investment companies are valued at their net asset value each business day and are categorized as Level 1.
Futures contracts are generally valued at the settlement prices established each day on the exchange on which they are traded and are categorized as Level 1.
Swap contracts are valued daily based upon prices supplied by a Board approved pricing vendor, if available, and otherwise are valued at the price provided by the broker-dealer. Swap contracts are generally categorized as Level 2.
Exchange-traded options are valued at the last sale price or, in the absence of a sale, the mean between the closing bid and asked prices or at the most recent asked price (bid for purchased options) if no bid or asked price are available. Exchange-traded options are generally categorized as Level 1. Over-the-counter written or purchased options are valued at prices supplied by a Board approved pricing vendor, if available, and otherwise are valued at the price provided by the broker-dealer with which the option was traded. Over-the-counter written or purchased options are generally categorized as Level 2.
Securities and other assets for which market quotations are not readily available or for which the above valuation procedures are deemed not to reflect fair value are valued in a manner that is intended to reflect their fair value as determined in accordance with procedures approved by the Board and are generally categorized as Level 3. In accordance with the Fund’s valuation procedures, factors considered in determining value may include, but are not limited to, the type of the security; the size of the holding; the initial cost of the security; the existence of any contractual restrictions on the security’s disposition; the price and extent of public trading in similar securities of the issuer or of comparable companies; quotations or evaluated prices from broker-dealers and/or pricing services; information obtained from the issuer, analysts, and/or the appropriate stock exchange
| 42 | | | DWS Enhanced Commodity Strategy Fund |
(for exchange-traded securities); an analysis of the company’s or issuer’s financial statements; an evaluation of the forces that influence the issuer and the market(s) in which the security is purchased and sold; and with respect to debt securities, the maturity, coupon, creditworthiness, currency denomination and the movement of the market in which the security is normally traded. The value determined under these procedures may differ from published values for the same securities.
Disclosure about the classification of fair value measurements is included in a table following the Fund’s Consolidated Investment Portfolio.
Securities Lending. Brown Brothers Harriman & Co., as lending agent, lends securities of the Fund to certain financial institutions under the terms of its securities lending agreement. During the term of the loans, the Fund continues to receive interest and dividends generated by the securities and to participate in any changes in their market value. The Fund requires the borrowers of the securities to maintain collateral with the Fund consisting of either cash and/or U.S. Treasury Securities having a value at least equal to the value of the securities loaned. When the collateral falls below specified amounts, the lending agent will use its best efforts to obtain additional collateral on the next business day to meet required amounts under the securities lending agreement. During the six months ended December 31, 2020, the Fund invested the cash collateral into a joint trading account in DWS Government & Agency Securities Portfolio, an affiliated money market fund managed by DWS Investment Management Americas, Inc. DWS Investment Management Americas, Inc. receives a management/administration fee (0.06% annualized effective rate as of December 31, 2020) on the cash collateral invested in DWS Government & Agency Securities Portfolio. The Fund receives compensation for lending its securities either in the form of fees or by earning interest on invested cash collateral net of borrower rebates and fees paid to a lending agent. Either the Fund or the borrower may terminate the loan at any time, and the borrower, after notice, is required to return borrowed securities within a standard time period. There may be risks of delay and costs in recovery of securities or even loss of rights in the collateral should the borrower of the securities fail financially. If the Fund is not able to recover securities lent, the Fund may sell the collateral and purchase a replacement investment in the market, incurring the risk that the value of the replacement security is greater than the value of the collateral. The Fund is also subject to all investment risks associated with the reinvestment of any cash collateral received, including, but not limited to, interest rate, credit and liquidity risk associated with such investments.
As of December 31, 2020, the Fund had securities on loan. The value of the related collateral exceeded the value of the securities loaned at period end.
| DWS Enhanced Commodity Strategy Fund | | | 43 |
| Remaining Contractual Maturity of the Agreements as of December 31, 2020 | ||||||||||||||||||||
| Overnight and Continuous | <30 Days | Between 30 & 90 Days | >90 Days | Total | ||||||||||||||||
Securities Lending Transactions |
| |||||||||||||||||||
| Corporate Bonds | $ | 2,542,248 | $ | — | $ | — | $ | — | $ | 2,542,248 | ||||||||||
| Exchange-Traded Funds | 164,900 | — | — | — | 164,900 | |||||||||||||||
| Total Borrowings | $ | 2,707,148 | $ | — | $ | — | $ | — | $ | 2,707,148 | ||||||||||
Gross amount of recognized liabilities for securities lending transactions |
| $ | 2,707,148 | |||||||||||||||||
When-Issued/Delayed Delivery Securities. The Fund may purchase or sell securities with delivery or payment to occur at a later date beyond the normal settlement period. At the time the Fund enters into a commitment to purchase or sell a security, the transaction is recorded and the value of the transaction is reflected in the net asset value. The price of such security and the date when the security will be delivered and paid for are fixed at the time the transaction is negotiated. The value of the security may vary with market fluctuations. At the time the Fund enters into a purchase transaction it is required to segregate cash or other liquid assets at least equal to the amount of the commitment. Additionally, the Fund may be required to post securities and/or cash collateral in accordance with the terms of the commitment.
Certain risks may arise upon entering into when-issued or delayed delivery transactions from the potential inability of counterparties to meet the terms of their contracts or if the issuer does not issue the securities due to political, economic, or other factors. Additionally, losses may arise due to changes in the value of the underlying securities.
Federal Income Taxes. The Fund’s policy is to comply with the requirements of the Internal Revenue Code, as amended, which are applicable to regulated investment companies and to distribute all of its taxable income to its shareholders.
Income from certain commodity-linked derivatives does not constitute “qualifying income” to the Fund. Receipt of such income could cause the Fund to be subject to tax at the Fund level. The IRS has issued a private letter ruling to the Fund stating that such income earned through its wholly owned Subsidiary constitutes qualifying income. The Fund is required to increase its taxable income by its share of the Subsidiary’s income, including net gains from commodity-linked transactions. Net investment losses of the Subsidiary cannot be deducted by the Fund in the current period nor carried forward to offset taxable income for future periods.
At June 30, 2020, the Fund had net tax basis capital loss carryforwards of approximately $25,583,000, including short-term losses ($6,701,000) and
| 44 | | | DWS Enhanced Commodity Strategy Fund |
long-term losses ($18,882,000), which may be applied against realized net taxable capital gains indefinitely.
At December 31, 2020, the aggregate cost of investments for federal income tax purposes was $2,201,759,876. The net unrealized depreciation for all investments based on tax cost was $544,473,677. This consisted of aggregate gross unrealized appreciation for all investments for which there was an excess of value over tax cost of $335,261,489 and aggregate gross unrealized depreciation for all investments for which there was an excess of tax cost over value of $879,735,166.
The Fund has reviewed the tax positions for the open tax years as of June 30, 2020 and has determined that no provision for income tax and/or uncertain tax positions is required in the Fund’s consolidated financial statements. The Fund’s federal tax returns for the prior three fiscal years remain open subject to examination by the Internal Revenue Service.
Distribution of Income and Gains. Distributions from net investment income of the Fund, if any, are declared and distributed to shareholders quarterly. Net realized gains from investment transactions, in excess of available capital loss carryforwards, would be taxable to the Fund if not distributed and, therefore, will be distributed to shareholders at least annually. The Fund may also make additional distributions for tax purposes if necessary.
The timing and characterization of certain income and capital gain distributions are determined annually in accordance with federal tax regulations which may differ from accounting principles generally accepted in the United States of America. These differences primarily relate to investments in futures, swap contracts, and investment in the Subsidiary. As a result, net investment income (loss) and net realized gain (loss) on investment transactions for a reporting period may differ significantly from distributions during such period. Accordingly, the Fund may periodically make reclassifications among certain of its capital accounts without impacting the net asset value of the Fund.
The tax character of current year distributions will be determined at the end of the current fiscal year.
Expenses. Expenses of the Trust arising in connection with a specific fund are allocated to that fund. Other Trust expenses which cannot be directly attributed to a fund are apportioned among the funds in the Trust based upon the relative net assets or other appropriate measures.
Contingencies. In the normal course of business, the Fund may enter into contracts with service providers that contain general indemnification clauses. The Fund’s maximum exposure under these arrangements is unknown, as this would involve future claims that may be made against the Fund that have not yet been made. However, based on experience, the Fund expects the risk of loss to be remote.
| DWS Enhanced Commodity Strategy Fund | | | 45 |
Other. Investment transactions are accounted for on a trade date plus one basis for daily net asset value calculations. However, for financial reporting purposes, investment transactions are reported on trade date. Interest income is recorded on the accrual basis. Realized gains and losses from investment transactions are recorded on an identified cost basis. Proceeds from litigation payments, if any, are included in net realized gain (loss) from investments. All discounts and premiums are accreted/amortized for both tax and financial reporting purposes.
B. Derivative Instruments
Swaps. A swap is a contract between two parties to exchange future cash flows at periodic intervals based on the notional amount of the swap. A bilateral swap is a transaction between the fund and a counterparty where cash flows are exchanged between the two parties. A centrally cleared swap is a transaction executed between the fund and a counterparty, then cleared by a clearing member through a central clearinghouse. The central clearinghouse serves as the counterparty, with whom the fund exchanges cash flows.
The value of a swap is adjusted daily, and the change in value, if any, is recorded as unrealized appreciation or depreciation in the Consolidated Statement of Assets and Liabilities. Gains or losses are realized when the swap expires or is closed. Certain risks may arise when entering into swap transactions including counterparty default; liquidity; or unfavorable changes in interest rates or the value of the underlying reference security, commodity or index. In connection with bilateral swaps, securities and/or cash may be identified as collateral in accordance with the terms of the swap agreement to provide assets of value and recourse in the event of default. The maximum counterparty credit risk is the net present value of the cash flows to be received from or paid to the counterparty over the term of the swap, to the extent that this amount is beneficial to the Fund, in addition to any related collateral posted to the counterparty by the Fund. This risk may be partially reduced by a master netting arrangement between the Fund and the counterparty. Upon entering into a centrally cleared swap, the Fund is required to deposit with a financial intermediary cash or securities (“initial margin”) in an amount equal to a certain percentage of the notional amount of the swap. Subsequent payments (“variation margin”) are made or received by the Fund dependent upon the daily fluctuations in the value of the swap. In a cleared swap transaction, counterparty risk is minimized as the central clearinghouse acts as the counterparty.
Commodity-linked swap agreements involve a commitment to pay interest in exchange for a commodity-linked return based on a notional amount. To the extent the return of the reference commodity or commodity index underlying the commodity-linked swap exceeds or falls short of the offsetting interest rate obligation, the Fund will receive
| 46 | | | DWS Enhanced Commodity Strategy Fund |
a payment or make a payment to the counterparty, respectively. For the six months ended December 31, 2020 the Fund entered into commodity-linked swap agreements to gain exposure to the investment return of assets that trade in the commodity markets, without investing directly in physical commodities.
A summary of the open commodity-linked swap contracts as of December 31, 2020 is included in a table following the Fund’s Consolidated Investment Portfolio. For the six months ended December 31, 2020, the investment in long commodity-linked swap contracts had a total notional amount generally indicative of a range from $1,924,248,000 to $2,458,656,000.
Options. An option contract is a contract in which the writer (seller) of the option grants the buyer of the option, upon payment of a premium, the right to purchase from (call option), or sell to (put option), the writer a designated instrument at a specified price within a specified period of time. The Fund may write or purchase interest rate swaption agreements which are options to enter into a pre-defined swap agreement. The interest rate swaption agreement will specify whether the buyer of the swaption will be a fixed-rate receiver or a fixed-rate payer upon exercise. The Fund may also purchase options on exchange-traded futures contracts where the Fund is required to deposit with a financial intermediary cash or securities (“initial margin”) in an amount equal to a certain percentage of the face value indicated in the underlying futures contract. Subsequent payments (“variation margin”) are made or received by the Fund dependent upon the daily fluctuations in the value and are recorded for financial reporting purposes as unrealized gains or losses by the Fund. Certain options, including options on indices, will require cash settlement by the Fund if exercised. For the six months ended December 31, 2020, the Fund entered into options on commodity futures contracts to gain exposure to the investment return of assets that trade in the commodity markets, without investing directly in physical commodities.
If the Fund writes a covered call option, the Fund foregoes, in exchange for the premium, the opportunity to profit during the option period from an increase in the market value of the underlying security above the exercise price. If the Fund writes a put option it accepts the risk of a decline in the value of the underlying security below the exercise price. Over-the-counter options have the risk of the potential inability of counterparties to meet the terms of their contracts. The Fund’s maximum exposure to purchased options is limited to the premium initially paid. There is no premium paid at the time of purchase on certain options on exchange-traded futures. At the expiration of these options on exchange-traded futures, the accumulated variation margin made or received is recorded as realized gains or losses. Certain risks may arise upon entering into option contracts including the risk that an illiquid
| DWS Enhanced Commodity Strategy Fund | | | 47 |
secondary market will limit the Fund’s ability to close out an option contract prior to the expiration date and that a change in the value of the option contract may not correlate exactly with changes in the value of the securities or currencies hedged.
There were no open purchased and written option contracts as of December 31, 2020. For the six months ended December 31, 2020, the investment in purchased options contracts had a total value generally indicative of a range from $0 to $540,000, and the investment in written options contracts had a total value generally indicative of a range from $0 to $1,140,000.
Futures Contracts. A futures contract is an agreement between a buyer or seller and an established futures exchange or its clearinghouse in which the buyer or seller agrees to take or make a delivery of a specific amount of a financial instrument at a specified price on a specific date (settlement date). For the six months ended December 31, 2020, the Fund entered into commodity futures contracts to gain exposure to the investment return of assets that trade in the commodity markets, without investing directly in physical commodities, and entered into interest rate futures to gain exposure to different parts of the yield curve while managing overall duration.
Upon entering into a futures contract, the Fund is required to deposit with a financial intermediary cash or securities (“initial margin”) in an amount equal to a certain percentage of the face value indicated in the futures contract. Subsequent payments (“variation margin”) are made or received by the Fund dependent upon the daily fluctuations in the value and are recorded for financial reporting purposes as unrealized gains or losses by the Fund. Gains or losses are realized when the contract expires or is closed. Since all futures contracts are exchange traded, counterparty risk is minimized as the exchange’s clearinghouse acts as the counterparty, and guarantees the futures against default.
Certain risks may arise upon entering into futures contracts, including the risk that an illiquid market will limit the Fund’s ability to close out a futures contract prior to the settlement date and the risk that the futures contract is not well correlated with the security, index or currency to which it relates. Risk of loss may exceed amounts disclosed in the Consolidated Statement of Assets and Liabilities.
A summary of the open futures contracts and futures options contracts as of December 31, 2020 is included in the table following the Fund’s Consolidated Investment Portfolio. For the six months ended December 31, 2020, the investment in futures contracts purchased had a total notional value generally indicative of a range from approximately $163,117,000 to $261,067,000, the investment in futures options contracts purchased had a total notional value generally indicative of a
| 48 | | | DWS Enhanced Commodity Strategy Fund |
range from $0 to $1,968,000, and the investment in futures contracts sold had a total notional value generally indicative of a range from approximately $190,828,000 to $323,746,000, the investment in futures options contracts sold had a total notional value generally indicative of a range from $0 to $4,536,000.
The following tables summarize the value of the Fund’s derivative instruments held as of December 31, 2020 and the related location in the accompanying Consolidated Statement of Assets and Liabilities, presented by primary underlying risk exposure:
| Asset Derivatives | Swap Contracts | Futures Contracts | Total | |||||||||
| Commodity Contracts (a) (b) | $51,553,501 | $ | 13,108,744 | $64,662,245 | ||||||||
Each of the above derivatives is located in the following Consolidated Statement of Assets and Liabilities accounts:
| (a) | Includes cumulative appreciation of futures and futures options contracts as disclosed in the Consolidated Investment Portfolio. Unsettled variation margin is disclosed separately within the Consolidated Statement of Assets and Liabilities. |
| (b) | Unrealized appreciation on bilateral swap contracts |
| Liability Derivatives | Swap Contracts | Futures Contracts | Total | |||||||||
| Interest Rate Contracts (c) | $ | — | $ | (222,932 | ) | $ | (222,932 | ) | ||||
| Commodity Contracts (c) (d) | (4,391,332 | ) | (15,566,707 | ) | (19,958,039 | ) | ||||||
| $ | (4,391,332 | ) | $ | (15,789,639 | ) | $ | (20,180,971 | ) | ||||
Each of the above derivatives is located in the following Consolidated Statement of Assets and Liabilities accounts:
| (c) | Includes cumulative depreciation of futures and futures options contracts as disclosed in the Consolidated Investment Portfolio. Unsettled variation margin is disclosed separately within the Consolidated Statement of Assets and Liabilities. |
| (d) | Unrealized depreciation on bilateral swap contracts |
Additionally, the amount of unrealized and realized gains and losses on derivative instruments recognized in Fund earnings during the six months ended December 31, 2020 and the related location on the accompanying Consolidated Statement of Operations is summarized in the following tables by primary underlying risk exposure:
| Realized Gain (Loss) | Purchased Options | Written Options | Swap Contracts | Futures Contracts | Total | |||||||||||||||
| Interest Rate Contracts (e) | $ | — | $ | — | $ | — | $ | 133,757 | $ | 133,757 | ||||||||||
| Commodity Contracts (e) | (885,200 | ) | 1,268,200 | 191,236,369 | (1,765,307 | ) | 189,854,062 | |||||||||||||
| $ | (885,200 | ) | $ | 1,268,200 | $ | 191,236,369 | $ | (1,631,550 | ) | $ | 189,987,819 | |||||||||
Each of the above derivatives is located in the following Consolidated Statement of Operations accounts:
| (e) | Net realized gain (loss) from investments (includes purchased options), written options, swap contracts and futures contracts, respectively |
| DWS Enhanced Commodity Strategy Fund | | | 49 |
| Change in Net Unrealized Appreciation (Depreciation) | ||||||||||||||||||||
Purchased Options | Written Options | Swap Contracts | Futures Contracts | Total | ||||||||||||||||
| Interest Rate Contracts (f) | $ | — | $ | — | $ | — | $ | (222,932 | ) | $ | (222,932 | ) | ||||||||
| Commodity Contracts (f) | 345,200 | (214,800 | ) | 25,259,159 | (333,442 | ) | 25,056,117 | |||||||||||||
| $ | 345,200 | $ | (214,800 | ) | $ | 25,259,159 | $ | (556,374 | ) | $ | 24,833,185 | |||||||||
Each of the above derivatives is located in the following Consolidated Statement of Operations accounts:
| (f) | Change in net unrealized appreciation (depreciation) on investments (includes purchased options), written options, swap contracts and futures and futures options contracts, respectively |
As of December 31, 2020, the Fund has transactions subject to enforceable master netting agreements which govern the terms of certain transactions, and reduce the counterparty risk associated with such transactions. Master netting agreements allow a Fund to close out and net total exposure to a counterparty in the event of a deterioration in the credit quality or contractual default with respect to all of the transactions with a counterparty. As defined by the master netting agreement, the Fund may have collateral agreements with certain counterparties to mitigate risk. For financial reporting purposes the Consolidated Statement of Assets and Liabilities generally shows derivatives assets and liabilities on a gross basis, which reflects the full risks and exposures prior to netting. A reconciliation of the gross amounts on the Consolidated Statement of Assets and Liabilities to the net amounts by a counterparty, including any collateral exposure, is included in the following tables:
| Counterparty | Gross Amounts of Assets Presented in the Consolidated Statement of Assets and Liabilities | Financial Instruments and Derivatives Available for Offset | Non-Cash Collateral Received | Cash Collateral Received (g) | Net Amount of Derivative Assets | |||||||||||||||
| Barclays Bank PLC | $ | 4,144,347 | $ | — | $ | — | $ | — | $ | 4,144,347 | ||||||||||
| BNP Paribas | 4,016,312 | (413,434 | ) | — | — | 3,602,878 | ||||||||||||||
| Canadian Imperial Bank of Commerce | 1,721,042 | — | — | — | 1,721,042 | |||||||||||||||
| Citigroup, Inc. | 5,229,789 | — | — | — | 5,229,789 | |||||||||||||||
| Credit Suisse | 4,589,883 | — | — | (3,860,000 | ) | 729,883 | ||||||||||||||
| Goldman Sachs & Co. | 6,155,783 | (67,614 | ) | — | (5,590,000 | ) | 498,169 | |||||||||||||
| JPMorgan Chase Securities, Inc. | 8,711,710 | — | — | — | 8,711,710 | |||||||||||||||
| Macquarie Bank Ltd. | 3,054,065 | (438,212 | ) | — | — | 2,615,853 | ||||||||||||||
| 50 | | | DWS Enhanced Commodity Strategy Fund |
| Counterparty | Gross Amounts of Assets Presented in the Consolidated Statement of Assets and Liabilities | Financial Instruments and Derivatives Available for Offset | Non-Cash Collateral Received | Cash Collateral Received (g) | Net Amount of Derivative Assets | |||||||||||||||
| Merrill Lynch International Ltd. | $ | 4,015,355 | $ | (331,307 | ) | $ | — | $ | — | $ | 3,684,048 | |||||||||
| Morgan Stanley | 1,721,265 | (817,271 | ) | — | — | 903,994 | ||||||||||||||
| Royal Bank of Canada | 4,104,663 | (667,053 | ) | — | — | 3,437,610 | ||||||||||||||
| Societe Generale | 3,128,318 | (1,391,505 | ) | — | — | 1,736,813 | ||||||||||||||
| UBS AG | 960,969 | (264,936 | ) | — | — | 696,033 | ||||||||||||||
| $ | 51,553,501 | $ | (4,391,332 | ) | $ | — | $ | (9,450,000 | ) | $ | 37,712,169 | |||||||||
| Counterparty | Gross Amounts of Liabilities Presented in the Consolidated Statement of Assets and Liabilities | Financial Instruments and Derivatives Available for Offset | Non-Cash Collateral Pledged | Cash Collateral Pledged | Net Amount of Derivative Liabilities | |||||||||||||||
| BNP Paribas | $ | 413,434 | $ | (413,434 | ) | $ | — | $ | — | $ | — | |||||||||
| Goldman Sachs & Co. | 67,614 | (67,614 | ) | — | — | — | ||||||||||||||
| Macquarie Bank Ltd. | 438,212 | (438,212 | ) | — | — | — | ||||||||||||||
| Merrill Lynch International Ltd. | 331,307 | (331,307 | ) | — | — | — | ||||||||||||||
| Morgan Stanley | 817,271 | (817,271 | ) | — | — | — | ||||||||||||||
| Royal Bank of Canada | 667,053 | (667,053 | ) | — | — | — | ||||||||||||||
| Societe Generale | 1,391,505 | (1,391,505 | ) | — | — | — | ||||||||||||||
| UBS AG | 264,936 | (264,936 | ) | — | — | — | ||||||||||||||
| $ | 4,391,332 | $ | (4,391,332 | ) | $ | — | $ | — | $ | — | ||||||||||
| (g) | The actual collateral received and/or pledged may be more than the amounts shown. |
| DWS Enhanced Commodity Strategy Fund | | | 51 |
C. Purchases and Sales of Securities
During the six months ended December 31, 2020, purchases and sales of investment securities, excluding short-term investments, were as follows:
| Purchases | Sales | |||||||
| Non-U.S. Treasury Obligations | $ | 293,300,203 | $ | 298,155,084 | ||||
| U.S. Treasury Obligations | $ | 187,307,716 | $ | 146,141,053 | ||||
D. Related Parties
Management Agreement. Under the Investment Management Agreement with DWS Investment Management Americas, Inc. (“DIMA” or the “Advisor”), an indirect, wholly owned subsidiary of DWS Group GmbH & Co. KGaA (“DWS Group”), the Advisor directs the investments of the Fund in accordance with its investment objectives, policies and restrictions. The Advisor determines the securities, instruments and other contracts relating to investments to be purchased, sold or entered into by the Fund.
Prior to October 1, 2020, under the Investment Management Agreement with the Advisor, the Fund paid a monthly management fee based on the Fund’s average daily net assets, computed and accrued daily and payable monthly, at the following annual rates:
| First $500 million of the Fund’s average daily net assets | .950% | |||
| Next $500 million of such net assets | .900% | |||
| Next $500 million of such net assets | .850% | |||
| Next $1 billion of such assets | .825% | |||
| Next $1 billion of such assets | .800% | |||
| Next $1.5 billion of such net assets | .775% | |||
| Over $5 billion of such net assets | .750% |
Effective October 1, 2020, under the Investment Management Agreement with the Advisor, the Fund pays a monthly management fee based on the Fund’s average daily net assets, computed and accrued daily and payable monthly, at the following annual rates:
| First $500 million of the Fund’s average daily net assets | .850% | |||
| Next $500 million of such net assets | .800% | |||
| Next $500 million of such net assets | .750% | |||
| Next $1 billion of such assets | .725% | |||
| Next $1 billion of such assets | .700% | |||
| Next $1.5 billion of such net assets | .675% | |||
| Over $5 billion of such net assets | .650% |
| 52 | | | DWS Enhanced Commodity Strategy Fund |
Accordingly, for the six months ended December 31, 2020, the fee pursuant to the Investment Management Agreement was equivalent to an annualized rate (exclusive of any applicable waivers/reimbursements) of 0.85% of the Fund’s average daily net assets.
For the period from July 1, 2020 through September 30, 2020 (through September 30, 2021 for Class R6 and Institutional Class shares), the Advisor has contractually agreed to waive all or a portion of its fees and/or reimburse certain operating expenses of the Fund to the extent necessary to maintain the total annual operating expenses (excluding certain expenses such as extraordinary expenses, taxes, brokerage and interest) of each class as follows:
| Class A | 1.27% | |||
| Class T | 1.27% | |||
| Class C | 2.02% | |||
| Class R6 | .89% | |||
| Class S | 1.07% | |||
| Institutional Class | .89% |
Effective October 1, 2020 through September 30, 2021, the Advisor has contractually agreed to waive all or a portion of its fees and/or reimburse certain operating expenses of the Fund to the extent necessary to maintain the total annual operating expenses (excluding certain expenses such as extraordinary expenses, taxes, brokerage and interest) of certain classes as follows:
| Class A | 1.21% | |||
| Class T | 1.21% | |||
| Class C | 1.96% | |||
| Class S | 1.01% |
For the six months ended December 31, 2020, fees waived and/or expenses reimbursed for each class are as follows:
| Class A | $ | 68,753 | ||
| Class T | 8 | |||
| Class C | 6,149 | |||
| Class R6 | 27,812 | |||
| Class S | 77,356 | |||
| Institutional Class | 1,855,475 | |||
| $ | 2,035,553 |
Administration Fee. Pursuant to an Administrative Services Agreement, DIMA provides most administrative services to the Fund. For all services
| DWS Enhanced Commodity Strategy Fund | | | 53 |
provided under the Administrative Services Agreement, the Fund pays the Advisor an annual fee (“Administration Fee”) of 0.097% of the Fund’s average daily net assets, computed and accrued daily and payable monthly. For the six months ended December 31, 2020, the Administration Fee was $782,860, of which $135,017 is unpaid.
Service Provider Fees. DWS Service Company (“DSC”), an affiliate of the Advisor, is the transfer agent, dividend-paying agent and shareholder service agent for the Fund. Pursuant to a sub-transfer agency agreement between DSC and DST Systems, Inc. (“DST”), DSC has delegated certain transfer agent, dividend-paying agent and shareholder service agent functions to DST. DSC compensates DST out of the shareholder servicing fee it receives from the Fund. For the six months ended December 31, 2020, the amounts charged to the Fund by DSC were as follows:
| Services to Shareholders | Total Aggregated | Unpaid at December 31, 2020 | ||||||
| Class A | $ | 4,538 | $ | 1,461 | ||||
| Class T | 12 | 3 | ||||||
| Class C | 478 | 189 | ||||||
| Class R6 | 6,437 | 1,632 | ||||||
| Class S | 4,478 | 1,585 | ||||||
| Institutional Class | 13,534 | 9,482 | ||||||
| $ | 29,477 | $ | 14,352 | |||||
In addition, for the six months ended December 31, 2020, the amounts charged to the Fund for recordkeeping and other administrative services provided by unaffiliated third parties, included in the Consolidated Statement of Operations under “Services to shareholders,” were as follows:
| Sub-Recordkeeping | Total Aggregated | |||
| Class A | $ | 58,832 | ||
| Class C | 4,692 | |||
| Class S | 84,108 | |||
| Institutional Class | 957,721 | |||
| $ | 1,105,353 | |||
Distribution and Service Fees. Under the Fund’s Class C 12b-1 Plan, DWS Distributors, Inc. (“DDI”), an affiliate of the Advisor, receives a fee (“Distribution Fee”) of 0.75% of the average daily net assets of Class C shares. In accordance with the Fund’s Underwriting and Distribution Services Agreement, DDI enters into related selling group agreements with
| 54 | | | DWS Enhanced Commodity Strategy Fund |
various firms at various rates for sales of C shares. For the six months ended December 31, 2020, the Distribution Fee was as follows:
| Distribution Fee | Total Aggregated | Unpaid at December 31, 2020 | ||||||
| Class C | $ | 31,204 | $ | 5,198 | ||||
In addition, DDI provides information and administrative services for a fee (“Service Fee”) to Class A, T and C shareholders at an annual rate of up to 0.25% of the average daily net assets for each such class. DDI in turn has various agreements with financial services firms that provide these services and pays these fees based upon the assets of shareholder accounts the firms service. For the six months ended December 31, 2020, the Service Fee was as follows:
| Service Fee | Total Aggregated | Unpaid at December 31, 2020 | Annualized Rate | |||||||||
| Class A | $ | 77,572 | $ | 28,368 | .24 | % | ||||||
| Class T | 7 | 5 | .15 | % | ||||||||
| Class C | 10,392 | 3,510 | .25 | % | ||||||||
| $ | 87,971 | $ | 31,883 | |||||||||
Underwriting Agreement and Contingent Deferred Sales Charge. DDI is the principal underwriter for the Fund. Underwriting commissions paid in connection with the distribution of Class A shares for the six months ended December 31, 2020 aggregated $2,705.
In addition, DDI receives any contingent deferred sales charge (“CDSC”) from Class C share redemptions occurring within one year of purchase. There is no such charge upon redemption of any share appreciation or reinvested dividends. The CDSC is 1% of the value of the shares redeemed for Class C. For the six months ended December 31, 2020, the CDSC for the Fund’s Class C shares was $634. A deferred sales charge of up to 1% is assessed on certain redemptions of Class A shares. For the six months ended December 31, 2020, DDI received $127 for Class A shares.
Other Service Fees. Under an agreement with the Fund, DIMA is compensated for providing certain pre-press and regulatory filing services to the Fund. For the six months ended December 31, 2020, the amount charged to the Fund by DIMA included in the Consolidated Statement of Operations under “Reports to shareholders” aggregated $8,599, of which $4,239 is unpaid.
Trustees’ Fees and Expenses. The Fund paid retainer fees to each Trustee not affiliated with the Advisor, plus specified amounts to the Board Chairperson and to each committee Chairperson.
| DWS Enhanced Commodity Strategy Fund | | | 55 |
Affiliated Cash Management Vehicles. The Fund may invest uninvested cash balances in DWS Central Cash Management Government Fund and DWS ESG Liquidity Fund, affiliated money market funds which are managed by the Advisor. Each affiliated money market fund is managed in accordance with Rule 2a-7 under the 1940 Act, which governs the quality, maturity, diversity and liquidity of instruments in which a money market fund may invest. DWS Central Cash Management Government Fund seeks to maintain a stable net asset value, and DWS ESG Liquidity Fund maintains a floating net asset value. The Fund indirectly bears its proportionate share of the expenses of each affiliated money market fund in which it invests. DWS Central Cash Management Government Fund does not pay the Advisor an investment management fee. To the extent that DWS ESG Liquidity Fund pays an investment management fee to the Advisor, the Advisor will waive an amount of the investment management fee payable to the Advisor by the Fund equal to the amount of the investment management fee payable on the Fund’s assets invested in DWS ESG Liquidity Fund.
E. Line of Credit
The Fund and other affiliated funds (the “Participants”) share in a $350 million revolving credit facility provided by a syndication of banks. The Fund may borrow for temporary or emergency purposes, including the meeting of redemption requests that otherwise might require the untimely disposition of securities. The Participants are charged an annual commitment fee, which is allocated based on net assets, among each of the Participants. Interest is calculated at a rate per annum equal to the sum of the Federal Funds Rate plus 1.25 percent plus if the one-month LIBOR exceeds the Federal Funds Rate, the amount of such excess. The Fund may borrow up to a maximum of 33 percent of its net assets under the agreement. The Fund had no outstanding loans at December 31, 2020.
F. Investing in Commodities-Related Investments
The Fund invests in commodity-linked derivative instruments such as commodity-linked swaps, commodity-linked structured notes and options and futures contracts that are designed to provide exposure to the investment return of assets that trade in the commodity markets, without investing directly in physical commodities. The commodities-linked derivatives instruments in which the Fund invests are more volatile than many other types of securities and may subject the Fund to special risks that do not apply to all derivatives transactions. The value of a commodity-linked derivative investment generally is based upon the price movements of a physical commodity (such as energy, minerals, or agricultural products), a futures contract, swap or commodity index, or other economic variables based upon changes in the value of
| 56 | | | DWS Enhanced Commodity Strategy Fund |
commodities or the commodities markets. The value of commodity-linked derivative instruments may be affected by changes in overall market movements, commodity index volatility, changes in interest rates, or factors affecting a particular industry or commodity, such as drought, floods, weather, livestock disease, changes in storage costs, embargoes, tariffs, policies of commodity cartels and international economic, political and regulatory developments. Also, a liquid secondary market may not exist for the types of commodity-linked derivative instruments the Fund buys, which may make it difficult for the Fund to sell them at an acceptable price.
G. Fund Share Transactions
The following table summarizes share and dollar activity in the Fund:
| Six Months Ended December 31, 2020 | Year Ended June 30, 2020 | |||||||||||||||
| Shares | Dollars | Shares | Dollars | |||||||||||||
| Shares sold |
| |||||||||||||||
| Class A | 1,854,921 | $ | 15,811,258 | 3,003,827 | $ | 25,768,683 | ||||||||||
| Class C | 116,076 | 900,203 | 132,676 | 1,001,796 | ||||||||||||
| Class R6 | 725,537 | 6,295,361 | 2,195,970 | 19,546,506 | ||||||||||||
| Class S | 1,518,237 | 13,138,965 | 4,291,227 | 37,977,660 | ||||||||||||
| Institutional Class | 48,379,537 | 418,997,718 | 104,404,005 | 886,976,150 | ||||||||||||
| $ | 455,143,505 | $ | 971,270,795 | |||||||||||||
| Shares issued to shareholders in reinvestment of distributions |
| |||||||||||||||
| Class A | 21,691 | $ | 185,594 | 55,864 | $ | 481,934 | ||||||||||
| Class T | 7 | 56 | 16 | 140 | ||||||||||||
| Class C | 2,078 | 15,779 | 8,516 | 66,833 | ||||||||||||
| Class R6 | 21,572 | 187,644 | 42,751 | 369,682 | ||||||||||||
| Class S | 62,589 | 540,774 | 197,381 | 1,736,109 | ||||||||||||
| Institutional Class | 1,240,092 | 10,799,995 | 3,369,116 | 29,352,252 | ||||||||||||
| $ | 11,729,842 | $ | 32,006,950 | |||||||||||||
| DWS Enhanced Commodity Strategy Fund | | | 57 |
| Six Months Ended December 31, 2020 | Year Ended June 30, 2020 | |||||||||||||||
| Shares | Dollars | Shares | Dollars | |||||||||||||
| Shares redeemed |
| |||||||||||||||
| Class A | (1,628,530 | ) | $ | (13,824,549 | ) | (3,646,248 | ) | $ | (31,607,613 | ) | ||||||
| Class C | (321,634 | ) | (2,457,740 | ) | (722,230 | ) | (5,721,740 | ) | ||||||||
| Class R6 | (526,611 | ) | (4,573,151 | ) | (1,488,691 | ) | (13,279,141 | ) | ||||||||
| Class S | (4,513,412 | ) | (39,474,208 | ) | (14,466,831 | ) | (132,412,485 | ) | ||||||||
| Institutional Class | (58,671,784 | ) | (511,823,038 | ) | (192,349,194 | ) | (1,680,590,964 | ) | ||||||||
| $ | (572,152,686 | ) | $ | (1,863,611,943 | ) | |||||||||||
| Net increase (decrease) |
| |||||||||||||||
| Class A | 248,082 | $ | 2,172,303 | (586,557 | ) | $ | (5,356,996 | ) | ||||||||
| Class T | 7 | 56 | 16 | 140 | ||||||||||||
| Class C | (203,480 | ) | (1,541,758 | ) | (581,038 | ) | (4,653,111 | ) | ||||||||
| Class R6 | 220,498 | 1,909,854 | 750,030 | 6,637,047 | ||||||||||||
| Class S | (2,932,586 | ) | (25,794,469 | ) | (9,978,223 | ) | (92,698,716 | ) | ||||||||
| Institutional Class | (9,052,155 | ) | (82,025,325 | ) | (84,576,073 | ) | (764,262,562 | ) | ||||||||
| $ | (105,279,339 | ) | $ | (860,334,198 | ) | |||||||||||
H. Other — COVID-19 Pandemic
A novel coronavirus known as COVID-19, declared a pandemic by the World Health Organization, has caused significant uncertainty, market volatility, decreased economic and other activity and increased government activity. Specifically, COVID-19 has led to significant death and morbidity, and concerns about its further spread have resulted in the closing of schools and non-essential businesses, cancellations, shelter-in place orders, lower consumer spending in certain sectors, social distancing, bans on large social gatherings and travel, quarantines, government economic stimulus measures, reduced productivity, rapid increases in unemployment, increased demand for and strain on government and medical resources, border closings and global trade and supply chain interruptions, among others. The full effects, duration and costs of the COVID-19 pandemic are impossible to predict, and the circumstances surrounding the COVID-19 pandemic will continue to evolve. The pandemic may affect certain countries, industries, economic sectors, companies and investment products more than others, may exacerbate existing economic, political, or social tensions and may increase the probability of an economic recession or depression. The Fund and its investments may be adversely affected by the effects of the COVID-19 pandemic, and a prolonged pandemic may result in the Fund
| 58 | | | DWS Enhanced Commodity Strategy Fund |
and its service providers experiencing operational difficulties in coordinating a remote workforce and implementing their business continuity plans, among others. Management will continue to monitor the impact COVID-19 has on the Fund and reflect the consequences as appropriate in the Fund’s accounting and financial reporting.
| DWS Enhanced Commodity Strategy Fund | | | 59 |
Information About Your Fund’s Expenses
As an investor of the Fund, you incur two types of costs: ongoing expenses and transaction costs. Ongoing expenses include management fees, distribution and service (12b-1) fees and other Fund expenses. Examples of transaction costs include sales charges (loads) and account maintenance fees, which are not shown in this section. The following tables are intended to help you understand your ongoing expenses (in dollars) of investing in the Fund and to help you compare these expenses with the ongoing expenses of investing in other mutual funds. In the most recent six-month period, the Fund limited these expenses; had it not done so, expenses would have been higher. The example in the table is based on an investment of $1,000 invested at the beginning of the six-month period and held for the entire period (July 1, 2020 to December 31, 2020).
The tables illustrate your Fund’s expenses in two ways:
| – | Actual Fund Return. This helps you estimate the actual dollar amount of ongoing expenses (but not transaction costs) paid on a $1,000 investment in the Fund using the Fund’s actual return during the period. To estimate the expenses you paid over the period, simply divide your account value by $1,000 (for example, an $8,600 account value divided by $1,000 = 8.6), then multiply the result by the number in the “Expenses Paid per $1,000” line under the share class you hold. |
| – | Hypothetical 5% Fund Return. This helps you to compare your Fund’s ongoing expenses (but not transaction costs) with those of other mutual funds using the Fund’s actual expense ratio and a hypothetical rate of return of 5% per year before expenses. Examples using a 5% hypothetical fund return may be found in the shareholder reports of other mutual funds. The hypothetical account values and expenses may not be used to estimate the actual ending account balance or expenses you paid for the period. |
Please note that the expenses shown in these tables are meant to highlight your ongoing expenses only and do not reflect any transaction costs. The “Expenses Paid per $1,000” line of the tables is useful in comparing ongoing expenses only and will not help you determine the relative total expense of owning different funds. Subject to certain exceptions, an account maintenance fee of $20.00 assessed once per calendar year for Classes A, C and S shares may apply for accounts with balances less than $10,000. This fee is not included in these tables. If it was, the estimate of expenses paid for Classes A, C and S shares during the period would be higher, and account value during the period would be lower, by this amount.
| 60 | | | DWS Enhanced Commodity Strategy Fund |
| Expenses and Value of a $1,000 Investment for the six months ended December 31, 2020 (Unaudited) | ||||||||||||||||||||||||
| Actual Fund Return | Class A | Class T | Class C | Class R6 | Class S | Institutional Class | ||||||||||||||||||
| Beginning Account Value 7/1/20 | $ | 1,000.00 | $ | 1,000.00 | $ | 1,000.00 | $ | 1,000.00 | $ | 1,000.00 | $ | 1,000.00 | ||||||||||||
| Ending Account Value 12/31/20 | $ | 1,154.70 | $ | 1,154.50 | $ | 1,150.40 | $ | 1,156.00 | $ | 1,155.20 | $ | 1,155.80 | ||||||||||||
| Expenses Paid per $1,000* | $ | 6.73 | $ | 6.73 | $ | 10.79 | $ | 4.84 | $ | 5.65 | $ | 4.84 | ||||||||||||
| Hypothetical 5% Fund Return | Class A | Class T | Class C | Class R6 | Class S | Institutional Class | ||||||||||||||||||
| Beginning Account Value 7/1/20 | $ | 1,000.00 | $ | 1,000.00 | $ | 1,000.00 | $ | 1,000.00 | $ | 1,000.00 | $ | 1,000.00 | ||||||||||||
| Ending Account Value 12/31/20 | $ | 1,018.95 | $ | 1,018.95 | $ | 1,015.17 | $ | 1,020.72 | $ | 1,019.96 | $ | 1,020.72 | ||||||||||||
| Expenses Paid per $1,000* | $ | 6.31 | $ | 6.31 | $ | 10.11 | $ | 4.53 | $ | 5.30 | $ | 4.53 | ||||||||||||
| * | Expenses are equal to the Fund’s annualized expense ratio for each share class, multiplied by the average account value over the period, multiplied by 184 (the number of days in the most recent six-month period), then divided by 365. |
| Annualized Expense Ratios | Class A | Class T | Class C | Class R6 | Class S | Institutional Class | ||||||||||||||||||
| DWS Enhanced Commodity Strategy Fund | 1.24 | % | 1.24 | % | 1.99 | % | .89 | % | 1.04 | % | .89 | % | ||||||||||||
For more information, please refer to the Fund’s prospectus.
For an analysis of the fees associated with an investment in the Fund or
similar funds, please refer to tools.finra.org/fund_analyzer/.
| DWS Enhanced Commodity Strategy Fund | | | 61 |
Advisory Agreement Board Considerations and Fee Evaluation
The Board of Trustees (hereinafter referred to as the “Board” or “Trustees”) approved the renewal of DWS Enhanced Commodity Strategy Fund’s (the “Fund”) investment management agreement (the “Agreement”) with DWS Investment Management Americas, Inc. (“DIMA”) in September 2020.
In terms of the process that the Board followed prior to approving the Agreement, shareholders should know that:
| — | During the entire process, all of the Fund’s Trustees were independent of DIMA and its affiliates (the “Independent Trustees”). |
| — | The Board met frequently during the past year to discuss fund matters and dedicated a substantial amount of time to contract review matters. Over the course of several months, the Board reviewed extensive materials received from DIMA, independent third parties and independent counsel. These materials included an analysis of the Fund’s performance, fees and expenses, and profitability from a fee consultant retained by the Fund’s Independent Trustees (the “Fee Consultant”). |
| — | The Board also received extensive information throughout the year regarding performance of the Fund. |
| — | The Independent Trustees regularly met privately with counsel to discuss contract review and other matters. In addition, the Independent Trustees were advised by the Fee Consultant in the course of their review of the Fund’s contractual arrangements and considered a comprehensive report prepared by the Fee Consultant in connection with their deliberations. |
| — | In connection with reviewing the Agreement, the Board also reviewed the terms of the Fund’s Rule 12b-1 plan, distribution agreement, administrative services agreement, transfer agency agreement and other material service agreements. |
In connection with the contract review process, the Board considered the factors discussed below, among others. The Board also considered that DIMA and its predecessors have managed the Fund since its inception, and the Board believes that a long-term relationship with a capable, conscientious advisor is in the best interests of the Fund. The Board considered, generally, that shareholders chose to invest or remain invested in the Fund knowing that DIMA managed the Fund. DIMA is part of DWS Group GmbH & Co. KGaA (“DWS Group”). DWS Group is a global asset management business that offers a wide range of investing
| 62 | | | DWS Enhanced Commodity Strategy Fund |
expertise and resources, including research capabilities in many countries throughout the world. In 2018, approximately 20% of DWS Group’s shares were sold in an initial public offering, with Deutsche Bank AG owning the remaining shares.
As part of the contract review process, the Board carefully considered the fees and expenses of each DWS fund overseen by the Board in light of the fund’s performance. In many cases, this led to the negotiation and implementation of expense caps.
While shareholders may focus primarily on fund performance and fees, the Fund’s Board considers these and many other factors, including the quality and integrity of DIMA’s personnel and administrative support services provided by DIMA, such as back-office operations, fund valuations, and compliance policies and procedures.
Nature, Quality and Extent of Services. The Board considered the terms of the Agreement, including the scope of advisory services provided under the Agreement. The Board noted that, under the Agreement, DIMA provides portfolio management services to the Fund and that, pursuant to a separate administrative services agreement, DIMA provides administrative services to the Fund. The Board considered the experience and skills of senior management and investment personnel and the resources made available to such personnel. The Board also considered the risks to DIMA in sponsoring or managing the Fund, including financial, operational and reputational risks, the potential economic impact to DIMA from such risks and DIMA’s approach to addressing such risks. The Board reviewed the Fund’s performance over short-term and long-term periods and compared those returns to various agreed-upon performance measures, including market index(es) and a peer universe compiled using information supplied by Morningstar Direct (“Morningstar”), an independent fund data service. The Board also noted that it has put into place a process of identifying “Funds in Review” (e.g., funds performing poorly relative to a peer universe), and receives additional reporting from DIMA regarding such funds and, where appropriate, DIMA’s plans to address underperformance. The Board believes this process is an effective manner of identifying and addressing underperforming funds. Based on the information provided, the Board noted that, for the one-, three- and five-year periods ended December 31, 2019, the Fund’s performance (Class A shares) was in the 4th quartile, 4th quartile and 3rd quartile, respectively, of the applicable Morningstar universe (the 1st quartile being the best performers and the 4th quartile being the worst performers). The Board also observed that the Fund has outperformed its benchmark in the five-year period and has underperformed its benchmark in the one- and three-year periods ended December 31, 2019. The Board noted the disappointing investment performance of the Fund in recent periods and continued to discuss with senior management of DIMA the
| DWS Enhanced Commodity Strategy Fund | | | 63 |
factors contributing to such underperformance and actions being taken to improve performance. The Board observed that the Fund had experienced improved relative performance during the first eight months of 2020. The Board recognized the efforts by DIMA in recent years to enhance its investment platform and improve long-term performance across the DWS fund complex.
Fees and Expenses. The Board considered the Fund’s investment management fee schedule, operating expenses and total expense ratios, and comparative information provided by Broadridge Financial Solutions, Inc. (“Broadridge”) and the Fee Consultant regarding investment management fee rates paid to other investment advisors by similar funds (1st quartile being the most favorable and 4th quartile being the least favorable). With respect to management fees paid to other investment advisors by similar funds, the Board noted that the contractual fee rates paid by the Fund, which include a 0.10% fee paid to DIMA under the Fund’s administrative services agreement, were higher than the median (3rd quartile) of the applicable Broadridge peer group (based on Broadridge data provided as of December 31, 2019). The Board noted that, effective March 1, 2020, the fee paid to DIMA under the Fund’s administrative services agreement was reduced to 0.097%. The Board noted that, in connection with the 2018 contract renewal process, DIMA agreed to implement a new management fee breakpoint. The Board noted further that, in connection with the 2020 contract renewal process, DIMA agreed to reduce the Fund’s contractual management fee at each breakpoint by 0.10%, effective October 1, 2020, and further reduce the Fund’s expense caps. The Board noted that the Fund’s Class A shares total (net) operating expenses (excluding 12b-1 fees) were expected to be lower than the median (2nd quartile) of the applicable Broadridge expense universe (based on Broadridge data provided as of December 31, 2019, and analyzing Broadridge expense universe Class A (net) expenses less any applicable 12b-1 fees) (“Broadridge Universe Expenses”). The Board also reviewed data comparing each other operational share class’s total (net) operating expenses to the applicable Broadridge Universe Expenses. The Board noted that the expense limitations agreed to by DIMA were expected to help the Fund’s total (net) operating expenses remain competitive. The Board considered the Fund’s management fee rate as compared to fees charged by DIMA to comparable DWS U.S. registered funds (“DWS Funds”), noting that DIMA indicated that it does not provide services to any other comparable DWS Funds. The information requested by the Board as part of its review of fees and expenses also included information about institutional accounts (including any sub-advised funds and accounts) and funds offered primarily to European investors (“DWS Europe Funds”) managed by DWS Group. The Board noted that DIMA indicated that DWS Group manages a DWS Europe Fund comparable to the Fund, but does not manage any comparable institutional accounts.
| 64 | | | DWS Enhanced Commodity Strategy Fund |
The Board took note of the differences in services provided to DWS Funds as compared to DWS Europe Funds and that such differences made comparison difficult.
On the basis of the information provided, the Board concluded that management fees were reasonable and appropriate in light of the nature, quality and extent of services provided by DIMA.
Profitability. The Board reviewed detailed information regarding revenues received by DIMA under the Agreement. The Board considered the estimated costs to DIMA, and pre-tax profits realized by DIMA, from advising the DWS Funds, as well as estimates of the pre-tax profits attributable to managing the Fund in particular. The Board also received information regarding the estimated enterprise-wide profitability of DIMA and its affiliates with respect to all fund services in totality and by fund. The Board and the Fee Consultant reviewed DIMA’s methodology in allocating its costs to the management of the Fund. Based on the information provided, the Board concluded that the pre-tax profits realized by DIMA in connection with the management of the Fund were not unreasonable. The Board also reviewed certain publicly available information regarding the profitability of certain similar investment management firms. The Board noted that, while information regarding the profitability of such firms is limited (and in some cases is not necessarily prepared on a comparable basis), DIMA and its affiliates’ overall profitability with respect to the DWS Funds (after taking into account distribution and other services provided to the funds by DIMA and its affiliates) was lower than the overall profitability levels of most comparable firms for which such data was available.
Economies of Scale. The Board considered whether there are economies of scale with respect to the management of the Fund and whether the Fund benefits from any economies of scale. The Board noted that the Fund’s investment management fee schedule includes fee breakpoints. The Board concluded that the Fund’s fee schedule represents an appropriate sharing between the Fund and DIMA of such economies of scale as may exist in the management of the Fund at current asset levels.
Other Benefits to DIMA and Its Affiliates. The Board also considered the character and amount of other incidental or “fall-out” benefits received by DIMA and its affiliates, including any fees received by DIMA for administrative services provided to the Fund, any fees received by an affiliate of DIMA for transfer agency services provided to the Fund and any fees received by an affiliate of DIMA for distribution services. The Board also considered benefits to DIMA related to brokerage and soft-dollar allocations, including allocating brokerage to pay for research generated by parties other than the executing broker dealers, which pertain primarily to funds investing in equity securities. In addition, the
| DWS Enhanced Commodity Strategy Fund | | | 65 |
Board considered the incidental public relations benefits to DIMA related to DWS Funds advertising and cross-selling opportunities among DIMA products and services. The Board considered these benefits in reaching its conclusion that the Fund’s management fees were reasonable.
Compliance. The Board considered the significant attention and resources dedicated by DIMA to its compliance processes in recent years. The Board noted in particular (i) the experience, seniority and time commitment of the individuals serving as DIMA’s and the Fund’s chief compliance officers and (ii) the substantial commitment of resources by DIMA and its affiliates to compliance matters, including the retention of compliance personnel.
The Board also considered that on September 24, 2020, the SEC granted a temporary order permitting DIMA and its affiliates to continue providing investment advisory and underwriting services to the DWS Funds notwithstanding a consent order entered into by Deutsche Bank AG on June 17, 2020 (the “Consent Order”). The Board noted that the temporary order was granted effective as of the date of the Consent Order. The Board also noted various representations by DIMA to the Board relating to the Consent Order, including that the conduct giving rise to the Consent Order (unintentional conduct that resulted from a system outage that prevented Deutsche Bank AG from reporting data in accordance with applicable CFTC requirements for five days in April 2016) did not involve any DWS Fund or services DIMA and its affiliates provide to the DWS Funds, that DIMA and its personnel had no involvement in the alleged conduct giving rise to the Consent Order, and that the DWS Funds would not bear any financial impact or costs relating to the Consent Order.
Based on all of the information considered and the conclusions reached, the Board determined that the continuation of the Agreement is in the best interests of the Fund. In making this determination, the Board did not give particular weight to any single factor identified above. The Board considered these factors over the course of numerous meetings, certain of which were in executive session with only the Independent Trustees and counsel present. It is possible that individual Independent Trustees may have weighed these factors differently in reaching their individual decisions to approve the continuation of the Agreement.
| 66 | | | DWS Enhanced Commodity Strategy Fund |
| For More Information | The automated telephone system allows you to access personalized account information and obtain information on other DWS funds using either your voice or your telephone keypad. Certain account types within Classes A, T, C and S also have the ability to purchase, exchange or redeem shares using this system.
For more information, contact your financial representative. You may also access our automated telephone system or speak with a Shareholder Service representative by calling:
(800) 728-3337 | |
| Web Site | dws.com
View your account transactions and balances, trade shares, monitor your asset allocation, subscribe to fund and account updates by e-mail, and change your address, 24 hours a day.
Obtain prospectuses and applications, news about DWS funds, insight from DWS economists and investment specialists and access to DWS fund account information. | |
| Written Correspondence | DWS
PO Box 219151 Kansas City, MO 64121-9151 | |
| Proxy Voting | The Fund’s policies and procedures for voting proxies for portfolio securities and information about how the Fund voted proxies related to its portfolio securities during the most recent 12-month period ended June 30 are available on our Web site — dws.com/en-us/resources/proxy-voting — or on the SEC’s Web site — sec.gov. To obtain a written copy of the Fund’s policies and procedures without charge, upon request, call us toll free at (800) 728-3337. | |
| Portfolio Holdings | Following the Fund’s fiscal first and third quarter-end, a complete portfolio holdings listing is posted on dws.com, and is available free of charge by contacting your financial intermediary, or if you are a direct investor, by calling (800) 728-3337. In addition, the portfolio holdings listing is filed with the SEC on the Fund’s Form N-PORT and will be available on the SEC’s Web site at sec.gov. Additional portfolio holdings for the Fund are also posted on dws.com from time to time. Please see the Fund’s current prospectus for more information. | |
| Principal Underwriter | If you have questions, comments or complaints, contact:
DWS Distributors, Inc.
222 South Riverside Plaza Chicago, IL 60606-5808 (800) 621-1148 |
| DWS Enhanced Commodity Strategy Fund | | | 67 |
| Investment Management | DWS Investment Management Americas, Inc. (“DIMA” or the “Advisor”), which is part of the DWS Group GmbH & Co. KGaA (“DWS Group”) is the investment advisor for the Fund. DIMA and its predecessors have more than 90 years of experience managing mutual funds and DIMA provides a full range of investment advisory services to both institutional and retail clients. DIMA is an indirect, wholly owned subsidiary of DWS Group.
DWS Group is a global organization that offers a wide range of investing expertise and resources, including hundreds of portfolio managers and analysts and an office network that reaches the world’s major investment centers. This well-resourced global investment platform brings together a wide variety of experience and investment insight across industries, regions, asset classes and investing styles. | |||||||||
| Class A | Class T | Class C | Class S | Institutional Class | ||||||
| Nasdaq Symbol | SKNRX | SKSTX | SKCRX | SKSRX | SKIRX | |||||
| CUSIP Number | 25159L 877 | 25159L 380 | 25159L 851 | 25159L 844 | 25159L 836 | |||||
| Fund Number | 485 | 1785 | 785 | 2085 | 817 | |||||
| For shareholders of Class R6 | ||||||||||
| Automated Information Line | DWS/Ascensus Plan Access (800) 728-3337
24-hour access to your retirement plan account. | |||||||||
| Web Site | dws.com
Obtain prospectuses and applications, news about DWS funds, insight from DWS economists and investment specialists and access to DWS fund account information.
Log in/register to manage retirement account assets at https://www.mykplan.com/participantsecure_net/login.aspx. | |||||||||
| For More Information | (800) 728-3337
To speak with a service representative. | |||||||||
| Written Correspondence | DWS Service Company
222 South Riverside Plaza Chicago, IL 60606-5806 | |||||||||
| Class R6 | ||||||||||
| Nasdaq Symbol | SKRRX |
|
|
|
| |||||
| CUSIP Number | 25159L 448 |
|
|
|
| |||||
| Fund Number | 1685 |
|
|
|
| |||||
| 68 | | | DWS Enhanced Commodity Strategy Fund |
| Privacy Statement |
| FACTS | What Does DWS Do With Your Personal Information? | |
| Why? | Financial companies choose how they share your personal information. Federal law gives consumers the right to limit some but not all sharing. Federal law also requires us to tell you how we collect, share and protect your personal information. Please read this notice carefully to understand what we do. | |
| What? | The types of personal information we collect and share can include:
– Social Security number
– Account balances
– Purchase and transaction history
– Bank account information
– Contact information such as mailing address, e-mail address and telephone number | |
| How? | All financial companies need to share customers’ personal information to run their everyday business. In the section below, we list the reasons financial companies can share their customers’ personal information, the reasons DWS chooses to share and whether you can limit this sharing. | |
| Reasons we can share your personal information | Does DWS share? | Can you limit this sharing? | ||
| For our everyday business purposes — such as to process your transactions, maintain your account(s), respond to court orders or legal investigations | Yes | No | ||
| For our marketing purposes — to offer our products and services to you | Yes | No | ||
| For joint marketing with other financial companies | No | We do not share | ||
| For our affiliates’ everyday business purposes — information about your transactions and experiences | No | We do not share | ||
| For our affiliates’ everyday business purposes — information about your creditworthiness | No | We do not share | ||
| For non-affiliates to market to you | No | We do not share | ||
| Questions? | Call (800) 728-3337 or e-mail us at service@dws.com |
| DWS Enhanced Commodity Strategy Fund | | | 69 |
| ||
| Who we are | ||
| Who is providing this notice? | DWS Distributors, Inc; DWS Investment Management Americas, Inc.; DWS Trust Company; the DWS Funds | |
| What we do | ||
| How does DWS protect my personal information? | To protect your personal information from unauthorized access and use, we use security measures that comply with federal law. These measures include computer safeguards, secured files, and secured buildings. | |
| How does DWS collect my personal information? | We collect your personal information, for example, when you:
– open an account
– give us your contact information
– provide bank account information for ACH or wire transactions
– tell us where to send money
– seek advice about your investments | |
| Why can’t I limit all sharing? | Federal law gives you the right to limit only
– sharing for affiliates’ everyday business purposes
– information about your creditworthiness
– affiliates from using your information to market to you
– sharing for non-affiliates to market to you
State laws and individual companies may give you additional rights to limit sharing. | |
| Definitions | ||
| Affiliates | Companies related by common ownership or control. They can be financial or non-financial companies. Our affiliates include financial companies with the DWS or Deutsche Bank (“DB”) name, such as DB AG Frankfurt. | |
| Non-affiliates | Companies not related by common ownership or control. They can be financial and non-financial companies.
Non-affiliates we share with include account service providers, service quality monitoring services, mailing service providers and verification services to help in the fight against money laundering and fraud. | |
| Joint marketing | A formal agreement between non-affiliated financial companies that together market financial products or services to you. DWS does not jointly market. | |
California residents may go to https://fundsus.dws.com/us/en-us/legal-resources/privacy-policy.html to obtain additional information relating to their rights under California state law.
Rev. 12/2020
| 70 | | | DWS Enhanced Commodity Strategy Fund |
Notes
DECSF-3
(R-025782-10 2/21)
| (b) Not applicable | ||
| ITEM 2. | CODE OF ETHICS | |
| Not applicable. | ||
| ITEM 3. | AUDIT COMMITTEE FINANCIAL EXPERT | |
| Not applicable | ||
| ITEM 4. | PRINCIPAL ACCOUNTANT FEES AND SERVICES | |
| Not applicable | ||
| ITEM 5. | AUDIT COMMITTEE OF LISTED REGISTRANTS | |
| Not applicable | ||
| ITEM 6. | SCHEDULE OF INVESTMENTS | |
| Not applicable | ||
| ITEM 7. | DISCLOSURE OF PROXY VOTING POLICIES AND PROCEDURES FOR CLOSED-END MANAGEMENT INVESTMENT COMPANIES | |
| Not applicable | ||
| ITEM 8. | PORTFOLIO MANAGERS OF CLOSED-END MANAGEMENT INVESTMENT COMPANIES | |
| Not applicable | ||
| ITEM 9. | PURCHASES OF EQUITY SECURITIES BY CLOSED-END MANAGEMENT INVESTMENT COMPANY AND AFFILIATED PURCHASERS | |
| Not applicable | ||
| ITEM 10. | SUBMISSION OF MATTERS TO A VOTE OF SECURITY HOLDERS | |
| There were no material changes to the procedures by which shareholders may recommend nominees to the Fund’s Board. The primary function of the Nominating and Governance Committee is to identify and recommend individuals for membership on the Board and oversee the administration of the Board Governance Guidelines. Shareholders may recommend candidates for Board positions by forwarding their correspondence by U.S. mail or courier service to Keith R. Fox, DWS Funds Board Chair, c/o Thomas R. Hiller, Ropes & Gray LLP, Prudential Tower, 800 Boylston Street, Boston, MA 02199-3600. | ||
| ITEM 11. | CONTROLS AND PROCEDURES | |
| (a) | The Chief Executive and Financial Officers concluded that the Registrant’s Disclosure Controls and Procedures are effective based on the evaluation of the Disclosure Controls and Procedures as of a date within 90 days of the filing date of this report. | |
| (b) | There have been no changes in the registrant’s internal control over financial reporting that occurred during the period covered by this report that has materially affected, or is reasonably likely to materially affect, the registrant’s internal controls over financial reporting. | |
| ITEM 12. | Disclosure of Securities Lending Activities for Closed-End Management Investment Companies. | |
| Not applicable | ||
| ITEM 13. | EXHIBITS | |
| (a)(1) | Not applicable | |
| (a)(2) | Certification pursuant to Rule 30a-2(a) under the Investment Company Act of 1940 (17 CFR 270.30a-2(a)) is filed and attached hereto as Exhibit 99.CERT. | |
| (b) | Certification pursuant to Rule 30a-2(b) under the Investment Company Act of 1940 (17 CFR 270.30a-2(b)) is furnished and attached hereto as Exhibit 99.906CERT. | |
SIGNATURES
Pursuant to the requirements of the Securities Exchange Act of 1934 and the Investment Company Act of 1940, the registrant has duly caused this report to be signed on its behalf by the undersigned, thereunto duly authorized.
| Registrant: | DWS Enhanced Commodity Strategy Fund, a series of Deutsche DWS Securities Trust |
| By: | /s/Hepsen Uzcan Hepsen Uzcan President |
| Date: | 3/1/2021 |
Pursuant to the requirements of the Securities Exchange Act of 1934 and the Investment Company Act of 1940, this report has been signed below by the following persons on behalf of the registrant and in the capacities and on the dates indicated.
| By: | /s/Hepsen Uzcan Hepsen Uzcan President |
| Date: | 3/1/2021 |
| By: | /s/Diane Kenneally Diane Kenneally Chief Financial Officer and Treasurer |
| Date: | 3/1/2021 |