UNITED STATES
SECURITIES AND EXCHANGE COMMISSION
WASHINGTON, D. C. 20549
FORM N-CSRS
Investment Company Act file number | 811-642 |
DWS International Fund, Inc.
(Exact Name of Registrant as Specified in Charter)
345 Park Avenue
New York, NY 10154-0004
(Address of Principal Executive Offices) (Zip Code)
Registrant’s Telephone Number, including Area Code: (212) 454-7190
Paul Schubert
345 Park Avenue
New York, NY 10154-0004
(Name and Address of Agent for Service)
Date of fiscal year end: | 10/31 |
Date of reporting period: | 04/30/09 |
ITEM 1. REPORT TO STOCKHOLDERS
APRIL 30, 2009 Semiannual Report |
|
DWS Latin America Equity Fund |
 |
Contents
4 Performance Summary 9 Information About Your Fund's Expenses 11 Portfolio Management Review 17 Portfolio Summary 19 Investment Portfolio 22 Financial Statements 26 Financial Highlights 30 Notes to Financial Statements 37 Summary of Management Fee Evaluation by Independent Fee Consultant 42 Summary of Administrative Fee Evaluation by Independent Fee Consultant 43 Account Management Resources 44 Privacy Statement |
This report must be preceded or accompanied by a prospectus. To obtain a prospectus for any of our funds, refer to the Account Management Resources information provided in the back of this booklet. We advise you to consider the fund's objectives, risks, charges and expenses carefully before investing. The prospectus contains this and other important information about the fund. Please read the prospectus carefully before you invest.
Investments in mutual funds involve risk. Some funds have more risk than others. The fund may focus its investments in certain geographical regions, thereby increasing its vulnerability to developments in that region and potentially subjecting the fund's shares to greater shares price volatility. Additionally, investing in foreign securities presents certain risks, such as currency fluctuation and political and economic changes, and market risks. This fund is also "non-diversified" and can take larger positions in fewer companies, increasing its overall potential risk. All of these factors may result in greater share price volatility. Please read this fund's prospectus for specific details regarding its investments and risk profile.
DWS Investments is part of Deutsche Bank's Asset Management division and, within the US, represents the retail asset management activities of Deutsche Bank AG, Deutsche Bank Trust Company Americas, Deutsche Investment Management Americas Inc. and DWS Trust Company.
NOT FDIC/NCUA INSURED NO BANK GUARANTEE MAY LOSE VALUE NOT A DEPOSIT NOT INSURED BY ANY FEDERAL GOVERNMENT AGENCY
Performance Summary April 30, 2009
Classes A, B and C
All performance shown is historical, assumes reinvestment of all dividend and capital gain distributions, and does not guarantee future results. Investment return and principal value fluctuate with changing market conditions so that, when redeemed, shares may be worth more or less than their original cost. Current performance may be lower or higher than the performance quoted. Please visit www.dws-investments.com for the Fund's most recent month-end performance.
The maximum sales charge for Class A shares is 5.75%. For Class B shares, the maximum contingent deferred sales charge (CDSC) is 4% within the first year after purchase, declining to 0% after six years. Class C shares have no front-end sales charge, but redemptions within one year of purchase may be subject to a CDSC of 1%. Unadjusted returns do not reflect sales charges and would have been lower if they had.
The total annual fund operating expense ratios, gross of any fee waivers or expense reimbursements, as stated in the fee table of the prospectus dated March 1, 2009 are 1.70%, 2.50% and 2.49% for Class A, Class B and Class C shares, respectively. Please see the Information About Your Fund's Expenses, the Financial Highlights and Notes to the Financial Statements (Note C, Related Parties) sections of this report for gross and net expense related disclosure for the period ended April 30, 2009.
To discourage short-term trading, the Fund imposes a 2% redemption fee on shareholders redeeming shares held less than 15 days, which has the effect of lowering total return.
Returns and rankings during the 5-year and 10-year periods for Class A and the 3-year, 5-year and 10-year periods for Class B and Class C shares reflect a fee waiver and/or expense reimbursement. Without this waiver/reimbursement, returns and rankings would have been lower.
Performance figures do not reflect the deduction of taxes that a shareholder would pay on fund distributions or the redemption of fund shares. Returns and rankings may differ by share class.
Returns shown for Class A, B and C shares for the period prior to their inception on May 29, 2001 are derived from the historical performance of Class S shares of DWS Latin America Equity Fund during such period and have been adjusted to reflect the higher total annual operating expenses of each specific class. Any difference in expenses will affect performance.
Average Annual Total Returns (Unadjusted for Sales Charge) as of 4/30/09 | |||||
DWS Latin America Equity Fund | 6-Month‡ | 1-Year | 3-Year | 5-Year | 10-Year |
Class A | 13.13% | -52.48% | -6.24% | 17.62% | 10.11% |
Class B | 12.63% | -52.88% | -7.02% | 16.64% | 9.23% |
Class C | 12.64% | -52.88% | -7.00% | 16.68% | 9.23% |
| MSCI EM Latin America Index+ | 18.98% | -44.57% | 1.29% | 23.25% | 14.15% |
Sources: Lipper Inc. and Deutsche Investment Management Americas Inc.
‡ Total returns shown for periods less than one year are not annualized.Net Asset Value and Distribution Information | |||
| Class A | Class B | Class C |
Net Asset Value: 4/30/09 | $ 31.61 | $ 30.94 | $ 30.90 |
| 10/31/08 | $ 31.89 | $ 31.14 | $ 31.12 |
Distribution Information: Six Months as of 4/30/09:Income Dividends | $ .26 | $ — | $ — |
Capital Gain Distributions | $ 3.43 | $ 3.43 | $ 3.43 |
Class A Lipper Rankings — Latin American Funds Category as of 4/30/09 | ||||
Period | Rank |
| Number of Funds Tracked | Percentile Ranking (%) |
| 1-Year | 18 | of | 27 | 65 |
| 3-Year | 15 | of | 18 | 79 |
| 5-Year | 15 | of | 18 | 79 |
Source: Lipper Inc. Rankings are historical and do not guarantee future results. Rankings are based on total return unadjusted for sales charges with distributions reinvested. If sales charges had been included, rankings might have been less favorable. Rankings are for Class A shares; other share classes may vary.
Growth of an Assumed $10,000 Investment (Adjusted for Maximum Sales Charge) |
[] DWS Latin America Equity Fund — Class A [] MSCI EM Latin America Index+ |
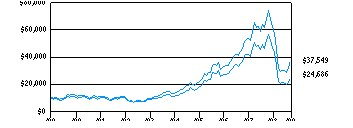 |
Yearly periods ended April 30 |
The Fund's growth of an assumed $10,000 investment is adjusted for the maximum sales charge of 5.75%. This results in a net initial investment of $9,425.
Comparative Results (Adjusted for Maximum Sales Charge) as of 4/30/09 | |||||
DWS Latin America Equity Fund | 1-Year | 3-Year | 5-Year | 10-Year | |
Class A | Growth of $10,000 | $4,479 | $7,769 | $21,221 | $24,686 |
| Average annual total return | -55.21% | -8.07% | 16.24% | 9.46% | |
Class B | Growth of $10,000 | $4,587 | $7,932 | $21,489 | $24,170 |
| Average annual total return | -54.13% | -7.43% | 16.53% | 9.23% | |
Class C | Growth of $10,000 | $4,712 | $8,042 | $21,628 | $24,172 |
| Average annual total return | -52.88% | -7.00% | 16.68% | 9.23% | |
| MSCI EM Latin America Index+ | Growth of $10,000 | $5,543 | $10,392 | $28,435 | $37,549 |
| Average annual total return | -44.57% | 1.29% | 23.25% | 14.15% | |
The growth of $10,000 is cumulative.
+ The Morgan Stanley Capital International (MSCI) EM (Emerging Markets) Latin America Index is an unmanaged free float-adjusted market capitalization index that is designed to measure equity market performance in seven Latin American markets. The index is calculated using closing market prices and translates into US dollars using the London close foreign exchange rates. Index returns assume reinvestment of dividends and, unlike Fund returns, do not reflect any fees or expenses. It is not possible to invest directly into an index.Class S
Class S shares are generally not available to new investors except under certain circumstances. (Please refer to the Fund's Statement of Additional Information.)
All performance shown is historical, assumes reinvestment of all dividend and capital gain distributions, and does not guarantee future results. Investment return and principal value fluctuate with changing market conditions so that, when redeemed, shares may be worth more or less than their original cost. Current performance may be lower or higher than the performance quoted. Please visit www.dws-investments.com for the Fund's most recent month-end performance.
The total annual fund operating expense ratio, gross of any fee waivers or expense reimbursements, as stated in the fee table of the prospectus dated March 1, 2009 is 1.44% for Class S shares. Please see the Information About Your Fund's Expenses, the Financial Highlights and Notes to the Financial Statements (Note C, Related Parties) sections of this report for gross and net expense related disclosure for the period ended April 30, 2009.
To discourage short-term trading, the Fund imposes a 2% redemption fee on shareholders redeeming shares held less than 15 days, which has the effect of lowering total return.
Returns and rankings for the 5-year and 10-year periods shown reflect a fee waiver and/or expense reimbursement. Without this waiver/reimbursement, returns and rankings would have been lower.
Performance figures do not reflect the deduction of taxes that a shareholder would pay on fund distributions or the redemption of fund shares. Returns and rankings may differ by share class.
Average Annual Total Returns as of 4/30/09 | |||||
DWS Latin America Equity Fund | 6-Month‡ | 1-Year | 3-Year | 5-Year | 10-Year |
Class S | 13.35% | -52.32% | -5.97% | 17.93% | 10.40% |
| MSCI EM Latin America Index+ | 18.98% | -44.57% | 1.29% | 23.25% | 14.15% |
Sources: Lipper Inc. and Deutsche Investment Management Americas Inc.
‡ Total returns shown for periods less than one year are not annualized.Net Asset Value and Distribution Information | |
| Class S |
Net Asset Value: 4/30/09 | $ 31.67 |
| 10/31/08 | $ 32.03 |
Distribution Information: Six Months as of 4/30/09:Income Dividends | $ .41 |
Capital Gain Distributions | $ 3.43 |
Class S Lipper Rankings — Latin American Funds Category as of 4/30/09 | ||||
Period | Rank |
| Number of Funds Tracked | Percentile Ranking (%) |
| 1-Year | 17 | of | 27 | 61 |
| 3-Year | 14 | of | 18 | 74 |
| 5-Year | 14 | of | 18 | 74 |
| 10-Year | 10 | of | 13 | 72 |
Source: Lipper Inc. Rankings are historical and do not guarantee future results. Rankings are based on total return with distributions reinvested. Rankings are for Class S shares; other share classes may vary.
Growth of an Assumed $10,000 Investment |
[] DWS Latin America Equity Fund — Class S [] MSCI EM Latin America Index+ |
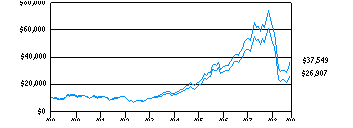 |
Yearly periods ended April 30 |
Comparative Results as of 4/30/09 | |||||
DWS Latin America Equity Fund | 1-Year | 3-Year | 5-Year | 10-Year | |
Class S | Growth of $10,000 | $4,768 | $8,315 | $22,807 | $26,907 |
| Average annual total return | -52.32% | -5.97% | 17.93% | 10.40% | |
| MSCI EM Latin America Index+ | Growth of $10,000 | $5,543 | $10,392 | $28,435 | $37,549 |
| Average annual total return | -44.57% | 1.29% | 23.25% | 14.15% | |
The growth of $10,000 is cumulative.
+ The Morgan Stanley Capital International (MSCI) EM (Emerging Markets) Latin America Index is an unmanaged free float-adjusted market capitalization index that is designed to measure equity market performance in seven Latin American markets. The index is calculated using closing market prices and translates into US dollars using the London close foreign exchange rates. Index returns assume reinvestment of dividends and, unlike Fund returns, do not reflect any fees or expenses. It is not possible to invest directly into an index.Information About Your Fund's Expenses
As an investor of the Fund, you incur two types of costs: ongoing expenses and transaction costs. Ongoing expenses include management fees, distribution and service (12b-1) fees and other Fund expenses. Examples of transaction costs include sales charges (loads), redemption fees and account maintenance fees, which are not shown in this section. The following tables are intended to help you understand your ongoing expenses (in dollars) of investing in the Fund and to help you compare these expenses with the ongoing expenses of investing in other mutual funds. The example in the table is based on an investment of $1,000 invested at the beginning of the six-month period and held for the entire period (November 1, 2008 to April 30, 2009).
The tables illustrate your Fund's expenses in two ways:
• Actual Fund Return. This helps you estimate the actual dollar amount of ongoing expenses (but not transaction costs) paid on a $1,000 investment in the Fund using the Fund's actual return during the period. To estimate the expenses you paid over the period, simply divide your account value by $1,000 (for example, an $8,600 account value divided by $1,000 = 8.6), then multiply the result by the number in the "Expenses Paid per $1,000" line under the share class you hold.
• Hypothetical 5% Fund Return. This helps you to compare your Fund's ongoing expenses (but not transaction costs) with those of other mutual funds using the Fund's actual expense ratio and a hypothetical rate of return of 5% per year before expenses. Examples using a 5% hypothetical fund return may be found in the shareholder reports of other mutual funds. The hypothetical account values and expenses may not be used to estimate the actual ending account balance or expenses you paid for the period.
Please note that the expenses shown in these tables are meant to highlight your ongoing expenses only and do not reflect any transaction costs. The "Expenses Paid per $1,000" line of the tables is useful in comparing ongoing expenses only and will not help you determine the relative total expense of owning different funds. An account maintenance fee of $6.25 per quarter for Class S shares may apply for certain accounts whose balances do not meet the applicable minimum initial investment. This fee is not included in these tables. If it was, the estimate of expenses paid for Class S shares during the period would be higher, and account value during the period would be lower, by this amount.
Expenses and Value of a $1,000 Investment for the six months ended April 30, 2009 | ||||
Actual Fund Return | Class A | Class B | Class C | Class S |
| Beginning Account Value 11/1/08 | $ 1,000.00 | $ 1,000.00 | $ 1,000.00 | $ 1,000.00 |
| Ending Account Value 4/30/09 | $ 1,131.30 | $ 1,126.30 | $ 1,126.40 | $ 1,133.50 |
| Expenses Paid per $1,000* | $ 10.83 | $ 15.34 | $ 15.87 | $ 8.46 |
Hypothetical 5% Fund Return | Class A | Class B | Class C | Class S |
| Beginning Account Value 11/1/08 | $ 1,000.00 | $ 1,000.00 | $ 1,000.00 | $ 1,000.00 |
| Ending Account Value 4/30/09 | $ 1,014.63 | $ 1,010.36 | $ 1,009.87 | $ 1,016.86 |
| Expenses Paid per $1,000* | $ 10.24 | $ 14.51 | $ 15.00 | $ 8.00 |
Annualized Expense Ratios | Class A | Class B | Class C | Class S |
| DWS Latin America Equity Fund | 2.05% | 2.91% | 3.01% | 1.61% |
For more information, please refer to the Fund's prospectus.
In the following interview, the portfolio management team discusses DWS Latin America Equity Fund's strategy and the market environment during the six-month period ended April 30, 2009.
The views expressed in the following discussion reflect those of the portfolio management team only through the end of the period of the report as stated on the cover. The management team's views are subject to change at any time based on market and other conditions and should not be construed as a recommendation. Past performance is no guarantee of future results. Current and future portfolio holdings are subject to risk.
Q: How did the Latin American stock markets perform during the semiannual period?
A: The asset class recovered from an early downturn to post a gain of 18.98% during the past six months, as gauged by the return of the fund's benchmark, the Morgan Stanley Capital International (MSCI) EM (Emerging Markets) Latin America Index.1 The region outpaced the return of emerging-markets equities, as measured by the 17.52% return of the MSCI Emerging Markets Index, as well as the developed markets, based on the -5.44% return of the MSCI World Index.2
The double-digit return of the Latin American markets obscures the negative environment that characterized the first four months of the period, when the ongoing global financial crisis led to heightened investor risk aversion and underperformance for all higher-risk asset classes. Beginning in early March, however, the investment picture began to improve. A slowdown in the pace of the global economic downturn, combined with the aggressive stimulus efforts of the world's governments and central banks, led to a massive relief rally in the markets. Stocks that had received the worst punishment in the prior year generally experienced the best performance as investors rushed to reestablish exposure to equities. Latin America, in particular, saw a surge in inflows, most notably via investor purchases of exchange-traded funds, or ETFs.
With this as the backdrop, the Latin markets returned 36.3% from the March 9 low through the end of the reporting period on April 30, 2009. The region gained an added benefit from the fact that Latin governments responded to the crisis with pro-growth policy reactions: from aggressive rate cutting in Chile, Brazil and Mexico to financial backstops put in place last year for Brazil and more recently for Mexico in the form of a lifeline from the International Monetary Fund. In this environment, economically sensitive sectors such as materials outperformed, while the more defensive areas of the market lagged.
For US dollar investors, the declining value of the major Latin American currencies dampened returns for the period. Since foreign shares are denominated in local currencies, a decline in the value of these currencies relative to the dollar decreases the value of the investment when it is measured in US dollar terms. For the full six-month period, the Brazilian real declined 3.3% versus the dollar, while the Mexican peso fell 6.7%. All of the weakness occurred in the first half of the period, when elevated risk aversion caused investors to seek safe havens in the developed-market currencies. This trend reversed sharply in March and April, when strong rallies in the currencies added significantly to equity returns for US dollar investors.
Q: How did the fund perform?
A: For the six months ended April 30, 2009, the total return of the fund's Class A shares was 13.13%. The fund trailed the 18.98% return of the MSCI EM Latin America Index and the 14.02% average return of the funds in its Lipper peer group, Latin America Funds.3 (Returns are unadjusted for sales charges. If sales charges had been included, returns would have been lower. Past performance is no guarantee of future results. Please see pages 4 through 8 for complete performance information.)
Q: What were the key factors affecting the fund's relative performance?
A: The key reason for the fund's underperformance was the fact that it held a defensive posture throughout the period.4 This approach helped during late 2008 and the first two months of 2009, when continued concerns about the global economy caused investors to flock to safer investments. Unfortunately, defensive issues underperformed sharply in March and April amid the stampede into the type of lower-quality stocks that had been beaten down in prior months. As we discuss below, however, we believe a defensive posture remains warranted despite the recent rally.
As would be expected at a time in which our market produced a double-digit gain, the fund was hurt by being underweight in the more aggressive areas of the market.5 Most notably, its performance was pressured by its below-benchmark weighting in the materials sector. While the index held an average weight of nearly 24% in this group, the fund's average weight was almost seven percentage points lower. Given that the sector comfortably outperformed the broader market, this underweight was a negative for performance. Similarly, an underweight in Mexico — which surged during the final two months of the period — was also a factor in our underperformance.
Among individual stocks, the leading contributor to performance was Petroleo Brasileiro SA ("Petrobras"). We liked Petrobras for the positive impact its oil production growth profile and exploratory successes are having on in its earnings results. The stock rose 25% during the period. Other top contributors to performance were Compania de Minas Buenaventura SA and Yamana Gold, Inc., which returned 68% and 70%, respectively. On the negative side, the largest individual detractor in the fund was an overweight in Fomento Economico Mexicano SAB de CV ("Femsa"), whose shares lagged due to fundamental concerns regarding the Mexican economy and its ties to the United States.6 For the same reason, the fund's positions in America Movil SAB de CV and Grupo Televisa SA also detracted from our performance relative to the benchmark.
Q: What is your overall view on the fundamental backdrop for the Latin markets, and how is this reflected in the fund's positioning?
A: We are staying the course in the sense that we are retaining a defensive bias in the fund. Although the March-April rebound in the markets was impressive, we do not think there has been enough improvement in the region's economies to justify a rally of that magnitude. Given that the rebound was largely driven by ETF inflows, we believe a defensive approach is warranted until we see a more meaningful recovery in economic fundamentals.7
We retain an overweight in Brazil on the belief that its economy is in better shape than Mexico's. We believe Brazil is better prepared than most emerging markets to withstand the crisis based on its successful monetary policy, solid trade balances and strong fiscal position as reflected in the lower debt/gross domestic product (GDP) ratio than the country has had in the past. In addition, Brazil's GDP growth drivers are largely domestic, meaning that is becoming less sensitive to broader global growth trends. Another reason for our positive view on Brazil is that its banking system has consolidated, is well capitalized and has high asset quality. Finally, its substantial international reserves (in excess of $200 billion) provide a firm foundation for the real.
Our favored positions in Brazil are banking stocks such as Banco Bradesco SA and Itau Unibanco Banco Multiplo SA. We also retain a focus on consumer stocks with staying power and strong franchises, such as Companhia de Bebidas das Americas ("Ambev"), the leading beer company in Latin America, and the cosmetics company Natura Cosmeticos SA. We continue to hold a large position in Petrobras on the strength of its large finds off the Brazilian coast and its continued exploration in that area.
In contrast to Brazil, the current economic crisis affecting Mexico is largely the result of external factors — namely, the slowdown in the United States. We therefore believe the Calderon administration can do little to fix the country's problems in the short term. Although the peso has stabilized and the Central Bank has boosted its reserves with the IMF lifeline, we not comfortable with the idea that the Mexican economy is out of the woods.
Our focus in Mexico therefore continues to be on the large, cash-rich companies with little or no debt. We continue to see opportunities in large-cap consumer stocks such as Wal-Mart de Mexico SAB de CV ("Walmex"), Grupo Televisa SA, America Movil SAB de CV and Fomento Economico Mexicano SAB de CV ("Femesa").
The fund remains underweight in Peru, where there are few stocks with sufficient liquidity, and in Chile, where both liquidity and valuations are an issue. The fund now has a zero weighting in Colombia, as we elected to sell the fund's position in Bancolombia SA.
Q: Do you have any closing thoughts for investors?
A: We continue to avoid the short-term temptations to follow the herd. Instead, we will continue with our process of investing in well-managed companies whose fundamentals should hold up in the current environment. We will also continue working to identify those stocks that we see as being undervalued from a longer-term perspective.
Over the long run, positive factors for the region's markets include the trend toward lower domestic real interest rates, the potential reacceleration of GDP growth in 2010 and attractive valuations relative to the rest of the emerging markets. Although valuations expanded during the March-April rally, Latin America currently trades below the historical average for the asset class with price-to-earnings ratios of 11.8 based on expected 2009 earnings and 10.5 for 2010. At the same time, however, estimated earnings growth for 2009 is well below the other emerging-markets regions due to Latin America's higher exposure to commodity prices.
We believe Latin American equities continue to represent a compelling long-term opportunity. Many companies in the region have extremely strong balance sheets and are generating robust cash flows. They have home-grown advantages that can help them to emerge stronger once the broader world economy stabilizes. Brazilian banks, for example, have little or no exposure to the problems facing US and European banks, and they have much stronger capital levels to ride out this crisis. While past-due loans will likely rise given the dramatic slowdown in the economy since November, the banks are well prepared to face them and poised to begin to lend again once the environment improves. Despite these positive factors, we expect volatility to remain in place in the near term. We will therefore look to be agile in moving among sectors and companies in order to take advantage of opportunities as they present themselves.
1 The Morgan Stanley Capital International (MSCI) (EM) Emerging Markets Latin America Index is an unmanaged, free float-adjusted market-capitalization index that is designed to measure equity market performance in seven Latin American markets. The index is calculated using closing market prices and translates into US dollars using the London close foreign exchange rates.2 The Morgan Stanley Capital International (MSCI) Emerging Markets Index is an unmanaged capitalization-weighted index of companies in a universe of 26 emerging markets. The index is calculated using closing local market prices and translates into US dollars using the London close foreign exchange rates.
MSCI World Index measures stock markets around the world, including North America, Europe, Australia and Asia.
Index returns assume reinvestment of dividends and, unlike fund returns, do not reflect any fees or expenses. It is not possible to invest directly into an index.
3 The Lipper Latin America Funds category consists of funds which concentrate their investments in equity securities with primary trading markets or operations concentrated in the Latin American region or in a single country within this region. It is not possible to invest directly into a Lipper category.
4 Defensive stocks are those that tend to perform better when economic growth is slowing and/or the markets are not performing well.
5 "Underweight" means the fund holds a lower weighting in a given sector or security than the benchmark.
6 "Overweight" means the fund holds a higher weighting in a given sector or security than the benchmark.
7 An exchange-traded fund (ETF) is a security that tracks an index, a commodity or a basket of assets like an index fund, but trades like a stock on an exchange.
Asset Allocation (As a % of Investment Portfolio) | 4/30/09 | 10/31/08 |
|
|
|
| Equity Securities | 97% | 97% |
| Cash Equivalents | 3% | 2% |
Exchange Traded Funds | — | 1% |
| 100% | 100% |
Geographical Diversification (As a % of Equity Securities) | 4/30/09 | 10/31/08 |
|
|
|
Brazil | 68% | 63% |
Mexico | 19% | 24% |
Peru | 6% | 4% |
Chile | 5% | 1% |
Canada | 1% | 1% |
Argentina | 1% | 4% |
United States | — | 1% |
Colombia | — | 1% |
Bermuda | — | 1% |
| 100% | 100% |
Sector Diversification (As a % of Equity Securities) | 4/30/09 | 10/31/08 |
|
|
|
Energy | 23% | 21% |
Materials | 17% | 19% |
Telecommunication Services | 14% | 15% |
Financials | 14% | 18% |
Consumer Staples | 12% | 9% |
Utilities | 7% | 2% |
Consumer Discretionary | 7% | 8% |
Information Technology | 4% | 3% |
Industrials | 2% | 4% |
Health Care | — | 1% |
| 100% | 100% |
Asset allocation, geographical diversification and sector diversification are subject to change.
Ten Largest Equity Holdings at April 30, 2009 (66.0% of Net Assets) | Country | Percent |
| 1. Petroleo Brasileiro SA Producer and distributor of petroleum | Brazil | 21.1% |
| 2. Companhia Vale do Rio Doce Operator of diverse mining and industrial complex | Brazil | 11.7% |
| 3. America Movil SAB de CV Provider of wireless communication services | Mexico | 7.8% |
| 4. Banco Bradesco SA Provider of banking services | Brazil | 5.1% |
| 5. Itau Unibanco Banco Multiplo SA Attracts deposits and offers retail, commercial, corporate and private banking services | Brazil | 4.5% |
| 6. Companhia de Bebidas das Americas Produces beer, soft drinks, teas, mineral water, fruit juices and sports drinks | Brazil | 3.9% |
| 7. Wal-Mart de Mexico SAB de CV Retailer of food, clothing and other merchandise | Mexico | 3.3% |
| 8. Vivo Participacoes SA Provider of cellular telecommunications services | Brazil | 3.0% |
| 9. Credicorp Ltd. Provider of a full range of financial services | Peru | 2.8% |
| 10. Compania de Minas Buenaventura SA Explores for mines and processes metals | Brazil | 2.8% |
Portfolio holdings are subject to change.
For more complete details about the Fund's investment portfolio, see page 19. A quarterly Fact Sheet is available upon request. A complete list of the Fund's portfolio holdings is posted as of the month end on www.dws-investments.com on or about the 15th day of the following month. More frequent posting of portfolio holdings information may be made from time to time on www.dws-investments.com. Please see the Account Management Resources section for contact information.
Following the Fund's fiscal first and third quarter-end, a complete portfolio holdings listing is filed with the SEC on Form N-Q. The form will be available on the SEC's Web site at www.sec.gov, and it also may be reviewed and copied at the SEC's Public Reference Room in Washington, D.C. Information on the operation of the SEC's Public Reference Room may be obtained by calling (800) SEC-0330.
Investment Portfolio as of April 30, 2009 (Unaudited)
|
| Value ($) |
|
| |
Equity Securities 96.7% | ||
Argentina 1.3% | ||
Nortel Inversora SA "A" (ADR) (Preferred)* | 33,663 | 119,571 |
Telecom Argentina SA "B"* | 893,275 | 1,635,727 |
Tenaris SA | 197,070 | 2,520,755 |
Tenaris SA (ADR) | 93,500 | 2,339,370 |
(Cost $7,756,635) | 6,615,423 | |
Brazil 65.6% | ||
Banco Bradesco SA (ADR) (Preferred) | 2,106,900 | 25,872,732 |
Braskem SA "A" (Preferred)* | 52 | 147 |
Companhia de Bebidas das Americas (ADR) (Preferred) | 348,873 | 19,669,460 |
Companhia Energetica de Minas Gerais (ADR) (Preferred) | 314,300 | 4,730,215 |
Companhia Paranaense de Energia (ADR) (Preferred) | 443,600 | 5,562,744 |
Companhia Vale do Rio Doce "A" (ADR) (Preferred) | 3,655,300 | 50,187,269 |
Companhia Vale do Rio Doce "A" (Preferred) | 9,156 | 127,493 |
Companhia Vale do Rio Doce (ADR) | 556,355 | 9,185,421 |
EDP — Energias do Brasil SA | 509,700 | 6,128,648 |
Equatorial Energia SA | 777,400 | 4,840,660 |
GVT Holding SA* | 728,200 | 9,647,456 |
Itau Unibanco Banco Multiplo SA (ADR) (Preferred) | 1,664,119 | 22,848,354 |
Lupatech SA* | 589,500 | 7,422,106 |
Natura Cosmeticos SA | 474,800 | 5,639,599 |
Net Servicos de Comunicacao SA (Preferred)* | 1,012,253 | 8,277,635 |
Perdigao SA* | 254,600 | 3,751,045 |
Petroleo Brasileiro SA (ADR) | 357,800 | 12,011,346 |
Petroleo Brasileiro SA (ADR) (Preferred) | 2,696,600 | 72,754,268 |
Petroleo Brasileiro SA (Preferred) | 1,691,476 | 22,826,561 |
Redecard SA | 846,100 | 10,648,966 |
Totvs SA | 349,000 | 9,335,046 |
Totvs SA (Units)* | 1,094 | 0 |
Tractebel Energia SA | 586,500 | 4,846,975 |
Usinas Siderurgicas de Minas Gerais SA "A" (Preferred) | 148,275 | 2,181,162 |
Vivo Participacoes SA (ADR) | 952,100 | 15,195,516 |
(Cost $193,662,615) | 333,690,824 | |
Canada 1.6% | ||
Yamana Gold, Inc. (a) (Cost $14,888,920) | 1,037,200 | 8,204,252 |
Chile 4.5% | ||
Banco Santander Chile (ADR) | 155,900 | 5,520,419 |
Compania Cervecerias Unidas SA | 192,493 | 1,138,248 |
Empresa Nacional de Electricidad SA (ADR) | 125,800 | 4,824,430 |
Empresa Nacional de Telecomunicaciones SA | 307,840 | 3,598,302 |
Enersis SA (ADR) | 387,800 | 5,813,122 |
S.A.C.I. Falabella SA* | 672,669 | 2,214,171 |
(Cost $22,372,909) | 23,108,692 | |
Mexico 18.2% | ||
America Movil SAB de CV "L" (ADR) | 1,211,900 | 39,810,915 |
Corporacion GEO SAB de CV "B"* | 4,019,900 | 5,241,069 |
Desarrolladora Homex SAB de CV* | 223,200 | 692,104 |
Desarrolladora Homex SAB de CV (ADR)* | 59,200 | 1,100,528 |
Empresas ICA SAB de CV* | 1,313,200 | 2,387,463 |
Fomento Economico Mexicano SAB de CV (ADR) (Units) | 270,700 | 7,663,517 |
Genomma Lab Internacional SA de CV "B"* | 2,438,500 | 1,790,989 |
Grupo Televisa SA (ADR) | 661,400 | 10,238,472 |
Kimberly-Clark de Mexico SAB de CV "A" | 731,400 | 2,667,390 |
Urbi, Desarrollos Urbanos, SAB de CV* | 3,877,300 | 4,268,793 |
Wal-Mart de Mexico SAB de CV "V" | 6,294,829 | 17,098,080 |
(Cost $61,191,550) | 92,959,320 | |
Peru 5.5% | ||
Compania de Minas Buenaventura SA (ADR) | 665,500 | 14,081,980 |
Credicorp Ltd. | 282,600 | 14,135,652 |
(Cost $26,020,347) | 28,217,632 | |
Total Equity Securities (Cost $325,892,976) | 492,796,143 | |
| ||
Cash Equivalents 3.4% | ||
Cash Management QP Trust, 0.46% (b) (Cost $17,301,938) | 17,301,938 | 17,301,938 |
| % of Net Assets | Value ($) |
|
| |
Total Investment Portfolio (Cost $343,194,914)+ | 100.1 | 510,098,081 |
Other Assets and Liabilities, Net | (0.1) | (574,022) |
Net Assets | 100.0 | 509,524,059 |
+ The cost for federal income tax purposes was $347,710,032. At April 30, 2009, net unrealized appreciation for all securities based on tax cost was $162,388,049. This consisted of aggregate gross unrealized appreciation for all securities in which there was an excess of value over tax cost of $202,694,216 and aggregate gross unrealized depreciation for all securities in which there was an excess of tax cost over value of $40,306,167.
(a) Security is listed in country of domicile. Significant business activities of company are in Latin America.
(b) Affiliated fund managed by Deutsche Investment Management Americas Inc. The rate shown is the annualized seven-day yield at period end.
ADR: American Depositary Receipt
Fair Value Measurements
Financial Accounting Standards Board Statement of Financial Accounting Standards No. 157, "Fair Value Measurements," establishes a three-tier hierarchy for measuring fair value and requires additional disclosure about the classification of fair value measurements.
Various inputs are used in determining the value of the Fund's investments. These inputs are summarized in three broad levels. Level 1 includes quoted prices in active markets for identical securities. Level 2 includes other significant observable inputs (including quoted prices for similar securities, interest rates, prepayment speeds and credit risk). Level 3 includes significant unobservable inputs (including the Fund's own assumptions in determining the fair value of investments). The inputs or methodology used for valuing securities are not necessarily an indication of the risk associated with investing in those securities.
The following is a summary of the inputs used as of April 30, 2009 in valuing the Fund's investments. For information on the Fund's policy regarding the valuation of investments, please refer to the Security Valuation section of Note A in the accompanying Notes to the Financial Statements.
Valuation Inputs | Investments in Securities |
| Level 1 | $ 484,472,320 |
| Level 2 | 25,506,190 |
| Level 3 | 119,571 |
Total | $ 510,098,081 |
The following is a reconciliation of the Fund's Level 3 investments for which significant unobservable inputs were used in determining value at April 30, 2009:
| Investments in Securities |
Balance as of October 31, 2008 | $ 91,294 |
| Total realized gain (loss) | — |
| Change in unrealized appreciation (depreciation) | 28,277 |
| Net purchases (sales) | — |
| Net transfers in (out) of Level 3 | — |
Balance as of April 30, 2009 | $ 119,571 |
Net change in unrealized appreciation (depreciation) from investments still held as of April 30, 2009 | $ 28,277 |
The accompanying notes are an integral part of the financial statements.
Statement of Assets and Liabilities as of April 30, 2009 (Unaudited) | |
Assets | |
| Investments: Investments in securities, at value (cost $325,892,976) | $ 492,796,143 |
Investment in Cash Management QP Trust (cost $17,301,938) | 17,301,938 |
| Total investments, at value (cost $343,194,914) | 510,098,081 |
| Foreign currency, at value (cost $5,387,482) | 4,643,959 |
| Receivable for investments sold | 1,281,514 |
| Receivable for Fund shares sold | 196,967 |
| Dividends receivable | 7,088,964 |
| Interest receivable | 3,690 |
| Other assets | 46,143 |
| Total assets | 523,359,318 |
Liabilities | |
| Payable for investments purchased | 12,504,827 |
| Payable for Fund shares redeemed | 271,799 |
| Accrued management fee | 463,461 |
| Other accrued expenses and payables | 595,172 |
| Total liabilities | 13,835,259 |
Net assets, at value | $ 509,524,059 |
Net Assets Consist of | |
| Undistributed net investment income | 3,096,011 |
| Net unrealized appreciation (depreciation) on: Investments | 166,903,167 |
Foreign currency | (704,762) |
| Accumulated net realized gain (loss) | (130,605,535) |
| Paid-in capital | 470,835,178 |
Net assets, at value | $ 509,524,059 |
The accompanying notes are an integral part of the financial statements.
Statement of Assets and Liabilities as of April 30, 2009 (Unaudited) (continued) | |
Net Asset Value | |
Class A Net Asset Value and redemption price(a) per share ($35,871,213 ÷ 1,134,658 shares of capital stock outstanding, $.01 par value, 50,000,000 shares authorized) | $ 31.61 |
| Maximum offering price per share (100 ÷ 94.25 of $31.61) | $ 33.54 |
Class B Net Asset Value, offering and redemption price(a) (subject to contingent deferred sales charge) per share ($3,932,407 ÷ 127,090 shares of capital stock outstanding, $.01 par value, 50,000,000 shares authorized) | $ 30.94 |
Class C Net Asset Value, offering and redemption price(a) (subject to contingent deferred sales charge) per share ($8,230,473 ÷ 266,340 shares of capital stock outstanding, $.01 par value, 20,000,000 shares authorized) | $ 30.90 |
Class S Net Asset Value, offering and redemption price(a) per share ($461,489,966 ÷ 14,573,151 shares of capital stock outstanding, $.01 par value, 100,000,000 shares authorized) | $ 31.67 |
The accompanying notes are an integral part of the financial statements.
Statement of Operations for the six months ended April 30, 2009 (Unaudited) | |
Investment Income | |
| Income: Dividends (net of foreign taxes withheld of $785,514) | $ 9,518,212 |
| Interest — Cash Management QP Trust | 55,901 |
| Total Income | 9,574,113 |
| Expenses: Management fee | 2,583,572 |
| Services to shareholders | 635,744 |
| Administration fee | 224,008 |
| Custodian fee | 10,386 |
| Distribution and service fees | 97,359 |
| Professional fees | 87,818 |
| Reports to shareholders | 51,710 |
| Registration fees | 35,549 |
| Directors' fees and expenses | 1,013 |
| Other | 20,312 |
| Total expenses | 3,747,471 |
Net investment income (loss) | 5,826,642 |
Realized and Unrealized Gain (Loss) | |
| Net realized gain (loss) from: Investments (net of foreign taxes of $423) | (125,671,526) |
| Foreign currency | (498,345) |
| | (126,169,871) |
| Change in net unrealized appreciation (depreciation) on: Investments | 176,707,702 |
| Foreign currency | (156,522) |
| | 176,551,180 |
Net gain (loss) | 50,381,309 |
Net increase (decrease) in net assets resulting from operations | $ 56,207,951 |
The accompanying notes are an integral part of the financial statements.
Statement of Changes in Net Assets | ||
Increase (Decrease) in Net Assets | Six Months Ended April 30, 2009 (Unaudited) | Year Ended October 31, 2008 |
| Operations: Net investment income (loss) | $ 5,826,642 | $ 5,920,970 |
| Net realized gain (loss) | (126,169,871) | 49,693,820 |
| Change in net unrealized appreciation (depreciation) | 176,551,180 | (755,703,852) |
| Net increase (decrease) in net assets resulting from operations | 56,207,951 | (700,089,062) |
| Distributions to shareholders from: Net investment income: Class A | (292,434) | (393,019) |
Class S | (5,605,251) | (5,934,319) |
| Net realized gains: Class A | (3,725,860) | (17,100,064) |
Class B | (450,112) | (1,860,108) |
Class C | (967,323) | (4,011,236) |
Class S | (45,152,910) | (152,749,837) |
| Total distributions | (56,193,890) | (182,048,583) |
| Fund share transactions: Proceeds from shares sold | 26,386,094 | 238,670,734 |
| Reinvestment of distributions | 52,675,384 | 170,841,959 |
| Cost of shares redeemed | (53,009,716) | (344,537,791) |
| Redemption fees | 30,693 | 97,412 |
| Net increase (decrease) in net assets from Fund share transactions | 26,082,455 | 65,072,314 |
Increase (decrease) in net assets | 26,096,516 | (817,065,331) |
| Net assets at beginning of period | 483,427,543 | 1,300,492,874 |
| Net assets at end of period (including undistributed net investment income of $3,096,011 and $3,167,054, respectively) | $ 509,524,059 | $ 483,427,543 |
The accompanying notes are an integral part of the financial statements.
Class A Years Ended October 31, | 2009a | 2008 | 2007 | 2006 | 2005 | 2004 |
Selected Per Share Data | ||||||
Net asset value, beginning of period | $ 31.89 | $ 87.06 | $57.68 | $ 44.84 | $ 27.80 | $ 21.59 |
Income (loss) from investment operations: Net investment income (loss)b | .31 | .21 | .28 | .34 | .47 | .54 |
Net realized and unrealized gain (loss) | 3.10 | (43.52) | 36.24 | 15.72 | 16.99 | 6.05 |
Total from investment operations | 3.41 | (43.31) | 36.52 | 16.06 | 17.46 | 6.59 |
Less distributions from: Net investment income | (.26) | (.26) | (.27) | (.47) | (.42) | (.38) |
Net realized gains | (3.43) | (11.61) | (6.87) | (2.76) | — | — |
Total distributions | (3.69) | (11.87) | (7.14) | (3.23) | (.42) | (.38) |
| Redemption fees | .00*** | .01 | .00*** | .01 | .00*** | — |
Net asset value, end of period | $ 31.61 | $ 31.89 | $ 87.06 | $ 57.68 | $ 44.84 | $ 27.80 |
| Total Return (%)c | 13.13** | (57.20) | 70.34 | 37.66 | 63.44 | 30.85d |
Ratios to Average Net Assets and Supplemental Data | ||||||
| Net assets, end of period ($ millions) | 36 | 37 | 120 | 51 | 32 | 9 |
| Ratio of expenses before expense reductions (%) | 2.05* | 1.70 | 1.68 | 1.82 | 1.81 | 1.99 |
| Ratio of expenses after expense reductions (%) | 2.05* | 1.70 | 1.68 | 1.82 | 1.81 | 1.91 |
| Ratio of net investment income (%) | 1.10e | .32 | .44 | .65 | 1.40 | 2.24 |
| Portfolio turnover rate (%) | 37** | 37 | 62 | 70 | 73 | 62 |
| a For the six months ended April 30, 2009 (Unaudited). b Based on average shares outstanding during the period. c Total return does not reflect the effect of any sales charges. d Total return would have been lower had certain expenses not been reduced. e The ratio for the six months ended April 30, 2009 has not been annualized since the Fund believes it would not be appropriate because the Fund's dividend income is not earned ratably throughout the fiscal year. * Annualized ** Not annualized *** Amount is less than $.005. | ||||||
Class B Years Ended October 31, | 2009a | 2008 | 2007 | 2006 | 2005 | 2004 |
Selected Per Share Data | ||||||
Net asset value, beginning of period | $ 31.14 | $ 85.63 | $ 56.99 | $ 44.28 | $ 27.71 | $ 21.51 |
Income (loss) from investment operations: Net investment income (loss)b | .20 | (.30) | (.20) | (.09) | .15 | .34 |
Net realized and unrealized gain (loss) | 3.03 | (42.59) | 35.71 | 15.57 | 16.84 | 6.04 |
Total from investment operations | 3.23 | (42.89) | 35.51 | 15.48 | 16.99 | 6.38 |
Less distributions from: Net investment income | — | — | — | (.02) | (.42) | (.18) |
Net realized gains | (3.43) | (11.61) | (6.87) | (2.76) | — | — |
Total distributions | (3.43) | (11.61) | (6.87) | (2.78) | (.42) | (.18) |
| Redemption fees | .00*** | .01 | .00*** | .01 | .00*** | — |
Net asset value, end of period | $ 30.94 | $ 31.14 | $ 85.63 | $ 56.99 | $ 44.28 | $ 27.71 |
| Total Return (%)c | 12.63** | (57.55) | 69.01 | 36.52d | 61.94 | 29.82d |
Ratios to Average Net Assets and Supplemental Data | ||||||
| Net assets, end of period ($ millions) | 4 | 4 | 14 | 8 | 4 | .4 |
| Ratio of expenses before expense reductions (%) | 2.91* | 2.50 | 2.47 | 2.68 | 2.73 | 3.09 |
| Ratio of expenses after expense reductions (%) | 2.91* | 2.50 | 2.47 | 2.67 | 2.73 | 2.76 |
| Ratio of net investment income (loss) (%) | .64e | (.48) | (.35) | (.20) | .48 | 1.39 |
| Portfolio turnover rate (%) | 37** | 37 | 62 | 70 | 73 | 62 |
| a For the six months ended April 30, 2009 (Unaudited). b Based on average shares outstanding during the period. c Total return does not reflect the effect of any sales charges. d Total return would have been lower had certain expenses not been reduced. e The ratio for the six months ended April 30, 2009 has not been annualized since the Fund believes it would not be appropriate because the Fund's dividend income is not earned ratably throughout the fiscal year. * Annualized ** Not annualized *** Amount is less than $.005. | ||||||
Class C Years Ended October 31, | 2009a | 2008 | 2007 | 2006 | 2005 | 2004 |
Selected Per Share Data | ||||||
Net asset value, beginning of period | $ 31.12 | $ 85.56 | $ 56.96 | $ 44.29 | $ 27.62 | $ 21.45 |
Income (loss) from investment operations: Net investment income (loss)b | .19 | (.30) | (.23) | (.07) | .17 | (.07)e |
Net realized and unrealized gain (loss) | 3.02 | (42.54) | 35.70 | 15.57 | 16.86 | 6.43 |
Total from investment operations | 3.21 | (42.84) | 35.47 | 15.50 | 17.03 | 6.36 |
Less distributions from: Net investment income | — | — | — | (.08) | (.36) | (.19) |
Net realized gains | (3.43) | (11.61) | (6.87) | (2.76) | — | — |
Total distributions | (3.43) | (11.61) | (6.87) | (2.84) | (.36) | (.19) |
| Redemption fees | .00*** | .01 | .00*** | .01 | .00*** | — |
Net asset value, end of period | $ 30.90 | $ 31.12 | $ 85.56 | $ 56.96 | $ 44.29 | $ 27.62 |
| Total Return (%)c | 12.64** | (57.55) | 68.97 | 36.61d | 62.19 | 29.77d |
Ratios to Average Net Assets and Supplemental Data | ||||||
| Net assets, end of period ($ millions) | 8 | 9 | 29 | 14 | 6 | .5 |
| Ratio of expenses before expense reductions (%) | 3.01* | 2.49 | 2.48 | 2.62 | 2.60 | 2.92 |
| Ratio of expenses after expense reductions (%) | 3.01* | 2.49 | 2.48 | 2.62 | 2.60 | 2.72 |
| Ratio of net investment income (loss) (%) | .60f | (.47) | (.36) | (.15) | .61 | (6.62)e |
| Portfolio turnover rate (%) | 37** | 37 | 62 | 70 | 73 | 62 |
| a For the six months ended April 30, 2009 (Unaudited). b Based on average shares outstanding during the period. c Total return does not reflect the effect of any sales charges. d Total return would have been lower had certain expenses not been reduced. e The amount shown does not correspond to the net investment income per share and ratio of net investment income (loss) of other classes during the year due to the timing of subscriptions and redemptions of this class in relation to the operating results of the Fund. f The ratio for the six months ended April 30, 2009 has not been annualized since the Fund believes it would not be appropriate because the Fund's dividend income is not earned ratably throughout the fiscal year. * Annualized ** Not annualized *** Amount is less than $.005. | ||||||
Class S Years Ended October 31, | 2009a | 2008 | 2007 | 2006 | 2005 | 2004 |
Selected Per Share Data | ||||||
Net asset value, beginning of period | $ 32.03 | $ 87.36 | $ 57.90 | $ 44.98 | $ 27.84 | $ 21.62 |
Income (loss) from investment operations: Net investment income (loss)b | .38 | .39 | .44 | .49 | .58 | .59 |
Net realized and unrealized gain (loss) | 3.10 | (43.66) | 36.34 | 15.76 | 16.99 | 6.06 |
Total from investment operations | 3.48 | (43.27) | 36.78 | 16.25 | 17.57 | 6.65 |
Less distributions from: Net investment income | (.41) | (.45) | (.45) | (.58) | (.43) | (.43) |
Net realized gains | (3.43) | (11.61) | (6.87) | (2.76) | — | — |
Total distributions | (3.84) | (12.06) | (7.32) | (3.34) | (.43) | (.43) |
| Redemption fees | .00*** | .00*** | .00*** | .01 | .00*** | — |
Net asset value, end of period | $ 31.67 | $ 32.03 | $ 87.36 | $ 57.90 | $ 44.98 | $ 27.84 |
| Total Return (%) | 13.35** | (57.08) | 70.72 | 38.06 | 63.76 | 31.09c |
Ratios to Average Net Assets and Supplemental Data | ||||||
| Net assets, end of period ($ millions) | 461 | 433 | 1,137 | 718 | 543 | 351 |
| Ratio of expenses before expense reductions (%) | 1.61* | 1.44 | 1.45 | 1.54 | 1.60 | 1.81 |
| Ratio of expenses after expense reductions (%) | 1.61* | 1.44 | 1.45 | 1.54 | 1.60 | 1.75 |
| Ratio of net investment income (%) | 1.32d | .58 | .67 | .93 | 1.61 | 2.40 |
| Portfolio turnover rate (%) | 37** | 37 | 62 | 70 | 73 | 62 |
| a For the six months ended April 30, 2009 (Unaudited). b Based on average shares outstanding during the period. c Total return would have been lower had certain expenses not been reduced. d The ratio for the six months ended April 30, 2009 has not been annualized since the Fund believes it would not be appropriate because the Fund's dividend income is not earned ratably throughout the fiscal year. * Annualized ** Not annualized *** Amount is less than $.005. | ||||||
Notes to Financial Statements (Unaudited)
A. Significant Accounting Policies
DWS Latin America Equity Fund (the "Fund") is a non-diversified series of DWS International Fund, Inc. (the "Corporation") which is registered under the Investment Company Act of 1940, as amended (the "1940 Act"), as an open-end management investment company organized as a Maryland corporation.
The Fund offers multiple classes of shares, which provide investors with different purchase options. Class A shares are offered to investors subject to an initial sales charge. Class B shares are offered to investors without an initial sales charge, but are subject to higher ongoing expenses than Class A shares and a contingent deferred sales charge payable upon certain redemptions. Class B shares automatically convert to Class A shares six years after issuance. Class C shares are offered to investors without an initial sales charge but are subject to higher ongoing expenses than Class A shares and a contingent deferred sales charge payable upon certain redemptions within one year of purchase. Class C shares do not automatically convert into another class. Class S shares are not subject to initial or contingent deferred sales charges and are generally not available to new investors except under certain circumstances.
Investment income, realized and unrealized gains and losses, and certain fund-level expenses and expense reductions, if any, are borne pro rata on the basis of relative net assets by the holders of all classes of shares, except that each class bears certain expenses unique to that class such as distribution and service fees, services to shareholders and certain other class-specific expenses. Differences in class-level expenses may result in payment of different per share dividends by class. All shares of the Fund have equal rights with respect to voting subject to class-specific arrangements.
The Fund's financial statements are prepared in accordance with accounting principles generally accepted in the United States of America which require the use of management estimates. Actual results could differ from those estimates. The policies described below are followed consistently by the Fund in the preparation of its financial statements.
Security Valuation. Investments are stated at value determined as of the close of regular trading on the New York Stock Exchange on each day the exchange is open for trading. Equity securities are valued at the most recent sale price or official closing price reported on the exchange (US or foreign) or over-the-counter market on which the security is traded most extensively. Securities for which no sales are reported are valued at the calculated mean between the most recent bid and asked quotations on the relevant market or, if a mean cannot be determined, at the most recent bid quotation.
Money market instruments purchased with an original or remaining maturity of sixty days or less, maturing at par, are valued at amortized cost. Investments in open-end investment companies and Cash Management QP Trust are valued at their net asset value each business day.
Securities and other assets for which market quotations are not readily available or for which the above valuation procedures are deemed not to reflect fair value are valued in a manner that is intended to reflect their fair value as determined in accordance with procedures approved by the Directors. The Fund may use a fair valuation model to value international equity securities in order to adjust for events which may occur between the close of the foreign exchanges and the close of the New York Stock Exchange. In accordance with the Fund's valuation procedures, factors used in determining value may include, but are not limited to, the type of the security, the size of the holding, the initial cost of the security, the existence of any contractual restrictions on the security's disposition, the price and extent of public trading in similar securities of the issuer or of comparable companies, quotations or evaluated prices from broker-dealers and/or pricing services, information obtained from the issuer, analysts, and/or the appropriate stock exchange (for exchange-traded securities), an analysis of the company's financial statements, an evaluation of the forces that influence the issuer and the market(s) in which the security is purchased and sold and with respect to debt securities, the maturity, coupon, creditworthiness, currency denomination, and the movement of the market in which the security is normally traded. The value determined under these procedures may differ from published values for the same securities.
The Fund adopted Financial Accounting Standards Board ("FASB") Statement of Financial Accounting Standards No. 157, "Fair Value Measurements" ("FAS 157"), effective at the beginning of the Fund's fiscal year. Disclosure about the classification of fair value measurements is included at the end of the Fund's Investment Portfolio.
New Accounting Pronouncement. In April 2009, FASB issued FASB Staff Position No. 157-4, "Determining Fair Value When the Volume and Level of Activity for the Asset or Liability Have Significantly Decreased and Identifying Transactions That Are Not Orderly" ("FSP 157-4"). FSP 157-4 provides additional guidance for estimating fair value in accordance with FAS 157, when the volume and level of activity for the asset or liability have significantly decreased as well as guidance on identifying circumstances that indicate a transaction is not orderly. FSP 157-4 is effective for fiscal years and interim periods ending after June 15, 2009. Management is currently reviewing the enhanced disclosure requirements for the adoption of FSP 157-4.
Foreign Currency Translations. The books and records of the Fund are maintained in US dollars. Investment securities and other assets and liabilities denominated in a foreign currency are translated into US dollars at the prevailing exchange rates at period end. Purchases and sales of investment securities, income and expenses are translated into US dollars at the prevailing exchange rates on the respective dates of the transactions.
Net realized and unrealized gains and losses on foreign currency transactions represent net gains and losses between trade and settlement dates on securities transactions, the disposition of forward foreign currency exchange contracts and foreign currencies, and the difference between the amount of net investment income accrued and the US dollar amount actually received. That portion of both realized and unrealized gains and losses on investments that results from fluctuations in foreign currency exchange rates is not separately disclosed but is included with net realized and unrealized gain/appreciation and loss/depreciation on investments.
Taxes. The Fund's policy is to comply with the requirements of the Internal Revenue Code, as amended, which are applicable to regulated investment companies, and to distribute all of its taxable income to its shareholders.
Additionally, based on the Fund's understanding of the tax rules and rates related to income, gains and transactions for the foreign jurisdictions in which it invests, the Fund will provide for foreign taxes, and where appropriate, deferred foreign taxes.
The Fund has reviewed the tax positions for the open tax years as of October 31, 2008 and has determined that no provision for income tax is required in the Fund's financial statements. The Fund's federal tax returns for the prior three fiscal years remain subject to examination by the Internal Revenue Service.
Distribution of Income and Gains. Net investment income of the Fund, if any, is declared and distributed to shareholders annually. Net realized gains from investment transactions, in excess of available capital loss carryforwards, would be taxable to the Fund if not distributed, and, therefore, will be distributed to shareholders at least annually.
The timing and characterization of certain income and capital gain distributions are determined annually in accordance with federal tax regulations which may differ from accounting principles generally accepted in the United States of America. These differences primarily relate to investments in foreign denominated investments, forward currency contracts, recognition of certain foreign currency gains (losses) as ordinary income (loss), and certain securities sold at a loss. As a result, net investment income (loss) and net realized gain (loss) on investments for a reporting period may differ significantly from distributions during such period. Accordingly, the Fund may periodically make reclassifications among certain of its capital accounts without impacting the net asset value of the Fund.
The tax character of current year distributions will be determined at the end of the current fiscal year.
Redemption Fees. The Fund imposes a redemption fee of 2% of the total redemption amount on all Fund shares redeemed or exchanged within 15 days of buying them, either by purchase or exchange. This fee is assessed and retained by the Fund for the benefit of the remaining shareholders. The redemption fee is accounted for as an addition to paid-in capital.
Expenses. Expenses of the Corporation arising in connection with a specific fund are allocated to that fund. Other Corporation expenses which cannot be directly attributed to a fund are apportioned among the funds in the Corporation.
Contingencies. In the normal course of business, the Fund may enter into contracts with service providers that contain general indemnification clauses. The Fund's maximum exposure under these arrangements is unknown as this would involve future claims that may be made against the Fund that have not yet been made. However, based on experience, the Fund expects the risk of loss to be remote.
Other. Investment transactions are accounted for on a trade date plus one basis for daily net asset value calculations. However, for financial reporting purposes, investment security transactions are reported on trade date. Interest income is recorded on the accrual basis. Dividend income is recorded on the ex-dividend date net of foreign withholding taxes. Certain dividends from foreign securities may be recorded subsequent to the ex-dividend date as soon as the Fund is informed of such dividends. Realized gains and losses from investment transactions are recorded on an identified cost basis.
B. Purchases and Sales of Securities
During the six months ended April 30, 2009, purchases and sales of investment securities (excluding short-term investments) aggregated $163,658,019 and $191,216,892, respectively.
C. Related Parties
Management Agreement. Under the Investment Management Agreement with Deutsche Investment Management Americas Inc. ("DIMA" or the "Advisor"), an indirect, wholly owned subsidiary of Deutsche Bank AG, the Advisor directs the investments of the Fund in accordance with its investment objectives, policies and restrictions. The Advisor determines the securities, instruments and other contracts relating to investments to be purchased, sold or entered into by the Fund.
Under the Investment Management Agreement with the Advisor, the Fund pays a monthly management fee based on the Fund's average daily net assets, computed and accrued daily and payable monthly, at the following annual rates:
| First $400 million of the Fund's average daily net assets | 1.165% |
| Over $400 million of such net assets | 1.065% |
Accordingly, for the six months ended April 30, 2009, the fee pursuant to the Investment Management Agreement was equivalent to an annualized effective rate of 1.15% of the Fund's average daily net assets.
Administration Fee. Pursuant to the Administrative Services Agreement, the Advisor provides most administrative services to the Fund. For all services provided under the Administrative Services Agreement, the Fund pays the Advisor an annual fee ("Administration Fee") of 0.10% of the Fund's average daily net assets, computed and accrued daily and payable monthly. For the six months ended April 30, 2009, the Advisor received an Administration Fee of $224,008, of which $40,410 is unpaid.
Service Provider Fees. DWS Investments Service Company ("DISC"), an affiliate of the Advisor, is the transfer agent, dividend-paying agent and shareholder service agent of the Fund. Pursuant to a sub-transfer agency agreement between DISC and DST Systems, Inc. ("DST"), DISC has delegated certain transfer agent, dividend-paying agent and shareholder service agent functions to DST. DISC compensates DST out of the shareholder serving fee it receives from the Fund. For the six months ended April 30, 2009, the amounts charged to the Fund by DISC were as follows:
Services to Shareholders | Total Aggregated | Unpaid at April 30, 2009 |
| Class A | $ 39,058 | $ 11,826 |
| Class B | 7,652 | 2,220 |
| Class C | 19,621 | 5,866 |
| Class S | 252,811 | 85,631 |
| $ 319,142 | $ 105,543 |
Distribution and Service Fees. Under the Fund's Class B and Class C 12b-1 Plans, DWS Investments Distributors, Inc. ("DIDI"), an affiliate of the Advisor, receives a fee ("Distribution Fee") of 0.75% of average daily net assets of each of Class B and C shares. In accordance with the Fund's Underwriting and Distribution Services Agreement DIDI enters into related selling group agreements with various firms at various rates for sales of Class B and C shares. For the six months ended April 30, 2009, the Distribution Fee was as follows:
Distribution Fee | Total Aggregated | Unpaid at April 30, 2009 |
| Class B | $ 14,280 | $ 2,155 |
| Class C | 30,061 | 4,572 |
| $ 44,341 | $ 6,727 |
In addition, DIDI provides information and administrative services for a fee ("Service Fee") to Class A, B and C shareholders at an annual rate of up to 0.25% of average daily net assets for each such class. DIDI in turn has various agreements with financial services firms that provide these services and pays these fees based upon assets of shareholder accounts the firms service. For the six months ended April 30, 2009, the Service Fee was as follows:
Service Fee | Total Aggregated | Unpaid at April 30, 2009 | Annualized Effective Rate |
| Class A | $ 38,517 | $ 3,528 | .24% |
| Class B | 4,635 | 477 | .24% |
| Class C | 9,866 | 2,125 | .25% |
| $ 53,018 | $ 6,130 |
|
Underwriting Agreement and Contingent Deferred Sales Charge. DIDI is the principal underwriter for the Fund. Underwriting commissions paid in connection with the distribution of Class A shares for the six months ended April 30, 2009 aggregated $2,867.
In addition, DIDI receives any contingent deferred sales charge ("CDSC") from Class B share redemptions occurring within six years of purchase and Class C share redemptions occurring within one year of purchase. There is no such charge upon redemption of any share appreciation or reinvested dividends. The CDSC is based on declining rates ranging from 4% to 1% for Class B and 1% for Class C, of the value of the shares redeemed. For the six months ended April 30, 2009, the CDSC for Class B and Class C shares aggregated $8,496 and $1,650, respectively. A deferred sales charge of up to 1% is assessed on certain redemptions of Class A shares. For the six months ended April 30, 2009, DIDI received $665 for Class A shares.
Typesetting and Filing Service Fees. Under an agreement with DIMA, DIMA is compensated for providing typesetting and certain regulatory filing services to the Fund. For the six months ended April 30, 2009, the amount charged to the Fund by DIMA included in the Statement of Operations under "reports to shareholders" aggregated $11,727, of which $3,468 is unpaid.
Directors' Fees and Expenses. The Fund paid each Director not affiliated with the Advisor retainer fees plus specified amounts for various committee services and for the Board Chairperson.
Cash Management QP Trust. Pursuant to an Exemptive Order issued by the SEC, the Fund may invest in the Cash Management QP Trust (the "QP Trust"), and other affiliated funds managed by the Advisor. The QP Trust seeks to provide as high a level of current income as is consistent with the preservation of capital and the maintenance of liquidity. The QP Trust does not pay the Advisor a management fee for the affiliated funds' investments in the QP Trust.
D. Investing in Emerging Markets
Investing in emerging markets may involve special risks and considerations not typically associated with investing in the United States of America. These risks include revaluation of currencies, high rates of inflation, repatriation restrictions on income and capital, and future adverse political, social and economic developments. Moreover, securities issued in these markets may be less liquid, subject to government ownership controls or delayed settlements and may have their prices more volatile than those of comparable securities of issuers in the United States of America.
E. Line of Credit
The Fund and other affiliated funds (the "Participants") share in a $450 million revolving credit facility provided by a syndication of banks. The Fund may borrow for temporary or emergency purposes, including the meeting of redemption requests that otherwise might require the untimely disposition of securities. The Participants are charged an annual commitment fee which is allocated based on net assets, among each of the Participants. Interest is calculated at a rate per annum equal to the sum of the Federal Funds Rate plus 1.25 percent plus if LIBOR exceeds the Federal Funds Rate the amount of such excess. The Fund may borrow up to a maximum of 25 percent of its net assets under the agreement.
F. Share Transactions
The following table summarizes share and dollar activity in the Fund:
| Six Months Ended April 30, 2009 | Year Ended October 31, 2008 | ||
| Shares | Dollars | Shares | Dollars |
Shares sold | ||||
| Class A | 167,313 | $ 4,906,724 | 1,039,180 | $ 75,265,704 |
| Class B | 4,161 | 118,616 | 63,352 | 4,446,290 |
| Class C | 18,099 | 508,176 | 135,575 | 9,799,508 |
| Class S | 710,342 | 20,852,578 | 2,131,112 | 149,159,232 |
| |
| $ 26,386,094 |
| $ 238,670,734 |
Shares issued to shareholders in reinvestment of distributions | ||||
| Class A | 134,778 | $ 3,539,815 | 219,276 | $ 15,499,458 |
| Class B | 16,216 | 416,288 | 25,073 | 1,742,351 |
| Class C | 33,780 | 866,441 | 52,974 | 3,678,008 |
| Class S | 1,815,867 | 47,852,840 | 2,116,841 | 149,922,142 |
| |
| $ 52,675,384 |
| $ 170,841,959 |
Shares redeemed | ||||
| Class A | (322,791) | $ (8,964,142) | (1,487,201) | $ (92,269,758) |
| Class B | (35,368) | (983,025) | (112,619) | (7,265,834) |
| Class C | (84,811) | (2,287,855) | (225,662) | (12,974,799) |
| Class S | (1,466,992) | (40,774,694) | (3,748,829) | (232,027,400) |
| |
| $ (53,009,716) |
| $ (344,537,791) |
Redemption fees |
| $ 30,693 |
| $ 97,412 |
Net increase (decrease) | ||||
| Class A | (20,700) | $ (507,228) | (228,745) | $ (1,485,089) |
| Class B | (14,991) | (448,060) | (24,194) | (1,074,435) |
| Class C | (32,932) | (913,144) | (37,113) | 507,471 |
| Class S | 1,059,217 | 27,950,887 | 499,124 | 67,124,367 |
| |
| $ 26,082,455 |
| $ 65,072,314 |
Summary of Management Fee Evaluation by Independent Fee Consultant
October 24, 2008
Pursuant to an Order entered into by Deutsche Investment Management Americas and affiliates (collectively, "DeAM") with the Attorney General of New York, I, Thomas H. Mack, have been appointed the Independent Fee Consultant for the DWS Funds (formerly the DWS Scudder Funds). My duties include preparing an annual written evaluation of the management fees DeAM charges the Funds, considering among other factors the management fees charged by other mutual fund companies for like services, management fees DeAM charges other clients for like services, DeAM's costs of supplying services under the management agreements and related profit margins, possible economies of scale if a Fund grows larger, and the nature and quality of DeAM's services, including fund performance. This report summarizes my evaluation for 2008, including my qualifications, the evaluation process for each of the DWS Funds, consideration of certain complex-level factors, and my conclusions. I served in substantially the same capacity in 2007.
Qualifications
For more than 35 years I have served in various professional capacities within the investment management business. I have held investment analysis and advisory positions, including securities analyst, portfolio strategist and director of investment policy with a large investment firm. I have also performed business management functions, including business development, financial management and marketing research and analysis.
Since 1991, I have been an independent consultant within the asset management industry. I have provided services to over 125 client organizations, including investment managers, mutual fund boards, product distributors and related organizations. Over the past ten years I have completed a number of assignments for mutual fund boards, specifically including assisting boards with management contract renewal.
I hold a Master of Business Administration degree, with highest honors, from Harvard University and Master of Science and Bachelor of Science (highest honors) degrees from the University of California at Berkeley. I am an independent director and audit committee financial expert for two closed-end mutual funds, serve on the board of directors of a private market research company, and have served in various leadership and financial oversight capacities with non-profit organizations.
Evaluation of Fees for each DWS Fund
My work focused primarily on evaluating, fund-by-fund, the fees charged to each of the 129 Fund portfolios in the DWS Fund family. For each Fund, I considered each of the key factors mentioned above, as well as any other relevant information. In doing so I worked closely with the Funds' Independent Directors in their annual contract renewal process, as well as in their approval of contracts for several new funds (documented separately).
In evaluating each Fund's fees, I reviewed comprehensive materials provided by or on behalf of DeAM, including expense information prepared by Lipper Analytical, comparative performance information, profitability data, manager histories, and other materials. I also accessed certain additional information from the Lipper, Strategic Insight, and Morningstar databases and drew on my industry knowledge and experience.
To facilitate evaluating this considerable body of information, I prepared for each Fund a document summarizing the key data elements in each area as well as additional analytics discussed below. This made it possible to consider each key data element in the context of the others.
In the course of contract renewal, DeAM agreed to implement a number of fee and expense adjustments requested by the Independent Directors which will favorably impact future fees and expenses, and my evaluation includes the effects of these changes.
Fees and Expenses Compared with Other Funds
The competitive fee and expense evaluation for each fund focused on two primary comparisons:
The Fund's contractual management fee (the advisory fee plus the administration fee where applicable) compared with those of a group of typically 12-15 funds in the same Lipper investment category (e.g. Large Capitalization Growth) having similar distribution arrangements and being of similar size.
The Fund's total expenses compared with a broader universe of funds from the same Lipper investment category and having similar distribution arrangements.
These two comparisons provide a view of not only the level of the fee compared with funds of similar scale but also the total expense the Fund bears for all the services it receives, in comparison with the investment choices available in the Fund's investment category and distribution channel. The principal figure-of-merit used in these comparisons was the subject Fund's percentile ranking against peers.
DeAM's Fees for Similar Services to Others
DeAM provided management fee schedules for all of its US domiciled fund and non-fund investment management accounts in any of the investment categories where there is a DWS Fund. These similar products included the other DWS Funds, non-fund pooled accounts, institutional accounts and sub-advisory accounts. Using this information, I calculated for each Fund the fee that would be charged to each similar product, at the subject Fund's asset level.
Evaluating information regarding non-fund products is difficult because there are varying levels of services required for different types of accounts, with mutual funds generally requiring considerably more regulatory and administrative types of service as well as having more frequent cash flows than other types of accounts. Also, while mutual fund fees for similar fund products can be expected to be similar, there will be some differences due to different pricing conditions in different distribution channels (e.g. retail funds versus those used in variable insurance products), differences in underlying investment processes and other factors.
Costs and Profit Margins
DeAM provided a detailed profitability analysis for each Fund. After making some adjustments so that the presentation would be more comparable to the available industry figures, I reviewed profit margins from investment management alone, from investment management plus other fund services (excluding distribution) provided to the Funds by DeAM (principally shareholder services), and DeAM profits from all sources, including distribution. A later section comments on overall profitability.
Economies of Scale
Economies of scale — an expected decline in management cost per dollar of fund assets as fund assets grow — are very rarely quantified and documented because of inherent difficulties in collecting and analyzing relevant data. However, in virtually every investment category that I reviewed, larger funds tend to have lower fees and lower total expenses than smaller funds. To see how each DWS Fund compares with this industry observation, I reviewed:
The trend in Fund assets over the last five years and the accompanying trend in total expenses. This shows if the Fund has grown and, if so, whether total expense (management fees as well as other expenses) have declined as a percent of assets.
Whether the Fund has break-points in its management fee schedule, the extent of the fee reduction built into the schedule and the asset levels where the breaks take effect, and in the case of a sub-advised Fund how the Fund's break-points compare with those of the sub-advisory fee schedule.
How the Fund's contractual fee schedule compares with trends in the industry data. To accomplish this, I constructed a chart showing how actual latest-fiscal-year contractual fees of the Fund and of other similar funds relate to average fund assets, with the subject Fund's contractual fee schedule superimposed.
Quality of Service — Performance
The quality-of-service evaluation focused on investment performance, which is the principal result of the investment management service. Each Fund's performance was reviewed over the past 1, 3, 5 and 10 years, as applicable, and compared with that of other funds in the same investment category and with a suitable market index.
In addition, I calculated and reviewed risk-adjusted returns relative to an index of similar mutual funds' returns and a suitable market index. The risk-adjusted returns analysis provides a way of determining the extent to which the Fund's return comparisons are mainly the product of investment value-added (or lack thereof) or alternatively taking considerably more or less risk than is typical in its investment category.
I also received and considered the history of portfolio manager changes for each Fund, as this provided an important context for evaluating the performance results.
Complex-Level Considerations
While this evaluation was conducted mainly at the individual fund level, there are some issues relating to the reasonableness of fees that can alternatively be considered across the whole fund complex:
I reviewed DeAM's profitability analysis for all DWS Funds, with a view toward determining if the allocation procedures used were reasonable and how profit levels compared with public data for other investment managers.
I considered whether DeAM and affiliates receive any significant ancillary or "fall-out" benefits that should be considered in interpreting the direct profitability results. These would be situations where serving as the investment manager of the Funds is beneficial to another part of the Deutsche Bank organization.
I considered how aggregated DWS Fund expenses had varied over the years, by asset class and in the context of trends in asset levels.
I reviewed the structure of the DeAM organization, trends in staffing levels, and information on compensation of investment management and other professionals compared with industry data.
Findings
Based on the process and analysis discussed above, which included reviewing a wide range of information from management and external data sources and considering among other factors the fees DeAM charges other clients, the fees charged by other fund managers, DeAM's costs and profits associated with managing the Funds, economies of scale, possible fall-out benefits, and the nature and quality of services provided, in my opinion the management fees charged the DWS Funds are reasonable.

Thomas H. Mack
Summary of Administrative Fee Evaluation by Independent Fee Consultant
September 29, 2008
Pursuant to an Order entered into by Deutsche Asset Management (DeAM) with the Attorney General of New York, I, Thomas H. Mack, have been appointed the Independent Fee Consultant for the DWS Funds and have as part of my duties evaluated the reasonableness of the proposed management fees to be charged by DeAM to the DWS Funds, taking onto account a proposal to pass through to the funds certain fund accounting-related charges in connection with new regulatory requirements. My evaluation considered the following:
• While the proposal would alter the services to be provided under the Administration Agreement, which I consider to be part of fund management under the Order, it is my opinion that the change in services is slight and that the scope of prospective services under the combination of the Advisory and Administration Agreements continues to be comparable with those typically provided to competitive funds under their management agreements.
• While the proposal would increase fund expenses, according to a pro forma analysis performed by management, the prospective effect is less than .01% for all but seven of the DeAM Funds' 438 active share classes, and in all cases the effect is less than .03% and overall expenses would remain reasonable in my opinion.
Based on the foregoing considerations, in my opinion the fees and expenses for all of the DWS Funds will remain reasonable if the Directors adopt this proposal.

Thomas H. Mack
| |
For More Information | The automated telephone system allows you to access personalized account information and obtain information on other DWS funds using either your voice or your telephone keypad. Certain account types within Classes A, B, C and S also have the ability to purchase, exchange or redeem shares using this system. For more information, contact your financial advisor. You may also access our automated telephone system or speak with a DWS Investments representative by calling the appropriate number below: For shareholders of Classes A, B and C: (800) 621-1048For shareholders of Class S: (800) 728-3337 |
Web Site | www.dws-investments.com View your account transactions and balances, trade shares, monitor your asset allocation, and change your address, 24 hours a day.Obtain prospectuses and applications, blank forms, interactive worksheets, news about DWS funds, subscription to fund updates by e-mail, retirement planning information, and more. |
Written Correspondence | DWS Investments PO Box 219151Kansas City, MO 64121-9151 |
Proxy Voting | A description of the fund's policies and procedures for voting proxies for portfolio securities and information about how the fund voted proxies related to its portfolio securities during the 12-month period ended June 30 is available on our Web site — www.dws-investments.com (click on "proxy voting"at the bottom of the page) — or on the SEC's Web site — www.sec.gov. To obtain a written copy of the fund's policies and procedures without charge, upon request, call us toll free at (800) 621-1048. |
Principal Underwriter | If you have questions, comments or complaints, contact: DWS Investments Distributors, Inc. 222 South Riverside PlazaChicago, IL 60606-5808 (800) 621-1148 |
| Class A | Class B | Class C | Class S |
Nasdaq Symbol | SLANX | SLAOX | SLAPX | SLAFX |
CUSIP Number | 23337R 775 | 23337R 767 | 23337R 759 | 23337R 874 |
Fund Number | 474 | 674 | 774 | 2074 |
Dear Valued Client:
We want to make sure you know our policy regarding the way in which our clients' private information is handled at DWS Investments. The following information is issued by DWS Investments Distributors, Inc., Deutsche Investment Management Americas Inc., DeAM Investor Services, Inc., DWS Trust Company and the DWS Funds.
We consider privacy fundamental to our client relationships and adhere to the policies and practices described below to protect current and former clients' information. We never sell customer lists or individual client information. Internal policies are in place to protect confidentiality, while allowing client needs to be served. Only individuals who need to do so in carrying out their job responsibilities may access client information. We maintain physical, electronic and procedural safeguards that comply with federal and state standards to protect confidentiality. These safeguards extend to all forms of interaction with us, including the Internet.
In the normal course of business, clients give us nonpublic personal information on applications and other forms, on our Web sites, and through transactions with us or our affiliates. Examples of the nonpublic personal information collected are name, address, Social Security number, and transaction and balance information. To be able to serve our clients, certain of this client information is shared with affiliated and nonaffiliated third party service providers such as transfer agents, custodians and broker-dealers to assist us in processing transactions and servicing your account.
In addition, we may disclose the information we collect to companies that perform marketing services on our behalf or to other financial institutions with which we have joint marketing agreements. These organizations may only use client information for the purpose designated by the companies listed above, and additional requirements beyond federal law may be imposed by certain states. To the extent that these state laws apply, we will comply with them before we share information about you.
We may also disclose nonpublic personal information about you to other parties as required or permitted by law. For example, we are required to or may provide information to government entities or regulatory bodies in response to requests for information or subpoenas, to private litigants in certain circumstances, to law enforcement authorities, or any time we believe it necessary to protect the firm.
At any time, if you have questions about our policy, please write to us at:
DWS Investments
Attention: Correspondence — Chicago
P.O. Box 219415
Kansas City, MO 64121-9415 September 2008

ITEM 2. | CODE OF ETHICS |
|
|
| Not applicable. |
|
|
ITEM 3. | AUDIT COMMITTEE FINANCIAL EXPERT |
|
|
| Not applicable. |
|
|
ITEM 4. | PRINCIPAL ACCOUNTANT FEES AND SERVICES |
|
|
| Not applicable. |
ITEM 5. | AUDIT COMMITTEE OF LISTED REGISTRANTS |
|
|
| Not Applicable |
|
|
ITEM 6. | SCHEDULE OF INVESTMENTS |
|
|
| Not Applicable |
|
|
ITEM 7. | DISCLOSURE OF PROXY VOTING POLICIES AND PROCEDURES FOR CLOSED-END MANAGEMENT INVESTMENT COMPANIES |
|
|
| Not applicable. |
|
|
ITEM 8. | PORTFOLIO MANAGERS OF CLOSED-END MANAGEMENT INVESTMENT COMPANIES |
|
|
| Not applicable. |
ITEM 9. | PURCHASES OF EQUITY SECURITIES BY CLOSED-END MANAGEMENT INVESTMENT COMPANY AND AFFILIATED PURCHASERS |
|
|
| Not Applicable. |
ITEM 10. | SUBMISSION OF MATTERS TO A VOTE OF SECURITY HOLDERS |
|
|
| The primary function of the Nominating and Governance Committee is to identify and recommend individuals for membership on the Board and oversee the administration of the Board Governance Guidelines. Shareholders may recommend candidates for Board positions by forwarding their correspondence by U.S. mail or courier service to Chairman of the Board, P.O. Box 100176, Cape Coral, FL 33910. |
|
|
ITEM 11. | CONTROLS AND PROCEDURES |
|
|
| (a) The Chief Executive and Financial Officers concluded that the Registrant’s Disclosure Controls and Procedures are effective based on the evaluation of the Disclosure Controls and Procedures as of a date within 90 days of the filing date of this report. |
|
|
| (b) There have been no changes in the registrant’s internal control over financial reporting that occurred during the second fiscal quarter of the period covered by this report that has materially affected, or is reasonably likely to materially affect, the registrant’s internal controls over financial reporting. |
|
|
ITEM 12. | EXHIBITS |
|
|
| (a)(1) Certification pursuant to Rule 30a-2(a) under the Investment Company Act of 1940 (17 CFR 270.30a-2(a)) is filed and attached hereto as Exhibit 99.CERT. |
|
|
| (b) Certification pursuant to Rule 30a-2(b) under the Investment Company Act of 1940 (17 CFR 270.30a-2(b)) is furnished and attached hereto as Exhibit 99.906CERT. |
Form N-CSRS Item F
SIGNATURES
Pursuant to the requirements of the Securities Exchange Act of 1934 and the Investment Company Act of 1940, the registrant has duly caused this report to be signed on its behalf by the undersigned, thereunto duly authorized.
Registrant: | DWS Latin America Equity Fund, a series of DWS International Fund, Inc. |
By: | /s/Michael G. Clark |
| Michael G. Clark |
President
Date: | July 1, 2009 |
Pursuant to the requirements of the Securities Exchange Act of 1934 and the Investment Company Act of 1940, this report has been signed below by the following persons on behalf of the registrant and in the capacities and on the dates indicated.
Registrant: | DWS Latin America Equity Fund, a series of DWS International Fund, Inc. |
By: | /s/Michael G. Clark |
| Michael G. Clark |
President
Date: | July 1, 2009 |
By: | /s/Paul Schubert |
| Paul Schubert |
Chief Financial Officer and Treasurer
Date: July 1, 2009