UNITED STATES
SECURITIES AND EXCHANGE COMMISSION
WASHINGTON, D. C. 20549
FORM N-CSR
Investment Company Act file number: 811-00642
Deutsche DWS International Fund, Inc.
(Exact Name of Registrant as Specified in Charter)
345 Park Avenue
New York, NY 10154-0004
(Address of Principal Executive Offices) (Zip Code)
Registrant’s Telephone Number, including Area Code: (212) 250-2500
Diane Kenneally
One International Place
Boston, MA 02110
(Name and Address of Agent for Service)
| Date of fiscal year end: | 10/31 |
| | |
| Date of reporting period: | 10/31/2018 |
| ITEM 1. | REPORT TO STOCKHOLDERS |
October 31, 2018
Annual Report
to Shareholders
DWS Emerging Markets Equity Fund
(formerly Deutsche Emerging Markets Equity Fund)

Contents
This report must be preceded or accompanied by a prospectus. To obtain a summary prospectus, if available, or prospectus for any of our funds, refer to the Account Management Resources information provided in the back of this booklet. We advise you to consider the Fund’s objectives, risks, charges and expenses carefully before investing. The summary prospectus and prospectus contain this and other important information about the Fund. Please read the prospectus carefully before you invest.
Investing in derivatives entails special risks relating to liquidity, leverage and credit that may reduce returns and/or increase volatility. Emerging markets tend to be more volatile and less liquid than the markets of more mature economies, and generally have less diverse and less mature economic structures and less stable political systems than those of developed countries. Investing in foreign securities presents certain risks, such as currency fluctuations, political and economic changes, and market risks. The Fund may lend securities to approved institutions. Stocks may decline in value. Please read the prospectus for details.
The brand DWS represents DWS Group GmbH & Co. KGaA and any of its subsidiaries such as DWS Distributors, Inc. which offers investment products or DWS Investment Management Americas, Inc. and RREEF America L.L.C. which offer advisory services.
NOT FDIC/NCUA INSURED NO BANK GUARANTEE MAY LOSE VALUE
NOT A DEPOSIT NOT INSURED BY ANY FEDERAL GOVERNMENT AGENCY
| | | | | | |
| 2 | | | | | DWS Emerging Markets Equity Fund | | |
Letter to Shareholders
Dear Shareholder:
The U.S. economy seems still to be in a cyclical sweet spot. Against a backdrop of solid growth, a tight labor market and inflation near the Federal Reserve Bank’s target, the expansion appears set to continue.
This is not to say there are no risks. Concerns regarding trade and other geopolitical issues have contributed to increased volatility and bear close watching. Overall, however, our Chief Investment Officer (“CIO”) and Chief Economist agree that the equity market is broadly attractive, thanks to strong earnings growth and the October dip in global equity markets. Meanwhile, our outlook is for interest rates to rise gradually as the economic recovery continues into 2019.
Our CIO Office, Chief Economist and Investment Specialists frequently post their perspectives on new developments, opportunities and emerging risks in the “Insight” section of our web site, dws.com. We invite you to visit us online frequently to access our most current views.
Best regards,
| | |
 | | 
Hepsen Uzcan President, DWS Funds |
Assumptions, estimates and opinions contained in this document constitute our judgment as of the date of the document and are subject to change without notice. Any projections are based on a number of assumptions as to market conditions and there can be no guarantee that any projected results will be achieved. Past performance is not a guarantee of future results.
| | | | | | | | |
| | DWS Emerging Markets Equity Fund | | | | | | 3 | |
| | |
| Portfolio Management Review | | (Unaudited) |
Market Overview and Fund Performance
All performance information below is historical and does not guarantee future results. Returns shown are for Class A shares, unadjusted for sales charges. Investment return and principal fluctuate, so your shares may be worth more or less when redeemed. Current performance may differ from performance data shown. Please visit dws.com for the most recent month-end performance of all share classes. Fund performance includes reinvestment of all distributions. Unadjusted returns do not reflect sales charges and would have been lower if they had. Please refer to pages 10 through 11 for more complete performance information.
Investment Process
Portfolio management generally uses a four step management process.
In the first step, using a macroeconomic outlook, portfolio management assesses the general outlook for emerging market equities. The key drivers of this outlook are growth, valuation, and market sentiment. This process is then applied at individual country and sector levels to determine country and sector weightings.
In the second step, portfolio management performs a bottom-up fundamental analysis of the companies in the designated countries and sectors (i.e., an analysis of the salient attributes of the various individual companies), resulting in recommended stocks for the designated countries and sectors and corresponding target prices for those stocks. Salient company attributes that portfolio management may consider include attractiveness of valuation relative to earnings, sustainability of business model, the presence of clearly identifiable catalysts, such as a specific corporate event, and positive share price momentum.
In the third step, portfolio management constructs the fund’s portfolio, weighting individual stocks based on management’s assessments and setting individual country and sector market exposure based on management’s outlook.
In the fourth and final step, portfolio management actively monitors the fund’s portfolio, including an ongoing assessment of the portfolio’s risks. Portfolio management will typically sell a security if it no longer represents good value relative to fundamentals and/or if it lacks positive catalysts.
DWS Emerging Markets Equity Fund returned -8.79% in the 12-month period ended October 31, 2018, outperforming the -12.52% return for its benchmark, the MSCI Emerging Markets Index, and the -13.34% average return for its Morningstar peer group, Diversified Emerging Markets Funds. The Fund also outpaced its benchmark and peers in the three- and five-year periods ended on the same date.
| | | | | | |
| 4 | | | | | DWS Emerging Markets Equity Fund | | |
Several factors combined to weigh on emerging-market equities in the past year. The U.S. Federal Reserve’s (Fed’s) four interest rate increases and ongoing unwinding of its quantitative easing policy, which sapped liquidity from the global financial markets, was the primary reason for the shortfall. Rising rates led to concerns that Argentina, Turkey, and other countries with high current account deficits would be unable to acquire adequate funding, sparking fears of a possible “contagion” during the summer. In addition to pressuring stocks, these factors weighed heavily on emerging-market currencies — a further headwind for dollar-based investors. Emerging-market equities also faced headwinds from increasingly protectionist U.S. trade policy, evidence of slowing growth in China, and uncertainty leading up to Brazil’s election. Together, these developments caused the Fund’s benchmark to lag the 1.16% gain of the developed-market MSCI World Index by a wide margin.
Fund Performance
We use a top-down strategy that seeks to establish weightings in what we determine are the most fundamentally sound countries in the asset class, and then strives to identify which stocks in those countries are in the best position to outperform. We also emphasize the outlook for currency market performance, since it can play such a large role in returns for U.S.-based investors. Given the wide dispersion in the fundamentals of individual countries across the asset class, we believe this top-down strategy represents a more effective approach than one that prioritizes bottom-up stock selection.
This top-down aspect of our approach, which helped cushion the effect of the downturn, was the primary reason for the Fund’s outperformance in a potentially challenging environment. During the summer of 2017, for instance, headline index performance was largely driven by a handful of technology stocks. As we entered the reporting period, we determined that this trend had become overextended and that leadership was poised to broaden. We therefore tilted the portfolio to stocks that tend to be driven more by domestic factors than broader, global developments. This shift worked well and allowed the Fund to capitalize on the strong market advance that ran from November 2017 through the end of January 2018.
At that point, we became more cautious given the extent of the rally that had been in place over the prior year. Anticipating that U.S. dollar strength would begin to disrupt the markets, we moved toward an emphasis on
| | | | | | | | |
| | DWS Emerging Markets Equity Fund | | | | | | 5 | |
countries with current account surpluses and lightened positions in those with deficits. The dollar indeed emerged as a key driver of performance through mid-2018, so our positioning added value by providing an element of downside protection once stocks started to weaken. Later in the period, we took an even more defensive positioning when the United States began to adopt a more protectionist trade policy. We reduced the portfolio’s overall risk profile, and we established a larger weighting in cash. These moves were well timed, as the sell-off subsequently accelerated through the summer and early autumn.
“Although the Fund lost ground on an absolute basis, several aspects of our broader positioning helped cushion the effects of the downdraft in the emerging equity markets.”
Several of the Fund’s individual holdings stood out as positive contributors, as well. Our stock selection was particularly effective in China, where shares of Anhui Conch Cement Co. Ltd.* gained ground on the strength of tighter cement supplies and improving prospects for industry consolidation. Other key contributors included PetroChina Co., Ltd., which benefited from rising oil prices, as well as Tencent Holdings Ltd. and Ping An Insurance (Group) Co. of China Ltd., both of which were well positioned to benefit from the growth of the country’s consumer sector: Our stock selection in Brazil also made a sizable contribution to results. Shares of the diversified mining company Vale SA were boosted by the company’s successful efforts at restructuring its operations, allowing it to post a 60%-plus gain even as the broader index experienced a loss. Positions in Banco do Brasil SA and Petroleo Brasileiro SA (“Petrobras”) also posted positive returns. India was an additional source of relative strength for the Fund thanks to positions in HDFC Bank Ltd. and ICICI Bank Ltd. Both banks outperformed due to the combination of management change, resilient fundamentals, and the strength in the nation’s economy. Outside of these three countries, key contributors included the Russian energy stocks LUKOIL PJSC and Rosneft Oil Co. PJSC, as well as the Australia-domiciled mining giant BHP Billiton PLC.
Stock selection in South Korea was less favorable, primarily as a result of an overweight position in Samsung Electronics Co. Ltd. The stock lost ground due to expectations of a slowdown in the cell-phone replacement cycle.
| | | | | | |
| 6 | | | | | DWS Emerging Markets Equity Fund | | |
Elsewhere, New Oriental Education & Technology Group, Inc. — a Chinese after-school tutoring company — suffered from increasing industry-wide regulation concerning class sizes, teacher licensing, and content. Alibaba Group Holding Ltd. (China), Melco Resorts & Entertainment Ltd. (Hong Kong), and the South Korean internet search provider Naver Corp. were also among the Fund’s leading detractors.
Outlook and Positioning
At the close of the period, the Fund was overweight in Brazil on the expectation that the election result would lead to economic reforms and a potential reduction in the fiscal deficit. We also maintained an overweight in Chinese companies with exposure to the domestic economy and lower sensitivity to global developments. The Fund was neutral weight in India and Mexico, and it was underweight in South Korea and Taiwan due to their above-average valuations and the weak backlog of orders for companies in the Apple supply chain. The portfolio was overweight in Russia, primarily through positions in energy stocks that are less affected by U.S. political sanctions.
Macroeconomic risks remained very much in play as the period drew to a close. However, the large downturn in stock prices since the beginning of February has created more attractive valuations in a number of countries. At the end of October, the broader category was trading at valuations that were below the long-term average and well beneath those of the United States. Valuations alone are not sufficient to fuel a rally, but we believe they may foster renewed interest in the asset class if the ascent in the U.S. dollar stalls and the currency begins to trade sideways or lower. We believe this combination of risks and opportunities provides a favorable backdrop for us to put our top-down strategy to work.
| * | Not held at October 31, 2018. |
| | | | | | | | |
| | DWS Emerging Markets Equity Fund | | | | | | 7 | |
Portfolio Management Team
Sean Taylor, Managing Director
Lead Portfolio Manager of the Fund. Began managing the Fund in 2014.
| – | Global Head of Emerging Markets Equities: Hong Kong. |
| – | Joined DWS in 2013 with 21 years of industry experience. Prior to his current role, he served as Head of Emerging Markets at Pioneer Investments, Investment Director at GAM, based in London and Dubai, and Head of International & Emerging Markets at Societe Generale. |
| – | MBA, Manchester Business School. |
Luiz Ribeiro, CFA, Managing Director
Portfolio Manager of the Fund. Began managing the Fund in 2017.
| – | Senior Equities Portfolio Manager: São Paolo. |
| – | Joined DWS in 2012 with 18 years of industry experience. Prior to joining DWS, Luiz served as a Senior Portfolio Manager at HSBC Bank. Prior to HSBC Bank, he worked as an Investment Officer at IFC - World Bank and as an Analyst and then as a Senior Portfolio Manager at ABN AMRO Bank. He began his investment career as a Trader at Dibran DTVM Ltda. |
| – | BA in Business Administration from University of São Paulo (USP); MBA in Finance from Brazilian Institute of Capital Markets (IBMEC). |
Marc Currat, Assistant Vice President
Portfolio Manager of the Fund. Began managing the Fund in 2017.
| – | Analyst and Portfolio Manager for Global Emerging Markets Equities: Hong Kong. |
| – | Joined DWS in 2012 with 6 years of professional experience, thereof one year in the financial industry. Prior to joining, he served as an equities and quant analyst at Surperformance SAS. Prior to that he was an auditor advisor at Currat & Associes SA. |
| – | BSc in Management from CIBU - California International Business University; MBA in Finance from International School of Management, Paris & St. John’s University; Investment Management Certificate (IMC). |
The views expressed reflect those of the portfolio management team only through the end of the period of the report as stated on the cover. The management team’s views are subject to change at any time based on market and other conditions and should not be construed as a recommendation. Past performance is no guarantee of future results. Current and future portfolio holdings are subject to risk.
| | | | | | |
| 8 | | | | | DWS Emerging Markets Equity Fund | | |
Terms to Know
The MSCI Emerging Markets Index is an unmanaged, capitalization-weighted index of companies in a universe of 23 emerging markets. The index is calculated using closing local market prices and translates into US dollars using the London close foreign exchange rates.
The Morningstar Diversified Emerging Markets Funds category encompasses funds that have at least 50% of stocks invested in the emerging markets. The average returns for the category in the one-, three-, five- and 10-year periods ended October 31, 2018 were -13.34%, 4.90%, 0.01%, and 7.39%, respectively.
The MSCI World Index captures large and mid-cap representation across 23 Developed Markets countries. With 1,653 constituents, the index covers approximately 85% of the free float-adjusted market capitalization in each country.
Index returns do not reflect any fees or expenses and it is not possible to invest directly into an index.
Top-down investing is a method in which the investor first looks at trends in the general economy (or, in the case of international investing, the economies of several countries), and next selects companies or industries that stand to benefit from those trends.
Current account deficit is the difference between the value of goods and services a country imports and the value of goods and services it exports. A deficit exists when the value of imports is greater than the value of exports.
Overweight means a fund holds a higher weighting in a given sector or security compared with its benchmark index. Underweight means a fund holds a lower weighting in a given sector or security.
Contribution incorporates both a stock’s total return and its weighting in the fund.
| | | | | | | | |
| | DWS Emerging Markets Equity Fund | | | | | | 9 | |
| | |
| Performance Summary | | October 31, 2018 (Unaudited) |
| | | | | | | | | | | | |
| Class A | | 1-Year | | | 5-Year | | | 10-Year | |
| Average Annual Total Returns as of 10/31/18 | | | | | | | | | | | | |
| Unadjusted for Sales Charge | | | –8.79% | | | | 1.96% | | | | 5.62% | |
Adjusted for the Maximum Sales Charge
(max 5.75% load) | | | –14.04% | | | | 0.76% | | | | 4.99% | |
| MSCI Emerging Markets Index† | | | –12.52% | | | | 0.78% | | | | 7.84% | |
| | | |
| Class T | | 1-Year | | | 5-Year | | | 10-Year | |
| Average Annual Total Returns as of 10/31/18 | | | | | | | | | | | | |
| Unadjusted for Sales Charge | | | –8.79% | | | | 1.96% | | | | 5.61% | |
Adjusted for the Maximum Sales Charge
(max 2.50% load) | | | –11.07% | | | | 1.45% | | | | 5.35% | |
| MSCI Emerging Markets Index† | | | –12.52% | | | | 0.78% | | | | 7.84% | |
| | | |
| Class C | | 1-Year | | | 5-Year | | | 10-Year | |
| Average Annual Total Returns as of 10/31/18 | |
| Unadjusted for Sales Charge | | | –9.52% | | | | 1.19% | | | | 4.78% | |
Adjusted for the Maximum Sales Charge
(max 1.00% CDSC) | | | –9.52% | | | | 1.19% | | | | 4.78% | |
| MSCI Emerging Markets Index† | | | –12.52% | | | | 0.78% | | | | 7.84% | |
| | | |
| Class S | | 1-Year | | | 5-Year | | | 10-Year | |
| Average Annual Total Returns as of 10/31/18 | |
| No Sales Charges | | | –8.61% | | | | 2.20% | | | | 5.87% | |
| MSCI Emerging Markets Index† | | | –12.52% | | | | 0.78% | | | | 7.84% | |
| | | |
| Institutional Class | | 1-Year | | | 5-Year | | | 10-Year | |
| Average Annual Total Returns as of 10/31/18 | |
| No Sales Charges | | | –8.54% | | | | 2.23% | | | | 5.94% | |
| MSCI Emerging Markets Index† | | | –12.52% | | | | 0.78% | | | | 7.84% | |
Performance in the Average Annual Total Returns table(s) above and the Growth of an Assumed $10,000 Investment line graph that follows is historical and does not guarantee future results. Investment return and principal fluctuate, so your shares may be worth more or less when redeemed. Current performance may differ from performance data shown. Please visit dws.com for the Fund’s most recent month-end performance. Fund performance includes reinvestment of all distributions. Unadjusted returns do not reflect sales charges and would have been lower if they had.
The gross expense ratios of the Fund, as stated in the fee table of the prospectus dated February 1, 2018 (September 1, 2018 for Class R6) are 1.75%, 1.67%, 2.46%, 1.23%, 1.46% and 1.23% for Class A, Class T, Class C, Class R6, Class S and Institutional Class shares, respectively, and may differ from the expense ratios disclosed in the Financial Highlights tables in this report.
| | | | | | |
| 10 | | | | | DWS Emerging Markets Equity Fund | | |
Index returns do not reflect any fees or expenses and it is not possible to invest directly into an index.
Performance figures do not reflect the deduction of taxes that a shareholder would pay on fund distributions or the redemption of fund shares.
Returns shown for Class T shares for the period prior to its inception on June 5, 2017 are derived from the historical performance of Class S shares of DWS Emerging Markets Equity Fund during such periods and have been adjusted to reflect the higher total annual operating expenses and applicable sales charges of Class T. Any difference in expenses will affect performance.
Generally accepted accounting principles require adjustments to be made to the net assets of the Fund at period end for financial reporting purposes only, and as such, the total return based on the unadjusted net asset value per share may differ from the total return reported in the financial highlights.
|
Growth of an Assumed $10,000 Investment
(Adjusted for Maximum Sales Charge) |
The Fund’s growth of an assumed $10,000 investment is adjusted for the maximum sales charge of 5.75%. This results in a net initial investment of $9,425.
The growth of $10,000 is cumulative.
Performance of other share classes will vary based on the sales charges and the fee structure of those classes.
| † | The MSCI Emerging Markets Index is an unmanaged, capitalization-weighted index of companies in a universe of 23 emerging markets. The index is calculated using closing local market prices and translates into U.S. dollars using the London close foreign exchange rates. |
| | | | | | | | | | | | | | | | | | | | | | | | |
| | | Class A | | | Class T | | | Class C | | | Class R6 | | | Class S | | | Institutional
Class | |
| Net Asset Value | |
| 10/31/18 | | $ | 17.74 | | | $ | 17.74 | | | $ | 15.77 | | | $ | 17.99 | | | $ | 18.00 | | | $ | 17.99 | |
| 9/7/18 (commencement of operations of Class R6) | | $ | — | | | $ | — | | | $ | — | | | $ | 18.68 | | | $ | — | | | $ | — | |
| 10/31/17 | | $ | 19.54 | | | $ | 19.54 | | | $ | 17.43 | | | $ | — | | | $ | 19.82 | | | $ | 19.81 | |
| Distribution Information as of 10/31/18 | |
| Income Dividends, Twelve Months | | $ | .09 | | | $ | .09 | | | $ | — | | | $ | — | | | $ | .13 | | | $ | .14 | |
| | | | | | | | |
| | DWS Emerging Markets Equity Fund | | | | | | 11 | |
| | | | | | | | |
| Portfolio Summary | | | (Unaudited) | |
| | |
Asset Allocation (As a % of Investment Portfolio excluding
Securities Lending Collateral) | | 10/31/18 | | | 10/31/17 | |
| Common stocks | | | 86% | | | | 91% | |
| Cash Equivalents | | | 5% | | | | 5% | |
| Exchange-Traded Funds | | | 9% | | | | 4% | |
| | | | 100% | | | | 100% | |
| | |
| Sector Diversification (As a % of Common Stocks) | | 10/31/18 | | | 10/31/17 | |
| Financials | | | 39% | | | | 30% | |
| Information Technology | | | 12% | | | | 17% | |
| Energy | | | 12% | | | | 7% | |
| Communication Services | | | 11% | | | | 16% | |
| Consumer Discretionary | | | 9% | | | | 10% | |
| Materials | | | 7% | | | | 8% | |
| Consumer Staples | | | 5% | | | | 5% | |
| Industrials | | | 2% | | | | 4% | |
| Real Estate | | | 2% | | | | 2% | |
| Utilities | | | 1% | | | | 1% | |
| | | | 100% | | | | 100% | |
| | |
Geographical Diversification (As a % of Common Stocks) | | 10/31/18 | | | 10/31/17 | |
China | | | 30% | | | | 33% | |
Korea | | | 13% | | | | 16% | |
Brazil | | | 12% | | | | 8% | |
Taiwan | | | 11% | | | | 10% | |
India | | | 9% | | | | 9% | |
Hong Kong | | | 7% | | | | 3% | |
Russia | | | 6% | | | | 7% | |
Mexico | | | 3% | | | | 2% | |
South Africa | | | 3% | | | | 5% | |
Thailand | | | 2% | | | | 2% | |
Australia | | | 2% | | | | 0% | |
Indonesia | | | 1% | | | | 1% | |
Turkey | | | 1% | | | | 0% | |
| Argentina | | | 0% | | | | 1% | |
Other | | | 0% | | | | 3% | |
| | | | 100% | | | | 100% | |
| | | | | | |
| 12 | | | | | DWS Emerging Markets Equity Fund | | |
| | | | | | | | | | |
Ten Largest Equity Holdings at October 31, 2018
(33.0% of Net Assets) | | Country | | Percent | |
| | 1 | | | Taiwan Semiconductor Manufacturing Co., Ltd. | | Taiwan | | | 5.1 | % |
| | | | | Manufacturer of integrated circuits and other semiconductor devices | | | | | | |
| | 2 | | | Samsung Electronics Co., Ltd. | | Korea | | | 3.9 | % |
| | | | | Manufacturer of electronic parts | | | | | | |
| | 3 | | | Alibaba Group Holding Ltd. | | China | | | 3.8 | % |
| | | | | Operates as a holding company | | | | | | |
| | 4 | | | Tencent Holdings Ltd. | | China | | | 3.6 | % |
| | | | | Provides Internet, mobile, and telecommunication value-added services | | | | | | |
| | 5 | | | Industrial & Commercial Bank of China Ltd. | | China | | | 3.1 | % |
| | | | | Provides a broad range of personal and corporate commercial banking services | | | | | | |
| | 6 | | | China Construction Bank Corp. | | China | | | 3.0 | % |
| | | | | Provides complete range of banking services & other financial services to individual and corporate consumers | | | | | | |
| | 7 | | | PetroChina Co., Ltd. | | China | | | 2.9 | % |
| | | | | Explores, develops and produces crude oil and natural gas | | | | | | |
| | 8 | | | Banco do Brasil SA | | Brazil | | | 2.6 | % |
| | | | | Offers retail and commercial banking services | | | | | | |
| | 9 | | | Ping An Insurance (Group) Co. of China Ltd. | | China | | | 2.6 | % |
| | | | | Provides a variety of insurance service | | | | | | |
| | 10 | | | HDFC Bank Ltd. | | India | | | 2.4 | % |
| | | | | Offers a wide range of services to the global corporate sector | | | | | | |
Portfolio holdings and characteristics are subject to change.
For more complete details about the Fund’s investment portfolio, see page 14. A quarterly Fact Sheet is available on dws.com or upon request. Please see the Account Management Resources section on page 55 for contact information.
| | | | | | | | |
| | DWS Emerging Markets Equity Fund | | | | | | 13 | |
| | |
| Investment Portfolio | | as of October 31, 2018 |
| | | | | | | | |
| | | Shares | | | Value ($) | |
| Common Stocks 83.4% | | | | | | | | |
| Australia 1.5% | | | | | | | | |
BHP Billiton PLC (Cost $1,580,877) | | | 98,778 | | | | 1,968,012 | |
| | |
| Brazil 10.1% | | | | | | | | |
Banco do Brasil SA | | | 296,342 | | | | 3,404,171 | |
CCR SA | | | 57,982 | | | | 170,916 | |
Itau Unibanco Holding SA (ADR) | | | 115,831 | | | | 1,525,494 | |
Itau Unibanco Holding SA (Preferred) | | | 96,322 | | | | 1,274,717 | |
Lojas Americanas SA (Preferred) | | | 192,337 | | | | 971,634 | |
Multiplan Empreendimentos Imobiliarios SA | | | 1,848 | | | | 11,421 | |
Petroleo Brasileiro SA (ADR) | | | 186,329 | | | | 3,027,846 | |
Vale SA (ADR) | | | 181,881 | | | | 2,746,403 | |
| | | | | | | | |
(Cost $11,333,652) | | | | | | | 13,132,602 | |
| | |
| China 25.0% | | | | | | | | |
Alibaba Group Holding Ltd. (ADR)* | | | 34,544 | | | | 4,914,920 | |
Bank of China Ltd. “H” | | | 3,494,000 | | | | 1,494,074 | |
China Construction Bank Corp. “H” | | | 4,974,577 | | | | 3,954,350 | |
China Merchants Bank Co., Ltd. “H” | | | 192,620 | | | | 748,555 | |
China Petroleum & Chemical Corp. “H” | | | 1,332,000 | | | | 1,087,414 | |
Ctrip.com International Ltd. (ADR)* | | | 11,500 | | | | 382,720 | |
Datang International Power Generation Co., Ltd. “H” | | | 1,116,000 | | | | 249,578 | |
Industrial & Commercial Bank of China Ltd. “H” | | | 5,968,096 | | | | 4,053,528 | |
Innovent Biologics, Inc. 144A* | | | 14,000 | | | | 29,600 | |
KWG Group Holdings Ltd.* | | | 454,000 | | | | 348,577 | |
NetEase, Inc. (ADR) | | | 3,354 | | | | 697,129 | |
New Oriental Education & Technology Group, Inc. (ADR)* | | | 24,328 | | | | 1,423,431 | |
PetroChina Co., Ltd. “H” | | | 5,091,300 | | | | 3,750,713 | |
Ping An Insurance (Group) Co. of China Ltd. “H” | | | 354,532 | | | | 3,364,433 | |
Tencent Holdings Ltd. | | | 134,300 | | | | 4,613,104 | |
Zhuzhou CRRC Times Electric Co., Ltd. “H” | | | 243,500 | | | | 1,305,715 | |
| | | | | | | | |
(Cost $29,573,819) | | | | | | | 32,417,841 | |
| | |
| Hong Kong 5.5% | | | | | | | | |
AIA Group Ltd. | | | 219,800 | | | | 1,677,406 | |
China Mobile Ltd. | | | 327,152 | | | | 3,067,873 | |
China Overseas Land & Investment Ltd. | | | 423,475 | | | | 1,333,464 | |
Galaxy Entertainment Group Ltd. | | | 59,000 | | | | 320,448 | |
Melco Resorts & Entertainment Ltd. (ADR) | | | 48,000 | | | | 798,240 | |
| | | | | | | | |
(Cost $7,946,391) | | | | | | | 7,197,431 | |
The accompanying notes are an integral part of the financial statements.
| | | | | | |
| 14 | | | | | DWS Emerging Markets Equity Fund | | |
| | | | | | | | |
| | | Shares | | | Value ($) | |
| India 7.6% | | | | | | | | |
HDFC Bank Ltd. (ADR) | | | 34,927 | | | | 3,105,360 | |
ICICI Bank Ltd. | | | 240,257 | | | | 1,149,333 | |
ICICI Bank Ltd. (ADR) | | | 119,070 | | | | 1,129,974 | |
ITC Ltd. | | | 192,000 | | | | 725,765 | |
Larsen & Toubro Ltd. | | | 32,190 | | | | 565,636 | |
Maruti Suzuki India Ltd. | | | 10,439 | | | | 934,385 | |
Tata Consultancy Services Ltd. | | | 52,744 | | | | 1,383,841 | |
UltraTech Cement Ltd. | | | 8,316 | | | | 391,743 | |
Zee Entertainment Enterprises Ltd. | | | 75,600 | | | | 460,735 | |
| | | | | | | | |
(Cost $9,438,982) | | | | | | | 9,846,772 | |
| | |
| Indonesia 1.0% | | | | | | | | |
PT Bank Central Asia Tbk (Cost $1,011,912) | | | 850,114 | | | | 1,326,105 | |
| | |
| Korea 10.5% | | | | | | | | |
Amorepacific Corp. | | | 1,658 | | | | 222,630 | |
Hyundai Motor Co. | | | 3,718 | | | | 346,984 | |
KB Financial Group, Inc. | | | 23,000 | | | | 955,319 | |
KT Corp. | | | 20,066 | | | | 503,009 | |
LG Chem Ltd. | | | 4,837 | | | | 1,474,195 | |
LG Household & Health Care Ltd. | | | 906 | | | | 828,906 | |
Naver Corp. | | | 9,590 | | | | 962,915 | |
Netmarble Corp. 144A | | | 2,615 | | | | 256,587 | |
POSCO | | | 4,240 | | | | 959,757 | |
Samsung Electronics Co., Ltd. | | | 135,200 | | | | 5,051,379 | |
Samsung Fire & Marine Insurance Co., Ltd. | | | 4,292 | | | | 1,047,369 | |
Shinhan Financial Group Co., Ltd. | | | 26,554 | | | | 993,565 | |
| | | | | | | | |
(Cost $13,728,613) | | | | | | | 13,602,615 | |
| | |
| Mexico 2.7% | | | | | | | | |
Fomento Economico Mexicano SAB de CV (ADR) | | | 31,746 | | | | 2,700,632 | |
Gruma SAB de CV “B” | | | 15,238 | | | | 159,407 | |
Grupo Financiero Inbursa SAB de CV “O” | | | 505,109 | | | | 658,203 | |
| | | | | | | | |
(Cost $4,196,624) | | | | | | | 3,518,242 | |
| | |
| Russia 5.2% | | | | | | | | |
Gazprom PJSC (ADR) | | | 409,072 | | | | 1,922,639 | |
LUKOIL PJSC (ADR) | | | 20,100 | | | | 1,500,264 | |
Rosneft Oil Co. PJSC (GDR) REG S | | | 271,941 | | | | 1,911,745 | |
Sberbank of Russia PJSC (ADR) | | | 62,267 | | | | 727,901 | |
Yandex NV “A”* (a) | | | 21,932 | | | | 660,811 | |
| | | | | | | | |
(Cost $6,492,611) | | | | | | | 6,723,360 | |
The accompanying notes are an integral part of the financial statements.
| | | | | | | | |
| | DWS Emerging Markets Equity Fund | | | | | | 15 | |
| | | | | | | | |
| | | Shares | | | Value ($) | |
| South Africa 2.6% | | | | | | | | |
Dis-Chem Pharmacies Ltd. 144A (b) | | | 204,702 | | | | 402,295 | |
FirstRand Ltd. | | | 402,453 | | | | 1,758,921 | |
Shoprite Holdings Ltd. | | | 35,000 | | | | 427,536 | |
Truworths International Ltd. | | | 109,301 | | | | 599,466 | |
Woolworths Holdings Ltd. | | | 71,988 | | | | 248,067 | |
| | | | | | | | |
(Cost $3,612,959) | | | | | | | 3,436,285 | |
| | |
| Taiwan 9.3% | | | | | | | | |
ASE Industrial Holdings Co., Ltd. | | | 239,761 | | | | 485,805 | |
Catcher Technology Co., Ltd. | | | 41,000 | | | | 415,334 | |
Chunghwa Telecom Co., Ltd. | | | 643,000 | | | | 2,260,606 | |
Formosa Plastics Corp. | | | 331,000 | | | | 1,083,395 | |
Fubon Financial Holding Co., Ltd. | | | 337,000 | | | | 529,904 | |
Hon Hai Precision Industry Co., Ltd. | | | 256,000 | | | | 656,345 | |
Taiwan Semiconductor Manufacturing Co., Ltd. | | | 774,803 | | | | 5,875,534 | |
Taiwan Semiconductor Manufacturing Co., Ltd. (ADR) | | | 21,014 | | | | 800,634 | |
| | | | | | | | |
(Cost $10,322,602) | | | | | | | 12,107,557 | |
| | |
| Thailand 1.8% | | | | | | | | |
CP ALL PCL (NVDR) | | | 458,600 | | | | 935,247 | |
Kasikornbank PCL (NVDR) | | | 80,500 | | | | 486,709 | |
PTT PCL (NVDR) | | | 595,700 | | | | 922,286 | |
| | | | | | | | |
(Cost $2,352,919) | | | | | | | 2,344,242 | |
| | |
| Turkey 0.3% | | | | | | | | |
KOC Holding AS | | | 100,545 | | | | 280,643 | |
Turkiye Garanti Bankasi AS | | | 97,879 | | | | 122,448 | |
| | | | | | | | |
(Cost $716,326) | | | | | | | 403,091 | |
| | |
| United Arab Emirates 0.3% | | | | | | | | |
Emaar Malls PJSC (Cost $589,330) | | | 687,850 | | | | 342,098 | |
| Total Common Stocks (Cost $102,897,617) | | | | | | | 108,366,253 | |
| | |
| Exchange-Traded Funds 8.9% | | | | | | | | |
iShares MSCI Emerging Markets ETF | | | 157,526 | | | | 6,168,718 | |
VanEck Vectors Vietnam ETF | | | 102,245 | | | | 1,552,079 | |
Vanguard FTSE Emerging Markets ETF | | | 101,998 | | | | 3,861,644 | |
| Total Exchange-Traded Funds (Cost $12,341,682) | | | | | | | 11,582,441 | |
| | |
| Securities Lending Collateral 0.3% | | | | | | | | |
DWS Government & Agency Securities Portfolio
“DWS Government Cash Institutional Shares”,
2.09% (c) (d) (Cost $387,000) | | | 387,000 | | | | 387,000 | |
The accompanying notes are an integral part of the financial statements.
| | | | | | |
| 16 | | | | | DWS Emerging Markets Equity Fund | | |
| | | | | | | | |
| | | Shares | | | Value ($) | |
| | |
| Cash Equivalents 4.5% | | | | | | | | |
DWS Central Cash Management Government Fund, 2.19% (c) (Cost $5,777,704) | | | 5,777,704 | | | | 5,777,704 | |
| | |
| | | % of Net
Assets | | | Value ($) | |
| Total Investment Portfolio (Cost $121,404,003) | | | 97.1 | | | | 126,113,398 | |
| Other Assets and Liabilities, Net | | | 2.9 | | | | 3,749,279 | |
| |
| Net Assets | | | 100.0 | | | | 129,862,677 | |
A summary of the Fund’s transactions with affiliated investments during the year ended October 31, 2018 are as follows:
| | | | | | | | | | | | | | | | | | | | | | | | | | | | | | | | | | |
Value ($)
at
10/31/2017 | | | Pur-
chases
Cost
($) | | | Sales
Proceeds
($) | | | Net
Real-
ized
Gain/
(Loss)
($) | | | Net
Change
in
Unreal
ized
Appreci-
ation
(Deprecia-
tion)
($) | | | Income
($) | | | Capital
Gain
Distri- butions
($) | | | Number of
Shares at
10/31/2018 | | | Value ($)
at
10/31/2018 | |
| | Securities Lending Collateral 0.3% | |
| | DWS Government & Agency Securities Portfolio “DWS Government Cash Institutional Shares”, 2.09% (c) (d) | |
| | 4,062,700 | | | | — | | | | 3,675,700 (e) | | | | — | | | | — | | | | 10,604 | | | | — | | | | 387,000 | | | | 387,000 | |
| | Cash Equivalents 4.5% | |
| | DWS Central Cash Management Government Fund, 2.19% (c) | |
| | 4,127,957 | | | | 98,112,851 | | | | 96,463,104 | | | | — | | | | — | | | | 158,205 | | | | — | | | | 5,777,704 | | | | 5,777,704 | |
| | 8,190,657 | | | | 98,112,851 | | | | 100,138,804 | | | | — | | | | — | | | | 168,809 | | | | — | | | | 6,164,704 | | | | 6,164,704 | |
| * | Non-income producing security. |
| (a) | Listed on the NASDAQ Stock Market, Inc. |
| (b) | All or a portion of these securities were on loan. In addition, “Other Assets and Liabilities, Net” may include pending sales that are also on loan. The value of securities loaned at October 31, 2018 amounted to $353,749, which is 0.3% of net assets. |
| (c) | Affiliated fund managed by DWS Investment Management Americas, Inc. The rate shown is the annualized seven-day yield at period end. |
| (d) | Represents collateral held in connection with securities lending. Income earned by the Fund is net of borrower rebates. |
| (e) | Represents the net increase (purchase cost) or decrease (sales proceeds) in the amount invested for the year ended October 31, 2018. |
144A: Security exempt from registration under Rule 144A of the Securities Act of 1933. These securities may be resold in transactions exempt from registration, normally to qualified institutional buyers.
ADR: American Depositary Receipt
FTSE: Financial Times and the London Stock Exchange
GDR: Global Depositary Receipt
MSCI: Morgan Stanley Capital International
NVDR: Non-Voting Depository Receipt
PJSC: Public Joint Stock Company
REG S: Securities sold under Regulation S may not be offered, sold or delivered within the United States or to, or for the account or benefit of, U.S. persons, except pursuant to an exemption from, or in a transaction not subject to, the registration requirements of the Securities Act of 1933.
The accompanying notes are an integral part of the financial statements.
| | | | | | | | |
| | DWS Emerging Markets Equity Fund | | | | | | 17 | |
Fair Value Measurements
Various inputs are used in determining the value of the Fund’s investments. These inputs are summarized in three broad levels. Level 1 includes quoted prices in active markets for identical securities. Level 2 includes other significant observable inputs (including quoted prices for similar securities, interest rates, prepayment speeds, and credit risk). Level 3 includes significant unobservable inputs (including the Fund’s own assumptions in determining the fair value of investments). The level assigned to the securities valuations may not be an indication of the risk associated with investing in those securities.
The following is a summary of the inputs used as of October 31, 2018 in valuing the Fund’s investments. For information on the Fund’s policy regarding the valuation of investments, please refer to the Security Valuation section of Note A in the accompanying Notes to Financial Statements.
| | | | | | | | | | | | | | | | |
| Assets | | Level 1 | | | Level 2 | | | Level 3 | | | Total | |
| Common Stocks | | | | | | | | | | | | | | | | |
Australia | | $ | — | | | $ | 1,968,012 | | | $ | — | | | $ | 1,968,012 | |
Brazil | | | 13,132,602 | | | | — | | | | — | | | | 13,132,602 | |
China | | | 7,447,800 | | | | 24,970,041 | | | | — | | | | 32,417,841 | |
Hong Kong | | | 798,240 | | | | 6,399,191 | | | | — | | | | 7,197,431 | |
India | | | 4,235,334 | | | | 5,611,438 | | | | — | | | | 9,846,772 | |
Indonesia | | | — | | | | 1,326,105 | | | | — | | | | 1,326,105 | |
Korea | | | — | | | | 13,602,615 | | | | — | | | | 13,602,615 | |
Mexico | | | 3,518,242 | | | | — | | | | — | | | | 3,518,242 | |
Russia | | | 6,723,360 | | | | — | | | | — | | | | 6,723,360 | |
South Africa | | | — | | | | 3,436,285 | | | | — | | | | 3,436,285 | |
Taiwan | | | 800,634 | | | | 11,306,923 | | | | — | | | | 12,107,557 | |
Thailand | | | — | | | | 2,344,242 | | | | — | | | | 2,344,242 | |
Turkey | | | — | | | | 403,091 | | | | — | | | | 403,091 | |
United Arab Emirates | | | — | | | | 342,098 | | | | — | | | | 342,098 | |
Exchange-Traded Funds | | | 11,582,441 | | | | — | | | | — | | | | 11,582,441 | |
| Short-Term Investments (f) | | | 6,164,704 | | | | — | | | | — | | | | 6,164,704 | |
| Total | | $ | 54,403,357 | | | $ | 71,710,041 | | | $ | — | | | $ | 126,113,398 | |
| (f) | See Investment Portfolio for additional detailed categorizations. |
The accompanying notes are an integral part of the financial statements.
| | | | | | |
| 18 | | | | | DWS Emerging Markets Equity Fund | | |
Statement of Assets and Liabilities
| | | | |
| As of October 31, 2018 | | | | |
| | | | |
| |
| Assets | | | | |
| Investments in non-affiliated securities, at value (cost $115,239,299) — including $353,749 of securities loaned | | $ | 119,948,694 | |
| Investment in DWS Government & Agency Securities Portfolio (cost $387,000)* | | | 387,000 | |
| Investment in DWS Central Cash Management Government Fund (cost $5,777,704) | | | 5,777,704 | |
| Cash | | | 3,801,412 | |
| Foreign currency, at value (cost $1,486,359) | | | 1,453,007 | |
| Receivable for investments sold | | | 1,838 | |
| Receivable for Fund shares sold | | | 4,599,819 | |
| Dividends receivable | | | 91,753 | |
| Interest receivable | | | 31,106 | |
| Foreign taxes recoverable | | | 144 | |
| Other assets | | | 43,787 | |
| Total assets | | | 136,136,264 | |
| |
| Liabilities | | | | |
| Payable upon return of securities loaned | | | 387,000 | |
| Payable for investments purchased | | | 4,288,402 | |
| Payable for Fund shares redeemed | | | 1,375,828 | |
| Accrued management fee | | | 17,142 | |
| Accrued Directors’ fees | | | 1,727 | |
| Other accrued expenses and payables | | | 203,488 | |
| Total liabilities | | | 6,273,587 | |
| Net assets, at value | | $ | 129,862,677 | |
| |
| Net Assets Consist of | | | | |
| Distributable earnings (loss) | | | (33,302,860 | ) |
| Paid-in capital | | | 163,165,537 | |
| Net assets, at value | | $ | 129,862,677 | |
| * | Represents collateral on securities loaned. |
The accompanying notes are an integral part of the financial statements.
| | | | | | | | |
| | DWS Emerging Markets Equity Fund | | | | | | 19 | |
| | |
| Statement of Assets and Liabilities as of October 31, 2018 (continued) | | |
| | | | |
| |
| Net Asset Value | | | | |
| | | | |
Class A | | | | |
Net Asset Value and redemption price per share
($9,483,284 ÷ 534,431 shares of capital stock outstanding,
$.01 par value, 50,000,000 shares authorized) | | $ | 17.74 | |
| Maximum offering price per share (100 ÷ 94.25 of $17.74) | | $ | 18.82 | |
Class T | | | | |
Net Asset Value, offering and redemption price per share
($10,163 ÷ 573 shares of capital stock outstanding,
$.01 par value, 50,000,000 shares authorized) | | $ | 17.74 | |
| Maximum offering price per share (100 ÷ 97.50 of $17.74) | | $ | 18.19 | |
Class C | | | | |
Net Asset Value, offering and redemption price per share
($2,880,064 ÷ 182,572 shares of capital stock outstanding,
$.01 par value, 20,000,000 shares authorized) | | $ | 15.77 | |
Class R6 | | | | |
Net Asset Value, offering and redemption price per share
($9,630 ÷ 535.3 shares of capital stock outstanding,
$.01 par value, 50,000,000 shares authorized) | | $ | 17.99 | |
Class S | | | | |
Net Asset Value, offering and redemption price per share
($89,356,452 ÷ 4,964,323 shares of capital stock outstanding,
$.01 par value, 100,000,000 shares authorized) | | $ | 18.00 | |
Institutional Class | | | | |
Net Asset Value, offering and redemption price per share
($28,123,084 ÷ 1,563,398 shares of capital stock outstanding,
$.01 par value, 100,000,000 shares authorized) | | $ | 17.99 | |
The accompanying notes are an integral part of the financial statements.
| | | | | | |
| 20 | | | | | DWS Emerging Markets Equity Fund | | |
Statement of Operations
| | | | |
| For the year ended October 31, 2018 | | | | |
| |
| Investment Income | | | | |
| | | | |
| Income: | | | | |
| Dividends (net of foreign taxes withheld of $296,172) | | $ | 2,302,388 | |
| Interest | | | 1,483 | |
| Income distributions — DWS Central Cash Management Government Fund | | | 158,205 | |
| Securities lending income, net of borrower rebates | | | 10,604 | |
| Other income | | | 4,122 | |
| Total income | | | 2,476,802 | |
| Expenses: | | | | |
| Management fee | | | 792,158 | |
| Administration fee | | | 113,165 | |
| Services to shareholders | | | 231,760 | |
| Distribution and service fees | | | 65,485 | |
| Custodian fee | | | 63,913 | |
| Professional fees | | | 106,564 | |
| Reports to shareholders | | | 45,148 | |
| Registration fees | | | 76,887 | |
| Directors’ fees and expenses | | | 8,371 | |
| Other | | | 19,970 | |
| Total expenses before expense reductions | | | 1,523,421 | |
| Expense reductions | | | (373,042 | ) |
| Total expenses after expense reductions | | | 1,150,379 | |
| Net investment income (loss) | | | 1,326,423 | |
| |
| Realized and Unrealized Gain (Loss) | | | | |
| Net realized gain (loss) from: | | | | |
| Investments | | | 2,757,990 | |
| Foreign currency | | | (85,159 | ) |
| | | | 2,672,831 | |
| Change in net unrealized appreciation (depreciation) on: | | | | |
| Investments | | | (17,828,441 | ) |
| Foreign currency | | | (25,697 | ) |
| | | | (17,854,138 | ) |
| Net gain (loss) | | | (15,181,307 | ) |
| Net increase (decrease) in net assets resulting from operations | | $ | (13,854,884 | ) |
The accompanying notes are an integral part of the financial statements.
| | | | | | | | |
| | DWS Emerging Markets Equity Fund | | | | | | 21 | |
Statements of Changes in Net Assets
| | | | | | | | |
| | | Years Ended October 31, | |
Increase (Decrease) in Net Assets | | 2018 | | | 2017 | |
| | | | | | | | |
Operations: | | | | | | | | |
Net investment income (loss) | | $ | 1,326,423 | | | $ | 546,681 | |
Net realized gain (loss) | | | 2,672,831 | | | | 997,833 | |
Change in net unrealized appreciation (depreciation) | | | (17,854,138 | ) | | | 13,852,668 | |
Net increase (decrease) in net assets resulting from operations | | | (13,854,884 | ) | | | 15,397,182 | |
Distributions to shareholders: | | | | | | | | |
Class A | | | (48,514 | ) | | | (20,049 | ) |
Class T | | | (52 | ) | | | — | |
Class S | | | (423,626 | ) | | | (232,886 | ) |
Institutional Class | | | (72,972 | ) | | | (5,617 | ) |
Total distributions | | | (545,164 | ) | | | (258,552 | )* |
Fund share transactions: | | | | | | | | |
Proceeds from shares sold | | | 118,734,902 | | | | 30,737,031 | |
Reinvestment of distributions | | | 519,832 | | | | 240,893 | |
Payments for shares redeemed | | | (62,332,008 | ) | | | (16,385,837 | ) |
Net increase (decrease) in net assets from Fund share transactions | | | 56,922,726 | | | | 14,592,087 | |
Increase (decrease) in net assets | | | 42,522,678 | | | | 29,730,717 | |
Net assets at beginning of year | | | 87,339,999 | | | | 57,609,282 | |
Net assets at end of year | | $ | 129,862,677 | | | $ | 87,339,999 | ** |
| * | Includes distributions from net investment income. |
| ** | Includes undistribution net investment income of $415,454. |
The accompanying notes are an integral part of the financial statements.
| | | | | | |
| 22 | | | | | DWS Emerging Markets Equity Fund | | |
Financial Highlights
| | | | | | | | | | | | | | | | | | | | | | |
| | | Years Ended October 31, | |
| Class A | | 2018 | | | 2017 | | | 2016 | | | 2015 | | | 2014 | |
| | | | | |
| Selected Per Share Data | | | | | | | | | | | | | | | | | | | | |
| Net asset value, beginning of period | | $ | 19.54 | | | $ | 15.71 | | | $ | 14.49 | | | $ | 16.53 | | | $ | 16.46 | |
| Income (loss) from investment operations: | | | | | | | | | | | | | | | | | | | | |
Net investment income (loss)a | | | .19 | | | | .10 | | | | .05 | | | | .06 | | | | .14 | |
Net realized and unrealized gain (loss) | | | (1.90 | ) | | | 3.77 | | | | 1.17 | | | | (1.95 | ) | | | .01 | |
Total from investment operations | | | (1.71 | ) | | | 3.87 | | | | 1.22 | | | | (1.89 | ) | | | .15 | |
| Less distributions from: | | | | | | | | | | | | | | | | | | | | |
Net investment income | | | (.09 | ) | | | (.04 | ) | | | — | | | | (.15 | ) | | | (.08 | ) |
| Redemption fees | | | — | | | | — | | | | .00 | * | | | .00 | * | | | .00 | * |
| Net asset value, end of period | | $ | 17.74 | | | $ | 19.54 | | | $ | 15.71 | | | $ | 14.49 | | | $ | 16.53 | |
| Total Return (%)b,c | | | (8.79 | ) | | | 24.75 | | | | 8.42 | | | | (11.57 | ) | | | .96 | |
|
| Ratios to Average Net Assets and Supplemental Data | |
| Net assets, end of period ($ millions) | | | 9 | | | | 10 | | | | 8 | | | | 10 | | | | 14 | |
| Ratio of expenses before expense reductions (%) | | | 1.55 | | | | 1.86 | | | | 2.16 | | | | 1.97 | | | | 1.98 | |
| Ratio of expenses after expense reductions (%) | | | 1.15 | | | | 1.35 | | | | 1.67 | | | | 1.63 | | | | 1.65 | |
| Ratio of net investment income (loss) (%) | | | .98 | | | | .59 | | | | .35 | | | | .40 | | | | .88 | |
| Portfolio turnover rate (%) | | | 34 | | | | 14 | | | | 72 | | | | 18 | | | | 65 | |
| a | Based on average shares outstanding during the period. |
| b | Total return does not reflect the effect of any sales charges. |
| c | Total return would have been lower had certain expenses not been reduced. |
| * | Amount is less than $.005. |
The accompanying notes are an integral part of the financial statements.
| | | | | | | | |
| | DWS Emerging Markets Equity Fund | | | | | | 23 | |
| | | | | | | | |
| Class T | | Year
Ended
10/31/18 | | | Period
Ended
10/31/17a | |
| | |
| Selected Per Share Data | | | | | | | | |
| Net asset value, beginning of period | | | $19.54 | | | | $17.54 | |
| Income (loss) from investment operations: | | | | | | | | |
Net investment income (loss)b | | | .19 | | | | .13 | |
Net realized and unrealized gain (loss) | | | (1.90 | ) | | | 1.87 | |
Total from investment operations | | | (1.71 | ) | | | 2.00 | |
| Less distributions from: | | | | | | | | |
Net investment income | | | (.09 | ) | | | — | |
| Net asset value, end of period | | | $17.74 | | | | $19.54 | |
| Total Return (%)c,d | | | (8.79 | ) | | | 11.40 | ** |
| | | |
| Ratios to Average Net Assets and Supplemental Data | | | | | | | | |
| Net assets, end of period ($ thousands) | | | 10 | | | | 11 | |
| Ratio of expenses before expense reductions (%) | | | 1.43 | | | | 1.65 | * |
| Ratio of expenses after expense reductions (%) | | | 1.15 | | | | 1.15 | * |
| Ratio of net investment income (loss) (%) | | | .97 | | | | 1.70 | * |
| Portfolio turnover rate (%) | | | 34 | | | | 14 | e |
| a | For the period from June 5, 2017 (commencement of operations) to October 31, 2017. |
| b | Based on average shares outstanding during the period. |
| c | Total return does not reflect the effect of any sales charges. |
| d | Total return would have been lower had certain expenses not been reduced. |
| e | Represents the Fund’s portfolio turnover rate for the year ended October 31, 2017. |
The accompanying notes are an integral part of the financial statements.
| | | | | | |
| 24 | | | | | DWS Emerging Markets Equity Fund | | |
| | | | | | | | | | | | | | | | | | | | |
| | | Years Ended October 31, | |
| Class C | | 2018 | | | 2017 | | | 2016 | | | 2015 | | | 2014 | |
| | | | | |
| Selected Per Share Data | | | | | | | | | | | | | | | | | | | | |
| Net asset value, beginning of period | | $ | 17.43 | | | $ | 14.07 | | | $ | 13.07 | | | $ | 14.92 | | | $ | 14.89 | |
| Income (loss) from investment operations: | | | | | | | | | | | | | | | | | | | | |
Net investment income (loss)a | | | .06 | | | | (.01 | ) | | | (.05 | ) | | | (.05 | ) | | | .02 | |
Net realized and unrealized gain (loss) | | | (1.72 | ) | | | 3.37 | | | | 1.05 | | | | (1.77 | ) | | | .01 | |
Total from investment operations | | | (1.66 | ) | | | 3.36 | | | | 1.00 | | | | (1.82 | ) | | | .03 | |
| Less distributions from: | | | | | | | | | | | | | | | | | | | | |
Net investment income | | | — | | | | — | | | | — | | | | (.03 | ) | | | — | |
| Redemption fees | | | — | | | | — | | | | .00 | * | | | .00 | * | | | .00 | * |
| Net asset value, end of period | | $ | 15.77 | | | $ | 17.43 | | | $ | 14.07 | | | $ | 13.07 | | | $ | 14.92 | |
| Total Return (%)b,c | | | (9.52 | ) | | | 23.88 | | | | 7.65 | | | | (12.24 | ) | | | .20 | |
|
| Ratios to Average Net Assets and Supplemental Data | |
| Net assets, end of period ($ millions) | | | 3 | | | | 3 | | | | 2 | | | | 2 | | | | 3 | |
| Ratio of expenses before expense reductions (%) | | | 2.26 | | | | 2.57 | | | | 2.91 | | | | 2.76 | | | | 2.76 | |
| Ratio of expenses after expense reductions (%) | | | 1.90 | | | | 2.09 | | | | 2.42 | | | | 2.38 | | | | 2.40 | |
| Ratio of net investment income (loss) (%) | | | .31 | | | | (.09 | ) | | | (.40 | ) | | | (.34 | ) | | | .10 | |
| Portfolio turnover rate (%) | | | 34 | | | | 14 | | | | 72 | | | | 18 | | | | 65 | |
| a | Based on average shares outstanding during the period. |
| b | Total return does not reflect the effect of any sales charges. |
| c | Total return would have been lower had certain expenses not been reduced. |
| * | Amount is less than $.005. |
The accompanying notes are an integral part of the financial statements.
| | | | | | | | |
| | DWS Emerging Markets Equity Fund | | | | | | 25 | |
| | | | |
| Class R6 | | Period
Ended
10/31/18a | |
| |
| Selected Per Share Data | | | | |
| Net asset value, beginning of period | | $ | 18.68 | |
| Income (loss) from investment operations: | | | | |
Net investment income (loss)b | | | .02 | |
Net realized and unrealized gain (loss) | | | (0.71 | ) |
Total from investment operations | | | (0.69 | ) |
| Net asset value, end of period | | $ | 17.99 | |
| Total Return (%)c | | | (3.69 | )** |
| |
| Ratios to Average Net Assets and Supplemental Data | | | | |
| Net assets, end of period ($ thousands) | | | 10 | |
| Ratio of expenses before expense reductions (%) | | | 1.41 | * |
| Ratio of expenses after expense reductions (%) | | | .90 | * |
| Ratio of net investment income (loss) (%) | | | .63 | * |
| Portfolio turnover rate (%) | | | 34 | d |
| a | For the period from September 7, 2018 (commencement of operations) to October 31, 2018. |
| b | Based on average shares outstanding during the period. |
| c | Total return would have been lower had certain expenses not been reduced. |
| d | Represents the Fund’s portfolio turnover rate for the year ended October 31, 2018. |
The accompanying notes are an integral part of the financial statements.
| | | | | | |
| 26 | | | | | DWS Emerging Markets Equity Fund | | |
| | | | | | | | | | | | | | | | | | | | |
| | | Years Ended October 31, | |
| Class S | | 2018 | | | 2017 | | | 2016 | | | 2015 | | | 2014 | |
| | | | |
| Selected Per Share Data | | | | | | | | | | | | | | | | | |
| Net asset value, beginning of period | | $ | 19.82 | | | $ | 15.94 | | | $ | 14.70 | | | $ | 16.77 | | | $ | 16.70 | |
| Income (loss) from investment operations: | | | | | | | | | | | | | | | | | |
Net investment income (loss)a | | | .24 | | | | .15 | | | | .09 | | | | .11 | | | | .18 | |
Net realized and unrealized gain (loss) | | | (1.93 | ) | | | 3.81 | | | | 1.18 | | | | (1.99 | ) | | | .01 | |
Total from investment operations | | | (1.69 | ) | | | 3.96 | | | | 1.27 | | | | (1.88 | ) | | | .19 | |
| Less distributions from: | | | | | | | | | | | | | | | | | |
Net investment income | | | (.13 | ) | | | (.08 | ) | | | (.03 | ) | | | (.19 | ) | | | (.12 | ) |
| Redemption fees | | | — | | | | — | | | | .00 | * | | | .00 | * | | | .00 | * |
| Net asset value, end of period | | $ | 18.00 | | | $ | 19.82 | | | $ | 15.94 | | | $ | 14.70 | | | $ | 16.77 | |
| Total Return (%)b | | | (8.61 | ) | | | 25.03 | | | | 8.68 | | | | (11.29 | ) | | | 1.20 | |
|
| Ratios to Average Net Assets and Supplemental Data | |
| Net Assets, end of period ($ millions) | | | 89 | | | | 65 | | | | 46 | | | | 48 | | | | 59 | |
| Ratio of expenses before expense reductions (%) | | | 1.31 | | | | 1.57 | | | | 1.90 | | | | 1.74 | | | | 1.74 | |
| Ratio of expenses after expense reductions (%) | | | .98 | | | | 1.14 | | | | 1.42 | | | | 1.38 | | | | 1.40 | |
| Ratio of net investment income (loss) (%) | | | 1.19 | | | | .87 | | | | .62 | | | | .68 | | | | 1.12 | |
| Portfolio turnover rate (%) | | | 34 | | | | 14 | | | | 72 | | | | 18 | | | | 65 | |
| a | Based on average shares outstanding during the period. |
| b | Total return would have been lower had certain expenses not been reduced. |
| * | Amount is less than $.005. |
The accompanying notes are an integral part of the financial statements.
| | | | | | | | |
| | DWS Emerging Markets Equity Fund | | | | | | 27 | |
| | | | | | | | | | | | | | | | | | | | |
| | | Years Ended October 31, | |
| Institutional Class | | 2018 | | | 2017 | | | 2016 | | | 2015 | | | 2014 | |
| | | | |
| Selected Per Share Data | | | | | | | | | | | | | | | | | |
| Net asset value, beginning of period | | $ | 19.81 | | | $ | 15.92 | | | $ | 14.68 | | | $ | 16.75 | | | $ | 16.69 | |
| Income (loss) from investment operations: | | | | | | | | | | | | | | | | | |
Net investment income (loss)a | | | .28 | | | | .21 | | | | (.04 | ) | | | .11 | | | | .18 | |
Net realized and unrealized gain (loss) | | | (1.96 | ) | | | 3.76 | | | | 1.31 | | | | (1.99 | ) | | | .01 | |
Total from investment operations | | | (1.68 | ) | | | 3.97 | | | | 1.27 | | | | (1.88 | ) | | | .19 | |
| Less distributions from: | | | | | | | | | | | | | | | | | |
Net investment income | | | (.14 | ) | | | (.08 | ) | | | (.03 | ) | | | (.19 | ) | | | (.13 | ) |
| Redemption fees | | | — | | | | — | | | | .00 | * | | | .00 | * | | | .00 | * |
| Net asset value, end of period | | $ | 17.99 | | | $ | 19.81 | | | $ | 15.92 | | | $ | 14.68 | | | $ | 16.75 | |
| Total Return (%)b | | | (8.54 | ) | | | 25.05 | | | | 8.76 | | | | (11.30 | ) | | | 1.19 | |
|
| Ratios to Average Net Assets and Supplemental Data | |
| Net Assets, end of period ($ millions) | | | 28 | | | | 9 | | | | 1 | | | | 8 | | | | 11 | |
| Ratio of expenses before expense reductions (%) | | | 1.18 | | | | 1.34 | | | | 1.72 | | | | 1.53 | | | | 1.54 | |
| Ratio of expenses after expense reductions (%) | | | .90 | | | | .97 | | | | 1.42 | | | | 1.38 | | | | 1.40 | |
| Ratio of net investment income (loss) (%) | | | 1.40 | | | | 1.14 | | | | (.28 | ) | | | .67 | | | | 1.12 | |
| Portfolio turnover rate (%) | | | 34 | | | | 14 | | | | 72 | | | | 18 | | | | 65 | |
| a | Based on average shares outstanding during the period. |
| b | Total return would have been lower had certain expenses not been reduced. |
| * | Amount is less than $.005. |
The accompanying notes are an integral part of the financial statements.
| | | | | | |
| 28 | | | | | DWS Emerging Markets Equity Fund | | |
| | |
| Notes to Financial Statements | | |
A. Organization and Significant Accounting Policies
DWS Emerging Markets Equity Fund (formerly Deutsche Emerging Markets Equity Fund) (the “Fund”) is a diversified series of Deutsche DWS International Fund, Inc. (formerly Deutsche International Fund, Inc.) (the “Corporation”), which is registered under the Investment Company Act of 1940, as amended (the “1940 Act”), as an open-end management investment company organized as a Maryland corporation.
The Fund offers multiple classes of shares which provide investors with different purchase options. Class A shares are subject to an initial sales charge. Class T shares are subject to an initial sales charge and are only available through certain financial intermediaries. Effective October 1, 2018, Class T shares closed to new purchases, except in connection with the reinvestment of dividends or other distributions. Class C shares are not subject to an initial sales charge but are subject to higher ongoing expenses than Class A shares and a contingent deferred sales charge payable upon certain redemptions within one year of purchase. Effective on August 10, 2018, Class C shares automatically convert to Class A shares in the same fund after 10 years, provided that the fund or the financial intermediary through which the shareholder purchased the Class C shares has records verifying that the Class C shares have been held for at least 10 years. Class S shares are not subject to initial or contingent deferred sales charges and are only available to a limited group of investors. Institutional Class shares are not subject to initial or contingent deferred sales charges and are generally available only to qualified institutions. Class R6 shares commenced operations on September 7, 2018. Class R6 shares are not subject to initial or contingent deferred sales charges and are generally available only to certain retirement plans.
Investment income, realized and unrealized gains and losses, and certain fund-level expenses and expense reductions, if any, are borne pro rata on the basis of relative net assets by the holders of all classes of shares, except that each class bears certain expenses unique to that class such as distribution and service fees, services to shareholders and certain other class-specific expenses. Differences in class-level expenses may result in payment of different per share dividends by class. All shares of the Fund have equal rights with respect to voting subject to class-specific arrangements.
The Fund’s financial statements are prepared in accordance with accounting principles generally accepted in the United States of America (“U.S. GAAP”) which require the use of management estimates. Actual results could differ from those estimates. The Fund qualifies as an
| | | | | | | | |
| | DWS Emerging Markets Equity Fund | | | | | | 29 | |
investment company under Topic 946 of Accounting Standards Codification of U.S. GAAP. The policies described below are followed consistently by the Fund in the preparation of its financial statements.
In October 2018, the Securities and Exchange Commission adopted amendments to certain disclosure requirements in Securities Act Release No. 33-10532, Disclosure Update and Simplification, which is intended to facilitate the disclosure of information to investors and simplify compliance without significantly altering the total mix of information provided to investors. Effective with the current reporting period, the Fund adopted the amendments with the impacts being that the Fund is no longer required to present components of distributable earnings on the Statement of Assets and Liabilities or the sources of distributable earnings and the amount of undistributed net investment income on the Statements of Changes in Net Assets.
Security Valuation. Investments are stated at value determined as of the close of regular trading on the New York Stock Exchange on each day the exchange is open for trading.
Various inputs are used in determining the value of the Fund’s investments. These inputs are summarized in three broad levels. Level 1 includes quoted prices in active markets for identical securities. Level 2 includes other significant observable inputs (including quoted prices for similar securities, interest rates, prepayment speeds and credit risk). Level 3 includes significant unobservable inputs (including the Fund’s own assumptions in determining the fair value of investments). The level assigned to the securities valuations may not be an indication of the risk or liquidity associated with investing in those securities.
Equity securities and exchange-traded funds (“ETFs”) are valued at the most recent sale price or official closing price reported on the exchange (U.S. or foreign) or over-the-counter market on which they trade. Equity securities or ETFs for which no sales are reported are valued at the calculated mean between the most recent bid and asked quotations on the relevant market or, if a mean cannot be determined, at the most recent bid quotation. Equity securities and ETFs are generally categorized as Level 1 securities. For certain international equity securities, in order to adjust for events which may occur between the close of the foreign exchanges and the close of the New York Stock Exchange, a fair valuation model may be used. This fair valuation model takes into account comparisons to the valuation of American Depository Receipts (ADRs), exchange-traded funds, futures contracts and certain indices and these securities are categorized as Level 2.
Investments in open-end investment companies are valued at their net asset value each business day and are categorized as Level 1.
| | | | | | |
| 30 | | | | | DWS Emerging Markets Equity Fund | | |
Securities and other assets for which market quotations are not readily available or for which the above valuation procedures are deemed not to reflect fair value are valued in a manner that is intended to reflect their fair value as determined in accordance with procedures approved by the Board and are generally categorized as Level 3. In accordance with the Fund’s valuation procedures, factors considered in determining value may include, but are not limited to, the type of the security; the size of the holding; the initial cost of the security; the existence of any contractual restrictions on the security’s disposition; the price and extent of public trading in similar securities of the issuer or of comparable companies; quotations or evaluated prices from broker-dealers and/or pricing services; information obtained from the issuer, analysts, and/or the appropriate stock exchange (for exchange-traded securities); an analysis of the company’s or issuer’s financial statements; an evaluation of the forces that influence the issuer and the market(s) in which the security is purchased and sold; and with respect to debt securities, the maturity, coupon, creditworthiness, currency denomination and the movement of the market in which the security is normally traded. The value determined under these procedures may differ from published values for the same securities.
Disclosure about the classification of fair value measurements is included in a table following the Fund’s Investment Portfolio.
Foreign Currency Translations. The books and records of the Fund are maintained in U.S. dollars. Investment securities and other assets and liabilities denominated in a foreign currency are translated into U.S. dollars at the prevailing exchange rates at period end. Purchases and sales of investment securities, income and expenses are translated into U.S. dollars at the prevailing exchange rates on the respective dates of the transactions.
Net realized and unrealized gains and losses on foreign currency transactions represent net gains and losses between trade and settlement dates on securities transactions, the acquisition and disposition of foreign currencies, and the difference between the amount of net investment income accrued and the U.S. dollar amount actually received. The portion of both realized and unrealized gains and losses on investments that results from fluctuations in foreign currency exchange rates is not separately disclosed but is included with net realized and unrealized gain/appreciation and loss/depreciation on investments.
Securities Lending. Deutsche Bank AG, as lending agent, lends securities of the Fund to certain financial institutions under the terms of its securities lending agreement. During the term of the loans, the Fund continues to receive interest and dividends generated by the securities and to participate in any changes in their market value. The Fund requires the borrowers of the securities to maintain collateral with the Fund consisting of either cash or liquid, unencumbered assets having a value at
| | | | | | | | |
| | DWS Emerging Markets Equity Fund | | | | | | 31 | |
least equal to the value of the securities loaned. When the collateral falls below specified amounts, the lending agent will use its best efforts to obtain additional collateral on the next business day to meet required amounts under the securities lending agreement. As of period end, any securities on loan were collateralized by cash. During the year ended October 31, 2018, the Fund invested the cash collateral into a joint trading account in affiliated money market funds managed by DWS Investment Management Americas, Inc. As of October 31, 2018, the Fund invested the cash collateral in DWS Government & Agency Securities Portfolio. DWS Investment Management Americas, Inc. receives a management/administration fee (0.12% annualized effective rate as of October 31, 2018) on the cash collateral invested in DWS Government & Agency Securities Portfolio. The Fund receives compensation for lending its securities either in the form of fees or by earning interest on invested cash collateral net of borrower rebates and fees paid to a lending agent. Either the Fund or the borrower may terminate the loan at any time, and the borrower, after notice, is required to return borrowed securities within a standard time period. There may be risks of delay and costs in recovery of securities or even loss of rights in the collateral should the borrower of the securities fail financially. If the Fund is not able to recover securities lent, the Fund may sell the collateral and purchase a replacement investment in the market, incurring the risk that the value of the replacement security is greater than the value of the collateral. The Fund is also subject to all investment risks associated with the reinvestment of any cash collateral received, including, but not limited to, interest rate, credit and liquidity risk associated with such investments.
As of October 31, 2018, the Fund had securities on loan which were classified as common stocks in the Investment Portfolio. The value of the related collateral exceeded the value of the securities loaned at period end. As of period end, the remaining contractual maturity of the collateral agreements was overnight and continuous.
Taxes. The Fund’s policy is to comply with the requirements of the Internal Revenue Code, as amended, which are applicable to regulated investment companies, and to distribute all of its taxable income to its shareholders.
Additionally, the Fund may be subject to taxes imposed by the governments of countries in which it invests and are generally based on income and/or capital gains earned or repatriated. Estimated tax liabilities on certain foreign securities are recorded on an accrual basis and are reflected as components of interest income or net change in unrealized gain/loss on investments. Tax liabilities realized as a result of security sales are reflected as a component of net realized gain/loss on investments.
At October 31, 2018, the Fund had a net tax basis capital loss carryforward of approximately $38,958,000, which may be applied against realized net taxable capital gains indefinitely, including short-term losses ($14,490,000) and long-term losses ($24,468,000).
| | | | | | |
| 32 | | | | | DWS Emerging Markets Equity Fund | | |
The Fund has reviewed the tax positions for the open tax years as of October 31, 2018 and has determined that no position for income tax and/or uncertain tax provisions is required in the Fund’s financial
statements. The Fund’s federal tax returns for the prior three fiscal years remain open subject to examination by the Internal Revenue Service.
Distribution of Income and Gains. Distributions from net investment income of the Fund, if any, are declared and distributed to shareholders annually. Net realized gains from investment transactions, in excess of available capital loss carryforwards, would be taxable to the Fund if not distributed, and, therefore, will be distributed to shareholders at least annually. The Fund may also make additional distributions for tax purposes, if necessary.
The timing and characterization of certain income and capital gain distributions are determined annually in accordance with federal tax regulations which may differ from accounting principles generally accepted in the United States of America. These differences primarily relate to investments in foreign denominated investments, investments in passive foreign investment companies, and certain securities sold at a loss. As a result, net investment income (loss) and net realized gain (loss) on investments for a reporting period may differ significantly from distributions during such period. Accordingly, the Fund may periodically make reclassifications among certain of its capital accounts without impacting the net asset value of the Fund.
At October 31, 2018, the Fund’s components of distributable earnings (accumulated losses) on a tax basis were as follows:
| | | | |
| Undistributed ordinary income* | | $ | 1,111,554 | |
| Capital loss carryforwards | | $ | (38,958,000 | ) |
| Net unrealized appreciation (depreciation) on investments | | $ | 4,578,923 | |
At October 31, 2018, the aggregate cost of investments for federal income tax purposes was $121,534,475. The net unrealized appreciation for all investments based on tax cost was $4,578,923. This consisted of aggregate gross unrealized appreciation for all investments which there was an excess of value over tax cost of $12,392,309 aggregate gross unrealized depreciation for all investments in which was an excess of tax cost over value of $7,813,386.
In addition, during the year ended October 31, 2018, the tax character of distributions paid to shareholders by the Fund is summarized as follows:
| | | | | | | | |
| | | Years Ended October 31, | |
| | | 2018 | | | 2017 | |
| Distributions from ordinary income* | | $ | 545,164 | | | $ | 258,552 | |
| * | For tax purposes, short-term capital gain distributions are considered income distributions. |
| | | | | | | | |
| | DWS Emerging Markets Equity Fund | | | | | | 33 | |
Expenses. Expenses of the Corporation arising in connection with a specific fund are allocated to that fund. Other Corporation expenses which cannot be directly attributed to a fund are apportioned among the funds in the Corporation based upon the relative net assets or other appropriate measures.
Contingencies. In the normal course of business, the Fund may enter into contracts with service providers that contain general indemnification clauses. The Fund’s maximum exposure under these arrangements is unknown, as this would involve future claims that may be made against the Fund that have not yet been made. However, based on experience, the Fund expects the risk of loss to be remote.
Other. Investment transactions are accounted for on a trade date plus one basis for daily net asset value calculations. However, for financial reporting purposes, investment transactions are reported on trade date. Interest income is recorded on the accrual basis. Dividend income is recorded on the ex-dividend date net of foreign withholding taxes. Certain dividends from foreign securities may be recorded subsequent to the ex-dividend date as soon as the Fund is informed of such dividends. Realized gains and losses from investment transactions are recorded on an identified cost basis. Proceeds from litigation payments, if any, are included in net realized gain (loss) from investments.
B. Purchases and Sales of Securities
During the year ended October 31, 2018, purchases and sales of investment securities (excluding short-term investments) aggregated $86,771,941 and $34,906,241, respectively.
C. Related Parties
Management Agreement. Under the Investment Management Agreement with DWS Investment Management Americas, Inc. (formerly Deutsche Investment Management Americas Inc.) (“DIMA” or the “Advisor”), an indirect, wholly owned subsidiary of DWS Group GmbH & Co. KGaA (“DWS Group”), the Advisor directs the investments of the Fund in accordance with its investment objectives, policies and restrictions. The Advisor determines the securities, instruments and other contracts relating to investments to be purchased, sold or entered into by the Fund or delegates such responsibility to the Fund’s subadvisor.
Deutsche Asset Management (Hong Kong) Limited (DeAM HK), an affiliate of DIMA, serves as subadvisor with respect to the investment and reinvestment of assets of the Fund, and is paid by the Advisor for their services.
| | | | | | |
| 34 | | | | | DWS Emerging Markets Equity Fund | | |
Under the Investment Management Agreement, the Fund pays a monthly management fee equal to an annual rate (exclusive of any applicable waivers/reimbursements) of 0.70% of the Fund’s average daily net assets, computed and accrued daily and payable monthly.
For the period from November 1, 2017 (September 7, 2018 (commencement of operations) for Class R6 shares) through September 30, 2019, the Advisor has contractually agreed to waive its fees and/or reimburse certain operating expenses of the Fund to the extent necessary to maintain the total annual operating expenses (excluding certain expenses such as extraordinary expenses, taxes, brokerage and interest) of certain classes as follows:
| | | | |
| Class A | | | 1.15% | |
| Class T | | | 1.15% | |
| Class C | | | 1.90% | |
| Class R6 | | | .90% | |
| Class S | | | .98% | |
| Institutional Class | | | .90% | |
For the year ended October 31, 2018, fees waived and/or expenses reimbursed for each class are as follows:
| | | | |
| Class A | | $ | 42,435 | |
| Class T | | | 32 | |
| Class C | | | 14,631 | |
| Class R6 | | | 7 | |
| Class S | | | 264,037 | |
| Institutional Class | | | 51,900 | |
| | | $ | 373,042 | |
Administration Fee. Pursuant to an Administrative Services Agreement, DIMA provides most administrative services to the Fund. For all services provided under the Administrative Services Agreement, the Fund pays the Advisor an annual fee (“Administration Fee”) of 0.10% of the Fund’s average daily net assets, computed and accrued daily and payable monthly. For the year ended October 31, 2018, the Administration Fee was $113,165, of which $11,121 is unpaid.
Service Provider Fees. DWS Service Company (“DSC”), an affiliate of the Advisor, is the transfer agent, dividend-paying agent and shareholder service agent for the Fund. Pursuant to a sub-transfer agency agreement between DSC and DST Systems, Inc. (“DST”), DSC has delegated certain transfer agent, dividend-paying agent and shareholder service agent functions to DST. DSC compensates DST out of the shareholder servicing
| | | | | | | | |
| | DWS Emerging Markets Equity Fund | | | | | | 35 | |
fee it receives from the Fund. For the year ended October 31, 2018, the amounts charged to the Fund by DSC were as follows:
| | | | | | | | |
| Services to Shareholders | | Total
Aggregated | | | Unpaid at
October 31, 2018 | |
| Class A | | $ | 11,791 | | | $ | 3,796 | |
| Class T | | | 19 | | | | 7 | |
| Class C | | | 1,628 | | | | 559 | |
| Class R6 | | | 3 | | | | 3 | |
| Class S | | | 53,430 | | | | 18,069 | |
| Institutional Class | | | 610 | | | | 212 | |
| | | $ | 67,481 | | | $ | 22,646 | |
In addition, for the year ended October 31, 2018, the amounts charged to the Fund for recordkeeping and other administrative services provided by unaffiliated third parties, included in the Statement of Operations under “Services to shareholders”, were as follows:
| | | | |
| Sub-Recordkeeping | | Total
Aggregated | |
| Class A | | $ | 10,367 | |
| Class C | | | 5,168 | |
| Class S | | | 109,475 | |
| Institutional Class | | | 12,909 | |
| | | $ | 137,919 | |
Distribution and Service Fees. Under the Fund’s Class C 12b-1 Plan, DWS Distributors, Inc. (“DDI”), an affiliate of the Advisor, receives a fee (“Distribution Fee”) of 0.75% of average daily net assets of Class C shares. In accordance with the Fund’s Underwriting and Distribution Services Agreement, DDI enters into related selling group agreements with various firms at various rates for sales of Class C shares. For the year ended October 31, 2018, the Distribution Fee was as follows:
| | | | | | | | |
| Distribution Fee | | Total
Aggregated | | | Unpaid at
October 31, 2018 | |
| Class C | | $ | 30,755 | | | $ | 1,896 | |
In addition, DDI provides information and administrative services for a fee (“Service Fee”) to Class A, T and C shareholders at an annual rate of up to 0.25% of average daily net assets for each such class. DDI in turn has various agreements with financial services firms that provide these services and pays these fees based upon the assets of shareholder
| | | | | | |
| 36 | | | | | DWS Emerging Markets Equity Fund | | |
accounts the firms service. For the year ended October 31, 2018, the Service Fee was as follows:
| | | | | | | | | | | | |
| Service Fee | | Total
Aggregated | | | Unpaid at
October 31, 2018 | | | Annual
Rate | |
| Class A | | $ | 25,050 | | | $ | 3,945 | | | | .23 | % |
| Class T | | | 18 | | | | 9 | | | | .16 | % |
| Class C | | | 9,662 | | | | 983 | | | | .24 | % |
| | | $ | 34,730 | | | $ | 4,937 | | | | | |
Underwriting Agreement and Contingent Deferred Sales Charge. DDI is the principal underwriter for the Fund. Underwriting commissions paid in connection with the distribution of Class A shares for the year ended October 31, 2018 aggregated $5,034.
In addition, DDI receives any contingent deferred sales charge (“CDSC”) from Class C share redemptions occurring within one year of purchase. There is no such charge upon redemption of any share appreciation or reinvested dividends. The CDSC is 1% of the value of the shares redeemed for Class C. For the year ended October 31, 2018, the CDSC for Class C shares aggregated $634. A deferred sales charge of up to 1% is assessed on certain redemptions of Class A shares.
Typesetting and Filing Service Fees. Under an agreement with DIMA, DIMA is compensated for providing certain prepress and regulatory filing services to the Fund. For the year ended October 31, 2018, the amount charged to the Fund by DIMA included in the Statement of Operations under “Reports to shareholders” aggregated $19,843, of which $9,611 is unpaid.
Directors’ Fees and Expenses. The Fund paid retainer fees to each Director not affiliated with the Advisor, plus specified amounts to the Board Chairperson and to each committee Chairperson.
Affiliated Cash Management Vehicles. The Fund may invest uninvested cash balances in DWS Central Cash Management Government Fund and DWS ESG Liquidity Fund, affiliated money market funds which are managed by the Advisor. Each affiliated money market fund seeks to provide a high level of current income consistent with liquidity and the preservation of capital. Each affiliated money market fund is managed in accordance with Rule 2a-7 under the 1940 Act, which governs the quality, maturity, diversity and liquidity of instruments in which a money market fund may invest. DWS Central Cash Management Government Fund seeks to maintain a stable net asset value, and DWS ESG Liquidity Fund maintains a floating net asset value. The Fund indirectly bears its proportionate share of the expenses of each affiliated money market fund in which it invests. DWS Central Cash Management Government Fund
| | | | | | | | |
| | DWS Emerging Markets Equity Fund | | | | | | 37 | |
does not pay the Advisor an investment management fee. To the extent that DWS ESG Liquidity Fund pays an investment management fee to the Advisor, the Advisor will waive an amount of the investment management fee payable to the Advisor by the Fund equal to the amount of the investment management fee payable on the Fund’s assets invested in DWS ESG Liquidity Fund.
Security Lending Fees. Deutsche Bank AG serves as lending agent for the Fund. For the year ended October 31, 2018, the Fund incurred lending agent fees to Deutsche Bank AG for the amount of $774.
D. Investing in Emerging Markets
Investing in emerging markets may involve special risks and considerations not typically associated with investing in developed markets. These risks include revaluation of currencies, high rates of inflation or deflation, repatriation restrictions on income and capital, and future adverse political, social and economic developments. Moreover, securities issued in these markets may be less liquid, subject to government ownership controls or delayed settlements, and may have prices that are more volatile or less easily assessed than those of comparable securities of issuers in developed markets.
E. Line of Credit
The Fund and other affiliated funds (the “Participants”) share in a $400 million revolving credit facility provided by a syndication of banks. The Fund may borrow for temporary or emergency purposes, including the meeting of redemption requests that otherwise might require the untimely disposition of securities. The Participants are charged an annual commitment fee which is allocated based on net assets, among each of the Participants. Interest is calculated at a rate per annum equal to the sum of the Federal Funds Rate plus 1.25 percent, plus if the one-month LIBOR exceeds the Federal Funds Rate, the amount of such excess. The Fund may borrow up to a maximum of 25 percent of its net assets under the agreement. The Fund had no outstanding loans at October 31, 2018.
| | | | | | |
| 38 | | | | | DWS Emerging Markets Equity Fund | | |
F. Fund Share Transactions
The following table summarizes share and dollar activity in the Fund:
| | | | | | | | | | | | | | | | | | | | | | | | | | | | | | | | |
| | | Year Ended October 31, 2018 | | | Year Ended October 31, 2017 | |
| | | | | | Shares | | | Dollars | | | | | | | | | Shares | | | Dollars | | | | |
|
| Shares sold | |
| Class A | | | | | | | 235,489 | | | $ | 4,727,401 | | | | | | | | | | | | 165,903 | | | $ | 2,930,038 | | | | | |
| Class T | | | | | | | — | | | | — | | | | | | | | | | | | 570 | * | | | 10,001 | * | | | | |
| Class C | | | | | | | 142,537 | | | | 2,574,024 | | | | | | | | | | | | 70,037 | | | | 1,115,546 | | | | | |
| Class R6 | | | | | | | 535 | ** | | | 10,001 | ** | | | | | | | | | | | — | | | | — | | | | | |
| Class S | | | | | | | 3,491,473 | | | | 69,341,347 | | | | | | | | | | | | 1,029,712 | | | | 18,016,958 | | | | | |
| Institutional Class | | | | | | | 2,163,326 | | | | 42,082,129 | | | | | | | | | | | | 475,444 | | | | 8,664,488 | | | | | |
| | | | | | | | | | | $ | 118,734,902 | | | | | | | | | | | | | | | $ | 30,737,031 | | | | | |
|
| Shares issued to shareholders in reinvestment of distributions | |
| Class A | | | | | | | 2,383 | | | $ | 47,718 | | | | | | | | | | | | 1,358 | | | $ | 19,820 | | | | | |
| Class T | | | | | | | 3 | | | | 52 | | | | | | | | | | | | — | | | | — | | | | | |
| Class S | | | | | | | 19,679 | | | | 399,090 | | | | | | | | | | | | 14,587 | | | | 215,456 | | | | | |
| Institutional Class | | | | | | | 3,604 | | | | 72,972 | | | | | | | | | | | | 381 | | | | 5,617 | | | | | |
| | | | | | | | | | | $ | 519,832 | | | | | | | | | | | | | | | $ | 240,893 | | | | | |
|
| Shares redeemed | |
| Class A | | | | | | | (215,722 | ) | | $ | (4,283,465 | ) | | | | | | | | | | | (179,068 | ) | | $ | (2,874,160 | ) | | | | |
| Class C | | | | | | | (145,019 | ) | | | (2,503,012 | ) | | | | | | | | | | | (34,547 | ) | | | (515,649 | ) | | | | |
| Class S | | | | | | | (1,811,607 | ) | | | (35,487,705 | ) | | | | | | | | | | | (676,646 | ) | | | (11,668,974 | ) | | | | |
| Institutional Class | | | | | | | (1,076,969 | ) | | | (20,057,826 | ) | | | | | | | | | | | (71,470 | ) | | | (1,327,054 | ) | | | | |
| | | | | | | | | | | $ | (62,332,008 | ) | | | | | | | | | | | | | | $ | (16,385,837 | ) | | | | |
|
| Net increase (decrease) | |
| Class A | | | | | | | 22,150 | | | $ | 491,654 | | | | | | | | | | | | (11,807 | ) | | $ | 75,698 | | | | | |
| Class T | | | | | | | 3 | | | | 52 | | | | | | | | | | | | 570 | * | | | 10,001 | * | | | | |
| Class C | | | | | | | (2,482 | ) | | | 71,012 | | | | | | | | | | | | 35,490 | | | | 599,897 | | | | | |
| Class R6 | | | | | | | 535 | ** | | | 10,001 | ** | | | | | | | | | | | — | | | | — | | | | | |
| Class S | | | | | | | 1,699,545 | | | | 34,252,732 | | | | | | | | | | | | 367,653 | | | | 6,563,440 | | | | | |
| Institutional Class | | | | | | | 1,089,961 | | | | 22,097,275 | | | | | | | | | | | | 404,355 | | | | 7,343,051 | | | | | |
| | | | | | | | | | | $ | 56,922,726 | | | | | | | | | | | | | | | $ | 14,592,087 | | | | | |
| * | For the period from June 5, 2017 (commencement of operations of Class T) to October 31, 2017. |
| ** | For the period from September 7, 2018 (commencement of operations of Class R6) to October 31, 2018. |
| | | | | | | | |
| | DWS Emerging Markets Equity Fund | | | | | | 39 | |
Report of Independent Registered
Public Accounting Firm
To the Board of Trustees of Deutsche DWS International Fund, Inc. and Shareholders of DWS Emerging Markets Equity Fund
Opinion on the Financial Statements
We have audited the accompanying statement of assets and liabilities, including the investment portfolio, of DWS Emerging Markets Equity Fund (one of the funds constituting Deutsche DWS International Fund, Inc., referred to hereafter as the “Fund”) as of October 31, 2018, the related statement of operations for the year ended October 31, 2018, the statements of changes in net assets for each of the two years in the period ended October 31, 2018, including the related notes, and the financial highlights for each of the periods indicated therein (collectively referred to as the “financial statements”). In our opinion, the financial statements present fairly, in all material respects, the financial position of the Fund as of October 31, 2018, the results of its operations for the year then ended, the changes in its net assets for each of the two years in the period ended October 31, 2018 and the financial highlights for each of the periods indicated therein in conformity with accounting principles generally accepted in the United States of America.
Basis for Opinion
These financial statements are the responsibility of the Fund’s management. Our responsibility is to express an opinion on the Fund’s financial statements based on our audits. We are a public accounting firm registered with the Public Company Accounting Oversight Board (United States) (“PCAOB”) and are required to be independent with respect to the Fund in accordance with the U.S. federal securities laws and the applicable rules and regulations of the Securities and Exchange Commission and the PCAOB.
We conducted our audits of these financial statements in accordance with the standards of the PCAOB. Those standards require that we plan and perform the audit to obtain reasonable assurance about whether the financial statements are free of material misstatement, whether due to error or fraud.
| | | | | | |
| 40 | | | | | DWS Emerging Markets Equity Fund | | |
Our audits included performing procedures to assess the risks of material misstatement of the financial statements, whether due to error or fraud, and performing procedures that respond to those risks. Such procedures included examining, on a test basis, evidence regarding the amounts and disclosures in the financial statements. Our audits also included evaluating the accounting principles used and significant estimates made by management, as well as evaluating the overall presentation of the financial statements. Our procedures included confirmation of securities owned as of October 31, 2018 by correspondence with the custodian, transfer agent and brokers; when replies were not received from brokers, we performed other auditing procedures. We believe that our audits provide a reasonable basis for our opinion.
PricewaterhouseCoopers LLP
Boston, Massachusetts
December 20, 2018
We have served as the auditor of one or more investment companies in the DWS family of funds since 1930.
| | | | | | | | |
| | DWS Emerging Markets Equity Fund | | | | | | 41 | |
Information About Your Fund’s Expenses
As an investor of the Fund, you incur two types of costs: ongoing expenses and transaction costs. Ongoing expenses include management fees, distribution and service (12b-1) fees and other Fund expenses. Examples of transaction costs include sales charges (loads) and account maintenance fees, which are not shown in this section. The following tables are intended to help you understand your ongoing expenses (in dollars) of investing in the Fund and to help you compare these expenses with the ongoing expenses of investing in other mutual funds. In the most recent six-month period, the Fund limited these expenses; had it not done so, expenses would have been higher. The example in the table is based on an investment of $1,000 invested at the beginning of the six-month period and held for the entire period (May 1, 2018 to October 31, 2018).
The tables illustrate your Fund’s expenses in two ways:
| – | Actual Fund Return. This helps you estimate the actual dollar amount of ongoing expenses (but not transaction costs) paid on a $1,000 investment in the Fund using the Fund’s actual return during the period. To estimate the expenses you paid over the period, simply divide your account value by $1,000 (for example, an $8,600 account value divided by $1,000 = 8.6), then multiply the result by the number in the “Expenses Paid per $1,000” line under the share class you hold. |
| – | Hypothetical 5% Fund Return. This helps you to compare your Fund’s ongoing expenses (but not transaction costs) with those of other mutual funds using the Fund’s actual expense ratio and a hypothetical rate of return of 5% per year before expenses. Examples using a 5% hypothetical fund return may be found in the shareholder reports of other mutual funds. The hypothetical account values and expenses may not be used to estimate the actual ending account balance or expenses you paid for the period. |
Please note that the expenses shown in these tables are meant to highlight your ongoing expenses only and do not reflect any transaction costs. The “Expenses Paid per $1,000” line of the tables is useful in comparing ongoing expenses only and will not help you determine the relative total expense of owning different funds. Subject to certain exceptions, an account maintenance fee of $20.00 assessed once per calendar year for Classes A, C and S shares may apply for accounts with balances less than $10,000. This fee is not included in these tables. If it was, the estimate of expenses paid for Classes A, C and S shares during the period would be higher, and account value during the period would be lower, by this amount.
| | | | | | |
| 42 | | | | | DWS Emerging Markets Equity Fund | | |
| | | | | | | | | | | | | | | | | | | | | | | | |
Expenses and Value of a $1,000 Investment
for the six months ended October 31, 2018 (Unaudited) | |
| | | | | | |
| Actual Fund Return | | Class A | | | Class T | | | Class C | | | Class R6* | | | Class S | | | Institutional
Class | |
| Beginning Account Value 5/1/18 | | $ | 1,000.00 | | | $ | 1,000.00 | | | $ | 1,000.00 | | | $ | 1,000.00 | | | $ | 1,000.00 | | | $ | 1,000.00 | |
| Ending Account Value 10/31/18 | | $ | 866.20 | | | $ | 866.20 | | | $ | 862.70 | | | $ | 963.10 | | | $ | 867.50 | | | $ | 867.80 | |
| Expenses Paid per $1,000** | | $ | 5.41 | | | $ | 5.41 | | | $ | 8.92 | | | $ | 1.33 | | | $ | 4.61 | | | $ | 4.24 | |
| | | | | | |
Hypothetical 5%
Fund Return | | Class A | | | Class T | | | Class C | | | Class R6 | | | Class S | | | Institutional
Class | |
| Beginning Account Value 5/1/18 | | $ | 1,000.00 | | | $ | 1,000.00 | | | $ | 1,000.00 | | | $ | 1,000.00 | | | $ | 1,000.00 | | | $ | 1,000.00 | |
| Ending Account Value 10/31/18 | | $ | 1,019.41 | | | $ | 1,019.41 | | | $ | 1,015.63 | | | $ | 1,020.67 | | | $ | 1,020.27 | | | $ | 1,020.67 | |
| Expenses Paid per $1,000** | | $ | 5.85 | | | $ | 5.85 | | | $ | 9.65 | | | $ | 4.58 | | | $ | 4.99 | | | $ | 4.58 | |
| * | For the period from September 7, 2018 (commencement of operations of Class R6) to October 31, 2018. |
| ** | Expenses (hypothetical expenses if Class R6 had been in existence from May 1, 2018) are equal to the Fund’s annualized expense ratio for each share class, multiplied by the average account value over the period, multiplied by 184 (the number of days in the most recent six-month period), then divided by 365. |
| | | | | | | | | | | | | | | | | | | | | | | | |
Annualized Expense
Ratios | | Class A | | | Class T | | | Class C | | | Class R6 | | | Class S | | | Institutional
Class | |
| DWS Emerging Markets Equity Fund | | | 1.15 | | | | 1.15 | | | | 1.90 | | | | .90 | | | | .98 | | | | .90 | |
For more information, please refer to the Fund’s prospectus.
For an analysis of the fees associated with an investment in the Fund or similar funds, please refer to http://apps.finra.org/fundanalyzer/1/fa.aspx.
| | | | | | | | |
| | DWS Emerging Markets Equity Fund | | | | | | 43 | |
| | |
| Tax Information | | (Unaudited) |
The Fund paid foreign taxes of $212,767 and earned $1,349,448 of foreign source income during the year ended October 31, 2018 Pursuant to Section 853 of the Internal Revenue Code, the Fund designates $0.03 per share as foreign taxes paid and $0.19 per share as income earned from foreign sources for the year ended October 31, 2018.
For federal income tax purposes, the Fund designates $2,858,000, or the maximum amount allowable under tax law, as qualified dividend income.
Please consult a tax advisor if you have questions about federal or state income tax laws, or on how to prepare your tax returns. If you have specific questions about your account, please call (800) 728-3337.
| | | | | | |
| 44 | | | | | DWS Emerging Markets Equity Fund | | |
Advisory Agreement Board Considerations and Fee Evaluation
The Board of Directors (hereinafter referred to as the “Board” or “Directors”) approved the renewal of DWS Emerging Markets Equity Fund’s (the “Fund”) investment management agreement (the “Agreement”) with DWS Investment Management Americas, Inc. (“DIMA”) and sub-advisory agreement (the “Sub-Advisory Agreement” and together with the Agreement, the “Agreements”) between DIMA and Deutsche Asset Management (Hong Kong) Limited (“DeAM HK”), an affiliate of DIMA, in September 2018.
In terms of the process that the Board followed prior to approving the Agreements, shareholders should know that:
| – | During the entire process, all of the Fund’s Directors were independent of DIMA and its affiliates (the “Independent Directors”). |
| – | The Board met frequently during the past year to discuss fund matters and dedicated a substantial amount of time to contract review matters. Over the course of several months, the Board’s Contract Committee reviewed extensive materials received from DIMA, independent third parties and independent counsel. These materials included an analysis of the Fund’s performance, fees and expenses, and profitability from a fee consultant retained by the Fund’s Independent Directors (the “Fee Consultant”). Based on its evaluation of the information provided, the Contract Committee presented its findings and recommendations to the Board. The Board then reviewed the Contract Committee’s findings and recommendations. |
| – | The Board also received extensive information throughout the year regarding performance of the Fund. |
| – | The Independent Directors regularly met privately with counsel to discuss contract review and other matters. In addition, the Independent Directors were advised by the Fee Consultant in the course of their review of the Fund’s contractual arrangements and considered a comprehensive report prepared by the Fee Consultant in connection with their deliberations. |
| – | In connection with reviewing the Agreements, the Board also reviewed the terms of the Fund’s Rule 12b-1 plan, distribution agreement, administrative services agreement, transfer agency agreement and other material service agreements. |
In connection with the contract review process, the Contract Committee and the Board considered the factors discussed below, among others.
| | | | | | | | |
| | DWS Emerging Markets Equity Fund | | | | | | 45 | |
The Board also considered that DIMA and its predecessors have managed the Fund since its inception, and the Board believes that a long-term relationship with a capable, conscientious advisor is in the best interests of the Fund. The Board considered, generally, that shareholders chose to invest or remain invested in the Fund knowing that DIMA managed the Fund. DIMA and DeAM HK are part of DWS Group GmbH & Co. KGaA (“DWS Group”). DWS Group is a global asset management business that offers a wide range of investing expertise and resources, including research capabilities in many countries throughout the world. In 2018, approximately 20% of DWS Group’s shares were sold in an initial public offering, with Deutsche Bank AG owning the remaining shares.
As part of the contract review process, the Board carefully considered the fees and expenses of each DWS fund overseen by the Board in light of the fund’s performance. In many cases, this led to the negotiation and implementation of expense caps. As part of these negotiations, the Board indicated that it would consider relaxing these caps in future years following sustained improvements in performance, among other considerations.
While shareholders may focus primarily on fund performance and fees, the Fund’s Board considers these and many other factors, including the quality and integrity of DIMA’s and DeAM HK’s personnel and administrative support services provided by DIMA, such as back-office operations, fund valuations, and compliance policies and procedures.
Nature, Quality and Extent of Services. The Board considered the terms of the Agreements, including the scope of advisory services provided under the Agreements. The Board noted that, under the Agreements, DIMA and DeAM HK provide portfolio management services to the Fund and that, pursuant to a separate administrative services agreement, DIMA provides administrative services to the Fund. The Board considered the experience and skills of senior management and investment personnel and the resources made available to such personnel. Throughout the course of the year, the Board also received information regarding DIMA’s oversight of Fund sub-advisers, including DeAM HK. The Board reviewed the Fund’s performance over short-term and long-term periods and compared those returns to various agreed-upon performance measures, including market index(es) and a peer universe compiled using information supplied by Morningstar Direct (“Morningstar”), an independent fund data service. The Board also noted that it has put into place a process of identifying “Funds in Review” (e.g., funds performing poorly relative to a peer universe), and receives additional reporting from DIMA regarding such funds and, where appropriate, DIMA’s plans to address underperformance. The Board believes this process is an effective manner of identifying and addressing underperforming funds. Based on the information provided, the Board noted that, for the one-, three- and
| | | | | | |
| 46 | | | | | DWS Emerging Markets Equity Fund | | |
five-year periods ended December 31, 2017, the Fund’s performance (Class A shares) was in the 2nd quartile of the applicable Morningstar universe (the 1st quartile being the best performers and the 4th quartile being the worst performers). The Board also observed that the Fund has outperformed its benchmark in the one-, three- and five-year periods ended December 31, 2017.
Fees and Expenses. The Board considered the Fund’s investment management fee schedule, sub-advisory fee schedule, operating expenses and total expense ratios, and comparative information provided by Broadridge Financial Solutions, Inc. (“Broadridge”) and the Fee Consultant regarding investment management fee rates paid to other investment advisors by similar funds (1st quartile being the most favorable and 4th quartile being the least favorable). With respect to management fees paid to other investment advisors by similar funds, the Board noted that the contractual fee rates paid by the Fund, which include a 0.10% fee paid to DIMA under the Fund’s administrative services agreement, were lower than the median (1st quartile) of the applicable Broadridge peer group (based on Broadridge data provided as of December 31, 2017). The Board considered that, effective May 1, 2017, DIMA agreed to reduce the Fund’s contractual management fee rate to an annual rate of 0.70%. With respect to the sub-advisory fee paid to DeAM HK, the Board noted that the fee is paid by DIMA out of its fee and not directly by the Fund. The Board noted that the Fund’s Class A shares total (net) operating expenses (excluding 12b-1 fees) were expected to be lower than the median of the applicable Broadridge expense universe (based on Broadridge data provided as of December 31, 2017, and analyzing Broadridge expense universe Class A (net) expenses less any applicable 12b-1 fees) (“Broadridge Universe Expenses”). The Board also reviewed data comparing each share class’s total (net) operating expenses to the applicable Broadridge Universe Expenses. The Board noted that the expense limitations agreed to by DIMA were expected to help the Fund’s total (net) operating expenses remain competitive. The Board considered the Fund’s management fee rate as compared to fees charged by DIMA to a comparable DWS U.S. registered fund (“DWS Funds”) and considered differences between the Fund and the comparable DWS Fund. The information requested by the Board as part of its review of fees and expenses also included information about institutional accounts (including any sub-advised funds and accounts) and funds offered primarily to European investors (“DWS Europe Funds”) managed by DWS Group. The Board noted that DIMA indicated that DWS Group does not manage any institutional accounts or DWS Europe Funds comparable to the Fund.
On the basis of the information provided, the Board concluded that management fees were reasonable and appropriate in light of the nature, quality and extent of services provided by DIMA and DeAM HK.
| | | | | | | | |
| | DWS Emerging Markets Equity Fund | | | | | | 47 | |
Profitability. The Board reviewed detailed information regarding revenues received by DIMA under the Agreement. The Board considered the estimated costs to DIMA, and pre-tax profits realized by DIMA, from advising the DWS Funds, as well as estimates of the pre-tax profits attributable to managing the Fund in particular. The Board also received information regarding the estimated enterprise-wide profitability of DIMA and its affiliates with respect to all fund services in totality and by fund. The Board and the Fee Consultant reviewed DIMA’s methodology in allocating its costs to the management of the Fund. Based on the information provided, the Board concluded that the pre-tax profits realized by DIMA in connection with the management of the Fund were not unreasonable. The Board also reviewed certain publicly available information regarding the profitability of certain similar investment management firms. The Board noted that, while information regarding the profitability of such firms is limited (and in some cases is not necessarily prepared on a comparable basis), DIMA and its affiliates’ overall profitability with respect to the DWS Funds (after taking into account distribution and other services provided to the funds by DIMA and its affiliates) was lower than the overall profitability levels of most comparable firms for which such data was available.
Economies of Scale. The Board considered whether there are economies of scale with respect to the management of the Fund and whether the Fund benefits from any economies of scale. In this regard, the Board observed that while the Fund’s current investment management fee schedule does not include breakpoints, the Fund’s fee schedule represents an appropriate sharing between the Fund and DIMA of such economies of scale as may exist in the management of the Fund at current asset levels.
Other Benefits to DIMA and Its Affiliates. The Board also considered the character and amount of other incidental or “fall-out” benefits received by DIMA and its affiliates, including any fees received by DIMA for administrative services provided to the Fund, any fees received by an affiliate of DIMA for transfer agency services provided to the Fund and any fees received by an affiliate of DIMA for distribution services. The Board also considered benefits to DIMA related to brokerage and soft-dollar allocations, including allocating brokerage to pay for research generated by parties other than the executing broker dealers, which pertain primarily to funds investing in equity securities. In addition, the Board considered the incidental public relations benefits to DIMA related to DWS Funds advertising and cross-selling opportunities among DIMA products and services. The Board considered these benefits in reaching its conclusion that the Fund’s management fees were reasonable.
Compliance. The Board considered the significant attention and resources dedicated by DIMA to its compliance processes in recent years. The
| | | | | | |
| 48 | | | | | DWS Emerging Markets Equity Fund | | |
Board noted in particular (i) the experience, seniority and time commitment of the individuals serving as DIMA’s and the Fund’s chief compliance officers and (ii) the substantial commitment of resources by DIMA and its affiliates to compliance matters, including the retention of compliance personnel.
Based on all of the information considered and the conclusions reached, the Board unanimously determined that the continuation of the Agreements is in the best interests of the Fund. In making this determination, the Board did not give particular weight to any single factor identified above. The Board considered these factors over the course of numerous meetings, certain of which were in executive session with only the Independent Directors and counsel present. It is possible that individual Independent Directors may have weighed these factors differently in reaching their individual decisions to approve the continuation of the Agreements.
| | | | | | | | |
| | DWS Emerging Markets Equity Fund | | | | | | 49 | |
Board Members and Officers
The following table presents certain information regarding the Board Members and Officers of the Fund. Each Board Member’s year of birth is set forth in parentheses after his or her name. Unless otherwise noted, (i) each Board Member has engaged in the principal occupation(s) noted in the table for at least the most recent five years, although not necessarily in the same capacity; and (ii) the address of each Independent Board Member is c/o Keith R. Fox, DWS Funds Board Chair, c/o Thomas R. Hiller, Ropes & Gray LLP, Prudential Tower, 800 Boylston Street, Boston, MA 02199-3600. Except as otherwise noted below, the term of office for each Board Member is until the election and qualification of a successor, or until such Board Member sooner dies, resigns, is removed or as otherwise provided in the governing documents of the Fund. Because the Fund does not hold an annual meeting of shareholders, each Board Member will hold office for an indeterminate period. The Board Members may also serve in similar capacities with other funds in the fund complex.
| | | | | | | | |
| Independent Board Members | | | | | | |
Name, Year of
Birth, Position
with the Fund
and Length of
Time Served1 | | Business Experience and Directorships
During the Past Five Years | | Number of
Funds in
DWS Fund
Complex
Overseen | | | Other
Directorships
Held by Board
Member
|
Keith R. Fox, CFA (1954) Chairperson since 2017, and Board Member since 1996 | | Managing General Partner, Exeter Capital Partners (a series of private investment funds) (since 1986). Directorships: Progressive International Corporation (kitchen goods importer and distributor); The Kennel Shop (retailer); former Chairman, National Association of Small Business Investment Companies; former Directorships: BoxTop Media Inc. (advertising); Sun Capital Advisers Trust (mutual funds) (2011–2012) | | | 85 | | | — |
John W. Ballantine (1946) Board Member since 1999 | | Retired; formerly, Executive Vice President and Chief Risk Management Officer, First Chicago NBD Corporation/The First National Bank of Chicago (1996–1998); Executive Vice President and Head of International Banking (1995–1996); former Directorships: Director and former Chairman of the Board, Healthways, Inc.2 (population well-being and wellness services) (2003–2014); Stockwell Capital Investments PLC (private equity); Enron Corporation; FNB Corporation; Tokheim Corporation; First Oak Brook Bancshares, Inc. and Oak Brook Bank; Prisma Energy International. Not-for-Profit Director, Trustee: Palm Beach Civic Association; Public Radio International; Window to the World Communications (public media); Harris Theater for Music and Dance (Chicago) | | | 85 | | | Portland
General
Electric2
(utility
company)
(2003–
present) |
| | | | | | |
| 50 | | | | | DWS Emerging Markets Equity Fund | | |
| | | | | | | | |
Name, Year of
Birth, Position
with the Fund
and Length of
Time Served1 | | Business Experience and Directorships
During the Past Five Years | | Number of
Funds in
DWS Fund
Complex
Overseen | | | Other
Directorships
Held by Board
Member
|
Henry P. Becton, Jr. (1943) Board Member since 1990 | | Vice Chair and former President, WGBH Educational Foundation. Directorships: Public Radio International; Public Radio Exchange (PRX); The Pew Charitable Trusts (charitable organization); Massachusetts Humane Society; American Documentary, Inc. (public media); Overseer of the New England Conservatory; former Directorships: Becton Dickinson and Company2 (medical technology company); Belo Corporation2 (media company); The PBS Foundation; Association of Public Television Stations; Boston Museum of Science; American Public Television; Concord Academy; New England Aquarium; Mass. Corporation for Educational Telecommunications; Committee for Economic Development; Public Broadcasting Service; Connecticut College; North Bennett Street School (Boston) | | | 85 | | | — |
Dawn-Marie Driscoll (1946) Board Member since 1987 | | Emeritus Executive Fellow, Center for Business Ethics, Bentley University; formerly: President, Driscoll Associates (consulting firm); Partner, Palmer & Dodge (law firm) (1988–1990); Vice President of Corporate Affairs and General Counsel, Filene’s (retail) (1978–1988). Directorships: Advisory Board, Center for Business Ethics, Bentley University; Trustee and former Chairman of the Board, Southwest Florida Community Foundation (charitable organization); former Directorships: ICI Mutual Insurance Company (2007–2015); Sun Capital Advisers Trust (mutual funds) (2007–2012), Investment Company Institute (audit, executive, nominating committees) and Independent Directors Council (governance, executive committees) | | | 85 | | | — |
Paul K. Freeman (1950) Board Member since 1993 | | Consultant, World Bank/Inter-American Development Bank; Independent Directors Council (former chair); Investment Company Institute (executive committee); Adjunct Professor, University of Denver Law School (2017–present); formerly: Chairman of Education Committee of Independent Directors Council; Project Leader, International Institute for Applied Systems Analysis (1998–2001); Chief Executive Officer, The Eric Group, Inc. (environmental insurance) (1986–1998); Directorships: Knoebel Institute for Healthy Aging, University of Denver (2017–present); former Directorships: Prisma Energy International; Denver Zoo Foundation (2012–2018) | | | 85 | | | — |
| | | | | | | | |
| | DWS Emerging Markets Equity Fund | | | | | | 51 | |
| | | | | | | | |
Name, Year of
Birth, Position
with the Fund
and Length of
Time Served1 | | Business Experience and Directorships
During the Past Five Years | | Number of
Funds in
DWS Fund
Complex
Overseen | | | Other
Directorships
Held by Board
Member
|
Richard J. Herring (1946) Board Member since 1990 | | Jacob Safra Professor of International Banking and Professor, Finance Department, The Wharton School, University of Pennsylvania (since July 1972); Co-Director, Wharton Financial Institutions Center; formerly: Vice Dean and Director, Wharton Undergraduate Division (July 1995–June 2000); Director, Lauder Institute of International Management Studies (July 2000–June 2006) | | | 85 | | | Director,
Aberdeen
Singapore
and Japan
Funds (since
2007);
Independent
Director of
Barclays
Bank
Delaware
(since
September
2010) |
William McClayton (1944) Board Member since 2004 | | Private equity investor (since October 2009); previously, Managing Director, Diamond Management & Technology Consultants, Inc. (global consulting firm) (2001–2009); Directorship: Board of Managers, YMCA of Metropolitan Chicago; formerly: Senior Partner, Arthur Andersen LLP (accounting) (1966–2001); Trustee, Ravinia Festival | | | 85 | | | — |
Rebecca W. Rimel (1951) Board Member since 1995 | | President, Chief Executive Officer and Director, The Pew Charitable Trusts (charitable organization) (1994–present); formerly: Executive Vice President, The Glenmede Trust Company (investment trust and wealth management) (1983–2004); Board Member, Investor Education (charitable organization) (2004–2005); Trustee, Executive Committee, Philadelphia Chamber of Commerce (2001–2007); Director, Viasys Health Care2 (January 2007–June 2007); Trustee, Thomas Jefferson Foundation (charitable organization) (1994–2012) | | | 85 | | | Director,
Becton
Dickinson
and
Company2
(medical
technology
company)
(2012–
present);
Director,
BioTelemetry
Inc.2 (health
care) (2009–
present) |
William N. Searcy, Jr. (1946) Board Member since 1993 | | Private investor since October 2003; formerly: Pension & Savings Trust Officer, Sprint Corporation2 (telecommunications) (November 1989–September 2003); Trustee, Sun Capital Advisers Trust (mutual funds) (1998–2012) | | | 85 | | | — |
| | | | | | |
| 52 | | | | | DWS Emerging Markets Equity Fund | | |
| | | | | | | | |
Name, Year of
Birth, Position
with the Fund
and Length of
Time Served1 | | Business Experience and Directorships
During the Past Five Years | | Number of
Funds in
DWS Fund
Complex
Overseen | | | Other
Directorships
Held by Board
Member
|
Jean Gleason Stromberg (1943) Board Member since 1997 | | Retired. Formerly, Consultant (1997–2001); Director, Financial Markets U.S. Government Accountability Office (1996–1997); Partner, Norton Rose Fulbright, L.L.P. (law firm) (1978–1996); former Directorships: The William and Flora Hewlett Foundation (charitable organization) (2000–2015); Service Source, Inc. (nonprofit), Mutual Fund Directors Forum (2002–2004), American Bar Retirement Association (funding vehicle for retirement plans) (1987–1990 and 1994–1996) | | | 85 | | | — |
| | |
| Officers4 | | |
Name, Year of Birth, Position with the Fund and Length of Time Served5 | | Business Experience and Directorships During the Past Five Years |
Hepsen Uzcan6,9 (1974) President and Chief Executive Officer, 2017–present Assistant Secretary, 2013–present | | Managing Director,3 DWS; Secretary, DWS USA Corporation (since March 2018); Assistant Secretary, DWS Distributors, Inc. (since June 25, 2018); Director and Vice President, DWS Service Company (since June 25, 2018); Assistant Secretary, DWS Investment Management Americas, Inc. (since June 25, 2018); and Director and President, DB Investment Managers, Inc. (since June 25, 2018); formerly: Vice President for the Deutsche funds (2016–2017) |
John Millette8 (1962) Vice President and Secretary, 1999–present | | Director,3 DWS; Chief Legal Officer, DWS Investment Management Americas, Inc. (2015–present); and Director and Vice President, DWS Trust Company (2016–present); formerly: Secretary, Deutsche Investment Management Americas Inc. (2015–2017) |
Diane Kenneally8,10 (1966) Treasurer and Chief Financial Officer since 2018 | | Director,3 DWS; formerly: Assistant Treasurer for the DWS funds (2007–2018) |
Caroline Pearson8 (1962) Chief Legal Officer, 2010–present | | Managing Director,3 DWS; formerly: Secretary, Deutsche AM Distributors, Inc. (2002–2017); and Secretary, Deutsche AM Service Company (2010–2017) |
Scott D. Hogan8 (1970) Chief Compliance Officer, 2016–present | | Director,3 DWS |
Wayne Salit7 (1967) Anti-Money Laundering Compliance Officer, 2014–present | | Director,3 Deutsche Bank; and AML Officer, DWS Trust Company; formerly: Managing Director, AML Compliance Officer at BNY Mellon (2011–2014); and Director, AML Compliance Officer at Deutsche Bank (2004–2011) |
Sheila Cadogan8 (1966) Assistant Treasurer, 2017–present | | Director,3 DWS; Director and Vice President, DWS Trust Company (since 2018) |
| | | | | | | | |
| | DWS Emerging Markets Equity Fund | | | | | | 53 | |
| | |
Name, Year of Birth, Position with the Fund and Length of Time Served5 | | Business Experience and Directorships During the Past Five Years |
Paul Antosca8 (1957) Assistant Treasurer, 2007–present | | Director,3 DWS |
| 1 | The length of time served represents the year in which the Board Member joined the board of one or more DWS funds currently overseen by the Board. |
| 2 | A publicly held company with securities registered pursuant to Section 12 of the Securities Exchange Act of 1934. |
| 3 | Executive title, not a board directorship. |
| 4 | As a result of their respective positions held with the Advisor or its affiliates, these individuals are considered “interested persons” of the Advisor within the meaning of the 1940 Act. Interested persons receive no compensation from the Fund. |
| 5 | The length of time served represents the year in which the officer was first elected in such capacity for one or more DWS funds. |
| 6 | Address: 345 Park Avenue, New York, NY 10154. |
| 7 | Address: 60 Wall Street, New York, NY 10005. |
| 8 | Address: One International Place, Boston, MA 02110. |
| 9 | Appointed President and Chief Executive Officer effective December 1, 2017. |
| 10 | Appointed Treasurer and Chief Financial Officer effective July 2, 2018. |
The Fund’s Statement of Additional Information (“SAI”) includes additional information about the Board Members. The SAI is available, without charge, upon request. If you would like to request a copy of the SAI, you may do so by calling the following toll-free number: (800) 728-3337.
| | | | | | |
| 54 | | | | | DWS Emerging Markets Equity Fund | | |
Account Management Resources
| | |
| For More Information | | The automated telephone system allows you to access personalized account information and obtain information on other DWS funds using either your voice or your telephone keypad. Certain account types within Classes A, T, C and S also have the ability to purchase, exchange or redeem shares using this system. For more information, contact your financial advisor. You may also access our automated telephone system or speak with a Shareholder Service representative by calling: (800) 728-3337 |
| Web Site | | dws.com View your account transactions and balances, trade shares, monitor your asset allocation, subscribe to fund and account updates by e-mail, and change your address, 24 hours a day. Obtain prospectuses and applications, news about DWS funds, insight from DWS economists and investment specialists and access to DWS fund account information. |
| Written Correspondence | | DWS PO Box 219151 Kansas City, MO 64121-9151 |
| Proxy Voting | | The Fund’s policies and procedures for voting proxies for portfolio securities and information about how the Fund voted proxies related to its portfolio securities during the most recent 12-month period ended June 30 are available on our Web site — dws.com/en-us/resources/proxy-voting — or on the SEC’s Web site — sec.gov. To obtain a written copy of the fund’s policies and procedures without charge, upon request, call us toll free at (800) 728-3337. |
| Portfolio Holdings | | Following the Fund’s fiscal first and third quarter-end, a complete portfolio holdings listing is filed with the SEC on Form N-Q. This form will be available on the SEC’s Web site at sec.gov. The Fund’s portfolio holdings are also posted on dws.com from time to time. Please see the Fund’s current prospectus for more information. |
| Principal Underwriter | | If you have questions, comments or complaints, contact: DWS Distributors, Inc. 222 South Riverside Plaza Chicago, IL 60606-5808 (800) 621-1148 |
| | | | | | | | |
| | DWS Emerging Markets Equity Fund | | | | | | 55 | |
| | | | | | | | | | |
| Investment Management | | DWS Investment Management Americas, Inc. (“DIMA” or the “Advisor”), which is part of the DWS Group GmbH & Co. KGaA (“DWS Group”), is the investment advisor for the Fund. DIMA and its predecessors have more than 90 years of experience managing mutual funds and DIMA provides a full range of investment advisory services to both institutional and retail clients. DIMA is an indirect, wholly owned subsidiary of DWS Group. DWS Group is a global organization that offers a wide range of investing expertise and resources, including hundreds of portfolio managers and analysts and an office network that reaches the world’s major investment centers. This well-resourced global investment platform brings together a wide variety of experience and investment insight across industries, regions, asset classes and investing styles. |
| | | | | |
| | | Class A | | Class T | | Class C | | Class S | | Institutional
Class |
| Nasdaq Symbol | | SEKAX | | SEKTX | | SEKCX | | SEMGX | | SEKIX |
| CUSIP Number | | 25156G 103 | | 25156G 566 | | 25156G 301 | | 25156G 400 | | 25156G 780 |
| Fund Number | | 479 | | 1779 | | 779 | | 2079 | | 1479 |
| | | |
| For shareholders of Class R6 | | | | | | |
| Automated Information Line | | DWS/Ascensus Plan Access (800) 728-3337 24-hour access to your retirement plan account. |
| Web Site | | dws.com Obtain prospectuses and applications, news about DWS funds, insight from DWS economists and investment specialists and access to DWS fund account information. Log in/register to manage retirement account assets at https://www.mykplan.com/participantsecure_net/login.aspx. |
| For More Information | | (800) 728-3337 To speak with a service representative. |
| Written Correspondence | | DWS Service Company 222 South Riverside Plaza Chicago, IL 60606-5806 |
| | | | | |
| | | Class R6 | | | | | | | | |
| Nasdaq Symbol | | SEKRX | | | | | | | | |
| CUSIP Number | | 25156G 426 | | | | | | | | |
| Fund Number | | 1679 | | | | | | | | |
| | | | | | |
| 56 | | | | | DWS Emerging Markets Equity Fund | | |
Notes
Notes
Notes
Notes
Notes
Notes
Notes
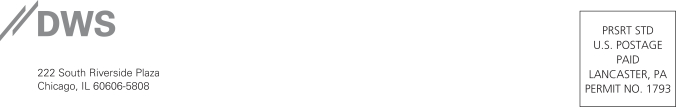
DEMEF-2
(R-024958-8 12/18)
| | |
| ITEM 2. | CODE OF ETHICS |
| | |
| | As of the end of the period covered by this report, the registrant has adopted a code of ethics, as defined in Item 2 of Form N-CSR that applies to its Principal Executive Officer and Principal Financial Officer. There have been no amendments to, or waivers from, a provision of the code of ethics during the period covered by this report that would require disclosure under Item 2. A copy of the code of ethics is filed as an exhibit to this Form N-CSR. |
| | |
| ITEM 3. | AUDIT COMMITTEE FINANCIAL EXPERT |
| | |
| | The fund’s audit committee is comprised solely of trustees who are "independent" (as such term has been defined by the Securities and Exchange Commission ("SEC") in regulations implementing Section 407 of the Sarbanes-Oxley Act (the "Regulations")). The fund’s Board of Trustees has determined that there are several "audit committee financial experts" (as such term has been defined by the Regulations) serving on the fund’s audit committee including Mr. William McClayton, the chair of the fund’s audit committee. An “audit committee financial expert” is not an “expert” for any purpose, including for purposes of Section 11 of the Securities Act of 1933 and the designation or identification of a person as an “audit committee financial expert” does not impose on such person any duties, obligations or liability that are greater than the duties, obligations and liability imposed on such person as a member of the audit committee and board of directors in the absence of such designation or identification. |
| | |
| ITEM 4. | PRINCIPAL ACCOUNTANT FEES AND SERVICES |
| | |
dWS emerging markets equity Fund form n-csr disclosure re: AUDIT FEES
The following table shows the amount of fees that PricewaterhouseCoopers, LLP (“PWC”), the Fund’s independent registered public accounting firm, billed to the Fund during the Fund’s last two fiscal years. The Audit Committee approved in advance all audit services and non-audit services that PWC provided to the Fund.
Services that the Fund’s Independent Registered Public Accounting Firm Billed to the Fund
| Fiscal Year Ended October 31, | Audit Fees Billed to Fund | Audit-Related Fees Billed to Fund | Tax Fees Billed to Fund | All Other Fees Billed to Fund |
| 2018 | $76,011 | $0 | $0 | $2,500 |
| 2017 | $74,888 | $0 | $0 | $5,641 |
The “All Other Fees Billed to Fund” were billed for services associated with foreign tax filings.
Services that the Fund’s Independent Registered Public Accounting Firm Billed to the Adviser and Affiliated Fund Service Providers
The following table shows the amount of fees billed by PWC to DWS Investment Management Americas Inc. (“DIMA” or the “Adviser”), and any entity controlling, controlled by or under common control with DIMA (“Control Affiliate”) that provides ongoing services to the Fund (“Affiliated Fund Service Provider”), for engagements directly related to the Fund’s operations and financial reporting, during the Fund’s last two fiscal years.
| Fiscal Year Ended October 31, | Audit-Related Fees Billed to Adviser and Affiliated Fund Service Providers | Tax Fees Billed to Adviser and Affiliated Fund Service Providers | All Other Fees Billed to Adviser and Affiliated Fund Service Providers |
| 2018 | $0 | $0 | $0 |
| 2017 | $0 | $0 | $0 |
Non-Audit Services
The following table shows the amount of fees that PWC billed during the Fund’s last two fiscal years for non-audit services. The Audit Committee pre-approved all non-audit services that PWC provided to the Adviser and any Affiliated Fund Service Provider that related directly to the Fund’s operations and financial reporting. The Audit Committee requested and received information from PWC about any non-audit services that PWC rendered during the Fund’s last fiscal year to the Adviser and any Affiliated Fund Service Provider. The Committee considered this information in evaluating PWC’s independence.
| Fiscal Year Ended October 31, | Total Non-Audit Fees Billed to Fund (A) | Total Non-Audit Fees billed to Adviser and Affiliated Fund Service Providers (engagements related directly to the operations and financial reporting of the Fund) (B) | Total Non-Audit Fees billed to Adviser and Affiliated Fund Service Providers (all other engagements) (C) | Total of (A), (B) and (C) |
| 2018 | $2,500 | $0 | $0 | $2,500 |
| 2017 | $5,641 | $0 | $0 | $5,641 |
Audit Committee Pre-Approval Policies and Procedures. Generally, each Fund’s Audit Committee must pre approve (i) all services to be performed for a Fund by a Fund’s Independent Registered Public Accounting Firm and (ii) all non-audit services to be performed by a Fund’s Independent Registered Public Accounting Firm for the DIMA Entities with respect to operations and financial reporting of the Fund, except that the Chairperson or Vice Chairperson of each Fund’s Audit Committee may grant the pre-approval for non-audit services described in items (i) and (ii) above for non-prohibited services for engagements of less than $100,000. All such delegated pre approvals shall be presented to each Fund’s Audit Committee no later than the next Audit Committee meeting.
There were no amounts that were approved by the Audit Committee pursuant to the de minimis exception under Rule 2-01 of Regulation S-X.
According to the registrant’s principal Independent Registered Public Accounting Firm, substantially all of the principal Independent Registered Public Accounting Firm's hours spent on auditing the registrant's financial statements were attributed to work performed by full-time permanent employees of the principal Independent Registered Public Accounting Firm.
***
In connection with the audit of the 2017 and 2018 financial statements, the Fund entered into an engagement letter with PwC. The terms of the engagement letter required by PwC, and agreed to by the Fund’s Audit Committee, include a provision mandating the use of mediation and arbitration to resolve any controversy or claim between the parties arising out of or relating to the engagement letter or the services provided there-under.
***
Pursuant to PCAOB Rule 3526, PwC is required to describe in writing to the Fund’s Audit Committee, on at least an annual basis, all relationships between PwC, or any of its affiliates, and the DWS Funds, including the Fund, or persons in financial reporting oversight roles at the DWS Funds that, as of the date of the communication, may reasonably be thought to bear on PwC’s independence. Pursuant to PCAOB Rule 3526, PwC has reported the matters set forth below that may reasonably be thought to bear on PwC’s independence. In its PCAOB Rule 3526 communications to the Audit Committee, PwC affirmed that they are independent accountants with respect to the DWS Funds, within the meaning of PCAOB Rule 3520. PwC also informed the Audit Committee that they concluded that a reasonable investor with knowledge of all relevant facts and circumstances would conclude that PwC is capable of exercising objective and impartial judgment on all issues encompassed within PwC’s audit of the financial statements of the Fund. Finally, PwC confirmed to the Audit Committee that they can continue to serve as the independent registered public accounting firm for the Fund.
| · | PwC advised the Fund’s Audit Committee that covered persons within PwC that provided non-audit services to entities within the DWS Funds “investment company complex” (as defined in Regulation S-X) (the “DWS Funds Complex”) maintained financial relationships with investment companies within the DWS Funds Complex. PwC informed the Audit Committee that these financial relationships were inconsistent with Rule 2-01(c)(1) of Regulation S-X. PwC reported that the breaches have been resolved and that, among other things, the breaches (i) did not involve professionals who were part of the audit engagement team for the Fund or in a position to influence the audit engagement team, (ii) involved professionals whose non-audit services were not and will not be utilized or relied upon by the audit engagement team in the audit of the financial statements of the Fund and (iii) involved professionals that did not provide any consultation to the audit engagement team of the Fund. |
| · | PwC advised the Fund’s Audit Committee of certain lending relationships of PwC with owners of greater than 10% of the shares of certain investment companies within the DWS Funds Complex that PwC had identified as inconsistent with Rule 2-01(c)(l)(ii)(A) of Regulation S-X (referred to as the “Loan Rule”). The Loan Rule specifically provides that an accounting firm would not be independent if it receives a loan from a lender that is a record or beneficial owner of more than ten percent of an audit client’s equity securities. For purposes of the Loan Rule, an audit client includes the Fund as well as all other investment companies in the DWS Funds Complex. PwC’s lending relationships affect PwC’s independence under the Loan Rule with respect to all investment companies in the DWS Funds Complex. |
PwC stated that, in each lending relationship, (i) PwC believes that it is unlikely the lenders would have any interest in the outcome of the audit of the Fund and therefore would not seek to influence the outcome of the audit, (ii) no third party made an attempt to influence the outcome of the audit of the Fund and even if an attempt was made, PwC professionals are required to disclose any relationships that may raise issues about objectivity, confidentiality, independence, conflicts of interest or favoritism, and (iii) the lenders typically lack influence over the investment adviser, who controls the management of the Fund. In addition, on June 20, 2016, the SEC Staff issued a “no-action” letter to another mutual fund complex, Fidelity Management & Research Company et al., SEC Staff No-Action Letter (June 20, 2016) (the “Fidelity Letter”), related to similar Loan Rule issues as those described above. In the Fidelity Letter, the SEC Staff confirmed that it would not recommend enforcement action against an investment company that relied on the audit services performed by an audit firm that was not in compliance with the Loan Rule in certain specified circumstances. With respect to each lending relationship identified by PwC, the circumstances described in the Fidelity Letter appear to be substantially similar to the circumstances that affected PwC’s independence under the Loan Rule with respect to the Fund. PwC represented that they have complied with PCAOB Rule 3526(b)(1) and (2), which are conditions to the Fund relying on the no action letter, and affirmed that they are independent accountants within the meaning of PCAOB Rule 3520.
| | |
| ITEM 5. | AUDIT COMMITTEE OF LISTED REGISTRANTS |
| | |
| | Not applicable |
| | |
| ITEM 6. | SCHEDULE OF INVESTMENTS |
| | |
| | Not applicable |
| | |
| ITEM 7. | DISCLOSURE OF PROXY VOTING POLICIES AND PROCEDURES FOR CLOSED-END MANAGEMENT INVESTMENT COMPANIES |
| | |
| | Not applicable |
| | |
| ITEM 8. | PORTFOLIO MANAGERS OF CLOSED-END MANAGEMENT INVESTMENT COMPANIES |
| | |
| | Not applicable |
| | |
| ITEM 9. | PURCHASES OF EQUITY SECURITIES BY CLOSED-END MANAGEMENT INVESTMENT COMPANY AND AFFILIATED PURCHASERS |
| | |
| | Not applicable |
| | |
| ITEM 10. | SUBMISSION OF MATTERS TO A VOTE OF SECURITY HOLDERS |
| | |
| | There were no material changes to the procedures by which shareholders may recommend nominees to the Fund’s Board. The primary function of the Nominating and Governance Committee is to identify and recommend individuals for membership on the Board and oversee the administration of the Board Governance Guidelines. Shareholders may recommend candidates for Board positions by forwarding their correspondence by U.S. mail or courier service to Keith R. Fox, DWS Funds Board Chair, c/o Thomas R. Hiller, Ropes & Gray LLP, Prudential Tower, 800 Boylston Street, Boston, MA 02199-3600. |
| | |
| ITEM 11. | CONTROLS AND PROCEDURES |
| | |
| | (a) | The Chief Executive and Financial Officers concluded that the Registrant’s Disclosure Controls and Procedures are effective based on the evaluation of the Disclosure Controls and Procedures as of a date within 90 days of the filing date of this report. |
| | |
| | (b) | There have been no changes in the registrant’s internal control over financial reporting that occurred during the second fiscal quarter of the period covered by this report that has materially affected, or is reasonably likely to materially affect, the registrant’s internal controls over financial reporting. |
| | |
| ITEM 12. | Disclosure of Securities Lending Activities for Closed-End Management Investment Companies |
| | |
| | Not applicable |
| | |
| ITEM 13. | EXHIBITS |
| | |
| | (a)(1) | Code of Ethics pursuant to Item 2 of Form N-CSR is filed and attached hereto as EX-99.CODE ETH. |
| | |
| | (a)(2) | Certification pursuant to Rule 30a-2(a) under the Investment Company Act of 1940 (17 CFR 270.30a-2(a)) is filed and attached hereto as Exhibit 99.CERT. |
| | |
| | (b) | Certification pursuant to Rule 30a-2(b) under the Investment Company Act of 1940 (17 CFR 270.30a-2(b)) is furnished and attached hereto as Exhibit 99.906CERT. |
SIGNATURES
Pursuant to the requirements of the Securities Exchange Act of 1934 and the Investment Company Act of 1940, the registrant has duly caused this report to be signed on its behalf by the undersigned, thereunto duly authorized.
| Registrant: | DWS Emerging Markets Equity Fund, a series of Deutsche DWS International Fund, Inc. |
| | |
| | |
| By: | /s/Hepsen Uzcan Hepsen Uzcan President |
| | |
| Date: | 1/2/2019 |
Pursuant to the requirements of the Securities Exchange Act of 1934 and the Investment Company Act of 1940, this report has been signed below by the following persons on behalf of the registrant and in the capacities and on the dates indicated.
| By: | /s/Hepsen Uzcan Hepsen Uzcan President |
| | |
| Date: | 1/2/2019 |
| | |
| | |
| | |
| By: | /s/Diane Kenneally Diane Kenneally Chief Financial Officer and Treasurer |
| | |
| Date: | 1/2/2019 |
| | |