UNITED STATES
SECURITIES AND EXCHANGE COMMISSION
WASHINGTON, D. C. 20549
FORM N-CSR
Investment Company Act file number: 811-00642
Deutsche DWS International Fund, Inc.
(Exact Name of Registrant as Specified in Charter)
875 Third Avenue
New York, NY 10022-6225
(Address of Principal Executive Offices) (Zip Code)
Registrant’s Telephone Number, including Area Code: (212) 454-4500
Diane Kenneally
100 Summer Street
Boston, MA 02110
(Name and Address of Agent for Service)
| Date of fiscal year end: | 10/31 |
| Date of reporting period: | 10/31/2021 |
| ITEM 1. | REPORT TO STOCKHOLDERS |
| (a) |


| 2 | | | DWS Emerging Markets Equity Fund |


| DWS Emerging Markets Equity Fund | | | 3 |
| Portfolio Management Review | (Unaudited) |
| 4 | | | DWS Emerging Markets Equity Fund |
| DWS Emerging Markets Equity Fund | | | 5 |
| 6 | | | DWS Emerging Markets Equity Fund |
| * | Not held at October 31, 2021. |
| DWS Emerging Markets Equity Fund | | | 7 |
| — | Global Head of Emerging Markets Equities: Hong Kong. |
| — | Joined DWS in 2013 with 21 years of industry experience. Prior to his current role, he served as Investment Director at GAM, based in London and Dubai, and Head of International & Emerging Markets at Societe Generale. |
| — | MBA, Manchester Business School. |
| — | Portfolio Manager for Global Emerging Markets Equities: Hong Kong. |
| — | Joined DWS in 2012 with 6 years of professional experience, thereof one year in the financial industry. Prior to joining, he served as an equities and quant analyst at Surperformance SAS. Prior to that he was an auditor advisor at Currat & Associes SA. |
| — | BS in Management from CIBU — California International Business University; MBA in Finance from International School of Management, Paris & St. John’s University; Investment Management Certificate (IMC). |
| 8 | | | DWS Emerging Markets Equity Fund |
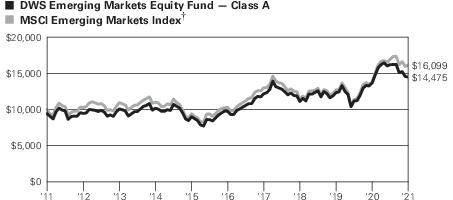
| Performance Summary | October 31, 2021 (Unaudited) |
| Class A | 1-Year | 5-Year | 10-Year |
| Average Annual Total Returns as of 10/31/21 | |||
| Unadjusted for Sales Charge | 6.07% | 8.22% | 4.38% |
| Adjusted for the Maximum Sales Charge (max 5.75% load) | –0.03% | 6.94% | 3.77% |
| MSCI Emerging Markets Index† | 16.96% | 9.39% | 4.88% |
| Class T | 1-Year | 5-Year | 10-Year |
| Average Annual Total Returns as of 10/31/21 | |||
| Unadjusted for Sales Charge | 6.07% | 8.22% | 4.37% |
| Adjusted for the Maximum Sales Charge (max 2.50% load) | 3.42% | 7.67% | 4.11% |
| MSCI Emerging Markets Index† | 16.96% | 9.39% | 4.88% |
| Class C | 1-Year | 5-Year | 10-Year |
| Average Annual Total Returns as of 10/31/21 | |||
| Unadjusted for Sales Charge | 5.32% | 7.41% | 3.59% |
| Adjusted for the Maximum Sales Charge (max 1.00% CDSC) | 5.32% | 7.41% | 3.59% |
| MSCI Emerging Markets Index† | 16.96% | 9.39% | 4.88% |
| Class R6 | 1-Year | Life of Class* |
| Average Annual Total Returns as of 10/31/21 | ||
| No Sales Charges | 6.36% | 7.80% |
| MSCI Emerging Markets Index† | 16.96% | 9.55% |
| Class S | 1-Year | 5-Year | 10-Year |
| Average Annual Total Returns as of 10/31/21 | |||
| No Sales Charges | 6.27% | 8.41% | 4.60% |
| MSCI Emerging Markets Index† | 16.96% | 9.39% | 4.88% |
| Institutional Class | 1-Year | 5-Year | 10-Year |
| Average Annual Total Returns as of 10/31/21 | |||
| No Sales Charges | 6.36% | 8.49% | 4.65% |
| MSCI Emerging Markets Index† | 16.96% | 9.39% | 4.88% |
| DWS Emerging Markets Equity Fund | | | 9 |
| 10 | | | DWS Emerging Markets Equity Fund |
| * | Class R6 shares commenced operations on September 7, 2018. |
| † | The MSCI Emerging Markets Index is an unmanaged equity index which captures large and mid-capitalization representation across 27 emerging markets countries. It covers approximately 85% of the free float-adjusted market capitalization in each country. |
| Class A | Class T | Class C | Class R6 | Class S | Institutional Class | |
| Net Asset Value | ||||||
| 10/31/21 | $22.37 | $22.37 | $19.85 | $22.70 | $22.69 | $22.67 |
| 10/31/20 | $21.32 | $21.32 | $18.92 | $21.63 | $21.63 | $21.61 |
| Distribution Information as of 10/31/21 | ||||||
| Income Dividends, Twelve Months | $ .26 | $ .26 | $ .07 | $ .32 | $ .30 | $ .32 |
| DWS Emerging Markets Equity Fund | | | 11 |
| Portfolio Summary | (Unaudited) |
| Asset Allocation (As a % of Net Assets) | 10/31/21 | 10/31/20 |
| Equity Securities | 89% | 87% |
| Exchange-Traded Funds | 7% | 6% |
| Cash Equivalents and Other Assets and Liabilities, Net | 4% | 7% |
| 100% | 100% |
| Sector Diversification (As a % of Equity Securities) | 10/31/21 | 10/31/20 |
| Financials | 24% | 17% |
| Information Technology | 18% | 23% |
| Consumer Discretionary | 17% | 30% |
| Energy | 17% | 4% |
| Communication Services | 12% | 14% |
| Materials | 7% | 8% |
| Consumer Staples | 3% | 2% |
| Industrials | 1% | 0% |
| Real Estate | 1% | 2% |
| 100% | 100% |
| Geographical Diversification (As a % of Equity Securities and Exchange-Traded Funds) | 10/31/21 | 10/31/20 |
| China | 29% | 45% |
| Taiwan | 13% | 9% |
| India | 12% | 11% |
| Korea | 10% | 14% |
| Russia | 9% | 1% |
| Brazil | 7% | 5% |
| Mexico | 4% | 1% |
| Indonesia | 3% | 1% |
| Singapore | 3% | — |
| Hong Kong | 2% | 5% |
| Thailand | 2% | 1% |
| Others | 6% | 7% |
| 100% | 100% |
| 12 | | | DWS Emerging Markets Equity Fund |
| Ten Largest Equity Holdings at October 31, 2021 (39.3% of Net Assets) | Country | Percent | |||
| 1 Taiwan Semiconductor Manufacturing Co., Ltd. | Taiwan | 8.5% | |||
| Manufacturer of integrated circuits and other semiconductor devices | |||||
| 2 Tencent Holdings Ltd. | China | 6.1% | |||
| Provider of Internet, mobile, and telecommunication value-added services | |||||
| 3 Alibaba Group Holding Ltd. | China | 4.4% | |||
| Provider of internet infrastructure, electronic commerce, online financial, and internet content services through its subsidiaries | |||||
| 4 Gazprom PJSC | Russia | 3.5% | |||
| Operator of gas pipeline systems | |||||
| 5 HDFC Bank Ltd. | India | 3.1% | |||
| Provider of retail, corporate banking, custodial, treasury and capital markets services | |||||
| 6 Samsung Electronics Co., Ltd. | Korea | 3.1% | |||
| Manufacturer of electronic parts | |||||
| 7 Reliance Industries Ltd. | India | 2.8% | |||
| Manufacturer of petrochemicals, synthetic fibers, fiber intermediates, textiles | |||||
| 8 Petroleo Brasileiro SA | Brazil | 2.8% | |||
| Company refines, markets, and supplies oil products | |||||
| 9 Meituan | China | 2.5% | |||
| Operator of a web based shopping platform for locally found consumer products and retail services | |||||
| 10 LUKOIL PJSC | Russia | 2.5% | |||
| Explores for, produces, refines, transports, and markets oil and gas mainly from Western Siberia | |||||
| DWS Emerging Markets Equity Fund | | | 13 |
| Investment Portfolio | as of October 31, 2021 |
| Shares | Value ($) | ||
| Equity Securities 88.6% | |||
| Argentina 1.0% | |||
| MercadoLibre, Inc.* (Cost $4,934,320) | 3,081 | 4,563,023 | |
| Brazil 7.0% | |||
| Americanas SA* | 112,784 | 593,518 | |
| B3 SA — Brasil Bolsa Balcao | 690,843 | 1,457,872 | |
| Banco Bradesco SA (ADR) | 1,191,292 | 4,169,520 | |
| CCR SA | 261,962 | 530,534 | |
| Gerdau SA (ADR) | 829,678 | 3,924,377 | |
| Itaú Unibanco Holding SA (ADR) (Preferred) (a) | 967,984 | 3,939,695 | |
| Lojas Americanas SA (Preferred) | 626,580 | 536,231 | |
| Multiplan Empreendimentos Imobiliarios SA | 1,848 | 6,064 | |
| Petroleo Brasileiro SA (ADR) | 1,333,154 | 13,091,572 | |
| Vale SA (ADR) | 296,918 | 3,779,766 | |
| XP, Inc. “A” * (a) | 22,348 | 733,238 | |
| (Cost $36,529,025) | 32,762,387 | ||
| Chile 1.1% | |||
| Antofagasta PLC (Cost $3,350,340) | 252,053 | 4,917,224 | |
| China 23.7% | |||
| Alibaba Group Holding Ltd. (ADR)* | 123,090 | 20,302,465 | |
| ANTA Sports Products Ltd. (a) | 267,000 | 4,172,894 | |
| BYD Co., Ltd. “H” | 230,000 | 8,767,817 | |
| China Construction Bank Corp. “H” | 9,881,577 | 6,718,532 | |
| Industrial & Commercial Bank of China Ltd. “H” | 4,419,095 | 2,419,555 | |
| JD.com, Inc. (ADR)* | 86,928 | 6,804,724 | |
| KWG Group Holdings Ltd. | 2,687,500 | 2,348,821 | |
| Li Ning Co., Ltd. | 433,500 | 4,819,452 | |
| Meituan “B” 144A* | 336,500 | 11,659,970 | |
| NetEase, Inc. (ADR) | 24,448 | 2,385,880 | |
| NIO, Inc. (ADR)* | 123,893 | 4,882,623 | |
| PetroChina Co., Ltd. “H” | 8,988,000 | 4,343,536 | |
| Ping An Insurance Group Co. of China Ltd. “H” | 330,000 | 2,370,927 | |
| Tencent Holdings Ltd. | 461,400 | 28,524,311 | |
| (Cost $94,063,921) | 110,521,507 | ||
| Hong Kong 2.3% | |||
| AIA Group Ltd. | 488,200 | 5,512,290 | |
| Hong Kong Exchanges & Clearing Ltd. | 87,300 | 5,282,545 | |
| (Cost $9,381,010) | 10,794,835 | ||
| 14 | | | DWS Emerging Markets Equity Fund |
| Shares | Value ($) | ||
| India 11.1% | |||
| Axis Bank Ltd.* | 277,906 | 2,764,911 | |
| Bharti Airtel Ltd.* | 314,892 | 2,883,939 | |
| HDFC Bank Ltd. (ADR) | 204,438 | 14,701,137 | |
| ICICI Bank Ltd. | 570,035 | 6,139,497 | |
| Infosys Ltd. (ADR) | 220,738 | 4,918,043 | |
| Larsen & Toubro Ltd. | 209,319 | 4,964,534 | |
| Maruti Suzuki India Ltd. | 10,439 | 1,039,428 | |
| Reliance Industries Ltd. | 188,817 | 6,404,743 | |
| Reliance Industries Ltd. 144A, (GDR) | 100,983 | 6,866,844 | |
| UltraTech Cement Ltd. | 8,316 | 849,244 | |
| (Cost $37,728,652) | 51,532,320 | ||
| Indonesia 2.7% | |||
| PT Bank Central Asia Tbk | 9,905,000 | 5,226,037 | |
| PT Bank Rakyat Indonesia Persero Tbk | 17,503,981 | 5,250,885 | |
| PT Elang Mahkota Teknologi Tbk* | 14,584,700 | 1,981,687 | |
| (Cost $12,257,926) | 12,458,609 | ||
| Korea 9.3% | |||
| Hyundai Motor Co. | 13,924 | 2,478,449 | |
| KB Financial Group, Inc. | 103,749 | 5,025,197 | |
| LG Household & Health Care Ltd. | 2,852 | 2,857,980 | |
| NAVER Corp. | 7,436 | 2,589,921 | |
| POSCO | 23,358 | 5,916,707 | |
| Samsung Electronics Co., Ltd. | 243,952 | 14,571,777 | |
| Samsung Fire & Marine Insurance Co., Ltd. | 12,812 | 2,532,687 | |
| Samsung SDI Co., Ltd. | 3,990 | 2,506,234 | |
| SK Hynix, Inc. | 55,665 | 4,906,504 | |
| (Cost $32,963,855) | 43,385,456 | ||
| Mexico 3.8% | |||
| Cemex SAB de CV (ADR)* | 1,112,654 | 7,154,365 | |
| Fomento Economico Mexicano SAB de CV (ADR) | 116,566 | 9,580,560 | |
| Gruma SAB de CV “B” | 61,238 | 716,902 | |
| Grupo Financiero Inbursa SAB de CV “O” * | 505,109 | 505,894 | |
| (Cost $20,371,998) | 17,957,721 | ||
| Russia 9.1% | |||
| Gazprom PJSC (ADR) (a) | 1,641,122 | 16,165,052 | |
| LUKOIL PJSC (ADR) | 114,000 | 11,631,420 | |
| Novatek PJSC (GDR) | 17,911 | 4,540,438 | |
| Sberbank of Russia PJSC (ADR) | 505,264 | 10,145,701 | |
| (Cost $35,623,061) | 42,482,611 | ||
| DWS Emerging Markets Equity Fund | | | 15 |
| Shares | Value ($) | ||
| Singapore 2.5% | |||
| Sea Ltd. (ADR)* (Cost $7,190,077) | 33,550 | 11,526,774 | |
| South Africa 0.7% | |||
| FirstRand Ltd. (Cost $4,390,428) | 915,114 | 3,475,336 | |
| Taiwan 12.2% | |||
| Formosa Plastics Corp. | 1,047,000 | 4,047,413 | |
| Fubon Financial Holding Co., Ltd. | 2,182,400 | 5,776,099 | |
| Hon Hai Precision Industry Co., Ltd. | 608,000 | 2,339,429 | |
| Taiwan Semiconductor Manufacturing Co., Ltd. | 1,208,803 | 25,646,610 | |
| Taiwan Semiconductor Manufacturing Co., Ltd. (ADR) | 121,281 | 13,789,650 | |
| United Microelectronics Corp. | 2,475,000 | 5,162,091 | |
| (Cost $40,300,880) | 56,761,292 | ||
| Thailand 1.9% | |||
| Kasikornbank PCL (NVDR) | 894,100 | 3,799,234 | |
| PTT PCL (NVDR) | 3,039,900 | 3,481,239 | |
| Thai Oil PCL (NVDR) | 926,800 | 1,557,119 | |
| (Cost $10,350,347) | 8,837,592 | ||
| Turkey 0.1% | |||
| KOC Holding AS | 100,545 | 246,952 | |
| Turkiye Garanti Bankasi AS | 97,879 | 100,535 | |
| (Cost $716,326) | 347,487 | ||
| United Arab Emirates 0.1% | |||
| Emaar Malls PJSC* (Cost $589,330) | 687,850 | 374,652 | |
| Total Equity Securities (Cost $350,741,496) | 412,698,826 | ||
| Exchange-Traded Funds 7.0% | |||
| iShares FTSE China A50 ETF (a) | 8,185,800 | 19,674,116 | |
| iShares MSCI Emerging Markets ETF | 253,732 | 12,920,033 | |
| Total Exchange-Traded Funds (Cost $28,563,990) | 32,594,149 | ||
| Securities Lending Collateral 4.6% | |||
| DWS Government & Agency Securities Portfolio “DWS Government Cash Institutional Shares” , 0.01% (b) (c) (Cost $21,422,090) | 21,422,090 | 21,422,090 | |
| 16 | | | DWS Emerging Markets Equity Fund |
| Shares | Value ($) | ||
| Cash Equivalents 0.5% | |||
| DWS Central Cash Management Government Fund, 0.03% (b) (Cost $2,470,217) | 2,470,217 | 2,470,217 | |
| % of Net Assets | Value ($) | ||
| Total Investment Portfolio (Cost $403,197,793) | 100.7 | 469,185,282 | |
| Other Assets and Liabilities, Net | (0.7) | (3,168,142) | |
| Net Assets | 100.0 | 466,017,140 |
| Value ($) at 10/31/2020 | Pur- chases Cost ($) | Sales Proceeds ($) | Net Real- ized Gain/ (Loss) ($) | Net Change in Unreal- ized Appreci- ation (Depreci- ation) ($) | Income ($) | Capital Gain Distri- butions ($) | Number of Shares at 10/31/2021 | Value ($) at 10/31/2021 |
| Securities Lending Collateral 4.6% | ||||||||
| DWS Government & Agency Securities Portfolio “DWS Government Cash Institutional Shares” , 0.01% (b) (c) | ||||||||
| 27,705,876 | — | 6,283,786 (d) | — | — | 368,733 | — | 21,422,090 | 21,422,090 |
| Cash Equivalents 0.5% | ||||||||
| DWS Central Cash Management Government Fund, 0.03% (b) | ||||||||
| 11,890,966 | 340,087,645 | 349,508,394 | — | — | 7,722 | — | 2,470,217 | 2,470,217 |
| 39,596,842 | 340,087,645 | 355,792,180 | — | — | 376,455 | — | 23,892,307 | 23,892,307 |
| * | Non-income producing security. |
| (a) | All or a portion of these securities were on loan. In addition, “Other Assets and Liabilities, Net” may include pending sales that are also on loan. The value of securities loaned at October 31, 2021 amounted to $28,661,856, which is 6.2% of net assets. |
| (b) | Affiliated fund managed by DWS Investment Management Americas, Inc. The rate shown is the annualized seven-day yield at period end. |
| (c) | Represents cash collateral held in connection with securities lending. Income earned by the Fund is net of borrower rebates. In addition, the Fund held non-cash U.S. Treasury securities collateral having a value of $9,550,265. |
| (d) | Represents the net increase (purchase cost) or decrease (sales proceeds) in the amount invested in cash collateral for the year ended October 31, 2021. |
| 144A: Security exempt from registration under Rule 144A of the Securities Act of 1933. These securities may be resold in transactions exempt from registration, normally to qualified institutional buyers. |
| ADR: American Depositary Receipt |
| FTSE: Financial Times and the London Stock Exchange |
| GDR: Global Depositary Receipt |
| DWS Emerging Markets Equity Fund | | | 17 |
| MSCI: Morgan Stanley Capital International |
| NVDR: Non-Voting Depository Receipt |
| PJSC: Public Joint Stock Company |
| Assets | Level 1 | Level 2 | Level 3 | Total |
| Equity Securities | ||||
| Argentina | $ 4,563,023 | $ — | $— | $ 4,563,023 |
| Brazil | 32,762,387 | — | — | 32,762,387 |
| Chile | 4,917,224 | — | — | 4,917,224 |
| China | 110,521,507 | — | — | 110,521,507 |
| Hong Kong | 10,794,835 | — | — | 10,794,835 |
| India | 51,532,320 | — | — | 51,532,320 |
| Indonesia | 12,458,609 | — | — | 12,458,609 |
| Korea | 43,385,456 | — | — | 43,385,456 |
| Mexico | 17,957,721 | — | — | 17,957,721 |
| Russia | 42,482,611 | — | — | 42,482,611 |
| Singapore | 11,526,774 | — | — | 11,526,774 |
| South Africa | 3,475,336 | — | — | 3,475,336 |
| Taiwan | 56,761,292 | — | — | 56,761,292 |
| Thailand | 8,837,592 | — | — | 8,837,592 |
| Turkey | — | 347,487 | — | 347,487 |
| United Arab Emirates | — | 374,652 | — | 374,652 |
| Exchange-Traded Funds | 32,594,149 | — | — | 32,594,149 |
| Short-Term Investments (a) | 23,892,307 | — | — | 23,892,307 |
| Total | $468,463,143 | $722,139 | $ — | $469,185,282 |
| (a) | See Investment Portfolio for additional detailed categorizations. |
| 18 | | | DWS Emerging Markets Equity Fund |
| Assets | |
| Investments in non-affiliated securities, at value (cost $379,305,486) — including $28,661,856 of securities loaned | $ 445,292,975 |
| Investment in DWS Government & Agency Securities Portfolio (cost $21,422,090)* | 21,422,090 |
| Investment in DWS Central Cash Management Government Fund (cost $2,470,217) | 2,470,217 |
| Cash | 864,294 |
| Foreign currency, at value (cost $9,755,900) | 9,697,376 |
| Receivable for investments sold | 9,389,214 |
| Receivable for Fund shares sold | 443,073 |
| Dividends receivable | 333,515 |
| Interest receivable | 25,703 |
| Other assets | 29,472 |
| Total assets | 489,967,929 |
| Liabilities | |
| Payable upon return of securities loaned | 21,422,090 |
| Payable for investments purchased | 860,033 |
| Payable for Fund shares redeemed | 575,917 |
| Deferred foreign taxes payable | 505,965 |
| Accrued management fee | 229,233 |
| Accrued Directors' fees | 4,575 |
| Other accrued expenses and payables | 352,976 |
| Total liabilities | 23,950,789 |
| Net assets, at value | $ 466,017,140 |
| Net Assets Consist of | |
| Distributable earnings (loss) | 34,502,630 |
| Paid-in capital | 431,514,510 |
| Net assets, at value | $ 466,017,140 |
| * | Represents collateral on securities loaned. In addition, the Fund held non-cash collateral having a value of $9,550,265. |
| DWS Emerging Markets Equity Fund | | | 19 |
| Net Asset Value | |
| Class A | |
| Net Asset Value and redemption price per share ($22,870,729 ÷ 1,022,300 shares of capital stock outstanding, $.01 par value, 50,000,000 shares authorized) | $ 22.37 |
| Maximum offering price per share (100 ÷ 94.25 of $22.37) | $ 23.73 |
| Class T | |
| Net Asset Value and redemption price per share ($13,253 ÷ 592 shares of capital stock outstanding, $.01 par value, 50,000,000 shares authorized)** | $ 22.37 |
| Maximum offering price per share (100 ÷ 97.50 of $22.37) | $ 22.94 |
| Class C | |
| Net Asset Value, offering and redemption price (subject to contingent deferred sales charge) per share ($5,910,122 ÷ 297,749 shares of capital stock outstanding, $.01 par value, 20,000,000 shares authorized) | $ 19.85 |
| Class R6 | |
| Net Asset Value, offering and redemption price per share ($846,399 ÷ 37,292 shares of capital stock outstanding, $.01 par value, 50,000,000 shares authorized) | $ 22.70 |
| Class S | |
| Net Asset Value, offering and redemption price per share ($128,219,979 ÷ 5,650,461 shares of capital stock outstanding, $.01 par value, 100,000,000 shares authorized) | $ 22.69 |
| Institutional Class | |
| Net Asset Value, offering and redemption price per share ($308,156,658 ÷ 13,590,947 shares of capital stock outstanding, $.01 par value, 100,000,000 shares authorized) | $ 22.67 |
| ** | Net asset value and redemption price per share may not recalculate due to rounding of net assets and/or shares outstanding. |
| 20 | | | DWS Emerging Markets Equity Fund |
| Investment Income | |
| Income: | |
| Dividends (net of foreign taxes withheld of $1,189,921) | $ 9,339,780 |
| Interest | 5,672 |
| Income distributions — DWS Central Cash Management Government Fund | 7,722 |
| Securities lending income, net of borrower rebates | 368,733 |
| Total income | 9,721,907 |
| Expenses: | |
| Management fee | 3,735,692 |
| Administration fee | 517,660 |
| Services to shareholders | 689,236 |
| Distribution and service fees | 117,405 |
| Custodian fee | 94,755 |
| Professional fees | 90,497 |
| Reports to shareholders | 64,285 |
| Registration fees | 107,291 |
| Directors' fees and expenses | 18,541 |
| Other | 37,264 |
| Total expenses before expense reductions | 5,472,626 |
| Expense reductions | (420,740) |
| Total expenses after expense reductions | 5,051,886 |
| Net investment income | 4,670,021 |
| Realized and Unrealized Gain (Loss) | |
| Net realized gain (loss) from: | |
| Investments (net of foreign taxes of $449,303) | 24,708,347 |
| Foreign currency | 168,687 |
| 24,877,034 | |
| Change in net unrealized appreciation (depreciation) on: | |
| Investments (including deferred foreign taxes of $435,254) | (9,215,291) |
| Foreign currency | (556,322) |
| (9,771,613) | |
| Net gain (loss) | 15,105,421 |
| Net increase (decrease) in net assets resulting from operations | $ 19,775,442 |
| DWS Emerging Markets Equity Fund | | | 21 |
| Years Ended October 31, | ||
| Increase (Decrease) in Net Assets | 2021 | 2020 |
| Operations: | ||
| Net investment income | $ 4,670,021 | $ 4,223,781 |
| Net realized gain (loss) | 24,877,034 | (20,837,301) |
| Change in net unrealized appreciation (depreciation) | (9,771,613) | 56,096,659 |
| Net increase (decrease) in net assets resulting from operations | 19,775,442 | 39,483,139 |
| Distributions to shareholders: | ||
| Class A | (216,767) | (444,350) |
| Class T | (151) | (211) |
| Class C | (16,877) | (66,492) |
| Class R6 | (9,291) | (315) |
| Class S | (2,344,399) | (3,612,454) |
| Institutional Class | (3,731,248) | (5,451,114) |
| Total distributions | (6,318,733) | (9,574,936) |
| Fund share transactions: | ||
| Proceeds from shares sold | 297,331,019 | 233,114,282 |
| Reinvestment of distributions | 6,229,691 | 9,422,476 |
| Payments for shares redeemed | (280,267,784) | (283,194,745) |
| Net increase (decrease) in net assets from Fund share transactions | 23,292,926 | (40,657,987) |
| Increase (decrease) in net assets | 36,749,635 | (10,749,784) |
| Net assets at beginning of period | 429,267,505 | 440,017,289 |
| Net assets at end of period | $ 466,017,140 | $ 429,267,505 |
| 22 | | | DWS Emerging Markets Equity Fund |
| DWS Emerging Markets Equity Fund — Class A | |||||
| Years Ended October 31, | |||||
| 2021 | 2020 | 2019 | 2018 | 2017 | |
| Selected Per Share Data | |||||
| Net asset value, beginning of period | $21.32 | $19.59 | $17.74 | $19.54 | $15.71 |
| Income (loss) from investment operations: | |||||
| Net investment incomea | .17 | .14 | .48 | .19 | .10 |
| Net realized and unrealized gain (loss) | 1.14 | 1.96 | 1.47 | (1.90) | 3.77 |
| Total from investment operations | 1.31 | 2.10 | 1.95 | (1.71) | 3.87 |
| Less distributions from: | |||||
| Net investment income | (.26) | (.37) | (.10) | (.09) | (.04) |
| Net asset value, end of period | $22.37 | $21.32 | $19.59 | $17.74 | $19.54 |
| Total Return (%)b,c | 6.07 | 10.75 | 11.04 | (8.79) | 24.75 |
| Ratios to Average Net Assets and Supplemental Data | |||||
| Net assets, end of period ($ millions) | 23 | 18 | 23 | 9 | 10 |
| Ratio of expenses before expense reductions (%) | 1.28 | 1.31 | 1.36 | 1.55 | 1.86 |
| Ratio of expenses after expense reductions (%) | 1.15 | 1.15 | 1.15 | 1.15 | 1.35 |
| Ratio of net investment income (%) | .68 | .73 | 2.49 | .98 | .59 |
| Portfolio turnover rate (%) | 94 | 57 | 32 | 34 | 14 |
| a | Based on average shares outstanding during the period. |
| b | Total return does not reflect the effect of any sales charges. |
| c | Total return would have been lower had certain expenses not been reduced. |
| DWS Emerging Markets Equity Fund | | | 23 |
| DWS Emerging Markets Equity Fund — Class T | |||||
| Years Ended October 31, | Period Ended | ||||
| 2021 | 2020 | 2019 | 2018 | 10/31/17 a | |
| Selected Per Share Data | |||||
| Net asset value, beginning of period | $21.32 | $19.59 | $17.74 | $19.54 | $17.54 |
| Income (loss) from investment operations: | |||||
| Net investment incomeb | .16 | .16 | .39 | .19 | .13 |
| Net realized and unrealized gain (loss) | 1.15 | 1.94 | 1.56 | (1.90) | 1.87 |
| Total from investment operations | 1.31 | 2.10 | 1.95 | (1.71) | 2.00 |
| Less distributions from: | |||||
| Net investment income | (.26) | (.37) | (.10) | (.09) | — |
| Net asset value, end of period | $22.37 | $21.32 | $19.59 | $17.74 | $19.54 |
| Total Return (%)c,d | 6.07 | 10.75 | 11.04 | (8.79) | 11.40 * |
| Ratios to Average Net Assets and Supplemental Data | |||||
| Net assets, end of period ($ thousands) | 13 | 12 | 11 | 10 | 11 |
| Ratio of expenses before expense reductions (%) | 1.21 | 1.25 | 1.30 | 1.43 | 1.65 ** |
| Ratio of expenses after expense reductions (%) | 1.15 | 1.15 | 1.15 | 1.15 | 1.15 ** |
| Ratio of net investment income (%) | .65 | .82 | 2.07 | .97 | 1.70 ** |
| Portfolio turnover rate (%) | 94 | 57 | 32 | 34 | 14 e |
| a | For the period from June 5, 2017 (commencement of operations) to October 31, 2017. |
| b | Based on average shares outstanding during the period. |
| c | Total return does not reflect the effect of any sales charges. |
| d | Total return would have been lower had certain expenses not been reduced. |
| e | Represents the Fund’s portfolio turnover rate for the year ended October 31, 2017. |
| * | Not annualized |
| ** | Annualized |
| 24 | | | DWS Emerging Markets Equity Fund |
| DWS Emerging Markets Equity Fund — Class C | |||||
| Years Ended October 31, | |||||
| 2021 | 2020 | 2019 | 2018 | 2017 | |
| Selected Per Share Data | |||||
| Net asset value, beginning of period | $18.92 | $17.38 | $15.77 | $17.43 | $14.07 |
| Income (loss) from investment operations: | |||||
| Net investment income (loss)a | (.01) | (.00) * | .26 | .06 | (.01) |
| Net realized and unrealized gain (loss) | 1.01 | 1.72 | 1.35 | (1.72) | 3.37 |
| Total from investment operations | 1.00 | 1.72 | 1.61 | (1.66) | 3.36 |
| Less distributions from: | |||||
| Net investment income | (.07) | (.18) | — | — | — |
| Net asset value, end of period | $19.85 | $18.92 | $17.38 | $15.77 | $17.43 |
| Total Return (%)b,c | 5.32 | 9.89 | 10.21 | (9.52) | 23.88 |
| Ratios to Average Net Assets and Supplemental Data | |||||
| Net assets, end of period ($ millions) | 6 | 4 | 6 | 3 | 3 |
| Ratio of expenses before expense reductions (%) | 1.99 | 2.02 | 2.08 | 2.26 | 2.57 |
| Ratio of expenses after expense reductions (%) | 1.90 | 1.90 | 1.90 | 1.90 | 2.09 |
| Ratio of net investment income (loss) (%) | (.05) | (.00) ** | 1.55 | .31 | (.09) |
| Portfolio turnover rate (%) | 94 | 57 | 32 | 34 | 14 |
| a | Based on average shares outstanding during the period. |
| b | Total return does not reflect the effect of any sales charges. |
| c | Total return would have been lower had certain expenses not been reduced. |
| * | Amount is less than $.005. |
| ** | Amount is less than .005%. |
| DWS Emerging Markets Equity Fund | | | 25 |
| DWS Emerging Markets Equity Fund — Class R6 | ||||
| Years Ended October 31, | Period Ended | |||
| 2021 | 2020 | 2019 | 10/31/18 a | |
| Selected Per Share Data | ||||
| Net asset value, beginning of period | $21.63 | $19.87 | $17.99 | $18.68 |
| Income (loss) from investment operations: | ||||
| Net investment incomeb | .27 | .19 | .48 | .02 |
| Net realized and unrealized gain (loss) | 1.12 | 2.00 | 1.54 | (.71) |
| Total from investment operations | 1.39 | 2.19 | 2.02 | (.69) |
| Less distributions from: | ||||
| Net investment income | (.32) | (.43) | (.14) | — |
| Net asset value, end of period | $22.70 | $21.63 | $19.87 | $17.99 |
| Total Return (%)c | 6.36 | 11.06 | 11.32 | (3.69) * |
| Ratios to Average Net Assets and Supplemental Data | ||||
| Net assets, end of period ($ thousands) | 846 | 126 | 25 | 10 |
| Ratio of expenses before expense reductions (%) | .90 | 1.26 | 1.21 | 1.41 ** |
| Ratio of expenses after expense reductions (%) | .90 | .90 | .90 | .90 ** |
| Ratio of net investment income (%) | 1.11 | .95 | 2.51 | .63 ** |
| Portfolio turnover rate (%) | 94 | 57 | 32 | 34 d |
| a | For the period from September 7, 2018 (commencement of operations) to October 31, 2018. |
| b | Based on average shares outstanding during the period. |
| c | Total return would have been lower had certain expenses not been reduced. |
| d | Represents the Fund’s portfolio turnover rate for the year ended October 31, 2018. |
| * | Not annualized |
| ** | Annualized |
| 26 | | | DWS Emerging Markets Equity Fund |
| DWS Emerging Markets Equity Fund — Class S | |||||
| Years Ended October 31, | |||||
| 2021 | 2020 | 2019 | 2018 | 2017 | |
| Selected Per Share Data | |||||
| Net asset value, beginning of period | $21.63 | $19.87 | $18.00 | $19.82 | $15.94 |
| Income (loss) from investment operations: | |||||
| Net investment incomea | .19 | .19 | .48 | .24 | .15 |
| Net realized and unrealized gain (loss) | 1.17 | 1.98 | 1.52 | (1.93) | 3.81 |
| Total from investment operations | 1.36 | 2.17 | 2.00 | (1.69) | 3.96 |
| Less distributions from: | |||||
| Net investment income | (.30) | (.41) | (.13) | (.13) | (.08) |
| Net asset value, end of period | $22.69 | $21.63 | $19.87 | $18.00 | $19.82 |
| Total Return (%)b | 6.27 | 10.92 | 11.19 | (8.61) | 25.03 |
| Ratios to Average Net Assets and Supplemental Data | |||||
| Net assets, end of period ($ millions) | 128 | 191 | 203 | 89 | 65 |
| Ratio of expenses before expense reductions (%) | 1.04 | 1.09 | 1.12 | 1.31 | 1.57 |
| Ratio of expenses after expense reductions (%) | .98 | .98 | .98 | .98 | 1.14 |
| Ratio of net investment income (%) | .75 | .99 | 2.46 | 1.19 | .87 |
| Portfolio turnover rate (%) | 94 | 57 | 32 | 34 | 14 |
| a | Based on average shares outstanding during the period. |
| b | Total return would have been lower had certain expenses not been reduced. |
| DWS Emerging Markets Equity Fund | | | 27 |
| DWS Emerging Markets Equity Fund — Institutional Class | |||||
| Years Ended October 31, | |||||
| 2021 | 2020 | 2019 | 2018 | 2017 | |
| Selected Per Share Data | |||||
| Net asset value, beginning of period | $21.61 | $19.86 | $17.99 | $19.81 | $15.92 |
| Income (loss) from investment operations: | |||||
| Net investment incomea | .24 | .21 | .55 | .28 | .21 |
| Net realized and unrealized gain (loss) | 1.14 | 1.97 | 1.46 | (1.96) | 3.76 |
| Total from investment operations | 1.38 | 2.18 | 2.01 | (1.68) | 3.97 |
| Less distributions from: | |||||
| Net investment income | (.32) | (.43) | (.14) | (.14) | (.08) |
| Net asset value, end of period | $22.67 | $21.61 | $19.86 | $17.99 | $19.81 |
| Total Return (%)b | 6.36 | 11.02 | 11.29 | (8.54) | 25.05 |
| Ratios to Average Net Assets and Supplemental Data | |||||
| Net assets, end of period ($ millions) | 308 | 216 | 208 | 28 | 9 |
| Ratio of expenses before expense reductions (%) | .98 | 1.00 | 1.05 | 1.18 | 1.34 |
| Ratio of expenses after expense reductions (%) | .90 | .90 | .90 | .90 | .97 |
| Ratio of net investment income (%) | .96 | 1.05 | 2.82 | 1.40 | 1.14 |
| Portfolio turnover rate (%) | 94 | 57 | 32 | 34 | 14 |
| a | Based on average shares outstanding during the period. |
| b | Total return would have been lower had certain expenses not been reduced. |
| 28 | | | DWS Emerging Markets Equity Fund |
| A. | Organization and Significant Accounting Policies |
| DWS Emerging Markets Equity Fund | | | 29 |
| 30 | | | DWS Emerging Markets Equity Fund |
| DWS Emerging Markets Equity Fund | | | 31 |
| Overnight and Continuous | <30 days | Between 30 & 90 days | >90 days | Total | |
| Securities Lending Transactions | |||||
| Common Stocks | $ 14,317,108 | $ — | $ — | $ 9,550,265 | $ 23,867,373 |
| Exchange-Traded Funds | 7,104,982 | — | — | — | 7,104,982 |
| Total Borrowings | $ 21,422,090 | $ — | $ — | $ 9,550,265 | $ 30,972,355 |
| Gross amount of recognized liabilities and non-cash collateral for securities lending transactions: | $ 30,972,355 | ||||
| 32 | | | DWS Emerging Markets Equity Fund |
| Undistributed ordinary income* | $ 5,584,832 |
| Capital loss carryforwards | $ (29,240,000) |
| Net unrealized appreciation (depreciation) on investments | $ 58,717,807 |
| Years Ended October 31, | ||
| 2021 | 2020 | |
| Distributions from ordinary income* | $ 6,318,733 | $ 9,574,936 |
| * | For tax purposes, short-term capital gain distributions are considered ordinary income distributions. |
| DWS Emerging Markets Equity Fund | | | 33 |
| B. | Purchases and Sales of Securities |
| C. | Related Parties |
| 34 | | | DWS Emerging Markets Equity Fund |
| Class A | 1.15% |
| Class T | 1.15% |
| Class C | 1.90% |
| Class R6 | .90% |
| Class S | .98% |
| Institutional Class | .90% |
| Class A | $ 29,833 |
| Class T | 8 |
| Class C | 5,149 |
| Class R6 | 6 |
| Class S | 103,681 |
| Institutional Class | 282,063 |
| $ 420,740 |
| DWS Emerging Markets Equity Fund | | | 35 |
| Services to Shareholders | Total Aggregated | Unpaid at October 31, 2021 |
| Class A | $ 10,292 | $ 1,674 |
| Class T | 26 | 4 |
| Class C | 644 | 100 |
| Class R6 | 185 | 37 |
| Class S | 48,228 | 7,968 |
| Institutional Class | 889 | 156 |
| $ 60,264 | $ 9,939 |
| Sub-Recordkeeping | Total Aggregated |
| Class A | $ 26,008 |
| Class C | 5,907 |
| Class S | 220,624 |
| Institutional Class | 359,796 |
| $ 612,335 |
| Distribution Fee | Total Aggregated | Unpaid at October 31, 2021 |
| Class C | $ 45,276 | $ 3,890 |
| 36 | | | DWS Emerging Markets Equity Fund |
| Service Fee | Total Aggregated | Unpaid at October 31, 2021 | Annual Rate |
| Class A | $ 57,042 | $ 8,964 | .24% |
| Class T | 22 | 10 | .15% |
| Class C | 15,065 | 2,157 | .25% |
| $ 72,129 | $ 11,131 |
| DWS Emerging Markets Equity Fund | | | 37 |
| D. | Investing in Emerging Markets |
| E. | Line of Credit |
| F. | Fund Share Transactions |
| Year Ended October 31, 2021 | Year Ended October 31, 2020 | |||
| Shares | Dollars | Shares | Dollars | |
| Shares sold | ||||
| Class A | 389,424 | $ 9,733,243 | 293,462 | $ 5,740,580 |
| Class C | 137,040 | 3,069,427 | 55,576 | 975,545 |
| Class R6 | 45,899 | 1,129,135 | 5,102.5 | 111,366 |
| Class S | 1,485,225 | 37,038,262 | 4,048,951 | 78,644,076 |
| Institutional Class | 9,717,408 | 246,360,952 | 7,657,399 | 147,642,715 |
| $ 297,331,019 | $ 233,114,282 | |||
| 38 | | | DWS Emerging Markets Equity Fund |
| Year Ended October 31, 2021 | Year Ended October 31, 2020 | |||
| Shares | Dollars | Shares | Dollars | |
| Shares issued to shareholders in reinvestment of distributions | ||||
| Class A | 9,050 | $ 214,843 | 21,278 | $ 441,739 |
| Class T | 6 | 151 | 10 | 211 |
| Class C | 796 | 16,877 | 3,583 | 66,434 |
| Class R6 | 387 | 9,291 | 15 | 315 |
| Class S | 95,270 | 2,290,299 | 168,095 | 3,533,360 |
| Institutional Class | 154,093 | 3,698,230 | 256,332 | 5,380,417 |
| $ 6,229,691 | $ 9,422,476 | |||
| Shares redeemed | ||||
| Class A | (203,017) | $ (4,922,407) | (680,017) | $ (13,176,421) |
| Class C | (75,197) | (1,648,569) | (165,576) | (2,732,847) |
| Class R6 | (14,821) | (366,878) | (533) | (10,709) |
| Class S | (4,755,224) | (120,503,042) | (5,604,984) | (107,347,026) |
| Institutional Class | (6,286,053) | (152,826,888) | (8,366,880) | (159,927,742) |
| $ (280,267,784) | $ (283,194,745) | |||
| Net increase (decrease) | ||||
| Class A | 195,457 | $ 5,025,679 | (365,277) | $ (6,994,102) |
| Class T | 6 | 151 | 10 | 211 |
| Class C | 62,639 | 1,437,735 | (106,417) | (1,690,868) |
| Class R6 | 31,465 | 771,548 | 4,584.5 | 100,972 |
| Class S | (3,174,729) | (81,174,481) | (1,387,938) | (25,169,590) |
| Institutional Class | 3,585,448 | 97,232,294 | (453,149) | (6,904,610) |
| $ 23,292,926 | $ (40,657,987) | |||
| G. | Other — COVID-19 Pandemic |
| DWS Emerging Markets Equity Fund | | | 39 |
| 40 | | | DWS Emerging Markets Equity Fund |
| DWS Emerging Markets Equity Fund | | | 41 |
| 42 | | | DWS Emerging Markets Equity Fund |
| — | Actual Fund Return. This helps you estimate the actual dollar amount of ongoing expenses (but not transaction costs) paid on a $1,000 investment in the Fund using the Fund’s actual return during the period. To estimate the expenses you paid over the period, simply divide your account value by $1,000 (for example, an $8,600 account value divided by $1,000 = 8.6), then multiply the result by the number in the “Expenses Paid per $1,000” line under the share class you hold. |
| — | Hypothetical 5% Fund Return. This helps you to compare your Fund’s ongoing expenses (but not transaction costs) with those of other mutual funds using the Fund’s actual expense ratio and a hypothetical rate of return of 5% per year before expenses. Examples using a 5% hypothetical fund return may be found in the shareholder reports of other mutual funds. The hypothetical account values and expenses may not be used to estimate the actual ending account balance or expenses you paid for the period. |
| DWS Emerging Markets Equity Fund | | | 43 |
| Actual Fund Return | Class A | Class T | Class C | Class R6 | Class S | Institutional Class |
| Beginning Account Value 5/1/21 | $1,000.00 | $1,000.00 | $1,000.00 | $1,000.00 | $1,000.00 | $1,000.00 |
| Ending Account Value 10/31/21 | $ 893.70 | $ 893.70 | $ 890.50 | $ 895.10 | $ 894.40 | $ 895.00 |
| Expenses Paid per $1,000* | $ 5.49 | $ 5.49 | $ 9.05 | $ 4.30 | $ 4.68 | $ 4.30 |
| Hypothetical 5% Fund Return | Class A | Class T | Class C | Class R6 | Class S | Institutional Class |
| Beginning Account Value 5/1/21 | $1,000.00 | $1,000.00 | $1,000.00 | $1,000.00 | $1,000.00 | $1,000.00 |
| Ending Account Value 10/31/21 | $1,019.41 | $1,019.41 | $1,015.63 | $1,020.67 | $1,020.27 | $1,020.67 |
| Expenses Paid per $1,000* | $ 5.85 | $ 5.85 | $ 9.65 | $ 4.58 | $ 4.99 | $ 4.58 |
| * | Expenses are equal to the Fund’s annualized expense ratio for each share class, multiplied by the average account value over the period, multiplied by 184 (the number of days in the most recent six-month period), then divided by 365. |
| Annualized Expense Ratios | Class A | Class T | Class C | Class R6 | Class S | Institutional Class |
| DWS Emerging Markets Equity Fund | 1.15% | 1.15% | 1.90% | .90% | .98% | .90% |
| 44 | | | DWS Emerging Markets Equity Fund |
| Tax Information | (Unaudited) |
| DWS Emerging Markets Equity Fund | | | 45 |
| — | During the entire process, all of the Fund’s Directors were independent of DIMA and its affiliates (the “Independent Directors” ). |
| — | The Board met frequently during the past year to discuss fund matters and dedicated a substantial amount of time to contract review matters. Over the course of several months, the Board reviewed extensive materials received from DIMA, independent third parties and independent counsel. These materials included an analysis of the Fund’s performance, fees and expenses, and profitability from a fee consultant retained by the Fund’s Independent Directors (the “Fee Consultant” ). |
| — | The Board also received extensive information throughout the year regarding performance of the Fund. |
| — | The Independent Directors regularly met privately with counsel to discuss contract review and other matters. In addition, the Independent Directors were advised by the Fee Consultant in the course of their review of the Fund’s contractual arrangements and considered a comprehensive report prepared by the Fee Consultant in connection with their deliberations. |
| — | In connection with reviewing the Agreements, the Board also reviewed the terms of the Fund’s Rule 12b-1 plan, distribution agreement, administrative services agreement, transfer agency agreement and other material service agreements. |
| 46 | | | DWS Emerging Markets Equity Fund |
| DWS Emerging Markets Equity Fund | | | 47 |
| 48 | | | DWS Emerging Markets Equity Fund |
| DWS Emerging Markets Equity Fund | | | 49 |
| 50 | | | DWS Emerging Markets Equity Fund |
| Name, Year of Birth, Position with the Trust/ Corporation and Length of Time Served1 | Business Experience and Directorships During the Past Five Years | Number of Funds in DWS Fund Complex Overseen | Other Directorships Held by Board Member |
| Keith R. Fox, CFA (1954)Chairperson since 2017, and Board Member since 1996 | Managing General Partner, Exeter Capital Partners (a series of private investment funds) (since 1986). Directorships: Progressive International Corporation (kitchen goods importer and distributor); former Chairman, National Association of Small Business Investment Companies; Former Directorships: ICI Mutual Insurance Company; BoxTop Media Inc. (advertising); Sun Capital Advisers Trust (mutual funds) | 70 | — |
| DWS Emerging Markets Equity Fund | | | 51 |
| Name, Year of Birth, Position with the Trust/ Corporation and Length of Time Served1 | Business Experience and Directorships During the Past Five Years | Number of Funds in DWS Fund Complex Overseen | Other Directorships Held by Board Member |
| John W. Ballantine (1946)Board Member since 1999 | Retired; formerly, Executive Vice President and Chief Risk Management Officer, First Chicago NBD Corporation/The First National Bank of Chicago (1996–1998); Executive Vice President and Head of International Banking (1995–1996); Not-for-Profit Directorships: Palm Beach Civic Assn.; Window to the World Communications (public media); Life Director of Harris Theater for Music and Dance (Chicago); Life Director of Hubbard Street Dance Chicago; Former Directorships: Director and Chairman of the Board, Healthways, Inc.2 (population wellbeing and wellness services) (2003–2014); Stockwell Capital Investments PLC (private equity); Enron Corporation; FNB Corporation; Tokheim Corporation; First Oak Brook Bancshares, Inc.; Oak Brook Bank; Portland General Electric2 (utility company (2003–2021); and Prisma Energy International; Former Not-for-Profit Directorships: Public Radio International | 70 | — |
| Dawn-Marie Driscoll (1946)Board Member since 1987 | Advisory Board and former Executive Fellow, Hoffman Center for Business Ethics, Bentley University; formerly: Partner, Palmer & Dodge (law firm) (1988–1990); Vice President of Corporate Affairs and General Counsel, Filene’s (retail) (1978–1988); Directorships: Trustee and former Chairman of the Board, Southwest Florida Community Foundation (charitable organization); Former Directorships: ICI Mutual Insurance Company (2007–2015); Sun Capital Advisers Trust (mutual funds) (2007–2012), Investment Company Institute (audit, executive, nominating committees) and Independent Directors Council (governance, executive committees) | 70 | — |
| 52 | | | DWS Emerging Markets Equity Fund |
| Name, Year of Birth, Position with the Trust/ Corporation and Length of Time Served1 | Business Experience and Directorships During the Past Five Years | Number of Funds in DWS Fund Complex Overseen | Other Directorships Held by Board Member |
| Richard J. Herring (1946)Board Member since 1990 | Jacob Safra Professor of International Banking and Professor of Finance, The Wharton School, University of Pennsylvania (since July 1972); Director, The Wharton Financial Institutions Center (1994–2020); formerly: Vice Dean and Director, Wharton Undergraduate Division (1995–2000) and Director, The Lauder Institute of International Management Studies (2000–2006); Member FDIC Systemic Risk Advisory Committee since 2011, member Systemic Risk Council since 2012 and member of the Advisory Board at the Yale Program on Financial Stability since 2013; Former Directorships: Co-Chair of the Shadow Financial Regulatory Committee (2003–2015), Executive Director of The Financial Economists Roundtable (2008–2015), Director of The Thai Capital Fund (2007–2013), Director of The Aberdeen Singapore Fund (2007–2018), and Nonexecutive Director of Barclays Bank DE (2010–2018) | 70 | Director, Aberdeen Japan Fund (since 2007) |
| William McClayton (1944)Board Member since 2004 | Private equity investor (since October 2009); formerly: Managing Director, Diamond Management & Technology Consultants, Inc. (global consulting firm) (2001–2009); Senior Partner, Arthur Andersen LLP (accounting) (1966–2001); Former Directorships: Board of Managers, YMCA of Metropolitan Chicago; Trustee, Ravinia Festival | 70 | — |
| Chad D. Perry (1972)Board Member or Advisory Board Member since 20213 | Executive Vice President, General Counsel and Secretary, Tanger Factory Outlet Centers, Inc.2 (since 2011); formerly Executive Vice President and Deputy General Counsel, LPL Financial Holdings Inc.2 (2006–2011); Senior Corporate Counsel, EMC Corporation (2005–2006); Associate, Ropes & Gray LLP (1997–2005) | 21 4 | — |
| DWS Emerging Markets Equity Fund | | | 53 |
| Name, Year of Birth, Position with the Trust/ Corporation and Length of Time Served1 | Business Experience and Directorships During the Past Five Years | Number of Funds in DWS Fund Complex Overseen | Other Directorships Held by Board Member |
| Rebecca W. Rimel (1951)Board Member since 1995 | Senior Advisor, The Pew Charitable Trusts (charitable organization) (since July 2020); Director, The Bridgespan Group (nonprofit organization) (since October 2020); formerly: Executive Vice President, The Glenmede Trust Company (investment trust and wealth management) (1983–2004); Board Member, Investor Education (charitable organization) (2004–2005); Former Directorships: Trustee, Executive Committee, Philadelphia Chamber of Commerce (2001–2007); Director, Viasys Health Care2 (January 2007–June 2007); Trustee, Thomas Jefferson Foundation (charitable organization) (1994–2012); President, Chief Executive Officer and Director, The Pew Charitable Trusts (charitable organization) (1994–2020); Director, BioTelemetry Inc.2 (acquired by Royal Philips in 2021) (healthcare) (2009–2021) | 70 | Director, Becton Dickinson and Company2 (medical technology company) (2012–present) |
| Catherine Schrand (1964)Board Member or Advisory Board Member since 20213 | Celia Z. Moh Professor of Accounting (since 2016) and Professor of Accounting (since 1994), The Wharton School, University of Pennsylvania; formerly Vice Dean, Wharton Doctoral Programs (2016–2019) | 21 4 | — |
| William N. Searcy, Jr. (1946)Board Member since 1993 | Private investor since October 2003; formerly: Pension & Savings Trust Officer, Sprint Corporation2 (telecommunications) (November 1989–September 2003); Former Directorships: Trustee, Sun Capital Advisers Trust (mutual funds) (1998–2012) | 70 | — |
| 54 | | | DWS Emerging Markets Equity Fund |
| Name, Year of Birth, Position with the Trust/Corporation and Length of Time Served6 | Business Experience and Directorships During the Past Five Years |
| Hepsen Uzcan7 (1974)President and Chief Executive Officer, 2017–present | Fund Administration (Head since 2017), DWS; Secretary, DWS USA Corporation (2018–present); Assistant Secretary, DWS Distributors, Inc. (2018–present); Director and Vice President, DWS Service Company (2018–present); Assistant Secretary, DWS Investment Management Americas, Inc. (2018–present); Director and President, DB Investment Managers, Inc. (2018–present); President and Chief Executive Officer, The European Equity Fund, Inc., The New Germany Fund, Inc. and The Central and Eastern Europe Fund, Inc. (2017–present); formerly: Vice President for the Deutsche funds (2016–2017); Assistant Secretary for the DWS funds (2013–2019); Assistant Secretary, The European Equity Fund, Inc., The New Germany Fund, Inc. and The Central and Eastern Europe Fund, Inc. (2013–2020); Directorships: Interested Director, The European Equity Fund, Inc., The New Germany Fund, Inc. and The Central and Eastern Europe Fund, Inc. (since June 25, 2020); ICI Mutual Insurance Company (since October 16, 2020); and Episcopalian Charities of New York (2018–present) |
| John Millette8 (1962)Vice President and Secretary, 1999–present | Legal (Associate General Counsel), DWS; Chief Legal Officer, DWS Investment Management Americas, Inc. (2015–present); Director and Vice President, DWS Trust Company (2016–present); Secretary, DBX ETF Trust (2020–present); Vice President, DBX Advisors LLC (2021–present); Secretary, The European Equity Fund, Inc., The New Germany Fund, Inc. and The Central and Eastern Europe Fund, Inc. 2011–present); formerly: Secretary, Deutsche Investment Management Americas Inc. (2015–2017); and Assistant Secretary, DBX ETF Trust (2019–2020) |
| Ciara Crawford9 (1984)Assistant Secretary, (2019–present) | Fund Administration (Specialist), DWS (2015–present); formerly, Legal Assistant at Accelerated Tax Solutions. |
| Diane Kenneally8 (1966)Chief Financial Officer and Treasurer, 2018–present | Fund Administration Treasurer’s Office (Co-Head since 2018), DWS; Treasurer, Chief Financial Officer and Controller, DBX ETF Trust (2019–present); Treasurer and Chief Financial Officer, The European Equity Fund, Inc., The New Germany Fund, Inc. and The Central and Eastern Europe Fund, Inc. (2018–present); formerly: Assistant Treasurer for the DWS funds (2007–2018) |
| Paul Antosca8 (1957)Assistant Treasurer, 2007–present | Fund Administration Tax (Head), DWS; and Assistant Treasurer, DBX ETF Trust (2019–present) |
| Sheila Cadogan8 (1966)Assistant Treasurer, 2017–present | Fund Administration Treasurer’s Office (Co-Head since 2018), DWS; Director and Vice President, DWS Trust Company (2018–present); Assistant Treasurer, DBX ETF Trust (2019–present); Assistant Treasurer, The European Equity Fund, Inc., The New Germany Fund, Inc. and The Central and Eastern Europe Fund, Inc. (2018–present) |
| Scott D. Hogan8 (1970)Chief Compliance Officer, 2016–present | Anti-Financial Crime & Compliance US (Senior Team Lead), DWS; Chief Compliance Officer, The European Equity Fund, Inc., The New Germany Fund, Inc. and The Central and Eastern Europe Fund, Inc. (2016–present) |
| DWS Emerging Markets Equity Fund | | | 55 |
| Name, Year of Birth, Position with the Trust/Corporation and Length of Time Served6 | Business Experience and Directorships During the Past Five Years |
| Caroline Pearson8 (1962)Chief Legal Officer, 2010–present | Legal (Senior Team Lead), DWS; Assistant Secretary, DBX ETF Trust (2020–present); Chief Legal Officer, DBX Advisors LLC (2020–present); Chief Legal Officer, The European Equity Fund, Inc., The New Germany Fund, Inc. and The Central and Eastern Europe Fund, Inc. (2012–present); formerly: Secretary, Deutsche AM Distributors, Inc. (2002–2017); Secretary, Deutsche AM Service Company (2010–2017); and Chief Legal Officer, DBX Strategic Advisors LLC (2020–2021) |
| Christian Rijs7 (1980)Anti-Money Laundering Compliance Officer, since October 6, 2021 | DWS Americas Head of Anti-Financial Crime and AML Officer, DWS; AML Officer, DWS Trust Company (since October 6, 2021); AML Officer, DBX ETF Trust (since October 6, 2021); AML Officer, The European Equity Fund, Inc., The New Germany Fund, Inc. and The Central and Eastern Europe Fund, Inc. (since October 6, 2021); formerly: DWS UK & Ireland Head of Anti-Financial Crime and MLRO |
| 1 | The length of time served represents the year in which the Board Member joined the board of one or more DWS funds currently overseen by the Board. |
| 2 | A publicly held company with securities registered pursuant to Section 12 of the Securities Exchange Act of 1934. |
| 3 | Mr. Perry and Ms. Schrand are Advisory Board Members of Deutsche DWS Asset Allocation Trust, Deutsche DWS Equity 500 Index Portfolio, Deutsche DWS Global/International Fund, Inc., Deutsche DWS Income Trust, Deutsche DWS Institutional Funds, Deutsche DWS International Fund, Inc., Deutsche DWS Investment Trust, Deutsche DWS Investments VIT Funds, Deutsche DWS Money Market Trust, Deutsche DWS Municipal Trust, Deutsche DWS Portfolio Trust, Deutsche DWS Securities Trust, Deutsche DWS Tax Free Trust, Deutsche DWS Variable Series I and Government Cash Management Portfolio. Mr. Perry and Ms. Schrand are Board Members of each other Trust. |
| 4 | Mr. Perry and Ms. Schrand oversee 21 funds in the DWS Fund Complex as Board Members of various Trusts. Mr. Perry and Ms. Schrand are Advisory Board Members of various Trusts/Corporations comprised of 49 funds in the DWS Fund Complex. |
| 5 | As a result of their respective positions held with the Advisor or its affiliates, these individuals are considered “interested persons” of the Advisor within the meaning of the 1940 Act. Interested persons receive no compensation from the Fund. |
| 6 | The length of time served represents the year in which the officer was first elected in such capacity for one or more DWS funds. |
| 7 | Address: 875 Third Avenue, New York, NY 10022. |
| 8 | Address: 100 Summer Street, Boston, MA 02110. |
| 9 | Address: 5022 Gate Parkway, Suite 400, Jacksonville, FL 32256. |
| 56 | | | DWS Emerging Markets Equity Fund |
| For More Information | The automated telephone system allows you to access personalized account information and obtain information on other DWS funds using either your voice or your telephone keypad. Certain account types within Classes A, T, C and S also have the ability to purchase, exchange or redeem shares using this system. |
| For more information, contact your financial representative. You may also access our automated telephone system or speak with a Shareholder Service representative by calling: (800) 728-3337 | |
| Web Site | dws.com View your account transactions and balances, trade shares, monitor your asset allocation, subscribe to fund and account updates by e-mail, and change your address, 24 hours a day. |
| Obtain prospectuses and applications, news about DWS funds, insight from DWS economists and investment specialists and access to DWS fund account information. | |
| Written Correspondence | DWSPO Box 219151 Kansas City, MO 64121-9151 |
| Proxy Voting | The Fund’s policies and procedures for voting proxies for portfolio securities and information about how the Fund voted proxies related to its portfolio securities during the most recent 12-month period ended June 30 are available on our Web site — dws.com/en-us/resources/proxy-voting — or on the SEC’s Web site — sec.gov. To obtain a written copy of the Fund’s policies and procedures without charge, upon request, call us toll free at (800) 728-3337. |
| Portfolio Holdings | Following the Fund’s fiscal first and third quarter-end, a complete portfolio holdings listing is posted on dws.com, and is available free of charge by contacting your financial intermediary, or if you are a direct investor, by calling (800) 728-3337. In addition, the portfolio holdings listing is filed with SEC on the Fund’s Form N-PORT and will be available on the SEC’s Web site at sec.gov. Additional portfolio holdings for the Fund are also posted on dws.com from time to time. Please see the Fund’s current prospectus for more information. |
| Principal Underwriter | If you have questions, comments or complaints, contact:DWS Distributors, Inc. 222 South Riverside Plaza Chicago, IL 60606-5808 (800) 621-1148 |
| DWS Emerging Markets Equity Fund | | | 57 |
| Investment Management | DWS Investment Management Americas, Inc. (“DIMA” or the “Advisor” ), which is part of the DWS Group GmbH & Co. KGaA (“DWS Group” ), is the investment advisor for the Fund. DIMA and its predecessors have more than 90 years of experience managing mutual funds and DIMA provides a full range of investment advisory services to both institutional and retail clients. DIMA is an indirect, wholly owned subsidiary of DWS Group. |
| DWS Group is a global organization that offers a wide range of investing expertise and resources, including hundreds of portfolio managers and analysts and an office network that reaches the world’s major investment centers. This well-resourced global investment platform brings together a wide variety of experience and investment insight across industries, regions, asset classes and investing styles. |
| Class A | Class T | Class C | Class S | Institutional Class | |
| Nasdaq Symbol | SEKAX | SEKTX | SEKCX | SEMGX | SEKIX |
| CUSIP Number | 25156G 103 | 25156G 566 | 25156G 301 | 25156G 400 | 25156G 780 |
| Fund Number | 479 | 1779 | 779 | 2079 | 1479 |
| For shareholders of Class R6 | ||
| Automated Information Line | DWS/Ascensus Plan Access (800) 728-3337 | |
| 24-hour access to your retirement plan account. | ||
| Web Site | dws.com | |
| Obtain prospectuses and applications, news about DWS funds, insight from DWS economists and investment specialists and access to DWS fund account information. | ||
| Log in/register to manage retirement account assets at https://www.mykplan.com/participantsecure_net/login.aspx. | ||
| For More Information | (800) 728-3337 | |
| To speak with a service representative. | ||
| Written Correspondence | DWS Service Company222 South Riverside Plaza Chicago, IL 60606-5806 | |
| Class R6 | |
| Nasdaq Symbol | SEKRX |
| CUSIP Number | 25156G 426 |
| Fund Number | 1679 |
| 58 | | | DWS Emerging Markets Equity Fund |
| (b) Not applicable | |
| ITEM 2. | CODE OF ETHICS |
As of the end of the period covered by this report, the registrant has adopted a code of ethics, as defined in Item 2 of Form N-CSR that applies to its Principal Executive Officer and Principal Financial Officer.
There have been no amendments to, or waivers from, a provision of the code of ethics during the period covered by this report that would require disclosure under Item 2.
A copy of the code of ethics is filed as an exhibit to this Form N-CSR. | |
| ITEM 3. | AUDIT COMMITTEE FINANCIAL EXPERT |
| The fund’s audit committee is comprised solely of trustees who are "independent" (as such term has been defined by the Securities and Exchange Commission ("SEC") in regulations implementing Section 407 of the Sarbanes-Oxley Act (the "Regulations")). The fund’s Board of Trustees has determined that there are several "audit committee financial experts" (as such term has been defined by the Regulations) serving on the fund’s audit committee including Mr. William McClayton, the chair of the fund’s audit committee. An “audit committee financial expert” is not an “expert” for any purpose, including for purposes of Section 11 of the Securities Act of 1933 and the designation or identification of a person as an “audit committee financial expert” does not impose on such person any duties, obligations or liability that are greater than the duties, obligations and liability imposed on such person as a member of the audit committee and board of directors in the absence of such designation or identification. | |
| ITEM 4. | PRINCIPAL ACCOUNTANT FEES AND SERVICES |
DWS Emerging Markets Equity Fund
form n-csr disclosure re: AUDIT FEES
The following table shows the amount of fees that Ernst & Young LLP (“EY”), the Fund’s Independent Registered Public Accounting Firm, billed to the Fund during the Fund’s last two fiscal years. The Audit Committee approved in advance all audit services and non-audit services that EY provided to the Fund.
Services that the Fund’s Independent Registered Public Accounting Firm Billed to the Fund
| Fiscal Year Ended October 31, | Audit Fees Billed to Fund | Audit-Related Fees Billed to Fund | Tax Fees Billed to Fund | All Other Fees Billed to Fund |
| 2021 | $62,433 | $0 | $7,879 | $0 |
| 2020 | $62,433 | $0 | $7,879 | $0 |
The above “Tax Fees” were billed for professional services rendered for tax preparation.
Services that the Fund’s Independent Registered Public Accounting Firm Billed to the Adviser and Affiliated Fund Service Providers
The following table shows the amount of fees billed by EY to DWS Investment Management Americas, Inc. (“DIMA” or the “Adviser”), and any entity controlling, controlled by or under common control with DIMA (“Control Affiliate”) that provides ongoing services to the Fund (“Affiliated Fund Service Provider”), for engagements directly related to the Fund’s operations and financial reporting, during the Fund’s last two fiscal years.
| Fiscal Year Ended October 31, | Audit-Related Fees Billed to Adviser and Affiliated Fund Service Providers | Tax Fees Billed to Adviser and Affiliated Fund Service Providers | All Other Fees Billed to Adviser and Affiliated Fund Service Providers |
| 2021 | $0 | $487,049 | $0 |
| 2020 | $0 | $650,763 | $0 |
The above “Tax Fees” were billed in connection with tax compliance services and agreed upon procedures.
Non-Audit Services
The following table shows the amount of fees that EY billed during the Fund’s last two fiscal years for non-audit services. The Audit Committee pre-approved all non-audit services that EY provided to the Adviser and any Affiliated Fund Service Provider that related directly to the Fund’s operations and financial reporting. The Audit Committee requested and received information from EY about any non-audit services that EY rendered during the Fund’s last fiscal year to the Adviser and any Affiliated Fund Service Provider. The Committee considered this information in evaluating EY’s independence.
| Fiscal Year Ended October 31, | Total Non-Audit Fees Billed to Fund (A) | Total Non-Audit Fees billed to Adviser and Affiliated Fund Service Providers (engagements related directly to the operations and financial reporting of the Fund) (B) | Total Non-Audit Fees billed to Adviser and Affiliated Fund Service Providers (all other engagements) (C) | Total of (A), (B) and (C) |
| 2021 | $7,879 | $487,049 | $0 | $494,928 |
| 2020 | $7,879 | $650,763 | $0 | $658,642 |
All other engagement fees were billed for services in connection with agreed upon procedures and tax compliance for DIMA and other related entities.
Audit Committee Pre-Approval Policies and Procedures. Generally, each Fund’s Audit Committee must pre approve (i) all services to be performed for a Fund by a Fund’s Independent Registered Public Accounting Firm and (ii) all non-audit services to be performed by a Fund’s Independent Registered Public Accounting Firm for the DIMA Entities with respect to operations and financial reporting of the Fund, except that the Chairperson or Vice Chairperson of each Fund’s Audit Committee may grant the pre-approval for non-audit services described in items (i) and (ii) above for non-prohibited services for engagements of less than $100,000. All such delegated pre approvals shall be presented to each Fund’s Audit Committee no later than the next Audit Committee meeting.
There were no amounts that were approved by the Audit Committee pursuant to the de minimis exception under Rule 2-01 of Regulation S-X.
According to the registrant’s principal Independent Registered Public Accounting Firm, substantially all of the principal Independent Registered Public Accounting Firm's hours spent on auditing the registrant's financial statements were attributed to work performed by full-time permanent employees of the principal Independent Registered Public Accounting Firm.
***
In connection with the audit of the 2020 and 2021 financial statements, the Fund entered into an engagement letter with EY. The terms of the engagement letter required by EY, and agreed to by the Audit Committee, include a provision mandating the use of mediation and arbitration to resolve any controversy or claim between the parties arising out of or relating to the engagement letter or services provided thereunder.
***
Pursuant to PCAOB Rule 3526, EY is required to describe in writing to the Fund’s Audit Committee, on at least an annual basis, all relationships between EY, or any of its affiliates, and the DWS Funds, including the Fund, or persons in financial reporting oversight roles at the DWS Funds that, as of the date of the communication, may reasonably be thought to bear on EY’s independence. Pursuant to PCAOB Rule 3526, EY has reported the matters set forth below that may reasonably be thought to bear on EY’s independence. With respect to each reported matter in the aggregate, EY advised the Audit Committee that, after careful consideration of the facts and circumstances and the applicable independence rules, it concluded that the matters do not and will not impair EY’s ability to exercise objective and impartial judgement in connection with the audits of the financial statements for the Fund and a reasonable investor with knowledge of all relevant facts and circumstances would conclude that EY has been and is capable of exercising objective and impartial judgment on all issues encompassed within EY’s audit engagements. EY also confirmed to the Audit Committee that it can continue to act as the Independent Registered Public Accounting Firm for the Fund.
| · | EY advised the Fund’s Audit Committee that various covered persons within EY and EY’s affiliates held investments in, or had other financial relationships with, entities within the DWS Funds “investment company complex” (as defined in Regulation S-X) (the “DWS Funds Complex”). EY informed the Audit Committee that these investments and financial relationships were inconsistent with Rule 2-01(c)(1) of Regulation S-X. EY reported that all breaches have been resolved and that none of the breaches involved any professionals who were part of the audit engagement team for the Fund or in the position to influence the audit engagement team for the Fund. |
| ITEM 5. | AUDIT COMMITTEE OF LISTED REGISTRANTS | |
| Not applicable | ||
| ITEM 6. | SCHEDULE OF INVESTMENTS | |
| Not applicable | ||
| ITEM 7. | DISCLOSURE OF PROXY VOTING POLICIES AND PROCEDURES FOR CLOSED-END MANAGEMENT INVESTMENT COMPANIES | |
| Not applicable | ||
| ITEM 8. | PORTFOLIO MANAGERS OF CLOSED-END MANAGEMENT INVESTMENT COMPANIES | |
| Not applicable | ||
| ITEM 9. | PURCHASES OF EQUITY SECURITIES BY CLOSED-END MANAGEMENT INVESTMENT COMPANY AND AFFILIATED PURCHASERS | |
| Not applicable | ||
| ITEM 10. | SUBMISSION OF MATTERS TO A VOTE OF SECURITY HOLDERS | |
| There were no material changes to the procedures by which shareholders may recommend nominees to the Fund’s Board. The primary function of the Nominating and Governance Committee is to identify and recommend individuals for membership on the Board and oversee the administration of the Board Governance Guidelines. Shareholders may recommend candidates for Board positions by forwarding their correspondence by U.S. mail or courier service to Keith R. Fox, DWS Funds Board Chair, c/o Thomas R. Hiller, Ropes & Gray LLP, Prudential Tower, 800 Boylston Street, Boston, MA 02199-3600. | ||
| ITEM 11. | CONTROLS AND PROCEDURES | |
| (a) | The Chief Executive and Financial Officers concluded that the Registrant’s Disclosure Controls and Procedures are effective based on the evaluation of the Disclosure Controls and Procedures as of a date within 90 days of the filing date of this report. | |
| (b) | There have been no changes in the registrant’s internal control over financial reporting that occurred during the period covered by this report that has materially affected, or is reasonably likely to materially affect, the registrant’s internal controls over financial reporting. | |
| ITEM 12. | Disclosure of Securities Lending Activities for Closed-End Management Investment Companies | |
| Not applicable | ||
| ITEM 13. | EXHIBITS | |
| (a)(1) | Code of Ethics pursuant to Item 2 of Form N-CSR is filed and attached hereto as EX-99.CODE ETH. | |
| (a)(2) | Certification pursuant to Rule 30a-2(a) under the Investment Company Act of 1940 (17 CFR 270.30a-2(a)) is filed and attached hereto as Exhibit 99.CERT. | |
| (b) | Certification pursuant to Rule 30a-2(b) under the Investment Company Act of 1940 (17 CFR 270.30a-2(b)) is furnished and attached hereto as Exhibit 99.906CERT. | |
SIGNATURES
Pursuant to the requirements of the Securities Exchange Act of 1934 and the Investment Company Act of 1940, the registrant has duly caused this report to be signed on its behalf by the undersigned, thereunto duly authorized.
| Registrant: | DWS Emerging Markets Equity Fund, a series of Deutsche DWS International Fund, Inc. |
| By: | /s/Hepsen Uzcan Hepsen Uzcan President |
| Date: | 12/30/2021 |
Pursuant to the requirements of the Securities Exchange Act of 1934 and the Investment Company Act of 1940, this report has been signed below by the following persons on behalf of the registrant and in the capacities and on the dates indicated.
| By: | /s/Hepsen Uzcan Hepsen Uzcan President |
| Date: | 12/30/2021 |
| By: | /s/Diane Kenneally Diane Kenneally Chief Financial Officer and Treasurer |
| Date: | 12/30/2021 |