
February 2013
• The following discussion may contain statements that are considered forward-looking within the meaning of the Private Securities Litigation Reform Act of 1995, including statements about the outlook and prospects for American Media, Inc. • Forward looking statements are those which are not historical facts. These and other statements that relate to future results and events are based upon management’s current expectations and assumptions and are subject to risks and uncertainties which may cause our actual results in future periods to differ materially from those currently expected because of risks discussed in this presentation, our Quarterly Report on Form 10-Q for the Three and Nine Months Ended December 31, 2012 and the “Risk Factors” section of our Registration Statement on Form S-4/A declared effective by the SEC on October 19, 2012. Please consult these documents for a more complete understanding of these risks and uncertainties. Except as required by law, we disclaim any intention or obligation to update or revise any forward-looking statements, whether as a result of new information, future events or otherwise. Non-GAAP and Other Financial Measures • This presentation contains disclosures of Adjusted EBITDA, Proforma Adjusted EBITDA and Free Cash Flow, which are non-GAAP financial measures. Certain information required to be disclosed about these non-GAAP measures, including reconciliations with the most comparable GAAP measures is available in our Quarterly Report on Form 10-Q for the Three and Nine Months ended December 31, 2012, which was filed with the SEC on February 14, 2013. • Please see the Appendix for Reconciliations of Non-GAAP Financial Measures to GAAP Financial Measures. Safe Harbor/Forward-Looking Statements

Extend Brand Equity Women’s Health and Fitness Sh pe

Extend Brand Equity Newsstan & Ad Pages Jan / Feb 2013 Issue +38% Newsstand +28% Ad pages

Extend Brand Equity Digital +250% January, 2013 increase in unique visitors year over year

Brand Extensions In Stores April 2013

Extend Brand Equity Women’s Health and Fitness Sh pe Pro Forma FY14 Revenue EBITDA $48.2 mm $12.3 mm EBITDA improvement: $7.0 million

Extend Brand Equity Newsstand & Ad Pages Feb 2013 Issue +75% Newsstand +12% Ad pages

Extend Brand Equity Digital +404% January 2013 increase in unique visitors year over year
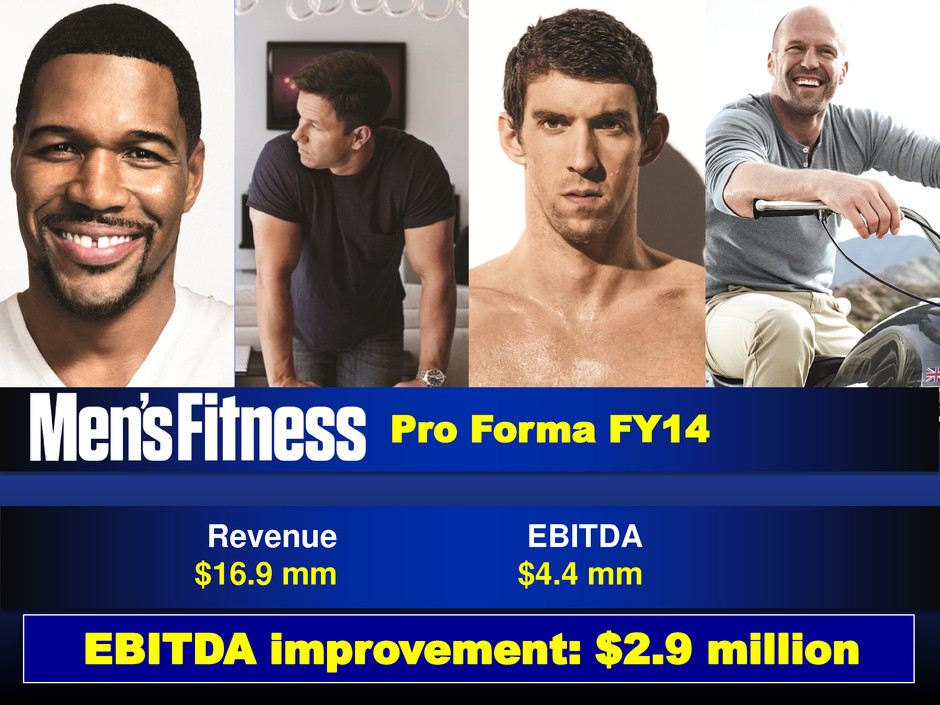
Pro Forma FY14 Revenue EBITDA $16.9 mm $4.4 mm EBITDA improvement: $2.9 million

Men’s Active Lifestyle Brands

Celebrity Magazines

Celebrity Brands Pro Forma FY14 Revenue EBITDA $217 mm $97 mm
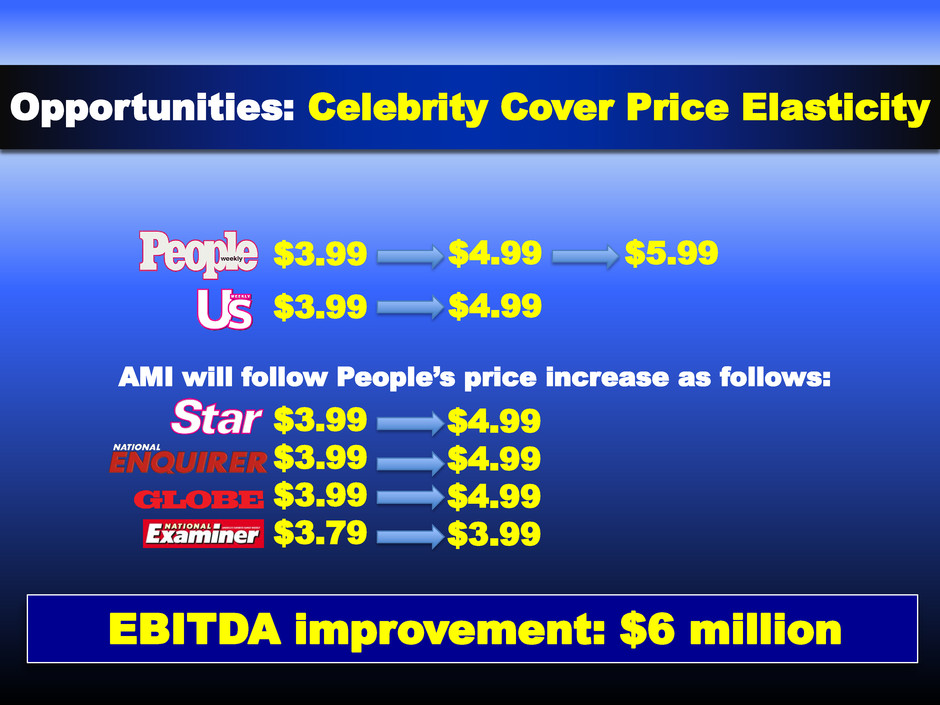
Extend Brand Equity Opportunities: Celebrity Cover Price Elasticity $3.99 $3.99 $3.99 $3.99 $3.99 $3.79 $4.99 $5.99 $4.99 $4.99 $4.99 $4.99 $3.99 AMI will follow People’s price increase as follows: EBITDA improvement: $6 million

Celebrity Market Annual Retail Sales: $650 mm Units (000's) 18 Weeks Prior 18 Weeks Prior Ending 18 Diff Diff Ending 18 7-Jan Weeks B(W) B(W) 7-Jan Weeks AMI 1,179 1,216 (37) -3% 36% 33% Competition 2,092 2,450 (358) -15% 64% 67% Market 3,271 3,666 (395) -11% 100% 100% SOMUnits (000's)Celebrity Newsstand

Extend Brand Equity Celebrity Digital (Radar & OK!) +81% January 2013 increase in unique visitors year over year

Extend Brand Equity Celebrity TV Opportunities

Publishing Services
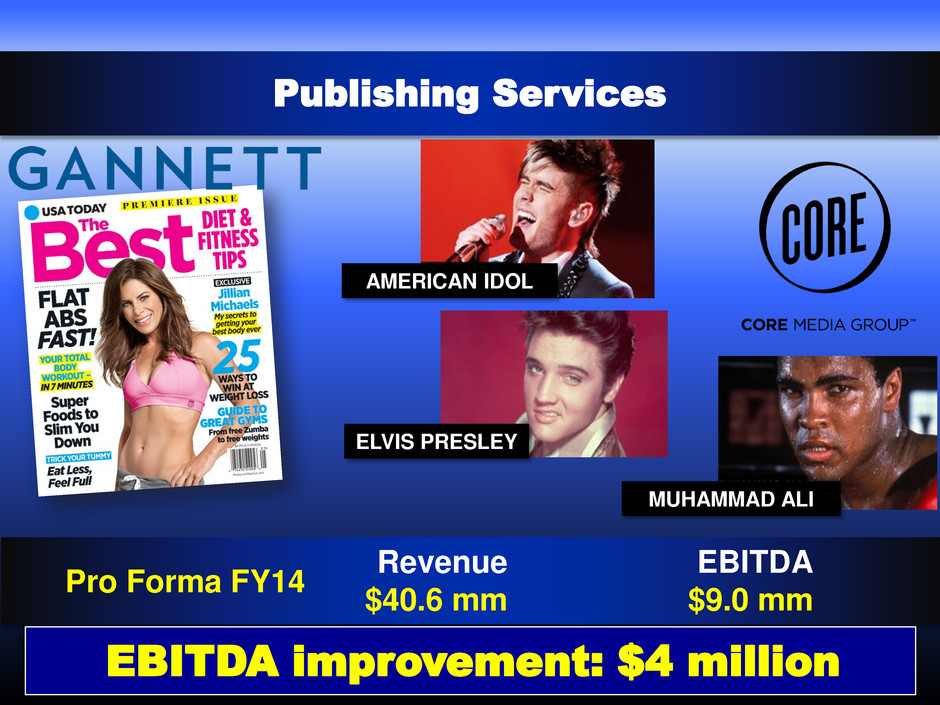
Publishing Services AMERICAN IDOL ELVIS PRESLEY Revenue EBITDA $40.6 mm $9.0 mm EBITDA improvement: $4 million ELVIS PRESLEY MUHAMMAD ALI Pro Forma FY14

On-going Conversations Opportunities: Publishing Services

Digital Opportunities

Digital Opportunities Tablet Enrichments Content Partnerships Mobile Applications FY16 Digital Financial Projections Revenue: $35 million EBITDA: $20 million
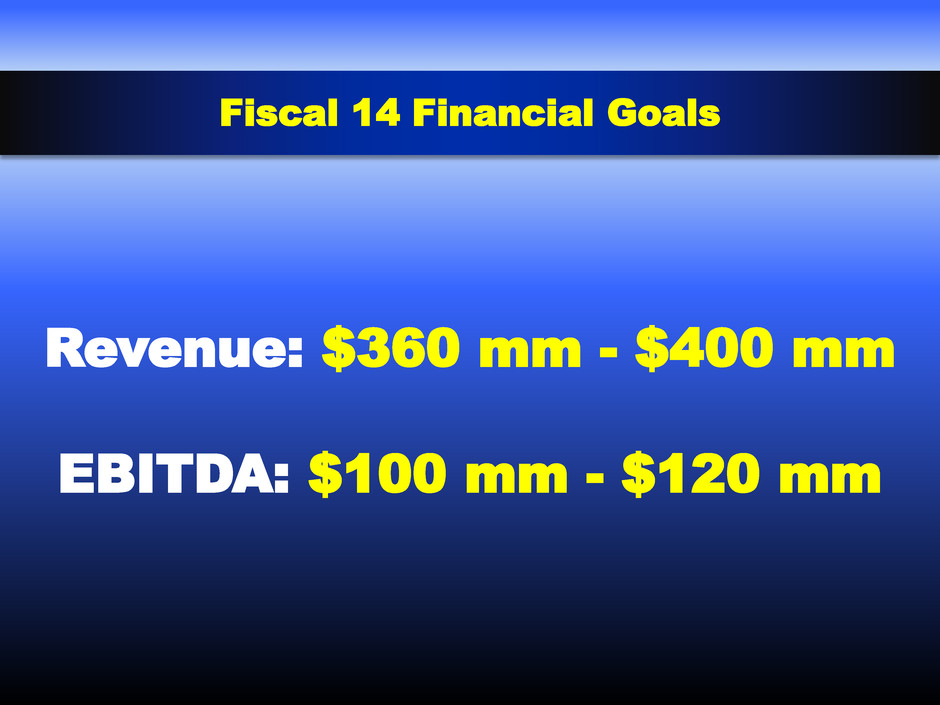
Fiscal 14 Financial Goals Revenue: $360 mm - $400 mm EBITDA: $100 mm - $120 mm

Financial Update Chris Polimeni, EVP / CFO
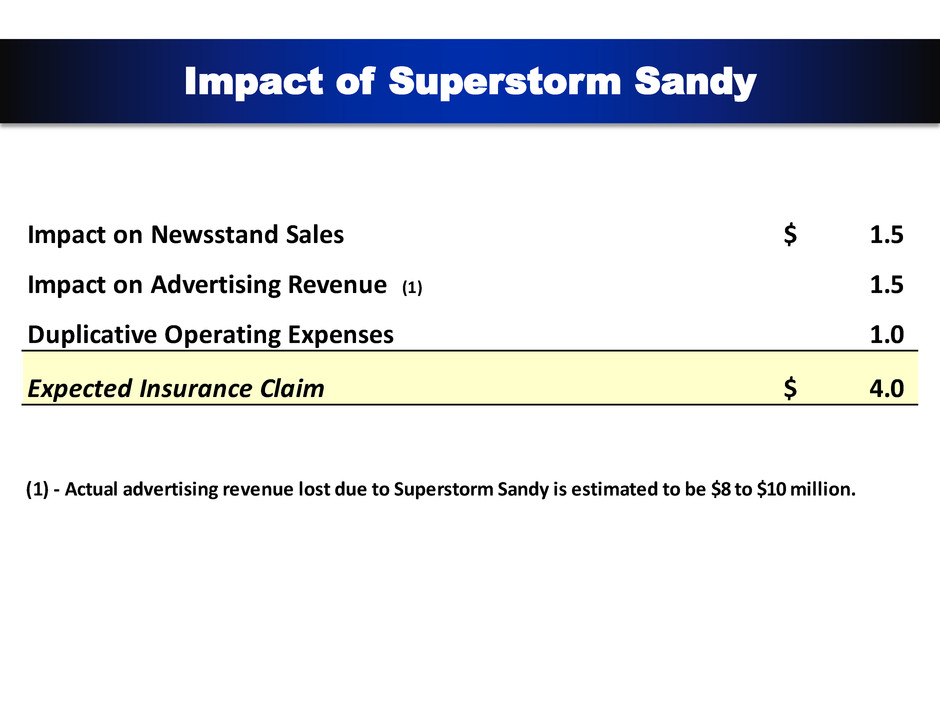
Impact of Superstorm Sandy Impact on Newsstand Sales 1.5$ Impact on Advertising Revenue (1) 1.5 Duplicative Operating Expenses 1.0 Expected Insurance Claim 4.0$ (1) - Actual advertising revenue lost due to Superstorm Sandy is estimated to be $8 to $10 million.
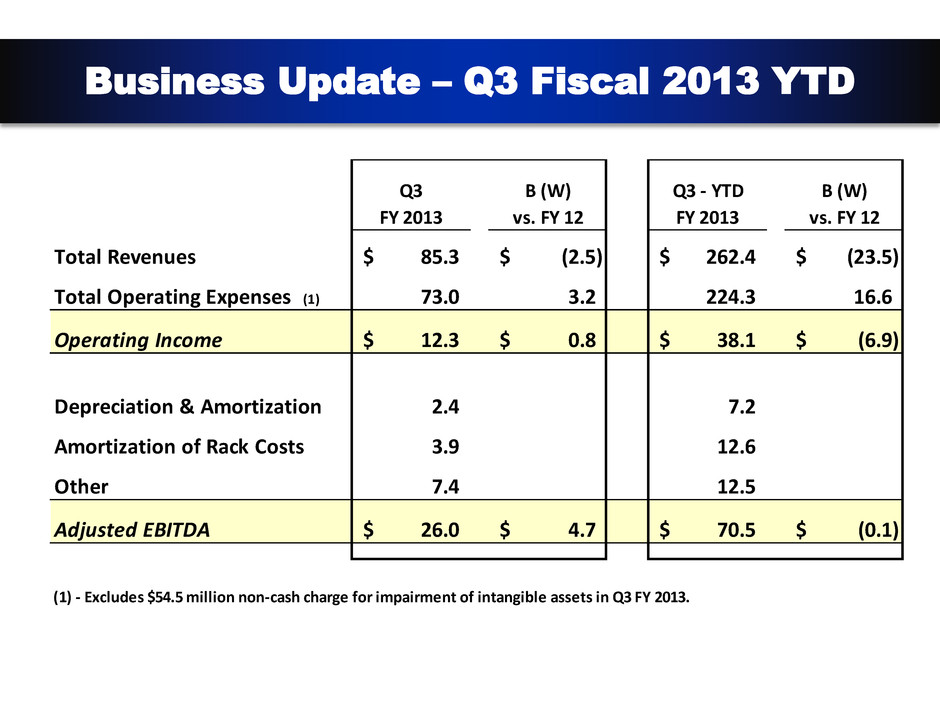
Business Update – Q3 Fiscal 2013 YTD Q3 B (W) Q3 - YTD B (W) FY 2013 vs. FY 12 FY 2013 vs. FY 12 Total Revenues 85.3$ (2.5)$ 262.4$ (23.5)$ Total Operating Expenses (1) 73.0 3.2 224.3 16.6 Operating Income 12.3$ 0.8$ 38.1$ (6.9)$ Depreciation & Amortization 2.4 7.2 Amortization of Rack Costs 3.9 12.6 Other 7.4 12.5 Adjusted EBITDA 26.0$ 4.7$ 70.5$ (0.1)$ (1) - Excludes $54.5 million non-cash charge for impairment of intangible assets in Q3 FY 2013.

Normalized Revenue and EBITDA Q3 FY 2013 Adjusted Revenue EBITDA 87.8$ Three months ended 12/31/11 21.3$ 85.3 Three months ended 12/31/12 26.0 (2.5) Variance as Reported 4.7 Proforma Adjustments: 1.7 Discontinued Titles - 1.4 International Licensing 1.4 3.8 Shape Frequency Change 1.5 3.0 Impact of Superstorm Sandy - 3.0 Relaunch of Shape and Men's Fitness 2.9 10.4$ Normalized Year over Year Change 10.4$
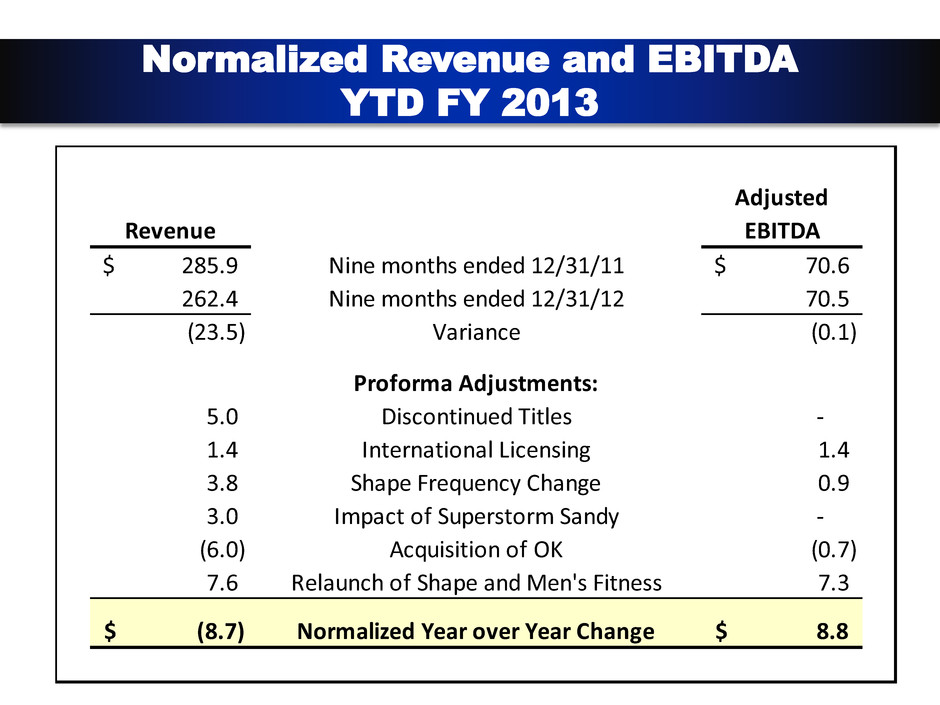
Normalized Revenue and EBITDA YTD FY 2013 Adjusted Revenue EBITDA 285.9$ Nine months ended 12/31/11 70.6$ 262.4 Nine months ended 12/31/12 70.5 (23.5) Variance (0.1) Proforma Adjustments: 5.0 Discontinued Titles - 1.4 International Licensing 1.4 3.8 Shape Frequency Change 0.9 3.0 Impact of Superstorm Sandy - (6.0) Acquisition of OK (0.7) 7.6 Relaunch of Shape and Men's Fitness 7.3 (8.7)$ Normalized Year over Year Change 8.8$
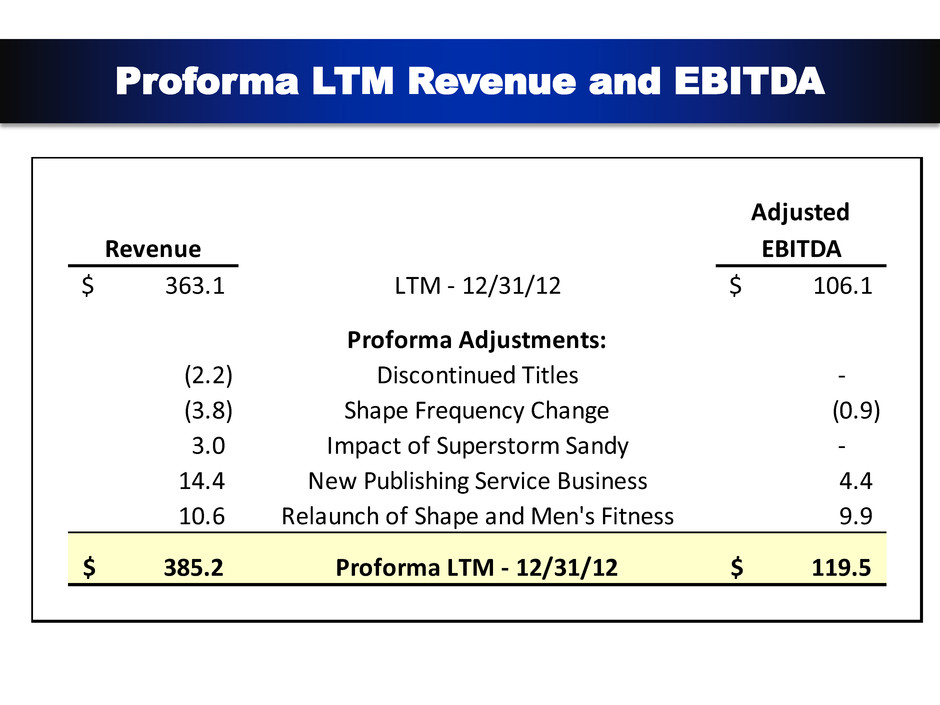
Proforma LTM Revenue and EBITDA Adjusted Revenue EBITDA 363.1$ LTM - 12/31/12 106.1$ Proforma Adjustments: (2.2) Discontinued Titles - (3.8) Shape Frequency Change (0.9) 3.0 Impact of Superstorm Sandy - 14.4 New Publishing Service Business 4.4 10.6 Relaunch of Shape and Men's Fitness 9.9 385.2$ Proforma LTM - 12/31/12 119.5$
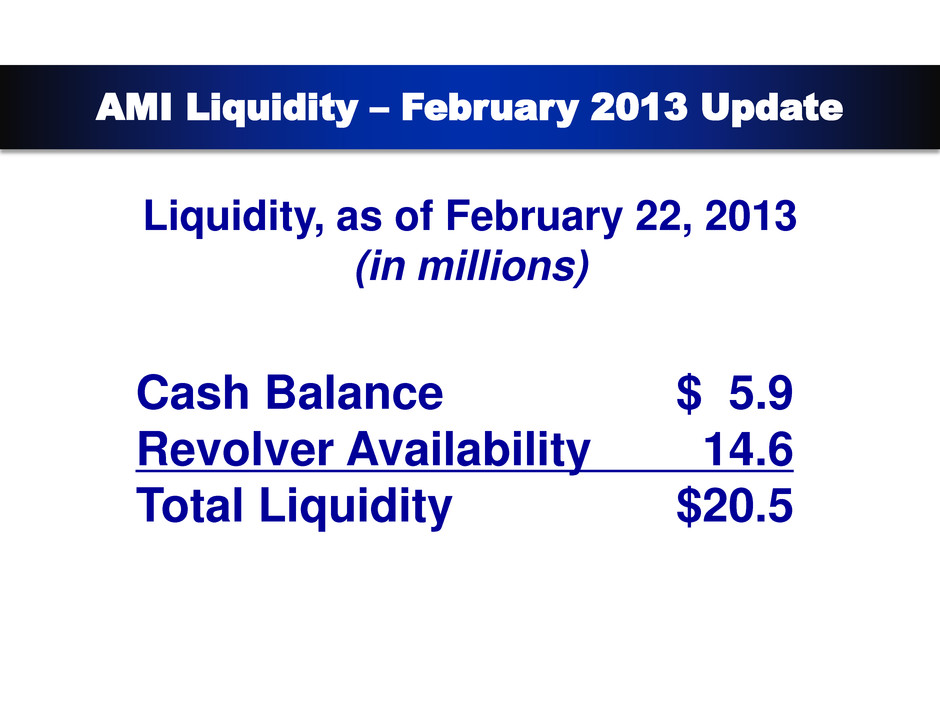
AMI Liquidity – February 2013 Update Liquidity, as of February 22, 2013 (in millions) Cash Balance $ 5.9 Revolver Availability 14.6 Total Liquidity $20.5
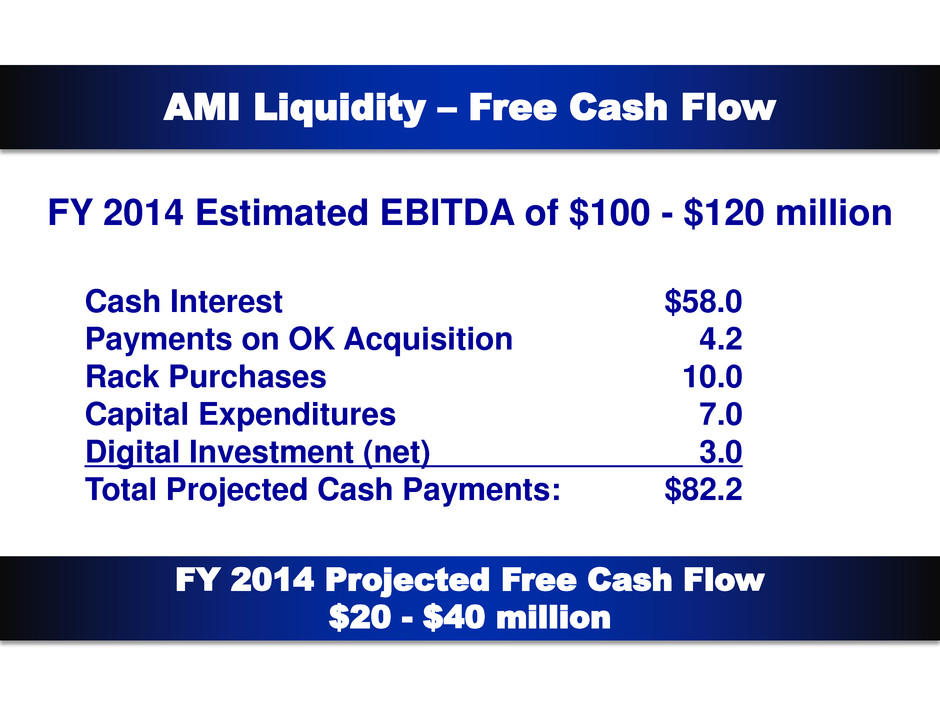
AMI Liquidity – Free Cash Flow FY 2014 Estimated EBITDA of $100 - $120 million Cash Interest $58.0 Payments on OK Acquisition 4.2 Rack Purchases 10.0 Capital Expenditures 7.0 Digital Investment (net) 3.0 Total Projected Cash Payments: $82.2 FY 2014 Projected Free Cash Flow $20 - $40 million

Q&A

Appendix
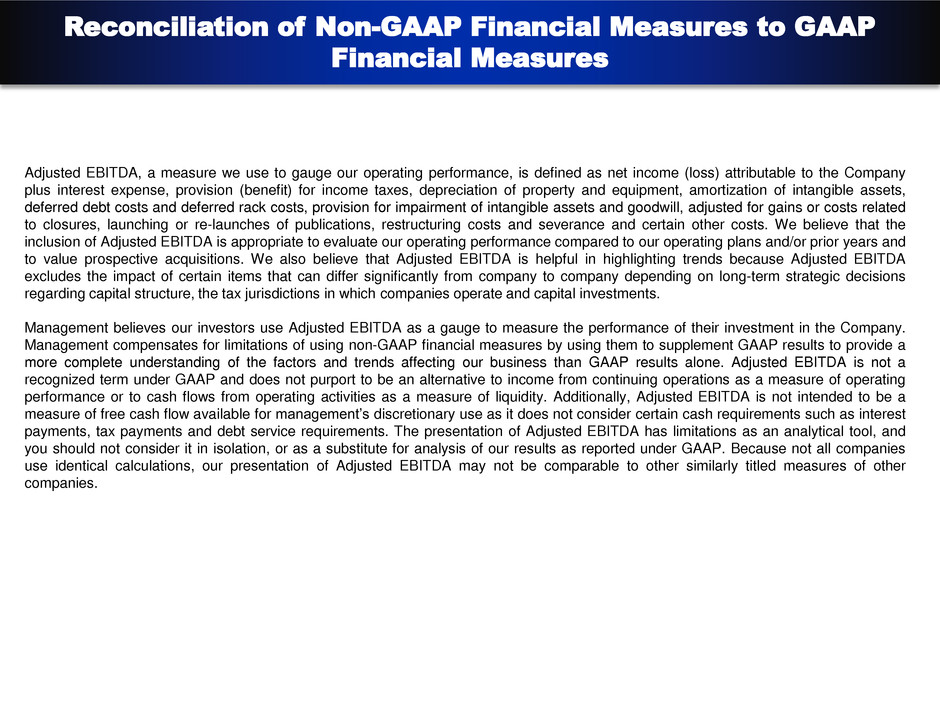
Reconciliation of Non-GAAP Financial Measures to GAAP Financial Measures Adjusted EBITDA, a measure we use to gauge our operating performance, is defined as net income (loss) attributable to the Company plus interest expense, provision (benefit) for income taxes, depreciation of property and equipment, amortization of intangible assets, deferred debt costs and deferred rack costs, provision for impairment of intangible assets and goodwill, adjusted for gains or costs related to closures, launching or re-launches of publications, restructuring costs and severance and certain other costs. We believe that the inclusion of Adjusted EBITDA is appropriate to evaluate our operating performance compared to our operating plans and/or prior years and to value prospective acquisitions. We also believe that Adjusted EBITDA is helpful in highlighting trends because Adjusted EBITDA excludes the impact of certain items that can differ significantly from company to company depending on long-term strategic decisions regarding capital structure, the tax jurisdictions in which companies operate and capital investments. Management believes our investors use Adjusted EBITDA as a gauge to measure the performance of their investment in the Company. Management compensates for limitations of using non-GAAP financial measures by using them to supplement GAAP results to provide a more complete understanding of the factors and trends affecting our business than GAAP results alone. Adjusted EBITDA is not a recognized term under GAAP and does not purport to be an alternative to income from continuing operations as a measure of operating performance or to cash flows from operating activities as a measure of liquidity. Additionally, Adjusted EBITDA is not intended to be a measure of free cash flow available for management’s discretionary use as it does not consider certain cash requirements such as interest payments, tax payments and debt service requirements. The presentation of Adjusted EBITDA has limitations as an analytical tool, and you should not consider it in isolation, or as a substitute for analysis of our results as reported under GAAP. Because not all companies use identical calculations, our presentation of Adjusted EBITDA may not be comparable to other similarly titled measures of other companies.
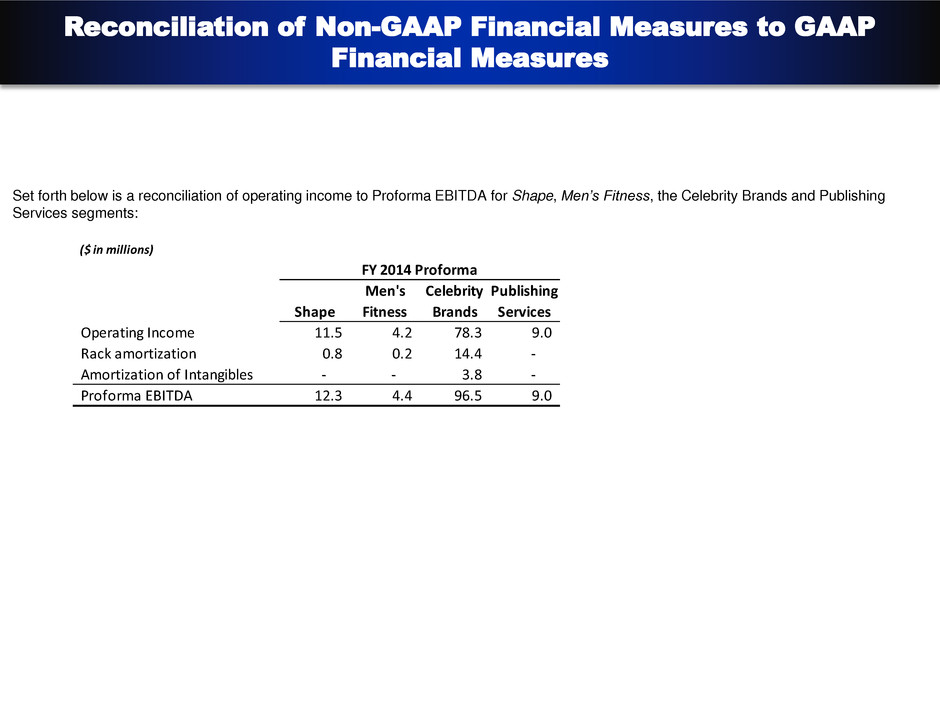
Reconciliation of Non-GAAP Financial Measures to GAAP Financial Measures ($ in millions) Men's Celebrity Publishing Shape Fitness Brands Services Operating Income 11.5 4.2 78.3 9.0 Rack amortization 0.8 0.2 14.4 - Amortization of Intangibles - - 3.8 - Proforma EBITDA 12.3 4.4 96.5 9.0 FY 2014 Proforma Set forth below is a reconciliation of operating income to Proforma EBITDA for Shape, Men’s Fitness, the Celebrity Brands and Publishing Services segments:
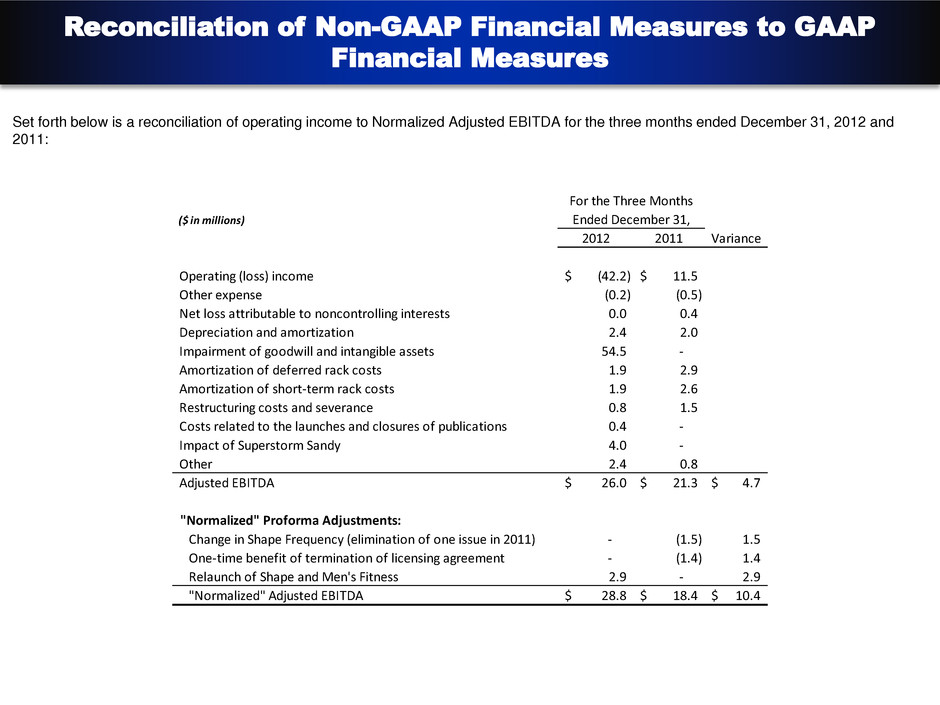
Reconciliation of Non-GAAP Financial Measures to GAAP Financial Measures Set forth below is a reconciliation of operating income to Normalized Adjusted EBITDA for the three months ended December 31, 2012 and 2011: ($ in millions) 2012 2011 Variance Operating (loss) income (42.2)$ 11.5$ Other expense (0.2) (0.5) Net loss attributable to noncontrolling interests 0.0 0.4 Depreciation and amortization 2.4 2.0 Impairment of goodwill and intangible assets 54.5 - Amortization of deferred rack costs 1.9 2.9 Amortization of short-term rack costs 1.9 2.6 Restructuring costs and severance 0.8 1.5 Costs related to the launches and closures of publications 0.4 - Impact of Superstorm Sandy 4.0 - Other 2.4 0.8 Adjusted EBITDA 26.0$ 21.3$ 4.7$ "Normalized" Proforma Adjustments: Change in Shape Frequency (elimination of one issue in 2011) - (1.5) 1.5 One-time benefit of termination of licensing agreement - (1.4) 1.4 Relaunch of Shape and Men's Fitness 2.9 - 2.9 "Normalized" Adjusted EBITDA 28.8$ 18.4$ 10.4$ For the Three Months Ended December 31,

Reconciliation of Non-GAAP Financial Measures to GAAP Financial Measures Set forth below is a reconciliation of operating income to Normalized Adjusted EBITDA for the nine months ended December 31, 2012 and 2011: ($ in millions) 2012 2011 Variance Operating (loss) income (16.4)$ 45.0$ Other expense (0.3) (1.4) Net (income) loss attributable to noncontrolling interests (0.7) 0.4 Depreciation and amortization 7.2 6.4 Impairment of goodwill and intangible assets 54.5 - Amortization of deferred rack costs 6.5 7.9 Amortization of short-term rack costs 6.1 7.1 Restructuring costs and severance 2.1 3.7 Costs related to the launches and closures of publications 1.9 - Impact of Superstorm Sandy 4.0 - Other 5.5 1.5 Adjusted EBITDA 70.5$ 70.6$ (0.1)$ "N r alized" Proforma Adjustments: Change in Shape Frequency (elimination of one issue in 2011) - (0.9) 0.9 One-time benefit of termination of licensing agreement - (1.4) 1.4 Acquisition of OK! Weekly - effective 6/29/11 - 0.7 (0.7) Relaunch of Shape and Men's Fitness 7.3 - 7.3 "Normalized" Adjusted EBITDA 77.8$ 69.0$ 8.8$ For the Nine Months Ended December 31,
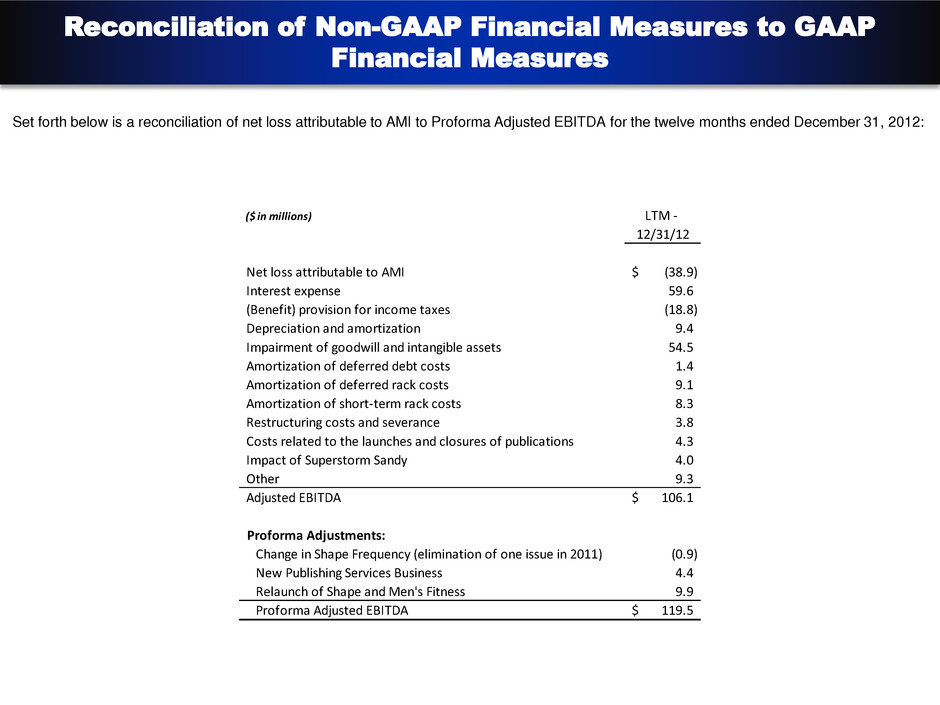
Reconciliation of Non-GAAP Financial Measures to GAAP Financial Measures Set forth below is a reconciliation of net loss attributable to AMI to Proforma Adjusted EBITDA for the twelve months ended December 31, 2012: ($ in millions) LTM - 12/31/12 Net loss attributable to AMI (38.9)$ Interest expense 59.6 (Benefit) provision for income taxes (18.8) Depreciation and amortization 9.4 Impairment of goodwill and intangible assets 54.5 Amortization of deferred debt costs 1.4 Amortization of deferred rack costs 9.1 Amortization of short-term rack costs 8.3 Restructuring costs and severance 3.8 Costs related to the launches and closures of publications 4.3 Impact of Superstorm Sandy 4.0 Other 9.3 Adjusted EBITDA 106.1$ Proforma Adjustments: Change in Shape Frequency (elimination of one issue in 2011) (0.9) New Publishing Services Business 4.4 Relaunch of Shape and Men's Fitness 9.9 Proforma Adjusted EBITDA 119.5$


