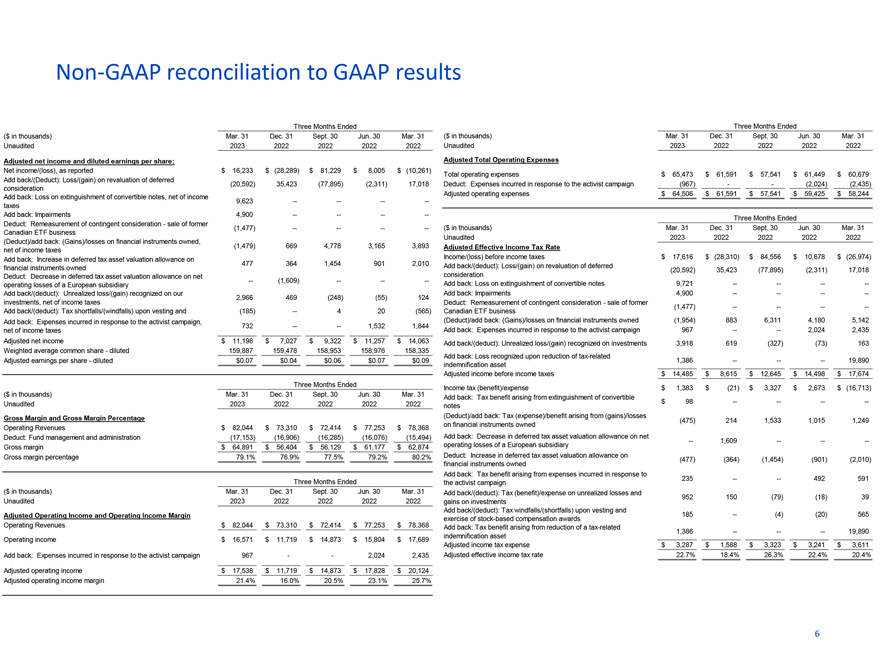
Non-GAAP reconciliation to GAAP results Three Months Ended ($ in thousands) Mar. 31 Dec. 31 Sept. 30 Jun. 30 Mar. 31 Unaudited 2023 2022 2022 2022 2022 Adjusted net income and diluted earnings per share: Net income/(loss), as reported $ 16,233 $ (28,289) $ 81,229 $ 8,005 $ (10,261) Add back/(Deduct): Loss/(gain) on revaluation of deferred (20,592) 35,423 (77,895) (2,311) 17,018 consideration Add back: Loss on extinguishment of convertible notes, net of income 9,623 ——— -taxes Add back: Impairments 4,900 ——— -Deduct: Remeasurement of contingent consideration—sale of former (1,477) ——— -Canadian ETF business (Deduct)/add back: (Gains)/losses on financial instruments owned, (1,479) 669 4,778 3,165 3,893 net of income taxes Add back: Increase in deferred tax asset valuation allowance on 477 364 1,454 901 2,010 financial instruments owned Deduct: Decrease in deferred tax asset valuation allowance on net —(1,609) —— -operating losses of a European subsidiary Add back/(deduct): Unrealized loss/(gain) recognized on our 2,966 469 (248) (55) 124 investments, net of income taxes Add back/(deduct): Tax shortfalls/(windfalls) upon vesting and (185) —4 20 (565) Add back: Expenses incurred in response to the activist campaign, 732 ——1,532 1,844 net of income taxes Adjusted net income $ 11,198 $ 7,027 $ 9,322 $ 11,257 $ 14,063 Weighted average common share—diluted 159,887 159,478 158,953 158,976 158,335 Adjusted earnings per share—diluted $0.07 $0.04 $0.06 $0.07 $0.09 Three Months Ended ($ in thousands) Mar. 31 Dec. 31 Sept. 30 Jun. 30 Mar. 31 Unaudited 2023 2022 2022 2022 2022 Gross Margin and Gross Margin Percentage Operating Revenues $ 82,044 $ 73,310 $ 72,414 $ 77,253 $ 78,368 Deduct: Fund management and administration (17,153) (16,906) (16,285) (16,076) (15,494) Gross margin $ 64,891 $ 56,404 $ 56,129 $ 61,177 $ 62,874 Gross margin percentage 79.1% 76.9% 77.5% 79.2% 80.2% Three Months Ended ($ in thousands) Mar. 31 Dec. 31 Sept. 30 Jun. 30 Mar. 31 Unaudited 2023 2022 2022 2022 2022 Adjusted Operating Income and Operating Income Margin Operating Revenues $ 82,044 $ 73,310 $ 72,414 $ 77,253 $ 78,368 Operating income $ 16,571 $ 11,719 $ 14,873 $ 15,804 $ 17,689 Add back: Expenses incurred in response to the activist campaign 967 — 2,024 2,435 Adjusted operating income $ 17,538 $ 11,719 $ 14,873 $ 17,828 $ 20,124 Adjusted operating income margin 21.4% 16.0% 20.5% 23.1% 25.7% Three Months Ended ($ in thousands) Mar. 31 Dec. 31 Sept. 30 Jun. 30 Mar. 31 Unaudited 2023 2022 2022 2022 2022 Adjusted Total Operating Expenses Total operating expenses $ 65,473 $ 61,591 $ 57,541 $ 61,449 $ 60,679 Deduct: Expenses incurred in response to the activist campaign (967) — (2,024) (2,435) Adjusted operating expenses $ 64,506 $ 61,591 $ 57,541 $ 59,425 $ 58,244 Three Months Ended ($ in thousands) Mar. 31 Dec. 31 Sept. 30 Jun. 30 Mar. 31 Unaudited 2023 2022 2022 2022 2022 Adjusted Effective Income Tax Rate Income/(loss) before income taxes $ 17,616 $ (28,310) $ 84,556 $ 10,678 $ (26,974) Add back/(deduct): Loss/(gain) on revaluation of deferred (20,592) 35,423 (77,895) (2,311) 17,018 consideration Add back: Loss on extinguishment of convertible notes 9,721 ——— -Add back: Impairments 4,900 ——— -Deduct: Remeasurement of contingent consideration—sale of former (1,477) ——— -Canadian ETF business (Deduct)/add back: (Gains)/losses on financial instruments owned (1,954) 883 6,311 4,180 5,142 Add back: Expenses incurred in response to the activist campaign 967 ——2,024 2,435 Add back/(deduct): Unrealized loss/(gain) recognized on investments 3,918 619 (327) (73) 163 Add back: Loss recognized upon reduction of tax-related 1,386 ———19,890 indemnification asset Adjusted income before income taxes $ 14,485 $ 8,615 $ 12,645 $ 14,498 $ 17,674 Income tax (benefit)/expense $ 1,383 $ (21) $ 3,327 $ 2,673 $ (16,713) Add back: Tax benefit arising from extinguishment of convertible $ 98 ——— -notes (Deduct)/add back: Tax (expense)/benefit arising from (gains)/losses (475) 214 1,533 1,015 1,249 on financial instruments owned Add back: Decrease in deferred tax asset valuation allowance on net —1,609 —— -operating losses of a European subsidiary Deduct: Increase in deferred tax asset valuation allowance on (477) (364) (1,454) (901) (2,010) financial instruments owned Add back: Tax benefit arising from expenses incurred in response to 235 ——492 591 the activist campaign Add back/(deduct): Tax (benefit)/expense on unrealized losses and 952 150 (79) (18) 39 gains on investments Add back/(deduct): Tax windfalls/(shortfalls) upon vesting and 185 —(4) (20) 565 exercise of stock-based compensation awards Add back: Tax benefit arising from reduction of a tax-related 1,386 ———19,890 indemnification asset Adjusted income tax expense $ 3,287 $ 1,588 $ 3,323 $ 3,241 $ 3,611 Adjusted effective income tax rate 22.7% 18.4% 26.3% 22.4% 20.4% 6