                                  UNITED STATES
                       SECURITIES AND EXCHANGE COMMISSION
                             WASHINGTON, D. C. 20549

                                   FORM N-CSRS

Investment Company Act file number 811-43

                                 Investment Trust
                             ----------------------
               (Exact Name of Registrant as Specified in Charter)

                 Two International Place, Boston, MA 02110-4103
                 ----------------------------------------------
               (Address of Principal Executive Offices) (Zip Code)

        Registrant's Telephone Number, including Area Code: (617) 295-3488
                                                            --------------

                                  Charles Rizzo
                             Two International Place
                           Boston, Massachusetts 02110
                     ---------------------------------------
                     (Name and Address of Agent for Service)

Date of fiscal year end:        9/30

Date of reporting period:       03/31/2005


ITEM 1.  REPORT TO STOCKHOLDERS
| ||
| ||
| Semiannual Report to Shareholders | |
| March 31, 2005 | |
Contents |
|
Click Here Performance Summary Click Here Information About Your Fund's Expenses Click Here Portfolio Management Review Click Here Portfolio Summary Click Here Investment Portfolio Click Here Financial Statements Click Here Financial Highlights Click Here Notes to Financial Statements Click Here Investment Management Agreement Approval Click Here Account Management Resources Click Here Privacy Statement |
This report must be preceded or accompanied by a prospectus. To obtain a prospectus for any of our funds, refer to the Account Management Resources information provided in the back of this booklet. We advise you to consider the fund's objectives, risks, charges and expenses carefully before investing. The prospectus contains this and other important information about the fund. Please read the prospectus carefully before you invest.
Investments in mutual funds involve risk. Some funds have more risk than others. This fund is subject to stock market risk, meaning stocks in the fund may decline in value for extended periods of time due to the activities and financial prospects of individual companies, or due to general market and economic conditions. Please read this fund's prospectus for specific details regarding its investments and risk profile.
Scudder Investments is part of Deutsche Asset Management, which is the marketing name in the US for the asset management activities of Deutsche Bank AG, Deutsche Investment Management Americas Inc., Deutsche Asset Management Inc., Deutsche Asset Management Investment Services Ltd., Deutsche Bank Trust Company Americas and Scudder Trust Company.
Fund shares are not FDIC-insured and are not deposits or other obligations of, or guaranteed by, any bank. Fund shares involve investment risk, including possible loss of principal.
|
Classes A, B, C, R and Institutional
All performance shown is historical, assumes reinvestment of all dividends and capital gains, and does not guarantee future results. Investment return and principal value fluctuate with changing market conditions so that, when redeemed, shares may be worth more or less than their original cost. Current performance may be lower or higher than the performance quoted. Please visit scudder.com for the Fund's most recent month-end performance.
The maximum sales charge for Class A shares is 5.75%. For Class B shares, the maximum contingent deferred sales charge (CDSC) is 4% within the first year after purchase, declining to 0% after six years. Class C shares have no adjustment for front-end sales charges but redemptions within one year of purchase may be subject to a CDSC of 1%. Unadjusted returns do not reflect sales charges and would have been lower if they had. Class R and Institutional Class shares are not subject to sales charges.
To discourage short-term trading, shareholders redeeming shares held less than 15 days will have a lower total return due to the effect of 2% short-term redemption fee.
Returns and rankings for 1-year, 3-year, 5-year and 10-year periods for Class B and C shares and during all periods for Class R shares reflect a fee waiver and/or expense reimbursement. Without this waiver/reimbursement returns and rankings would have been lower.
Performance figures do not reflect the deduction of taxes that a shareholder would pay on fund distributions or the redemption of fund shares. Returns and rankings may differ by share class.
Returns shown prior to its inception on August 2, 1999 for Class A shares, prior to their inception on December 29, 2000 for Class B and C shares and prior to its inception on November 3, 2003 for Class R shares are derived from the historical performance of Class S shares of the Scudder Growth and Income Fund during such periods and have been adjusted to reflect the higher gross total annual operating expenses of each specific class. Any difference in expenses will affect performance. Class S shares are no longer available to new investors except under certain circumstances. (Please refer to the Fund's Statement of Additional Information.)
Average Annual Total Returns (Unadjusted for Sales Charge) as of 3/31/05 | |||||
Scudder Growth and Income Fund | 6-Month* | 1-Year | 3-Year | 5-Year | 10-Year |
Class A | 6.44% | 5.50% | 1.05% | -2.80% | 6.67% |
Class B | 5.92% | 4.54% | .21% | -3.59% | 5.87% |
Class C | 5.97% | 4.60% | .21% | -3.58% | 5.89% |
Class R | 6.18% | 5.05% | .79% | -3.04% | 6.47% |
S&P 500 Index+ | 6.88% | 6.69% | 2.75% | -3.16% | 10.79% |
Scudder Growth and Income Fund | 6-Month* | 1-Year | Life of Class* |
Institutional Class | 6.67% | 5.97% | 8.68% |
S&P 500 Index+ | 6.88% | 6.69% | 12.30% |
Sources: Lipper Inc. and Deutsche Investment Management Americas Inc.
* Total returns shown for periods less than one year are not annualized.
*Institutional Class shares commenced operations on August 19, 2002. Index returns begin August 31, 2002.
|
|
Growth of an Assumed $10,000 Investment (Adjusted for Maximum Sales Charge) |
[] Scudder Growth and Income Fund — Class A [] S&P 500 Index+ |
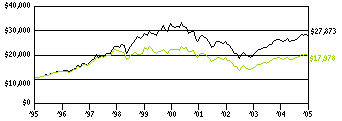 |
Yearly periods ended March 31 |
The Fund's growth of an assumed $10,000 investment is adjusted for the maximum sales charge of 5.75%. This results in a net initial investment of $9,425.
Comparative Results (Adjusted for Maximum Sales Charge) as of 3/31/05 | |||||
Scudder Growth and Income Fund | 1-Year | 3-Year | 5-Year | 10-Year | |
Class A | Growth of $10,000 | $9,943 | $9,725 | $8,176 | $17,978 |
Average annual total return | -.57% | -.93% | -3.95% | 6.04% | |
Class B | Growth of $10,000 | $10,154 | $9,863 | $8,252 | $17,688 |
Average annual total return | 1.54% | -.46% | -3.77% | 5.87% | |
Class C | Growth of $10,000 | $10,460 | $10,063 | $8,335 | $17,723 |
Average annual total return | 4.60% | .21% | -3.58% | 5.89% | |
Class R | Growth of $10,000 | $10,505 | $10,240 | $8,571 | $18,722 |
Average annual total return | 5.05% | .79% | -3.04% | 6.47% | |
S&P 500 Index+ | Growth of $10,000 | $10,669 | $10,847 | $8,516 | $27,873 |
Average annual total return | 6.69% | 2.75% | -3.16% | 10.79% | |
The growth of $10,000 is cumulative.
+ The Standard & Poor's 500 (S&P 500) Index is an unmanaged capitalization-weighted index of 500 stocks. The index is designed to measure performance of the broad domestic economy through changes in the aggregate market value of 500 stocks representing all major industries. Index returns assume reinvestment of dividends and, unlike Fund returns, do not reflect any fees or expenses. It is not possible to invest directly into an index.
|
|
Comparative Results as of 3/31/05 | |||
Scudder Growth and Income Fund | 1-Year | Life of Class* | |
Institutional Class | Growth of $1,000,000 | $1,059,700 | $1,243,100 |
Average annual total return | 5.97% | 8.68% | |
S&P 500 Index+ | Growth of $1,000,000 | $1,066,900 | $1,349,500 |
Average annual total return | 6.69% | 12.30% | |
The growth of $1,000,000 is cumulative.
The minimum initial investment for Institutional Class shares is $1,000,000.
*Institutional Class shares commenced operations on August 19, 2002. Index returns begin August 31, 2002.
+ The Standard & Poor's 500 (S&P 500) Index is an unmanaged capitalization-weighted index of 500 stocks. The index is designed to measure performance of the broad domestic economy through changes in the aggregate market value of 500 stocks representing all major industries. Index returns assume reinvestment of dividends and, unlike Fund returns, do not reflect any fees or expenses. It is not possible to invest directly into an index.
Net Asset Value and Distribution Information | |||||
| Class A | Class B | Class C | Class R | Institutional Class |
Net Asset Value: 3/31/05 | $ 21.16 | $ 20.87 | $ 20.88 | $ 21.28 | $ 21.30 |
9/30/04 | $ 20.05 | $ 19.78 | $ 19.78 | $ 20.17 | $ 20.18 |
Distribution Information: Six Months: Income Dividends as of 3/31/05 | $ .18 | $ .08 | $ .08 | $ .14 | $ .23 |
Class A Lipper Rankings — Large-Cap Core Funds Category as of 3/31/05 | ||||
Period | Rank |
| Number of Funds Tracked | Percentile Ranking |
1-Year | 339 | of | 908 | 38 |
3-Year | 356 | of | 774 | 46 |
5-Year | 183 | of | 596 | 31 |
Source: Lipper Inc. Rankings are historical and do not guarantee future results. Rankings are based on total return unadjusted for sales charges with distributions reinvested. If sales charges had been included, rankings might have been less favorable. Rankings are for Class A shares; other share classes may vary.
|
|
Class AARP has been created especially for members of AARP. Class S shares are no longer available to new investors except under certain circumstances. (Please refer to the Fund's Statement of Additional Information.)
All performance shown is historical, assumes reinvestment of all dividends and capital gains, and does not guarantee future results. Investment return and principal value fluctuate with changing market conditions so that, when redeemed, shares may be worth more or less than their original cost. Current performance may be lower or higher than the performance quoted. Please visit aarp.scudder.com (Class AARP) or myScudder.com (Class S) for the Fund's most recent month-end performance.
To discourage short-term trading, shareholders redeeming shares held less than 15 days will have a lower total return due to the effect of the 2% short-term redemption fee.
Returns and rankings for 1-year, 3-year, 5-year and 10-year periods shown for Class AARP and S reflect a fee and/or expense waiver. Without this waiver/reimbursement returns and rankings would have been lower.
Performance figures do not reflect the deduction of taxes that a shareholder would pay on fund distributions or the redemption of fund shares. Returns and rankings may differ by share class.
Returns shown for Class AARP shares for the periods prior to its inception on August 14, 2000 are derived from the historical performance of Class S shares of the Scudder Growth and Income Fund during such periods and have assumed the same expense structure during such periods. Any difference in expenses will affect performance.
Average Annual Total Returns as of 3/31/05 | |||||
Scudder Growth and Income Fund | 6-Month* | 1-Year | 3-Year | 5-Year | 10-Year |
Class S | 6.63% | 5.95% | 1.37% | -2.51% | 7.04% |
Class AARP | 6.66% | 5.97% | 1.41% | -2.49% | 7.05% |
S&P 500 Index+ | 6.88% | 6.69% | 2.75% | -3.16% | 10.79% |
Sources: Lipper Inc. and Deutsche Investment Management Americas Inc.
* Total returns shown for periods less than one year are not annualized.
Net Asset Value and Distribution Information | ||
| Class AARP | Class S |
Net Asset Value: 3/31/05 | $ 21.32 | $ 21.29 |
9/30/04 | $ 20.20 | $ 20.17 |
Distribution Information: Six Months: Income Dividends as of 3/31/05 | $ .23 | $ .22 |
|
|
Class S Lipper Rankings — Large-Cap Core Funds Category as of 3/31/05 | ||||
Period | Rank |
| Number of Funds Tracked | Percentile Ranking |
1-Year | 303 | of | 908 | 34 |
3-Year | 311 | of | 774 | 41 |
5-Year | 159 | of | 596 | 27 |
10-Year | 194 | of | 229 | 84 |
Source: Lipper Inc. Rankings are historical and do not guarantee future results. Rankings are based on total rankings with distributions reinvested. Rankings are for Class S shares; other share classes may vary.
Growth of an Assumed $10,000 Investment |
[] Scudder Growth and Income Fund — Class S [] S&P 500 Index+ |
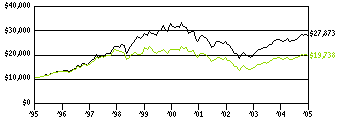 |
Yearly periods ended March 31 |
Comparative Results as of 3/31/05 | |||||
Scudder Growth and Income Fund | 1-Year | 3-Year | 5-Year | 10-Year | |
Class S | Growth of $10,000 | $10,595 | $10,417 | $8,808 | $19,738 |
Average annual total return | 5.95% | 1.37% | -2.51% | 7.04% | |
Class AARP | Growth of $10,000 | $10,597 | $10,429 | $8,817 | $19,757 |
Average annual total return | 5.97% | 1.41% | -2.49% | 7.05% | |
S&P 500 Index+ | Growth of $10,000 | $10,669 | $10,847 | $8,516 | $27,873 |
Average annual total return | 6.69% | 2.75% | -3.16% | 10.79% | |
The growth of $10,000 is cumulative.
+ The Standard & Poor's 500 (S&P 500) Index is an unmanaged capitalization-weighted index of 500 stocks. The index is designed to measure performance of the broad domestic economy through changes in the aggregate market value of 500 stocks representing all major industries. Index returns assume reinvestment of dividends and, unlike Fund returns, do not reflect any fees or expenses. It is not possible to invest directly into an index.
|
 As an investor of the Fund, you incur two types of costs: ongoing expenses and transaction costs. Ongoing expenses include management fees, distribution and service (12b-1) fees and other Fund expenses. Examples of transaction costs include sales charges (loads), redemption fees and account maintenance fees, which are not shown in this section. The following tables are intended to help you understand your ongoing expenses (in dollars) of investing in the Fund and to help you compare these expenses with the ongoing expenses of investing in other mutual funds. In the most recent six-month period, Class R shares of the Fund limited these expenses; had it not done so, expenses would have been higher. The tables are based on an investment of $1,000 made at the beginning of the six-month period ended March 31, 2005.
The tables illustrate your Fund's expenses in two ways:
Actual Fund Return. This helps you estimate the actual dollar amount of ongoing expenses (but not transaction costs) paid on a $1,000 investment in the Fund using the Fund's actual return during the period. To estimate the expenses you paid over the period, simply divide your account value by $1,000 (for example, an $8,600 account value divided by $1,000 = 8.6), then multiply the result by the number in the "Expenses Paid per $1,000" line under the share class you hold.
Hypothetical 5% Fund Return. This helps you to compare your Fund's ongoing expenses (but not transaction costs) with those of other mutual funds using the Fund's actual expense ratio and a hypothetical rate of return of 5% per year before expenses. Examples using a 5% hypothetical fund return may be found in the shareholder reports of other mutual funds. The hypothetical account values and expenses may not be used to estimate the actual ending account balance or expenses you paid for the period.
Please note that the expenses shown in these tables are meant to highlight your ongoing expenses only and do not reflect any transaction costs. The "Expenses Paid per $1,000" line of the tables is useful in comparing ongoing expenses only and will not help you determine the relative total expense of owning different funds. If these transaction costs had been included, your costs would have been higher.
* Expenses are equal to the Fund's annualized expense ratio for each share class, multiplied by the average account value over the period, multiplied by the number of days in the most recent six-month period, then divided by 365.
Annualized Expense Ratios | Class A | Class B | Class C | Class R | Class AARP | Class S | Institutional Class |
Scudder Growth and Income Fund | 1.04% | 1.94% | 1.90% | 1.45% | .65% | .68% | .59% |
For more information, please refer to the Fund's prospectus.
|
 In the following interview, Lead Portfolio Manager Theresa Gusman addresses the economy, the management team's approach and the resulting performance of Scudder Growth and Income Fund for the six-month period October 1, 2004, through March 31, 2005. Gusman took the helm on April 1, 2005, replacing former Lead Portfolio Manager Greg Adams.
Q: How would you characterize the market environment during the period?
A: A confluence of political and economic issues, including rising short-term interest rates, sustained high energy prices and dollar weakness, created a challenging investment environment for Scudder Growth and Income Fund during the six months ended March 31, 2005.
Despite per-barrel oil prices that approached historic highs, the period got off to a strong start with the reelection of President George W. Bush in November. The Republican victory lifted nearly all sectors of the stock market, which logged robust gains through the end of the calendar year. Against a backdrop of strong stock market performance, the dollar fell. Reaching a new low against the euro during the period, dollar weakness effectively increased profits for US exporters.
During the second half of the period, however, growing concerns about rising interest rates, elevated energy prices and a slowdown in the economy dampened investor enthusiasm. January, in which stocks tend to rally on prospects for a new year, was uncharacteristically weak. And although the market finished comfortably higher in February, driven by the strong performance of energy stocks, rising per-barrel oil prices and inflationary fears ultimately kept investors on the sidelines. The Federal Reserve Board (the Fed) in March released a statement in which it observed inflationary pressure on the economy and reiterated its plan to continue to increase short-term interest rates at a measured pace.
Q: How did the fund perform during the period?
A: Scudder Growth and Income Fund Class A shares posted a total return of 6.44% for the six months ended March 31, 2005. (Returns are unadjusted for sales charges. If sales charges had been included, returns would have been lower. Past performance is no guarantee of future results. Please see pages 3 through 7 for the performance of other share classes and more complete performance information.) The fund's return was slightly above the 6.21% average total return of its peers in the Large-Cap Core Funds category,1 as tracked by Lipper Inc., but fell shy of the 6.88% return of its benchmark, the Standard & Poor's 500 (S&P 500) Index,2 for the same period.
1 Large-Cap Core Funds are those that, by portfolio practice, invest at least 75% of their equity assets in companies with market capitalizations (on a three-year weighted basis) of greater than 300% of the dollar-weighted median market capitalization of the S&P Mid-Cap 400 Index. Large-Cap Core Funds have wide latitude in the companies in which they invest. These funds normally will have an average price-to-earnings ratio, price-to-book ratio and three-year earnings growth figure that compares with the US diversified large-cap funds universe average.
2 The Standard & Poor's 500 (S&P 500) Index is an unmanaged capitalization-weighted index of 500 stocks. The index is designed to measure performance of the broad domestic economy through changes in the aggregate market value of 500 stocks representing all major industries. Index returns assume reinvestment of dividends and, unlike fund returns, do not reflect any fees or expenses. It is not possible to invest directly into an index.
Q: Which stocks or industry sectors contributed most to fund performance?
A: Fueled by seasonal demand and growing concern about supply shortages, crude oil and natural gas prices climbed during the period. Energy stocks rose nearly across the board, driving absolute performance. Integrated oil giant ExxonMobil Corp. was the portfolio's largest position, accounting for 4.52% of the fund's market value as of March 31, 2005. Other energy holdings also performed well, contributing powerfully to absolute results, including EnCana Corp., a Canadian oil and natural gas production company; ChevronTexaco Corp., an integrated oil company; and Devon Energy Corp., an independent energy company engaged primarily in the exploration and development of oil and gas properties.
The materials, utilities and financials services sectors contributed most to fund performance on a relative basis. Materials added to performance based primarily on the strength of Monsanto Co., a global provider of agricultural products and integrated solutions for farmers. Monsanto saw a substantial increase in net sales, as well as improved profits and operating margins.
Among utilities, the portfolio's holdings performed very well amid a backdrop of higher energy prices, strong earnings reports and increased dividends. Notable were the performances of Exelon Corp. (a public utility holding company) and TXU Corp. (an energy company).
While the portfolio maintained a slight underweight (proportionately smaller) position in the financial services sector as compared to the benchmark S&P 500, it carried a comparative overweight in capital markets stocks (stocks of companies operating within the financial markets). This overweight was based on our assumption that mergers and acquisitions (M&A) would accelerate, which benefits investment banks that help advise companies throughout the process. We did, in fact, see a marked increase in M&A activity during December 2004, when several high-profile deals were made public. Investors viewed the increased activity as a positive indicator of prospects for investment banks during 2005. Several of the portfolio's holdings consequently benefited, including Morgan Stanley, which also was among the 10 largest holdings during the period, and Lehman Brothers Holdings, Inc.
Consumer discretionary stocks also contributed to relative performance, as strategic underweightings helped to avoid much of the weakness in the sector. A lack of exposure to eBay proved beneficial, as the stock fell on lowered 2005 expectations and a patent-infringement ruling. In addition, avoiding the automobile industry, in which General Motors and Ford Motor saw very weak quarters, proved positive for the portfolio. The Gap, Inc., a retailing stock, finished higher, also helping return.
An additional one-time event was Microsoft Corp.'s declaration of a $3.00 per share special dividend, which was paid out in December 2004.
Q: Which stocks or industry sectors detracted from performance?
A: Information technology, in which the fund was overweight as compared to the benchmark, was the portfolio's worst relative performer. Much of the underperformance was due to computer companies. The fund had no position in Apple Computer, which skyrocketed as sales showed strong growth or to Hewlett-Packard, which rallied in part, after naming a new CEO. Further, the portfolio's stake in Microsoft Corp. finished lower as the European Union threatened it with fines over antitrust compliance. A bright spot for the portfolio in the sector was VERITAS Software Corp., which saw gains after the announcement that it would be purchased by security software firm Symantec.
Despite robust gains in holdings including pharmaceutical services company Caremark Rx, Inc. and commercial health benefits provider WellPoint, Inc., the portfolio's stake in health care detracted from performance overall. The fund held a proportionately smaller share of health care providers and service companies than the benchmark index. These rallied, along with insurers, after the reelection of President Bush. The Republican administration was widely perceived by investors as fostering a more favorable regulatory environment than the would-be Kerry administration.
The poor performance of machinery and air freight stocks pushed industrials lower.
Q: What are your plans to add value to the fund's investment process?
A: In April 2005, we introduced enhancements to the portfolio to provide shareholders with the opportunity to benefit more fully from our research insights. Fundamental research is Scudder's competitive advantage, and stock selection is our primary source of alpha (superior performance relative to the benchmark). This enhancement therefore combines our proprietary equity research platform with objective portfolio construction to create a portfolio intended to produce consistent, competitive investment performance over the long term.
The portfolio seeks to bring together the top US equity research recommendations of the advisor into a single investment portfolio. In managing the portfolio, each of the advisor's US equity analysts individually assigns qualitative ratings to stocks under their coverage using bottom-up analysis and looking for companies with strong prospects for continued growth of capital and earnings. Using criteria specifically designed for the portfolio by the advisor, as well as the investment parameters of the portfolio and risk management considerations, a quantitative model compiles these research analyst ratings into a proposed list of stocks for the portfolio and suggests appropriate weightings for each stock.
Making adjustments where necessary, the managers normally will buy and sell securities in accordance with the model's, and hence the research analysts', recommendations. In addition to the risk management criteria inherent in the portfolio construction process, the managers use analytical tools to monitor the risk profile of the portfolio relative to comparable portfolios and appropriate benchmarks and peer groups.
As part of this enhancement, Theresa Gusman and Greg Sivin have assumed management of the strategy, replacing Gregory Adams and Andrew Brudenell.
The views expressed in this report reflect those of the portfolio managers only through the end of the period of the report as stated on the cover. The managers' views are subject to change at any time based on market and other conditions and should not be construed as a recommendation.
|
Asset Allocation (Excludes Securities Lending Collateral) | 3/31/05 | 9/30/04 |
| ||
Common Stocks | 100% | 98% |
Cash Equivalents | — | 2% |
| 100% | 100% |
Sector Diversification (As a % of Common Stocks) | 3/31/05 | 9/30/04 |
| ||
Financials | 18% | 19% |
Information Technology | 17% | 18% |
Industrials | 14% | 13% |
Health Care | 11% | 13% |
Consumer Discretionary | 11% | 11% |
Energy | 10% | 8% |
Consumer Staples | 8% | 7% |
Materials | 4% | 3% |
Utilities | 4% | 4% |
Telecommunication Services | 3% | 4% |
| 100% | 100% |
Asset allocation and sector diversification are subject to change.
|
|
Ten Largest Equity Holdings at March 31, 2005 (29.5% of Net Assets) | |
1. ExxonMobil Corp. Explorer and producer of oil and gas | 4.5% |
2. General Electric Co. Industrial conglomerate | 4.4% |
3. Microsoft Corp. Developer of computer software | 3.4% |
4. Citigroup, Inc. Provider of diversified financial services | 3.3% |
5. Johnson & Johnson Provider of health care products | 2.6% |
6. Morgan Stanley Provider of investment banking and brokerage services | 2.5% |
7. Pfizer, Inc. Manufacturer of prescription pharmaceuticals and non-prescription self-medications | 2.5% |
8. Bank of America Corp. Provider of commercial banking services | 2.3% |
9. United Technologies Corp. Manufacturer of aerospace equipment, climate control systems and elevators | 2.2% |
10. Time Warner, Inc. Operator of media and entertainment company | 1.8% |
Portfolio holdings are subject to change.
For more complete details about the fund's investment portfolio, see page 18. A quarterly Fact Sheet is available upon request. Information concerning portfolio holdings of the Fund as of month end will be posted to scudder.com on the 15th of the following month. Please see the Account Management Resources section for contact information.
Following the Fund's fiscal first and third quarter-end, a complete portfolio holdings listing is filed with the SEC on Form N-Q. The form will be available on the SEC's Web site at www.sec.gov, and it also may be reviewed and copied at the SEC's Public Reference Room in Washington, D.C. Information on the operation of the SEC's Public Reference Room may be obtained by calling (800) SEC-0330.
 |  | |
|
|
| Value ($) |
|
| |
Common Stocks 100.0% | ||
Consumer Discretionary 10.9% | ||
Hotels Restaurants & Leisure 0.7% | ||
McDonald's Corp. | 1,153,300 | 35,913,762 |
Household Durables 0.5% | ||
Harman International Industries, Inc. | 287,300 | 25,414,558 |
Media 5.0% | ||
Comcast Corp. "A"* | 1,879,400 | 62,771,960 |
Interpublic Group of Companies, Inc.* (c) | 2,243,000 | 27,544,040 |
Time Warner, Inc.* | 5,043,600 | 88,515,180 |
Viacom, Inc. "B" | 1,879,000 | 65,445,570 |
244,276,750 | ||
Multiline Retail 1.9% | ||
Dollar General Corp. | 1,636,800 | 35,862,288 |
Target Corp. | 1,146,200 | 57,332,924 |
93,195,212 | ||
Specialty Retail 2.8% | ||
Sherwin-Williams Co. | 998,700 | 43,932,813 |
Staples, Inc. | 1,433,100 | 45,042,333 |
The Gap, Inc. | 2,090,100 | 45,647,784 |
134,622,930 | ||
Consumer Staples 8.3% | ||
Beverages 2.7% | ||
Coca-Cola Co. | 1,481,100 | 61,717,437 |
PepsiCo, Inc. | 1,348,200 | 71,495,046 |
133,212,483 | ||
Food & Staples Retailing 1.8% | ||
Safeway, Inc.* (c) | 1,388,000 | 25,719,640 |
Wal-Mart Stores, Inc. | 1,276,800 | 63,980,448 |
89,700,088 | ||
Food Products 1.6% | ||
General Mills, Inc. | 772,900 | 37,988,035 |
Hershey Foods Corp. | 685,900 | 41,469,514 |
79,457,549 | ||
Household Products 1.3% | ||
Procter & Gamble Co. | 1,184,400 | 62,773,200 |
Personal Products 0.9% | ||
Avon Products, Inc. | 978,400 | 42,012,496 |
Energy 9.5% | ||
Energy Equipment & Services 1.0% | ||
Baker Hughes, Inc. | 1,085,300 | 48,284,997 |
Oil & Gas 8.5% | ||
ChevronTexaco Corp. | 1,262,950 | 73,642,615 |
Devon Energy Corp. | 638,900 | 30,507,475 |
EnCana Corp. | 843,100 | 59,540,409 |
ExxonMobil Corp. | 3,701,938 | 220,635,505 |
Sunoco, Inc. | 281,800 | 29,171,936 |
413,497,940 | ||
Financials 18.3% | ||
Banks 4.7% | ||
Bank of America Corp. | 2,579,600 | 113,760,360 |
US Bancorp. | 1,374,100 | 39,601,562 |
Wachovia Corp. | 1,492,000 | 75,957,720 |
229,319,642 | ||
Capital Markets 4.1% | ||
Lehman Brothers Holdings, Inc. | 823,500 | 77,540,760 |
Morgan Stanley | 2,148,400 | 122,995,900 |
200,536,660 | ||
Diversified Financial Services 5.8% | ||
CIT Group, Inc. | 878,800 | 33,394,400 |
Citigroup, Inc. | 3,616,999 | 162,547,935 |
Fannie Mae | 530,475 | 28,884,364 |
JPMorgan Chase & Co. | 1,626,300 | 56,269,980 |
281,096,679 | ||
Insurance 3.7% | ||
Ambac Financial Group, Inc. | 360,600 | 26,954,850 |
American International Group, Inc. | 1,320,150 | 73,149,511 |
Hartford Financial Services Group, Inc. | 581,600 | 39,874,496 |
Prudential Financial, Inc. (c) | 693,000 | 39,778,200 |
179,757,057 | ||
Health Care 11.5% | ||
Biotechnology 1.6% | ||
Amgen, Inc.* | 1,291,900 | 75,201,499 |
Health Care Equipment & Supplies 0.9% | ||
Biomet, Inc. | 1,209,800 | 43,915,740 |
Health Care Providers & Services 1.9% | ||
Caremark Rx, Inc.* | 1,302,000 | 51,793,560 |
WellPoint, Inc.* | 325,400 | 40,788,890 |
92,582,450 | ||
Pharmaceuticals 7.1% | ||
Allergan, Inc. | 580,900 | 40,355,123 |
Eli Lilly & Co. | 550,800 | 28,696,680 |
Johnson & Johnson | 1,873,700 | 125,837,692 |
Pfizer, Inc. | 4,636,300 | 121,795,601 |
Wyeth | 725,700 | 30,610,026 |
347,295,122 | ||
Industrials 13.6% | ||
Aerospace & Defense 4.4% | ||
Honeywell International, Inc. | 1,889,500 | 70,308,295 |
Lockheed Martin Corp. | 599,900 | 36,629,894 |
United Technologies Corp. | 1,050,200 | 106,763,332 |
213,701,521 | ||
Industrial Conglomerates 7.3% | ||
3M Co. | 720,300 | 61,722,507 |
General Electric Co. | 5,902,500 | 212,844,150 |
Tyco International Ltd. | 2,387,600 | 80,700,880 |
355,267,537 | ||
Machinery 1.9% | ||
Deere & Co. | 572,800 | 38,452,064 |
Parker-Hannifin Corp. | 937,800 | 57,130,776 |
95,582,840 | ||
Information Technology 16.7% | ||
Communications Equipment 2.7% | ||
Cisco Systems, Inc.* | 4,827,800 | 86,369,342 |
Motorola, Inc. | 3,075,600 | 46,041,732 |
132,411,074 | ||
Computers & Peripherals 4.3% | ||
Dell, Inc.* | 1,723,600 | 66,220,712 |
EMC Corp.* | 4,550,600 | 56,063,392 |
International Business Machines Corp. | 937,200 | 85,641,336 |
207,925,440 | ||
Internet Software & Services 0.8% | ||
Yahoo!, Inc.* | 1,134,200 | 38,449,380 |
IT Consulting & Services 0.8% | ||
Accenture Ltd. "A"* | 1,661,300 | 40,120,395 |
Semiconductors & Semiconductor Equipment 2.4% | ||
Altera Corp.* | 1,499,400 | 29,658,132 |
National Semiconductor Corp. | 1,354,000 | 27,905,940 |
Texas Instruments, Inc. | 2,293,000 | 58,448,570 |
116,012,642 | ||
Software 5.7% | ||
Microsoft Corp. | 6,808,100 | 164,551,777 |
Oracle Corp.* | 5,915,400 | 73,824,192 |
Symantec Corp.* | 600,800 | 12,815,064 |
VERITAS Software Corp.* | 1,227,400 | 28,500,228 |
279,691,261 | ||
Materials 4.4% | ||
Chemicals 2.5% | ||
E.I. du Pont de Nemours & Co. | 705,000 | 36,124,200 |
Monsanto Co. | 1,342,900 | 86,617,050 |
122,741,250 | ||
Metals & Mining 0.8% | ||
Alcoa, Inc. | 1,284,900 | 39,048,111 |
Paper & Forest Products 1.1% | ||
Georgia-Pacific Corp. | 1,488,200 | 52,816,218 |
Telecommunication Services 2.9% | ||
Diversified Telecommunication Services | ||
ALLTEL Corp. | 735,900 | 40,364,115 |
Sprint Corp. (c) | 1,816,600 | 41,327,650 |
Verizon Communications, Inc. | 1,753,990 | 62,266,645 |
143,958,410 | ||
Utilities 3.9% | ||
Electric Utilities | ||
Entergy Corp. | 389,300 | 27,507,938 |
Exelon Corp. | 1,845,800 | 84,703,762 |
PG&E Corp.* | 1,386,200 | 47,269,420 |
TXU Corp. | 408,000 | 32,489,040 |
191,970,160 | ||
Total Common Stocks (Cost $4,080,637,619) | 4,881,763,053 | |
| ||
Securities Lending Collateral 1.3% | ||
Daily Assets Fund Institutional, 2.83% (b) (d) (Cost $60,847,900) | 60,847,900 | 60,847,900 |
| % of Net Assets | Value ($) |
|
| |
Total Investment Portfolio (Cost $4,141,485,519) (a) | 101.3 | 4,942,610,953 |
Other Assets and Liabilities, Net | (1.3) | (62,842,101) |
Net Assets | 100.0 | 4,879,768,852 |
* Non-income producing security.
(a) The cost for federal income tax purposes was $4,198,627,363. At March 31, 2005, net unrealized appreciation for all securities based on tax cost was $743,983,590. This consisted of aggregate gross unrealized appreciation for all securities in which there was an excess of value over tax cost of $982,687,980 and aggregate gross unrealized depreciation for all securities in which there was an excess of tax cost over value of $238,704,390.
(b) Daily Assets Fund Institutional, an affiliated fund, is managed by Deutsche Asset Management, Inc. The rate shown is the annualized seven-day yield at period end.
(c) All or a portion of these securities were on loan (see Notes to Financial Statements). The value of all securities loaned at March 31, 2005 amounted to $59,289,656, which is 1.2% of net assets.
(d) Represents collateral held in connection with securities lending.
The accompanying notes are an integral part of the financial statements.
|
Statement of Assets and Liabilities as of March 31, 2005 (Unaudited) | |
Assets | |
Investments: Investments in securities, at value (cost $4,080,637,619) — including $59,289,656 of securities loaned | $ 4,881,763,053 |
Investment in Daily Assets Fund Institutional (cost $60,847,900)* | 60,847,900 |
Total investments in securities, at value (cost $4,141,485,519) | 4,942,610,953 |
Cash | 60,889 |
Foreign currency, at value (cost $2,408,018) | 2,395,356 |
Receivable for investments sold | 4,880,510 |
Dividends receivable | 4,614,078 |
Interest receivable | 9,893 |
Receivable for Fund shares sold | 750,864 |
Other assets | 183,038 |
Total assets | 4,955,505,581 |
Liabilities | |
Notes payable | 3,600,000 |
Payable for investments purchased | 3,091 |
Payable upon return of securities loaned | 60,847,900 |
Payable for Fund shares redeemed | 5,664,861 |
Accrued management fee | 1,833,714 |
Other accrued expenses and payables | 3,787,163 |
Total liabilities | 75,736,729 |
Net assets, at value | $ 4,879,768,852 |
Net Assets | |
Net assets consist of: Undistributed net investment income | 1,675,604 |
Net unrealized appreciation (depreciation) on: Investments | 801,125,434 |
Foreign currency related transactions | (12,671) |
Accumulated net realized gain (loss) | (218,986,602) |
Paid-in capital | 4,295,967,087 |
Net assets, at value | $ 4,879,768,852 |
* Represents collateral on securities loaned.
The accompanying notes are an integral part of the financial statements.
|
|
Statement of Assets and Liabilities as of March 31, 2005 (Unaudited) (continued) | |
Net Asset Value | |
Class A Net Asset Value and redemption price (a) per share ($33,430,610 ÷ 1,579,820 outstanding shares of beneficial interest, $.01 par value, unlimited number of shares authorized) | $ 21.16 |
Maximum offering price per share (100 ÷ 94.25 of $21.16) | $ 22.45 |
Class B Net Asset Value, offering and redemption price (subject to contingent deferred sales charge) (a) per share ($9,554,172 ÷ 457,703 outstanding shares of beneficial interest, $.01 par value, unlimited number of shares authorized) | $ 20.87 |
Class C Net Asset Value, offering and redemption price (subject to contingent deferred sales charge) (a) per share ($4,666,412 ÷ 223,503 outstanding shares of beneficial interest, $.01 par value, unlimited number of shares authorized) | $ 20.88 |
Class R Net Asset Value, offering and redemption price (a) per share ($611,126 ÷ 28,712 outstanding shares of beneficial interest, $.01 par value, unlimited number of shares authorized) | $ 21.28 |
Class AARP Net Asset Value, offering and redemption price (a) per share ($2,580,654,013 ÷ 121,060,077 outstanding shares of beneficial interest, $.01 par value, unlimited number of shares authorized) | $ 21.32 |
Class S Net Asset Value, offering and redemption price (a) per share ($2,195,926,173 ÷ 103,152,814 outstanding shares of beneficial interest, $.01 par value, unlimited number of shares authorized) | $ 21.29 |
Institutional Class Net Asset Value, offering and redemption price (a) per share ($54,926,346 ÷ 2,578,298 outstanding shares of beneficial interest, $.01 par value, unlimited number of shares authorized) | $ 21.30 |
(a) Redemption price per share for shares held less than 15 days is equal to net asset value less a 2% redemption fee.
The accompanying notes are an integral part of the financial statements.
|
|
Statement of Operations for the six months ended March 31, 2005 (Unaudited) | |
Investment Income | |
Income: Dividends (net of foreign taxes withheld of $149,837) | $ 60,801,475 |
Interest — Scudder Cash Management QP Trust | 444,262 |
Securities lending income, including income from Daily Assets Fund Institutional, net of borrower rebates | 90,153 |
Total Income | 61,335,890 |
Expenses: Management fee | 11,301,956 |
Services to shareholders | 4,856,370 |
Custodian and accounting fees | 165,995 |
Distribution service fees | 114,040 |
Auditing | 45,906 |
Legal | 45,574 |
Trustees' fees and expenses | 70,980 |
Reports to shareholders | 122,346 |
Registration fees | 48,438 |
Interest expense | 1,160 |
Other | 104,319 |
Total expenses, before expense reductions | 16,877,084 |
Expense reductions | (30,702) |
Total expenses, after expense reductions | 16,846,382 |
Net investment income | 44,489,508 |
Realized and Unrealized Gain (Loss) on Investment Transactions | |
Net realized gain (loss) from: Investments | 214,762,628 |
Foreign currency related transactions | 44,324 |
Written options | 316,715 |
| 215,123,667 |
Net unrealized appreciation (depreciation) during period on: Investments | 65,816,662 |
Foreign currency related transactions | (58,617) |
| 65,758,045 |
Net gain (loss) on investment transactions | 280,881,712 |
Net increase (decrease) in net assets resulting from operations | $ 325,371,220 |
The accompanying notes are an integral part of the financial statements.
|
|
Statement of Changes in Net Assets | ||
Increase (Decrease) in Net Assets |
Six Months Ended March 31, 2005 (Unaudited) | Year Ended September 30, 2004 |
Operations: Net investment income (loss) | $ 44,489,508 | $ 37,045,582 |
Net realized gain (loss) on investment transactions | 215,123,667 | 263,058,721 |
Net unrealized appreciation (depreciation) on investment transactions during the period | 65,758,045 | 276,366,273 |
Net increase (decrease) in net assets resulting from operations | 325,371,220 | 576,470,576 |
Distributions to shareholders from: Net investment income: Class A | (293,470) | (83,395) |
Class B | (40,096) | — |
Class C | (19,280) | — |
Class R | (3,606) | (448) |
Class AARP | (27,798,375) | (14,649,197) |
Class S | (23,303,341) | (12,909,203) |
Institutional Class | (472,940) | (301,376) |
Fund share transactions: Proceeds from shares sold | 119,877,501 | 373,988,884 |
Reinvestment of distributions | 47,103,551 | 25,246,926 |
Cost of shares redeemed | (478,171,663) | (910,863,403) |
Redemption fees | 4,099 | — |
Net increase (decrease) in net assets from Fund share transactions | (311,186,512) | (511,627,593) |
Increase (decrease) in net assets | (37,746,400) | 36,899,364 |
Net assets at beginning of period | 4,917,515,252 | 4,880,615,888 |
Net assets at end of period (including undistributed net investment income of $1,675,604 and $9,117,204, respectively) | $ 4,879,768,852 | $ 4,917,515,252 |
The accompanying notes are an integral part of the financial statements.
|
Class A | ||||||
Years Ended September 30, | 2005a | 2004 | 2003 | 2002 | 2001 | 2000b |
Selected Per Share Data | ||||||
Net asset value, beginning of period | $ 20.05 | $ 18.04 | $ 15.10 | $ 18.99 | $ 26.86 | $ 26.65 |
Income (loss) from investment operations: Net investment income (loss)c | .15 | .07 | .06 | .09 | .11 | (.03) |
Net realized and unrealized gain (loss) on investment transactions | 1.14 | 1.99 | 2.96 | (3.90) | (6.31) | .46 |
Total from investment operations | 1.29 | 2.06 | 3.02 | (3.81) | (6.20) | .43 |
Less distributions from: Net investment income | (.18) | (.05) | (.08) | (.08) | (.11) | (.02) |
Net realized gains on investment transactions | — | — | — | — | (1.56) | (.20) |
Total distributions | (.18) | (.05) | (.08) | (.08) | (1.67) | (.22) |
Redemption fees | .00*** | — | — | — | — | — |
Net asset value, end of period | $ 21.16 | $ 20.05 | $ 18.04 | $ 15.10 | $ 18.99 | $ 26.86 |
Total Return (%)d | 6.44** | 11.44 | 20.01 | (20.11) | (24.34) | 1.62** |
Ratios to Average Net Assets and Supplemental Data | ||||||
Net assets, end of period ($ millions) | 33 | 32 | 27 | 18 | 23 | 8 |
Ratio of expenses (%) | 1.04* | 1.12 | 1.17 | 1.00e | 1.02 | 1.62f* |
Ratio of net investment income (loss) (%) | .98* | .33 | .35 | .45 | .45 | (.12)* |
Portfolio turnover rate (%) | 21* | 26 | 42 | 52 | 57 | 55* |
a For the six months ended March 31, 2005 (Unaudited). b For the nine months ended September 30, 2000. On February 7, 2000, the Fund changed its fiscal year end from December 31 to September 30. c Based on average shares outstanding during the period. d Total return does not reflect the effect of any sales charges. e The ratio of operating expenses includes a one-time reduction in certain liabilities of an acquired fund (Kemper US Growth and Income Fund). The ratio without the reduction was 1.01%. f The ratio of operating expenses excluding costs incurred in connection with a fund complex reorganization was 1.60%. * Annualized. ** Not annualized. *** Amount is less than $.005. | ||||||
| |||||
Class B | |||||
Years Ended September 30, | 2005a | 2004 | 2003 | 2002 | 2001b |
Selected Per Share Data | |||||
Net asset value, beginning of period | $ 19.78 | $ 17.90 | $ 15.03 | $ 18.96 | $ 24.04 |
Income (loss) from investment operations: Net investment income (loss)c | .06 | (.10) | (.07) | (.07) | (.06) |
Net realized and unrealized gain (loss) on investment transactions | 1.11 | 1.98 | 2.94 | (3.86) | (5.00) |
Total from investment operations | 1.17 | 1.88 | 2.87 | (3.93) | (5.06) |
Less distributions from: Net investment income | (.08) | — | — | — | (.02) |
Redemption fees | .00*** | — | — | — | — |
Net asset value, end of period | $ 20.87 | $ 19.78 | $ 17.90 | $ 15.03 | $ 18.96 |
Total Return (%)d | 5.92** | 10.50e | 19.10 | (20.73) | (21.03)** |
Ratios to Average Net Assets and Supplemental Data | |||||
Net assets, end of period ($ millions) | 10 | 11 | 12 | 10 | 13 |
Ratio of expenses before expense reductions (%) | 1.94* | 1.99 | 1.94 | 1.81f | 1.83* |
Ratio of expenses after expense reductions (%) | 1.94* | 1.97 | 1.94 | 1.81f | 1.83* |
Ratio of net investment income (loss) (%) | .09* | (.52) | (.42) | (.36) | (.39)* |
Portfolio turnover rate (%) | 21* | 26 | 42 | 52 | 57 |
a For the six months ended March 31, 2005 (Unaudited). b For the period from December 29, 2000 (commencement of operations of Class B shares) to September 30, 2001. c Based on average shares outstanding during the period. d Total return does not reflect the effect of any sales charges. e Total return would have been lower had certain expenses not been reduced. f The ratio of operating expenses includes a one-time reduction in certain liabilities of an acquired fund (Kemper US Growth and Income Fund). The ratio without the reduction was 1.83%. * Annualized. ** Not annualized. *** Amount is less than $.005. | |||||
| |||||
Class C | |||||
Years Ended September 30, | 2005a | 2004 | 2003 | 2002 | 2001b |
Selected Per Share Data | |||||
Net asset value, beginning of period | $ 19.78 | $ 17.89 | $ 15.03 | $ 18.97 | $ 24.04 |
Income (loss) from investment operations: Net investment income (loss)c | .06 | (.10) | (.07) | (.07) | (.06) |
Net realized and unrealized gain (loss) on investment transactions | 1.12 | 1.99 | 2.93 | (3.87) | (4.99) |
Total from investment operations | 1.18 | 1.89 | 2.86 | (3.94) | (5.05) |
Less distributions from: Net investment income | (.08) | — | — | — | (.02) |
Redemption fees | .00*** | — | — | — | — |
Net asset value, end of period | $ 20.88 | $ 19.78 | $ 17.89 | $ 15.03 | $ 18.97 |
Total Return (%)d | 5.97** | 10.56e | 19.03 | (20.77) | (21.03)** |
Ratios to Average Net Assets and Supplemental Data | |||||
Net assets, end of period ($ millions) | 5 | 5 | 5 | 3 | 4 |
Ratio of expenses before expense reductions (%) | 1.90* | 2.02 | 1.93 | 1.84f | 1.80* |
Ratio of expenses after expense reductions (%) | 1.90* | 1.96 | 1.93 | 1.84f | 1.80* |
Ratio of net investment income (loss) (%) | .12* | (.51) | (.41) | (.39) | (.36)* |
Portfolio turnover rate (%) | 21* | 26 | 42 | 52 | 57 |
a For the six months ended March 31, 2005 (Unaudited). b For the period from December 29, 2000 (commencement of operations of Class C shares) to September 30, 2001. c Based on average shares outstanding during the period. d Total return does not reflect the effect of any sales charges. e Total return would have been lower had certain expenses not been reduced. f The ratio of operating expenses includes a one-time increase in certain liabilities of an acquired fund (Kemper US Growth and Income Fund). The ratio without this increase was 1.81%. * Annualized. ** Not annualized. *** Amount is less than $.005. | |||||
| ||
Class R | ||
Years Ended September 30, | 2005a | 2004b |
Selected Per Share Data | ||
Net asset value, beginning of period | $ 20.17 | $ 19.22 |
Income (loss) from investment operations: Net investment income (loss)c | .11 | .03 |
Net realized and unrealized gain (loss) on investment transactions | 1.14 | .94 |
Total from investment operations | 1.25 | .97 |
Less distributions from: Net investment income | (.14) | (.02) |
Redemption fees | .00*** | — |
Net asset value, end of period | $ 21.28 | $ 20.17 |
Total Return (%) | 6.18d** | 5.06** |
Ratios to Average Net Assets and Supplemental Data | ||
Net assets, end of period ($ millions) | .6 | .4 |
Ratio of expenses before expense reductions (%) | 1.51* | 1.33* |
Ratio of expenses after expense reductions (%) | 1.45* | 1.33* |
Ratio of net investment income (loss) (%) | .52* | .17* |
Portfolio turnover rate (%) | 21* | 26 |
a For the six months ended March 31, 2005 (Unaudited). b For the period November 3, 2003 (commencement of operations of Class R shares) to September 30, 2004. c Based on average shares outstanding during the period. d Total return would have been lower had certain expenses not been reduced. * Annualized. ** Not annualized. *** Amount is less than $.005. | ||
| ||||||
Class AARP | ||||||
Years Ended September 30, | 2005a | 2004 | 2003 | 2002 | 2001 | 2000b |
Selected Per Share Data | ||||||
Net asset value, beginning of period | $ 20.20 | $ 18.15 | $ 15.18 | $ 19.08 | $ 27.01 | $ 27.09 |
Income (loss) from investment operations: Net investment income (loss)c | .19 | .15 | .13 | .14 | .17 | .01 |
Net realized and unrealized gain (loss) on investment transactions | 1.16 | 2.01 | 2.96 | (3.91) | (6.36) | (.06) |
Total from investment operations | 1.35 | 2.16 | 3.09 | (3.77) | (6.19) | (.05) |
Less distributions from: Net investment income | (.23) | (.11) | (.12) | (.13) | (.18) | (.03) |
Net realized gains on investment transactions | — | — | — | — | (1.56) | — |
Total distributions | (.23) | (.11) | (.12) | (.13) | (1.74) | (.03) |
Redemption fees | .00*** | — | — | — | — | — |
Net asset value, end of period | $ 21.32 | $ 20.20 | $ 18.15 | $ 15.18 | $ 19.08 | $ 27.01 |
Total Return (%) | 6.66** | 11.91d | 20.40 | (19.90) | (24.15) | (.18)** |
Ratios to Average Net Assets and Supplemental Data | ||||||
Net assets, end of period ($ millions) | 2,581 | 2,591 | 2,518 | 2,338 | 3,416 | 5,353 |
Ratio of expenses before expense reductions (%) | .65* | .74 | .80 | .76 | .76 | .75* |
Ratio of expenses after expense reductions (%) | .65* | .70 | .80 | .76 | .76 | .75* |
Ratio of net investment income (loss) (%) | 1.37* | .75 | .72 | .69 | .71 | .04** |
Portfolio turnover rate (%) | 21* | 26 | 42 | 52 | 57 | 55* |
a For the six months ended March 31, 2005 (Unaudited). b For the period from August 14, 2000 (commencement of operations of Class AARP shares) to September 30, 2000. c Based on average shares outstanding during the period. d Total return would have been lower had certain expenses not been reduced. * Annualized. ** Not annualized. *** Amount is less than $.005. | ||||||
| ||||||
Class S | ||||||
Years Ended September 30, | 2005a | 2004 | 2003 | 2002 | 2001 | 2000b |
Selected Per Share Data | ||||||
Net asset value, beginning of period | $ 20.17 | $ 18.13 | $ 15.17 | $ 19.08 | $ 27.02 | $ 26.69 |
Income (loss) from investment operations: | ||||||
Net investment income (loss)c | .19 | .14 | .11 | .14 | .17 | .13 |
Net realized and unrealized gain (loss) on investment transactions | 1.15 | 2.01 | 2.97 | (3.92) | (6.36) | .51 |
Total from investment operations | 1.34 | 2.15 | 3.08 | (3.78) | (6.19) | .64 |
Less distributions from: Net investment income | (.22) | (.11) | (.12) | (.13) | (.19) | (.11) |
Net realized gains on investment transactions | — | — | — | — | (1.56) | (.20) |
Total distributions | (.22) | (.11) | (.12) | (.13) | (1.75) | (.31) |
Redemption fee | .00*** | — | — | — | — | — |
Net asset value, end of period | $ 21.29 | $ 20.17 | $ 18.13 | $ 15.17 | $ 19.08 | $ 27.02 |
Total Return (%) | 6.63** | 11.86d | 20.35 | (19.91) | (24.14) | 2.32** |
Ratios to Average Net Assets and Supplemental Data | ||||||
Net assets, end of period ($ millions) | 2,196 | 2,240 | 2,284 | 2,218 | 3,434 | 5,834 |
Ratio of expenses before expense reductions (%) | .68* | .83 | .90 | .76 | .76 | .86e* |
Ratio of expenses after expense reductions (%) | .68* | .75 | .90 | .76 | .76 | .86e* |
Ratio of net investment income (loss) (%) | 1.34* | .70 | .62 | .69 | .71 | .64* |
Portfolio turnover rate (%) | 21* | 26 | 42 | 52 | 57 | 55* |
a For the six months ended March 31, 2005 (Unaudited). b For the nine months ended September 30, 2000. On February 7, 2000, the Fund changed its fiscal year end from December 31 to September 30. c Based on average shares outstanding during the period. d Total return would have been lower had certain expenses not been reduced. e The ratio of operating expenses excluding costs incurred in connection with a fund complex reorganization was .84%. * Annualized. ** Not annualized. *** Amount is less than $.005. | ||||||
| ||||
Institutional Class | ||||
Years Ended September 30, | 2005a | 2004 | 2003 | 2002b |
Selected Per Share Data | ||||
Net asset value, beginning of period | $ 20.18 | $ 18.15 | $ 15.17 | $ 17.61 |
Income (loss) from investment operations: Net investment income (loss)c | .20 | .16 | .13 | .02 |
Net realized and unrealized gain (loss) on investment transactions | 1.15 | 2.01 | 2.97 | (2.42) |
Total from investment operations | 1.35 | 2.17 | 3.10 | (2.40) |
Less distributions from: Net investment income | (.23) | (.14) | (.12) | (.04) |
Redemption fee | .00*** | — | — | — |
Net asset value, end of period | $ 21.30 | $ 20.18 | $ 18.15 | $ 15.17 |
Total Return (%) | 6.67** | 11.98 | 20.50 | (13.64)** |
Ratios to Average Net Assets and Supplemental Data | ||||
Net assets, end of period ($ millions) | 55 | 38 | 35 | .001 |
Ratio of expenses (%) | .59* | .65 | .73 | .73* |
Ratio of net investment income (loss) (%) | 1.39* | .80 | .79 | .95* |
Portfolio turnover rate (%) | 21* | 26 | 42 | 52 |
a For the six months ended March 31, 2005 (Unaudited). b For the period from August 19, 2002 (commencement of operations of Institutional Class shares) to September 30, 2002. c Based on average shares outstanding during the period. * Annualized. ** Not annualized. *** Amount is less than $.005. | ||||
|
 A. Significant Accounting Policies
Scudder Growth and Income Fund (the "Fund") is a diversified series of Investment Trust (the "Trust") which is registered under the Investment Company Act of 1940, as amended (the "1940 Act"), as an open-end management investment company organized as a Massachusetts business trust.
The Fund offers multiple classes of shares which provide investors with different purchase options. Class A shares are offered to investors subject to an initial sales charge. Class B shares are offered without an initial sales charge but are subject to higher ongoing expenses than Class A shares and a contingent deferred sales charge payable upon certain redemptions. Class B shares automatically convert to Class A shares six years after issuance. Class C shares are offered to investors without an initial sales charge but are subject to higher ongoing expenses than Class A shares and a contingent deferred sales charge payable upon certain redemptions within one year of purchase. Class C shares do not convert into another class. Institutional Class shares are offered to a limited group of investors, are not subject to initial or contingent deferred sales charges and have lower ongoing expenses than other classes. Class R shares are only available to participants in certain retirement plans and are offered to investors without an initial sales charge or contingent deferred sales charge. Shares of Class AARP are designed for members of AARP. Class AARP and Class S shares are not subject to initial or contingent deferred sales charges. Class S shares are no longer available to new investors except under certain circumstances. (Please refer to the Fund's Statement of Additional Information).
Investment income, realized and unrealized gains and losses, and certain fund-level expenses and expense reductions, if any, are borne pro rata on the basis of relative net assets by the holders of all classes of shares, except that each class bears certain expenses unique to that class such as distribution service fees, services to shareholders and certain other class-specific expenses. Differences in class-level expenses may result in payment of different per share dividends by class. All shares of the Fund have equal rights with respect to voting subject to class-specific arrangements.
The Fund's financial statements are prepared in accordance with accounting principles generally accepted in the United States of America which require the use of management estimates. Actual results could differ from those estimates. The policies described below are followed consistently by the Fund in the preparation of its financial statements.
Security Valuation. Investments are stated at value determined as of the close of regular trading on the New York Stock Exchange on each day the exchange is open for trading. Equity securities are valued at the most recent sale price or official closing price reported on the exchange (US or foreign) or over-the-counter market on which the security is traded most extensively. Securities for which no sales are reported are valued at the calculated mean between the most recent bid and asked quotations on the relevant market or, if a mean cannot be determined, at the most recent bid quotation.
Money market instruments purchased with an original or remaining maturity of sixty days or less, maturing at par, are valued at amortized cost. Investments in open-end investment companies and Scudder Cash Management QP Trust are valued at their net asset value each business day.
Securities and other assets for which market quotations are not readily available or for which the above valuation procedures are deemed not to reflect fair value are valued in a manner that is intended to reflect their fair value as determined in accordance with procedures approved by the Trustees.
Options. An option contract is a contract in which the writer of the option grants the buyer of the option the right to purchase from (call option), or sell to (put option), the writer a designated instrument at a specified price within a specified period of time. Certain options, including options on indices, will require cash settlement by the Fund if the option is exercised. The Fund may enter into option contracts in order to hedge against potential adverse price movements in the value of portfolio assets; as a temporary substitute for selling selected investments; to lock in the purchase price of a security or currency which it expects to purchase in the near future; as a temporary substitute for purchasing selected investments; and to enhance potential gain.
The liability representing the Fund's obligation under an exchange traded written option or investment in a purchased option is valued at the last sale price or, in the absence of a sale, the mean between the closing bid and asked prices or at the most recent asked price (bid for purchased options) if no bid and asked price are available. Over-the-counter written or purchased options are valued using dealer supplied quotations. Gain or loss is recognized when the option contract expires or is closed.
If the Fund writes a covered call option, the Fund foregoes, in exchange for the premium, the opportunity to profit during the option period from an increase in the value of the underlying security above the exercise price. If the Fund writes a put option it accepts the risk of a decline in the value of the underlying security below the exercise price. Over-the-counter options have the risk of the potential inability of counterparties to meet the terms of their contracts. The Fund's maximum exposure to purchased options is limited to the premium initially paid. In addition, certain risks may arise upon entering into option contracts including the risk that an illiquid secondary market will limit the Fund's ability to close out an option contract prior to the expiration date and that a change in the value of the option contract may not correlate exactly with changes in the value of the securities or currencies hedged.
Securities Lending. The Fund may lend securities to financial institutions. The Fund retains beneficial ownership of the securities it has loaned and continues to receive interest and dividends paid by the securities and to participate in any changes in their market value. The Fund requires the borrowers of the securities to maintain collateral with the Fund consisting of liquid, unencumbered assets having a value at least equal to the value of the securities loaned. The Fund may invest the cash collateral into a joint trading account in an affiliated money market fund pursuant to Exemptive Order issued by the SEC. The Fund receives compensation for lending its securities either in the form of fees or by earning interest on invested cash collateral net of fees paid to the lending agent. Either the Fund or the borrower may terminate the loan. The Fund is subject to all investment risks associated with the value of any cash collateral received, including, but not limited to, interest rate, credit and liquidity risk associated with such investments.
Foreign Currency Translations. The books and records of the Fund are maintained in US dollars. Investment securities and other assets and liabilities denominated in a foreign currency are translated into US dollars at the prevailing exchange rates at period end. Purchases and sales of investment securities, income and expenses are translated into US dollars at the prevailing exchange rates on the respective dates of the transactions.
Net realized and unrealized gains and losses on foreign currency transactions represent net gains and losses between trade and settlement dates on securities transactions, the disposition of forward foreign currency exchange contracts and foreign currencies, and the difference between the amount of net investment income accrued and the US dollar amount actually received. That portion of both realized and unrealized gains and losses on investments that results from fluctuations in foreign currency exchange rates is not separately disclosed but is included with net realized and unrealized gains and losses on investment securities.
Federal Income Taxes. The Fund's policy is to comply with the requirements of the Internal Revenue Code, as amended, which are applicable to regulated investment companies, and to distribute all of its taxable income to its shareholders. Accordingly, the Fund paid no federal income taxes and no federal income tax provision was required.
At September 30, 2004, the Fund had a net tax basis capital loss carryforward of approximately $369,800,000 which may be applied against any realized net taxable capital gains of each succeeding year until fully utilized or until September 30, 2010 ($69,900,000) and September 30, 2011 ($299,900,000), the respective expiration dates, whichever occurs first, and which may be subject to certain limitations under Sections 382-384 of the Internal Revenue Code.
Distribution of Income and Gains. Net investment income of the Fund is distributed to shareholders quarterly. Net realized gains from investment transactions, in excess of available capital loss carryforwards, would be taxable to the Fund if not distributed, and, therefore, will be distributed to shareholders at least annually.
The timing and characterization of certain income and capital gains distributions are determined annually in accordance with federal tax regulations which may differ from accounting principles generally accepted in the United States of America. These differences primarily relate to certain securities sold at a loss. As a result, net investment income (loss) and net realized gain (loss) on investment transactions for a reporting period may differ significantly from distributions during such period. Accordingly, the Fund may periodically make reclassifications among certain of its capital accounts without impacting the net asset value of the Fund.
The tax character of current year distributions will be determined at the end of the current fiscal year.
Redemption Fees. Effective February 1, 2005, the Fund imposes a redemption fee of 2% of the total redemption amount on the Fund shares redeemed or exchanged within 15 days of buying them, either by purchase or exchange. This fee is assessed and retained by the Fund for the benefit of the remaining shareholders. The redemption fee is accounted for as an addition to paid-in-capital.
Expenses. Expenses of the Trust arising in connection with a specific fund are allocated to that fund. Other Trust expenses which cannot be directly attributed to a fund are apportioned among the funds in the Trust.
Contingencies. In the normal course of business, the Fund may enter into contracts with service providers that contain general indemnification clauses. The Fund's maximum exposure under these arrangements is unknown as this would involve future claims that may be made against the Fund that have not yet occurred. However, based on experience, the Fund expects the risk of loss to be remote.
Other. Investment transactions are accounted for on a trade date plus one basis for daily net asset value calculations. However, for financial reporting purposes, investment security transactions are reported on trade date. Interest income is recorded on the accrual basis. Dividend income is recorded on the ex-date. Certain dividends from foreign securities may be recorded subsequent to the ex-dividend date as soon as the Fund is informed of such dividends. Realized gains and losses from investment transactions are recorded on an identified cost basis.
B. Purchases and Sales of Securities
During the six months ended March 31, 2005, purchases and sales of investment securities (excluding short-term investments) aggregated $524,562,501 and $756,135,431, respectively.
For the six months ended March 31, 2005, transactions for written call options on securities were as follows:
| Contract Amounts | Premium |
Outstanding, beginning of period | — | $ — |
Options written | 3,828 | 325,827 |
Options expired | (3,101) | (252,399) |
Options closed | (727) | (73,428) |
Outstanding, end of period | — | $ — |
C. Related Parties
Management Agreement. Under the Management Agreement with Deutsche Investment Management Americas Inc. ("DeIM" or the "Advisor"), an indirect, wholly owned subsidiary of Deutsche Bank AG, the Advisor directs the investments of the Fund in accordance with its investment objectives, policies and restrictions. The Advisor determines the securities, instruments and other contracts relating to investments to be purchased, sold or entered into by the Fund. In addition to portfolio management services, the Advisor provides certain administrative services in accordance with the Management Agreement. The management fee payable under the Management Agreement is equal to an annual rate of 0.45% of the first $14,000,000,000 of the Fund's average daily net assets, 0.425% of the next $2,000,000,000 of such net assets, 0.400% of the next $2,000,000,000 of such net assets and 0.385% of such net assets in excess of $18,000,000,000, computed and accrued daily and payable monthly. Accordingly, for the six months ended March 31, 2005, the fee pursuant to the Management Agreement was equivalent to an annualized effective rate of 0.45% of the Fund's average daily net assets.
Effective October 1, 2003 through January 31, 2006, the Advisor has contractually agreed to waive all or a portion of its management fee and reimburse or pay certain operating expenses of the Fund to the extent necessary to maintain the operating expenses of each class at 0.95%, 0.97%, 0.96%, 0.81%, 0.94% and 0.73%, of average daily net assets for Class A, B, C, AARP, S and Institutional Class shares, respectively (excluding certain expenses such as extraordinary expenses, taxes, brokerage, interest, Rule 12b-1 distribution and/or service fees, trustee and trustee counsel fees, and organizational and offering expenses). For Class R shares, the Advisor has contractually agreed to waive all or a portion of its management fee and reimburse or pay operating expenses at 1.45%, excluding certain expenses such as extraordinary expenses, taxes, brokerage, interest and trustee and trustee counsel fees. This expense cap will remain in effect until January 31, 2006.
Service Provider Fees. Scudder Investments Service Company ("SISC"), an affiliate of the Advisor, is the transfer, dividend-paying and shareholder service agent for Class A, B, C, R and Institutional Class shares of the Fund. Scudder Service Corporation ("SSC"), a subsidiary of the Advisor, is the transfer, dividend-paying and shareholder service agent for Class AARP and S shares of the Fund. Pursuant to a sub-transfer agency agreement among SISC, SSC and DST Systems, Inc. ("DST"), SISC and SSC have delegated certain transfer agent and dividend paying agent functions to DST. SISC and SSC compensate DST out of the shareholder servicing fee they receive from the Fund. For the six months ended March 31, 2005, the amounts charged to the Fund by SISC and SSC were as follows:
Services to Shareholders | Total Aggregated | Waived | Unpaid at March 31, 2005 |
Class A | $ 55,104 | $ — | $ 34,330 |
Class B | 23,660 | — | 22,205 |
Class C | 9,842 | — | 8,647 |
Class R | 1,386 | 152 | 2,149 |
Class AARP | 2,020,200 | — | 1,372,333 |
Class S | 1,842,400 | — | 1,322,965 |
Institutional Class | 18,844 | — | 11,095 |
| $ 3,971,436 | $ 152 | $ 2,773,724 |
Scudder Fund Accounting Corporation ("SFAC"), an affiliate of the Advisor, is responsible for computing the daily net asset value per share and maintaining the portfolio and general accounting records of the Fund. SFAC has retained State Street Bank and Trust Company to provide certain administrative, fund accounting and record-keeping services to the Fund. For the six months ended March 31, 2005, the amount charged to the Fund by SFAC for accounting services aggregated $71,077, all of which is unpaid at March 31, 2005.
Distribution Service Agreement. Under the Distribution Service Agreement, in accordance with Rule 12b-1 under the 1940 Act, Scudder Distributors, Inc. ("SDI"), a subsidiary of the Advisor, receives a fee ("Distribution Fee") of 0.75% of average daily net assets of Class B and C shares and 0.25% of average daily net assets for Class R shares. Pursuant to the agreement, SDI enters into related selling group agreements with various firms at various rates for sales of Class B, C and R shares. For the six months ended March 31, 2005 the Distribution Fee was as follows:
Distribution Fee | Total Aggregated | Unpaid at March 31, 2005 |
Class B | $ 39,486 | $ 6,286 |
Class C | 18,507 | 3,087 |
Class R | 651 | 133 |
| $ 58,644 | $ 9,506 |
In addition, SDI provides information and administrative services ("Service Fee") to Class A, B, C and R shareholders at an annual rate of up to 0.25% of average daily net assets for each such class. SDI in turn has various agreements with financial services firms that provide these services and pays these fees based upon the assets of shareholder accounts the firms service. For the six months ended March 31, 2005 the Service Fee was as follows:
Service Fee | Total Aggregated | Unpaid at March 31, 2005 | Annualized Effective Rate |
Class A | $ 36,285 | $ 14,428 | .21% |
Class B | 12,486 | 2,956 | .24% |
Class C | 6,021 | 2,029 | .24% |
Class R | 604 | 429 | .23% |
| $ 55,396 | $ 19,842 |
|
Underwriting Agreement and Contingent Deferred Sales Charge. SDI is the principal underwriter for the Fund. Underwriting commissions paid in connection with the distribution of Class A shares for the six months ended March 31, 2005 aggregated $8,733.
In addition, SDI receives any contingent deferred sales charge ("CDSC") from Class B share redemptions occurring within six years of purchase and Class C share redemptions occurring within one year of purchase. There is no such charge upon redemption of any share appreciation or reinvested dividends. The CDSC is based on declining rates ranging from 4% to 1% for Class B and 1% for Class C, of the value of the shares redeemed. For the six months ended March 31, 2005, the CDSC for Class B and C shares aggregated $21,740 and $28, respectively.
Trustees' Fees and Expenses. The Fund pays each Trustee not affiliated with the Advisor retainer fees plus specified amounts for attended board and committee meetings.
Scudder Cash Management QP Trust. Pursuant to an Exemptive Order issued by the SEC, the Fund may invest in the Scudder Cash Management QP Trust (the "QP Trust") and other affiliated funds managed by the Advisor. The QP Trust seeks to provide as high a level of current income as is consistent with the preservation of capital and the maintenance of liquidity. The QP Trust does not pay the Advisor a management fee for the affiliated funds' investments in the QP Trust.
Other Related Parties. AARP through its affiliate, AARP Services, Inc., monitors and oversees the AARP Investment Program from Scudder Investments, but does not act as an investment advisor or recommend specific mutual funds. DeIM has agreed to pay a fee to AARP and/or its affiliates in return for the use of the AARP trademark and services relating to investments by AARP members in AARP Class shares of the Fund. This fee is calculated on a daily basis as a percentage of the combined net assets of the AARP classes of all funds managed by DeIM. The fee rates, which decrease as the aggregate net assets of the AARP classes become larger, are as follows: 0.07% for the first $6 billion of net assets, 0.06% for the next $10 billion of such net assets and 0.05% of such net assets thereafter. These amounts are used for the general purposes of AARP and its members.
Insurance Brokerage Commissions. The Fund paid insurance premiums to an unaffiliated insurance broker in 2002 and 2003. This broker in turn paid a portion of its commissions to an affiliate of the Advisor, which performed certain insurance brokerage services for the broker. The Advisor has reimbursed the Fund for the portion of commissions (plus interest) paid to the affiliate of the Advisor attributable to the premiums paid by the Fund. The amounts for 2002 and 2003 were $1,711 and $1,554, respectively.
D. Expense Reductions
For the six months ended March 31, 2005, the Advisor agreed to reimburse the Fund $27,332, which represents a portion of the fee savings expected to be realized by the Advisor related to the outsourcing by the Advisor of certain administrative services to an unaffiliated service provider.
In addition, the Fund has entered into an arrangement with its custodian whereby credits realized as a result of uninvested cash balances were used to reduce a portion of the Fund's custodian expenses. During the six months ended March 31, 2005, the custodian fees were reduced by $3,218 for custodian credits earned.
E. Line of Credit
The Fund and several other affiliated funds (the "Participants") share in a $1.25 billion revolving credit facility administered by J.P. Morgan Chase Bank for temporary or emergency purposes, including the meeting of redemption requests that otherwise might require the untimely disposition of securities. The Participants are charged an annual commitment fee which is allocated, based upon net assets, among each of the Participants. Interest is calculated at the Federal Funds Rate plus 0.5 percent. The Fund may borrow up to a maximum of 33 percent of its net assets under the agreement. At March 31, 2005, $3,600,000 was outstanding. Interest expense incurred on the borrowings amounted to $1,160 for the six months ended March 31, 2005. The average dollar amount of the borrowings was $4,040,000 and the weighted average interest rate on these borrowings was 2.10%.
F. Share Transactions
The following table summarizes share and dollar activity in the Fund:
| Six Months Ended | Year Ended | ||
| Shares | Dollars | Shares | Dollars |
Shares sold | ||||
Class A | 316,171 | $ 6,730,320 | 729,404 | $ 14,506,946 |
Class B | 27,992 | 586,985 | 178,714 | 3,518,919 |
Class C | 34,062 | 714,301 | 92,027 | 1,816,719 |
Class R | 8,374 | 180,490 | 23,708* | 484,645* |
Class AARP | 1,653,100 | 35,425,980 | 5,443,269 | 109,157,852 |
Class S | 2,749,483 | 58,669,752 | 11,635,111 | 235,578,803 |
Institutional Class | 811,190 | 17,569,673 | 438,910 | 8,925,000 |
|
| $ 119,877,501 |
| $ 373,988,884 |
Shares issued to shareholders in reinvestment of distributions | ||||
Class A | 12,897 | $ 275,652 | 3,973 | $ 79,236 |
Class B | 1,735 | 36,733 | — | — |
Class C | 808 | 17,112 | — | — |
Class R | 168 | 3,606 | 22* | 448* |
Class AARP | 1,152,094 | 24,787,361 | 647,883 | 12,985,355 |
Class S | 1,000,732 | 21,510,147 | 593,841 | 11,880,511 |
Institutional Class | 22,051 | 472,940 | 15,019 | 301,376 |
|
| $ 47,103,551 |
| $ 25,246,926 |
Shares redeemed | ||||
Class A | (338,095) | $ (7,197,292) | (620,021) | $ (12,340,433) |
Class B | (142,787) | (2,978,118) | (300,168) | (5,930,065) |
Class C | (51,077) | (1,075,721) | (105,165) | (2,080,744) |
Class R | (1,318) | (27,924) | (2,242)* | (44,970)* |
Class AARP | (9,978,953) | (213,220,798) | (16,582,157) | (332,476,189) |
Class S | (11,667,253) | (250,571,810) | (27,171,922) | (547,999,874) |
Institutional Class | (146,120) | (3,100,000) | (489,410) | (9,991,128) |
|
| $ (478,171,663) |
| $ (910,863,403) |
Redemption fees | $ 4,099 |
| $ — | |
Net increase (decrease) | ||||
Class A | (9,027) | $ (191,320) | 113,356 | $ 2,245,749 |
Class B | (113,060) | (2,354,400) | (121,454) | (2,411,146) |
Class C | (16,207) | (344,308) | (13,138) | (264,025) |
Class R | 7,224 | 156,172 | 21,488* | 440,123* |
Class AARP | (7,173,759) | (153,007,170) | (10,491,005) | (210,332,982) |
Class S | (7,917,038) | (170,388,099) | (14,942,970) | (300,540,560) |
Institutional Class | 687,121 | 14,942,613 | (35,481) | (764,752) |
|
| $ (311,186,512) |
| $ (511,627,593) |
* For the period from November 3, 2003 (commencement of operations of Class R shares) to September 30, 2004.
G. Regulatory Matters and Litigation
Since at least July 2003, federal, state and industry regulators have been conducting ongoing inquiries and investigations ("inquiries") into the mutual fund industry, and have requested information from numerous mutual fund companies, including Scudder Investments. It is not possible to determine what the outcome of these inquiries will be or what the effect, if any, would be on the funds or their advisors. Publicity about mutual fund practices arising from these industry-wide inquiries serves as the general basis of a number of private lawsuits against the Scudder funds. These lawsuits, which previously have been reported in the press, involve purported class action and derivative lawsuits, making various allegations and naming as defendants various persons, including certain Scudder funds, the funds' investment advisors and their affiliates, certain individuals, including in some cases fund Trustees/Directors, officers, and other parties. Each Scudder fund's investment advisor has agreed to indemnify the applicable Scudder funds in connection with these lawsuits, or other lawsuits or regulatory actions that may be filed making allegations similar to these lawsuits regarding market timing, revenue sharing, fund valuation or other subjects arising from or related to the pending inquiries. Based on currently available information, the funds' investment advisors believe the likelihood that the pending lawsuits will have a material adverse financial impact on a Scudder fund is remote and such actions are not likely to materially affect their ability to perform under their investment management agreements with the Scudder funds.
|
At its December 13, 2004 meeting, the Trust's Board considered a proposal by Deutsche Investment Management Americas Inc. (the "Advisor"), the investment advisor to the Scudder Growth and Income Fund (the "Fund"), that the Fund acquire the assets and assume the liabilities of Scudder Focus Value + Growth Fund, which we refer to as a "merger" between the similar funds. In connection with the proposed merger, the Advisor proposed that the Board approve for the Fund a new, more favorable management fee schedule designed to reflect additional economies of scale attributable to the larger asset size of the Fund resulting from the merger.
The Board normally considers the renewal of the Fund's investment management agreement annually pursuant to a comprehensive review process that most recently concluded at the Board's August 10, 2004 meeting. The Advisor's proposal for a new management fee schedule in connection with the merger was made on December 13, 2004. As the Advisor represented to the Board that the new fee schedule would have no effect on the quality or nature of the services provided by the Advisor to the Fund or any other factors considered by the Board in connection with their August 10, 2004 renewal, the scope of the Board's review of the investment management agreement was limited to the consideration of the new management fee schedule. The Board concluded that the economies of scale to be enjoyed by the Advisor as a result of the merger were appropriately reflected by the proposed management fee schedule and determined to approve the new investment management agreement, which would take effect upon completion of the Fund's merger. The Board will conduct its annual comprehensive review of the Advisor's investment management agreement for the Fund in the summer of 2005.
|
For shareholders of Classes A, B, C and Institutional
Automated Information Lines | ScudderACCESS (800) 972-3060 Personalized account information, information on other Scudder funds and services via touchtone telephone and for Classes A, B, and C only, the ability to exchange or redeem shares. |
Web Site | scudder.com View your account transactions and balances, trade shares, monitor your asset allocation, and change your address, 24 hours a day. Obtain prospectuses and applications, blank forms, interactive worksheets, news about Scudder funds, subscription to fund updates by e-mail, retirement planning information, and more. |
For More Information | (800) 621-1048 To speak with a Scudder service representative. |
Written Correspondence | Scudder Investments PO Box 219356 |
Proxy Voting | A description of the fund's policies and procedures for voting proxies for portfolio securities and information about how the fund voted proxies related to its portfolio securities during the 12-month period ended June 30 is available on our Web site — scudder.com (type "proxy voting" in the search field) — or on the SEC's Web site — www.sec.gov. To obtain a written copy of the fund's policies and procedures without charge, upon request, call us toll free at (800) 621-1048. |
Principal Underwriter | If you have questions, comments or complaints, contact: Scudder Distributors, Inc. 222 South Riverside Plaza (800) 621-1148 |
| Class A | Class B | Class C | Institutional Class |
Nasdaq Symbol | SUWAX | SUWBX | SUWCX | SUWIX |
CUSIP Number | 460965-627 | 460965-619 | 460965-593 | 460965-551 |
Fund Number | 464 | 664 | 764 | 550 |
|
|
For shareholders of Class R
Automated Information Lines | Scudder Flex Plan Access (800) 532-8411 24-hour access to your retirement plan account. |
Web Site | scudder.com Click "Retirement Plans" to reallocate assets, process transactions and review your funds through our secure online account access. Obtain prospectuses and applications, blank forms, interactive worksheets, news about Scudder funds, subscription to fund updates by e-mail, retirement planning information, and more. |
For More Information | (800) 543-5776 To speak with a Scudder service representative. |
Written Correspondence | Scudder Retirement Services 222 South Riverside Plaza |
Proxy Voting | A description of the fund's policies and procedures for voting proxies for portfolio securities and information about how the fund voted proxies related to its portfolio securities during the 12-month period ended June 30 is available on our Web site — scudder.com (type "proxy voting" in the search field) — or on the SEC's Web site — www.sec.gov. To obtain a written copy of the fund's policies and procedures without charge, upon request, call us toll free at (800) 621-1048. |
Principal Underwriter | If you have questions, comments or complaints, contact: Scudder Distributors, Inc. 222 South Riverside Plaza (800) 621-1148 |
Nasdaq Symbol | SUWRX |
CUSIP Number | 460965-858 |
Fund Number | 1509 |
|
|
| AARP Investment Program Shareholders | Scudder Class S Shareholders |
Automated Information Lines | Easy-Access Line (800) 631-4636 | SAILTM (800) 343-2890 |
| Personalized account information, the ability to exchange or redeem shares, and information on other Scudder funds and services via touchtone telephone. | |
Web Sites | aarp.scudder.com | myScudder.com |
| View your account transactions and balances, trade shares, monitor your asset allocation, and change your address, 24 hours a day. Obtain prospectuses and applications, blank forms, interactive worksheets, news about Scudder funds, subscription to fund updates by e-mail, retirement planning information, and more. | |
For More Information | (800) 253-2277 To speak with an AARP Investment Program service representative. | (800) SCUDDER To speak with a Scudder service representative. |
Written Correspondence | AARP Investment Program from Scudder Investments PO Box 219735 | Scudder Investments PO Box 219669 |
Proxy Voting | A description of the fund's policies and procedures for voting proxies for portfolio securities and information about how the fund voted proxies related to its portfolio securities during the 12-month period ended June 30 is available on our Web sites — aarp.scudder.com or myScudder.com (type "proxy voting" in the search field) — or on the SEC's Web site — www.sec.gov. To obtain a written copy of the fund's policies and procedures without charge, upon request, call your service representative. | |
Principal Underwriter | If you have questions, comments or complaints, contact: Scudder Distributors, Inc. 222 South Riverside Plaza (800) 621-1148 | |
| Class AARP | Class S |
Nasdaq Symbol | ACDGX | SCDGX |
Fund Number | 164 | 064 |
|
This privacy statement is issued by Deutsche Investment Management Americas Inc., Deutsche Asset Management, Inc., Scudder Distributors, Inc., Scudder Investor Services, Inc., Scudder Trust Company and the Scudder Funds.
We never sell customer lists or individual client information. We consider privacy fundamental to our client relationships and adhere to the policies and practices described below to protect current and former clients' information. Internal policies are in place to protect confidentiality, while allowing client needs to be served. Only individuals who need to do so in carrying out their job responsibilities may access client information. We maintain physical, electronic and procedural safeguards that comply with federal and state standards to protect confidentiality. These safeguards extend to all forms of interaction with us, including the Internet.
In the normal course of business, clients give us nonpublic personal information on applications and other forms, on our websites, and through transactions with us or our affiliates. Examples of the nonpublic personal information collected are name, address, Social Security number and transaction and balance information. To be able to serve our clients, certain of this client information is shared with affiliated and nonaffiliated third party service providers such as transfer agents, custodians, and broker-dealers to assist us in processing transactions and servicing your account with us. In addition, we may disclose all of the information we collect to companies that perform marketing services on our behalf or to other financial institutions with which we have joint marketing agreements. The organizations described above that receive client information may only use it for the purpose designated by the Scudder Companies listed above.
We may also disclose nonpublic personal information about you to other parties as required or permitted by law. For example, we are required or we may provide information to government entities or regulatory bodies in response to requests for information or subpoenas, to private litigants in certain circumstances, to law enforcement authorities, or any time we believe it necessary to protect the firm.
For AARP shareholders only: Certain investors in the AARP Investment Program are advised that limited nonpublic personal information is shared with AARP and its subsidiary AARP Services Inc. (ASI). This includes an investor's status as a current or former Program participant, name, address, and type of account maintained (i.e. IRA or non-IRA). This information must be shared so that ASI can provide quality control services, such as monitoring satisfaction with the Program. However, AARP and ASI may also use this information for other purposes such as member research, and may share this information with other AARP providers to inform members of AARP benefits and services. Shareholders residing in states with certain state specific privacy restrictions are excluded from this information sharing. All other shareholders may instruct us in writing not to share information regarding themselves or joint account holders with AARP or ASI for any purposes unrelated to the AARP Investment Program. With respect to accounts that are jointly held, an opt-out request received from any of the joint account holders will be applied to the entire account.
Questions on this policy may be sent to:
For Class AARP:
AARP Investment Program, Attention: Correspondence,
P.O. Box 219735, Kansas City, MO 64121-9735
For Class S:
Scudder Investments, Attention: Correspondence,
P.O. Box 219669, Kansas City, MO 64121-9669
For all other classes:
Scudder Investments, Attention: Correspondence — Chicago
P.O. Box 219415, Kansas City, MO 64121-9415
September 2004
Notes |
|

Notes |
|


ITEM 2.         CODE OF ETHICS.

                Not applicable.

ITEM 3.         AUDIT COMMITTEE FINANCIAL EXPERT.

                Not applicable.

ITEM 4.         PRINCIPAL ACCOUNTANT FEES AND SERVICES.

                Not applicable.

ITEM 5.         AUDIT COMMITTEE OF LISTED REGISTRANTS

                Not Applicable

ITEM 6.         SCHEDULE OF INVESTMENTS

                Not Applicable

ITEM 7.         DISCLOSURE OF PROXY VOTING POLICIES AND PROCEDURES FOR
                CLOSED-END MANAGEMENT INVESTMENT COMPANIES.

                Not applicable.

ITEM 8.         PORTFOLIO MANAGERS OF CLOSED-END MANAGEMENT INVESTMENT COMPANIES.

                Not applicable.

ITEM 9.         PURCHASES OF EQUITY SECURITIES BY CLOSED-END MANAGEMENT
                INVESTMENT COMPANY AND AFFILIATED PURCHASERS

                Not Applicable.

ITEM 10.        SUBMISSION OF MATTERS TO A VOTE OF SECURITY HOLDERS.

The Committee on Independent Trustees/Directors selects and nominates
Independent Trustees/Directors. Fund shareholders may also submit nominees that
will be considered by the committee when a Board vacancy occurs. Submissions
should be mailed to: c/o Dawn-Marie Driscoll, PO Box 100176, Cape Coral, FL
33910.

ITEM 11.        CONTROLS AND PROCEDURES.

(a) The Chief Executive and Financial Officers concluded that the Registrant's
Disclosure Controls and Procedures are effective based on the evaluation of the
Disclosure Controls and Procedures as of a date within 90 days of the filing
date of this report.

(b) There have been no changes in the registrant's internal control over
financial reporting that occurred during the registrant's last half-year (the
registrant's second fiscal half-year in the case of the annual report) that has
materially affected, or is reasonably likely to materially affect, the
registrant's internal controls over financial reporting.

ITEM 12.        EXHIBITS.

(a)(1)   Certification  pursuant to Rule 30a-2(a) under the  Investment  Company
         Act of 1940 (17 CFR  270.30a-2(a))  is filed  and  attached  hereto  as
         Exhibit 99.CERT.

(b)      Certification  pursuant to Rule 30a-2(b) under the  Investment  Company
         Act of 1940 (17 CFR  270.30a-2(b))  is furnished and attached hereto as
         Exhibit 99.906CERT.


Form N-CSR Item F

                                   SIGNATURES

Pursuant to the requirements of the Securities Exchange Act of 1934 and the
Investment Company Act of 1940, the registrant has duly caused this report to be
signed on its behalf by the undersigned, thereunto duly authorized.

Registrant:                         Scudder Growth & Income Fund


By:                                 /s/Julian Sluyters
                                    ---------------------------
                                    Chief Executive Officer

Date:                               May 31, 2005


Pursuant to the requirements of the Securities Exchange Act of 1934 and the
Investment Company Act of 1940, this report has been signed below by the
following persons on behalf of the registrant and in the capacities and on the
dates indicated.

Registrant:                         Scudder Growth & Income Fund


By:                                 /s/Julian Sluyters
                                    ---------------------------
                                    Chief Executive Officer

Date:                               May 31, 2005


By:                                 /s/Paul Schubert
                                    ---------------------------
                                    Chief Financial Officer

Date:                               May 31, 2005