UNITED STATES
SECURITIES AND EXCHANGE COMMISSION
WASHINGTON, D. C. 20549
FORM N-CSRS
Investment Company Act file number: 811-00043
Deutsche DWS Investment Trust
(Exact Name of Registrant as Specified in Charter)
875 Third Avenue
New York, NY 10022-6225
(Address of Principal Executive Offices) (Zip Code)
Registrant’s Telephone Number, including Area Code: (212) 454-4500
Diane Kenneally
100 Summer Street
Boston, MA 02110
(Name and Address of Agent for Service)
| Date of fiscal year end: | 7/31 |
| Date of reporting period: | 1/31/2021 |
| ITEM 1. | REPORT TO STOCKHOLDERS |
| (a) | |


| 2 | | DWS Large Cap Focus Growth Fund |
 |  Hepsen Uzcan President, DWS Funds |
| DWS Large Cap Focus Growth Fund | | 3 |
| Performance Summary | January 31, 2021 (Unaudited) |
| Class A | 6–Month ‡ | 1-Year | 5-Year | 10-Year |
| Average Annual Total Returns as of 1/31/21 | ||||
| Unadjusted for Sales Charge | 13.99% | 33.87% | 21.35% | 15.43% |
| Adjusted for the Maximum Sales Charge (max 5.75% load) | 7.43% | 26.17% | 19.92% | 14.75% |
| Russell 1000® Growth Index† | 16.24% | 34.46% | 22.22% | 16.83% |
| Average Annual Total Returns as of 12/31/20 (most recent calendar quarter end) | ||||
| Unadjusted for Sales Charge | 40.43% | 19.24% | 15.44% | |
| Adjusted for the Maximum Sales Charge (max 5.75% load) | 32.35% | 17.83% | 14.76% | |
| Russell 1000® Growth Index | 38.49% | 21.00% | 17.21% | |
| Class C | 6–Month ‡ | 1-Year | 5-Year | 10-Year |
| Average Annual Total Returns as of 1/31/21 | ||||
| Unadjusted for Sales Charge | 13.56% | 32.91% | 20.44% | 14.57% |
| Adjusted for the Maximum Sales Charge (max 1.00% CDSC) | 12.56% | 32.91% | 20.44% | 14.57% |
| Russell 1000® Growth Index† | 16.24% | 34.46% | 22.22% | 16.83% |
| Average Annual Total Returns as of 12/31/20 (most recent calendar quarter end) | ||||
| Unadjusted for Sales Charge | 39.38% | 18.34% | 14.58% | |
| Adjusted for the Maximum Sales Charge (max 1.00% CDSC) | 39.38% | 18.34% | 14.58% | |
| Russell 1000® Growth Index | 38.49% | 21.00% | 17.21% | |
| Class S | 6–Month ‡ | 1-Year | 5-Year | 10-Year |
| Average Annual Total Returns as of 1/31/21 | ||||
| No Sales Charges | 14.12% | 34.22% | 21.66% | 15.72% |
| Russell 1000® Growth Index† | 16.24% | 34.46% | 22.22% | 16.83% |
| Average Annual Total Returns as of 12/31/20 (most recent calendar quarter end) | ||||
| No Sales Charges | 40.75% | 19.54% | 15.73% | |
| Russell 1000® Growth Index | 38.49% | 21.00% | 17.21% | |
| 4 | | DWS Large Cap Focus Growth Fund |
| Institutional Class | 6–Month ‡ | 1-Year | 5-Year | 10-Year |
| Average Annual Total Returns as of 1/31/21 | ||||
| No Sales Charges | 14.14% | 34.21% | 21.67% | 15.75% |
| Russell 1000® Growth Index† | 16.24% | 34.46% | 22.22% | 16.83% |
| Average Annual Total Returns as of 12/31/20 (most recent calendar quarter end) | ||||
| No Sales Charges | 40.75% | 19.54% | 15.76% | |
| Russell 1000® Growth Index | 38.49% | 21.00% | 17.21% | |
| DWS Large Cap Focus Growth Fund | | 5 |
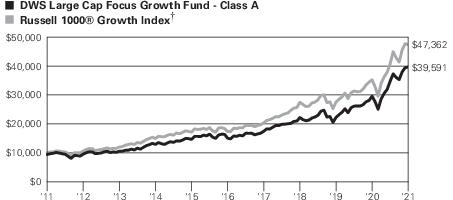
| † | The Russell 1000® Growth Index is an unmanaged index that consists of those stocks in the Russell 1000® Index that have higher price-to-book ratios and higher forecasted growth values. The Russell 1000® Index is an unmanaged price-only index of the 1,000 largest capitalized companies that are domiciled in the U.S. and whose common stocks are traded. |
| ‡ | Total returns shown for periods less than one year are not annualized. |
| Class A | Class C | Class S | Institutional Class | |
| Net Asset Value | ||||
| 1/31/21 | $69.43 | $55.58 | $73.27 | $74.42 |
| 7/31/20 | $63.63 | $51.67 | $66.92 | $67.92 |
| Distribution Information as of 1/31/21 | ||||
| Capital Gain Distributions, Six Months | $ 3.00 | $ 3.00 | $ 3.00 | $ 3.00 |
| 6 | | DWS Large Cap Focus Growth Fund |
| — | Joined DWS in 2008; previously, he served as a Research Assistant for the Endowed Chair of Asset Management at the European Business School, Oestrich-Winkel while earning his PhD. |
| — | Portfolio Manager for Global and US Growth Equities: New York. |
| — | MBA in International Management from the Thunderbird School of Global Management; Master’s Degree (“Diplom-Kaufmann”) and PhD in Finance (“Dr.rer.pol.”) from the European Business School, Oestrich-Winkel. |
| DWS Large Cap Focus Growth Fund | | 7 |
| Portfolio Summary | (Unaudited) |
| Asset Allocation (As a % of Investment Portfolio excluding Securities Lending Collateral) | 1/31/21 | 7/31/20 |
| Common Stocks | 99% | 99% |
| Cash Equivalents | 1% | 1% |
| 100% | 100% |
| Sector Diversification (As a % of Investment Portfolio excluding Securities Lending Collateral and Cash Equivalents) | 1/31/21 | 7/31/20 |
| Information Technology | 38% | 37% |
| Health Care | 18% | 18% |
| Consumer Discretionary | 16% | 17% |
| Communication Services | 11% | 10% |
| Industrials | 7% | 7% |
| Financials | 5% | 5% |
| Real Estate | 2% | 3% |
| Consumer Staples | 2% | 2% |
| Materials | 1% | 1% |
| 100% | 100% |
| 8 | | DWS Large Cap Focus Growth Fund |
| Ten Largest Equity Holdings at January 31, 2021 (49.1% of Net Assets) | |
| 1 Apple, Inc. | 10.3% |
| Designs, manufactures and markets personal computing and mobile communication devices | |
| 2 Microsoft Corp. | 9.2% |
| Develops, manufactures, licenses, sells and supports software products | |
| 3 Amazon.com, Inc. | 6.7% |
| Online retailer offering a wide range of products | |
| 4 Alphabet, Inc. | 5.1% |
| Holding company with subsidiaries that provide web-based search, maps, hardware products and various software applications | |
| 5 Thermo Fisher Scientific, Inc. | 4.2% |
| Manufacturer of measurement instruments that monitor, collect and analyze information for various industries | |
| 6 Visa, Inc. | 3.5% |
| Operates a retail electronic payments network and manages global financial services | |
| 7 Progressive Corp. | 2.7% |
| Provider of property and casualty insurance | |
| 8 ServiceNow, Inc. | 2.6% |
| Designs, develops and produces prepackaged computer software, cloud services and IT services | |
| 9 NVIDIA Corp. | 2.5% |
| Designs, develops and markets three dimensional (3D) graphic processors and related Software | |
| 10 Equinix, Inc. | 2.3% |
| Global company offering data center space and power to customers | |
| DWS Large Cap Focus Growth Fund | | 9 |
| Investment Portfolio | as of January 31, 2021 (Unaudited) |
| Shares | Value ($) | ||
| Common Stocks 99.6% | |||
| Communication Services 11.0% | |||
| Entertainment 3.5% | |||
| Activision Blizzard, Inc. | 62,500 | 5,687,500 | |
| Netflix, Inc.* | 11,800 | 6,282,202 | |
| 11,969,702 | |||
| Interactive Media & Services 6.1% | |||
| Alphabet, Inc. “A”* | 9,805 | 17,917,265 | |
| MediaAlpha, Inc. “A”* | 62,400 | 3,432,000 | |
| 21,349,265 | |||
| Wireless Telecommunication Services 1.4% | |||
| T-Mobile U.S., Inc.* | 39,000 | 4,917,120 | |
| Consumer Discretionary 16.3% | |||
| Hotels, Restaurants & Leisure 1.2% | |||
| Airbnb, Inc. “A”* | 3,059 | 561,724 | |
| McDonald's Corp. | �� 18,200 | 3,782,688 | |
| 4,344,412 | |||
| Internet & Direct Marketing Retail 8.5% | |||
| Amazon.com, Inc.* | 7,327 | 23,491,827 | |
| Chewy, Inc. “A”* (a) | 42,000 | 4,276,440 | |
| ContextLogic, Inc. “A”* (a) | 66,400 | 1,996,648 | |
| 29,764,915 | |||
| Leisure Products 1.4% | |||
| YETI Holdings, Inc.* | 72,069 | 4,743,582 | |
| Multiline Retail 2.0% | |||
| Dollar General Corp. | 36,700 | 7,142,187 | |
| Specialty Retail 3.2% | |||
| CarMax, Inc.* | 39,200 | 4,616,976 | |
| Home Depot, Inc. | 23,700 | 6,418,434 | |
| 11,035,410 | |||
| Consumer Staples 1.9% | |||
| Food & Staples Retailing | |||
| Costco Wholesale Corp. | 19,203 | 6,767,713 | |
| 10 | | DWS Large Cap Focus Growth Fund |
| Shares | Value ($) | ||
| Financials 4.6% | |||
| Capital Markets 1.9% | |||
| Intercontinental Exchange, Inc. | 61,000 | 6,731,350 | |
| Insurance 2.7% | |||
| Progressive Corp. | 106,900 | 9,320,611 | |
| Health Care 17.4% | |||
| Biotechnology 1.3% | |||
| Certara, Inc.* | 31,100 | 1,070,462 | |
| Exact Sciences Corp.* | 24,000 | 3,291,840 | |
| 4,362,302 | |||
| Health Care Equipment & Supplies 8.2% | |||
| Becton, Dickinson & Co. | 11,000 | 2,879,690 | |
| DexCom, Inc.* | 20,000 | 7,497,000 | |
| Eargo, Inc.* (a) | 40,300 | 2,118,974 | |
| Hologic, Inc.* | 90,000 | 7,175,700 | |
| Intuitive Surgical, Inc.* | 5,500 | 4,112,020 | |
| Quidel Corp.* | 20,000 | 5,019,400 | |
| 28,802,784 | |||
| Health Care Technology 0.5% | |||
| Schrodinger, Inc.* | 20,000 | 1,806,600 | |
| Life Sciences Tools & Services 5.6% | |||
| Berkeley Lights, Inc.* | 15,000 | 1,080,000 | |
| PPD, Inc.* | 115,000 | 3,698,400 | |
| Thermo Fisher Scientific, Inc. | 29,000 | 14,781,300 | |
| 19,559,700 | |||
| Pharmaceuticals 1.8% | |||
| Zoetis, Inc. | 40,100 | 6,185,425 | |
| Industrials 6.6% | |||
| Building Products 0.6% | |||
| AZEK Co., Inc.* | 53,600 | 2,138,104 | |
| Electrical Equipment 1.7% | |||
| AMETEK, Inc. | 51,520 | 5,835,155 | |
| Industrial Conglomerates 1.8% | |||
| Roper Technologies, Inc. | 16,500 | 6,483,015 | |
| Professional Services 1.8% | |||
| Clarivate PLC* | 212,600 | 6,152,644 | |
| Road & Rail 0.7% | |||
| Norfolk Southern Corp. | 9,700 | 2,295,214 | |
| DWS Large Cap Focus Growth Fund | | 11 |
| Shares | Value ($) | ||
| Information Technology 38.2% | |||
| IT Services 7.3% | |||
| Fiserv, Inc.* | 67,500 | 6,931,575 | |
| Globant SA* | 32,500 | 6,240,000 | |
| Visa, Inc. “A” | 64,252 | 12,416,699 | |
| 25,588,274 | |||
| Semiconductors & Semiconductor Equipment 5.5% | |||
| Advanced Micro Devices, Inc.* | 60,000 | 5,138,400 | |
| Applied Materials, Inc. | 54,100 | 5,230,388 | |
| NVIDIA Corp. | 16,800 | 8,729,112 | |
| 19,097,900 | |||
| Software 15.1% | |||
| Datadog, Inc. “A”* | 17,500 | 1,798,125 | |
| DocuSign, Inc.* | 11,540 | 2,687,551 | |
| Microsoft Corp. | 139,125 | 32,271,435 | |
| salesforce.com, Inc.* | 30,200 | 6,811,912 | |
| ServiceNow, Inc.* | 17,000 | 9,233,720 | |
| 52,802,743 | |||
| Technology Hardware, Storage & Peripherals 10.3% | |||
| Apple, Inc. | 271,500 | 35,827,140 | |
| Materials 1.3% | |||
| Chemicals 0.8% | |||
| Ecolab, Inc. | 14,200 | 2,904,042 | |
| Construction Materials 0.5% | |||
| Vulcan Materials Co. | 12,000 | 1,789,680 | |
| Real Estate 2.3% | |||
| Equity Real Estate Investment Trusts (REITs) | |||
| Equinix, Inc. | 10,695 | 7,913,872 | |
| Total Common Stocks (Cost $139,199,316) | 347,630,861 | ||
| Securities Lending Collateral 2.0% | |||
| DWS Government & Agency Securities Portfolio “DWS Government Cash Institutional Shares”, 0.01% (b) (c) (Cost $6,959,840) | 6,959,840 | 6,959,840 | |
| Cash Equivalents 0.5% | |||
| DWS Central Cash Management Government Fund, 0.05% (b) (Cost $1,945,204) | 1,945,204 | 1,945,204 | |
| 12 | | DWS Large Cap Focus Growth Fund |
| % of Net Assets | Value ($) | ||
| Total Investment Portfolio (Cost $148,104,360) | 102.1 | 356,535,905 | |
| Other Assets and Liabilities, Net | (2.1) | (7,373,983) | |
| Net Assets | 100.0 | 349,161,922 |
| Value ($) at 7/31/2020 | Pur- chases Cost ($) | Sales Proceeds ($) | Net Real- ized Gain/ (Loss) ($) | Net Change in Unreal- ized Appreci- ation (Depreci- ation) ($) | Income ($) | Capital Gain Distri- butions ($) | Number of Shares at 1/31/2021 | Value ($) at 1/31/2021 |
| Securities Lending Collateral 2.0% | ||||||||
| DWS Government & Agency Securities Portfolio “DWS Government Cash Institutional Shares”, 0.01% (b) (c) | ||||||||
| 19,822,510 | — | 12,862,670 (d) | — | — | 29,415 | — | 6,959,840 | 6,959,840 |
| Cash Equivalents 0.6% | ||||||||
| DWS Central Cash Management Government Fund, 0.05% (b) | ||||||||
| 4,452,761 | 27,979,941 | 30,487,498 | — | — | 2,557 | — | 1,945,204 | 1,945,204 |
| 24,275,271 | 27,979,941 | 43,350,168 | — | — | 31,972 | — | 8,905,044 | 8,905,044 |
| * | Non-income producing security. |
| (a) | All or a portion of these securities were on loan. In addition, "Other Assets and Liabilities, Net" may include pending sales that are also on loan. The value of securities loaned at January 31, 2021 amounted to $6,771,005, which is 1.9% of net assets. |
| (b) | Affiliated fund managed by DWS Investment Management Americas, Inc. The rate shown is the annualized seven-day yield at period end. |
| (c) | Represents cash collateral held in connection with securities lending. Income earned by the Fund is net of borrower rebates. |
| (d) | Represents the net increase (purchase cost) or decrease (sales proceeds) in the amount invested in cash collateral for the period ended January 31, 2021. |
| DWS Large Cap Focus Growth Fund | | 13 |
| Assets | Level 1 | Level 2 | Level 3 | Total |
| Common Stocks (a) | $347,630,861 | $— | $— | $347,630,861 |
| Short-Term Investments (a) | 8,905,044 | — | — | 8,905,044 |
| Total | $356,535,905 | $ — | $ — | $356,535,905 |
| (a) | See Investment Portfolio for additional detailed categorizations. |
| 14 | | DWS Large Cap Focus Growth Fund |
| Assets | |
| Investments in non-affiliated securities, at value (cost $139,199,316) — including $6,771,005 of securities loaned | $ 347,630,861 |
| Investment in DWS Government & Agency Securities Portfolio (cost $6,959,840)* | 6,959,840 |
| Investment in DWS Central Cash Management Government Fund (cost $1,945,204) | 1,945,204 |
| Cash | 10,000 |
| Receivable for Fund shares sold | 215,604 |
| Dividends receivable | 10,025 |
| Interest receivable | 18,172 |
| Other assets | 43,839 |
| Total assets | 356,833,545 |
| Liabilities | |
| Payable upon return of securities loaned | 6,959,840 |
| Payable for investments purchased | 248,937 |
| Payable for Fund shares redeemed | 119,976 |
| Accrued management fee | 174,993 |
| Accrued Trustees' fees | 3,186 |
| Other accrued expenses and payables | 164,691 |
| Total liabilities | 7,671,623 |
| Net assets, at value | $ 349,161,922 |
| Net Assets Consist of | |
| Distributable earnings (loss) | 220,002,116 |
| Paid-in capital | 129,159,806 |
| Net assets, at value | $ 349,161,922 |
| * | Represents collateral on securities loaned. |
| DWS Large Cap Focus Growth Fund | | 15 |
| Net Asset Value | |
| Class A | |
| Net Asset Value and redemption price per share ($40,879,863 ÷ 588,762 outstanding shares of beneficial interest, $.01 par value, unlimited number of shares authorized) | $ 69.43 |
| Maximum offering price per share (100 ÷ 94.25 of $69.43) | $ 73.67 |
| Class C | |
| Net Asset Value, offering and redemption price (subject to contingent deferred sales charge) per share ($6,344,606 ÷ 114,159 outstanding shares of beneficial interest, $.01 par value, unlimited number of shares authorized) | $ 55.58 |
| Class S | |
| Net Asset Value, offering and redemption price per share ($286,075,312 ÷ 3,904,166 outstanding shares of beneficial interest, $.01 par value, unlimited number of shares authorized) | $ 73.27 |
| Institutional Class | |
| Net Asset Value, offering and redemption price per share ($15,862,141 ÷ 213,149 outstanding shares of beneficial interest, $.01 par value, unlimited number of shares authorized) | $ 74.42 |
| 16 | | DWS Large Cap Focus Growth Fund |
| Investment Income | |
| Income: | |
| Dividends | $ 1,478,382 |
| Income distributions — DWS Central Cash Management Government Fund | 2,557 |
| Securities lending income, net of borrower rebates | 29,415 |
| Total income | 1,510,354 |
| Expenses: | |
| Management fee | 1,046,255 |
| Administration fee | 165,019 |
| Services to shareholders | 160,781 |
| Distribution and service fees | 77,856 |
| Custodian fee | 1,840 |
| Professional fees | 43,720 |
| Reports to shareholders | 22,670 |
| Registration fees | 27,202 |
| Trustees' fees and expenses | 6,362 |
| Other | 9,800 |
| Total expenses before expense reductions | 1,561,505 |
| Expense reductions | (36,090) |
| Total expenses after expense reductions | 1,525,415 |
| Net investment income (loss) | (15,061) |
| Realized and Unrealized Gain (Loss) | |
| Net realized gain (loss) from investments | 12,048,249 |
| Change in net unrealized appreciation (depreciation) on investments | 31,607,518 |
| Net gain (loss) | 43,655,767 |
| Net increase (decrease) in net assets resulting from operations | $ 43,640,706 |
| DWS Large Cap Focus Growth Fund | | 17 |
| Six Months Ended January 31, 2021 | Year Ended July 31, | |
| Increase (Decrease) in Net Assets | (Unaudited) | 2020 |
| Operations: | ||
| Net investment income (loss) | $ (15,061) | $ (71,753) |
| Net realized gain (loss) | 12,048,249 | 14,038,213 |
| Change in net unrealized appreciation (depreciation) | 31,607,518 | 65,410,733 |
| Net increase (decrease) in net assets resulting from operations | 43,640,706 | 79,377,193 |
| Distributions to shareholders: | ||
| Class A | (1,747,910) | (1,658,497) |
| Class C | (352,851) | (357,700) |
| Class S | (11,377,035) | (11,848,832) |
| Institutional Class | (604,553) | (281,885) |
| Total distributions | (14,082,349) | (14,146,914) |
| Fund share transactions: | ||
| Proceeds from shares sold | 21,644,765 | 27,518,007 |
| Reinvestment of distributions | 13,459,079 | 13,516,876 |
| Payments for shares redeemed | (29,530,887) | (50,614,142) |
| Net increase (decrease) in net assets from Fund share transactions | 5,572,957 | (9,579,259) |
| Increase (decrease) in net assets | 35,131,314 | 55,651,020 |
| Net assets at beginning of period | 314,030,608 | 258,379,588 |
| Net assets at end of period | $349,161,922 | $314,030,608 |
| 18 | | DWS Large Cap Focus Growth Fund |
| DWS Large Cap Focus Growth Fund — Class A | ||||||
| Six Months Ended 1/31/21 | Years Ended July 31, | |||||
| (Unaudited) | 2020 | 2019 | 2018 | 2017 | 2016 | |
| Selected Per Share Data | ||||||
| Net asset value, beginning of period | $ 63.63 | $ 50.70 | $ 47.19 | $ 42.39 | $ 38.46 | $ 43.94 |
| Income (loss) from investment operations: | ||||||
| Net investment income (loss)a | (.07) | (.12) | (.04) | (.06) | .02 | (.07) |
| Net realized and unrealized gain | 8.87 | 16.01 | 6.07 | 6.46 | 6.61 | .57 |
| Total from investment operations | 8.80 | 15.89 | 6.03 | 6.40 | 6.63 | .50 |
| Less distributions from: | ||||||
| Net realized gains | (3.00) | (2.96) | (2.52) | (1.60) | (2.70) | (5.98) |
| Net asset value, end of period | $ 69.43 | $ 63.63 | $ 50.70 | $ 47.19 | $ 42.39 | $ 38.46 |
| Total Return (%)b,c | 13.99 * | 32.91 | 13.92 | 15.47 | 18.45 | 1.77 |
| Ratios to Average Net Assets and Supplemental Data | ||||||
| Net assets, end of period ($ millions) | 41 | 36 | 29 | 26 | 25 | 26 |
| Ratio of expenses before expense reductions (%) | 1.13 ** | 1.18 | 1.22 | 1.22 | 1.25 | 1.25 |
| Ratio of expenses after expense reductions (%) | 1.10 ** | 1.12 | 1.15 | 1.22 | 1.21 | 1.17 |
| Ratio of net investment income (loss) (%) | (.20) ** | (.23) | (.08) | (.15) | .05 | (.17) |
| Portfolio turnover rate (%) | 10 * | 21 | 26 | 36 | 30 | 55 |
| a | Based on average shares outstanding during the period. |
| b | Total return does not reflect the effect of any sales charges. |
| c | Total return would have been lower had certain expenses not been reduced. |
| * | Not annualized |
| ** | Annualized |
| DWS Large Cap Focus Growth Fund | | 19 |
| DWS Large Cap Focus Growth Fund — Class C | ||||||
| Six Months Ended 1/31/21 | Years Ended July 31, | |||||
| (Unaudited) | 2020 | 2019 | 2018 | 2017 | 2016 | |
| Selected Per Share Data | ||||||
| Net asset value, beginning of period | $ 51.67 | $ 42.00 | $ 39.84 | $ 36.29 | $ 33.54 | $ 39.38 |
| Income (loss) from investment operations: | ||||||
| Net investment income (loss)a | (.26) | (.42) | (.32) | (.33) | (.23) | (.31) |
| Net realized and unrealized gain | 7.17 | 13.05 | 5.00 | 5.48 | 5.68 | .45 |
| Total from investment operations | 6.91 | 12.63 | 4.68 | 5.15 | 5.45 | .14 |
| Less distributions from: | ||||||
| Net realized gains | (3.00) | (2.96) | (2.52) | (1.60) | (2.70) | (5.98) |
| Net asset value, end of period | $ 55.58 | $ 51.67 | $ 42.00 | $ 39.84 | $ 36.29 | $ 33.54 |
| Total Return (%)b,c | 13.56 * | 31.92 | 13.07 | 14.60 | 17.60 | .98 |
| Ratios to Average Net Assets and Supplemental Data | ||||||
| Net assets, end of period ($ millions) | 6 | 6 | 5 | 6 | 6 | 6 |
| Ratio of expenses before expense reductions (%) | 1.89 ** | 1.93 | 1.96 | 1.97 | 1.99 | 1.97 |
| Ratio of expenses after expense reductions (%) | 1.85 ** | 1.87 | 1.90 | 1.97 | 1.96 | 1.92 |
| Ratio of net investment income (loss) (%) | (.94) ** | (.97) | (.82) | (.89) | (.70) | (.92) |
| Portfolio turnover rate (%) | 10 * | 21 | 26 | 36 | 30 | 55 |
| a | Based on average shares outstanding during the period. |
| b | Total return does not reflect the effect of any sales charges. |
| c | Total return would have been lower had certain expenses not been reduced. |
| * | Not annualized |
| ** | Annualized |
| 20 | | DWS Large Cap Focus Growth Fund |
| DWS Large Cap Focus Growth Fund — Class S | ||||||
| Six Months Ended 1/31/21 | Years Ended July 31, | |||||
| (Unaudited) | 2020 | 2019 | 2018 | 2017 | 2016 | |
| Selected Per Share Data | ||||||
| Net asset value, beginning of period | $ 66.92 | $ 53.11 | $ 49.22 | $ 44.09 | $ 39.86 | $ 45.30 |
| Income (loss) from investment operations: | ||||||
| Net investment incomea | .01 | .01 | .08 | .06 | .12 | .03 |
| Net realized and unrealized gain | 9.34 | 16.82 | 6.37 | 6.72 | 6.88 | .58 |
| Total from investment operations | 9.35 | 16.83 | 6.45 | 6.78 | 7.00 | .61 |
| Less distributions from: | ||||||
| Net investment income | — | (.06) | (.04) | (.05) | (.07) | (.07) |
| Net realized gains | (3.00) | (2.96) | (2.52) | (1.60) | (2.70) | (5.98) |
| Total distributions | (3.00) | (3.02) | (2.56) | (1.65) | (2.77) | (6.05) |
| Net asset value, end of period | $ 73.27 | $ 66.92 | $ 53.11 | $ 49.22 | $ 44.09 | $ 39.86 |
| Total Return (%) | 14.12 b* | 33.23 b | 14.24 b | 15.75 | 18.77 b | 1.98 b |
| Ratios to Average Net Assets and Supplemental Data | ||||||
| Net assets, end of period ($ millions) | 286 | 260 | 223 | 209 | 198 | 180 |
| Ratio of expenses before expense reductions (%) | .87 ** | .91 | .94 | .95 | .98 | .98 |
| Ratio of expenses after expense reductions (%) | .85 ** | .87 | .90 | .95 | .96 | .92 |
| Ratio of net investment income (%) | .04 ** | .02 | .16 | .12 | .30 | .08 |
| Portfolio turnover rate (%) | 10 * | 21 | 26 | 36 | 30 | 55 |
| a | Based on average shares outstanding during the period. |
| b | Total return would have been lower had certain expenses not been reduced. |
| * | Not annualized |
| ** | Annualized |
| DWS Large Cap Focus Growth Fund | | 21 |
| DWS Large Cap Focus Growth Fund — Institutional Class | ||||||
| Six Months Ended 1/31/21 | Years Ended July 31, | |||||
| (Unaudited) | 2020 | 2019 | 2018 | 2017 | 2016 | |
| Selected Per Share Data | ||||||
| Net asset value, beginning of period | $ 67.92 | $ 53.83 | $ 49.88 | $ 44.65 | $ 40.34 | $ 45.77 |
| Income (loss) from investment operations: | ||||||
| Net investment incomea | .02 | .01 | .03 | .06 | .12 | .04 |
| Net realized and unrealized gain | 9.48 | 17.10 | 6.49 | 6.82 | 6.96 | .58 |
| Total from investment operations | 9.50 | 17.11 | 6.52 | 6.88 | 7.08 | .62 |
| Less distributions from: | ||||||
| Net investment income | — | (.06) | (.05) | (.05) | (.07) | (.07) |
| Net realized gains | (3.00) | (2.96) | (2.52) | (1.60) | (2.70) | (5.98) |
| Total distributions | (3.00) | (3.02) | (2.57) | (1.65) | (2.77) | (6.05) |
| Net asset value, end of period | $ 74.42 | $ 67.92 | $ 53.83 | $ 49.88 | $ 44.65 | $ 40.34 |
| Total Return (%) | 14.14 b* | 33.31 | 14.18 b | 15.78 | 18.76 b | 1.99 b |
| Ratios to Average Net Assets and Supplemental Data | ||||||
| Net assets, end of period ($ millions) | 16 | 13 | 2 | 10 | 8 | 8 |
| Ratio of expenses before expense reductions (%) | .87 ** | .86 | 1.01 | .94 | .98 | 1.00 |
| Ratio of expenses after expense reductions (%) | .85 ** | .86 | .90 | .94 | .96 | .91 |
| Ratio of net investment income (%) | .06 ** | .01 | .06 | .13 | .30 | .09 |
| Portfolio turnover rate (%) | 10 * | 21 | 26 | 36 | 30 | 55 |
| a | Based on average shares outstanding during the period. |
| b | Total return would have been lower had certain expenses not been reduced. |
| * | Not annualized |
| ** | Annualized |
| 22 | | DWS Large Cap Focus Growth Fund |
| Notes to Financial Statements | (Unaudited) |
| A. | Organization and Significant Accounting Policies |
| DWS Large Cap Focus Growth Fund | | 23 |
| 24 | | DWS Large Cap Focus Growth Fund |
| DWS Large Cap Focus Growth Fund | | 25 |
| 26 | | DWS Large Cap Focus Growth Fund |
| B. | Purchases and Sales of Securities |
| C. | Related Parties |
| First $1.5 billion of the Fund's average daily net assets | .615% |
| Next $500 million of such net assets | .565% |
| Over $2.0 billion of such net assets | .515% |
| DWS Large Cap Focus Growth Fund | | 27 |
| Class A | 1.12% |
| Class C | 1.87% |
| Class S | .87% |
| Institutional Class | .87% |
| Class A | 1.09% | |
| Class C | 1.84% | |
| Class S | .84% | |
| Institutional Class | .84% |
| Class A | $ 6,444 |
| Class C | 1,383 |
| Class S | 26,809 |
| Institutional Class | 1,454 |
| $ 36,090 |
| 28 | | DWS Large Cap Focus Growth Fund |
| Services to Shareholders | Total Aggregated | Unpaid at January 31, 2021 |
| Class A | $ 5,760 | $ 1,504 |
| Class C | 491 | 181 |
| Class S | 64,171 | 17,462 |
| Institutional Class | 150 | 86 |
| $ 70,572 | $ 19,233 |
| Sub-Recordkeeping | Total Aggregated |
| Class A | $ 14,751 |
| Class C | 3,025 |
| Class S | 48,297 |
| Institutional Class | 5,660 |
| $ 71,733 |
| Distribution Fee | Total Aggregated | Unpaid at January 31, 2021 |
| Class C | $ 23,303 | $ 4,124 |
| DWS Large Cap Focus Growth Fund | | 29 |
| Service Fee | Total Aggregated | Unpaid at January 31, 2021 | Annualized Rate |
| Class A | $ 47,026 | $ 17,643 | .24% |
| Class C | 7,527 | 2,581 | .24% |
| $ 54,553 | $ 20,224 |
| 30 | | DWS Large Cap Focus Growth Fund |
| D. | Line of Credit |
| E. | Fund Share Transactions |
| Six Months Ended January 31, 2021 | Year Ended July 31, 2020 | |||
| Shares | Dollars | Shares | Dollars | |
| Shares sold | ||||
| Class A | 66,626 | $ 4,521,946 | 98,664 | $ 5,210,328 |
| Class C | 26,222 | 1,441,813 | 37,982 | 1,642,275 |
| Class S | 171,504 | 12,399,588 | 157,436 | 8,765,611 |
| Institutional Class | 45,320 | 3,281,418 | 210,779 | 11,899,793 |
| $ 21,644,765 | $ 27,518,007 | |||
| Shares issued to shareholders in reinvestment of distributions | ||||
| Class A | 24,494 | $ 1,646,726 | 31,206 | $ 1,567,468 |
| Class C | 6,505 | 350,395 | 8,343 | 341,906 |
| Class S | 153,094 | 10,857,405 | 214,704 | 11,325,618 |
| Institutional Class | 8,393 | 604,553 | 5,266 | 281,884 |
| $ 13,459,079 | $ 13,516,876 | |||
| DWS Large Cap Focus Growth Fund | | 31 |
| Six Months Ended January 31, 2021 | Year Ended July 31, 2020 | |||
| Shares | Dollars | Shares | Dollars | |
| Shares redeemed | ||||
| Class A | (69,052) | $ (4,675,912) | (128,079) | $ (6,649,730) |
| Class C | (26,829) | (1,470,395) | (56,265) | (2,500,416) |
| Class S | (298,393) | (21,215,982) | (689,328) | (38,148,939) |
| Institutional Class | (29,866) | (2,168,598) | (63,359) | (3,315,057) |
| $ (29,530,887) | $ (50,614,142) | |||
| Net increase (decrease) | ||||
| Class A | 22,068 | $ 1,492,760 | 1,791 | $ 128,066 |
| Class C | 5,898 | 321,813 | (9,940) | (516,235) |
| Class S | 26,205 | 2,041,011 | (317,188) | (18,057,710) |
| Institutional Class | 23,847 | 1,717,373 | 152,686 | 8,866,620 |
| $ 5,572,957 | $ (9,579,259) | |||
| F. | Other — COVID-19 Pandemic |
| 32 | | DWS Large Cap Focus Growth Fund |
| DWS Large Cap Focus Growth Fund | | 33 |
| — | Actual Fund Return. This helps you estimate the actual dollar amount of ongoing expenses (but not transaction costs) paid on a $1,000 investment in the Fund using the Fund’s actual return during the period. To estimate the expenses you paid over the period, simply divide your account value by $1,000 (for example, an $8,600 account value divided by $1,000 = 8.6), then multiply the result by the number in the “Expenses Paid per $1,000” line under the share class you hold. |
| — | Hypothetical 5% Fund Return. This helps you to compare your Fund’s ongoing expenses (but not transaction costs) with those of other mutual funds using the Fund’s actual expense ratio and a hypothetical rate of return of 5% per year before expenses. Examples using a 5% hypothetical fund return may be found in the shareholder reports of other mutual funds. The hypothetical account values and expenses may not be used to estimate the actual ending account balance or expenses you paid for the period. |
| 34 | | DWS Large Cap Focus Growth Fund |
| Actual Fund Return | Class A | Class C | Class S | Institutional Class |
| Beginning Account Value 8/1/20 | $1,000.00 | $1,000.00 | $1,000.00 | $1,000.00 |
| Ending Account Value 1/31/21 | $1,139.87 | $1,135.62 | $1,141.23 | $1,141.36 |
| Expenses Paid per $1,000* | $ 5.93 | $ 9.96 | $ 4.59 | $ 4.59 |
| Hypothetical 5% Fund Return | Class A | Class C | Class S | Institutional Class |
| Beginning Account Value 8/1/20 | $1,000.00 | $1,000.00 | $1,000.00 | $1,000.00 |
| Ending Account Value 1/31/21 | $1,019.66 | $1,015.88 | $1,020.92 | $1,020.92 |
| Expenses Paid per $1,000* | $ 5.60 | $ 9.40 | $ 4.33 | $ 4.33 |
| * | Expenses are equal to the Fund's annualized expense ratio for each share class, multiplied by the average account value over the period, multiplied by 184 (the number of days in the most recent six-month period), then divided by 365. |
| Annualized Expense Ratios | Class A | Class C | Class S | Institutional Class |
| DWS Large Cap Focus Growth Fund | 1.10% | 1.85% | .85% | .85% |
| DWS Large Cap Focus Growth Fund | | 35 |
| — | During the entire process, all of the Fund's Trustees were independent of DIMA and its affiliates (the "Independent Trustees"). |
| — | The Board met frequently during the past year to discuss fund matters and dedicated a substantial amount of time to contract review matters. Over the course of several months, the Board reviewed extensive materials received from DIMA, independent third parties and independent counsel. These materials included an analysis of the Fund’s performance, fees and expenses, and profitability from a fee consultant retained by the Fund’s Independent Trustees (the “Fee Consultant”). |
| — | The Board also received extensive information throughout the year regarding performance of the Fund. |
| — | The Independent Trustees regularly met privately with counsel to discuss contract review and other matters. In addition, the Independent Trustees were advised by the Fee Consultant in the course of their review of the Fund's contractual arrangements and considered a comprehensive report prepared by the Fee Consultant in connection with their deliberations. |
| — | In connection with reviewing the Agreement, the Board also reviewed the terms of the Fund's Rule 12b-1 plan, distribution agreement, administrative services agreement, transfer agency agreement and other material service agreements. |
| 36 | | DWS Large Cap Focus Growth Fund |
| DWS Large Cap Focus Growth Fund | | 37 |
| 38 | | DWS Large Cap Focus Growth Fund |
| DWS Large Cap Focus Growth Fund | | 39 |
| 40 | | DWS Large Cap Focus Growth Fund |
| For More Information | The automated telephone system allows you to access personalized account information and obtain information on other DWS funds using either your voice or your telephone keypad. Certain account types within also have the ability to purchase, exchange or redeem shares using this system. |
| For more information, contact your financial representative. You may also access our automated telephone system or speak with a Shareholder Service representative by calling: (800) 728-3337 | |
| Web Site | dws.com View your account transactions and balances, trade shares, monitor your asset allocation, subscribe to fund and account updates by e-mail, and change your address, 24 hours a day. |
| Obtain prospectuses and applications, news about DWS funds, insight from DWS economists and investment specialists and access to DWS fund account information. | |
| Written Correspondence | DWSPO Box 219151 Kansas City, MO 64121-9151 |
| Proxy Voting | The Fund’s policies and procedures for voting proxies for portfolio securities and information about how the Fund voted proxies related to its portfolio securities during the most recent 12-month period ended June 30 are available on our Web site — dws.com/en-us/resources/proxy-voting — or on the SEC’s Web site — sec.gov. To obtain a written copy of the Fund’s policies and procedures without charge, upon request, call us toll free at (800) 728-3337. |
| Portfolio Holdings | Following the Fund’s fiscal first and third quarter-end, a complete portfolio holdings listing is posted on dws.com, and is available free of charge by contacting your financial intermediary, or if you are a direct investor, by calling (800) 728-3337. In addition, the portfolio holdings listing is filed with SEC on the Fund’s Form N-PORT and will be available on the SEC’s Web site at sec.gov. Additional portfolio holdings for the Fund are also posted on dws.com from time to time. Please see the Fund’s current prospectus for more information. |
| Principal Underwriter | If you have questions, comments or complaints, contact:DWS Distributors, Inc. 222 South Riverside Plaza Chicago, IL 60606-5808 (800) 621-1148 |
| DWS Large Cap Focus Growth Fund | | 41 |
| Investment Management | DWS Investment Management Americas, Inc. (“DIMA” or the “Advisor”), which is part of the DWS Group GmbH & Co. KGaA (“DWS Group”), is the investment advisor for the Fund. DIMA and its predecessors have more than 90 years of experience managing mutual funds and DIMA provides a full range of investment advisory services to both institutional and retail clients. DIMA is an indirect, wholly owned subsidiary of DWS Group. |
| DWS Group is a global organization that offers a wide range of investing expertise and resources, including hundreds of portfolio managers and analysts and an office network that reaches the world’s major investment centers. This well-resourced global investment platform brings together a wide variety of experience and investment insight across industries, regions, asset classes and investing styles. |
| Class A | Class C | Class S | Institutional Class | |
| Nasdaq Symbol | SGGAX | SGGCX | SCQGX | SGGIX |
| CUSIP Number | 25157M 695 | 25157M 737 | 25157M 745 | 25157M 752 |
| Fund Number | 469 | 769 | 2060 | 1469 |
| 42 | | DWS Large Cap Focus Growth Fund |
| FACTS | What Does DWS Do With Your Personal Information? |
| Why? | Financial companies choose how they share your personal information. Federal law gives consumers the right to limit some but not all sharing. Federal law also requires us to tell you how we collect, share and protect your personal information. Please read this notice carefully to understand what we do. |
| What? | The types of personal information we collect and share can include: — Social Security number — Account balances — Purchase and transaction history — Bank account information — Contact information such as mailing address, e-mail address and telephone number |
| How? | All financial companies need to share customers’ personal information to run their everyday business. In the section below, we list the reasons financial companies can share their customers’ personal information, the reasons DWS chooses to share and whether you can limit this sharing. |
| Reasons we can share your personal information | Does DWS share? | Can you limit this sharing? |
| For our everyday business purposes —such as to process your transactions, maintain your account(s), respond to court orders or legal investigations | Yes | No |
| For our marketing purposes — to offer our products and services to you | Yes | No |
| For joint marketing with other financial companies | No | We do not share |
| For our affiliates’ everyday business purposes — information about your transactions and experiences | No | We do not share |
| For our affiliates’ everyday business purposes — information about your creditworthiness | No | We do not share |
| For non-affiliates to market to you | No | We do not share |
| Questions? | Call (800) 728-3337 or e-mail us at service@dws.com |
| DWS Large Cap Focus Growth Fund | | 43 |
| Who we are | |
| Who is providing this notice? | DWS Distributors, Inc; DWS Investment Management Americas, Inc.; DWS Trust Company; the DWS Funds |
| What we do | |
| How does DWS protect my personal information? | To protect your personal information from unauthorized access and use, we use security measures that comply with federal law. These measures include computer safeguards, secured files, and secured buildings. |
| How does DWS collect my personal information? | We collect your personal information, for example, when you: — open an account — give us your contact information — provide bank account information for ACH or wire transactions — tell us where to send money — seek advice about your investments |
| Why can't I limit all sharing? | Federal law gives you the right to limit only — sharing for affiliates’ everyday business purposes — information about your creditworthiness — affiliates from using your information to market to you — sharing for non-affiliates to market to you State laws and individual companies may give you additional rights to limit sharing. |
| Definitions | |
| Affiliates | Companies related by common ownership or control. They can be financial or non-financial companies. Our affiliates include financial companies with the DWS or Deutsche Bank (“DB”) name, such as DB AG Frankfurt. |
| Non-affiliates | Companies not related by common ownership or control. They can be financial and non-financial companies. Non-affiliates we share with include account service providers, service quality monitoring services, mailing service providers and verification services to help in the fight against money laundering and fraud. |
| Joint marketing | A formal agreement between non-affiliated financial companies that together market financial products or services to you. DWS does not jointly market. |
| 44 | | DWS Large Cap Focus Growth Fund |
| (b) Not applicable | ||
| ITEM 2. | CODE OF ETHICS | |
| Not applicable. | ||
| ITEM 3. | AUDIT COMMITTEE FINANCIAL EXPERT | |
| Not applicable | ||
| ITEM 4. | PRINCIPAL ACCOUNTANT FEES AND SERVICES | |
| Not applicable | ||
| ITEM 5. | AUDIT COMMITTEE OF LISTED REGISTRANTS | |
| Not applicable | ||
| ITEM 6. | SCHEDULE OF INVESTMENTS | |
| Not applicable | ||
| ITEM 7. | DISCLOSURE OF PROXY VOTING POLICIES AND PROCEDURES FOR CLOSED-END MANAGEMENT INVESTMENT COMPANIES | |
| Not applicable | ||
| ITEM 8. | PORTFOLIO MANAGERS OF CLOSED-END MANAGEMENT INVESTMENT COMPANIES | |
| Not applicable | ||
| ITEM 9. | PURCHASES OF EQUITY SECURITIES BY CLOSED-END MANAGEMENT INVESTMENT COMPANY AND AFFILIATED PURCHASERS | |
| Not applicable | ||
| ITEM 10. | SUBMISSION OF MATTERS TO A VOTE OF SECURITY HOLDERS | |
| There were no material changes to the procedures by which shareholders may recommend nominees to the Fund’s Board. The primary function of the Nominating and Governance Committee is to identify and recommend individuals for membership on the Board and oversee the administration of the Board Governance Guidelines. Shareholders may recommend candidates for Board positions by forwarding their correspondence by U.S. mail or courier service to Keith R. Fox, DWS Funds Board Chair, c/o Thomas R. Hiller, Ropes & Gray LLP, Prudential Tower, 800 Boylston Street, Boston, MA 02199-3600. | ||
| ITEM 11. | CONTROLS AND PROCEDURES | |
| (a) | The Chief Executive and Financial Officers concluded that the Registrant’s Disclosure Controls and Procedures are effective based on the evaluation of the Disclosure Controls and Procedures as of a date within 90 days of the filing date of this report. | |
| (b) | There have been no changes in the registrant’s internal control over financial reporting that occurred during the period covered by this report that has materially affected, or is reasonably likely to materially affect, the registrant’s internal controls over financial reporting. | |
| ITEM 12. | Disclosure of Securities Lending Activities for Closed-End Management Investment Companies. | |
| Not applicable | ||
| ITEM 13. | EXHIBITS | |
| (a)(1) | Not applicable | |
| (a)(2) | Certification pursuant to Rule 30a-2(a) under the Investment Company Act of 1940 (17 CFR 270.30a-2(a)) is filed and attached hereto as Exhibit 99.CERT. | |
| (b) | Certification pursuant to Rule 30a-2(b) under the Investment Company Act of 1940 (17 CFR 270.30a-2(b)) is furnished and attached hereto as Exhibit 99.906CERT. | |
SIGNATURES
Pursuant to the requirements of the Securities Exchange Act of 1934 and the Investment Company Act of 1940, the registrant has duly caused this report to be signed on its behalf by the undersigned, thereunto duly authorized.
| Registrant: | DWS Large Cap Focus Growth Fund, a series of Deutsche DWS Investment Trust |
| By: | /s/Hepsen Uzcan Hepsen Uzcan President |
| Date: | 4/1/2021 |
Pursuant to the requirements of the Securities Exchange Act of 1934 and the Investment Company Act of 1940, this report has been signed below by the following persons on behalf of the registrant and in the capacities and on the dates indicated.
| By: | /s/Hepsen Uzcan Hepsen Uzcan President |
| Date: | 4/1/2021 |
| By: | /s/Diane Kenneally Diane Kenneally Chief Financial Officer and Treasurer |
| Date: | 4/1/2021 |