UNITED STATES
SECURITIES AND EXCHANGE COMMISSION
WASHINGTON, D. C. 20549
FORM N-CSRS
Investment Company Act file number: 811-00043
Deutsche DWS Investment Trust
(Exact Name of Registrant as Specified in Charter)
875 Third Avenue
New York, NY 10022-6225
(Address of Principal Executive Offices) (Zip Code)
Registrant’s Telephone Number, including Area Code: (212) 454-4500
Diane Kenneally
100 Summer Street
Boston, MA 02110
(Name and Address of Agent for Service)
| Date of fiscal year end: | 9/30 |
| Date of reporting period: | 3/31/2024 |
| ITEM 1. | REPORT TO STOCKHOLDERS |
| (a) | |


Contents
2 | | | DWS CROCI® U.S. Fund |
Class A | 6-Month‡ | 1-Year | 5-Year | Life of Fund* |
Average Annual Total Returns as of 3/31/24 | ||||
Unadjusted for Sales Charge | 23.35% | 26.72% | 7.76% | 6.33% |
Adjusted for the Maximum Sales Charge (max 5.75% load) | 16.26% | 19.43% | 6.50% | 5.63% |
Russell 1000® Value Index† | 19.34% | 20.27% | 10.32% | 8.82% |
Class C | 6-Month‡ | 1-Year | 5-Year | Life of Fund* |
Average Annual Total Returns as of 3/31/24 | ||||
Unadjusted for Sales Charge | 22.88% | 25.72% | 6.93% | 5.50% |
Adjusted for the Maximum Sales Charge (max 1.00% CDSC) | 21.88% | 25.72% | 6.93% | 5.50% |
Russell 1000® Value Index† | 19.34% | 20.27% | 10.32% | 8.82% |
Class S | 6-Month‡ | 1-Year | 5-Year | Life of Fund* |
Average Annual Total Returns as of 3/31/24 | ||||
No Sales Charges | 23.54% | 27.13% | 8.12% | 6.64% |
Russell 1000® Value Index† | 19.34% | 20.27% | 10.32% | 8.82% |
Institutional Class | 6-Month‡ | 1-Year | 5-Year | Life of Fund* |
Average Annual Total Returns as of 3/31/24 | ||||
No Sales Charges | 23.47% | 27.17% | 8.11% | 6.65% |
Russell 1000® Value Index† | 19.34% | 20.27% | 10.32% | 8.82% |
DWS CROCI® U.S. Fund | | | 3 |
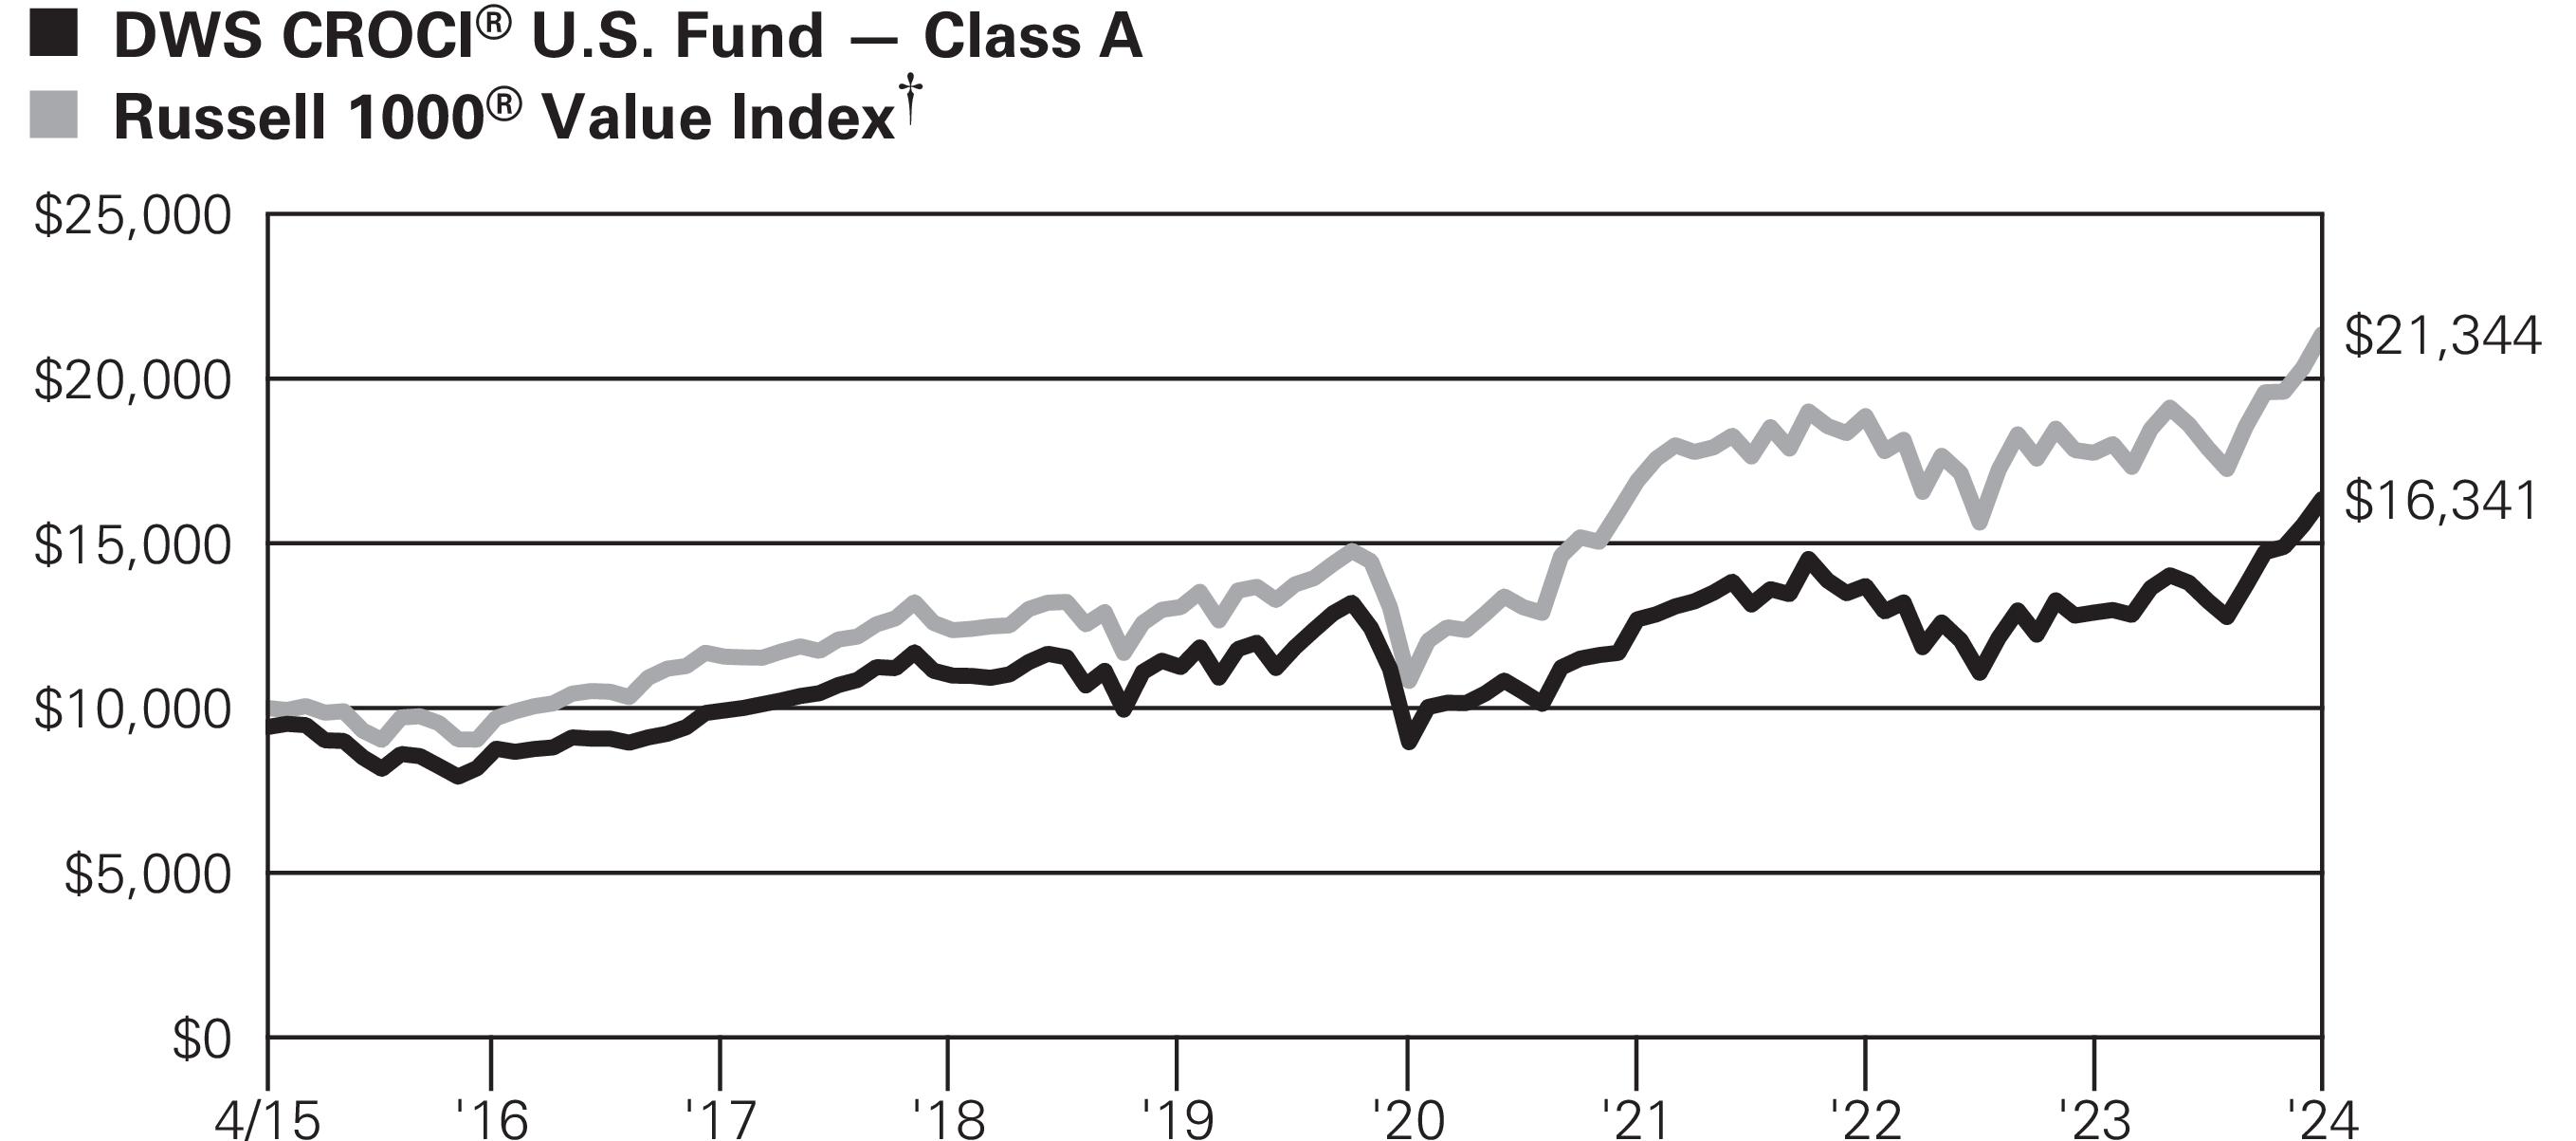 Yearly periods ended March 31
* | The Fund commenced operations on April 13, 2015. |
† | Russell 1000® Value Index is an unmanaged market capitalization-weighted index of value-oriented stocks of the largest U.S. domiciled companies that are included in the Russell 1000® Index. Value-oriented stocks tend to have lower price-to-book ratios and lower forecasted growth values. Russell 1000 Index is an unmanaged price-only index of the 1,000 largest capitalized companies that are domiciled in the U.S. and whose common stocks are traded. |
‡ | Total returns shown for periods less than one year are not annualized. |
4 | | | DWS CROCI® U.S. Fund |
Class A | Class C | Class S | Institutional Class | |
Net Asset Value | ||||
3/31/24 | $14.22 | $14.09 | $14.22 | $14.22 |
9/30/23 | $11.68 | $11.52 | $11.70 | $11.70 |
Distribution Information as of 3/31/24 | ||||
Income Dividends, Six Months | $.17 | $.06 | $.21 | $.21 |
DWS CROCI® U.S. Fund | | | 5 |
6 | | | DWS CROCI® U.S. Fund |
Asset Allocation (As a % of Investment Portfolio) | 3/31/24 | 9/30/23 |
Common Stocks | 99% | 100% |
Cash Equivalents | 1% | 0% |
100% | 100% |
Sector Diversification (As a % of Investment Portfolio excluding Cash Equivalents) | 3/31/24 | 9/30/23 |
Information Technology | 24% | 24% |
Health Care | 20% | 23% |
Communication Services | 13% | 14% |
Financials | 12% | 11% |
Consumer Discretionary | 11% | 9% |
Industrials | 8% | 6% |
Energy | 5% | 7% |
Materials | 4% | 3% |
Consumer Staples | 3% | 3% |
100% | 100% |
DWS CROCI® U.S. Fund | | | 7 |
Ten Largest Equity Holdings at March 31, 2024 (39.9% of Net Assets) | |
1PACCAR, Inc. | 5.1% |
Manufacturer and distributor of light, medium, and heavy-duty commercial trucks | |
2Alphabet, Inc. | 4.9% |
Holding company with subsidiaries that provide Web-based search, maps, hardware products and various software applications | |
3Merck & Co., Inc. | 4.8% |
Developer of medicines, vaccines, biologic therapies and animal health products | |
4D.R. Horton, Inc. | 4.4% |
Constructor and seller of single family homes designed primarily for the entry-level and move-up markets | |
5Hewlett Packard Enterprise Co. | 3.9% |
Provider of information technology solutions | |
6Meta Platforms, Inc. | 3.8% |
Operator of social networking web site | |
7Fox Corp. | 3.5% |
Operator of an entertainment company | |
8JPMorgan Chase & Co. | 3.3% |
Provider of global financial services | |
9Cognizant Technology Solutions Corp. | 3.1% |
Provider of information technology, consulting, and business process outsourcing services | |
10Johnson & Johnson | 3.1% |
Provider of health care products | |
8 | | | DWS CROCI® U.S. Fund |
Shares | Value ($) | ||
Common Stocks 99.5% | |||
Communication Services 12.4% | |||
Interactive Media & Services 8.7% | |||
Alphabet, Inc. “A” * | 226,377 | 34,167,081 | |
Meta Platforms, Inc. “A” | 54,399 | 26,415,066 | |
60,582,147 | |||
Media 3.7% | |||
Comcast Corp. “A” | 38,997 | 1,690,520 | |
Fox Corp. “A” | 763,518 | 23,875,208 | |
25,565,728 | |||
Consumer Discretionary 10.7% | |||
Hotels, Restaurants & Leisure 2.9% | |||
Boyd Gaming Corp. | 269,790 | 18,162,263 | |
Expedia Group, Inc.* | 11,972 | 1,649,143 | |
19,811,406 | |||
Household Durables 4.4% | |||
D.R. Horton, Inc. | 185,085 | 30,455,737 | |
Specialty Retail 2.6% | |||
AutoNation, Inc.* | 53,996 | 8,940,657 | |
Best Buy Co., Inc. | 21,799 | 1,788,172 | |
Lowe’s Companies, Inc. | 20,038 | 5,104,280 | |
Signet Jewelers Ltd. | 23,933 | 2,394,975 | |
18,228,084 | |||
Textiles, Apparel & Luxury Goods 0.8% | |||
Tapestry, Inc. | 115,646 | 5,490,872 | |
Consumer Staples 3.3% | |||
Beverages 1.0% | |||
Molson Coors Beverage Co. “B” | 105,149 | 7,071,270 | |
Food Products 0.6% | |||
Kraft Heinz Co. | 106,224 | 3,919,666 | |
Tobacco 1.7% | |||
Altria Group, Inc. | 230,719 | 10,063,963 | |
Philip Morris International, Inc. | 18,002 | 1,649,343 | |
11,713,306 | |||
DWS CROCI® U.S. Fund | | | 9 |
Shares | Value ($) | ||
Energy 5.4% | |||
Oil, Gas & Consumable Fuels | |||
Coterra Energy, Inc. | 92,955 | 2,591,585 | |
Marathon Petroleum Corp. | 55,282 | 11,139,323 | |
Phillips 66 | 26,733 | 4,366,568 | |
Pioneer Natural Resources Co. | 52,871 | 13,878,638 | |
Valero Energy Corp. | 29,955 | 5,113,019 | |
37,089,133 | |||
Financials 11.9% | |||
Banks 6.3% | |||
Bank of America Corp. | 224,812 | 8,524,871 | |
JPMorgan Chase & Co. | 114,054 | 22,845,016 | |
M&T Bank Corp. | 18,930 | 2,753,179 | |
PNC Financial Services Group, Inc. | 22,944 | 3,707,751 | |
Wells Fargo & Co. | 103,471 | 5,997,179 | |
43,827,996 | |||
Capital Markets 1.1% | |||
State Street Corp. | 96,135 | 7,433,158 | |
Consumer Finance 4.5% | |||
Capital One Financial Corp. | 42,685 | 6,355,370 | |
Discover Financial Services | 64,691 | 8,480,343 | |
Synchrony Financial | 370,997 | 15,997,391 | |
30,833,104 | |||
Health Care 20.1% | |||
Biotechnology 7.8% | |||
AbbVie, Inc. | 29,367 | 5,347,731 | |
Amgen, Inc. | 6,661 | 1,893,856 | |
Gilead Sciences, Inc. | 231,949 | 16,990,264 | |
Regeneron Pharmaceuticals, Inc.* | 19,014 | 18,300,785 | |
Vertex Pharmaceuticals, Inc.* | 27,040 | 11,302,990 | |
53,835,626 | |||
Health Care Equipment & Supplies 2.8% | |||
Edwards Lifesciences Corp.* | 31,437 | 3,004,120 | |
Hologic, Inc.* | 92,481 | 7,209,819 | |
Medtronic PLC | 105,280 | 9,175,152 | |
19,389,091 | |||
10 | | | DWS CROCI® U.S. Fund |
Shares | Value ($) | ||
Health Care Providers & Services 0.5% | |||
HCA Healthcare, Inc. | 5,877 | 1,960,156 | |
Laboratory Corp. of America Holdings | 7,512 | 1,641,071 | |
3,601,227 | |||
Pharmaceuticals 9.0% | |||
Johnson & Johnson | 132,899 | 21,023,293 | |
Merck & Co., Inc. | 252,596 | 33,330,042 | |
Viatris, Inc. | 676,734 | 8,080,204 | |
62,433,539 | |||
Industrials 8.0% | |||
Machinery 7.6% | |||
Caterpillar, Inc. | 14,398 | 5,275,859 | |
Cummins, Inc. | 27,730 | 8,170,645 | |
Deere & Co. | 8,380 | 3,442,001 | |
PACCAR, Inc. | 285,928 | 35,423,620 | |
52,312,125 | |||
Professional Services 0.4% | |||
SS&C Technologies Holdings, Inc. | 45,047 | 2,899,675 | |
Information Technology 24.1% | |||
Communications Equipment 2.6% | |||
Cisco Systems, Inc. | 362,077 | 18,071,263 | |
Electronic Equipment, Instruments & Components 0.8% | |||
Sanmina Corp.* | 88,282 | 5,489,375 | |
IT Services 3.4% | |||
Amdocs Ltd. | 21,778 | 1,968,078 | |
Cognizant Technology Solutions Corp. “A” | 295,016 | 21,621,722 | |
23,589,800 | |||
Semiconductors & Semiconductor Equipment 9.6% | |||
Applied Materials, Inc. | 58,095 | 11,980,932 | |
KLA Corp. | 9,331 | 6,518,357 | |
Microchip Technology, Inc. | 118,570 | 10,636,915 | |
NXP Semiconductors NV | 28,113 | 6,965,558 | |
ON Semiconductor Corp.* | 98,095 | 7,214,887 | |
QUALCOMM, Inc. | 101,286 | 17,147,720 | |
Skyworks Solutions, Inc. | 57,583 | 6,237,390 | |
66,701,759 | |||
Software 0.3% | |||
Gen Digital, Inc. | 75,477 | 1,690,685 | |
DWS CROCI® U.S. Fund | | | 11 |
Shares | Value ($) | ||
Technology Hardware, Storage & Peripherals 7.4% | |||
Apple, Inc. | 96,976 | 16,629,444 | |
Dell Technologies, Inc. “C” | 64,557 | 7,366,599 | |
Hewlett Packard Enterprise Co. | 1,535,294 | 27,220,763 | |
51,216,806 | |||
Materials 3.6% | |||
Chemicals 0.2% | |||
LyondellBasell Industries NV “A” | 16,758 | 1,714,008 | |
Construction Materials 1.1% | |||
CRH PLC | 85,186 | 7,348,145 | |
Metals & Mining 2.3% | |||
Nucor Corp. | 82,107 | 16,248,975 | |
Total Common Stocks (Cost $539,720,173) | 688,563,706 | ||
Cash Equivalents 0.5% | |||
DWS Central Cash Management Government Fund, 5.36% (a) (Cost $3,634,210) | 3,634,210 | 3,634,210 | |
% of Net Assets | Value ($) | ||
Total Investment Portfolio (Cost $543,354,383) | 100.0 | 692,197,916 | |
Other Assets and Liabilities, Net | (0.0 ) | (48,933 ) | |
Net Assets | 100.0 | 692,148,983 |
12 | | | DWS CROCI® U.S. Fund |
Value ($) at 9/30/2023 | Pur- chases Cost ($) | Sales Proceeds ($) | Net Real- ized Gain/ (Loss) ($) | Net Change in Unreal- ized Appreci- ation (Depreci- ation) ($) | Income ($) | Capital Gain Distri- butions ($) | Number of Shares at 3/31/2024 | Value ($) at 3/31/2024 |
Securities Lending Collateral 0.0% | ||||||||
DWS Government & Agency Securities Portfolio “DWS Government Cash Institutional Shares” , 5.26% (a) (b) | ||||||||
— | 0 (c) | — | — | — | 39,654 | — | — | — |
Cash Equivalents 0.5% | ||||||||
DWS Central Cash Management Government Fund, 5.36% (a) | ||||||||
2,152,662 | 27,515,374 | 26,033,826 | — | — | 86,919 | — | 3,634,210 | 3,634,210 |
2,152,662 | 27,515,374 | 26,033,826 | — | — | 126,573 | — | 3,634,210 | 3,634,210 |
* | Non-income producing security. |
(a) | Affiliated fund managed by DWS Investment Management Americas, Inc. The rate shown is the annualized seven-day yield at period end. |
(b) | Represents cash collateral held in connection with securities lending. Income earned by the Fund is net of borrower rebates. |
(c) | Represents the net increase (purchase cost) or decrease (sales proceeds) in the amount invested in cash collateral for the period ended March 31, 2024. |
Assets | Level 1 | Level 2 | Level 3 | Total |
Common Stocks (a) | $688,563,706 | $— | $— | $688,563,706 |
Short-Term Investments | 3,634,210 | — | — | 3,634,210 |
Total | $692,197,916 | $— | $— | $692,197,916 |
(a) | See Investment Portfolio for additional detailed categorizations. |
DWS CROCI® U.S. Fund | | | 13 |
Assets | |
Investments in non-affiliated securities, at value (cost $539,720,173) | $688,563,706 |
Investment in DWS Central Cash Management Government Fund (cost $3,634,210) | 3,634,210 |
Cash | 189,086 |
Receivable for Fund shares sold | 3,290 |
Dividends receivable | 973,552 |
Affiliated securities lending income receivable | 39,568 |
Other assets | 69,978 |
Total assets | 693,473,390 |
Liabilities | |
Payable for Fund shares redeemed | 772,151 |
Accrued management fee | 243,822 |
Accrued Trustees' fees | 1,412 |
Other accrued expenses and payables | 307,022 |
Total liabilities | 1,324,407 |
Net assets, at value | $692,148,983 |
Net Assets Consist of | |
Distributable earnings (loss) | 156,107,549 |
Paid-in capital | 536,041,434 |
Net assets, at value | $692,148,983 |
14 | | | DWS CROCI® U.S. Fund |
Net Asset Value | |
Class A | |
Net Asset Value and redemption price per share ($96,157,390 ÷ 6,760,308 outstanding shares of beneficial interest, $.01 par value, unlimited number of shares authorized) | $14.22 |
Maximum offering price per share (100 ÷ 94.25 of $14.22) | $15.09 |
Class C | |
Net Asset Value, offering and redemption price (subject to contingent deferred sales charge) per share ($1,187,806 ÷ 84,310 outstanding shares of beneficial interest, $.01 par value, unlimited number of shares authorized) | $14.09 |
Class S | |
Net Asset Value, offering and redemption price per share ($589,158,125 ÷ 41,420,805 outstanding shares of beneficial interest, $.01 par value, unlimited number of shares authorized) | $14.22 |
Institutional Class | |
Net Asset Value, offering and redemption price per share ($5,645,662 ÷ 397,151 outstanding shares of beneficial interest, $.01 par value, unlimited number of shares authorized) | $14.22 |
DWS CROCI® U.S. Fund | | | 15 |
Investment Income | |
Income: | |
Dividends (net of foreign taxes withheld of $7,069) | $7,314,937 |
Income distributions — DWS Central Cash Management Government Fund | 86,919 |
Affiliated securities lending income | 39,654 |
Total income | 7,441,510 |
Expenses: | |
Management fee | 1,333,512 |
Administration fee | 304,355 |
Services to shareholders | 372,592 |
Distribution and service fees | 113,342 |
Custodian fee | 629 |
Professional fees | 40,852 |
Reports to shareholders | 27,384 |
Registration fees | 34,603 |
Trustees' fees and expenses | 12,200 |
Other | 22,537 |
Total expenses before expense reductions | 2,262,006 |
Expense reductions | (1,249 ) |
Total expenses after expense reductions | 2,260,757 |
Net investment income | 5,180,753 |
Realized and Unrealized Gain (Loss) | |
Net realized gain (loss) from investments | 19,278,944 |
Change in net unrealized appreciation (depreciation) on investments | 110,111,372 |
Net gain (loss) | 129,390,316 |
Net increase (decrease) in net assets resulting from operations | $134,571,069 |
16 | | | DWS CROCI® U.S. Fund |
Six Months Ended March 31, 2024 | Year Ended September 30, | |
Increase (Decrease) in Net Assets | (Unaudited) | 2023 |
Operations: | ||
Net investment income | $5,180,753 | $9,331,704 |
Net realized gain (loss) | 19,278,944 | (14,459,043 ) |
Change in net unrealized appreciation (depreciation) | 110,111,372 | 111,863,422 |
Net increase (decrease) in net assets resulting from operations | 134,571,069 | 106,736,083 |
Distributions to shareholders: | ||
Class A | (1,154,175 ) | (1,946,057 ) |
Class C | (5,817 ) | (18,316 ) |
Class R | (7,070 )* | (22,887 ) |
Class R6 | (2,970 )* | (6,440 ) |
Class S | (8,755,479 ) | (13,274,302 ) |
Institutional Class | (88,020 ) | (137,869 ) |
Total distributions | (10,013,531 ) | (15,405,871 ) |
Fund share transactions: | ||
Proceeds from shares sold | 5,442,946 | 7,376,294 |
Reinvestment of distributions | 9,594,872 | 14,709,788 |
Payments for shares redeemed | (40,216,485 ) | (64,251,675 ) |
Net increase (decrease) in net assets from Fund share transactions | (25,178,667 ) | (42,165,593 ) |
Increase (decrease) in net assets | 99,378,871 | 49,164,619 |
Net assets at beginning of period | 592,770,112 | 543,605,493 |
Net assets at end of period | $692,148,983 | $592,770,112 |
* | For the period from October 1, 2023 to March 25, 2024 (Class R and Class R6 liquidation date). |
DWS CROCI® U.S. Fund | | | 17 |
DWS CROCI® U.S. Fund — Class A | ||||||
Six Months Ended 3/31/24 | Years Ended September 30, | |||||
(Unaudited) | 2023 | 2022 | 2021 | 2020 | 2019 | |
Selected Per Share Data | ||||||
Net asset value, beginning of period | $11.68 | $9.99 | $12.02 | $9.80 | $11.70 | $11.83 |
Income (loss) from investment operations: | ||||||
Net investment incomea | .09 | .15 | .14 | .18 | .21 | .21 |
Net realized and unrealized gain (loss) | 2.62 | 1.80 | (1.99) | 2.26 | (1.41) | .04 |
Total from investment operations | 2.71 | 1.95 | (1.85) | 2.44 | (1.20) | .25 |
Less distributions from: | ||||||
Net investment income | (.17) | (.14) | (.18) | (.22) | (.19) | (.25) |
Net realized gains | — | (.12) | — | — | (.51) | (.13) |
Total distributions | (.17) | (.26) | (.18) | (.22) | (.70) | (.38) |
Net asset value, end of period | $14.22 | $11.68 | $9.99 | $12.02 | $9.80 | $11.70 |
Total Return (%)b | 23.35 * | 19.68 | (15.76) | 25.24 | (11.40) | 2.61 |
Ratios to Average Net Assets and Supplemental Data | ||||||
Net assets, end of period ($ millions) | 96 | 83 | 78 | 103 | 101 | 132 |
Ratio of expenses (%) | .99 ** | 1.00 | 1.00 | .98 | 1.01 | .99 |
Ratio of net investment income (%) | 1.38 ** | 1.27 | 1.20 | 1.59 | 1.94 | 1.88 |
Portfolio turnover rate (%) | 30 * | 60 | 61 | 108 | 138 | 95 |
a | Based on average shares outstanding during the period. |
b | Total return does not reflect the effect of any sales charges. |
* | Not annualized |
** | Annualized |
18 | | | DWS CROCI® U.S. Fund |
DWS CROCI® U.S. Fund — Class C | ||||||
Six Months Ended 3/31/24 | Years Ended September 30, | |||||
(Unaudited) | 2023 | 2022 | 2021 | 2020 | 2019 | |
Selected Per Share Data | ||||||
Net asset value, beginning of period | $11.52 | $9.86 | $11.84 | $9.66 | $11.55 | $11.68 |
Income (loss) from investment operations: | ||||||
Net investment incomea | .04 | .05 | .05 | .09 | .12 | .12 |
Net realized and unrealized gain (loss) | 2.59 | 1.78 | (1.97) | 2.23 | (1.40) | .05 |
Total from investment operations | 2.63 | 1.83 | (1.92) | 2.32 | (1.28) | .17 |
Less distributions from: | ||||||
Net investment income | (.06) | (.05) | (.06) | (.14) | (.10) | (.17) |
Net realized gains | — | (.12) | — | — | (.51) | (.13) |
Total distributions | (.06) | (.17) | (.06) | (.14) | (.61) | (.30) |
Net asset value, end of period | $14.09 | $11.52 | $9.86 | $11.84 | $9.66 | $11.55 |
Total Return (%)b | 22.88 c* | 18.67 c | (16.31 )c | 24.18 | (12.16 )c | 1.90 |
Ratios to Average Net Assets and Supplemental Data | ||||||
Net assets, end of period ($ millions) | 1 | 1 | 1 | 2 | 2 | 4 |
Ratio of expenses before expense reductions (%) | 1.86 ** | 1.88 | 1.86 | 1.84 | 1.81 | 1.73 |
Ratio of expenses after expense reductions (%) | 1.78 ** | 1.83 | 1.76 | 1.84 | 1.78 | 1.73 |
Ratio of net investment income (%) | .57 ** | .44 | .43 | .78 | 1.15 | 1.11 |
Portfolio turnover rate (%) | 30 * | 60 | 61 | 108 | 138 | 95 |
a | Based on average shares outstanding during the period. |
b | Total return does not reflect the effect of any sales charges. |
c | Total return would have been lower had certain expenses not been reduced. |
* | Not annualized |
** | Annualized |
DWS CROCI® U.S. Fund | | | 19 |
DWS CROCI® U.S. Fund — Class S | ||||||
Six Months Ended 3/31/24 | Years Ended September 30, | |||||
(Unaudited) | 2023 | 2022 | 2021 | 2020 | 2019 | |
Selected Per Share Data | ||||||
Net asset value, beginning of period | $11.70 | $10.01 | $12.04 | $9.82 | $11.73 | $11.86 |
Income (loss) from investment operations: | ||||||
Net investment incomea | .11 | .18 | .18 | .22 | .24 | .25 |
Net realized and unrealized gain (loss) | 2.62 | 1.80 | (1.99) | 2.26 | (1.40) | .03 |
Total from investment operations | 2.73 | 1.98 | (1.81) | 2.48 | (1.16) | .28 |
Less distributions from: | ||||||
Net investment income | (.21) | (.17) | (.22) | (.26) | (.24) | (.28) |
Net realized gains | — | (.12) | — | — | (.51) | (.13) |
Total distributions | (.21) | (.29) | (.22) | (.26) | (.75) | (.41) |
Net asset value, end of period | $14.22 | $11.70 | $10.01 | $12.04 | $9.82 | $11.73 |
Total Return (%) | 23.54 * | 20.06 | (15.47) | 25.63 | (11.08) | 2.98 |
Ratios to Average Net Assets and Supplemental Data | ||||||
Net assets, end of period ($ millions) | 589 | 503 | 458 | 586 | 530 | 660 |
Ratio of expenses (%) | .67 ** | .68 | .67 | .67 | .67 | .67 |
Ratio of net investment income (%) | 1.70 ** | 1.60 | 1.53 | 1.90 | 2.28 | 2.21 |
Portfolio turnover rate (%) | 30 * | 60 | 61 | 108 | 138 | 95 |
a | Based on average shares outstanding during the period. |
* | Not annualized |
** | Annualized |
20 | | | DWS CROCI® U.S. Fund |
DWS CROCI® U.S. Fund — Institutional Class | ||||||
Six Months Ended 3/31/24 | Years Ended September 30, | |||||
(Unaudited) | 2023 | 2022 | 2021 | 2020 | 2019 | |
Selected Per Share Data | ||||||
Net asset value, beginning of period | $11.70 | $10.01 | $12.03 | $9.81 | $11.72 | $11.86 |
Income (loss) from investment operations: | ||||||
Net investment incomea | .11 | .18 | .18 | .22 | .25 | .24 |
Net realized and unrealized gain (loss) | 2.62 | 1.81 | (1.98) | 2.26 | (1.42) | .03 |
Total from investment operations | 2.73 | 1.99 | (1.80) | 2.48 | (1.17) | .27 |
Less distributions from: | ||||||
Net investment income | (.21) | (.18) | (.22) | (.26) | (.23) | (.28) |
Net realized gains | — | (.12) | — | — | (.51) | (.13) |
Total distributions | (.21) | (.30) | (.22) | (.26) | (.74) | (.41) |
Net asset value, end of period | $14.22 | $11.70 | $10.01 | $12.03 | $9.81 | $11.72 |
Total Return (%) | 23.47 b* | 20.07 b | (15.40) | 25.65 b | (11.11 )b | 2.88 b |
Ratios to Average Net Assets and Supplemental Data | ||||||
Net assets, end of period ($ millions) | 6 | 5 | 5 | 7 | 6 | 7 |
Ratio of expenses before expense reductions (%) | .69 ** | .70 | .66 | .67 | .71 | .71 |
Ratio of expenses after expense reductions (%) | .67 ** | .67 | .66 | .67 | .67 | .69 |
Ratio of net investment income (%) | 1.71 ** | 1.61 | 1.53 | 1.91 | 2.32 | 2.14 |
Portfolio turnover rate (%) | 30 * | 60 | 61 | 108 | 138 | 95 |
a | Based on average shares outstanding during the period. |
b | Total return would have been lower had certain expenses not been reduced. |
* | Not annualized |
** | Annualized |
DWS CROCI® U.S. Fund | | | 21 |
22 | | | DWS CROCI® U.S. Fund |
DWS CROCI® U.S. Fund | | | 23 |
24 | | | DWS CROCI® U.S. Fund |
DWS CROCI® U.S. Fund | | | 25 |
First $1.5 billion of the Fund’s average daily net assets | .425% |
Next $500 million of such net assets | .400% |
Next $1.0 billion of such net assets | .375% |
Next $1.0 billion of such net assets | .350% |
Next $1.0 billion of such net assets | .325% |
Over $5.0 billion of such net assets | .300% |
26 | | | DWS CROCI® U.S. Fund |
Class A | 1.03% |
Class C | 1.78% |
Class R | 1.28% |
Class S | .78% |
Institutional Class | .67% |
Class C | $458 |
Class R | 186 |
Institutional Class | 605 |
$1,249 |
DWS CROCI® U.S. Fund | | | 27 |
Services to Shareholders | Total Aggregated | Unpaid at March 31, 2024 |
Class A | $24,969 | $8,499 |
Class C | 593 | 175 |
Class R | 17 | 5 |
Class R6 | 61 | 22 |
Class S | 142,311 | 48,310 |
Institutional Class | 345 | 130 |
$168,296 | $57,141 |
Sub-Recordkeeping | Total Aggregated |
Class A | $48,577 |
Class C | 1,144 |
Class R | 793 |
Class S | 96,382 |
Institutional Class | 2,515 |
$149,411 |
Distribution Fee | Total Aggregated | Unpaid at March 31, 2024 |
Class C | $4,506 | $763 |
Class R | 793 | 89 |
$5,299 | $852 |
28 | | | DWS CROCI® U.S. Fund |
Service Fee | Total Aggregated | Unpaid at March 31, 2024 | Annualized Rate |
Class A | $105,854 | $37,296 | .24% |
Class C | 1,401 | 1,019 | .23% |
Class R | 788 | 282 | .25% |
$108,043 | $38,597 |
DWS CROCI® U.S. Fund | | | 29 |
Six Months Ended March 31, 2024 | Year Ended September 30, 2023 | |||
Shares | Dollars | Shares | Dollars | |
Shares sold | ||||
Class A | 76,052 | $973,777 | 187,379 | $2,154,389 |
Class C | 2,274 | 28,687 | 4,507 | 51,046 |
Class R | 2,979 * | 38,939 * | 3,491 | 38,665 |
Class R6 | 3,346 * | 46,198 * | 619 | 7,025 |
Class S | 320,377 | 3,989,092 | 364,707 | 4,259,533 |
Institutional Class | 30,339 | 366,253 | 74,912 | 865,636 |
$5,442,946 | $7,376,294 | |||
30 | | | DWS CROCI® U.S. Fund |
Six Months Ended March 31, 2024 | Year Ended September 30, 2023 | |||
Shares | Dollars | Shares | Dollars | |
Shares issued to shareholders in reinvestment of distributions | ||||
Class A | 87,165 | $1,103,513 | 170,779 | $1,861,488 |
Class C | 463 | 5,817 | 1,691 | 18,302 |
Class R | 558 * | 7,070 * | 2,098 | 22,887 |
Class R6 | 235 * | 2,970 * | 591 | 6,440 |
Class S | 663,048 | 8,387,550 | 1,162,789 | 12,662,802 |
Institutional Class | 6,958 | 87,952 | 12,672 | 137,869 |
$9,594,872 | $14,709,788 | |||
Shares redeemed | ||||
Class A | (508,544 ) | $(6,455,034 ) | (1,067,923 ) | $(12,192,893 ) |
Class C | (19,176 ) | (250,876 ) | (18,912 ) | (212,377 ) |
Class R | (62,234 )* | (851,324 )* | (47,539 ) | (550,276 ) |
Class R6 | (26,094 )* | (347,750 )* | (74 ) | (795 ) |
Class S | (2,527,888 ) | (31,675,916 ) | (4,333,664 ) | (49,422,519 ) |
Institutional Class | (49,178 ) | (635,585 ) | (159,334 ) | (1,872,815 ) |
$(40,216,485 ) | $(64,251,675 ) | |||
Net increase (decrease) | ||||
Class A | (345,327 ) | $(4,377,744 ) | (709,765 ) | $(8,177,016 ) |
Class C | (16,439 ) | (216,372 ) | (12,714 ) | (143,029 ) |
Class R | (58,697 )* | (805,315 )* | (41,950 ) | (488,724 ) |
Class R6 | (22,513 )* | (298,582 )* | 1,136 | 12,670 |
Class S | (1,544,463 ) | (19,299,274 ) | (2,806,168 ) | (32,500,184 ) |
Institutional Class | (11,881 ) | (181,380 ) | (71,750 ) | (869,310 ) |
$(25,178,667 ) | $(42,165,593 ) | |||
* | For the period from October 1, 2023 to March 25, 2024 (Class R and Class R6 liquidation date). |
DWS CROCI® U.S. Fund | | | 31 |
32 | | | DWS CROCI® U.S. Fund |
DWS CROCI® U.S. Fund | | | 33 |
Actual Fund Return | Class A | Class C | Class S | Institutional Class |
Beginning Account Value 10/1/23 | $1,000.00 | $1,000.00 | $1,000.00 | $1,000.00 |
Ending Account Value 3/31/24 | $1,233.50 | $1,228.80 | $1,235.40 | $1,234.70 |
Expenses Paid per $1,000* | $5.53 | $9.92 | $3.74 | $3.74 |
Hypothetical 5% Fund Return | Class A | Class C | Class S | Institutional Class |
Beginning Account Value 10/1/23 | $1,000.00 | $1,000.00 | $1,000.00 | $1,000.00 |
Ending Account Value 3/31/24 | $1,020.05 | $1,016.10 | $1,021.65 | $1,021.65 |
Expenses Paid per $1,000* | $5.00 | $8.97 | $3.39 | $3.39 |
* | Expenses are equal to the Fund’s annualized expense ratio for each share class, multiplied by the average account value over the period, multiplied by 183 (the number of days in the most recent six-month period), then divided by 366. |
Annualized Expense Ratios | Class A | Class C | Class S | Institutional Class |
DWS CROCI® U.S. Fund | .99% | 1.78% | .67% | .67% |
34 | | | DWS CROCI® U.S. Fund |
DWS CROCI® U.S. Fund | | | 35 |
36 | | | DWS CROCI® U.S. Fund |
DWS CROCI® U.S. Fund | | | 37 |
38 | | | DWS CROCI® U.S. Fund |
DWS CROCI® U.S. Fund | | | 39 |
40 | | | DWS CROCI® U.S. Fund |
For More Information | The automated telephone system allows you to access personalized account information and obtain information on other DWS funds using either your voice or your telephone keypad. Certain account types within Classes A, C and S also have the ability to purchase, exchange or redeem shares using this system. |
For more information, contact your financial representative. You may also access our automated telephone system or speak with a Shareholder Service representative by calling: (800) 728-3337 | |
Web Site | dws.com View your account transactions and balances, trade shares, monitor your asset allocation, subscribe to fund and account updates by e-mail, and change your address, 24 hours a day. |
Obtain prospectuses and applications, news about DWS funds, insight from DWS economists and investment specialists and access to DWS fund account information. | |
Written Correspondence | DWS PO Box 219151 Kansas City, MO 64121-9151 |
Proxy Voting | The Fund’s policies and procedures for voting proxies for portfolio securities and information about how the Fund voted proxies related to its portfolio securities during the most recent 12-month period ended June 30 are available on our Web site — dws.com/en-us/resources/proxy-voting — or on the SEC’s Web site — sec.gov. To obtain a written copy of the Fund’s policies and procedures without charge, upon request, call us toll free at (800) 728-3337. |
Portfolio Holdings | Following the Fund’s fiscal first and third quarter-end, a complete portfolio holdings listing is posted on dws.com and is available free of charge by contacting your financial intermediary or, if you are a direct investor, by calling (800) 728-3337. In addition, the portfolio holdings listing is filed with the SEC on the Fund’s Form N-PORT and will be available on the SEC’s Web site at sec.gov. Additional portfolio holdings for the Fund are also posted on dws.com from time to time. Please see the Fund’s current prospectus for more information. |
Principal Underwriter | If you have questions, comments or complaints, contact: DWS Distributors, Inc. 222 South Riverside Plaza Chicago, IL 60606-5808 (800) 621-1148 |
DWS CROCI® U.S. Fund | | | 41 |
Investment Management | DWS Investment Management Americas, Inc. (“DIMA” or the “Advisor” ), which is part of the DWS Group GmbH & Co. KGaA (“DWS Group” ), is the investment advisor for the Fund. DIMA and its predecessors have more than 90 years of experience managing mutual funds and DIMA provides a full range of investment advisory services to both institutional and retail clients. DIMA is an indirect, wholly owned subsidiary of DWS Group. |
DWS Group is a global organization that offers a wide range of investing expertise and resources, including hundreds of portfolio managers and analysts and an office network that reaches the world’s major investment centers. This well-resourced global investment platform brings together a wide variety of experience and investment insight across industries, regions, asset classes and investing styles. |
Class A | Class C | Class S | Institutional Class | |
Nasdaq Symbol | DCUAX | DCUCX | DCUSX | DCUIX |
CUSIP Number | 25157M 588 | 25157M 570 | 25157M 547 | 25157M 554 |
Fund Number | 1020 | 1320 | 2020 | 1420 |
42 | | | DWS CROCI® U.S. Fund |
| (b) Not applicable | ||
| ITEM 2. | CODE OF ETHICS | |
| Not applicable. | ||
| ITEM 3. | AUDIT COMMITTEE FINANCIAL EXPERT | |
| Not applicable | ||
| ITEM 4. | PRINCIPAL ACCOUNTANT FEES AND SERVICES | |
| Not applicable | ||
| ITEM 5. | AUDIT COMMITTEE OF LISTED REGISTRANTS | |
| Not applicable | ||
| ITEM 6. | INVESTMENTS | |
| Not applicable | ||
| ITEM 7. | DISCLOSURE OF PROXY VOTING POLICIES AND PROCEDURES FOR CLOSED-END MANAGEMENT INVESTMENT COMPANIES | |
| Not applicable | ||
| ITEM 8. | PORTFOLIO MANAGERS OF CLOSED-END MANAGEMENT INVESTMENT COMPANIES | |
| Not applicable | ||
| ITEM 9. | PURCHASES OF EQUITY SECURITIES BY CLOSED-END MANAGEMENT INVESTMENT COMPANY AND AFFILIATED PURCHASERS | |
| Not applicable | ||
| ITEM 10. | SUBMISSION OF MATTERS TO A VOTE OF SECURITY HOLDERS | |
| There were no material changes to the procedures by which shareholders may recommend nominees to the Fund’s Board. The primary function of the Nominating and Governance Committee is to identify and recommend individuals for membership on the Board and oversee the administration of the Board Governance Guidelines. Shareholders may recommend candidates for Board positions by forwarding their correspondence by U.S. mail or courier service to Keith R. Fox, DWS Funds Board Chair, c/o Thomas R. Hiller, Ropes & Gray LLP, Prudential Tower, 800 Boylston Street, Boston, MA 02199-3600. | ||
| ITEM 11. | CONTROLS AND PROCEDURES | |
| (a) | The Chief Executive and Financial Officers concluded that the Registrant’s Disclosure Controls and Procedures are effective based on the evaluation of the Disclosure Controls and Procedures as of a date within 90 days of the filing date of this report. | |
| (b) | There have been no changes in the registrant’s internal control over financial reporting that occurred during the period covered by this report that has materially affected, or is reasonably likely to materially affect, the registrant’s internal controls over financial reporting. | |
| ITEM 12. | Disclosure of Securities Lending Activities for Closed-End Management Investment Companies. | |
| Not applicable | ||
| ITEM 13. | EXHIBITS | |
| (a)(1) | Not applicable | |
| (a)(2) | Certification pursuant to Rule 30a-2(a) under the Investment Company Act of 1940 (17 CFR 270.30a-2(a)) is filed and attached hereto as Exhibit 99.CERT. | |
| (b) | Certification pursuant to Rule 30a-2(b) under the Investment Company Act of 1940 (17 CFR 270.30a-2(b)) is furnished and attached hereto as Exhibit 99.906CERT. | |
SIGNATURES
Pursuant to the requirements of the Securities Exchange Act of 1934 and the Investment Company Act of 1940, the registrant has duly caused this report to be signed on its behalf by the undersigned, thereunto duly authorized.
| Registrant: | DWS CROCI® U.S. Fund, a series of Deutsche DWS Investment Trust |
| By: | /s/Hepsen Uzcan Hepsen Uzcan Principal Executive |
| Date: | 5/30/2024 |
Pursuant to the requirements of the Securities Exchange Act of 1934 and the Investment Company Act of 1940, this report has been signed below by the following persons on behalf of the registrant and in the capacities and on the dates indicated.
| By: | /s/Hepsen Uzcan Hepsen Uzcan Principal Executive |
| Date: | 5/30/2024 |
| By: | /s/Diane Kenneally Diane Kenneally Principal Financial Officer |
| Date: | 5/30/2024 |