UNITED STATES
SECURITIES AND EXCHANGE COMMISSION
Washington, D.C. 20549
FORM N-CSR
CERTIFIED SHAREHOLDER REPORT OF REGISTERED
MANAGEMENT INVESTMENT COMPANIES
Investment Company Act file number 811-6453
Fidelity Court Street Trust II
(Exact name of registrant as specified in charter)
82 Devonshire St., Boston, Massachusetts 02109
(Address of principal executive offices) (Zip code)
Scott C. Goebel, Secretary
82 Devonshire St.
Boston, Massachusetts 02109
(Name and address of agent for service)
Registrant's telephone number, including area code: 617-563-7000
Date of fiscal year end: | November 30 |
| |
Date of reporting period: | November 30, 2012 |
Item 1. Reports to Stockholders
Fidelity®
New Jersey AMT
Tax-Free Money Market Fund -
Fidelity New Jersey AMT Tax-Free
Money Market Fund
Institutional Class
Service Class
Annual Report
November 30, 2012
Contents
Shareholder Expense Example | (Click Here) | An example of shareholder expenses. |
Investment Changes/ Performance | (Click Here) | A summary of major shifts in the fund's investments over the past six months. |
Investments | (Click Here) | A complete list of the fund's investments. |
Financial Statements | (Click Here) | Statements of assets and liabilities, operations, and changes in net assets,
as well as financial highlights. |
Notes | (Click Here) | Notes to the financial statements. |
Report of Independent Registered Public Accounting Firm | (Click Here) | |
Trustees and Officers | (Click Here) | |
Distributions | (Click Here) | |
Board Approval of Investment Advisory Contracts and Management Fees | (Click Here) | |
To view a fund's proxy voting guidelines and proxy voting record for the 12-month period ended June 30, visit http://www.fidelity.com/proxyvotingresults or visit the Securities and Exchange Commission's (SEC) web site at http://www.sec.gov. You may also call 1-800-544-8544 for Fidelity New Jersey AMT Tax-Free Money Market Fund or 1-877-208-0098 for Institutional Class or Service Class of the fund to request a free copy of the proxy voting guidelines.
Standard & Poor's, S&P and S&P 500 are registered service marks of The McGraw-Hill Companies, Inc. and have been licensed for use by Fidelity Distributors Corporation.
Other third party marks appearing herein are the property of their respective owners.
All other marks appearing herein are registered or unregistered trademarks or service marks of FMR LLC or an affiliated company. © 2013 FMR LLC. All rights reserved.
This report and the financial statements contained herein are submitted for the general information of the shareholders of the fund. This report is not authorized for distribution to prospective investors in the fund unless preceded or accompanied by an effective prospectus.
A fund files its complete schedule of portfolio holdings with the SEC for the first and third quarters of each fiscal year on Form N-Q. Forms N-Q are available on the SEC's web site at http://www.sec.gov. A fund's Forms N-Q may be reviewed and copied at the SEC's Public Reference Room in Washington, DC. Information regarding the operation of the SEC's Public Reference Room may be obtained by calling 1-800-SEC-0330. For a complete list of a fund's portfolio holdings, view the most recent holdings listing, semiannual report, or annual report on Fidelity's web site at http://www.fidelity.com, http://www.advisor.fidelity.com, or http://www.401k.com, as applicable.
NOT FDIC INSURED • MAY LOSE VALUE • NO BANK GUARANTEE
Neither the fund nor Fidelity Distributors Corporation is a bank.
Annual Report
Shareholder Expense Example
As a shareholder of the Fund, you incur two types of costs: (1) transaction costs, and (2) ongoing costs, including management fees, distribution and/or service (12b-1) fees and other Fund expenses. This Example is intended to help you understand your ongoing costs (in dollars) of investing in the Fund and to compare these costs with the ongoing costs of investing in other mutual funds.
The Example is based on an investment of $1,000 invested at the beginning of the period and held for the entire period (June 1, 2012 to November 30, 2012).
Actual Expenses
The first line of the accompanying table for each class of the Fund provides information about actual account values and actual expenses. You may use the information in this line, together with the amount you invested, to estimate the expenses that you paid over the period. Simply divide your account value by $1,000.00 (for example, an $8,600 account value divided by $1,000.00 = 8.6), then multiply the result by the number in the first line for a class of the Fund under the heading entitled "Expenses Paid During Period" to estimate the expenses you paid on your account during this period. A small balance maintenance fee of $12.00 that is charged once a year may apply for certain accounts with a value of less than $2,000. This fee is not included in the table below. If it was, the estimate of expenses you paid during the period would be higher, and your ending account value lower, by this amount. In addition, the Fund, as a shareholder in the underlying Fidelity Central Funds, will indirectly bear its pro-rata share of the fees and expenses incurred by the underlying Fidelity Central Funds. These fees and expenses are not included in the Fund's annualized expense ratio used to calculate the expense estimate in the table below.
Hypothetical Example for Comparison Purposes
The second line of the accompanying table for each class of the Fund provides information about hypothetical account values and hypothetical expenses based on a Class' actual expense ratio and an assumed rate of return of 5% per year before expenses, which is not the Class' actual return. The hypothetical account values and expenses may not be used to estimate the actual ending account balance or expenses you paid for the period. You may use this information to compare the ongoing costs of investing in the Fund and other funds. To do so, compare this 5% hypothetical example with the 5% hypothetical examples that appear in the shareholder reports of the other funds. A small balance maintenance fee of $12.00 that is charged once a year may apply for certain accounts with a value of less than $2,000. This fee is not included in the table below. If it was, the estimate of expenses you paid during the period would be higher, and your ending account value lower, by this amount. In addition, the Fund, as a shareholder in the underlying Fidelity Central Funds, will indirectly bear its pro-rata share of the fees and expenses incurred by the underlying Fidelity Central Funds. These fees and expenses are not included in the Fund's annualized expense ratio used to calculate the expense estimate in the table below.
Please note that the expenses shown in the table are meant to highlight your ongoing costs only and do not reflect any transaction costs. Therefore, the second line of the table is useful in comparing ongoing costs only, and will not help you determine the relative total costs of owning different funds.
Annual Report
| Annualized Expense Ratio | Beginning
Account Value
June 1, 2012 | Ending
Account Value
November 30, 2012 | Expenses Paid
During Period*
June 1, 2012 to
November 30, 2012 |
New Jersey AMT Tax-Free Money Market | .21% | | | |
Actual | | $ 1,000.00 | $ 1,000.20 | $ 1.05 ** |
HypotheticalA | | $ 1,000.00 | $ 1,023.95 | $ 1.06 ** |
Institutional Class | .20% | | | |
Actual | | $ 1,000.00 | $ 1,000.20 | $ 1.00 |
HypotheticalA | | $ 1,000.00 | $ 1,024.00 | $ 1.01 |
Service Class | .21% | | | |
Actual | | $ 1,000.00 | $ 1,000.20 | $ 1.05 ** |
HypotheticalA | | $ 1,000.00 | $ 1,023.95 | $ 1.06 ** |
A 5% return per year before expenses
* Expenses are equal to each Class' annualized expense ratio, multiplied by the average account value over the period, multiplied by 183/366 (to reflect the one-half year period).
** If certain fees were not voluntarily waived by Fidelity Management & Research Company (FMR) or its affiliates during the period, the annualized expense ratio and the expenses paid in the actual and hypothetical examples above would have been as follows:
| Annualized Expense Ratio | Expenses Paid |
New Jersey AMT Tax-Free Money Market | .30% | |
Actual | | $ 1.50 |
HypotheticalA | | $ 1.52 |
| | |
Service Class | .45% | |
Actual | | $ 2.25 |
HypotheticalA | | $ 2.28 |
Annual Report
Investment Changes/Performance (Unaudited)
Effective Maturity Diversification |
Days | % of fund's investments 11/30/12 | % of fund's investments 5/31/12 | % of fund's investments 11/30/11 |
1 - 7 | 69.0 | 67.6 | 74.6 |
8 - 30 | 6.2 | 7.7 | 5.4 |
31 - 60 | 5.8 | 5.5 | 0.3 |
61 - 90 | 2.7 | 7.1 | 0.5 |
91 - 180 | 2.6 | 6.1 | 7.8 |
> 180 | 13.7 | 6.0 | 11.4 |
Effective maturity is determined in accordance with the requirements of Rule 2a-7 under the Investment Company Act of 1940. |
Weighted Average Maturity |
| 11/30/12 | 5/31/12 | 11/30/11 |
Fidelity New Jersey AMT Tax-Free Money Market Fund | 49 Days | 36 Days | 46 Days |
New Jersey Tax-Free Money Market Funds Average* | 48 Days | 40 Days | 42 Days |
This is a weighted average of all the maturities of the securities held in a fund. Weighted Average Maturity (WAM) can be used as a measure of sensitivity to interest rate changes and market changes. Generally, the longer the maturity, the greater the sensitivity to such changes. WAM is based on the dollar-weighted average length of time until principal payments must be paid. Depending on the types of securities held in a fund, certain maturity shortening devices (e.g., demand features, interest rate resets, and call options) may be taken into account when calculating the WAM. |
Weighted Average Life |
| 11/30/12 | 5/31/12 | 11/30/11 |
Fidelity New Jersey AMT Tax-Free Money Market Fund | 49 Days | 36 Days | 46 Days |
Weighted Average Life (WAL) is the weighted average of the life of the securities held in a fund or portfolio and can be used as a measure of sensitivity to changes in liquidity and/or credit risk. Generally, the higher the value, the greater the sensitivity. WAL is based on the dollar-weighted average length of time until principal payments must be paid, taking into account any call options exercised by the issuer and any permissible maturity shortening features other than interest rate resets. The difference between WAM and WAL is that WAM takes into account interest rate resets and WAL does not. WAL for money market funds is not the same as WAL of a mortgage- or asset-backed security. |
Asset Allocation (% of fund's net assets) |
As of November 30, 2012 | As of May 31, 2012 |
 | Variable Rate
Demand Notes
(VRDNs) 64.5% | | | Variable Rate
Demand Notes
(VRDNs) 65.0% | |
 | Other Municipal
Debt 30.1% | | | Other Municipal
Debt 28.7% | |
 | Investment
Companies 6.9% | | | Investment
Companies 6.6% | |
 | Net Other Assets (Liabilities) ** (1.5)% | | | Net Other Assets (Liabilities) ** (0.3)% | |

* Source: iMoneyNet, Inc.
** Net Other Assets (Liabilities) are not included in the pie chart.
Current and Historical Seven-Day Yields
| 11/30/12 | 8/31/12 | 5/31/12 | 2/29/12 | 11/28/11 |
| | | | | |
New Jersey AMT
Tax-Free Money Market | 0.01% | 0.01% | 0.01% | 0.01% | 0.01% |
Current and Historical Seven-Day Yields
| 11/30/12 | 8/31/12 | 5/31/12 | 2/29/12 | 11/28/11 |
| | | | | |
Institutional Class | 0.01% | 0.01% | 0.02% | 0.01% | 0.01% |
Current and Historical Seven-Day Yields
| 11/30/12 | 8/31/12 | 5/31/12 | 2/29/12 | 11/28/11 |
| | | | | |
Service Class | 0.01% | 0.01% | 0.01% | 0.01% | 0.01% |
Yield refers to the income paid by the fund over a given period. Yields for money market funds are usually for seven-day periods, as they are here, though they are expressed as annual percentage rates. Past performance is no guarantee of future results. Yield will vary and it's possible to lose money investing in the Fund. A portion of the Fund's expenses was reimbursed and/or waived. Absent such reimbursements and/or waivers the yield for the period ending November 30, 2012, the most recent period shown in the table, would have been -0.09% for New Jersey AMT Tax-Free Money Market, -0.05% for Institutional Class and -0.30% for Service Class.
Annual Report
Investments November 30, 2012
Showing Percentage of Net Assets
Variable Rate Demand Note - 64.5% |
| Principal Amount | | Value |
Delaware - 0.2% |
Delaware Econ. Dev. Auth. Rev. (Delmarva Pwr. & Lt. Co. Proj.) Series 1993 C, 0.33% 12/7/12, VRDN (a) | $ 950,000 | | $ 950,000 |
Florida - 0.4% |
Orange County Indl. Dev. Auth. Indl. Dev. Rev. (Central Florida YMCA Proj.) Series 2002 A, 0.2% 12/7/12, LOC Bank of America NA, VRDN (a) | 1,990,000 | | 1,990,000 |
Louisiana - 0.1% |
Saint James Parish Gen. Oblig. (Nucor Steel Louisiana LLC Proj.) Series 2010 B1, 0.4% 12/7/12, VRDN (a) | 500,000 | | 500,000 |
Minnesota - 0.3% |
St. Paul Port Auth. District Cooling Rev. Series 2009 9BB, 0.2% 12/7/12, LOC Deutsche Bank AG, VRDN (a) | 1,400,000 | | 1,400,000 |
New Jersey - 46.9% |
Garden State Preservation Trust Open Space & Farmland Preservation Participating VRDN Series Putters 2865, 0.17% 12/7/12 (Liquidity Facility JPMorgan Chase Bank) (a)(d) | 4,190,000 | | 4,190,000 |
Hudson County Impt. Auth. Rev. (Essential Purp. Pooled Govt. Ln. Prog.) Series 1986, 0.15% 12/7/12, LOC Bank of New York, New York, VRDN (a) | 27,155,000 | | 27,155,000 |
New Jersey Bldg. Auth. State Bldg. Rev.: | | | |
Series 2003 A1, 0.14% 12/7/12, LOC Barclays Bank PLC, VRDN (a) | 9,000,000 | | 9,000,000 |
Series 2003 A2, 0.14% 12/7/12, LOC Barclays Bank PLC, VRDN (a) | 14,650,000 | | 14,650,000 |
Series 2003 A3, 0.14% 12/7/12, LOC Barclays Bank PLC, VRDN (a) | 7,100,000 | | 7,100,000 |
Series 2003 A4, 0.14% 12/7/12, LOC Barclays Bank PLC, VRDN (a) | 7,500,000 | | 7,500,000 |
New Jersey Econ. Dev. Auth. Econ. Dev. Rev. (Stolt Haven Perth Amboy Proj.) Series 1998 A, 0.18% 12/7/12, LOC Citibank NA, VRDN (a) | 2,000,000 | | 2,000,000 |
New Jersey Econ. Dev. Auth. Natural Gas Facilities Rev. (Natural Gas Co. Proj.) Series 2011 A, 0.18% 12/3/12, VRDN (a) | 3,100,000 | | 3,100,000 |
New Jersey Econ. Dev. Auth. School Facilities Construction Rev. (The Hun School of Princeton Proj.) Series 2004, 0.15% 12/7/12, LOC PNC Bank NA, VRDN (a) | 2,925,000 | | 2,925,000 |
New Jersey Edl. Facilities Auth. Rev. Participating VRDN Series ROC II R 14043, 0.18% 12/7/12 (Liquidity Facility Deutsche Postbank AG) (a)(d) | 5,300,000 | | 5,300,000 |
New Jersey Health Care Facilities Fing. Auth. Rev.: | | | |
(AHS Hosp. Corp. Proj.): | | | |
Series 2008 B, 0.18% 12/7/12, LOC Bank of America NA, VRDN (a) | 24,925,000 | | 24,925,000 |
Variable Rate Demand Note - continued |
| Principal Amount | | Value |
New Jersey - continued |
New Jersey Health Care Facilities Fing. Auth. Rev.: - continued | | | |
(AHS Hosp. Corp. Proj.): | | | |
Series 2008 C, 0.16% 12/7/12, LOC JPMorgan Chase Bank, VRDN (a) | $ 17,100,000 | | $ 17,100,000 |
(East Orange Gen. Hosp. Proj.) Series 2006 A2, 0.15% 12/7/12, LOC PNC Bank NA, VRDN (a) | 1,060,000 | | 1,060,000 |
(Meridian Health Sys. Proj.) Series 2003 A, 0.16% 12/7/12, LOC JPMorgan Chase Bank, VRDN (a) | 13,335,000 | | 13,335,000 |
(Underwood-Memorial Hosp. Proj.) Series 2008, 0.16% 12/7/12, LOC TD Banknorth, NA, VRDN (a) | 24,165,000 | | 24,165,000 |
(Virtua Health Proj.) Series 2009 D, 0.14% 12/7/12, LOC TD Banknorth, NA, VRDN (a) | 800,000 | | 800,000 |
New Jersey Hsg. & Mtg. Fin. Agcy. Multi-family Rev. Series 2008 B, 0.18% 12/7/12, LOC Bank of America NA, VRDN (a) | 9,300,000 | | 9,300,000 |
New Jersey Tpk. Auth. Tpk. Rev. Series 2009 A, 0.16% 12/7/12, LOC JPMorgan Chase Bank, VRDN (a) | 18,800,000 | | 18,800,000 |
New Jersey Trans. Trust Fund Auth.: | | | |
Series 2009 C, 0.14% 12/7/12, LOC Wells Fargo Bank NA, VRDN (a) | 18,890,000 | | 18,890,000 |
Series 2009 D, 0.16% 12/7/12, LOC Wells Fargo Bank NA, VRDN (a) | 12,100,000 | | 12,100,000 |
Rutgers State Univ. Rev. Participating VRDN Series Putters 3445, 0.17% 12/7/12 (Liquidity Facility JPMorgan Chase Bank) (a)(d) | 2,500,000 | | 2,500,000 |
South Jersey Trans. Auth. Trans. Sys. Rev. Series 2009 A3, 0.14% 12/7/12, LOC Wells Fargo Bank NA, VRDN (a) | 14,200,000 | | 14,200,000 |
| | 240,095,000 |
New Jersey/Pennsylvania - 4.0% |
Delaware River Port Auth. Pennsylvania & New Jersey Rev.: | | | |
Series 2008 A, 0.17% 12/7/12, LOC Bank of America NA, VRDN (a) | 14,300,000 | | 14,300,000 |
Series 2010 B, 0.17% 12/7/12, LOC Bank of America NA, VRDN (a) | 6,000,000 | | 6,000,000 |
| | 20,300,000 |
New York - 0.2% |
Dutchess County Indl. Dev. Agcy. Civic Facility Rev. (Lutheran Ctr. at Poughkeepsie, Inc. Proj.) 0.3% 12/7/12, LOC KeyBank NA, VRDN (a) | 100,000 | | 100,000 |
New York Dorm. Auth. Revs. (College of New Rochelle Proj.) Series 2008, 0.25% 12/7/12, LOC RBS Citizens NA, VRDN (a) | 1,000,000 | | 1,000,000 |
| | 1,100,000 |
Variable Rate Demand Note - continued |
| Principal Amount | | Value |
New York & New Jersey - 9.3% |
Port Auth. of New York & New Jersey: | | | |
Participating VRDN: | | | |
Series MS 3264, 0.22% 12/7/12 (Liquidity Facility Morgan Stanley Bank, West Valley City Utah) (a)(d) | $ 7,650,000 | | $ 7,650,000 |
Series Putters 1546, 0.17% 12/7/12 (Liquidity Facility JPMorgan Chase Bank) (a)(d) | 8,385,000 | | 8,385,000 |
Series Putters 3862, 0.17% 12/7/12 (Liquidity Facility JPMorgan Chase Bank) (a)(d) | 1,500,000 | | 1,500,000 |
Series ROC II R 664, 0.17% 12/7/12 (Liquidity Facility Citibank NA) (a)(d) | 4,885,000 | | 4,885,000 |
Series 1992 2, 0.21% 12/31/12, VRDN (a)(e) | 6,900,000 | | 6,900,000 |
Series 1997 1, 0.21% 12/31/12, VRDN (a)(e) | 8,900,000 | | 8,900,000 |
Series 1997 2, 0.21% 12/31/12, VRDN (a)(e) | 9,400,000 | | 9,400,000 |
| | 47,620,000 |
North Carolina - 0.3% |
North Carolina Cap. Facilities Fin. Agcy. Edl. Facilities Rev. (Campbell Univ. Proj.) Series 2009, 0.18% 12/7/12, LOC Branch Banking & Trust Co., VRDN (a) | 975,000 | | 975,000 |
North Carolina Cap. Facilities Fin. Agcy. Rev. (Goodwill Cmnty. Proj.) Series 2002, 0.21% 12/7/12, LOC Bank of America NA, VRDN (a) | 500,000 | | 500,000 |
Parson County Indl. Facilities and Poll. Cont. Fing. Auth. (CertainTeed Gypsum NC, Inc. Proj.) Series 2010, 0.3% 12/7/12, LOC Cr. Industriel et Commercial, VRDN (a) | 200,000 | | 200,000 |
| | 1,675,000 |
Ohio - 0.3% |
Ohio Air Quality Dev. Auth. Rev. (Cincinnati Gas & Elec. Co. Proj.) Series A, 0.37% 12/7/12, VRDN (a) | 1,800,000 | | 1,800,000 |
Puerto Rico - 1.8% |
Puerto Rico Commonwealth Hwy. & Trans. Auth. Trans. Rev. Series 1998 A, 0.14% 12/7/12, LOC Bank of Nova Scotia New York Branch, VRDN (a) | 9,400,000 | | 9,400,000 |
Tennessee - 0.3% |
Clarksville Pub. Bldg. Auth. Rev. (Tennessee Muni. Bond Fund Proj.) Series 2003, 0.21% 12/3/12, LOC Bank of America NA, VRDN (a) | 1,315,000 | | 1,315,000 |
Texas - 0.4% |
Northside Independent School District Participating VRDN Series ROC II R 11965, 0.16% 12/7/12 (Liquidity Facility Citibank NA) (a)(d) | 2,000,000 | | 2,000,000 |
TOTAL VARIABLE RATE DEMAND NOTE | 330,145,000 |
Other Municipal Debt - 30.1% |
| Principal Amount | | Value |
Massachusetts - 0.5% |
Massachusetts Indl. Fin. Agcy. Poll. Cont. Rev. Bonds (New England Pwr. Co. Proj.): | | | |
Series 1992, 0.45% tender 1/9/13, CP mode | $ 800,000 | | $ 800,000 |
Series 1993 B, 0.5% tender 12/14/12, CP mode | 1,600,000 | | 1,600,000 |
| | 2,400,000 |
New Jersey - 23.9% |
Bergen County Gen. Oblig.: | | | |
BAN 0.75% 12/21/12 | 6,800,000 | | 6,802,141 |
Bonds Series 2011 A, 2% 12/1/12 | 750,000 | | 750,000 |
Bernardsville Gen. Oblig. BAN 2% 2/21/13 | 4,113,300 | | 4,127,704 |
Burlington County Bridge Commission Rev. BAN (Solid Waste Proj.) Series 2012, 2% 10/8/13 | 2,000,000 | | 2,025,427 |
Burlington County Gen. Oblig. BAN Series 2012 C, 1.5% 9/6/13 | 8,004,800 | | 8,082,292 |
Cape May Gen. Oblig. BAN 1.5% 7/19/13 | 4,600,000 | | 4,631,740 |
Carteret Gen. Oblig. BAN 1.5% 10/18/13 | 2,018,000 | | 2,030,672 |
Cliffside Park Gen. Oblig. BAN 1.5% 7/24/13 | 2,000,000 | | 2,014,229 |
Denville Township BAN 1.5% 10/17/13 | 1,000,000 | | 1,010,222 |
Englewood Gen. Oblig. BAN Series 2012 A, 1.5% 5/3/13 | 5,700,000 | | 5,722,330 |
Franklin Lakes Gen. Oblig. BAN 1.5% 10/25/13 | 1,000,000 | | 1,010,471 |
Hopatcong Borough Gen. Oblig. BAN 1.5% 8/2/13 | 2,800,000 | | 2,820,870 |
Lacey Township Gen. Oblig. BAN Series 2012 B, 1.25% 7/18/13 | 1,400,000 | | 1,405,232 |
Mahwah Township Gen. Oblig. BAN 1.5% 8/9/13 | 1,400,000 | | 1,412,092 |
Mercer County Gen. Oblig. BAN Series 2012 A, 1.5% 12/5/13 | 7,300,000 | | 7,392,199 |
Middlesex County Gen. Oblig. BAN 1.5% 6/6/13 | 2,281,000 | | 2,294,980 |
Millburn Township Gen. Oblig. BAN 2% 1/11/13 | 4,113,288 | | 4,119,325 |
Morris Township Gen. Oblig. BAN 1.5% 11/15/13 | 3,600,000 | | 3,642,201 |
New Jersey Bldg. Auth. State Bldg. Rev. Bonds Series 2002 B, 5.25% 12/15/12 | 700,000 | | 701,325 |
New Jersey Gen. Oblig. Bonds: | | | |
Series D, 6% 2/15/13 | 3,020,000 | | 3,056,030 |
Series S, 5% 2/15/13 | 3,400,000 | | 3,433,737 |
New Jersey Tobacco Settlement Fing. Corp. Bonds Series 2003: | | | |
6.25% 6/1/13 (Pre-Refunded to 6/1/13 @ 100) | 1,000,000 | | 1,029,782 |
6.375% 6/1/13 (Pre-Refunded to 6/1/13 @ 100) | 1,155,000 | | 1,190,261 |
6.75% 6/1/13 (Pre-Refunded to 6/1/13 @ 100) | 3,600,000 | | 3,717,341 |
7% 6/1/13 (Pre-Refunded to 6/1/13 @ 100) | 1,000,000 | | 1,033,900 |
Other Municipal Debt - continued |
| Principal Amount | | Value |
New Jersey - continued |
New Jersey Trans. Trust Fund Auth. Bonds: | | | |
Series 2001 C, 5.75% 12/15/12 | $ 500,000 | | $ 501,057 |
Series 2005 A, 5.25% 12/15/12 | 4,300,000 | | 4,308,246 |
Series B, 5.25% 12/15/12 | 1,000,000 | | 1,001,954 |
North Brunswick Township Gen. Oblig. BAN Series 2012 A, 1.5% 8/7/13 | 5,778,500 | | 5,829,611 |
Ocean Township Gen. Oblig. BAN Series 2011, 1.5% 12/19/12 | 1,800,000 | | 1,800,863 |
Passaic County Gen. Oblig. BAN Series 2011 C, 2% 12/28/12 | 5,500,000 | | 5,506,667 |
Ramsey School District BAN 1.5% 7/22/13 | 2,500,000 | | 2,511,874 |
Ridgewood Gen. Oblig. BAN 1.5% 6/21/13 | 3,200,000 | | 3,218,149 |
Robbinsville Township Gen. Oblig. BAN Series 2012 A, 1.5% 8/6/13 | 3,700,000 | | 3,729,545 |
Rutgers State Univ. Rev. Series 2012 B, 0.17% 12/6/12, CP | 5,300,000 | | 5,300,000 |
South River Borough Gen. Oblig. BAN Series 2011 A, 1.5% 12/19/12 | 3,200,000 | | 3,201,013 |
Sussex County Gen. Oblig. BAN: | | | |
1.25% 6/28/13 | 3,400,000 | | 3,420,186 |
1.25% 9/17/13 | 1,000,000 | | 1,007,919 |
Township of Lawrence BAN 1.5% 7/26/13 | 1,200,000 | | 1,207,433 |
Union County Gen. Oblig. Bonds: | | | |
Series 2012 A, 2% 3/1/13 | 235,000 | | 235,984 |
Series 2012 C, 2% 3/1/13 | 820,000 | | 823,435 |
Verona Township Gen. Oblig. BAN 1.5% 8/9/13 | 1,598,000 | | 1,610,363 |
West Caldwell Township BAN 1.5% 7/11/13 | 1,810,960 | | 1,821,475 |
| | 122,492,277 |
New York & New Jersey - 5.7% |
Port Auth. of New York & New Jersey: | | | |
Series 2012 B: | | | |
0.19% 2/6/13, CP | 3,400,000 | | 3,400,000 |
0.19% 3/6/13, CP | 1,561,000 | | 1,561,000 |
0.2% 3/1/13, CP | 5,020,000 | | 5,020,000 |
Series B: | | | |
0.18% 12/5/12, CP | 12,330,000 | | 12,330,000 |
0.18% 12/11/12, CP | 7,000,000 | | 7,000,000 |
| | 29,311,000 |
TOTAL OTHER MUNICIPAL DEBT | 154,203,277 |
Investment Company - 6.9% |
| Shares | | Value |
Fidelity Tax-Free Cash Central Fund, 0.16% (b)(c) | 35,223,000 | | $ 35,223,000 |
TOTAL INVESTMENT PORTFOLIO - 101.5% (Cost $519,571,277) | 519,571,277 |
NET OTHER ASSETS (LIABILITIES) - (1.5)% | (7,819,672) |
NET ASSETS - 100% | $ 511,751,605 |
Security Type Abbreviations |
BAN | - | BOND ANTICIPATION NOTE |
CP | - | COMMERCIAL PAPER |
VRDN | - | VARIABLE RATE DEMAND NOTE (A debt instrument that is payable upon demand, either daily, weekly or monthly) |
Legend |
(a) Coupon rates for floating and adjustable rate securities reflect the rates in effect at period end. |
(b) Information in this report regarding holdings by state and security types does not reflect the holdings of the Fidelity Tax-Free Cash Central Fund. |
(c) Affiliated fund that is available only to investment companies and other accounts managed by Fidelity Investments. The rate quoted is the annualized seven-day yield of the fund at period end. A complete unaudited listing of the fund's holdings as of its most recent quarter end is available upon request. In addition, each Fidelity Central Fund's financial statements, which are not covered by the Fund's Report of Independent Registered Public Accounting Firm, are available on the SEC's website or upon request. |
(d) Provides evidence of ownership in one or more underlying municipal bonds. |
(e) Restricted securities - Investment in securities not registered under the Securities Act of 1933 (excluding 144A issues). At the end of the period, the value of restricted securities (excluding 144A issues) amounted to $25,200,000 or 4.9% of net assets. |
Additional information on each restricted holding is as follows: |
Security | Acquisition Date | Cost |
Port Auth. of New York & New Jersey Series: 1992 2, 0.21% 12/31/12, VRDN | 2/14/92 | $ 6,900,000 |
1997 1, 0.21% 12/31/12, VRDN | 8/9/02 | $ 8,900,000 |
1997 2, 0.21% 12/31/12, VRDN | 9/15/97 | $ 9,400,000 |
Affiliated Central Funds |
Information regarding fiscal year to date income earned by the Fund from investments in Fidelity Central Funds is as follows: |
Fund | Income earned |
Fidelity Tax-Free Cash Central Fund | $ 65,097 |
Other Information |
The date shown for securities represents the date when principal payments must be paid, taking into account any call options exercised by the issuer and any permissible maturity shortening features other than interest rate resets. |
All investments are categorized as Level 2 under the Fair Value Hierarchy. The inputs or methodology used for valuing securities may not be an indication of the risk associated with investing in those securities. For more information on valuation inputs, please refer to the Security Valuation section in the accompanying Notes to Financial Statements. |
See accompanying notes which are an integral part of the financial statements.
Annual Report
Statement of Assets and Liabilities
| November 30, 2012 |
| | |
Assets | | |
Investment in securities, at value - See accompanying schedule: Unaffiliated issuers (cost $484,348,277) | $ 484,348,277 | |
Fidelity Central Funds (cost $35,223,000) | 35,223,000 | |
Total Investments (cost $519,571,277) | | $ 519,571,277 |
Cash | | 90,412 |
Receivable for fund shares sold | | 61,322 |
Interest receivable | | 1,200,474 |
Distributions receivable from Fidelity Central Funds | | 5,692 |
Receivable from investment adviser for expense reductions | | 14,204 |
Other receivables | | 1,245 |
Total assets | | 520,944,626 |
| | |
Liabilities | | |
Payable for investments purchased | $ 7,392,199 | |
Payable for fund shares redeemed | 1,617,070 | |
Distributions payable | 343 | |
Accrued management fee | 86,199 | |
Distribution and service plan fees payable | 1 | |
Other affiliated payables | 97,209 | |
Total liabilities | | 9,193,021 |
| | |
Net Assets | | $ 511,751,605 |
Net Assets consist of: | | |
Paid in capital | | $ 511,773,149 |
Accumulated undistributed net realized gain (loss) on investments | | (21,544) |
Net Assets | | $ 511,751,605 |
| | |
New Jersey AMT Tax-Free Money Market:
Net Asset Value, offering price and redemption price per share ($194,183,915 ÷ 193,867,861 shares) | | $ 1.00 |
| | |
Institutional Class:
Net Asset Value, offering price and redemption price per share ($317,500,508 ÷ 317,096,198 shares) | | $ 1.00 |
| | |
Service Class:
Net Asset Value, offering price and redemption price per share ($67,182 ÷ 67,096 shares) | | $ 1.00 |
See accompanying notes which are an integral part of the financial statements.
Annual Report
Statement of Operations
| Year ended November 30, 2012 |
| | |
Investment Income | | |
Interest | | $ 1,151,367 |
Income from Fidelity Central Funds | | 65,097 |
Total income | | 1,216,464 |
| | |
Expenses | | |
Management fee | $ 1,118,769 | |
Transfer agent fees | 388,943 | |
Distribution and service plan fees | 168 | |
Independent trustees' compensation | 2,094 | |
Total expenses before reductions | 1,509,974 | |
Expense reductions | (374,381) | 1,135,593 |
Net investment income (loss) | | 80,871 |
Realized and Unrealized Gain (Loss) Net realized gain (loss) on: | | |
Investment securities: | | |
Unaffiliated issuers | 27,266 | |
Investment not meeting investment restrictions | (654) | |
Payment from investment advisor for loss on investment not meeting investment restrictions | 654 | |
Total net realized gain (loss) | | 27,266 |
Net increase in net assets resulting from operations | | $ 108,137 |
See accompanying notes which are an integral part of the financial statements.
Annual Report
Financial Statements - continued
Statement of Changes in Net Assets
| Year ended
November 30, 2012 | Year ended
November 30, 2011 |
Increase (Decrease) in Net Assets | | |
Operations | | |
Net investment income (loss) | $ 80,871 | $ 235,695 |
Net realized gain (loss) | 27,266 | 2,547 |
Net increase in net assets resulting
from operations | 108,137 | 238,242 |
Distributions to shareholders from net investment income | (76,249) | (235,693) |
Distributions to shareholders from net realized gain | (81,856) | - |
Total distributions | (158,105) | (235,693) |
Share transactions - net increase (decrease) | (103,812,013) | (138,654,229) |
Total increase (decrease) in net assets | (103,861,981) | (138,651,680) |
| | |
Net Assets | | |
Beginning of period | 615,613,586 | 754,265,266 |
End of period | $ 511,751,605 | $ 615,613,586 |
See accompanying notes which are an integral part of the financial statements.
Annual Report
Financial Highlights - New Jersey AMT Tax-Free Money Market
Years ended November 30, | 2012 | 2011 | 2010 | 2009 | 2008 |
Selected Per-Share Data | | | | | |
Net asset value, beginning of period | $ 1.00 | $ 1.00 | $ 1.00 | $ 1.00 | $ 1.00 |
Income from Investment Operations | | | | | |
Net investment income (loss) | - D | - D | - D | .003 | .021 |
Net realized and unrealized gain (loss)D | - | - | - | - | - |
Total from investment operations | - D | - D | - D | .003 | .021 |
Distributions from net investment income | - D | - D | - D | (.003) | (.021) |
Distributions from net realized gain (loss) | -D | - | - | -D | -D |
Total distributions | - D | - D | - D | (.003) | (.021) |
Net asset value, end of period | $ 1.00 | $ 1.00 | $ 1.00 | $ 1.00 | $ 1.00 |
Total Return A | .03% | .01% | .01% | .27% | 2.10% |
Ratios to Average Net Assets B,C | | | | | |
Expenses before reductions | .30% | .30% | .30% | .34% | .31% |
Expenses net of fee waivers, if any | .21% | .23% | .28% | .34% | .31% |
Expenses net of all reductions | .21% | .23% | .28% | .34% | .24% |
Net investment income (loss) | .01% | .01% | .01% | .28% | 2.08% |
Supplemental Data | | | | | |
Net assets, end of period (000 omitted) | $ 194,184 | $ 243,463 | $ 302,325 | $ 433,202 | $ 644,791 |
A Total returns would have been lower if certain expenses had not been reduced during the applicable periods shown.
B Fees and expenses of any underlying Fidelity Central Funds are not included in the Fund's expense ratio. The Fund indirectly bears its proportionate share of the expenses of any underlying Fidelity Central Funds.
C Expense ratios reflect operating expenses of the class. Expenses before reductions do not reflect amounts reimbursed or waived or reductions from expense offset arrangements and do not represent the amount paid by the class during periods when reimbursements, waivers or reductions occur. Expenses net of fee waivers reflect expenses after reimbursement and waivers but prior to reductions from expense offset arrangements. Expenses net of all reductions represent the net expenses paid by the class.
D Amount represents less than $.001 per share.
See accompanying notes which are an integral part of the financial statements.
Annual Report
Financial Highlights - Institutional Class
Years ended November 30, | 2012 | 2011 | 2010 | 2009 | 2008 |
Selected Per-Share Data | | | | | |
Net asset value, beginning of period | $ 1.00 | $ 1.00 | $ 1.00 | $ 1.00 | $ 1.00 |
Income from Investment Operations | | | | | |
Net investment income (loss) | - D | - D | .001 | .004 | .022 |
Net realized and unrealized gain (loss)D | - | - | - | - | - |
Total from investment operations | - D | - D | .001 | .004 | .022 |
Distributions from net investment income | - D | - D | (.001) | (.004) | (.022) |
Distributions from net realized gain (loss) | -D | - | - | -D | -D |
Total distributions | - D | - D | (.001) | (.004) | (.022) |
Net asset value, end of period | $ 1.00 | $ 1.00 | $ 1.00 | $ 1.00 | $ 1.00 |
Total Return A | .03% | .05% | .09% | .37% | 2.20% |
Ratios to Average Net Assets B,C | | | | | |
Expenses before reductions | .25% | .25% | .25% | .29% | .26% |
Expenses net of fee waivers, if any | .20% | .19% | .20% | .24% | .21% |
Expenses net of all reductions | .20% | .19% | .20% | .24% | .14% |
Net investment income (loss) | .02% | .05% | .09% | .38% | 2.18% |
Supplemental Data | | | | | |
Net assets, end of period (000 omitted) | $ 317,501 | $ 372,083 | $ 451,833 | $ 624,266 | $ 842,271 |
A Total returns would have been lower if certain expenses had not been reduced during the applicable periods shown.
B Fees and expenses of any underlying Fidelity Central Funds are not included in the Fund's expense ratio. The Fund indirectly bears its proportionate share of the expenses of any underlying Fidelity Central Funds.
C Expense ratios reflect operating expenses of the class. Expenses before reductions do not reflect amounts reimbursed or waived or reductions from expense offset arrangements and do not represent the amount paid by the class during periods when reimbursements, waivers or reductions occur. Expenses net of fee waivers reflect expenses after reimbursement and waivers but prior to reductions from expense offset arrangements. Expenses net of all reductions represent the net expenses paid by the class.
D Amount represents less than $.001 per share.
See accompanying notes which are an integral part of the financial statements.
Annual Report
Financial Highlights - Service Class
Years ended November 30, | 2012 | 2011 | 2010 | 2009 | 2008 |
Selected Per-Share Data | | | | | |
Net asset value, beginning of period | $ 1.00 | $ 1.00 | $ 1.00 | $ 1.00 | $ 1.00 |
Income from Investment Operations | | | | | |
Net investment income (loss) | - D | - D | - D | .002 | .019 |
Net realized and unrealized gain (loss)D | - | - | - | - | - |
Total from investment operations | - D | - D | - D | .002 | .019 |
Distributions from net investment income | - D | - D | - D | (.002) | (.019) |
Distributions from net realized gain (loss) | -D | - | - | -D | -D |
Total distributions | - D | - D | - D | (.002) | (.019) |
Net asset value, end of period | $ 1.00 | $ 1.00 | $ 1.00 | $ 1.00 | $ 1.00 |
Total Return A | .03% | .01% | .01% | .17% | 1.95% |
Ratios to Average Net Assets B,C | | | | | |
Expenses before reductions | .50% | .50% | .50% | .55% | .51% |
Expenses net of fee waivers, if any | .21% | .24% | .28% | .46% | .46% |
Expenses net of all reductions | .21% | .24% | .28% | .46% | .39% |
Net investment income (loss) | .01% | .01% | .01% | .17% | 1.93% |
Supplemental Data | | | | | |
Net assets, end of period (000 omitted) | $ 67 | $ 67 | $ 107 | $ 129 | $ 261 |
A Total returns would have been lower if certain expenses had not been reduced during the applicable periods shown.
B Fees and expenses of any underlying Fidelity Central Funds are not included in the Fund's expense ratio. The Fund indirectly bears its proportionate share of the expenses of any underlying Fidelity Central Funds.
C Expense ratios reflect operating expenses of the class. Expenses before reductions do not reflect amounts reimbursed or waived or reductions from expense offset arrangements and do not represent the amount paid by the class during periods when reimbursements, waivers or reductions occur. Expenses net of fee waivers reflect expenses after reimbursement and waivers but prior to reductions from expense offset arrangements. Expenses net of all reductions represent the net expenses paid by the class.
D Amount represents less than $.001 per share.
See accompanying notes which are an integral part of the financial statements.
Annual Report
Notes to Financial Statements
For the period ended November 30, 2012
1. Organization.
Fidelity New Jersey AMT Tax-Free Money Market Fund (the Fund) is a fund of Fidelity Court Street Trust II (the Trust) and is authorized to issue an unlimited number of shares. The Trust is registered under the Investment Company Act of 1940, as amended (the 1940 Act), as an open-end management investment company organized as a Delaware statutory trust. The Fund offers New Jersey AMT Tax-Free Money Market, Institutional Class and Service Class shares, each of which has equal rights as to assets and voting privileges. Each class has exclusive voting rights with respect to matters that affect that class. Investment income, realized and unrealized capital gains and losses, the common expenses of the Fund, and certain fund-level expense reductions, if any, are allocated on a pro-rata basis to each class based on the relative net assets of each class to the total net assets of the Fund. Each class differs with respect to transfer agent and distribution and service plan fees incurred. Certain expense reductions may also differ by class. The Fund may be affected by economic and political developments in the state of New Jersey.
2. Investments in Fidelity Central Funds.
The Fund invests in Fidelity Central Funds, which are open-end investment companies available only to other investment companies and accounts managed by Fidelity Management & Research Company (FMR) and its affiliates. The Fund's Schedule of Investments lists each of the Fidelity Central Funds held as of period end, if any, as an investment of the Fund, but does not include the underlying holdings of each Fidelity Central Fund. As an Investing Fund, the Fund indirectly bears its proportionate share of the expenses of the underlying Fidelity Central Funds.
The Money Market Central Funds seek preservation of capital and current income and are managed by Fidelity Investments Money Management, Inc. (FIMM), an affiliate of FMR.
A complete unaudited list of holdings for each Fidelity Central Fund is available upon request or at the Securities and Exchange Commission (the SEC) website at www.sec.gov. In addition, the financial statements of the Fidelity Central Funds, which are not covered by the Fund's Report of Independent Registered Public Accounting Firm, are available on the SEC website or upon request.
Annual Report
3. Significant Accounting Policies.
The financial statements have been prepared in conformity with accounting principles generally accepted in the United States of America (GAAP), which require management to make certain estimates and assumptions at the date of the financial statements. Actual results could differ from those estimates. Subsequent events, if any, through the date that the financial statements were issued have been evaluated in the preparation of the financial statements. The following summarizes the significant accounting policies of the Fund:
Security Valuation. The Fund categorizes the inputs to valuation techniques used to value its investments into a disclosure hierarchy consisting of three levels as shown below:
Level 1 - quoted prices in active markets for identical investments
Level 2 - other significant observable inputs (including quoted prices for similar investments, interest rates, prepayment speeds, etc.)
Level 3 - unobservable inputs (including the Fund's own assumptions based on the best information available)
As permitted by compliance with certain conditions under Rule 2a-7 of the 1940 Act, securities are valued at amortized cost, which approximates fair value. The amortized cost of an instrument is determined by valuing it at its original cost and thereafter amortizing any discount or premium from its face value at a constant rate until maturity. Securities held by a money market fund are generally high quality and liquid; however, they are reflected as Level 2 because the inputs used to determine fair value are not quoted prices in an active market.
Investment Transactions and Income. The net asset value per share for processing shareholder transactions is calculated as of the close of business of the New York Stock Exchange (NYSE), normally 4:00 p.m. Eastern time. Security transactions, including the Fund's investment activity in the Fidelity Central Funds, are accounted for as of trade date. Gains and losses on securities sold are determined on the basis of identified cost. Interest income and distributions from the Fidelity Central Funds are accrued as earned. Interest income includes coupon interest and amortization of premium and accretion of discount on debt securities.
Expenses. Expenses directly attributable to a fund are charged to that fund. Expenses attributable to more than one fund are allocated among the respective funds on the basis of relative net assets or other appropriate methods. Expense estimates are accrued in the period to which they relate and adjustments are made when actual amounts are known.
Annual Report
Notes to Financial Statements - continued
3. Significant Accounting Policies - continued
Income Tax Information and Distributions to Shareholders. Each year, the Fund intends to qualify as a regulated investment company under Subchapter M of the Internal Revenue Code, including distributing substantially all of its taxable income and realized gains. As a result, no provision for income taxes is required. As of November 30, 2012, the Fund did not have any unrecognized tax benefits in the financial statements; nor is the Fund aware of any tax positions for which it is reasonably possible that the total amounts of unrecognized tax benefits will significantly change in the next twelve months. The Fund files a U.S. federal tax return, in addition to state and local tax returns as required. A fund's federal income tax returns are subject to examination by the Internal Revenue Service (IRS) for a period of three fiscal years after they are filed. State and local tax returns may be subject to examination for an additional fiscal year depending on the jurisdiction.
Dividends are declared and recorded daily and paid monthly from net investment income. Distributions from realized gains, if any, are declared and recorded on the ex-dividend date. Income dividends and capital gain distributions are declared separately for each class. Income and capital gain distributions are determined in accordance with income tax regulations, which may differ from GAAP.
Capital accounts within the financial statements are adjusted for permanent book-tax differences. These adjustments have no impact on net assets or the results of operations. Temporary book-tax differences will reverse in a subsequent period.
Book-tax differences are primarily due to deferred trustees compensation and capital loss carryforwards.
The Fund purchases municipal securities whose interest, in the opinion of the issuer, is free from federal income tax. There is no assurance that the IRS will agree with this opinion. In the event the IRS determines that the issuer does not comply with relevant tax requirements, interest payments from a security could become federally taxable, possibly retroactively to the date the security was issued.
The federal tax cost of investment securities and unrealized appreciation (depreciation) as of period end were as follows:
Gross unrealized appreciation | $ - |
Gross unrealized depreciation | - |
Net unrealized appreciation (depreciation) on securities and other investments | $ - |
| |
Tax Cost | $ 519,571,277 |
Annual Report
3. Significant Accounting Policies - continued
Income Tax Information and Distributions to Shareholders - continued
The tax-based components of distributable earnings as of period end were as follows:
Undistributed tax-exempt income | $ 2,038 |
Capital loss carryforward | $ (23,325) |
Capital loss carryforwards are only available to offset future capital gains of the Fund to the extent provided by regulations and may be limited. Under the Regulated Investment Company Modernization Act of 2010 (the Act), the Fund is permitted to carry forward capital losses incurred in taxable years beginning after December 22, 2010 for an unlimited period and such capital losses are required to be used prior to any losses that expire. Capital loss carryforwards were as follows:
Fiscal year of expiration | |
2017 | $ (21,927) |
2018 | (1,398) |
Total capital loss carryforward | $ (23,325) |
The tax character of distributions paid was as follows:
| November 30, 2012 | November 30, 2011 |
Tax-exempt Income | $ 76,249 | $ 235,693 |
Long-term Capital Gains | 81,856 | - |
Total | $ 158,105 | $ 235,693 |
Restricted Securities. The Fund may invest in securities that are subject to legal or contractual restrictions on resale. These securities generally may be resold in transactions exempt from registration or to the public if the securities are registered. Disposal of these securities may involve time-consuming negotiations and expense, and prompt sale at an acceptable price may be difficult. Information regarding restricted securities is included at the end of the Fund's Schedule of Investments.
Annual Report
Notes to Financial Statements - continued
4. Fees and Other Transactions with Affiliates.
Management Fee and Expense Contract. FMR and its affiliates provide the Fund with investment management related services for which the Fund pays a monthly management fee that is based on an annual rate of .20% of the Fund's average net assets. Under the management contract, FMR pays all other fund-level expenses, except the compensation of the independent Trustees and certain other expenses such as interest expense. The management fee paid to FMR by the Fund is reduced by an amount equal to the fees and expenses paid by the Fund to the independent Trustees.
In addition, under the expense contract, FMR pays class level expenses for New Jersey AMT Tax-Free Money Market so that the total expenses do not exceed .35%, expressed as a percentage of class average net assets, with certain exceptions such as interest expense.
Distribution and Service Plan Fees. In accordance with Rule 12b-1 of the 1940 Act, the Fund has adopted separate Distribution and Service Plans for each class of shares. Service Class pays Fidelity Distributors Corporation (FDC), an affiliate of FMR, a Service Fee based on an annual percentage of Service Class' average net assets. In addition, FDC may pay financial intermediaries for selling shares of the Fund and providing shareholder support services. For the period, the Service Fee rate, total service fees and amounts retained by FDC were as follows:
| Service
Fee | Total Fees | Retained
by FDC |
Service Class | .25% | $ 168 | $ 12 |
During the period, FMR or its affiliates waived a portion of these fees.
Transfer Agent and Accounting Fees. Citibank, N.A. (Citibank) is the custodian, transfer agent, and servicing agent for the Fund. Citibank has entered into a sub-arrangement with Fidelity Investments Institutional Operations Company, Inc. (FIIOC), an affiliate of FMR, under which FIIOC performs the activities associated with the Fund's transfer agency, dividend disbursing and shareholder servicing functions. FIIOC pays for typesetting, printing and mailing of shareholder reports, except proxy statements. The transfer agent fee for each class is paid to Citibank. For the period, transfer agent fees for each class were as follows:
| Amount | % of
Average
Net Assets |
New Jersey AMT Tax-Free Money Market | $ 217,748 | .10 |
Institutional Class | 171,159 | .05 |
Service Class | 36 | .05 |
| $ 388,943 | |
Annual Report
4. Fees and Other Transactions with Affiliates - continued
Transfer Agent and Accounting Fees - continued
During the period, FMR or its affiliates waived a portion of these fees.
Citibank also has a sub-arrangement with Fidelity Service Company, Inc. (FSC), an affiliate of FMR, under which FSC maintains the Fund's accounting records. The fee is paid to Citibank and is based on the level of average net assets for each month.
Other
The Fund realized a loss on the sale of an investment not meeting the investment restrictions of the Fund. The loss was fully reimbursed by the Fund's investment advisor.
5. Expense Reductions.
FMR contractually agreed to reimburse Institutional Class and Service Class to the extent annual operating expenses, expressed as a percentage of each class' average net assets, exceed .20% and .45%, respectively. Some expenses, for example interest expense, are excluded from this reimbursement. During the period, this reimbursement reduced Institutional Class and Service Class expenses by $171,069 and $35, respectively.
Additionally, FMR or its affiliates voluntarily agreed to waive certain fees in order to maintain a minimum annualized yield of .01%. Such arrangements may be discontinued by FMR at any time. For the period, the amount of the waiver for each class was as follows:
| Amount |
New Jersey AMT Tax-Free Money Market | $ 202,374 |
Service Class | 163 |
In addition, through arrangements with the Fund's custodian, credits realized as a result of uninvested cash balances were used to reduce the Fund's expenses. During the period, these credits reduced the Fund's expenses by $740.
Annual Report
Notes to Financial Statements - continued
6. Distributions to Shareholders.
Distributions to shareholders of each class were as follows:
Years ended November 30, | 2012 | 2011 |
From net investment income | | |
New Jersey AMT Tax-Free Money Market | $ 21,813 | $ 33,638 |
Institutional Class | 54,429 | 202,045 |
Service Class | 7 | 10 |
Total | $ 76,249 | $ 235,693 |
From net realized gain | | |
New Jersey AMT Tax-Free Money Market | $ 31,506 | $ - |
Institutional Class | 50,340 | - |
Service Class | 10 | - |
Total | $ 81,856 | $ - |
7. Share Transactions.
Transactions for each class of shares at a $1.00 per share were as follows:
Years ended November 30, | 2012 | 2011 |
New Jersey AMT Tax-Free Money Market
Shares sold | 40,311,655 | 60,362,902 |
Reinvestment of distributions | 49,869 | 31,026 |
Shares redeemed | (89,600,094) | (119,239,372) |
Net increase (decrease) | (49,238,570) | (58,845,444) |
Institutional Class
Shares sold | 29,156,180 | 39,586,079 |
Reinvestment of distributions | 98,458 | 182,556 |
Shares redeemed | (83,828,098) | (119,537,886) |
Net increase (decrease) | (54,573,460) | (79,769,251) |
Service Class
Shares sold | - | 129,173 |
Reinvestment of distributions | 17 | 10 |
Shares redeemed | - | (168,717) |
Net increase (decrease) | 17 | (39,534) |
8. Other.
The Fund's organizational documents provide former and current trustees and officers with a limited indemnification against liabilities arising in connection with the performance of their duties to the Fund. In the normal course of business, the Fund may also enter into contracts that provide general indemnifications. The Fund's maximum exposure under these arrangements is unknown as this would be dependent on future claims that may be made against the Fund. The risk of material loss from such claims is considered remote.
Annual Report
To the Trustees of Fidelity Court Street Trust II and the Shareholders of Fidelity New Jersey AMT Tax-Free Money Market Fund:
In our opinion, the accompanying statement of assets and liabilities, including the schedule of investments, and the related statements of operations and of changes in net assets and the financial highlights present fairly, in all material respects, the financial position of Fidelity New Jersey AMT Tax-Free Money Market Fund (a fund of Fidelity Court Street Trust II) at November 30, 2012, the results of its operations for the year then ended, the changes in its net assets for each of the two years in the period then ended and the financial highlights for each of the five years in the period then ended, in conformity with accounting principles generally accepted in the United States of America. These financial statements and financial highlights (hereafter referred to as "financial statements") are the responsibility of the Fidelity New Jersey AMT Tax-Free Money Market Fund's management. Our responsibility is to express an opinion on these financial statements based on our audits. We conducted our audits of these financial statements in accordance with the standards of the Public Company Accounting Oversight Board (United States). Those standards require that we plan and perform the audit to obtain reasonable assurance about whether the financial statements are free of material misstatement. An audit includes examining, on a test basis, evidence supporting the amounts and disclosures in the financial statements, assessing the accounting principles used and significant estimates made by management, and evaluating the overall financial statement presentation. We believe that our audits, which included confirmation of securities at November 30, 2012 by correspondence with the custodian and brokers, provide a reasonable basis for our opinion.
PricewaterhouseCoopers LLP
Boston, Massachusetts
January 14, 2013
Annual Report
The Trustees, Member of the Advisory Board, and executive officers of the trust and fund, as applicable, are listed below. The Board of Trustees governs the fund and is responsible for protecting the interests of shareholders. The Trustees are experienced executives who meet periodically throughout the year to oversee the fund's activities, review contractual arrangements with companies that provide services to the fund, oversee management of the risks associated with such activities and contractual arrangements, and review the fund's performance. Except for James C. Curvey, each of the Trustees oversees 218 funds advised by FMR or an affiliate. Mr. Curvey oversees 454 funds advised by FMR or an affiliate.
The Trustees hold office without limit in time except that (a) any Trustee may resign; (b) any Trustee may be removed by written instrument, signed by at least two-thirds of the number of Trustees prior to such removal; (c) any Trustee who requests to be retired or who has become incapacitated by illness or injury may be retired by written instrument signed by a majority of the other Trustees; and (d) any Trustee may be removed at any special meeting of shareholders by a two-thirds vote of the outstanding voting securities of the trust. Each Trustee who is not an interested person (as defined in the 1940 Act) (Independent Trustee), shall retire not later than the last day of the month in which his or her 75th birthday occurs. The Independent Trustees may waive this mandatory retirement age policy with respect to individual Trustees. The executive officers and Advisory Board Member hold office without limit in time, except that any officer and Advisory Board Member may resign or may be removed by a vote of a majority of the Trustees at any regular meeting or any special meeting of the Trustees. Except as indicated, each individual has held the office shown or other offices in the same company for the past five years.
Experience, Skills, Attributes, and Qualifications of the Fund's Trustees. The Governance and Nominating Committee has adopted a statement of policy that describes the experience, qualifications, attributes, and skills that are necessary and desirable for potential Independent Trustee candidates (Statement of Policy). The Board believes that each Trustee satisfied at the time he or she was initially elected or appointed a Trustee, and continues to satisfy, the standards contemplated by the Statement of Policy. The Governance and Nominating Committee also engages professional search firms to help identify potential Independent Trustee candidates who have the experience, qualifications, attributes, and skills consistent with the Statement of Policy. From time to time, additional criteria based on the composition and skills of the current Independent Trustees, as well as experience or skills that may be appropriate in light of future changes to board composition, business conditions, and regulatory or other developments, have also been considered by the professional search firms and the Governance and Nominating Committee. In addition, the Board takes into account the Trustees' commitment and participation in Board and committee meetings, as well as their leadership of standing and ad hoc committees throughout their tenure.
In determining that a particular Trustee was and continues to be qualified to serve as a Trustee, the Board has considered a variety of criteria, none of which, in isolation, was controlling. The Board believes that, collectively, the Trustees have balanced and diverse experience, qualifications, attributes, and skills, which allow the Board to operate effectively in governing the fund and protecting the interests of shareholders. Information about the specific experience, skills, attributes, and qualifications of each Trustee, which in each case led to the Board's conclusion that the Trustee should serve (or continue to serve) as a trustee of the fund, is provided below.
Annual Report
Board Structure and Oversight Function. Abigail P. Johnson is an interested person (as defined in the 1940 Act) and currently serves as Chairman. The Trustees have determined that an interested Chairman is appropriate and benefits shareholders because an interested Chairman has a personal and professional stake in the quality and continuity of services provided to the fund. Independent Trustees exercise their informed business judgment to appoint an individual of their choosing to serve as Chairman, regardless of whether the Trustee happens to be independent or a member of management. The Independent Trustees have determined that they can act independently and effectively without having an Independent Trustee serve as Chairman and that a key structural component for assuring that they are in a position to do so is for the Independent Trustees to constitute a substantial majority for the Board. The Independent Trustees also regularly meet in executive session. Albert R. Gamper, Jr. serves as Chairman of the Independent Trustees and as such (i) acts as a liaison between the Independent Trustees and management with respect to matters important to the Independent Trustees and (ii) with management prepares agendas for Board meetings.
Fidelity funds are overseen by different Boards of Trustees. The fund's Board oversees Fidelity's investment-grade bond, money market, and asset allocation funds and another Board oversees Fidelity's equity and high income funds. The asset allocation funds may invest in Fidelity funds that are overseen by such other Board. The use of separate Boards, each with its own committee structure, allows the Trustees of each group of Fidelity funds to focus on the unique issues of the funds they oversee, including common research, investment, and operational issues. On occasion, the separate Boards establish joint committees to address issues of overlapping consequences for the Fidelity funds overseen by each Board.
The Trustees operate using a system of committees to facilitate the timely and efficient consideration of all matters of importance to the Trustees, the fund, and fund shareholders and to facilitate compliance with legal and regulatory requirements and oversight of the fund's activities and associated risks. The Board, acting through its committees, has charged FMR and its affiliates with (i) identifying events or circumstances the occurrence of which could have demonstrably adverse effects on the fund's business and/or reputation; (ii) implementing processes and controls to lessen the possibility that such events or circumstances occur or to mitigate the effects of such events or circumstances if they do occur; and (iii) creating and maintaining a system designed to evaluate continuously business and market conditions in order to facilitate the identification and implementation processes described in (i) and (ii) above. Because the day-to-day operations and activities of the fund are carried out by or through FMR, its affiliates and other service providers, the fund's exposure to risks is mitigated but not eliminated by the processes overseen by the Trustees. While each of the Board's committees has responsibility for overseeing different aspects of the fund's activities, oversight is exercised primarily through the Operations and Audit Committees. In addition, an ad hoc Board committee of Independent Trustees has worked with FMR to enhance the Board's oversight of investment and financial risks, legal and regulatory risks, technology risks, and operational risks, including the development of additional risk reporting to the Board. The Operations Committee also worked and continues to work with FMR to enhance the stress tests required under SEC regulations for money market funds. Appropriate personnel, including but not limited to the fund's Chief Compliance Officer (CCO), FMR's internal auditor, the independent accountants, the fund's Treasurer and portfolio management personnel, make periodic reports to the Board's committees, as appropriate, including an annual review of FMR's risk management program for the Fidelity funds. The responsibilities of each standing committee, including their oversight responsibilities, are described further under "Standing Committees of the Fund's Trustees."
Annual Report
Trustees and Officers - continued
The fund's Statement of Additional Information (SAI) includes more information about the Trustees. To request a free copy, call Fidelity at 1-800-544-8544 for Fidelity New Jersey AMT Tax-Free Money Market Fund, or 1-877-208-0098 for Institutional Class or Service Class.
Interested Trustees*:
Correspondence intended for each Trustee who is an interested person may be sent to Fidelity Investments, 82 Devonshire Street, Boston, Massachusetts 02109.
Name, Age; Principal Occupations and Other Relevant Experience+ |
Abigail P. Johnson (50) |
| Year of Election or Appointment: 2009 Ms. Johnson is Trustee and Chairman of the Board of Trustees of certain Trusts. Ms. Johnson serves as President of Fidelity Financial Services (2012-present) and President of Personal, Workplace and Institutional Services (2005-present). Ms. Johnson is Chairman and Director of FMR Co., Inc. (2011-present), Chairman and Director of FMR (2011-present), and the Vice Chairman and Director (2007-present) of FMR LLC. Previously, Ms. Johnson served as President and a Director of FMR (2001-2005), a Trustee of other investment companies advised by FMR, Fidelity Investments Money Management, Inc., and FMR Co., Inc. (2001-2005), Senior Vice President of the Fidelity funds (2001-2005), and managed a number of Fidelity funds. Ms. Abigail P. Johnson and Mr. Arthur E. Johnson are not related. |
James C. Curvey (77) |
| Year of Election or Appointment: 2008 Mr. Curvey also serves as Trustee (2007-present) of other investment companies advised by FMR. Mr. Curvey is a Director of Fidelity Investments Money Management, Inc. (2009-present), Director of Fidelity Research & Analysis Co. (2009-present) and Director of FMR and FMR Co., Inc. (2007-present). Mr. Curvey is also Vice Chairman (2007-present) and Director of FMR LLC. In addition, Mr. Curvey serves as an Overseer for the Boston Symphony Orchestra and a member of the Trustees of Villanova University. Previously, Mr. Curvey was the Vice Chairman (2006-2007) and Director (2000-2007) of FMR Corp. |
* Trustees have been determined to be "Interested Trustees" by virtue of, among other things, their affiliation with the trust or various entities under common control with FMR.
+ The information above includes each Trustee's principal occupation during the last five years and other information relating to the experience, attributes, and skills relevant to each Trustee's qualifications to serve as a Trustee, which led to the conclusion that each Trustee should serve as a Trustee for the fund.
Independent Trustees:
Correspondence intended for each Independent Trustee (that is, the Trustees other than the Interested Trustees) may be sent to Fidelity Investments, P.O. Box 55235, Boston, Massachusetts 02205-5235.
Name, Age; Principal Occupations and Other Relevant Experience+ |
Albert R. Gamper, Jr. (70) |
| Year of Election or Appointment: 2006 Mr. Gamper is Chairman of the Independent Trustees of the Fixed Income and Asset Allocation Funds (2012-present). Prior to his retirement in December 2004, Mr. Gamper served as Chairman of the Board of CIT Group Inc. (commercial finance). During his tenure with CIT Group Inc. Mr. Gamper served in numerous senior management positions, including Chairman (1987-1989; 1999-2001; 2002-2004), Chief Executive Officer (1987-2004), and President (2002-2003). Mr. Gamper currently serves as a member of the Board of Directors of Public Service Enterprise Group (utilities, 2000-present), a member of the Board of Trustees, Rutgers University (2004-present), and Chairman of the Board of Barnabas Health Care System. Previously, Mr. Gamper served as Vice Chairman of the Independent Trustees of the Fixed Income and Asset Allocation Funds (2011-2012) and as Chairman of the Board of Governors, Rutgers University (2004-2007). |
Robert F. Gartland (60) |
| Year of Election or Appointment: 2010 Mr. Gartland is Chairman and an investor in Gartland and Mellina Group Corp. (consulting, 2009-present). Previously, Mr. Gartland served as a partner and investor of Vietnam Partners LLC (investments and consulting, 2008-2011). Prior to his retirement, Mr. Gartland held a variety of positions at Morgan Stanley (financial services, 1979-2007) including Managing Director (1987-2007). |
Arthur E. Johnson (65) |
| Year of Election or Appointment: 2008 Mr. Johnson serves as a member of the Board of Directors of Eaton Corporation (diversified power management, 2009-present), AGL Resources, Inc. (holding company, 2002-present) and Booz Allen Hamilton (management consulting, 2011-present). Prior to his retirement, Mr. Johnson served as Senior Vice President of Corporate Strategic Development of Lockheed Martin Corporation (defense contractor, 1999-2009). He previously served on the Board of Directors of IKON Office Solutions, Inc. (1999-2008) and Delta Airlines (2005-2007). Mr. Arthur E. Johnson is not related to Ms. Abigail P. Johnson. |
Michael E. Kenneally (58) |
| Year of Election or Appointment: 2009 Previously, Mr. Kenneally served as a Member of the Advisory Board for certain Fidelity Fixed Income and Asset Allocation Funds (2008-2009). Prior to his retirement, Mr. Kenneally served as Chairman and Global Chief Executive Officer of Credit Suisse Asset Management (2003-2005). Mr. Kenneally was a Director of the Credit Suisse Funds (U.S. mutual funds, 2004-2008) and certain other closed-end funds (2004-2005) and was awarded the Chartered Financial Analyst (CFA) designation in 1991. |
James H. Keyes (72) |
| Year of Election or Appointment: 2007 Mr. Keyes serves as a member of the Boards of Navistar International Corporation (manufacture and sale of trucks, buses, and diesel engines, since 2002) and Pitney Bowes, Inc. (integrated mail, messaging, and document management solutions, since 1998). Prior to his retirement, Mr. Keyes served as Chairman and Chief Executive Officer of Johnson Controls (automotive, building, and energy, 1998-2002) and as a member of the Board of LSI Logic Corporation (semiconductor technologies, 1984-2008). |
Marie L. Knowles (66) |
| Year of Election or Appointment: 2001 Ms. Knowles is Vice Chairman of the Independent Trustees of the Fixed Income and Asset Allocation Funds (2012-present). Prior to Ms. Knowles' retirement in June 2000, she served as Executive Vice President and Chief Financial Officer of Atlantic Richfield Company (ARCO) (diversified energy, 1996-2000). From 1993 to 1996, she was a Senior Vice President of ARCO and President of ARCO Transportation Company. She served as a Director of ARCO from 1996 to 1998. Ms. Knowles currently serves as a Director and Chairman of the Audit Committee of McKesson Corporation (healthcare service, since 2002). Ms. Knowles is an Honorary Trustee of the Brookings Institution and a member of the Board of the Catalina Island Conservancy and of the Santa Catalina Island Company (2009-present). She also serves as a member of the Advisory Board for the School of Engineering of the University of Southern California and the Foundation Board of the School of Architecture at the University of Virginia (2007-present). Previously, Ms. Knowles served as a Director of Phelps Dodge Corporation (copper mining and manufacturing, 1994-2007). |
Kenneth L. Wolfe (73) |
| Year of Election or Appointment: 2005 Prior to his retirement, Mr. Wolfe served as Chairman and a Director (2007-2009) and Chairman and Chief Executive Officer (1994-2001) of Hershey Foods Corporation. He also served as a member of the Boards of Adelphia Communications Corporation (telecommunications, 2003-2006), Bausch & Lomb, Inc. (medical/pharmaceutical, 1993-2007), and Revlon, Inc. (personal care products, 2004-2009). Mr. Wolfe previously served as Chairman of the Independent Trustees of the Fixed Income and Asset Allocation Funds (2008-2012). |
+ The information above includes each Trustee's principal occupation during the last five years and other information relating to the experience, attributes, and skills relevant to each Trustee's qualifications to serve as a Trustee, which led to the conclusion that each Trustee should serve as a Trustee for the fund.
Annual Report
Trustees and Officers - continued
Advisory Board Member and Executive Officers:
Correspondence intended for Elizabeth S. Acton may be sent to Fidelity Investments, P.O. Box 55235, Boston, Massachusetts 02205-5235. Correspondence intended for each executive officer may be sent to Fidelity Investments, 82 Devonshire Street, Boston, Massachusetts 02109.
Name, Age; Principal Occupation |
Elizabeth S. Acton (61) |
| Year of Election or Appointment: 2013 Member of the Advisory Board. Ms. Acton also serves as Trustee or Member of the Advisory Board of other Fidelity Fixed Income and Asset Allocation Funds (2013-present). Prior to her retirement in April 2012, Ms. Acton was Executive Vice President, Finance (November 2011-April 2012), Executive Vice President, Chief Financial Officer (April 2002-November 2011), and Treasurer (May 2004-May 2005) of Comerica Incorporated (financial services). Prior to joining Comerica, Ms. Acton held a variety of positions at Ford Motor Company (1983-2002), including Vice President and Treasurer (2000-2002) and Executive Vice President and Chief Financial Officer of Ford Motor Credit Company (1998-2000). Ms. Acton currently serves as a member of the Board of Directors and Audit and Finance Committees of Beazer Homes USA, Inc. (homebuilding, 2012-present). |
John R. Hebble (54) |
| Year of Election or Appointment: 2008 President and Treasurer of Fidelity's Fixed Income and Asset Allocation Funds. Mr. Hebble also serves as President (2011-present), Treasurer, and Chief Financial Officer of The North Carolina Capital Management Trust: Cash and Term Portfolios (2008-present), Assistant Treasurer of other Fidelity funds (2009-present) and is an employee of Fidelity Investments. |
Charles S. Morrison (51) |
| Year of Election or Appointment: 2012 Vice President of Fidelity's Fixed Income and Asset Allocation Funds. Mr. Morrison also serves as President, Fixed Income and is an employee of Fidelity Investments. Previously, Mr. Morrison served as Vice President of Fidelity's Money Market Funds (2005-2009), President, Money Market Group Leader of FMR (2009), and Senior Vice President, Money Market Group of FMR (2004-2009). Mr. Morrison also served as Vice President of Fidelity's Bond Funds (2002-2005), certain Balanced Funds (2002-2005), and certain Asset Allocation Funds (2002-2007), and as Senior Vice President (2002-2005) of Fidelity's Fixed Income Division. |
Nancy D. Prior (45) |
| Year of Election or Appointment: 2012 Vice President of Fidelity's Money Market Funds. Ms. Prior also serves as President, Money Market Group of FMR (2011-present) and is an employee of Fidelity Investments (2002-present). Previously, Ms. Prior served as Managing Director of Research (2009-2011), Senior Vice President and Deputy General Counsel (2007-2009), and Assistant Secretary of Fidelity's Fixed Income and Asset Allocation Funds (2008-2009). |
Scott C. Goebel (44) |
| Year of Election or Appointment: 2008 Secretary and Chief Legal Officer (CLO) of the Fidelity funds. Mr. Goebel also serves as Secretary of Fidelity Investments Money Management, Inc. (FIMM) (2010-present) and Fidelity Research and Analysis Company (FRAC) (2010-present); Secretary and CLO of The North Carolina Capital Management Trust: Cash and Term Portfolios (2008-present); General Counsel, Secretary, and Senior Vice President of FMR (2008-present) and FMR Co., Inc. (2008-present); employed by FMR LLC or an affiliate (2001-present); Chief Legal Officer of Fidelity Management & Research (Hong Kong) Limited (2008-present) and Assistant Secretary of Fidelity Management & Research (Japan) Inc. (2008-present), and Fidelity Management & Research (U.K.) Inc. (2008-present). Previously, Mr. Goebel served as Assistant Secretary of FIMM (2008-2010), FRAC (2008-2010), and the Funds (2007-2008) and as Vice President and Secretary of Fidelity Distributors Corporation (FDC) (2005-2007). |
Ramon Herrera (38) |
| Year of Election or Appointment: 2012 Assistant Secretary of Fidelity's Fixed Income and Asset Allocation Funds. Mr. Herrera also serves as Vice President, Associate General Counsel (2010-present) and is an employee of Fidelity Investments (2004-present). |
Elizabeth Paige Baumann (44) |
| Year of Election or Appointment: 2012 Anti-Money Laundering (AML) Officer of the Fidelity funds. Ms. Baumann also serves as AML Officer of The North Carolina Capital Management Trust: Cash and Term Portfolios (2012-present), Chief AML Officer of FMR LLC (2012-present), and is an employee of Fidelity Investments. Previously, Ms. Baumann served as Vice President and Deputy Anti-Money Laundering Officer (2007-2012). |
Christine Reynolds (54) |
| Year of Election or Appointment: 2008 Chief Financial Officer of the Fidelity funds. Ms. Reynolds became President of Fidelity Pricing and Cash Management Services (FPCMS) in August 2008. Ms. Reynolds served as Chief Operating Officer of FPCMS (2007-2008). Previously, Ms. Reynolds served as President, Treasurer, and Anti-Money Laundering officer of the Fidelity funds (2004-2007). |
Michael H. Whitaker (45) |
| Year of Election or Appointment: 2008 Chief Compliance Officer of Fidelity's Fixed Income and Asset Allocation Funds. Mr. Whitaker also serves as Chief Compliance Officer of The North Carolina Capital Management Trust: Cash and Term Portfolios (2008-present). Mr. Whitaker is an employee of Fidelity Investments (2007-present). Prior to joining Fidelity Investments, Mr. Whitaker worked at MFS Investment Management where he served as Senior Vice President and Chief Compliance Officer (2004-2006), and Assistant General Counsel. |
Joseph F. Zambello (55) |
| Year of Election or Appointment: 2011 Deputy Treasurer of the Fidelity funds. Mr. Zambello is an employee of Fidelity Investments. Previously, Mr. Zambello served as Vice President of FMR's Program Management Group (2009-2011) and Vice President of the Transfer Agent Oversight Group (2005-2009). |
Stephanie J. Dorsey (43) |
| Year of Election or Appointment: 2008 Deputy Treasurer of Fidelity's Fixed Income and Asset Allocation Funds. Ms. Dorsey also serves as Assistant Treasurer of other Fidelity funds (2010-present) and is an employee of Fidelity Investments (2008-present). Previously, Ms. Dorsey served as Treasurer (2004-2008) of the JPMorgan Mutual Funds and Vice President (2004-2008) of JPMorgan Chase Bank. |
Adrien E. Deberghes (45) |
| Year of Election or Appointment: 2010 Assistant Treasurer of Fidelity's Fixed Income and Asset Allocation Funds. Mr. Deberghes also serves as Vice President and Assistant Treasurer (2011-present) and Deputy Treasurer (2008-present) of other Fidelity funds, and is an employee of Fidelity Investments (2008-present). Previously, Mr. Deberghes served as Senior Vice President of Mutual Fund Administration at State Street Corporation (2007-2008), Senior Director of Mutual Fund Administration at Investors Bank & Trust (2005-2007), and Director of Finance for Dunkin' Brands (2000-2005). |
Kenneth B. Robins (43) |
| Year of Election or Appointment: 2009 Assistant Treasurer of the Fidelity Fixed Income and Asset Allocation Funds. Mr. Robins also serves as President and Treasurer of other Fidelity funds (2008-present; 2010-present) and is an employee of Fidelity Investments (2004-present). Previously, Mr. Robins served as Deputy Treasurer of the Fidelity funds (2005-2008) and Treasurer and Chief Financial Officer of The North Carolina Capital Management Trust: Cash and Term Portfolios (2006-2008). |
Stephen Sadoski (41) |
| Year of Election or Appointment: 2012 Assistant Treasurer of Fidelity's Fixed Income and Asset Allocation Funds. Mr. Sadoski also serves as Deputy Treasurer of other Fidelity funds (2012-present) and is an employee of Fidelity Investments (2012-present). Previously, Mr. Sadoski served as an assistant chief accountant in the Division of Investment Management of the Securities and Exchange Commission (SEC) (2009-2012) and as a senior manager at Deloitte & Touche (1997-2009). |
Gary W. Ryan (54) |
| Year of Election or Appointment: 2005 Assistant Treasurer of the Fidelity funds. Mr. Ryan is an employee of Fidelity Investments. Previously, Mr. Ryan served as Vice President of Fund Reporting in Fidelity Pricing and Cash Management Services (FPCMS) (1999-2005). |
Jonathan Davis (44) |
| Year of Election or Appointment: 2010 Assistant Treasurer of the Fidelity funds. Mr. Davis is also Assistant Treasurer of Fidelity Rutland Square Trust II and Fidelity Commonwealth Trust II. Mr. Davis is an employee of Fidelity Investments. Previously, Mr. Davis served as Vice President and Associate General Counsel of FMR LLC (2003-2010). |
Annual Report
During fiscal year ended 2012, 100% of the fund's income dividends was free from federal income tax.
The fund will notify shareholders in January 2013 of amounts for use in preparing 2012 income tax returns.
Annual Report
Board Approval of Investment Advisory Contracts and Management Fees
Fidelity New Jersey AMT Tax-Free Money Market Fund
Each year, the Board of Trustees, including the Independent Trustees (together, the Board), votes on the renewal of the management contract and sub-advisory agreements (together, the Advisory Contracts) for the fund. The Board, assisted by the advice of fund counsel and Independent Trustees' counsel, requests and considers a broad range of information relevant to the renewal of the Advisory Contracts throughout the year.
The Board meets regularly and, at each of its meetings, covers an extensive agenda of topics and materials and considers factors that are relevant to its annual consideration of the renewal of the fund's Advisory Contracts, including the services and support provided to the fund and its shareholders. The Board has established three standing committees, Operations, Audit, and Governance and Nominating, each composed of and chaired by Independent Trustees with varying backgrounds, to which the Board has assigned specific subject matter responsibilities in order to enhance effective decision-making by the Board. The Operations Committee, of which all of the Independent Trustees are members, meets regularly throughout the year and, among other matters, considers matters specifically related to the annual consideration of the renewal of the fund's Advisory Contracts. The Board, acting directly and through its Committees, requests and receives information concerning the annual consideration of the renewal of the fund's Advisory Contracts. The Board also meets as needed to consider matters specifically related to the Board's annual consideration of the renewal of Advisory Contracts. Members of the Board may also meet with trustees of other Fidelity funds through ad hoc joint committees to discuss certain matters relevant to the Fidelity funds.
At its September 2012 meeting, the Board of Trustees, including the Independent Trustees, unanimously determined to renew the fund's Advisory Contracts. In reaching its determination, the Board considered all factors it believed relevant, including (i) the nature, extent, and quality of the services to be provided to the fund and its shareholders (including the investment performance of the fund); (ii) the competitiveness of the fund's management fee and total expense ratio relative to peer funds; (iii) the total costs of the services to be provided by and the profits to be realized by Fidelity from its relationship with the fund; (iv) the extent to which economies of scale exist and would be realized as the fund grows; and (v) whether fee levels reflect these economies of scale, if any, for the benefit of fund shareholders.
In considering whether to renew the Advisory Contracts for the fund, the Board reached a determination, with the assistance of fund counsel and Independent Trustees' counsel and through the exercise of its business judgment, that the renewal of the Advisory Contracts is in the best interests of the fund and its shareholders and that the compensation payable under the Advisory Contracts is fair and reasonable. The Board's decision to renew the Advisory Contracts was not based on any single factor, but rather was based on a comprehensive consideration of all the information provided to the Board at its meetings throughout the year. The Board, in reaching its determination to renew the Advisory Contracts, was aware that shareholders in the fund have a broad range of investment choices available to them, including a wide choice among mutual funds offered by Fidelity's competitors, and that the fund's shareholders, who have the opportunity to review and weigh the disclosure provided by the fund in its prospectus and other public disclosures, have chosen to invest in this fund, managed by Fidelity.
Annual Report
Board Approval of Investment Advisory Contracts and
Management Fees - continued
Nature, Extent, and Quality of Services Provided. The Board considered the staffing within the investment adviser, FMR, and the sub-advisers (together, the Investment Advisers), including the backgrounds of the fund's investment personnel, and also considered the fund's investment objective, strategies, and related investment philosophy. The Independent Trustees also had discussions with senior management of Fidelity's investment operations and investment groups. The Board considered the structure of the portfolio manager compensation program and whether this structure provides appropriate incentives to act in the best interests of the fund.
Resources Dedicated to Investment Management and Support Services. The Board reviewed the general qualifications and capabilities of the Investment Advisers' investment staff, including its size, education, experience, and resources, as well as the Investment Advisers' approach to recruiting, managing, and compensating investment personnel. The Board also noted that FMR has continued to increase the resources devoted to non-U.S. offices, including expansion of Fidelity's global investment organization. The Board noted that Fidelity's analysts have extensive resources, tools and capabilities that allow them to conduct sophisticated quantitative and fundamental analysis, as well as credit analysis of issuers, counterparties and guarantors. The Board also believes that Fidelity's investment professionals have sufficient access to global information and data so as to provide competitive investment results over time, and that those professionals also have access to sophisticated tools that permit them to assess portfolio construction and risk and performance attribution characteristics continuously, as well as to transmit new information and research conclusions rapidly around the world. Additionally, in its deliberations, the Board considered the Investment Advisers' trading and risk management capabilities and resources, which are an integral part of the investment management process.
Shareholder and Administrative Services. The Board considered (i) the nature, extent, quality, and cost of advisory, administrative, and shareholder services performed by the Investment Advisers and their affiliates under the Advisory Contracts and under separate agreements covering transfer agency and pricing and bookkeeping services for the fund; (ii) the nature and extent of the supervision of third party service providers, principally custodians and subcustodians; and (iii) the resources devoted to, and the record of compliance with, the fund's compliance policies and procedures.
Annual Report
The Board noted that the growth of fund assets over time across the complex allows Fidelity to reinvest in the development of services designed to enhance the value or convenience of the Fidelity funds as investment vehicles. These services include 24-hour access to account information and market information through telephone representatives and over the Internet, investor education materials and asset allocation tools, and the expanded availability of Fidelity Investor Centers.
Investment in a Large Fund Family. The Board considered the benefits to shareholders of investing in a Fidelity fund, including the benefits of investing in a fund that is part of a large family of funds offering a variety of investment disciplines and providing a large variety of mutual fund investor services. The Board noted that Fidelity had taken, or had made recommendations that resulted in the Fidelity funds taking, a number of actions over the previous year that benefited particular funds, including (i) continuing to dedicate additional resources to investment research and support of the senior management team that oversees asset management; (ii) persisting in efforts to enhance Fidelity's research capabilities, in particular, international research; (iii) launching new funds and making other enhancements to meet client needs for global and income-oriented solutions; (iv) continuing to launch dedicated lower cost underlying funds to meet investment management's portfolio construction needs related to expanding underlying fund options, specifically for the Freedom Fund product lines; (v) adopting a sector neutral investment approach for certain funds and utilizing a team of portfolio managers to manage certain sector-neutral funds; (vi) rationalizing product lines and gaining increased efficiencies through combinations of several funds with other funds; (vii) strengthening the Spartan Index Fund product line by adding new funds and/or new low-cost institutional share classes, restructuring fund expenses to accommodate new classes, and reducing investment minimums for certain classes of shares; (viii) modifying the eligibility criteria for Institutional Class shares to increase their appeal to government entities and charitable investors; and (ix) reducing certain transfer agent fee rates.
Investment Performance. The Board considered whether the fund has operated in accordance with its investment objective, as well as its record of compliance with its investment restrictions. It also reviewed the fund's absolute investment performance for each class, as well as the fund's relative investment performance for each class measured over multiple periods against a peer group of mutual funds deemed appropriate by Fidelity and reviewed by the Board. The following charts considered by the Board show, over the one-, three-, and five-year periods ended December 31, 2011, as available, the cumulative total returns of the retail class and Service Class of the fund and a range of cumulative total returns of a peer group of mutual funds identified by Lipper Inc. as having an investment objective similar to that of the fund. The returns of the retail class and Service Class show the performance of the highest performing class (based on five-year performance) and the lowest performing class (based on three-year performance), respectively. The box within each chart shows the 25th percentile return (top of box) and the 75th percentile return (bottom of box) of the peer group. Returns shown above the box are in the first quartile and returns shown below the box are in the fourth quartile. The percentage beaten numbers noted below each chart correspond to the percentile box and represent the percentage of funds in the peer group whose performance was equal to or lower than that of the class indicated.
Annual Report
Board Approval of Investment Advisory Contracts and
Management Fees - continued
Fidelity New Jersey AMT Tax-Free Money Market Fund
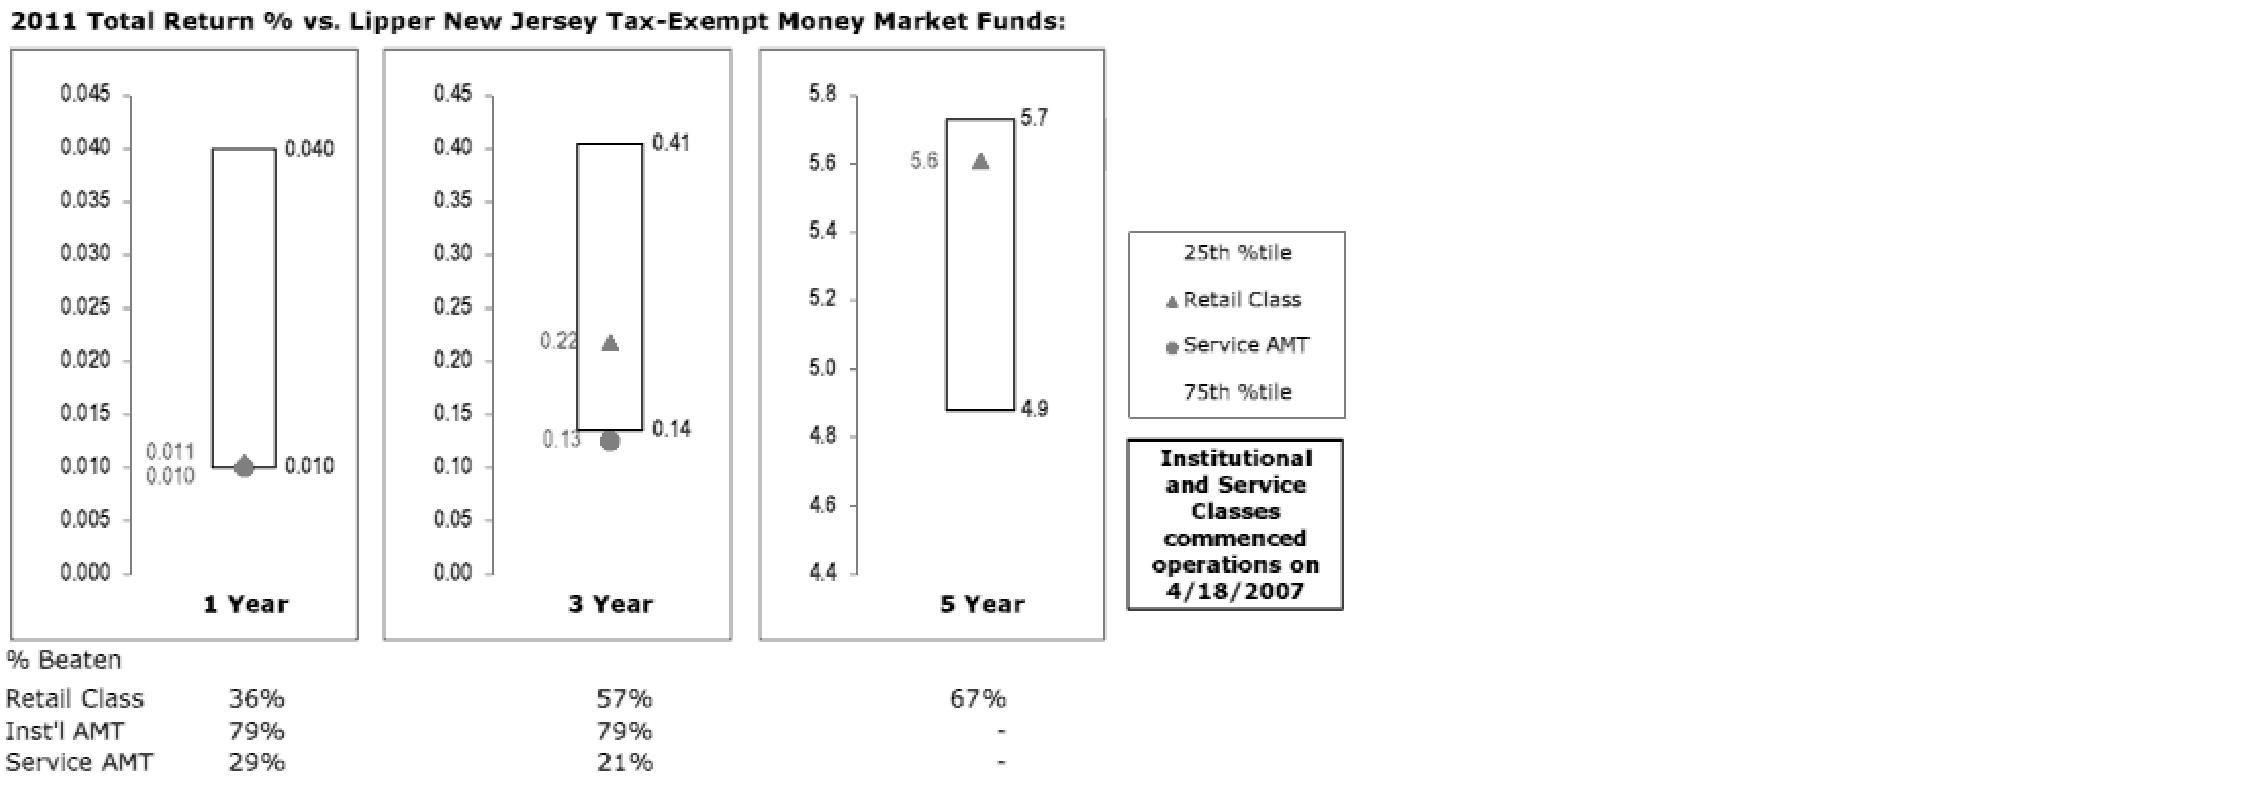
The Board reviewed the fund's relative investment performance against its peer group and noted that the performance of the retail class of the fund was in the third quartile for the one-year period and the second quartile for the three- and five-year periods. The Board considered that FMR had taken steps to provide shareholders with stability of principal and to enhance safety and liquidity. The Board considered that the variations in performance among the fund's classes reflect the variations in class expenses, which result in lower performance for higher expense classes. The Board also reviewed the fund's performance since inception as well as performance in the current year.
The Board noted as a general matter that the percentage beaten numbers for money market funds in recent years were less meaningful than in earlier years, as many competitors have been waiving fees to maintain a one basis point yield and performance differences among funds may not be apparent due to rounding.
Based on its review, the Board concluded that the nature, extent, and quality of services provided to the fund under the Advisory Contracts should benefit the fund's shareholders.
Annual Report
Competitiveness of Management Fee and Total Expense Ratio. The Board considered the fund's management fee and total expense ratio compared to "mapped groups" of competitive funds and classes. Fidelity creates "mapped groups" by combining similar Lipper investment objective categories that have comparable management fee characteristics. Combining Lipper investment objective categories aids the Board's management fee and total expense ratio comparisons by broadening the competitive group used for comparison and by reducing the number of universes to which various Fidelity funds are compared.
Management Fee. The Board considered two proprietary management fee comparisons for the 12-month periods shown in the chart below. The group of Lipper funds used by the Board for management fee comparisons is referred to below as the "Total Mapped Group" and, for the reasons explained above, is broader than the Lipper peer group used by the Board for performance comparisons. The Total Mapped Group comparison focuses on a fund's standing relative to the total universe of comparable funds available to investors in terms of gross management fees before expense reimbursements or caps. "TMG %" represents the percentage of funds in the Total Mapped Group that had management fees that were lower than the fund's. For example, a TMG % of 10% means that 90% of the funds in the Total Mapped Group had higher management fees than the fund. The "Asset-Size Peer Group" (ASPG) comparison focuses on a fund's standing relative to non-Fidelity funds similar in size to the fund within the Total Mapped Group. The ASPG represents at least 15% of the funds in the Total Mapped Group with comparable asset size and management fee characteristics, subject to a minimum of 50 funds (or all funds in the Total Mapped Group if fewer than 50). Additional information, such as the ASPG quartile in which the fund's management fee ranked, is also included in the chart and considered by the Board. Because the vast majority of competitor funds' management fees do not cover non-management expenses, for a more meaningful comparison of management fees, the fund is compared on the basis of a hypothetical "net management fee," which is derived by subtracting payments made by FMR for "fund-level" non-management expenses (including pricing and bookkeeping fees and fees paid to non-affiliated custodians) from the fund's management fee. In this regard, the Board considered that net management fees can vary from year to year because of differences in "fund-level" non-management expenses. The Board noted, however, that FMR does not pay transfer agent fees or other "class-level" expenses (including 12b-1 fees, if applicable) under the fund's management contract.
Annual Report
Board Approval of Investment Advisory Contracts and
Management Fees - continued
Fidelity New Jersey AMT Tax-Free Money Market Fund
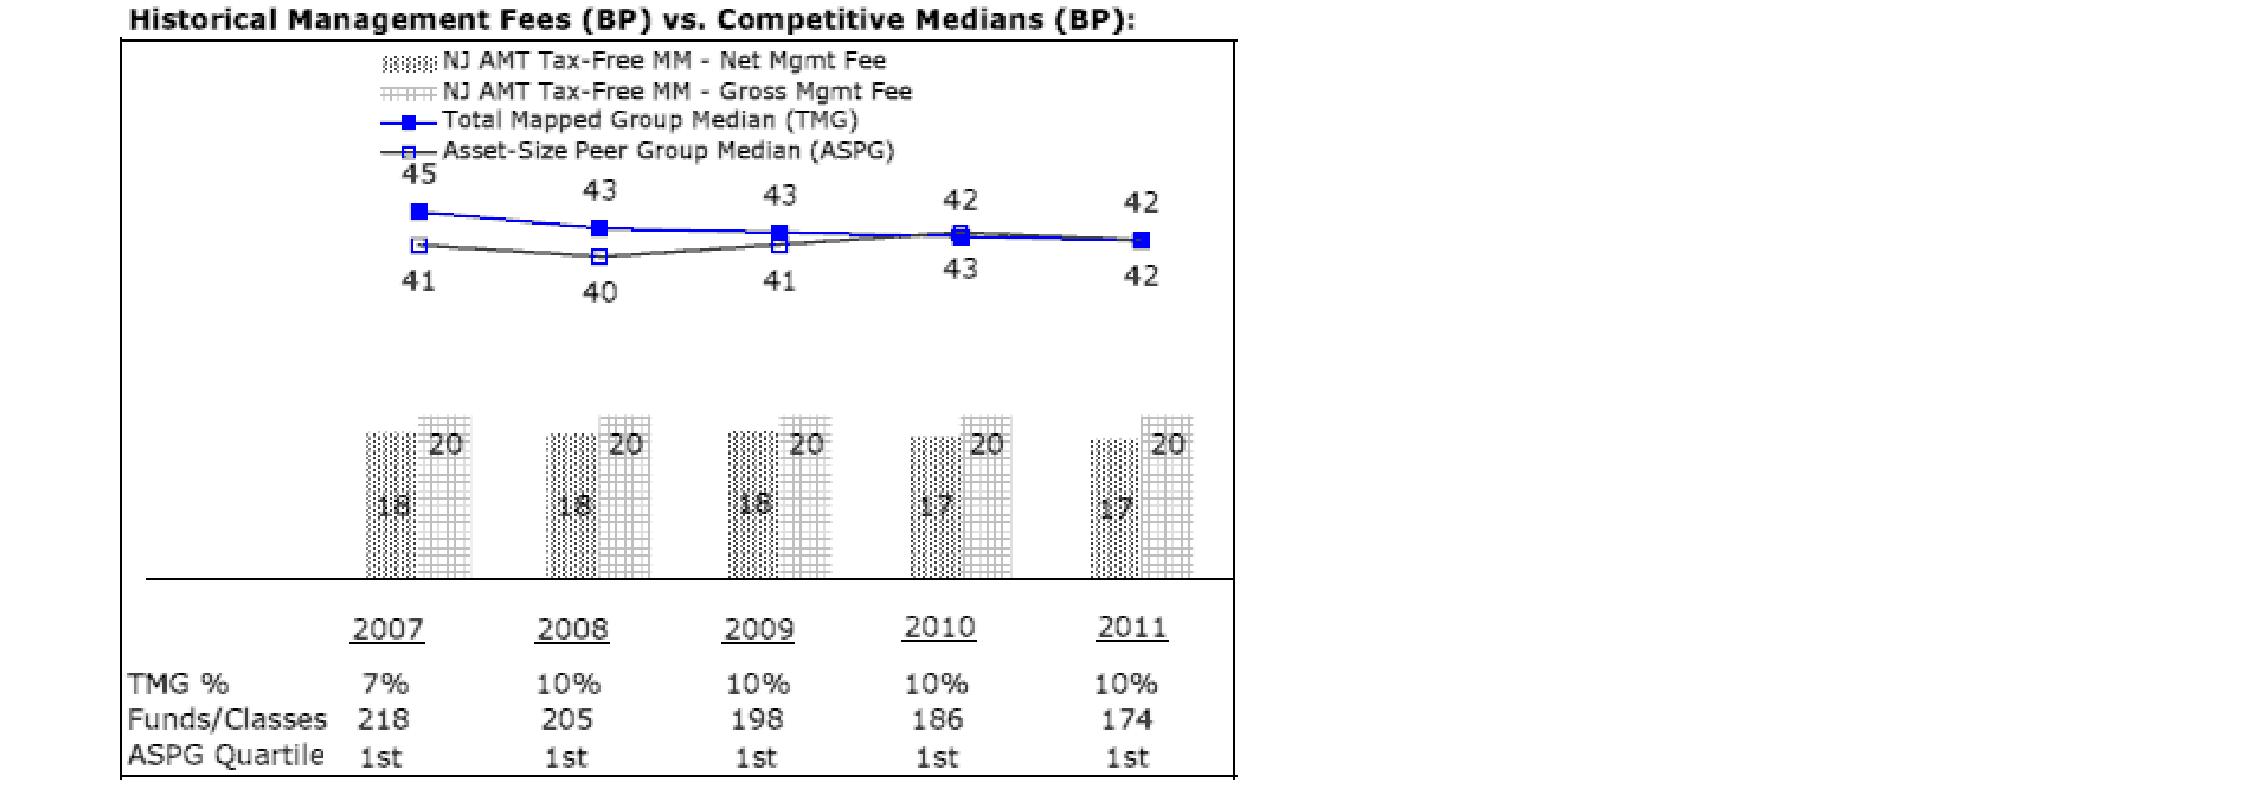
The Board noted that the fund's hypothetical net management fee ranked below the median of its Total Mapped Group and below the median of its ASPG for 2011.
Furthermore, the Board considered that it had approved an amended and restated management contract for the fund (effective April 1, 2007) that (i) lowered the fund's management fee from 0.43% to 0.20%, and (ii) provides that FMR will pay all "fund-level" expenses out of the management fee, with certain limited exceptions. (Transfer agent fees and 12b-1 fees, if applicable, currently are the only "class-level" expenses.) The Board considered that the chart reflects the fund's lower management fee for 2007 as if the lower fee were in effect for the entire year.
Based on its review, the Board concluded that the fund's management fee is fair and reasonable in light of the services that the fund receives and the other factors considered.
Total Expense Ratio. In its review of each class's total expense ratio, the Board considered the fund's hypothetical net management fee as well as the fund's gross management fee. The Board also considered other "fund-level" expenses, such as pricing and bookkeeping fees and custodial, legal, and audit fees. The Board also considered other "class-level" expenses, such as transfer agent fees and fund-paid 12b-1 fees. The Board also noted the effects of any waivers and reimbursements on fees and expenses. As part of its review, the Board also considered the current and historical total expense ratios of each class of the fund compared to competitive fund median expenses. Each class of the fund is compared to those funds and classes in the Total Mapped Group (used by the Board for management fee comparisons) that have a similar sales load structure.
Annual Report
The Board noted that the total expense ratio of each class ranked below its competitive median for 2011.
The Board considered that the current contractual arrangements for the fund (i) have the effect of setting the total "fund-level" expenses (including, among certain other expenses, the management fee) for each class at 0.20%, (ii) limit the total expenses, with certain exceptions, of the retail class to 0.35%, and (iii) limit the total expenses, with certain exceptions, of Institutional Class and Service Class to 0.20% and 0.45%, respectively. The fees and expenses payable under these contractual arrangements may not be increased without the approval of the Board and, in the case of (i) and (ii), the shareholders of the applicable class.
The Board considered that Fidelity has been voluntarily waiving part or all of the 12b-1 fees, transfer agent fees, and/or management fees to maintain a minimum yield, and also noted that Fidelity retains the ability to be repaid in certain circumstances.
Fees Charged to Other Fidelity Clients. The Board also considered Fidelity fee structures and other information with respect to clients of FMR and its affiliates, such as other mutual funds advised or subadvised by FMR or its affiliates, pension plan clients, and other institutional clients. The Board noted the findings of the 2010 ad hoc joint committee (created with the board of other Fidelity funds), which reviewed and compared Fidelity's institutional investment advisory business with its business of providing services to the Fidelity funds, including the differences in services provided, fees charged, and costs incurred, as well as competition in their respective marketplaces.
Based on its review of total expense ratios and fees charged to other Fidelity clients, the Board concluded that the total expense ratio of each class of the fund was reasonable in light of the services that the fund and its shareholders receive and the other factors considered.
Costs of the Services and Profitability. The Board considered the revenues earned and the expenses incurred by Fidelity in conducting the business of developing, marketing, distributing, managing, administering and servicing the fund and its shareholders. The Board also considered the level of Fidelity's profits in respect of all the Fidelity funds.
On an annual basis, FMR presents to the Board Fidelity's profitability for the fund. Fidelity calculates the profitability for each fund, as well as aggregate profitability for groups of Fidelity funds and all Fidelity funds, using a series of detailed revenue and cost allocation methodologies which originate with the books and records of Fidelity on which Fidelity's audited financial statements are based. The Audit Committee of the Board reviews any significant changes from the prior year's methodologies.
PricewaterhouseCoopers LLP (PwC), independent registered public accounting firm and auditor to Fidelity and certain Fidelity funds, has been engaged annually by the Board as part of the Board's assessment of Fidelity's profitability analysis. PwC's engagement includes the review and assessment of Fidelity's methodologies used in determining the revenues and expenses attributable to Fidelity's mutual fund business, and completion of agreed-upon procedures surrounding the mathematical accuracy of fund profitability and its conformity to allocation methodologies. After considering PwC's reports issued under the engagement and information provided by Fidelity, the Board concluded that while other allocation methods may also be reasonable, Fidelity's profitability methodologies are reasonable in all material respects.
Annual Report
Board Approval of Investment Advisory Contracts and
Management Fees - continued
The Board also reviewed Fidelity's non-fund businesses and fall-out benefits related to the mutual fund business as well as cases where Fidelity's affiliates may benefit from or be related to the fund's business.
The Board considered the costs of the services provided by and the profits realized by Fidelity in connection with the operation of the fund and was satisfied that the profitability was not excessive in the circumstances.
Economies of Scale. The Board considered whether there have been economies of scale in respect of the management of the Fidelity funds, whether the Fidelity funds (including the fund) have appropriately benefited from any such economies of scale, and whether there is potential for realization of any further economies of scale. The Board considered the extent to which the fund will benefit from economies of scale through increased services to the fund, through waivers or reimbursements, or through fee or expense reductions. The Board also noted that in 2009, it and the board of other Fidelity funds created an ad hoc committee (the Economies of Scale Committee) to analyze whether FMR attains economies of scale in respect of the management and servicing of the Fidelity funds, whether the Fidelity funds have appropriately benefited from such economies of scale, and whether there is potential for realization of any further economies of scale.
The Board concluded, taking into account the analysis of the Economies of Scale Committee, that economies of scale, if any, are being appropriately shared between fund shareholders and Fidelity.
Additional Information Requested by the Board. In order to develop fully the factual basis for consideration of the Fidelity funds' Advisory Contracts, the Board requested and received additional information on certain topics, including: (i) Fidelity's fund profitability methodology, profitability trends for certain funds, and the impact of certain factors on fund profitability results; (ii) portfolio manager changes that have occurred during the past year and the amount of the investment that each portfolio manager has made in the Fidelity fund(s) that he or she manages; (iii) Fidelity's compensation structure for portfolio managers, research analysts, and other key personnel, including its effects on fund profitability, the rationale for the compensation structure, and the extent to which current market conditions have affected retention and recruitment; (iv) the compensation paid to fund sub-advisers on behalf of the Fidelity funds; (v) Fidelity's fee structures, including the group fee structure, and the rationale for recommending different fees among different categories of funds and classes; (vi) Fidelity's voluntary waiver of its fees to maintain minimum yields for certain money market funds and classes as well as contractual waivers in place for certain funds; (vii) regulatory and industry developments, including those affecting money market funds and target date funds, and the potential impact to Fidelity; (viii) Fidelity's transfer agent fees, expenses, and services, and drivers for determining the transfer agent fee structure of different funds and classes ; (ix) management fee rates charged by FMR or Fidelity entities to other Fidelity clients; (x) the allocation of and historical trends in Fidelity's realization of fall-out benefits; and (xi) explanations regarding the relative total expense ratios of certain funds and classes, total expense competitive trends, and actions that might be taken by FMR to reduce total expense ratios for certain funds and classes or to achieve further economies of scale.
Annual Report
Based on its evaluation of all of the conclusions noted above, and after considering all factors it believed relevant, the Board ultimately concluded that the advisory fee structures are fair and reasonable, and that the fund's Advisory Contracts should be renewed.
Annual Report
Investment Adviser
Fidelity Management & Research Company
Boston, MA
Investment Sub-Advisers
Fidelity Investments
Money Management, Inc.
Fidelity Management & Research Company
(U.K.) Inc.
Fidelity Management & Research Company
(Hong Kong) Limited
Fidelity Management & Research Company
(Japan) Inc.
General Distributor
Fidelity Distributors Corporation
Smithfield, RI
Transfer and Service Agents
Citibank, N.A.
New York, NY
Fidelity Investments Institutional
Operations Company, Inc.
Boston, MA
Fidelity Service Company, Inc.
Boston, MA
Custodian
Citibank, N.A.
New York, NY
The Fidelity Telephone Connection
Mutual Fund 24-Hour Service
Exchanges/Redemptions
and Account Assistance 1-800-544-6666
Product Information 1-800-544-6666
Retirement Accounts 1-800-544-4774 (8 a.m. - 9 p.m.)
TDD Service 1-800-544-0118
for the deaf and hearing impaired
(9 a.m. - 9 p.m. Eastern time)
Fidelity Automated Service
Telephone (FAST®)
1-800-544-5555
Automated line for quickest service
(Fidelity Investment logo)(registered trademark)
Corporate Headquarters
82 Devonshire St., Boston, MA 02109
www.fidelity.com
SNJ-UANN-0113
1.850769.105
Fidelity®
Connecticut Municipal
Income Fund
and
Fidelity
Connecticut Municipal
Money Market Fund
Annual Report
November 30, 2012
(Fidelity Cover Art)
Contents
Shareholder Expense Example | (Click Here) | An example of shareholder expenses. |
Fidelity® Connecticut Municipal Income Fund |
Performance | (Click Here) | How the fund has done over time. |
Management's
Discussion of Fund
Performance | (Click Here) | The Portfolio Manager's review of fund performance and strategy. |
Investment Changes | (Click Here) | A summary of major shifts in the fund's investments over the past six months. |
Investments | (Click Here) | A complete list of the fund's investments with their market values. |
Financial Statements | (Click Here) | Statements of assets and liabilities, operations, and changes in net assets, as well as financial highlights. |
Fidelity Connecticut Municipal Money Market Fund |
Investment Changes/Performance | (Click Here) | A summary of major shifts in the fund's investments over the past six months. |
Investments | (Click Here) | A complete list of the fund's investments. |
Financial Statements | (Click Here) | Statements of assets and liabilities, operations, and changes in net assets, as well as financial highlights. |
Notes | (Click Here) | Notes to the Financial Statements. |
Report of Independent Registered Public Accounting Firm | (Click Here) | |
Trustees and Officers | (Click Here) | |
Distributions | (Click Here) | |
Board Approval of Investment Advisory Contracts and Management Fees | (Click Here) | |
To view a fund's proxy voting guidelines and proxy voting record for the 12-month period ended June 30, visit http://www.fidelity.com/proxyvotingresults or visit the Securities and Exchange Commission's (SEC) web site at http://www.sec.gov. You may also call 1-800-544-8544 to request a free copy of the proxy voting guidelines.
Standard & Poor's, S&P and S&P 500 are registered service marks of The McGraw-Hill Companies, Inc. and have been licensed for use by Fidelity Distributors Corporation.
Other third party marks appearing herein are the property of their respective owners.
All other marks appearing herein are registered or unregistered trademarks or service marks of FMR LLC or an affiliated company. © 2013 FMR LLC. All rights reserved.
Annual Report
This report and the financial statements contained herein are submitted for the general information of the shareholders of the funds. This report is not authorized for distribution to prospective investors in the funds unless preceded or accompanied by an effective prospectus.
A fund files its complete schedule of portfolio holdings with the SEC for the first and third quarters of each fiscal year on Form N-Q. Forms N-Q are available on the SEC's web site at http://www.sec.gov. A fund's Forms N-Q may be reviewed and copied at the SEC's Public Reference Room in Washington, DC. Information regarding the operation of the SEC's Public Reference Room may be obtained by calling 1-800-SEC-0330. For a complete list of a fund's portfolio holdings, view the most recent holdings listing, semiannual report, or annual report on Fidelity's web site at http://www.fidelity.com, http://www.advisor.fidelity.com, or http://www.401k.com, as applicable.
NOT FDIC INSURED • MAY LOSE VALUE • NO BANK GUARANTEE
Neither the funds nor Fidelity Distributors Corporation is a bank.
Annual Report
Shareholder Expense Example
As a shareholder of a Fund, you incur two types of costs: (1) transaction costs, including redemption fees and (2) ongoing costs, including management fees and other Fund expenses. This Example is intended to help you understand your ongoing costs (in dollars) of investing in the Funds and to compare these costs with the ongoing costs of investing in other mutual funds.
The Example is based on an investment of $1,000 invested at the beginning of the period and held for the entire period (June 1, 2012 to November 30, 2012).
Actual Expenses
The first line of the accompanying table for each fund provides information about actual account values and actual expenses. You may use the information in this line, together with the amount you invested, to estimate the expenses that you paid over the period. Simply divide your account value by $1,000.00 (for example, an $8,600 account value divided by $1,000.00 = 8.6), then multiply the result by the number in the first line for a fund under the heading entitled "Expenses Paid During Period" to estimate the expenses you paid on your account during this period. A small balance maintenance fee of $12.00 that is charged once a year may apply for certain accounts with a value of less than $2,000. This fee is not included in the table below. If it was, the estimate of expenses you paid during the period would be higher, and your ending account value lower, by this amount. In addition, each Fund, as a shareholder in the underlying Fidelity Central Funds, will indirectly bear its pro-rata share of the fees and expenses incurred by the underlying Fidelity Central Funds. These fees and expenses are not included in the Fund's annualized expense ratio used to calculate the expense estimate in the table below.
Hypothetical Example for Comparison Purposes
The second line of the accompanying table for each fund provides information about hypothetical account values and hypothetical expenses based on a fund's actual expense ratio and an assumed rate of return of 5% per year before expenses, which is not the Fund's actual return. The hypothetical account values and expenses may not be used to estimate the actual ending account balance or expenses you paid for the period. You may use this information to compare the ongoing costs of investing in the Fund and other funds. To do so, compare this 5% hypothetical example with the 5% hypothetical examples that appear in the shareholder reports of the other funds. A small balance maintenance fee of $12.00 that is charged once a year may apply for certain accounts with a value of less than $2,000. This fee is not included in the table below. If it was, the estimate of expenses you paid during the period would be higher, and your ending account value lower, by this amount. In addition, each Fund, as a shareholder in the underlying Fidelity Central Funds, will indirectly bear its pro-rata share of the fees and expenses incurred by the underlying Fidelity Central Funds. These fees and expenses are not included in the Fund's annualized expense ratio used to calculate the expense estimate in the table below.
Please note that the expenses shown in the table are meant to highlight your ongoing costs only and do not reflect any transaction costs. Therefore, the second line of the table is useful in comparing ongoing costs only, and will not help you determine the relative total costs of owning different funds. In addition, if these transactional costs were included, your costs would have been higher.
Annual Report
| Annualized Expense Ratio | Beginning
Account Value
June 1, 2012 | Ending
Account Value
November 30, 2012 | Expenses Paid
During Period*
June 1, 2012 to
November 30, 2012 |
Fidelity Connecticut Municipal Income Fund | .48% | | | |
Actual | | $ 1,000.00 | $ 1,032.20 | $ 2.44 |
HypotheticalA | | $ 1,000.00 | $ 1,022.60 | $ 2.43 |
Fidelity Connecticut Municipal Money Market Fund | .19% | | | |
Actual | | $ 1,000.00 | $ 1,000.10 | $ .95** |
HypotheticalA | | $ 1,000.00 | $ 1,024.05 | $ .96** |
A 5% return per year before expenses
* Expenses are equal to each Fund's annualized expense ratio, multiplied by the average account value over the period, multiplied by 183/366 (to reflect the one-half year period).
** If certain fees were not voluntarily waived by Fidelity Management & Research Company (FMR) or its affiliates during the period, the annualized expense ratio for Fidelity Connecticut Municipal Money Market Fund would have been .48% and the expenses paid in the actual and hypothetical examples above would have been $2.40 and $2.43, respectively.
Annual Report
Fidelity® Connecticut Municipal Income Fund
Performance: The Bottom Line
Average annual total return reflects the change in the value of an investment, assuming reinvestment of the fund's distributions from dividend income and capital gains (the profits earned upon the sale of securities that have grown in value, if any) and assuming a constant rate of performance each year. The $10,000 table and the fund's returns do not reflect the deduction of taxes that a shareholder would pay on fund distributions or the redemption of fund shares. During periods of reimbursement by Fidelity, a fund's total return will be greater than it would be had the reimbursement not occurred. How a fund did yesterday is no guarantee of how it will do tomorrow.
Average Annual Total Returns
Periods ended November 30, 2012 | Past 1
year | Past 5
years | Past 10
years |
Fidelity® Connecticut Municipal Income Fund | 8.08% | 5.59% | 4.85% |
$10,000 Over 10 Years
Let's say hypothetically that $10,000 was invested in Fidelity Connecticut Municipal Income Fund on November 30, 2002. The chart shows how the value of your investment would have changed, and also shows how the Barclays® Municipal Bond Index performed over the same period.
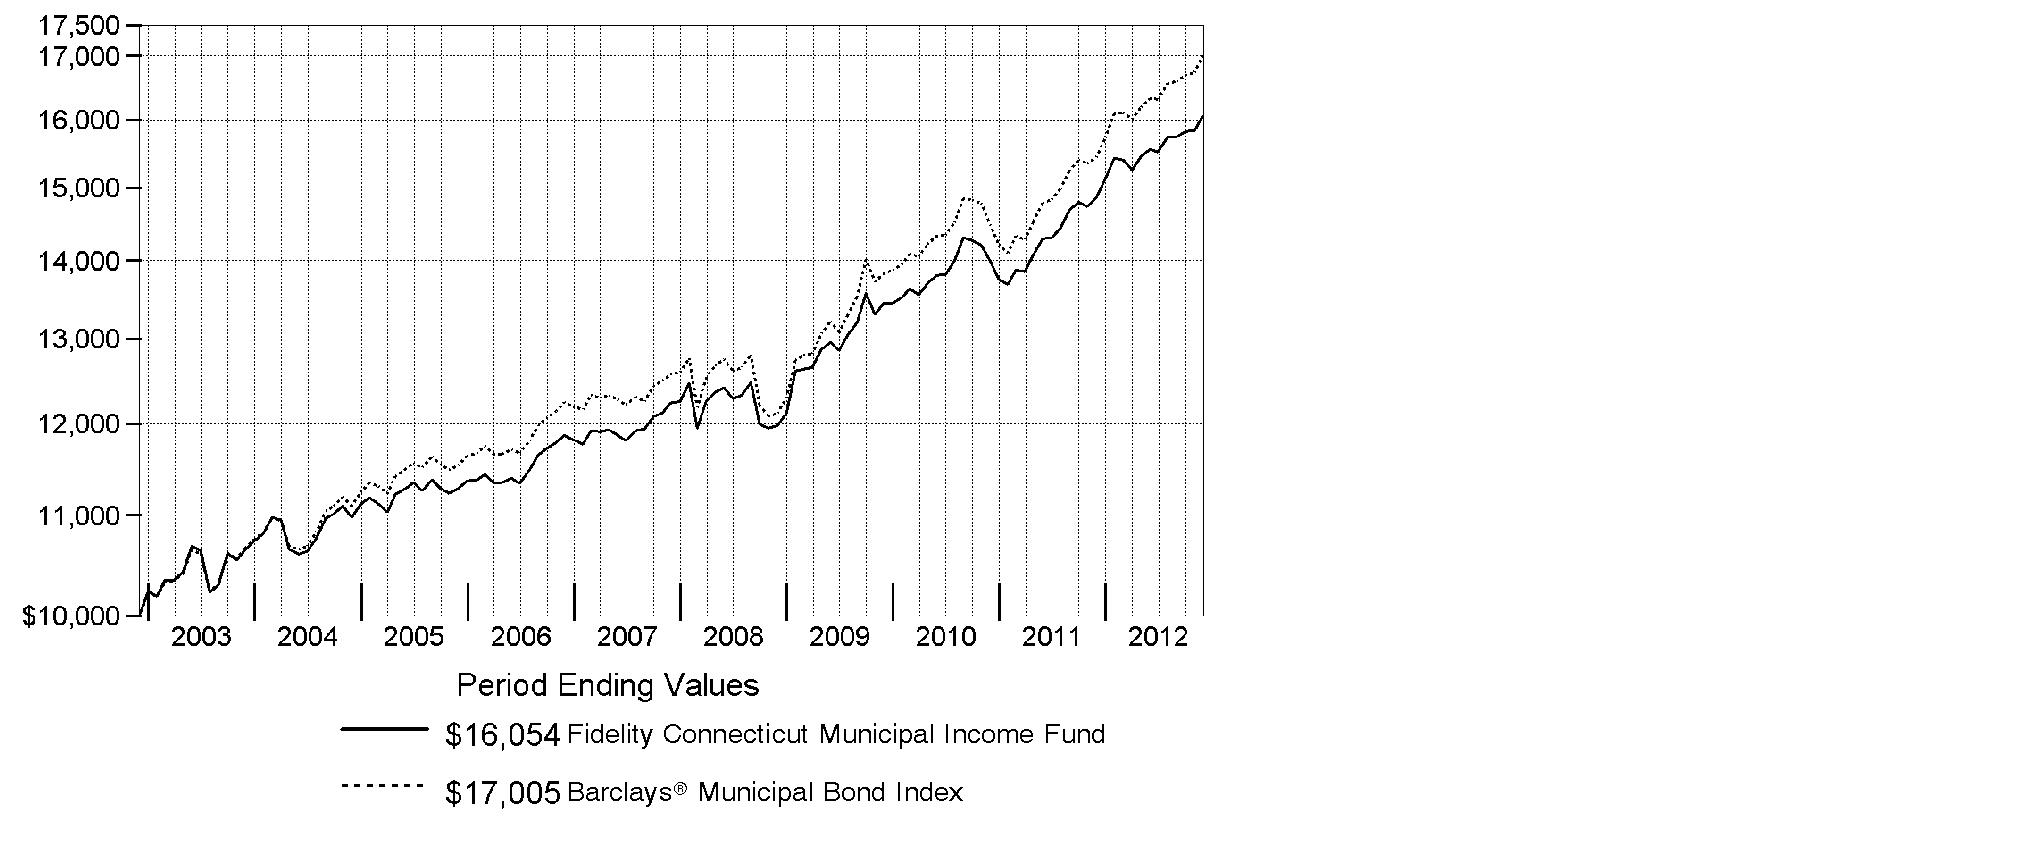
Annual Report
Market Recap: The bull market for municipal bonds continued to run during the year ending November 30, 2012, with the Barclays® Municipal Bond Index advancing 10.17% and achieving new multiyear highs. By contrast, taxable investment-grade debt gained 5.51%, as measured by the Barclays® U.S. Aggregate Bond Index. Munis remained bolstered by improving issuer fundamentals and favorable technical factors of supply and demand. On the basis of fundamentals, investors were encouraged by a recovery in tax revenues to pre-2009 levels for many issuers. And despite a handful of well-publicized bankruptcies by local issuers, the overall muni default rate declined and remained low. Even with a surge in refinancings, the supply of newly issued muni bonds was muted, even with an uptick in refinancings. As for demand, munis continued to benefit from their yield advantage over U.S. Treasuries and heightened interest in high-quality fixed-income securities as a perceived safe haven amid mixed U.S. economic data and the ongoing financial crisis in Europe. Investors' appetite for tax-advantaged investments in advance of potentially higher federal tax rates in 2013 also helped, particularly in November after Election Day, when the muni market rose 1.65% for the month. A steady stream of municipal redemptions (calls and maturities), many of which were reinvested in the muni market, also competed for limited new supply, driving up valuations.
Comments from Mark Sommer, Portfolio Manager of Fidelity® Connecticut Municipal Income Fund: For the year, the fund returned 8.08%, while the Barclays Connecticut 4+ Year Enhanced Municipal Bond Index - which tracks the types of securities in which the fund investments - rose 8.56%. Versus the index, the fund was hurt by owning fewer bonds that were advance refunded during the period because they appreciated more than the benchmark when they were transformed into non-callable, shorter-maturity securities that were backed by U.S. government securities. Having a modestly shorter duration than the benchmark - meaning the fund had less sensitivity to interest rates - hurt because, on the margin, it caused the fund to appreciate a little less than its benchmark as interest rates declined. The fund was helped by its underweighting in housing bonds, which underperformed as investors feared being prepaid at par when the bonds were trading above par and having to reinvest the proceeds at lower prevailing rates. The fund's overweightings in health care and investor-owned utility bonds proved advantageous because these sectors outperformed, largely due to investors' appetite for higher-yielding bonds.
The views expressed above reflect those of the portfolio manager(s) only through the end of the period as stated on the cover of this report and do not necessarily represent the views of Fidelity or any other person in the Fidelity organization. Any such views are subject to change at any time based upon market or other conditions and Fidelity disclaims any responsibility to update such views. These views may not be relied on as investment advice and, because investment decisions for a Fidelity fund are based on numerous factors, may not be relied on as an indication of trading intent on behalf of any Fidelity fund.
Annual Report
Fidelity Connecticut Municipal Income Fund
Investment Changes (Unaudited)
Top Five Sectors as of November 30, 2012 |
| % of fund's
net assets | % of fund's net assets
6 months ago |
General Obligations | 49.4 | 47.1 |
Water & Sewer | 11.9 | 12.0 |
Health Care | 11.4 | 12.1 |
Special Tax | 9.5 | 11.0 |
Education | 8.6 | 10.1 |
Weighted Average Maturity as of November 30, 2012 |
| | 6 months ago |
Years | 6.1 | 6.0 |
This is a weighted average of all the maturities of the securities held in a fund. Weighted Average Maturity (WAM) can be used as a measure of sensitivity to interest rate changes and market changes. Generally, the longer the maturity, the greater the sensitivity to such changes. WAM is based on the dollar-weighted average length of time until principal payments must be paid. Depending on the types of securities held in a fund, certain maturity shortening devices (e.g., demand features, interest rate resets, and call options) may be taken into account when calculating the WAM. |
Duration as of November 30, 2012 |
| | 6 months ago |
Years | 6.1 | 6.5 |
Duration estimates how much a bond fund's price will change with a change in comparable interest rates. If rates rise 1%, for example, a fund with a 5-year duration is likely to lose about 5% of its value. Other factors also can influence a bond fund's performance and share price. Accordingly, a bond fund's actual performance may differ from this example. Duration takes into account any call or put option embedded in the bonds. |
Quality Diversification (% of fund's net assets) |
As of November 30, 2012 | As of May 31, 2012 |
 | AAA 11.4% | | | AAA 15.3% | |
 | AA,A 79.0% | | | AA,A 76.2% | |
 | BBB 5.1% | | | BBB 5.3% | |
 | Not Rated 1.3% | | | Not Rated 1.5% | |
 | Short-Term
Investments and
Net Other Assets 3.2% | | | Short-Term
Investments and
Net Other Assets 1.7% | |

We have used ratings from Moody's Investors Service, Inc. Where Moody's® ratings are not available, we have used S&P® ratings. All ratings are as of the date indicated and do not reflect subsequent changes. |
Annual Report
Fidelity Connecticut Municipal Income Fund
Investments November 30, 2012
Showing Percentage of Net Assets
Municipal Bonds - 96.8% |
| Principal Amount | | Value |
Connecticut - 90.0% |
Bethany, Orange and Woodbridge Reg'l. School
District #5: | | | | |
4.5% 8/15/20 | | $ 1,315,000 | | $ 1,525,532 |
4.5% 8/15/21 | | 1,225,000 | | 1,411,996 |
4.5% 8/15/22 | | 1,325,000 | | 1,514,859 |
5% 8/15/18 | | 1,500,000 | | 1,795,035 |
5% 8/15/19 | | 750,000 | | 894,458 |
Bloomfield Gen. Oblig.: | | | | |
Series 2010 A, 4% 10/15/20 | | 750,000 | | 899,610 |
Series 2010 B, 4% 10/15/19 | | 1,110,000 | | 1,319,735 |
Bridgeport Gen. Oblig.: | | | | |
Series 2004 A, 5.25% 8/15/16 (Nat'l. Pub. Fin. Guarantee Corp. Insured) | | 1,320,000 | | 1,414,235 |
Series 2006 B: | | | | |
5% 12/1/14 (FSA Insured) | | 1,655,000 | | 1,789,833 |
5% 12/1/17 (FSA Insured) | | 1,830,000 | | 2,083,949 |
5% 12/1/18 (FSA Insured) | | 1,635,000 | | 1,857,131 |
Series 2012 A: | | | | |
5% 2/15/23 | | 3,510,000 | | 4,179,041 |
5% 2/15/24 | | 2,490,000 | | 2,953,439 |
Cap. City Econ. Dev. Auth. Series 2004 A, 5% 6/15/15 (FSA Insured) | | 1,705,000 | | 1,808,954 |
Connecticut Dev. Auth. Poll. Cont. Rev. Bonds Series 2011 A, 1.55%, tender 4/1/15 (b)(c) | | 5,000,000 | | 5,029,600 |
Connecticut Dev. Auth. Wtr. Facilities Rev. (Aquatron Wtr. Corp., Proj.) Series 2006, 4.7% 7/1/36 (XL Cap. Assurance, Inc. Insured) (c) | | 5,000,000 | | 5,181,000 |
Connecticut Gen. Oblig.: | | | | |
Series 2005 B, 5.25% 6/1/18 (AMBAC Insured) | | 1,925,000 | | 2,367,827 |
Series 2006 D: | | | | |
5% 11/1/24 | | 17,980,000 | | 20,968,456 |
5% 11/1/25 | | 10,000,000 | | 11,649,500 |
Series 2006 F, 5% 12/1/21 | | 14,000,000 | | 16,442,580 |
Series 2007 D, 5% 12/1/19 | | 1,745,000 | | 2,096,094 |
Series 2008 A, 5% 4/15/27 | | 5,000,000 | | 5,906,600 |
Series 2008 B, 5% 4/15/28 | | 4,000,000 | | 4,700,480 |
Series 2011 D: | | | | |
5% 11/1/24 | | 4,810,000 | | 6,053,193 |
5% 11/1/25 | | 10,000,000 | | 12,519,300 |
Series 2012 B: | | | | |
5% 4/15/24 | | 11,875,000 | | 15,006,438 |
5% 4/15/25 | | 7,460,000 | | 9,390,797 |
Municipal Bonds - continued |
| Principal Amount | | Value |
Connecticut - continued |
Connecticut Gen. Oblig.: - continued | | | | |
Series 2012 C, 5% 6/1/22 | | $ 3,020,000 | | $ 3,886,861 |
Series 2012 D: | | | | |
5% 9/15/31 | | 3,250,000 | | 4,004,748 |
5% 9/15/32 | | 4,860,000 | | 5,964,775 |
Series A: | | | | |
5% 2/15/28 | | 2,500,000 | | 3,045,450 |
5% 2/15/29 | | 2,500,000 | | 3,038,800 |
Connecticut Health & Ed. Facilities Auth. Rev.: | | | | |
Bonds (Ascension Health Cr. Group Proj.) Series 1998 B, 1.55%, tender 2/1/17 (b) | | 4,790,000 | | 4,908,792 |
Series A: | | | | |
5% 7/1/20 | | 4,855,000 | | 5,720,501 |
5% 7/1/21 | | 800,000 | | 946,672 |
5% 7/1/41 | | 3,000,000 | | 3,305,010 |
Series C: | | | | |
5% 7/1/20 | | 465,000 | | 571,736 |
5% 7/1/22 | | 425,000 | | 527,616 |
5% 7/1/24 | | 1,000,000 | | 1,225,960 |
Series D: | | | | |
5% 7/1/21 | | 2,975,000 | | 3,520,437 |
5% 7/1/23 | | 3,335,000 | | 3,913,623 |
Series H, 5% 7/1/23 (FSA Insured) | | 2,290,000 | | 2,710,421 |
Series N: | | | | |
5% 7/1/20 | | 1,250,000 | | 1,478,538 |
5% 7/1/21 | | 610,000 | | 715,182 |
5% 7/1/21 | | 1,940,000 | | 2,284,253 |
5% 7/1/22 | | 2,035,000 | | 2,377,429 |
5% 7/1/23 | | 1,500,000 | | 1,704,600 |
Connecticut Health & Edl. Facilities Auth. Rev.: | | | | |
(Fairfield Univ. Proj.): | | | | |
Series 2008 N, 5% 7/1/21 | | 3,000,000 | | 3,480,870 |
Series M, 5% 7/1/34 | | 1,000,000 | | 1,110,570 |
Series O, 5% 7/1/40 | | 2,000,000 | | 2,231,800 |
(Hosp. for Spl. Care Proj.) Series C, 5.25% 7/1/19 (Radian Asset Assurance, Inc. Insured) | | 1,170,000 | | 1,288,498 |
(Loomis Chaffee School Proj.) Series G, 5% 7/1/38 | | 3,000,000 | | 3,307,320 |
(Lutheran Gen. Health Care Sys. Proj.) 7.375% 7/1/19 (Escrowed to Maturity) | | 1,915,000 | | 2,317,552 |
(Quinnipiac Univ. Proj.): | | | | |
Series J, 5.75% 7/1/33 (Nat'l. Pub. Fin. Guarantee Corp. Insured) | | 2,000,000 | | 2,323,680 |
Municipal Bonds - continued |
| Principal Amount | | Value |
Connecticut - continued |
Connecticut Health & Edl. Facilities Auth. Rev.: - continued | | | | |
(Quinnipiac Univ. Proj.): | | | | |
Series K1, 5% 7/1/27 (Nat'l. Pub. Fin. Guarantee Corp. Insured) | | $ 2,000,000 | | $ 2,250,780 |
(Sacred Heart Univ. Proj.) Series G: | | | | |
5% 7/1/17 | | 1,000,000 | | 1,135,130 |
5% 7/1/18 | | 1,000,000 | | 1,147,760 |
(Saint Raphael Hosp. Proj.) Series H, 6.5% 7/1/13 (Escrowed to Maturity) | | 2,755,000 | | 2,852,913 |
(Stamford Hosp. Proj.) Series I, 5% 7/1/30 | | 12,640,000 | | 14,304,182 |
(Wesleyan Univ. Proj.) Series G: | | | | |
5% 7/1/29 | | 3,000,000 | | 3,599,130 |
5% 7/1/30 | | 2,000,000 | | 2,390,160 |
(William W. Backus Hosp. Proj.) Series F, 5.125% 7/1/35 (FSA Insured) | | 1,000,000 | | 1,107,730 |
(Yale Univ. Proj.): | | | | |
Series Y1, 5% 7/1/35 | | 5,000,000 | | 5,512,000 |
Series Z1, 5% 7/1/42 | | 3,335,000 | | 3,748,140 |
(Yale-New Haven Hosp. Proj.) Series J1: | | | | |
5% 7/1/17 (AMBAC Insured) | | 3,095,000 | | 3,466,926 |
5% 7/1/18 (AMBAC Insured) | | 3,020,000 | | 3,388,531 |
5% 7/1/19 (AMBAC Insured) | | 2,035,000 | | 2,275,781 |
5% 7/1/31 (AMBAC Insured) | | 5,000,000 | | 5,438,850 |
Series 2011 M, 5.375% 7/1/41 | | 5,485,000 | | 6,368,634 |
Series G, 5% 7/1/39 | | 1,000,000 | | 1,160,250 |
Series H1, 5% 7/1/41 | | 1,250,000 | | 1,430,588 |
Series J: | | | | |
5% 11/1/24 | | 1,390,000 | | 1,735,026 |
5% 11/1/25 | | 1,465,000 | | 1,823,222 |
Connecticut Muni. Elec. Energy Coop. Transmission Svcs. Rev. Series 2012 A: | | | | |
5% 1/1/23 | | 1,380,000 | | 1,708,992 |
5% 1/1/25 | | 875,000 | | 1,076,294 |
Connecticut Resource Recovery Auth. Resource Recovery Rev. (Covanta Southeastern Connecticut Co. Proj.) Series 2010 A, 4% 11/15/14 (c) | | 1,520,000 | | 1,599,435 |
Connecticut Spl. Tax Oblig. Trans. Infrastructure Rev.: | | | | |
Series 2004 A: | | | | |
5% 7/1/18 (AMBAC Insured) | | 2,000,000 | | 2,219,920 |
5% 7/1/23 | | 3,260,000 | | 3,579,806 |
Series 2007 A: | | | | |
5% 8/1/26 | | 3,800,000 | | 4,386,568 |
Municipal Bonds - continued |
| Principal Amount | | Value |
Connecticut - continued |
Connecticut Spl. Tax Oblig. Trans. Infrastructure Rev.: - continued | | | | |
Series 2007 A: | | | | |
5% 8/1/27 (AMBAC Insured) | | $ 2,000,000 | | $ 2,302,900 |
Series 2008 A, 5% 11/1/21 | | 5,000,000 | | 6,048,300 |
Series 2009 1, 5% 2/1/17 | | 10,000,000 | | 11,717,600 |
Series 2010 C, 5% 11/1/20 | | 1,085,000 | | 1,371,700 |
Series 2011 A, 5% 12/1/25 | | 5,000,000 | | 6,242,450 |
Connecticut State Revolving Fund Gen. Rev.: | | | | |
Series 2008 A: | | | | |
5% 2/1/16 | | 5,500,000 | | 6,257,130 |
5% 2/1/17 | | 3,000,000 | | 3,528,750 |
Series 2009 A: | | | | |
5% 6/1/23 | | 1,750,000 | | 2,151,678 |
5% 6/1/25 | | 7,210,000 | | 8,819,633 |
5% 6/1/26 | | 2,000,000 | | 2,438,180 |
Danbury Gen. Oblig.: | | | | |
Series 2010 B, 5% 7/1/20 | | 1,220,000 | | 1,544,508 |
Series 2011: | | | | |
5% 7/15/22 | | 1,000,000 | | 1,268,790 |
5% 7/15/23 | | 1,300,000 | | 1,636,349 |
5% 7/15/24 | | 410,000 | | 514,218 |
5% 7/15/25 | | 350,000 | | 437,700 |
East Lyme Gen. Oblig. Series 2010: | | | | |
4% 7/15/17 | | 260,000 | | 296,197 |
4% 7/15/18 | | 535,000 | | 621,408 |
4% 7/15/19 | | 335,000 | | 395,374 |
4% 7/15/21 | | 360,000 | | 425,923 |
4% 7/15/22 | | 325,000 | | 379,412 |
Enfield Gen. Oblig. Series 2009: | | | | |
5% 7/1/17 | | 820,000 | | 965,427 |
5% 7/1/18 | | 350,000 | | 420,641 |
Fairfield Gen. Oblig.: | | | | |
Series 2009, 5% 7/1/20 | | 1,500,000 | | 1,923,900 |
5% 7/1/17 | | 1,000,000 | | 1,195,150 |
5% 7/1/18 | | 1,000,000 | | 1,229,670 |
Farmington Gen. Oblig.: | | | | |
Series 2009 B: | | | | |
4% 9/15/17 | | 740,000 | | 810,063 |
4% 9/15/19 | | 500,000 | | 548,065 |
4% 9/15/20 | | 250,000 | | 271,570 |
Series A: | | | | |
4% 9/15/20 | | 1,445,000 | | 1,702,441 |
Municipal Bonds - continued |
| Principal Amount | | Value |
Connecticut - continued |
Farmington Gen. Oblig.: - continued | | | | |
Series A: | | | | |
4% 9/15/21 | | $ 905,000 | | $ 1,053,447 |
5% 9/15/19 | | 325,000 | | 407,319 |
Greater New Haven Wtr. Poll. Cont. Auth. Reg'l. Wastewtr. Sys. Rev.: | | | | |
Series 2005 A, 5% 8/15/35 (Nat'l. Pub. Fin. Guarantee Corp. Insured) | | 1,000,000 | | 1,086,550 |
Series 2008 A, 5% 11/15/37 (FSA Insured) | | 1,000,000 | | 1,112,160 |
Hartford Gen. Oblig.: | | | | |
Series 2005 A, 5.25% 8/1/15 (FSA Insured) | | 1,335,000 | | 1,489,273 |
Series 2005 D: | | | | |
5% 9/1/19 (Nat'l. Pub. Fin. Guarantee Corp. Insured) | | 1,700,000 | | 1,894,990 |
5% 9/1/22 (Nat'l. Pub. Fin. Guarantee Corp. Insured) | | 1,700,000 | | 1,866,736 |
Series 2009, 5% 11/15/17 (Assured Guaranty Corp. Insured) | | 1,000,000 | | 1,184,000 |
Series 2012 A: | | | | |
5% 4/1/20 (FSA Insured) | | 1,000,000 | | 1,199,600 |
5% 4/1/21 (FSA Insured) | | 1,000,000 | | 1,207,620 |
5% 4/1/22 (FSA Insured) | | 1,000,000 | | 1,216,920 |
5% 4/1/24 | | 2,500,000 | | 2,980,100 |
Meriden Gen. Oblig. Series 2010 B: | | | | |
5% 8/1/14 | | 1,335,000 | | 1,435,299 |
5% 8/1/15 | | 1,000,000 | | 1,113,210 |
5% 8/1/17 | | 2,680,000 | | 3,178,507 |
Monroe Gen. Oblig. Series 2009: | | | | |
4% 5/1/13 | | 500,000 | | 507,720 |
4% 5/1/14 | | 800,000 | | 841,480 |
5% 5/1/15 | | 500,000 | | 551,320 |
5% 5/1/16 | | 1,000,000 | | 1,141,180 |
5% 5/1/18 | | 500,000 | | 605,570 |
Naugatuck Ctfs. of Prtn. (Incineration Facilities Proj.) Series A: | | | | |
5% 6/15/14 (AMBAC Insured) (c) | | 1,335,000 | | 1,364,183 |
5% 6/15/17 (AMBAC Insured) (c) | | 775,000 | | 784,843 |
Naugatuck Gen. Oblig. 5.875% 2/15/21 (AMBAC Insured) | | 1,985,000 | | 2,188,820 |
New Canaan Gen. Oblig. Series 2009 A, 5% 4/1/19 | | 1,015,000 | | 1,265,938 |
New Haven Gen. Oblig.: | | | | |
Series 2002 C, 5.125% 11/1/16 (Escrowed to Maturity) | | 30,000 | | 32,889 |
Municipal Bonds - continued |
| Principal Amount | | Value |
Connecticut - continued |
New Haven Gen. Oblig.: - continued | | | | |
Series 2005, 5% 2/1/15 (Nat'l. Pub. Fin. Guarantee Corp. Insured) | | $ 1,705,000 | | $ 1,847,385 |
Series 2006: | | | | |
5% 11/1/15 (AMBAC Insured) | | 2,575,000 | | 2,857,452 |
5% 11/1/16 (AMBAC Insured) | | 6,000,000 | | 6,850,020 |
Series 2009 A: | | | | |
5% 3/1/20 (Assured Guaranty Corp. Insured) | | 1,000,000 | | 1,188,020 |
5% 3/1/25 (Assured Guaranty Corp. Insured) | | 2,000,000 | | 2,313,360 |
5.25% 3/1/19 (Assured Guaranty Corp. Insured) | | 2,000,000 | | 2,430,420 |
Series 2012 A: | | | | |
4% 11/1/22 (FSA Insured) | | 2,185,000 | | 2,493,609 |
5% 11/1/17 | | 1,900,000 | | 2,207,477 |
5% 11/1/18 | | 2,005,000 | | 2,371,534 |
Series B, 5% 8/1/21 (FSA Insured) | | 2,225,000 | | 2,733,190 |
New Milford Gen. Oblig. Series 2004: | | | | |
5% 1/15/16 (AMBAC Insured) | | 1,025,000 | | 1,158,701 |
5% 1/15/17 (AMBAC Insured) | | 1,025,000 | | 1,193,777 |
Newtown Gen. Oblig. Series 2009 B, 5% 7/1/18 | | 600,000 | | 732,306 |
Norwalk Gen. Oblig.: | | | | |
Series 2010 B: | | | | |
4.5% 7/1/21 | | 1,465,000 | | 1,790,201 |
5% 7/1/23 | | 975,000 | | 1,210,511 |
5% 7/1/26 | | 625,000 | | 768,463 |
Series 2011 A: | | | | |
4% 7/1/22 | | 1,000,000 | | 1,183,610 |
4% 7/1/23 | | 1,000,000 | | 1,174,030 |
4% 7/1/24 | | 1,000,000 | | 1,169,700 |
Oxford Gen. Oblig. Series 2011: | | | | |
4% 8/1/19 | | 500,000 | | 597,770 |
4% 8/1/20 | | 200,000 | | 237,830 |
Plainville Gen. Oblig. Series 2010 A: | | | | |
4% 7/15/19 | | 600,000 | | 697,344 |
4% 7/15/21 | | 600,000 | | 697,194 |
4% 7/15/22 | | 600,000 | | 687,972 |
4% 7/15/23 | | 600,000 | | 684,324 |
Reg'l. School District #15: | | | | |
4% 7/1/16 | | 750,000 | | 830,430 |
4% 7/1/22 | | 1,520,000 | | 1,754,551 |
Municipal Bonds - continued |
| Principal Amount | | Value |
Connecticut - continued |
South Central Reg'l. Wtr. Auth. Wtr. Sys. Rev.: | | | | |
Eighteenth Series B: | | | | |
5.25% 8/1/31 (Nat'l. Pub. Fin. Guarantee Corp. Insured) | | $ 1,500,000 | | $ 1,744,920 |
5.25% 8/1/32 (Nat'l. Pub. Fin. Guarantee Corp. Insured) | | 1,510,000 | | 1,751,585 |
Eighteenth Series B1, 5% 8/1/28 (Nat'l. Pub. Fin. Guarantee Corp. Insured) | | 4,655,000 | | 4,942,446 |
Twentieth Series A: | | | | |
5.25% 8/1/19 (Nat'l. Pub. Fin. Guarantee Corp. Insured) | | 1,020,000 | | 1,279,019 |
5.25% 8/1/21 (Nat'l. Pub. Fin. Guarantee Corp. Insured) | | 2,795,000 | | 3,590,429 |
Twenty-Second Series, 5% 8/1/38 (FSA Insured) | | 25,000,000 | | 28,290,486 |
Twenty-Seventh Series, 5% 8/1/30 | | 4,355,000 | | 5,372,023 |
Stamford Gen. Oblig.: | | | | |
Series 2009 B: | | | | |
5% 7/1/17 | | 4,520,000 | | 5,386,303 |
5% 7/1/18 | | 3,600,000 | | 4,400,388 |
Series 2011, 4% 7/1/23 | | 1,045,000 | | 1,245,138 |
5.25% 7/15/15 | | 3,000,000 | | 3,089,850 |
Trumbull Gen. Oblig.: | | | | |
Series 2004, 5% 1/15/17 (AMBAC Insured) | | 1,100,000 | | 1,164,944 |
Series 2009: | | | | |
4% 9/15/17 | | 850,000 | | 976,812 |
4% 9/15/19 | | 400,000 | | 473,836 |
4% 9/15/20 | | 525,000 | | 614,812 |
4% 9/15/21 | | 500,000 | | 580,265 |
Univ. of Connecticut Gen. Oblig.: | | | | |
Series 2010 A, 5% 2/15/29 | | 2,805,000 | | 3,444,203 |
Series 2011 A, 5% 2/15/27 | | 3,000,000 | | 3,687,210 |
Univ. of Connecticut Rev. Series 2012 A: | | | | |
5% 11/15/21 (a) | | 1,000,000 | | 1,291,930 |
5% 11/15/23 (a) | | 2,700,000 | | 3,483,459 |
Vernon Gen. Oblig. Series 2012: | | | | |
4% 8/1/20 | | 1,135,000 | | 1,348,505 |
4% 8/1/22 | | 1,000,000 | | 1,149,710 |
4.25% 8/1/21 | | 1,000,000 | | 1,190,210 |
Watertown Gen. Oblig.: | | | | |
Series 2005, 5% 8/1/18 (Nat'l. Pub. Fin. Guarantee Corp. Insured) | | 1,060,000 | | 1,293,211 |
Municipal Bonds - continued |
| Principal Amount | | Value |
Connecticut - continued |
Watertown Gen. Oblig.: - continued | | | | |
Series 2009 B: | | | | |
4.5% 7/1/20 | | $ 1,375,000 | | $ 1,651,293 |
5% 7/1/18 | | 2,635,000 | | 3,208,033 |
5% 7/1/19 | | 1,000,000 | | 1,245,890 |
West Hartford Gen. Oblig. Series 2010 A: | | | | |
5% 7/1/20 | | 2,195,000 | | 2,806,132 |
5% 7/1/21 | | 1,000,000 | | 1,274,260 |
5% 7/1/22 | | 1,210,000 | | 1,519,942 |
West Haven Gen. Oblig. Series 2005, 5% 7/1/15 (Nat'l. Pub. Fin. Guarantee Corp. Insured) | | 2,480,000 | | 2,658,486 |
Weston Gen. Oblig. Series 2010 B: | | | | |
5% 8/1/21 | | 1,750,000 | | 2,217,425 |
5% 8/1/22 | | 2,000,000 | | 2,497,880 |
Westport Gen. Oblig.: | | | | |
Series 2009 A, 4% 2/1/22 | | 800,000 | | 914,632 |
Series 2009, 5% 2/1/21 | | 480,000 | | 586,954 |
Series 2010: | | | | |
4% 11/1/20 | | 1,050,000 | | 1,282,607 |
4% 11/1/21 | | 1,000,000 | | 1,208,060 |
Wilton Gen. Oblig. Series 2009: | | | | |
5% 1/15/18 | | 300,000 | | 362,640 |
5% 1/15/20 | | 350,000 | | 442,572 |
Windsor Gen. Oblig. Series 2010 B: | | | | |
4% 7/15/18 | | 530,000 | | 607,661 |
4% 7/15/19 | | 500,000 | | 569,125 |
4% 7/15/20 | | 460,000 | | 519,814 |
| | 544,779,196 |
Guam - 0.4% |
Guam Ed. Fing. Foundation Ctfs. of Prtn. Series 2006 A, 5% 10/1/14 | | 1,000,000 | | 1,030,320 |
Guam Pwr. Auth. Rev. Series 2012 A, 5% 10/1/24 (FSA Insured) | | 1,100,000 | | 1,292,060 |
| | 2,322,380 |
Puerto Rico - 6.0% |
Puerto Rico Commonwealth Hwy. & Trans. Auth. Hwy. Rev.: | | | | |
Series AA: | | | | |
5.5% 7/1/19 (Escrowed to Maturity) | | 2,035,000 | | 2,643,139 |
5.5% 7/1/19 (Nat'l. Pub. Fin. Guarantee Corp. Insured) | | 465,000 | | 523,525 |
Municipal Bonds - continued |
| Principal Amount | | Value |
Puerto Rico - continued |
Puerto Rico Commonwealth Hwy. & Trans. Auth. Hwy. Rev.: - continued | | | | |
Series CC, 5.25% 7/1/33 | | $ 2,495,000 | | $ 2,921,695 |
Puerto Rico Commonwealth Hwy. & Trans. Auth. Trans. Rev. Series E, 5.5% 7/1/17 (FSA Insured) | | 5,400,000 | | 6,209,082 |
Puerto Rico Commonwealth Infrastructure Fing. Auth. Series 2005 C, 5.5% 7/1/17 (AMBAC Insured) | | 6,010,000 | | 6,620,316 |
Puerto Rico Commonwealth Pub. Impt. Gen. Oblig.: | | | | |
(Pub. Impt. Proj.) Series 2002 A, 5.5% 7/1/20 (Nat'l. Pub. Fin. Guarantee Corp. Insured) | | 2,000,000 | | 2,231,600 |
Series 2002 A, 5.5% 7/1/18 (Nat'l. Pub. Fin. Guarantee Corp. Insured) | | 250,000 | | 278,183 |
Series 2007 A, 5.5% 7/1/19 (Nat'l. Pub. Fin. Guarantee Corp. Insured) | | 2,000,000 | | 2,226,760 |
Puerto Rico Elec. Pwr. Auth. Pwr. Rev.: | | | | |
Series JJ, 5.25% 7/1/15 (Nat'l. Pub. Fin. Guarantee Corp. Insured) | | 5,000,000 | | 5,408,000 |
Series QQ: | | | | |
5.25% 7/1/14 (XL Cap. Assurance, Inc. Insured) | | 1,300,000 | | 1,375,244 |
5.5% 7/1/18 (XL Cap. Assurance, Inc. Insured) | | 800,000 | | 909,824 |
Series VV, 5.25% 7/1/24 (Nat'l. Pub. Fin. Guarantee Corp. Insured) | | 2,500,000 | | 2,814,325 |
Puerto Rico Muni. Fin. Agcy. Series 2005 C, 5.25% 8/1/17 (FSA Insured) | | 2,000,000 | | 2,282,740 |
| | 36,444,433 |
Virgin Islands - 0.4% |
Virgin Islands Pub. Fin. Auth. Series 2009 B, 5% 10/1/17 | | 2,250,000 | | 2,497,478 |
TOTAL INVESTMENT PORTFOLIO - 96.8% (Cost $537,751,567) | | 586,043,487 |
NET OTHER ASSETS (LIABILITIES) - 3.2% | | 19,188,752 |
NET ASSETS - 100% | $ 605,232,239 |
Legend |
(a) Security or a portion of the security purchased on a delayed delivery or when-issued basis. |
(b) Coupon rates for floating and adjustable rate securities reflect the rates in effect at period end. |
(c) Private activity obligations whose interest is subject to the federal alternative minimum tax for individuals. |
Other Information |
All investments are categorized as Level 2 under the Fair Value Hierarchy. The inputs or methodology used for valuing securities may not be an indication of the risk associated with investing in those securities. For more information on valuation inputs, please refer to the Investment Valuation section in the accompanying Notes to Financial Statements. |
The distribution of municipal securities by revenue source, as a percentage of total net assets, is as follows (Unaudited): |
General Obligations | 49.4% |
Water & Sewer | 11.9% |
Health Care | 11.4% |
Special Tax | 9.5% |
Education | 8.6% |
Others* (Individually Less Than 5%) | 9.2% |
| 100.0% |
*Includes net other assets |
See accompanying notes which are an integral part of the financial statements.
Annual Report
Fidelity Connecticut Municipal Income Fund
Statement of Assets and Liabilities
| November 30, 2012 |
| | |
Assets | | |
Investment in securities, at value - See accompanying schedule: Unaffiliated issuers (cost $537,751,567) | | $ 586,043,487 |
Cash | | 17,242,601 |
Receivable for fund shares sold | | 119,148 |
Interest receivable | | 7,769,571 |
Prepaid expenses | | 1,677 |
Other receivables | | 4,280 |
Total assets | | 611,180,764 |
| | |
Liabilities | | |
Payable for investments purchased on a delayed delivery basis | $ 4,773,062 | |
Payable for fund shares redeemed | 337,889 | |
Distributions payable | 462,843 | |
Accrued management fee | 182,726 | |
Other affiliated payables | 148,683 | |
Other payables and accrued expenses | 43,322 | |
Total liabilities | | 5,948,525 |
| | |
Net Assets | | $ 605,232,239 |
Net Assets consist of: | | |
Paid in capital | | $ 553,828,635 |
Undistributed net investment income | | 65,714 |
Accumulated undistributed net realized gain (loss) on investments | | 3,045,970 |
Net unrealized appreciation (depreciation) on investments | | 48,291,920 |
Net Assets, for 49,357,934 shares outstanding | | $ 605,232,239 |
Net Asset Value, offering price and redemption price per share ($605,232,239 ÷ 49,357,934 shares) | | $ 12.26 |
See accompanying notes which are an integral part of the financial statements.
Annual Report
Statement of Operations
| Year ended November 30, 2012 |
| | |
Investment Income | | |
Interest | | $ 19,910,228 |
| | |
Expenses | | |
Management fee | $ 2,119,408 | |
Transfer agent fees | 439,385 | |
Accounting fees and expenses | 141,983 | |
Custodian fees and expenses | 6,951 | |
Independent trustees' compensation | 2,139 | |
Registration fees | 23,727 | |
Audit | 50,899 | |
Legal | 4,624 | |
Miscellaneous | 4,946 | |
Total expenses before reductions | 2,794,062 | |
Expense reductions | (8,734) | 2,785,328 |
Net investment income (loss) | | 17,124,900 |
Realized and Unrealized Gain (Loss) Net realized gain (loss) on: | | |
Investment securities: | | |
Unaffiliated issuers | | 3,244,261 |
Change in net unrealized appreciation (depreciation) on investment securities | | 24,324,508 |
Net gain (loss) | | 27,568,769 |
Net increase (decrease) in net assets resulting from operations | | $ 44,693,669 |
See accompanying notes which are an integral part of the financial statements.
Annual Report
Fidelity Connecticut Municipal Income Fund
Financial Statements - continued
Statement of Changes in Net Assets
| Year ended
November 30, 2012 | Year ended
November 30, 2011 |
Increase (Decrease) in Net Assets | | |
Operations | | |
Net investment income (loss) | $ 17,124,900 | $ 17,525,619 |
Net realized gain (loss) | 3,244,261 | 4,019,078 |
Change in net unrealized appreciation (depreciation) | 24,324,508 | 8,326,175 |
Net increase (decrease) in net assets resulting
from operations | 44,693,669 | 29,870,872 |
Distributions to shareholders from net investment income | (17,069,207) | (17,520,408) |
Distributions to shareholders from net realized gain | (3,724,173) | (2,210,578) |
Total distributions | (20,793,380) | (19,730,986) |
Share transactions
Proceeds from sales of shares | 98,924,672 | 93,093,450 |
Reinvestment of distributions | 13,985,491 | 13,264,729 |
Cost of shares redeemed | (78,034,109) | (171,553,670) |
Net increase (decrease) in net assets resulting from share transactions | 34,876,054 | (65,195,491) |
Redemption fees | 1,067 | 3,676 |
Total increase (decrease) in net assets | 58,777,410 | (55,051,929) |
| | |
Net Assets | | |
Beginning of period | 546,454,829 | 601,506,758 |
End of period (including undistributed net investment income of $65,714 and undistributed net investment income of $59,141, respectively) | $ 605,232,239 | $ 546,454,829 |
Other Information Shares | | |
Sold | 8,231,110 | 8,140,912 |
Issued in reinvestment of distributions | 1,164,938 | 1,160,690 |
Redeemed | (6,495,294) | (15,178,209) |
Net increase (decrease) | 2,900,754 | (5,876,607) |
See accompanying notes which are an integral part of the financial statements.
Annual Report
Financial Highlights
Years ended November 30, | 2012 | 2011 | 2010 | 2009 | 2008 |
Selected Per-Share Data | | | | | |
Net asset value, beginning of period | $ 11.76 | $ 11.49 | $ 11.46 | $ 10.64 | $ 11.32 |
Income from Investment Operations | | | | | |
Net investment income (loss) B | .355 | .378 | .373 | .407 | .426 |
Net realized and unrealized gain (loss) | .579 | .313 | .078 | .879 | (.651) |
Total from investment operations | .934 | .691 | .451 | 1.286 | (.225) |
Distributions from net investment income | (.354) | (.377) | (.372) | (.408) | (.426) |
Distributions from net realized gain | (.080) | (.044) | (.049) | (.058) | (.030) |
Total distributions | (.434) | (.421) | (.421) | (.466) | (.456) |
Redemption fees added to paid in capital B | - D | - D | - D | - D | .001 |
Net asset value, end of period | $ 12.26 | $ 11.76 | $ 11.49 | $ 11.46 | $ 10.64 |
Total Return A | 8.08% | 6.18% | 3.99% | 12.31% | (2.06)% |
Ratios to Average Net Assets C | | | | | |
Expenses before reductions | .48% | .48% | .48% | .48% | .48% |
Expenses net of fee waivers, if any | .48% | .48% | .48% | .48% | .48% |
Expenses net of all reductions | .48% | .48% | .48% | .48% | .44% |
Net investment income (loss) | 2.95% | 3.29% | 3.23% | 3.64% | 3.84% |
Supplemental Data | | | | | |
Net assets, end of period (000 omitted) | $ 605,232 | $ 546,455 | $ 601,507 | $ 587,643 | $ 462,018 |
Portfolio turnover rate | 14% | 14% | 12% | 15% | 15% |
A Total returns would have been lower if certain expenses had not been reduced during the applicable periods shown.
B Calculated based on average shares outstanding during the period.
C Expense ratios reflect operating expenses of the Fund. Expenses before reductions do not reflect amounts reimbursed by the investment adviser or reductions from expense offset arrangements and do not represent the amount paid by the Fund during periods when reimbursements or reductions occur. Expenses net of fee waivers reflect expenses after reimbursement by the investment adviser but prior to reductions from expense offset arrangements. Expenses net of all reductions represent the net expenses paid by the Fund.
D Amount represents less than $.001 per share.
See accompanying notes which are an integral part of the financial statements.
Annual Report
Fidelity Connecticut Municipal Money Market Fund
Investment Changes/Performance (Unaudited)
Effective Maturity Diversification |
Days | % of fund's investments 11/30/12 | % of fund's investments 5/31/12 | % of fund's
investments
11/30/11 |
1 - 7 | 75.0 | 75.0 | 70.7 |
8 - 30 | 3.6 | 1.3 | 3.8 |
31 - 60 | 7.1 | 3.4 | 6.5 |
61 - 90 | 2.0 | 0.4 | 0.9 |
91 - 180 | 5.3 | 6.1 | 11.5 |
> 180 | 7.0 | 13.8 | 6.6 |
Effective maturity is determined in accordance with the requirements of Rule 2a-7 under the Investment Company Act of 1940. |
Weighted Average Maturity |
| 11/30/12 | 5/31/12 | 11/30/11 |
Fidelity Connecticut Municipal Money Market Fund | 37 Days | 48 Days | 41 Days |
Connecticut Tax-Free Money Market
Funds Average* | 37 Days | 44 Days | 41 Days |
This is a weighted average of all the maturities of the securities held in a fund. Weighted Average Maturity (WAM) can be used as a measure of sensitivity to interest rate changes and market changes. Generally, the longer the maturity, the greater the sensitivity to such changes. WAM is based on the dollar-weighted average length of time until principal payments must be paid. Depending on the types of securities held in a fund, certain maturity shortening devices (e.g., demand features, interest rate resets, and call options) may be taken into account when calculating the WAM. |
Weighted Average Life |
| 11/30/12 | 5/31/12 | 11/30/11 |
Fidelity Connecticut Municipal Money Market Fund | 40 Days | 50 Days | 45 Days |
Weighted Average Life (WAL) is the weighted average of the life of the securities held in a fund or portfolio and can be used as a measure of sensitivity to changes in liquidity and/or credit risk. Generally, the higher the value, the greater the sensitivity. WAL is based on the dollar-weighted average length of time until principal payments must be paid, taking into account any call options exercised by the issuer and any permissible maturity shortening features other than interest rate resets. The difference between WAM and WAL is that WAM takes into account interest rate resets and WAL does not. WAL for money market funds is not the same as WAL of a mortgage- or asset-backed security. |
* Source: iMoneyNet, Inc.
Annual Report
Asset Allocation (% of fund's net assets) |
As of November 30, 2012 | As of May 31, 2012 |
| Variable Rate
Demand Notes
(VRDNs) 54.5% | | | Variable Rate
Demand Notes
(VRDNs) 59.8% | |
 | Other Municipal
Debt 29.7% | | | Other Municipal
Debt 26.5% | |
 | Investment
Companies 16.1% | | | Investment
Companies 13.7% | |
 | Net Other Assets (Liabilities)** (0.3)% | | | Net Other Assets (Liabilities)** 0.0% | |

** Net Other Assets (Liabilities) are not included in the pie chart.
Current and Historical Seven-Day Yields |
| 11/30/12 | 8/31/12 | 5/31/12 | 2/29/12 | 11/28/11 |
| | | | | |
Connecticut Municipal Money
Market Fund | 0.01% | 0.01% | 0.01% | 0.01% | 0.01% |
Yield refers to the income paid by the fund over a given period. Yields for money market funds are usually for seven-day periods, as they are here, though they are expressed as annual percentage rates. Past performance is no guarantee of future results. Yield will vary and it's possible to lose money investing in the Fund. A portion of the fund's expenses was reimbursed and/or waived. Absent such reimbursements and/or waivers the yield for the period ending November 30, 2012, the most recent period shown in the table, would have been -0.30%
Annual Report
Fidelity Connecticut Municipal Money Market Fund
Investments November 30, 2012
Showing Percentage of Net Assets
Variable Rate Demand Note - 54.5% |
| Principal Amount | | Value |
Alabama - 0.1% |
Decatur Indl. Dev. Board Exempt Facilities Rev. (Nucor Steel Decatur LLC Proj.) Series 2003 A, 0.45% 12/7/12, VRDN (b)(e) | $ 1,100,000 | | $ 1,100,000 |
Connecticut - 48.9% |
Austin Trust Various States Participating VRDN Series BA 08 1086, 0.22% 12/7/12 (Liquidity Facility Bank of America NA) (b)(f) | 2,000,000 | | 2,000,000 |
Connecticut Dev. Auth. Arpt. Facility Rev. (Embraer Aircraft Holding, Inc. Proj.) Series 2010 A, 0.15% 12/7/12, LOC Citibank NA, VRDN (b) | 11,045,000 | | 11,045,000 |
Connecticut Dev. Auth. Wtr. Facilities Rev. (Connecticut Wtr. Co. Proj.): | | | |
Series 2004 A, 0.5% 12/7/12, LOC RBS Citizens NA, VRDN (b)(e) | 5,000,000 | | 5,000,000 |
Series 2004 B, 0.45% 12/7/12, LOC RBS Citizens NA, VRDN (b) | 4,550,000 | | 4,550,000 |
Connecticut Gen. Oblig.: | | | |
Participating VRDN: | | | |
Series Putters 3996, 0.17% 12/7/12 (Liquidity Facility JPMorgan Chase Bank) (b)(f) | 10,000,000 | | 10,000,000 |
Series WF 11 89C, 0.19% 12/7/12 (Liquidity Facility Wells Fargo Bank NA) (b)(f) | 23,100,000 | | 23,100,000 |
Series B, 0.15% 12/7/12 (Liquidity Facility Bayerische Landesbank Girozentrale), VRDN (b) | 16,460,000 | | 16,460,000 |
Connecticut Health & Edl. Facilities Auth. Rev.: | | | |
(Avon Old Farms Proj.): | | | |
Series A, 0.21% 12/7/12, LOC Bank of America NA, VRDN (b) | 15,120,000 | | 15,120,000 |
Series B, 0.21% 12/7/12, LOC Bank of America NA, VRDN (b) | 5,805,000 | | 5,805,000 |
(Charlotte Hungerford Hosp. Proj.) Series C, 0.22% 12/7/12, LOC Bank of America NA, VRDN (b) | 1,100,000 | | 1,100,000 |
(Choate Rosemary Hall Proj.) Series D, 0.16% 12/7/12, LOC JPMorgan Chase Bank, VRDN (b) | 8,405,000 | | 8,405,000 |
(Eastern Connecticut Health Network Proj.) Series 2010 E, 0.17% 12/7/12, LOC TD Banknorth, NA, VRDN (b) | 13,470,000 | | 13,470,000 |
(Gaylord Hosp. Proj.) Series B, 0.21% 12/7/12, LOC Bank of America NA, VRDN (b) | 16,665,000 | | 16,665,000 |
(Greenwich Hosp. Proj.) Series C, 0.17% 12/7/12, LOC Bank of America NA, VRDN (b) | 35,055,000 | | 35,055,000 |
(Griffin Hosp. Proj.) Series C, 0.15% 12/7/12, LOC Wells Fargo Bank NA, VRDN (b) | 20,300,000 | | 20,300,000 |
(Hamden Hall Country Day School Proj.) Series A, 0.22% 12/7/12, LOC RBS Citizens NA, VRDN (b) | 14,750,000 | | 14,750,000 |
Variable Rate Demand Note - continued |
| Principal Amount | | Value |
Connecticut - continued |
Connecticut Health & Edl. Facilities Auth. Rev.: - continued | | | |
(Hosp. for Spl. Care Proj.) Series E, 0.17% 12/7/12, LOC Fed. Home Ln. Bank of Boston, VRDN (b) | $ 10,510,000 | | $ 10,510,000 |
(Masonicare Corp. Proj.) Series C, 0.18% 12/7/12, LOC Manufacturers & Traders Trust Co., VRDN (b) | 73,680,000 | | 73,680,000 |
(Pierce Memorial Baptist Home Proj.) Series A, 0.17% 12/7/12, LOC Bank of America NA, VRDN (b) | 7,770,000 | | 7,770,000 |
(Ridgefield Academy Proj.) Series A, 0.15% 12/7/12, LOC TD Banknorth, NA, VRDN (b) | 10,490,000 | | 10,490,000 |
(Sacred Heart Univ. Proj.) Series F, 0.2% 12/7/12, LOC Bank of America NA, VRDN (b) | 19,045,000 | | 19,045,000 |
(St. Francis Hosp. & Med. Ctr. Proj.) Series F, 0.18% 12/7/12, LOC JPMorgan Chase Bank, VRDN (b) | 148,910,000 | | 148,910,000 |
(The Taft School Proj.) Series H, 0.25% 12/7/12, LOC Wells Fargo Bank NA, VRDN (b) | 4,250,000 | | 4,250,000 |
(Trinity College Proj.) Series L, 0.17% 12/7/12, LOC JPMorgan Chase Bank, VRDN (b) | 10,525,000 | | 10,525,000 |
(Wesleyan Univ. Proj.) Series H, 0.15% 12/7/12, VRDN (b) | 5,805,000 | | 5,805,000 |
(Yale Univ. Proj.): | | | |
Series U1, 0.15% 12/7/12, VRDN (b) | 8,250,000 | | 8,250,000 |
Series X2, 0.14% 12/7/12, VRDN (b) | 37,680,000 | | 37,680,000 |
(Yale-New Haven Hosp. Proj.): | | | |
Series K1, 0.16% 12/7/12, LOC JPMorgan Chase Bank, VRDN (b) | 9,200,000 | | 9,200,000 |
Series K2, 0.16% 12/7/12, LOC JPMorgan Chase Bank, VRDN (b) | 7,970,000 | | 7,970,000 |
Series L1, 0.19% 12/7/12, LOC Bank of America NA, VRDN (b) | 26,550,000 | | 26,550,000 |
Series L2, 0.19% 12/7/12, LOC Bank of America NA, VRDN (b) | 18,480,000 | | 18,480,000 |
Participating VRDN: | | | |
Series BA 08 1080, 0.19% 12/7/12 (Liquidity Facility Bank of America NA) (b)(f) | 13,114,000 | | 13,114,000 |
Series BBT 08 17, 0.16% 12/7/12 (Liquidity Facility Branch Banking & Trust Co.) (b)(f) | 10,150,000 | | 10,150,000 |
Series BBT 08 32, 0.16% 12/7/12 (Liquidity Facility Branch Banking & Trust Co.) (b)(f) | 14,360,000 | | 14,360,000 |
Series EGL 02 6027 Class A, 0.17% 12/7/12 (Liquidity Facility Citibank NA) (b)(f) | 19,805,000 | | 19,805,000 |
Series EGL 7 05 3031, 0.16% 12/7/12 (Liquidity Facility Citibank NA) (b)(f) | 51,400,000 | | 51,400,000 |
Series Floaters 13 TP, 0.16% 12/7/12 (Liquidity Facility Wells Fargo & Co.) (b)(f) | 29,200,000 | | 29,200,000 |
Variable Rate Demand Note - continued |
| Principal Amount | | Value |
Connecticut - continued |
Connecticut Health & Edl. Facilities Auth. Rev.: - continued | | | |
Participating VRDN: | | | |
Series MS 06 1884, 0.18% 12/7/12 (Liquidity Facility Wells Fargo & Co.) (b)(f) | $ 2,540,000 | | $ 2,540,000 |
Series Putters 3363, 0.17% 12/7/12 (Liquidity Facility JPMorgan Chase Bank) (b)(f) | 5,630,000 | | 5,630,000 |
Series ROC II R 11854, 0.16% 12/7/12 (Liquidity Facility Citibank NA) (b)(f) | 11,010,000 | | 11,010,000 |
Series Solar 07 27, 0.16% 12/7/12 (Liquidity Facility U.S. Bank NA, Cincinnati) (b)(f) | 25,640,000 | | 25,640,000 |
Series 2007 B, 0.17% 12/7/12, LOC TD Banknorth, NA, VRDN (b) | 12,425,000 | | 12,425,000 |
Series 2007 D, 0.21% 12/7/12, LOC Bank of America NA, VRDN (b) | 10,710,000 | | 10,710,000 |
Series 2011 B, 0.17% 12/7/12, LOC Bank of America NA, VRDN (b) | 36,590,000 | | 36,590,000 |
Connecticut Hsg. Fin. Auth.: | | | |
(CIL Realty, Inc. Proj.): | | | |
Series 2008, 0.16% 12/7/12, LOC HSBC Bank USA, NA, VRDN (b) | 7,445,000 | | 7,445,000 |
Series 2010, 0.16% 12/7/12, LOC HSBC Bank USA, NA, VRDN (b) | 4,000,000 | | 4,000,000 |
Participating VRDN Series Putters 4091, 0.23% 12/3/12 (Liquidity Facility JPMorgan Chase Bank) (b)(e)(f) | 15,230,000 | | 15,230,000 |
Stamford Hsg. Auth. Multi-family Rev. (Fairfield Apts. Proj.) Series 2010, 0.17% 12/7/12, LOC Freddie Mac, VRDN (b)(e) | 30,095,000 | | 30,095,000 |
Waterford Gen. Oblig. Participating VRDN Series Putters 4074, 0.18% 12/3/12 (Liquidity Facility JPMorgan Chase & Co.) (b)(f) | 7,065,000 | | 7,065,000 |
| | 908,349,000 |
Kentucky - 0.1% |
Carroll County Solid Waste Disp. Rev. (North American Stainless LP Proj.) Series 2000, 0.19% 12/7/12, LOC PNC Bank NA, VRDN (b)(e) | 2,000,000 | | 2,000,000 |
Louisiana - 0.1% |
Saint James Parish Gen. Oblig. (Nucor Steel Louisiana LLC Proj.) Series 2010 B1, 0.4% 12/7/12, VRDN (b) | 800,000 | | 800,000 |
Nebraska - 0.1% |
Stanton County Indl. Dev. Rev. (Nucor Corp. Proj.) Series 1996, 0.45% 12/7/12, VRDN (b)(e) | 1,100,000 | | 1,100,000 |
Variable Rate Demand Note - continued |
| Principal Amount | | Value |
New Jersey - 0.1% |
Salem County Poll. Cont. Fin. Auth. Rev. (Pub. Svc. Elec. and Gas Co. Proj.) Series 2012 A, 0.42% 12/7/12, VRDN (b)(e) | $ 1,100,000 | | $ 1,100,000 |
New York - 0.1% |
Dutchess County Indl. Dev. Agcy. Civic Facility Rev. (Lutheran Ctr. at Poughkeepsie, Inc. Proj.) 0.3% 12/7/12, LOC KeyBank NA, VRDN (b) | 2,200,000 | | 2,200,000 |
North Carolina - 0.0% |
Parson County Indl. Facilities and Poll. Cont. Fing. Auth. (CertainTeed Gypsum NC, Inc. Proj.) Series 2010, 0.3% 12/7/12, LOC Cr. Industriel et Commercial, VRDN (b) | 700,000 | | 700,000 |
Ohio - 0.3% |
Ohio Air Quality Dev. Auth. Rev. (Cincinnati Gas & Elec. Co. Proj.) Series B, 0.29% 12/7/12, VRDN (b) | 6,200,000 | | 6,200,000 |
Puerto Rico - 4.6% |
Puerto Rico Commonwealth Hwy. & Trans. Auth. Trans. Rev. Series 1998 A, 0.14% 12/7/12, LOC Bank of Nova Scotia New York Branch, VRDN (b) | 59,190,000 | | 59,190,000 |
Puerto Rico Commonwealth Pub. Impt. Gen. Oblig. Series 2003 C5-2, 0.17% 12/7/12, LOC Barclays Bank PLC NY Branch, VRDN (b) | 27,000,000 | | 27,000,000 |
| | 86,190,000 |
Tennessee - 0.1% |
Clarksville Pub. Bldg. Auth. Rev. (Tennessee Muni. Bond Fund Proj.) Series 2004, 0.21% 12/3/12, LOC Bank of America NA, VRDN (b) | 2,270,000 | | 2,270,000 |
West Virginia - 0.0% |
Marion County Solid Waste Disp. Rev. (Grant Town Cogeneration Proj.) Series 1990 A, 0.17% 12/7/12, LOC Deutsche Bank AG, VRDN (b)(e) | 800,000 | | 800,000 |
TOTAL VARIABLE RATE DEMAND NOTE | 1,012,809,000 |
Other Municipal Debt - 29.7% |
| | | |
Connecticut - 29.2% |
Berlin Gen. Oblig. BAN 1.25% 5/23/13 | 9,703,000 | | 9,751,440 |
Bethel Gen. Oblig. BAN 1.25% 8/15/13 | 7,470,000 | | 7,524,218 |
Branford Gen. Oblig. BAN Series 2012, 1.5% 8/15/13 | 5,910,000 | | 5,963,119 |
Brookfield Gen. Oblig. BAN 1.5% 1/25/13 | 7,795,000 | | 7,809,600 |
Clinton Gen. Oblig. BAN 1.25% 2/12/13 | 3,700,000 | | 3,706,648 |
Other Municipal Debt - continued |
| Principal Amount | | Value |
Connecticut - continued |
Connecticut Dev. Auth. Poll. Cont. Rev. Bonds (New England Pwr. Co. Proj.) Series 1999, 0.4% tender 12/6/12, CP mode | $ 8,465,000 | | $ 8,465,000 |
Connecticut Gen. Oblig. Bonds: | | | |
Series 2001 C: | | | |
5.5% 12/15/12 | 4,980,000 | | 4,990,139 |
5.5% 12/15/13 | 2,525,000 | | 2,663,007 |
Series 2003 B, 5% 4/15/13 (Pre-Refunded to 4/15/13 @ 100) | 5,000,000 | | 5,088,272 |
Series 2003 C, 5% 5/1/13 | 1,050,000 | | 1,070,795 |
Series 2003 F, 5% 10/15/13 | 2,500,000 | | 2,603,763 |
Series 2004 B: | | | |
5% 12/1/12 | 8,140,000 | | 8,140,000 |
5% 6/1/13 | 550,000 | | 562,913 |
Series 2004 C, 5% 4/1/13 | 3,500,000 | | 3,555,839 |
Series 2004 D, 5% 12/1/12 | 5,355,000 | | 5,355,000 |
Series 2006 F, 3.5% 12/1/12 | 500,000 | | 500,000 |
Series 2007 A, 4% 5/1/13 | 590,000 | | 598,968 |
Series 2007 B, 4% 5/1/13 | 1,100,000 | | 1,117,092 |
Series 2007 E, 5% 3/15/13 | 2,670,000 | | 2,706,526 |
Series 2008 A, 3.25% 4/15/13 | 800,000 | | 808,842 |
Series 2009 A: | | | |
3% 1/1/13 | 1,075,000 | | 1,077,541 |
4% 1/1/13 | 575,000 | | 576,742 |
5% 1/1/13 | 38,890,000 | | 39,047,516 |
5% 1/1/13 | 28,750,000 | | 28,866,727 |
5% 2/15/13 | 400,000 | | 403,905 |
5% 3/1/13 | 1,000,000 | | 1,011,811 |
Series 2010 C, 5% 12/1/12 | 1,750,000 | | 1,750,000 |
Series 2011 A, 0.31% 5/15/13 (b) | 16,950,000 | | 16,958,306 |
Series 2011 D: | | | |
2% 11/1/13 | 3,000,000 | | 3,049,415 |
3% 11/1/13 | 1,000,000 | | 1,025,129 |
5% 11/1/13 | 2,000,000 | | 2,087,524 |
Series 2012 A, 0.15% 4/15/13 (b) | 11,800,000 | | 11,800,000 |
Series 2012 C, 3% 6/1/13 | 2,145,000 | | 2,173,995 |
Series 2012 F: | | | |
1% 3/15/13 | 11,375,000 | | 11,401,362 |
1% 9/15/13 | 17,700,000 | | 17,807,256 |
Connecticut Health & Edl. Facilities Auth. Rev. Bonds: | | | |
(Yale Univ. Proj.): | | | |
Series 2010 A3, 4%, tender 2/7/13 (b) | 8,900,000 | | 8,962,204 |
Other Municipal Debt - continued |
| Principal Amount | | Value |
Connecticut - continued |
Connecticut Health & Edl. Facilities Auth. Rev. Bonds: - continued | | | |
(Yale Univ. Proj.): | | | |
Series S1, 0.18% tender 12/4/12, CP mode | $ 11,000,000 | | $ 11,000,000 |
Series S2, 0.22% tender 12/4/12, CP mode | 17,700,000 | | 17,700,000 |
Series 2010 A3, 2%, tender 2/7/13 (b) | 470,000 | | 471,461 |
Connecticut Hsg. Fin. Auth. Bonds: | | | |
Series 2008 G, 0.3%, tender 5/15/13 (b) | 4,235,000 | | 4,235,000 |
Series 2012 A, 0.22% 5/15/13 | 5,250,000 | | 5,250,000 |
Series 2012 D1, 0.22% 5/15/13 | 12,350,000 | | 12,350,000 |
Connecticut Muni. Elec. Energy Coop. Pwr. Supply Sys. Rev. Bonds Series 2009 A, 4% 1/1/13 | 2,015,000 | | 2,021,229 |
Connecticut Muni. Elec. Energy Coop. Transmission Svcs. Rev. Bonds Series 2012 A. 2% 1/1/13 | 1,755,000 | | 1,757,139 |
Connecticut Spl. Tax Oblig. Trans. Infrastructure Rev. Bonds: | | | |
Series 1998 A, 5.5% 10/1/13 | 2,000,000 | | 2,087,813 |
Series 2004 A, 5% 7/1/13 | 615,000 | | 632,017 |
Series 2005 A, 5% 7/1/13 | 7,000,000 | | 7,194,997 |
Series 2009 1, 5% 2/1/13 | 9,765,000 | | 9,843,752 |
Series 2009 A: | | | |
3% 12/1/12 | 1,265,000 | | 1,265,000 |
5% 12/1/13 | 5,575,000 | | 5,841,624 |
Series 2011 A, 5% 12/1/13 | 1,000,000 | | 1,047,441 |
Series 2011 B, 2% 12/15/12 | 45,075,000 | | 45,104,742 |
Connecticut State Revolving Fund Gen. Rev. Bonds Series 2011 A, 3.5% 1/1/13 | 1,165,000 | | 1,168,260 |
Danbury Gen. Oblig. BAN Series 2012 A, 1.25% 7/26/13 | 2,500,000 | | 2,516,343 |
Darien Gen. Oblig. Bonds Series 2012 B, 2% 2/1/13 | 620,000 | | 621,827 |
East Hampton Gen. Oblig. BAN 1.25% 8/15/13 | 3,535,000 | | 3,560,391 |
East Lyme Gen. Oblig. BAN 1.25% 7/25/13 | 3,450,000 | | 3,472,234 |
Fairfield Gen. Oblig.: | | | |
BAN Series 2012, 1.5% 7/19/13 | 12,135,000 | | 12,234,285 |
Bonds Series 2008, 3.375% 1/1/13 | 1,015,000 | | 1,017,725 |
Glastonbury Gen. Oblig. Bonds Series 2010, 5% 5/15/13 | 1,320,000 | | 1,348,473 |
Greenwich Gen. Oblig.: | | | |
BAN Series 2012, 1.5% 1/24/13 | 31,000,000 | | 31,060,263 |
Bonds: | | | |
Series 2010, 3% 1/15/13 | 1,210,000 | | 1,214,162 |
Series 2011, 5% 1/15/13 | 500,000 | | 502,939 |
Series 2012, 2% 1/15/13 | 2,440,000 | | 2,445,478 |
Hartford Gen. Oblig. Bonds Series 2012 A, 2% 4/1/13 | 2,500,000 | | 2,513,382 |
Ledyard Gen. Oblig. BAN 1.5% 10/14/13 | 4,985,000 | | 5,038,529 |
Other Municipal Debt - continued |
| Principal Amount | | Value |
Connecticut - continued |
Lyme and Old Lyme Reg'l. School District #18 Gen. Oblig. BAN Series 2012, 1.5% 1/9/13 | $ 7,825,000 | | $ 7,835,225 |
Middletown Gen. Oblig. BAN 1.5% 4/10/13 | 13,050,000 | | 13,107,942 |
Milford Gen. Oblig.: | | | |
BAN 2% 5/2/13 | 14,290,000 | | 14,398,484 |
Bonds: | | | |
Series 2012 B, 2% 11/1/13 (a) | 1,555,000 | | 1,578,994 |
Series 2012, 2% 11/1/13 | 1,170,000 | | 1,188,747 |
New Milford Gen. Oblig. BAN 1% 7/25/13 | 510,000 | | 511,972 |
Oxford Gen. Oblig. BAN 1.5% 7/25/13 | 3,964,000 | | 3,996,203 |
Redding Gen. Oblig. BAN 1.25% 3/25/13 | 1,750,000 | | 1,754,643 |
Ridgefield Gen. Oblig. BAN Lot A, 1.5% 12/18/12 | 12,690,000 | | 12,697,348 |
South Windsor Gen. Oblig. BAN Series 2012, 2% 2/20/13 | 9,035,000 | | 9,070,503 |
Stamford Gen. Oblig. Bonds Series 2011 B, 2% 12/15/12 | 3,000,000 | | 3,002,015 |
Trumbull Gen. Oblig.: | | | |
BAN 1.25% 9/6/13 | 17,426,000 | | 17,561,437 |
Bonds Series 2012, 2% 9/1/13 | 1,070,000 | | 1,083,859 |
Univ. of Connecticut Gen. Oblig. Bonds: | | | |
Series 2010 A, 5% 2/15/13 | 1,000,000 | | 1,009,907 |
Series 2011 A, 5% 2/15/13 | 3,470,000 | | 3,504,384 |
Univ. of Connecticut Rev. Bonds Series 2012 A, 1.5% 11/15/13 (a) | 2,625,000 | | 2,656,421 |
Watertown Gen. Oblig. BAN 2% 3/28/13 | 7,100,000 | | 7,140,417 |
Windsor Locks Gen. Oblig. BAN 1% 4/4/13 | 750,000 | | 751,649 |
Wolcott Gen. Oblig. BAN 1.5% 10/24/13 | 9,780,000 | | 9,883,937 |
Woodbridge Gen. Oblig. BAN 1.5% 8/23/13 | 2,935,000 | | 2,961,769 |
| | 543,192,976 |
Kentucky - 0.2% |
Jefferson County Poll. Cont. Rev. Bonds (Louisville Gas & Elec. Co. Proj.) Series 2001 A, 0.38% tender 12/10/12, CP mode | 700,000 | | 700,000 |
Trimble County Poll. Cont. Rev. Bonds (Louisville Gas & Elec. Co. Proj.) Series 2001 B, 0.4% tender 12/6/12, CP mode (e) | 2,700,000 | | 2,700,000 |
| | 3,400,000 |
New Hampshire - 0.0% |
New Hampshire Bus. Fin. Auth. Poll. Cont. Rev. Bonds (New England Pwr. Co. Proj.) Series 1990 A, 0.5% tender 1/9/13, CP mode (e) | 300,000 | | 300,000 |
Other Municipal Debt - continued |
| Principal Amount | | Value |
Virginia - 0.3% |
Halifax County Indl. Dev. Auth. Poll. Cont. Rev. Bonds (Virginia Elec. & Pwr. Co. Proj.) Series 1992, 0.95% tender 1/4/13, CP mode (e) | $ 5,100,000 | | $ 5,100,000 |
TOTAL OTHER MUNICIPAL DEBT | 551,992,976 |
Investment Company - 16.1% |
| Shares | | |
Fidelity Municipal Cash Central Fund, 0.17% (c)(d) | 298,641,000 | | 298,641,000 |
TOTAL INVESTMENT PORTFOLIO - 100.3% (Cost $1,863,442,976) | | 1,863,442,976 |
NET OTHER ASSETS (LIABILITIES) - (0.3)% | | (5,637,218) |
NET ASSETS - 100% | $ 1,857,805,758 |
Security Type Abbreviations |
BAN | - | BOND ANTICIPATION NOTE |
CP | - | COMMERCIAL PAPER |
VRDN | - | VARIABLE RATE DEMAND NOTE (A debt instrument that is payable upon demand, either daily, weekly or monthly) |
Legend |
(a) Security or a portion of the security purchased on a delayed delivery or when-issued basis. |
(b) Coupon rates for floating and adjustable rate securities reflect the rates in effect at period end. |
(c) Information in this report regarding holdings by state and security types does not reflect the holdings of the Fidelity Municipal Cash Central Fund. |
(d) Affiliated fund that is available only to investment companies and other accounts managed by Fidelity Investments. The rate quoted is the annualized seven-day yield of the fund at period end. A complete unaudited listing of the fund's holdings as of its most recent quarter end is available upon request. In addition, each Fidelity Central Fund's financial statements, which are not covered by the Fund's Report of Independent Registered Public Accounting Firm, are available on the SEC's website or upon request. |
(e) Private activity obligations whose interest is subject to the federal alternative minimum tax for individuals. |
(f) Provides evidence of ownership in one or more underlying municipal bonds. |
Affiliated Central Funds |
Information regarding fiscal year to date income earned by the Fund from investments in Fidelity Central Funds is as follows: |
Fund | Income earned |
Fidelity Municipal Cash Central Fund | $ 404,744 |
Other Information |
The date shown for securities represents the date when principal payments must be paid, taking into account any call options exercised by the issuer and any permissible maturity shortening features other than interest rate resets. |
All investments are categorized as Level 2 under the Fair Value Hierarchy. The inputs or methodology used for valuing securities may not be an indication of the risk associated with investing in those securities. For more information on valuation inputs, please refer to the Investment Valuation section in the accompanying Notes to Financial Statements. |
See accompanying notes which are an integral part of the financial statements.
Annual Report
Fidelity Connecticut Municipal Money Market Fund
Statement of Assets and Liabilities
| November 30, 2012 |
| | |
Assets | | |
Investment in securities, at value - See accompanying schedule: Unaffiliated issuers (cost $1,564,801,976) | $ 1,564,801,976 | |
Fidelity Central Funds (cost $298,641,000) | 298,641,000 | |
Total Investments (cost $1,863,442,976) | | $ 1,863,442,976 |
Cash | | 95,771 |
Receivable for investments sold | | 10,000,076 |
Receivable for fund shares sold | | 15,773,747 |
Interest receivable | | 5,650,127 |
Distributions receivable from Fidelity Central Funds | | 44,364 |
Prepaid expenses | | 4,789 |
Receivable from investment adviser for expense reductions | | 19,056 |
Other receivables | | 221 |
Total assets | | 1,895,031,127 |
| | |
Liabilities | | |
Payable for investments purchased
Regular delivery | $ 17,107,942 | |
Delayed delivery | 4,235,415 | |
Payable for fund shares redeemed | 15,193,155 | |
Distributions payable | 405 | |
Accrued management fee | 296,724 | |
Other affiliated payables | 355,227 | |
Other payables and accrued expenses | 36,501 | |
Total liabilities | | 37,225,369 |
| | |
Net Assets | | $ 1,857,805,758 |
Net Assets consist of: | | |
Paid in capital | | $ 1,857,788,151 |
Distributions in excess of net investment income | | (11,829) |
Accumulated undistributed net realized gain (loss) on investments | | 29,436 |
Net Assets, for 1,857,041,030 shares outstanding | | $ 1,857,805,758 |
Net Asset Value, offering price and redemption price per share ($1,857,805,758 ÷ 1,857,041,030 shares) | | $ 1.00 |
See accompanying notes which are an integral part of the financial statements.
Annual Report
Statement of Operations
| Year ended November 30, 2012 |
| | |
Investment Income | | |
Interest | | $ 3,008,346 |
Income from Fidelity Central Funds | | 404,744 |
Total income | | 3,413,090 |
| | |
Expenses | | |
Management fee | $ 6,531,273 | |
Transfer agent fees | 1,877,977 | |
Accounting fees and expenses | 178,343 | |
Custodian fees and expenses | 21,776 | |
Independent trustees' compensation | 6,501 | |
Registration fees | 32,116 | |
Audit | 39,694 | |
Legal | 14,952 | |
Miscellaneous | 11,564 | |
Total expenses before reductions | 8,714,196 | |
Expense reductions | (5,479,942) | 3,234,254 |
Net investment income (loss) | | 178,836 |
Realized and Unrealized Gain (Loss) Net realized gain (loss) on: | | |
Investment securities: | | |
Unaffiliated issuers | 71,249 | |
Capital gain distributions from Fidelity Central Funds | 2,347 | |
Total net realized gain (loss) | | 73,596 |
Net increase in net assets resulting from operations | | $ 252,432 |
See accompanying notes which are an integral part of the financial statements.
Annual Report
Fidelity Connecticut Municipal Money Market Fund
Financial Statements - continued
Statement of Changes in Net Assets
| Year ended
November 30, 2012 | Year ended
November 30, 2011 |
Increase (Decrease) in Net Assets | | |
Operations | | |
Net investment income (loss) | $ 178,836 | $ 172,531 |
Net realized gain (loss) | 73,596 | 3,951 |
Net increase in net assets resulting
from operations | 252,432 | 176,482 |
Distributions to shareholders from net investment income | (179,081) | (172,498) |
Distributions to shareholders from net realized gain | - | (33,931) |
Total distributions | (179,081) | (206,429) |
Share transactions at net asset value of $1.00 per share
Proceeds from sales of shares | 3,812,107,186 | 4,270,731,400 |
Reinvestment of distributions | 175,513 | 204,461 |
Cost of shares redeemed | (3,737,650,600) | (4,143,393,818) |
Net increase (decrease) in net assets and shares resulting from share transactions | 74,632,099 | 127,542,043 |
Total increase (decrease) in net assets | 74,705,450 | 127,512,096 |
| | |
Net Assets | | |
Beginning of period | 1,783,100,308 | 1,655,588,212 |
End of period (including distributions in excess of net investment income of $11,829 and distributions in excess of net investment income of $12,029, respectively) | $ 1,857,805,758 | $ 1,783,100,308 |
See accompanying notes which are an integral part of the financial statements.
Annual Report
Financial Highlights
Years ended November 30, | 2012 | 2011 | 2010 | 2009 | 2008 |
Selected Per-Share Data | | | | | |
Net asset value, beginning of period | $ 1.00 | $ 1.00 | $ 1.00 | $ 1.00 | $ 1.00 |
Income from Investment Operations | | | | | |
Net investment income (loss) | - D | - D | - D | .001 | .019 |
Net realized and unrealized gain (loss) D | - | - | - | - | - |
Total from investment operations | - D | - D | - D | .001 | .019 |
Distributions from net investment income | - D | - D | - D | (.001) | (.019) |
Distributions from net realized gain | - | - D | - | - | - D |
Total distributions | - D | - D | - D | (.001) | (.019) |
Net asset value, end of period | $ 1.00 | $ 1.00 | $ 1.00 | $ 1.00 | $ 1.00 |
Total Return A | .01% | .01% | .01% | .12% | 1.97% |
Ratios to Average Net Assets B, C | | | | | |
Expenses before reductions | .49% | .49% | .49% | .53% | .50% |
Expenses net of fee waivers, if any | .18% | .22% | .28% | .49% | .49% |
Expenses net of all reductions | .18% | .22% | .28% | .48% | .42% |
Net investment income (loss) | .01% | .01% | .01% | .12% | 1.90% |
Supplemental Data | | | | | |
Net assets, end of period (000 omitted) | $ 1,857,806 | $ 1,783,100 | $ 1,655,588 | $ 1,807,770 | $ 2,116,583 |
A Total returns would have been lower if certain expenses had not been reduced during the applicable periods shown.
B Fees and expenses of any underlying Fidelity Central Funds are not included in the Fund's expense ratio. The Fund indirectly bears its proportionate share of the expenses of any underlying Fidelity Central Funds.
C Expense ratios reflect operating expenses of the Fund. Expenses before reductions do not reflect amounts reimbursed or waived or reductions from expense offset arrangements and do not represent the amount paid by the Fund during periods when reimbursements, waivers or reductions occur. Expenses net of fee waivers reflect expenses after reimbursement and waivers but prior to reductions from expense offset arrangements. Expenses net of all reductions represent the net expenses paid by the Fund.
D Amount represents less than $.001 per share.
See accompanying notes which are an integral part of the financial statements.
Annual Report
Notes to Financial Statements
For the period ended November 30, 2012
1. Organization.
Fidelity Connecticut Municipal Income Fund (the Income Fund) is a fund of Fidelity Court Street Trust. Fidelity Connecticut Municipal Money Market Fund (the Money Market Fund) is a fund of Fidelity Court Street Trust II. Each Trust is registered under the Investment Company Act of 1940, as amended (the 1940 Act), as an open-end management investment company. Fidelity Court Street Trust and Fidelity Court Street Trust II (the Trusts) are organized as a Massachusetts business trust and a Delaware statutory trust, respectively. The Income Fund is a non-diversified fund. Each Fund is authorized to issue an unlimited number of shares. Each Fund may be affected by economic and political developments in the state of Connecticut.
2. Investments in Fidelity Central Funds.
The Funds may invest in Fidelity Central Funds, which are open-end investment companies available only to other investment companies and accounts managed by Fidelity Management & Research Company (FMR) and its affiliates. The Funds' Schedules of Investments list each of the Fidelity Central Funds held as of period end, if any, as an investment of each Fund, but do not include the underlying holdings of each Fidelity Central Fund. As an Investing Fund, each Fund indirectly bears its proportionate share of the expenses of the underlying Fidelity Central Funds.
The Money Market Central Funds seek preservation of capital and current income and are managed by Fidelity Investments Money Management, Inc. (FIMM), an affiliate of FMR.
A complete unaudited list of holdings for each Fidelity Central Fund is available upon request or at the Securities and Exchange Commission (the SEC) website at www.sec.gov. In addition, the financial statements of the Fidelity Central Funds, which are not covered by the Funds' Report of Independent Registered Public Accounting Firm, are available on the SEC website or upon request.
3. Significant Accounting Policies.
The financial statements have been prepared in conformity with accounting principles generally accepted in the United States of America (GAAP), which require management to make certain estimates and assumptions at the date of the financial statements. Actual results could differ from those estimates. Subsequent events, if any, through the date that the financial statements were issued have been evaluated in the preparation of the financial statements. The following summarizes the significant accounting policies of the Funds:
Investment Valuation. Investments are valued as of 4:00 p.m. Eastern time on the last calendar day of the period. In accordance with valuation policies and procedures approved by the Board of Trustees (the Board), the Income Fund attempts to obtain prices from one
Annual Report
Notes to Financial Statements - continued
3. Significant Accounting Policies - continued
Investment Valuation - continued
or more third party pricing vendors or brokers to value its investments. When current market prices, quotations or rates are not readily available or reliable, investments will be fair valued in good faith by the FMR Fair Value Committee (the Committee), in accordance with procedures adopted by the Board. Factors used in determining fair value vary by investment type and may include market or investment specific events, changes in interest rates and credit quality. The frequency with which these procedures are used cannot be predicted and they may be utilized to a significant extent. The Committee oversees the Income Fund's valuation policies and procedures and is responsible for approving and reporting to the Board all fair value determinations.
Each Fund categorizes the inputs to valuation techniques used to value their investments into a disclosure hierarchy consisting of three levels as shown below:
Level 1 - quoted prices in active markets for identical investments
Level 2 - other significant observable inputs (including quoted prices for similar investments, interest rates, prepayment speeds, etc.)
Level 3 - unobservable inputs (including the Fund's own assumptions based on the best information available)
Valuation techniques used to value each Fund's investments by major category are as follows:
For the Income Fund, debt securities, including restricted securities, are valued based on evaluated prices received from third party pricing vendors or from brokers who make markets in such securities. For municipal securities, pricing vendors utilize matrix pricing which considers yield or price of bonds of comparable quality, coupon, maturity and type as well as broker-supplied prices and are generally categorized as Level 2 in the hierarchy. When independent prices are unavailable or unreliable, debt securities may be valued utilizing pricing methodologies which consider similar factors that would be used by third party pricing vendors.
For the Money Market Fund, as permitted by compliance with certain conditions under Rule 2a-7 of the 1940 Act, securities are valued at amortized cost, which approximates fair value. The amortized cost of an instrument is determined by valuing it at its original cost and thereafter amortizing any discount or premium from its face value at a constant rate until maturity. Securities held by a money market fund are generally high quality and liquid; however, they are reflected as Level 2 because the inputs used to determine fair value are not quoted prices in an active market.
For the Income Fund, changes in valuation techniques may result in transfers in or out of an assigned level within the disclosure hierarchy.
Annual Report
3. Significant Accounting Policies - continued
Investment Transactions and Income. For financial reporting purposes, the Funds' investment holdings and net asset value (NAV) include trades executed through the end of the last business day of the period. The NAV per share for processing shareholder transactions is calculated as of the close of business of the New York Stock Exchange (NYSE), normally 4:00 p.m. Eastern time and includes trades executed through the end of the prior business day for the Income Fund and trades executed through the end of the current business day for the Money Market Fund. Gains and losses on securities sold are determined on the basis of identified cost. Interest income and distributions from the Fidelity Central Funds are accrued as earned. Interest income includes coupon interest and amortization of premium and accretion of discount on debt securities.
Expenses. Expenses directly attributable to a fund are charged to that fund. Expenses attributable to more than one fund are allocated among the respective funds on the basis of relative net assets or other appropriate methods. Expense estimates are accrued in the period to which they relate and adjustments are made when actual amounts are known.
Income Tax Information and Distributions to Shareholders. Each year, each Fund intends to qualify as a regulated investment company under Subchapter M of the Internal Revenue Code, including distributing substantially all of its taxable income and realized gains. As a result, no provision for income taxes is required. As of November 30, 2012, each Fund did not have any unrecognized tax benefits in the financial statements; nor is each Fund aware of any tax positions for which it is reasonably possible that the total amounts of unrecognized tax benefits will significantly change in the next twelve months. Each Fund files a U.S. federal tax return, in addition to state and local tax returns as required. A fund's federal income tax returns are subject to examination by the Internal Revenue Service (IRS) for a period of three fiscal years after they are filed. State and local tax returns may be subject to examination for an additional fiscal year depending on the jurisdiction.
Dividends are declared and recorded daily and paid monthly from net investment income. Distributions from realized gains, if any, are declared and recorded on the ex-dividend date. Income and capital gain distributions are determined in accordance with income tax regulations, which may differ from GAAP. In addition, the Funds claimed a portion of the payment made to redeeming shareholders as a distribution for income tax purposes.
Capital accounts within the financial statements are adjusted for permanent book-tax differences. These adjustments have no impact on net assets or the results of operations. Temporary book-tax differences will reverse in a subsequent period.
Book-tax differences are primarily due to market discount and deferred trustees compensation.
Annual Report
Notes to Financial Statements - continued
3. Significant Accounting Policies - continued
Income Tax Information and Distributions to Shareholders - continued
The Funds purchase municipal securities whose interest, in the opinion of the issuer, is free from federal income tax. There is no assurance that the IRS will agree with this opinion. In the event the IRS determines that the issuer does not comply with relevant tax requirements, interest payments from a security could become federally taxable, possibly retroactively to the date the security was issued.
The federal tax cost of investment securities and unrealized appreciation (depreciation) as of period end were as follows for each Fund:
| Tax cost | Gross unrealized appreciation | Gross unrealized depreciation | Net unrealized
appreciation
(depreciation) on
securities and other
investments |
Fidelity Connecticut Municipal Income Fund | $ 537,751,567 | $ 48,291,920 | $ - | $ 48,291,920 |
Fidelity Connecticut Municipal Money Market Fund | 1,863,442,976 | - | - | - |
The tax-based components of distributable earnings as of period end were as follows for each Fund:
| Undistributed
tax-exempt income | Undistributed
ordinary
income | Undistributed long-term
capital gain | Net unrealized appreciation
(depreciation) |
Fidelity Connecticut Municipal Income Fund | $ 66,219 | $ - | $ 3,045,969 | $ 48,291,920 |
Fidelity Connecticut Municipal Money Market Fund | - | 19,682 | 9,754 | - |
The tax character of distributions paid was as follows:
November 30, 2012 | | | |
| Tax-Exempt
Income | Long-term
Capital Gains | Total |
Fidelity Connecticut Municipal Income Fund | $ 17,069,207 | $ 3,724,173 | $ 20,793,380 |
Fidelity Connecticut Municipal Money Market Fund | 179,081 | - | 179,081 |
Annual Report
3. Significant Accounting Policies - continued
Income Tax Information and Distributions to Shareholders - continued
November 30, 2011 | | | |
| Tax-Exempt Income | Long-term
Capital Gains | Total |
Fidelity Connecticut Municipal Income Fund | $ 17,520,408 | $ 2,210,578 | $ 19,730,986 |
Fidelity Connecticut Municipal Money Market Fund | 172,498 | 33,931 | 206,429 |
Short-Term Trading (Redemption) Fees. Shares held by investors in the Income Fund less than 30 days are subject to a redemption fee equal to ..50% of the net asset value of shares redeemed. All redemption fees, which reduce the proceeds of the shareholder redemption, are retained by the Fund and accounted for as an addition to paid in capital.
Delayed Delivery Transactions and When-Issued Securities. During the period, the Funds transacted in securities on a delayed delivery or when-issued basis. Payment and delivery may take place after the customary settlement period for that security. The price of the underlying securities and the date when the securities will be delivered and paid for are fixed at the time the transaction is negotiated. The securities purchased on a delayed delivery or when-issued basis are identified as such in each applicable Fund's Schedule of Investments. The Funds may receive compensation for interest forgone in the purchase of a delayed delivery or when-issued security. With respect to purchase commitments, each applicable Fund identifies securities as segregated in its records with a value at least equal to the amount of the commitment. Losses may arise due to changes in the value of the underlying securities or if the counterparty does not perform under the contract's terms, or if the issuer does not issue the securities due to political, economic, or other factors.
4. Purchases and Sales of Investments.
Purchases and sales of securities, other than short-term securities, for the Income Fund aggregated $102,374,644 and $81,338,592, respectively.
5. Fees and Other Transactions with Affiliates.
Management Fee. FMR and its affiliates provide the Funds with investment management related services for which the Funds pay a monthly management fee. The management fee is the sum of an individual fund fee rate and an annualized group fee rate. The individual fund fee rate is applied to each Fund's average net assets. The group fee rate is based upon the average net assets of all the mutual funds advised by FMR. The group fee rate decreases as assets under management increase and increases as assets under management decrease. For the period, each Fund's annual management fee rate expressed as a percentage of each Fund's average net assets was as follows:
Annual Report
Notes to Financial Statements - continued
5. Fees and Other Transactions with Affiliates - continued
Management Fee - continued
| Individual Rate | Group Rate | Total |
Fidelity Connecticut Municipal Income Fund | .25% | .12% | .37% |
Fidelity Connecticut Municipal Money Market Fund | .25% | .12% | .37% |
Transfer Agent and Accounting Fees. Citibank, N.A. (Citibank) is the custodian, transfer agent and servicing agent for the Funds. Citibank has entered into a sub-arrangement with Fidelity Investments Institutional Operations Company, Inc. (FIIOC), an affiliate of FMR, under which FIIOC performs the activities associated with the Funds' transfer agency, dividend disbursing and shareholder servicing functions. The Funds pay Citibank account fees and asset-based fees that vary according to account size and type of account. FIIOC pays for typesetting, printing and mailing of shareholder reports, except proxy statements. For the period, the transfer agent fees were equivalent to the following annual rates expressed as a percentage of average net assets:
Fidelity Connecticut Municipal Income Fund | .08% |
Fidelity Connecticut Municipal Money Market Fund | .11%* |
* During the period, FMR or its affiliates waived a portion of these fees for the Money Market Fund.
Citibank also has a sub-arrangement with Fidelity Service Company, Inc. (FSC), an affiliate of FMR, under which FSC maintains each Fund's accounting records. The fee is paid to Citibank and is based on the level of average net assets for each month.
6. Committed Line of Credit.
The Income Fund participates with other funds managed by FMR or an affiliate in a $4.25 billion credit facility (the "line of credit") to be utilized for temporary or emergency purposes to fund shareholder redemptions or for other short-term liquidity purposes. The participating funds have agreed to pay commitment fees on their pro-rata portion of the line of credit, which are reflected in Miscellaneous expenses on the Statement of Operations, and are as follows:
Fidelity Connecticut Municipal Income Fund | $ 1,571 |
During the period, there were no borrowings on this line of credit.
Annual Report
7. Expense Reductions.
FMR voluntarily agreed to reimburse expenses of each Fund to the extent annual operating expenses exceeded certain levels of average net assets as noted in the table below. Some expenses, for example interest expense, including commitment fees, are excluded from this reimbursement.
The following Funds were in reimbursement during the period:
| Expense
Limitations | Reimbursement
from adviser |
| | |
Fidelity Connecticut Municipal Money Market Fund | .48% | $ 136,338 |
Additionally, FMR or its affiliates voluntarily agreed to waive certain fees for the Money Market Fund in order to maintain a minimum annualized yield of .01%. Such arrangements may be discontinued by FMR at any time. For the period, the amount of the waiver was $5,339,237.
In addition, through arrangements with each applicable Fund's custodian and transfer agent, credits realized as a result of uninvested cash balances were used to reduce each applicable Fund's expenses. All of the applicable expense reductions are noted in the table below.
| Custody
expense
reduction | Transfer Agent
expense
reduction | Accounting
expense
reduction |
| | | |
Fidelity Connecticut Municipal Income Fund | $ 6,003 | $ 2,728 | $ 3 |
Fidelity Connecticut Municipal Money Market Fund | 4,367 | - | - |
8. Other.
The Funds' organizational documents provide former and current trustees and officers with a limited indemnification against liabilities arising in connection with the performance of their duties to the Funds. In the normal course of business, the Funds may also enter into contracts that provide general indemnifications. The Funds' maximum exposure under these arrangements is unknown as this would be dependent on future claims that may be made against the Funds. The risk of material loss from such claims is considered remote.
Annual Report
To the Trustees of Fidelity Court Street Trust and Fidelity Court Street Trust II and the Shareholders of Fidelity Connecticut Municipal Income Fund and Fidelity Connecticut Municipal Money Market Fund:
In our opinion, the accompanying statements of assets and liabilities, including the schedules of investments, and the related statements of operations and of changes in net assets and the financial highlights present fairly, in all material respects, the financial position of Fidelity Connecticut Municipal Income Fund (a fund of Fidelity Court Street Trust) and Fidelity Connecticut Municipal Money Market Fund a fund of Fidelity Court Street Trust II) at November 30, 2012, the results of each of their operations for the year then ended, the changes in their net assets for each of the two years in the period then ended and the financial highlights for each of the five years in the period then ended, in conformity with accounting principles generally accepted in the United States of America. These financial statements and financial highlights (hereafter referred to as "financial statements") are the responsibility of the Fidelity Court Street Trust's and Fidelity Court Street Trust II's management. Our responsibility is to express an opinion on these financial statements based on our audits. We conducted our audits of these financial statements in accordance with the standards of the Public Company Accounting Oversight Board (United States). Those standards require that we plan and perform the audit to obtain reasonable assurance about whether the financial statements are free of material misstatement. An audit includes examining, on a test basis, evidence supporting the amounts and disclosures in the financial statements, assessing the accounting principles used and significant estimates made by management, and evaluating the overall financial statement presentation. We believe that our audits, which included confirmation of securities at November 30, 2012 by correspondence with the custodian and brokers, provide a reasonable basis for our opinion.
PricewaterhouseCoopers LLP
Boston, Massachusetts
January 14, 2013
Annual Report
The Trustees, Member of the Advisory Board, and executive officers of the trusts and funds, as applicable, are listed below. The Board of Trustees governs each fund and is responsible for protecting the interests of shareholders. The Trustees are experienced executives who meet periodically throughout the year to oversee each fund's activities, review contractual arrangements with companies that provide services to each fund, oversee management of the risks associated with such activities and contractual arrangements, and review each fund's performance. Except for James C. Curvey, each of the Trustees oversees 218 funds advised by FMR or an affiliate. Mr. Curvey oversees 454 funds advised by FMR or an affiliate.
The Trustees hold office without limit in time except that (a) any Trustee may resign; (b) any Trustee may be removed by written instrument, signed by at least two-thirds of the number of Trustees prior to such removal; (c) any Trustee who requests to be retired or who has become incapacitated by illness or injury may be retired by written instrument signed by a majority of the other Trustees; and (d) any Trustee may be removed at any special meeting of shareholders by a two-thirds vote of the outstanding voting securities of the trust. Each Trustee who is not an interested person (as defined in the 1940 Act) (Independent Trustee), shall retire not later than the last day of the month in which his or her 75th birthday occurs. The Independent Trustees may waive this mandatory retirement age policy with respect to individual Trustees. The executive officers and Advisory Board Member hold office without limit in time, except that any officer and Advisory Board Member may resign or may be removed by a vote of a majority of the Trustees at any regular meeting or any special meeting of the Trustees. Except as indicated, each individual has held the office shown or other offices in the same company for the past five years.
Experience, Skills, Attributes, and Qualifications of the Funds' Trustees. The Governance and Nominating Committee has adopted a statement of policy that describes the experience, qualifications, attributes, and skills that are necessary and desirable for potential Independent Trustee candidates (Statement of Policy). The Board believes that each Trustee satisfied at the time he or she was initially elected or appointed a Trustee, and continues to satisfy, the standards contemplated by the Statement of Policy. The Governance and Nominating Committee also engages professional search firms to help identify potential Independent Trustee candidates who have the experience, qualifications, attributes, and skills consistent with the Statement of Policy. From time to time, additional criteria based on the composition and skills of the current Independent Trustees, as well as experience or skills that may be appropriate in light of future changes to board composition, business conditions, and regulatory or other developments, have also been considered by the professional search firms and the Governance and Nominating Committee. In addition, the Board takes into account the Trustees' commitment and participation in Board and committee meetings, as well as their leadership of standing and ad hoc committees throughout their tenure.
In determining that a particular Trustee was and continues to be qualified to serve as a Trustee, the Board has considered a variety of criteria, none of which, in isolation, was controlling. The Board believes that, collectively, the Trustees have balanced and diverse experience, qualifications, attributes, and skills, which allow the Board to operate effectively in governing each fund and protecting the interests of shareholders. Information about the specific experience, skills, attributes, and qualifications of each Trustee, which in each case led to the Board's conclusion that the Trustee should serve (or continue to serve) as a trustee of the funds, is provided below.
Annual Report
Board Structure and Oversight Function. Abigail P. Johnson is an interested person (as defined in the 1940 Act) and currently serves as Chairman. The Trustees have determined that an interested Chairman is appropriate and benefits shareholders because an interested Chairman has a personal and professional stake in the quality and continuity of services provided to the funds. Independent Trustees exercise their informed business judgment to appoint an individual of their choosing to serve as Chairman, regardless of whether the Trustee happens to be independent or a member of management. The Independent Trustees have determined that they can act independently and effectively without having an Independent Trustee serve as Chairman and that a key structural component for assuring that they are in a position to do so is for the Independent Trustees to constitute a substantial majority for the Board. The Independent Trustees also regularly meet in executive session. Albert R. Gamper, Jr. serves as Chairman of the Independent Trustees and as such (i) acts as a liaison between the Independent Trustees and management with respect to matters important to the Independent Trustees and (ii) with management prepares agendas for Board meetings.
Fidelity funds are overseen by different Boards of Trustees. The funds' Board oversees Fidelity's investment-grade bond, money market, and asset allocation funds and another Board oversees Fidelity's equity and high income funds. The asset allocation funds may invest in Fidelity funds that are overseen by such other Board. The use of separate Boards, each with its own committee structure, allows the Trustees of each group of Fidelity funds to focus on the unique issues of the funds they oversee, including common research, investment, and operational issues. On occasion, the separate Boards establish joint committees to address issues of overlapping consequences for the Fidelity funds overseen by each Board.
The Trustees operate using a system of committees to facilitate the timely and efficient consideration of all matters of importance to the Trustees, each fund, and fund shareholders and to facilitate compliance with legal and regulatory requirements and oversight of the funds' activities and associated risks. The Board, acting through its committees, has charged FMR and its affiliates with (i) identifying events or circumstances the occurrence of which could have demonstrably adverse effects on the funds' business and/or reputation; (ii) implementing processes and controls to lessen the possibility that such events or circumstances occur or to mitigate the effects of such events or circumstances if they do occur; and (iii) creating and maintaining a system designed to evaluate continuously business and market conditions in order to facilitate the identification and implementation processes described in (i) and (ii) above. Because the day-to-day operations and activities of the funds are carried out by or through FMR, its affiliates and other service providers, the funds' exposure to risks is mitigated but not eliminated by the processes overseen by the Trustees. While each of the Board's committees has responsibility for overseeing different aspects of the funds' activities, oversight is exercised primarily through the Operations and Audit Committees. In addition, an ad hoc Board committee of Independent Trustees has worked with FMR to enhance the Board's oversight of investment and financial risks, legal and regulatory risks, technology risks, and operational risks, including the development of additional risk reporting to the Board. The Operations Committee also worked and continues to work with FMR to enhance the stress tests required under SEC regulations for money market funds. Appropriate personnel, including but not limited to the funds' Chief Compliance Officer (CCO), FMR's internal auditor, the independent accountants, the funds' Treasurer and portfolio management personnel, make periodic reports to the Board's committees, as appropriate, including an annual review of FMR's risk management program for the Fidelity funds. The responsibilities of each standing committee, including their oversight responsibilities, are described further under "Standing Committees of the Funds' Trustees."
Annual Report
Trustees and Officers - continued
The funds' Statement of Additional Information (SAI) includes more information about the Trustees. To request a free copy, call Fidelity at 1-800-544-8544.
Interested Trustees*:
Correspondence intended for each Trustee who is an interested person may be sent to Fidelity Investments, 82 Devonshire Street, Boston, Massachusetts 02109.
Name, Age; Principal Occupations and Other Relevant Experience+ |
Abigail P. Johnson (50) |
| Year of Election or Appointment: 2009 Ms. Johnson is Trustee and Chairman of the Board of Trustees of certain Trusts. Ms. Johnson serves as President of Fidelity Financial Services (2012-present) and President of Personal, Workplace and Institutional Services (2005-present). Ms. Johnson is Chairman and Director of FMR Co., Inc. (2011-present), Chairman and Director of FMR (2011-present), and the Vice Chairman and Director (2007-present) of FMR LLC. Previously, Ms. Johnson served as President and a Director of FMR (2001-2005), a Trustee of other investment companies advised by FMR, Fidelity Investments Money Management, Inc., and FMR Co., Inc. (2001-2005), Senior Vice President of the Fidelity funds (2001-2005), and managed a number of Fidelity funds. Ms. Abigail P. Johnson and Mr. Arthur E. Johnson are not related. |
James C. Curvey (77) |
| Year of Election or Appointment: 2008 Mr. Curvey also serves as Trustee (2007-present) of other investment companies advised by FMR. Mr. Curvey is a Director of Fidelity Investments Money Management, Inc. (2009-present), Director of Fidelity Research & Analysis Co. (2009-present) and Director of FMR and FMR Co., Inc. (2007-present). Mr. Curvey is also Vice Chairman (2007-present) and Director of FMR LLC. In addition, Mr. Curvey serves as an Overseer for the Boston Symphony Orchestra and a member of the Trustees of Villanova University. Previously, Mr. Curvey was the Vice Chairman (2006-2007) and Director (2000-2007) of FMR Corp. |
* Trustees have been determined to be "Interested Trustees" by virtue of, among other things, their affiliation with the trusts or various entities under common control with FMR.
+ The information above includes each Trustee's principal occupation during the last five years and other information relating to the experience, attributes, and skills relevant to each Trustee's qualifications to serve as a Trustee, which led to the conclusion that each Trustee should serve as a Trustee for each fund.
Independent Trustees:
Correspondence intended for each Independent Trustee (that is, the Trustees other than the Interested Trustees) may be sent to Fidelity Investments, P.O. Box 55235, Boston, Massachusetts 02205-5235.
Name, Age; Principal Occupations and Other Relevant Experience+ |
Albert R. Gamper, Jr. (70) |
| Year of Election or Appointment: 2006 Mr. Gamper is Chairman of the Independent Trustees of the Fixed Income and Asset Allocation Funds (2012-present). Prior to his retirement in December 2004, Mr. Gamper served as Chairman of the Board of CIT Group Inc. (commercial finance). During his tenure with CIT Group Inc. Mr. Gamper served in numerous senior management positions, including Chairman (1987-1989; 1999-2001; 2002-2004), Chief Executive Officer (1987-2004), and President (2002-2003). Mr. Gamper currently serves as a member of the Board of Directors of Public Service Enterprise Group (utilities, 2000-present), a member of the Board of Trustees, Rutgers University (2004-present), and Chairman of the Board of Barnabas Health Care System. Previously, Mr. Gamper served as Vice Chairman of the Independent Trustees of the Fixed Income and Asset Allocation Funds (2011-2012) and as Chairman of the Board of Governors, Rutgers University (2004-2007). |
Robert F. Gartland (60) |
| Year of Election or Appointment: 2010 Mr. Gartland is Chairman and an investor in Gartland and Mellina Group Corp. (consulting, 2009-present). Previously, Mr. Gartland served as a partner and investor of Vietnam Partners LLC (investments and consulting, 2008-2011). Prior to his retirement, Mr. Gartland held a variety of positions at Morgan Stanley (financial services, 1979-2007) including Managing Director (1987-2007). |
Arthur E. Johnson (65) |
| Year of Election or Appointment: 2008 Mr. Johnson serves as a member of the Board of Directors of Eaton Corporation (diversified power management, 2009-present), AGL Resources, Inc. (holding company, 2002-present) and Booz Allen Hamilton (management consulting, 2011-present). Prior to his retirement, Mr. Johnson served as Senior Vice President of Corporate Strategic Development of Lockheed Martin Corporation (defense contractor, 1999-2009). He previously served on the Board of Directors of IKON Office Solutions, Inc. (1999-2008) and Delta Airlines (2005-2007). Mr. Arthur E. Johnson is not related to Ms. Abigail P. Johnson. |
Michael E. Kenneally (58) |
| Year of Election or Appointment: 2009 Previously, Mr. Kenneally served as a Member of the Advisory Board for certain Fidelity Fixed Income and Asset Allocation Funds (2008-2009). Prior to his retirement, Mr. Kenneally served as Chairman and Global Chief Executive Officer of Credit Suisse Asset Management (2003-2005). Mr. Kenneally was a Director of the Credit Suisse Funds (U.S. mutual funds, 2004-2008) and certain other closed-end funds (2004-2005) and was awarded the Chartered Financial Analyst (CFA) designation in 1991. |
James H. Keyes (72) |
| Year of Election or Appointment: 2007 Mr. Keyes serves as a member of the Boards of Navistar International Corporation (manufacture and sale of trucks, buses, and diesel engines, since 2002) and Pitney Bowes, Inc. (integrated mail, messaging, and document management solutions, since 1998). Prior to his retirement, Mr. Keyes served as Chairman and Chief Executive Officer of Johnson Controls (automotive, building, and energy, 1998-2002) and as a member of the Board of LSI Logic Corporation (semiconductor technologies, 1984-2008). |
Marie L. Knowles (66) |
| Year of Election or Appointment: 2001 Ms. Knowles is Vice Chairman of the Independent Trustees of the Fixed Income and Asset Allocation Funds (2012-present). Prior to Ms. Knowles' retirement in June 2000, she served as Executive Vice President and Chief Financial Officer of Atlantic Richfield Company (ARCO) (diversified energy, 1996-2000). From 1993 to 1996, she was a Senior Vice President of ARCO and President of ARCO Transportation Company. She served as a Director of ARCO from 1996 to 1998. Ms. Knowles currently serves as a Director and Chairman of the Audit Committee of McKesson Corporation (healthcare service, since 2002). Ms. Knowles is an Honorary Trustee of the Brookings Institution and a member of the Board of the Catalina Island Conservancy and of the Santa Catalina Island Company (2009-present). She also serves as a member of the Advisory Board for the School of Engineering of the University of Southern California and the Foundation Board of the School of Architecture at the University of Virginia (2007-present). Previously, Ms. Knowles served as a Director of Phelps Dodge Corporation (copper mining and manufacturing, 1994-2007). |
Kenneth L. Wolfe (73) |
| Year of Election or Appointment: 2005 Prior to his retirement, Mr. Wolfe served as Chairman and a Director (2007-2009) and Chairman and Chief Executive Officer (1994-2001) of Hershey Foods Corporation. He also served as a member of the Boards of Adelphia Communications Corporation (telecommunications, 2003-2006), Bausch & Lomb, Inc. (medical/pharmaceutical, 1993-2007), and Revlon, Inc. (personal care products, 2004-2009). Mr. Wolfe previously served as Chairman of the Independent Trustees of the Fixed Income and Asset Allocation Funds (2008-2012). |
+ The information above includes each Trustee's principal occupation during the last five years and other information relating to the experience, attributes, and skills relevant to each Trustee's qualifications to serve as a Trustee, which led to the conclusion that each Trustee should serve as a Trustee for each fund.
Annual Report
Trustees and Officers - continued
Advisory Board Member and Executive Officers:
Correspondence intended for Elizabeth S. Acton may be sent to Fidelity Investments, P.O. Box 55235, Boston, Massachusetts 02205-5235. Correspondence intended for each executive officer may be sent to Fidelity Investments, 82 Devonshire Street, Boston, Massachusetts 02109.
Name, Age; Principal Occupation |
Elizabeth S. Acton (61) |
| Year of Election or Appointment: 2013 Member of the Advisory Board. Ms. Acton also serves as Trustee or Member of the Advisory Board of other Fidelity Fixed Income and Asset Allocation Funds (2013-present). Prior to her retirement in April 2012, Ms. Acton was Executive Vice President, Finance (November 2011-April 2012), Executive Vice President, Chief Financial Officer (April 2002-November 2011), and Treasurer (May 2004-May 2005) of Comerica Incorporated (financial services). Prior to joining Comerica, Ms. Acton held a variety of positions at Ford Motor Company (1983-2002), including Vice President and Treasurer (2000-2002) and Executive Vice President and Chief Financial Officer of Ford Motor Credit Company (1998-2000). Ms. Acton currently serves as a member of the Board of Directors and Audit and Finance Committees of Beazer Homes USA, Inc. (homebuilding, 2012-present). |
John R. Hebble (54) |
| Year of Election or Appointment: 2008 President and Treasurer of Fidelity's Fixed Income and Asset Allocation Funds. Mr. Hebble also serves as President (2011-present), Treasurer, and Chief Financial Officer of The North Carolina Capital Management Trust: Cash and Term Portfolios (2008-present), Assistant Treasurer of other Fidelity funds (2009-present) and is an employee of Fidelity Investments. |
Charles S. Morrison (51) |
| Year of Election or Appointment: 2012 Vice President of Fidelity's Fixed Income and Asset Allocation Funds. Mr. Morrison also serves as President, Fixed Income and is an employee of Fidelity Investments. Previously, Mr. Morrison served as Vice President of Fidelity's Money Market Funds (2005-2009), President, Money Market Group Leader of FMR (2009), and Senior Vice President, Money Market Group of FMR (2004-2009). Mr. Morrison also served as Vice President of Fidelity's Bond Funds (2002-2005), certain Balanced Funds (2002-2005), and certain Asset Allocation Funds (2002-2007), and as Senior Vice President (2002-2005) of Fidelity's Fixed Income Division. |
Robert P. Brown (49) |
| Year of Election or Appointment: 2012 Vice President of Fidelity's Bond Funds. Mr. Brown also serves as Executive Vice President of Fidelity Investments Money Management, Inc. (2010-present), President, Bond Group of FMR (2011-present), Director and Managing Director, Research of Fidelity Management & Research (U.K.) Inc. (2008-present) and is an employee of Fidelity Investments. Previously, Mr. Brown served as President, Money Market Group of FMR (2010-2011) and Vice President of Fidelity's Money Market Funds (2010-2012). |
Nancy D. Prior (45) |
| Year of Election or Appointment: 2012 Vice President of Fidelity's Money Market Funds. Ms. Prior also serves as President, Money Market Group of FMR (2011-present) and is an employee of Fidelity Investments (2002-present). Previously, Ms. Prior served as Managing Director of Research (2009-2011), Senior Vice President and Deputy General Counsel (2007-2009), and Assistant Secretary of Fidelity's Fixed Income and Asset Allocation Funds (2008-2009). |
Scott C. Goebel (44) |
| Year of Election or Appointment: 2008 Secretary and Chief Legal Officer (CLO) of the Fidelity funds. Mr. Goebel also serves as Secretary of Fidelity Investments Money Management, Inc. (FIMM) (2010-present) and Fidelity Research and Analysis Company (FRAC) (2010-present); Secretary and CLO of The North Carolina Capital Management Trust: Cash and Term Portfolios (2008-present); General Counsel, Secretary, and Senior Vice President of FMR (2008-present) and FMR Co., Inc. (2008-present); employed by FMR LLC or an affiliate (2001-present); Chief Legal Officer of Fidelity Management & Research (Hong Kong) Limited (2008-present) and Assistant Secretary of Fidelity Management & Research (Japan) Inc. (2008-present), and Fidelity Management & Research (U.K.) Inc. (2008-present). Previously, Mr. Goebel served as Assistant Secretary of FIMM (2008-2010), FRAC (2008-2010), and the Funds (2007-2008) and as Vice President and Secretary of Fidelity Distributors Corporation (FDC) (2005-2007). |
Ramon Herrera (38) |
| Year of Election or Appointment: 2012 Assistant Secretary of Fidelity's Fixed Income and Asset Allocation Funds. Mr. Herrera also serves as Vice President, Associate General Counsel (2010-present) and is an employee of Fidelity Investments (2004-present). |
Elizabeth Paige Baumann (44) |
| Year of Election or Appointment: 2012 Anti-Money Laundering (AML) Officer of the Fidelity funds. Ms. Baumann also serves as AML Officer of The North Carolina Capital Management Trust: Cash and Term Portfolios (2012-present), Chief AML Officer of FMR LLC (2012-present), and is an employee of Fidelity Investments. Previously, Ms. Baumann served as Vice President and Deputy Anti-Money Laundering Officer (2007-2012). |
Christine Reynolds (54) |
| Year of Election or Appointment: 2008 Chief Financial Officer of the Fidelity funds. Ms. Reynolds became President of Fidelity Pricing and Cash Management Services (FPCMS) in August 2008. Ms. Reynolds served as Chief Operating Officer of FPCMS (2007-2008). Previously, Ms. Reynolds served as President, Treasurer, and Anti-Money Laundering officer of the Fidelity funds (2004-2007). |
Michael H. Whitaker (45) |
| Year of Election or Appointment: 2008 Chief Compliance Officer of Fidelity's Fixed Income and Asset Allocation Funds. Mr. Whitaker also serves as Chief Compliance Officer of The North Carolina Capital Management Trust: Cash and Term Portfolios (2008-present). Mr. Whitaker is an employee of Fidelity Investments (2007-present). Prior to joining Fidelity Investments, Mr. Whitaker worked at MFS Investment Management where he served as Senior Vice President and Chief Compliance Officer (2004-2006), and Assistant General Counsel. |
Joseph F. Zambello (55) |
| Year of Election or Appointment: 2011 Deputy Treasurer of the Fidelity funds. Mr. Zambello is an employee of Fidelity Investments. Previously, Mr. Zambello served as Vice President of FMR's Program Management Group (2009-2011) and Vice President of the Transfer Agent Oversight Group (2005-2009). |
Stephanie J. Dorsey (43) |
| Year of Election or Appointment: 2008 Deputy Treasurer of Fidelity's Fixed Income and Asset Allocation Funds. Ms. Dorsey also serves as Assistant Treasurer of other Fidelity funds (2010-present) and is an employee of Fidelity Investments (2008-present). Previously, Ms. Dorsey served as Treasurer (2004-2008) of the JPMorgan Mutual Funds and Vice President (2004-2008) of JPMorgan Chase Bank. |
Adrien E. Deberghes (45) |
| Year of Election or Appointment: 2010 Assistant Treasurer of Fidelity's Fixed Income and Asset Allocation Funds. Mr. Deberghes also serves as Vice President and Assistant Treasurer (2011-present) and Deputy Treasurer (2008-present) of other Fidelity funds, and is an employee of Fidelity Investments (2008-present). Previously, Mr. Deberghes served as Senior Vice President of Mutual Fund Administration at State Street Corporation (2007-2008), Senior Director of Mutual Fund Administration at Investors Bank & Trust (2005-2007), and Director of Finance for Dunkin' Brands (2000-2005). |
Kenneth B. Robins (43) |
| Year of Election or Appointment: 2009 Assistant Treasurer of the Fidelity Fixed Income and Asset Allocation Funds. Mr. Robins also serves as President and Treasurer of other Fidelity funds (2008-present; 2010-present) and is an employee of Fidelity Investments (2004-present). Previously, Mr. Robins served as Deputy Treasurer of the Fidelity funds (2005-2008) and Treasurer and Chief Financial Officer of The North Carolina Capital Management Trust: Cash and Term Portfolios (2006-2008). |
Stephen Sadoski (41) |
| Year of Election or Appointment: 2012 Assistant Treasurer of Fidelity's Fixed Income and Asset Allocation Funds. Mr. Sadoski also serves as Deputy Treasurer of other Fidelity funds (2012-present) and is an employee of Fidelity Investments (2012-present). Previously, Mr. Sadoski served as an assistant chief accountant in the Division of Investment Management of the Securities and Exchange Commission (SEC) (2009-2012) and as a senior manager at Deloitte & Touche (1997-2009). |
Gary W. Ryan (54) |
| Year of Election or Appointment: 2005 Assistant Treasurer of the Fidelity funds. Mr. Ryan is an employee of Fidelity Investments. Previously, Mr. Ryan served as Vice President of Fund Reporting in Fidelity Pricing and Cash Management Services (FPCMS) (1999-2005). |
Jonathan Davis (44) |
| Year of Election or Appointment: 2010 Assistant Treasurer of the Fidelity funds. Mr. Davis is also Assistant Treasurer of Fidelity Rutland Square Trust II and Fidelity Commonwealth Trust II. Mr. Davis is an employee of Fidelity Investments. Previously, Mr. Davis served as Vice President and Associate General Counsel of FMR LLC (2003-2010). |
Annual Report
The Board of Trustees of each fund voted to pay to shareholders of record at the opening of business on record date, the following distributions per share derived from capital gains realized from sales of portfolio securities, and dividends derived from net investment income:
Fund | Pay Date | Record Date | Dividends | Capital Gains |
Fidelity Connecticut Municipal Income Fund | 12/24/12 | 12/21/12 | $0.00 | $0.062 |
| 1/14/13 | 1/11/13 | $0.00 | $0.001 |
The funds hereby designate as capital gain dividend the amounts noted below for the taxable year ended November 30, 2012, or, if subsequently determined to be different, the net capital gain of such year.
Fund | |
Fidelity Connecticut Municipal Income Fund | $ 3,285,440 |
Fidelity Connecticut Municipal Money Market Fund | $ 9,754 |
During fiscal year ended 2012, 100% of each fund's income dividends were free from federal income tax, and 2.44% and 10.91% of Fidelity Connecticut Municipal Income Fund and Fidelity Connecticut Municipal Money Market Fund's income dividends, respectively, were subject to the federal alternative minimum tax.
The fund will notify shareholders in January 2013 of amounts for use in preparing 2012 income tax returns.
Annual Report
Board Approval of Investment Advisory Contracts and Management Fees
Fidelity Connecticut Municipal Income Fund / Fidelity Connecticut Municipal Money Market Fund
Each year, the Board of Trustees, including the Independent Trustees (together, the Board), votes on the renewal of the management contract and sub-advisory agreements (together, the Advisory Contracts) for each fund. The Board, assisted by the advice of fund counsel and Independent Trustees' counsel, requests and considers a broad range of information relevant to the renewal of the Advisory Contracts throughout the year.
The Board meets regularly and, at each of its meetings, covers an extensive agenda of topics and materials and considers factors that are relevant to its annual consideration of the renewal of each fund's Advisory Contracts, including the services and support provided to each fund and its shareholders. The Board has established three standing committees, Operations, Audit, and Governance and Nominating, each composed of and chaired by Independent Trustees with varying backgrounds, to which the Board has assigned specific subject matter responsibilities in order to enhance effective decision-making by the Board. The Operations Committee, of which all of the Independent Trustees are members, meets regularly throughout the year and, among other matters, considers matters specifically related to the annual consideration of the renewal of each fund's Advisory Contracts. The Board, acting directly and through its Committees, requests and receives information concerning the annual consideration of the renewal of each fund's Advisory Contracts. The Board also meets as needed to consider matters specifically related to the Board's annual consideration of the renewal of Advisory Contracts. Members of the Board may also meet with trustees of other Fidelity funds through ad hoc joint committees to discuss certain matters relevant to the Fidelity funds.
At its September 2012 meeting, the Board of Trustees, including the Independent Trustees, unanimously determined to renew each fund's Advisory Contracts. In reaching its determination, the Board considered all factors it believed relevant, including (i) the nature, extent, and quality of the services to be provided to each fund and its shareholders (including the investment performance of each fund); (ii) the competitiveness of each fund's management fee and total expense ratio relative to peer funds; (iii) the total costs of the services to be provided by and the profits to be realized by Fidelity from its relationship with each fund; (iv) the extent to which economies of scale exist and would be realized as each fund grows; and (v) whether fee levels reflect these economies of scale, if any, for the benefit of fund shareholders.
In considering whether to renew the Advisory Contracts for each fund, the Board reached a determination, with the assistance of fund counsel and Independent Trustees' counsel and through the exercise of its business judgment, that the renewal of the Advisory Contracts is in the best interests of each fund and its shareholders and that the compensation payable under the Advisory Contracts is fair and reasonable. The Board's decision to renew the Advisory Contracts was not based on any single factor, but rather was based on a comprehensive consideration of all the information provided to the Board at its meetings throughout the year. The Board, in reaching its determination to renew the Advisory Contracts, was aware that shareholders in each fund have a broad range of investment choices available to them, including a wide choice among mutual funds offered by Fidelity's competitors, and that each fund's shareholders, who have the opportunity to review and weigh the disclosure provided by the fund in its prospectus and other public disclosures, have chosen to invest in that fund, managed by Fidelity.
Annual Report
Nature, Extent, and Quality of Services Provided. The Board considered the staffing within the investment adviser, FMR, and the sub-advisers (together, the Investment Advisers), including the backgrounds of the funds' investment personnel, and also considered the funds' investment objectives, strategies, and related investment philosophies. The Independent Trustees also had discussions with senior management of Fidelity's investment operations and investment groups. The Board considered the structure of the portfolio manager compensation program and whether this structure provides appropriate incentives to act in the best interests of each fund.
Resources Dedicated to Investment Management and Support Services. The Board reviewed the general qualifications and capabilities of the Investment Advisers' investment staff, including its size, education, experience, and resources, as well as the Investment Advisers' approach to recruiting, managing, and compensating investment personnel. The Board also noted that FMR has continued to increase the resources devoted to non-U.S. offices, including expansion of Fidelity's global investment organization. The Board noted that Fidelity's analysts have extensive resources, tools and capabilities that allow them to conduct sophisticated quantitative and fundamental analysis, as well as credit analysis of issuers, counterparties and guarantors. The Board also believes that Fidelity's investment professionals have sufficient access to global information and data so as to provide competitive investment results over time, and that those professionals also have access to sophisticated tools that permit them to assess portfolio construction and risk and performance attribution characteristics continuously, as well as to transmit new information and research conclusions rapidly around the world. Additionally, in its deliberations, the Board considered the Investment Advisers' trading and risk management capabilities and resources, which are an integral part of the investment management process.
Shareholder and Administrative Services. The Board considered (i) the nature, extent, quality, and cost of advisory, administrative, and shareholder services performed by the Investment Advisers and their affiliates under the Advisory Contracts and under separate agreements covering transfer agency and pricing and bookkeeping services for each fund; (ii) the nature and extent of the supervision of third party service providers, principally custodians and subcustodians; and (iii) the resources devoted to, and the record of compliance with, each fund's compliance policies and procedures.
Annual Report
Board Approval of Investment Advisory Contracts and
Management Fees - continued
The Board noted that the growth of fund assets over time across the complex allows Fidelity to reinvest in the development of services designed to enhance the value or convenience of the Fidelity funds as investment vehicles. These services include 24-hour access to account information and market information through telephone representatives and over the Internet, investor education materials and asset allocation tools, and the expanded availability of Fidelity Investor Centers.
Investment in a Large Fund Family. The Board considered the benefits to shareholders of investing in a Fidelity fund, including the benefits of investing in a fund that is part of a large family of funds offering a variety of investment disciplines and providing a large variety of mutual fund investor services. The Board noted that Fidelity had taken, or had made recommendations that resulted in the Fidelity funds taking, a number of actions over the previous year that benefited particular funds, including (i) continuing to dedicate additional resources to investment research and support of the senior management team that oversees asset management; (ii) persisting in efforts to enhance Fidelity's research capabilities, in particular, international research; (iii) launching new funds and making other enhancements to meet client needs for global and income-oriented solutions; (iv) continuing to launch dedicated lower cost underlying funds to meet investment management's portfolio construction needs related to expanding underlying fund options, specifically for the Freedom Fund product lines; (v) adopting a sector neutral investment approach for certain funds and utilizing a team of portfolio managers to manage certain sector-neutral funds; (vi) rationalizing product lines and gaining increased efficiencies through combinations of several funds with other funds; (vii) strengthening the Spartan Index Fund product line by adding new funds and/or new low-cost institutional share classes, restructuring fund expenses to accommodate new classes, and reducing investment minimums for certain classes of shares; (viii) modifying the eligibility criteria for Institutional Class shares to increase their appeal to government entities and charitable investors; and (ix) reducing certain transfer agent fee rates.
Investment Performance. The Board considered whether each fund has operated in accordance with its investment objective, as well as its record of compliance with its investment restrictions. It also reviewed each fund's absolute investment performance, as well as each fund's relative investment performance measured over multiple periods against (i) a broad-based securities market index (bond fund only, as money market funds are typically not compared against a market index), and (ii) a peer group of mutual funds deemed appropriate by Fidelity and reviewed by the Board. For each fund, the following charts considered by the Board show, over the one-, three-, and five-year periods ended December 31, 2011, the fund's cumulative total returns, the cumulative total returns of a broad-based securities market index ("benchmark") (bond fund only), and a range of cumulative total returns of a peer group of mutual funds identified by Lipper Inc. as having an investment objective similar to that of the fund. The box within each chart shows the 25th percentile return (top of box) and the 75th percentile return (bottom of box) of the peer group. Returns shown above the box are in the first quartile and returns shown below the box are in the fourth quartile. The percentage beaten number noted below each chart corresponds to the percentile box and represents the percentage of funds in the peer group whose performance was equal to or lower than that of the fund.
Annual Report
Fidelity Connecticut Municipal Income Fund
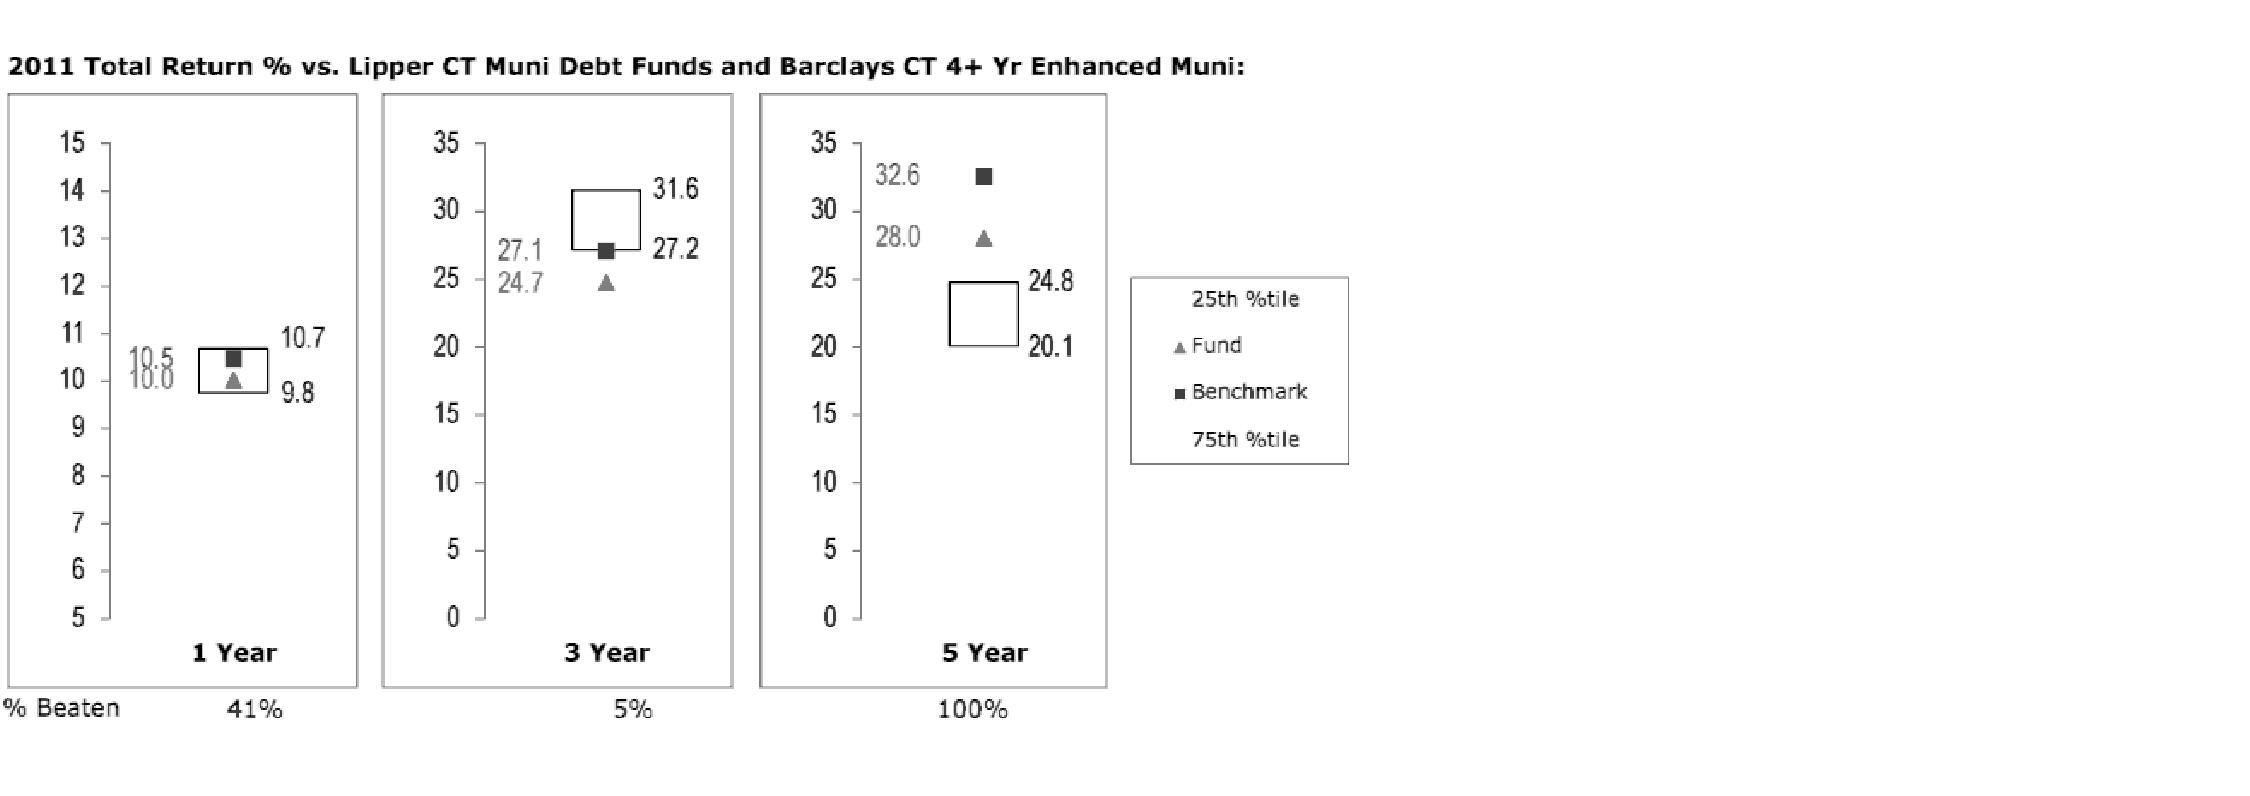
The Board reviewed the fund's relative investment performance against its peer group and noted that the performance of the fund was in the third quartile for the one-year period, the fourth quartile for the three-year period, and the first quartile for the five-year period. The Board also noted that the investment performance of the fund was lower than its benchmark for all the periods shown. The Board discussed with FMR actions to improve the fund's disappointing performance. The Board noted that this fund had underperformed in the past and discussed with FMR its disappointment with the continued underperformance of the fund. The Board noted that there was a portfolio management change for the fund in December 2011. The Board also reviewed the fund's performance since inception as well as performance in the current year. The Board will continue to closely monitor the performance of the fund in the coming year and discuss with FMR other appropriate actions to address the performance of the fund.
Annual Report
Board Approval of Investment Advisory Contracts and
Management Fees - continued
Fidelity Connecticut Municipal Money Market Fund

The Board reviewed the fund's relative investment performance against its peer group and noted that the performance of the fund was in the second quartile for the one- and three-year periods and the first quartile for the five-year period. The Board considered that FMR had taken steps to provide shareholders with stability of principal and to enhance safety and liquidity. The Board noted that there was a portfolio management change for the fund in December 2011. The Board also reviewed the fund's performance since inception as well as performance in the current year.
The Board noted as a general matter that the percentage beaten numbers for money market funds in recent years were less meaningful than in earlier years, as many competitors have been waiving fees to maintain a one basis point yield and performance differences among funds may not be apparent due to rounding.
Based on its review, the Board concluded that the nature, extent, and quality of services provided to each fund under the Advisory Contracts should benefit each fund's shareholders.
Competitiveness of Management Fee and Total Expense Ratio. The Board considered each fund's management fee and total expense ratio compared to "mapped groups" of competitive funds and classes. Fidelity creates "mapped groups" by combining similar Lipper investment objective categories that have comparable management fee characteristics. Combining Lipper investment objective categories aids the Board's management fee and total expense ratio comparisons by broadening the competitive group used for comparison and by reducing the number of universes to which various Fidelity funds are compared.
Annual Report
Management Fee. The Board considered two proprietary management fee comparisons for the 12-month periods shown in the charts below. The group of Lipper funds used by the Board for management fee comparisons is referred to below as the "Total Mapped Group" and, for the reasons explained above, is broader than the Lipper peer group used by the Board for performance comparisons. The Total Mapped Group comparison focuses on a fund's standing relative to the total universe of comparable funds available to investors in terms of gross management fees before expense reimbursements or caps. "TMG %" represents the percentage of funds in the Total Mapped Group that had management fees that were lower than a fund's. For example, a TMG % of 38% would mean that 62% of the funds in the Total Mapped Group had higher management fees than a fund. The "Asset-Size Peer Group" (ASPG) comparison focuses on a fund's standing relative to non-Fidelity funds similar in size to the fund within the Total Mapped Group. The ASPG represents at least 15% of the funds in the Total Mapped Group with comparable asset size and management fee characteristics, subject to a minimum of 50 funds (or all funds in the Total Mapped Group if fewer than 50). Additional information, such as the ASPG quartile in which a fund's management fee ranked, is also included in the charts and considered by the Board.
Fidelity Connecticut Municipal Income Fund
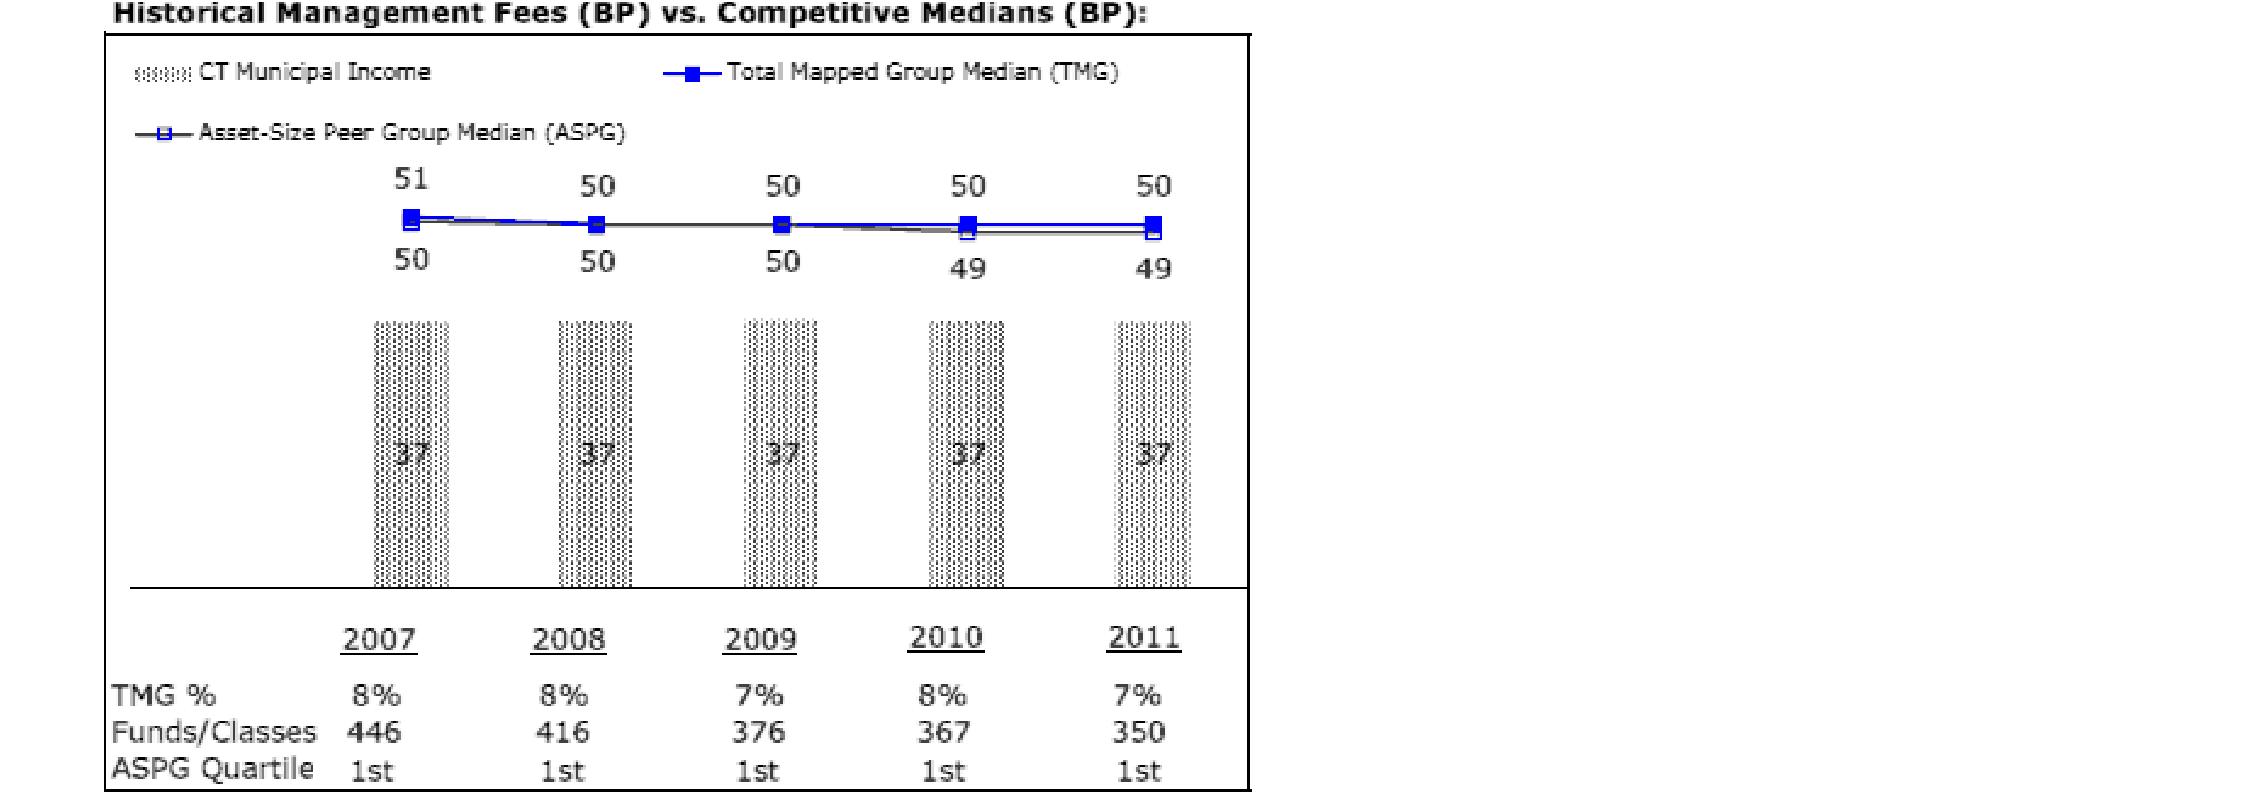
The Board noted that the fund's management fee ranked below the median of its Total Mapped Group and below the median of its ASPG for 2011.
Annual Report
Board Approval of Investment Advisory Contracts and
Management Fees - continued
Fidelity Connecticut Municipal Money Market Fund
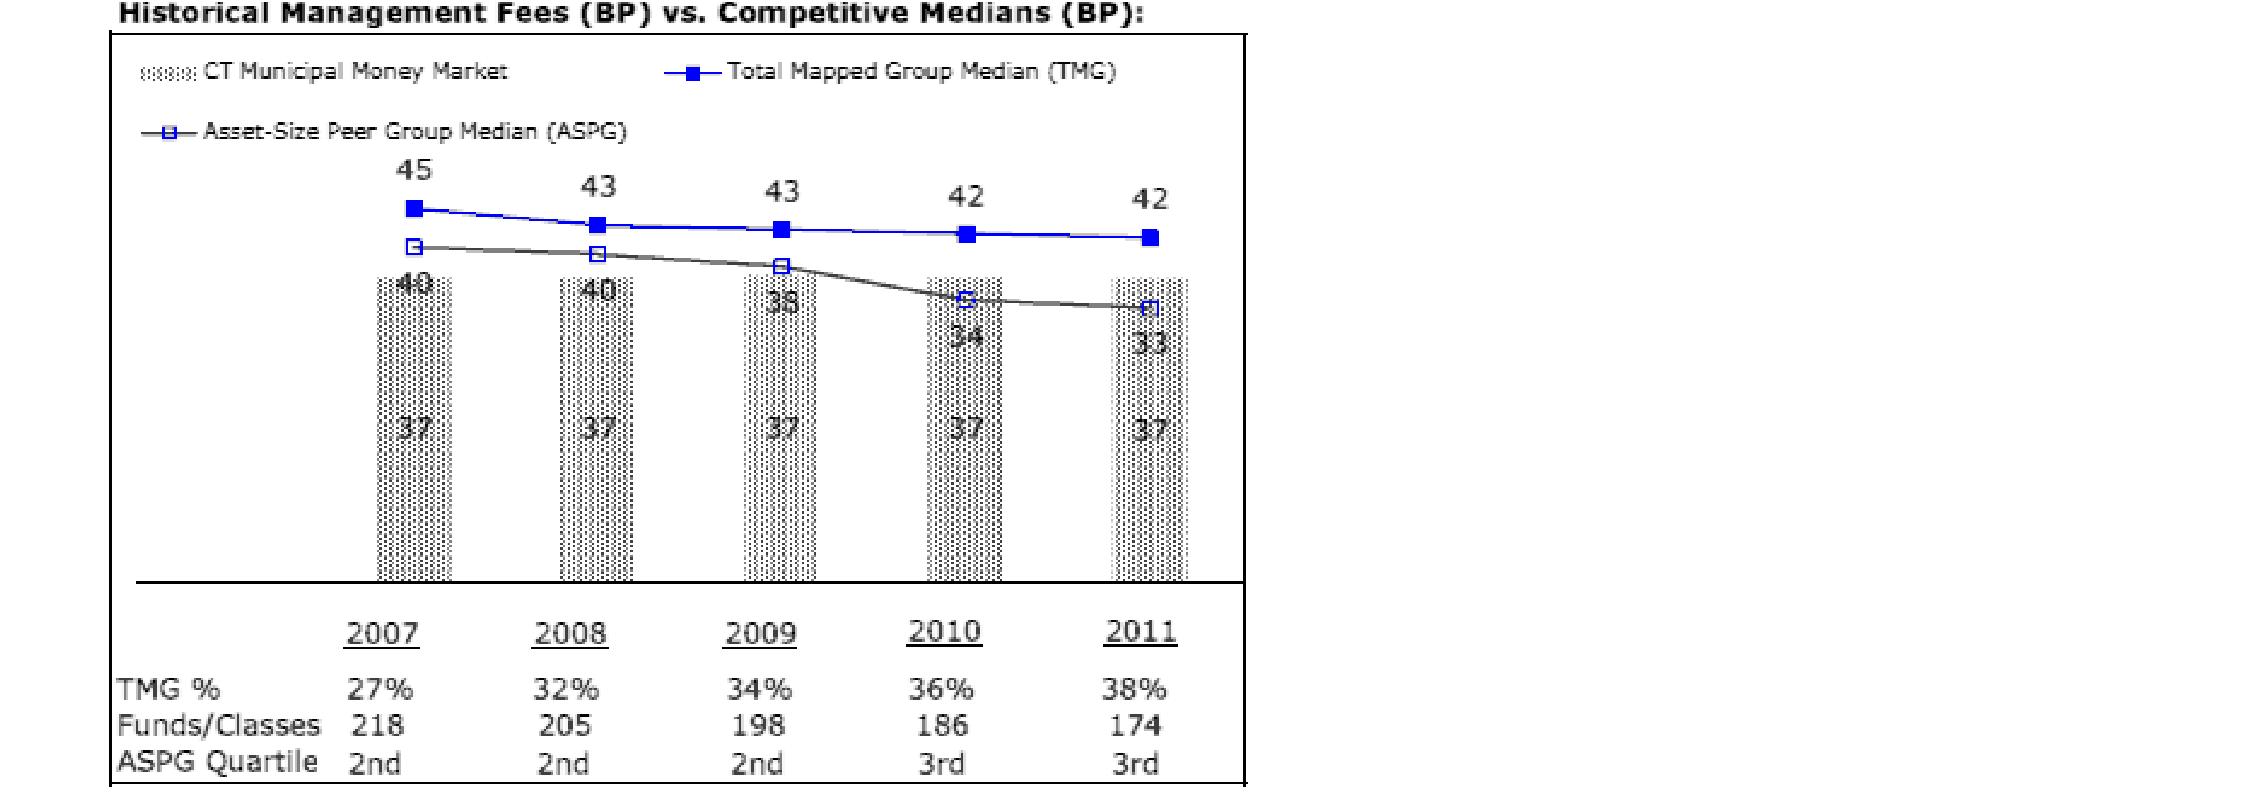
The Board noted that the fund's management fee ranked below the median of its Total Mapped Group and above the median of its ASPG for 2011.
Based on its review, the Board concluded that each fund's management fee is fair and reasonable in light of the services that the fund receives and the other factors considered.
Total Expense Ratio. In its review of each fund's total expense ratio, the Board considered the fund's management fee as well as other fund expenses, such as transfer agent fees, pricing and bookkeeping fees, and custodial, legal, and audit fees. The Board also noted the effects of any waivers and reimbursements on fees and expenses. As part of its review, the Board also considered the current and historical total expense ratios of each fund compared to competitive fund median expenses. Each fund is compared to those funds and classes in the Total Mapped Group (used by the Board for management fee comparisons) that have a similar sales load structure.
The Board noted that each fund's total expense ratio ranked below its competitive median for 2011. The Board considered that Fidelity has been voluntarily waiving part or all of the transfer agent fees and/or management fees to maintain a minimum yield for Fidelity Connecticut Municipal Money Market Fund, and also noted that Fidelity retains the ability to be repaid in certain circumstances.
Fees Charged to Other Fidelity Clients. The Board also considered Fidelity fee structures and other information with respect to clients of FMR and its affiliates, such as other mutual funds advised or subadvised by FMR or its affiliates, pension plan clients, and other institutional clients. The Board noted the findings of the 2010 ad hoc joint committee (created with the board of other Fidelity funds), which reviewed and compared Fidelity's institutional investment advisory business with its business of providing services to the Fidelity funds, including the differences in services provided, fees charged, and costs incurred, as well as competition in their respective marketplaces.
Annual Report
Based on its review of total expense ratios and fees charged to other Fidelity clients, the Board concluded that each fund's total expense ratio was reasonable in light of the services that the fund and its shareholders receive and the other factors considered.
Costs of the Services and Profitability. The Board considered the revenues earned and the expenses incurred by Fidelity in conducting the business of developing, marketing, distributing, managing, administering and servicing each fund and its shareholders. The Board also considered the level of Fidelity's profits in respect of all the Fidelity funds.
On an annual basis, FMR presents to the Board Fidelity's profitability for each fund. Fidelity calculates the profitability for each fund, as well as aggregate profitability for groups of Fidelity funds and all Fidelity funds, using a series of detailed revenue and cost allocation methodologies which originate with the books and records of Fidelity on which Fidelity's audited financial statements are based. The Audit Committee of the Board reviews any significant changes from the prior year's methodologies.
PricewaterhouseCoopers LLP (PwC), independent registered public accounting firm and auditor to Fidelity and certain Fidelity funds, has been engaged annually by the Board as part of the Board's assessment of Fidelity's profitability analysis. PwC's engagement includes the review and assessment of Fidelity's methodologies used in determining the revenues and expenses attributable to Fidelity's mutual fund business, and completion of agreed-upon procedures surrounding the mathematical accuracy of fund profitability and its conformity to allocation methodologies. After considering PwC's reports issued under the engagement and information provided by Fidelity, the Board concluded that while other allocation methods may also be reasonable, Fidelity's profitability methodologies are reasonable in all material respects.
The Board also reviewed Fidelity's non-fund businesses and fall-out benefits related to the mutual fund business as well as cases where Fidelity's affiliates may benefit from or be related to the funds' business.
The Board considered the costs of the services provided by and the profits realized by Fidelity in connection with the operation of each fund and was satisfied that the profitability was not excessive in the circumstances.
Economies of Scale. The Board considered whether there have been economies of scale in respect of the management of the Fidelity funds, whether the Fidelity funds (including each fund) have appropriately benefited from any such economies of scale, and whether there is potential for realization of any further economies of scale. The Board considered the extent to which each fund will benefit from economies of scale through increased services to the fund, through waivers or reimbursements, or through fee or expense reductions. The Board also noted that in 2009, it and the board of other Fidelity funds created an ad hoc committee (the Economies of Scale Committee) to analyze whether FMR attains economies of scale in respect of the management and servicing of the Fidelity funds, whether the Fidelity funds have appropriately benefited from such economies of scale, and whether there is potential for realization of any further economies of scale.
Annual Report
Board Approval of Investment Advisory Contracts and
Management Fees - continued
The Board recognized that each fund's management contract incorporates a "group fee" structure, which provides for lower group fee rates as total fund assets under FMR's management increase, and for higher group fee rates as total fund assets under FMR's management decrease. FMR calculates the group fee rates based on a tiered asset "breakpoint" schedule that varies based on asset class. The Board considered that the group fee is designed to deliver the benefits of economies of scale to fund shareholders when total Fidelity fund assets increase, even if assets of any particular fund are unchanged or have declined, because some portion of Fidelity's costs are attributable to services provided to all Fidelity funds, and all funds benefit if those costs can be allocated among more assets. The Board concluded that, given the group fee structure, fund shareholders will benefit from lower management fees as assets under FMR's management increase at the fund complex level, regardless of whether Fidelity achieves any such economies of scale.
The Board concluded, taking into account the analysis of the Economies of Scale Committee, that economies of scale, if any, are being appropriately shared between fund shareholders and Fidelity.
Additional Information Requested by the Board. In order to develop fully the factual basis for consideration of the Fidelity funds' Advisory Contracts, the Board requested and received additional information on certain topics, including: (i) Fidelity's fund profitability methodology, profitability trends for certain funds, and the impact of certain factors on fund profitability results; (ii) portfolio manager changes that have occurred during the past year and the amount of the investment that each portfolio manager has made in the Fidelity fund(s) that he or she manages; (iii) Fidelity's compensation structure for portfolio managers, research analysts, and other key personnel, including its effects on fund profitability, the rationale for the compensation structure, and the extent to which current market conditions have affected retention and recruitment; (iv) the compensation paid to fund sub-advisers on behalf of the Fidelity funds; (v) Fidelity's fee structures, including the group fee structure, and the rationale for recommending different fees among different categories of funds and classes; (vi) Fidelity's voluntary waiver of its fees to maintain minimum yields for certain money market funds and classes as well as contractual waivers in place for certain funds; (vii) regulatory and industry developments, including those affecting money market funds and target date funds, and the potential impact to Fidelity; (viii) Fidelity's transfer agent fees, expenses, and services, and drivers for determining the transfer agent fee structure of different funds and classes; (ix) management fee rates charged by FMR or Fidelity entities to other Fidelity clients; (x) the allocation of and historical trends in Fidelity's realization of fall-out benefits; and (xi) explanations regarding the relative total expense ratios of certain funds and classes, total expense competitive trends, and actions that might be taken by FMR to reduce total expense ratios for certain funds and classes or to achieve further economies of scale.
Annual Report
Based on its evaluation of all of the conclusions noted above, and after considering all factors it believed relevant, the Board ultimately concluded that the advisory fee structures are fair and reasonable, and that each fund's Advisory Contracts should be renewed.
Annual Report
Investment Adviser
Fidelity Management & Research Company
Boston, MA
Investment Sub-Advisers
Fidelity Investments
Money Management, Inc.
Fidelity Management & Research
(Hong Kong) Limited
Fidelity Management & Research
(Japan) Inc.
Fidelity Management & Research
(U.K.) Inc.
General Distributor
Fidelity Distributors Corporation
Smithfield, RI
Transfer and Service Agents
Citibank, N.A.
New York, NY
Fidelity Investments Institutional Operations Company, Inc.
Boston, MA
Fidelity Service Company, Inc.
Boston, MA
Custodian
Citibank, N.A.
New York, NY
The Fidelity Telephone Connection
Mutual Fund 24-Hour Service
Exchanges/Redemptions
and Account Assistance 1-800-544-6666
Product Information 1-800-544-6666
Retirement Accounts 1-800-544-4774 (8 a.m. - 9 p.m.)
TDD Service 1-800-544-0118
for the deaf and hearing impaired
(9 a.m. - 9 p.m. Eastern time)
Fidelity Automated Service
Telephone (FAST®)
1-800-544-5555
Automated line for quickest service
(Fidelity Investment logo)(registered trademark)
Corporate Headquarters
82 Devonshire St., Boston, MA 02109
www.fidelity.com
CTF-UANN-0113
1.786713.109
Fidelity®
New Jersey
Municipal Income Fund
and
Fidelity
New Jersey Municipal
Money Market Fund
Annual Report
November 30, 2012
Contents
Shareholder Expense Example | (Click Here) | An example of shareholder expenses. |
Fidelity® New Jersey Municipal Income Fund |
Performance | (Click Here) | How the fund has done over time. |
Management's
Discussion of Fund
Performance | (Click Here) | The Portfolio Manager's review of fund performance and strategy. |
Investment Changes | (Click Here) | A summary of major shifts in the fund's investments over the past six months. |
Investments | (Click Here) | A complete list of the fund's investments with their market values. |
Financial Statements | (Click Here) | Statements of assets and liabilities, operations, and changes in net assets,
as well as financial highlights. |
Fidelity® New Jersey Municipal Money Market Fund |
Investment Changes/
Performance | (Click Here) | A summary of major shifts in the fund's investments over the past six months and one year, and performance information. |
Investments | (Click Here) | A complete list of the fund's investments. |
Financial Statements | (Click Here) | Statements of assets and liabilities, operations, and changes in net assets,
as well as financial highlights. |
Notes | (Click Here) | Notes to the Financial Statements. |
Report of Independent Registered Public Accounting Firm | (Click Here) | |
Trustees and Officers | (Click Here) | |
Distributions | (Click Here) | |
Board Approval of Investment Advisory Contracts and Management Fees | (Click Here) | |
To view a fund's proxy voting guidelines and proxy voting record for the 12-month period ended June 30, visit http://www.fidelity.com/proxyvotingresults or visit the Securities and Exchange Commission's (SEC) web site at http://www.sec.gov. You may also call 1-800-544-8544 to request a free copy of the proxy voting guidelines.
Standard & Poor's, S&P and S&P 500 are registered service marks of The McGraw-Hill Companies, Inc. and have been licensed for use by Fidelity Distributors Corporation.
Other third party marks appearing herein are the property of their respective owners.
All other marks appearing herein are registered or unregistered trademarks or service marks of FMR LLC or an affiliated company. © 2013 FMR LLC. All rights reserved.
Annual Report
This report and the financial statements contained herein are submitted for the general information of the shareholders of the funds. This report is not authorized for distribution to prospective investors in the funds unless preceded or accompanied by an effective prospectus.
A fund files its complete schedule of portfolio holdings with the SEC for the first and third quarters of each fiscal year on Form N-Q. Forms N-Q are available on the SEC's web site at http://www.sec.gov. A fund's Forms N-Q may be reviewed and copied at the SEC's Public Reference Room in Washington, DC. Information regarding the operation of the SEC's Public Reference Room may be obtained by calling 1-800-SEC-0330. For a complete list of a fund's portfolio holdings, view the most recent holdings listing, semiannual report, or annual report on Fidelity's web site at http://www.fidelity.com, http://www.advisor.fidelity.com, or http://www.401k.com, as applicable.
NOT FDIC INSURED • MAY LOSE VALUE • NO BANK GUARANTEE
Neither the funds nor Fidelity Distributors Corporation is a bank.
Annual Report
Shareholder Expense Example
As a shareholder of a Fund, you incur two types of costs: (1) transaction costs, including redemption fees and (2) ongoing costs, including management fees and other Fund expenses. This Example is intended to help you understand your ongoing costs (in dollars) of investing in the Funds and to compare these costs with the ongoing costs of investing in other mutual funds.
The Example is based on an investment of $1,000 invested at the beginning of the period and held for the entire period (June 1, 2012 to November 30, 2012).
Actual Expenses
The first line of the accompanying table for each fund provides information about actual account values and actual expenses. You may use the information in this line, together with the amount you invested, to estimate the expenses that you paid over the period. Simply divide your account value by $1,000.00 (for example, an $8,600 account value divided by $1,000.00 = 8.6), then multiply the result by the number in the first line for a fund under the heading entitled "Expenses Paid During Period" to estimate the expenses you paid on your account during this period. A small balance maintenance fee of $12.00 that is charged once a year may apply for certain accounts with a value of less than $2,000. This fee is not included in the table below. If it was, the estimate of expenses you paid during the period would be higher, and your ending account value lower, by this amount. In addition, each Fund, as a shareholder in the underlying Fidelity Central Funds, will indirectly bear its pro-rata share of the fees and expenses incurred by the underlying Fidelity Central Funds. These fees and expenses are not included in the Fund's annualized expense ratio used to calculate the expense estimate in the table below.
Hypothetical Example for Comparison Purposes
The second line of the accompanying table for each fund provides information about hypothetical account values and hypothetical expenses based on a fund's actual expense ratio and an assumed rate of return of 5% per year before expenses, which is not the Fund's actual return. The hypothetical account values and expenses may not be used to estimate the actual ending account balance or expenses you paid for the period. You may use this information to compare the ongoing costs of investing in the Fund and other funds. To do so, compare this 5% hypothetical example with the 5% hypothetical examples that appear in the shareholder reports of the other funds. A small balance maintenance fee of $12.00 that is charged once a year may apply for certain accounts with a value of less than $2,000. This fee is not included in the table below. If it was, the estimate of expenses you paid during the period would be higher, and your ending account value lower, by this amount. In addition, each Fund, as a shareholder in the underlying Fidelity Central Funds, will indirectly bear its pro-rata share of the fees and expenses incurred by the underlying Fidelity Central Funds. These fees and expenses are not included in the Fund's annualized expense ratio used to calculate the expense estimate in the table below.
Please note that the expenses shown in the table are meant to highlight your ongoing costs only and do not reflect any transaction costs. Therefore, the second line of the table is useful in comparing ongoing costs only, and will not help you determine the relative total costs of owning different funds. In addition, if these transactional costs were included, your costs would have been higher.
Annual Report
| Annualized Expense Ratio | Beginning
Account Value
June 1, 2012 | Ending
Account Value
November 30, 2012 | Expenses Paid
During Period*
June 1, 2012 to
November 30, 2012 |
Fidelity New Jersey Municipal Income Fund | .47% | | | |
Actual | | $ 1,000.00 | $ 1,038.00 | $ 2.39 |
HypotheticalA | | $ 1,000.00 | $ 1,022.65 | $ 2.38 |
Fidelity New Jersey Municipal Money Market Fund | .22% | | | |
Actual | | $ 1,000.00 | $ 1,000.10 | $ 1.10** |
HypotheticalA | | $ 1,000.00 | $ 1,023.90 | $ 1.11** |
A 5% return per year before expenses
* Expenses are equal to each Fund's annualized expense ratio, multiplied by the average account value over the period, multiplied by 183/366 (to reflect the one-half year period).
** If certain fees were not voluntarily waived by Fidelity Management & Research Company (FMR) or its affiliates during the period, the annualized expense ratio for Fidelity New Jersey Municipal Money Market Fund would have been .51% and the expenses paid in the actual and hypothetical examples above would have been $2.55 and $2.58, respectively.
Annual Report
Fidelity New Jersey Municipal Income Fund
Performance: The Bottom Line
Average annual total return reflects the change in the value of an investment, assuming reinvestment of the fund's distributions from dividend income and capital gains (the profits earned upon the sale of securities that have grown in value, if any) and assuming a constant rate of performance each year. The $10,000 table and the fund's returns do not reflect the deduction of taxes that a shareholder would pay on fund distributions or the redemption of fund shares. During periods of reimbursement by Fidelity, a fund's total return will be greater than it would be had the reimbursement not occurred. How a fund did yesterday is no guarantee of how it will do tomorrow.
Average Annual Total Returns
Periods ended November 30, 2012 | Past 1
year | Past 5
years | Past 10
years |
Fidelity New Jersey Municipal Income Fund | 10.21% | 5.63% | 5.13% |
$10,000 Over 10 Years
Let's say hypothetically that $10,000 was invested in Fidelity New Jersey Municipal Income Fund on November 30, 2002. The chart shows how the value of your investment would have changed, and also shows how the Barclays® Municipal Bond Index performed over the same period.
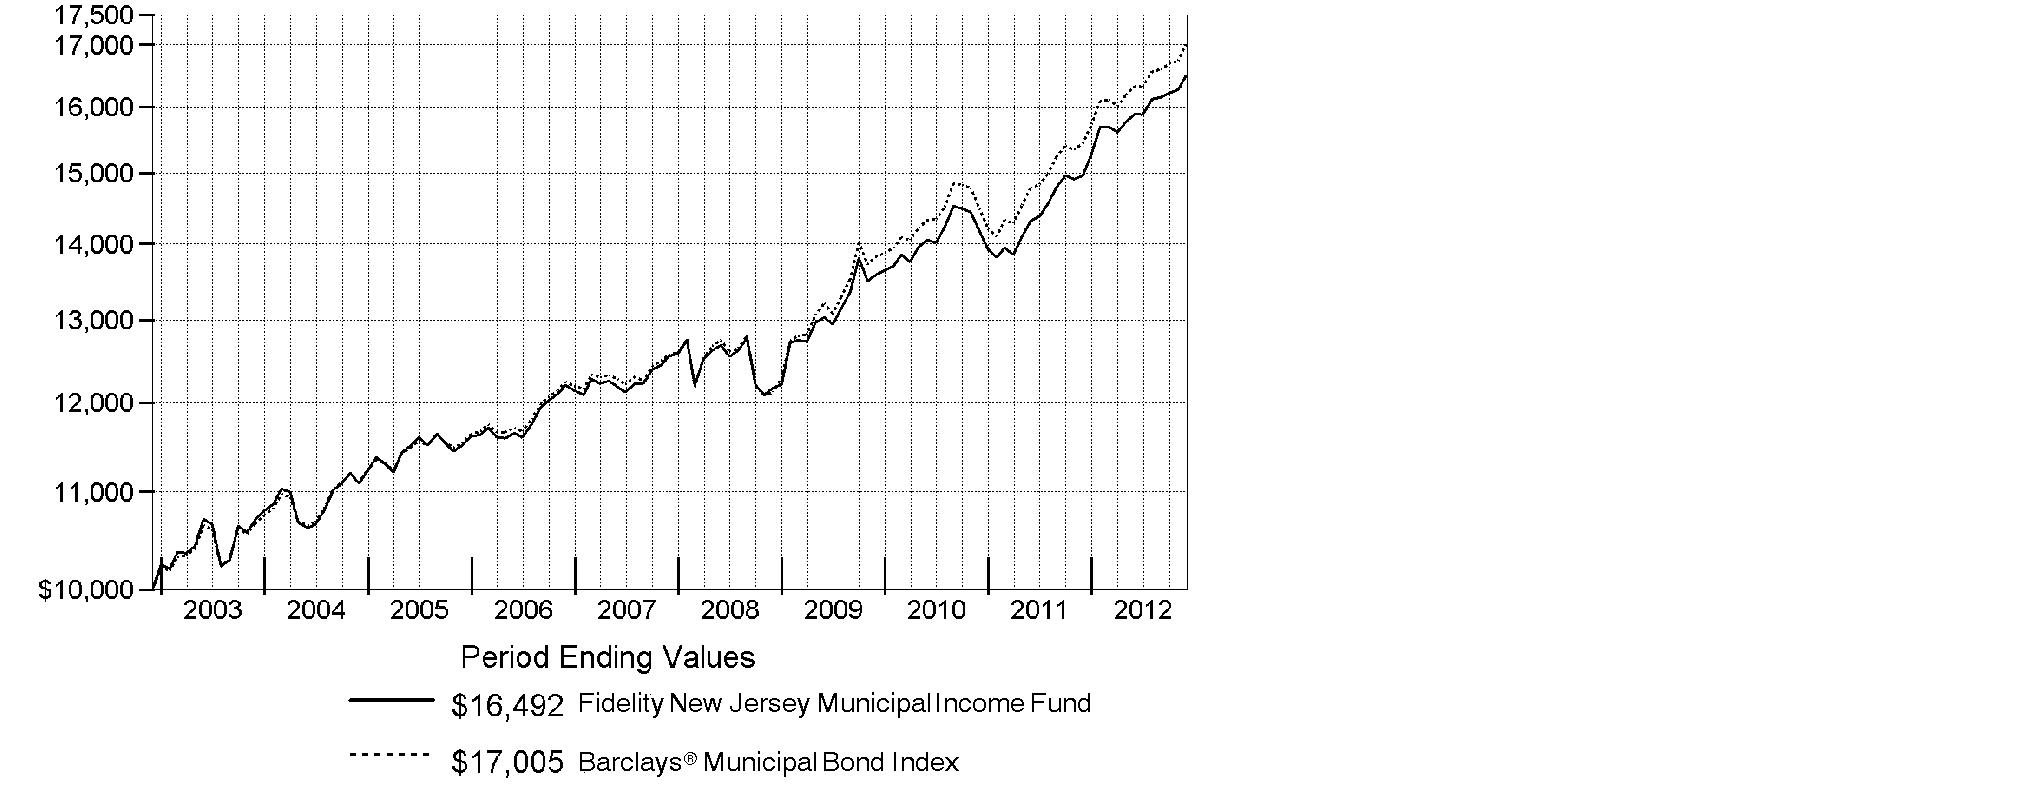
Annual Report
Market Recap: The bull market for municipal bonds continued to run during the year ending November 30, 2012, with the Barclays® Municipal Bond Index advancing 10.17% and achieving new multiyear highs. By contrast, taxable investment-grade debt gained 5.51%, as measured by the Barclays® U.S. Aggregate Bond Index. Munis remained bolstered by improving issuer fundamentals and favorable technical factors of supply and demand. On the basis of fundamentals, investors were encouraged by a recovery in tax revenues to pre-2009 levels for many issuers. And despite a handful of well-publicized bankruptcies by local issuers, the overall muni default rate declined and remained low. Even with a surge in refinancings, the supply of newly issued muni bonds was muted. As for demand, munis continued to benefit from their yield advantage over U.S. Treasuries and heightened interest in high-quality fixed-income securities as a perceived safe haven amid mixed U.S. economic data and the ongoing financial crisis in Europe. Investors' appetite for tax-advantaged investments in advance of potentially higher federal tax rates in 2013 also helped, particularly in November after Election Day, when the muni market rose 1.65% for the month. A steady stream of municipal redemptions (calls and maturities), many of which were reinvested in the muni market, also competed for limited new supply, driving up valuations.
Comments from Jamie Pagliocco, Portfolio Manager of Fidelity® New Jersey Municipal Income Fund: For the year, the fund returned 10.21%, while the Barclays New Jersey Enhanced Modified Municipal Bond Index - which tracks the types of securities in which the fund invests - rose 11.05%. Versus the index, the fund was hurt by its out-of-benchmark exposure to Puerto Rico bonds, which lagged the New Jersey market amid concerns about the territory's poor economic prospects, high debt load, dramatically underfunded pension system and change in political leadership. The fund's overweighting in premium callable bonds also detracted from performance, because they lagged the market due to comparatively tepid demand. In contrast, the fund benefited on a relative basis from its underweighting in housing bonds, which lagged due to prepayment concerns. Yield-curve positioning was modestly beneficial, with the fund's slight overweighting in longer-terms bonds and underweighting in intermediate-maturity securities proving helpful due to strong demand for longer-term bonds.
The views expressed above reflect those of the portfolio manager(s) only through the end of the period as stated on the cover of this report and do not necessarily represent the views of Fidelity or any other person in the Fidelity organization. Any such views are subject to change at any time based upon market or other conditions and Fidelity disclaims any responsibility to update such views. These views may not be relied on as investment advice and, because investment decisions for a Fidelity fund are based on numerous factors, may not be relied on as an indication of trading intent on behalf of any Fidelity fund.
Annual Report
Fidelity New Jersey Municipal Income Fund
Investment Changes (Unaudited)
Top Five Sectors as of November 30, 2012 |
| % of fund's
net assets | % of fund's net assets
6 months ago |
General Obligations | 48.9 | 48.1 |
Transportation | 10.6 | 11.5 |
Special Tax | 8.1 | 6.9 |
Health Care | 8.0 | 6.7 |
Education | 7.7 | 8.7 |
Weighted Average Maturity as of November 30, 2012 |
| | 6 months ago |
Years | 6.3 | 6.1 |
This is a weighted average of all the maturities of the securities held in a fund. Weighted Average Maturity (WAM) can be used as a measure of sensitivity to interest rate changes and market changes. Generally, the longer the maturity, the greater the sensitivity to such changes. WAM is based on the dollar-weighted average length of time until principal payments must be paid. Depending on the types of securities held in a fund, certain maturity shortening devices (e.g., demand features, interest rate resets, and call options) may be taken into account when calculating the WAM. |
Duration as of November 30, 2012 |
| | 6 months ago |
Years | 6.6 | 6.9 |
Duration estimates how much a bond fund's price will change with a change in comparable interest rates. If rates rise 1%, for example, a fund with a 5-year duration is likely to lose about 5% of its value. Other factors also can influence a bond fund's performance and share price. Accordingly, a bond fund's actual performance may differ from this example. Duration takes into account any call or put option embedded in the bonds. |
Quality Diversification (% of fund's net assets) |
As of November 30, 2012 | As of May 31, 2012 |
 | AAA 4.2% | | | AAA 2.8% | |
 | AA,A 79.2% | | | AA,A 79.6% | |
 | BBB 9.8% | | | BBB 9.1% | |
 | BB and Below 0.6% | |  | BB and Below 0.6% | |
 | Not Rated 1.3% | | | Not Rated 1.8% | |
 | Short-Term
Investments and
Net Other Assets 4.9% | | | Short-Term
Investments and
Net Other Assets 6.1% | |

We have used ratings from Moody's Investors Service, Inc. Where Moody's® ratings are not available, we have used S&P® ratings. All ratings are as of the date indicated and do not reflect subsequent changes. |
Annual Report
Fidelity New Jersey Municipal Income Fund
Investments November 30, 2012
Showing Percentage of Net Assets
Municipal Bonds - 95.1% |
| Principal Amount | | Value |
Guam - 0.3% |
Guam Pwr. Auth. Rev. Series 2012 A, 5% 10/1/22 (FSA Insured) | | $ 1,500,000 | | $ 1,791,570 |
New Jersey - 83.8% |
Atlantic County Impt. Auth. Luxury Tax Rev. (Convention Ctr. Proj.) Series 1985 A, 7.4% 7/1/16 (Escrowed to Maturity) | | 2,540,000 | | 2,882,595 |
Bayonne Gen. Oblig. 5.5% 7/1/39 | | 5,000,000 | | 5,798,650 |
Burlington County Board Commission Pooled Ln. Rev. (Govt. Ln. Prog.) Series 2004, 5.25% 12/15/22 (AMBAC Insured) | | 3,290,000 | | 3,593,667 |
Burlington County Bridge Commission Lease Rev. Series 2002: | | | | |
5.25% 8/15/16 | | 20,000 | | 20,069 |
5.25% 8/15/17 | | 20,000 | | 20,072 |
Camden County Impt. Auth. Health Care Redev. Rev. (Cooper Health Sys. Obligated Group Proj.) Series 2005 B, 5% 2/15/14 | | 1,350,000 | | 1,417,257 |
Cape May County Indl. Poll. Cont. Fing. Auth. Rev. (Atlantic City Elec. Co. Proj.) Series 1991 A, 6.8% 3/1/21 (Nat'l. Pub. Fin. Guarantee Corp. Insured) | | 1,350,000 | | 1,751,706 |
Casino Reinvestment Dev. Auth. Hotel Room Fee Rev. Series 2004, 5.25% 1/1/24 (AMBAC Insured) | | 1,600,000 | | 1,718,000 |
East Brunswick Township Board of Ed.: | | | | |
5% 11/1/22 | | 1,000,000 | | 1,274,540 |
5% 11/1/23 | | 1,000,000 | | 1,263,220 |
East Windsor Reg'l. School District: | | | | |
5% 3/1/20 | | 1,045,000 | | 1,290,951 |
5% 3/1/21 | | 1,000,000 | | 1,248,320 |
Essex County Util. Auth. Solid Waste Rev. Series 2009, 5% 4/1/20 (Assured Guaranty Corp. Insured) | | 1,000,000 | | 1,163,750 |
Garden State Preservation Trust Open Space & Farmland Preservation: | | | | |
Series 2003 B, 0% 11/1/21 (FSA Insured) | | 1,635,000 | | 1,341,975 |
Series 2005 A, 5.8% 11/1/19 (Pre-Refunded to 11/1/15 @ 100) | | 5,000,000 | | 5,771,300 |
Series 2005 B: | | | | |
6.375% 11/1/13 (Nat'l. Pub. Fin. Guarantee Corp. Insured) | | 4,000,000 | | 4,221,440 |
6.375% 11/1/15 (Nat'l. Pub. Fin. Guarantee Corp. Insured) | | 11,515,000 | | 13,442,035 |
Series 2012 A, 5% 11/1/22 | | 6,600,000 | | 8,577,756 |
Gloucester County Impt. Auth. Solid Waste Resource Recovery Rev. Bonds (Waste Mangement, Inc. Proj.) Series 1999 B, 3.375%, tender 12/3/12 (b)(c) | | 1,210,000 | | 1,210,000 |
Municipal Bonds - continued |
| Principal Amount | | Value |
New Jersey - continued |
Hudson County Ctfs. of Prtn. Series 2002: | | | | |
6.25% 6/1/14 (Nat'l. Pub. Fin. Guarantee Corp. Insured) | | $ 3,210,000 | | $ 3,398,427 |
6.25% 6/1/15 (Nat'l. Pub. Fin. Guarantee Corp. Insured) | | 2,420,000 | | 2,655,490 |
6.25% 12/1/15 (Nat'l. Pub. Fin. Guarantee Corp. Insured) | | 1,525,000 | | 1,702,251 |
6.25% 6/1/16 (Nat'l. Pub. Fin. Guarantee Corp. Insured) | | 1,610,000 | | 1,812,812 |
Jersey City Gen. Oblig.: | | | | |
Series 2002 B, 5.25% 3/1/15 (AMBAC Insured) | | 1,250,000 | | 1,358,000 |
Series 2005 C, 5% 9/1/18 (Nat'l. Pub. Fin. Guarantee Corp. Insured) | | 3,500,000 | | 3,809,680 |
Lenape Reg'l. High School District: | | | | |
7.625% 1/1/13 (Nat'l. Pub. Fin. Guarantee Corp. Insured) | | 675,000 | | 678,166 |
7.625% 1/1/14 (Nat'l. Pub. Fin. Guarantee Corp. Insured) | | 1,000,000 | | 1,067,790 |
Margate City Gen. Oblig. Series 2009, 5% 2/1/18 | | 750,000 | | 891,645 |
Middlesex County Impt. Auth. Rev. (Guaranteed Open Space Trust Fund Prog.) Series 2003: | | | | |
5.25% 9/15/16 (Pre-Refunded to 9/15/13 @ 100) | | 1,360,000 | | 1,413,013 |
5.25% 9/15/17 (Pre-Refunded to 9/15/13 @ 100) | | 2,000,000 | | 2,077,960 |
Monroe Township Board of Ed. Series 2012: | | | | |
5% 8/1/26 | | 3,220,000 | | 4,057,844 |
5% 8/1/28 | | 4,000,000 | | 4,989,120 |
Morristown Gen. Oblig. Series 2005, 6.5% 8/1/19 (FSA Insured) | | 20,000 | | 26,505 |
New Brunswick Parking Auth. Rev. Series 2012: | | | | |
5% 9/1/23 | | 1,450,000 | | 1,740,740 |
5% 9/1/26 | | 600,000 | | 713,502 |
5% 9/1/27 | | 440,000 | | 522,821 |
New Jersey Econ. Dev. Auth. School Facilities Construction Rev.: | | | | |
Bonds Series 2008 J4, 5%, tender 9/1/14 (FSA Insured) (b) | | 3,000,000 | | 3,207,390 |
Series 2004 A, 5.25% 7/1/15 (Nat'l. Pub. Fin. Guarantee Corp. Insured) | | 3,500,000 | | 3,770,375 |
Series 2005 K: | | | | |
5.25% 12/15/16 (AMBAC Insured) | | 3,000,000 | | 3,398,550 |
5.5% 12/15/19 | | 8,000,000 | | 10,181,920 |
Series 2005 N1, 5.5% 9/1/24 (AMBAC Insured) | | 5,000,000 | | 6,529,500 |
Municipal Bonds - continued |
| Principal Amount | | Value |
New Jersey - continued |
New Jersey Econ. Dev. Auth. School Facilities Construction Rev.: - continued | | | | |
Series 2005 O: | | | | |
5% 3/1/20 (Pre-Refunded to 3/1/15 @ 100) | | $ 2,700,000 | | $ 2,975,265 |
5.125% 3/1/28 | | 18,455,000 | | 20,093,060 |
5.125% 3/1/30 | | 2,175,000 | | 2,360,462 |
5.25% 3/1/21 | | 2,800,000 | | 3,075,912 |
5.25% 3/1/21 (Nat'l. Pub. Fin. Guarantee Corp. Insured) | | 3,000,000 | | 3,307,620 |
5.25% 3/1/22 | | 15,700,000 | | 17,228,552 |
5.25% 3/1/23 | | 4,740,000 | | 5,201,486 |
5.25% 3/1/24 | | 9,000,000 | | 9,880,470 |
5.25% 3/1/25 | | 3,000,000 | | 3,287,850 |
5.25% 3/1/26 | | 9,000,000 | | 9,853,020 |
Series 2005 P: | | | | |
5.125% 9/1/28 | | 6,800,000 | | 7,565,612 |
5.25% 9/1/26 | | 8,000,000 | | 8,950,880 |
Series 2006 S, 5% 9/1/36 | | 9,000,000 | | 9,954,000 |
Series 2007 U, 5% 9/1/37 | | 2,000,000 | | 2,246,800 |
Series 2009 Z, 6% 12/15/34 (Assured Guaranty Corp. Insured) | | 2,900,000 | | 3,462,861 |
Series 2012 II, 5% 3/1/26 | | 5,000,000 | | 6,043,650 |
Series 2012, 5% 6/15/20 | | 5,000,000 | | 5,920,650 |
New Jersey Econ. Dev. Auth. Wtr. Facilities Rev.: | | | | |
(American Wtr. Co., Inc. Proj.) Series 2009 A, 5.7% 10/1/39 (c) | | 5,000,000 | | 5,604,200 |
(Middlesex Wtr. Co. Proj.) Series 1998, 5.35% 2/1/38 (Nat'l. Pub. Fin. Guarantee Corp. Insured) (c) | | 1,000,000 | | 1,002,940 |
New Jersey Edl. Facilities Auth. Rev.: | | | | |
(Montclair State Univ. Proj.): | | | | |
Series 2002 F, 5% 7/1/17 (FGIC Insured) (Pre-Refunded to 7/1/15 @ 100) | | 1,000,000 | | 1,116,230 |
Series 2003 L, 5.125% 7/1/20 (Nat'l. Pub. Fin. Guarantee Corp. Insured) | | 170,000 | | 179,428 |
Series L, 5.125% 7/1/20 (Pre-Refunded to 7/1/14 @ 100) | | 1,975,000 | | 2,123,382 |
(New Jersey Institute of Technology Proj.) Series 2010 H, 5% 7/1/31 | | 2,000,000 | | 2,299,780 |
(Princeton Theological Seminary Proj.) Series 2009 B: | | | | |
4% 7/1/22 | | 1,000,000 | | 1,168,860 |
5% 7/1/13 | | 250,000 | | 256,873 |
5% 7/1/14 | | 235,000 | | 252,388 |
Municipal Bonds - continued |
| Principal Amount | | Value |
New Jersey - continued |
New Jersey Edl. Facilities Auth. Rev.: - continued | | | | |
(Princeton Theological Seminary Proj.) Series 2009 B: - continued | | | | |
5% 7/1/15 | | $ 235,000 | | $ 263,409 |
5% 7/1/17 | | 490,000 | | 586,604 |
5% 7/1/18 | | 250,000 | | 308,800 |
5% 7/1/19 | | 200,000 | | 252,798 |
(Princeton Univ. Proj.) Series 2010 B, 4.25% 7/1/40 | | 5,000,000 | | 5,669,800 |
(Rowan Univ. Proj.) Series 2007 B: | | | | |
5.5% 7/1/16 (Nat'l. Pub. Fin. Guarantee Corp. Insured) | | 2,500,000 | | 2,845,600 |
5.5% 7/1/18 (Nat'l. Pub. Fin. Guarantee Corp. Insured) | | 4,390,000 | | 5,224,363 |
(The College of New Jersey Proj.) Series 2008 D, 5% 7/1/35 (FSA Insured) | | 4,000,000 | | 4,453,200 |
(William Paterson College Proj.) Series 2008 C, 5% 7/1/19 (Assured Guaranty Corp. Insured) | | 2,570,000 | | 3,035,530 |
Series 2012 A: | | | | |
5% 7/1/18 | | 1,000,000 | | 1,195,870 |
5% 7/1/19 | | 1,000,000 | | 1,216,870 |
Series 2012 B: | | | | |
5% 7/1/37 | | 750,000 | | 868,575 |
5% 7/1/42 | | 1,100,000 | | 1,268,003 |
New Jersey Envir. Infrastructure Trust: | | | | |
Series 2012 A, 4% 9/1/20 | | 10,000,000 | | 12,014,200 |
5% 9/1/17 | | 4,870,000 | | 5,682,706 |
5% 9/1/17 (Pre-Refunded to 9/1/16 @ 100) | | 30,000 | | 34,970 |
New Jersey Health Care Facilities Fing. Auth. Rev.: | | | | |
(AHS Hosp. Corp. Proj.) Series 2011, 6% 7/1/41 | | 5,000,000 | | 6,311,800 |
(AtlantiCare Reg'l. Med. Ctr. Proj.) Series 2007, 5% 7/1/17 | | 1,000,000 | | 1,142,670 |
(Chilton Memorial Hosp. Proj.) Series 2009, 5.75% 7/1/39 | | 3,765,000 | | 4,225,535 |
(Hackensack Univ. Med. Ctr. Proj.): | | | | |
Series 2010 B, 5% 1/1/22 | | 1,725,000 | | 1,962,188 |
Series 2010, 5% 1/1/34 | | 2,000,000 | | 2,164,320 |
(Robert Wood Johnson Univ. Hosp. Proj.) Series 2010, 5% 7/1/31 | | 5,000,000 | | 5,588,950 |
(Saint Mary's Hosp. - Passaic Proj.) Series 2007-1: | | | | |
5% 3/1/20 | | 2,030,000 | | 2,280,664 |
5% 3/1/21 | | 2,680,000 | | 3,002,806 |
(South Jersey Hosp. Proj.) Series 2006, 5% 7/1/14 | | 1,620,000 | | 1,711,919 |
(Virtua Health Proj.) Series A, 5.25% 7/1/17 (Assured Guaranty Corp. Insured) | | 6,000,000 | | 6,836,640 |
Municipal Bonds - continued |
| Principal Amount | | Value |
New Jersey - continued |
New Jersey Health Care Facilities Fing. Auth. Rev.: - continued | | | | |
Series 2008 A, 5.25% 10/1/38 | | $ 5,965,000 | | $ 6,670,063 |
Series 2008, 6.625% 7/1/38 | | 3,225,000 | | 3,732,873 |
Series 2009 A, 5.75% 10/1/31 | | 4,000,000 | | 4,769,080 |
Series 2011: | | | | |
5% 7/1/19 | | 1,500,000 | | 1,808,625 |
5% 7/1/23 | | 2,500,000 | | 3,003,150 |
5% 7/1/24 | | 2,000,000 | | 2,376,420 |
5% 7/1/25 | | 2,265,000 | | 2,676,664 |
Series 2012 A: | | | | |
5% 7/1/18 (a) | | 795,000 | | 929,291 |
5% 7/1/22 (a) | | 1,400,000 | | 1,690,990 |
5% 7/1/23 (a) | | 1,000,000 | | 1,195,650 |
5% 7/1/24 (a) | | 2,000,000 | | 2,378,280 |
5% 7/1/25 (a) | | 1,000,000 | | 1,183,590 |
Series 2012 II, 5% 7/1/42 | | 1,000,000 | | 1,114,200 |
Series 2012, 5% 7/1/21 | | 2,325,000 | | 2,729,783 |
New Jersey Higher Ed. Student Assistance Auth. Student Ln. Rev. Series 2010 1A, 5% 12/1/17 | | 2,500,000 | | 2,885,250 |
New Jersey Institute of Technology Series 2012 A: | | | | |
5% 7/1/32 | | 1,250,000 | | 1,502,750 |
5% 7/1/42 | | 5,000,000 | | 5,849,250 |
New Jersey Tobacco Settlement Fing. Corp.: | | | | |
Series 2003, 6.375% 6/1/32 (Pre-Refunded to 6/1/13 @ 100) | | 6,175,000 | | 6,361,856 |
Series 2007 1A, 5% 6/1/15 | | 1,000,000 | | 1,096,790 |
New Jersey Tpk. Auth. Tpk. Rev.: | | | | |
Series 1991 C: | | | | |
6.5% 1/1/16 (Escrowed to Maturity) | | 2,415,000 | | 2,606,510 |
6.5% 1/1/16 (Escrowed to Maturity) | | 5,975,000 | | 6,595,623 |
Series 2005 C: | | | | |
6.5% 1/1/16 | | 385,000 | | 447,632 |
6.5% 1/1/16 (Escrowed to Maturity) | | 190,000 | | 225,097 |
Series 2009 E, 5.25% 1/1/40 | | 10,600,000 | | 12,264,942 |
Series 2009 G, 5% 1/1/17 | | 3,745,000 | | 4,328,284 |
Series 2009 I, 5% 1/1/35 | | 5,000,000 | | 5,809,100 |
Series 2012 B, 5% 1/1/24 | | 2,650,000 | | 3,325,194 |
6.5% 1/1/16 (Escrowed to Maturity) | | 210,000 | | 248,084 |
New Jersey Trans. Trust Fund Auth.: | | | | |
Series 2001 A, 6% 6/15/35 | | 2,800,000 | | 3,514,168 |
Municipal Bonds - continued |
| Principal Amount | | Value |
New Jersey - continued |
New Jersey Trans. Trust Fund Auth.: - continued | | | | |
Series 2004 B: | | | | |
5.5% 12/15/15 (Nat'l. Pub. Fin. Guarantee Corp. Insured) | | $ 11,000,000 | | $ 12,554,190 |
5.5% 12/15/16 (Nat'l. Pub. Fin. Guarantee Corp. Insured) | | 5,275,000 | | 6,232,729 |
Series 2005 B: | | | | |
5.25% 12/15/16 (Nat'l. Pub. Fin. Guarantee Corp. Insured) | | 9,830,000 | | 11,132,770 |
5.25% 12/15/22 (AMBAC Insured) | | 1,200,000 | | 1,521,552 |
5.5% 12/15/20 (Nat'l. Pub. Fin. Guarantee Corp. Insured) | | 15,235,000 | | 19,443,973 |
Series 2005 C, 5.25% 6/15/20 (Nat'l. Pub. Fin. Guarantee Corp. Insured) | | 10,000,000 | | 11,140,700 |
Series 2005 D, 5% 6/15/20 | | 4,000,000 | | 4,403,680 |
Series 2006 C: | | | | |
0% 12/15/26 (AMBAC Insured) | | 10,000,000 | | 5,889,400 |
0% 12/15/34 | | 4,000,000 | | 1,611,520 |
Series 2008 A: | | | | |
0% 12/15/35 | | 12,055,000 | | 4,287,481 |
0% 12/15/36 | | 25,000,000 | | 8,362,500 |
5.5% 12/15/38 (Assured Guaranty Corp. Insured) | | 1,710,000 | | 2,038,628 |
Series 2009 A: | | | | |
0% 12/15/36 | | 1,915,000 | | 640,568 |
0% 12/15/38 | | 13,900,000 | | 4,169,583 |
0% 12/15/39 | | 18,895,000 | | 5,397,546 |
Series 2010 A, 0% 12/15/30 | | 14,750,000 | | 6,984,420 |
Series 2010 A3, 0% 12/15/34 | | 10,775,000 | | 4,069,179 |
Series 2011 A, 5.25% 6/15/25 | | 6,000,000 | | 7,468,620 |
Series 2011 B: | | | | |
5.25% 6/15/25 | | 3,185,000 | | 3,978,670 |
5.25% 6/15/26 | | 2,000,000 | | 2,493,080 |
New Jersey Transit Corp. Ctfs. of Prtn. Series 2003 A, 5.25% 9/15/15 (AMBAC Insured) | | 3,300,000 | | 3,657,291 |
Newark City Hsg. Auth. City-Secured Police Facility Rev. (Southward Police Proj.) Series 2009 A, 6.75% 12/1/38 (Assured Guaranty Corp. Insured) | | 1,000,000 | | 1,280,580 |
Newark Gen. Oblig. Series 2002, 5.375% 12/15/13 (Nat'l. Pub. Fin. Guarantee Corp. Insured) | | 2,840,000 | | 2,849,940 |
Newark Port Auth. Hsg. Auth. Rev.: | | | | |
(City of Newark Redev. Proj.) Series 2004, 5.5% 1/1/27 (Pre-Refunded to 1/1/14 @ 100) | | 2,500,000 | | 2,638,775 |
Municipal Bonds - continued |
| Principal Amount | | Value |
New Jersey - continued |
Newark Port Auth. Hsg. Auth. Rev.: - continued | | | | |
(Newark Redev. Proj.) Series 2007, 5.25% 1/1/18 (Nat'l. Pub. Fin. Guarantee Corp. Insured) | | $ 1,350,000 | | $ 1,485,230 |
North Bergen Township Muni. Utils. Auth. Swr. Rev. Series 2003: | | | | |
5.25% 12/15/16 (Nat'l. Pub. Fin. Guarantee Corp. Insured) | | 2,800,000 | | 2,934,092 |
5.25% 12/15/17 (Nat'l. Pub. Fin. Guarantee Corp. Insured) | | 1,000,000 | | 1,045,980 |
North Hudson Swr. Auth. Wtr. & Swr. Rev. Series 2001 A, 0% 8/1/24 (Escrowed to Maturity) | | 2,000,000 | | 1,565,960 |
Rutgers State Univ. Rev.: | | | | |
Series 1992 A, 6.4% 5/1/13 | | 390,000 | | 399,812 |
Series 2009 F: | | | | |
5% 5/1/30 | | 1,500,000 | | 1,756,470 |
5% 5/1/39 | | 9,500,000 | | 10,849,190 |
Series 2010 I, 5% 5/1/29 | | 1,110,000 | | 1,315,472 |
Union County Impt. Auth. (Juvenile Detention Ctr. Facility Proj.) Series 2005, 5.5% 5/1/34 (Nat'l. Pub. Fin. Guarantee Corp. Insured) | | 6,000,000 | | 6,326,880 |
| | 588,817,475 |
New Jersey/Pennsylvania - 2.4% |
Delaware River Joint Toll Bridge Commission Pennsylvania-New Jersey Bridge Rev.: | | | | |
Series 2003, 5.25% 7/1/17 (Pre-Refunded to 7/1/13 @ 100) | | 1,300,000 | | 1,337,297 |
Series 2007 A, 5% 7/1/26 (Nat'l. Pub. Fin. Guarantee Corp. Insured) | | 2,855,000 | | 3,200,855 |
Series 2012 A: | | | | |
5% 7/1/21 | | 600,000 | | 744,342 |
5% 7/1/24 | | 1,200,000 | | 1,478,088 |
5% 7/1/25 | | 1,100,000 | | 1,349,612 |
5% 7/1/26 | | 500,000 | | 610,580 |
Delaware River Port Auth. Pennsylvania & New Jersey Rev.: | | | | |
(Port District Proj.): | | | | |
Series 1999 B, 5.7% 1/1/22 (FSA Insured) | | 2,000,000 | | 2,007,380 |
Series 2001 A, 5.5% 1/1/18 (FSA Insured) | | 2,000,000 | | 2,007,120 |
Series 2010 D, 5% 1/1/40 | | 4,000,000 | | 4,487,320 |
| | 17,222,594 |
Municipal Bonds - continued |
| Principal Amount | | Value |
New York & New Jersey - 4.0% |
Port Auth. of New York & New Jersey: | | | | |
124th Series, 5% 8/1/13 (Nat'l. Pub. Fin. Guarantee Corp. Insured) (c) | | $ 3,000,000 | | $ 3,010,140 |
136th Series, 5.25% 11/1/16 (c) | | 2,800,000 | | 2,987,936 |
141st Series: | | | | |
5% 9/1/18 (c) | | 6,000,000 | | 6,603,840 |
5% 9/1/21 (CIFG North America Insured) (c) | | 2,400,000 | | 2,639,496 |
163rd Series, 5% 7/15/35 | | 3,255,000 | | 3,788,755 |
166th Series, 5% 1/15/41 | | 5,000,000 | | 5,804,900 |
Port Auth. of New York & New Jersey Spl. Oblig. Rev. (JFK Int'l. Air Term. Spl. Proj.) Series 6, 6.25% 12/1/15 (Nat'l. Pub. Fin. Guarantee Corp. Insured) (c) | | 3,000,000 | | 3,323,880 |
| | 28,158,947 |
Puerto Rico - 4.2% |
Puerto Rico Commonwealth Aqueduct & Swr. Auth. Series 2012 A, 5.75% 7/1/37 | | 2,100,000 | | 2,230,053 |
Puerto Rico Commonwealth Hwy. & Trans. Auth. Trans. Rev. Series 2003, 5.75% 7/1/19 (FGIC Insured) | | 3,000,000 | | 3,086,340 |
Puerto Rico Commonwealth Infrastructure Fing. Auth. Series 2005 C, 5.5% 7/1/18 | | 2,000,000 | | 2,214,720 |
Puerto Rico Commonwealth Pub. Impt. Gen. Oblig. Series 2007 A, 5.5% 7/1/19 (Nat'l. Pub. Fin. Guarantee Corp. Insured) | | 2,000,000 | | 2,226,760 |
Puerto Rico Elec. Pwr. Auth. Pwr. Rev.: | | | | |
Series NN, 5.25% 7/1/21 (Nat'l. Pub. Fin. Guarantee Corp. Insured) | | 5,000,000 | | 5,666,800 |
Series QQ: | | | | |
5.5% 7/1/17 (XL Cap. Assurance, Inc. Insured) | | 1,700,000 | | 1,919,028 |
5.5% 7/1/18 (XL Cap. Assurance, Inc. Insured) | | 1,000,000 | | 1,137,280 |
Puerto Rico Sales Tax Fing. Corp. Sales Tax Rev.: | | | | |
Series 2007 A: | | | | |
0% 8/1/41 (Nat'l. Pub. Fin. Guarantee Corp. Insured) | | 2,100,000 | | 452,340 |
0% 8/1/47 (AMBAC Insured) | | 1,000,000 | | 148,480 |
Series 2009 A, 6.5% 8/1/44 | | 1,500,000 | | 1,766,010 |
Series 2010 C, 6% 8/1/39 | | 2,200,000 | | 2,534,532 |
Series 2011 C, 0% 8/1/38 | | 23,300,000 | | 6,195,936 |
| | 29,578,279 |
Municipal Bonds - continued |
| Principal Amount | | Value |
Virgin Islands - 0.4% |
Virgin Islands Pub. Fin. Auth.: | | | | |
Series 2009 A, 6.75% 10/1/37 | | $ 1,000,000 | | $ 1,186,980 |
Series 2009 A1, 5% 10/1/24 | | 500,000 | | 558,315 |
Series 2009 B, 5% 10/1/25 | | 1,200,000 | | 1,343,880 |
| | 3,089,175 |
TOTAL INVESTMENT PORTFOLIO - 95.1% (Cost $605,496,946) | 668,658,040 |
NET OTHER ASSETS (LIABILITIES) - 4.9% | | 34,274,029 |
NET ASSETS - 100% | $ 702,932,069 |
Legend |
(a) Security or a portion of the security purchased on a delayed delivery or when-issued basis. |
(b) Coupon rates for floating and adjustable rate securities reflect the rates in effect at period end. |
(c) Private activity obligations whose interest is subject to the federal alternative minimum tax for individuals. |
Other Information |
All investments are categorized as Level 2 under the Fair Value Hierarchy. The inputs or methodology used for valuing securities may not be an indication of the risk associated with investing in those securities. For more information on valuation inputs, please refer to the Investment Valuation section in the accompanying Notes to Financial Statements. |
The distribution of municipal securities by revenue source, as a percentage of total net assets, is as follows (Unaudited): |
General Obligations | 48.9% |
Transportation | 10.6% |
Special Tax | 8.1% |
Health Care | 8.0% |
Education | 7.7% |
Escrowed/Pre-Refunded | 5.6% |
Others* (Individually Less Than 5%) | 11.1% |
| 100.0% |
* Includes net other assets |
See accompanying notes which are an integral part of the financial statements.
Annual Report
Fidelity New Jersey Municipal Income Fund
Statement of Assets and Liabilities
| November 30, 2012 |
| | |
Assets | | |
Investment in securities, at value - See accompanying schedule: Unaffiliated issuers (cost $605,496,946) | | $ 668,658,040 |
Cash | | 32,562,718 |
Receivable for investments sold | | 512,496 |
Receivable for fund shares sold | | 278,311 |
Interest receivable | | 9,524,457 |
Prepaid expenses | | 1,978 |
Other receivables | | 10,331 |
Total assets | | 711,548,331 |
| | |
Liabilities | | |
Payable for investments purchased on a delayed delivery basis | $ 7,375,478 | |
Payable for fund shares redeemed | 254,851 | |
Distributions payable | 569,861 | |
Accrued management fee | 212,325 | |
Other affiliated payables | 162,554 | |
Other payables and accrued expenses | 41,193 | |
Total liabilities | | 8,616,262 |
| | |
Net Assets | | $ 702,932,069 |
Net Assets consist of: | | |
Paid in capital | | $ 638,555,224 |
Undistributed net investment income | | 281,163 |
Accumulated undistributed net realized gain (loss) on investments | | 934,588 |
Net unrealized appreciation (depreciation) on investments | | 63,161,094 |
Net Assets, for 56,276,032 shares outstanding | | $ 702,932,069 |
Net Asset Value, offering price and redemption price per share ($702,932,069 ÷ 56,276,032 shares) | | $ 12.49 |
See accompanying notes which are an integral part of the financial statements.
Annual Report
Statement of Operations
| Year ended November 30, 2012 |
| | |
Investment Income | | |
Interest | | $ 25,672,835 |
| | |
Expenses | | |
Management fee | $ 2,438,110 | |
Transfer agent fees | 475,444 | |
Accounting fees and expenses | 155,592 | |
Custodian fees and expenses | 7,728 | |
Independent trustees' compensation | 2,456 | |
Registration fees | 22,670 | |
Audit | 48,689 | |
Legal | 3,495 | |
Miscellaneous | 5,643 | |
Total expenses before reductions | 3,159,827 | |
Expense reductions | (31,455) | 3,128,372 |
Net investment income (loss) | | 22,544,463 |
Realized and Unrealized Gain (Loss) Net realized gain (loss) on: | | |
Investment securities: | | |
Unaffiliated issuers | | 1,859,123 |
Change in net unrealized appreciation (depreciation) on investment securities | | 39,339,548 |
Net gain (loss) | | 41,198,671 |
Net increase (decrease) in net assets resulting from operations | | $ 63,743,134 |
See accompanying notes which are an integral part of the financial statements.
Annual Report
Fidelity New Jersey Municipal Income Fund
Financial Statements - continued
Statement of Changes in Net Assets
| Year ended
November 30, 2012 | Year ended
November 30, 2011 |
Increase (Decrease) in Net Assets | | |
Operations | | |
Net investment income (loss) | $ 22,544,463 | $ 23,113,941 |
Net realized gain (loss) | 1,859,123 | 1,678,000 |
Change in net unrealized appreciation (depreciation) | 39,339,548 | 5,576,026 |
Net increase (decrease) in net assets resulting
from operations | 63,743,134 | 30,367,967 |
Distributions to shareholders from net investment income | (22,463,191) | (23,071,431) |
Share transactions
Proceeds from sales of shares | 110,814,259 | 97,424,849 |
Reinvestment of distributions | 15,452,624 | 15,927,072 |
Cost of shares redeemed | (72,991,867) | (178,970,772) |
Net increase (decrease) in net assets resulting from share transactions | 53,275,016 | (65,618,851) |
Redemption fees | 1,512 | 9,291 |
Total increase (decrease) in net assets | 94,556,471 | (58,313,024) |
| | |
Net Assets | | |
Beginning of period | 608,375,598 | 666,688,622 |
End of period (including undistributed net investment income of $281,163 and undistributed net investment income of $81,738, respectively) | $ 702,932,069 | $ 608,375,598 |
Other Information Shares | | |
Sold | 9,104,814 | 8,551,214 |
Issued in reinvestment of distributions | 1,263,319 | 1,391,611 |
Redeemed | (5,988,962) | (15,819,339) |
Net increase (decrease) | 4,379,171 | (5,876,514) |
See accompanying notes which are an integral part of the financial statements.
Annual Report
Financial Highlights
Years ended November 30, | 2012 | 2011 | 2010 | 2009 | 2008 |
Selected Per-Share Data | | | | | |
Net asset value, beginning of period | $ 11.72 | $ 11.54 | $ 11.48 | $ 10.71 | $ 11.49 |
Income from Investment Operations | | | | | |
Net investment income (loss)B | .412 | .445 | .435 | .431 | .440 |
Net realized and unrealized gain (loss) | .769 | .179 | .060 | .795 | (.771) |
Total from investment operations | 1.181 | .624 | .495 | 1.226 | (.331) |
Distributions from net investment income | (.411) | (.444) | (.435) | (.431) | (.439) |
Distributions from net realized gain | - | - | - | (.025) | (.010) |
Total distributions | (.411) | (.444) | (.435) | (.456) | (.449) |
Redemption fees added to paid in capital B, D | - | - | - | - | - |
Net asset value, end of period | $ 12.49 | $ 11.72 | $ 11.54 | $ 11.48 | $ 10.71 |
Total ReturnA | 10.21% | 5.57% | 4.34% | 11.64% | (2.98)% |
Ratios to Average Net Assets C | | | | | |
Expenses before reductions | .47% | .48% | .48% | .48% | .48% |
Expenses net of fee waivers, if any | .47% | .48% | .48% | .48% | .48% |
Expenses net of all reductions | .47% | .48% | .47% | .47% | .45% |
Net investment income (loss) | 3.38% | 3.88% | 3.74% | 3.85% | 3.90% |
Supplemental Data | | | | | |
Net assets, end of period (000 omitted) | $ 702,932 | $ 608,376 | $ 666,689 | $ 651,501 | $ 547,850 |
Portfolio turnover rate | 11% | 7% | 5% | 6% | 19% |
A Total returns would have been lower if certain expenses had not been reduced during the applicable periods shown.
B Calculated based on average shares outstanding during the period.
C Expense ratios reflect operating expenses of the Fund. Expenses before reductions do not reflect amounts reimbursed by the investment adviser or reductions from expense offset arrangements and do not represent the amount paid by the Fund during periods when reimbursements or reductions occur. Expenses net of fee waivers reflect expenses after reimbursement by the investment adviser but prior to reductions from expense offset arrangements. Expenses net of all reductions represent the net expenses paid by the Fund.
D Amount represents less than $.001 per share.
See accompanying notes which are an integral part of the financial statements.
Annual Report
Fidelity New Jersey Municipal Money Market Fund
Effective Maturity Diversification |
Days | % of fund's investments 11/30/12 | % of fund's investments 5/31/12 | % of fund's
investments
11/30/11 |
1 - 7 | 72.5 | 71.9 | 74.9 |
8 - 30 | 4.5 | 3.7 | 4.2 |
31 - 60 | 3.7 | 3.4 | 1.5 |
61 - 90 | 1.5 | 7.4 | 1.5 |
91 - 180 | 4.4 | 6.4 | 5.8 |
> 180 | 13.4 | 7.2 | 12.1 |
Effective maturity is determined in accordance with the requirements of Rule 2a-7 under the Investment Company Act of 1940. |
Weighted Average Maturity |
| 11/30/12 | 5/31/12 | 11/30/11 |
Fidelity New Jersey Municipal Money Market Fund | 49 Days | 39 Days | 47 Days |
New Jersey Tax-Free Money Market Funds Average * | 48 Days | 40 Days | 42 Days |
This is a weighted average of all the maturities of the securities held in a fund. Weighted Average Maturity (WAM) can be used as a measure of sensitivity to interest rate changes and market changes. Generally, the longer the maturity, the greater the sensitivity to such changes. WAM is based on the dollar-weighted average length of time until principal payments must be paid. Depending on the types of securities held in a fund, certain maturity shortening devices (e.g., demand features, interest rate resets, and call options) may be taken into account when calculating the WAM. |
Weighted Average Life |
| 11/30/12 | 5/31/12 | 11/30/11 |
Fidelity New Jersey Municipal Money Market Fund | 49 Days | 39 Days | 47 Days |
Weighted Average Life (WAL) is the weighted average of the life of the securities held in a fund or portfolio and can be used as a measure of sensitivity to changes in liquidity and/or credit risk. Generally, the higher the value, the greater the sensitivity. WAL is based on the dollar-weighted average length of time until principal payments must be paid, taking into account any call options exercised by the issuer and any permissible maturity shortening features other than interest rate resets. The difference between WAM and WAL is that WAM takes into account interest rate resets and WAL does not. WAL for money market funds is not the same as WAL of a mortgage- or asset-backed security. |
Asset Allocation (% of fund's net assets) |
As of November 30, 2012 | As of May 31, 2012 |
| Variable Rate Demand Notes (VRDNs) 60.1% | | | Variable Rate Demand Notes (VRDNs) 62.7% | |
 | Other Municipal
Debt 28.4% | |  | Other Municipal
Debt 26.6% | |
 | Investment
Companies 12.4% | | | Investment
Companies 9.2% | |
 | Net Other Assets†
(Liabilities) (0.9)% | | | Net Other Assets
(Liabilities) 1.5% | |

† Net Other Assets (Liabilities) are not included in the pie chart.
* Source: iMoneyNet, Inc.
Annual Report
Current and Historical Seven Day Yields |
| | | | | |
| 11/30/12 | 8/31/12 | 5/31/12 | 2/29/12 | 11/28/11 |
| | | | | |
New Jersey Municipal Money Market Fund | 0.01% | 0.01% | 0.01% | 0.01% | 0.01% |
Yield refers to the income paid by the fund over a given period. Yields for money market funds are usually for seven-day periods, as they are here, though they are expressed as annual percentage rates. Past performance is no guarantee of future results. Yield will vary and it's possible to lose money investing in the Fund. A portion of the fund's expenses was reimbursed and/or waived. Absent such reimbursements and/or waivers the yield for the period ending November 30, 2012, the most recent period shown in the table, would have been -0.29%.
Annual Report
Fidelity New Jersey Municipal Money Market Fund
Investments November 30, 2012
Showing Percentage of Net Assets
Variable Rate Demand Note - 60.1% |
| Principal Amount | | Value |
Alabama - 0.2% |
Decatur Indl. Dev. Board Exempt Facilities Rev. (Nucor Steel Decatur LLC Proj.) Series 2003 A, 0.45% 12/7/12, VRDN (b)(e) | $ 1,400,000 | | $ 1,400,000 |
Mobile Indl. Dev. Board Dock & Wharf Rev. (Holnam, Inc. Proj.) Series 1999 A, 0.2% 12/7/12, LOC Bayerische Landesbank Girozentrale, VRDN (b) | 2,500,000 | | 2,500,000 |
| | 3,900,000 |
Delaware - 0.1% |
Delaware Econ. Dev. Auth. Rev. (Delmarva Pwr. & Lt. Co. Proj.) Series 1988, 0.3% 12/3/12, VRDN (b)(e) | 2,550,000 | | 2,550,000 |
Delaware/New Jersey - 0.8% |
Delaware River & Bay Auth. Rev. Series 2008, 0.13% 12/7/12, LOC TD Banknorth, NA, VRDN (b) | 18,800,000 | | 18,800,000 |
Florida - 0.1% |
Miami-Dade County Indl. Dev. Auth. Rev. (Tarmac America Proj.) Series 2004, 0.22% 12/7/12, LOC Bank of America NA, VRDN (b)(e) | 3,200,000 | | 3,200,000 |
Iowa - 0.4% |
Iowa Fin. Auth. Solid Disp. Waste Rev. (MidAmerican Energy Proj.) Series 2008 A, 0.22% 12/7/12, VRDN (b)(e) | 8,000,000 | | 8,000,000 |
Kentucky - 0.3% |
Carroll County Envir. Facilities Rev. (Kentucky Utils. Co. Proj.) Series 2006 B, 0.18% 12/7/12, LOC Sumitomo Mitsui Banking Corp., VRDN (b)(e) | 5,000,000 | | 5,000,000 |
Carroll County Solid Waste Disp. Rev. (North American Stainless LP Proj.) Series 2000, 0.19% 12/7/12, LOC PNC Bank NA, VRDN (b)(e) | 2,070,000 | | 2,070,000 |
| | 7,070,000 |
Louisiana - 0.2% |
Louisiana Pub. Facilities Auth. Rev. (Air Products & Chemicals, Inc. Proj.) Series 2002, 0.18% 12/7/12, VRDN (b)(e) | 2,500,000 | | 2,500,000 |
Saint James Parish Gen. Oblig. (Nucor Steel Louisiana LLC Proj.) Series 2010 B1, 0.4% 12/7/12, VRDN (b) | 1,000,000 | | 1,000,000 |
| | 3,500,000 |
Nebraska - 0.1% |
Stanton County Indl. Dev. Rev. (Nucor Corp. Proj.) Series 1996, 0.45% 12/7/12, VRDN (b)(e) | 1,400,000 | | 1,400,000 |
New Jersey - 39.5% |
Bergen County Impt. Auth. Multi-family Hsg. Rev. (Kentshire Apts. Proj.) Series 2001, 0.16% 12/7/12, LOC Fannie Mae, VRDN (b)(e) | 21,000,000 | | 21,000,000 |
Variable Rate Demand Note - continued |
| Principal Amount | | Value |
New Jersey - continued |
Camden County Impt. Auth. Rev. (Parkview Redev. Hsg. Proj.) Series 2006, 0.14% 12/7/12, LOC Fannie Mae, VRDN (b)(e) | $ 900,000 | | $ 900,000 |
Essex County Impt. Auth. Multi-family Hsg. Rev. (Fern Sr. Hsg. Proj.) Series 2010, 0.16% 12/7/12, LOC Freddie Mac, VRDN (b) | 4,000,000 | | 4,000,000 |
Garden State Preservation Trust Open Space & Farmland Preservation Participating VRDN Series Putters 2865, 0.17% 12/7/12 (Liquidity Facility JPMorgan Chase Bank) (b)(f) | 4,185,000 | | 4,185,000 |
Hudson County Impt. Auth. Rev. (Essential Purp. Pooled Govt. Ln. Prog.) Series 1986, 0.15% 12/7/12, LOC Bank of New York, New York, VRDN (b) | 43,795,000 | | 43,795,000 |
Mercer County Impt. Auth. Rev. (The Atlantic Foundation Proj.) Series 2008, 0.18% 12/3/12, LOC Bank of America NA, VRDN (b) | 9,135,000 | | 9,135,000 |
New Jersey Bldg. Auth. State Bldg. Rev.: | | | |
Series 2003 A1, 0.14% 12/7/12, LOC Barclays Bank PLC, VRDN (b) | 23,935,000 | | 23,935,000 |
Series 2003 A2, 0.14% 12/7/12, LOC Barclays Bank PLC, VRDN (b) | 33,200,000 | | 33,200,000 |
Series 2003 A3, 0.14% 12/7/12, LOC Barclays Bank PLC, VRDN (b) | 8,500,000 | | 8,500,000 |
Series 2003 A4, 0.14% 12/7/12, LOC Barclays Bank PLC, VRDN (b) | 12,100,000 | | 12,100,000 |
New Jersey Econ. Dev. Auth. Econ. Dev. Rev. (Duke Farms Foundation Proj.) Series 2009 A, 0.18% 12/3/12, LOC Northern Trust Co., VRDN (b) | 2,000,000 | | 2,000,000 |
New Jersey Econ. Dev. Auth. Natural Gas Facilities Rev.: | | | |
(Natural Gas Co. Proj.): | | | |
Series 2011 B, 0.2% 12/3/12, VRDN (b)(e) | 16,600,000 | | 16,600,000 |
Series 2011 C, 0.2% 12/7/12, VRDN (b)(e) | 17,400,000 | | 17,400,000 |
(South Jersey Gas Co. Proj.) Series 2006-1, 0.19% 12/7/12, LOC JPMorgan Chase Bank, VRDN (b)(e) | 16,800,000 | | 16,800,000 |
New Jersey Econ. Dev. Auth. Rev. (Bayshore Health Ctr. Proj.) Series 1998 A, 0.18% 12/7/12, LOC JPMorgan Chase Bank, VRDN (b) | 7,050,000 | | 7,050,000 |
New Jersey Econ. Dev. Auth. School Facilities Construction Rev.: | | | |
(Cooper Health Sys. Proj.) Series 2008 A, 0.15% 12/7/12, LOC TD Banknorth, NA, VRDN (b) | 9,800,000 | | 9,800,000 |
(Morris Hall/St. Lawrence, Inc. Proj.) Series 2003, 0.19% 12/7/12, LOC Wells Fargo Bank NA, VRDN (b) | 17,615,000 | | 17,615,000 |
(The Hun School of Princeton Proj.) Series 2004, 0.15% 12/7/12, LOC PNC Bank NA, VRDN (b) | 9,310,000 | | 9,310,000 |
Variable Rate Demand Note - continued |
| Principal Amount | | Value |
New Jersey - continued |
New Jersey Econ. Dev. Auth. Spl. Facilities Rev. (Port Newark Container Term. LLC Proj.) Series 2003 A, 0.19% 12/7/12, LOC Citibank NA, VRDN (b)(e) | $ 62,500,000 | | $ 62,500,000 |
New Jersey Econ. Dev. Auth. Thermal Energy Facilities Rev. (Marina Energy LLC Proj.): | | | |
Series 2001 A, 0.18% 12/7/12, LOC JPMorgan Chase Bank, VRDN (b)(e) | 10,000,000 | | 10,000,000 |
Series 2006 A, 0.18% 12/7/12, LOC JPMorgan Chase Bank, VRDN (b)(e) | 5,465,000 | | 5,465,000 |
New Jersey Edl. Facilities Auth. Rev.: | | | |
(Seton Hall Univ. Proj.) Series 2008 D, 0.14% 12/7/12, LOC TD Banknorth, NA, VRDN (b) | 29,395,000 | | 29,395,000 |
Participating VRDN: | | | |
Series BC 11 117B, 0.16% 12/7/12 (Liquidity Facility Barclays Bank PLC) (b)(f) | 3,700,000 | | 3,700,000 |
Series Putters 3922, 0.17% 12/7/12 (Liquidity Facility JPMorgan Chase Bank) (b)(f) | 4,335,000 | | 4,335,000 |
Series ROC II R 14043, 0.18% 12/7/12 (Liquidity Facility Deutsche Postbank AG) (b)(f) | 23,400,000 | | 23,400,000 |
New Jersey Envir. Infrastructure Trust Participating VRDN Series Putters 4729, 0.18% 12/7/12 (Liquidity Facility Bank of America NA) (b)(f) | 2,015,000 | | 2,015,000 |
New Jersey Health Care Facilities Fing. Auth. Rev.: | | | |
(AHS Hosp. Corp. Proj.): | | | |
Series 2008 B, 0.18% 12/7/12, LOC Bank of America NA, VRDN (b) | 41,630,000 | | 41,630,000 |
Series 2008 C, 0.16% 12/7/12, LOC JPMorgan Chase Bank, VRDN (b) | 2,455,000 | | 2,455,000 |
(Barnabas Health Proj.) Series 2011 B, 0.16% 12/7/12, LOC JPMorgan Chase Bank, VRDN (b) | 14,700,000 | | 14,700,000 |
(East Orange Gen. Hosp. Proj.) Series 2006 A2, 0.15% 12/7/12, LOC PNC Bank NA, VRDN (b) | 7,355,000 | | 7,355,000 |
(Meridian Health Sys. Proj.) Series 2003 A, 0.16% 12/7/12, LOC JPMorgan Chase Bank, VRDN (b) | 21,615,000 | | 21,615,000 |
(Meridian Nursing and Rehab. at Red Bank, Inc. Proj.) Series 2004 A3, 0.15% 12/7/12, LOC Wells Fargo Bank NA, VRDN (b) | 9,800,000 | | 9,800,000 |
(South Jersey Hosp. Proj.) Series 2004 A4, 0.15% 12/7/12, LOC TD Banknorth, NA, VRDN (b) | 1,200,000 | | 1,200,000 |
(Underwood-Memorial Hosp. Proj.) Series 2008, 0.16% 12/7/12, LOC TD Banknorth, NA, VRDN (b) | 10,625,000 | | 10,625,000 |
(Virtua Health Proj.): | | | |
Series 2009 D, 0.14% 12/7/12, LOC TD Banknorth, NA, VRDN (b) | 13,710,000 | | 13,710,000 |
Variable Rate Demand Note - continued |
| Principal Amount | | Value |
New Jersey - continued |
New Jersey Health Care Facilities Fing. Auth. Rev.: - continued | | | |
(Virtua Health Proj.): | | | |
Series 2009 E, 0.14% 12/7/12, LOC TD Banknorth, NA, VRDN (b) | $ 6,000,000 | | $ 6,000,000 |
Series 2006 A6, 0.15% 12/7/12, LOC TD Banknorth, NA, VRDN (b) | 4,765,000 | | 4,765,000 |
New Jersey Hsg. & Mtg. Fin. Agcy. Multi-family Rev.: | | | |
Series 2008 B, 0.18% 12/7/12, LOC Bank of America NA, VRDN (b) | 37,740,000 | | 37,740,000 |
Series 2008 F, 0.2% 12/7/12, LOC Bank of America NA, VRDN (b)(e) | 88,425,000 | | 88,425,000 |
New Jersey Tpk. Auth. Tpk. Rev. Series 2009 A, 0.16% 12/7/12, LOC JPMorgan Chase Bank, VRDN (b) | 34,775,000 | | 34,775,000 |
New Jersey Trans. Trust Fund Auth.: | | | |
Series 2009 C, 0.14% 12/7/12, LOC Wells Fargo Bank NA, VRDN (b) | 48,360,000 | | 48,360,000 |
Series 2009 D, 0.16% 12/7/12, LOC Wells Fargo Bank NA, VRDN (b) | 94,050,000 | | 94,050,000 |
Rutgers State Univ. Rev.: | | | |
Participating VRDN: | | | |
Series Putters 3445, 0.17% 12/7/12 (Liquidity Facility JPMorgan Chase Bank) (b)(f) | 2,500,000 | | 2,500,000 |
Series RBC O 27, 0.16% 12/7/12 (Liquidity Facility Royal Bank of Canada) (b)(f) | 3,115,000 | | 3,115,000 |
Series 2009 G, 0.18% 12/3/12 (Liquidity Facility U.S. Bank NA, Cincinnati), VRDN (b) | 855,000 | | 855,000 |
Salem County Poll. Cont. Fin. Auth. Rev.: | | | |
(Atlantic City Elec. Co. Proj.) Series 1997 B, 0.19% 12/7/12, LOC JPMorgan Chase Bank, VRDN (b)(e) | 4,400,000 | | 4,400,000 |
(Pub. Svc. Elec. and Gas Co. Proj.) Series 2012 A, 0.42% 12/7/12, VRDN (b)(e) | 10,700,000 | | 10,700,000 |
South Jersey Trans. Auth. Trans. Sys. Rev. Series 2009 A3, 0.14% 12/7/12, LOC Wells Fargo Bank NA, VRDN (b) | 11,300,000 | | 11,300,000 |
Union County Utils. Resources Auth. Participating VRDN Series RBC O 7, 0.18% 12/7/12 (Liquidity Facility Royal Bank of Canada) (b)(e)(f) | 7,140,000 | | 7,140,000 |
Vineland Gen. Oblig. 0.18% 12/7/12, LOC Wells Fargo Bank NA, VRDN (b)(e) | 16,415,000 | | 16,415,000 |
| | 891,765,000 |
New Jersey/Pennsylvania - 4.0% |
Delaware River Port Auth. Pennsylvania & New Jersey Rev.: | | | |
Series 2008 A, 0.17% 12/7/12, LOC Bank of America NA, VRDN (b) | 48,880,000 | | 48,880,000 |
Variable Rate Demand Note - continued |
| Principal Amount | | Value |
New Jersey/Pennsylvania - continued |
Delaware River Port Auth. Pennsylvania & New Jersey Rev.: - continued | | | |
Series 2008 B, 0.15% 12/7/12, LOC TD Banknorth, NA, VRDN (b) | $ 23,710,000 | | $ 23,710,000 |
Series 2010 B, 0.17% 12/7/12, LOC Bank of America NA, VRDN (b) | 17,300,000 | | 17,300,000 |
| | 89,890,000 |
New York - 0.8% |
Dutchess County Indl. Dev. Agcy. Civic Facility Rev. (Lutheran Ctr. at Poughkeepsie, Inc. Proj.) 0.3% 12/7/12, LOC KeyBank NA, VRDN (b) | 3,200,000 | | 3,200,000 |
New York City Gen. Oblig. Series 2008 J8, 0.2% 12/3/12, LOC Landesbank Baden-Wuert, VRDN (b) | 2,900,000 | | 2,900,000 |
New York Hsg. Fin. Agcy. Rev. (101 West End Hsg. Proj.) Series 1998 A, 0.16% 12/7/12, LOC Fannie Mae, VRDN (b)(e) | 12,200,000 | | 12,200,000 |
| | 18,300,000 |
New York & New Jersey - 10.9% |
Port Auth. of New York & New Jersey: | | | |
Participating VRDN: | | | |
Series Austin 07 1017, 0.26% 12/7/12 (Liquidity Facility Bank of America NA) (b)(e)(f) | 35,980,000 | | 35,980,000 |
Series BA 08 1066, 0.29% 12/7/12 (Liquidity Facility Bank of America NA) (b)(e)(f) | 3,540,000 | | 3,540,000 |
Series BA 08 1067, 0.26% 12/7/12 (Liquidity Facility Bank of America NA) (b)(e)(f) | 5,815,000 | | 5,815,000 |
Series BA 08 1107, 0.26% 12/7/12 (Liquidity Facility Bank of America NA) (b)(e)(f) | 24,260,000 | | 24,260,000 |
Series BC 11 17B, 0.16% 12/7/12 (Liquidity Facility Barclays Bank PLC) (a)(b)(f) | 6,460,000 | | 6,460,000 |
Series EGL 06 107 Class A, 0.21% 12/7/12 (Liquidity Facility Citibank NA) (b)(e)(f) | 33,200,000 | | 33,200,000 |
Series MS 3266, 0.16% 12/7/12 (Liquidity Facility Cr. Suisse) (b)(f) | 5,050,000 | | 5,050,000 |
Series Putters 2945, 0.22% 12/7/12 (Liquidity Facility JPMorgan Chase Bank) (b)(e)(f) | 1,670,000 | | 1,670,000 |
Series Putters 3114, 0.22% 12/7/12 (Liquidity Facility JPMorgan Chase Bank) (b)(e)(f) | 7,190,000 | | 7,190,000 |
Series Putters 3162, 0.22% 12/7/12 (Liquidity Facility JPMorgan Chase Bank) (b)(e)(f) | 22,605,000 | | 22,605,000 |
Series Putters 3172, 0.22% 12/7/12 (Liquidity Facility JPMorgan Chase Bank) (b)(e)(f) | 13,505,000 | | 13,505,000 |
Variable Rate Demand Note - continued |
| Principal Amount | | Value |
New York & New Jersey - continued |
Port Auth. of New York & New Jersey: - continued | | | |
Participating VRDN: | | | |
Series Putters 4001 Z, 0.22% 12/7/12 (Liquidity Facility JPMorgan Chase Bank) (b)(e)(f) | $ 7,155,000 | | $ 7,155,000 |
Series Putters 4129, 0.22% 12/7/12 (Liquidity Facility JPMorgan Chase Bank) (b)(e)(f) | 9,250,000 | | 9,250,000 |
Series Putters 4217, 0.18% 12/3/12 (Liquidity Facility JPMorgan Chase Bank) (b)(e)(f) | 3,290,000 | | 3,290,000 |
Series RBC O 19, 0.18% 12/7/12 (Liquidity Facility Royal Bank of Canada) (b)(e)(f) | 3,470,000 | | 3,470,000 |
Series ROC II R 11439, 0.17% 12/7/12 (Liquidity Facility Citibank NA) (b)(f) | 2,690,000 | | 2,690,000 |
Series ROC II R 14023, 0.17% 12/7/12 (Liquidity Facility Citibank NA) (b)(f) | 2,000,000 | | 2,000,000 |
Series Solar 06 16, 0.16% 12/7/12 (Liquidity Facility U.S. Bank NA, Cincinnati) (b)(f) | 12,755,000 | | 12,755,000 |
Series 1991 1, 0.24% 12/31/12, VRDN (b)(e)(g) | 8,800,000 | | 8,800,000 |
Series 1991 3, 0.24% 12/31/12, VRDN (b)(e)(g) | 9,800,000 | | 9,800,000 |
Series 1992 1, 0.21% 12/31/12, VRDN (b)(g) | 6,800,000 | | 6,800,000 |
Series 1995 3, 0.24% 12/31/12, VRDN (b)(e)(g) | 9,400,000 | | 9,400,000 |
Series 1995 4, 0.24% 12/31/12, VRDN (b)(e)(g) | 10,500,000 | | 10,500,000 |
Series 1997 2, 0.21% 12/31/12, VRDN (b)(g) | 1,000,000 | | 1,000,000 |
| | 246,185,000 |
North Carolina - 0.0% |
Parson County Indl. Facilities and Poll. Cont. Fing. Auth. (CertainTeed Gypsum NC, Inc. Proj.) Series 2010, 0.3% 12/7/12, LOC Cr. Industriel et Commercial, VRDN (b) | 900,000 | | 900,000 |
Ohio - 0.3% |
Ohio Air Quality Dev. Auth. Rev. (Cincinnati Gas & Elec. Co. Proj.) Series A, 0.37% 12/7/12, VRDN (b) | 6,900,000 | | 6,900,000 |
Puerto Rico - 2.0% |
Puerto Rico Commonwealth Hwy. & Trans. Auth. Trans. Rev. Series 1998 A, 0.14% 12/7/12, LOC Bank of Nova Scotia New York Branch, VRDN (b) | 38,550,000 | | 38,550,000 |
Puerto Rico Commonwealth Pub. Impt. Gen. Oblig. Series 2003 C5-2, 0.17% 12/7/12, LOC Barclays Bank PLC NY Branch, VRDN (b) | 5,700,000 | | 5,700,000 |
| | 44,250,000 |
Variable Rate Demand Note - continued |
| Principal Amount | | Value |
Tennessee - 0.3% |
Henderson TN IDB Rev. (Arvin Sango, Inc. Proj.) Series 2012, 0.21% 12/7/12, LOC Bank of Tokyo-Mitsubishi UFJ Ltd., VRDN (b)(e) | $ 5,000,000 | | $ 5,000,000 |
Montgomery County Pub. Bldg. Auth. Pooled Fing. Rev. (Tennessee County Ln. Pool Prog.) Series 2002, 0.21% 12/3/12, LOC Bank of America NA, VRDN (b) | 1,900,000 | | 1,900,000 |
| | 6,900,000 |
Virginia - 0.1% |
Virginia Hsg. Dev. Auth. Commonwealth Mtg. Rev. Participating VRDN Series BA 1046, 0.26% 12/7/12 (Liquidity Facility Bank of America NA) (b)(e)(f) | 2,500,000 | | 2,500,000 |
TOTAL VARIABLE RATE DEMAND NOTE | 1,356,010,000 |
Other Municipal Debt - 28.4% |
| | | |
Kentucky - 0.2% |
Jefferson County Poll. Cont. Rev. Bonds (Louisville Gas & Elec. Co. Proj.) Series 2001 A, 0.38% tender 12/10/12, CP mode | 900,000 | | 900,000 |
Trimble County Poll. Cont. Rev. Bonds (Louisville Gas & Elec. Co. Proj.) Series 2001 B, 0.4% tender 12/6/12, CP mode (e) | 3,400,000 | | 3,400,000 |
| | 4,300,000 |
Massachusetts - 0.2% |
Massachusetts Indl. Fin. Agcy. Poll. Cont. Rev. Bonds (New England Pwr. Co. Proj.): | | | |
Series 1992, 0.45% tender 1/9/13, CP mode | 3,740,000 | | 3,740,000 |
Series 1993 B, 0.5% tender 12/14/12, CP mode | 1,650,000 | | 1,650,000 |
| | 5,390,000 |
New Hampshire - 0.3% |
New Hampshire Bus. Fin. Auth. Poll. Cont. Rev. Bonds (New England Pwr. Co. Proj.): | | | |
Series 1990 A, 0.5% tender 1/9/13, CP mode (e) | 2,500,000 | | 2,500,000 |
Series A1, 0.4% tender 12/6/12, CP mode (e) | 2,900,000 | | 2,900,000 |
| | 5,400,000 |
New Jersey - 23.4% |
Bergen County Gen. Oblig. BAN 0.75% 12/21/12 | 26,558,000 | | 26,566,362 |
Other Municipal Debt - continued |
| Principal Amount | | Value |
New Jersey - continued |
Burlington County Bridge Commission Rev. BAN (Solid Waste Proj.) Series 2012, 2% 10/8/13 | $ 8,400,000 | | $ 8,506,793 |
Burlington County Gen. Oblig. BAN Series 2012 C, 1.5% 9/6/13 | 32,200,000 | | 32,511,718 |
Cape May Gen. Oblig.: | | | |
BAN 1.5% 7/19/13 | 18,145,000 | | 18,270,201 |
Bonds Series 2012, 0.05% 8/15/13 | 1,900,000 | | 1,895,996 |
Carteret Gen. Oblig. BAN 1.5% 10/18/13 | 8,900,000 | | 8,955,886 |
Chatham Township Gen. Oblig. BAN 1.5% 7/19/13 | 6,478,000 | | 6,521,470 |
Cherry Hill Township Gen. Oblig. Bonds Series 2012, 2% 5/1/13 | 2,540,000 | | 2,558,535 |
Cliffside Park Gen. Oblig. BAN 1.5% 7/24/13 | 8,000,000 | | 8,056,915 |
Cranbury Township Gen. Oblig. BAN 2% 1/11/13 | 5,666,000 | | 5,674,191 |
Denville Township BAN 1.5% 10/17/13 | 4,066,730 | | 4,108,302 |
East Greenwich Township BAN Series A, 2% 2/7/13 | 9,097,134 | | 9,119,734 |
Englewood Gen. Oblig. BAN Series 2012 A, 1.5% 5/3/13 | 22,171,753 | | 22,258,610 |
Florham Park Gen. Oblig. BAN: | | | |
1.25% 10/24/13 | 1,916,000 | | 1,928,806 |
2% 1/24/13 | 7,714,000 | | 7,731,906 |
Franklin Lakes Gen. Oblig. BAN 1.5% 10/25/13 | 3,129,575 | | 3,162,344 |
Hopatcong Borough Gen. Oblig. BAN 1.5% 8/2/13 | 11,092,000 | | 11,174,676 |
Hopewell Township Gen. Oblig. BAN: | | | |
1.25% 6/7/13 | 3,925,666 | | 3,945,990 |
1.5% 1/18/13 | 9,350,000 | | 9,365,038 |
Lacey Township Gen. Oblig. BAN Series 2012 B, 1.25% 7/18/13 | 5,400,000 | | 5,420,180 |
Long Beach Township Gen. Oblig. BAN Series 2012 A, 2% 3/28/13 | 6,589,450 | | 6,620,966 |
Madison Borough Gen. Oblig. BAN 2% 1/18/13 | 8,193,000 | | 8,211,529 |
Mahwah Township Gen. Oblig. BAN 1.5% 8/9/13 | 5,400,000 | | 5,446,641 |
Mercer County Gen. Oblig. BAN Series 2012 A, 1.5% 12/5/13 | 31,700,000 | | 32,100,371 |
Morris Township Gen. Oblig. BAN 1.5% 11/15/13 | 15,400,000 | | 15,580,528 |
New Jersey Bldg. Auth. State Bldg. Rev. Bonds: | | | |
Series 2002 B, 5.25% 12/15/12 | 2,800,000 | | 2,805,299 |
Series 2007 A, 5% 6/15/13 | 1,085,000 | | 1,112,078 |
New Jersey Edl. Facilities Auth. Rev. Bonds Series 2012 B, 2% 7/1/13 | 2,140,000 | | 2,157,701 |
New Jersey Gen. Oblig. Bonds: | | | |
Series D, 6% 2/15/13 | 4,665,000 | | 4,720,892 |
Series S, 5% 2/15/13 | 6,200,000 | | 6,261,229 |
Other Municipal Debt - continued |
| Principal Amount | | Value |
New Jersey - continued |
New Jersey Health Care Facilities Fing. Auth. Rev. Bonds Series 2012, 3% 7/1/13 | $ 775,000 | | $ 785,058 |
New Jersey Tobacco Settlement Fing. Corp. Bonds Series 2003: | | | |
6.375% 6/1/13 (Pre-Refunded to 6/1/13 @ 100) | 2,140,000 | | 2,205,999 |
6.75% 6/1/13 (Pre-Refunded to 6/1/13 @ 100) | 19,330,000 | | 19,960,356 |
7% 6/1/13 (Pre-Refunded to 6/1/13 @ 100) | 5,050,000 | | 5,221,263 |
New Jersey Trans. Trust Fund Auth. Bonds: | | | |
Series 2001 C, 5.75% 12/15/12 | 9,350,000 | | 9,369,679 |
Series 2005 A, 5.25% 12/15/12 | 3,375,000 | | 3,381,499 |
Series 2011 B, 4% 6/15/13 | 4,300,000 | | 4,384,547 |
Series B, 5.25% 12/15/12 | 10,740,000 | | 10,760,527 |
North Brunswick Township Gen. Oblig. BAN Series 2012 A, 1.5% 8/7/13 | 22,600,000 | | 22,799,896 |
Ocean City Gen. Oblig. BAN: | | | |
1.5% 6/21/13 | 9,350,000 | | 9,403,039 |
2% 3/8/13 | 9,750,000 | | 9,787,364 |
Ocean Township Gen. Oblig. BAN Series 2011, 1.5% 12/19/12 | 6,227,835 | | 6,230,820 |
Passaic County Gen. Oblig.: | | | |
BAN Series 2011 C, 2% 12/28/12 | 20,181,000 | | 20,205,468 |
Bonds: | | | |
Series 2011, 5% 5/1/13 | 2,450,000 | | 2,496,661 |
Series 2012 A, 2% 4/1/13 | 1,025,000 | | 1,030,076 |
Princeton Township Gen. Oblig. BAN 1.5% 11/1/13 | 4,000,000 | | 4,046,111 |
Randolph Township Gen. Oblig. BAN 2% 3/27/13 | 7,980,000 | | 8,021,161 |
Ridgewood Gen. Oblig. BAN 1.5% 6/21/13 | 12,573,300 | | 12,644,610 |
Robbinsville Township Gen. Oblig. BAN Series 2012 A, 1.5% 8/6/13 | 14,445,351 | | 14,560,698 |
Rutgers State Univ. Rev. Series 2012 B, 0.17% 12/6/12, CP | 20,700,000 | | 20,700,000 |
Somerset County Gen. Oblig. Bonds Series 2012 B, 2% 7/15/13 | 1,820,000 | | 1,838,987 |
South River Borough Gen. Oblig. BAN Series 2011 A, 1.5% 12/19/12 | 11,245,000 | | 11,248,560 |
Sussex County Gen. Oblig. BAN: | | | |
1.25% 6/28/13 | 13,600,000 | | 13,680,743 |
1.25% 9/17/13 | 4,250,000 | | 4,283,657 |
Township of Lawrence BAN 1.5% 7/26/13 | 4,752,000 | | 4,781,436 |
Union County Gen. Oblig. Bonds Series 2012 B, 2% 3/1/13 | 4,060,000 | | 4,077,007 |
Upper Saddle River Gen. Oblig. BAN 2% 2/22/13 | 3,870,000 | | 3,883,713 |
Other Municipal Debt - continued |
| Principal Amount | | Value |
New Jersey - continued |
Verona Township Gen. Oblig. BAN 1.5% 8/9/13 | $ 6,200,000 | | $ 6,247,965 |
West Caldwell Township BAN 1.5% 7/11/13 | 7,300,000 | | 7,342,385 |
| | 528,130,172 |
New York & New Jersey - 4.2% |
Port Auth. of New York & New Jersey: | | | |
Bonds: | | | |
131st Series, 5% 12/15/12 (e) | 1,000,000 | | 1,001,724 |
139th Series, 5% 10/1/13 (e) | 1,000,000 | | 1,039,340 |
Series 2012 A: | | | |
0.19% 2/6/13, CP (e) | 2,620,000 | | 2,620,000 |
0.2% 2/20/13, CP (e) | 7,475,000 | | 7,475,000 |
0.21% 3/5/13, CP (e) | 21,055,000 | | 21,055,000 |
0.21% 3/20/13, CP (e) | 8,120,000 | | 8,120,000 |
0.21% 3/26/13, CP (e) | 7,615,000 | | 7,615,000 |
Series 2012 B: | | | |
0.19% 3/6/13, CP | 5,503,500 | | 5,503,500 |
0.2% 3/13/13, CP | 1,405,000 | | 1,405,000 |
Series A: | | | |
0.18% 12/3/12, CP (e) | 16,145,000 | | 16,145,000 |
0.18% 12/6/12, CP (e) | 8,885,000 | | 8,885,000 |
Series B: | | | |
0.18% 12/5/12, CP | 5,800,000 | | 5,800,000 |
0.18% 12/11/12, CP | 7,510,000 | | 7,510,000 |
| | 94,174,564 |
South Carolina - 0.1% |
York County Poll. Cont. Rev. Bonds (Duke Energy Corp. Proj.) 0.4% tender 12/3/12, CP mode | 2,000,000 | | 2,000,000 |
TOTAL OTHER MUNICIPAL DEBT | 639,394,736 |
Investment Company - 12.4% |
| Shares | | Value |
Fidelity Municipal Cash Central Fund, 0.17% (c)(d) | 279,903,000 | | $ 279,903,000 |
TOTAL INVESTMENT PORTFOLIO - 100.9% (Cost $2,275,307,736) | 2,275,307,736 |
NET OTHER ASSETS (LIABILITIES) - (0.9)% | | (20,385,069) |
NET ASSETS - 100% | $ 2,254,922,667 |
Security Type Abbreviations |
BAN | - | BOND ANTICIPATION NOTE |
CP | - | COMMERCIAL PAPER |
VRDN | - | VARIABLE RATE DEMAND NOTE (A debt instrument that is payable upon demand, either daily, weekly or monthly) |
Legend |
(a) Security exempt from registration under Rule 144A of the Securities Act of 1933. These securities may be resold in transactions exempt from registration, normally to qualified institutional buyers. At the end of the period, the value of these securities amounted to $6,460,000 or 0.3% of net assets. |
(b) Coupon rates for floating and adjustable rate securities reflect the rates in effect at period end. |
(c) Information in this report regarding holdings by state and security types does not reflect the holdings of the Fidelity Municipal Cash Central Fund. |
(d) Affiliated fund that is available only to investment companies and other accounts managed by Fidelity Investments. The rate quoted is the annualized seven-day yield of the fund at period end. A complete unaudited listing of the fund's holdings as of its most recent quarter end is available upon request. In addition, each Fidelity Central Fund's financial statements, which are not covered by the Fund's Report of Independent Registered Public Accounting Firm, are available on the SEC's website or upon request. |
(e) Private activity obligations whose interest is subject to the federal alternative minimum tax for individuals. |
(f) Provides evidence of ownership in one or more underlying municipal bonds. |
(g) Restricted securities - Investment in securities not registered under the Securities Act of 1933 (excluding 144A issues). At the end of the period, the value of restricted securities (excluding 144A issues) amounted to $46,300,000 or 2.1% of net assets. |
Additional information on each restricted holding is as follows: |
Security | Acquisition Date | Cost |
Port Auth. of New York & New Jersey Series: | | |
1991 1, 0.24% 12/31/12, VRDN | 6/18/91 | $ 8,800,000 |
1991 3, 0.24% 12/31/12, VRDN | 12/3/03 | $ 9,800,000 |
1992 1, 0.21% 12/31/12, VRDN | 2/14/92 | $ 6,800,000 |
1995 3, 0.24% 12/31/12, VRDN | 9/15/95 | $ 9,400,000 |
1995 4, 0.24% 12/31/12, VRDN | 8/9/02 | $ 10,500,000 |
1997 2, 0.21% 12/31/12, VRDN | 10/26/12 | $ 1,000,000 |
Affiliated Central Funds |
Information regarding fiscal year to date income earned by the Fund from investments in Fidelity Central Funds is as follows: |
Fund | Income earned |
Fidelity Municipal Cash Central Fund | $ 388,203 |
Other Information |
The date shown for securities represents the date when principal payments must be paid, taking into account any call options exercised by the issuer and any permissible maturity shortening features other than interest rate resets. |
All investments are categorized as Level 2 under the Fair Value Hierarchy. The inputs or methodology used for valuing securities may not be an indication of the risk associated with investing in those securities. For more information on valuation inputs, please refer to the Security Valuation section in the accompanying Notes to Financial Statements. |
See accompanying notes which are an integral part of the financial statements.
Annual Report
Fidelity New Jersey Municipal Money Market Fund
Statement of Assets and Liabilities
| November 30, 2012 |
| | |
Assets | | |
Investment in securities, at value - See accompanying schedule: Unaffiliated issuers (cost $1,995,404,736) | $ 1,995,404,736 | |
Fidelity Central Funds (cost $279,903,000) | 279,903,000 | |
Total Investments (cost $2,275,307,736) | | $ 2,275,307,736 |
Cash | | 35,781 |
Receivable for fund shares sold | | 24,738,282 |
Interest receivable | | 5,167,698 |
Distributions receivable from Fidelity Central Funds | | 40,937 |
Prepaid expenses | | 5,912 |
Other receivables | | 176 |
Total assets | | 2,305,296,522 |
| | |
Liabilities | | |
Payable for investments purchased | $ 32,600,380 | |
Payable for fund shares redeemed | 16,802,371 | |
Distributions payable | 550 | |
Accrued management fee | 399,454 | |
Other affiliated payables | 533,074 | |
Other payables and accrued expenses | 38,026 | |
Total liabilities | | 50,373,855 |
| | |
Net Assets | | $ 2,254,922,667 |
Net Assets consist of: | | |
Paid in capital | | $ 2,254,946,586 |
Accumulated undistributed net realized gain (loss) on investments | | (23,919) |
Net Assets, for 2,253,293,323 shares outstanding | | $ 2,254,922,667 |
Net Asset Value, offering price and redemption price per share ($2,254,922,667 ÷ 2,253,293,323 shares) | | $ 1.00 |
See accompanying notes which are an integral part of the financial statements.
Annual Report
Statement of Operations
| Year ended November 30, 2012 |
| | |
Investment Income | | |
Interest | | $ 4,613,544 |
Income from Fidelity Central Funds | | 388,203 |
Total income | | 5,001,747 |
| | |
Expenses | | |
Management fee | $ 8,045,355 | |
Transfer agent fees | 2,818,273 | |
Accounting fees and expenses | 210,625 | |
Custodian fees and expenses | 27,120 | |
Independent trustees' compensation | 7,987 | |
Registration fees | 34,893 | |
Audit | 40,393 | |
Legal | 12,189 | |
Miscellaneous | 13,731 | |
Total expenses before reductions | 11,210,566 | |
Expense reductions | (6,430,386) | 4,780,180 |
Net investment income (loss) | | 221,567 |
Realized and Unrealized Gain (Loss) Investment securities: | | |
Unaffiliated issuers | 41,854 | |
Capital gain distributions from Fidelity Central Funds | 2,409 | |
Total net realized gain (loss) | | 44,263 |
Net increase in net assets resulting from operations | | $ 265,830 |
See accompanying notes which are an integral part of the financial statements.
Annual Report
Fidelity New Jersey Municipal Money Market Fund
Financial Statements - continued
Statement of Changes in Net Assets
| Year ended
November 30, 2012 | Year ended
November 30, 2011 |
Increase (Decrease) in Net Assets | | |
Operations | | |
Net investment income (loss) | $ 221,567 | $ 211,699 |
Net realized gain (loss) | 44,263 | (39) |
Net increase in net assets resulting
from operations | 265,830 | 211,660 |
Distributions to shareholders from net investment income | (220,458) | (211,542) |
Share transactions at net asset value of $1.00 per share
Proceeds from sales of shares | 5,431,216,836 | 5,992,337,156 |
Reinvestment of distributions | 215,933 | 209,423 |
Cost of shares redeemed | (5,313,856,569) | (5,931,191,190) |
Net increase (decrease) in net assets and shares resulting from share transactions | 117,576,200 | 61,355,389 |
Total increase (decrease) in net assets | 117,621,572 | 61,355,507 |
| | |
Net Assets | | |
Beginning of period | 2,137,301,095 | 2,075,945,588 |
End of period | $ 2,254,922,667 | $ 2,137,301,095 |
See accompanying notes which are an integral part of the financial statements.
Annual Report
Financial Highlights
Years ended November 30, | 2012 | 2011 | 2010 | 2009 | 2008 |
Selected Per-Share Data | | | | | |
Net asset value, beginning of period | $ 1.00 | $ 1.00 | $ 1.00 | $ 1.00 | $ 1.00 |
Income from Investment Operations | | | | | |
Net investment income (loss) | - D | - D | - D | .001 | .019 |
Net realized and unrealized gain (loss) D | - | - | - | - | - |
Total from investment operations | - D | - D | - D | .001 | .019 |
Distributions from net investment income | - D | - D | - D | (.001) | (.019) |
Distributions from net realized gain (loss) | - | - | - | - | - D |
Total distributions | - D | - D | - D | (.001) | (.019) |
Net asset value, end of period | $ 1.00 | $ 1.00 | $ 1.00 | $ 1.00 | $ 1.00 |
Total Return A | .01% | .01% | .01% | .11% | 1.90% |
Ratios to Average Net Assets B,C | | | | |
Expenses before reductions | .51% | .51% | .51% | .55% | .52% |
Expenses net of fee waivers, if any | .22% | .25% | .30% | .51% | .52% |
Expenses net of all reductions | .22% | .25% | .30% | .51% | .44% |
Net investment income (loss) | .01% | .01% | .01% | .11% | 1.84% |
Supplemental Data | | | | | |
Net assets, end of period (000 omitted) | $ 2,254,923 | $ 2,137,301 | $ 2,075,946 | $ 2,241,592 | $ 2,598,967 |
A Total returns would have been lower if certain expenses had not been reduced during the applicable periods shown.
B Fees and expenses of any underlying Fidelity Central Funds are not included in the Fund's expense ratio. The Fund indirectly bears its proportionate share of the expenses of any underlying Fidelity Central Funds.
C Expense ratios reflect operating expenses of the Fund. Expenses before reductions do not reflect amounts reimbursed or waived or reductions from expense offset arrangements and do not represent the amount paid by the Fund during periods when reimbursements, waivers or reductions occur. Expenses net of fee waivers reflect expenses after reimbursement and waivers but prior to reductions from expense offset arrangements. Expenses net of all reductions represent the net expenses paid by the Fund.
D Amount represents less than $.001 per share.
See accompanying notes which are an integral part of the financial statements.
Annual Report
Notes to Financial Statements
For the period ended November 30, 2012
1. Organization.
Fidelity New Jersey Municipal Income Fund (the Income Fund) is a fund of Fidelity Court Street Trust. Fidelity New Jersey Municipal Money Market Fund (the Money Market Fund) is a fund of Fidelity Court Street Trust II. Each Trust is registered under the Investment Company Act of 1940, as amended (the 1940 Act), as an open-end management investment company. Fidelity Court Street Trust and Fidelity Court Street Trust II (the Trusts) are organized as a Massachusetts business trust and a Delaware statutory trust, respectively. The Income Fund is a non-diversified fund. Each Fund is authorized to issue an unlimited number of shares. Each Fund may be affected by economic and political developments in the state of New Jersey.
2. Investments in Fidelity Central Funds.
The Funds may invest in Fidelity Central Funds, which are open-end investment companies available only to other investment companies and accounts managed by Fidelity Management & Research Company (FMR) and its affiliates. The Funds' Schedules of Investments list each of the Fidelity Central Funds held as of period end, if any, as an investment of each Fund, but does not include the underlying holdings of each Fidelity Central Fund. As an Investing Fund, each Fund indirectly bears its proportionate share of the expenses of the underlying Fidelity Central Funds.
The Money Market Central Funds seek preservation of capital and current income and are managed by Fidelity Investments Money Management, Inc. (FIMM), an affiliate of FMR.
A complete unaudited list of holdings for each Fidelity Central Fund is available upon request or at the Securities and Exchange Commission (the SEC) web site at www.sec.gov. In addition, the financial statements of the Fidelity Central Funds, which are not covered by the Funds' Report of Independent Registered Public Accounting Firm, are available on the SEC web site or upon request.
3. Significant Accounting Policies.
The financial statements have been prepared in conformity with accounting principles generally accepted in the United States of America (GAAP), which require management to make certain estimates and assumptions at the date of the financial statements. Actual results could differ from those estimates. Subsequent events, if any, through the date that the financial statements were issued have been evaluated in the preparation of the financial statements. The following summarizes the significant accounting policies of the Funds:
Annual Report
Notes to Financial Statements - continued
3. Significant Accounting Policies - continued
Investment Valuation. Investments are valued as of 4:00 p.m. Eastern time on the last calendar day of the period. In accordance with valuation policies and procedures approved by the Board of Trustees (the Board), the Income Fund attempts to obtain prices from one or more third party pricing vendors or brokers to value its investments. When current market prices, quotations or rates are not readily available or reliable, securities will be fair valued in good faith by the FMR Fair Value Committee (the Committee), in accordance with procedures adopted by the Board. Factors used in determining fair value vary by security type and may include market or security specific events, changes in interest rates and credit quality. The frequency with which these procedures are used cannot be predicted and they may be utilized to a significant extent. The Committee oversees the Income Fund's valuation policies and procedures and is responsible for approving and reporting to the Board all fair value determinations.
Each Fund categorizes the inputs to valuation techniques used to value their investments into a disclosure hierarchy consisting of three levels as shown below:
Level 1 - quoted prices in active markets for identical investments
Level 2 - other significant observable inputs (including quoted prices for similar investments, interest rates, prepayment speeds, etc.)
Level 3 - unobservable inputs (including the Fund's own assumptions based on the best information available)
Valuation techniques used to value each Fund's investments by major category are as follows:
For the Income Fund, debt securities, including restricted securities, are valued based on evaluated prices received from third party pricing vendors or from brokers who make markets in such securities. For municipal securities, pricing vendors utilize matrix pricing which considers yield or price of bonds of comparable quality, coupon, maturity and type as well as broker-supplied prices and are generally categorized as Level 2 in the hierarchy. When independent prices are unavailable or unreliable, debt securities may be valued utilizing pricing methodologies which consider similar factors that would be used by third party pricing vendors. These are generally categorized as Level 2 in the hierarchy but may be Level 3 depending on the circumstances.
For the Money Market Fund, as permitted by compliance with certain conditions under Rule 2a-7 of the 1940 Act, securities are valued at amortized cost, which approximates fair value. The amortized cost of an instrument is determined by valuing it at its original cost and thereafter amortizing any discount or premium from its face value at a constant rate until maturity. Securities held by a money market fund are generally high quality and liquid; however, they are reflected as Level 2 because the inputs used to determine fair value are not quoted prices in an active market.
Annual Report
3. Significant Accounting Policies - continued
Investment Valuation - continued
For the Income Fund, changes in valuation techniques may result in transfers in or out of an assigned level within the disclosure hierarchy.
Investment Transactions and Income. For financial reporting purposes, the Funds' investment holdings and net asset value (NAV) include trades executed through the end of the last business day of the period. The NAV per share for processing shareholder transactions is calculated as of the close of business of the New York Stock Exchange (NYSE), normally 4:00 p.m. Eastern time and includes trades executed through the end of the prior business day for the Income Fund and trades executed through the end of the current business day for the Money Market Fund. Gains and losses on securities sold are determined on the basis of identified cost. Interest income and distributions from the Fidelity Central Funds are accrued as earned. Interest income includes coupon interest and amortization of premium and accretion of discount on debt securities.
Expenses. Expenses directly attributable to a fund are charged to that fund. Expenses attributable to more than one fund are allocated among the respective funds on the basis of relative net assets or other appropriate methods. Expense estimates are accrued in the period to which they relate and adjustments are made when actual amounts are known.
Income Tax Information and Distributions to Shareholders. Each year, each Fund intends to qualify as a regulated investment company under Subchapter M of the Internal Revenue Code, including distributing substantially all of its taxable income and realized gains. As a result, no provision for income taxes is required. As of November 30, 2012, each Fund did not have any unrecognized tax benefits in the financial statements; nor is each Fund aware of any tax positions for which it is reasonably possible that the total amounts of unrecognized tax benefits will significantly change in the next twelve months. Each Fund files a U.S. federal tax return, in addition to state and local tax returns as required. A fund's federal income tax returns are subject to examination by the Internal Revenue Service (IRS) for a period of three fiscal years after they are filed. State and local tax returns may be subject to examination for an additional fiscal year depending on the jurisdiction.
Dividends are declared and recorded daily and paid monthly from net investment income. Distributions from realized gains, if any, are declared and recorded on the ex-dividend date. Income and capital gain distributions are determined in accordance with income tax regulations, which may differ from GAAP. In addition, the Income Fund claimed a portion of the payment made to redeeming shareholders as a distribution for income tax purposes.
Capital accounts within the financial statements are adjusted for permanent book-tax differences. These adjustments have no impact on net assets or the results of operations. Temporary book-tax differences will reverse in a subsequent period.
Annual Report
Notes to Financial Statements - continued
3. Significant Accounting Policies - continued
Income Tax Information and Distributions to Shareholders - continued
Book-tax differences are primarily due to market discount, deferred trustees compensation and capital loss carryforwards.
The Funds purchase municipal securities whose interest, in the opinion of the issuer, is free from federal income tax. There is no assurance that the IRS will agree with this opinion. In the event the IRS determines that the issuer does not comply with relevant tax requirements, interest payments from a security could become federally taxable, possibly retroactively to the date the security was issued.
The federal tax cost of investment securities and unrealized appreciation (depreciation) as of period end were as follows for each Fund:
| Tax cost | Gross
unrealized
appreciation | Gross
unrealized
depreciation | Net unrealized
appreciation
(depreciation) on
securities and
other investments |
Fidelity New Jersey Municipal Income Fund | $ 605,493,201 | $ 63,225,179 | $ (60,340) | $ 63,164,839 |
Fidelity New Jersey Municipal Money Market Fund | 2,275,307,736 | - | - | - |
The tax-based components of distributable earnings as of period end were as follows for each Fund:
| Undistributed tax-exempt income | Undistributed ordinary
income | Undistributed long-term capital gain | Capital loss carryforward | Net unrealized appreciation
(depreciation) |
Fidelity New Jersey Municipal Income Fund | $ - | $ 313,479 | $ 1,045,429 | $ - | $ 63,164,839 |
Fidelity New Jersey Municipal Money Market Fund | 35,509 | - | - | (59,038) | - |
Capital loss carryforwards are only available to offset future capital gains of the Funds to the extent provided by regulations and may be limited. Under the Regulated Investment Company Modernization Act of 2010 (the Act), the Funds are permitted to carry forward capital losses incurred in taxable years beginning after December 22, 2010 for an unlimited period and such capital losses are required to be used prior to any losses that expire. Capital loss carryforwards were as follows:
Annual Report
3. Significant Accounting Policies - continued
Income Tax Information and Distributions to Shareholders - continued
| Fiscal year of expiration | |
| 2017 | 2019 | Total capital loss
carryfoward |
| | | |
Fidelity New Jersey Municipal Money Market Fund | (58,999) | (39) | (59,038) |
The tax character of distributions paid was as follows:
November 30, 2012 | | | | |
| Tax-Exempt
Income | Ordinary
Income | Long-term
Capital Gains | Total |
Fidelity New Jersey Municipal Income Fund | $ 22,463,191 | $ - | $ - | $ 22,463,191 |
Fidelity New Jersey Municipal Money Market Fund | 220,458 | - | - | 220,458 |
November 30, 2011 | | | | |
| Tax-Exempt
Income | Ordinary
Income | Long-term
Capital Gains | Total |
Fidelity New Jersey Municipal Income Fund | $ 23,071,431 | $ - | $ - | $ 23,071,431 |
Fidelity New Jersey Municipal Money Market Fund | 211,542 | - | - | 211,542 |
Short-Term Trading (Redemption) Fees. Shares held by investors in the Income Fund less than 30 days are subject to a redemption fee equal to ..50% of the net asset value of shares redeemed. All redemption fees, which reduce the proceeds of the shareholder redemption, are retained by the Fund and accounted for as an addition to paid in capital.
Delayed Delivery Transactions and When-Issued Securities. During the period, the Funds transacted in securities on a delayed delivery or when-issued basis. Payment and delivery may take place after the customary settlement period for that security. The price of the underlying securities and the date when the securities will be delivered and paid for are fixed at the time the transaction is negotiated. The securities purchased on a
Annual Report
Notes to Financial Statements - continued
3. Significant Accounting Policies - continued
Delayed Delivery Transactions and When-Issued Securities - continued
delayed delivery or when-issued basis are identified as such in each applicable Fund's Schedule of Investments. The Funds may receive compensation for interest forgone in the purchase of a delayed delivery or when-issued security. With respect to purchase commitments, each applicable Fund identifies securities as segregated in its records with a value at least equal to the amount of the commitment. Losses may arise due to changes in the value of the underlying securities or if the counterparty does not perform under the contract's terms, or if the issuer does not issue the securities due to political, economic, or other factors.
Restricted Securities. The Funds may invest in securities that are subject to legal or contractual restrictions on resale. These securities generally may be resold in transactions exempt from registration or to the public if the securities are registered. Disposal of these securities may involve time-consuming negotiations and expense, and prompt sale at an acceptable price may be difficult. Information regarding restricted securities is included at the end of each applicable Fund's Schedule of Investments.
4. Purchases and Sales of Investments.
Purchases and sales of securities, other than short-term securities, for the Income Fund aggregated $113,575,070 and $71,208,432, respectively.
5. Fees and Other Transactions with Affiliates.
Management Fee. FMR and its affiliates provide the Funds with investment management related services for which the Funds pay a monthly management fee. The management fee is the sum of an individual fund fee rate and an annualized group fee rate. The individual fund fee rate is applied to each Fund's average net assets. The group fee rate is based upon the average net assets of all the mutual funds advised by FMR. The group fee rate decreases as assets under management increase and increases as assets under management decrease. For the period, each Fund's annual management fee rate expressed as a percentage of each Fund's average net assets was as follows:
| Individual Rate | Group Rate | Total |
Fidelity New Jersey Municipal Income Fund | .25% | .12% | .37% |
Fidelity New Jersey Municipal Money Market Fund | .25% | .12% | .37% |
Transfer Agent and Accounting Fees. Citibank, N.A. (Citibank) is the custodian, transfer agent and servicing agent for the Funds. Citibank has entered into a sub-arrangement with Fidelity Investments Institutional Operations Company, Inc. (FIIOC), an affiliate of FMR, under which FIIOC performs the activities associated with the Funds'
Annual Report
5. Fees and Other Transactions with Affiliates - continued
Transfer Agent and Accounting Fees - continued
transfer agency, dividend disbursing and shareholder servicing functions. The Funds pay Citibank account fees and asset-based fees that vary according to account size and type of account. FIIOC pays for typesetting, printing and mailing of shareholder reports, except proxy statements. For the period, the transfer agent fees were equivalent to the following annual rates expressed as a percentage of average net assets:
Fidelity New Jersey Municipal Income Fund | .07% |
Fidelity New Jersey Municipal Money Market Fund | .13% |
During the period, FMR or its affiliates waived a portion of these fees for the Money Market Fund.
Citibank also has a sub-arrangement with Fidelity Service Company, Inc. (FSC), an affiliate of FMR, under which FSC maintains the Fund's accounting records. The fee is paid to Citibank and is based on the level of average net assets for each month.
6. Committed Line of Credit.
The Income Fund participates with other funds managed by FMR or an affiliate in a $4.25 billion credit facility (the "line of credit") to be utilized for temporary or emergency purposes to fund shareholder redemptions or for other short-term liquidity purposes. The participating funds have agreed to pay commitment fees on their pro-rata portion of the line of credit, which are reflected in Miscellaneous expenses on the Statement of Operations, and are as follows:
Fidelity New Jersey Municipal Income Fund | $ 1,792 |
During the period, there were no borrowings on this line of credit.
7. Expense Reductions.
FMR or its affiliates voluntarily agreed to waive certain fees for the Money Market Fund in order to maintain a minimum annualized yield of .01%. Such arrangements may be discontinued by FMR at any time. For the period, the amount of the waiver was $6,428,969.
Through arrangements with the Fund's custodian, credits realized as a result of uninvested cash balances were used to reduce fund expenses. These expense reductions are noted in the table below.
| Custody
expense
reduction | Transfer
Agent
expense
reduction | Accounting
expense
reduction |
Fidelity New Jersey Municipal Income Fund | $ 7,447 | $ 24,007 | $ 1 |
Fidelity New Jersey Municipal Money Market Fund | 1,417 | - | - |
Annual Report
Notes to Financial Statements - continued
8. Other.
The Funds' organizational documents provide former and current trustees and officers with a limited indemnification against liabilities arising in connection with the performance of their duties to the Funds. In the normal course of business, the Funds may also enter into contracts that provide general indemnifications. The Funds' maximum exposure under these arrangements is unknown as this would be dependent on future claims that may be made against the Funds. The risk of material loss from such claims is considered remote.
Annual Report
To the Trustees of Fidelity Court Street Trust and Fidelity Court Street Trust II and the Shareholders of Fidelity New Jersey Municipal Income Fund and Fidelity New Jersey Municipal Money Market Fund:
In our opinion, the accompanying statements of assets and liabilities, including the schedules of investments, and the related statements of operations and of changes in net assets and the financial highlights present fairly, in all material respects, the financial position of Fidelity New Jersey Municipal Income Fund (a fund of Fidelity Court Street Trust) and Fidelity New Jersey Municipal Money Market Fund (a fund of Fidelity Court Street Trust II) at November 30, 2012 the results of each of their operations for the year then ended, the changes in their net assets for each of the two years in the period then ended and the financial highlights for each of the five years in the period then ended, in conformity with accounting principles generally accepted in the United States of America. These financial statements and financial highlights (hereafter referred to as "financial statements") are the responsibility of the Fidelity New Jersey Municipal Income Fund and Fidelity New Jersey Municipal Money Market Fund management. Our responsibility is to express an opinion on these financial statements based on our audits. We conducted our audits of these financial statements in accordance with the standards of the Public Company Accounting Oversight Board (United States). Those standards require that we plan and perform the audit to obtain reasonable assurance about whether the financial statements are free of material misstatement. An audit includes examining, on a test basis, evidence supporting the amounts and disclosures in the financial statements, assessing the accounting principles used and significant estimates made by management, and evaluating the overall financial statement presentation. We believe that our audits, which included confirmation of securities at November 30, 2012 by correspondence with the custodian and brokers, provide a reasonable basis for our opinion.
PricewaterhouseCoopers LLP
Boston, Massachusetts
January 15, 2013
Annual Report
The Trustees, Member of the Advisory Board, and executive officers of the trusts and funds, as applicable, are listed below. The Board of Trustees governs each fund and is responsible for protecting the interests of shareholders. The Trustees are experienced executives who meet periodically throughout the year to oversee each fund's activities, review contractual arrangements with companies that provide services to each fund, oversee management of the risks associated with such activities and contractual arrangements, and review each fund's performance. Except for James C. Curvey, each of the Trustees oversees 218 funds advised by FMR or an affiliate. Mr. Curvey oversees 454 funds advised by FMR or an affiliate.
The Trustees hold office without limit in time except that (a) any Trustee may resign; (b) any Trustee may be removed by written instrument, signed by at least two-thirds of the number of Trustees prior to such removal; (c) any Trustee who requests to be retired or who has become incapacitated by illness or injury may be retired by written instrument signed by a majority of the other Trustees; and (d) any Trustee may be removed at any special meeting of shareholders by a two-thirds vote of the outstanding voting securities of the trust. Each Trustee who is not an interested person (as defined in the 1940 Act) (Independent Trustee), shall retire not later than the last day of the month in which his or her 75th birthday occurs. The Independent Trustees may waive this mandatory retirement age policy with respect to individual Trustees. The executive officers and Advisory Board Member hold office without limit in time, except that any officer and Advisory Board Member may resign or may be removed by a vote of a majority of the Trustees at any regular meeting or any special meeting of the Trustees. Except as indicated, each individual has held the office shown or other offices in the same company for the past five years.
Experience, Skills, Attributes, and Qualifications of the Funds' Trustees. The Governance and Nominating Committee has adopted a statement of policy that describes the experience, qualifications, attributes, and skills that are necessary and desirable for potential Independent Trustee candidates (Statement of Policy). The Board believes that each Trustee satisfied at the time he or she was initially elected or appointed a Trustee, and continues to satisfy, the standards contemplated by the Statement of Policy. The Governance and Nominating Committee also engages professional search firms to help identify potential Independent Trustee candidates who have the experience, qualifications, attributes, and skills consistent with the Statement of Policy. From time to time, additional criteria based on the composition and skills of the current Independent Trustees, as well as experience or skills that may be appropriate in light of future changes to board composition, business conditions, and regulatory or other developments, have also been considered by the professional search firms and the Governance and Nominating Committee. In addition, the Board takes into account the Trustees' commitment and participation in Board and committee meetings, as well as their leadership of standing and ad hoc committees throughout their tenure.
In determining that a particular Trustee was and continues to be qualified to serve as a Trustee, the Board has considered a variety of criteria, none of which, in isolation, was controlling. The Board believes that, collectively, the Trustees have balanced and diverse experience, qualifications, attributes, and skills, which allow the Board to operate effectively in governing each fund and protecting the interests of shareholders. Information about the specific experience, skills, attributes, and qualifications of each Trustee, which in each case led to the Board's conclusion that the Trustee should serve (or continue to serve) as a trustee of the funds, is provided below.
Annual Report
Trustees and Officers - continued
Board Structure and Oversight Function. Abigail P. Johnson is an interested person (as defined in the 1940 Act) and currently serves as Chairman. The Trustees have determined that an interested Chairman is appropriate and benefits shareholders because an interested Chairman has a personal and professional stake in the quality and continuity of services provided to the funds. Independent Trustees exercise their informed business judgment to appoint an individual of their choosing to serve as Chairman, regardless of whether the Trustee happens to be independent or a member of management. The Independent Trustees have determined that they can act independently and effectively without having an Independent Trustee serve as Chairman and that a key structural component for assuring that they are in a position to do so is for the Independent Trustees to constitute a substantial majority for the Board. The Independent Trustees also regularly meet in executive session. Albert R. Gamper, Jr. serves as Chairman of the Independent Trustees and as such (i) acts as a liaison between the Independent Trustees and management with respect to matters important to the Independent Trustees and (ii) with management prepares agendas for Board meetings.
Fidelity funds are overseen by different Boards of Trustees. The funds' Board oversees Fidelity's investment-grade bond, money market, and asset allocation funds and another Board oversees Fidelity's equity and high income funds. The asset allocation funds may invest in Fidelity funds that are overseen by such other Board. The use of separate Boards, each with its own committee structure, allows the Trustees of each group of Fidelity funds to focus on the unique issues of the funds they oversee, including common research, investment, and operational issues. On occasion, the separate Boards establish joint committees to address issues of overlapping consequences for the Fidelity funds overseen by each Board.
The Trustees operate using a system of committees to facilitate the timely and efficient consideration of all matters of importance to the Trustees, each fund, and fund shareholders and to facilitate compliance with legal and regulatory requirements and oversight of the funds' activities and associated risks. The Board, acting through its committees, has charged FMR and its affiliates with (i) identifying events or circumstances the occurrence of which could have demonstrably adverse effects on the funds' business and/or reputation; (ii) implementing processes and controls to lessen the possibility that such events or circumstances occur or to mitigate the effects of such events or circumstances if they do occur; and (iii) creating and maintaining a system designed to evaluate continuously business and market conditions in order to facilitate the identification and implementation processes described in (i) and (ii) above. Because the day-to-day operations and activities of the funds are carried out by or through FMR, its affiliates and other service providers, the funds' exposure to risks is mitigated but not eliminated by the processes overseen by the Trustees. While each of the Board's committees has responsibility for overseeing different aspects of the funds' activities, oversight is exercised primarily through the Operations and Audit Committees. In addition, an ad hoc Board committee of Independent Trustees has worked with FMR to enhance the Board's oversight of investment and financial risks, legal and regulatory risks, technology risks, and operational risks, including the development of additional risk reporting to the Board. The Operations Committee also worked and continues to work with FMR to enhance the stress tests required under SEC regulations for money market funds. Appropriate personnel, including but not limited to the funds' Chief Compliance Officer (CCO), FMR's internal auditor, the independent accountants, the funds' Treasurer and portfolio management personnel, make periodic reports to the Board's committees, as appropriate, including an annual review of FMR's risk management program for the Fidelity funds. The responsibilities of each standing committee, including their oversight responsibilities, are described further under "Standing Committees of the Funds' Trustees."
Annual Report
The funds' Statement of Additional Information (SAI) includes more information about the Trustees. To request a free copy, call Fidelity at 1-800-544-8544.
Interested Trustees*:
Correspondence intended for each Trustee who is an interested person may be sent to Fidelity Investments, 82 Devonshire Street, Boston, Massachusetts 02109.
Name, Age; Principal Occupations and Other Relevant Experience+ |
Abigail P. Johnson (50) |
| Year of Election or Appointment: 2009 Ms. Johnson is Trustee and Chairman of the Board of Trustees of certain Trusts. Ms. Johnson serves as President of Fidelity Financial Services (2012-present) and President of Personal, Workplace and Institutional Services (2005-present). Ms. Johnson is Chairman and Director of FMR Co., Inc. (2011-present), Chairman and Director of FMR (2011-present), and the Vice Chairman and Director (2007-present) of FMR LLC. Previously, Ms. Johnson served as President and a Director of FMR (2001-2005), a Trustee of other investment companies advised by FMR, Fidelity Investments Money Management, Inc., and FMR Co., Inc. (2001-2005), Senior Vice President of the Fidelity funds (2001-2005), and managed a number of Fidelity funds. Ms. Abigail P. Johnson and Mr. Arthur E. Johnson are not related. |
James C. Curvey (77) |
| Year of Election or Appointment: 2008 Mr. Curvey also serves as Trustee (2007-present) of other investment companies advised by FMR. Mr. Curvey is a Director of Fidelity Investments Money Management, Inc. (2009-present), Director of Fidelity Research & Analysis Co. (2009-present) and Director of FMR and FMR Co., Inc. (2007-present). Mr. Curvey is also Vice Chairman (2007-present) and Director of FMR LLC. In addition, Mr. Curvey serves as an Overseer for the Boston Symphony Orchestra and a member of the Trustees of Villanova University. Previously, Mr. Curvey was the Vice Chairman (2006-2007) and Director (2000-2007) of FMR Corp. |
* Trustees have been determined to be "Interested Trustees" by virtue of, among other things, their affiliation with the trusts or various entities under common control with FMR.
+ The information above includes each Trustee's principal occupation during the last five years and other information relating to the experience, attributes, and skills relevant to each Trustee's qualifications to serve as a Trustee, which led to the conclusion that each Trustee should serve as a Trustee for each fund.
Independent Trustees:
Correspondence intended for each Independent Trustee (that is, the Trustees other than the Interested Trustees) may be sent to Fidelity Investments, P.O. Box 55235, Boston, Massachusetts 02205-5235.
Name, Age; Principal Occupations and Other Relevant Experience+ |
Albert R. Gamper, Jr. (70) |
| Year of Election or Appointment: 2006 Mr. Gamper is Chairman of the Independent Trustees of the Fixed Income and Asset Allocation Funds (2012-present). Prior to his retirement in December 2004, Mr. Gamper served as Chairman of the Board of CIT Group Inc. (commercial finance). During his tenure with CIT Group Inc. Mr. Gamper served in numerous senior management positions, including Chairman (1987-1989; 1999-2001; 2002-2004), Chief Executive Officer (1987-2004), and President (2002-2003). Mr. Gamper currently serves as a member of the Board of Directors of Public Service Enterprise Group (utilities, 2000-present), a member of the Board of Trustees, Rutgers University (2004-present), and Chairman of the Board of Barnabas Health Care System. Previously, Mr. Gamper served as Vice Chairman of the Independent Trustees of the Fixed Income and Asset Allocation Funds (2011-2012) and as Chairman of the Board of Governors, Rutgers University (2004-2007). |
Robert F. Gartland (60) |
| Year of Election or Appointment: 2010 Mr. Gartland is Chairman and an investor in Gartland and Mellina Group Corp. (consulting, 2009-present). Previously, Mr. Gartland served as a partner and investor of Vietnam Partners LLC (investments and consulting, 2008-2011). Prior to his retirement, Mr. Gartland held a variety of positions at Morgan Stanley (financial services, 1979-2007) including Managing Director (1987-2007). |
Arthur E. Johnson (65) |
| Year of Election or Appointment: 2008 Mr. Johnson serves as a member of the Board of Directors of Eaton Corporation (diversified power management, 2009-present), AGL Resources, Inc. (holding company, 2002-present) and Booz Allen Hamilton (management consulting, 2011-present). Prior to his retirement, Mr. Johnson served as Senior Vice President of Corporate Strategic Development of Lockheed Martin Corporation (defense contractor, 1999-2009). He previously served on the Board of Directors of IKON Office Solutions, Inc. (1999-2008) and Delta Airlines (2005-2007). Mr. Arthur E. Johnson is not related to Ms. Abigail P. Johnson. |
Michael E. Kenneally (58) |
| Year of Election or Appointment: 2009 Previously, Mr. Kenneally served as a Member of the Advisory Board for certain Fidelity Fixed Income and Asset Allocation Funds (2008-2009). Prior to his retirement, Mr. Kenneally served as Chairman and Global Chief Executive Officer of Credit Suisse Asset Management (2003-2005). Mr. Kenneally was a Director of the Credit Suisse Funds (U.S. mutual funds, 2004-2008) and certain other closed-end funds (2004-2005) and was awarded the Chartered Financial Analyst (CFA) designation in 1991. |
James H. Keyes (72) |
| Year of Election or Appointment: 2007 Mr. Keyes serves as a member of the Boards of Navistar International Corporation (manufacture and sale of trucks, buses, and diesel engines, since 2002) and Pitney Bowes, Inc. (integrated mail, messaging, and document management solutions, since 1998). Prior to his retirement, Mr. Keyes served as Chairman and Chief Executive Officer of Johnson Controls (automotive, building, and energy, 1998-2002) and as a member of the Board of LSI Logic Corporation (semiconductor technologies, 1984-2008). |
Marie L. Knowles (66) |
| Year of Election or Appointment: 2001 Ms. Knowles is Vice Chairman of the Independent Trustees of the Fixed Income and Asset Allocation Funds (2012-present). Prior to Ms. Knowles' retirement in June 2000, she served as Executive Vice President and Chief Financial Officer of Atlantic Richfield Company (ARCO) (diversified energy, 1996-2000). From 1993 to 1996, she was a Senior Vice President of ARCO and President of ARCO Transportation Company. She served as a Director of ARCO from 1996 to 1998. Ms. Knowles currently serves as a Director and Chairman of the Audit Committee of McKesson Corporation (healthcare service, since 2002). Ms. Knowles is an Honorary Trustee of the Brookings Institution and a member of the Board of the Catalina Island Conservancy and of the Santa Catalina Island Company (2009-present). She also serves as a member of the Advisory Board for the School of Engineering of the University of Southern California and the Foundation Board of the School of Architecture at the University of Virginia (2007-present). Previously, Ms. Knowles served as a Director of Phelps Dodge Corporation (copper mining and manufacturing, 1994-2007). |
Kenneth L. Wolfe (73) |
| Year of Election or Appointment: 2005 Prior to his retirement, Mr. Wolfe served as Chairman and a Director (2007-2009) and Chairman and Chief Executive Officer (1994-2001) of Hershey Foods Corporation. He also served as a member of the Boards of Adelphia Communications Corporation (telecommunications, 2003-2006), Bausch & Lomb, Inc. (medical/pharmaceutical, 1993-2007), and Revlon, Inc. (personal care products, 2004-2009). Mr. Wolfe previously served as Chairman of the Independent Trustees of the Fixed Income and Asset Allocation Funds (2008-2012). |
+ The information above includes each Trustee's principal occupation during the last five years and other information relating to the experience, attributes, and skills relevant to each Trustee's qualifications to serve as a Trustee, which led to the conclusion that each Trustee should serve as a Trustee for each fund.
Annual Report
Advisory Board Member and Executive Officers:
Correspondence intended for Elizabeth S. Acton may be sent to Fidelity Investments, P.O. Box 55235, Boston, Massachusetts 02205-5235. Correspondence intended for each executive officer may be sent to Fidelity Investments, 82 Devonshire Street, Boston, Massachusetts 02109.
Name, Age; Principal Occupation |
Elizabeth S. Acton (61) |
| Year of Election or Appointment: 2013 Member of the Advisory Board. Ms. Acton also serves as Trustee or Member of the Advisory Board of other Fidelity Fixed Income and Asset Allocation Funds (2013-present). Prior to her retirement in April 2012, Ms. Acton was Executive Vice President, Finance (November 2011- April 2012), Executive Vice President, Chief Financial Officer (April 2002-November 2011), and Treasurer (May 2004-May 2005) of Comerica Incorporated (financial services). Prior to joining Comerica, Ms. Acton held a variety of positions at Ford Motor Company (1983-2002), including Vice President and Treasurer (2000-2002) and Executive Vice President and Chief Financial Officer of Ford Motor Credit Company (1998-2000). Ms. Acton currently serves as a member of the Board of Directors and Audit and Finance Committees of Beazer Homes USA, Inc. (homebuilding, 2012-present). |
John R. Hebble (54) |
| Year of Election or Appointment: 2008 President and Treasurer of Fidelity's Fixed Income and Asset Allocation Funds. Mr. Hebble also serves as President (2011-present), Treasurer, and Chief Financial Officer of The North Carolina Capital Management Trust: Cash and Term Portfolios (2008-present), Assistant Treasurer of other Fidelity funds (2009-present) and is an employee of Fidelity Investments. |
Charles S. Morrison (51) |
| Year of Election or Appointment: 2012 Vice President of Fidelity's Fixed Income and Asset Allocation Funds. Mr. Morrison also serves as President, Fixed Income and is an employee of Fidelity Investments. Previously, Mr. Morrison served as Vice President of Fidelity's Money Market Funds (2005-2009), President, Money Market Group Leader of FMR (2009), and Senior Vice President, Money Market Group of FMR (2004-2009). Mr. Morrison also served as Vice President of Fidelity's Bond Funds (2002-2005), certain Balanced Funds (2002-2005), and certain Asset Allocation Funds (2002-2007), and as Senior Vice President (2002-2005) of Fidelity's Fixed Income Division. |
Robert P. Brown (49) |
| Year of Election or Appointment: 2012 Vice President of Fidelity's Bond Funds. Mr. Brown also serves as Executive Vice President of Fidelity Investments Money Management, Inc. (2010-present), President, Bond Group of FMR (2011-present), Director and Managing Director, Research of Fidelity Management & Research (U.K.) Inc. (2008-present) and is an employee of Fidelity Investments. Previously, Mr. Brown served as President, Money Market Group of FMR (2010-2011) and Vice President of Fidelity's Money Market Funds (2010-2012). |
Nancy D. Prior (45) |
| Year of Election or Appointment: 2012 Vice President of Fidelity's Money Market Funds. Ms. Prior also serves as President, Money Market Group of FMR (2011-present) and is an employee of Fidelity Investments (2002-present). Previously, Ms. Prior served as Managing Director of Research (2009-2011), Senior Vice President and Deputy General Counsel (2007-2009), and Assistant Secretary of Fidelity's Fixed Income and Asset Allocation Funds (2008-2009). |
Scott C. Goebel (44) |
| Year of Election or Appointment: 2008 Secretary and Chief Legal Officer (CLO) of the Fidelity funds. Mr. Goebel also serves as Secretary of Fidelity Investments Money Management, Inc. (FIMM) (2010-present) and Fidelity Research and Analysis Company (FRAC) (2010-present); Secretary and CLO of The North Carolina Capital Management Trust: Cash and Term Portfolios (2008-present); General Counsel, Secretary, and Senior Vice President of FMR (2008-present) and FMR Co., Inc. (2008-present); employed by FMR LLC or an affiliate (2001-present); Chief Legal Officer of Fidelity Management & Research (Hong Kong) Limited (2008-present) and Assistant Secretary of Fidelity Management & Research (Japan) Inc. (2008-present), and Fidelity Management & Research (U.K.) Inc. (2008-present). Previously, Mr. Goebel served as Assistant Secretary of FIMM (2008-2010), FRAC (2008-2010), and the Funds (2007-2008) and as Vice President and Secretary of Fidelity Distributors Corporation (FDC) (2005-2007). |
Ramon Herrera (38) |
| Year of Election or Appointment: 2012 Assistant Secretary of Fidelity's Fixed Income and Asset Allocation Funds. Mr. Herrera also serves as Vice President, Associate General Counsel (2010-present) and is an employee of Fidelity Investments (2004-present). |
Elizabeth Paige Baumann (44) |
| Year of Election or Appointment: 2012 Anti-Money Laundering (AML) Officer of the Fidelity funds. Ms. Baumann also serves as AML Officer of The North Carolina Capital Management Trust: Cash and Term Portfolios (2012-present), Chief AML Officer of FMR LLC (2012-present), and is an employee of Fidelity Investments. Previously, Ms. Baumann served as Vice President and Deputy Anti-Money Laundering Officer (2007-2012). |
Christine Reynolds (54) |
| Year of Election or Appointment: 2008 Chief Financial Officer of the Fidelity funds. Ms. Reynolds became President of Fidelity Pricing and Cash Management Services (FPCMS) in August 2008. Ms. Reynolds served as Chief Operating Officer of FPCMS (2007-2008). Previously, Ms. Reynolds served as President, Treasurer, and Anti-Money Laundering officer of the Fidelity funds (2004-2007). |
Michael H. Whitaker (45) |
| Year of Election or Appointment: 2008 Chief Compliance Officer of Fidelity's Fixed Income and Asset Allocation Funds. Mr. Whitaker also serves as Chief Compliance Officer of The North Carolina Capital Management Trust: Cash and Term Portfolios (2008-present). Mr. Whitaker is an employee of Fidelity Investments (2007-present). Prior to joining Fidelity Investments, Mr. Whitaker worked at MFS Investment Management where he served as Senior Vice President and Chief Compliance Officer (2004-2006), and Assistant General Counsel. |
Joseph F. Zambello (55) |
| Year of Election or Appointment: 2011 Deputy Treasurer of the Fidelity funds. Mr. Zambello is an employee of Fidelity Investments. Previously, Mr. Zambello served as Vice President of FMR's Program Management Group (2009-2011) and Vice President of the Transfer Agent Oversight Group (2005-2009). |
Stephanie J. Dorsey (43) |
| Year of Election or Appointment: 2008 Deputy Treasurer of Fidelity's Fixed Income and Asset Allocation Funds. Ms. Dorsey also serves as Assistant Treasurer of other Fidelity funds (2010-present) and is an employee of Fidelity Investments (2008-present). Previously, Ms. Dorsey served as Treasurer (2004-2008) of the JPMorgan Mutual Funds and Vice President (2004-2008) of JPMorgan Chase Bank. |
Adrien E. Deberghes (45) |
| Year of Election or Appointment: 2010 Assistant Treasurer of Fidelity's Fixed Income and Asset Allocation Funds. Mr. Deberghes also serves as Vice President and Assistant Treasurer (2011-present) and Deputy Treasurer (2008-present) of other Fidelity funds, and is an employee of Fidelity Investments (2008-present). Previously, Mr. Deberghes served as Senior Vice President of Mutual Fund Administration at State Street Corporation (2007-2008), Senior Director of Mutual Fund Administration at Investors Bank & Trust (2005-2007), and Director of Finance for Dunkin' Brands (2000-2005). |
Kenneth B. Robins (43) |
| Year of Election or Appointment: 2009 Assistant Treasurer of the Fidelity Fixed Income and Asset Allocation Funds. Mr. Robins also serves as President and Treasurer of other Fidelity funds (2008-present; 2010-present) and is an employee of Fidelity Investments (2004-present). Previously, Mr. Robins served as Deputy Treasurer of the Fidelity funds (2005-2008) and Treasurer and Chief Financial Officer of The North Carolina Capital Management Trust: Cash and Term Portfolios (2006-2008). |
Stephen Sadoski (41) |
| Year of Election or Appointment: 2012 Assistant Treasurer of Fidelity's Fixed Income and Asset Allocation Funds. Mr. Sadoski also serves as Deputy Treasurer of other Fidelity funds (2012-present) and is an employee of Fidelity Investments (2012-present). Previously, Mr. Sadoski served as an assistant chief accountant in the Division of Investment Management of the Securities and Exchange Commission (SEC) (2009-2012) and as a senior manager at Deloitte & Touche (1997-2009). |
Gary W. Ryan (54) |
| Year of Election or Appointment: 2005 Assistant Treasurer of the Fidelity funds. Mr. Ryan is an employee of Fidelity Investments. Previously, Mr. Ryan served as Vice President of Fund Reporting in Fidelity Pricing and Cash Management Services (FPCMS) (1999-2005). |
Jonathan Davis (44) |
| Year of Election or Appointment: 2010 Assistant Treasurer of the Fidelity funds. Mr. Davis is also Assistant Treasurer of Fidelity Rutland Square Trust II and Fidelity Commonwealth Trust II. Mr. Davis is an employee of Fidelity Investments. Previously, Mr. Davis served as Vice President and Associate General Counsel of FMR LLC (2003-2010). |
Annual Report
The Board of Trustees of each fund voted to pay to shareholders of record at the opening of business on record date, the following distributions per share derived from capital gains realized from sales of portfolio securities, and dividends derived from net investment income:
Fund | Pay Date | Record Date | Dividends | Capital Gains |
Fidelity New Jersey Municipal Income Fund | 12/24/12 | 12/21/12 | $0.000 | $0.026 |
Fidelity New Jersey Municipal Money Market Fund | 12/24/12 | 12/21/12 | $0.000 | $0.000 |
The funds hereby designate as capital gain dividend the amounts noted below for the taxable year ended November 30, 2012, or, if subsequently determined to be different, the net capital gain of such year.
Fund |
|
Fidelity New Jersey Municipal Income Fund | $ 1,045,429 |
During fiscal year ended 2012, 100% of each fund's income dividends were free from federal income tax, and 7.18% and 30.57% of Fidelity New Jersey Municipal Income Fund and Fidelity New Jersey Municipal Money Market Fund 's income dividends, respectively, were subject to the federal alternative minimum tax.
The fund will notify shareholders in January 2013 of amounts for use in preparing 2012 income tax returns.
Annual Report
Board Approval of Investment Advisory Contracts and Management Fees
Fidelity New Jersey Municipal Income Fund / Fidelity New Jersey Municipal Money Market Fund
Each year, the Board of Trustees, including the Independent Trustees (together, the Board), votes on the renewal of the management contract and sub-advisory agreements (together, the Advisory Contracts) for each fund. The Board, assisted by the advice of fund counsel and Independent Trustees' counsel, requests and considers a broad range of information relevant to the renewal of the Advisory Contracts throughout the year.
The Board meets regularly and, at each of its meetings, covers an extensive agenda of topics and materials and considers factors that are relevant to its annual consideration of the renewal of each fund's Advisory Contracts, including the services and support provided to each fund and its shareholders. The Board has established three standing committees, Operations, Audit, and Governance and Nominating, each composed of and chaired by Independent Trustees with varying backgrounds, to which the Board has assigned specific subject matter responsibilities in order to enhance effective decision-making by the Board. The Operations Committee, of which all of the Independent Trustees are members, meets regularly throughout the year and, among other matters, considers matters specifically related to the annual consideration of the renewal of each fund's Advisory Contracts. The Board, acting directly and through its Committees, requests and receives information concerning the annual consideration of the renewal of each fund's Advisory Contracts. The Board also meets as needed to consider matters specifically related to the Board's annual consideration of the renewal of Advisory Contracts. Members of the Board may also meet with trustees of other Fidelity funds through ad hoc joint committees to discuss certain matters relevant to the Fidelity funds.
At its September 2012 meeting, the Board of Trustees, including the Independent Trustees, unanimously determined to renew each fund's Advisory Contracts. In reaching its determination, the Board considered all factors it believed relevant, including (i) the nature, extent, and quality of the services to be provided to each fund and its shareholders (including the investment performance of each fund); (ii) the competitiveness of each fund's management fee and total expense ratio relative to peer funds; (iii) the total costs of the services to be provided by and the profits to be realized by Fidelity from its relationship with each fund; (iv) the extent to which economies of scale exist and would be realized as each fund grows; and (v) whether fee levels reflect these economies of scale, if any, for the benefit of fund shareholders.
In considering whether to renew the Advisory Contracts for each fund, the Board reached a determination, with the assistance of fund counsel and Independent Trustees' counsel and through the exercise of its business judgment, that the renewal of the Advisory Contracts is in the best interests of each fund and its shareholders and that the compensation payable under the Advisory Contracts is fair and reasonable. The Board's decision to renew the Advisory Contracts was not based on any single factor, but rather was based on a comprehensive consideration of all the information provided to the Board at its meetings throughout the year. The Board, in reaching its determination to renew the Advisory Contracts, was aware that shareholders in each fund have a broad range of investment choices available to them, including a wide choice among mutual funds offered by Fidelity's competitors, and that each fund's shareholders, who have the opportunity to review and weigh the disclosure provided by the fund in its prospectus and other public disclosures, have chosen to invest in that fund, managed by Fidelity.
Annual Report
Board Approval of Investment Advisory Contracts and
Management Fees - continued
Nature, Extent, and Quality of Services Provided. The Board considered the staffing within the investment adviser, FMR, and the sub-advisers (together, the Investment Advisers), including the backgrounds of the funds' investment personnel, and also considered the funds' investment objectives, strategies, and related investment philosophies. The Independent Trustees also had discussions with senior management of Fidelity's investment operations and investment groups. The Board considered the structure of the portfolio manager compensation program and whether this structure provides appropriate incentives to act in the best interests of each fund.
Resources Dedicated to Investment Management and Support Services. The Board reviewed the general qualifications and capabilities of the Investment Advisers' investment staff, including its size, education, experience, and resources, as well as the Investment Advisers' approach to recruiting, managing, and compensating investment personnel. The Board also noted that FMR has continued to increase the resources devoted to non-U.S. offices, including expansion of Fidelity's global investment organization. The Board noted that Fidelity's analysts have extensive resources, tools and capabilities that allow them to conduct sophisticated quantitative and fundamental analysis, as well as credit analysis of issuers, counterparties and guarantors. The Board also believes that Fidelity's investment professionals have sufficient access to global information and data so as to provide competitive investment results over time, and that those professionals also have access to sophisticated tools that permit them to assess portfolio construction and risk and performance attribution characteristics continuously, as well as to transmit new information and research conclusions rapidly around the world. Additionally, in its deliberations, the Board considered the Investment Advisers' trading and risk management capabilities and resources, which are an integral part of the investment management process.
Shareholder and Administrative Services. The Board considered (i) the nature, extent, quality, and cost of advisory, administrative, and shareholder services performed by the Investment Advisers and their affiliates under the Advisory Contracts and under separate agreements covering transfer agency and pricing and bookkeeping services for each fund; (ii) the nature and extent of the supervision of third party service providers, principally custodians and subcustodians; and (iii) the resources devoted to, and the record of compliance with, each fund's compliance policies and procedures.
Annual Report
The Board noted that the growth of fund assets over time across the complex allows Fidelity to reinvest in the development of services designed to enhance the value or convenience of the Fidelity funds as investment vehicles. These services include 24-hour access to account information and market information through telephone representatives and over the Internet, investor education materials and asset allocation tools, and the expanded availability of Fidelity Investor Centers.
Investment in a Large Fund Family. The Board considered the benefits to shareholders of investing in a Fidelity fund, including the benefits of investing in a fund that is part of a large family of funds offering a variety of investment disciplines and providing a large variety of mutual fund investor services. The Board noted that Fidelity had taken, or had made recommendations that resulted in the Fidelity funds taking, a number of actions over the previous year that benefited particular funds, including (i) continuing to dedicate additional resources to investment research and support of the senior management team that oversees asset management; (ii) persisting in efforts to enhance Fidelity's research capabilities, in particular, international research; (iii) launching new funds and making other enhancements to meet client needs for global and income-oriented solutions; (iv) continuing to launch dedicated lower cost underlying funds to meet investment management's portfolio construction needs related to expanding underlying fund options, specifically for the Freedom Fund product lines; (v) adopting a sector neutral investment approach for certain funds and utilizing a team of portfolio managers to manage certain sector-neutral funds; (vi) rationalizing product lines and gaining increased efficiencies through combinations of several funds with other funds; (vii) strengthening the Spartan Index Fund product line by adding new funds and/or new low-cost institutional share classes, restructuring fund expenses to accommodate new classes, and reducing investment minimums for certain classes of shares; (viii) modifying the eligibility criteria for Institutional Class shares to increase their appeal to government entities and charitable investors; and (ix) reducing certain transfer agent fee rates.
Investment Performance. The Board considered whether each fund has operated in accordance with its investment objective, as well as its record of compliance with its investment restrictions. It also reviewed each fund's absolute investment performance, as well as each fund's relative investment performance measured over multiple periods against (i) a broad-based securities market index (bond fund only, as money market funds are typically not compared against a market index), and (ii) a peer group of mutual funds deemed appropriate by Fidelity and reviewed by the Board. For each fund, the following charts considered by the Board show, over the one-, three-, and five-year periods ended December 31, 2011, the fund's cumulative total returns, the cumulative total returns of a broad-based securities market index ("benchmark") (bond fund only), and a range of cumulative total returns of a peer group of mutual funds identified by Lipper Inc. as having an investment objective similar to that of the fund. The box within each chart shows the 25th percentile return (top of box) and the 75th percentile return (bottom of box) of the peer group. Returns shown above the box are in the first quartile and returns shown below the box are in the fourth quartile. The percentage beaten number noted below each chart corresponds to the percentile box and represents the percentage of funds in the peer group whose performance was equal to or lower than that of the fund.
Annual Report
Board Approval of Investment Advisory Contracts and
Management Fees - continued
Fidelity New Jersey Municipal Income Fund
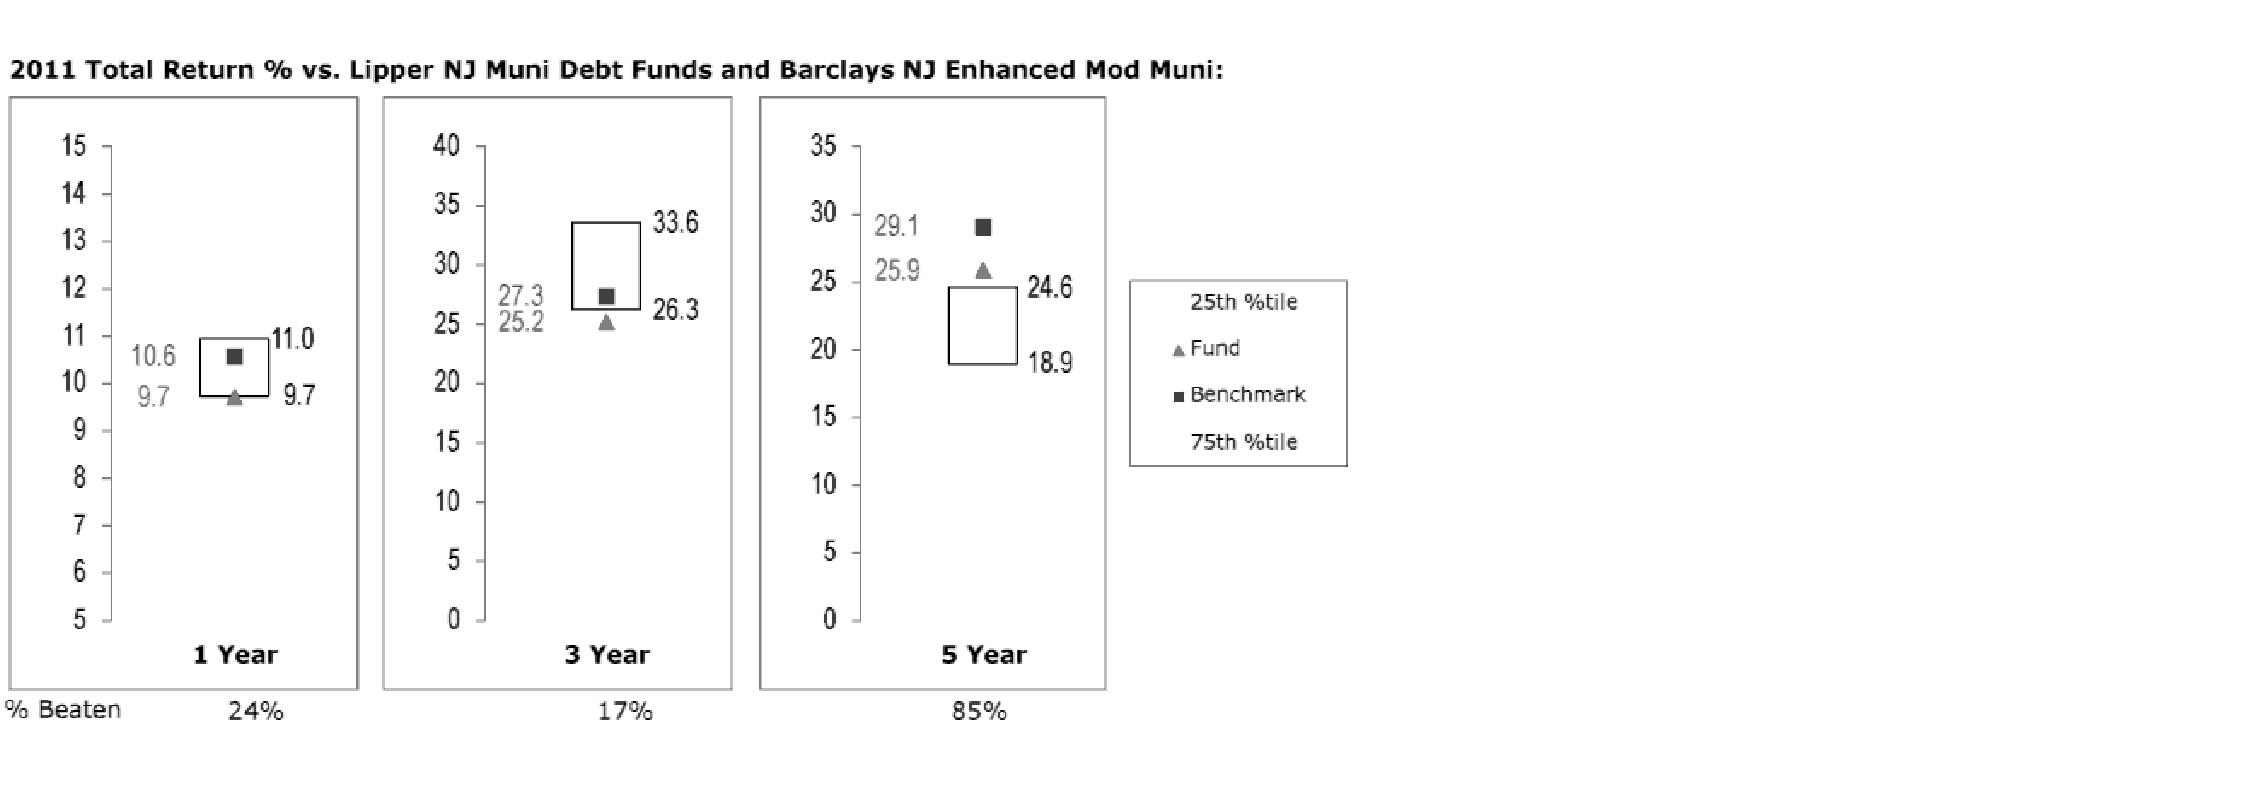
The Board reviewed the fund's relative investment performance against its peer group and noted that the performance of the fund was in the fourth quartile for the one- and three-year periods and the first quartile for the five-year period. The Board also noted that the investment performance of the fund was lower than its benchmark for all the periods shown. The Board discussed with FMR actions to improve the fund's disappointing performance. The Board also reviewed the fund's performance since inception as well as performance in the current year. The Board will continue to closely monitor the performance of the fund in the coming year and discuss with FMR other appropriate actions to address the performance of the fund.
Annual Report
Fidelity New Jersey Municipal Money Market Fund
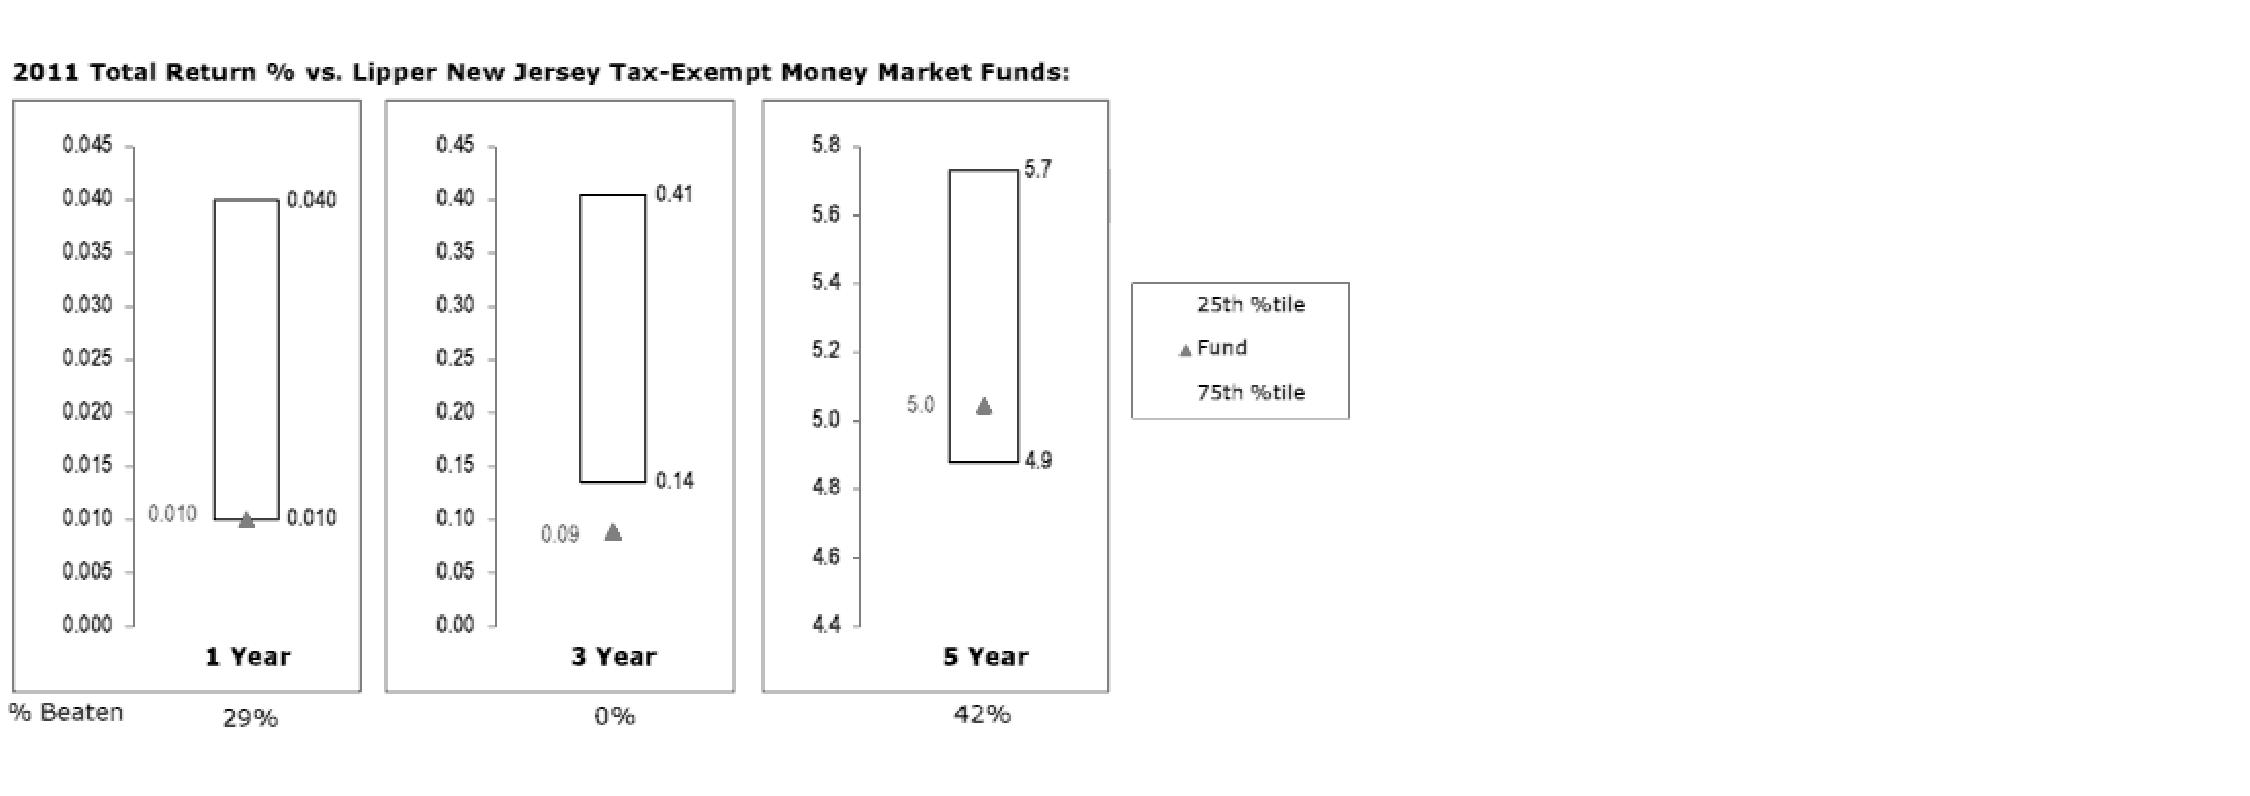
The Board reviewed the fund's relative investment performance against its peer group and noted that the performance of the fund was in the third quartile for the one- and five-year periods and the fourth quartile for the three-year period. The Board considered that FMR had taken steps to provide shareholders with stability of principal and to enhance safety and liquidity, which contributed to the fund's weakened performance relative to its peer group. The Board also reviewed the fund's performance since inception as well as performance in the current year.
The Board noted as a general matter that the percentage beaten numbers for money market funds in recent years were less meaningful than in earlier years, as many competitors have been waiving fees to maintain a one basis point yield and performance differences among funds may not be apparent due to rounding.
Based on its review, the Board concluded that the nature, extent, and quality of services provided to each fund under the Advisory Contracts should benefit each fund's shareholders.
Competitiveness of Management Fee and Total Expense Ratio. The Board considered each fund's management fee and total expense ratio compared to "mapped groups" of competitive funds and classes. Fidelity creates "mapped groups" by combining similar Lipper investment objective categories that have comparable management fee characteristics. Combining Lipper investment objective categories aids the Board's management fee and total expense ratio comparisons by broadening the competitive group used for comparison and by reducing the number of universes to which various Fidelity funds are compared.
Annual Report
Board Approval of Investment Advisory Contracts and
Management Fees - continued
Management Fee. The Board considered two proprietary management fee comparisons for the 12-month periods shown in the charts below. The group of Lipper funds used by the Board for management fee comparisons is referred to below as the "Total Mapped Group" and, for the reasons explained above, is broader than the Lipper peer group used by the Board for performance comparisons. The Total Mapped Group comparison focuses on a fund's standing relative to the total universe of comparable funds available to investors in terms of gross management fees before expense reimbursements or caps. "TMG %" represents the percentage of funds in the Total Mapped Group that had management fees that were lower than a fund's. For example, a TMG % of 38% would mean that 62% of the funds in the Total Mapped Group had higher management fees than a fund. The "Asset-Size Peer Group" (ASPG) comparison focuses on a fund's standing relative to non-Fidelity funds similar in size to the fund within the Total Mapped Group. The ASPG represents at least 15% of the funds in the Total Mapped Group with comparable asset size and management fee characteristics, subject to a minimum of 50 funds (or all funds in the Total Mapped Group if fewer than 50). Additional information, such as the ASPG quartile in which a fund's management fee ranked, is also included in the charts and considered by the Board.
Fidelity New Jersey Municipal Income Fund
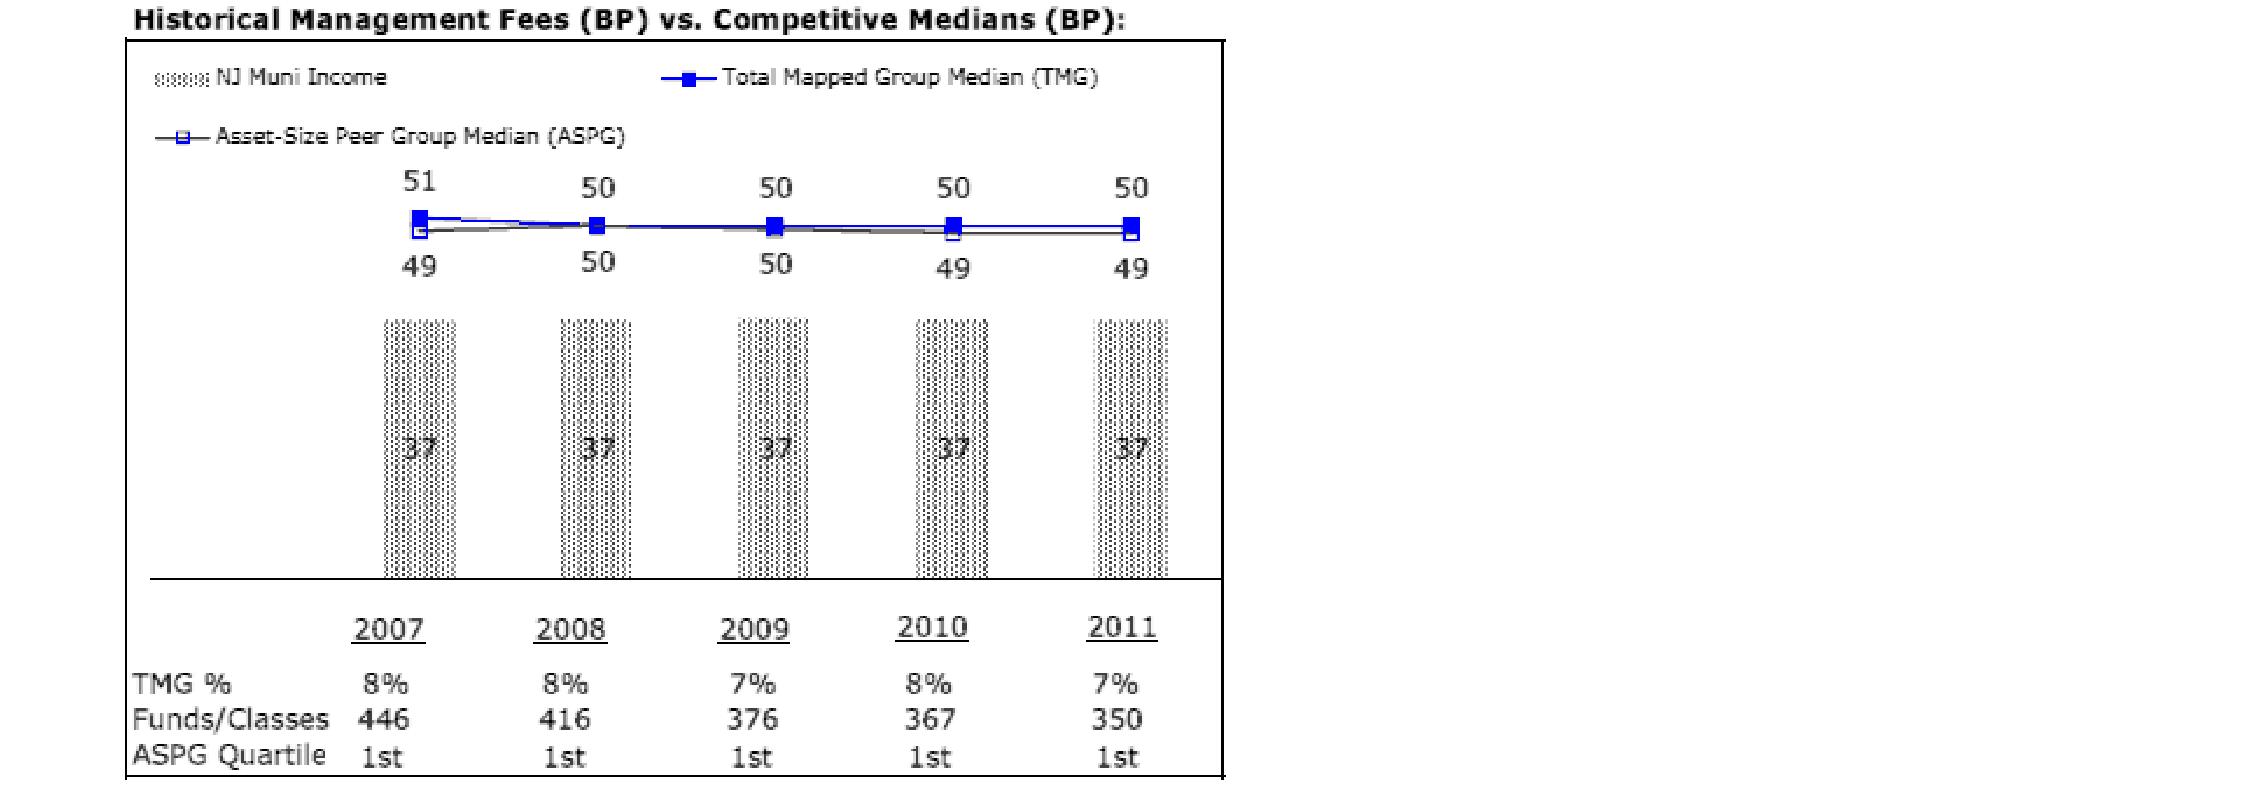
The Board noted that the fund's management fee ranked below the median of its Total Mapped Group and below the median of its ASPG for 2011.
Annual Report
Fidelity New Jersey Municipal Money Market Fund
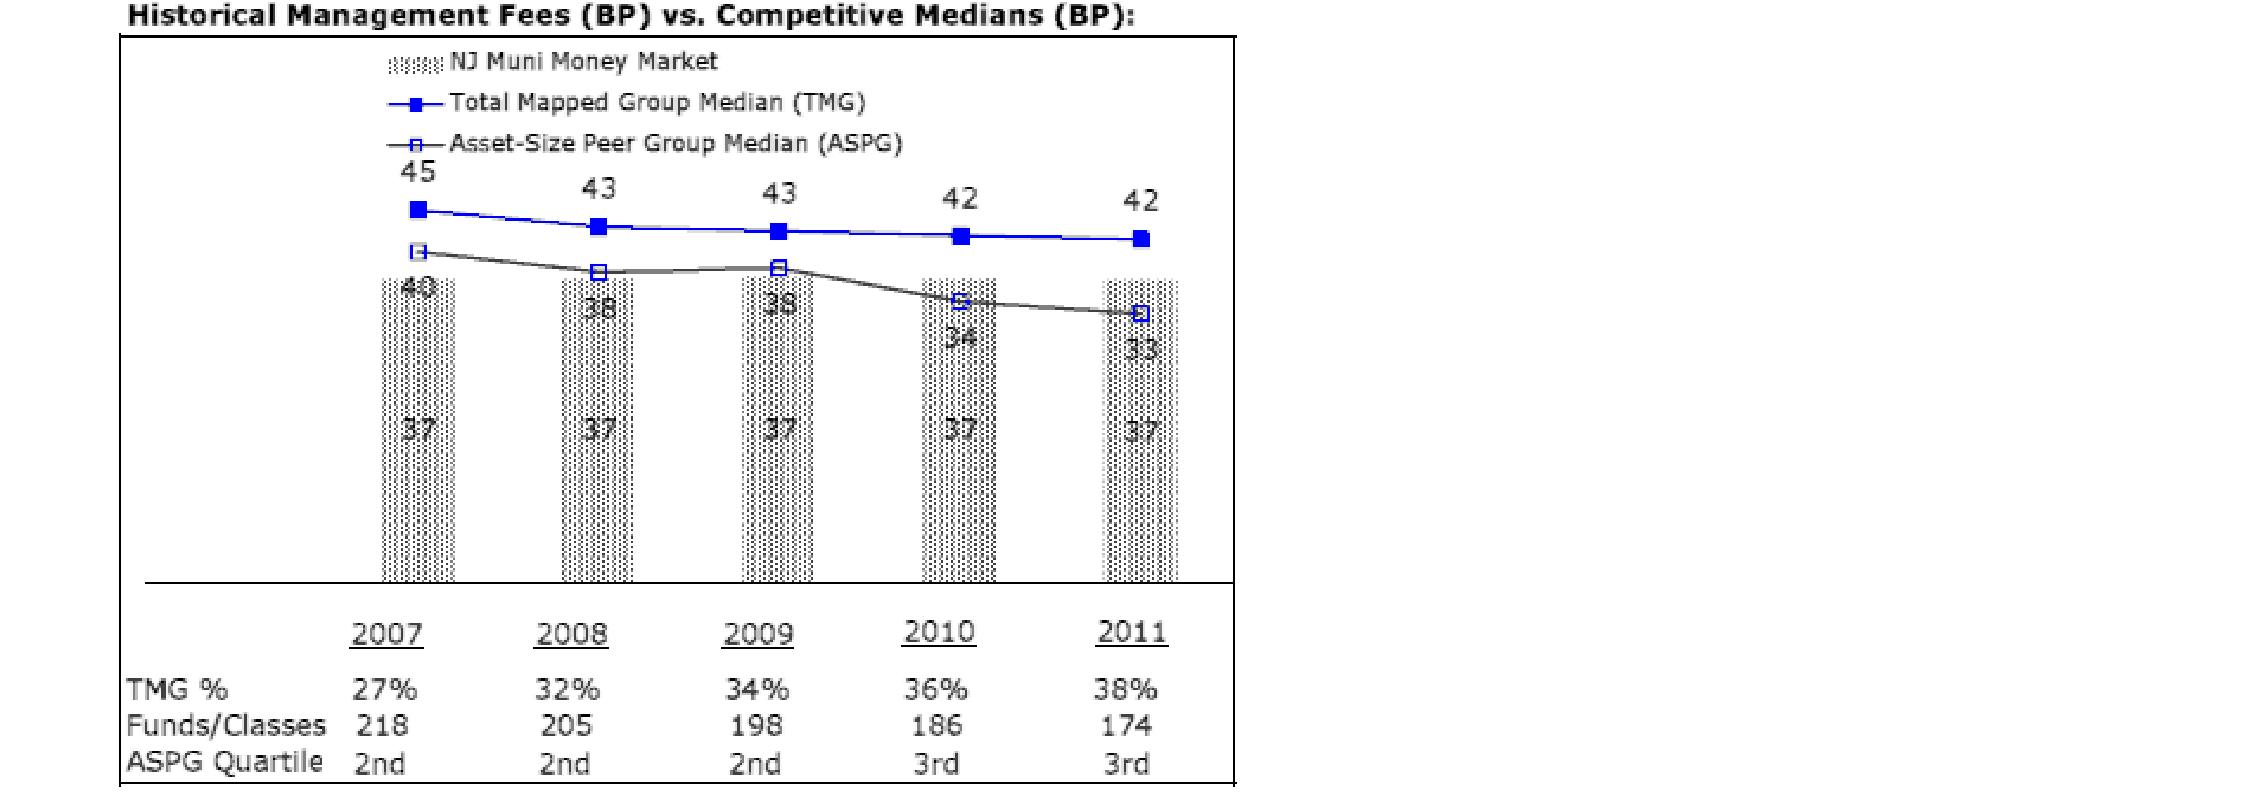
The Board noted that the fund's management fee ranked below the median of its Total Mapped Group and above the median of its ASPG for 2011.
Based on its review, the Board concluded that each fund's management fee is fair and reasonable in light of the services that the fund receives and the other factors considered.
Total Expense Ratio. In its review of each fund's total expense ratio, the Board considered the fund's management fee as well as other fund expenses, such as transfer agent fees, pricing and bookkeeping fees, and custodial, legal, and audit fees. The Board also noted the effects of any waivers and reimbursements on fees and expenses. As part of its review, the Board also considered the current and historical total expense ratios of each fund compared to competitive fund median expenses. Each fund is compared to those funds and classes in the Total Mapped Group (used by the Board for management fee comparisons) that have a similar sales load structure.
The Board noted that each fund's total expense ratio ranked below its competitive median for 2011. The Board considered that Fidelity has been voluntarily waiving part or all of the transfer agent fees and/or management fees to maintain a minimum yield for Fidelity New Jersey Municipal Money Market Fund, and also noted that Fidelity retains the ability to be repaid in certain circumstances.
Fees Charged to Other Fidelity Clients. The Board also considered Fidelity fee structures and other information with respect to clients of FMR and its affiliates, such as other mutual funds advised or subadvised by FMR or its affiliates, pension plan clients, and other institutional clients. The Board noted the findings of the 2010 ad hoc joint committee (created with the board of other Fidelity funds), which reviewed and compared Fidelity's institutional investment advisory business with its business of providing services to the Fidelity funds, including the differences in services provided, fees charged, and costs incurred, as well as competition in their respective marketplaces.
Annual Report
Board Approval of Investment Advisory Contracts and
Management Fees - continued
Based on its review of total expense ratios and fees charged to other Fidelity clients, the Board concluded that each fund's total expense ratio was reasonable in light of the services that the fund and its shareholders receive and the other factors considered.
Costs of the Services and Profitability. The Board considered the revenues earned and the expenses incurred by Fidelity in conducting the business of developing, marketing, distributing, managing, administering and servicing each fund and its shareholders. The Board also considered the level of Fidelity's profits in respect of all the Fidelity funds.
On an annual basis, FMR presents to the Board Fidelity's profitability for each fund. Fidelity calculates the profitability for each fund, as well as aggregate profitability for groups of Fidelity funds and all Fidelity funds, using a series of detailed revenue and cost allocation methodologies which originate with the books and records of Fidelity on which Fidelity's audited financial statements are based. The Audit Committee of the Board reviews any significant changes from the prior year's methodologies.
PricewaterhouseCoopers LLP (PwC), independent registered public accounting firm and auditor to Fidelity and certain Fidelity funds, has been engaged annually by the Board as part of the Board's assessment of Fidelity's profitability analysis. PwC's engagement includes the review and assessment of Fidelity's methodologies used in determining the revenues and expenses attributable to Fidelity's mutual fund business, and completion of agreed-upon procedures surrounding the mathematical accuracy of fund profitability and its conformity to allocation methodologies. After considering PwC's reports issued under the engagement and information provided by Fidelity, the Board concluded that while other allocation methods may also be reasonable, Fidelity's profitability methodologies are reasonable in all material respects.
The Board also reviewed Fidelity's non-fund businesses and fall-out benefits related to the mutual fund business as well as cases where Fidelity's affiliates may benefit from or be related to the funds' business.
The Board considered the costs of the services provided by and the profits realized by Fidelity in connection with the operation of each fund and was satisfied that the profitability was not excessive in the circumstances.
Economies of Scale. The Board considered whether there have been economies of scale in respect of the management of the Fidelity funds, whether the Fidelity funds (including each fund) have appropriately benefited from any such economies of scale, and whether there is potential for realization of any further economies of scale. The Board considered the extent to which each fund will benefit from economies of scale through increased services to the fund, through waivers or reimbursements, or through fee or expense reductions. The Board also noted that in 2009, it and the board of other Fidelity funds created an ad hoc committee (the Economies of Scale Committee) to analyze whether FMR attains economies of scale in respect of the management and servicing of the Fidelity funds, whether the Fidelity funds have appropriately benefited from such economies of scale, and whether there is potential for realization of any further economies of scale.
Annual Report
The Board recognized that each fund's management contract incorporates a "group fee" structure, which provides for lower group fee rates as total fund assets under FMR's management increase, and for higher group fee rates as total fund assets under FMR's management decrease. FMR calculates the group fee rates based on a tiered asset "breakpoint" schedule that varies based on asset class. The Board considered that the group fee is designed to deliver the benefits of economies of scale to fund shareholders when total Fidelity fund assets increase, even if assets of any particular fund are unchanged or have declined, because some portion of Fidelity's costs are attributable to services provided to all Fidelity funds, and all funds benefit if those costs can be allocated among more assets. The Board concluded that, given the group fee structure, fund shareholders will benefit from lower management fees as assets under FMR's management increase at the fund complex level, regardless of whether Fidelity achieves any such economies of scale.
The Board concluded, taking into account the analysis of the Economies of Scale Committee, that economies of scale, if any, are being appropriately shared between fund shareholders and Fidelity.
Additional Information Requested by the Board. In order to develop fully the factual basis for consideration of the Fidelity funds' Advisory Contracts, the Board requested and received additional information on certain topics, including: (i) Fidelity's fund profitability methodology, profitability trends for certain funds, and the impact of certain factors on fund profitability results; (ii) portfolio manager changes that have occurred during the past year and the amount of the investment that each portfolio manager has made in the Fidelity fund(s) that he or she manages; (iii) Fidelity's compensation structure for portfolio managers, research analysts, and other key personnel, including its effects on fund profitability, the rationale for the compensation structure, and the extent to which current market conditions have affected retention and recruitment; (iv) the compensation paid to fund sub-advisers on behalf of the Fidelity funds; (v) Fidelity's fee structures, including the group fee structure, and the rationale for recommending different fees among different categories of funds and classes; (vi) Fidelity's voluntary waiver of its fees to maintain minimum yields for certain money market funds and classes as well as contractual waivers in place for certain funds; (vii) regulatory and industry developments, including those affecting money market funds and target date funds, and the potential impact to Fidelity; (viii) Fidelity's transfer agent fees, expenses, and services, and drivers for determining the transfer agent fee structure of different funds and classes; (ix) management fee rates charged by FMR or Fidelity entities to other Fidelity clients; (x) the allocation of and historical trends in Fidelity's realization of fall-out benefits; and (xi) explanations regarding the relative total expense ratios of certain funds and classes, total expense competitive trends, and actions that might be taken by FMR to reduce total expense ratios for certain funds and classes or to achieve further economies of scale.
Annual Report
Board Approval of Investment Advisory Contracts and
Management Fees - continued
Based on its evaluation of all of the conclusions noted above, and after considering all factors it believed relevant, the Board ultimately concluded that the advisory fee structures are fair and reasonable, and that each fund's Advisory Contracts should be renewed.
Annual Report
Investment Adviser
Fidelity Management & Research Company
Boston, MA
Investment Sub-Advisers
Fidelity Investments
Money Management, Inc.
Fidelity Management & Research
(U.K.) Inc.
Fidelity Management & Research
(Hong Kong) Limited
Fidelity Management & Research
(Japan) Inc.
General Distributor
Fidelity Distributors Corporation
Smithfield, RI
Transfer and Service Agents
Fidelity Investments Institutional
Operations Company, Inc.
Boston, MA
Citibank, N.A.
New York, NY
Fidelity Service Company, Inc.
Boston, MA
Custodian
Citibank, N.A.
New York, NY
The Fidelity Telephone Connection
Mutual Fund 24-Hour Service
Exchanges/Redemptions
and Account Assistance 1-800-544-6666
Product Information 1-800-544-6666
Retirement Accounts 1-800-544-4774 (8 a.m. - 9 p.m.)
TDD Service 1-800-544-0118
for the deaf and hearing impaired
(9 a.m. - 9 p.m. Eastern time)
Fidelity Automated Service
Telephone (FAST®)
1-800-544-5555
Automated line for quickest service
(Fidelity Investment logo)(registered trademark)
Corporate Headquarters
82 Devonshire St., Boston, MA 02109
www.fidelity.com
NJN-UANN-0113
1.786715.109
Item 2. Code of Ethics
As of the end of the period, November 30, 2012, Fidelity Court Street Trust II (the trust) has adopted a code of ethics, as defined in Item 2 of Form N-CSR, that applies to its President and Treasurer and its Chief Financial Officer. A copy of the code of ethics is filed as an exhibit to this Form N-CSR.
Item 3. Audit Committee Financial Expert
The Board of Trustees of the trust has determined that James H. Keyes is an audit committee financial expert, as defined in Item 3 of Form N-CSR. Mr. Keyes is independent for purposes of Item 3 of Form N-CSR.
Item 4. Principal Accountant Fees and Services
Fees and Services
The following table presents fees billed by PricewaterhouseCoopers LLP ("PwC") in each of the last two fiscal years for services rendered to Fidelity Connecticut Municipal Money Market Fund, Fidelity New Jersey AMT Tax-Free Money Market Fund, and Fidelity New Jersey Municipal Money Market Fund (the "Funds"):
Services Billed by PwC
November 30, 2012 FeesA
| Audit Fees | Audit-Related Fees | Tax Fees | All Other Fees |
Fidelity Connecticut Municipal Money Market Fund | $35,000 | $- | $2,000 | $2,200 |
Fidelity New Jersey AMT Tax-Free Money Market Fund | $38,000 | $- | $2,000 | $1,700 |
Fidelity New Jersey Municipal Money Market Fund | $35,000 | $- | $2,000 | $2,400 |
November 30, 2011 FeesA
| Audit Fees | Audit-Related Fees | Tax Fees | All Other Fees |
Fidelity Connecticut Municipal Money Market Fund | $38,000 | $- | $2,000 | $2,400 |
Fidelity New Jersey AMT Tax-Free Money Market Fund | $41,000 | $- | $2,000 | $1,900 |
Fidelity New Jersey Municipal Money Market Fund | $38,000 | $- | $2,000 | $2,500 |
A Amounts may reflect rounding.
The following table presents fees billed by PwC that were required to be approved by the Audit Committee for services that relate directly to the operations and financial reporting of the Funds and that are rendered on behalf of Fidelity Management & Research Company ("FMR") and entities controlling, controlled by, or under common control with FMR (not including any sub-adviser whose role is primarily portfolio management and is subcontracted with or overseen by another investment adviser) that provide ongoing services to the Funds ("Fund Service Providers"):
Services Billed by PwC
| November 30, 2012A | November 30, 2011A |
Audit-Related Fees | $5,130,000 | $3,505,000 |
Tax Fees | $- | $- |
All Other Fees | $- | $- |
A Amounts may reflect rounding.
"Audit-Related Fees" represent fees billed for assurance and related services that are reasonably related to the performance of the fund audit or the review of the fund's financial statements and that are not reported under Audit Fees.
"Tax Fees" represent fees billed for tax compliance, tax advice or tax planning that relate directly to the operations and financial reporting of the fund.
"All Other Fees" represent fees billed for services provided to the fund or Fund Service Provider, a significant portion of which are assurance related, that relate directly to the operations and financial reporting of the fund, excluding those services that are reported under Audit Fees, Audit-Related Fees or Tax Fees.
Assurance services must be performed by an independent public accountant.
* * *
The aggregate non-audit fees billed by PwC for services rendered to the Funds, FMR (not including any sub-adviser whose role is primarily portfolio management and is subcontracted with or overseen by another investment adviser), and any Fund Service Provider for each of the last two fiscal years of the Funds are as follows:
Billed By | November 30, 2012 A | November 30, 2011 A |
PwC | $6,050,000 | $5,260,000 |
A Amounts may reflect rounding.
The trust's Audit Committee has considered non-audit services that were not pre-approved that were provided by PwC to Fund Service Providers to be compatible with maintaining the independence of PwC in its audit of the Funds, taking into account representations from PwC, in accordance with Public Company Accounting Oversight Board rules, regarding its independence from the Funds and their related entities and FMR's review of the appropriateness and permissibility under applicable law of such non-audit services prior to their provision to the Fund Service Providers.
Audit Committee Pre-Approval Policies and Procedures
The trust's Audit Committee must pre-approve all audit and non-audit services provided by a fund's independent registered public accounting firm relating to the operations or financial reporting of the fund. Prior to the commencement of any audit or non-audit services to a fund, the Audit Committee reviews the services to determine whether they are appropriate and permissible under applicable law.
The Audit Committee has adopted policies and procedures to, among other purposes, provide a framework for the Committee's consideration of non-audit services by the audit firms that audit the Fidelity funds. The policies and procedures require that any non-audit service provided by a fund audit firm to a Fidelity fund and any non-audit service provided by a fund auditor to a Fund Service Provider that relates directly to the operations and financial reporting of a Fidelity fund ("Covered Service") are subject to approval by the Audit Committee before such service is provided.
All Covered Services must be approved in advance of provision of the service either: (i) by formal resolution of the Audit Committee, or (ii) by oral or written approval of the service by the Chair of the Audit Committee (or if the Chair is unavailable, such other member of the Audit Committee as may be designated by the Chair to act in the Chair's absence). The approval contemplated by (ii) above is permitted where the Treasurer determines that action on such an engagement is necessary before the next meeting of the Audit Committee.
Non-audit services provided by a fund audit firm to a Fund Service Provider that do not relate directly to the operations and financial reporting of a Fidelity fund are reported to the Audit Committee on a periodic basis.
Non-Audit Services Approved Pursuant to Rule 2-01(c)(7)(i)(C) and (ii) of Regulation S-X ("De Minimis Exception")
There were no non-audit services approved or required to be approved by the Audit Committee pursuant to the De Minimis Exception during the Funds' last two fiscal years relating to services provided to (i) the Funds or (ii) any Fund Service Provider that relate directly to the operations and financial reporting of the Funds.
Item 5. Audit Committee of Listed Registrants
Not applicable.
Item 6. Investments
(a) Not applicable.
(b) Not applicable
Item 7. Disclosure of Proxy Voting Policies and Procedures for Closed-End Management Investment Companies
Not applicable.
Item 8. Portfolio Managers of Closed-End Management Investment Companies
Not applicable.
Item 9. Purchase of Equity Securities by Closed-End Management Investment Company and Affiliated Purchasers
Not applicable.
Item 10. Submission of Matters to a Vote of Security Holders
There were no material changes to the procedures by which shareholders may recommend nominees to the trust's Board of Trustees.
Item 11. Controls and Procedures
(a)(i) The President and Treasurer and the Chief Financial Officer have concluded that the trust's disclosure controls and procedures (as defined in Rule 30a-3(c) under the Investment Company Act) provide reasonable assurances that material information relating to the trust is made known to them by the appropriate persons, based on their evaluation of these controls and procedures as of a date within 90 days of the filing date of this report.
(a)(ii) There was no change in the trust's internal control over financial reporting (as defined in Rule 30a-3(d) under the Investment Company Act) that occurred during the second fiscal quarter of the period covered by this report that has materially affected, or is reasonably likely to materially affect, the trust's internal control over financial reporting.
Item 12. Exhibits
(a) | (1) | Code of Ethics pursuant to Item 2 of Form N-CSR is filed and attached hereto as EX-99.CODE ETH. |
(a) | (2) | Certification pursuant to Rule 30a-2(a) under the Investment Company Act of 1940 (17 CFR 270.30a-2(a)) is filed and attached hereto as Exhibit 99.CERT. |
(a) | (3) | Not applicable. |
(b) | | Certification pursuant to Rule 30a-2(b) under the Investment Company Act of 1940 (17 CFR 270.30a-2(b)) is furnished and attached hereto as Exhibit 99.906CERT. |
SIGNATURES
Pursuant to the requirements of the Securities Exchange Act of 1934 and the Investment Company Act of 1940, the registrant has duly caused this report to be signed on its behalf by the undersigned, thereunto duly authorized.
Fidelity Court Street Trust II
By: | /s/John R. Hebble |
| John R. Hebble |
| President and Treasurer |
| |
Date: | January 25, 2013 |
Pursuant to the requirements of the Securities Exchange Act of 1934 and the Investment Company Act of 1940, this report has been signed below by the following persons on behalf of the registrant and in the capacities and on the dates indicated.
By: | /s/John R. Hebble |
| John R. Hebble |
| President and Treasurer |
| |
Date: | January 25, 2013 |
By: | /s/Christine Reynolds |
| Christine Reynolds |
| Chief Financial Officer |
| |
Date: | January 25, 2013 |